International Talent Analytics Company X

Welcome message from author
This document is posted to help you gain knowledge. Please leave a comment to let me know what you think about it! Share it to your friends and learn new things together.
Transcript
International Talent Analytics Company X

13Appendices
3029 AK Rotterdam
+31 (0)88 730 28 00
The copyright of this report remains property of Intelligence Group. This version is for own use only and may not be replicated. For publication of (parts of) this report in media, literature or other
forms of publication, a permission of Intelligence Group is required. In case of publication, the client must always state Intelligence Group as the source.
T
Intelligence Group
July 2014
Intelligence Group
15
14
The Netherlands
Copyright © Intelligence Group, 2014
1
Contacts and Additional Information
E
W
www.intelligence-group.nl
Marconistraat 16
Attract Your Candidates 8
Research Methodology & Terminology
2Introduction
Target Group Descriptives
Table of Content
3
2
Introduction International Talent Analytics
Why?
● All important target group information aggregated in one report
● Solid foundation for your international recruitment plan
● Attract your specific target audience quick and efficient
● Input for your global strategic recruitment plan
What?
This International Talent Analytics report consists of:
● Target group key figures
● Recruitment feasability
● Social demographics
● Education and work background
● Drivers and Pull factors
● Targetting intelligence
● Expected recruitment experience
● Global interests
Who?
This International Talent Analytics report focusses on the following target audience(s):
● [job title]● [educational level]
● [current job]
● Benchmark: [country of choice]

Target Group Descriptives
4
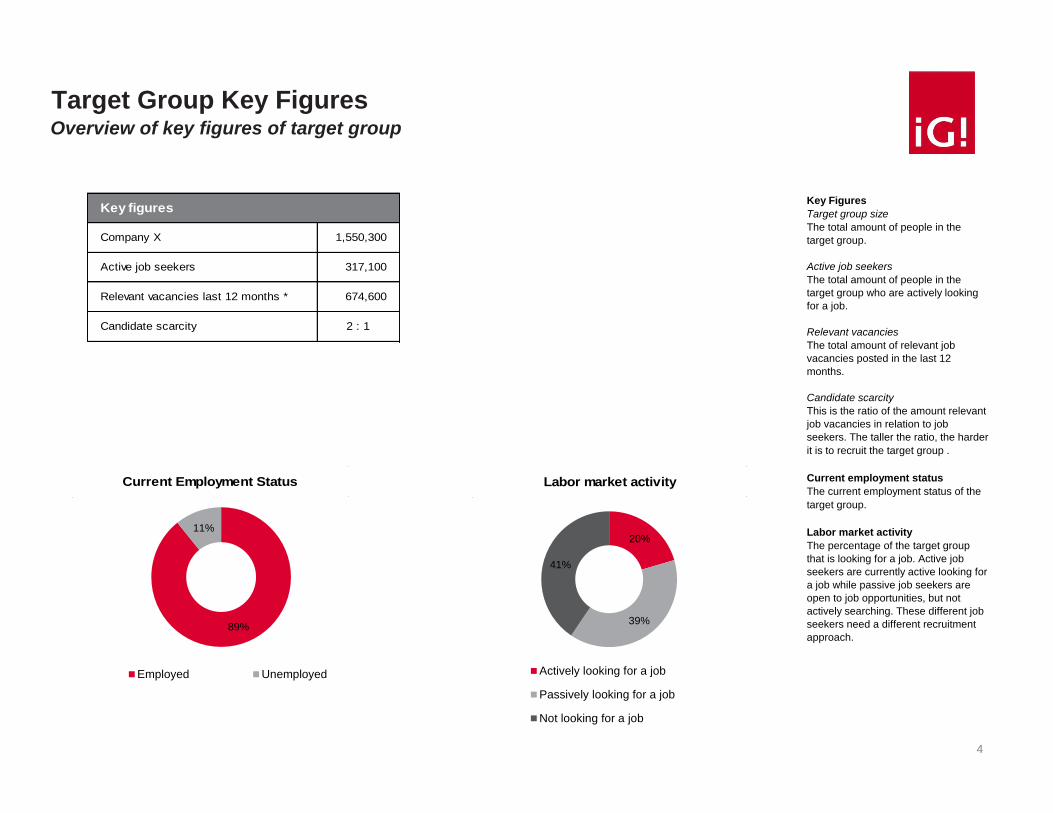
Key Figures
Target group size
The total amount of people in the
target group.
Active job seekers
The total amount of people in the
target group who are actively looking
for a job.
Relevant vacancies
The total amount of relevant job
vacancies posted in the last 12
months.
Candidate scarcity
This is the ratio of the amount relevant
job vacancies in relation to job
seekers. The taller the ratio, the harder
it is to recruit the target group .
Current employment status
The current employment status of the
target group.
Labor market activity
The percentage of the target group
that is looking for a job. Active job
seekers are currently active looking for
a job while passive job seekers are
open to job opportunities, but not
actively searching. These different job
seekers need a different recruitment
approach.
Target Group Key FiguresOverview of key figures of target group
Labor market activityCurrent Employment Status
20%
39%
41%
Actively looking for a job
Passively looking for a job
Not looking for a job
89%
11%
Employed Unemployed
Key figures
Company X
Active job seekers
Relevant vacancies last 12 months *
Candidate scarcity
1,550,300
317,100
674,600
2 : 1
5
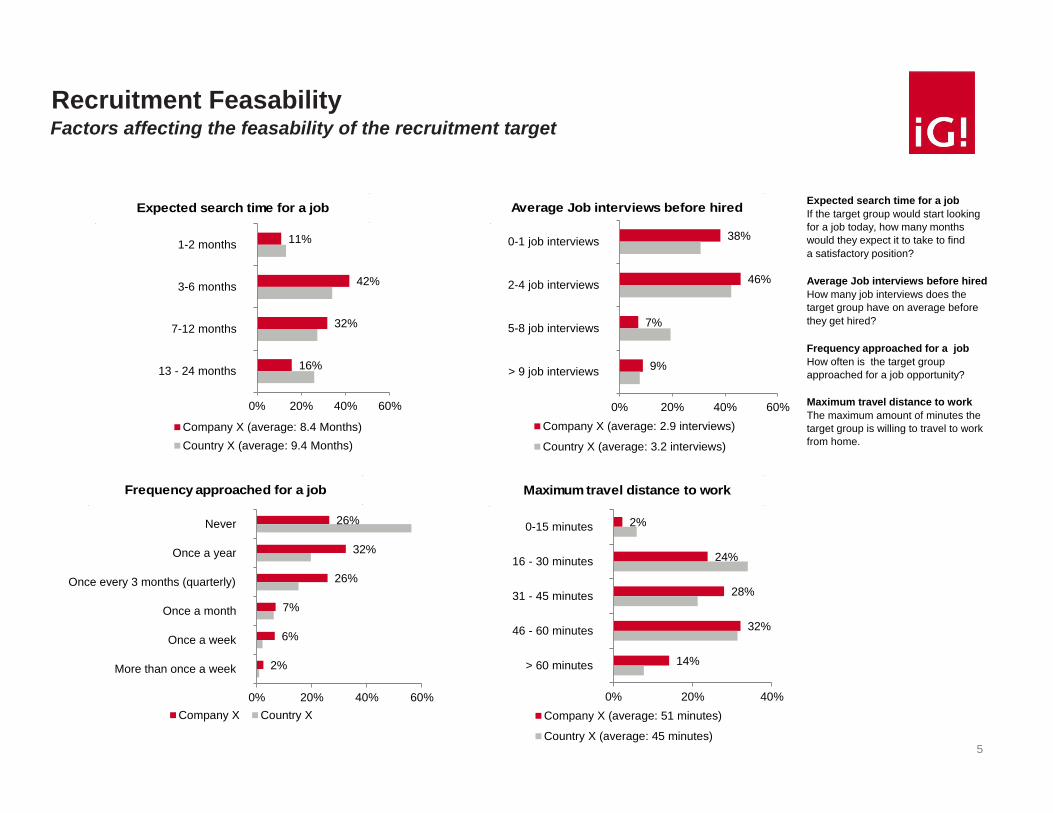
Factors affecting the feasability of the recruitment target
Expected search time for a job
If the target group would start looking
for a job today, how many months
would they expect it to take to find
a satisfactory position?
Average Job interviews before hired
How many job interviews does the
target group have on average before
they get hired?
Frequency approached for a job
How often is the target group
approached for a job opportunity?
Maximum travel distance to work
The maximum amount of minutes the
target group is willing to travel to work
from home.
Recruitment Feasability
Expected search time for a job
Frequency approached for a job
Average Job interviews before hired
Maximum travel distance to work
38%
46%
7%
9%
0% 20% 40% 60%
0-1 job interviews
2-4 job interviews
5-8 job interviews
> 9 job interviews
Company X (average: 2.9 interviews)
Country X (average: 3.2 interviews)
11%
42%
32%
16%
0% 20% 40% 60%
1-2 months
3-6 months
7-12 months
13 - 24 months
Company X (average: 8.4 Months)
Country X (average: 9.4 Months)
26%
32%
26%
7%
6%
2%
0% 20% 40% 60%
Never
Once a year
Once every 3 months (quarterly)
Once a month
Once a week
More than once a week
Company X Country X
2%
24%
28%
32%
14%
0% 20% 40%
0-15 minutes
16 - 30 minutes
31 - 45 minutes
46 - 60 minutes
> 60 minutes
Company X (average: 51 minutes)
Country X (average: 45 minutes)
6
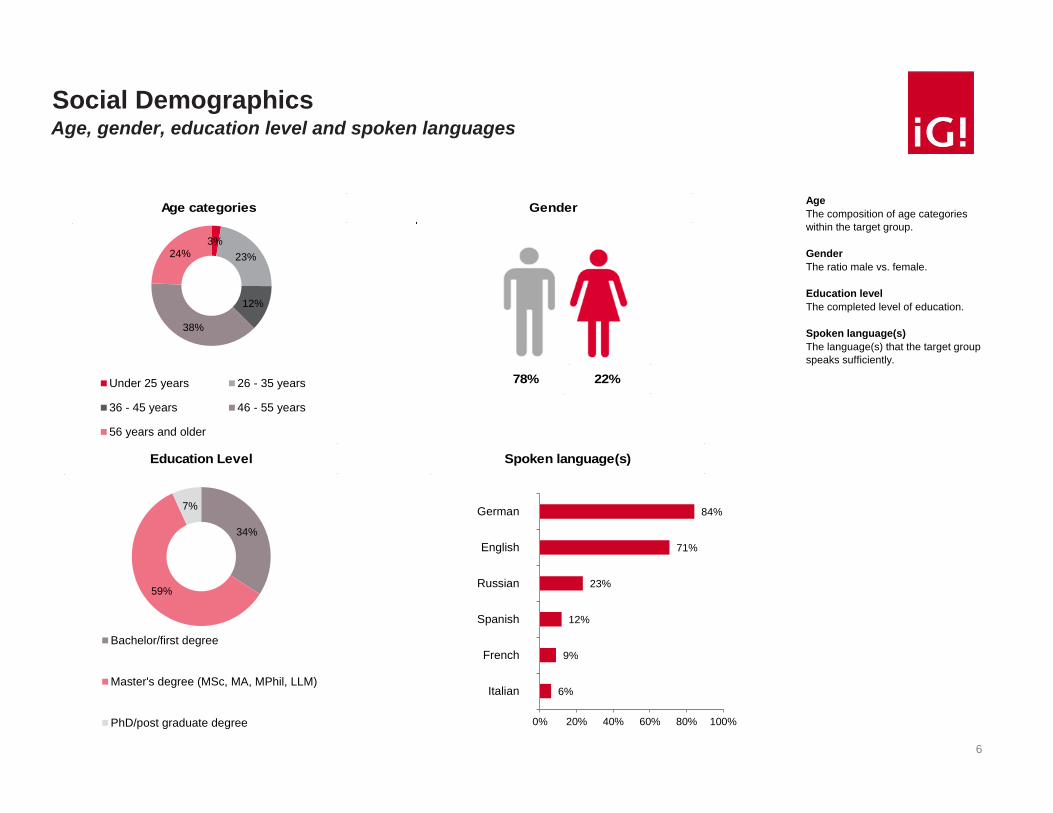
Age
The composition of age categories
within the target group.
Gender
The ratio male vs. female.
Education level
The completed level of education.
Spoken language(s)
The language(s) that the target group
speaks sufficiently.
Social DemographicsAge, gender, education level and spoken languages
Education Level
Age categories Gender
Spoken language(s)
84%
71%
23%
12%
9%
6%
0% 20% 40% 60% 80% 100%
German
English
Russian
Spanish
French
Italian
34%
59%
7%
Bachelor/first degree
Master's degree (MSc, MA, MPhil, LLM)
PhD/post graduate degree
3%
23%
12%
38%
24%
Under 25 years 26 - 35 years
36 - 45 years 46 - 55 years
56 years and older
78% 22%

7
Education
The specialization of the educational
background of the target group.
Experience level
Current level of work experience of the
target group.
Current industry
Industries where the target group is
currently working.
Current work occupation(s)
Occupation(s) of the target group.
Education and WorkThe work and study background and occupations
Experience level
2%11%
15%
17%
55%
student/graduate starter
mid career experienced
senior
100%
11%
8%
8%
4%
Education
Engineering and engineering-related trades
Computing/IT
Manufacturing and processing
Physical sciences (physics, chemistry,
geology, astronomy etc.)
Mathematics and statistics
22%
21%
14%
7%
5%
Information and communications
Manufacturing
Construction
Professional/scientific/technical industries
Transportation and storage
Current industry
51%
28%
13%
8%
8%
Current occupation area
Engineering
IT / Automation
Administrative / Secretarial
Consultancy
Sale, commercial sales or call center employee

Attract your Candidates

9
Employer Benefits
Critical factors
Employer benefits which are of critical
importance for the target group. They
score high on importance rate (>33%)
and is typical for the target group
compared to the benchmark (index
>120).
Drivers
Employer benefits which are typical
drivers of the target group. The
importance is not extreme high (<33%)
, but relatively high (index >120)
compared to the benchmark.
Primary conditions
Employer benefits which are important
(> 33%), but not typical for the target
group.
Important and typical employer benefits
Drivers and Pull factors
Critical Factors
Primary Conditions
Drivers
Le
ss
im
po
rta
nt
Typical for targetgroup
Less typical for target group
Imp
ort
an
t
Acceptable workload
Challenging work
International company
Job security
Permanent contract
Responsibility
Salary
Skilled managers
Holiday pay
Working hours
Opportunity to work from home
Number of paid vacation days
Pension package
Company car
Health and safety focus of employer
Variable bonus
Company laptop/tablet/smartphone

10
Preferred orientation sources
Sources where the target group
prefers to search for a job.
Preferred job boards
Job boards where the target group
prefers to search for a job.
Preferred search engines
Search engines where the target
group prefers to search for a job.
Pereferred social media
Social Media where the target group
prefers to search for a job.
Preferred agencies
Agencies where the target group
prefers to search for a job.
Overall most important orientation
channel
Most important specific channel that
the target group indicates to prefer to
search for a job.
Targetting
* Overall most important orientation channel
Reaching the active part of the target audience
Preferred Orientation Sources
56%
39%
36%
35%
33%
33%
29%
26%
22%
19%
0% 20% 40% 60%
Job boards/job websites
Internal job opportunities
Search engines
Company websites
Unsolicited job application to anemployer
Personal/professional network
Local/national newspaper
Recruitment agency (approaching aheadhunter/commercial recruiter)
Resume upload to resumedatabase
Professional magazine
Preferred social media
Xing.com
Facebook.com
Linkedin.com
Preferred Job Boards
Monsterboard.nl
Stepstone.nl *
Nationalevacaturebank.nl
Hays
Adecco
Preferred Agencies
Randstad
Preferred Search engines
Google.com
Bing.com
Yahoo.com
11
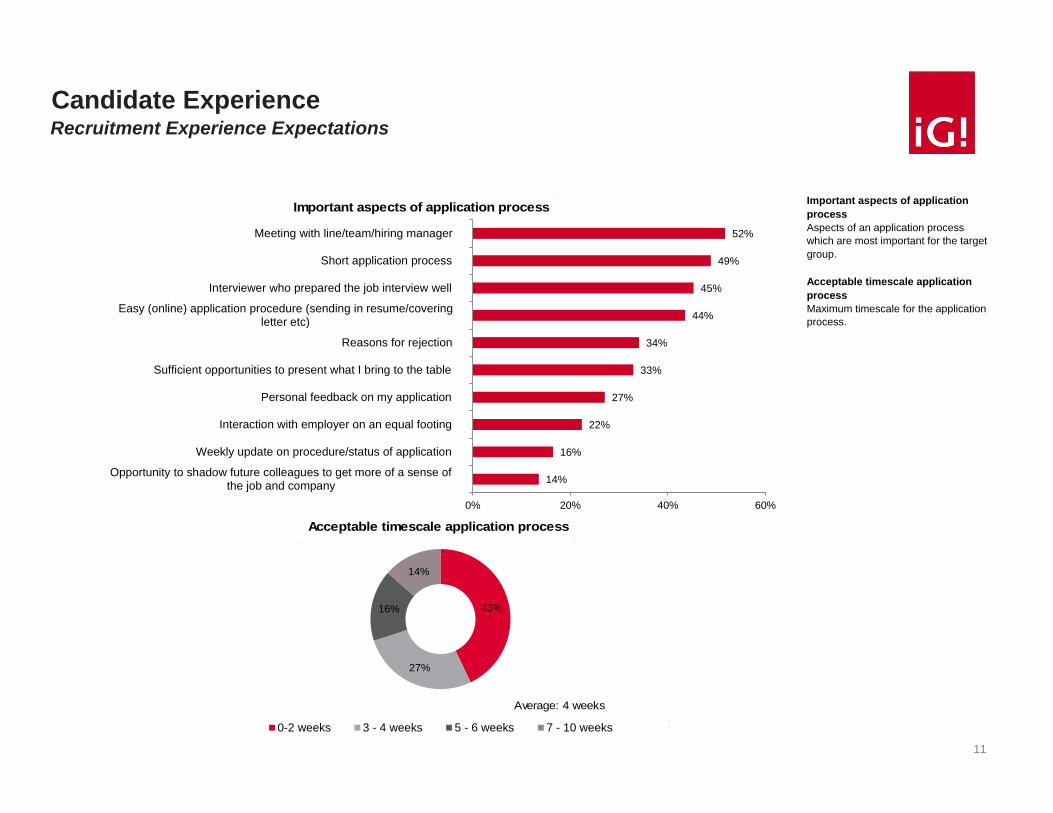
Important aspects of application
process
Aspects of an application process
which are most important for the target
group.
Acceptable timescale application
process
Maximum timescale for the application
process.
Candidate ExperienceRecruitment Experience Expectations
Important aspects of application process
Acceptable timescale application process
43%
27%
16%
14%
0-2 weeks 3 - 4 weeks 5 - 6 weeks 7 - 10 weeks
52%
49%
45%
44%
34%
33%
27%
22%
16%
14%
0% 20% 40% 60%
Meeting with line/team/hiring manager
Short application process
Interviewer who prepared the job interview well
Easy (online) application procedure (sending in resume/coveringletter etc)
Reasons for rejection
Sufficient opportunities to present what I bring to the table
Personal feedback on my application
Interaction with employer on an equal footing
Weekly update on procedure/status of application
Opportunity to shadow future colleagues to get more of a sense ofthe job and company
Average: 4 weeks
12
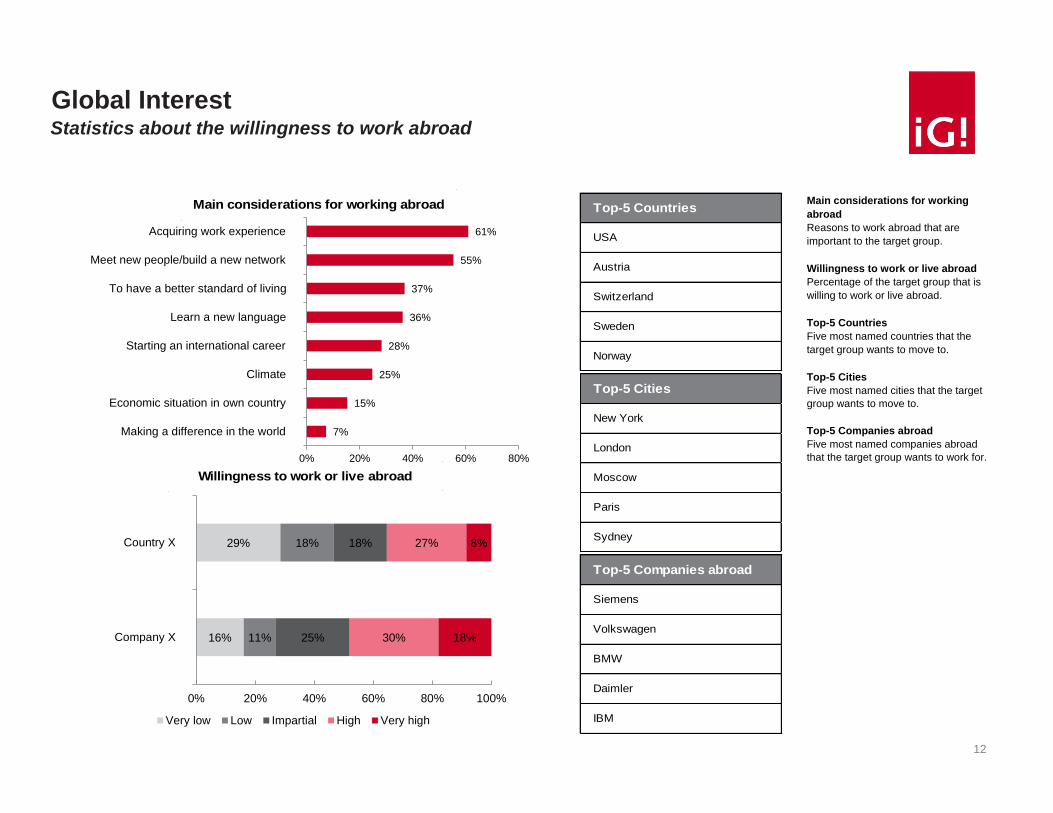
Global InterestStatistics about the willingness to work abroad
Main considerations for working
abroad
Reasons to work abroad that are
important to the target group.
Willingness to work or live abroad
Percentage of the target group that is
willing to work or live abroad.
Top-5 Countries
Five most named countries that the
target group wants to move to.
Top-5 Cities
Five most named cities that the target
group wants to move to.
Top-5 Companies abroad
Five most named companies abroad
that the target group wants to work for.
Willingness to work or live abroad
Main considerations for working abroad
61%
55%
37%
36%
28%
25%
15%
7%
0% 20% 40% 60% 80%
Acquiring work experience
Meet new people/build a new network
To have a better standard of living
Learn a new language
Starting an international career
Climate
Economic situation in own country
Making a difference in the world
16%
29%
11%
18%
25%
18%
30%
27%
18%
8%
0% 20% 40% 60% 80% 100%
Company X
Country X
Very low Low Impartial High Very high
Top-5 Cities
New York
London
Moscow
Paris
Sydney
Top-5 Countries
Austria
Switzerland
Sweden
Norway
USA
Top-5 Companies abroad
Siemens
Volkswagen
BMW
Daimler
IBM
13
Appendices
14
Research Methodology and Terminology
Technical justification
This International Talent Analytics is mostly based on the Global Talent Acquisition Monitor (GTAM) 2014: the
fourth wave of international research executed by iG! in April and May 2014.
● Data has been collected in 45 countries
● SSI, a panel agency that adheres to ESOMAR standards and is ISO Certified, has been used to
distribute the questionnaire among the respondents
● The questionnaire used has been translated into 31 languages and dialects
● The questionnaire has been translated by renowned freelance translators
● We have made use of CAWI to allow our respondents to fill out the questionnaire
● Data has been cleaned using a Survey Validator per country, consisting of 3 elements:
Speed Validator, based on the average filltime
Grid Validator, based on the repetition in chosen answer categories
Open answer Validator, based on the length and quality of each open answer
● The average completion time comes down to 20 minutes
Data analyses
The total database after cleaning consisted of 69.399 respondents. Data has been weighted by the size of the
labour force of each country, subdivided into low and high educated people and people of 50 years and younger
and above according to data taken from the ILO 2012. If necessary, additional sources like the CIA World Factbook
2013 and national statistics agencies have been used.
www.
15
Additional Information – Contacts
www.recruitment-intelligence-group.com
+31 (0) 88 730 28 00
Related Documents