3 October 2006 The Manager Company Announcements Australian Stock Exchange Limited 20 Bridge Street SYDNEY NSW 2000 Dear Sir / Madam, INTERNATIONAL ROADSHOW PRESENTATION I enclose powerpoint slides which form the basis of presentations to be made by Spark Infrastructure Group in its current international roadshow. Yours faithfully, Giri Tenneti Company Secretary Spark Infrastructure Management Limited ABN 84 114 940 304 Level 6 255 George Street Sydney NSW 2000 Australia T +61 2 9086 3600 F +61 2 9086 3666

Welcome message from author
This document is posted to help you gain knowledge. Please leave a comment to let me know what you think about it! Share it to your friends and learn new things together.
Transcript

3 October 2006 The Manager Company Announcements Australian Stock Exchange Limited 20 Bridge Street SYDNEY NSW 2000 Dear Sir / Madam, INTERNATIONAL ROADSHOW PRESENTATION I enclose powerpoint slides which form the basis of presentations to be made by Spark Infrastructure Group in its current international roadshow. Yours faithfully,
Giri Tenneti Company Secretary
Spark Infrastructure Management Limited ABN 84 114 940 304 Level 6 255 George Street Sydney NSW 2000 Australia
T +61 2 9086 3600 F +61 2 9086 3666

Bob Stobbe, Chief Executive OfficerJohn Dorrian, Chief Financial Officer
Mario Falchoni, GM Investor Relations

• This presentation is not an offer or invitation for subscription or purchase of or a recommendation of securities. It contains general information only and does not take into account the investment objectives, financial situation and particular needs of individual investors. Investors should obtain their own independent advice from a qualified financial advisor having regard to their objectives, financial situation and needs.
• This presentation does not constitute an offer to sell, or a solicitation of an offer to buy, securities in the United States or to any “U.S. person”. Neither the Stapled Securities nor the Instalment Receipts have been registered under the Securities Act or the securities laws of any state of the United States. In addition, none of the Stapled Companies, the Trust or the Responsible Entity have been registered under the Investment Company Act of 1940, as amended (“US Investment Company Act”), in reliance on the exemption provided by Section 3(c)(7) thereof.
• No representation or warranty, express or implied, is made in relation to the accuracy or completeness of the information and opinions expressed in the course of this presentation. To the maximum extent permitted by law, each of Spark Infrastructure, all of its related bodies corporate and their representatives, officers, employees, agents and advisors do not accept any responsibility or liability for any of the information or for any action taken by you on the basis of the information or opinions expressed in the course of this presentation, including without limitation any liability arising from negligence on the part of any person.
• No representation or warranty is given as to the accuracy, likelihood of achievement or reasonableness of any forecasts, prospects, returns or statements in relation to future matters contained in the information provided in this presentation. Such forecasts, prospects, returns and statements are by their nature subject to significant uncertainties and contingencies many of which are outside the control of Spark Infrastructure. You must make your own independent assessment of the information and in respect of any action taken on the basis of the information 2
Disclaimer & Securities Warnings

Spark Infrastructure - Overview
Existing business portfolio
Investment model & criteria
Financial performance
Outlook
Presentation Agenda
3

Spark InfrastructureOverview
4

• Spark is a listed investment fund managed jointly by Cheung Kong Infrastructure and RREEF Infrastructure
• Spark listed in December 2005 and has a current market capitalisation of circa $1.8B (1) (on a fully paid basis)
• Seed portfolio comprises three high quality natural monopoly electricity distribution companies
• The total portfolio has long term regulatory certainty until 2010 which provides attractive and sustainable yields underpinned by operating cash-flows
• Spark’s growth mandate is to invest in regulated utility infrastructure assets in Australia and other OECD countries
Overview of Spark Infrastructure
CitiPowerCitiPower ETSAETSAPowercorPowercor
49%
Spark InfrastructureSpark Infrastructure
Institutions& Retail
19.5%
Institutions& Retail
PartnersCKI / DBPartnersCKI / DB
CKI / HKECKI / HKE
80.5%
51%
(1) Note all references are $Aust
5

Relative Strengths of Spark Infrastructure
Spark Infrastructure strengths
Regulatory certainty for a further 4.5 years across total portfolio
Stable and predictable cash-flows provide relative certainty of attractive and sustainable yield
Potential for organic growth from existing businesses
Quality businesses and management teams
Strength and track record of partners
Strength and independence of board
Prudent long term international growth strategy
6

Benefits of Co-investment Model
19.5% cornerstone investment in Spark
Provides Spark with access to global deal flow from CKI & RREEF, organisations with a global presence and access to investment opportunities
Partnering/co-investment vehicle for future acquisitions
Provides CKI and RREEF with potential access to equity to fund future acquisitions
Ability to target larger investment opportunities globally
Significant experience in not only owning, but also operating infrastructure businesses within varied regulated environments
Provides resources and asset/funds management expertise
7

Key Metrics
1 Based on share price of $1.23 (25 August 2006). 2 Calculations based on share price of $1.23, second instalment of $0.54 and interest. Expected Final Instalment payment date is 15 March 20073 Based on Spark Infrastructure’s net debt of $425 million plus Asset Company net senior debt ($2,112m) / EV (fully paid – based on share price
of $1.23 (25 August 2006))4 Any deficit in performance in any period is carried forward and taken into account in determining whether the return exceeds the benchmark
return and whether a performance fee is payable.5 All financial forecasts have been prepared by Spark. As with all forward looking statements, there can be no guarantee that the financial
outcomes, including distributions will be achieved. Forward looking statements involve risks and uncertainties that may cause actual outcomes to be different from the forward looking statements.
$millionSecurity metrics
Market Cap. $1.8 billion (fully paid)
IPO Price per security $1.80 (fully paid)First Instalment price $1.26
$0.54 + interest (5cps)Second Instalment¹
Forecast Distributions 2 5
FY06 cash yield 12.37%¹
FY07 cash yield 9.4% (fully paid)²
Tax deferred portion FY06: 4.5%
FY07: 20.4%
$millionFinancials 2
Market based gearing 3 59.6%EV/ FY06e EBITDA 9.25xEV/ RAB (adjusted Dec 05) 1.32x
Management FeesBase fees 0.5% of EV < $2.4b
1.0% of EV > $2.4b
Performance fee 4 20% return>ASX200 Ind. Acc. Index
Regulatory revenue baseETSA $2.5b (49% of total RAB)Powercor $1.6b (31% of total RAB)CitiPower $1.0b (20% of total RAB)Regulated revenues Circa 80% (73-83% per asset)Regulated asset base FY05e average $5.1b
Asset level credit rating A- (S&P)Fund credit rating Baa1 (Moody’s)
Market price (25 August 2006) $1. 23
Free float $1.6 billion (fully paid)
FY06 cash distribution 15.22 centsFY07 cash distribution 17.06 centsNext distribution date 15 Mar 2007
WACCETSA 7.13% (pre tax, real)Citipower/Powercor 5.90% (post tax, real)
8

Analyst Coverage Recommendation Target price
Date
Deutsche Bank Yes Buy $1.38 28 August
Merrill Lynch Yes Buy $1.30 28 August
Citigroup Yes Buy $1.36 28 August
ABN AMRO Yes Hold $1.35 28 August
Aegis Equities Yes Buy $1.31 28 August
Current broker coverage
9

Existing business portfolio
10

Electricity Industry Supply Chain in Australia
GENERATION TRANSMISSION DISTRIBUTION RETAIL
Competitive Regulated Natural
Monopolies
Regulated Natural
Monopolies
Competitive
VIC & SA KEY PLAYERS
VictoriaSP AusNet
Victoria
SP AusNetAGL
United EnergySouth AustraliaElectraNet SA
South Australia
11

Regulatory Certainty Until 2010
• Well established, transparent regulatory process – Resets every 5 years
• CPI – X price formula
• Businesses can benefit from efficiency out performance
• Existing price determinations remain in force until their expiry in 2010
Regulated Revenue
Regulated Asset Base WACC OPEXDepreciation= ++X
(Inc. forecast Capex)
Regulated tariff
Actual Revenue
Regulated Revenue
target
Regulators Forecast volume
Actual Volume Regulated tariff
=
=
x
x
1
3
2
121. Based on 10 yr Treasury Note2. Depreciation based on regulated economic life of assets3. X factor is currently +1.1 in Victoria, and -0.8 in South Australia

Existing Business Portfolio
Business Electricity distribution network in the CBD and inner suburban areas of Melbourne
Network 4,132km servicing 157 km2
Customers 293,000Asset infrastructure 39 zone / 3,148 distribution
substations and 60,487 poles
Wires underground 45%State regulator ESCPrice determination Completed 2006-2010 Final
Price DecisionNetwork availability 99.99%
ETSA CitiPower
Powercor
Business Electricity distribution network in the state of South Australia
Network 80,645km servicing 178,200 km2 of South Australia
Customers 776,000Asset infrastructure 394 zone / 66,336
distribution substations and 723,000 poles
Wires underground 14%State regulator ESCOSAPrice determination Completed 2005-2010 Final
Price (variation) determinationNetwork availability 99.97%
Business Electricity distribution network in Central and Western Victoria and the Western suburbs of Melbourne
Network 81,613km servicing 150,000 km2
Customers 656,000Asset infrastructure 67 zone / 74,973
distribution substations and 515,562 poles
Wires underground 7%State regulator ESCPrice determination Completed 2006-2010
Final Price DecisionNetwork availability 99.97%
Queensland
Sydney
SouthAustralia
WesternAustraIia
Tasmania
VictoriaAdelaide
NorthernTerritory
Melbourne
New South Wales
High quality management teams with track record of outperforming operational and financial regulatory targets
Natural monopoly “Poles and Wires”businesses
RAB $5.1b (FY05 average)
No energy market related price risk
A- credit ratings by S & P
Well maintained long life assets which have demonstrated superior reliability and performance
13

Quality AssetsRegulation Market Position Certainty
Electricity distribution to Melbourne CBD and inner suburbsMost reliable urban distribution business in Australia 31 Dec 2004
Regulated income certainty until 31 Dec 2010
Regulated income certainty until 31 Dec 2010
Regulated income certainty until 30 June 2010
Largest electricity distributor in Victoria covering western half of the StateMost reliable ruraldistribution business in Australia 31 Dec 2004
Only significant electricity distributor in South Australia
Growth
Regulated by ESCRevenue linked to inflationPrudent hedging policies to mitigate against interest rate movementsCalculation of WACC incorporates interest rate movements
Victorian electricity consumption forecast to grow by 1.8 p.a.Opportunity to outperform subject to weather
Regulated by ESCRevenue linked to inflationPrudent hedging policies to mitigate against interest rate movementsCalculation of WACC incorporates interest rate movements
Victorian electricity consumption forecast to grow by 1.8 p.a.Opportunities for growth in unregulated business activityOpportunity to outperform subject to weather
Regulated by ESCOSARevenue linked to inflationPrudent hedging policies to mitigate against interest rate movementsCalculation of WACC incorporates interest rate movements
Strong growth in un-regulated business activity by winning contracts to supply of servicesSouth Australian electricity consumption forecast to grow by 1.4% p.a.
14

Investment model & criteria
15
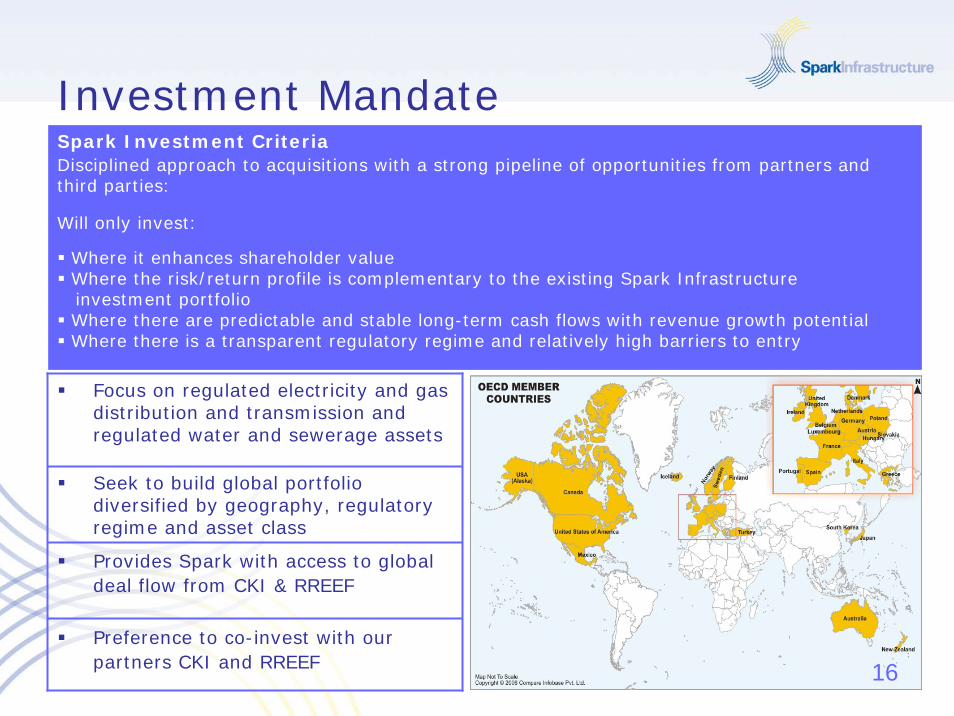
Investment Mandate
Focus on regulated electricity and gas distribution and transmission and regulated water and sewerage assets
Seek to build global portfolio diversified by geography, regulatory regime and asset class
Provides Spark with access to global deal flow from CKI & RREEF
Preference to co-invest with our partners CKI and RREEF
Spark Investment CriteriaDisciplined approach to acquisitions with a strong pipeline of opportunities from partners and third parties:
Will only invest:
Where it enhances shareholder valueWhere the risk/return profile is complementary to the existing Spark Infrastructure investment portfolioWhere there are predictable and stable long-term cash flows with revenue growth potentialWhere there is a transparent regulatory regime and relatively high barriers to entry
16

Financial performanceResults to 30 June 2006
17

Financial performance
1 Figures represent Spark 49% share of aggregated asset company totals excluding transmission revenue which is “pass through” and does not contribute to profit
2 Budget plans underpin prospectus/PDS3 This excludes the non-cash impact of movements in the fair value of financial instruments which do not qualify for hedge accounting in the
asset companies’ accounts, being a positive impact of $15.6 million and a related tax expense of $2.7 million.
Spark and asset companies perform above prospectus/PDS expectations
Upgrade to distribution guidance for 2006
Spark Financial performance6 months to 30 June 2006
Actual($m)
PDS²($m)
Variance
Asset company revenue (Spark share)¹ 332.9 320.0 4.1%
Asset company EBITDA (Spark share)¹ 238.2 224.9 5.9%
Spark’s underlying income³ 96.4 84.2 14.5%
Spark distributionsFY ending 31 December 2006
Current PDS Variance
Forecast distribution per stapled security 15.22 cents
14.07 cents
8.2%
Forecast Yield(market close 25 August 2006)
12.37% 11.17% 10.7%
18

Spark InfrastructureHighlights
Forecast 2006 distributions increased due to better than forecast performance:Increased by 8.2% from 14.07 cents (prospectus/PDS) to 15.22 cents per stapled security
Asset companies well managed and performing strongly:Very strong management teams that continue to outperform financial and operational targetsFavourable weather factors and strong customer growth leading to increased domestic consumptionEffective control of costsGrowth in unregulated business activityCapital investment of $204.7 million (Spark share $100.3 million – in line with prospectus/PDS forecast) in the underlying businesses that is expected to generate ongoing electricity distribution revenue
Growth in unregulated business activity:Achieved by winning contracts for construction, maintenance and asset management services –unregulated revenue of $157.2 million (Spark share $77.0 million) accounts for 23% of total revenue
Strong cash-flow backed distributionsAll forecast cash distributions to be paid from operating cash-flows – no re-gearing or re-valuing to pay distributions
Gearing level conservative and hedged:Spark’s gearing of 59.6% on a look through basisA- credit ratings re-affirmed for asset companies 19

Aggregated Results Asset companies
Seasonality impact on sales – financial performance for the half year period is ahead of expectations due mainly to favourable weather factors and strong customer growth.
Capital Expenditure – asset companies continue to invest in expansion of networks, improving asset performance and reliability, and replacement of assets -$204.7 million invested over the HY is expected to result in increased revenue in future periods.
Un-regulated business – good growth achieved in un-regulated business activity through winning of contracts in construction, maintenance and asset management. Un-regulated revenue now accounts for 23% of total revenue.²
Net operating cost – operating expenses have been effectively constrained while earnings have been ahead of expectations for the half year period.
1 Business plan outcomes underpin the prospectus/PDS forecasts2 Transmission revenue is ‘pass through’ and does not contribute to profit. It is therefore excluded from this calculation.3 This excludes the non-cash impact of movements in the fair value of financial instruments which do not qualify for hedge accounting in
the asset companies’ accounts. The profit before tax excludes a positive impact of $18.9 million and the profit after tax excludes an additional tax credit of $13.0 million.
ETSA, Powercor & CitiPower6 months to 30 June 2006
Actual($ millions)
Prospectus/PDS¹($ millions)
Variance(percent)
Electricity Distribution Revenue 522.2
157.2
679.4
(193.2)
486.2
349.8
64.8
67.2
204.7
504.5 ▲3.5%
Other Revenue 147.9 ▲6.3%
Total Revenue² 652.4 ▲4.1%
Net Profit before Tax (underlying)³ 39.9 ▲62.4%
Profit after tax (underlying)³ 37.2 ▲80.6%
Capital expenditure (gross) 204.3 ▲0.2%
Total Cash Operating Expenses (195.5) ▼1.2%
EBITDA 459.0 ▲5.9%
EBIT 323.1 ▲8.3%
20

Financial PerformanceSpark Infrastructure6 months to 30 June 2006 (Underlying)
Actual($ millions)
Prospectus/PDS ($ millions)
Variance(percent)
Income from associates – interest 48.0 48.0
Income from associates – underlying share of Net profits of Associates accounted for using equity method
47.7 35.8 ▲33.2%
Other income – interest 0.7 0.4
General and administrative expenses (1.6) (2.6) ▼38.5%
Profit before income tax and Loan Notes interest 75.6 61.9 ▲22.1%
Income tax expense (2.1) (0.6)
Underlying net profit after tax attributable to Security Holders
5.6 (6.6)
Tax effect (2.7)
Impact on equity share profits of movements in financial instruments
15.6
Interest expense - Loan Notes (distribution paid /payable to Security Holders)
(67.9) (67.9)
Profit before tax attributable to Security Holders 7.7 (6.0)
Total income 96.4 84.2 ▲14.5%
Management fees (5.4) (5.7) ▼5.3%
Finance costs - Senior Debt (13.8) (14.0) ▼1.4%
Net profit attributable to Security Holders 18.5 (6.6) 21

Outlook
22

Outlook
2006 forecast total distributions for 2006 to 15.22 cents per stapled security – increased by 1.15 cents per stapled security, 8.2% above prospectus/PDS forecast
Spark Infrastructure is confident that the asset companies will achieve their budget outcomes for the second half of 2006 subject to the assumptions contained in the prospectus/PDS
We confirm the forecast cash distribution of 17.06 cents per stapled security for 2007 as indicated in the prospectus/PDS
The asset companies are well managed and have significant potential for organic growth
Regulatory certainty until 2010
Strong pipeline of investment opportunities – co-investment with CKI and RREEF
23
Outlook
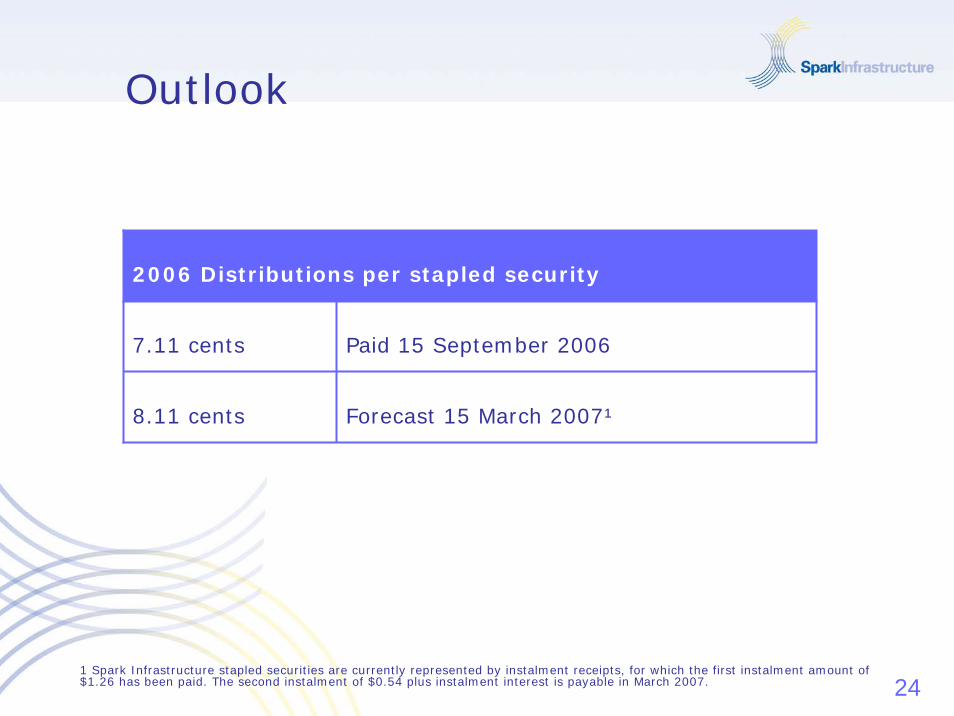
2006 Distributions per stapled security
7.11 cents Paid 15 September 2006
8.11 cents Forecast 15 March 2007¹
1 Spark Infrastructure stapled securities are currently represented by instalment receipts, for which the first instalment amount of $1.26 has been paid. The second instalment of $0.54 plus instalment interest is payable in March 2007. 24

QUESTIONS
Related Documents