ROLE OF SEDENTARY AND PHYSICAL ACTIVITY PATTERNS ON FRAILTY SYNDROME PhD in Public Health Research and Physical Activity International PhD Thesis Asier Mañas Bote Toledo, 2019

Welcome message from author
This document is posted to help you gain knowledge. Please leave a comment to let me know what you think about it! Share it to your friends and learn new things together.
Transcript
ROLE OF SEDENTARY AND
PHYSICAL ACTIVITY PATTERNS
ON FRAILTY SYNDROME
PhD in Public Health Research and Physical Activity
International PhD Thesis
Asier Mañas Bote
Toledo, 2019


International PhD Thesis
ROLE OF SEDENTARY AND
PHYSICAL ACTIVITY PATTERNS
ON FRAILTY SYNDROME
Asier Mañas Bote
Supervisors:
Ignacio Ara Royo
Borja del Pozo Cruz
Amelia Guadalupe Grau
University of Castilla-La Mancha
PhD in Public Health Research and Physical Activity
Department of Physical Activity and Sport Sciences
Faculty of Sport Sciences
Toledo, Spain (2019)

I have noticed even people who claim everything is predestined,
and that we can do nothing to change it,
look before they cross the road.
Stephen Hawking, English theoretical physicist

Any man could,
if he were so inclined,
be the sculptor of his own brain.
Santiago Ramón y Cajal, Spanish neuroscientist.

ROLE OF SEDENTARY
AND PHYSICAL ACTIVITY PATTERNS
ON FRAILTY SYNDROME
PHD SUPERVISORY BOARD
PhD. Ignacio Ara
Royo
PhD. Borja del Pozo
Cruz
PhD. Amelia
Guadalupe Grau
Faculty of Sport
Sciences.
University of Castilla-
La Mancha.
Institute for Positive
Psychology and
Education.
Australian Catholic
University.
Faculty of Physical
Activity and Sport.
Technical University
of Madrid.
PHD EXAMINATION BOARD
President Secretary Vocal
PhD. Francisco B.
Ortega
PhD. Eric J. Shiroma PhD. Ulf Ekelund
Faculty of Sport
Sciences.
University of
Granada.
Laboratory of
Epidemiology and
Population Science.
National Institute on
Aging.
Department of Sport
Medicine.
Norwegian School of
Sport Sciences.

Dr. Ignacio Ara Royo
Associate Professor
Department of Physical Activity and Sport Sciences
Faculty of Sport Sciences, Toledo
University of Castilla-La Mancha
Dr. Ignacio Ara Royo, Associate Professor of the University of Castilla-La
Mancha in the Faculty of Sport Sciences of Toledo,
Certify:
That the International PhD thesis entitled "Role of sedentary and
physical activity patterns on frailty syndrome" presented by Mr. Asier Mañas
Bote to the committee designated by the University of Castilla-La Mancha,
has been carried out under my direction, being an expression of the
technical and interpretative capacity of its author in conditions that he
deserves the title of Doctor with International Mention, provided by the
committee if it considers so.
Signed by Ignacio Ara Royo
In Toledo, 25 October 2019

Dr. Borja del Pozo Cruz
Senior Research Fellow
Institute for Positive Psychology and Education
Faculty of Health Sciences, Sydney
Australian Catholic University
Dr. Borja del Pozo Cruz, Senior Research Fellow of the Australian
Catholic University in the Faculty of Health Sciences of Sydney,
Certify:
That the International PhD thesis entitled "Role of sedentary and
physical activity patterns on frailty syndrome" presented by Mr. Asier Mañas
Bote to the committee designated by the University of Castilla-La Mancha,
has been carried out under my direction, being an expression of the
technical and interpretative capacity of its author in conditions that he
deserves the title of Doctor with International Mention, provided by the
committee if it considers so.
Signed by Borja del Pozo Cruz
In Toledo, 25 October 2019

Dra. Amelia Guadalupe Grau
Assistant Professor
Department of Health and Human Performance
Faculty of Sport Sciences, Madrid
Technical University of Madrid
Dra. Amelia Guadalupe Grau, Assistant Professor of the Technical
University of Madrid in the Faculty of Sport Sciences,
Certify:
That the International PhD thesis entitled "Role of sedentary and
physical activity patterns on frailty syndrome" presented by Mr. Asier Mañas
Bote to the committee designated by the University of Castilla-La Mancha,
has been carried out under my direction, being an expression of the
technical and interpretative capacity of its author in conditions that he
deserves the title of Doctor with International Mention, provided by the
committee if it considers so.
Signed by Amelia Guadalupe Grau
In Toledo, 25 October 2019

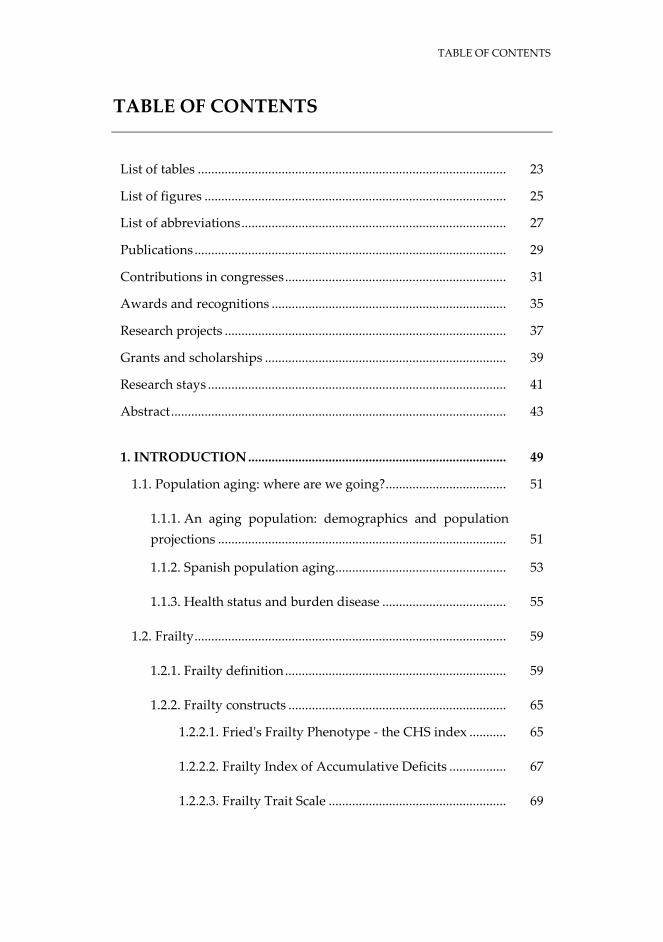
TABLE OF CONTENTS
TABLE OF CONTENTS
List of tables ............................................................................................ 23
List of figures .......................................................................................... 25
List of abbreviations ............................................................................... 27
Publications ............................................................................................. 29
Contributions in congresses .................................................................. 31
Awards and recognitions ...................................................................... 35
Research projects .................................................................................... 37
Grants and scholarships ........................................................................ 39
Research stays ......................................................................................... 41
Abstract .................................................................................................... 43
1. INTRODUCTION ............................................................................. 49
1.1. Population aging: where are we going? .................................... 51
1.1.1. An aging population: demographics and population
projections ...................................................................................... 51
1.1.2. Spanish population aging ................................................... 53
1.1.3. Health status and burden disease ..................................... 55
1.2. Frailty ............................................................................................. 59
1.2.1. Frailty definition .................................................................. 59
1.2.2. Frailty constructs ................................................................. 65
1.2.2.1. Fried's Frailty Phenotype - the CHS index ........... 65
1.2.2.2. Frailty Index of Accumulative Deficits ................. 67
1.2.2.3. Frailty Trait Scale ..................................................... 69
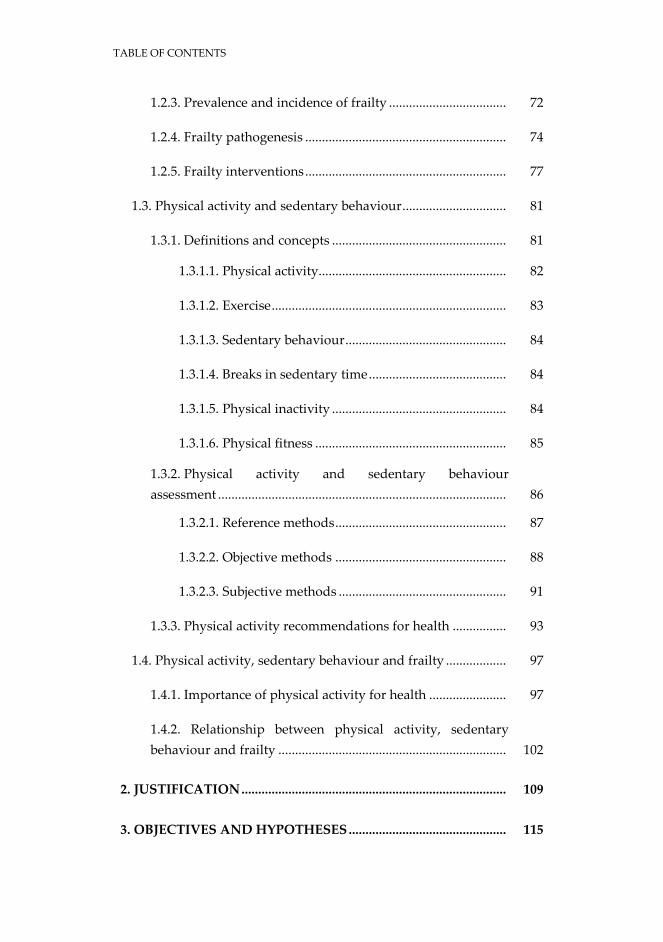
TABLE OF CONTENTS
1.2.3. Prevalence and incidence of frailty ................................... 72
1.2.4. Frailty pathogenesis ............................................................ 74
1.2.5. Frailty interventions ............................................................ 77
1.3. Physical activity and sedentary behaviour ............................... 81
1.3.1. Definitions and concepts .................................................... 81
1.3.1.1. Physical activity........................................................ 82
1.3.1.2. Exercise ...................................................................... 83
1.3.1.3. Sedentary behaviour ................................................ 84
1.3.1.4. Breaks in sedentary time ......................................... 84
1.3.1.5. Physical inactivity .................................................... 84
1.3.1.6. Physical fitness ......................................................... 85
1.3.2. Physical activity and sedentary behaviour
assessment ...................................................................................... 86
1.3.2.1. Reference methods ................................................... 87
1.3.2.2. Objective methods ................................................... 88
1.3.2.3. Subjective methods .................................................. 91
1.3.3. Physical activity recommendations for health ................ 93
1.4. Physical activity, sedentary behaviour and frailty .................. 97
1.4.1. Importance of physical activity for health ....................... 97
1.4.2. Relationship between physical activity, sedentary
behaviour and frailty .................................................................... 102
2. JUSTIFICATION ............................................................................... 109
3. OBJECTIVES AND HYPOTHESES ............................................... 115

TABLE OF CONTENTS
4. MATERIAL AND METHODS ........................................................ 125
4.1. Systematic Review ....................................................................... 127
4.1.1. Literature search .................................................................. 127
4.1.2. Eligibility criteria ................................................................. 129
4.2. Participants of the studies ........................................................... 131
4.3. Data collection .............................................................................. 133
4.3.1. Cross-sectional studies........................................................ 134
4.3.2. Longitudinal studies ........................................................... 136
4.4. Assessments .................................................................................. 137
4.4.1. Anthropometrics and confounding variables ................. 137
4.4.2. Physical activity and sedentary behaviour ...................... 139
4.4.2.1. Time ........................................................................... 139
4.4.2.2. Patterns ...................................................................... 140
4.4.2.3. Categories .................................................................. 141
4.4.3. Frailty .................................................................................... 144
4.4.4. Physical Function ................................................................ 146
4.5. Data analyses ................................................................................ 147
5. RESULTS ............................................................................................ 155
5.1. Study 1 ........................................................................................... 157
5.2. Study 2 ........................................................................................... 173
5.3. Study 3 ........................................................................................... 185
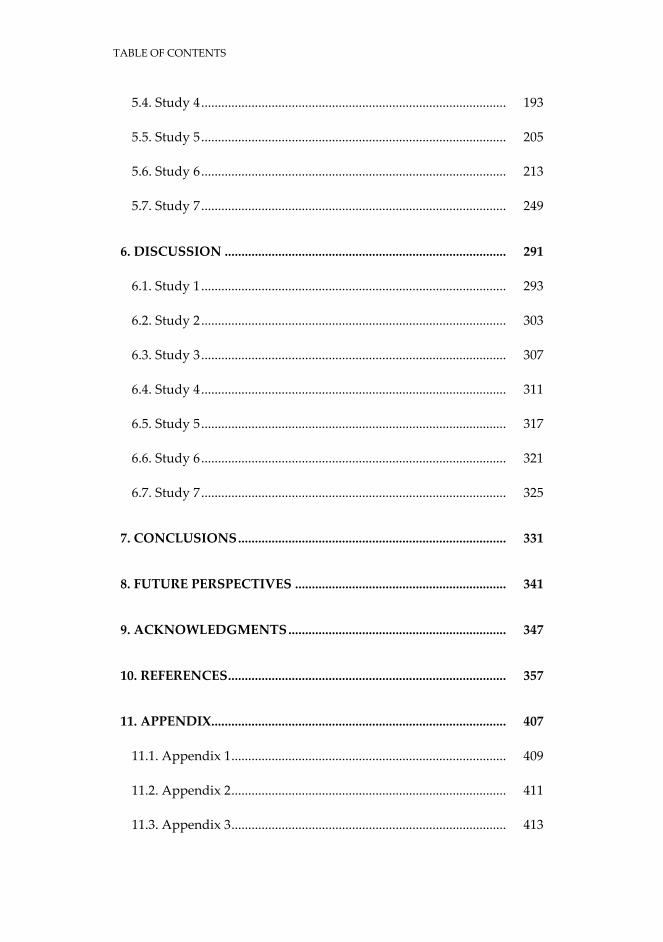
TABLE OF CONTENTS
5.4. Study 4 ........................................................................................... 193
5.5. Study 5 ........................................................................................... 205
5.6. Study 6 ........................................................................................... 213
5.7. Study 7 ........................................................................................... 249
6. DISCUSSION .................................................................................... 291
6.1. Study 1 ........................................................................................... 293
6.2. Study 2 ........................................................................................... 303
6.3. Study 3 ........................................................................................... 307
6.4. Study 4 ........................................................................................... 311
6.5. Study 5 ........................................................................................... 317
6.6. Study 6 ........................................................................................... 321
6.7. Study 7 ........................................................................................... 325
7. CONCLUSIONS ................................................................................ 331
8. FUTURE PERSPECTIVES ............................................................... 341
9. ACKNOWLEDGMENTS ................................................................. 347
10. REFERENCES ................................................................................... 357
11. APPENDIX........................................................................................ 407
11.1. Appendix 1 .................................................................................. 409
11.2. Appendix 2 .................................................................................. 411
11.3. Appendix 3 .................................................................................. 413
LIST OF TABLES
23
LIST OF TABLES
INTRODUCTION
Table 1 Projection of the Spanish population residing in
Spain by age groups, 2018-2033 ............................ 54
MATERIAL AND METHODS
Table 2 Main characteristics of the subjects included in
studies 2 and 3 ........................................................ 134
Table 3 Main characteristics of the subjects included in
the study 4 ............................................................... 135
Table 4 Main characteristics of the subjects included in
the study 5 ............................................................... 135
Table 5 Main characteristics of the subjects included in
studies 6 and 7 ........................................................ 136
RESULTS
(Study 1)
Table 1 Main characteristics of the selected studies ........ 163
(Study 2)
Table 1 Characteristics of the participants in the study .. 179
Table 2 Linear regression analysis for the association of
various sedentary behaviour patterns with
frailty in the TSHA study ...................................... 180
(Study 3)
Table 1 Comparison of Characteristics in Those
Included and Excluded by Accelerometry From
the Study .................................................................. 189
LIST OF TABLES
24
Table 2 Single Behavior, Partition, and Isotemporal
Substitution Models for Frailty (FTS) in Elderly
People ....................................................................... 189
Table 3 Single Behavior, Partition, and Isotemporal
Substitution Models for Frailty (FTS)
Subdivided by Comorbidity (Charlson Index)
in Elderly People .................................................... 190
(Study 4)
Table 1 Participant characteristics ..................................... 198
Table 2 Categorical associations with physical function
and frailty ................................................................ 200
Table 3 Continuous associations with physical function
and frailty ................................................................ 200
(Study 5)
Table 1 Participant Characteristics .................................... 208
(Study 6)
Table 1 Sociodemographic and descriptive data ............. 244
Supplementary
File 1
Comparison of characteristics at baseline of
participants retained with those of participants
not retained from wave1-wave2 ........................... 248
(Study 7)
Table 1 Sociodemographic and descriptive data ............. 283
Supplementary
File 1
Comparison of characteristics at baseline of
participants retained with those of individuals
not retained from T1-T2 ......................................... 288
LIST OF FIGURES
25
LIST OF FIGURES
INTRODUCTION
Figure 1 Global population by broad age group, in 1980, 2017,
2030 and 2050 ..................................................................... 52
Figure 2 Vulnerability of frail older adults to external stressors 60
Figure 3 Venn diagram displaying extent of overlap of frailty
with activities of daily living disability and
comorbidity (≥2 diseases) ................................................. 64
Figure 4 Cycle of frailty .................................................................... 66
Figure 5 Pathogenesis of the frailty syndrome: potential
underlying mechanisms and hypothetical modal
pathways leading to frailty .............................................. 75
Figure 6 Conceptual model of movement-based terminology
arranged around a 24-h period ........................................ 81
Figure 7 Components of total daily energy expenditure and
measurement approaches ................................................. 86
Figure 8 Proportion of time-awake at different categories of
accelerometer counts for U.S. adults, by sex and age
group, 2003-2004 ................................................................ 98
Figure 9 Low cardiorespiratory fitness as a major health
problem ............................................................................... 99
Figure 10 Physical activity positively affects function of multiple
components of the syndrome of frailty .......................... 103
MATERIAL AND METHODS
Figure 11 Mutually exclusive behavioural categories ................... 142
RESULTS
(Study 1)
LIST OF FIGURES
26
Figure 1 Flow diagram on identification, screening, eligibility
and inclusion of full-text articles ..................................... 162
(Study 2)
Figure 1 Frailty trait scale score in different groups .................... 180
(Study 4)
Figure 1 Ternary plots of the mutually exclusive behavioural
categories of time spent in sedentary behavior (SB),
light physical activity (LPA) and moderate-to-
vigorous physical activity (MVPA) ................................. 199
(Study 5)
Figure 1 Conditional effect of sedentary time on frailty as
function of moderate-to-vigorous physical activity ..... 209
Appendix
1
Relationship between sedentary time and moderate-
to-vigorous physical activity with frailty ....................... 212
(Study 6)
Figure 1 Flow diagram of the process for obtaining the final
sample of the study ........................................................... 245
Figure 2 Cross-lagged panel model 1: Moderate-to-vigorous
physical activity ................................................................. 246
Figure 3 Cross-lagged panel model 2: Sedentary behavior ......... 247
(Study 7)
Figure 1 Cross-lagged panel model 1: Total sample .................... 285
Figure 2 Cross-lagged panel model 2: Physically active
individuals .......................................................................... 286
Figure 3 Cross-lagged panel model 3: Physically inactive
individuals .......................................................................... 287
LIST OF ABBREVIATIONS
27
LIST OF ABBREVIATIONS
ATC Anatomical Therapeutic Chemical
BMI Body Mass Index
BST Break in Sedentary Time
CFI Confirmatory Fit Index
CHS Cardiovascular Health Study
CSHA Canadian Study of Health and Aging
FI Frailty Index
FRADEA Frailty and Dependence in Albacete
FTS Frailty Trait Scale
IFN Interferon
IL Interleukin
LIFE Lifestyle Interventions and Independence for Elders
LPA Light Physical Activity
MeSH Medical Subject Headings
MET Metabolic Equivalent of Task
MMSE Mini-Mental State Examination
MPA Moderate Physical Activity
MVPA Moderate-to-Vigorous Physical Activity
RCT Randomized Control Trial
RMSEA Root Mean Square Error of Approximation
SB Sedentary Behaviour
SD Standard Deviation
SHARE Survey of Health, Ageing and Retirement
SPPB Short Physical Performance Battery
SRMR Standardized Root Mean Square Residual
LIST OF ABBREVIATIONS
28
ST Sedentary Time
ST-10 ≥10-min Bout of Sedentary Time
TLI Tucker-Lewis Index
TNF Tumour Necrosis Factor
TSHA Toledo Study for Healthy Aging
VPA Vigorous Physical Activity
WHO World Health Organization
WOS Web of Science
PUBLICATIONS
29
PUBLICATIONS
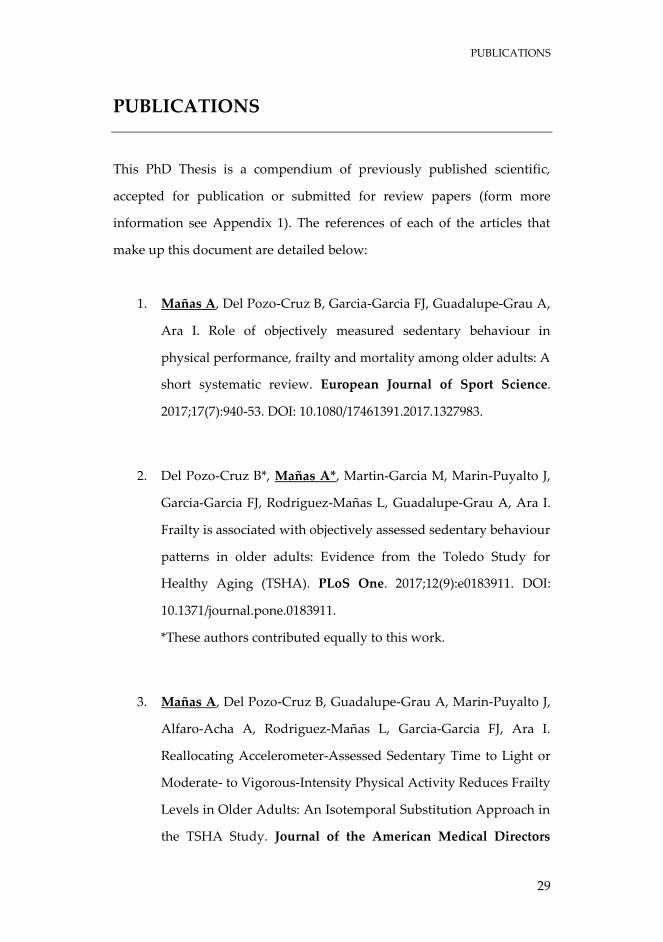
This PhD Thesis is a compendium of previously published scientific,
accepted for publication or submitted for review papers (form more
information see Appendix 1). The references of each of the articles that
make up this document are detailed below:
1. Mañas A, Del Pozo-Cruz B, Garcia-Garcia FJ, Guadalupe-Grau A,
Ara I. Role of objectively measured sedentary behaviour in
physical performance, frailty and mortality among older adults: A
short systematic review. European Journal of Sport Science.
2017;17(7):940-53. DOI: 10.1080/17461391.2017.1327983.
2. Del Pozo-Cruz B*, Mañas A*, Martin-Garcia M, Marin-Puyalto J,
Garcia-Garcia FJ, Rodriguez-Mañas L, Guadalupe-Grau A, Ara I.
Frailty is associated with objectively assessed sedentary behaviour
patterns in older adults: Evidence from the Toledo Study for
Healthy Aging (TSHA). PLoS One. 2017;12(9):e0183911. DOI:
10.1371/journal.pone.0183911.
*These authors contributed equally to this work.
3. Mañas A, Del Pozo-Cruz B, Guadalupe-Grau A, Marin-Puyalto J,
Alfaro-Acha A, Rodriguez-Mañas L, Garcia-Garcia FJ, Ara I.
Reallocating Accelerometer-Assessed Sedentary Time to Light or
Moderate- to Vigorous-Intensity Physical Activity Reduces Frailty
Levels in Older Adults: An Isotemporal Substitution Approach in
the TSHA Study. Journal of the American Medical Directors
PUBLICATIONS
30
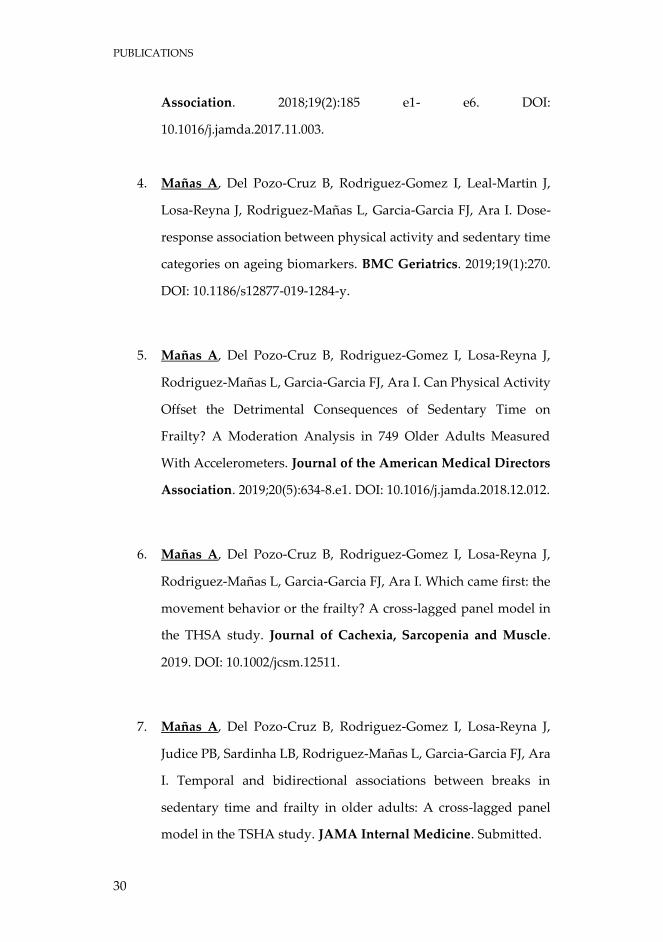
Association. 2018;19(2):185 e1- e6. DOI:
10.1016/j.jamda.2017.11.003.
4. Mañas A, Del Pozo-Cruz B, Rodriguez-Gomez I, Leal-Martin J,
Losa-Reyna J, Rodriguez-Mañas L, Garcia-Garcia FJ, Ara I. Dose-
response association between physical activity and sedentary time
categories on ageing biomarkers. BMC Geriatrics. 2019;19(1):270.
DOI: 10.1186/s12877-019-1284-y.
5. Mañas A, Del Pozo-Cruz B, Rodriguez-Gomez I, Losa-Reyna J,
Rodriguez-Mañas L, Garcia-Garcia FJ, Ara I. Can Physical Activity
Offset the Detrimental Consequences of Sedentary Time on
Frailty? A Moderation Analysis in 749 Older Adults Measured
With Accelerometers. Journal of the American Medical Directors
Association. 2019;20(5):634-8.e1. DOI: 10.1016/j.jamda.2018.12.012.
6. Mañas A, Del Pozo-Cruz B, Rodriguez-Gomez I, Losa-Reyna J,
Rodriguez-Mañas L, Garcia-Garcia FJ, Ara I. Which came first: the
movement behavior or the frailty? A cross-lagged panel model in
the THSA study. Journal of Cachexia, Sarcopenia and Muscle.
2019. DOI: 10.1002/jcsm.12511.
7. Mañas A, Del Pozo-Cruz B, Rodriguez-Gomez I, Losa-Reyna J,
Judice PB, Sardinha LB, Rodriguez-Mañas L, Garcia-Garcia FJ, Ara
I. Temporal and bidirectional associations between breaks in
sedentary time and frailty in older adults: A cross-lagged panel
model in the TSHA study. JAMA Internal Medicine. Submitted.
CONTRIBUTIONS IN CONGRESSES
31
CONTRIBUTIONS IN CONGRESSES
Of the aforementioned scientific works, some previous data have been
presented in different congresses and symposia. Next, all of them are
detailed:
Study 1.
Mañas A. [Importance of sedentary behaviour over physical
function, frailty and mortality]. Importancia del sedentarismo sobre
la funcionalidad física, la fragilidad y la mortalidad. I Simposio de
Avances en Fisiología del Ejercicio, Madrid, Spain (2016). Invited
presentation.
Study 2.
Mañas A, Del Pozo-Cruz B, Martin-Garcia M, Marin-Puyalto J,
Garcia-Garcia FJ, Guadalupe-Grau A, Ara I. The way you spend your
sedentary time also matters: an analysis of the association between
sedentary time, sedentary patterns and frailty in the elderly. 21st
Annual Congress of the European College of Sport Science (ECSS),
Vienna, Austria (2016). Mini-oral presentation.
Mañas A, Del Pozo-Cruz B, Martin-Garcia M, Marin-Puyalto J,
Garcia-Garcia FJ, Guadalupe-Grau A, Ara I. [The way you spend
your sedentary time also matters: an analysis of the association
between sedentary time, sedentary patterns and frailty in the
elderly]. La forma en la que acumulas tu tiempo sedentario también
importa: asociación entre el tiempo sedentario, el patrón sedentario
CONTRIBUTIONS IN CONGRESSES
32
y la fragilidad en personas mayores. VI Jornadas Doctorales
Universidad de Castilla-La Mancha, Toledo, Spain (2016). Poster.
Del Pozo-Cruz B, Mañas A, Martin-Garcia M, Marin-Puyalto J,
Garcia-Garcia FJ, Guadalupe-Grau A, Ara I. Interrupting 10 minutes
blocks of sedentary time is associated with frailty in older adults:
evidence from the Toledo Study for Healthy Aging. 6th
International Society of Physical Activity & Health (ISPAH)
Congress, Bangkok, Thailand (2016). Poster.
Mañas A, Leal-Martín J, Guadalupe-Grau A, Rodriguez-Mañas L,
Garcia-Garcia FJ, Ara I. Breaks in sedentary time could have similar
effects as moderate-to-vigorous physical activity on the reduction of
frailty in older people with comorbidities. I Jornadas
Internacionales de Investigación en Actividad Física y Salud,
Cuenca, Spain (2017). Oral presentation.
Study 3.
Mañas A, Guadalupe-Grau A, Del Pozo-Cruz B, Rodriguez-Gomez
I, Garcia-Garcia FJ, Ara I. [Isotemporal substitution models for the
prevention of frailty: replacing sedentary time with physical
activity]. Modelos de sustitución isotemporal para la prevención de
la fragilidad: reemplazando sedentarismo por actividad física. IX
Congreso Internacional de la Asociación Española de Ciencias del
Deporte, Toledo, Spain (2016). Poster.
CONTRIBUTIONS IN CONGRESSES
33
Leal-Martin J, Mañas A, Alegre L, Guadalupe-Grau A, Garcia-Garcia
FJ, Ara I. [Association between moderate-to-vigorous physical
activity, sedentary time and sedentary breaks with frailty in people
over 65]. Asociación entre actividad física moderada-vigorosa,
tiempo sedentario y rupturas del sedentarismo con la fragilidad en
personas mayores de 65 años. X International Symposium in
Strength Training, Madrid, Spain (2017). Poster.
Study 4.
Mañas A, Del Pozo-Cruz B, Rodriguez-Gomez I, Leal-Martin J, Losa-
Reyna J, Rodriguez-Mañas L, Garcia-Garcia FJ, Ara I. [Moving more
or sitting less? Analysis over physical function in 771 older adults].
¿Moverte más o sentarte menos? Análisis sobre la función física en
771 personas mayores. VIII Jornadas Doctorales Universidad de
Castilla-La Mancha, Cuenca, Spain (2018). Poster.
Mañas A, Del Pozo-Cruz B, Rodriguez-Gomez I, Leal-Martin J, Losa-
Reyna J, Rodriguez-Mañas L, Garcia-Garcia FJ, Ara I. Associations of
mutually exclusive categories of physical activity and sedentary time
on physical function. Moving more or sitting less?. Annual Meeting
International Society of Behavioral Nutrition and Physical
Activity (ISBNPA), Prague, Czech Republic (2019). Poster.
CONTRIBUTIONS IN CONGRESSES
34
Study 5.
Mañas A, Del Pozo-Cruz B, Rodriguez-Gomez I, Losa-Reyna J,
Rodriguez-Mañas L, Garcia-Garcia FJ, Ara I. [Can moderate-to-
vigorous physical activity offset the association between sedentary
time and frailty in older people? A moderation analysis]. ¿Puede la
actividad física moderada-vigorosa compensar la asociación entre
el tiempo sedentario y la fragilidad en personas mayores? Un
análisis de moderación. VI Simposio EXERNET. Investigación en
Ejercicio, Salud y Bienestar. "Exercise is Medicine", Pamplona,
Spain (2018). Poster.
AWARDS AND RECOGNITIONS
35
AWARDS AND RECOGNITIONS
Below are the awards and recognitions resulting from the works presented
in this PhD thesis:
Outstanding student.
University of Castilla-La Mancha. 18/06/2019.
2nd Poster Presentation Award.
Leal-Martin J, Mañas A, Alegre L, Guadalupe-Grau A, Garcia-Garcia FJ,
Ara I.
[Association between moderate-to-vigorous physical activity, sedentary
time and sedentary breaks with frailty in people over 65]. Asociación entre
actividad física moderada-vigorosa, tiempo sedentario y rupturas del
sedentarismo con la fragilidad en personas mayores de 65 años.
X International Symposium in Strength Training. Technical University of
Madrid and National Strength and Conditioning Association (NCSA
Spain). 16/12/2017.
Young Investigators Award (YIA). 5th equal Short Oral Communication.
Mañas A, Del Pozo-Cruz B, Martin-Garcia M, Marin-Puyalto J, Garcia-
Garcia FJ, Guadalupe-Grau A, Ara I.
The way you spend your sedentary time also matters: an analysis of the
association between sedentary time, sedentary patterns and frailty in the
elderly.
21th Annual Congress of the European College of Sport Science. European
College of Sport Science (ECSS). 09/07/2016.
AWARDS AND RECOGNITIONS
36
RESEARCH PROJECTS
37
RESEARCH PROJECTS
The PhD thesis presented below, as well as the articles that comprise it, are
framed within the following research project:
Toledo Study for Healthy Aging (TSHA), Instituto de Salud Carlos
III, 2012-2018.
The studies that are part of this PhD thesis have been partially funded by
the following organizations:
Biomedical Research Networking Center on Frailty and Healthy
Aging (CIBERFES) and FEDER funds from the European Union
(CB16/10/00477, CB16/10/00456, and CB16/10/00464).
European Grant. “FRAILOMIC INITIATIVE” (FP7-305483-2 from
FP7-Health-2012-Innovation, European Union).
Spanish Government (Spanish Ministry of Economy, “Ministerio
de Economía y Competitividad,” Instituto de Salud Carlos III,
PI031558 and RD12/0043, PI10/01532, PI11/01068, PI15/01305).
Government of Castilla-La Mancha (FISCAM – “Junta de
Comunidades de Castilla-La Mancha” PI2010/020; and Institute of
Health Sciences, “Consejería de Sanidad de Castilla-La Mancha”
03031-00).

RESEARCH PROJECTS
38
GRANTS AND SCHOLARSHIPS
39
GRANTS AND SCHOLARSHIPS
The following funding organizations have directly contributed to the
realization of the present PhD Thesis:
Pre-doctoral grant: Universidad de Castilla-La Mancha.
“Contratos predoctorales para la formación de personal investigador en el
marco del Plan Propio de I+D+i, cofinanciados por el Fondo Social
Europeo (2015/4062)”. Duration: 48 months.
Pre-doctoral stay scholarship: CYTEMA – Universidad de
Castilla-La Mancha. “Becas Pre-doc CYTEMA-Net II Convocatoria de
ayudas pre‐doctorales para estancias cortas en Universidades agregadas
al CEI CYTEMA”. Duration: 3 months.
Pre-doctoral stay scholarship: Universidad de Castilla-La
Mancha. “Ayudas para estancias en universidades y centros de
investigación en el extranjero para el año 2019 en el ámbito del Plan
Propio de Investigación, cofinanciadas por el Fondo Europeo de Desarrollo
Regional (Feder). [2018/14343]”. Duration: 2 months.
GRANTS AND SCHOLARSHIPS
40
RESEARCH STAYS
41
RESEARCH STAYS
The PhD candidate has completed two research stays during the time of his
PhD in the following destinations:
Institute for Positive Psychology and Education, Motivation and
Behaviour Research Program. Australian Catholic University.
Sydney (Australia).
Supervisor: Borja del Pozo Cruz, PhD.
Date: from 03rd July 2019 to 03rd October 2019.
Duration: 3 months.
Certificate in Appendix 2.
Exercise and Health Laboratory. University of Lisbon.
Lisbon (Portugal).
Supervisor: Luís B. Sardinha.
Date: from 01st July 2019 to 31st August 2019.
Duration: 2 months.
Certificate in Appendix 3.
RESEARCH STAYS
42
ABSTRACT
43
ABSTRACT
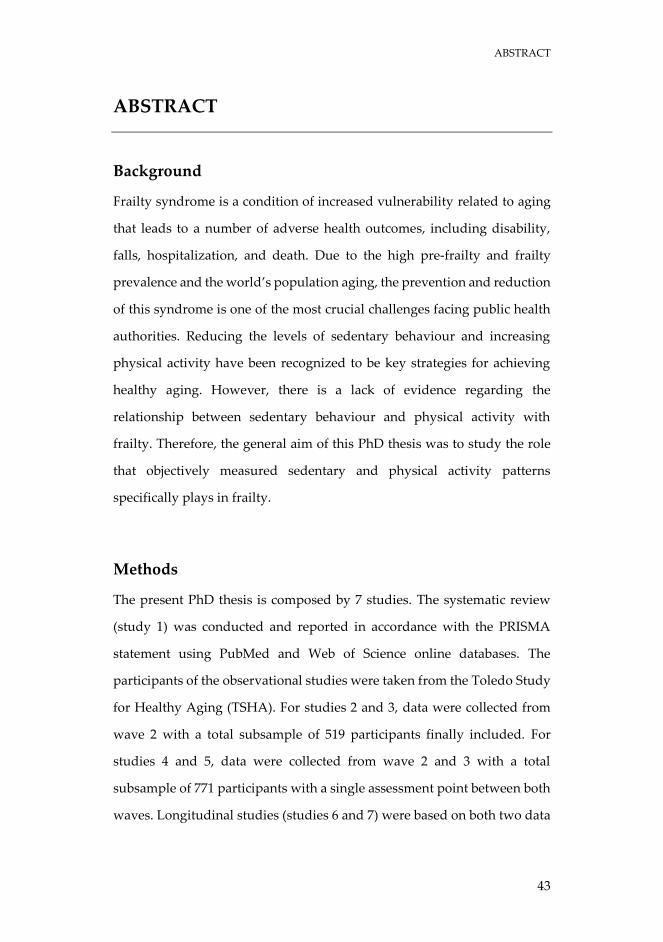
Background
Frailty syndrome is a condition of increased vulnerability related to aging
that leads to a number of adverse health outcomes, including disability,
falls, hospitalization, and death. Due to the high pre-frailty and frailty
prevalence and the world’s population aging, the prevention and reduction
of this syndrome is one of the most crucial challenges facing public health
authorities. Reducing the levels of sedentary behaviour and increasing
physical activity have been recognized to be key strategies for achieving
healthy aging. However, there is a lack of evidence regarding the
relationship between sedentary behaviour and physical activity with
frailty. Therefore, the general aim of this PhD thesis was to study the role
that objectively measured sedentary and physical activity patterns
specifically plays in frailty.
Methods
The present PhD thesis is composed by 7 studies. The systematic review
(study 1) was conducted and reported in accordance with the PRISMA
statement using PubMed and Web of Science online databases. The
participants of the observational studies were taken from the Toledo Study
for Healthy Aging (TSHA). For studies 2 and 3, data were collected from
wave 2 with a total subsample of 519 participants finally included. For
studies 4 and 5, data were collected from wave 2 and 3 with a total
subsample of 771 participants with a single assessment point between both
waves. Longitudinal studies (studies 6 and 7) were based on both two data
ABSTRACT
44
collection waves separated by 4-years with 186 subjects with complete data
on all exposures and outcomes. Briefly, sedentary patterns and physical
activity were measured by accelerometry. Frailty Trait Scale (FTS) was used
to determine frailty levels. Age, sex, educational status, income, and marital
status were self-reported by the participants and used as confounding
variables in the statistical analyses. Moreover, other health-related
outcomes such as body mass index, waist-to-hip ratio, number of drugs,
functional fitness, comorbidity status, and cognitive function were assessed
with standard procedures and also used as confounding variables.
Significance levels were set at P<0.05 in all the analyses performed.
Results
The systematic review (study 1) evidenced that objectively measured
sedentary behaviour was adversely related to physical performance.
However, the association between sedentary behaviour and frailty levels
or mortality rates remained unclear and warranted further research. In the
cross-sectional study 2, we found that sedentary time per day and the
proportion of the day spent in sedentary bouts of 10 minutes or more were
positively linked to frailty. In contrast, breaks in sedentary time were
negatively associated with frailty levels. In the cross-sectional study 3, we
observed that replacing sedentary time with moderate-to-vigorous
physical activity is associated with positive theoretical effects on the frailty
status. In addition, people with comorbidities may also benefit from
substituting sedentary time with light physical activity. When participants
were classified into four movement patterns derived from the physically
active/inactive and low/high sedentary behaviour categories (study 4), it
was found that those physically active older adults had better physical
ABSTRACT
45
function and frailty profiles than those considered physically inactive, even
in the presence of high sedentary time. Higher levels of light physical
activity relative to sedentary time seemed to confer additional
improvements in the frailty profile between those who meet the physical
activity recommendations and also for those who do not. In the study 5, we
found that moderate-to-vigorous physical activity was a moderator in the
relationship between sedentary time and frailty in older adults, offsetting
the detrimental effects of sedentary behaviour with 27 min/d of moderate-
to-vigorous activity. In longitudinal studies 6 and 7, cross-lagged panel
models revealed that the relationship between moderate-to-vigorous
physical activity and sedentary behaviour with frailty was unidirectional:
initial moderate-to-vigorous physical activity predicted future frailty and
baseline frailty was a predictor of sedentary behaviour at follow-up.
Conversely, a reciprocal inverse relationship between breaks in sedentary
time and frailty was displayed in physically inactive participants, while in
active individuals no associations were found.
Conclusions
The relationship between objectively measured sedentary patterns and
frailty in older adults was identified as a gap in the scientific literature
through the systematic review (study 1). In cross-sectional studies, we
found that both reducing sedentary time and introducing frequent short
periods of activity within sedentary periods were associated with reduced
frailty levels (study 2). In addition, we observed that replacing sedentary
time with moderate-to-vigorous physical activity could have positive
theoretical effects on frailty (study 3). Light physical activity could be
ABSTRACT
46
proposed as a middle step strategy for those individuals with comorbidities
(study 3), besides to confer additional improvements on frailty status in
both those who meet and those who do not meet the recommendations of
physical activity (study 4). We also observed that engaging in 27 min/day
of moderate-to-vigorous physical activity could eliminate the potential
negative effects of sedentary behaviour on frailty (study 5). Finally, based
on longitudinal data we found that moderate-to-vigorous physical activity
predicts future frailty (study 6), and therefore, whenever possible, efforts
should be directed towards the promotion of moderate-to-vigorous
physical activity in early stages. For those individuals who do not meet
with physical activity recommendations, the relationship between breaks
in sedentary time with frailty was negative in both directions (study 7), and
consequently, breaking-up sedentary time more frequently could be a good
strategy to attenuate the burden associated with frailty. Future evidence
should move towards experimental studies in order to address the
hypotheses derived from this PhD thesis.
ABSTRACT
47

ABSTRACT
48

49
CHAPTER 1
INTRODUCTION

INTRODUCTION
50
INTRODUCTION
51
1.1. POPULATION AGING:
WHERE ARE WE GOING?
1.1.1. An aging population: demographics and population
projections
The increase in life expectancy and, in some countries, the low birth rate
are causing an accelerated growth in the percentage of older adults, which
has as a consequence an increase in the aging population [1, 2].
The increase in life expectancy is due to the improvement in the quality of
life and fundamentally to the advances in medical science that have
occurred in recent decades [3]. Individuals are reaching ages that were
unthinkable in earlier times, and have significantly increased the number
of octogenarian people [4, 5]. The growing weight of the older adult
population is therefore one of the most significant changes that has
occurred in developed societies in the second half of the 20th century [6, 7].
The overall population aged 60 or over consisted of 962 million in 2017,
which has more than double since 1980, when there were 382 million older
persons worldwide [8]. In addition, the older persons rate is expected to
double again by 2050, when it is estimated to reach nearly 2.1 billion [8].
The number of older persons is a growing phenomenon worldwide: in
reality, it is considered that between 2017 and 2050, every country around
the world will suffer a significant increase in the size of the population aged
60 or over [9]. Without exception, the number of older persons is growing
faster than the number of people in all younger age groups. As a matter of
fact, in 1980, children aged 0-9 considerably exceeded the number of
INTRODUCTION
52
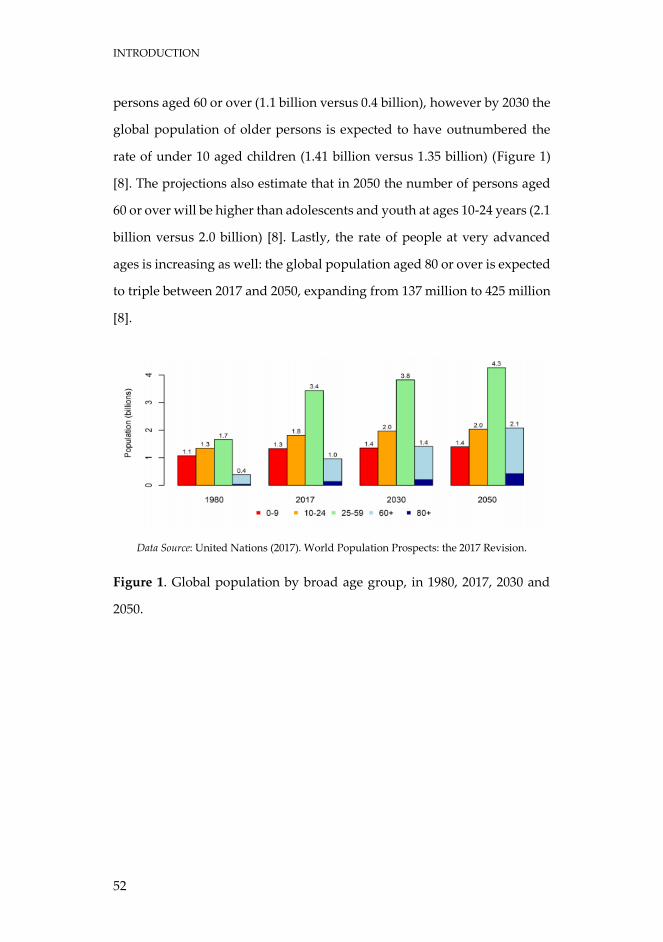
persons aged 60 or over (1.1 billion versus 0.4 billion), however by 2030 the
global population of older persons is expected to have outnumbered the
rate of under 10 aged children (1.41 billion versus 1.35 billion) (Figure 1)
[8]. The projections also estimate that in 2050 the number of persons aged
60 or over will be higher than adolescents and youth at ages 10-24 years (2.1
billion versus 2.0 billion) [8]. Lastly, the rate of people at very advanced
ages is increasing as well: the global population aged 80 or over is expected
to triple between 2017 and 2050, expanding from 137 million to 425 million
[8].
Data Source: United Nations (2017). World Population Prospects: the 2017 Revision.
Figure 1. Global population by broad age group, in 1980, 2017, 2030 and
2050.
INTRODUCTION
53
1.1.2. Spanish population aging
According to the estimates carried out by the United Nations, the
population aging phenomenon is even more alarming in Spain, which
place it as the second oldest country in the world in 2050, whose population
41.9% would be above 60 years old [8].
If an analysis of the data focused on Spain was carried out in comparison
with the rest of the countries, the phenomenon of aging would particularly
mark an obvious growth in our country, as a consequence of a greater
longevity, since in less than 30 years the number of people over 65 has
considerably increased [10]. This process is accentuated by the low birth
rate that has been recorded for some decades. This reduction is registered
in Spain since the mid-70s. In 1975, the average number of children was
almost 3 per woman of childbearing age, while currently it is only 1.31 [11].
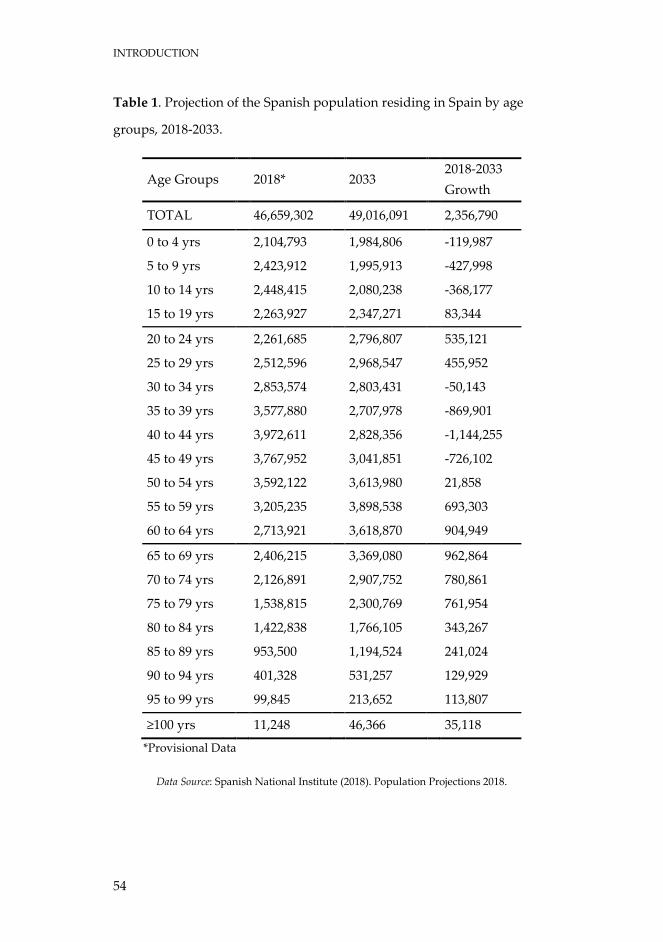
Current data in Spain show that the population over 65 years old is around
19% of the total population, with almost 9 million people, of which
approximately 32% are octogenarian [10]. In this sense and according to the
projections made by the Spanish National Institute (Table 1), in 2033 people
over 65 will be over 25% of the population and the octogenarians will be
close to 4 million, which would represent more than 30% of the total older
population [10].
INTRODUCTION
54
Table 1. Projection of the Spanish population residing in Spain by age
groups, 2018-2033.
Age Groups 2018* 2033 2018-2033
Growth
TOTAL 46,659,302 49,016,091 2,356,790
0 to 4 yrs 2,104,793 1,984,806 -119,987
5 to 9 yrs 2,423,912 1,995,913 -427,998
10 to 14 yrs 2,448,415 2,080,238 -368,177
15 to 19 yrs 2,263,927 2,347,271 83,344
20 to 24 yrs 2,261,685 2,796,807 535,121
25 to 29 yrs 2,512,596 2,968,547 455,952
30 to 34 yrs 2,853,574 2,803,431 -50,143
35 to 39 yrs 3,577,880 2,707,978 -869,901
40 to 44 yrs 3,972,611 2,828,356 -1,144,255
45 to 49 yrs 3,767,952 3,041,851 -726,102
50 to 54 yrs 3,592,122 3,613,980 21,858
55 to 59 yrs 3,205,235 3,898,538 693,303
60 to 64 yrs 2,713,921 3,618,870 904,949
65 to 69 yrs 2,406,215 3,369,080 962,864
70 to 74 yrs 2,126,891 2,907,752 780,861
75 to 79 yrs 1,538,815 2,300,769 761,954
80 to 84 yrs 1,422,838 1,766,105 343,267
85 to 89 yrs 953,500 1,194,524 241,024
90 to 94 yrs 401,328 531,257 129,929
95 to 99 yrs 99,845 213,652 113,807
≥100 yrs 11,248 46,366 35,118
*Provisional Data
Data Source: Spanish National Institute (2018). Population Projections 2018.
INTRODUCTION
55
1.1.3. Health status and burden disease
This last phenomenon is known as "aging of the aging" or "over-aging". Far
from establishing a pessimistic perspective, these demographic
phenomena, is a clear example of the progress and social, economic and
health development of the peoples, as a result of which mortality rates have
been reduced, especially infant mortality, whereas life expectancy has
increased [12]. Undoubtedly it deserves to be considered a triumph, but at
the same time it constitutes a challenge, since aging produces considerable
social, political and economic changes in health systems, pensions, etc. [13].
It is currently estimated that public health expenditure in Spain for 2050-
2060 will lead to an increase of 1.6 points of gross domestic product in total
health expenditure and 0.9 points of gross domestic product in long-term
care. Older people consume 40% of the pharmaceutical benefit and 70% of
the pharmaceutical expenditure [14]. We also know that the greatest health
expense of any person is concentrated in the last phase of his life, especially
in the last year [15, 16].
In parallel with the change in the demographic pattern, this increasingly
aging population shows a change in the epidemiological pattern of both
morbidity and mortality. The disease pattern has evolved from acute
diseases, of a transmissible nature (infectious and contagious) that were
generally isolated, to chronic, degenerative, non-communicable diseases,
the result of habits and lifestyles, and which are generally associated
(pluripathology), interacting negatively in a synergistic way with each
other (comorbidity) [17, 18]. These diseases, in the elderly, have a well
differentiated and unique behaviour characterized by its tendency to
chronicity, not presenting a restitution or complete cure, by the association
of more than one disease per person (multipathology or comorbidity), with
INTRODUCTION
56
the negative interactions that it entails and in addition, by printing different
degrees of clinical frailty, deterioration in the functional domain, loss of
autonomy, disability and dependency for the activities of the daily life [19-
21]. Diseases are responsible for disability and dependence, that is, it is
disease, and not exclusively age, that causes dependence, although
dependence obviously increases in those over 65 and, above all, in the
elderly 80 years old. In Spain, between 15 and 25% of people over 65 are
dependent for basic activities of daily life, and when we consider those over
75 years, these figures reach 25-35% [22].
The aging population is one of the four main trends (along with increases
in non-communicable disease, shifts towards disabling causes and away
from fatal causes, and changes in risk factors, particularly the influence of
obesity) driving a change in the leading causes of disease burden. As a
consequence of the change in the pattern of morbidity, the elderly, in
general, need multiple medications to alleviate, improve or cure their
health problems, finding the phenomenon of “polymedication” or
“pluripharmacy” [23]: continuous consumption during the last 6 months of
four or more active principles, specifically related to chronic and multi-
pathological elderly patients. Thus, polypharmacy is also defined as the
continued consumption of six or more active substances. Today, we know
that 88.9% of people over 65 take any medication, rising to 93.4% when
considering those over 75, and that 94% of people with chronic diseases are
polymedicated [24]. The average medication taken by the elderly varies
between two and four medications per day, but when self-medication is
considered, it rises between four and six, and in institutionalised people
between 4.2 and eight [24].
INTRODUCTION
57
That is to say, we find older and very old people, multi-pathological,
polymedicated, dependent, with a compromised functional reserve, which
makes them frail and vulnerable. Therefore, they require continued or
prolonged professionalized care, which in the community-domiciliary
field, in some occasions, can hardly be guaranteed. First of all, we must
consider as a challenge not only to live many years, but to live with the best
possible state of health, in order to prevent disability and dependency.
Moreover, it is known that medium-term estimates show that the increase
in disability and dependence expected in the coming years is not
attributable exclusively to population demographic change, but to other
factors, some of them modifiable through appropriate intervention, such as
tobacco use, obesity, alcohol use, high blood pressure and physical
inactivity leading lifestyle risk factors [25-28]. Good health is one of the
essential pillars of an economically and socially prosperous society that
also contributes to the sustainability of the system. In this sense, the actions
to be implemented are based on three fundamental pillars: the promotion
of autonomy and self-care through "active aging", the integral prevention
of dependence, and the active participation of health services in these
activities [29, 30].
This increase in population aging is one of the main challenges that we will
have to face in the medium and long term, and it can be an important
challenge for governments that must implement policies to address the
needs and interests of the older population, especially those related to with
health care.

INTRODUCTION
58
INTRODUCTION
59
1.2. FRAILTY
1.2.1. Frailty definition
The health of the elderly must be measured in terms of function and not of
disease, since it is that which determines the life expectancy, the quality of
life and the resources or care that each population will need [31]. The
functional situation prior to the development of disability (restriction or
loss of ability to perform an activity), and dependence (help from a person
to carry out the activity) is one of the best indicators of health status and it
is also a better predictor of disability incident than morbidity [32, 33]. In
this regard, the importance of including this term is to focus on
functionality and not in the diagnosis of disease.
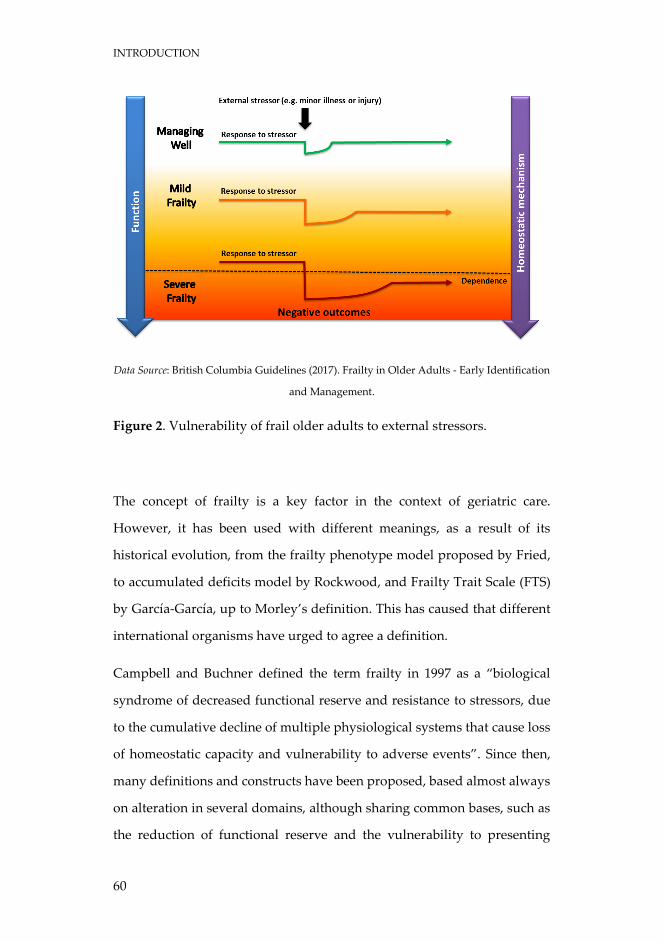
Currently, frailty can be considered as a pre-disability or risk of developing
a new disability from a situation of incipient functional limitation. In other
words, it can be said that frailty is a syndrome characterised by a decrease
in strength and endurance, with an increase in vulnerability to low
intensity stressors, produced by an alteration in multiple interrelated
systems, which decreases the homeostatic reserve and the capacity of
adaptation of the organism, predisposing it to adverse health events, higher
probabilities of dependence and even death (Figure 2).
INTRODUCTION
60
Data Source: British Columbia Guidelines (2017). Frailty in Older Adults - Early Identification
and Management.
Figure 2. Vulnerability of frail older adults to external stressors.
The concept of frailty is a key factor in the context of geriatric care.
However, it has been used with different meanings, as a result of its
historical evolution, from the frailty phenotype model proposed by Fried,
to accumulated deficits model by Rockwood, and Frailty Trait Scale (FTS)
by García-García, up to Morley’s definition. This has caused that different
international organisms have urged to agree a definition.
Campbell and Buchner defined the term frailty in 1997 as a “biological
syndrome of decreased functional reserve and resistance to stressors, due
to the cumulative decline of multiple physiological systems that cause loss
of homeostatic capacity and vulnerability to adverse events”. Since then,
many definitions and constructs have been proposed, based almost always
on alteration in several domains, although sharing common bases, such as
the reduction of functional reserve and the vulnerability to presenting
INTRODUCTION
61
adverse events. The two main theoretical frameworks on which the frailty
construct has been developed are the one defended by Fried and colleagues
in 2001 based on data from the Cardiovascular Health Study (CHS), in
which they established a phenotype as a risk situation to develop disability,
and the one promoted by Rockwood et al. based on data from the Canadian
Study of Health and Aging (CSHA), which determined that frailty consists
of the addition of several health conditions that include, among others,
comorbidity and disability. These approaches diverge both in their
conceptual framework and in the operational approach to frailty, and each
could have a clinical utility in differentiated areas. Despite these
differences, there is a growing consensus that frailty is a state or condition
that precedes disability and that it is intrinsically related to the biological
phenomenon of aging. Recently, a consensus conference sought, using the
Delphi methodology, an operative definition of frailty.
Experts agreed that no single biomarker by itself was adequate for the
assessment of frailty, suggesting a need for a combination of multiple
biomarkers. However, none of the proposed combinations of biomarkers
was able to reach the 80% threshold of agreement required by the Delphi
process. Remarkably important it is the fact that among all the laboratory
biomarkers suggested for the assessment of frailty, none was accepted.
Although an absolute consensus was not reached on the constituent
elements that would be included in an operational definition of frailty, a
high percentage of agreement was detected in the aspects of frailty that are
detailed below:
Frailty is a syndrome of decreased functional reserve and
resistance to stressors, which causes vulnerability.
INTRODUCTION
62
It identifies subjects at high risk of disability and/or other adverse
outcomes.
It is multidimensional, dynamic and nonlinear.
It is different from disability and comorbidity, although the
diseases modulate its appearance.
Diagnosis is useful in primary and community care.
Gait speed, mobility and physical activity can be useful for
diagnosis, as well as the assessment of mental and nutritional
status.
It can be reversible. Physical activity is a treatment.
Subsequently, in 2013, a consensus group led by J.E. Morley defined frailty
as “a medical syndrome of multiple causes characterised by loss of strength
and endurance, and decreased physiological function, which increases
individual vulnerability to develop dependence or death” [34]. This is the
last definition of consensus that we have to identify frailty. In this same
consensus there were also four major points of agreement [34]:
1. Physical frailty is an important medical syndrome. The group
defined physical frailty as “a medical syndrome with multiple
causes and contributors that is characterised by diminished
strength, endurance, and reduced physiologic function that
increases an individual's vulnerability to develop increased
dependency and/or death”.
2. Physical frailty can potentially be prevented or treated with
specific modalities, such as exercise, protein-calorie
supplementation, vitamin D, and reduction of polypharmacy.
INTRODUCTION
63
3. Simple, rapid screening tests have been developed and validated,
such as the simple FRAIL scale, to allow physicians to objectively
recognize frail persons.
4. For the purposes of optimally managing individuals with physical
frailty, all persons older than 70 and all individuals with significant
weight loss (>5%) due to chronic disease should be screened for
frailty.
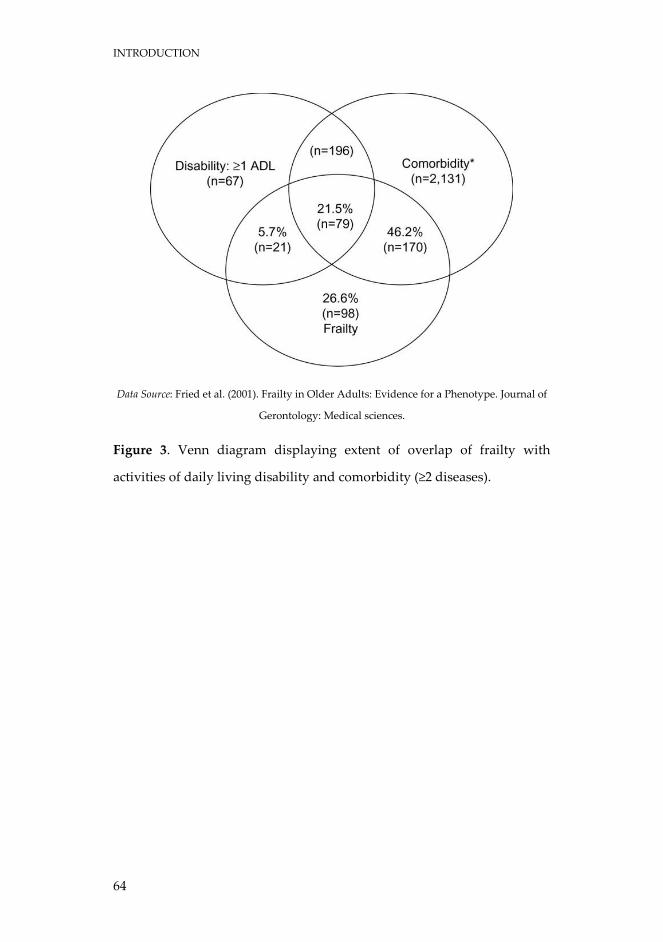
It is important to highlight that frailty is an autonomous concept, different
from comorbidity and disability. Despite the possibility of coexistence, it
can be present in the absence of both in 26.6% of the elderly (Figure 3). In
the CHS on 2,762 people with disabilities, comorbidity or frailty, only 3%
had all three entities at the same time and 14% had two of them. In the
Toledo Study for Healthy Aging (TSHA) it was shown that 87% of the
dependent elderly for instrumental activities and 67% of dependents for
basic activities were not frail. Therefore, by definition we should not
confuse comorbidity-pluripathology-multimorbidity with frailty, or
disability or dependence with frailty.
INTRODUCTION
64
Data Source: Fried et al. (2001). Frailty in Older Adults: Evidence for a Phenotype. Journal of
Gerontology: Medical sciences.
Figure 3. Venn diagram displaying extent of overlap of frailty with
activities of daily living disability and comorbidity (≥2 diseases).
INTRODUCTION
65
1.2.2. Frailty constructs
Regardless of what definition of frailty is used, to be applied practically,
frailty first needs to be operationally defined. A breakthrough in frailty
measurement came in the mid-1990s, when it was verified that when frailty
manifestations, such as slow walking speed and weight loss, were grouped
together to form combination scores, prediction of adverse clinical
outcomes was better than when components were considered alone [35,
36]. Frailty combination scores have been used to operationally define
frailty ever since. In 2001, Fried and colleagues proposed their landmark
frailty phenotype measurement, which assessed frailty by measuring five
of its physical components [37]. Following this, and also in 2001, Rockwood
and Mitnitski released their accumulated deficits model of frailty, which
considered not only the physical components of frailty, but also the
psychosocial aspects of frailty [38]. Both of these frailty models are highly
regarded and in common use today.
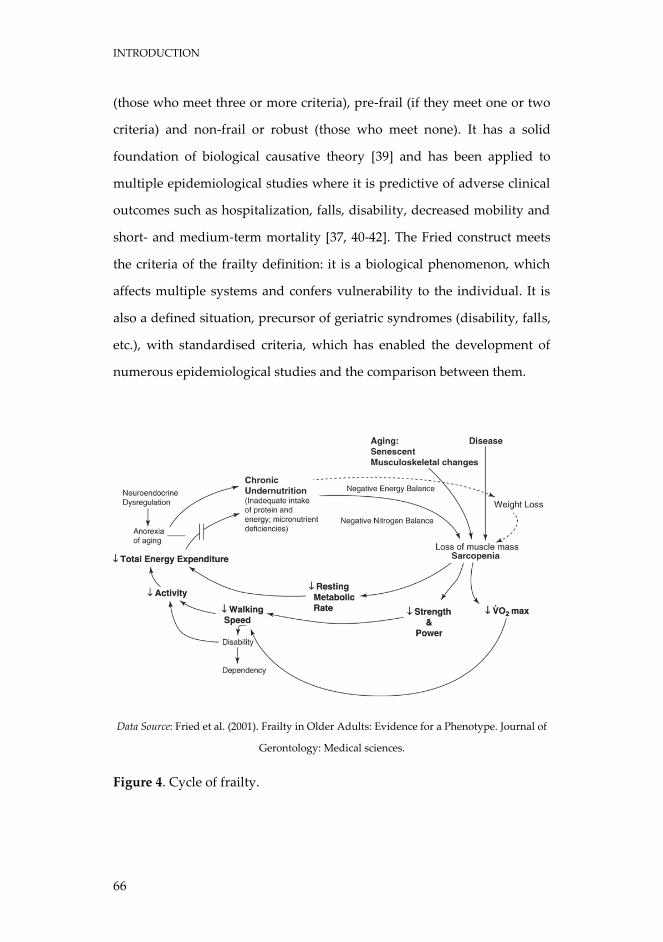
1.2.2.1. Fried's Frailty Phenotype - the CHS index
Fried's Frailty Phenotype is a popular measurement of frailty, also known
as the CHS Index from the study it was originally applied to [37]. The frailty
phenotype considers frailty by its physical characteristics, creating a
construct whose bases are sarcopenia and energy imbalance, and
establishes a feedback relationship between them, called “cycle of frailty”
(Figure 4). They identify five dimensions in the construct: shrinking
(unintentional weight loss of 4.5 kg or more in the last year), weakness (low
grip strength), exhaustion (self-reported), slowness (slow walking speed)
and low physical activity [37]. This scale divides the population into frail
INTRODUCTION
66
(those who meet three or more criteria), pre-frail (if they meet one or two
criteria) and non-frail or robust (those who meet none). It has a solid
foundation of biological causative theory [39] and has been applied to
multiple epidemiological studies where it is predictive of adverse clinical
outcomes such as hospitalization, falls, disability, decreased mobility and
short- and medium-term mortality [37, 40-42]. The Fried construct meets
the criteria of the frailty definition: it is a biological phenomenon, which
affects multiple systems and confers vulnerability to the individual. It is
also a defined situation, precursor of geriatric syndromes (disability, falls,
etc.), with standardised criteria, which has enabled the development of
numerous epidemiological studies and the comparison between them.
Data Source: Fried et al. (2001). Frailty in Older Adults: Evidence for a Phenotype. Journal of
Gerontology: Medical sciences.
Figure 4. Cycle of frailty.
INTRODUCTION
67
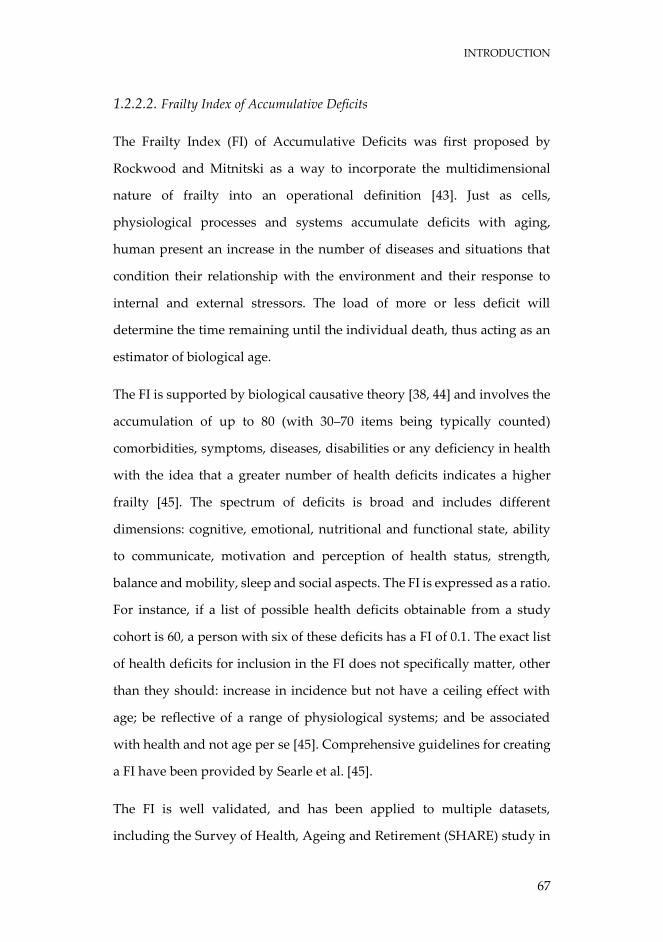
1.2.2.2. Frailty Index of Accumulative Deficits
The Frailty Index (FI) of Accumulative Deficits was first proposed by
Rockwood and Mitnitski as a way to incorporate the multidimensional
nature of frailty into an operational definition [43]. Just as cells,
physiological processes and systems accumulate deficits with aging,
human present an increase in the number of diseases and situations that
condition their relationship with the environment and their response to
internal and external stressors. The load of more or less deficit will
determine the time remaining until the individual death, thus acting as an
estimator of biological age.
The FI is supported by biological causative theory [38, 44] and involves the
accumulation of up to 80 (with 30–70 items being typically counted)
comorbidities, symptoms, diseases, disabilities or any deficiency in health
with the idea that a greater number of health deficits indicates a higher
frailty [45]. The spectrum of deficits is broad and includes different
dimensions: cognitive, emotional, nutritional and functional state, ability
to communicate, motivation and perception of health status, strength,
balance and mobility, sleep and social aspects. The FI is expressed as a ratio.
For instance, if a list of possible health deficits obtainable from a study
cohort is 60, a person with six of these deficits has a FI of 0.1. The exact list
of health deficits for inclusion in the FI does not specifically matter, other
than they should: increase in incidence but not have a ceiling effect with
age; be reflective of a range of physiological systems; and be associated
with health and not age per se [45]. Comprehensive guidelines for creating
a FI have been provided by Searle et al. [45].
The FI is well validated, and has been applied to multiple datasets,
including the Survey of Health, Ageing and Retirement (SHARE) study in
INTRODUCTION
68
Europe [46, 47]. Ideally, the FI should be used as a continuous variable,
however for comparison studies, various cut-off points have been
considered to identify frailty [48, 49].
Several studies have found that the FI has a higher predictive ability of
adverse clinical events than other frailty measurements in both hospital
and community settings [48, 50, 51]. Additionally, it has been reported that
it is the total FI score, rather than type of health deficits included in the FI,
that is most predictive of adverse outcomes [38]. An upper limit to the FI is
believed to exist at around 0.67, beyond which survival is unlikely [52].
Both frailty phenotype and frailty index have some weaknesses [53].
The FI of Rockwood et al. [38] has been criticised due to different possible
limitations: the inclusion of too many elements, the inclusion of conditions
that do not share a biological construct make it little useful to identify the
pathophysiological determinants of frailty, and the inclusion of functional
deficits away from the concept of frailty as a “precursor” state of disability
on which action can be taken to prevent it.
Similarly, the frailty phenotype of Fried et al. [37] also has some restrictions
for clinical practice and research purposes. Firstly, it should be borne in
mind that several biological mechanisms of the clinical syndrome (such as
obesity, inflammation, hormonal changes, low muscular strength,
sarcopenia, insulin resistance, physical inactivity, deficient cardiovascular
balance, etc.) seem to be interdependent, creating a constant gradient of
multisystemic biological dysfunction from vigorous to the most vulnerable
individual. The previously mentioned is the one known as “Frailty Trait”.
Fried et al. [37] definition does not include the continuous change from
robustness to frailty, since the worst population quintile is used as the base
INTRODUCTION
69
for some of the criteria to assess the different domains, being complicated
to establish any contrast among older people over/under the thresholds.
Secondly, as a result, Fried et al. [37] scale shows some difficulties with
regards to the assessment of small changes in the patient’s status and to the
supervised evolution in elderly individuals. Thirdly, the concept of frailty
most accepted in its broadest sense [54] includes the multisystem
involvement as the central element of the construct. However, contrary to
the nature of frailty, the frailty phenotype definition is mainly
oligodimensional. Therefore, there is an increasing movement to extend the
frailty phenotype to other dimensions as in nutrition and cognitive
functioning [55]. In this line, there is a very close relationship between
vascular disease and frailty [56]. Both of them share some biological
elements (inflammation, coagulation disorder, insulin resistance, hormonal
changes) as well as risk factors (e.g. inactivity, obesity), a bidirectional
pathogenic path, and outcomes [57]. The relation is then clear from the
early stages of the disease [58]. These conclusions are linked to vascular
disease within the spectrum of frailty.
1.2.2.3. Frailty Trait Scale
Based on the characteristics of the biological trait of the frailty syndrome
and overcoming some of the problems mentioned above, a new operational
scale called Frailty Trait Scale (FTS) appears [59]. This construct
incorporates new relevant domains according to the most recent findings
on the pathophysiology of the frailty syndrome (vascular and nervous
system and nutrition), makes a more extensive assessment of the domains
and classifies the elderly in a more proper way according to their frailty
status. This biological trait is a continuous phenomenon: the more it
INTRODUCTION
70
decreases in the biological reserve, the closer it is to the threshold of
presenting adverse effects derived from it (functional deterioration,
hospitalization, mortality, etc.). This threshold is not a qualitative jump
(presence/absence of risk of adverse events) but a continuous
intensification in the risk.
The FTS includes 7 aspects such as the following: energy balance and
nutrition, physical activity, nervous system, vascular system, weakness,
endurance, and slowness. These domains become operational through 12
items [59]:
1. Energy balance and nutrition were estimated by using the body
mass index (BMI), central obesity (waist circumference),
unintentional weight loss and serum albumin level.
2. Activity was assessed by using the total score of the Physical
Activity Scale for the Elderly [60].
3. The nervous system was calculated by considering verbal fluency
and balance. Verbal fluency was estimated by asking the
participants to give names of animals during one minute [61].
Balance was measured by Romberg test [62].
4. The vascular system was measured by the brachial-ankle index
done with Doppler ultrasound [63].
5. Weakness was estimated by assessing grip strength in the
dominant arm and the knee extension strength [64].
6. Endurance was assessed by the chair stand test, which measures
the number of times that a person stands up in 30 seconds [65].
7. Slowness was estimated by calculating the time to walk 3 m at a
“normal pace” according to a standard protocol [62].
INTRODUCTION
71
Each item score represents a biological trait. When appropriate, items were
analysed according to the item’s quintile distribution in the population.
Participants had to complete at least 75% of the items included in the FTS
in order to be included in the study analytical sample. The total score was
determined according to the formula [59]: Total score = (Σ items score/total
score possible by individual)*100. Therefore, the total FTS score ranged
from 0 (best score) to 100 (worst score).
The FTS was built following the methodology proposed by Searle et al. [45],
as in the original article by using 40 items, which basically kept the
dimensions and scaling.
INTRODUCTION
72
1.2.3. Prevalence and incidence of frailty
Depending on the diagnostic criteria used, cut-off points, areas of study
and inclusion criteria of the populations studied, different studies of
international cohorts have found prevalences that fluctuate between 4 and
59.1%.
The prevalence of this syndrome increases exponentially as it ages [66],
from 3.2% on average to 65 years old, going through 16.3% in those over 80
years old, until reaching 23.1% at 90 years old.
It is also estimated that this syndrome is more prevalent in women than in
men, with an approximate ratio of 2:1 [66].
The prevalence differs among countries, in countries with higher incomes,
the prevalence of frailty is lower [67]. This is explained by the expenditure
that each country devotes to health, those with less investment in health,
have a higher rate of frailty. These differences can be explained by
socioeconomic factors, especially due to low individual income and high
social vulnerability.
Collard et al. [66] conducted a joint analysis of the main international
epidemiological studies, detecting a prevalence of frailty in 61,500
community elders of 10.7% (9.6% applying the Fried phenotype and 13.6%
applying broad-spectrum criteria such as those of Rockwood). The
prevalence was higher in women than in men, and it increased along with
the age. In this review, an estimated 44.2% of the studied population were
at risk of becoming frail in the two following years [66]. However, data
from none of the Spanish epidemiological studies were not included in the
analysis, as they were not yet published at the time of preparing the article.
INTRODUCTION
73
The data from the Spanish studies confirm the severity of frailty among
elderly individuals living in the community. The TSHA of 8.4% (95% CI:
7.1-9.8%) in 3,214 older than 64 years of the community [64]; the FRADEA
study (Frailty and Dependence in Albacete) detected a prevalence of frailty
of 16.3% (95% CI: 14.0-18.6%) in 993 older than 70 years of Albacete
(included older than the community and institutionalised) [68]; and the
Peñagrande study (Madrid) of 10.5% (95% CI: 8.9-12.3%) in 1,250
community-dwelling older than 64 years [69]. Other cohorts, such as those
of Leganes [70], Lleida (FRALLE) [71], and Barcelona (Octabaix) [72], have
found prevalences between 9.6 and 20.4% according to population strata
and criteria used.
Recently, frailty prevalence data have also been published in nursing
homes. The studies of Cuenca and Albacete (FINAL study) have shown
very high figures, between 53.7 and 68.8%, respectively [73, 74].
There are not many studies that estimate the incidence of frailty. A recent
systematic review found only 6 studies where the incidence of frailty was
estimated [75]. Frailty incidence ranged from 5% (follow-up 22.2 years; age
≥ 30) to 13% (follow-up 1 year, age ≥ 55) [75]. Therefore, due to the
heterogeneity of the data, more well-designed prospective frailty studies
are needed to overcome the general scarcity of data on the onset and
progression of this dynamic condition over time.
INTRODUCTION
74
1.2.4. Frailty pathogenesis
Frailty is characterised by multisystem dysregulations, leading to a loss of
dynamic homeostasis, decreased physiologic reserve, and increased
vulnerability for subsequent morbidity and mortality [76]. This is often
manifested by maladaptive response to stressors, leading to a vicious cycle
toward functional decline and other serious adverse health outcomes [77-
80].
In recent years, great efforts have been made to know the origins and causes
of this syndrome. This evidence suggests several important multisystem
pathophysiological processes in the pathogenesis of frailty syndrome,
especially those related to the musculoskeletal and endocrine systems, and
chronic inflammation and immune activation [76].
In this complex process sarcopenia has been proposed as one of the
cornerstones. Sarcopenia is defined as the loss of muscle mass and strength,
which can occur rapidly after the age of 50 years [81]. It can be further
accelerated by chronic diseases, and is a major contributor to disability [82].
Its causes include age-related changes in α-motor neurons, type I muscle
fibres, muscular atrophy, poor nutrition, growth hormone (GH)
production, sex-steroid levels, and physical activity [83]. The
musculoskeletal system is the body system that consumes more energy at
rest, so that its reduction involves a decrease in the amount of energy
consumed at rest. Likewise, sarcopenia decreases the energy consumed
with exercise, since subjects move less, walk slower, have greater fatigue
and avoid exercise. Both processes entail a decrease in the total energy
expenditure that produces a down regulation of the appetite, with the
consequent decrease in the intake of nutrients (especially proteins), which
INTRODUCTION
75
causes lower protein synthesis. This approach was initially postulated by
Fried [37], denominating cycle of the frailty, although later it has been
completed with other elements.
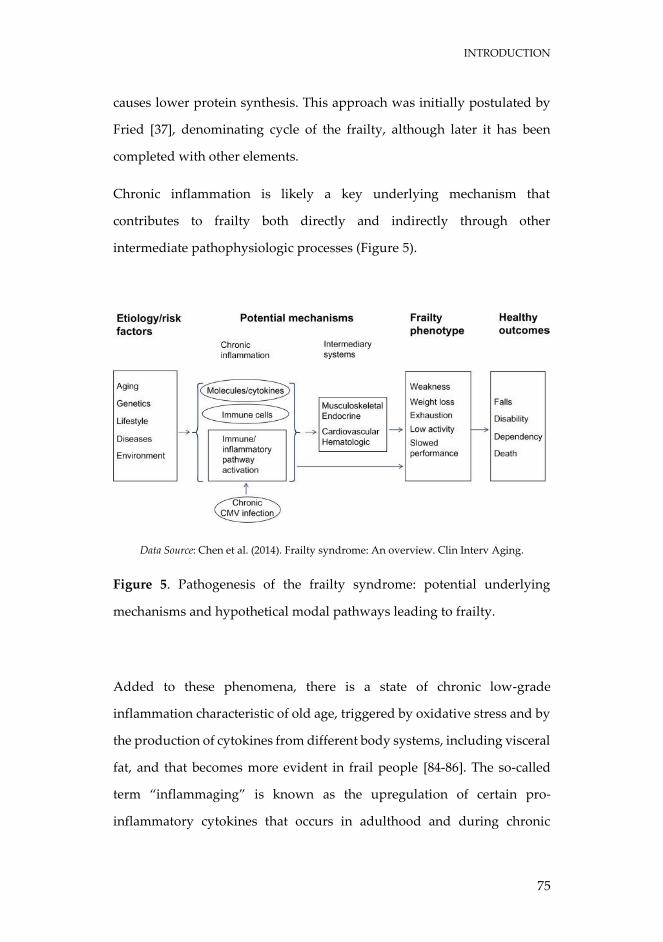
Chronic inflammation is likely a key underlying mechanism that
contributes to frailty both directly and indirectly through other
intermediate pathophysiologic processes (Figure 5).
Data Source: Chen et al. (2014). Frailty syndrome: An overview. Clin Interv Aging.
Figure 5. Pathogenesis of the frailty syndrome: potential underlying
mechanisms and hypothetical modal pathways leading to frailty.
Added to these phenomena, there is a state of chronic low-grade
inflammation characteristic of old age, triggered by oxidative stress and by
the production of cytokines from different body systems, including visceral
fat, and that becomes more evident in frail people [84-86]. The so-called
term “inflammaging” is known as the upregulation of certain pro-
inflammatory cytokines that occurs in adulthood and during chronic
INTRODUCTION
76
diseases associated with aging, highlighting interleukin 6 (IL-6) [87, 88], IL-
1a, tumour necrosis factor α (TNF-α) and interferon α (IFN-α) [89, 90]. This
activation of cytokines produces, as deleterious effects, chronic
inflammation, release of acute phase hepatic reactants, insulin resistance
and osteoclastic activity [91, 92].
To counteract this inflammatory state, the body acts through the anti-
inflammatory cytokines IL-4, IL-10 and IL-13 producing activation of the
hypothalamic-pituitary-adrenal axis, and causing an elevation of the
cortisol, which will cause secondarily, and as unwanted effects, bone
resorption, lipolysis, protein catabolism, gluconeogenesis and immune
dysfunction, depending on the system on which it acts, ultimately
producing frailty and chronic disease [93]. The coexistence of inflammatory
and anti-inflammatory phenomena in the elderly will have a negative effect
on metabolism, bone density, strength, exercise tolerance, vascular system,
cognition and affect, ultimately helping to trigger the phenotype of frailty
[94]. Chronic inflammation is also an important contributor to sarcopenia,
thus interrelating the two key pathophysiological factors in frailty.
Since frailty is a multifactorial process, it is not surprising that many other
elements have been implicated in its pathogenesis. It is noteworthy the
neuroendocrine dysregulation (relationship with testosterone levels,
growth hormone-insulin-like growth factor axis, cortisol, estradiol, leptin,
ghrelin, obestatin or vitamin D), endothelial dysfunction and the presence
of a procoagulant state, favoured by stress oxidative and chronic
inflammation [95-98]. All this can prompt atherosclerosis, with the
consequent visceral damage, cognitive deterioration, depression, obesity,
osteoporosis, insulin resistance, alterations of the circadian rhythm and
alterations of balance and gait, among others.
INTRODUCTION
77
1.2.5. Frailty interventions
Frailty is the new paradigm on which health care for the elderly should be
based. The relevance of frailty as a public health problem lies in the number
of elderly people who suffer from it. It is a dynamic process with evidence
of reversibility [99], therefore, early identification of the state of pre-frailty
is currently a vitally important issue in primary prevention, because pre-
frail individuals have more than doubled the risk of becoming frail during
the next three years [100].
Frailty has become the most problematic expression of aging, as it is the
prelude to disability. It is known that once the disability is established, the
probability of reversing it is scarce, and although its treatment is highly
expensive, it has been shown to be ineffective. In this regard, the European
economic projections for the years 2016-2070 refer to an early intervention
in frail people, which will improve the quality of life and reduce the
economic cost [9].
A consensus group in 2013 supported four possible treatments that
appeared to be effective in the treatment of frailty. These are: caloric and
protein support, vitamin D deficit correction, reduction of polypharmacy,
and exercise (resistance and aerobic).
Weight loss is an important component of the frailty syndrome [101-103].
Nutritional interventions with calorie supplementation increased weight
gain and reduced mortality in malnourished elderly people [104].
Nutritional supplementation is effective in the treatment of weight loss
[105, 106]. Protein supplementation increases muscle mass [107, 108],
reduces complications [109], improves grip strength [109], produces weight
gain [109], and can act synergistically with resistance exercises in older
INTRODUCTION
78
people [110, 111]. However, other studies of protein supplementation have
not shown benefits in the functional improvement [104].
Regarding vitamin D, it has been proved that vitamin D supplementation
will reduce falls [112], hip fractures [113], and mortality [114] in older
people who are vitamin D deficient. It may also help the muscle to have a
better functioning [115]. Despite the fact that the absence of large-scale
clinical trials show that frailty can be prevented or treated by vitamin D,
there is sufficient evidence of efficacy in frailty-appearing populations to
assume that vitamin D in frail persons who are vitamin D deficient would
be useful [34].
Polypharmacy is likely to be recognized as the main contributor to the
pathogenesis of frailty [116, 117]. Therefore, reduction in inappropriate
medicines can clearly decrease costs [118] and medication side effects in
frail populations [119-121]. The STOPP and START criteria [122, 123] can
be helpful guidelines to reduce inappropriate medicine use in this
population.
The therapy that has proven most effective so far to prevent and treat frailty
is physical exercise, which has been shown to reduce mortality and
disability in the elderly, maintaining muscle mass, increasing strength and
functionality, stabilizing bone mineral density and favouring
cardiovascular system [124-128]. In this connection, Singh et al. [129]
proved that a year of resistance exercise in frail persons following hip
fracture implied a decrease in hospitalisations and nursing home
placement. Other study carried out in a community-based exercise
program involving 610 frail persons, found that exercise was cost effective
in preventing frailty progression and disability [130]. Theou et al. [127] in a
systematic review, found that 45 to 60 minutes of exercise 3 times a week
INTRODUCTION
79
seemed to have positive effects on frail older adults and may be used for
the management of frailty. In the Lifestyle Interventions and Independence
for Elders study (LIFE) according to which the patients received two
different kinds of intervention, that is to say, physical activity versus
education in successful aging, it has been shown that the prevalence of
frailty at 12 months was considerably low regarding the physical activity
group (10%), when compared to the control group that received education
in successful aging (19.1%) [131]. Thus, it can be stated that exercise in frail
subjects increases some functional performances, such as walking speed,
chair stand, stair climbing, and balance, and decreased depression and fear
of falling [132, 133]. Likewise, it has also been found that exercise can
improve cognitive performance in frail individuals, mainly executive
functions, processing speed and working memory [134, 135].
INTRODUCTION
80
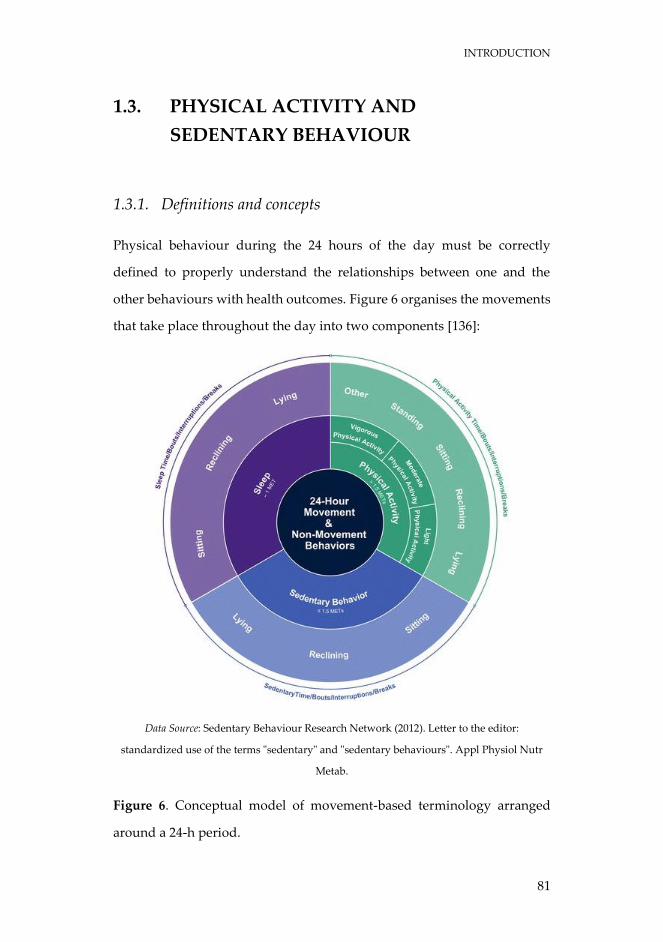
INTRODUCTION
81
1.3. PHYSICAL ACTIVITY AND
SEDENTARY BEHAVIOUR
1.3.1. Definitions and concepts
Physical behaviour during the 24 hours of the day must be correctly
defined to properly understand the relationships between one and the
other behaviours with health outcomes. Figure 6 organises the movements
that take place throughout the day into two components [136]:
Data Source: Sedentary Behaviour Research Network (2012). Letter to the editor:
standardized use of the terms "sedentary" and "sedentary behaviours". Appl Physiol Nutr
Metab.
Figure 6. Conceptual model of movement-based terminology arranged
around a 24-h period.
INTRODUCTION
82
The inner ring represents the main behaviour categories using energy
expenditure. The outer ring provides general categories using posture. The
proportion of space occupied by each behaviour is not prescriptive of the
time that should be spent in these behaviours each day.
1.3.1.1. Physical activity
Since 1996 approximately and as a result of a broad international consensus
[137], physical activity has been defined as any movement produced by
skeletal muscles that requires a substantial increase in energy expenditure
above the resting level. What basically characterises physical activity is the
energy expenditure it produces.
The quantification and prescription of physical activity, as indicated below,
is the product of four variables: intensity, duration, frequency, and type of
physical activity. Thus, the dose of physical activity for health could be
described as a combination of these four variables.
Intensity is an essential prerequisite for physical activity to induce
improvements in physical fitness and other components of physical health.
The intensity of physical activity is usually measured in metabolic
equivalents, or METs. One MET is defined as the amount of oxygen
consumed while sitting at rest and is equal to 3.5 ml O2 per kg body weight
x minute [138]. The MET concept represents a simple, practical, and easily
understood procedure to express the energy cost of physical activities as a
multiple of the resting metabolic rate. Light physical activity (LPA) is
defined between 1.6 and less than 3.0 METs. Moderate physical activity
INTRODUCTION
83
(MPA) is between 3.0 and less than 6.0 METs. Finally, vigorous physical
activity (VPA) requires 6.0 or greater METs.
The duration is the amount of time in hours or minutes per day dedicated
specifically to physical activity. Although years ago it was established that
the minimum duration of time to account for a physical activity bout was
10 minutes [139], currently, the new physical activity guidelines are
eliminating it within their recommendations [140].
The frequency is the physical activity regularity and is usually expressed
by the number of times or days per week of physical activity.
The type of physical activity refers to the specific modality performed and
the context in which the physical activity is developed (e.g. walking,
running).
To obtain health benefits through physical activity and exercise, a specific
dose is necessary [141]. The principles of overload, progression and
specificity are the main determinants of how the body responds to the dose
of physical activity [142].
1.3.1.2. Exercise
Exercise is a subset of physical activity that is planned, structured, and
repetitive and has as a final or an intermediate objective the improvement
or maintenance of physical fitness [143].
INTRODUCTION
84
1.3.1.3. Sedentary behaviour
Sedentary behaviour (SB) is any waking behaviour characterized by an
energy expenditure ≤1.5 METs, while in a sitting, reclining or lying posture
[144]. In general, this means that any time a person is sitting or lying down,
they are engaging in SB. Common sedentary time (ST) include TV viewing,
video game playing, computer use (collective termed “screen time”),
driving automobiles, and reading.
1.3.1.4. Breaks in sedentary time
A break in ST (BST) is generally defined as a period of non-sedentary
activity (e.g. standing or walking) in between two sedentary conditions
(e.g. sitting or reclining posture) [145].
1.3.1.5. Physical inactivity
In a letter to the editor in 2012, physical inactivity is defined as people who
are performing insufficient amounts of moderate-to-vigorous physical
activity (MVPA) (i.e., not meeting specified physical activity guidelines)
[136].
This recommendation was made after a high confusion was generated
because the sedentary term was also used to define those individuals with
lack of physical activity.
INTRODUCTION
85
1.3.1.6. Physical fitness
Physical fitness is a set of attributes that are either health- or skill-related
[143]. The most common components of fitness are: cardiorespiratory
endurance, muscle endurance, muscle strength, muscle power, flexibility,
balance, and speed.
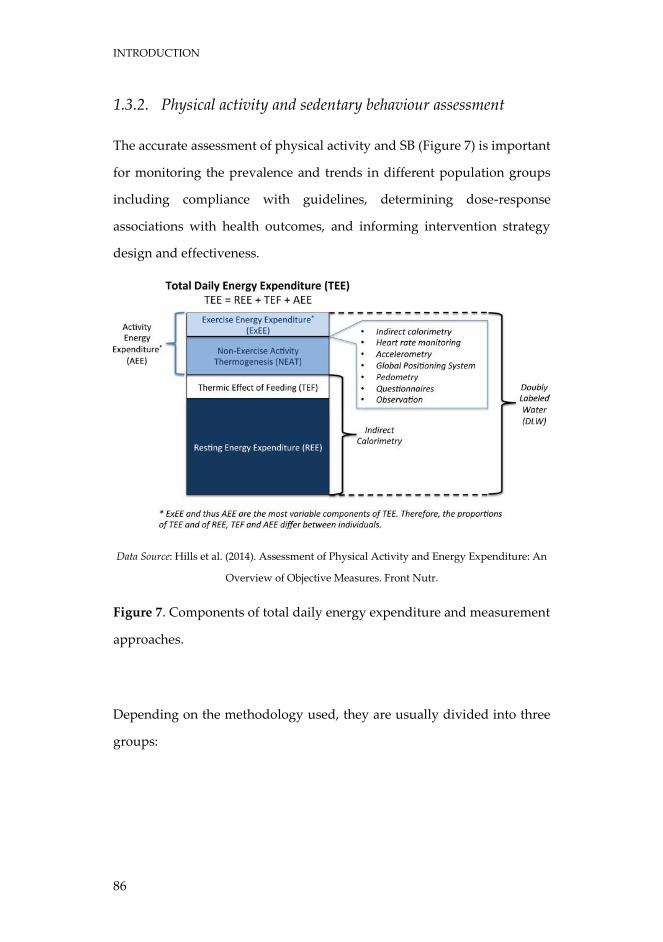
INTRODUCTION
86
1.3.2. Physical activity and sedentary behaviour assessment
The accurate assessment of physical activity and SB (Figure 7) is important
for monitoring the prevalence and trends in different population groups
including compliance with guidelines, determining dose-response
associations with health outcomes, and informing intervention strategy
design and effectiveness.
Data Source: Hills et al. (2014). Assessment of Physical Activity and Energy Expenditure: An
Overview of Objective Measures. Front Nutr.
Figure 7. Components of total daily energy expenditure and measurement
approaches.
Depending on the methodology used, they are usually divided into three
groups:
INTRODUCTION
87
1.3.2.1. Reference methods
Reference methods are based on obtaining energy expenditure, and the
main ones are: direct calorimetry, indirect calorimetry, and doubly labelled
water.
Human energy metabolism leads to the production of energy from the
combustion of fuel via carbohydrate, protein, fat, or alcohol. This way,
oxygen is consumed and carbon dioxide is produced. The measurement of
energy expenditure involves the assessment of heat generation or heat loss
directly, evaluated through direct calorimetry. The evaluation of heat
production or loss by determining oxygen consumption and/or carbon
dioxide production is termed indirect calorimetry [146]. First calorimeters
for the quantification of human energy expenditure were direct
calorimeters; nevertheless, currently most measurement of energy
expenditure is carried out by indirect calorimetry. This method is based on
the relationship between O2 consumption and energy produced, i.e., for
each litre of O2 consumed by the body, the equivalent of ~5 kcal is utilized.
Simply, by determining O2 consumption during defined tasks such as
resting, standing, walking, and running, the energy cost or energy
expenditure can be calculated.
Doubly labelled water, developed in the early 1950s by Nathan Lifson and
colleagues, is the gold standard method to assess total energy expenditure
due to its high degree of accuracy [147, 148]. In the doubly labelled water
technique, daily urine samples are collected over a 7- to 14-day period and
successively analysed through isotope ratio mass spectrometry [149]. This
approach has been previously explained by Hills et al. [150]. The stable
isotopes, deuterium (2H) and oxygen-18 (18O) are administered orally via a
drink of water, and elimination of the isotopes from the body is tracked
INTRODUCTION
88
[151, 152]. The difference between the elimination rates of 2H and 18O is
equivalent to the rate of carbon dioxide generation that can then be
converted to average total daily energy expenditure [153]. Generally, the
method is appropriate in a wide range of populations including the most
vulnerable, is used in a free-living context, is non-invasive and demands
minimal participant burden. Another main advantage is the accuracy and
precision of the technique. Despite being the gold standard method for the
measurement of total energy expenditure, the doubly labelled water
technique does not bring specific information concerning daily physical
activity [154]. Briefly, the technique provides an accurate estimate of total
energy expenditure from which average daily of energy expenditure can
be determined, but does not quantify activity type, intensity, or duration
from the energy expenditure [155]. Likewise, as the study of biological
samples (commonly urine) for the technique needs the use of refined
laboratory-based material, the combined cost of isotopes, and the
examination of samples is a potential barrier for large-scale studies.
1.3.2.2. Objective methods
Objective methods are tools recognised for their quality and high precision
when collecting data corresponding to the performance of physical activity
(intensity, frequency and duration) and SB (duration, breaks) in
epidemiological studies. In this category are pedometers, accelerometers,
heart rate monitoring, and the combination of devices.
The most common and controversial form to use motion sensor is by
employing a pedometer. Pedometers count the steps taken by an individual
while the person concerned goes walking and running and they have been
INTRODUCTION
89
popularised as a motivational tool to stimulate sedentary or inactive
individuals to turn into more physically active people. Physical activity
targets in “steps per day” take into account the commonly used adult
objective of “10,000 steps”, which is both well-known and understood by
the lay public [150]. The objective review of pedometers has shown
extensive and significant flaws in accuracy, for instance the inaccuracy at
slow speeds, the variation according to the place where it is worn or the
possible manipulation of data. However, some important advantages
related to pedometers should be mentioned as well. They are relatively
inexpensive, easy to use, and output data can be used to raise awareness
regarding the level of physical activity, which causes a motivation to
increase physical activity.
Accelerometers are motion sensors that detect accelerations of the body.
Acceleration is therefore defined as the variation rate of velocity in a
specific time frame; thus, the frequency, intensity, in addition to the length
of the physical activity, and the length and interruption of sedentary
periods can be assessed as a function of body movement [156].
Accelerometers comprise piezoelectric transmitters that are stressed by
acceleration forces. This is associated with the production of an electrical
signal that will be subsequently converted by processing units to produce
an indication of movement [157]. Accelerometers have become quite
popular in recent years as a tool to achieve an objective approach to
measure daily physical activity and SB, and they have also achieved a
significant improvement over self-report methodologies [158]. Numerous
papers [159, 160] have informed of the objective, practical, non-invasive,
accurate, and reliable traits of accelerometers, which are used as a tool to
quantify physical activity volume and intensity with minimal discomfort
INTRODUCTION
90
[161]. In addition, accelerometers provide information (outputs) linked to
the body movement in counts per unit time (also known as an epoch).
Piezoelectric sensors catch the rate or intensity of movements to detect
acceleration in one plane (uni-axial), two planes (bi-axial), or three
orthogonal planes (tri-axial) which is equivalent to vertical,
anteroposterior, and mediolateral directions [157]. Accelerometers are
more complex and therefore greater motion sensors than pedometers.
Additionally, the most considerable advantages of accelerometers are their
relatively small size and the regular capacity to record data over a
prolonged period (days or weeks) [154] and the absence of visual feedback
to the subject who wear the device. This way, the lack of immediate
feedback involves the likelihood of a reduce overestimation of physical
activity or an underestimation of ST (such as the manipulation of a
pedometer). Accelerometry has then facilitated the assessment of both
physical activity and SB with a greater accuracy and precision than in
previous studies by using subjective methodologies to quantify physical
activity [162]. However, accelerometers also have certain limitations such
as the possibility of reactivity based on the individual awareness to be
monitored. Another significant limitation is related to the epoch chosen,
since the final result depends on the fact and as well as on the algorithms
introduced for the non-wear time, or the cut-off points used, among others.
The use of heart rate monitoring as part of the estimation of energy
expenditure and physical activity is well-known, convenient, relatively
inexpensive, non-invasive, and versatile. Along with pedometers and
accelerometers, heart rate monitors are the greatest samples of objective
measurement. Monitoring heart rate minute-by-minute provides precise
information on frequency, intensity, and duration of free-living physical
INTRODUCTION
91
activity [163]. In addition, heart rate monitoring is also used to estimate
energy expenditure based on the assumption of a linear relationship
between heart rate and oxygen consumption. However, the method has
important limitations. Due to the differences in the relationship between
heart rate–oxygen consumption between upper-body and lower-body
activities [164], the use of a single regression line derived from an activity
such as walking or running will not be precise for other activities. As a
matter of fact, it is safe to say that there is a very close relationship between
heart rate and energy expenditure during exercise, however, this is not the
case during rest and light activity [154, 165].
As it is not possible to quantify all the aspects of physical activity under
free-living conditions through any technique, it is suggested the use of
multiple complementary methods [163]. For instance, a potentially
powerful approach to quantify energy expenditure is the simultaneous use
of accelerometry and heart rate monitoring [154, 166]. The reason to
combine these techniques is that accelerometer counts verify that elevations
in heart rate are caused by physical activity.
1.3.2.3. Subjective methods
Subjective methods are indirect approaches, generally linked to the
individual’s record of his or her own activity [156]. These include direct
observation, activity diaries, physical activity and SB questionnaires, and
interviews [165]. They are widely used for their practicality, both for the
evaluator and for those who are evaluated, which facilitates their use in
population studies. These methods are based on prediction equations in
which a count is made of the activities performed in one or more days.
INTRODUCTION
92
Energy expenditure is sometimes the result of multiplying the time spent
on an activity by an estimated rate of energy expenditure for that activity.
Considering these subjective methods, questioners are the most used
instrument to assess physical activity and sedentary lifestyle, due to the
absence of inexpensive, readily available, non-invasive, valid, and reliable
objective technology employed for the evaluation of activity energy
expenditure. Nevertheless, most of the physical activity and SB
questionnaires have shown a reduced reliability and validity [167] and it is
uncertain whether any of them are valid to estimate the activity energy
expenditure at the individual and group levels (176).
INTRODUCTION
93
1.3.3. Physical activity recommendations for health
The physical activity recommendations from a health perspective have
evolved over time, focusing several aspects of it, either towards its intensity
(moderate and vigorous), the type of physical activity (aerobic, resistance,
flexibility), frequency and, duration.
In 2010, the World Health Organization (WHO) publishes the global
recommendations on physical activity for health (currently under review)
[139]. Specifically, for older adults (65 years old and above), these are the
recommendations [139]:
o Older adults should do at least 150 minutes of aerobic MVPA
throughout the week or do at least 75 minutes of aerobic VPA
throughout the week or an equivalent combination of MVPA.
o Aerobic activity should be performed in bouts of at least 10
minutes duration.
o For additional health benefits, older adults should increase their
aerobic MVPA to 300 minutes per week, or engage in 150 minutes
of aerobic VPA per week, or an equivalent combination of MVPA.
o Older adults, with poor mobility, should perform physical activity
to enhance balance and prevent falls on 3 or more days per week.
o Muscle-strengthening activities, involving major muscle groups,
should be done on 2 or more days a week.
o When older adults cannot do the recommended amounts of
physical activity due to health conditions, they should be as
physically active as their abilities and conditions allow.
In November 2018, the U.S. Department of Health and Human Services
issued the second edition of Physical Activity Guidelines for Americans
INTRODUCTION
94
[140], thus updating those of 2008. These guidelines provide the most
current physical activity recommendations, prepared by a Physical Activity
Guidelines Advisory Committee formed by experts in the sciences of
physical activity and health who conducted an extensive literature review.
The update in physical activity recommendations published by the WHO
is expected to be similar to these ones.
In 2018, the new committee accepted most of the recommendations made
by the 2008 committee, but not all of them. The major change in the activity
recommendation in 2018 was to no longer require bouts of aerobic activity
which consisted of at least 10 minutes in length; activity bouts of any length
now contribute to accomplish the weekly goal. Although there is still
limited published research testing for health benefits of exercise
accumulated throughout the day in bouts lasting less than 5 minutes each,
data are beginning to emerge that show the potential efficacy [168, 169].
However, understanding the specific health benefits of very short bouts
remains in need of further research.
The physical activity recommendations for American older adults are as
follows [140]:
o Older adults should move more and sit less throughout the day.
Some physical activity is better than none. Older adults who sit less
and do any amount of MVPA gain some health benefits.
o For substantial health benefits, older adults should do at least 150
minutes (2 hours and 30 minutes) to 300 minutes (5 hours) a week
of moderate-intensity, or 75 minutes (1 hour and 15 minutes) to 150
minutes (2 hours and 30 minutes) a week of VPA, or an equivalent
combination of MVPA. Preferably, aerobic activity should be
spread throughout the week.
INTRODUCTION
95
o Additional health benefits are gained by engaging in physical
activity beyond the equivalent of 300 minutes (5 hours) of aerobic
MPA a week.
o Older adults should also do muscle-strengthening activities of
moderate or greater intensity and that involve all major muscle
groups on 2 or more days a week, as these activities provide
additional health benefits.
o As a part of their weekly physical activity, older adults should do
multicomponent physical activity that includes balance training as
well as aerobic and muscle strengthening activities.
o Older adults should determine their level of effort for physical
activity relative to their level of fitness.
o Older adults with chronic conditions should understand whether
and how their conditions affect their ability to do regular physical
activity safely.
o When older adults cannot do 150 minutes of aerobic MPA a week
because of chronic conditions, they should be as physically active
as their abilities and conditions allow.
INTRODUCTION
96
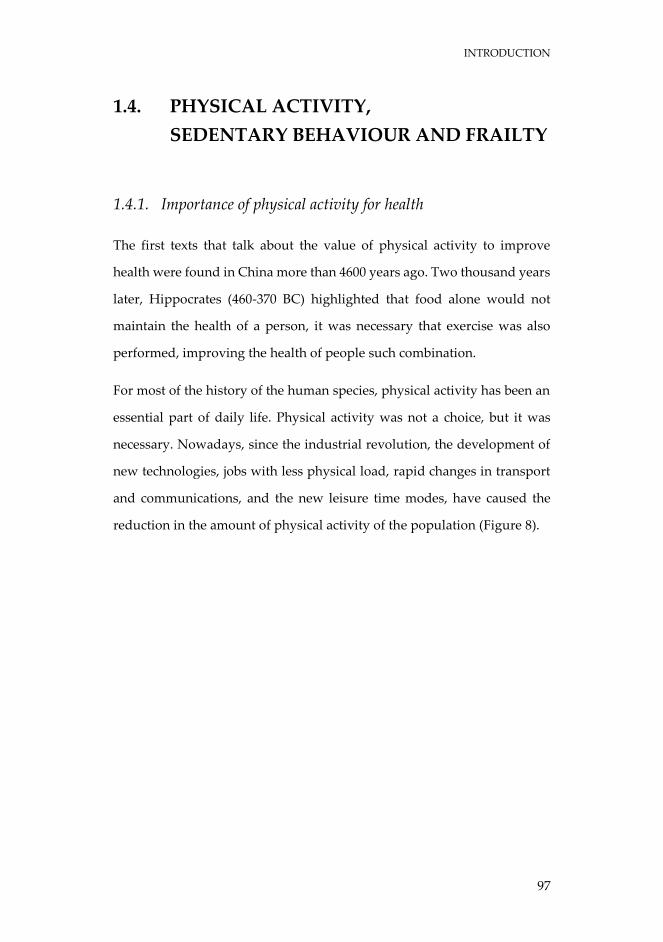
INTRODUCTION
97
1.4. PHYSICAL ACTIVITY,
SEDENTARY BEHAVIOUR AND FRAILTY
1.4.1. Importance of physical activity for health
The first texts that talk about the value of physical activity to improve
health were found in China more than 4600 years ago. Two thousand years
later, Hippocrates (460-370 BC) highlighted that food alone would not
maintain the health of a person, it was necessary that exercise was also
performed, improving the health of people such combination.
For most of the history of the human species, physical activity has been an
essential part of daily life. Physical activity was not a choice, but it was
necessary. Nowadays, since the industrial revolution, the development of
new technologies, jobs with less physical load, rapid changes in transport
and communications, and the new leisure time modes, have caused the
reduction in the amount of physical activity of the population (Figure 8).
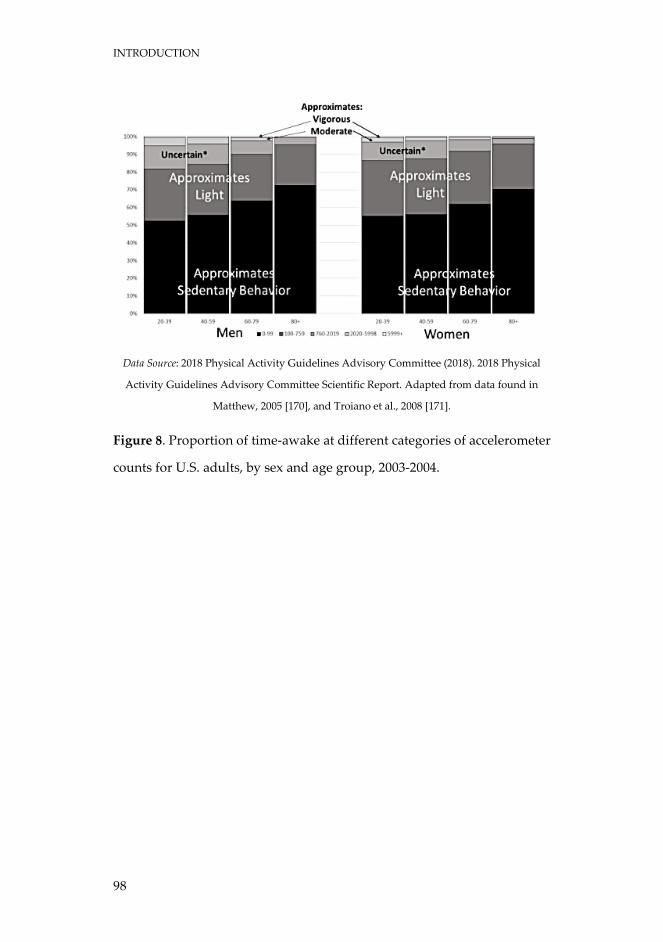
INTRODUCTION
98
Data Source: 2018 Physical Activity Guidelines Advisory Committee (2018). 2018 Physical
Activity Guidelines Advisory Committee Scientific Report. Adapted from data found in
Matthew, 2005 [170], and Troiano et al., 2008 [171].
Figure 8. Proportion of time-awake at different categories of accelerometer
counts for U.S. adults, by sex and age group, 2003-2004.
INTRODUCTION
99
Physical inactivity has been recognised as the fourth leading risk factor for
global mortality (6% of deaths globally) [139]. In 2009, Blair [172]
considered physical inactivity as the biggest public health problem of the
21st century (Figure 9).
Data Source: Blair (2009). Physical inactivity: the biggest public health problem of the 21st
century. Br J Sports Med.
Figure 9. Low cardiorespiratory fitness as a major health problem.
Attributable fractions (%) for all-cause deaths in 40,842 (3,333 deaths) men and 12,943 (491
deaths) women in the Aerobics Center Longitudinal Study. The attributable fractions are
adjusted for age and each other item in the figure. *Cardiorespiratory fitness determined by a
maximal exercise test on a treadmill.
INTRODUCTION
100
According to the WHO, chronic noncommunicable diseases, especially
those derived from the cardio-metabolic system (high blood pressure,
obesity, type 2 diabetes, ischemic heart disease, etc.), represent a serious
public health problem with crucial social, psychological and physical
consequences, and are associated with a higher risk of morbidity and
mortality [173].
Today it is well known that physical activity is an effective factor in
reducing the risk of mortality and preventing the loss of health, and
therefore should be part of the activities of the daily life of all people (2).
There is a multitude of evidence that shows that the enhancement in fitness
improves health [174] and reduces the risk of a number of chronic diseases,
such as cardiovascular diseases [175, 176], type 2 diabetes mellitus [177],
osteoporosis [178], obesity [179], depression [180] and breast and colon
cancer [181] among others. In addition, habitual physical activity improves
the quality and duration of sleep [182] and also improves a wide range of
other cardiovascular, hemodynamic, metabolic, neural, and arterial and
cardiac risk factors, with the overall result of reduced clinical events [183].
The reduction of these diseases would entail the consequent decrease of
direct and indirect medical costs. In addition, people would have a better
quality of life, which would their energy and vitality. Despite this
knowledge, a large proportion of the world’s population remains
physically inactive.
While greater attention has been placed on promoting physical activity for
general health, the negative effects of SB have been shown to be highly
important. Thus, there is now rapidly emerging evidence on the adverse
associations for SB with health outcomes, showing a crucial role on diseases
such as cardiovascular diseases, type 2 diabetes, cancer, obesity, and
INTRODUCTION
101
metabolic syndrome [184-187], mental disorders, and musculoskeletal
disorders [188]. Numerous studies have shown that some people can meet
the physical activity recommendations and yet display high levels of SB.
The reverse could also be true. In fact, some of these studies indicate that
the detrimental consequences of SB may be independent of the time spent
in physical activities [189].
Therefore, because both physical activity and SB contribute to the burden
of chronic disease, it is necessary to mutually address the problem for
global health population.
INTRODUCTION
102
1.4.2. Relationship between physical activity, sedentary behaviour
and frailty
As described above, physical activity plays an important role in
maintaining health, well-being, and quality of life. Physical inactivity is
considered to be a major contributing factor for sarcopenia, physiological
systems dysregulation, decreased physical and cognitive performance, and
disability [190, 191].
Fried [192] establishes three systems by which physical activity can
prevent, delay or treat physical frailty (Figure 10): the frailty phenotype
itself, physiologic dysregulation and cellular and molecular dysfunction.
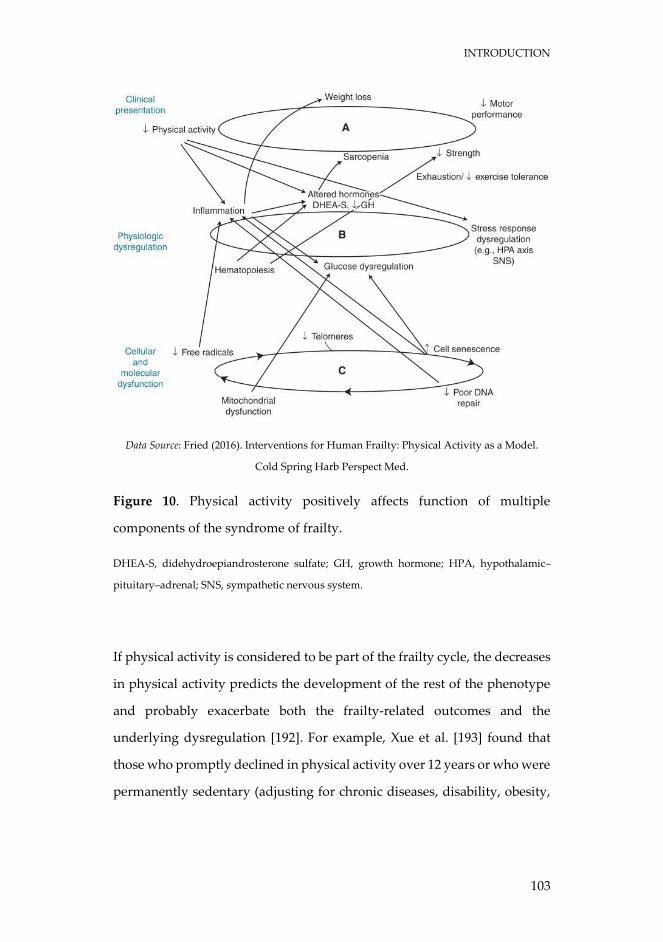
INTRODUCTION
103
Data Source: Fried (2016). Interventions for Human Frailty: Physical Activity as a Model.
Cold Spring Harb Perspect Med.
Figure 10. Physical activity positively affects function of multiple
components of the syndrome of frailty.
DHEA-S, didehydroepiandrosterone sulfate; GH, growth hormone; HPA, hypothalamic–
pituitary–adrenal; SNS, sympathetic nervous system.
If physical activity is considered to be part of the frailty cycle, the decreases
in physical activity predicts the development of the rest of the phenotype
and probably exacerbate both the frailty-related outcomes and the
underlying dysregulation [192]. For example, Xue et al. [193] found that
those who promptly declined in physical activity over 12 years or who were
permanently sedentary (adjusting for chronic diseases, disability, obesity,
INTRODUCTION
104
and other confounders) had hazard ratios for mortality of 2.34 and 3.34,
respectively, compared with those who were permanently active.
Physical activity is an effective protective strategy for avoiding the loss of
muscle mass and functionality (i.e., sarcopenia), which in turn seems to be
one of the cornerstones of frailty [194, 195]. Although sarcopenia and frailty
are not the same construct they share some pathogenic mechanisms.
Regular physical activity is a valuable strategy to attenuate age-related
general decline of muscle structure and function [196, 197]. Different
studies have shown that physical activity decreased the risk of low
functionality and had the ability to delay the onset of disability [198-200].
Similarly, in a study conducted in older Finnish men and women it was
found that those involved in a high level of daily physical activity
(household chores, gardening, etc.) showed a significantly lower decrease
in physical performance after 5 years, compared to those who were
sedentary [201]. Ultimately, sarcopenia is highly predictive of disability,
poor quality of life and all-cause mortality [202].
Physical activity can also maintain or improve protein synthesis, glucose
metabolism, inflammation, anaemia and exercise tolerance, thus eluding
other triggers in the cycle of physical frailty [192].
In addition, physical activity is able to regulate cellular and molecular
functions [192]. Although physical activity does not mitigate the aging
process, it attenuates many of the systemic and cellular detrimental effects,
also improving the function of most of the mechanisms involved in aging
[203].
Nevertheless, frailty is a multidimensional entity that includes other factors
such as cognitive function. The growing evidence suggests that physical
INTRODUCTION
105
activity decreases the risk of early cognitive impairment and poor
cognition. A review of meta-analyses concluded that physical activity has
a neuroprotective effect for older adults [204]. Furthermore, a recent study
has shown that physical activity can reduce by 36% the risk of death among
cognitively frail people [205].
All of these might be reasons why physical activity can be a good strategy
in the frailty process. However, the role that physical activity and SB
specifically plays in frailty is poorly understood.
Epidemiological studies suggest an association between lower risk of
frailty and physical activity [206], especially that of MVPA. A cross-
sectional study showed that low MVPA was independently associated with
higher levels of frailty, inferior self-reported health, increased disability
and higher healthcare utilisation [207]. Similarly, Rogers et al. [208] found
that higher intensities of physical activity are needed for continued
improvement in frailty trajectories. Studies also show that there is a dose-
response relationship between greater amounts of physical activity and
lower frailty levels [206, 209-212]. For example, the likelihood of incident
frailty was decreased by 6% for each additional 1 MET-h/week increase in
physical activity [209]. However, most of these studies have been based on
self-reported measures of physical activity levels, which according to
Prince et al. [213], tend to be less accurate and overestimate physical
activity compared to objective methods such as accelerometry.
Although the relationship between physical behaviours and frailty has
been mainly focused on physical activity, there is currently a growing
interest in the association between frailty and SB. To our knowledge, there
are no clinical trials that have studied the effect of reducing ST on frailty.
Thus, the impact of SB on frailty is based on observational evidence. da
INTRODUCTION
106
Silva Coqueiro et al. [214] showed a positive association between self-
reported SB and frailty in a community-dwelling older adults. Blodgett et
al. [207] cross-sectional study performed in a sample of >50 years-old adults
found that ST was related with various adverse health outcomes including
frailty, regardless of the time spent in MVPA. The scarce longitudinal
evidence also indicates a harmful relationship between SB and frailty. For
example, a study in two Spanish cohorts of older adults demonstrated that
baseline self-reported television viewing time was linked to frailty at
follow-up [215]. Another longitudinal study carried out in 1333 middle to
older aged adults reported that every additional hour per day of ST
increased the odds of becoming frail at follow-up by 36%, independently
of MVPA [216]. Nonetheless, all these studies have important limitations
due to the wide heterogeneity in the age of the sample, the use of self-
reported measures, or poor approaches in the frailty construct.
Other SB accumulation patterns such as the frequency of BST have been
related to cardiometabolic health risk factors [217], physical function [218],
impairment in activities of daily living [219], and disability [220]. However,
the evidence is highly limited in relation to the way ST is spent on frailty.
INTRODUCTION
107

108

109
CHAPTER 2
JUSTIFICATION

JUSTIFICATION
110
JUSTIFICATION
111
Given that the older population has increased dramatically in recent
decades, successful aging is a major concern in developed societies. This
situation represents a challenge for health and social care resources, in
order to reduce the risk of non-communicable diseases, frailty and
disability associated with aging.
There is a large amount of evidence indicating that maintaining an active
lifestyle is crucial for healthy aging. In addition, SB has recently emerged
as an independent risk factor for different health outcomes. However, the
role that objectively measured ST and physical activity plays specifically in
frailty is insufficiently understood.
A review of how objectively measured ST is associated to frailty, disability,
and mortality in older adults can help clarify its importance as a risk factor
in these health outcomes (Study 1). Beyond the total time spent on SB, the
way in which SB is accumulated may impact on the wider health of
individuals. Specifically, the relationship between sedentary patterns and
frailty has not been yet investigated (Study 2).
Furthermore, a deeper understanding on how ST and physical activity
jointly interact with frailty in older adults could be relevant to identify
evidence-based strategies for the prevention and management of frailty in
this population group (Studies 3, 4 and 5).
Finally, a major limitation of the existing evidence to date is that mainly
relies on cross-sectional data, precluding us from making any causal
inferences due to the inability of establishing the temporal sequence of the
effects of ST or physical activity on frailty outcomes. Moreover, the absence
of longitudinal data assessing relationships between ST, physical activity,
and frailty are further complicated by the possibility of reverse causality.
JUSTIFICATION
112
Therefore, understanding the temporal order and the potential
bidirectionality underpinning the relationship between patterns of SB and
physical activity with frailty has the potential to inform about future public
health interventions aimed at reducing the frailty burden among older
adults (Studies 6 and 7).
JUSTIFICATION
113

114
115
CHAPTER 3
OBJECTIVES AND
HYPOTHESES
OBJECTIVES AND HYPOTHESES
116
OBJECTIVES AND HYPOTHESES
117
Study 1
Objectives:
- To systematically review the published literature related to the
potential role of objectively assessed ST with regards to some
of the most relevant outcomes of aging such as frailty,
disability, and mortality among older adults.
- To identify gaps in the current knowledge and future
directions for research.
Hypotheses:
- The available evidence will be limited, particularly in the
relationship between ST with frailty and mortality.
- The association between objectively measured ST and physical
performance in older adults will be strong.
- A wide variety of methodologies for data extraction and
analysis in the measurement of ST will be observed in the
included articles.
OBJECTIVES AND HYPOTHESES
118
Study 2
Objectives:
- To examine the associations of various SB patterns with frailty
in older people.
- To observe the association of the number of BST with frailty in
both active and inactive groups.
Hypotheses:
- Total ST per day and the proportion of the day spent in 10-
minutes bouts of ST will be positively linked to frailty.
- Breaks in sedentary time will be negatively associated with
frailty.
- Inactive subjects with less BST will have higher frailty values
compared to those with greater number of BST. In active
individuals, there will be no such differences between both
groups.
OBJECTIVES AND HYPOTHESES
119
Study 3
Objective:
- To use the isotemporal substitution technique in order to
investigate the displacement effect of replacing ST with LPA
and MVPA on frailty status among older adults (both in the
whole group and also separately with/without comorbidities).
Hypotheses:
- Replacing ST with MVPA will produce reductions in frailty in
both older adults with and without comorbidities.
- Light physical activity will only be beneficial in older adults
with comorbidities.
OBJECTIVES AND HYPOTHESES
120
Study 4
Objective:
- To examine the combination of mutually exclusive categories
of accelerometer-measured physical activity and ST on
physical function and frailty in a community-dwelling sample
of older adults.
Hypotheses:
- Meeting the physical activity guidelines will be associated with
the most beneficial physical function and frailty profiles in our
sample, regardless of sedentary status.
- Engaging in more LPA relative to ST will be associated with
better frailty and functional status only among inactive
individuals.
OBJECTIVES AND HYPOTHESES
121
Study 5
Objective:
- To determine whether the detrimental effects of SB on frailty
were moderated by objectively measured MVPA and the
magnitude of this moderation in a sample of older adults.
Hypotheses:
- Moderate-to-vigorous physical activity will be a moderator in
the relationship between ST and frailty in older adults.
- A MVPA amount close to the guidelines will be necessary to
eliminate the harmful effects of ST on frailty.
OBJECTIVES AND HYPOTHESES
122
Study 6
Objective:
- To examine the longitudinal and temporal order of the
association of accelerometer-assessed MVPA and ST with
frailty through a cross-lagged panel model during a follow-up
period of 4-years in a population sample of older adults.
Hypotheses:
- The relationship between MVPA and ST with frailty will be
unidirectional. Individuals who spent less time on MVPA at
baseline will be more likely to increase their future frailty score,
and individuals who are more frail will be more likely to spent
more time on SB at follow-up.
OBJECTIVES AND HYPOTHESES
123
Study 7
Objective:
- To investigate the longitudinal and temporal order of the
association between the number of daily BST and frailty using
a cross-lagged panel model in a total sample of community-
dwelling older adults as well as separately depending of their
level of physical activity (inactive vs. active participants) over
a 4-year period.
Hypotheses:
- There will be no relationship between daily BST and frailty
neither in the whole sample or in physically active individuals,
while the association will be inversely reciprocal in those
physically inactive individuals.

124

125
CHAPTER 4
MATERIAL AND
METHODS

MATERIAL AND METHODS
126
MATERIAL AND METHODS
127
4.1. Systematic Review
(Study 1)
The current short systematic review follows the PRISMA recommendations
for reporting systematic reviews [221].
4.1.1. Literature search
(Study 1)
The Literature search was conducted (October 2016) in PubMed and Web
of Science (WoS) online databases. The following Medical Subject Headings
(MeSH) of the United States National Library of Medicine and search terms
with the correspondent operators were included in this Boolean search
syntax: (elderly OR “older adults” OR “old people” OR “elders”) AND
(sedentarism OR sedentary OR sitting) AND (accelerometer OR
accelerometry OR “objectively measured sedentary” OR “objectively
measured physical”) AND:
(“physical function” OR “physical performance” OR “walking
performance” OR “walking velocity” OR “gait speed” OR “activity
of daily living”) to identify the section of articles related with
physical performance;
(frail OR frailty) to distinguish the section of articles related with
frailty status;
(mortality OR death OR “life expectancy”) to detect the section of
articles related with mortality.
MATERIAL AND METHODS
128
The search was limited to English language and full text availability of
eligible articles. Additional suitable studies were included by screening the
reference lists of each included study and other relevant reviews recently
published.
MATERIAL AND METHODS
129
4.1.2. Eligibility criteria
(Study 1)
For the review, studies were included if (i) they were journal articles in full,
(ii) participants were humans aged ≥60 years old, (iii) SB was assessed
using objective techniques and (iv) measurement of physical performance
was carried out by filed or laboratory objective tests. Performance was
defined as aspects of physical function (such as strength, endurance,
flexibility, speed and agility) that are associated with daily life activities
that are important for maintaining independence in older adults [222]. In
addition, frailty should be evaluated with a validated scale.
Studies were excluded from the analysis if (i) they were not available in
English and (ii) the association of sedentary lifestyle evaluated with
accelerometers was not examined with physical performance, frailty or
mortality. In the studies with participants younger than 60 years old we
only included the subsamples older than 60 years old when reported. The
retrieved studies were imported into the EndNote Web® reference
management software to remove any duplicates.
Firstly, titles and abstracts were screened by two independent reviewers
(AM and IA). Relevant articles were then selected for a full read of the
article. If no consensus was achieved between the two reviewers, a third
reviewer was consulted (AGG).
MATERIAL AND METHODS
130
MATERIAL AND METHODS
131
4.2. Participants of the studies
(Studies 2, 3, 4, 5, 6, and 7)
Data were taken from the TSHA, whose complete methodology has been
reported elsewhere [59, 64]. Briefly, the TSHA is a population prospective
cohort study aimed at studying the determinants and consequences of
frailty in institutionalized and community-dwelling individuals older than
65 years living in the province of Toledo, Spain.
Signed informed consent was obtained from all volunteers prior
participation in the study. The complete study was approved by the
Clinical Research Ethics Committee of the Toledo Hospital, which was
conducted according to the ethical standards defined in the 1964
Declaration of Helsinki.

MATERIAL AND METHODS
132
MATERIAL AND METHODS
133
4.3. Data collection
(Studies 2, 3, 4, 5, 6, and 7)
Data were collected in 3 stages for each wave. In the first stage, 6
psychologists conducted computer-assisted interviews face-to-face with
potential subjects. In the second stage, 3 nurses performed a physical
examination followed by clinical and performance tests at the subject’s
home. In the third stage, the participants went to their health centre to
provide a blood sample while fasting. At this stage, participants were
invited to wear an accelerometer for a week. Only participants who wore
the accelerometer for a week were included in these studies.
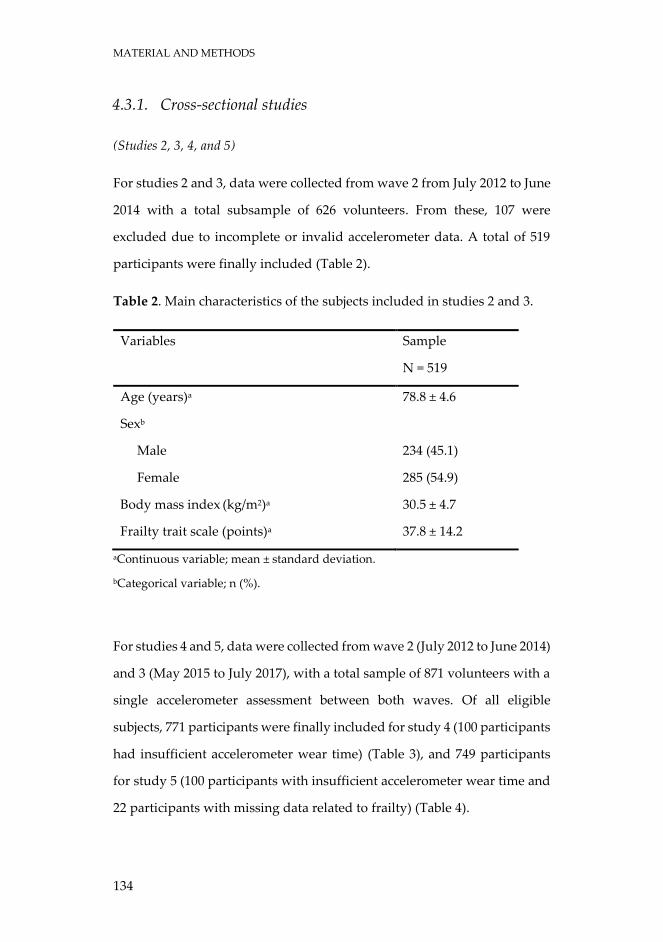
MATERIAL AND METHODS
134
4.3.1. Cross-sectional studies
(Studies 2, 3, 4, and 5)
For studies 2 and 3, data were collected from wave 2 from July 2012 to June
2014 with a total subsample of 626 volunteers. From these, 107 were
excluded due to incomplete or invalid accelerometer data. A total of 519
participants were finally included (Table 2).
Table 2. Main characteristics of the subjects included in studies 2 and 3.
Variables Sample
N = 519
Age (years)a 78.8 ± 4.6
Sexb
Male 234 (45.1)
Female 285 (54.9)
Body mass index (kg/m2)a 30.5 ± 4.7
Frailty trait scale (points)a 37.8 ± 14.2
aContinuous variable; mean ± standard deviation.
bCategorical variable; n (%).
For studies 4 and 5, data were collected from wave 2 (July 2012 to June 2014)
and 3 (May 2015 to July 2017), with a total sample of 871 volunteers with a
single accelerometer assessment between both waves. Of all eligible
subjects, 771 participants were finally included for study 4 (100 participants
had insufficient accelerometer wear time) (Table 3), and 749 participants
for study 5 (100 participants with insufficient accelerometer wear time and
22 participants with missing data related to frailty) (Table 4).
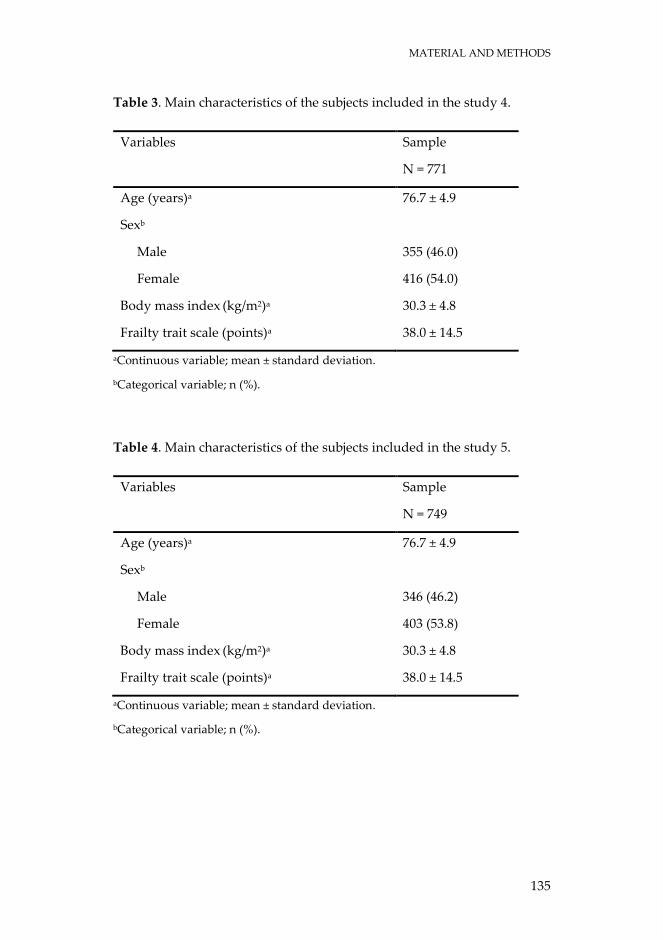
MATERIAL AND METHODS
135
Table 3. Main characteristics of the subjects included in the study 4.
Variables Sample
N = 771
Age (years)a 76.7 ± 4.9
Sexb
Male 355 (46.0)
Female 416 (54.0)
Body mass index (kg/m2)a 30.3 ± 4.8
Frailty trait scale (points)a 38.0 ± 14.5
aContinuous variable; mean ± standard deviation.
bCategorical variable; n (%).
Table 4. Main characteristics of the subjects included in the study 5.
Variables Sample
N = 749
Age (years)a 76.7 ± 4.9
Sexb
Male 346 (46.2)
Female 403 (53.8)
Body mass index (kg/m2)a 30.3 ± 4.8
Frailty trait scale (points)a 38.0 ± 14.5
aContinuous variable; mean ± standard deviation.
bCategorical variable; n (%).
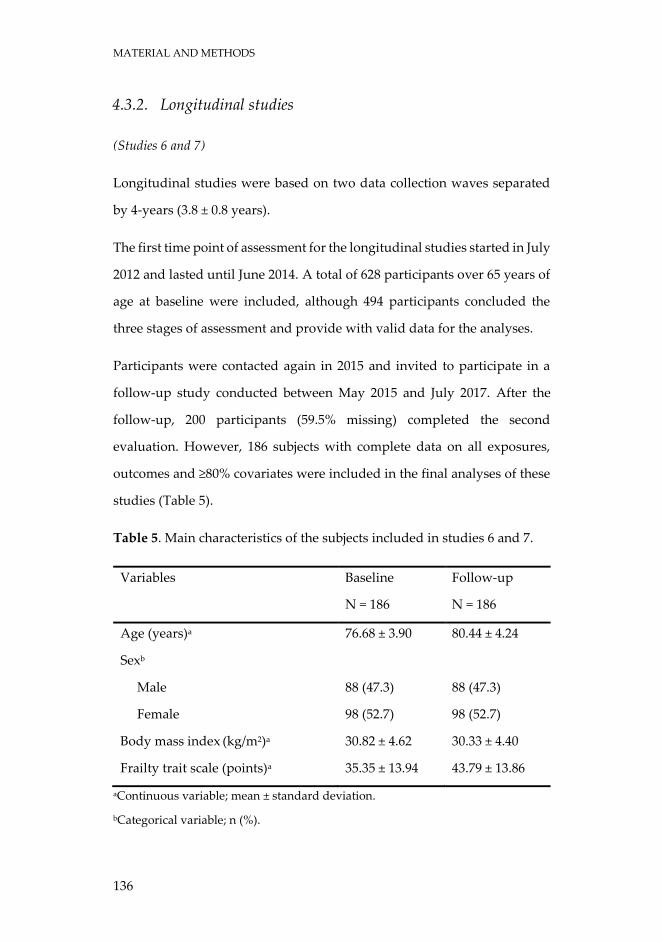
MATERIAL AND METHODS
136
4.3.2. Longitudinal studies
(Studies 6 and 7)
Longitudinal studies were based on two data collection waves separated
by 4-years (3.8 ± 0.8 years).
The first time point of assessment for the longitudinal studies started in July
2012 and lasted until June 2014. A total of 628 participants over 65 years of
age at baseline were included, although 494 participants concluded the
three stages of assessment and provide with valid data for the analyses.
Participants were contacted again in 2015 and invited to participate in a
follow-up study conducted between May 2015 and July 2017. After the
follow-up, 200 participants (59.5% missing) completed the second
evaluation. However, 186 subjects with complete data on all exposures,
outcomes and ≥80% covariates were included in the final analyses of these
studies (Table 5).
Table 5. Main characteristics of the subjects included in studies 6 and 7.
Variables Baseline
N = 186
Follow-up
N = 186
Age (years)a 76.68 ± 3.90 80.44 ± 4.24
Sexb
Male 88 (47.3) 88 (47.3)
Female 98 (52.7) 98 (52.7)
Body mass index (kg/m2)a 30.82 ± 4.62 30.33 ± 4.40
Frailty trait scale (points)a 35.35 ± 13.94 43.79 ± 13.86
aContinuous variable; mean ± standard deviation.
bCategorical variable; n (%).
MATERIAL AND METHODS
137
4.4. Assessments
(Studies 2, 3, 4, 5, 6, and 7)
4.4.1. Anthropometrics and confounding variables
(Studies 2, 3, 4, 5, 6, and 7)
Participants self-reported their age, sex and ethnicity (used in studies 2, 3,
4, 5, 6, and 7). Other socio-demographic variables such as education,
income, and marital status were also self-reported in face-to-face
interviews.
Educational status was assessed using seven categories ranging from 0 (no
schooling) to 6 (university studies). We standardized this item into none
(no schooling), low (primary school) and high (completed secondary school
or more) categories of education (used in studies 3, 4, 5, 6, and 7).
Marital status was coded into 4 categories: single, married/living together,
widowed, divorced/separated (used in studies 4, 5, 6 and 7).
Income was coded into 3 categories ranging from any income to
€3000/month (used in studies 4, 5, and 6).
Height and body mass were obtained on each subject using calibrated
balance and stadiometer (Seca 711 scales, Hamburg, Germany). Both
measurements were performed in the upright position, in underwear and
barefoot. Height was recorded in the Frankfort plane with a precision of 1
mm, and the body mass was determined with a 100 g precision. Body mass
index (BMI) was calculated as body mass (kg) divided by height (m)
squared (kg/m2) (used in studies 5 and 7).
MATERIAL AND METHODS
138
Waist and hip circumference were measured using standard procedures
[223]. Waist-to-hip ratio was then calculated by dividing waist
circumference by hip circumference (used in the study 3).
We also assessed objective cognitive function using the Mini-Mental State
Examination (MMSE) [224] (used in studies 2, 3, 6, and 7).
The Charlson Comorbidity Index was used to account for comorbidity
status of participants [225] (used in studies 2 and 3). Diseases included in
this Index and their weighting are myocardial infarction, congestive heart
failure, peripheral vascular disease, dementia, cerebrovascular disease,
chronic lung disease, connective tissue disease, ulcer, chronic liver disease,
diabetes (weight 1); hemiplegia, moderate or severe kidney disease,
diabetes with complication, tumour, leukaemia, lymphoma (weight 2);
moderate or severe liver disease (weight 3); metastatic solid tumour, and
AIDS (weight 6).
Finally, the number of prescription and non-prescription drugs within the
Anatomical Therapeutic Chemical (ATC) Classification System taken by
the participant was calculated [226] (used in studies 2 and 3).
MATERIAL AND METHODS
139
4.4.2. Physical activity and sedentary behaviour
(Studies 2, 3, 4, 5, 6, and 7)
Physical activity and SB were objectively assessed by accelerometry
(ActiTrainer and wGT3X-BT; ActiGraph, LLC, Pensacola, FL). All
participants were instructed how to wear an accelerometer on the left hip
during waking hours. Participants wore the accelerometer for 7 consecutive
days and removed it during any bathing or swimming activities.
Accelerometer output is an activity count, which is the weighted sum of the
number of accelerations measured over a time period or epoch. The devices
were initialized to collect data using 1-minute epochs and all data were
collected using the vertical axis collection mode. Non-wear time was
defined as periods of at least 60 consecutive minutes of zero counts, with
allowance for 2 minutes of counts between zero and 100 [227]. Inclusion
criteria comprised at least 4 days with at least 8 hours recorded per day
without excessive counts (i.e., >20,000 counts).
4.4.2.1. Time
(Studies 2, 3, 4, 5, 6, and 7)
Accelerometer counts were used to derive the time spent in each intensity
band: SB (<100 counts/min), LPA (100-1951 counts/min), MPA (1952-5724
counts/min), VPA (≥5725 counts/min), and MVPA (≥1952 counts/min)
[228]. Although there is a lack of consensus on the use of cut-off points to
classify the intensity of the activity, the cut-off points used in these studies
are the most commonly reported in this population group [229]; making
our results comparable to other studies. Time spent in ST, LPA, MPA, VPA,
MATERIAL AND METHODS
140
and MVPA was then registered. All these outcomes were weighted by daily
averaged wear time on valid days (i.e. outcome summed over all wear time
divided by the number of successfully monitored days for each
participant). Minutes per day spent in each intensity band were then
calculated (used in studies 2, 3, 4, 5, 6, and 7). In addition, SB, MPA, VPA,
and MVPA time accumulated in bouts of ≥10 min, allowing for a two-
minute exception in the intensity threshold, were also derived (used in
studies 2 and 4).
4.4.2.2. Patterns
(Studies 2 and 7)
Each minute with less than 100 counts was considered ST [228, 229].
Therefore, a BST was defined as at least 1 min where the accelerometer
registers ≥100 counts following a sedentary period. The number per day of
BST was recorded (used in studies 2 and 7). The duration (min) per day of
BST was also recorded (used in the study 2).
A ≥10-min bout of sedentary time (ST-10) was defined as a period of at least
10 consecutive minutes where the accelerometer registered <100
counts/min. The number, duration (min) and proportion over total ST-10
per day were recorded (used in the study 2). The corresponding variables
were weighted by daily average wear time on valid days.
Different sedentary pattern variables were standardized (Z-score =
[observed - sample mean]/sample standard deviation (SD)).
In an effort to account for the combined effect of both duration and number
of the different patterns, two composite Z-scores representing patterns of
MATERIAL AND METHODS
141
ST [ST COMP = Z-score ST-10 (number/day) + Z-score ST-10 (minutes/day)]
and patterns of BST [BST-COMP = Z-score BST (number/day) + Z-score BST
(minutes/day)] were then computed (used in the study 2).
4.4.2.3. Categories
(Studies 4 and 7)
We followed the methods outlined in Bakrania et al. [230] to classify
participants into 4 mutually exclusive behavioural categories according to
their levels of physical activity and SB (used in the study 4). Based on
Bakrania et al. [230], and other studies [231, 232], the LPA-to-ST ratio was
used to classify participants in this study as low sedentary if they resided
in the first quartile. Given that most of our sample was expected to be
sedentary [233, 234], the remaining participants (i.e. those in quartiles 2, 3,
and 4 of LPA-to-ST ratio) were classified as high sedentary. MVPA status
was classified as ‘physically active’ or ‘physically inactive’ on the basis of
whether or not participants met the WHO physical activity
recommendations for older adults [139]. For this, at least one of these three
premises had to be met: accumulate 150 minutes of MPA per week over
periods of at least 10 minutes; accumulate 75 minutes of VPA per week over
periods of at least 10 minutes, or accumulate 150 minutes per week of an
equivalent combination of MVPA over periods of at least 10 minutes.
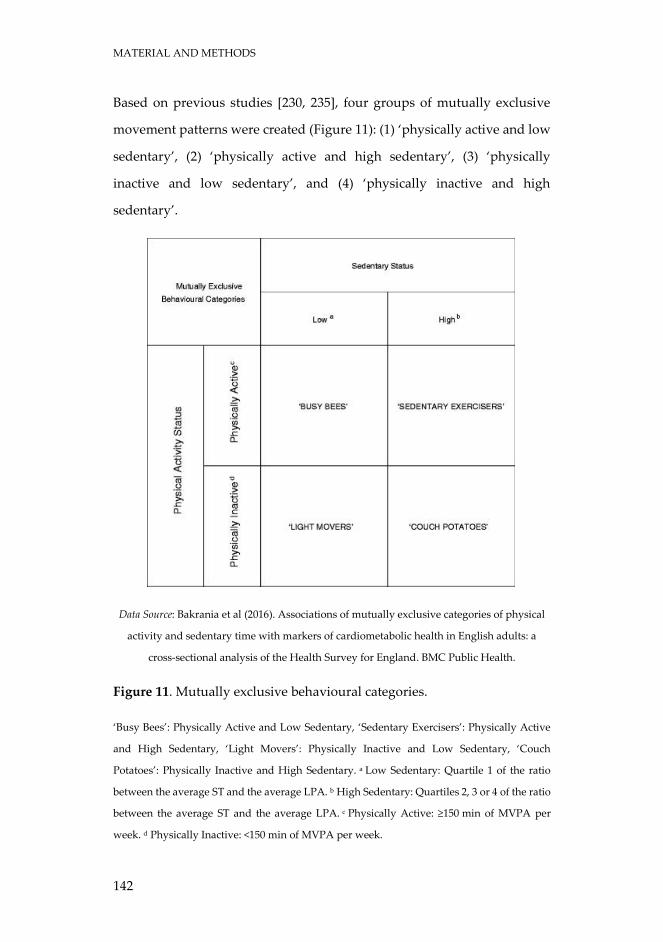
MATERIAL AND METHODS
142
Based on previous studies [230, 235], four groups of mutually exclusive
movement patterns were created (Figure 11): (1) ‘physically active and low
sedentary’, (2) ‘physically active and high sedentary’, (3) ‘physically
inactive and low sedentary’, and (4) ‘physically inactive and high
sedentary’.
Data Source: Bakrania et al (2016). Associations of mutually exclusive categories of physical
activity and sedentary time with markers of cardiometabolic health in English adults: a
cross-sectional analysis of the Health Survey for England. BMC Public Health.
Figure 11. Mutually exclusive behavioural categories.
‘Busy Bees’: Physically Active and Low Sedentary, ‘Sedentary Exercisers’: Physically Active
and High Sedentary, ‘Light Movers’: Physically Inactive and Low Sedentary, ‘Couch
Potatoes’: Physically Inactive and High Sedentary. a Low Sedentary: Quartile 1 of the ratio
between the average ST and the average LPA. b High Sedentary: Quartiles 2, 3 or 4 of the ratio
between the average ST and the average LPA. c Physically Active: ≥150 min of MVPA per
week. d Physically Inactive: <150 min of MVPA per week.
MATERIAL AND METHODS
143
Compliance with physical activity recommendations was calculated in
order to classify individuals as active or inactive (used in the study 7). To
be active, at least one of these three premises had to be met [140]:
accumulate 150 minutes of MPA per week; accumulate 75 minutes of VPA
per week; or accumulate 150 minutes per week of an equivalent
combination of MVPA.
MATERIAL AND METHODS
144
4.4.3. Frailty
(Studies 2, 3, 4, 5, 6, and 7)
The FTS [59] was used to assess frailty in this study. The FTS includes 7
aspects: energy balance and nutrition, activity, nervous system, vascular
system, weakness, endurance, and slowness. These domains become
operational through 12 items:
Energy balance and nutrition were assessed by BMI, central obesity (waist
circumference), unintentional weight loss, and serum albumin level.
Activity was assessed by using the total score of the Physical Activity Scale
for the Elderly [60].
The nervous system was calculated by considering verbal fluency and
balance. Verbal fluency was estimated by asking the participants to give
names of animals during one minute [61]. Balance was measured by
Romberg test [62].
The vascular system was measured by the brachial-ankle index done with
Doppler ultrasound [63].
Weakness was estimated by assessing grip strength in the dominant arm
and the knee extension strength [64].
Endurance was assessed by the chair stand test, which measures the
number of times that a person stands up in 30 seconds [65].
Slowness was estimated by calculating the time to walk 3 m at a “normal
pace” according to a standard protocol [62].
Each item score represents a biological trait and ranges from 0 (the best) to
4 (the worst), except in the “chair test” where the range is from 0 to 5 points
MATERIAL AND METHODS
145
because of the necessity of scoring those unable to stand a single time.
When appropriate, items are analysed according to the item’s quintile
distribution in the population.
To be included in the study, the participants had to overcome at least 75%
(9 of the 12) of the items included in the FTS [59]. The total score was
calculated by adding all the scores in each item divided by total score for
each individual and multiplying by 100, standardizing the measure to a
range from 0 (best score) to 100 (worst score), according to the formula
Total score = (Σ items score/total score possible by individual)*100.
MATERIAL AND METHODS
146
4.4.4. Physical Function
(Study 4)
The Short Physical Performance Battery (SPPB) was used to assess the
physical function in this study [62]. The SPPB consists of the following tests:
1) balance test: time standing in 3 different positions (feet together, semi-
tandem and full tandem) a maximum time of 10 s each; 2) usual gait speed:
tested in a distance of three meters; and 3) chair stand test: time necessary
to get up and sit on the chair five times with the arms crossed on the chest
as fast as possible. The tests were scored as described in the original
protocol [62].
MATERIAL AND METHODS
147
4.5. Data analyses
(Study 2)
Data were analysed using PASW Statistic, version 23.0.0, with statistical
significance set at p<0.05 (two-tailed). Descriptive statistics (mean ± SD)
were calculated for all outcome measurements of the study.
Multiple linear regressions were used to examine the associations between
frailty and the different SB patterns assessed. A model adjusted by age,
gender, comorbidity status, mental health, and polypharmacy status was
fitted for each of the SB pattern outcomes.
Participants were clustered into 2 different groups according to the
adherence to WHO physical activity guidelines status (i.e. meeting or not
the guidelines) and were compared using t-test for independent
measurements. Participants within each of the former groups were re-
allocated to either less BST group (i.e. group falling below the 50th
percentile of BST) or more BST group (i.e. group falling over the 50th
percentile of BST) and then compared using t-test for independent
measurements.
(Study 3)
All analyses were performed using the statistical software SPSS, version
24.0 (IBM Corp, Armonk, NY). Mean (SD) and frequency (percentage) were
provided for continuous and categorical variables, respectively.
Descriptive variables were compared between included and excluded
participants with an independent t test or chi-square test for continuous
and categorical variables, respectively.
MATERIAL AND METHODS
148
Linear regression models were used to examine associations between time
spent (minutes/d) in SB, LPA, and MVPA with the score in the FTS. Models
were adjusted for prespecified covariates hypothesized to be
independently associated with both exposure and outcome variables,
including sex, age, educational status, polypharmacy status, functional
fitness (SPPB), waist-to-hip ratio, comorbidity status (Charlson Index), and
cognitive function (MMSE).
Variance inflation factor was calculated to quantify the severity of
multicollinearity in the regression analyses. All variance inflation factors
were below 10. The Condition Number and Durbin-Watson statistic were
also analysed.
When performing subgroup analysis by comorbidity status, the Charlson
Index was removed from the covariates. Subjects without comorbidity
were those who scored 0 and subjects with comorbidity scored 1 or higher
on the Charlson Index.
Three different linear regression models were used [236]. The first set of
models are single-factor, examining the association of each intensity
category (ST, LPA, and MVPA) with frailty status without mutual
adjustment for other activity categories. The second are partition models
examining the association of each intensity category while controlling for
each of the other categories of activity. The third are isotemporal
substitution models that represent the estimated effects of substituting ST
with an equal amount of time spent in LPA or in MVPA. In this model, ST
was excluded whereas total wear time was kept constant in the equation
[237]. For ease of interpretation, 30-minute units were chosen as time units
for each behaviour. These models assume linear relationships between
MATERIAL AND METHODS
149
dependent and independent variables, which were determined prior to
performing these analyses.
(Study 4)
Analyses were performed using the statistical software SPSS version 24.0
(IBM Corp., Armonk, NY). Participant characteristics of the full sample,
stratified by each category, were tabulated. Mean (SD) and frequency
(percentage) were provided for continuous and categorical variables,
respectively.
Ternary plots with the three behaviours were generated to show the
distribution of the sample compositions using R statistical system version
3.1.1.
To test our hypothesis, a multiple linear regression analysis with the
behavioural category as independent variable and frailty or physical
function as dependent variable was fitted. Covariates in the model
included: age, sex, education, marital status, and income. The ‘physically
inactive and high sedentary’ category was selected as the reference
category.
Also, the continuous association between time spent in sedentary activities
as well as MVPA with the outcomes of interest in the study were explored
via regression. The same set of covariates in addition to accelerometer wear
time as well as both continuous MVPA time and sedentary status was used.
All analyses were two-sided where p≤0.05 was considered to be statistically
significant.
MATERIAL AND METHODS
150
(Study 5)
Statistical analyses were conducted using R software (R project version
3.5.1). Summary statistics were used to describe variables of interest.
Significance levels were set at P<0.05.
A multiple linear regression was conducted to determine the associations
between time per day spent in SB and frailty in the sample population.
An interaction term was then included in the equation to test the
moderation effects of MVPA in the SB-frailty relationship.
Lastly, the Johnson-Neyman technique [238, 239] was used to elucidate the
MVPA values in which a significant and nonsignificant relationship exists
between SB and frailty in the sample population. To confirm the robustness
of our estimates, rank-based regression analyses were performed. All
models above were adjusted for age, sex, education, income, marital status,
BMI, MVPA, and accelerometer wear time.
(Study 6)
Preliminary analyses examined variable distributions, sample
characteristics and attrition using R software (R project version 3.5.1).
Descriptive variables were compared between participants retained with
those of participants not retained from wave1-wave2 with an independent
t test or chi-square test for continuous and categorical variables,
respectively.
MATERIAL AND METHODS
151
Descriptive statistics (mean and SD for continuous variables and as
frequencies and percentages for categorical variables) were calculated for
all outcome measurements. Comparison between baseline and follow-up
time continuous variables was performed using a paired sample t-test.
We tested our hypotheses using structural equation modelling with
maximum likelihood estimation using functions from the R package
Lavaan [240]. Full information maximum likelihood was used to provide
unbiased and efficient estimates of the parameters of interest missingness
at random [241]. Two cross-lagged panel models were used to test the
hypothesis of the study. A cross-lagged panel model was implemented to
test the relationships between SB and frailty status across the two time
points for the present study (i.e., initial assessment and 4-year follow-up).
The second cross-lagged panel model was used to test the relationships
between MVPA and frailty status. The null hypotheses would be supported
if neither of the coefficients associated with the cross paths were
significantly different from zero. If the cross path towards frailty in time 2,
but not towards SB/MVPA in time 2, was significant, then hypotheses 1 (H1)
would be supported. If it were the reverse of the latter, then H2 would be
supported. Finally, if both paths were significant, then H3 would be
supported. Analyses included sex as time-invariant variable; in addition,
age, education, marital status, income, BMI, MMSE, and accelerometer
wear time were allowed to be time-varying covariates (i.e., allowing for
possible changes in these measures from initial assessment to follow-up).
Among the strengths of using a cross-lagged panel approach is that it
allows simultaneous analysis of the two dependent outcomes, thereby
permitting the identification of possible bidirectional associations over
time.
MATERIAL AND METHODS
152
Model fit was assessed using a selection of fit indices and criteria: root mean
square error of approximation (RMSEA) (≤0.06), standardized root mean
square residual (SRMR) (≤0.08), confirmatory fit index (CFI) (≥0.95), and
Tucker-Lewis index (TLI) (≥0.95) [242].
(Study 7)
All analyses were conducted with the R software (R project version 3.5.1)
and significance level was set at usual P<0.05.
Baseline participants that did and did not complete the follow-up
assessment were compared on their demographics and other
characteristics with an independent t-test or chi-square test for continuous
and categorical variables, respectively. The Mean (SD) and frequencies
(percentages) were used to describe continuous variables and categorical
variables respectively. A paired t-test was used to compare participants
retained in the study across time points of assessment. An independent t-
test was conducted to compare active and inactive participants.
We addressed our main objective using a structural equation modelling
framework using functions from the R package Lavaan [240]. The full
information maximum likelihood was used to provide unbiased and
efficient estimates of the parameters of interest using the complete available
information [241]. A cross-lagged panel model was designed to test the
relationships between number of daily BST and frailty status between the
initial assessment and the 4-year follow-up. Among the strengths of using
a cross-lagged panel approach is that it tolerates simultaneous analysis of
the two dependent outcomes, thereby allowing the identification of
possible bidirectional associations over time. Covariates included sex as
MATERIAL AND METHODS
153
time-invariant variable, in addition to age, education, marital status, BMI,
MMSE, MVPA, and accelerometer wear time as time-variant.
Subsequently, two more cross-lagged panel models were made by
stratifying the sample in those active and inactive individuals.
Model fit was considered using a selection of fit indices and criteria as
previously published [242]: RMSEA (≤0.06), SRMR (≤0.08), CFI (≥0.95), and
TLI (≥0.95).

154

155
CHAPTER 5
RESULTS

RESULTS
156
RESULTS
157
5.1. STUDY 1
“Role of objectively measured
sedentary behaviour in physical
performance, frailty and mortality
among older adults: A short
systematic review”

RESULTS
158
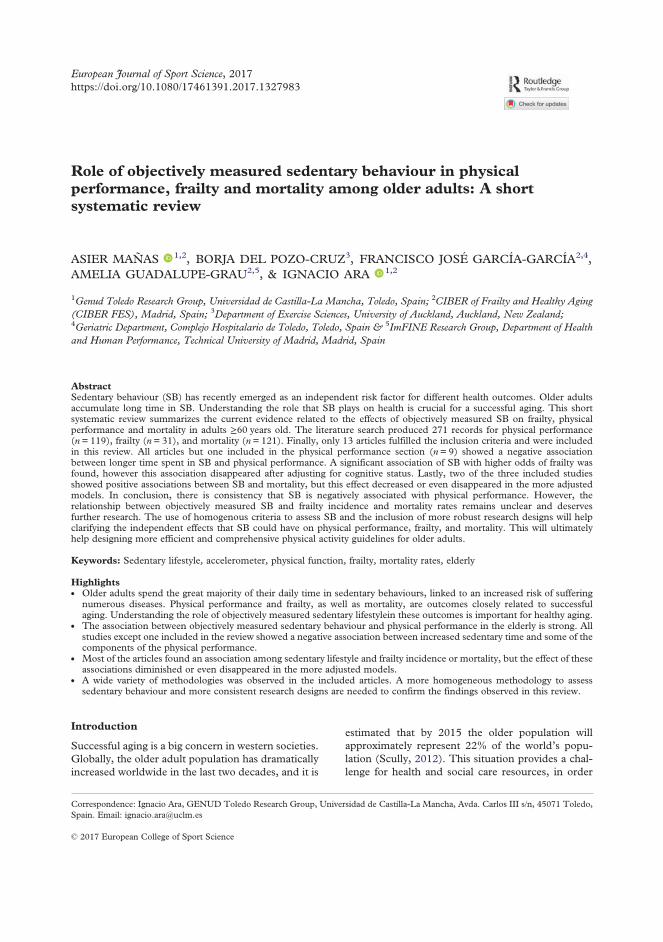
Role of objectively measured sedentary behaviour in physicalperformance, frailty and mortality among older adults: A shortsystematic review
ASIER MAÑAS 1,2, BORJA DEL POZO-CRUZ3, FRANCISCO JOSÉ GARCÍA-GARCÍA2,4,AMELIA GUADALUPE-GRAU2,5, & IGNACIO ARA 1,2
1Genud Toledo Research Group, Universidad de Castilla-La Mancha, Toledo, Spain; 2CIBER of Frailty and Healthy Aging(CIBER FES), Madrid, Spain; 3Department of Exercise Sciences, University of Auckland, Auckland, New Zealand;4Geriatric Department, Complejo Hospitalario de Toledo, Toledo, Spain & 5ImFINE Research Group, Department of Healthand Human Performance, Technical University of Madrid, Madrid, Spain
AbstractSedentary behaviour (SB) has recently emerged as an independent risk factor for different health outcomes. Older adultsaccumulate long time in SB. Understanding the role that SB plays on health is crucial for a successful aging. This shortsystematic review summarizes the current evidence related to the effects of objectively measured SB on frailty, physicalperformance and mortality in adults ≥60 years old. The literature search produced 271 records for physical performance(n= 119), frailty (n= 31), and mortality (n= 121). Finally, only 13 articles fulfilled the inclusion criteria and were includedin this review. All articles but one included in the physical performance section (n= 9) showed a negative associationbetween longer time spent in SB and physical performance. A significant association of SB with higher odds of frailty wasfound, however this association disappeared after adjusting for cognitive status. Lastly, two of the three included studiesshowed positive associations between SB and mortality, but this effect decreased or even disappeared in the more adjustedmodels. In conclusion, there is consistency that SB is negatively associated with physical performance. However, therelationship between objectively measured SB and frailty incidence and mortality rates remains unclear and deservesfurther research. The use of homogenous criteria to assess SB and the inclusion of more robust research designs will helpclarifying the independent effects that SB could have on physical performance, frailty, and mortality. This will ultimatelyhelp designing more efficient and comprehensive physical activity guidelines for older adults.
Keywords: Sedentary lifestyle, accelerometer, physical function, frailty, mortality rates, elderly
Highlights. Older adults spend the great majority of their daily time in sedentary behaviours, linked to an increased risk of suffering
numerous diseases. Physical performance and frailty, as well as mortality, are outcomes closely related to successfulaging. Understanding the role of objectively measured sedentary lifestylein these outcomes is important for healthy aging.
. The association between objectively measured sedentary behaviour and physical performance in the elderly is strong. Allstudies except one included in the review showed a negative association between increased sedentary time and some of thecomponents of the physical performance.
. Most of the articles found an association among sedentary lifestyle and frailty incidence or mortality, but the effect of theseassociations diminished or even disappeared in the more adjusted models.
. A wide variety of methodologies was observed in the included articles. A more homogeneous methodology to assesssedentary behaviour and more consistent research designs are needed to confirm the findings observed in this review.
Introduction
Successful aging is a big concern in western societies.Globally, the older adult population has dramaticallyincreased worldwide in the last two decades, and it is
estimated that by 2015 the older population willapproximately represent 22% of the world’s popu-lation (Scully, 2012). This situation provides a chal-lenge for health and social care resources, in order
© 2017 European College of Sport Science
Correspondence: Ignacio Ara, GENUD Toledo Research Group, Universidad de Castilla-La Mancha, Avda. Carlos III s/n, 45071 Toledo,Spain. Email: [email protected]
European Journal of Sport Science, 2017https://doi.org/10.1080/17461391.2017.1327983
to reduce the risk of non-communicable diseases anddisability. In that regard, sarcopenia (i.e. loss ofmuscle mass and strength) plays a central role, indu-cing to a reduced physical performance and impairedability to perform activities of daily living thereforeincreasing the risk of being frail (Roubenoff, 2000).Frailty, a common condition among the older
population (Landi et al., 2010), has been describedas a biological status in which resistance to stressorsis reduced mainly due to cumulative declines in thefunction of different biological systems (Fried et al.,2001), including the immune, endocrine, musculos-keletal and nervous system (Walston et al., 2006).Frailty leads to a state of high vulnerability toadverse health outcomes in the individuals and it isassociated with worsening of physical functioning,falls, higher rates of admissions to hospital, co-mor-bidity and mortality (Landi et al., 2010).There is substantial evidence indicating that main-
tenance of an active lifestyle is central to successfulaging. Consequently, the relationship between phys-ical activity (PA), especially moderate-to-vigorousphysical activity (MVPA), and frailty is now wellestablished. In a recent study, Blodgett, Theou, Kirk-land, Andreou, and Rockwood (2015) demonstrateda relationship between MVPA and frailty among agroup of people over 50 years old. Peterson et al.(2009) concluded that PA is a preventive factor forfrailty among the older population. A recent meta-analysis conducted by Chang and Lin (2015)suggested that older adults with frailty have thehighest risks of mortality when compared withrobust elderly, followed by individuals in the pre-frail phase.While greater attention has been placed on pro-
moting MVPA for general health, the negativeeffects of sedentary behaviour (SB), including thosebehaviours characterized by very low energy expendi-ture while in a sitting or reclining posture, have beenshown to be highly important. In a study published byStamatakis and Hamer (2011), SB emerged as anindependent risk factor for different health outcomessuch as cardiovascular and chronic diseases. Inaddition, large epidemiological studies have indi-cated that self-reported SB is associated with allcauses of mortality in a dose–response manner (Katz-marzyk, Church, Craig, & Bouchard, 2009) and withthe incidence of cardiovascular diseases among thegeneral population (Manson et al., 2002). SB ishighly prevalent among the older population (Daviset al., 2011; Matthews et al., 2008). Hallal et al.(2012) conducted a global assessment in more than60 countries and found that the elderly had thehighest prevalence of self-reported sitting time ascompare with younger adults. The scarce numberof studies conducted among older adults indicate
that SB is an independent risk factor for importantaging outcomes including declining physical function(Santos et al., 2012; Seguin et al., 2012), greater dis-ability in activities of daily living (Dunlop et al.,2015), and increased mortality (Leon-Munoz et al.,2013). Finally, some reviews have systematically ana-lysed the detrimental effects of sedentary lifestyle on avariety of health outcomes in older people (deRezende, Rey-Lopez, Matsudo, & do Carmo Luiz,2014; Wirth et al., 2017), but none have done so con-sidering only objectively measured data of SB andrelating it to physical performance, frailty and mor-tality. Identifying the health outcomes of objectivelyassessed SB in the older population seems to becrucial for a successful aging.Therefore, the aim of this short systematic review is
to provide a brief summary of the published literaturerelated to the potential role of objectively assessed SBwith regards to some of the important outcomes ofaging. Thus, this review is divided into three differentsections, summarizing separately the existing evi-dence in regards to the potential role of objectivelyassessed SB for frailty, disability and mortalityamong older adults. For each section, the limitedavailable evidence is critically reviewed, while gapsin the current knowledge and future directions forresearch are identified.
Methods
The current short systematic review follows thePRISMA recommendations for reporting systematicreviews (Hutton et al., 2015).
Literature search
Literature search was conducted (October 2016) inPubMed and Web of Science (WoS) online data-bases. The following Medical Subject Headings(MeSH) of the United States National Library ofMedicine (NLM) and search terms with the corre-spondent operators were included in this Booleansearch syntax: (elderly OR “older adults” OR “oldpeople” OR “elders”) AND (sedentarism OR seden-tary OR sitting) AND (accelerometer OR accelero-metry OR “objectively measured sedentary” OR“objectively measured physical”) AND:
. (“physical function”OR “physical performance”OR “walking performance” OR “walking vel-ocity” OR “gait speed” OR “activity of dailyliving”) to identify the section of articles relatedwith physical performance;
. (frail OR frailty) to distinguish the section ofarticles related with frailty status;
2 A. Mañas et al.
. (mortality OR death OR “life expectancy”) todetect the section of articles related withmortality.
The search was limited to English language and fulltext availability of eligible articles. Additional suitablestudies were included by screening the reference listsof each included study and other relevant reviewsrecently published.
Eligibility criteria
For the review, studies were included if (i) they werejournal articles in full, (ii) participants were humansaged ≥60 years old, (iii) SB was assessed using objec-tive techniques and (iv) measurement of physical per-formance was carried out by filed or laboratoryobjective tests. Performance was defined as aspectsof physical function (such as strength, endurance,flexibility, speed and agility) that are associated withdaily life activities that are important for maintainingindependence in older adults (Guralnik, Ferrucci,Simonsick, Salive, & Wallace, 1995). In addition,frailty should be evaluated with a validated scale.Studies were excluded from the analysis if (i) theywere not available in English and (ii) the associationof sedentary lifestyle evaluated with accelerometerswas not examined with physical performance, frailtyor mortality. In the studies with participants youngerthan 60 years old we only included the subsamplesolder than 60 years old when reported. The retrievedstudies were imported into the EndNote Web® refer-ence management software to remove any duplicates.Firstly, titles and abstracts were screened by two inde-pendent reviewers (AM and IA). Relevant articleswere then selected for a full read of the article. If noconsensus was achieved between the two reviewers, athird reviewer was consulted (AGG).
Results
The literature search produced 271 records, 119 inthe physical performance section, 31 in the frailtystatus section and 121 in the mortality section.After the removal of duplicates, 177 articles wereexcluded based on title and abstract screening (59in the physical performance section, 17 in the frailtystatus section and 101 in the mortality section) and31 were excluded based on eligibility criteria (19 inthe physical performance section, 6 in the frailtystatus section and 6 in the mortality section) (seedetails in Figure 1).After all this process, nine full-text article remained
in the in the physical performance section, one in thefrailty status section, and three in the mortality
section. Thus, in total 13 full-text articles werefinally included in the review (a summary of themost relevant study details of these studies areincluded in Table I).
SB and physical performance
Seven cross-sectional studies, one interventionalstudy and one randomized clinical trial (RCT) inves-tigated the relationship between SB and physical per-formance (Table I). Fleig et al. (2016) showed anegative association between time spent in sedentaryactivities and gait speed (Beta (β): −90.13; standarderror (SE): 42.03) in 53 older adults with hip frac-ture. Cooper et al. (2015) conducted a study in alarge cohort of 1727 participants from the MRCNational Survey of Health and Development inEngland, Scotland and Wales. They showed thatone standard deviation score greater time spentsedentary was associated with lower grip strength(−0.588 kg; 95% CI: −1.062, −0.115), chair risespeed (−0.550 stands/min; 95% CI: −0.898,−0.201), standing balance time (−0.050 s; 95% CI:−0.076, −0.024) and Timed Up-&-Go speed(−0.021 m/s; 95% CI: −0.028, −0.013). Theseeffect estimates remained similar after additionaladjustment for other potential confounders, exceptfor the association with chair rise speed (−0.084stands/min; 95% CI: −0.426, 0.257) and standingbalance time (−0.024 s; 95% CI: −0.050, 0.002)which were substantially attenuated, largely due toadjustment for long-term limiting illness or disability.A total of 117 males and 195 females, aged 65–
103 years, were assessed in the article of Santoset al. (2012). They found a negative associationbetween the composite Z-score for functional fitnessand the sedentary time (β: −0.002; 95% CI:−0.003, −0.001), even adjusting for MVPA andother confounders (β: −0.002; 95% CI: −0.002,−0.001). Likewise, Rosenberg et al. (2016) con-firmed these findings showing that higher sedentaryactivity was statistically significant associated withworse physical function (Short Physical PerformanceBattery (SPPB), balance task scores, 400-m walktime, chair stand time and gait speed), regardless ofparticipation in MVPA.Rosenberg et al. (2015) examined the effects of an
eight-week behavioural intervention to reduce seden-tary time among older overweight and obese olderadults. An improvement in gait speed (p= .01; d:0.52) but not in chair stands (p= .46; d: 0.11) andSPPB total score (p= .37; d: 0.14) was found as aresult of the intervention.Barone Gibbs et al. (2016), in a RCT, divided par-
ticipants into one of two arms: Sit Less or Get Active.
Role of objectively measured sedentary behaviour 3
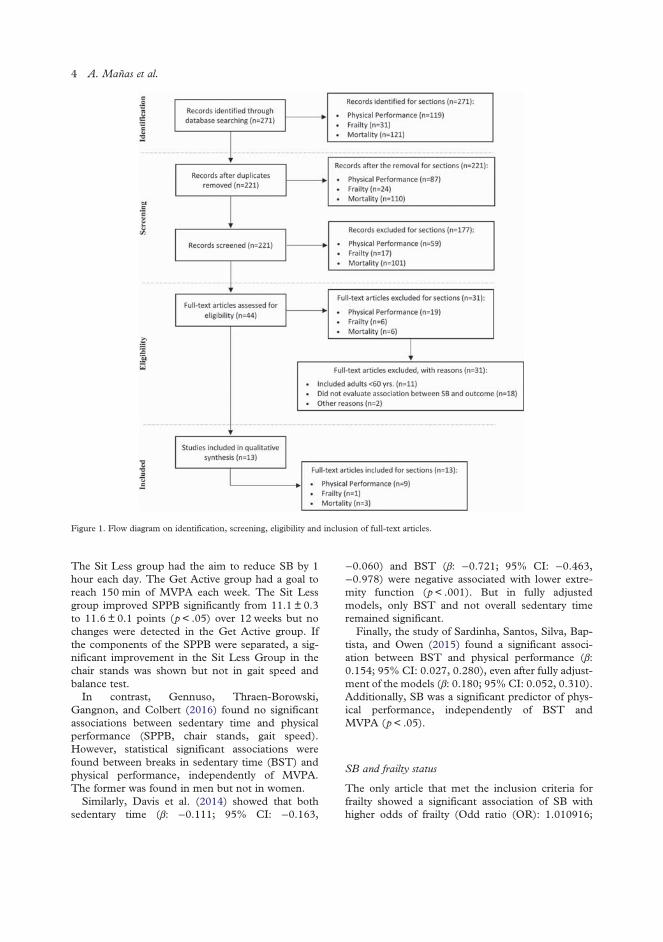
The Sit Less group had the aim to reduce SB by 1hour each day. The Get Active group had a goal toreach 150 min of MVPA each week. The Sit Lessgroup improved SPPB significantly from 11.1 ± 0.3to 11.6 ± 0.1 points (p< .05) over 12 weeks but nochanges were detected in the Get Active group. Ifthe components of the SPPB were separated, a sig-nificant improvement in the Sit Less Group in thechair stands was shown but not in gait speed andbalance test.In contrast, Gennuso, Thraen-Borowski,
Gangnon, and Colbert (2016) found no significantassociations between sedentary time and physicalperformance (SPPB, chair stands, gait speed).However, statistical significant associations werefound between breaks in sedentary time (BST) andphysical performance, independently of MVPA.The former was found in men but not in women.Similarly, Davis et al. (2014) showed that both
sedentary time (β: −0.111; 95% CI: −0.163,
−0.060) and BST (β: −0.721; 95% CI: −0.463,−0.978) were negative associated with lower extre-mity function (p< .001). But in fully adjustedmodels, only BST and not overall sedentary timeremained significant.Finally, the study of Sardinha, Santos, Silva, Bap-
tista, and Owen (2015) found a significant associ-ation between BST and physical performance (β:0.154; 95% CI: 0.027, 0.280), even after fully adjust-ment of the models (β: 0.180; 95% CI: 0.052, 0.310).Additionally, SB was a significant predictor of phys-ical performance, independently of BST andMVPA (p< .05).
SB and frailty status
The only article that met the inclusion criteria forfrailty showed a significant association of SB withhigher odds of frailty (Odd ratio (OR): 1.010916;
Figure 1. Flow diagram on identification, screening, eligibility and inclusion of full-text articles.
4 A. Mañas et al.
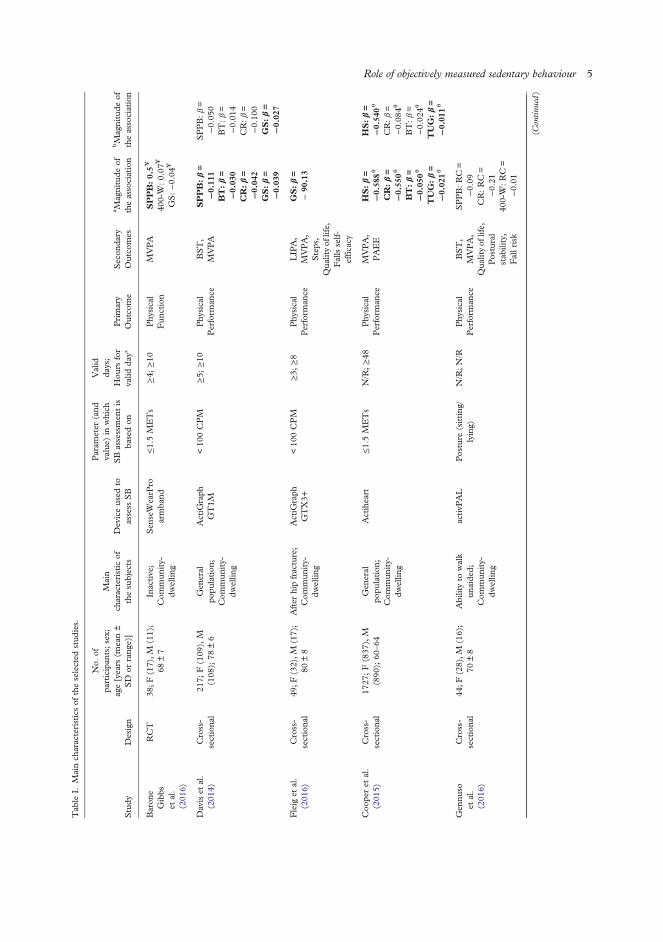
Tab
leI.
Mainch
aracteristicsof
theselected
stud
ies.
Study
Design
No.
ofpa
rticipan
ts;sex;
age[years
(mean±
SD
orrang
e)]
Main
characteristic
ofthesubjects
Deviceused
toassess
SB
Param
eter
(and
value)
inwhich
SBassessmen
tis
basedon
Valid
days;
Hou
rsfor
valid
day∗
Primary
Outco
me
Secon
dary
Outco
mes
a Magnitude
oftheassociation
bMagnitude
oftheassociation
Baron
eGibbs
etal.
(201
6)
RCT
38;F
(17),M
(11);
68±7
Inactive;
Com
mun
ity-
dwellin
g
Sen
seW
earP
roarmba
nd≤1.5M
ETs
≥4;
≥10
Phy
sical
Fun
ction
MVPA
SPPB:0.5¥
400-W
:0.07
¥
GS:−0.04
¥
Daviset
al.
(201
4)Cross-
sectiona
l21
7;F(109
),M
(108
);78
±6
Gen
eral
popu
lation
;Com
mun
ity-
dwellin
g
ActiG
raph
GT1M
<10
0CPM
≥5;
≥10
Phy
sical
Perform
ance
BST,
MVPA
SPPB:β=
−0.11
1BT:β=
−0.03
0CR:β=
−0.04
2GS:β=
−0.03
9
SPPB:β=
−0.05
0BT:β=
−0.01
4CR:β=
−0.10
0GS:β=
−0.02
7
Fleig
etal.
(201
6)Cross-
sectiona
l49
;F(32),M
(17);
80±8
After
hipfracture;
Com
mun
ity-
dwellin
g
ActiG
raph
GTX3+
<10
0CPM
≥3;
≥8
Phy
sical
Perform
ance
LIP
A,
MVPA,
Steps,
Qua
lityof
life,
Fallsself-
effic
acy
GS:β=
−90
.13
Coo
peret
al.
(201
5)Cross-
sectiona
l17
27;F(837
),M
(890
);60
–64
Gen
eral
popu
lation
;Com
mun
ity-
dwellin
g
Actiheart
≤1.5M
ETs
N/R;≥48
Phy
sical
Perform
ance
MVPA,
PAEE
HS:β=
−0.58
8θ
CR:β=
−0.55
0θ
BT:β=
−0.05
0θ
TUG:β=
−0.02
1θ
HS:β=
−0.54
0θ
CR:β=
−0.08
4θ
BT:β=
−0.02
4θ
TUG:β=
−0.01
1θ
Gen
nuso
etal.
(201
6)
Cross-
sectiona
l44
;F(28),M
(16);
70±8
Abilityto
walk
unaide
d;Com
mun
ity-
dwellin
g
activP
AL
Posture
(sitting
/lying)
N/R;N/R
Phy
sical
Perform
ance
BST,
MVPA,
Qua
lityof
life,
Postural
stab
ility,
Fallrisk
SPPB:RC=
−0.09
CR:RC=
−0.21
400-W
:RC=
−0.01
(Contin
ued)
Role of objectively measured sedentary behaviour 5
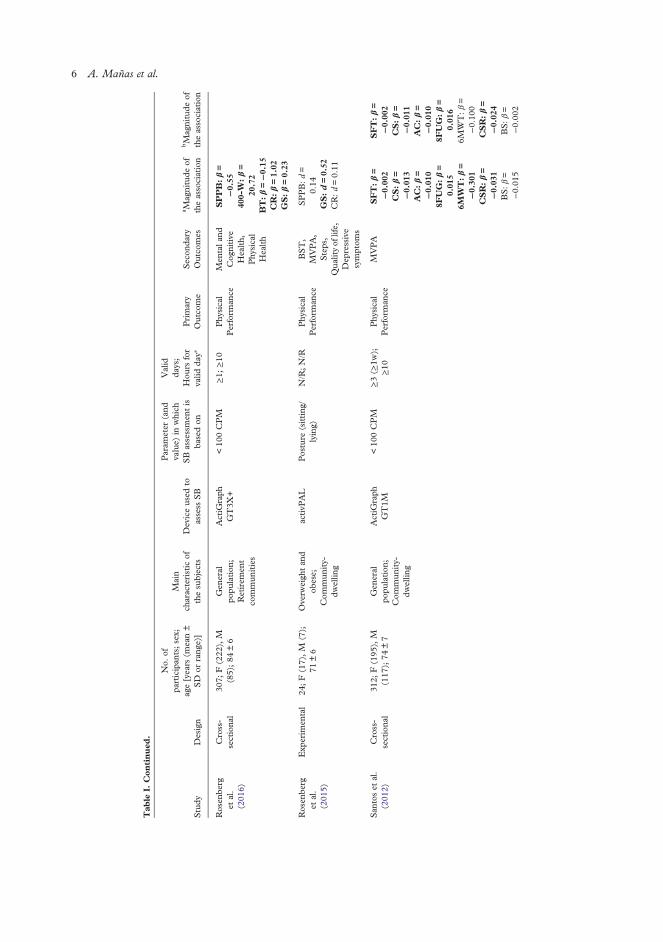
Tab
leI.
Con
tinued
.
Study
Design
No.
ofpa
rticipan
ts;sex;
age[years
(mean±
SD
orrang
e)]
Main
characteristic
ofthesubjects
Deviceused
toassess
SB
Param
eter
(and
value)
inwhich
SBassessmen
tis
basedon
Valid
days;
Hou
rsfor
valid
day∗
Primary
Outco
me
Secon
dary
Outco
mes
a Magnitude
oftheassociation
bMagnitude
oftheassociation
Rosen
berg
etal.
(201
6)
Cross-
sectiona
l30
7;F(222
),M
(85);84
±6
Gen
eral
popu
lation
;Retirem
ent
commun
ities
ActiG
raph
GT3X
+<10
0CPM
≥1;
≥10
Phy
sical
Perform
ance
Men
tala
ndCog
nitive
Health,
Phy
sical
Health
SPPB:β=
−0.55
400-W
:β=
20.72
BT:β=−0.15
CR:β=1.02
GS:β=0.23
Rosen
berg
etal.
(201
5)
Exp
erim
ental
24;F(17),M
(7);
71±6
Overw
eigh
tan
dob
ese;
Com
mun
ity-
dwellin
g
activP
AL
Posture
(sitting
/lying)
N/R;N/R
Phy
sical
Perform
ance
BST,
MVPA,
Steps,
Qua
lityof
life,
Dep
ressive
symptom
s
SPPB:d=
0.14
GS:d=0.52
CR:d=0.11
San
toset
al.
(201
2)Cross-
sectiona
l31
2;F(195
),M
(117
);74
±7
Gen
eral
popu
lation
;Com
mun
ity-
dwellin
g
ActiG
raph
GT1M
<10
0CPM
≥3(≥
1w);
≥10
Phy
sical
Perform
ance
MVPA
SFT:β=
−0.00
2CS:β=
−0.01
3AC:β=
−0.01
08F
UG:β=
0.01
56M
WT:β=
−0.30
1CSR:β=
−0.03
1BS:β=
−0.01
5
SFT:β=
−0.00
2CS:β=
−0.01
1AC:β=
−0.01
08F
UG:β=
0.01
66M
WT:β=
−0.10
0CSR:β=
−0.02
4BS:β=
−0.00
2
6 A. Mañas et al.
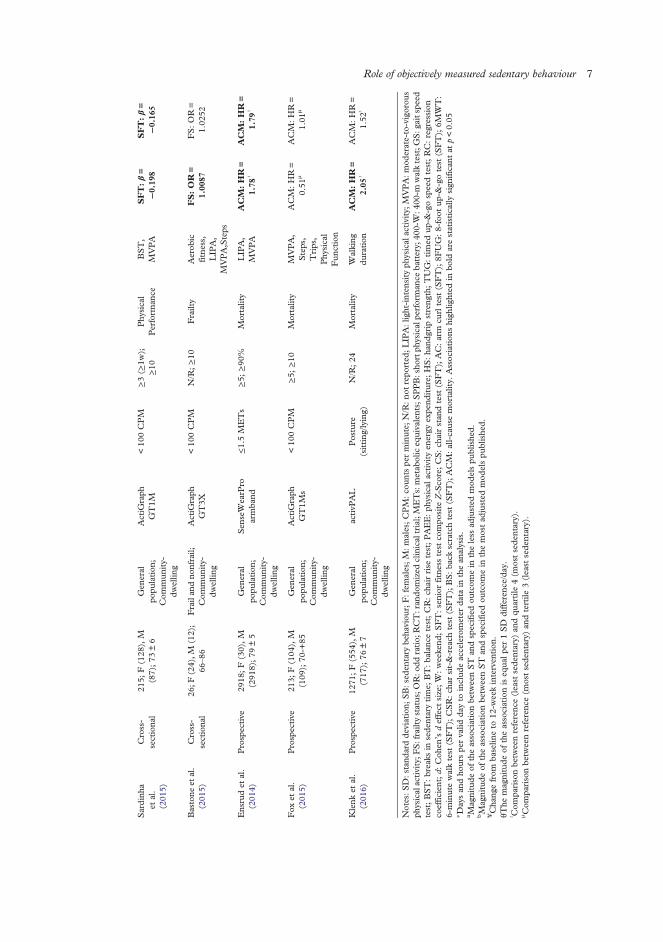
Sardinh
aet
al.
(201
5)
Cross-
sectiona
l21
5;F(128
),M
(87);73
±6
Gen
eral
popu
lation
;Com
mun
ity-
dwellin
g
ActiG
raph
GT1M
<10
0CPM
≥3(≥
1w);
≥10
Phy
sical
Perform
ance
BST,
MVPA
SFT:β=
−0.19
8SFT:β=
−0.16
5
Bastone
etal.
(201
5)Cross-
sectiona
l26
;F(24),M
(12);
66–86
Frailan
dno
nfrail;
Com
mun
ity-
dwellin
g
ActiG
raph
GT3X
<10
0CPM
N/R;≥10
Frailty
Aerob
icfitne
ss,
LIP
A,
MVPA,Steps
FS:OR=
1.00
87FS:OR=
1.02
52
Ensrudet
al.
(201
4)Prospective
2918
;F(30),M
(291
8);79
±5
Gen
eral
popu
lation
;Com
mun
ity-
dwellin
g
Sen
seW
earP
roarmba
nd≤1.5M
ETs
≥5;
≥90
%Mortality
LIPA,
MVPA
ACM:HR=
1.78
ᶾ
ACM:HR=
1.79
ᶾ
Fox
etal.
(201
5)Prospective
213;
F(104
),M
(109
);70
-+85
Gen
eral
popu
lation
;Com
mun
ity-
dwellin
g
ActiG
raph
GT1M
s<10
0CPM
≥5;
≥10
Mortality
MVPA,
Steps,
Trips,
Phy
sical
Fun
ction
ACM
:HR=
0.51
μACM
:HR=
1.01
μ
Klenk
etal.
(201
6)Prospective
1271
;F(554
),M
(717
);76
±7
Gen
eral
popu
lation
;Com
mun
ity-
dwellin
g
activP
AL
Posture
(sitting
/lying)
N/R;24
Mortality
Walking
duration
ACM:HR=
2.05
ᶾ
ACM
:HR=
1.52
ᶾ
Notes:S
D:stand
ardde
viation;
SB:sed
entary
beha
viou
r;F:fem
ales;M
:males;C
PM:c
ountspe
rminute;
N/R:n
otrepo
rted
;LIPA:light-inten
sity
physical
activity;M
VPA:m
oderate-to-vigorou
sph
ysicalactivity;F
S:frailtystatus;O
R:o
ddratio;
RCT:ran
domized
clinicaltrial;METs:metab
oliceq
uivalents;SPPB:sho
rtph
ysicalpe
rforman
ceba
ttery;
400-W:4
00-m
walktest;G
S:g
aitspe
edtest;BST:breaks
insede
ntarytime;
BT:ba
lanc
etest;CR:ch
airrise
test;PAEE:ph
ysical
activity
energy
expe
nditure;
HS:ha
ndgrip
streng
th;TUG:timed
up-&
-gospeedtest;RC:regression
coeffic
ient;d:
Coh
en’sdeffect
size;W:weekend
;SFT:senior
fitne
sstest
compo
site
Z-Sco
re;CS:ch
airstan
dtest
(SFT);AC:arm
curltest
(SFT);8F
UG:8-foot
up-&
-gotest
(SFT);6M
WT:
6-minutewalktest
(SFT);CSR:ch
arsit-&-reach
test
(SFT);BS:ba
ckscratchtest
(SFT);ACM:all-causemortality.
Assoc
iation
shigh
lighted
inbo
ldarestatistically
sign
ificant
atp<0.05
∗ Daysan
dho
urspe
rvalid
dayto
includ
eaccelerometer
data
inthean
alysis.
a Magnitude
oftheassociationbe
tweenST
andspecified
outcom
ein
theless
adjusted
mod
elspu
blishe
d.bMagnitude
oftheassociationbe
tweenST
andspecified
outcom
ein
themostad
justed
mod
elspu
blishe
d.¥Cha
ngefrom
baselin
eto
12-w
eekinterven
tion
.θT
hemagnitude
oftheassociationiseq
ualp
er1SD
differen
ce/day.
ᶾ Com
parisonbe
tweenreferenc
e(least
sede
ntary)
andqu
artile
4(m
ostsede
ntary).
μ Com
parisonbe
tweenreferenc
e(m
ostsede
ntary)
andtertile
3(least
sede
ntary).
Role of objectively measured sedentary behaviour 7
95% CI: 1.00127, 1.020655), but this associationdisappeared when the statistical model was adjustedfor cognitive function (OR: 1.025228; 95% CI:0.999848, 1.051252) (Table I).
SB and mortality
Three prospective cohort studies investigated therelationship between SB and mortality (all-cause,cardiovascular, cancer, other causes) (Table I).Ensrud et al. (2014) showed that more time spent
in sedentary activities was associated with greaterrisk of death. Individuals in the highest SB quartilehad a higher all-cause mortality (Hazard ratio (HR):1.56, 95% CI: 1.15, 2.14) than those in the lowestSB quartile (reference group) after adjusting ofmodels for multiple confounders. Further adjust-ment did not attenuate this association (HR: 1.79,95% CI: 1.19, 2.70).Similarly, Klenk et al. (2016) found a higher mor-
tality risk in those subjects with the longer SB timescompared with their physically active counterparts(HR: 2.05, 95% CI: 1.13, 3.73). However, afteradjusting for various health outcomes and biomarkersthis association disappeared (HR: 1.63, 95% CI:0.88, 3.02).In Fox et al. (2015) individuals were classified as
low, medium and high sedentary time per day.They showed no associations between sedentarytime and all-cause mortality in any case, with unad-justed (low group, HR= 0.51, 95% CI: 0.21, 1.26)and after more completely adjusted models (lowgroup, HR = 1.01, 95% CI: 0.35, 2.98).
Discussion
To the best of our knowledge, this is the first reviewthat examines the association between objectivelymeasured SB and its effects on physical performance,frailty and mortality in older people. Although thenumber of studies in which accelerometers wereused in order to ascertain SB is very limited in thispopulation, a relationship between SB and a wor-sened physical performance is observed. However,the association between SB and frailty incidenceand mortality rates remains unclear due to thereduced number of studies available in the literature.
Effects of SB on physical performance
Earlier studies where sedentary lifestyle has beenmeasured by auto-reported questionnaires show thatthe longer time older adults spend on SB, the higheradverse health outcomes (i.e. diabetes, cardiovascular
diseases) present, independently of MVPA (Wilmotet al., 2012). Disability is a major adverse healthoutcome resulting in limitations in the activities ofdaily living. This is of special interest, since PA hasbeen proposed for the prevention of impaired physicalfunctioning in older ages (Lang, Guralnik, & Melzer,2007). However, these studies do not consider seden-tary time as an independent domain of behaviour.In the current review, we have found a negative
association between SB and physical performance,regardless of MVPA in two of the cross-sectionalstudies reviewed (Rosenberg et al., 2016; Santoset al., 2012). Likewise, Fleig et al. (2016) andCooper et al. (2015) found a negative associationbetween time spent on sedentary activities andvarious physical performance tests in older adults.Accordingly, Dunlop et al. (2015) found a strongrelationship between greater time spent in SB andthe presence of activities of daily living disability,and Ikezoe, Asakawa, Shima, Kishibuchi, and Ichiha-shi (2013) with a slower time in the Timed Up-&-Gotest and lower muscle strength. The independentrelationship of SPPB extends recent findings demon-strating that objectively measured sedentary time,controlled for MVPA, is related to metabolic syn-drome (Bankoski et al., 2011), cancer (Lynch et al.,2011) and mortality (Koster et al., 2012). In contrast,investigations performed in adults failed to relatesitting time with impaired muscle strength or gait/mobility (Reid et al., 2016). These discrepanciesmay be attributable, at least in part, to the heterogen-eity in the participant study samples examined.SB and physical performance have also been
related longitudinally. Seguin et al. (2012) studied62,000 woman aged 50–79 years from the Women’sHealth Initiative, and observed that those with thehigher auto-reported sitting time and total sedentarytime at the beginning of the study, had the higherreduction in self-reported physical performanceafter 12.3 years’ follow-up. Unfortunately, self-report is susceptible to socially desirable responding(Adams et al., 2005), and older adults have a lessaccurate recall (Bonnefoy et al., 2001).Thus, objectively assessed SB as well as home-
based physical performance tests may provide moreaccurate and reliable results. According to our litera-ture review, the RCT study performed by BaroneGibbs et al. (2016) demonstrated that a 12 weekintervention aimed to reduce SB has a higher effecton physical performance rather than on time spenton MVPA in older sedentary but highly physicallyfunctional adults. In agreement, Rosenberg et al.(2015) showed that an eight-week behavioural inter-vention to reduce SB is feasible and effective amongolder overweight and obese adults in order to increasephysical performance.
8 A. Mañas et al.
The present findings highlight the need to separateSB from insufficient MVPA patterns. This is impor-tant because it enables SB as a modifiable additionalrisk factor for impaired physical performance, disabil-ity and loss of independence. Beyond this, thereseems to be a negative relationship between spendingmore time on sedentary activities and physicalperformance.Moreover, it is important to discuss that the way
sedentary time is spent also matters. For example,Sardinha et al. (2015) as well as Davis et al. (2014)found that breaking-up time in SB was positivelyassociated with physical performance in olderadults, even after controlling for overall time inMVPA and SB. Davis et al. (2014) also reportedthat breaking-up time in SB predicted overall physicalperformance and was associated to higher scores inselected fitness parameters like upper and lowerbody muscle strength. This is not the case of highfunctioning older adults who spend over an hour aday walking, where higher SB and lower breakswere associated with an improved muscle quality(Chastin, Ferriolli, Stephens, Fearon, & Greig,2012). Given the surprising results, authors explainit by a higher body fat that might provide a trainingstimulus to maintain muscle power.Gennuso et al. (2016) reported that longer bouts
and fewer breaks in SB is negatively associated withphysical function in older adults, regardless of partici-pation inMVPA. This adds to previous research werethe odds for abdominal obesity decreased 7% foreach additional hourly break in sedentary time inolder women (Judice, Silva, Santos, Baptista, & Sar-dinha, 2015), as well as triglycerides and plasmaglucose (Healy, Dunstan, et al., 2008).These findings represent a new challenge for public
health recommendations regarding how to break upsedentary patterns complementary to those for PAin order to improve physical functionality.
Effects of SB on frailty status
Current scientific evidence consistently shows thatchanges in body composition, especially loss ofmuscle mass, together with low PA and high SB,could be an important contributor for developingfrailty in older adults (Fried et al., 2001). Interest-ingly, regular exercise is probably the only non-drugderived therapy effective to improve physical func-tion, cognitive performance and mood (Landi et al.,2010), besides sarcopenia (Gianoudis, Bailey, &Daly, 2015), which is the central problem in thefrailty syndrome.Despite all the potential benefits of PA in relation to
frailty, frail older adults spend 84.9% (about 10 h), oftheir daily time in SBs (Jansen et al., 2015). Previous
evidence indicates that physically inactive individualswho have higher levels of functional disability (Trem-blay, Kho, Tricco, & Duggan, 2010), and those indi-viduals who have high levels of SB are more likely tobe frail (Peterson et al., 2009).DA Silva Coqueiro et al. (2016) found a positive
association between self-reported sedentary timeand frailty in 316 community-dwelling older adults.The authors calculated that 7 h per day of SB wasthe best cut-off point to discriminate frail individuals.However, this cut-off point is quite low in compari-son with other studies reporting objectively measuredSB (Jansen et al., 2015).The only study that met the inclusion criteria in the
present literature review for the frailty section was theone recently published by Bastone Ade, Ferriolli,Teixeira, Dias, and Dias (2015). This investigationfound that the frail group spent more time in SBthat their robust peers. SB was significantly associ-ated to frailty, even after adjusting by the number ofchronic health conditions, but this association disap-peared when the statistical model was adjusted bycognitive status. Bastone and coworkers did notreport an association between SB and frailty statusindependently of the PA levels. This was the case inBlodgett et al. (2015) study, where a positive associ-ation was observed between SB and various adversehealth outcomes (frailty, self-reported health, activi-ties of daily living disability and healthcare utiliz-ation), independent of MVPA in a community-dwelling older adults (>50 years) sample. As a limit-ation, these cross-sectional studies do not take intoconsideration causality. Therefore, it is not possibleto certainly know if SB causes the appearance offrailty or if frailty can cause that individuals chooseto have a more sedentary lifestyle.Longitudinal studies like the one by Song et al.
(2015) support the existing idea of a relationshipamong daily sedentary time and the development ofa frailty status, regardless of MVPA. But the scarceavailable data prevent to robustly demonstrate thisassociation, and more studies using similar method-ologies both to measure SB and frailty are needed.
Effects of SB on mortality
As early as in the 1950s, we can found the first indi-cation that SB could markedly increase adversehealth outcomes. Morris, Heady, Raffle, Roberts,and Parks (1953) demonstrated a double age-adjusted rate of fatal coronary heart disease in busdrivers (sedentary) when compared with conductors(active) workers.Since then, much research efforts have been
focused on the relationship of an active lifestyle andvarious health outcomes, even with all-cause
Role of objectively measured sedentary behaviour 9
mortality rates (Bembom, van der Laan, Haight, &Tager, 2009). However, much less attention hasbeen devoted on the effects of SB on mortality.Again, scientific literature relies on self-reported ques-tionnaires to demonstrate an association between SBand mortality (all-cause, cardiovascular, colorectalcancer and other causes) in adults and older adults,independently of PA levels (Dunstan et al., 2010).This implies the limitation that questionnaires maynot correctly differentiate sedentary time from lightPA (Pate, O’Neill, & Lobelo, 2008), but the existingscientific literature using objective PA measurementsis very scarce at the moment (Pate et al., 2008).While Ensrud et al. (2014) observed that individ-
uals in the higher SB quartile had a higher all-causemortality than those in the lower SB quartile, Foxet al. (2015) found that despite spending a meantime of 11 SB hours, the study participants did notshow an association among mortality rates andsedentary time volume.Klenk et al. (2016) found a higher mortality risk in
those subjects who spent more time in sedentaryactivities. However, when biomarkers were includedas a confounding variable the association disappeared.Interestingly, a large recent review combining data
from over one million participants found that 60–75 min of PA a day eliminated the harms of sittingwhen it came to measuring death from cardiovasculardisease or death by all causes (Ekelund et al., 2016).Despite the large number of people included in thereview, the results should be taken with caution asthey are based on self-report PA and SB data. Whenwe take into consideration populations younger thanthose included in this review, studies mainly report asignificant effect of SB onmortality (Healy,Wijndaele,et al., 2008; Koster et al., 2012). Among those, Kosteret al. (2012) concluded that SB is a risk factor for mor-tality independent of moderate-to-vigorous PA.Unfortunately, drawing conclusions in this section iscomplicated because of the small number of studiesand the confusing results of each of them.
Methodological issues
To date, the use of accelerometers is considered themost valid and reliable method to assess SB, despitenot all devices are able to discriminate betweensitting and standing changes in the posture (An,Kim, & Lee, 2017). In order tomake stronger the con-clusions of this review, only studies using acceler-ometers to assess SB were included. However, thevariety of devices utilized and the diversity in tech-niques regarding data extraction and analysis acrossstudies makes difficult drawing definitive conclusions.Reactivity is an important point to take into
account when measuring PA and SB with
accelerometry because it may introduce a relevantbias. Although the Hawthorne effect has been recog-nized as a potential limitation of the accelerometrymethod, evidence remains limited (Dossegger et al.,2014). It seems clear that in children and adolescentsthere may be some reactivity (Kremers & Brug,2008). However, tampering with devices seems tobe less likely among older adults (Pedisic &Bauman, 2015). None of the studies included inthis review use strategies to avoid reactivity, thereforethe results and conclusions must be interpreted withcaution since the evidence in this area is still scarce.The number of valid days and the minimum hours
per day included in the analysis from the acceler-ometer data is another important methodologicalissue when working with these type of devices. Theaverage number of valid days to include acceler-ometer data in the analysis is 3.6 ± 1.4 days amongthe studies reporting this value included in thereview. However, according to the study of Hart,Swartz, Cashin, and Strath (2011) conducted inolder people, at least five days are necessary to ade-quately capture the SB. Thus, studies which takeless than five valid days for the accelerometry analysismight be unrepresentative. Moreover, cut-offs pointsfor sedentary strip establishment is also important,knowing that they are dependent on the analysesunit (i.e. epoch length and axes) (Aguilar-Farias,Brown, & Peeters, 2014).The third important methodological variable to
consider is the criteria for non-wear time of the accel-erometers. In that regard, published studies aredivided between the algorithm proposed by Troiano(2007) or the algorithm recommended by Choi,Liu, Matthews, and Buchowski (2011). The latterincorporates improvements for the misclassificationof time intervals spent in SB that do not pass thewear/non-wear classification criteria for the lowactivity counts. Thus, studies in populations with alow PA and high SB patterns, such as older adults,could likely benefit from these improvements (Choiet al., 2011).Although according to the definition of SB (Seden-
tary Behaviour Research Network, 2012) only SBshould be accounted during waking hours, onestudy in this review included the time that individualsspend sleeping as SB (Klenk et al., 2016). This canlead to an overestimation of sedentary time andshould be taken into account when comparingresults from studies using different approaches.Finally, another important aspect that should be
considered when studying SB in relation to healthoutcomes is MVPA. This factor should be takeninto account within the covariates included in thestatistical models so that the independent effect ofSB can be ascertain. The same applies with health
10 A. Mañas et al.
status, especially in older adults studies in order toavoid confounding interactions (Andrade & Fer-nandes, 2012).Although Pedisic and Bauman (2015) concluded
that accelerometer-based studies had limitationsregarding generalisability, validity, comprehensive-ness, simplicity, affordability, adaptability, between-study comparability and sustainability, many ofthese methodological aspects have not yet been hom-ogenized. Overall, the discrepancy in the methodo-logical aspects across the analysed studies in thisreview may preclude us from drawing definitive con-clusions, although a recent review that could helpresearchers to make better decisions before andafter data collection using accelerometers, in orderto obtain more valid and comparable data has beenpublished (Migueles et al., 2017). Consistency inthe methodological aspects when assessing SB andstronger research designs are crucial points toconfirm the observed findings in this review.
Summary and conclusion
There is consistent evidence of the relationshipbetween objectively measured SB and physical per-formance in the elderly. The association amongsedentary lifestyle, frailty incidence and mortalityrates warrant further investigation. The lack ofstudies assessing these outcomes and the widevariety of methodological issues reported among thereviewed studies make difficult to draw definitiveconclusions. Another important aspect that deservesfurther investigation is the manner that SB is accu-mulated. BST seem to minimize the decline of phys-ical performance with aging. Future research shouldtest this hypothesis also regarding frailty and mor-tality outcomes.While sedentary lifestyle can have an independent
relationship on the outcomes of interest for thisreview, future studies should consider how PA andSB could simultaneously influence these outcomes.The latter has already been studied in relation tocardio-metabolic health variables (Bakrania et al.,2015) but, to our knowledge, no studies have ana-lysed this combined effect on physical performance,frailty and mortality. Nonetheless, homogeneitywith regards to the assessment of SB and other meth-odological issues commented in this review will helpclarifying the potential role of SB (and patterns) onphysical performance, frailty and mortality amongolder adults.
Disclosure statement
No potential conflict of interest was reported by the authors.
Funding
This work was supported by the Biomedical Research NetworkingCenter on Frailty and Healthy Aging (CIBERFES) and FEDERfunds from the European Union [CB16/10/00477]. AM hasreceived a PhD Grant from the Universidad de Castilla LaMancha [2015/4062].
ORCID
Asier Mañas http://orcid.org/0000-0002-1683-1365Ignacio Ara http://orcid.org/0000-0002-2854-6684
References
Adams, S. A., Matthews, C. E., Ebbeling, C. B., Moore, C. G.,Cunningham, J. E., Fulton, J., & Hebert, J. R. (2005). Theeffect of social desirability and social approval on self-reportsof physical activity. American Journal of Epidemiology, 161(4),389–398. doi:10.1093/aje/kwi054
Aguilar-Farias, N., Brown, W. J., & Peeters, G. M. (2014).Actigraph GT3X+ cut-points for identifying sedentary behav-iour in older adults in free-living environments. Journal ofScience and Medicine in Sport, 17(3), 293–299. doi:10.1016/j.jsams.2013.07.002
Andrade, C., & Fernandes, P. (2012). Is sitting harmful to health?It is too early to say.Archives of InternalMedicine, 172(16), 1272–1273; author reply 1273. doi:10.1001/archinternmed.2012.2539
An, H. S., Kim, Y., & Lee, J. M. (2017). Accuracy of inclinometerfunctions of the activPAL and ActiGraph GT3X+: A focus onphysical activity. Gait & Posture, 51, 174–180. doi:10.1016/j.gaitpost.2016.10.014
Bakrania, K., Edwardson, C. L., Bodicoat, D. H., Esliger, D. W.,Gill, J. M., Kazi, A.,…Yates, T. (2015). Associations ofmutually exclusive categories of physical activity and sedentarytime with markers of cardiometabolic health in English adults:A cross-sectional analysis of the Health Survey for England.BMC Public Health, 16, 25. doi:10.1186/s12889-016-2694-9
Bankoski, A., Harris, T. B., McClain, J. J., Brychta, R. J.,Caserotti, P., Chen, K. Y.,…Koster, A. (2011). Sedentaryactivity associated with metabolic syndrome independent ofphysical activity. Diabetes Care, 34(2), 497–503. doi:10.2337/dc10-0987
Barone Gibbs, B., Brach, J. S., Byard, T., Creasy, S., Davis, K. K.,McCoy, S.,… Jakicic, J. M. (2016). Reducing sedentary behav-ior versus increasing moderate-to-vigorous intensity physicalactivity in older adults: A 12-week randomized, clinical trial.Journal of Aging Health, doi:10.1177/0898264316635564
Bastone Ade, C., Ferriolli, E., Teixeira, C. P., Dias, J. M., & Dias,R. C. (2015). Aerobic fitness and habitual physical activity infrail and nonfrail community-dwelling elderly. Journal ofPhysical Activity and Health, 12(9), 1304–1311. doi:10.1123/jpah.2014-0290
Bembom, O., van der Laan, M., Haight, T., & Tager, I. (2009).Leisure-time physical activity and all-cause mortality in anelderly cohort. Epidemiology, 20(3), 424–430. doi:10.1097/EDE.0b013e31819e3f28
Blodgett, J., Theou, O., Kirkland, S., Andreou, P., & Rockwood, K.(2015). The association between sedentary behaviour, moderate-vigorous physical activity and frailty in NHANES cohorts.Maturitas, 80(2), 187–191. doi:10.1016/j.maturitas.2014.11.010
Role of objectively measured sedentary behaviour 11
Bonnefoy, M., Normand, S., Pachiaudi, C., Lacour, J. R., Laville,M., & Kostka, T. (2001). Simultaneous validation of ten phys-ical activity questionnaires in older men: A doubly labeled waterstudy. Journal of the American Geriatrics Society, 49(1), 28–35.
Chang, S. F., & Lin, P. L. (2015). Frail phenotype and mortalityprediction: A systematic review and meta-analysis of prospec-tive cohort studies. International Journal of Nursing Studies, 52(8), 1362–1374. doi:10.1016/j.ijnurstu.2015.04.005
Chastin, S. F., Ferriolli, E., Stephens, N. A., Fearon, K. C., &Greig, C. (2012). Relationship between sedentary behaviour,physical activity, muscle quality and body composition inhealthy older adults. Age and Ageing, 41(1), 111–114. doi:10.1093/ageing/afr075
Choi, L., Liu, Z., Matthews, C. E., & Buchowski, M. S. (2011).Validation of accelerometer wear and nonwear time classifi-cation algorithm. Medicine & Science in Sports & Exercise, 43(2), 357–364. doi:10.1249/MSS.0b013e3181ed61a3
Cooper, A. J., Simmons, R. K., Kuh, D., Brage, S., Cooper, R., &López Lluch, G. (2015). Physical activity, sedentary time andphysical capability in early old age: British birth cohort study.PLoS One, 10(5), e0126465. doi:10.1371/journal.pone.0126465
DA Silva Coqueiro, R., DE Queiroz, B., Oliveira, D. S., DASMerces, M., Carneiro, J. A., Pereira, R., & Fernandes, M. H.(2016). Cross-sectional relationships between sedentary behav-ior and frailty in older adults. Journal of Sports Medicine andPhysical Fitness, 57(6), 825–830. doi: 10.23736/s0022- 4707.16.06289-7
Davis, M. G., Fox, K. R., Hillsdon, M., Sharp, D. J., Coulson, J.C., & Thompson, J. L. (2011). Objectively measured physicalactivity in a diverse sample of older urban UK adults.Medicine & Science in Sports & Exercise, 43(4), 647–654.doi:10.1249/MSS.0b013e3181f36196
Davis, M. G., Fox, K. R., Stathi, A., Trayers, T., Thompson, J. L.,& Cooper, A. R. (2014). Objectively measured sedentary timeand its association with physical function in older adults. Journalof Aging and Physical Activity, 22(4), 474–481. doi:10.1123/japa.2013-0042
de Rezende, L. F., Rey-Lopez, J. P., Matsudo, V. K., & do CarmoLuiz, O. (2014). Sedentary behavior and health outcomesamong older adults: A systematic review. BMC Public Health,14, S2. doi:10.1186/1471-2458-14-333
Dossegger, A., Ruch, N., Jimmy, G., Braun-Fahrlander, C.,Mader, U., Hanggi, J.,…Bringolf-Isler, B. (2014). Reactivityto accelerometer measurement of children and adolescents.Medicine & Science in Sports & Exercise, 46(6), 1140–1146.doi:10.1249/mss.0000000000000215
Dunlop, D. D., Song, J., Arnston, E. K., Semanik, P. A., Lee, J.,Chang, R. W., & Hootman, J. M. (2015). Sedentary time inUS older adults associated with disability in activities of dailyliving independent of physical activity. Journal of PhysicalActivity and Health, 12(1), 93–101. doi:10.1123/jpah.2013-0311
Dunstan, D. W., Barr, E. L., Healy, G. N., Salmon, J., Shaw, J. E.,Balkau, B.,…Owen, N. (2010). Television viewing time andmortality: The Australian diabetes, obesity and lifestyle study(AusDiab). Circulation, 121(3), 384–391. doi:10.1161/circulationaha.109.894824
Ekelund, U., Steene-Johannessen, J., Brown, W. J., Fagerland, M.W., Owen, N., Powell, K. E.,…Lee, I. M. (2016). Does phys-ical activity attenuate, or even eliminate, the detrimental associ-ation of sitting time with mortality? A harmonised meta-analysisof data from more than 1 million men and women. The Lancet,388(10051), 1302–1310. doi:10.1016/s0140-6736(16)30370-1
Ensrud, K. E., Blackwell, T. L., Cauley, J. A., Dam, T. T.,Cawthon, P. M., Schousboe, J. T.,…Mackey, D. C. (2014).Objective measures of activity level and mortality in older
men. Journal of the American Geriatrics Society, 62(11), 2079–2087. doi:10.1111/jgs.13101
Fleig, L., McAllister, M. M., Brasher, P., Cook, W. L., Guy, P.,Puyat, J. H.,…Ashe, M. C. (2016). Sedentary behavior andphysical activity patterns in older adults after Hip fracture: Acall to action. Journal of Aging and Physical Activity, 24(1), 79–84. doi:10.1123/japa.2015-0013
Fox, K. R., Ku, P. W., Hillsdon, M., Davis, M. G., Simmonds, B.A., Thompson, J. L.,…Coulson, J. C. (2015). Objectivelyassessed physical activity and lower limb function and prospec-tive associations with mortality and newly diagnosed disease inUK older adults: An OPAL four-year follow-up study. Ageand Ageing, 44(2), 261–268. doi:10.1093/ageing/afu168
Fried, L. P., Tangen, C. M., Walston, J., Newman, A. B., Hirsch,C., Gottdiener, J.,…McBurnie, M. A. (2001). Frailty in olderadults: Evidence for a phenotype. The Journals of GerontologySeries A: Biological Sciences and Medical Sciences, 56(3), M146–M156.
Gennuso, K. P., Thraen-Borowski, K. M., Gangnon, R. E., &Colbert, L. H. (2016). Patterns of sedentary behavior and phys-ical function in older adults. Aging Clinical and ExperimentalResearch, 28(5), 943–950. doi:10.1007/s40520-015-0386-4
Gianoudis, J., Bailey, C. A., & Daly, R. M. (2015). Associationsbetween sedentary behaviour and body composition, musclefunction and sarcopenia in community-dwelling older adults.Osteoporosis International, 26(2), 571–579. doi:10.1007/s00198-014-2895-y
Guralnik, J. M., Ferrucci, L., Simonsick, E. M., Salive, M. E., &Wallace, R. B. (1995). Lower-extremity function in personsover the age of 70 years as a predictor of subsequent disability.New England Journal of Medicine, 332(9), 556–562. doi:10.1056/nejm199503023320902
Hallal, P. C., Andersen, L. B., Bull, F. C., Guthold, R., Haskell,W., & Ekelund, U. (2012). Global physical activity levels:Surveillance progress, pitfalls, and prospects. The Lancet, 380(9838), 247–257. doi:10.1016/s0140-6736(12)60646-1
Hart, T. L., Swartz, A. M., Cashin, S. E., & Strath, S. J. (2011).How many days of monitoring predict physical activity andsedentary behaviour in older adults? International Journal ofBehavioral Nutrition and Physical Activity, 8, 62. doi:10.1186/1479-5868-8-62
Healy, G. N., Dunstan, D. W., Salmon, J., Cerin, E., Shaw, J. E.,Zimmet, P. Z., & Owen, N. (2008). Breaks in sedentary time:Beneficial associations with metabolic risk. Diabetes Care, 31(4),661–666. doi:10.2337/dc07-2046
Healy, G. N.,Wijndaele, K., Dunstan, D.W., Shaw, J. E., Salmon,J., Zimmet, P. Z., & Owen, N. (2008). Objectively measuredsedentary time, physical activity, and metabolic risk: TheAustralian Diabetes, Obesity and Lifestyle Study (AusDiab).Diabetes Care, 31(2), 369–371. doi:10.2337/dc07-1795
Hutton, B., Salanti, G., Caldwell, D. M., Chaimani, A., Schmid,C. H., Cameron, C.,…Moher, D. (2015). The PRISMAextension statement for reporting of systematic reviews incor-porating network meta-analyses of health care interventions:Checklist and explanations. Annals of Internal Medicine, 162(11), 777–784. doi:10.7326/m14-2385
Ikezoe, T., Asakawa, Y., Shima, H., Kishibuchi, K., & Ichihashi,N. (2013). Daytime physical activity patterns and physicalfitness in institutionalized elderly women: An exploratorystudy. Archives of Gerontology and Geriatrics, 57(2), 221–225.doi:10.1016/j.archger.2013.04.004
Jansen, F. M., Prins, R. G., Etman, A., van der Ploeg, H. P., deVries, S. I., van Lenthe, F. J.,…Dorner, T. E. (2015).Physical activity in non-frail and frail older adults. PLoS One,10(4), e0123168. doi:10.1371/journal.pone.0123168
Judice, P. B., Silva, A. M., Santos, D. A., Baptista, F., & Sardinha,L. B. (2015). Associations of breaks in sedentary time with
12 A. Mañas et al.
abdominal obesity in Portuguese older adults. Age (Dordr), 37(2), 23. https://www.ncbi.nlm.nih.gov/pubmed/25844429https://link.springer.com/article/10.1007/s11357-015-9760-6
Katzmarzyk, P. T., Church, T. S., Craig, C. L., & Bouchard, C.(2009). Sitting time and mortality from all causes, cardiovascu-lar disease, and cancer. Medicine & Science in Sports & Exercise,41(5), 998–1005. doi:10.1249/MSS.0b013e3181930355
Klenk, J., Dallmeier, D., Denkinger, M. D., Rapp, K., Koenig,W.,Rothenbacher, D., & Macaluso, A. (2016). Objectivelymeasured walking duration and sedentary behaviour and four-year mortality in older people. PLoS One, 11(4), e0153779.doi:10.1371/journal.pone.0153779
Koster, A., Caserotti, P., Patel, K. V., Matthews, C. E., Berrigan,D., Van Domelen, D. R.,…Ruiz, J. R. (2012). Association ofsedentary time with mortality independent of moderate to vigor-ous physical activity. PLoS One, 7(6), e37696. doi:10.1371/journal.pone.0037696
Kremers, S. P., & Brug, J. (2008). Habit strength of physicalactivity and sedentary behavior among children and adoles-cents. Pediatric Exercise Science, 20(1), 5–17. Discussion 14–17.
Landi, F., Abbatecola, A. M., Provinciali, M., Corsonello, A.,Bustacchini, S., Manigrasso, L.,…Lattanzio, F. (2010).Moving against frailty: Does physical activity matter?Biogerontology, 11(5), 537–545. doi:10.1007/s10522-010-9296-1
Lang, I. A., Guralnik, J. M., &Melzer, D. (2007). Physical activityin middle-aged adults reduces risks of functional impairmentindependent of its effect on weight. Journal of the AmericanGeriatrics Society, 55(11), 1836–1841. doi:10.1111/j.1532-5415.2007.01426.x
Leon-Munoz, L. M., Martinez-Gomez, D., Balboa-Castillo, T.,Lopez-Garcia, E., Guallar-Castillon, P., & Rodriguez-Artalejo, F. (2013). Continued sedentariness, change insitting time, and mortality in older adults. Medicine and Sciencein Sports and Exercise, 45(8), 1501–1507. doi:10.1249/MSS.0b013e3182897e87
Lynch, B. M., Friedenreich, C. M., Winkler, E. A., Healy, G. N.,Vallance, J. K., Eakin, E. G., & Owen, N. (2011). Associationsof objectively assessed physical activity and sedentary time withbiomarkers of breast cancer risk in postmenopausal women:Findings from NHANES (2003-2006). Breast Cancer Researchand Treatment, 130(1), 183–194. doi:10.1007/s10549-011-1559-2
Manson, J. E., Greenland, P., LaCroix, A. Z., Stefanick, M. L.,Mouton, C. P., Oberman, A.,… Siscovick, D. S. (2002).Walking compared with vigorous exercise for the preventionof cardiovascular events in women. New England Journal ofMedicine, 347(10), 716–725. doi:10.1056/NEJMoa021067
Matthews, C. E., Chen, K. Y., Freedson, P. S., Buchowski, M. S.,Beech, B. M., Pate, R. R., & Troiano, R. P. (2008). Amount oftime spent in sedentary behaviors in the United States, 2003-2004. American Journal of Epidemiology, 167(7), 875–881.doi:10.1093/aje/kwm390
Migueles, J. H., Cadenas-Sanchez, C., Ekelund, U., DelisleNyström, C., Mora-Gonzalez, J., Löf, M.,…Ortega, F. B.(2017). Accelerometer data collection and processing criteriato assess physical activity and other outcomes: A systematicreview and practical considerations. Sports Medicine, 1–25.doi:10.1007/s40279-017-0716-0
Morris, J. N., Heady, J. A., Raffle, P. A., Roberts, C. G., & Parks, J.W. (1953). Coronary heart-disease and physical activity ofwork. The Lancet, 262(6796), 1111–1120; concl.
Pate, R. R., O’Neill, J. R., & Lobelo, F. (2008). The evolving defi-nition of “sedentary”. Exercise and Sport Sciences Reviews, 36(4),173–178. doi:10.1097/JES.0b013e3181877d1a
Pedisic, Z., & Bauman, A. (2015). Accelerometer-based measuresin physical activity surveillance: Current practices and issues.
British Journal of Sports Medicine, 49(4), 219–223. doi:10.1136/bjsports-2013-093407
Peterson, M. J., Giuliani, C., Morey, M. C., Pieper, C. F.,Evenson, K. R., Mercer, V.,… Simonsick, E. M. (2009).Physical activity as a preventative factor for frailty: The health,aging, and body composition study. The Journals ofGerontology Series A: Biological Sciences and Medical Sciences,64A(1), 61–68. doi:10.1093/gerona/gln001
Reid, N., Daly, R. M., Winkler, E. A., Gardiner, P. A., Eakin, E.G., Owen, N.,…Maetzler, W. (2016). Associations ofmonitor-assessed activity with performance-based physicalfunction. PLoS One, 11(4), e0153398. doi:10.1371/journal.pone.0153398
Rosenberg, D. E., Bellettiere, J., Gardiner, P. A., Villarreal, V. N.,Crist, K., & Kerr, J. (2016). Independent associations betweensedentary behaviors and mental, cognitive, physical, and func-tional health among older adults in retirement communities.The Journals of Gerontology Series A: Biological Sciences andMedical Sciences, 71(1), 78–83. doi:10.1093/gerona/glv103
Rosenberg, D. E., Gell, N. M., Jones, S. M., Renz, A., Kerr, J.,Gardiner, P. A., & Arterburn, D. (2015). The feasibility ofreducing sitting time in overweight and obese older adults.Health Education & Behavior, 42(5), 669–676. doi:10.1177/1090198115577378
Roubenoff, R. (2000). Sarcopenia: A major modifiable cause offrailty in the elderly. Journal of Nutrition, Health and Aging, 4(3), 140–142.
Santos, D. A., Silva, A.M., Baptista, F., Santos, R., Vale, S.,Mota,J., & Sardinha, L. B. (2012). Sedentary behavior and physicalactivity are independently related to functional fitness in olderadults. Experimental Gerontology, 47(12), 908–912. doi:10.1016/j.exger.2012.07.011
Sardinha, L. B., Santos, D. A., Silva, A. M., Baptista, F., & Owen,N. (2015). Breaking-up sedentary time is associated with phys-ical function in older adults. The Journals of Gerontology Series A:Biological Sciences and Medical Sciences, 70(1), 119–124. doi:10.1093/gerona/glu193
Scully, T. (2012). Demography: To the limit. Nature, 492(7427),S2–3. doi:10.1038/492S2a
Sedentary Behaviour Research Network, T. (2012). Letter to theeditor: Standardized use of the terms “sedentary” and “seden-tary behaviours”. Applied Physiology, Nutrition, and Metabolism,37(3), 540–542. doi:10.1139/h2012-024
Seguin, R., Lamonte, M., Tinker, L., Liu, J., Woods, N., Michael,Y. L.,…Lacroix, A. Z. (2012). Sedentary behavior and phys-ical function decline in older women: Findings from thewomen’s health initiative. Journal of Aging Research, 2012, 1–10. doi:10.1155/2012/271589
Song, J., Lindquist, L. A., Chang, R. W., Semanik, P. A., Ehrlich-Jones, L. S., Lee, J.,…Dunlop, D. D. (2015). Sedentary be-havior as a risk factor for physical frailty independent of moder-ate activity: Results from the osteoarthritis initiative. AmericanJournal of Public Health, 105(7), 1439–1445. doi:10.2105/ajph.2014.302540
Stamatakis, E., & Hamer, M. (2011). Sedentary behaviour:Redefining its meaning and links to chronic disease. BritishJournal of Hospital Medicine, 72(4), 192–195.
Tremblay, M. S., Kho, M. E., Tricco, A. C., & Duggan, M.(2010). Process description and evaluation of Canadian phys-ical activity guidelines development. International Journal ofBehavioral Nutrition and Physical Activity, 7, 42. doi:10.1186/1479-5868-7-42
Troiano, R. P. (2007). Large-scale applications of accelerometers:New frontiers and new questions.Medicine& Science in Sports &Exercise, 39(9), 1501. doi:10.1097/mss.0b013e318150d42e
Walston, J., Hadley, E. C., Ferrucci, L., Guralnik, J. M., Newman,A. B., Studenski, S. A.,…Fried, L. P. (2006). Research agenda
Role of objectively measured sedentary behaviour 13
for frailty in older adults: Toward a better understanding ofphysiology and etiology: Summary from the American geriatricssociety/national institute on aging research conference on frailtyin older adults. Journal of the American Geriatrics Society, 54(6),991–1001. doi:10.1111/j.1532-5415.2006.00745.x
Wilmot, E. G., Edwardson, C. L., Achana, F. A., Davies, M. J.,Gorely, T., Gray, L. J.,…Biddle, S. J. (2012). Sedentary timein adults and the association with diabetes, cardiovascular
disease and death: Systematic review and meta-analysis.Diabetologia, 55(11), 2895–2905. doi:10.1007/s00125-012-2677-z
Wirth, K., Klenk, J., Brefka, S., Dallmeier, D., Faehling, K.,Roque, I. F. M.,… Stubbs, B. (2017). Biomarkers associatedwith sedentary behaviour in older adults: A systematic review.Ageing Research Reviews, 35, 87–111. doi:10.1016/j.arr.2016.12.002
14 A. Mañas et al.
RESULTS
173
5.2. STUDY 2
“Frailty is associated with objectively
assessed sedentary behaviour
patterns in older adults: Evidence
from the Toledo Study for Healthy
Aging (TSHA)”
RESULTS
174
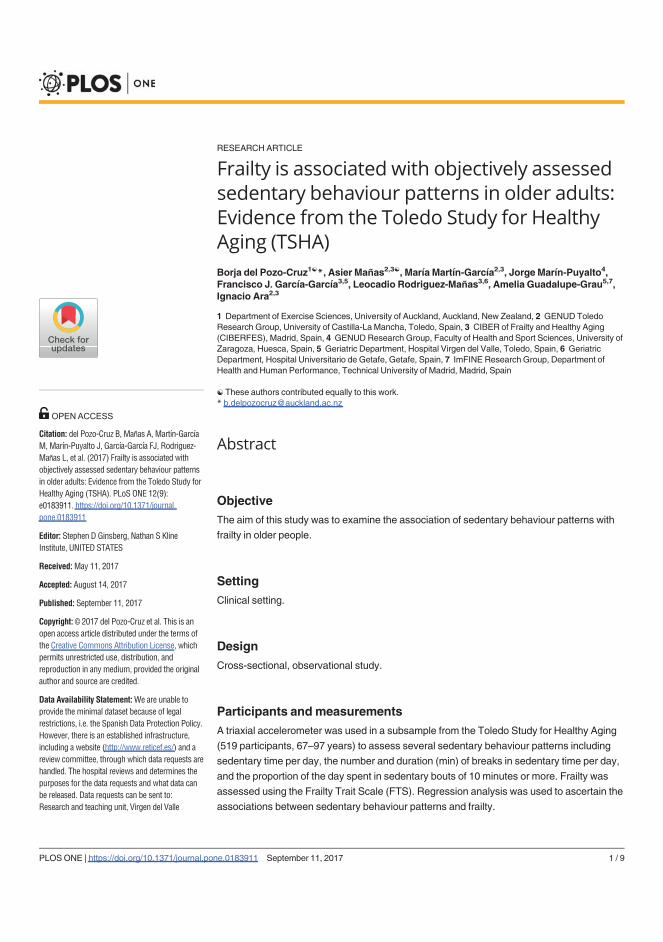
RESEARCH ARTICLE
Frailty is associated with objectively assessedsedentary behaviour patterns in older adults:Evidence from the Toledo Study for HealthyAging (TSHA)
Borja del Pozo-Cruz1 , Asier Ma as2,3 , Marı́a Martı́n-Garcı́a2,3, Jorge Marı́n-Puyalto4,Francisco J. Garcı́a-Garcı́a3,5, Leocadio Rodriguez-Ma as3,6, Amelia Guadalupe-Grau5,7,Ignacio Ara2,3
1 Department of Exercise Sciences, University of Auckland, Auckland, New Zealand, 2 GENUD ToledoResearch Group, University of Castilla-La Mancha, Toledo, Spain, 3 CIBER of Frailty and Healthy Aging(CIBERFES), Madrid, Spain, 4 GENUDResearch Group, Faculty of Health and Sport Sciences, University ofZaragoza, Huesca, Spain, 5 Geriatric Department, Hospital Virgen del Valle, Toledo, Spain, 6 GeriatricDepartment, Hospital Universitario de Getafe, Getafe, Spain, 7 ImFINE Research Group, Department ofHealth and Human Performance, Technical University of Madrid, Madrid, Spain
These authors contributed equally to this work.* [email protected]
Abstract
ObjectiveThe aim of this study was to examine the association of sedentary behaviour patterns with
frailty in older people.
SettingClinical setting.
DesignCross-sectional, observational study.
Participants andmeasurementsA triaxial accelerometer was used in a subsample from the Toledo Study for Healthy Aging
(519 participants, 67–97 years) to assess several sedentary behaviour patterns including
sedentary time per day, the number and duration (min) of breaks in sedentary time per day,
and the proportion of the day spent in sedentary bouts of 10 minutes or more. Frailty was
assessed using the Frailty Trait Scale (FTS). Regression analysis was used to ascertain the
associations between sedentary behaviour patterns and frailty.
PLOSONE | https://doi.org/10.1371/journal.pone.0183911 September 11, 2017 1 / 9
a1111111111a1111111111a1111111111a1111111111a1111111111
Citation: del Pozo-Cruz B, Ma as A, Martı́n-Garcı́aM, Marı́n-Puyalto J, Garcı́a-Garcı́a FJ, Rodriguez-Ma as L, et al. (2017) Frailty is associated withobjectively assessed sedentary behaviour patternsin older adults: Evidence from the Toledo Study forHealthy Aging (TSHA). PLoS ONE 12(9):e0183911. https://doi.org/10.1371/journal.pone.0183911
Editor: Stephen D Ginsberg, Nathan S KlineInstitute, UNITED STATES
Received:May 11, 2017
Accepted: August 14, 2017
Published: September 11, 2017
Copyright: 2017 del Pozo-Cruz et al. This is anopen access article distributed under the terms ofthe Creative Commons Attribution License, whichpermits unrestricted use, distribution, andreproduction in any medium, provided the originalauthor and source are credited.
Data Availability Statement:We are unable toprovide the minimal dataset because of legalrestrictions, i.e. the Spanish Data Protection Policy.However, there is an established infrastructure,including a website (http://www.reticef.es/) and areview committee, through which data requests arehandled. The hospital reviews and determines thepurposes for the data requests and what data canbe released. Data requests can be sent to:Research and teaching unit, Virgen del Valle
ResultsSedentary time per day and the proportion of the day spent in sedentary bouts of 10 minutes
or more, were positively associated with frailty in the study sample. Conversely, the time
spent in breaks in sedentary time was negatively associated with frailty.
ConclusionIn summary, breaking up sedentary time and time spent in sedentary behaviour are associ-
ated with frailty in older people.
IntroductionFrailty in older adults is considered a biological condition where poor resolution of several
physiological systems to maintain homoeostasis occurs after a low-power stressor event [1, 2].
Frailty is associated with alterations in the musculoskeletal, vascular and central nervous sys-
tems [3]. Prevalence of frailty in Spain is 8.4%, with an additional prevalence of pre-frailty of
41.8%, therefore approximately 50% of people over 65 years are categorized as frail or pre-frail
[4]. Socio-economic costs associated with frailty are also of relevance [5]. Frailty has been asso-
ciated with an increase in hospitalization rates, falls, incident disability, decreased mobility,
and higher mortality rates [2, 6, 7]. In the last decade, frailty has been recognized as one of the
most promising indicators to help prevent disability [8]. Finding mechanisms to prevent frailty
are therefore of interest.
Sedentary behaviours, including those characterized by low energy expenditure while in a
sitting or reclining posture, have been shown to contribute to adverse outcomes. Even in the
absence of other risk factors, sedentary behaviour has recently emerged as an independent car-
diovascular risk factor [9–11] and is related to all causes of mortality in a dose-response man-
ner [12], possibly because sedentary behaviour influences homeostasis and function of many if
not all body systems [13]. Lack of exercise and a sedentary lifestyle is one of the most signifi-
cant public health problems of the 21st century [14], the effect that a sedentary lifestyle exerts
on frailty is poorly assessed [1].
Da Silva Coqueiro et al. [15] recently reported an association between sedentary behaviour
as assessed by a questionnaire and frailty status among adults over 60 years. Similarly, objec-
tively assessed sedentary behaviour was associated with frailty among adults over 50 years old
in the National Health and Nutrition Examination Survey [16] independent of moderate-to-
vigorous physical activity (MVPA). Sedentary behaviour patterns (i.e. how sedentary behav-
iour is accumulated) can make an impact on the wider health of individuals [17]. For example,
an increased number of bouts of sedentary behaviour per day is associated with worse health
outcomes including reduced cardiovascular health or physical function [17]. Inserting bouts of
activity into otherwise sedentary time (ST) is associated with better physical function in older
adults [18]. Breaking up sedentary time has also been positively associated with a lower risk of
disability in the activities of daily life and inversely associated with impairments and physical
dependence in older age, independent of MVPA [19]. Hence, reducing or breaking up long
sedentary periods seems to be a feasible and promising approach expected to attenuate the
consequences of frailty among older adults. Nonetheless, there is a lack of data regarding the
relationship between sedentary behaviour patterns and frailty in this population group [1].
Sedentary behaviour and frailty in the elderly
PLOSONE | https://doi.org/10.1371/journal.pone.0183911 September 11, 2017 2 / 9
Hospital Ctra. Cobisa S/N45071 Toledo - [email protected].
Funding: This work was supported by grantsRD12/0043/0026, RD12/0040/0020, RD12/0040/0001 CB16/10/00456, CB16/10/00477, CB16/10/00464, PI15/01305 and PI10/01532, from theInstituto de Salud Carlos III (Ministerio deEconomia, Industria y Competitividad), Spain, byGrant FP7-305483-2 from the FP7-Health-2012Innovation program, European Union andBiomedical Research Networking Center on Frailtyand Healthy Aging (CIBERFES) and FEDER fundsfrom the European Union.
Competing interests: The authors have declaredthat no competing interests exist.
Therefore, the aim of this study was to examine the associations of various sedentary behaviour
patterns with frailty in older people.
Methods
Research design and participantsData were taken from the Toledo Study for Healthy Aging (TSHA), whose complete method-
ology has been reported elsewhere [4, 20]. Briefly, the TSHA is a population prospective cohort
study aimed at studying the determinants and consequences of frailty in institutionalised and
community-dwelling individuals older than 65 years living in the province of Toledo, Spain. A
subsample of 626 volunteers was assessed on sedentary behaviour patterns. From these, 107
were excluded due to incomplete or invalid accelerometer data. A total of 519 participants
were finally included. All the subjects gave their informed consent in written and the study
was performed in accordance with the Helsinki Declaration of 1975, as last modified in 2000,
regarding the conduct of clinical research, and was approved by the Ethical Committee of the
Toledo Hospital (CEIC).
OutcomemeasuresFrailty. The Frailty Trait Scale (FTS) was used to assess frailty [21]. Briefly, the FTS
includes 7 dimensions (i.e. energy balance and nutrition, activity, nervous system, vascular sys-
tem, weakness, endurance, and slowness) operationalised through 12 items. Each item repre-
sents a biological trait. All items but one (“chair test”, which scored 0 [worst status] to -5 [best
status]) are scored 0 (best status) to 4 (worst status). The total score was calculated by adding
all the scores in each item divided by total score possible for each individual, multiplied by
100. The total score ranged from 0 (best score) to 100 (worst score).
Sedentary behaviour patterns. Sedentary behaviour patterns were assessed by accelero-
metry (ActiGraph, ActiTrainer 3X, Fort Walton Beach, FL). Accelerometer output is an activ-
ity count, which is the weighted sum of the number of accelerations measured over a time
period or epoch (a 1 minute epoch was used in this study). The intensity of activity is assessed
from the weighted sums, which are proportional to the magnitude of measured acceleration.
Participants were asked to wear the accelerometer on their left hip for 7 consecutive days.
Sleeping periods were removed from the analyses and considered non-wear time. Moreover,
periods of at least 60 consecutive minutes of zero counts were also considered as non-wear
time and removed as well [22]. Only data from participants with 4 or more valid days of accel-
erometer data (i.e. a day with 480 minutes or more of wear time) were included in the analyses
(n = 519).
Each minute with less than 100 counts was considered sedentary time [23, 24]. Time per
day (min) spent in sedentary time was then registered. A break in sedentary time (BST) was
defined as at least 1 min where the accelerometer registers�100 counts following a sedentary
period. The number and duration (min) per day of BST were recorded. A 10-min bout of sed-
entary time (ST-10) was defined as a period of at least 10 consecutive minutes where the accel-
erometer registered<100 counts/min. The number, duration (min) and proportion over total
10-min bouts per day of ST-10 were recorded. All outcomes were weighted by daily averaged
wear time on valid days (i.e. outcome summed over all wear time divided by the number of
successfully monitored days for each participant). The different sedentary pattern variables
were standardized (Z-score = [observed—sample mean]/sample SD). In an effort to account
for the combined effect of both duration and number of the different patterns, two composite
Z-scores representing patterns of ST [ST-COMP = Z-score ST-10 (number/day) + Z-score ST-
Sedentary behaviour and frailty in the elderly
PLOSONE | https://doi.org/10.1371/journal.pone.0183911 September 11, 2017 3 / 9
10 (minutes/day)] and patterns of BST [BST-COMP = Z-score BST (number/day) + Z-score
BST (minutes/day)] were then computed.
Adherence to WHO physical activity guidelines. In order to analyse the adherence of
physical activity (PA) in the study with recommendations for public health proposed by the
World Health Organization, the accumulation of at least 150 min/week of moderate physical
activity or 75 min/week of vigorous physical activity or as an equivalent combination of mod-
erate and vigorous physical activity was assessed with an accelerometer [25].
Anthropometrics and confounding variables. Height was measured to the nearest milli-
metre using a portable stadiometer (Medizintechnik seit 1890, KaWe, Germany), and weight
was measured with a SECA precision scale (SECA 884 floor scale, Germany). Individuals
removed their shoes, socks and heavy clothes prior to weighing. Body mass index (BMI) was
calculated as weight (kg) divided by height squared (m2). A number of confounders were
assessed. Mental status was assessed using the Minimental Scale questionnaire [26]. Comor-
bidity history was assessed using the Charlson Comorbidity index [27]. Physical performance
was assessed by means of the Short Physical Performance Battery [28]. MVPA was assessed by
accelerometry (i.e. each minute of 1952 or more counts was considered MVPA) [23]. Current
medication (i.e. number of drugs), age, and gender were also recorded.
Statistical analysisData were analysed using PASW Statistic, version 23.0.0, with statistical significance set at
p<0.05 (two-tailed). Descriptive statistics (mean ± SD) were calculated for all outcome mea-
surements of the study.
Multiple linear regressions were used to examine the associations between frailty and the
different sedentary behaviour patterns assessed. A model adjusted by age, gender, comorbidity
status, mental health, and polypharmacy status was fitted for each of the sedentary behaviour
pattern outcomes.
Participants were clustered into 2 different groups according to the adherence to WHO PA
guidelines status (i.e. meeting or not the guidelines) and were compared using t-test for inde-
pendent measurements. Participants within each of the former groups were re-allocated to
either less BST group (i.e. group falling below the 50th percentile of BST) or more BST group
(i.e. group falling over the 50th percentile of BST) and then compared using t-test for indepen-
dent measurements.
ResultsCharacteristics of the participants are shown in Table 1. A total of 519 older adults aged 67–97
including 234 males and 285 females, were included in the study.
Table 2 shows the results of different multiple regressions analyses testing the associations
between various sedentary behaviour patterns and frailty in the TSHA study. After adjusting
for several covariates (i.e. age, gender, comorbidity status, mental health, and polypharmacy
status) ST ( , 95CI% = 0.015, 0.004 to 0.027; p = 0.03), ST-10 (proportion) ( , 95CI% = 0.079,
0.234 to 0.195; p = 0.04), BST (minutes/day) ( , 95CI% = -0.031, -0.048 to -0.014; p = 0.03),
and BST-COMP ( , 95CI% = -0.805, -1.339to -0.210; p = 0.01), were significantly associated
with frailty in the study sample. However, ST-10 (number/day and minutes/day), BST (num-
ber/day), and ST-COMP were not significantly associated with frailty.
Participants who met the WHO PA guidelines scored statistically significant less in the
Frailty Trait Scale than those who did not meet the PA guidelines (Fig 1). In both groups,
those who fell into the bottom half of interruptions of sedentary time had a statistically signifi-
cant higher frailty level than those depicting more BST (p<0.05) (Fig 1).
Sedentary behaviour and frailty in the elderly
PLOSONE | https://doi.org/10.1371/journal.pone.0183911 September 11, 2017 4 / 9
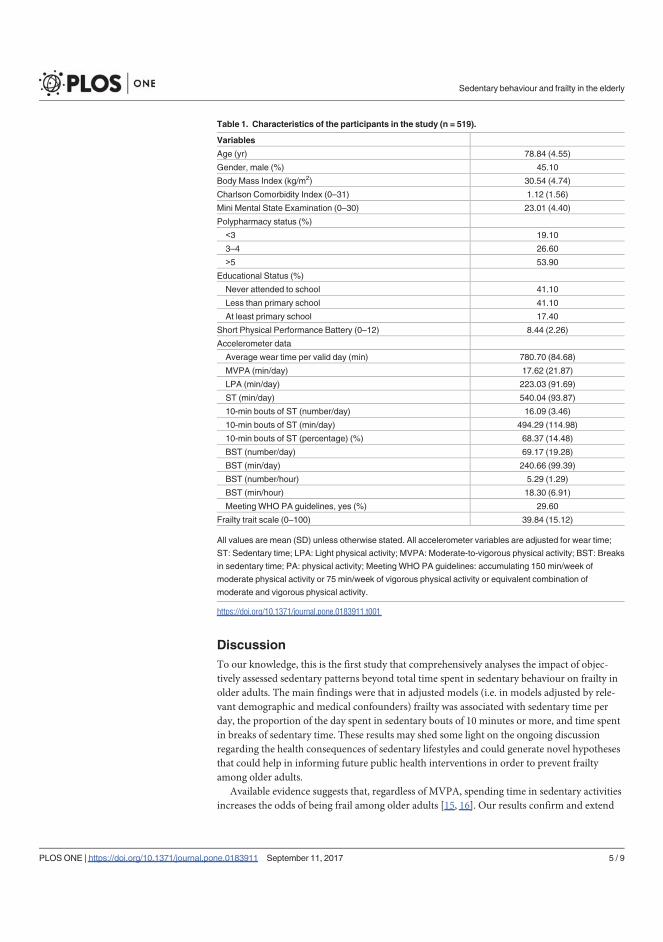
DiscussionTo our knowledge, this is the first study that comprehensively analyses the impact of objec-
tively assessed sedentary patterns beyond total time spent in sedentary behaviour on frailty in
older adults. The main findings were that in adjusted models (i.e. in models adjusted by rele-
vant demographic and medical confounders) frailty was associated with sedentary time per
day, the proportion of the day spent in sedentary bouts of 10 minutes or more, and time spent
in breaks of sedentary time. These results may shed some light on the ongoing discussion
regarding the health consequences of sedentary lifestyles and could generate novel hypotheses
that could help in informing future public health interventions in order to prevent frailty
among older adults.
Available evidence suggests that, regardless of MVPA, spending time in sedentary activities
increases the odds of being frail among older adults [15, 16]. Our results confirm and extend
Table 1. Characteristics of the participants in the study (n = 519).
Variables
Age (yr) 78.84 (4.55)
Gender, male (%) 45.10
Body Mass Index (kg/m2) 30.54 (4.74)
Charlson Comorbidity Index (0–31) 1.12 (1.56)
Mini Mental State Examination (0–30) 23.01 (4.40)
Polypharmacy status (%)
3 19.10
3–4 26.60
5 53.90
Educational Status (%)
Never attended to school 41.10
Less than primary school 41.10
At least primary school 17.40
Short Physical Performance Battery (0–12) 8.44 (2.26)
Accelerometer data
Average wear time per valid day (min) 780.70 (84.68)
MVPA (min/day) 17.62 (21.87)
LPA (min/day) 223.03 (91.69)
ST (min/day) 540.04 (93.87)
10-min bouts of ST (number/day) 16.09 (3.46)
10-min bouts of ST (min/day) 494.29 (114.98)
10-min bouts of ST (percentage) (%) 68.37 (14.48)
BST (number/day) 69.17 (19.28)
BST (min/day) 240.66 (99.39)
BST (number/hour) 5.29 (1.29)
BST (min/hour) 18.30 (6.91)
Meeting WHO PA guidelines, yes (%) 29.60
Frailty trait scale (0–100) 39.84 (15.12)
All values are mean (SD) unless otherwise stated. All accelerometer variables are adjusted for wear time;
ST: Sedentary time; LPA: Light physical activity; MVPA: Moderate-to-vigorous physical activity; BST: Breaks
in sedentary time; PA: physical activity; MeetingWHO PA guidelines: accumulating 150 min/week of
moderate physical activity or 75 min/week of vigorous physical activity or equivalent combination of
moderate and vigorous physical activity.
https://doi.org/10.1371/journal.pone.0183911.t001
Sedentary behaviour and frailty in the elderly
PLOSONE | https://doi.org/10.1371/journal.pone.0183911 September 11, 2017 5 / 9
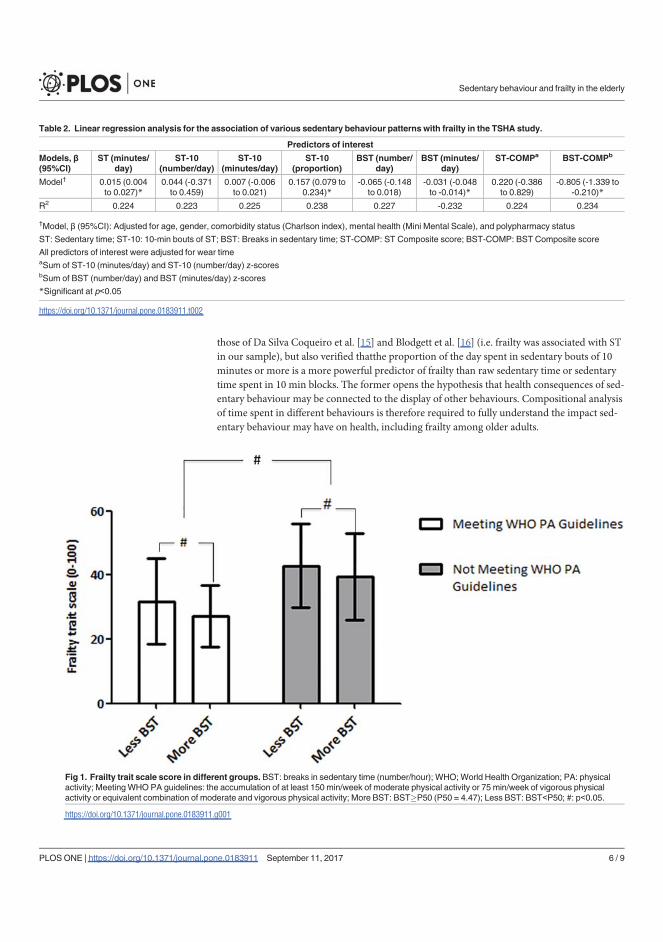
those of Da Silva Coqueiro et al. [15] and Blodgett et al. [16] (i.e. frailty was associated with ST
in our sample), but also verified thatthe proportion of the day spent in sedentary bouts of 10
minutes or more is a more powerful predictor of frailty than raw sedentary time or sedentary
time spent in 10 min blocks. The former opens the hypothesis that health consequences of sed-
entary behaviour may be connected to the display of other behaviours. Compositional analysis
of time spent in different behaviours is therefore required to fully understand the impact sed-
entary behaviour may have on health, including frailty among older adults.
Table 2. Linear regression analysis for the association of various sedentary behaviour patterns with frailty in the TSHA study.
Predictors of interest
Models,(95%CI)
ST (minutes/day)
ST-10(number/day)
ST-10(minutes/day)
ST-10(proportion)
BST (number/day)
BST (minutes/day)
ST-COMPa BST-COMPb
Model† 0.015 (0.004to 0.027)*
0.044 (-0.371to 0.459)
0.007 (-0.006to 0.021)
0.157 (0.079 to0.234)*
-0.065 (-0.148to 0.018)
-0.031 (-0.048to -0.014)*
0.220 (-0.386to 0.829)
-0.805 (-1.339 to-0.210)*
R2 0.224 0.223 0.225 0.238 0.227 -0.232 0.224 0.234
†Model, (95%CI): Adjusted for age, gender, comorbidity status (Charlson index), mental health (Mini Mental Scale), and polypharmacy status
ST: Sedentary time; ST-10: 10-min bouts of ST; BST: Breaks in sedentary time; ST-COMP: ST Composite score; BST-COMP: BST Composite score
All predictors of interest were adjusted for wear timeaSum of ST-10 (minutes/day) and ST-10 (number/day) z-scoresbSum of BST (number/day) and BST (minutes/day) z-scores
*Significant at p 0.05
https://doi.org/10.1371/journal.pone.0183911.t002
Fig 1. Frailty trait scale score in different groups. BST: breaks in sedentary time (number/hour); WHO;World Health Organization; PA: physicalactivity; MeetingWHOPA guidelines: the accumulation of at least 150 min/week of moderate physical activity or 75 min/week of vigorous physicalactivity or equivalent combination of moderate and vigorous physical activity; More BST: BST�P50 (P50 = 4.47); Less BST: BST P50; #: p 0.05.
https://doi.org/10.1371/journal.pone.0183911.g001
Sedentary behaviour and frailty in the elderly
PLOSONE | https://doi.org/10.1371/journal.pone.0183911 September 11, 2017 6 / 9
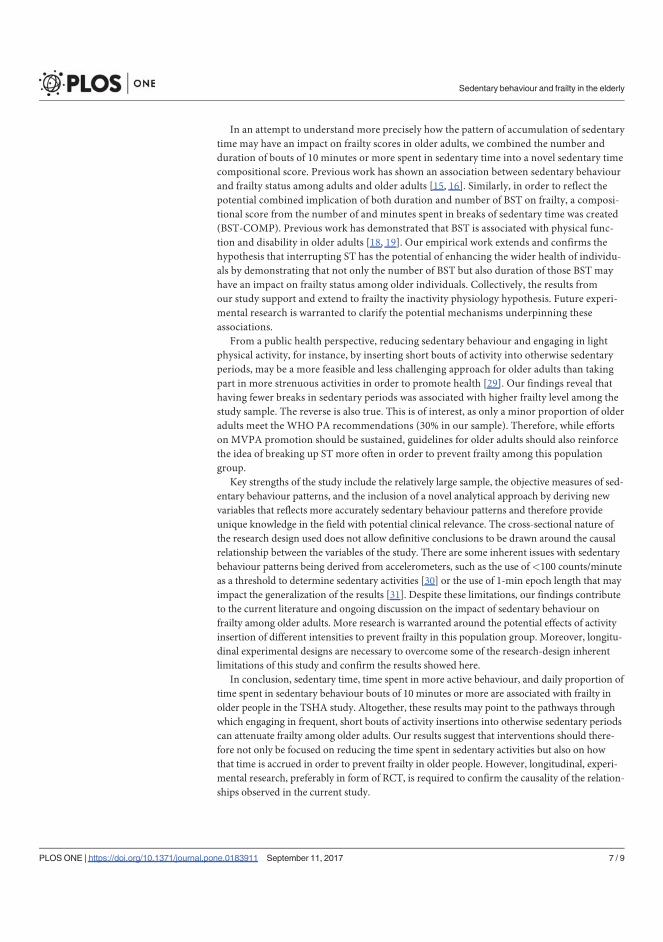
In an attempt to understand more precisely how the pattern of accumulation of sedentary
time may have an impact on frailty scores in older adults, we combined the number and
duration of bouts of 10 minutes or more spent in sedentary time into a novel sedentary time
compositional score. Previous work has shown an association between sedentary behaviour
and frailty status among adults and older adults [15, 16]. Similarly, in order to reflect the
potential combined implication of both duration and number of BST on frailty, a composi-
tional score from the number of and minutes spent in breaks of sedentary time was created
(BST-COMP). Previous work has demonstrated that BST is associated with physical func-
tion and disability in older adults [18, 19]. Our empirical work extends and confirms the
hypothesis that interrupting ST has the potential of enhancing the wider health of individu-
als by demonstrating that not only the number of BST but also duration of those BST may
have an impact on frailty status among older individuals. Collectively, the results from
our study support and extend to frailty the inactivity physiology hypothesis. Future experi-
mental research is warranted to clarify the potential mechanisms underpinning these
associations.
From a public health perspective, reducing sedentary behaviour and engaging in light
physical activity, for instance, by inserting short bouts of activity into otherwise sedentary
periods, may be a more feasible and less challenging approach for older adults than taking
part in more strenuous activities in order to promote health [29]. Our findings reveal that
having fewer breaks in sedentary periods was associated with higher frailty level among the
study sample. The reverse is also true. This is of interest, as only a minor proportion of older
adults meet the WHO PA recommendations (30% in our sample). Therefore, while efforts
on MVPA promotion should be sustained, guidelines for older adults should also reinforce
the idea of breaking up ST more often in order to prevent frailty among this population
group.
Key strengths of the study include the relatively large sample, the objective measures of sed-
entary behaviour patterns, and the inclusion of a novel analytical approach by deriving new
variables that reflects more accurately sedentary behaviour patterns and therefore provide
unique knowledge in the field with potential clinical relevance. The cross-sectional nature of
the research design used does not allow definitive conclusions to be drawn around the causal
relationship between the variables of the study. There are some inherent issues with sedentary
behaviour patterns being derived from accelerometers, such as the use of<100 counts/minute
as a threshold to determine sedentary activities [30] or the use of 1-min epoch length that may
impact the generalization of the results [31]. Despite these limitations, our findings contribute
to the current literature and ongoing discussion on the impact of sedentary behaviour on
frailty among older adults. More research is warranted around the potential effects of activity
insertion of different intensities to prevent frailty in this population group. Moreover, longitu-
dinal experimental designs are necessary to overcome some of the research-design inherent
limitations of this study and confirm the results showed here.
In conclusion, sedentary time, time spent in more active behaviour, and daily proportion of
time spent in sedentary behaviour bouts of 10 minutes or more are associated with frailty in
older people in the TSHA study. Altogether, these results may point to the pathways through
which engaging in frequent, short bouts of activity insertions into otherwise sedentary periods
can attenuate frailty among older adults. Our results suggest that interventions should there-
fore not only be focused on reducing the time spent in sedentary activities but also on how
that time is accrued in order to prevent frailty in older people. However, longitudinal, experi-
mental research, preferably in form of RCT, is required to confirm the causality of the relation-
ships observed in the current study.
Sedentary behaviour and frailty in the elderly
PLOSONE | https://doi.org/10.1371/journal.pone.0183911 September 11, 2017 7 / 9
Author ContributionsConceptualization: Borja del Pozo-Cruz, Asier Mañas, Ignacio Ara.
Formal analysis: Borja del Pozo-Cruz, Asier Mañas, Leocadio Rodriguez-Mañas, Ignacio Ara.
Funding acquisition: Francisco J. Garcı́a-Garcı́a, Leocadio Rodriguez-Mañas.
Methodology:Marı́a Martı́n-Garcı́a, Leocadio Rodriguez-Mañas.
Resources:Marı́a Martı́n-Garcı́a, Jorge Marı́n-Puyalto, Francisco J. Garcı́a-Garcı́a.
Software: Jorge Marı́n-Puyalto.
Supervision: Amelia Guadalupe-Grau, Ignacio Ara.
Writing – original draft: Borja del Pozo-Cruz, Jorge Marı́n-Puyalto, Francisco J. Garcı́a-
Garcı́a.
Writing – review & editing: Borja del Pozo-Cruz, Asier Mañas, Marı́a Martı́n-Garcı́a, Leoca-
dio Rodriguez-Mañas, Amelia Guadalupe-Grau, Ignacio Ara.
References1. Manas A, Del Pozo-Cruz B, Garcia-Garcia FJ, Guadalupe-Grau A, Ara I. Role of objectively measured
sedentary behaviour in physical performance, frailty and mortality among older adults: A short system-atic review. Eur J Sport Sci. 2017; 17(7):940–53. https://doi.org/10.1080/17461391.2017.1327983PMID: 28532299
2. Fried LP, Tangen CM,Walston J, Newman AB, Hirsch C, Gottdiener J, et al. Frailty in older adults: evi-dence for a phenotype. The journals of gerontology Series A, Biological sciences andmedical sciences.2001; 56(3):M146–56. PMID: 11253156
3. Walston J, Hadley EC, Ferrucci L, Guralnik JM, Newman AB, Studenski SA, et al. Research agenda forfrailty in older adults: toward a better understanding of physiology and etiology: summary from theAmerican Geriatrics Society/National Institute on Aging Research Conference on Frailty in Older Adults.Journal of the American Geriatrics Society. 2006; 54(6):991–1001. https://doi.org/10.1111/j.1532-5415.2006.00745.x PMID: 16776798
4. Garcia-Garcia FJ, Gutierrez Avila G, Alfaro-Acha A, Amor Andres MS, De Los Angeles De La TorreLanza M, Escribano Aparicio MV, et al. The prevalence of frailty syndrome in an older population fromSpain. The Toledo Study for Healthy Aging. The journal of nutrition, health & aging. 2011; 15(10):852–6.
5. Sirven N, Rapp T. The cost of frailty in France. The European journal of health economics: HEPAC:health economics in prevention and care. 2017; 18(2):243–53. https://doi.org/10.1007/s10198-016-0772-7 PMID: 26914932
6. Cawthon PM, Marshall LM, Michael Y, Dam TT, Ensrud KE, Barrett-Connor E, et al. Frailty in oldermen: prevalence, progression, and relationship with mortality. Journal of the American Geriatrics Soci-ety. 2007; 55(8):1216–23. https://doi.org/10.1111/j.1532-5415.2007.01259.x PMID: 17661960
7. Ensrud KE, Ewing SK, Cawthon PM, Fink HA, Taylor BC, Cauley JA, et al. A comparison of frailtyindexes for the prediction of falls, disability, fractures, and mortality in older men. Journal of the Ameri-can Geriatrics Society. 2009; 57(3):492–8. https://doi.org/10.1111/j.1532-5415.2009.02137.x PMID:19245414
8. Daniels R, van Rossum E, deWitte L, Kempen GI, van den Heuvel W. Interventions to prevent disabilityin frail community-dwelling elderly: a systematic review. BMC health services research. 2008; 8:278.https://doi.org/10.1186/1472-6963-8-278 PMID: 19115992
9. Ford ES, Caspersen CJ. Sedentary behaviour and cardiovascular disease: a review of prospectivestudies. International journal of epidemiology. 2012; 41(5):1338–53. https://doi.org/10.1093/ije/dys078PMID: 22634869
10. Stamatakis E, Hamer M. Sedentary behaviour: redefining its meaning and links to chronic disease. Br JHosp Med (Lond). 2011; 72(4):192–5.
11. Gomez-Cabello A, Pedrero-Chamizo R, Olivares PR, Hernandez-Perera R, Rodriguez-Marroyo JA,Mata E, et al. Sitting time increases the overweight and obesity risk independently of walking time inelderly people from Spain. Maturitas. 2012; 73(4):337–43. https://doi.org/10.1016/j.maturitas.2012.09.001 PMID: 23021800
Sedentary behaviour and frailty in the elderly
PLOSONE | https://doi.org/10.1371/journal.pone.0183911 September 11, 2017 8 / 9
12. Katzmarzyk PT, Church TS, Craig CL, Bouchard C. Sitting time and mortality from all causes, cardio-vascular disease, and cancer. Medicine and science in sports and exercise. 2009; 41(5):998–1005.https://doi.org/10.1249/MSS.0b013e3181930355 PMID: 19346988
13. Tremblay MS, Colley RC, Saunders TJ, Healy GN, Owen N. Physiological and health implications of asedentary lifestyle. Applied Physiology Nutrition and Metabolism-Physiologie Appliquee Nutrition EtMetabolisme. 2010; 35(6):725–40.
14. Blair SN, Sallis RE, Hutber A, Archer E. Exercise therapy—the public health message. ScandinavianJournal of Medicine & Science in Sports. 2012; 22(4):E24–E8.
15. DASCR, DEQ BM, Oliveira DS, DASMMC, Carneiro JA, Pereira R, et al. Cross-sectional relationshipsbetween sedentary behavior and frailty in older adults. The Journal of sports medicine and physical fit-ness. 2016.
16. Blodgett J, Theou O, Kirkland S, Andreou P, Rockwood K. The association between sedentary behav-iour, moderate-vigorous physical activity and frailty in NHANES cohorts. Maturitas. 2015; 80(2):187–91.https://doi.org/10.1016/j.maturitas.2014.11.010 PMID: 25542406
17. Jefferis BJ, Sartini C, Shiroma E, Whincup PH, Wannamethee SG, Lee IM. Duration and breaks in sed-entary behaviour: accelerometer data from 1566 community-dwelling older men (British Regional HeartStudy). British journal of sports medicine. 2014.
18. Sardinha LB, Santos DA, Silva AM, Baptista F, Owen N. Breaking-up sedentary time is associated withphysical function in older adults. The journals of gerontology Series A, Biological sciences and medicalsciences. 2015; 70(1):119–24. https://doi.org/10.1093/gerona/glu193 PMID: 25324221
19. Sardinha LB, Ekelund U, dos Santos L, Cyrino ES, Silva AM, Santos DA. Breaking-up sedentary time isassociated with impairment in activities of daily living. Exp Gerontol. 2015; 72:278-. https://doi.org/10.1016/j.exger.2015.10.010 PMID: 26514290
20. Guadalupe-Grau A, Carnicero JA, Gomez-Cabello A, Gutierrez Avila G, Humanes S, Alegre LM, et al.Association of regional muscle strength with mortality and hospitalisation in older people. Age and age-ing. 2015; 44(5):790–5. https://doi.org/10.1093/ageing/afv080 PMID: 26163682
21. Garcia-Garcia FJ, Carcaillon L, Fernandez-Tresguerres J, Alfaro A, Larrion JL, Castillo C, et al. A NewOperational Definition of Frailty: The Frailty Trait Scale. J AmMed Dir Assoc. 2014; 15(5).
22. Colley R, Connor Gorber S, Tremblay MS. Quality control and data reduction procedures for accelero-metry-derived measures of physical activity. Health reports. 2010; 21(1):63–9. PMID: 20426228
23. Freedson PS, Melanson E, Sirard J. Calibration of the Computer Science and Applications, Inc. acceler-ometer. Med Sci Sports Exerc. 1998; 30(5):777–81. PMID: 9588623
24. Migueles JH, Cadenas-Sanchez C, Ekelund U, Delisle NystromC, Mora-Gonzalez J, Lof M, et al. Accel-erometer Data Collection and Processing Criteria to Assess Physical Activity and Other Outcomes: ASystematic Review and Practical Considerations. Sports Med. 2017.
25. In: Global Recommendations on Physical Activity for Health. WHOGuidelines Approved by the Guide-lines Review Committee. Geneva2010.
26. Folstein MF, Folstein SE, McHugh PR. "Mini-mental state". A practical method for grading the cognitivestate of patients for the clinician. Journal of psychiatric research. 1975; 12(3):189–98. PMID: 1202204
27. Katz JN, Chang LC, Sangha O, Fossel AH, Bates DW. Can comorbidity be measured by questionnairerather than medical record review?Medical care. 1996; 34(1):73–84. PMID: 8551813
28. Guralnik JM, Simonsick EM, Ferrucci L, Glynn RJ, Berkman LF, Blazer DG, et al. A short physical per-formance battery assessing lower extremity function: association with self-reported disability and pre-diction of mortality and nursing home admission. J Gerontol. 1994; 49(2):M85–94. PMID: 8126356
29. BumanMP, Hekler EB, Haskell WL, Pruitt L, Conway TL, Cain KL, et al. Objective light-intensity physi-cal activity associations with rated health in older adults. Am J Epidemiol. 2010; 172(10):1155–65.https://doi.org/10.1093/aje/kwq249 PMID: 20843864
30. Chastin SF, Egerton T, Leask C, Stamatakis E. Meta-analysis of the relationship between breaks insedentary behavior and cardiometabolic health. Obesity. 2015; 23(9):1800–10. https://doi.org/10.1002/oby.21180 PMID: 26308477
31. Aguilar-Farias N, BrownWJ, Peeters GM. ActiGraph GT3X+ cut-points for identifying sedentary behav-iour in older adults in free-living environments. Journal of science and medicine in sport / Sports Medi-cine Australia. 2014; 17(3):293–9.
Sedentary behaviour and frailty in the elderly
PLOSONE | https://doi.org/10.1371/journal.pone.0183911 September 11, 2017 9 / 9

RESULTS
184
RESULTS
185
5.3. STUDY 3
“Reallocating Accelerometer-
Assessed Sedentary Time to Light or
Moderate- to Vigorous-Intensity
Physical Activity Reduces Frailty
Levels in Older Adults: An
Isotemporal Substitution Approach
in the TSHA Study”

RESULTS
186
Original Study
Reallocating Accelerometer-Assessed Sedentary Time to Light orModerate- to Vigorous-Intensity Physical Activity Reduces FrailtyLevels in Older Adults: An Isotemporal Substitution Approach in theTSHA Study
Asier Mañas MSc a,b, Borja del Pozo-Cruz PhD c, Amelia Guadalupe-Grau PhD b,d,Jorge Marín-Puyalto MSc e, Ana Alfaro-Acha PhD, MDb,f,Leocadio Rodríguez-Mañas PhD, MDb,g, Francisco J. García-García PhD, MDb,f,Ignacio Ara PhD a,b,*aGENUD Toledo Research Group, University of Castilla-La Mancha, Toledo, Castilla-La Mancha, SpainbCIBER of Frailty and Healthy Aging (CIBERFES), Madrid, Comunidad de Madrid, SpaincDepartment of Exercise Sciences, University of Auckland, Auckland, New Zealandd ImFINE Research Group, Department of Health and Human Performance, Technical University of Madrid, Madrid, SpaineGENUD Research Group, Faculty of Health and Sport Sciences, University of Zaragoza, Huesca, Aragón, SpainfGeriatric Department, Hospital Virgen del Valle, Toledo, Castilla-La Mancha, SpaingGeriatric Department, Hospital Universitario de Getafe, Getafe, Comunidad de Madrid, Spain
Keywords:Accelerometrysedentary behaviorelderlyagingexercisecomorbidity
a b s t r a c t
Introduction: The effects of replacing sedentary time with light or moderate- to vigorous-intensityphysical activity on frailty are not well known.Aim: To examine the mutually independent associations of sedentary time (ST), light-intensity physicalactivity (LPA), and moderate- to vigorous-intensity physical activity (MVPA) with frailty status in olderadults.Methods: A total of 628 people aged �65 years from the Toledo Study of Healthy Aging (TSHA) partici-pated in this cross-sectional study. Frailty was measured using the Frailty Trait Scale. Hip-worn accel-erometers were used to capture objective measurements of ST, LPA, and MVPA. Linear regression andisotemporal substitution analyses were used to examine associations of ST, LPA, and MVPA with frailtystatus. Analyses were also stratified by comorbidity.Results: In single and partition models, LPA and MVPA were negatively associated with frailty. Time insedentary behavior was not associated with frailty in these models. In the isotemporal substitutionmodels, replacing 30 minutes/d of ST with MVPA was associated with a decrease in frailty [b �2.460;95% confidence interval (CI): �3.782, �1.139]. In contrast, replacing ST with LPA was not associatedwith favorable effects on this outcome. However, when the models were stratified by comorbidity,replacing ST with MVPA had the greatest effect on frailty in both the comorbidity (b �2.556; 95% CI:�4.451, �0.661) and the no comorbidity group (b �2.535; 95% CI: �4.343, �0.726). Moreover, thefavorable effects of LPA in people with comorbidities was found when replacing 30 minutes/d of STwith LPA (b �0.568; 95% CI: �1.050, �0.086).Conclusions: Substituting ST with MVPA is associated with theoretical positive effects on frailty. Peoplewith comorbidity may also benefit from replacing ST with LPA, which may have important clinical im-plications in order to decrease the levels of physical frailty.
� 2017 AMDA e The Society for Post-Acute and Long-Term Care Medicine.
The authors declare no conflicts of interest.This work was supported by the Biomedical Research Networking Center on
Frailty and Healthy Aging (CIBERFES) and FEDER funds from the European Union(CB16/10/00477). It was further funded by grants from the Government of Castilla-La Mancha (PI2010/020; Institute of Health Sciences, Ministry of Health of Castilla-La Mancha, 03031-00), Spanish Government (Spanish Ministry of Economy,“Ministerio de Economía y Competitividad,” Instituto de Salud Carlos III, PI10/
01532, PI031558, PI11/01068), and by European Grants (Seventh FrameworkProgramme: FRAILOMIC). A.M. has received a PhD Grant from the Universidad deCastilla-La Mancha (2015/4062).* Address correspondence to Ignacio Ara, PhD, GENUD Toledo Research Group,
University of Castilla-La Mancha, Avda. Carlos III s/n, Toledo 45071, Spain.E-mail address: [email protected] (I. Ara).
JAMDA
journal homepage: www.jamda.com
https://doi.org/10.1016/j.jamda.2017.11.0031525-8610/� 2017 AMDA e The Society for Post-Acute and Long-Term Care Medicine.
JAMDA 19 (2018) 185.e1e185.e6
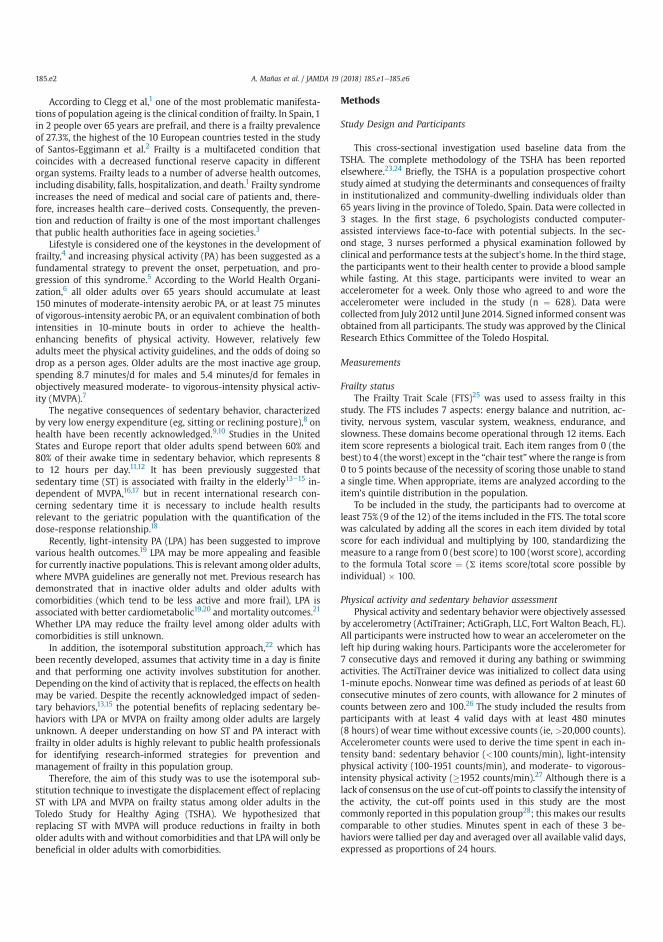
According to Clegg et al,1 one of the most problematic manifesta-tions of population ageing is the clinical condition of frailty. In Spain, 1in 2 people over 65 years are prefrail, and there is a frailty prevalenceof 27.3%, the highest of the 10 European countries tested in the studyof Santos-Eggimann et al.2 Frailty is a multifaceted condition thatcoincides with a decreased functional reserve capacity in differentorgan systems. Frailty leads to a number of adverse health outcomes,including disability, falls, hospitalization, and death.1 Frailty syndromeincreases the need of medical and social care of patients and, there-fore, increases health careederived costs. Consequently, the preven-tion and reduction of frailty is one of the most important challengesthat public health authorities face in ageing societies.3
Lifestyle is considered one of the keystones in the development offrailty,4 and increasing physical activity (PA) has been suggested as afundamental strategy to prevent the onset, perpetuation, and pro-gression of this syndrome.5 According to the World Health Organi-zation,6 all older adults over 65 years should accumulate at least150 minutes of moderate-intensity aerobic PA, or at least 75 minutesof vigorous-intensity aerobic PA, or an equivalent combination of bothintensities in 10-minute bouts in order to achieve the health-enhancing benefits of physical activity. However, relatively fewadults meet the physical activity guidelines, and the odds of doing sodrop as a person ages. Older adults are the most inactive age group,spending 8.7 minutes/d for males and 5.4 minutes/d for females inobjectively measured moderate- to vigorous-intensity physical activ-ity (MVPA).7
The negative consequences of sedentary behavior, characterizedby very low energy expenditure (eg, sitting or reclining posture),8 onhealth have been recently acknowledged.9,10 Studies in the UnitedStates and Europe report that older adults spend between 60% and80% of their awake time in sedentary behavior, which represents 8to 12 hours per day.11,12 It has been previously suggested thatsedentary time (ST) is associated with frailty in the elderly13e15 in-dependent of MVPA,16,17 but in recent international research con-cerning sedentary time it is necessary to include health resultsrelevant to the geriatric population with the quantification of thedose-response relationship.18
Recently, light-intensity PA (LPA) has been suggested to improvevarious health outcomes.19 LPA may be more appealing and feasiblefor currently inactive populations. This is relevant among older adults,where MVPA guidelines are generally not met. Previous research hasdemonstrated that in inactive older adults and older adults withcomorbidities (which tend to be less active and more frail), LPA isassociated with better cardiometabolic19,20 and mortality outcomes.21
Whether LPA may reduce the frailty level among older adults withcomorbidities is still unknown.
In addition, the isotemporal substitution approach,22 which hasbeen recently developed, assumes that activity time in a day is finiteand that performing one activity involves substitution for another.Depending on the kind of activity that is replaced, the effects on healthmay be varied. Despite the recently acknowledged impact of seden-tary behaviors,13,15 the potential benefits of replacing sedentary be-haviors with LPA or MVPA on frailty among older adults are largelyunknown. A deeper understanding on how ST and PA interact withfrailty in older adults is highly relevant to public health professionalsfor identifying research-informed strategies for prevention andmanagement of frailty in this population group.
Therefore, the aim of this study was to use the isotemporal sub-stitution technique to investigate the displacement effect of replacingST with LPA and MVPA on frailty status among older adults in theToledo Study for Healthy Aging (TSHA). We hypothesized thatreplacing ST with MVPA will produce reductions in frailty in botholder adults with and without comorbidities and that LPA will only bebeneficial in older adults with comorbidities.
Methods
Study Design and Participants
This cross-sectional investigation used baseline data from theTSHA. The complete methodology of the TSHA has been reportedelsewhere.23,24 Briefly, the TSHA is a population prospective cohortstudy aimed at studying the determinants and consequences of frailtyin institutionalized and community-dwelling individuals older than65 years living in the province of Toledo, Spain. Data were collected in3 stages. In the first stage, 6 psychologists conducted computer-assisted interviews face-to-face with potential subjects. In the sec-ond stage, 3 nurses performed a physical examination followed byclinical and performance tests at the subject’s home. In the third stage,the participants went to their health center to provide a blood samplewhile fasting. At this stage, participants were invited to wear anaccelerometer for a week. Only those who agreed to and wore theaccelerometer were included in the study (n ¼ 628). Data werecollected from July 2012 until June 2014. Signed informed consent wasobtained from all participants. The study was approved by the ClinicalResearch Ethics Committee of the Toledo Hospital.
Measurements
Frailty statusThe Frailty Trait Scale (FTS)25 was used to assess frailty in this
study. The FTS includes 7 aspects: energy balance and nutrition, ac-tivity, nervous system, vascular system, weakness, endurance, andslowness. These domains become operational through 12 items. Eachitem score represents a biological trait. Each item ranges from 0 (thebest) to 4 (theworst) except in the “chair test”where the range is from0 to 5 points because of the necessity of scoring those unable to standa single time. When appropriate, items are analyzed according to theitem’s quintile distribution in the population.
To be included in the study, the participants had to overcome atleast 75% (9 of the 12) of the items included in the FTS. The total scorewas calculated by adding all the scores in each item divided by totalscore for each individual and multiplying by 100, standardizing themeasure to a range from 0 (best score) to 100 (worst score), accordingto the formula Total score ¼ (S items score/total score possible byindividual) � 100.
Physical activity and sedentary behavior assessmentPhysical activity and sedentary behavior were objectively assessed
by accelerometry (ActiTrainer; ActiGraph, LLC, Fort Walton Beach, FL).All participants were instructed how to wear an accelerometer on theleft hip during waking hours. Participants wore the accelerometer for7 consecutive days and removed it during any bathing or swimmingactivities. The ActiTrainer device was initialized to collect data using1-minute epochs. Nonwear time was defined as periods of at least 60consecutive minutes of zero counts, with allowance for 2 minutes ofcounts between zero and 100.26 The study included the results fromparticipants with at least 4 valid days with at least 480 minutes(8 hours) of wear time without excessive counts (ie, >20,000 counts).Accelerometer counts were used to derive the time spent in each in-tensity band: sedentary behavior (<100 counts/min), light-intensityphysical activity (100-1951 counts/min), and moderate- to vigorous-intensity physical activity (�1952 counts/min).27 Although there is alack of consensus on the use of cut-off points to classify the intensity ofthe activity, the cut-off points used in this study are the mostcommonly reported in this population group28; this makes our resultscomparable to other studies. Minutes spent in each of these 3 be-haviors were tallied per day and averaged over all available valid days,expressed as proportions of 24 hours.
A. Mañas et al. / JAMDA 19 (2018) 185.e1e185.e6185.e2
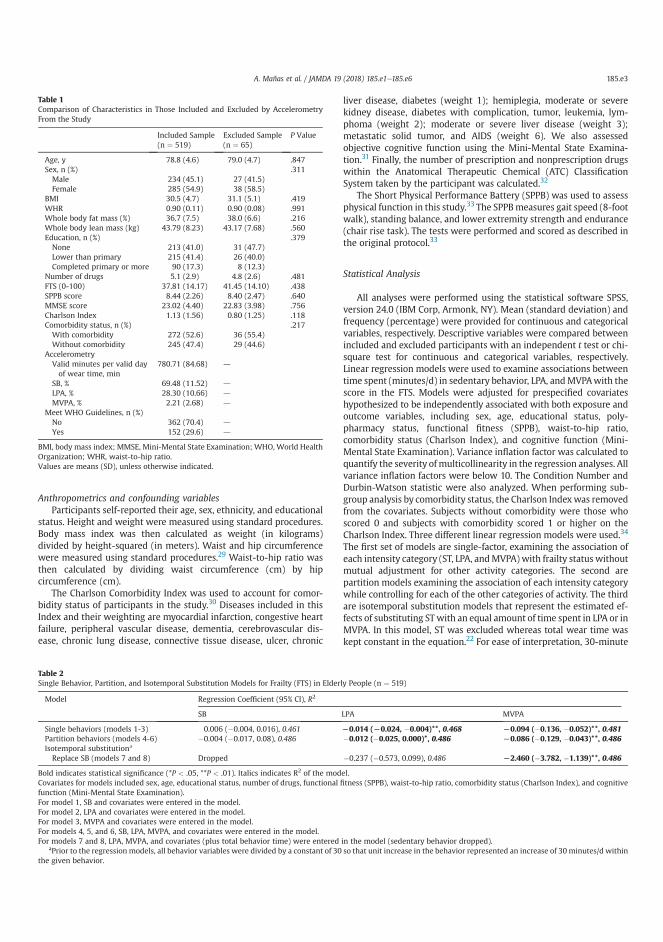
Anthropometrics and confounding variablesParticipants self-reported their age, sex, ethnicity, and educational
status. Height and weight were measured using standard procedures.Body mass index was then calculated as weight (in kilograms)divided by height-squared (in meters). Waist and hip circumferencewere measured using standard procedures.29 Waist-to-hip ratio wasthen calculated by dividing waist circumference (cm) by hipcircumference (cm).
The Charlson Comorbidity Index was used to account for comor-bidity status of participants in the study.30 Diseases included in thisIndex and their weighting are myocardial infarction, congestive heartfailure, peripheral vascular disease, dementia, cerebrovascular dis-ease, chronic lung disease, connective tissue disease, ulcer, chronic
liver disease, diabetes (weight 1); hemiplegia, moderate or severekidney disease, diabetes with complication, tumor, leukemia, lym-phoma (weight 2); moderate or severe liver disease (weight 3);metastatic solid tumor, and AIDS (weight 6). We also assessedobjective cognitive function using the Mini-Mental State Examina-tion.31 Finally, the number of prescription and nonprescription drugswithin the Anatomical Therapeutic Chemical (ATC) ClassificationSystem taken by the participant was calculated.32
The Short Physical Performance Battery (SPPB) was used to assessphysical function in this study.33 The SPPBmeasures gait speed (8-footwalk), standing balance, and lower extremity strength and endurance(chair rise task). The tests were performed and scored as described inthe original protocol.33
Statistical Analysis
All analyses were performed using the statistical software SPSS,version 24.0 (IBM Corp, Armonk, NY). Mean (standard deviation) andfrequency (percentage) were provided for continuous and categoricalvariables, respectively. Descriptive variables were compared betweenincluded and excluded participants with an independent t test or chi-square test for continuous and categorical variables, respectively.Linear regression models were used to examine associations betweentime spent (minutes/d) in sedentary behavior, LPA, andMVPAwith thescore in the FTS. Models were adjusted for prespecified covariateshypothesized to be independently associated with both exposure andoutcome variables, including sex, age, educational status, poly-pharmacy status, functional fitness (SPPB), waist-to-hip ratio,comorbidity status (Charlson Index), and cognitive function (Mini-Mental State Examination). Variance inflation factor was calculated toquantify the severity of multicollinearity in the regression analyses. Allvariance inflation factors were below 10. The Condition Number andDurbin-Watson statistic were also analyzed. When performing sub-group analysis by comorbidity status, the Charlson Indexwas removedfrom the covariates. Subjects without comorbidity were those whoscored 0 and subjects with comorbidity scored 1 or higher on theCharlson Index. Three different linear regression models were used.34
The first set of models are single-factor, examining the association ofeach intensity category (ST, LPA, andMVPA) with frailty status withoutmutual adjustment for other activity categories. The second arepartition models examining the association of each intensity categorywhile controlling for each of the other categories of activity. The thirdare isotemporal substitution models that represent the estimated ef-fects of substituting ST with an equal amount of time spent in LPA or inMVPA. In this model, ST was excluded whereas total wear time waskept constant in the equation.22 For ease of interpretation, 30-minute
Table 1Comparison of Characteristics in Those Included and Excluded by AccelerometryFrom the Study
Included Sample(n ¼ 519)
Excluded Sample(n ¼ 65)
P Value
Age, y 78.8 (4.6) 79.0 (4.7) .847Sex, n (%) .311Male 234 (45.1) 27 (41.5)Female 285 (54.9) 38 (58.5)
BMI 30.5 (4.7) 31.1 (5.1) .419WHR 0.90 (0.11) 0.90 (0.08) .991Whole body fat mass (%) 36.7 (7.5) 38.0 (6.6) .216Whole body lean mass (kg) 43.79 (8.23) 43.17 (7.68) .560Education, n (%) .379None 213 (41.0) 31 (47.7)Lower than primary 215 (41.4) 26 (40.0)Completed primary or more 90 (17.3) 8 (12.3)
Number of drugs 5.1 (2.9) 4.8 (2.6) .481FTS (0-100) 37.81 (14.17) 41.45 (14.10) .438SPPB score 8.44 (2.26) 8.40 (2.47) .640MMSE score 23.02 (4.40) 22.83 (3.98) .756Charlson Index 1.13 (1.56) 0.80 (1.25) .118Comorbidity status, n (%) .217With comorbidity 272 (52.6) 36 (55.4)Without comorbidity 245 (47.4) 29 (44.6)
AccelerometryValid minutes per valid dayof wear time, min
780.71 (84.68) d
SB, % 69.48 (11.52) d
LPA, % 28.30 (10.66) d
MVPA, % 2.21 (2.68) d
Meet WHO Guidelines, n (%)No 362 (70.4) d
Yes 152 (29.6) d
BMI, body mass index; MMSE, Mini-Mental State Examination; WHO, World HealthOrganization; WHR, waist-to-hip ratio.Values are means (SD), unless otherwise indicated.
Table 2Single Behavior, Partition, and Isotemporal Substitution Models for Frailty (FTS) in Elderly People (n ¼ 519)
Model Regression Coefficient (95% CI), R2
SB LPA MVPA
Single behaviors (models 1-3) 0.006 (�0.004, 0.016), 0.461 L0.014 (L0.024, �0.004)**, 0.468 L0.094 (�0.136, �0.052)**, 0.481Partition behaviors (models 4-6) �0.004 (�0.017, 0.08), 0.486 �0.012 (�0.025, 0.000)*, 0.486 L0.086 (�0.129, �0.043)**, 0.486Isotemporal substitutiona
Replace SB (models 7 and 8) Dropped �0.237 (�0.573, 0.099), 0.486 L2.460 (�3.782, �1.139)**, 0.486
Bold indicates statistical significance (*P < .05, **P < .01). Italics indicates R2 of the model.Covariates for models included sex, age, educational status, number of drugs, functional fitness (SPPB), waist-to-hip ratio, comorbidity status (Charlson Index), and cognitivefunction (Mini-Mental State Examination).For model 1, SB and covariates were entered in the model.For model 2, LPA and covariates were entered in the model.For model 3, MVPA and covariates were entered in the model.For models 4, 5, and 6, SB, LPA, MVPA, and covariates were entered in the model.For models 7 and 8, LPA, MVPA, and covariates (plus total behavior time) were entered in the model (sedentary behavior dropped).
aPrior to the regression models, all behavior variables were divided by a constant of 30 so that unit increase in the behavior represented an increase of 30 minutes/d withinthe given behavior.
A. Mañas et al. / JAMDA 19 (2018) 185.e1e185.e6 185.e3
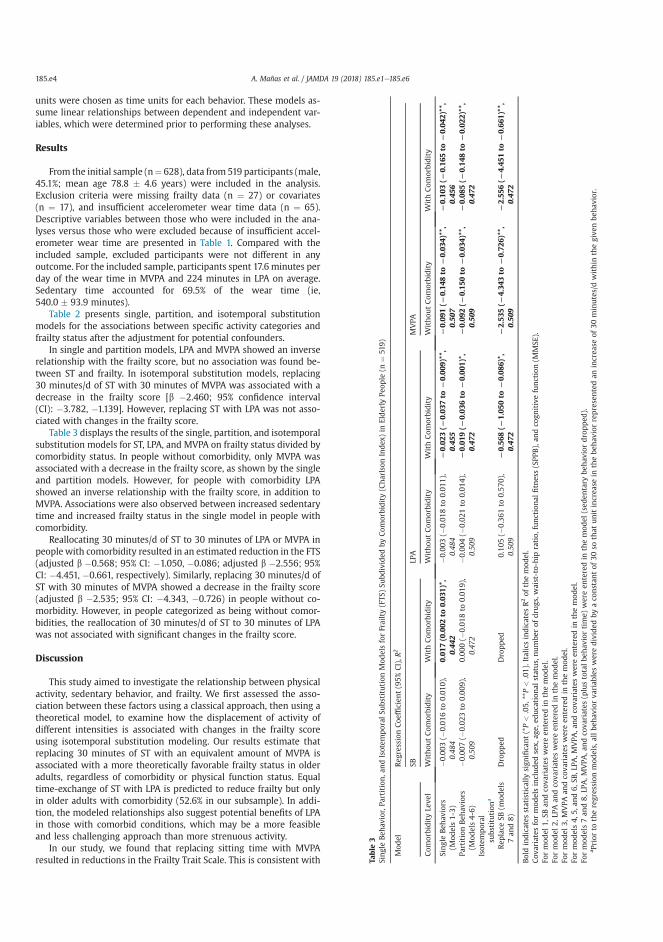
units were chosen as time units for each behavior. These models as-sume linear relationships between dependent and independent var-iables, which were determined prior to performing these analyses.
Results
From the initial sample (n¼ 628), data from 519 participants (male,45.1%; mean age 78.8 � 4.6 years) were included in the analysis.Exclusion criteria were missing frailty data (n ¼ 27) or covariates(n ¼ 17), and insufficient accelerometer wear time data (n ¼ 65).Descriptive variables between those who were included in the ana-lyses versus those who were excluded because of insufficient accel-erometer wear time are presented in Table 1. Compared with theincluded sample, excluded participants were not different in anyoutcome. For the included sample, participants spent 17.6 minutes perday of the wear time in MVPA and 224 minutes in LPA on average.Sedentary time accounted for 69.5% of the wear time (ie,540.0 � 93.9 minutes).
Table 2 presents single, partition, and isotemporal substitutionmodels for the associations between specific activity categories andfrailty status after the adjustment for potential confounders.
In single and partition models, LPA and MVPA showed an inverserelationship with the frailty score, but no association was found be-tween ST and frailty. In isotemporal substitution models, replacing30 minutes/d of ST with 30 minutes of MVPA was associated with adecrease in the frailty score [b �2.460; 95% confidence interval(CI): �3.782, �1.139]. However, replacing ST with LPA was not asso-ciated with changes in the frailty score.
Table 3 displays the results of the single, partition, and isotemporalsubstitution models for ST, LPA, and MVPA on frailty status divided bycomorbidity status. In people without comorbidity, only MVPA wasassociated with a decrease in the frailty score, as shown by the singleand partition models. However, for people with comorbidity LPAshowed an inverse relationship with the frailty score, in addition toMVPA. Associations were also observed between increased sedentarytime and increased frailty status in the single model in people withcomorbidity.
Reallocating 30 minutes/d of ST to 30 minutes of LPA or MVPA inpeople with comorbidity resulted in an estimated reduction in the FTS(adjusted b �0.568; 95% CI: �1.050, �0.086; adjusted b �2.556; 95%CI: �4.451, �0.661, respectively). Similarly, replacing 30 minutes/d ofST with 30 minutes of MVPA showed a decrease in the frailty score(adjusted b �2.535; 95% CI: �4.343, �0.726) in people without co-morbidity. However, in people categorized as being without comor-bidities, the reallocation of 30 minutes/d of ST to 30 minutes of LPAwas not associated with significant changes in the frailty score.
Discussion
This study aimed to investigate the relationship between physicalactivity, sedentary behavior, and frailty. We first assessed the asso-ciation between these factors using a classical approach, then using atheoretical model, to examine how the displacement of activity ofdifferent intensities is associated with changes in the frailty scoreusing isotemporal substitution modeling. Our results estimate thatreplacing 30 minutes of ST with an equivalent amount of MVPA isassociated with a more theoretically favorable frailty status in olderadults, regardless of comorbidity or physical function status. Equaltime-exchange of ST with LPA is predicted to reduce frailty but onlyin older adults with comorbidity (52.6% in our subsample). In addi-tion, the modeled relationships also suggest potential benefits of LPAin those with comorbid conditions, which may be a more feasibleand less challenging approach than more strenuous activity.
In our study, we found that replacing sitting time with MVPAresulted in reductions in the Frailty Trait Scale. This is consistent with Ta
ble
3SingleBeh
avior,Pa
rtition,a
ndIsotem
poral
Subs
titution
Mod
elsforFrailty(FTS
)Su
bdivided
byCom
orbidity(Charlson
Index
)in
Elderly
Peop
le(n
¼51
9)
Mod
elReg
ressionCoe
fficien
t(95%
CI),R
2
SBLP
AMVPA
Com
orbidityLe
vel
Withou
tCom
orbidity
WithCom
orbidity
Withou
tCom
orbidity
WithCom
orbidity
Withou
tCom
orbidity
WithCom
orbidity
SingleBeh
aviors
(Mod
els1-3)
�0.003
(�0.01
6to
0.01
0),
0.48
40.01
7(0.002
to0.03
1)*,
0.44
2�0
.003
(�0.01
8to
0.01
1),
0.48
4L
0.02
3(L
0.03
7to
L0.00
9)**,
0.45
5L
0.09
1(L
0.14
8to
L0.03
4)**,
0.50
7L
0.10
3(L
0.16
5to
L0.04
2)**,
0.45
6Pa
rtitionBeh
aviors
(Mod
els4-6)
�0.007
(�0.02
3to
0.00
9),
0.50
90.00
0(�
0.01
8to
0.01
9),
0.47
2�0
.004
(�0.02
1to
0.01
4),
0.50
9L
0.01
9(L
0.03
6to
L0.00
1)*,
0.47
2L
0.09
2(L
0.15
0to
L0.03
4)**,
0.50
9L
0.08
5(L
0.14
8to
L0.02
2)**,
0.47
2Isotem
poral
subs
titution
a
Rep
lace
SB(m
odels
7an
d8)
Dropped
Dropped
0.10
5(�
0.36
1to
0.57
0),
0.50
9L
0.56
8(L
1.05
0to
L0.08
6)*,
0.47
2L
2.53
5(L
4.34
3to
L0.72
6)**,
0.50
9L
2.55
6(L
4.45
1to
L0.66
1)**,
0.47
2
Boldindicates
statistically
sign
ificant(*P<
.05,
**P<
.01).Italic
sindicates
R2of
themod
el.
Cov
ariatesformod
elsincluded
sex,
age,
education
alstatus,numbe
rof
drugs,w
aist-to-hip
ratio,
functional
fitness(SPP
B),an
dco
gnitivefunction(M
MSE
).Fo
rmod
el1,
SBan
dco
variates
wereen
teredin
themod
el.
Formod
el2,
LPAan
dco
variates
wereen
teredin
themod
el.
Formod
el3,
MVPA
andco
variates
wereen
teredin
themod
el.
Formod
els4,
5,an
d6,
SB,L
PA,M
VPA
,andco
variates
wereen
teredin
themod
el.
Formod
els7an
d8,
LPA,M
VPA
,andco
variates
(plustotalbe
hav
iortime)
wereen
teredin
themod
el(sed
entary
behav
iordropped
).a Prior
totheregression
mod
els,allbe
hav
iorva
riab
lesweredivided
byaco
nstan
tof
30so
that
unitincrea
sein
thebe
hav
iorrepresentedan
increa
seof
30minutes/dwithin
thegive
nbe
hav
ior.
A. Mañas et al. / JAMDA 19 (2018) 185.e1e185.e6185.e4
previous findings where MVPA was associated with frailty even aftercontrolling for ST.16 MVPA is well known to affect cognitive andphysical outcomes, all known to impact frailty. Supporting our resultsare the findings of Song et al17 and Peterson et al,35 which show evi-dence that ST negatively impacts frailty in older adults. Likewise,Fanning et al36 only found an improvement in self-regulatory behaviorand executive functioning when 30 minutes of ST was replaced by30 minutes of MVPA time.
We have found in single and partitionmodels that LPA has a role onfrailty. Some authors have found a positive relationship between LPAand different outcomes regarding frailty, whereas others have not.Elkins37 showed that daily time spent in LPA is associated with lowerrisk of onset and progression of disability whereas Lee et al38 found apositive effect of LPA in cognitive status. Jantunen et al39 also showedthat LPA was positively associated with better physical performance.However, Pau et al40 found that LPA is not the most adequate intensityto improve daily static and dynamic motor tasks.
As a novelty, our grouping analysis shows that only in peoplereporting comorbidities did LPA bring benefits in terms of frailty.Other studies have shown the beneficial effects of LPA in the iso-temporal substitution analyses. Ekblom-Bak et al41 showed signifi-cant lower metabolic syndrome prevalence by replacing 10 minutesof ST with the same amount of LPA. Similarly, Fishman et al42 andSchmid et al43 found that replacing 30 minutes of ST with LPA wasassociated with significant reduction in mortality risk. Our findingsshow that in frail individuals, with low fitness even minimal move-ment can positively impact health.44 But when a certain fitness levelis reached, more strenuous activity is needed to elicit more beneficialresults.
Despite requiring between 4 to 5 times more LPA to elicit the samechanges in frailty compared with MVPA, according to our estimates,the benefits of LPA for improving frailty status in those with comor-bidities is of relevance from a public health perspective as might be apopulation, of those with comorbidities, that cannot or do not findopportunities to (frail older adults spend 84.9% of their daily time insedentary behaviors45) become engaged in MVPA successfully. Thus,replacing ST (eg, television viewing, sitting) with LPA (eg, leisurewalking, active transport) may be a more feasible strategy to reducethe risk of frailty in older adults with additional disease. Future lon-gitudinal experimental studies should confirm these results.
This study has several strengths and limitations. The sample in-cludes a relatively large number of community-dwelling older adultswith objectively assessed frailty and physical activity. However, whencomparing the full cohort with the included sample, there were dif-ferences in most outcomes used in this study, so caution should beexercised when interpreting the results. Although there is no estab-lished gold standard to identify frailty, the Frailty Trait Scale, derivedfrom the classical model proposed by Fried et al46 in combinationwiththe positive aspects of the Frailty Index of Rockwood et al,47 has beensuggested as a more sensitive scale for detecting changes in the in-dividual’s biological status.25 The validity of this scale was evaluatedby assessing its associationwith comorbidities, biomarkers associatedwith frailty status, and by comparing its predictive value for adverseevents with the 2 most frequently used frailty scales: Frailty Pheno-type46 and the Frailty Index.47 Although accelerometry has some ad-vantages over questionnaires and other self-report methods,48 it is notexempt from error. Waist-worn accelerometers are not able to detectdifferences between sitting and standing positions, and therefore themeasurement of ST can be overestimated. In addition, the cut-offpoints used in this study and the algorithm chosen to discard zero-value periods can affect the amount of different physical activity in-tensity ranges and sedentary behavior.
Causal inferences are limited towing to the cross-sectional natureof the study. Moreover, isotemporal substitution models represent amathematical way of replacing one behavior with another, so the
results should be interpreted with caution. There is therefore a needfor more experimental research in this area, especially in the clinicalsetting, in order to better understand the impact of replacing ST withactivity of different intensities on frailty status among older adults.Another limitation of the study may be the nonmeasurement of sleep,an important behavior that may affect the associations found in thisstudy.
Conclusions
In conclusion, this study demonstrates that replacing 30 minutes/d of sedentary behavior with the same amount of MVPA could bringbenefits in terms of frailty status among older adults. Participants withcomorbidities may also benefit from the substitution of ST by LPA.From a public health perspective, this is an important message inorder to improve frailty status through increasing LPA, which a prioriseems to be a more feasible approach as opposed to increasing MVPAin this population group. Future research should move beyond thishypothetical, observational evidence and identify more-robust indi-cation of the frailty outcomes of experimentally reallocating timespent in sedentary behaviors with physical activities of differentintensities.49
References
1. Clegg A, Young J, Iliffe S, et al. Frailty in elderly people. Lancet 2013;381:752e762.
2. Santos-Eggimann B, Cuenoud P, Spagnoli J, Junod J. Prevalence of frailty inmiddle-aged and older community-dwelling Europeans living in 10 countries.J Gerontol A Biol Sci Med Sci 2009;64:675e681.
3. Rodriguez-Artalejo F, Rodriguez-Manas L. The frailty syndrome in the publichealth agenda. J Epidemiol Community health 2014;68:703e704.
4. Bergman H, Ferrucci L, Guralnik J, et al. Frailty: An emerging research andclinical paradigmdIssues and controversies. J Gerontol A Biol Sci Med Sci 2007;62:731e737.
5. Liu CK, Fielding RA. Exercise as an intervention for frailty. Clin Geriatr Med2011;27:101e110.
6. World Health Organization. Global Recommendations on Physical Activity forHealth. Geneva: World Health Organization; 2010.
7. Troiano RP, Berrigan D, Dodd KW, et al. Physical activity in the United Statesmeasured by accelerometer. Med Sci Sports Exerc 2008;40:181e188.
8. Sedentary Behaviour Research Network. Letter to the editor: Standardized useof the terms “sedentary” and “sedentary behaviours”. Appl Physiol Nutr Metab2012;37:540e542.
9. Chau JY, Grunseit A, Midthjell K, et al. Sedentary behaviour and risk of mor-tality from all-causes and cardiometabolic diseases in adults: Evidence fromthe HUNT3 population cohort. Br J Sports Med 2015;49:737e742.
10. de Rezende LF, Rey-Lopez JP, Matsudo VK, do Carmo Luiz O. Sedentary behaviorand health outcomes among older adults: A systematic review. BMC PublicHealth 2014;14:333.
11. Davis MG, Fox KR, Hillsdon M, et al. Objectively measured physical activity in adiverse sample of older urban UK adults. Med Sci Sports Exerc 2011;43:647e654.
12. Matthews CE, Chen KY, Freedson PS, et al. Amount of time spent insedentary behaviors in the United States, 2003-2004. Am J Epidemiol 2008;167:875e881.
13. da Silva Coqueiro R, de Queiroz BM, Oliveira DS, et al. Cross-sectional re-lationships between sedentary behavior and frailty in older adults. J SportsMed Phys Fitness 2017;57:825e830.
14. Manas A, Del Pozo-Cruz B, Garcia-Garcia FJ, et al. Role of objectively measuredsedentary behaviour in physical performance, frailty and mortality amongolder adults: A short systematic review. Eur J Sport Sci 2017;17:940e953.
15. Del Pozo-Cruz B, Manas A, Martin-Garcia M, et al. Frailty is associated withobjectively assessed sedentary behaviour patterns in older adults: Evidencefrom the Toledo Study for Healthy Aging (TSHA). PLoS One 2017;12:e0183911.
16. Blodgett J, Theou O, Kirkland S, et al. The association between sedentarybehaviour, moderate-vigorous physical activity and frailty in NHANES cohorts.Maturitas 2015;80:187e191.
17. Song J, Lindquist LA, Chang RW, et al. Sedentary behavior as a risk factor forphysical frailty independent of moderate activity: Results from the Osteoar-thritis Initiative. Am J Public Health 2015;105:1439e1445.
18. Dogra S, Ashe MC, Biddle SJH, et al. Sedentary time in older men and women:An international consensus statement and research priorities. Br J Sports Med2017;51:1526e1532.
A. Mañas et al. / JAMDA 19 (2018) 185.e1e185.e6 185.e5
19. Fuzeki E, Engeroff T, Banzer W. Health benefits of light-intensity physical ac-tivity: A systematic review of accelerometer data of the National Health andNutrition Examination Survey (NHANES). Sports Med; 2017.
20. Loprinzi PD, Lee H, Cardinal BJ. Evidence to support including lifestyle light-intensity recommendations in physical activity guidelines for older adults.Am J Health Promot 2015;29:277e284.
21. Loprinzi PD. Light-intensity physical activity and all-cause mortality. Am JHealth Promot 2017;31:340e342.
22. Mekary RA, Willett WC, Hu FB, Ding EL. Isotemporal substitution paradigm forphysical activity epidemiology and weight change. Am J Epidemiol 2009;170:519e527.
23. Carcaillon L, Blanco C, Alonso-Bouzon C, et al. Sex differences in the associationbetween serum levels of testosterone and frailty in an elderly population: TheToledo Study for Healthy Aging. PLoS One 2012;7:e32401.
24. Garcia-Garcia FJ, Gutierrez Avila G, Alfaro-Acha A, et al. The prevalence offrailty syndrome in an older population from Spain. The Toledo Study forHealthy Aging. J Nutr Health Aging 2011;15:852e856.
25. Garcia-Garcia FJ, Carcaillon L, Fernandez-Tresguerres J, et al. A new operationaldefinition of frailty: The Frailty Trait Scale. J Am Med Dir Assoc 2014;15:371.e7e371.e13.
26. Colley R, Connor Gorber S, Tremblay MS. Quality control and data reductionprocedures for accelerometry-derived measures of physical activity. HealthRep 2010;21:63e69.
27. Freedson PS, Melanson E, Sirard J. Calibration of the Computer Science andApplications, Inc. accelerometer. Med Sci Sports Exerc 1998;30:777e781.
28. Migueles JH, Cadenas-Sanchez C, Ekelund U, et al. Accelerometer data collec-tion and processing criteria to assess physical activity and other outcomes: Asystematic review and practical considerations. Sports Med; 2017.
29. Guadalupe-Grau A, Aznar-Lain S, Manas A, et al. Short- and long-term effects ofconcurrent strength and HIIT training in octogenarians with COPD. J AgingPhys Act 2017;25:105e115.
30. Charlson ME, Pompei P, Ales KL, MacKenzie CR. A new method of classifyingprognostic comorbidity in longitudinal studies: Development and validation.J Chronic Dis 1987;40:373e383.
31. Tombaugh TN, McIntyre NJ. The Mini-Mental State Examination: A compre-hensive review. J Am Geriatr Soc 1992;40:922e935.
32. Gnjidic D, Hilmer SN, Blyth FM, et al. Polypharmacy cutoff and outcomes: Fiveor more medicines were used to identify community-dwelling older men atrisk of different adverse outcomes. J Clin Epidemiol 2012;65:989e995.
33. Guralnik JM, Simonsick EM, Ferrucci L, et al. A short physical performancebattery assessing lower extremity function: Association with self-reporteddisability and prediction of mortality and nursing home admission.J Gerontol 1994;49:M85eM94.
34. Hamer M, Stamatakis E, Steptoe A. Effects of substituting sedentary time withphysical activity on metabolic risk. Med Sci Sports Exerc 2014;46:1946e1950.
35. Peterson MJ, Giuliani C, Morey MC, et al. Physical activity as a preventativefactor for frailty: The Health, Aging, and Body Composition Study. J Gerontol ABiol Sci Med Sci 2009;64:61e68.
36. Fanning J, Porter G, Awick EA, et al. Replacing sedentary time with sleep, light,or moderate-to-vigorous physical activity: Effects on self-regulation and ex-ecutive functioning. J Behav Med 2017;40:332e342.
37. Elkins M. Light intensity physical activity is associated with lower disability inadults with or at risk of knee osteoarthritis. J Physiother 2014;60:163.
38. Lee S, Yuki A, Nishita Y, et al. Research relationship between light-intensityphysical activity and cognitive function in a community-dwelling elderlypopulationdAn 8-year longitudinal study. J Am Geriatr Soc 2013;61:452e453.
39. Jantunen H, Wasenius N, Salonen MK, et al. Objectively measured physicalactivity and physical performance in old age. Age Ageing 2017;46:232e237.
40. Pau M, Leban B, Collu G, Migliaccio GM. Effect of light and vigorous physicalactivity on balance and gait of older adults. Arch Gerontol Geriatr 2014;59:568e573.
41. Ekblom-Bak E, Ekblom O, Bergstrom G, Borjesson M. Isotemporal substitu-tion of sedentary time by physical activity of different intensities and boutlengths, and its associations with metabolic risk. Eur J Prev Cardiol 2016;23:967e974.
42. Fishman EI, Steeves JA, Zipunnikov V, et al. Association between ObjectivelyMeasured Physical Activity and Mortality in NHANES. Med Sci Sports Exerc2016;48:1303e1311.
43. Schmid D, Ricci C, Baumeister SE, Leitzmann MF. Replacing sedentary timewith physical activity in relation to mortality. Med Sci Sports Exerc 2016;48:1312e1319.
44. Prizer LP, Gay JL, Gerst-Emerson K, Froehlich-Grobe K. The role of age inmoderating the association between disability and light-intensity physicalactivity. Am J Health Promot 2016;30:e101ee109.
45. Jansen FM, Prins RG, Etman A, et al. Physical activity in non-frail and frail olderadults. PLoS One 2015;10:e0123168.
46. Fried LP, Tangen CM, Walston J, et al. Frailty in older adults: Evidence for aphenotype. J Gerontol A Biol Sci Med Sci 2001;56:M146eM156.
47. Rockwood K, Song X, MacKnight C, et al. A global clinical measure of fitness andfrailty in elderly people. CMAJ 2005;173:489e495.
48. Warren JM, Ekelund U, Besson H, et al. Assessment of physical activitydAreview of methodologies with reference to epidemiological research: A reportof the exercise physiology section of the European Association of Cardiovas-cular Prevention and Rehabilitation. Eur J Cardiovasc Prev Rehabil 2010;17:127e139.
49. Martin A, Fitzsimons C, Jepson R, et al. Interventions with potential to reducesedentary time in adults: Systematic review and meta-analysis. Br J Sports Med2015;49:1056e1063.
A. Mañas et al. / JAMDA 19 (2018) 185.e1e185.e6185.e6
RESULTS
193
5.4. STUDY 4
“Dose-response association between
physical activity and sedentary time
categories on ageing biomarkers”

RESULTS
194
RESEARCH ARTICLE Open Access
Dose-response association betweenphysical activity and sedentary timecategories on ageing biomarkersAsier Mañas1,2, Borja del Pozo-Cruz3, Irene Rodríguez-Gómez1,2, Javier Leal-Martín1,2, José Losa-Reyna1,2,4,Leocadio Rodríguez-Mañas2,5, Francisco J. García-García2,4 and Ignacio Ara1,2*
Abstract
Background: Physical activity and sedentary behaviour have been suggested to independently affect a number ofhealth outcomes. To what extent different combinations of physical activity and sedentary behaviour may influencephysical function and frailty outcomes in older adults is unknown. The aim of this study was to examine the combinationof mutually exclusive categories of accelerometer-measured physical activity and sedentary time on physical function andfrailty in older adults.
Methods: 771 older adults (54% women; 76.8 ± 4.9 years) from the Toledo Study for Healthy Aging participated in thiscross-sectional study. Physical activity and sedentary time were measured by accelerometry. Physically active was definedas meeting current aerobic guidelines for older adults proposed by the World Health Organization. Low sedentary wasdefined as residing in the lowest quartile of the light physical activity-to-sedentary time ratio. Participants were thenclassified into one of four mutually exclusive movement patterns: (1) ‘physically active & low sedentary’, (2) ‘physicallyactive & high sedentary’, (3) ‘physically inactive & low sedentary’, and (4) ‘physically inactive & high sedentary’. The ShortPhysical Performance Battery was used to measure physical function and frailty was assessed using the Frailty Trait Scale.
Results: ‘Physically active & low sedentary’ and ‘physically active & high sedentary’ individuals had significantly higherlevels of physical function (β = 1.73 and β = 1.30 respectively; all p < 0.001) and lower frailty (β = − 13.96 and β = − 8.71respectively; all p < 0.001) compared to ‘physically inactive & high sedentary’ participants. Likewise, ‘physically inactive &low sedentary’ group had significantly lower frailty (β = − 2.50; p = 0.05), but significance was not reached for physicalfunction.
Conclusions: We found a dose-response association of the different movement patterns analysed in this study withphysical function and frailty. Meeting the physical activity guidelines was associated with the most beneficial physicalfunction and frailty profiles in our sample. Among inactive people, more light intensity relative to sedentary time wasassociated with better frailty status. These results point out to the possibility of stepwise interventions (i.e. targeting lessstrenuous activities) to promote successful aging, particularly in inactive older adults.
Keywords: Exercise, Ageing, Functioning and disability, Health behaviour, Lifestyle
© The Author(s). 2019 Open Access This article is distributed under the terms of the Creative Commons Attribution 4.0International License (http://creativecommons.org/licenses/by/4.0/), which permits unrestricted use, distribution, andreproduction in any medium, provided you give appropriate credit to the original author(s) and the source, provide a link tothe Creative Commons license, and indicate if changes were made. The Creative Commons Public Domain Dedication waiver(http://creativecommons.org/publicdomain/zero/1.0/) applies to the data made available in this article, unless otherwise stated.
* Correspondence: [email protected] Toledo Research Group, Universidad de Castilla-La Mancha, Avda.Carlos III s/n, 45071 Toledo, Spain2CIBER of Frailty and Healthy Aging (CIBERFES), Madrid, SpainFull list of author information is available at the end of the article
Mañas et al. BMC Geriatrics (2019) 19:270 https://doi.org/10.1186/s12877-019-1284-y
BackgroundThere is compiling evidence showing the benefits of regu-lar physical activity to improve physical functioning andreduce frailty among the elderly [1, 2]. Consequently,physical activity, particularly more strenuous activity isnow routinely recommended in the clinical managementof frailty [2, 3]. Blodgett et al. [4] and Manas et al. [5] haveshown that moderate-to-vigorous physical activity(MVPA) is inversely associated with frailty and adversehealth outcomes in middle-age (≥50 years) and olderadults (≥65 years), respectively. However, few older adultsmeet the physical activity recommendations (i.e., 150minof moderate intensity aerobic activity, 75min of vigorousintensity aerobic activity, or an equivalent combination, in10-min bouts [6]). In fact, previous research has foundthat older adults spend between 8 and 12 h of their wakingday sedentary [7]. Sedentary behaviours, such as TV view-ing, motorized transport, or leisure-time sitting, have beenshown to contribute to adverse health outcomes in olderpeople, including lower levels of physical functioning andhigher levels of frailty [4, 8–10].Nevertheless, we are far from a complete understand-
ing of the inter-relationships between MVPA and seden-tary behaviours and the role they may play on preservingphysical function and reducing frailty levels among olderadults. Several studies have shown that some people canmeet the physical activity recommendations and yet dis-play high levels of sedentary behaviours. The reversecould also be true. Thus, different combinations of be-haviours (i.e. ‘physically active and low sedentary’, ‘phys-ically active and high sedentary’, ‘physically inactive andlow sedentary’, and ‘physically inactive and high seden-tary’) are plausible during waking times. Potentially,these distinct combinations of behaviours may lead to agradient of health consequences [11, 12]. For example,Bakrania et al. [11] found that physically active adults,even those who spent much of their time on sedentarybehaviours, had better cardiometabolic health than thosewho were inactive. It was also suggested that those indi-viduals with lower sedentary status in the absence ofmeeting the physical activity recommendations had bet-ter cardiometabolic health profile compared to thosewith higher sedentary status and that were physically in-active (i.e. did not meet the physical activity guidelines).This dose-response pattern has also been confirmedfor biological markers and mortality in previousstudies [12, 13].Appreciation of potential physical function and frailty
consequences that different combinations of mutuallyexclusive waking behaviours may have among olderadults will be advantageous to target successful publichealth interventions. For instance, increasing light inten-sity physical activity could be a feasible approach to im-prove the physical functioning and reduce the level of
frailty of older adults categorize as inactive and high sed-entary. Further, if a dose-response exists between thedifferent movement behaviour patterns and physicalfunctioning/frailty in older individuals (i.e., if more activepatterns of behaviour are associated with better healthprofiles), a gradual range of stepwise interventions canbe proposed. For example, if someone is sitting in thelowest movement category (i.e., inactive, high sedentary),we could focus on an intervention that targets sedentarybehaviour first to move that particular person from in-active, high sedentary to inactive, low sedentary. Thereare, however, no existing studies analysing the associa-tions between mutually exclusive categories of physicalactivity and sedentary time with physical function andfrailty in older adults. Therefore, the purpose of thisstudy was to examine the combination of mutually ex-clusive categories of accelerometer-measured physicalactivity and sedentary time on physical function andfrailty in a community-dwelling sample of older adults.
MethodsStudy design and participantsThe current study included a sample of 871 community-dwelling older adults (416 women) from wave 2 (2012 to2014) and wave 3 (2015 to 2017) of the Toledo Study forHealthy Aging (TSHA) [14]. The methodology of theTSHA study has been described in detail elsewhere [5,15]. Briefly, the TSHA is a population-based prospectivecohort study originally conceived to explore the determi-nants and consequences of ageing and frailty in olderadults from Toledo, Spain. All participants gave theirwritten informed consent prior enrolment. All proce-dures were approved by the Clinical Research EthicsCommittee of the Toledo Hospital and were conductedin accordance with the Declaration of Helsinki for hu-man studies.
MeasurementsFrailty statusFrailty was assessed by means of the Frailty Trait Scale(FTS) [16]. The FTS includes 7 domains calculated from12 items including energy balance and nutrition,assessed using the body mass index, central obesity(waist circumference), unintentional weight loss andserum albumin levels; activity levels, assessed using thetotal score of the Physical Activity Scale for the Elderly[17]; the nervous system performance, evaluated basedon was verbal fluency (estimated by asking the partici-pants to give names of animals during one minute [18])and balance (Romberg test [19]); the vascular system,measured by the brachial-ankle index done with Dopplerultrasound [20]; weakness, estimated with the gripstrength in the dominant arm and the knee extensionstrength [14]; endurance, assessed by the chair stand
Mañas et al. BMC Geriatrics (2019) 19:270 Page 2 of 9
test, which measures the number of times that a personstands up in 30 s [21]; and slowness, estimated by calcu-lating the time to walk 3m at a “normal pace” accordingto a standard protocol [19]. Scoring is detailed elsewhere[16]. The Total FTS score ranged from 0 (less frailty) to100 (more frailty).
Physical FunctionThe Short Physical Performance Battery (SPPB) wasused to assess physical function in this study [19]. Previ-ous studies have shown that low scores on the SPPBhave a high predictive value for a wide range of healthconsequences comprising disability [22], hospitalization[23], and death [24].The SPPB measures gait speed (8-ft walk), standing
balance, and lower extremity strength and endurance(chair rise task). A maximum of 4 points each for thebalance, chair stand, and gait speed tests may beawarded, for a score between 0 and 12 (best), in whichonly integers are allowed [19].
Physical activity and sedentary time assessmentPhysical activity and sedentary time were assessed viaaccelerometry (ActiTrainer and ActiGraph wGT3X-BT;ActiGraph, LLC, Pensacola, FL). Participants wereinstructed to wear an accelerometer on the left hip dur-ing waking hours for 7 consecutive days and to removethe accelerometer only before going to bed or for wateractivities [25]. A valid day was defined as having ≥480min (≥8 h) of monitor wear, and the study included theresults from participants with at least four valid days[26, 27]. Accelerometer cut-points for sedentary timewere 0–99 cpm, 100–1951 cpm for light physical activ-ity, 1952–5724 cpm for moderate physical activity,and ≥ 5725 cpm for vigorous physical activity based onpreviously established cut-points [28]. These cut-offvalues have been used in previous analyses from theTSHA [5, 15]. In addition, moderate physical activity,vigorous physical activity and MVPA time accumulatedin bouts of ≥10 min, allowing for a two-minute excep-tion in the intensity threshold, were also derived. Thetotal minutes in each intensity band were averaged overthe number of valid days to estimate the mean timespent in each activity band.
Physical activity and sedentary time categoriesdeterminationWe followed the methods outlined in Bakrania et al. [11]to classify participants in this study into 4 mutually ex-clusive behavioural categories according to their levels ofphysical activity and sedentary behaviour. Based on Bak-rania et al. [11], and other studies [12, 29], the lightphysical activity-to-sedentary time ratio was used toclassify participants in this study as low sedentary if they
resided in the first quartile. Given that most of oursample was expected to be sedentary [7, 15], theremaining participants (i.e. those in quartiles 2, 3, and 4of light physical activity-to-sedentary time ratio) wereclassified as high sedentary. MVPA status was classifiedas ‘physically active’ or ‘physically inactive’ on the basisof whether or not participants met the WHO (WorldHealth Organization) physical activity recommendationsfor older adults [30]. For this, at least one of these threepremises had to be met: accumulate 150 min of moder-ate physical activity per week over periods of at least 10min; accumulate 75 min of vigorous physical activity perweek over periods of at least 10 min, or accumulate 150min per week of an equivalent combination of MVPAover periods of at least 10 min.Based on previous studies [31], four groups of mu-
tually exclusive movement patterns were created: [1]‘physically active and low sedentary’, [2] ‘physicallyactive and high sedentary’, [3] ‘physically inactive andlow sedentary’, and [4] ‘physically inactive and highsedentary’.
Confounding variablesParticipants were asked about their age, sex and ethni-city. Other socio-demographic variables such as educa-tion, income, and marital status were also self-reportedin face-to-face interviews as described elsewhere [15].
Statistical analysisAnalyses were performed using the statistical softwareSPSS version 24.0 (IBM Corp., Armonk, NY). Participantcharacteristics of the full sample, stratified by each cat-egory, were tabulated. Mean (standard deviation) andfrequency (percentage) were provided for continuousand categorical variables, respectively. Ternary plots withthe three behaviours were generated to show the distri-bution of the sample compositions using R statisticalsystem version 3.1.1. To test our hypothesis, a multiplelinear regression analysis with the behavioural categoryas independent variable and frailty or physical functionas dependent variable was fitted. Covariates in the modelincluded: age, sex, education, marital status, and income.The ‘physically inactive and high sedentary’ category wasselected as the reference category.Also, the continuous association between time spent in
sedentary activities as well as MVPA with the outcomes ofinterest in the study were explored via regression. Thesame set of covariates in addition to accelerometer weartime as well as both continuous MVPA time and seden-tary status was used.All analyses were two-sided where p ≤ 0.05 was con-
sidered to be statistically significant.
Mañas et al. BMC Geriatrics (2019) 19:270 Page 3 of 9
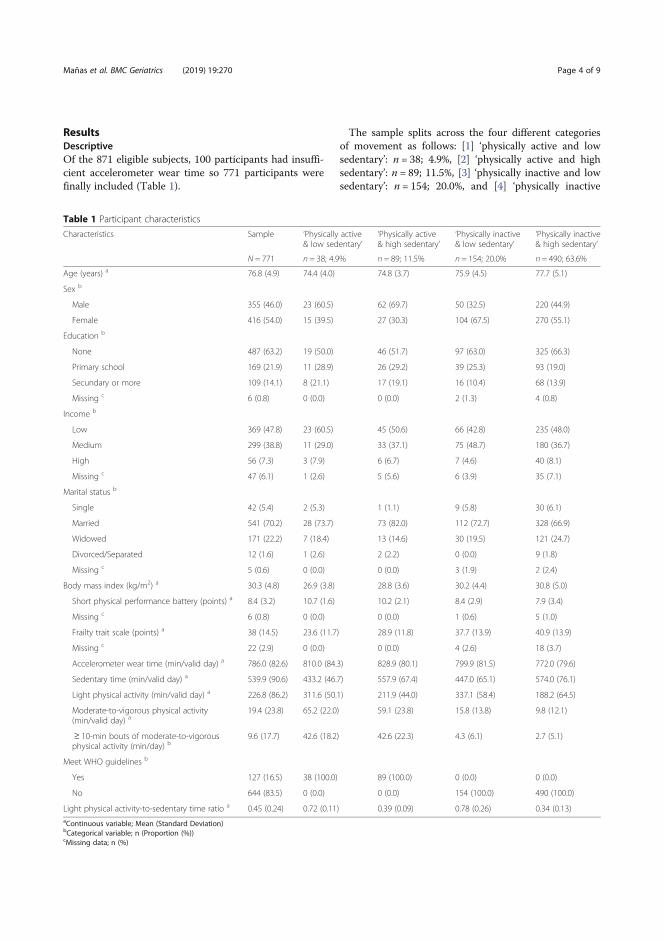
ResultsDescriptiveOf the 871 eligible subjects, 100 participants had insuffi-cient accelerometer wear time so 771 participants werefinally included (Table 1).
The sample splits across the four different categoriesof movement as follows: [1] ‘physically active and lowsedentary’: n = 38; 4.9%, [2] ‘physically active and highsedentary’: n = 89; 11.5%, [3] ‘physically inactive and lowsedentary’: n = 154; 20.0%, and [4] ‘physically inactive
Table 1 Participant characteristics
Characteristics Sample ‘Physically active& low sedentary’
‘Physically active& high sedentary’
‘Physically inactive& low sedentary’
‘Physically inactive& high sedentary’
N = 771 n = 38; 4.9% n = 89; 11.5% n = 154; 20.0% n = 490; 63.6%
Age (years) a 76.8 (4.9) 74.4 (4.0) 74.8 (3.7) 75.9 (4.5) 77.7 (5.1)
Sex b
Male 355 (46.0) 23 (60.5) 62 (69.7) 50 (32.5) 220 (44.9)
Female 416 (54.0) 15 (39.5) 27 (30.3) 104 (67.5) 270 (55.1)
Education b
None 487 (63.2) 19 (50.0) 46 (51.7) 97 (63.0) 325 (66.3)
Primary school 169 (21.9) 11 (28.9) 26 (29.2) 39 (25.3) 93 (19.0)
Secundary or more 109 (14.1) 8 (21.1) 17 (19.1) 16 (10.4) 68 (13.9)
Missing c 6 (0.8) 0 (0.0) 0 (0.0) 2 (1.3) 4 (0.8)
Income b
Low 369 (47.8) 23 (60.5) 45 (50.6) 66 (42.8) 235 (48.0)
Medium 299 (38.8) 11 (29.0) 33 (37.1) 75 (48.7) 180 (36.7)
High 56 (7.3) 3 (7.9) 6 (6.7) 7 (4.6) 40 (8.1)
Missing c 47 (6.1) 1 (2.6) 5 (5.6) 6 (3.9) 35 (7.1)
Marital status b
Single 42 (5.4) 2 (5.3) 1 (1.1) 9 (5.8) 30 (6.1)
Married 541 (70.2) 28 (73.7) 73 (82.0) 112 (72.7) 328 (66.9)
Widowed 171 (22.2) 7 (18.4) 13 (14.6) 30 (19.5) 121 (24.7)
Divorced/Separated 12 (1.6) 1 (2.6) 2 (2.2) 0 (0.0) 9 (1.8)
Missing c 5 (0.6) 0 (0.0) 0 (0.0) 3 (1.9) 2 (2.4)
Body mass index (kg/m2) a 30.3 (4.8) 26.9 (3.8) 28.8 (3.6) 30.2 (4.4) 30.8 (5.0)
Short physical performance battery (points) a 8.4 (3.2) 10.7 (1.6) 10.2 (2.1) 8.4 (2.9) 7.9 (3.4)
Missing c 6 (0.8) 0 (0.0) 0 (0.0) 1 (0.6) 5 (1.0)
Frailty trait scale (points) a 38 (14.5) 23.6 (11.7) 28.9 (11.8) 37.7 (13.9) 40.9 (13.9)
Missing c 22 (2.9) 0 (0.0) 0 (0.0) 4 (2.6) 18 (3.7)
Accelerometer wear time (min/valid day) a 786.0 (82.6) 810.0 (84.3) 828.9 (80.1) 799.9 (81.5) 772.0 (79.6)
Sedentary time (min/valid day) a 539.9 (90.6) 433.2 (46.7) 557.9 (67.4) 447.0 (65.1) 574.0 (76.1)
Light physical activity (min/valid day) a 226.8 (86.2) 311.6 (50.1) 211.9 (44.0) 337.1 (58.4) 188.2 (64.5)
Moderate-to-vigorous physical activity(min/valid day) a
19.4 (23.8) 65.2 (22.0) 59.1 (23.8) 15.8 (13.8) 9.8 (12.1)
≥ 10-min bouts of moderate-to-vigorousphysical activity (min/day) b
9.6 (17.7) 42.6 (18.2) 42.6 (22.3) 4.3 (6.1) 2.7 (5.1)
Meet WHO guidelines b
Yes 127 (16.5) 38 (100.0) 89 (100.0) 0 (0.0) 0 (0.0)
No 644 (83.5) 0 (0.0) 0 (0.0) 154 (100.0) 490 (100.0)
Light physical activity-to-sedentary time ratio a 0.45 (0.24) 0.72 (0.11) 0.39 (0.09) 0.78 (0.26) 0.34 (0.13)aContinuous variable; Mean (Standard Deviation)bCategorical variable; n (Proportion (%))cMissing data; n (%)
Mañas et al. BMC Geriatrics (2019) 19:270 Page 4 of 9
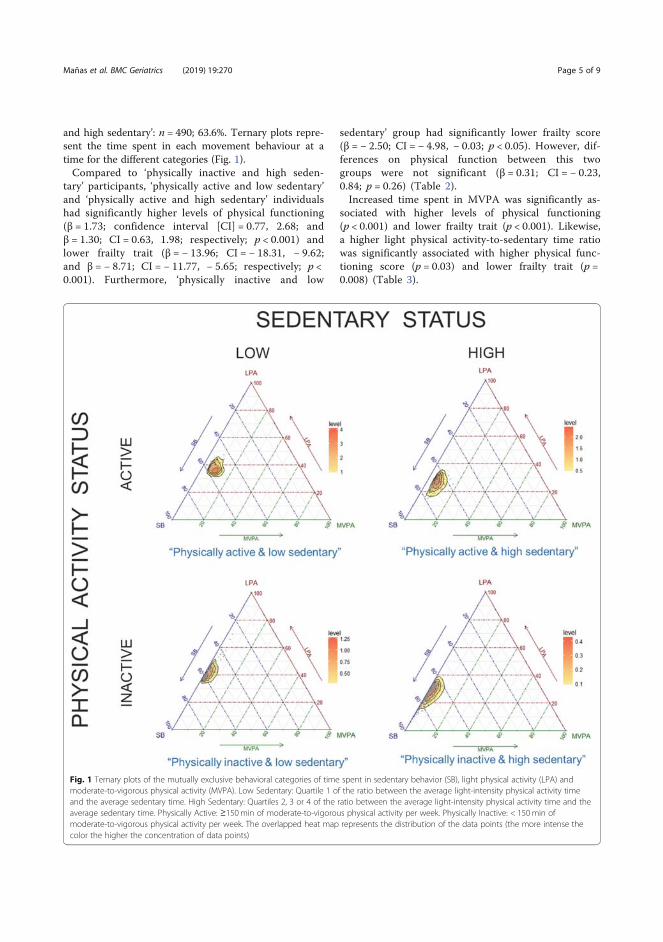
and high sedentary’: n = 490; 63.6%. Ternary plots repre-sent the time spent in each movement behaviour at atime for the different categories (Fig. 1).Compared to ‘physically inactive and high seden-
tary’ participants, ‘physically active and low sedentary’and ‘physically active and high sedentary’ individualshad significantly higher levels of physical functioning(β = 1.73; confidence interval [CI] = 0.77, 2.68; andβ = 1.30; CI = 0.63, 1.98; respectively; p < 0.001) andlower frailty trait (β = − 13.96; CI = − 18.31, − 9.62;and β = − 8.71; CI = − 11.77, − 5.65; respectively; p <0.001). Furthermore, ‘physically inactive and low
sedentary’ group had significantly lower frailty score(β = − 2.50; CI = − 4.98, − 0.03; p < 0.05). However, dif-ferences on physical function between this twogroups were not significant (β = 0.31; CI = − 0.23,0.84; p = 0.26) (Table 2).Increased time spent in MVPA was significantly as-
sociated with higher levels of physical functioning(p < 0.001) and lower frailty trait (p < 0.001). Likewise,a higher light physical activity-to-sedentary time ratiowas significantly associated with higher physical func-tioning score (p = 0.03) and lower frailty trait (p =0.008) (Table 3).
Fig. 1 Ternary plots of the mutually exclusive behavioral categories of time spent in sedentary behavior (SB), light physical activity (LPA) andmoderate-to-vigorous physical activity (MVPA). Low Sedentary: Quartile 1 of the ratio between the average light-intensity physical activity timeand the average sedentary time. High Sedentary: Quartiles 2, 3 or 4 of the ratio between the average light-intensity physical activity time and theaverage sedentary time. Physically Active: ≥150min of moderate-to-vigorous physical activity per week. Physically Inactive: < 150min ofmoderate-to-vigorous physical activity per week. The overlapped heat map represents the distribution of the data points (the more intense thecolor the higher the concentration of data points)
Mañas et al. BMC Geriatrics (2019) 19:270 Page 5 of 9
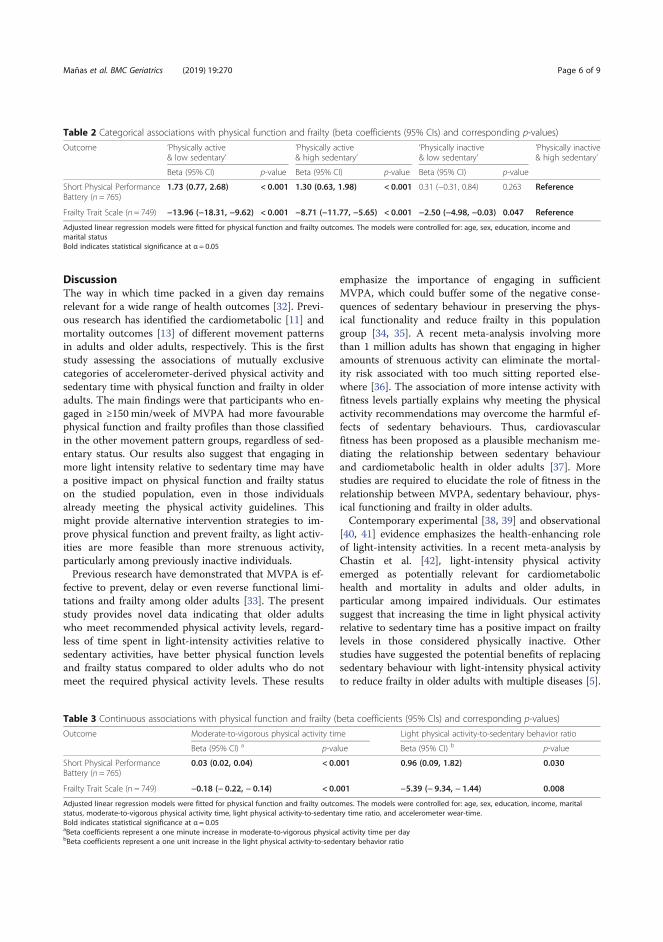
DiscussionThe way in which time packed in a given day remainsrelevant for a wide range of health outcomes [32]. Previ-ous research has identified the cardiometabolic [11] andmortality outcomes [13] of different movement patternsin adults and older adults, respectively. This is the firststudy assessing the associations of mutually exclusivecategories of accelerometer-derived physical activity andsedentary time with physical function and frailty in olderadults. The main findings were that participants who en-gaged in ≥150 min/week of MVPA had more favourablephysical function and frailty profiles than those classifiedin the other movement pattern groups, regardless of sed-entary status. Our results also suggest that engaging inmore light intensity relative to sedentary time may havea positive impact on physical function and frailty statuson the studied population, even in those individualsalready meeting the physical activity guidelines. Thismight provide alternative intervention strategies to im-prove physical function and prevent frailty, as light activ-ities are more feasible than more strenuous activity,particularly among previously inactive individuals.Previous research have demonstrated that MVPA is ef-
fective to prevent, delay or even reverse functional limi-tations and frailty among older adults [33]. The presentstudy provides novel data indicating that older adultswho meet recommended physical activity levels, regard-less of time spent in light-intensity activities relative tosedentary activities, have better physical function levelsand frailty status compared to older adults who do notmeet the required physical activity levels. These results
emphasize the importance of engaging in sufficientMVPA, which could buffer some of the negative conse-quences of sedentary behaviour in preserving the phys-ical functionality and reduce frailty in this populationgroup [34, 35]. A recent meta-analysis involving morethan 1 million adults has shown that engaging in higheramounts of strenuous activity can eliminate the mortal-ity risk associated with too much sitting reported else-where [36]. The association of more intense activity withfitness levels partially explains why meeting the physicalactivity recommendations may overcome the harmful ef-fects of sedentary behaviours. Thus, cardiovascularfitness has been proposed as a plausible mechanism me-diating the relationship between sedentary behaviourand cardiometabolic health in older adults [37]. Morestudies are required to elucidate the role of fitness in therelationship between MVPA, sedentary behaviour, phys-ical functioning and frailty in older adults.Contemporary experimental [38, 39] and observational
[40, 41] evidence emphasizes the health-enhancing roleof light-intensity activities. In a recent meta-analysis byChastin et al. [42], light-intensity physical activityemerged as potentially relevant for cardiometabolichealth and mortality in adults and older adults, inparticular among impaired individuals. Our estimatessuggest that increasing the time in light physical activityrelative to sedentary time has a positive impact on frailtylevels in those considered physically inactive. Otherstudies have suggested the potential benefits of replacingsedentary behaviour with light-intensity physical activityto reduce frailty in older adults with multiple diseases [5].
Table 2 Categorical associations with physical function and frailty (beta coefficients (95% CIs) and corresponding p-values)
Outcome ‘Physically active& low sedentary’
‘Physically active& high sedentary’
‘Physically inactive& low sedentary’
‘Physically inactive& high sedentary’
Beta (95% CI) p-value Beta (95% CI) p-value Beta (95% CI) p-value
Short Physical PerformanceBattery (n = 765)
1.73 (0.77, 2.68) < 0.001 1.30 (0.63, 1.98) < 0.001 0.31 (−0.31, 0.84) 0.263 Reference
Frailty Trait Scale (n = 749) −13.96 (−18.31, −9.62) < 0.001 −8.71 (−11.77, −5.65) < 0.001 −2.50 (−4.98, −0.03) 0.047 Reference
Adjusted linear regression models were fitted for physical function and frailty outcomes. The models were controlled for: age, sex, education, income andmarital statusBold indicates statistical significance at α = 0.05
Table 3 Continuous associations with physical function and frailty (beta coefficients (95% CIs) and corresponding p-values)
Outcome Moderate-to-vigorous physical activity time Light physical activity-to-sedentary behavior ratio
Beta (95% CI) a p-value Beta (95% CI) b p-value
Short Physical PerformanceBattery (n = 765)
0.03 (0.02, 0.04) < 0.001 0.96 (0.09, 1.82) 0.030
Frailty Trait Scale (n = 749) −0.18 (− 0.22, − 0.14) < 0.001 −5.39 (− 9.34, − 1.44) 0.008
Adjusted linear regression models were fitted for physical function and frailty outcomes. The models were controlled for: age, sex, education, income, maritalstatus, moderate-to-vigorous physical activity time, light physical activity-to-sedentary time ratio, and accelerometer wear-time.Bold indicates statistical significance at α = 0.05aBeta coefficients represent a one minute increase in moderate-to-vigorous physical activity time per daybBeta coefficients represent a one unit increase in the light physical activity-to-sedentary behavior ratio
Mañas et al. BMC Geriatrics (2019) 19:270 Page 6 of 9
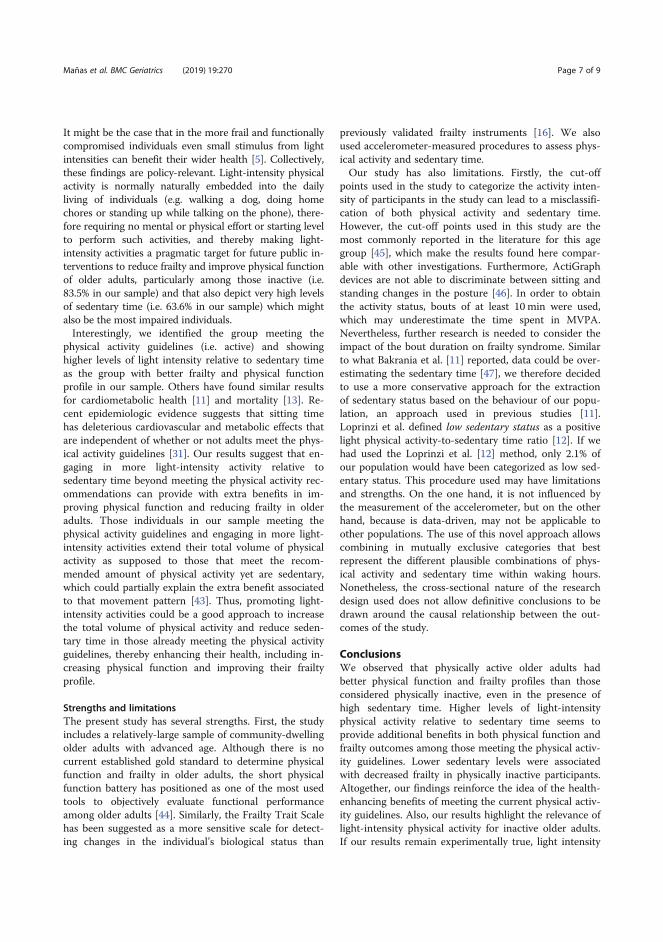
It might be the case that in the more frail and functionallycompromised individuals even small stimulus from lightintensities can benefit their wider health [5]. Collectively,these findings are policy-relevant. Light-intensity physicalactivity is normally naturally embedded into the dailyliving of individuals (e.g. walking a dog, doing homechores or standing up while talking on the phone), there-fore requiring no mental or physical effort or starting levelto perform such activities, and thereby making light-intensity activities a pragmatic target for future public in-terventions to reduce frailty and improve physical functionof older adults, particularly among those inactive (i.e.83.5% in our sample) and that also depict very high levelsof sedentary time (i.e. 63.6% in our sample) which mightalso be the most impaired individuals.Interestingly, we identified the group meeting the
physical activity guidelines (i.e. active) and showinghigher levels of light intensity relative to sedentary timeas the group with better frailty and physical functionprofile in our sample. Others have found similar resultsfor cardiometabolic health [11] and mortality [13]. Re-cent epidemiologic evidence suggests that sitting timehas deleterious cardiovascular and metabolic effects thatare independent of whether or not adults meet the phys-ical activity guidelines [31]. Our results suggest that en-gaging in more light-intensity activity relative tosedentary time beyond meeting the physical activity rec-ommendations can provide with extra benefits in im-proving physical function and reducing frailty in olderadults. Those individuals in our sample meeting thephysical activity guidelines and engaging in more light-intensity activities extend their total volume of physicalactivity as supposed to those that meet the recom-mended amount of physical activity yet are sedentary,which could partially explain the extra benefit associatedto that movement pattern [43]. Thus, promoting light-intensity activities could be a good approach to increasethe total volume of physical activity and reduce seden-tary time in those already meeting the physical activityguidelines, thereby enhancing their health, including in-creasing physical function and improving their frailtyprofile.
Strengths and limitationsThe present study has several strengths. First, the studyincludes a relatively-large sample of community-dwellingolder adults with advanced age. Although there is nocurrent established gold standard to determine physicalfunction and frailty in older adults, the short physicalfunction battery has positioned as one of the most usedtools to objectively evaluate functional performanceamong older adults [44]. Similarly, the Frailty Trait Scalehas been suggested as a more sensitive scale for detect-ing changes in the individual’s biological status than
previously validated frailty instruments [16]. We alsoused accelerometer-measured procedures to assess phys-ical activity and sedentary time.Our study has also limitations. Firstly, the cut-off
points used in the study to categorize the activity inten-sity of participants in the study can lead to a misclassifi-cation of both physical activity and sedentary time.However, the cut-off points used in this study are themost commonly reported in the literature for this agegroup [45], which make the results found here compar-able with other investigations. Furthermore, ActiGraphdevices are not able to discriminate between sitting andstanding changes in the posture [46]. In order to obtainthe activity status, bouts of at least 10 min were used,which may underestimate the time spent in MVPA.Nevertheless, further research is needed to consider theimpact of the bout duration on frailty syndrome. Similarto what Bakrania et al. [11] reported, data could be over-estimating the sedentary time [47], we therefore decidedto use a more conservative approach for the extractionof sedentary status based on the behaviour of our popu-lation, an approach used in previous studies [11].Loprinzi et al. defined low sedentary status as a positivelight physical activity-to-sedentary time ratio [12]. If wehad used the Loprinzi et al. [12] method, only 2.1% ofour population would have been categorized as low sed-entary status. This procedure used may have limitationsand strengths. On the one hand, it is not influenced bythe measurement of the accelerometer, but on the otherhand, because is data-driven, may not be applicable toother populations. The use of this novel approach allowscombining in mutually exclusive categories that bestrepresent the different plausible combinations of phys-ical activity and sedentary time within waking hours.Nonetheless, the cross-sectional nature of the researchdesign used does not allow definitive conclusions to bedrawn around the causal relationship between the out-comes of the study.
ConclusionsWe observed that physically active older adults hadbetter physical function and frailty profiles than thoseconsidered physically inactive, even in the presence ofhigh sedentary time. Higher levels of light-intensityphysical activity relative to sedentary time seems toprovide additional benefits in both physical function andfrailty outcomes among those meeting the physical activ-ity guidelines. Lower sedentary levels were associatedwith decreased frailty in physically inactive participants.Altogether, our findings reinforce the idea of the health-enhancing benefits of meeting the current physical activ-ity guidelines. Also, our results highlight the relevance oflight-intensity physical activity for inactive older adults.If our results remain experimentally true, light intensity
Mañas et al. BMC Geriatrics (2019) 19:270 Page 7 of 9
physical activity can be promoted as a middle stepintervention among inactive individuals to achieve therecommended levels of physical activity and improvetheir health. We should move beyond observationalstudies and confirm our results in well-design longitu-dinal, experimental studies.
AbbreviationsFTS: Frailty Trait Scale; MVPA: Moderate-to-Vigorous Physical Activity;SPPB: Short Physical Performance Battery; TSHA: Toledo Study for HealthyAging; WHO: World Health Organization
AcknowledgementsThe authors would like to thank the cohort members, investigators, researchassociates, and team members.
Authors’ contributionsAM: conceptualization, investigation, data curation, formal analysis, writingoriginal draft preparation; BdPC, IRG, JLM & JLR: investigation, data curation,writing/review & editing; LRM, FJGG & IA: funding acquisition, writing/review& editing; AM, BdPC and IA performed the statistical analyses and areguarantors. All the authors read the draft, made contributions and approvedthe final manuscript.
FundingThis work was supported by the Biomedical Research Networking Center onFrailty and Healthy Aging (CIBERFES) and FEDER funds from the EuropeanUnion (CB16/10/00477) and (CB16/10/00456). It was further funded by grantsfrom the Government of Castilla-La Mancha (PI2010/020; Institute of HealthSciences, Ministry of Health of Castilla-La Mancha, 03031–00), Spanish Gov-ernment (Spanish Ministry of Economy, “Ministerio de Economía y Competiti-vidad,” Instituto de Salud Carlos III, PI10/01532, PI031558, PI11/01068), and byEuropean Grants (Seventh Framework Programme: FRAILOMIC). Asier MañasBote and Irene Rodríguez Gómez received a PhD grant from the Universidadde Castilla-La Mancha “Contratos predoctorales para la formación de per-sonal investigador en el marco del Plan Propio de I+D+i, cofinanciados porel Fondo Social Europeo” (2015/4062 and 2014/10340, respectively). Thesefunding bodies played no role in the design of the study, collection, analysis,and interpretation of data or in writing the manuscript.
Availability of data and materialsThere is an established infrastructure, including a website (http://http://www.ciberfes.es/) and a review committee, through which data requests arehandled. The hospital reviews and determines the purposes for the datarequests and what data can be released. Data requests can be sent to:Research and teaching unit, Virgen del Valle Hospital Ctra. Cobisa S/N, 45071Toledo – Spain, [email protected].
Ethics approval and consent to participateAll participants volunteered and signed an informed consent. All theobjectives, physical tests, and aspects related to the methodology wereexplained orally and in writing. Data confidentiality and anonymity wereguaranteed in all phases of the study following the 2009 law regulatingpersonal data protection. The study was approved by the appropriate EthicsCommittee (The Clinical Research Ethics Committee of the Toledo Hospital –June 2012).
Consent for publicationNot applicable.
Competing interestsThe authors declare that they have no competing interests.
Author details1GENUD Toledo Research Group, Universidad de Castilla-La Mancha, Avda.Carlos III s/n, 45071 Toledo, Spain. 2CIBER of Frailty and Healthy Aging(CIBERFES), Madrid, Spain. 3Motivation and Behaviour Research Program,Institute for Positive Psychology and Education, Faculty of Health Sciences,Australian Catholic University, Sydney, Australia. 4Geriatric Department,
Hospital Virgen del Valle, Toledo, Spain. 5Geriatric Department, HospitalUniversitario de Getafe, Getafe, Spain.
Received: 22 January 2019 Accepted: 16 September 2019
References1. Pahor M, Guralnik JM, Ambrosius WT, Blair S, Bonds DE, Church TS, et al.
Effect of structured physical activity on prevention of major mobilitydisability in older adults: the LIFE study randomized clinical trial. Jama. 2014;311(23):2387–96.
2. Puts MTE, Toubasi S, Andrew MK, Ashe MC, Ploeg J, Atkinson E, et al.Interventions to prevent or reduce the level of frailty in community-dwelling older adults: a scoping review of the literature and internationalpolicies. Age Ageing. 2017;46(3):383–92.
3. Daly RM, Ahlborg HG, Ringsberg K, Gardsell P, Sernbo I, Karlsson MK.Association between changes in habitual physical activity and changes inbone density, muscle strength, and functional performance in elderly menand women. J Am Geriatr Soc. 2008;56(12):2252–60.
4. Blodgett J, Theou O, Kirkland S, Andreou P, Rockwood K. The associationbetween sedentary behaviour, moderate-vigorous physical activity andfrailty in NHANES cohorts. Maturitas. 2015;80(2):187–91.
5. Manas A, Del Pozo-Cruz B, Guadalupe-Grau A, Marin-Puyalto J, Alfaro-AchaA, Rodriguez-Manas L, et al. Reallocating Accelerometer-Assessed SedentaryTime to Light or Moderate- to Vigorous-Intensity Physical Activity ReducesFrailty Levels in Older Adults: An Isotemporal Substitution Approach in theTSHA Study. J Am Med Dir Assoc. 2018;19(2):185 e1–6.
6. Sun F, Norman IJ, While AE. Physical activity in older people: a systematicreview. BMC public health. 2013;13:449.
7. Matthews CE, Chen KY, Freedson PS, Buchowski MS, Beech BM, Pate RR,et al. Amount of time spent in sedentary behaviors in the United States,2003-2004. Am J Epidemiol. 2008;167(7):875–81.
8. Del Pozo-Cruz B, Manas A, Martin-Garcia M, Marin-Puyalto J, Garcia-Garcia FJ,Rodriguez-Manas L, et al. Frailty is associated with objectively assessedsedentary behaviour patterns in older adults: evidence from the Toledostudy for healthy aging (TSHA). PLoS One. 2017;12(9):e0183911.
9. Kehler DS, Clara I, Hiebert B, Stammers AN, Hay JL, Schultz A, et al. Theassociation between bouts of moderate to vigorous physical activity andpatterns of sedentary behavior with frailty. Exp Gerontol. 2018;104:28–34.
10. Manas A, Del Pozo-Cruz B, Garcia-Garcia FJ, Guadalupe-Grau A, Ara I. Role ofobjectively measured sedentary behaviour in physical performance, frailtyand mortality among older adults: a short systematic review. Eur J Sport Sci.2017;17(7):940–53.
11. Bakrania K, Edwardson CL, Bodicoat DH, Esliger DW, Gill JM, Kazi A,et al. Associations of mutually exclusive categories of physical activityand sedentary time with markers of cardiometabolic health in Englishadults: a cross-sectional analysis of the health survey for England. BMCPublic Health. 2016;16:25.
12. Loprinzi PD, Lee H, Cardinal BJ. Daily movement patterns and biologicalmarkers among adults in the United States. Prev Med. 2014;60:128–30.
13. Bayán-Bravo A, Pérez-Tasigchana RF, López-García E, Martínez-Gómez D,Rodríguez-Artalejo F, Guallar-Castillón P. The association of major patterns ofphysical activity, sedentary behavior and sleeping with mortality in olderadults. J Sports Sci. 2018:1–10.
14. Garcia-Garcia FJ, Gutierrez Avila G, Alfaro-Acha A, Amor Andres MS, Lanza MDLADLT, Escribano Aparicio MV, et al. The prevalence of frailty syndrome inan older population from Spain. The Toledo study for healthy aging. J NutrHealth Aging. 2011;15(10):852–6.
15. Manas A, Pozo-Cruz BD, Rodriguez-Gomez I, Losa-Reyna J, Rodriguez-Manas L, Garcia-Garcia FJ, et al. Can physical activity offset thedetrimental consequences of sedentary time on frailty? A moderationanalysis in 749 older adults measured with accelerometers. J Am MedDir Assoc. 2019.
16. Garcia-Garcia FJ, Carcaillon L, Fernandez-Tresguerres J, Alfaro A, Larrion JL,Castillo C, et al. A new operational definition of frailty: the Frailty Trait Scale.J Am Med Dir Assoc. 2014;15(5):371.e7–e13.
17. Schuit AJ, Schouten EG, Westerterp KR, Saris WH. Validity of thephysical activity scale for the elderly (PASE): according to energyexpenditure assessed by the doubly labeled water method. J ClinEpidemiol. 1997;50(5):541–6.
Mañas et al. BMC Geriatrics (2019) 19:270 Page 8 of 9
18. del Ser Quijano T, Sanchez Sanchez F, Garcia de Yebenes MJ, Otero PuimeA, Zunzunegui MV, Munoz DG. [Spanish version of the 7 Minute screeningneurocognitive battery. Normative data of an elderly population sampleover 70]. Neurologia (Barcelona, Spain). 2004;19(7):344–358.
19. Guralnik JM, Simonsick EM, Ferrucci L, Glynn RJ, Berkman LF, Blazer DG,et al. A short physical performance battery assessing lower extremityfunction: association with self-reported disability and prediction of mortalityand nursing home admission. J Gerontol. 1994;49(2):M85–94.
20. Fowkes FG, Low LP, Tuta S, Kozak J. Ankle-brachial index and extent ofatherothrombosis in 8891 patients with or at risk of vascular disease: resultsof the international AGATHA study. Eur Heart J. 2006;27(15):1861–7.
21. Jones CJ, Rikli RE, Beam WC. A 30-s chair-stand test as a measure oflower body strength in community-residing older adults. Res Q ExercSport. 1999;70(2):113–9.
22. Guralnik JM, Ferrucci L, Pieper CF, Leveille SG, Markides KS, Ostir GV,et al. Lower extremity function and subsequent disability: consistencyacross studies, predictive models, and value of gait speed alonecompared with the short physical performance battery. J Gerontol ABiol Sci Med Sci. 2000;55(4):M221–31.
23. Penninx BW, Ferrucci L, Leveille SG, Rantanen T, Pahor M, Guralnik JM.Lower extremity performance in nondisabled older persons as apredictor of subsequent hospitalization. J Gerontol A Biol Sci Med Sci.2000;55(11):M691–7.
24. Cesari M, Onder G, Zamboni V, Manini T, Shorr RI, Russo A, et al. Physicalfunction and self-rated health status as predictors of mortality: results fromlongitudinal analysis in the ilSIRENTE study. BMC Geriatr. 2008;8:34.
25. Rodríguez-Gómez I, Mañas A, Losa-Reyna J, Rodríguez-Mañas L, Chastin S,Alegre L, et al. Associations between sedentary time, physical activity andbone health among older people using compositional data analysis. PloSone. 2018;13(10):e0206013-e.
26. Chudyk AM, McAllister MM, Cheung HK, McKay HA, Ashe MC. Are wemissing the sitting? Agreement between accelerometer non-wear timevalidation methods used with older adults' data. Cogent Med. 2017;4:1313505.
27. Rodríguez-Gómez I, Mañas A, Losa-Reyna J, Rodríguez-Mañas L, Chastin SF,Alegre LM, et al. The impact of movement behaviors on bone health inelderly with adequate nutritional status: compositional data analysisdepending on the frailty status. Nutrients. 2019;11(3):582.
28. Freedson PS, Melanson E, Sirard J. Calibration of the computer science andapplications, Inc. accelerometer. Med Sci Sports Exerc. 1998;30(5):777–81.
29. Kozakova M, Palombo C, Morizzo C, Nolan JJ, Konrad T, Balkau B, et al. Effectof sedentary behaviour and vigorous physical activity on segment-specificcarotid wall thickness and its progression in a healthy population. Eur HeartJ. 2010;31(12):1511–9.
30. World Health Organization. Global Recommendations on Physical Activityfor Health. WHO Press. Geneva: World Health Organization; 2010.
31. Hamilton MT, Healy GN, Dunstan DW, Zderic TW, Owen N. Too littleexercise and too much sitting: inactivity physiology and the need for newrecommendations on sedentary behavior. Current cardiovascular riskreports. 2008;2(4):292–8.
32. Chastin SFM, Palarea-Albaladejo J, Dontje ML, Skelton DA. Combined effectsof time spent in physical activity, sedentary behaviors and sleep on obesityand cardio-metabolic health markers: a novel compositional data analysisapproach. PLoS One. 2015;10(10):e0139984.
33. Fried LP. Interventions for Human Frailty: Physical Activity as a Model. ColdSpring Harb Perspect Med. 2016;6(6).
34. Santos DA, Silva AM, Baptista F, Santos R, Vale S, Mota J, et al. Sedentarybehavior and physical activity are independently related to functionalfitness in older adults. Exp Gerontol. 2012;47(12):908–12.
35. Trudelle-Jackson E, Jackson AW. Do Older Adults Who Meet 2008 PhysicalActivity Guidelines Have Better Physical Performance Than Those Who DoNot Meet? J Geriatr Phys Ther (2001). 2018;41(3):180–185.
36. Ekelund U, Steene-Johannessen J, Brown WJ, Fagerland MW, Owen N,Powell KE, et al. Does physical activity attenuate, or even eliminate, thedetrimental association of sitting time with mortality? A harmonised meta-analysis of data from more than 1 million men and women. Lancet(London, England). 2016;388(10051):1302–1310.
37. Pollock RD, Duggal NA, Lazarus NR, Lord JM, Harridge SDR. Cardiorespiratoryfitness not sedentary time or physical activity is associated withcardiometabolic risk in active older adults. Scand J Med Sci Sports. 2018;28(6):1653–60.
38. Dunstan DW, Kingwell BA, Larsen R, Healy GN, Cerin E, Hamilton MT, et al.Breaking up prolonged sitting reduces postprandial glucose and insulinresponses. Diabetes Care. 2012;35(5):976–83.
39. McCarthy M, Edwardson CL, Davies MJ, Henson J, Bodicoat DH, Khunti K,et al. Fitness moderates glycemic responses to sitting and light activitybreaks. Med Sci Sports Exerc. 2017;49(11):2216–22.
40. Buman MP, Hekler EB, Haskell WL, Pruitt L, Conway TL, Cain KL, et al.Objective light-intensity physical activity associations with rated health inolder adults. Am J Epidemiol. 2010;172(10):1155–65.
41. Hamer M, de Oliveira C, Demakakos P. Non-exercise physical activityand survival: English longitudinal study of ageing. Am J Prev Med.2014;47(4):452–60.
42. Chastin SFM, De Craemer M, De Cocker K, Powell L, Van Cauwenberg J, DallP, et al. How does light-intensity physical activity associate with adultcardiometabolic health and mortality? Systematic review with meta-analysisof experimental and observational studies. Br J Sports Med. 2018.
43. Wolff-Hughes DL, Fitzhugh EC, Bassett DR, Churilla JR. Total activity countsand Bouted minutes of moderate-to-vigorous physical activity: relationshipswith Cardiometabolic biomarkers using 2003-2006 NHANES. J Phys ActHealth. 2015;12(5):694–700.
44. Pavasini R, Guralnik J, Brown JC, di Bari M, Cesari M, Landi F, et al. Shortphysical performance battery and all-cause mortality: systematic review andmeta-analysis. BMC Med. 2016;14:215.
45. Migueles JH, Cadenas-Sanchez C, Ekelund U, Delisle Nystrom C, Mora-Gonzalez J, Lof M, et al. Accelerometer Data Collection and ProcessingCriteria to Assess Physical Activity and Other Outcomes: A SystematicReview and Practical Considerations. Sports medicine (Auckland, NZ). 2017.
46. An HS, Kim Y, Lee JM. Accuracy of inclinometer functions of theactivPAL and ActiGraph GT3X+: a focus on physical activity. Gait &posture. 2017;51:174–80.
47. Judice PB, Santos DA, Hamilton MT, Sardinha LB, Silva AM. Validity of GT3Xand Actiheart to estimate sedentary time and breaks using ActivPAL as thereference in free-living conditions. Gait & posture. 2015;41(4):917–22.
Publisher’s NoteSpringer Nature remains neutral with regard to jurisdictional claims inpublished maps and institutional affiliations.
Mañas et al. BMC Geriatrics (2019) 19:270 Page 9 of 9

RESULTS
204
RESULTS
205
5.5. STUDY 5
“Can Physical Activity Offset the
Detrimental Consequences of
Sedentary Time on Frailty? A
Moderation Analysis in 749 Older
Adults Measured With
Accelerometers”

RESULTS
206
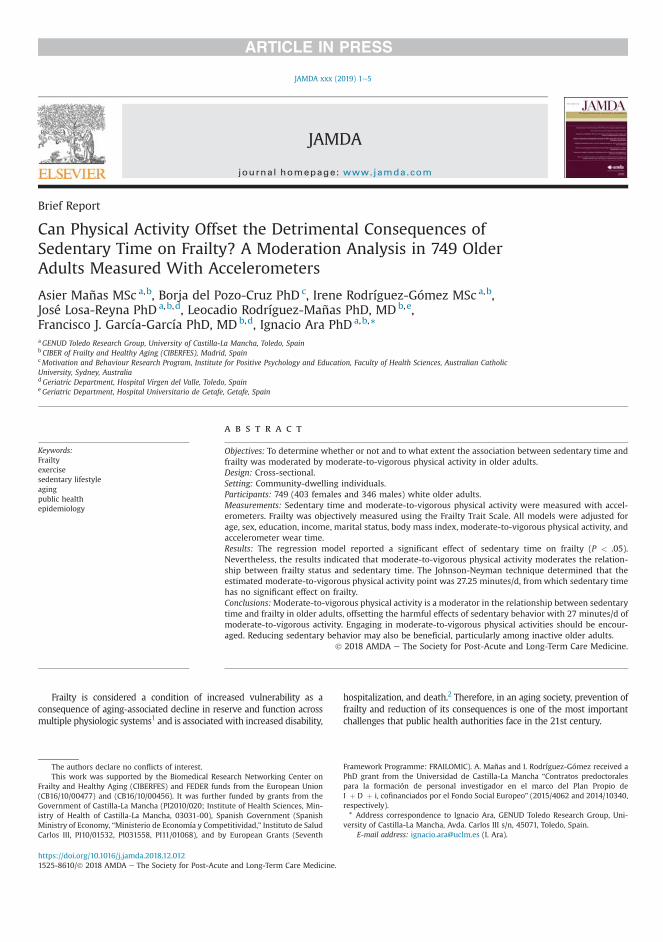
Brief Report
Can Physical Activity Offset the Detrimental Consequences ofSedentary Time on Frailty? A Moderation Analysis in 749 OlderAdults Measured With Accelerometers
Asier Mañas MSc a,b, Borja del Pozo-Cruz PhD c, Irene Rodríguez-Gómez MSc a,b,José Losa-Reyna PhD a,b,d, Leocadio Rodríguez-Mañas PhD, MDb,e,Francisco J. García-García PhD, MDb,d, Ignacio Ara PhD a,b,*aGENUD Toledo Research Group, University of Castilla-La Mancha, Toledo, SpainbCIBER of Frailty and Healthy Aging (CIBERFES), Madrid, SpaincMotivation and Behaviour Research Program, Institute for Positive Psychology and Education, Faculty of Health Sciences, Australian CatholicUniversity, Sydney, AustraliadGeriatric Department, Hospital Virgen del Valle, Toledo, SpaineGeriatric Department, Hospital Universitario de Getafe, Getafe, Spain
Keywords:Frailtyexercisesedentary lifestyleagingpublic healthepidemiology
a b s t r a c t
Objectives: To determine whether or not and to what extent the association between sedentary time andfrailty was moderated by moderate-to-vigorous physical activity in older adults.Design: Cross-sectional.Setting: Community-dwelling individuals.Participants: 749 (403 females and 346 males) white older adults.Measurements: Sedentary time and moderate-to-vigorous physical activity were measured with accel-erometers. Frailty was objectively measured using the Frailty Trait Scale. All models were adjusted forage, sex, education, income, marital status, body mass index, moderate-to-vigorous physical activity, andaccelerometer wear time.Results: The regression model reported a significant effect of sedentary time on frailty (P < .05).Nevertheless, the results indicated that moderate-to-vigorous physical activity moderates the relation-ship between frailty status and sedentary time. The Johnson-Neyman technique determined that theestimated moderate-to-vigorous physical activity point was 27.25 minutes/d, fromwhich sedentary timehas no significant effect on frailty.Conclusions:Moderate-to-vigorous physical activity is a moderator in the relationship between sedentarytime and frailty in older adults, offsetting the harmful effects of sedentary behavior with 27 minutes/d ofmoderate-to-vigorous activity. Engaging in moderate-to-vigorous physical activities should be encour-aged. Reducing sedentary behavior may also be beneficial, particularly among inactive older adults.
� 2018 AMDA e The Society for Post-Acute and Long-Term Care Medicine.
Frailty is considered a condition of increased vulnerability as aconsequence of aging-associated decline in reserve and function acrossmultiple physiologic systems1 and is associated with increased disability,
hospitalization, and death.2 Therefore, in an aging society, prevention offrailty and reduction of its consequences is one of the most importantchallenges that public health authorities face in the 21st century.
The authors declare no conflicts of interest.This work was supported by the Biomedical Research Networking Center on
Frailty and Healthy Aging (CIBERFES) and FEDER funds from the European Union(CB16/10/00477) and (CB16/10/00456). It was further funded by grants from theGovernment of Castilla-La Mancha (PI2010/020; Institute of Health Sciences, Min-istry of Health of Castilla-La Mancha, 03031-00), Spanish Government (SpanishMinistry of Economy, “Ministerio de Economía y Competitividad,” Instituto de SaludCarlos III, PI10/01532, PI031558, PI11/01068), and by European Grants (Seventh
Framework Programme: FRAILOMIC). A. Mañas and I. Rodríguez-Gómez received aPhD grant from the Universidad de Castilla-La Mancha “Contratos predoctoralespara la formación de personal investigador en el marco del Plan Propio deI þ D þ i, cofinanciados por el Fondo Social Europeo” (2015/4062 and 2014/10340,respectively).* Address correspondence to Ignacio Ara, GENUD Toledo Research Group, Uni-
versity of Castilla-La Mancha, Avda. Carlos III s/n, 45071, Toledo, Spain.E-mail address: [email protected] (I. Ara).
https://doi.org/10.1016/j.jamda.2018.12.0121525-8610/� 2018 AMDA e The Society for Post-Acute and Long-Term Care Medicine.
JAMDA
journal homepage: www.jamda.com
JAMDA xxx (2019) 1e5
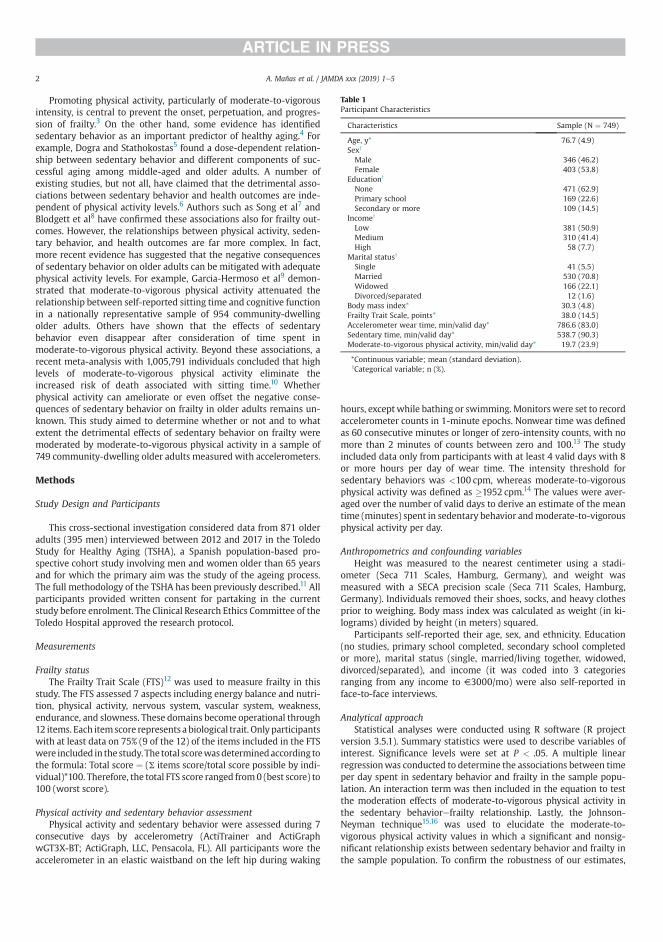
Promoting physical activity, particularly of moderate-to-vigorousintensity, is central to prevent the onset, perpetuation, and progres-sion of frailty.3 On the other hand, some evidence has identifiedsedentary behavior as an important predictor of healthy aging.4 Forexample, Dogra and Stathokostas5 found a dose-dependent relation-ship between sedentary behavior and different components of suc-cessful aging among middle-aged and older adults. A number ofexisting studies, but not all, have claimed that the detrimental asso-ciations between sedentary behavior and health outcomes are inde-pendent of physical activity levels.6 Authors such as Song et al7 andBlodgett et al8 have confirmed these associations also for frailty out-comes. However, the relationships between physical activity, seden-tary behavior, and health outcomes are far more complex. In fact,more recent evidence has suggested that the negative consequencesof sedentary behavior on older adults can be mitigated with adequatephysical activity levels. For example, Garcia-Hermoso et al9 demon-strated that moderate-to-vigorous physical activity attenuated therelationship between self-reported sitting time and cognitive functionin a nationally representative sample of 954 community-dwellingolder adults. Others have shown that the effects of sedentarybehavior even disappear after consideration of time spent inmoderate-to-vigorous physical activity. Beyond these associations, arecent meta-analysis with 1,005,791 individuals concluded that highlevels of moderate-to-vigorous physical activity eliminate theincreased risk of death associated with sitting time.10 Whetherphysical activity can ameliorate or even offset the negative conse-quences of sedentary behavior on frailty in older adults remains un-known. This study aimed to determine whether or not and to whatextent the detrimental effects of sedentary behavior on frailty weremoderated by moderate-to-vigorous physical activity in a sample of749 community-dwelling older adults measured with accelerometers.
Methods
Study Design and Participants
This cross-sectional investigation considered data from 871 olderadults (395 men) interviewed between 2012 and 2017 in the ToledoStudy for Healthy Aging (TSHA), a Spanish population-based pro-spective cohort study involving men and women older than 65 yearsand for which the primary aim was the study of the ageing process.The full methodology of the TSHA has been previously described.11 Allparticipants provided written consent for partaking in the currentstudy before enrolment. The Clinical Research Ethics Committee of theToledo Hospital approved the research protocol.
Measurements
Frailty statusThe Frailty Trait Scale (FTS)12 was used to measure frailty in this
study. The FTS assessed 7 aspects including energy balance and nutri-tion, physical activity, nervous system, vascular system, weakness,endurance, and slowness. These domains become operational through12 items. Each itemscore represents a biological trait. Only participantswith at least data on 75% (9 of the 12) of the items included in the FTSwere included in the study. The total scorewasdeterminedaccording tothe formula: Total score ¼ (S items score/total score possible by indi-vidual)*100. Therefore, the total FTS score ranged from0 (best score) to100 (worst score).
Physical activity and sedentary behavior assessmentPhysical activity and sedentary behavior were assessed during 7
consecutive days by accelerometry (ActiTrainer and ActiGraphwGT3X-BT; ActiGraph, LLC, Pensacola, FL). All participants wore theaccelerometer in an elastic waistband on the left hip during waking
hours, exceptwhile bathing or swimming. Monitors were set to recordaccelerometer counts in 1-minute epochs. Nonwear time was definedas 60 consecutive minutes or longer of zero-intensity counts, with nomore than 2 minutes of counts between zero and 100.13 The studyincluded data only from participants with at least 4 valid days with 8or more hours per day of wear time. The intensity threshold forsedentary behaviors was <100 cpm, whereas moderate-to-vigorousphysical activity was defined as �1952 cpm.14 The values were aver-aged over the number of valid days to derive an estimate of the meantime (minutes) spent in sedentary behavior andmoderate-to-vigorousphysical activity per day.
Anthropometrics and confounding variablesHeight was measured to the nearest centimeter using a stadi-
ometer (Seca 711 Scales, Hamburg, Germany), and weight wasmeasured with a SECA precision scale (Seca 711 Scales, Hamburg,Germany). Individuals removed their shoes, socks, and heavy clothesprior to weighing. Body mass index was calculated as weight (in ki-lograms) divided by height (in meters) squared.
Participants self-reported their age, sex, and ethnicity. Education(no studies, primary school completed, secondary school completedor more), marital status (single, married/living together, widowed,divorced/separated), and income (it was coded into 3 categoriesranging from any income to V3000/mo) were also self-reported inface-to-face interviews.
Analytical approachStatistical analyses were conducted using R software (R project
version 3.5.1). Summary statistics were used to describe variables ofinterest. Significance levels were set at P < .05. A multiple linearregressionwas conducted to determine the associations between timeper day spent in sedentary behavior and frailty in the sample popu-lation. An interaction term was then included in the equation to testthe moderation effects of moderate-to-vigorous physical activity inthe sedentary behaviorefrailty relationship. Lastly, the Johnson-Neyman technique15,16 was used to elucidate the moderate-to-vigorous physical activity values in which a significant and nonsig-nificant relationship exists between sedentary behavior and frailty inthe sample population. To confirm the robustness of our estimates,
Table 1Participant Characteristics
Characteristics Sample (N ¼ 749)
Age, y* 76.7 (4.9)Sexy
Male 346 (46.2)Female 403 (53.8)
Educationy
None 471 (62.9)Primary school 169 (22.6)Secondary or more 109 (14.5)
Incomey
Low 381 (50.9)Medium 310 (41.4)High 58 (7.7)
Marital statusy
Single 41 (5.5)Married 530 (70.8)Widowed 166 (22.1)Divorced/separated 12 (1.6)
Body mass index* 30.3 (4.8)Frailty Trait Scale, points* 38.0 (14.5)Accelerometer wear time, min/valid day* 786.6 (83.0)Sedentary time, min/valid day* 538.7 (90.3)Moderate-to-vigorous physical activity, min/valid day* 19.7 (23.9)
*Continuous variable; mean (standard deviation).yCategorical variable; n (%).
A. Mañas et al. / JAMDA xxx (2019) 1e52
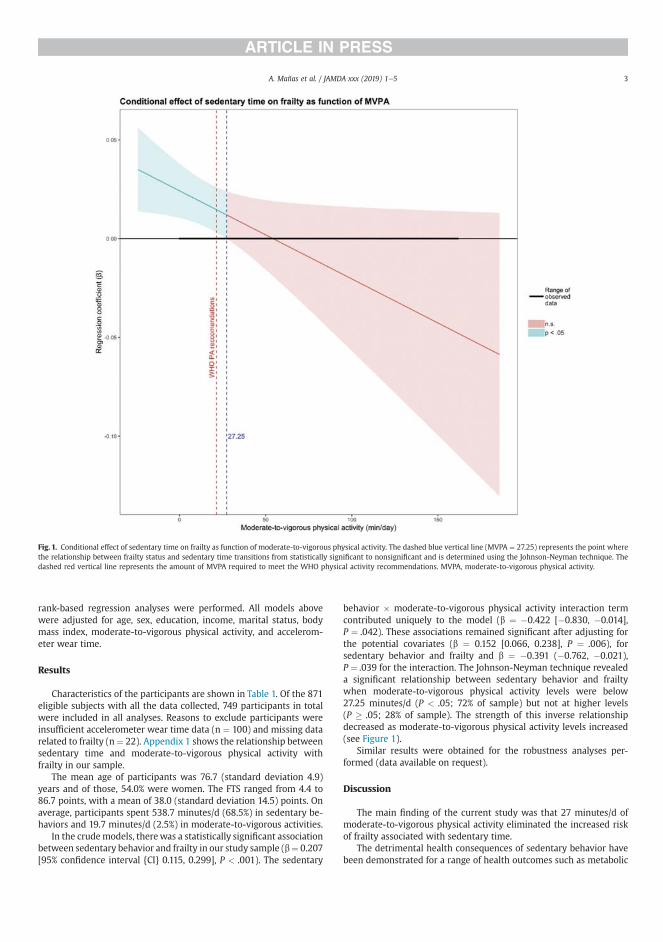
rank-based regression analyses were performed. All models abovewere adjusted for age, sex, education, income, marital status, bodymass index, moderate-to-vigorous physical activity, and accelerom-eter wear time.
Results
Characteristics of the participants are shown in Table 1. Of the 871eligible subjects with all the data collected, 749 participants in totalwere included in all analyses. Reasons to exclude participants wereinsufficient accelerometer wear time data (n ¼ 100) and missing datarelated to frailty (n¼ 22). Appendix 1 shows the relationship betweensedentary time and moderate-to-vigorous physical activity withfrailty in our sample.
The mean age of participants was 76.7 (standard deviation 4.9)years and of those, 54.0% were women. The FTS ranged from 4.4 to86.7 points, with a mean of 38.0 (standard deviation 14.5) points. Onaverage, participants spent 538.7 minutes/d (68.5%) in sedentary be-haviors and 19.7 minutes/d (2.5%) in moderate-to-vigorous activities.
In the crudemodels, therewas a statistically significant associationbetween sedentary behavior and frailty in our study sample (b¼ 0.207[95% confidence interval {CI} 0.115, 0.299], P < .001). The sedentary
behavior � moderate-to-vigorous physical activity interaction termcontributed uniquely to the model (b ¼ �0.422 [�0.830, �0.014],P ¼ .042). These associations remained significant after adjusting forthe potential covariates (b ¼ 0.152 [0.066, 0.238], P ¼ .006), forsedentary behavior and frailty and b ¼ �0.391 (�0.762, �0.021),P ¼ .039 for the interaction. The Johnson-Neyman technique revealeda significant relationship between sedentary behavior and frailtywhen moderate-to-vigorous physical activity levels were below27.25 minutes/d (P < .05; 72% of sample) but not at higher levels(P � .05; 28% of sample). The strength of this inverse relationshipdecreased as moderate-to-vigorous physical activity levels increased(see Figure 1).
Similar results were obtained for the robustness analyses per-formed (data available on request).
Discussion
The main finding of the current study was that 27 minutes/d ofmoderate-to-vigorous physical activity eliminated the increased riskof frailty associated with sedentary time.
The detrimental health consequences of sedentary behavior havebeen demonstrated for a range of health outcomes such as metabolic
Fig. 1. Conditional effect of sedentary time on frailty as function of moderate-to-vigorous physical activity. The dashed blue vertical line (MVPA ¼ 27.25) represents the point wherethe relationship between frailty status and sedentary time transitions from statistically significant to nonsignificant and is determined using the Johnson-Neyman technique. Thedashed red vertical line represents the amount of MVPA required to meet the WHO physical activity recommendations. MVPA, moderate-to-vigorous physical activity.
A. Mañas et al. / JAMDA xxx (2019) 1e5 3
syndrome, waist circumference, and overweight/obesity.4 Forexample, Gao et al17 found that greater time spent viewing televisionwas associatedwith highwaist-to-hip ratio, and Gennuso et al18 foundthat more time spent in objectively measured sedentary behavior wasassociated with a high waist circumference and body mass index. Thisdamaging effect of time spent in sedentary activities seems to beconfirmed for frailty in older adults7,8,19,20 and remains true also in oursample. Several factors such as loss of maximal aerobic capacity andmuscle strength, decreased cognitive function, dysfunction of theimmune system, and damaged metabolic function or weight gain maypartially explain these associations.21
The main contribution of our study is the confirmation of themoderating role of physical activity on the sedentary behaviorefrailtyassociation. Our results suggest that engagement in 27 minutes/d ofmoderate-to-vigorous physical activity could eliminate the negativeconsequences of spending too much time in otherwise sedentary ac-tivities. Recent evidence in Chilean older adults also suggests thatmore intense physical activity attenuates the negative effects of sittingtime on cognition.9 This estimated protective role of physical activityhas also been confirmed in a large meta-analysis with more than 1million adults and older adults.10 The former study suggests that inhighly physically active people (ie, participants accumulating 60-75 minutes/d of moderate-to-vigorous physical activity), sitting timewas no longer a predictive factor of all-cause mortality. Also, Theouet al22 reported that in active individuals over 50 years old, sedentarytime does not affect the risk of mortality, regardless the level of frailty.Altogether, these findings seem to reinforce the idea of increasingmoderate-to-vigorous activity to offset the harmfulness that seden-tary time may have on frailty in older adults. Future studies need toconfirm our results in longitudinal, experimental studies.
Despite the well-established health benefits,23,24 engaging in moremoderate-to-vigorous physical activity may not be feasible for allolder adults. In fact, only 28% in our sample met the suggestedthreshold of 27 minutes/d of moderate-to-vigorous activity (which is6 minutes/d above the current physical activity guidelines) necessaryto theoretically offset the impact of sedentary behavior on frailty. Arecent systematic review and meta-analysis25 concluded that replac-ing accelerometer-assessed sedentary time with light-intensity ac-tivities is a feasible health-enhancing strategy, particularly amongpreviously sedentary individuals. A previous study also demonstratedthat replacing sedentary behavior with light-intensity activities canreduce the frailty levels among vulnerable older adults.26 Our esti-mations confirm the benefits of reducing sedentary behavior to reducefrailty levels among inactive older adults (ie, 68% of the sample in thecurrent study). Some studies have also demonstrated that reductionsin sedentary behavior (ie, short breaks of light activity into otherwiseinactive periods) are possible27 and have the potential of improvingthe physical function of older individuals.28e31 Collectively, thesefindings indicate that both increasing moderate-to-vigorous physicalactivity and reducing sedentary time should be encouraged to reducefrailty among older adults. The inclusion of strategies to reduce timespent sitting and increase time spent in light-intensity activities toreduce frailty may be of particular interest among the most inactiveolder adults and could be taken as a first, feasible step toward accu-mulation of more moderate-to-vigorous physical activity throughoutthe day.
Strengths and Limitations
An important strength of our study is that it includes a relativelylarge sample of community-dwelling older adults with accelerometer-derived sedentary behavior and physical activity estimations. Also,although there is no established gold standard to identify frailty, theFrailty Trait Scale has been suggested as a more sensitive scale fordetecting comorbidities, biomarkers, and adverse events associated
with frailty than previously validated frailty scales such as FrailtyPhenotype32 and the Frailty Index.33 Some limitations have to beacknowledged. Despite the validity and widespread use of acceler-ometers to assess physical activity in free living conditions, thesedevices are not able to discriminate between sitting and standing34 oractivity type, thus potentially biasing the estimations in our study. Thecross-sectional nature of the observations does not allow definitiveconclusions to be drawn around the causal relationship between thevariables of interest. Additional evidence is required to extend thesefindings using longitudinal and experimental data.
Conclusions
The present study shows that moderate-to-vigorous physical ac-tivity is a moderator in the relationship between sedentary time andfrailty in older adults, offsetting the harmful effects of sedentarybehavior with 27 minutes/d of moderate-to-vigorous physical activity.Whenever possible, efforts should be directed toward the promotionof moderate-to-vigorous physical activity in older adults. Also,reducing sedentary behavior may be beneficial, particularly in thoseengaging in less-intense activity throughout the day.
References
1. Morley JE, Vellas B, van Kan GA, et al. Frailty consensus: A call to action. J AmMed Dir Assoc 2013;14:392e397.
2. Clegg A, Young J, Iliffe S, et al. Frailty in elderly people. Lancet 2013;381:752e762.
3. Izquierdo M, Rodriguez-Manas L, Casas-Herrero A, et al. Is it ethical not toprescribe physical activity for the elderly frail? J Am Med Dir Assoc 2016;17:779e781.
4. de Rezende LF, Rey-Lopez JP, Matsudo VK, do Carmo Luiz O. Sedentary behaviorand health outcomes among older adults: A systematic review. BMC PublicHealth 2014;14:333.
5. Dogra S, Stathokostas L. Sedentary behavior and physical activity are inde-pendent predictors of successful aging in middle-aged and older adults. J AgingRes 2012;2012:190654.
6. Manas A, Del Pozo-Cruz B, Garcia-Garcia FJ, et al. Role of objectively measuredsedentary behaviour in physical performance, frailty and mortality amongolder adults: A short systematic review. Eur J Sport Sci 2017;17:940e953.
7. Song J, Lindquist LA, Chang RW, et al. Sedentary behavior as a risk factor forphysical frailty independent of moderate activity: Results from the Osteoar-thritis Initiative. Am J Public Health 2015;105:1439e1445.
8. Blodgett J, Theou O, Kirkland S, et al. The association between sedentarybehaviour, moderate-vigorous physical activity and frailty in NHANES cohorts.Maturitas 2015;80:187e191.
9. Garcia-Hermoso A, Ramirez-Velez R, Celis-Morales CA, et al. Can physical ac-tivity attenuate the negative association between sitting time and cognitivefunction among older adults? A mediation analysis. Exp Gerontol 2018;106:173e177.
10. Ekelund U, Steene-Johannessen J, Brown WJ, et al. Does physical activityattenuate, or even eliminate, the detrimental association of sitting time withmortality? A harmonised meta-analysis of data from more than 1 million menand women. Lancet 2016;388(10051):1302e1310.
11. Garcia-Garcia FJ, Avila GG, Alfaro-Acha A, et al. The prevalence of frailty syn-drome in an older population from Spain. The Toledo Study for Healthy Aging.J Nutr Health Aging 2011;15:852e856.
12. Garcia-Garcia FJ, Carcaillon L, Fernandez-Tresguerres J, et al. A new operationaldefinition of frailty: The Frailty Trait Scale. J Am Med Dir Assoc 2014;15:371.e7e371.e13.
13. Colley R, Connor Gorber S, Tremblay MS. Quality control and data reductionprocedures for accelerometry-derived measures of physical activity. HealthRep 2010;21:63e69.
14. Freedson PS, Melanson E, Sirard J. Calibration of the Computer Science andApplications, Inc. accelerometer. Med Sci Sports Exerc 1998;30:777e781.
15. Johnson PO, Fay LC. The Johnson-Neyman technique, its theory and application.Psychometrika 1950;15:349e367.
16. Anderson JR, Calvo D, Glickman E, et al. The moderating role of insulin-likegrowth factor 1 in the relationship between cognitive and aerobic endurancechange. J Geriatr Psychiatry Neurol 2017;30:84e89.
17. Gao X, Nelson ME, Tucker KL. Television viewing is associated with prevalenceof metabolic syndrome in Hispanic elders. Diabetes Care 2007;30:694e700.
18. Gennuso KP, Gangnon RE, Matthews CE, et al. Sedentary behavior, physicalactivity, and markers of health in older adults. Med Sci Sports Exerc 2013;45:1493e1500.
A. Mañas et al. / JAMDA xxx (2019) 1e54
19. Del Pozo-Cruz B, Manas A, Martin-Garcia M, et al. Frailty is associated withobjectively assessed sedentary behaviour patterns in older adults: Evidencefrom the Toledo Study for Healthy Aging (TSHA). PLoS One 2017;12:e0183911.
20. Kehler DS, Clara I, Hiebert B, et al. The association between bouts of moderateto vigorous physical activity and patterns of sedentary behavior with frailty.Exp Gerontol 2018;104:28e34.
21. Thyfault JP, Du M, Kraus WE, et al. Physiology of sedentary behavior and itsrelationship to health outcomes. Med Sci Sports Exerc 2015;47:1301e1305.
22. Theou O, Blodgett JM, Godin J, Rockwood K. Association between sedentarytime and mortality across levels of frailty. Can Med Assoc J 2017;189:E1056eE1064.
23. Lee IM, Shiroma EJ, Lobelo F, et al. Effect of physical inactivity on major non-communicable diseases worldwide: An analysis of burden of disease and lifeexpectancy. Lancet 2012;380:219e229.
24. Wen CP, Wu X. Stressing harms of physical inactivity to promote exercise.Lancet 2012;380:192e193.
25. Del Pozo-Cruz J, Garcia-Hermoso A, Alfonso-Rosa RM, et al. Replacing seden-tary time: Meta-analysis of objective-assessment studies. Am J Prev Med 2018;55:395e402.
26. Manas A, Del Pozo-Cruz B, Guadalupe-Grau A, et al. Reallocatingaccelerometer-assessed sedentary time to light or moderate- to vigorous-intensity physical activity reduces frailty levels in older adults: An
isotemporal substitution approach in the TSHA Study. J Am Med Dir Assoc2018;19:185.e1e185.e6.
27. Gardiner PA, Eakin EG, Healy GN, Owen N. Feasibility of reducing older adults’sedentary time. Am J Prev Med 2011;41:174e177.
28. Sardinha LB, Santos DA, Silva AM, et al. Breaking-up sedentary time is associ-ated with physical function in older adults. J Gerontol A Biol Sci Med Sci 2015;70:119e124.
29. Buman MP, Hekler EB, Haskell WL, et al. Objective light-intensity physicalactivity associations with rated health in older adults. Am J Epidemiol 2010;172:1155e1165.
30. Tse ACY, Wong TWL, Lee PH. Effect of low-intensity exercise on physical andcognitive health in older adults: A systematic review. Sports Medicine Open2015;1:37.
31. Brach JS, FitzGerald S, Newman AB, et al. Physical activity and functional statusin community-dwelling older women: A 14-year prospective study. ArchIntern Med 2003;163:2565e2571.
32. Fried LP, Tangen CM, Walston J, et al. Frailty in older adults: Evidence for aphenotype. J Gerontol A Biol Sci Med Sci 2001;56:M146eM156.
33. Rockwood K, Song X, MacKnight C, et al. A global clinical measure of fitness andfrailty in elderly people. Can Med Assoc J 2005;173:489e495.
34. An HS, Kim Y, Lee JM. Accuracy of inclinometer functions of the activPAL andActiGraph GT3Xþ: A focus on physical activity. Gait Posture 2017;51:174e180.
A. Mañas et al. / JAMDA xxx (2019) 1e5 5
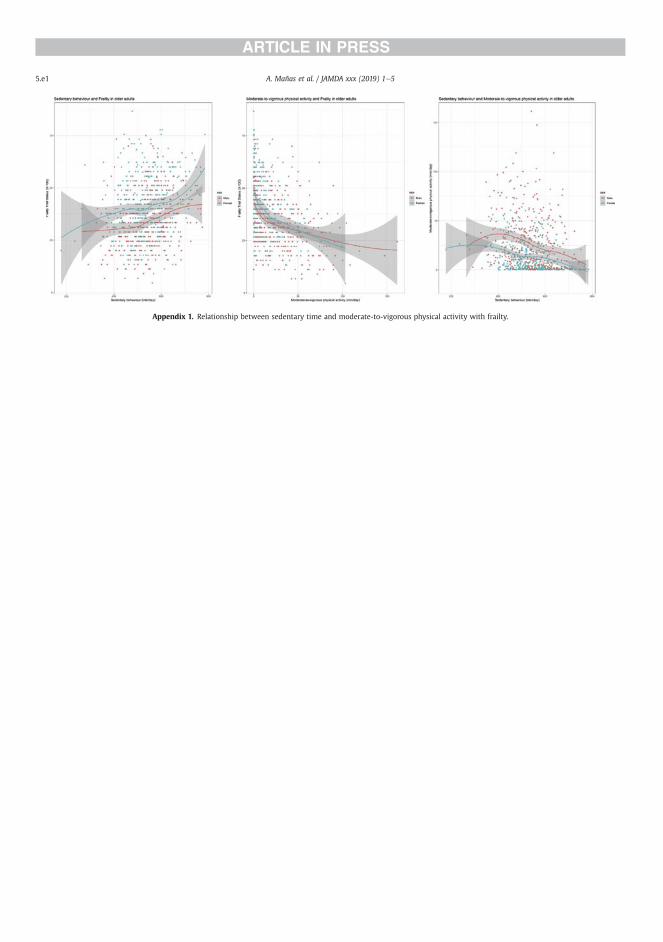
Appendix 1. Relationship between sedentary time and moderate-to-vigorous physical activity with frailty.
A. Mañas et al. / JAMDA xxx (2019) 1e55.e1
RESULTS
213
5.6. STUDY 6
“Which came first: the movement
behavior or the frailty? A cross-
lagged panel model in the THSA
study”

RESULTS
214
1
Which came first: the movement behavior or the frailty? A cross-lagged panel 1
model in the THSA study. 2
3
Asier Mañasa,b* MSc, Borja del Pozo-Cruzc* PhD, Irene Rodríguez-Gómeza,b PhD, José 4
Losa-Reynaa,b,d PhD, Leocadio Rodríguez-Mañasb,e PhD, MD, Francisco J. García-5
Garcíab,d PhD, MD, Ignacio Araa,b† PhD 6
7
aGENUD Toledo Research Group, University of Castilla-La Mancha (Toledo, Spain). 8
bCIBER of Frailty and Healthy Aging (CIBERFES). 9
cMotivation and Behaviour Research Program, Institute for Positive Psychology and 10
Education, Faculty of Health Sciences, Australian Catholic University, Sydney, 11
Australia. 12
dGeriatric Department. Hospital Virgen del Valle (Toledo, Spain). 13
eGeriatric Department. Hospital Universitario de Getafe (Getafe, Spain). 14
*These authors contributed equally to this work. 15
†Address correspondence to Ignacio Ara, GENUD Toledo Research Group, University 16
of Castilla-La Mancha, Avda. Carlos III s/n, 45071, Toledo, Spain. 17
E-mail address: [email protected] (Ignacio Ara) 18
19
20
Word count: 3625 21
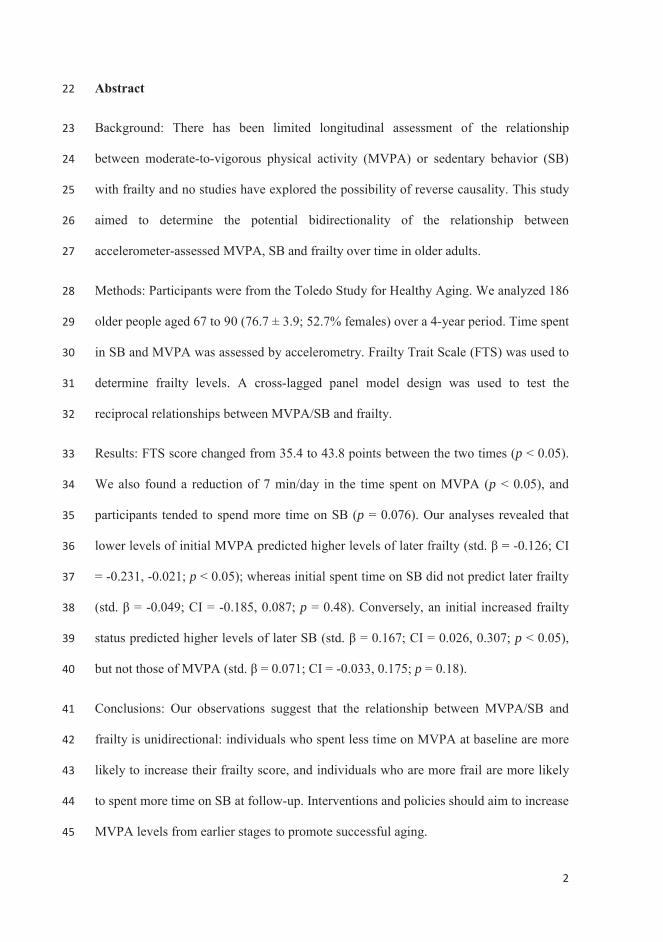
2
Abstract 22
Background: There has been limited longitudinal assessment of the relationship 23
between moderate-to-vigorous physical activity (MVPA) or sedentary behavior (SB) 24
with frailty and no studies have explored the possibility of reverse causality. This study 25
aimed to determine the potential bidirectionality of the relationship between 26
accelerometer-assessed MVPA, SB and frailty over time in older adults. 27
Methods: Participants were from the Toledo Study for Healthy Aging. We analyzed 186 28
older people aged 67 to 90 (76.7 ± 3.9; 52.7% females) over a 4-year period. Time spent 29
in SB and MVPA was assessed by accelerometry. Frailty Trait Scale (FTS) was used to 30
determine frailty levels. A cross-lagged panel model design was used to test the 31
reciprocal relationships between MVPA/SB and frailty. 32
Results: FTS score changed from 35.4 to 43.8 points between the two times (p < 0.05). 33
We also found a reduction of 7 min/day in the time spent on MVPA (p < 0.05), and 34
participants tended to spend more time on SB (p = 0.076). Our analyses revealed that 35
lower levels of initial MVPA predicted higher levels of later frailty (std. β = -0.126; CI 36
= -0.231, -0.021; p < 0.05); whereas initial spent time on SB did not predict later frailty 37
(std. β = -0.049; CI = -0.185, 0.087; p = 0.48). Conversely, an initial increased frailty 38
status predicted higher levels of later SB (std. β = 0.167; CI = 0.026, 0.307; p < 0.05), 39
but not those of MVPA (std. β = 0.071; CI = -0.033, 0.175; p = 0.18). 40
Conclusions: Our observations suggest that the relationship between MVPA/SB and 41
frailty is unidirectional: individuals who spent less time on MVPA at baseline are more 42
likely to increase their frailty score, and individuals who are more frail are more likely 43
to spent more time on SB at follow-up. Interventions and policies should aim to increase 44
MVPA levels from earlier stages to promote successful aging. 45
3
Keywords: Structural equation modeling; Longitudinal; Exercise; Sedentary time; 46
Ageing; Functioning and disability 47
48
Abbreviations 49
MVPA: Moderate-to-Vigorous Physical Activity 50
SB: Sedentary Behavior 51
TSHA: Toledo Study of Health Aging 52
FTS: Frailty Trait Scale 53
BMI: Body Mass Index 54
MMSE: Mini-Mental State Examination 55
RMSEA: Root Mean Square Error of Approximation 56
SRMR: Standardized Root Mean Square Residual 57
CFI: Confirmatory Fit Index 58
TLI: Tucker-Lewis Index 59
CI: Confidence Interval 60
61
62
63
64
65
4
Introduction 66
Globally, the population aged 65 and over is growing faster than all other age groups [1, 67
2]. One of the most remarkable changes in body composition related to aging is the loss 68
of skeletal muscle (i.e., sarcopenia) [3]. Frailty, defined as a condition of increased 69
vulnerability associated with aging, and sarcopenia have been linked because both can 70
lead to disability, hospitalization and premature death [4-6]. Sarcopenia has been 71
considered both as the biological substrate for the development of physical frailty and 72
the pathway through which adverse health-related outcomes of physical frailty occur 73
[7]. Consequently, interventions to reduce the burden associated with frailty should be 74
focused, among others, on skeletal muscle and its functionality [8]. 75
Increasing physical activity and reducing the levels of sedentary behavior has been 76
suggested to be a key strategy to attenuate the declines in muscle mass and physical 77
function associated with aging, and may also delay the clinical symptoms of frailty in 78
older adults [9]. Several cross-sectional studies suggest that objectively-assessed 79
moderate-to-vigorous physical activity (MVPA) and sedentary behavior (SB) are related 80
with frailty in middle- to older-aged adults [10-13]. Nonetheless, a major limitation of 81
the existing evidence is that it mainly relies on cross-sectional designs, thus precluding 82
us from making any causal inferences due to the inability of establishing the temporal 83
sequence of the effects of MVPA or SB on frailty outcomes. 84
Therefore, longitudinal studies are essential because they provide an opportunity to 85
explore in more detail the causal direction of the associations between MVPA or SB 86
and frailty, knowledge which could then contribute to the development of intervention 87
strategies to favor successful aging outcomes, including frailty and associated 88
symptoms. To date, most of the existing longitudinal studies found a positive 89
association between SB and frailty [14, 15] and an inverse association for MVPA and 90
5
frailty [16]. For example, a longitudinal study in two Spanish cohorts of community-91
dwelling older adults reported baseline television viewing time was also associated with 92
frailty at 4-years follow-up [17]. Nevertheless, all of these studies used self-report 93
methods to assess the movement behavior of interest. Song et al. [18] showed a 94
relationship between objectively-assessed sedentary time and development of physical 95
frailty. However, an important caveat with this study is that used gait speed as a proxy 96
measure of frailty, thus could not capture the multidimensional nature of frailty [4]. To 97
our knowledge, there is no longitudinal study that has objectively measured both frailty 98
and MVPA/SB. 99
The relationships between physical activity, sedentary time and frailty are further 100
complicated by the possibility of reverse causality [16, 19]. In all previous longitudinal 101
studies, whether using objective or subjective measures of the variables of interest, the 102
authors investigated the prospective associations of MVPA or SB with frailty, not 103
taking into account the potential reverse or temporal order in the causality chain. We 104
cannot rule out the possibility that a high level of frailty can be associated with lower 105
levels of physical activity and a greater amount of sedentary time at a future time. The 106
reverse may also be true. Estimating the temporal ordering, and potential 107
bidirectionality of the association of SB and MVPA with frailty would be advantageous 108
to inform subsequent interventions aimed at reducing the burden of frailty among the 109
older population. However, no studies exist investigating this issue. 110
With fill in this gap by examining the longitudinal association of accelerometer-111
assessed MVPA and SB with frailty over a period of 4-years in a population sample of 112
older adults from the Toledo Study of Health Aging (TSHA). In doing so, we applied a 113
cross-lagged panel model, a statistical technique appropriate for the context and aims of 114
the current study [20, 21]. Specifically, this study examined whether MVPA or SB 115
6
predicted frailty in the future and whether frailty predicted subsequent movement 116
behaviors (or both). As far as we know, this is the first study that has examined the 117
potentially reciprocal relationships between movement behaviors and frailty in older 118
adults. In the current study, four hypotheses were tested: 119
H0: Frailty does not predict changes in SB/MVPA, and SB/MVPA does not predict 120
changes in frailty. 121
H1: Frailty predicts changes in SB/MVPA, but SB/MVPA does not predict changes in 122
frailty. 123
H2: SB/MVPA predicts changes in frailty, but frailty does not predict changes in 124
SB/MVPA. 125
H3: SB/MVPA and frailty have a reciprocal relationship - frailty predicts changes in SB/ 126
MVPA, and SB/ MVPA predicts changes in frailty. 127
128
Methods 129
Study Design and Participants 130
This is a longitudinal study consisting of two data collection waves separated by 4-years 131
(3.8 ± 0.8 years). This investigation used data from the second and third wave of the 132
TSHA. Details of the protocol of the TSHA is described elsewhere [22, 23]. Briefly, the 133
TSHA is a population prospective cohort study aimed at studying the determinants and 134
consequences of frailty in institutionalized and community-dwelling individuals older 135
than 65 years living in the province of Toledo, Spain. In the current study a subsample 136
of the TSHA with accelerometer data was included. A total of 277 men and 351 women 137
over 65 years of age at baseline, although 494 participants concluded the three stages of 138
7
assessment and provide with valid data for the analyses [224 men (45.3%)]. The first 139
time point of assessment for this study started in July 2012 and lasted until June 2014. 140
In the first stage, six psychologists conducted computer-assisted interviews face to face 141
with potential subjects. In the second stage, three nurses performed a physical 142
examination followed by clinical and performance tests at the subject’s home. In the 143
third stage, the participants were invited to wear an accelerometer for a week. 144
Participants were contacted again in 2015 and invited to participate in a follow-up study 145
conducted between May 2015 and July 2017 [24]. After the follow up, 200 participants 146
(59.5% missing) completed the second evaluation. However, 186 subjects (88 men 147
(47.3%) with complete data on all exposures, outcomes and ≥80% covariates were 148
included in the final analyses of this study (see Figure 1 for the study participant flow 149
diagram). Signed informed consent was obtained from all participants prior 150
participation in the study. The study was approved by the Clinical Research Ethics 151
Committee of the Toledo Hospital, which was conducted according to the ethical 152
standards defined in the 1964 Declaration of Helsinki. 153
Measurements 154
Frailty status 155
The Frailty Trait Scale (FTS) [25] was used to assess frailty in this study. The FTS 156
includes 7 aspects: energy balance and nutrition, activity, nervous system, vascular 157
system, weakness, endurance, and slowness. These domains become operational 158
through 12 items: 159
Body mass index, central obesity (waist circumference), unintentional weight loss and 160
serum albumin level were used to assess energy balance and nutrition. 161
8
Activity was assessed using the total score of the Physical Activity Scale for the Elderly 162
[26]. 163
The nervous system was calculated by considering verbal fluency and balance. Verbal 164
fluency was estimated by asking the participants to give names of animals during one 165
minute [27]. Balance was measured by Romberg test [28]. 166
The vascular system was measured by the brachial-ankle index done with Doppler 167
ultrasound [29]. 168
Weakness was estimated assessing grip strength in the dominant arm and the knee 169
extension strength [23]. 170
Endurance was assessed by the chair stand test, which measures the number of times 171
that a person stands up in 30 seconds [30]. 172
Slowness was estimated by calculating the time to walk 3 m at a “normal pace” 173
according to a standard protocol [28]. 174
Each item score represents a biological trait and ranges from 0 (the best) to 4 (the 175
worst), except in the “chair test” where the range is from 0 to 5 points because of the 176
necessity of scoring those unable to stand a single time. When appropriate, items are 177
analyzed according to the item’s quintile distribution in the population. 178
To be included in the study, the participants had to overcome at least 75% (9 of the 12) 179
of the items included in the FTS [25]. The total score was calculated by adding all the 180
scores in each item divided by total score for each individual and multiplying by 100, 181
standardizing the measure to a range from 0 (best score) to 100 (worst score), according 182
to the formula Total score = (Σ items score/total score possible by individual)*100. 183
184
9
Physical activity and sedentary behavior assessment 185
The ActiGraph accelerometer ActiTrainer and wGT3X-BT (ActiGraph, LLC, 186
Pensacola, FL) were used to assess the participants’ physical activity and SB levels 187
during a week as previously described [11]. In brief, participants were instructed to 188
wear an accelerometer on the left hip during waking hours, with exception for water 189
activities. The devices were initialized to collect data using one-minute epochs and all 190
data were collected using the vertical axis collection mode. Inclusion criteria comprised 191
at least 4 days with at least 8 hours recorded per day without excessive counts (i.e., 192
>20,000 counts) [31]. Non-wear time was defined as a minimum of 60 minutes with 193
allowance of 1‐2 minutes of counts below 100 counts [32]. Daily average times spent in 194
SB (<100 counts/min) and MVPA (≥1952 counts/min) were derived according to 195
previous work [33]. Although there is a lack of consensus on the use of cut-off points to 196
classify the intensity of the activity, the cut-off points used in this study are the most 197
commonly reported in this population group [34], this makes our results comparable to 198
other studies. Minutes spent in each of these three behaviors were tallied per day and 199
averaged over all available valid days. 200
Anthropometrics and confounding variables 201
Height was measured to the nearest centimeter using a stadiometer (Seca 711 scales, 202
Hamburg, Germany), and weight was measured with a SECA precision scale (Seca 711 203
scales, Hamburg, Germany). Individuals removed their shoes, socks and heavy clothes 204
prior to weighing. Body mass index (BMI) was calculated as weight (kg) divided by 205
height squared (m2). 206
Participants self-reported their age, sex and ethnicity. Education (no studies, primary 207
school completed, secondary school completed or more), marital status (single, 208
10
married/living together, widowed, divorced/separated), and income (it was coded into 3 209
categories ranging from any income to 3000€/month) were also self-reported in face-to-210
face interviews. We also evaluated objective cognitive function using the Mini-Mental 211
State Examination (MMSE) [35]. 212
Statistical analysis 213
Preliminary analyses examined variable distributions, sample characteristics and 214
attrition using R software (R project version 3.5.1). Descriptive variables were 215
compared between participants retained with those of participants not retained from 216
wave1-wave2 with an independent t test or chi-square test for continuous and 217
categorical variables, respectively. Descriptive statistics (mean and standard deviation 218
(SD) for continuous variables and as frequencies and percentages for categorical 219
variables) were calculated for all outcome measurements. Comparison between baseline 220
and follow-up time continuous variables was performed using a paired sample t-test. 221
We tested our hypotheses using structural equation modeling with maximum likelihood 222
estimation using functions from the R package Lavaan [36]. Full information maximum 223
likelihood was used to provide unbiased and efficient estimates of the parameters of 224
interest missingness at random [37]. Two cross-lagged panel models were used to test 225
the hypothesis of the study. A cross-lagged panel model was implemented to test the 226
relationships between SB and frailty status across the two time points for the present 227
study (i.e., initial assessment and 4-year follow-up). The second cross-lagged panel 228
model was used to test the relationships between MVPA and frailty status. The null 229
hypotheses would be supported if neither of the coefficients associated with the cross 230
paths were significantly different from zero. If the cross path towards frailty in time 2, 231
but not towards SB/MVPA in time 2, was significant, then H1 would be supported. If it 232
were the reverse of the latter, then H2 would be supported. Finally, if both paths were 233
11
significant, then H3 would be supported. Analyses included sex as time-invariant 234
variable; in addition, age, education, marital status, income, BMI, MMSE, and 235
accelerometer wear time were allowed to be time-varying covariates (i.e., allowing for 236
possible changes in these measures from initial assessment to follow-up). Among the 237
strengths of using a cross-lagged panel approach is that it allows simultaneous analysis 238
of the two dependent outcomes, thereby permitting the identification of possible 239
bidirectional associations over time. Model fit was assessed using a selection of fit 240
indices and criteria: root mean square error of approximation (RMSEA) (≤0.06), 241
standardized root mean square residual (SRMR) (≤0.08), confirmatory fit index (CFI) 242
(≥0.95), and Tucker-Lewis index (TLI) (≥0.95) [38]. 243
244
Results 245
Attrition/missing data across time points 246
Participants decreased from 494 with complete data at baseline to 186 with complete 247
data at follow-up assessment (see Figure 1). The causes and numbers who were lost to 248
the follow-up assessment were death (n = 42), refusal (n = 225), and could not be 249
located (n = 27). Additional missing data were lost by insufficient accelerometer wear 250
time data (n = 9), missing frailty data (n = 2) or losing more than 80% of the covariates 251
(n = 3). Compared with the retained sample, participants who dropped the study at 4-252
year follow-up were significantly older, less educated and spent more time on SB 253
(Supplementary File 1). Also, MVPA had a trend toward significance reductions in 254
those participants. Missing data were addressed using a full information maximum 255
likelihood algorithm, as recommended elsewhere [39]. 256
257
12
Descriptive statistics 258
Means and standard deviations for MVPA, SB and frailty as well as confounders at each 259
of the two time-points of assessment (namely T1 and T2) for the present study are 260
shown in Table 1. At baseline, participants had a mean age of 76.68 (SD = 3.90), a 261
mean FTS of 35.35 (SD = 13.94), and a mean time (min/day) spent on SB of 530.18 262
(SD = 84.86), and MVPA of 20.12 (SD = 23.30). FTS score declined significantly 263
between T1 and T2 (p<0.05). It was found that participants tended to spend more time 264
on SB (p=0.076), and there was a significant reduction in the time spent on MVPA 265
between the two times (p<0.05). BMI and MSSE also decreased significantly at both 266
time points (p<0.05). 267
Cross-lagged panel model 1: Moderate-to-vigorous physical activity 268
Figure 2 shows the final cross-lagged model. The data fit the model well (RMSEA = 269
0.000; SRMR = 0.013; CFI = 1.000; TLI = 1.023). The largest effects on T2 MVPA and 270
T2 frailty were those determined by the autoregressive pathways. That is, past MVPA 271
and frailty scores predicted future MVPA and frailty scores respectively. The cross-272
lagged effect from MVPA at T1 to frailty status at T2 was statistically significant 273
(standardized regression coefficient of -0.126; 95% Confidence Interval [CI] = -0.231, -274
0.021; p<0.05), indicating that higher levels of MVPA at baseline predicted lower 275
frailty score 4-years later, adjusting for baseline frailty status. In contrast, the cross-276
lagged effect from frailty status to MVPA was not statistically significant (standardized 277
regression coefficient of -0.049; 95% CI = -0.185, 0.087; p=0.48), suggesting that 278
frailty did not predict future levels of MVPA. 279
280
281
13
Cross-lagged panel model 2: Sedentary behavior 282
Figure 3 shows the final cross-lagged model. The data fit the model well (RMSEA = 283
0.012; SRMR = 0.018; CFI = 0.997; TLI = 0.992). Similar to the previous model, the 284
autoregressive SB and frailty pathways were statistically significant. The cross-lagged 285
effect from frailty to SB levels was statistically significant (standardized regression 286
coefficient of 0.167; 95% CI = 0.026, 0.307; p<0.05), indicating that higher levels of 287
frailty at baseline predicted higher SB 4-years later, adjusting for baseline SB. In 288
contrast, the cross-lagged effect from SB levels to frailty was not statistically significant 289
(standardized regression coefficient of 0.071; 95% CI = -0.033, 0.175; p=0.18), 290
suggesting that SB levels did not predict future frailty status. 291
292
Discussion 293
The present study investigated the longitudinal relationships between MVPA and SB 294
with frailty status in a community-based sample of older adults. As a novelty, we 295
applied a cross-lagged panel model to test for potential reciprocal relationships between 296
MVPA/SB and frailty over a 4-years period. The main finding in our study was that 297
accelerometer-assessed initial MVPA predicted frailty score at follow-up. However, 298
baseline sedentary time was not significantly related to frailty after the follow-up. We 299
further found that initial frailty status predicted subsequent sedentary time (i.e., more 300
frailty status was related to posterior higher levels of SB), but not of MVPA. These 301
results have the potential to inform future interventions that aim at reducing the burden 302
associated with frailty among older adults. 303
Different cross-sectional [10, 11, 40] and longitudinal [16] studies have linked 304
moderate-to-vigorous physical activity with frailty. Blodgett et al. [10] found that 305
14
MVPA was associated with frailty in a group of community dwelling adults aged over 306
50 from the National Health and Nutrition Examination Survey. Other longitudinal 307
studies such as Rogers et al. [16] have also confirmed these results in 8649 adults aged 308
50 and over an average of 10 years of follow-up. We also found that MVPA 309
prospectively predicted frailty levels in our sample. There are numerous arguments 310
supporting these findings [41-44]. It has been demonstrated that physical activity, 311
particularly of moderate intensity plays an important role on multiple components of the 312
frailty syndrome including the frailty phenotype, physiologic dysregulation, and cellular 313
function [9]. Increases in MVPA seem to also preserve or even improve muscle 314
function and structure, protein synthesis, glucose metabolism or inflammation [43]. 315
Furthermore, regular physical activity can maintain a set of bioenergetically functional 316
mitochondria that, by improving systemic mitochondrial function, contribute to 317
reducing the risk of morbidity and mortality throughout life [41]. Not surprisingly, 318
MVPA is considered a cornerstone for the prevention, delay or treatment of frailty 319
among older adults. 320
On the other hand, our results did not support the hypothesis that initial frailty levels 321
predict future MVPA levels. Several studies support the predictive ability of physical 322
functioning on subsequent MVPA levels [45-47]. However, it may also be plausible that 323
other, non-biological mechanisms (e.g., behavioral) accounted for the observations of 324
the current study. Different intervention studies have shown the possibility of increasing 325
physical activity also in frail participants [48]. For example, Yamada et al. [49] found 326
that is possible to promote exercise of moderate-to-vigorous intensity among very frail 327
older adults. Future studies are warranted to clarify the role of frailty in subsequent 328
MVPA levels in older adults. 329
15
Sedentary behavior has recently been considered as an important factor for numerous 330
health outcomes [50, 51]. A recent systematic review has shown that SB may be 331
associated with increased levels of frailty, particularly among the most vulnerable 332
population [52]. Interestingly, our results indicate that SB was not a determinant of 333
frailty, but rather a consequence of an altered state of increased frailty. A smaller study 334
by Edholm et al. [53] with 60 older woman found that only activities of at least 335
moderate intensity were associated with physical function in a subsequent follow-up 336
time but not activities of lighter intensity or sedentary activities. In addition, Marques et 337
al. [54], in a study conducted with 131 males and 240 females aged 65-103 years, 338
suggested that sedentary time was not a significant predictor of loss of physical 339
independence in later life. In a previous cross-sectional study, we showed that engaging 340
in high levels of MVPA (i.e., 27 minutes/day) could cancel out the detrimental effects 341
of sedentary behavior on frailty, which may partly explain our current observations [55]. 342
Given that the relationship between SB and frailty may go beyond total accumulated 343
time [12], future studies should enquire whether or not the results of this, and other 344
studies are confirmed for different patterns of accumulation of SB. 345
According to our findings, the promotion of MVPA at earlier stages will translate into 346
more MVPA and less frailty markers in the future. Also, the observations of the current 347
study point out to the possibility that the detrimental effects on frailty are primarily 348
defined by insufficient amounts of MVPA rather than an excessive amount of sedentary 349
time. Public health organizations should target MVPA to reduce the burden associated 350
with frailty in older adults. 351
Strengths and limitations 352
An important strength of our study is that includes a relatively large sample of 353
community-dwelling older adults with longitudinal data separated by 4-years. It also 354
16
includes accelerometer-derived sedentary and physical activity behavior estimations. 355
Also, although there is no established gold standard to identify frailty, the FTS has been 356
suggested as a measurement of frailty with superior predictive validity than previously 357
validated scales such as the Frailty Phenotype [56] and the Frailty Index [57]. 358
Additionally, a key strength of this study was that the statistical analysis deployed has 359
allowed to explore the auto-regressive and cross-lagged pathways in exploring how 360
frailty relates over time with both MVPA and SB. Despite the methodological rigor of 361
this study, some limitations have to be acknowledged. First, we cannot rule out the 362
possibility that our estimations could be influenced by the characteristics of the 363
participants who did not provide valid data at follow-up (i.e., older, less active, more 364
sedentary, less educated) and therefore our results should be interpreted with caution. A 365
further limitation of our work was that despite validity and widely used of 366
accelerometers to assess physical activity in free living conditions, these devices are not 367
able to discriminate between sitting and standing [58] or activity type (e.g., running vs. 368
muscle strength), which could potentially bias the estimations in our study. Finally, 369
physical activity and sedentary behavior have been examined separately from other 370
lifestyle behaviors (e.g., diet, smoking, alcohol consumption). However, lifestyle 371
behaviors tend to cluster together. Therefore, it could be that our results rather reflect 372
the synergistic consequences of different observed (i.e., physical activity and sedentary 373
behavior) and unobserved (e.g., diet quality) lifestyle behaviors [59, 60]. Future studies 374
may want to test this hypothesis. 375
376
Conclusion 377
In summary, our findings suggest that moderate-to-vigorous physical activity, but not 378
sedentary behavior, predicts frailty in older adults. In contrast, frailty seems to be a 379
17
predictor of sedentary behavior but not of moderate-to-vigorous physical activity. 380
Efforts should be directed at increasing moderate-to-vigorous physical activity from 381
earlier stages. Future experimental studies should examine the best strategies to include 382
moderate-to-vigorous physical activity in the daily lives of older people [61]. 383
384
Acknowledgements 385
We are deeply thankful to Linda Fried, Professor (University of Columbia, USA) and 386
Jack Guralnik, PhD (University of Maryland School of Medicine, USA), for their 387
assistance in reviewing the final version of the manuscript. The authors would like to 388
thank the cohort members, investigators, research associates, and team members. 389
The authors certify that they comply with the ethical guidelines for authorship and 390
publishing of the Journal of Cachexia, Sarcopenia and Muscle [62]. 391
392
Conflict of interest 393
None to declare. 394
395
Funding: 396
This work was supported by the Biomedical Research Networking Center on Frailty and 397
Healthy Aging (CIBERFES) and FEDER funds from the European Union 398
(CB16/10/00477), (CB16/10/00456) and (CB16/10/00464). It was further funded by 399
grants from the Government of Castilla-La Mancha (PI2010/020; Institute of Health 400
18
Sciences, Ministry of Health of Castilla-La Mancha, 03031-00), Spanish Government 401
(Spanish Ministry of Economy, “Ministerio de Economía y Competitividad,” Instituto 402
de Salud Carlos III, PI10/01532, PI031558, PI11/01068), and by European Grants 403
(Seventh Framework Programme: FRAILOMIC). Asier Mañas Bote received a PhD 404
grant from the Universidad de Castilla-La Mancha “Contratos predoctorales para la 405
formación de personal investigador en el marco del Plan Propio de I+D+i, cofinanciados 406
por el Fondo Social Europeo” (2015/4062). 407
408
References 409
410
1. Kontis V, Bennett JE, Mathers CD, Li G, Foreman K, Ezzati M. Future life 411
expectancy in 35 industrialised countries: projections with a Bayesian model ensemble. 412
Lancet (London, England). 2017;389(10076):1323-35. 413
2. Oeppen J, Vaupel JW. Broken limits to life expectancy. Science. 414
2002;296(5570):1029-31. 415
3. Rosenberg IH. Sarcopenia: origins and clinical relevance. The Journal of 416
nutrition. 1997;127(5 Suppl):990s-1s. 417
4. Clegg A, Young J, Iliffe S, Rikkert MO, Rockwood K. Frailty in elderly people. 418
Lancet (London, England). 2013;381(9868):752-62. 419
5. Vermeiren S, Vella-Azzopardi R, Beckwee D, Habbig AK, Scafoglieri A, Jansen 420
B, et al. Frailty and the Prediction of Negative Health Outcomes: A Meta-Analysis. 421
Journal of the American Medical Directors Association. 2016;17(12):1163.e1-.e17. 422
6. Guralnik JM, Ferrucci L, Simonsick EM, Salive ME, Wallace RB. Lower-423
extremity function in persons over the age of 70 years as a predictor of subsequent 424
disability. The New England journal of medicine. 1995;332(9):556-61. 425
19
7. Calvani R, Marini F, Cesari M, Tosato M, Anker SD, von Haehling S, et al. 426
Biomarkers for physical frailty and sarcopenia: state of the science and future 427
developments. Journal of cachexia, sarcopenia and muscle. 2015;6(4):278-86. 428
8. St-Jean-Pelletier F, Pion CH, Leduc-Gaudet JP, Sgarioto N, Zovile I, Barbat-429
Artigas S, et al. The impact of ageing, physical activity, and pre-frailty on skeletal 430
muscle phenotype, mitochondrial content, and intramyocellular lipids in men. J 431
Cachexia Sarcopenia Muscle. 2017;8(2):213-28. 432
9. Fried LP. Interventions for Human Frailty: Physical Activity as a Model. Cold 433
Spring Harb Perspect Med. 2016;6(6). 434
10. Blodgett J, Theou O, Kirkland S, Andreou P, Rockwood K. The association 435
between sedentary behaviour, moderate-vigorous physical activity and frailty in 436
NHANES cohorts. Maturitas. 2015;80(2):187-91. 437
11. Manas A, Del Pozo-Cruz B, Guadalupe-Grau A, Marin-Puyalto J, Alfaro-Acha 438
A, Rodriguez-Manas L, et al. Reallocating Accelerometer-Assessed Sedentary Time to 439
Light or Moderate- to Vigorous-Intensity Physical Activity Reduces Frailty Levels in 440
Older Adults: An Isotemporal Substitution Approach in the TSHA Study. Journal of the 441
American Medical Directors Association. 2018;19(2):185 e1- e6. 442
12. Del Pozo-Cruz B, Manas A, Martin-Garcia M, Marin-Puyalto J, Garcia-Garcia 443
FJ, Rodriguez-Manas L, et al. Frailty is associated with objectively assessed sedentary 444
behaviour patterns in older adults: Evidence from the Toledo Study for Healthy Aging 445
(TSHA). PLoS One. 2017;12(9):e0183911. 446
13. Kehler DS, Clara I, Hiebert B, Stammers AN, Hay JL, Schultz A, et al. The 447
association between bouts of moderate to vigorous physical activity and patterns of 448
sedentary behavior with frailty. Experimental gerontology. 2018;104:28-34. 449
20
14. Soler-Vila H, Garcia-Esquinas E, Leon-Munoz LM, Lopez-Garcia E, Banegas 450
JR, Rodriguez-Artalejo F. Contribution of health behaviours and clinical factors to 451
socioeconomic differences in frailty among older adults. Journal of epidemiology and 452
community health. 2016;70(4):354-60. 453
15. Stenholm S, Strandberg TE, Pitkala K, Sainio P, Heliovaara M, Koskinen S. 454
Midlife obesity and risk of frailty in old age during a 22-year follow-up in men and 455
women: the Mini-Finland Follow-up Survey. The journals of gerontology Series A, 456
Biological sciences and medical sciences. 2014;69(1):73-8. 457
16. Rogers NT, Marshall A, Roberts CH, Demakakos P, Steptoe A, Scholes S. 458
Physical activity and trajectories of frailty among older adults: Evidence from the 459
English Longitudinal Study of Ageing. PLoS One. 2017;12(2):e0170878. 460
17. Garcia-Esquinas E, Andrade E, Martinez-Gomez D, Caballero FF, Lopez-Garcia 461
E, Rodriguez-Artalejo F. Television viewing time as a risk factor for frailty and 462
functional limitations in older adults: results from 2 European prospective cohorts. The 463
international journal of behavioral nutrition and physical activity. 2017;14(1):54. 464
18. Song J, Lindquist LA, Chang RW, Semanik PA, Ehrlich-Jones LS, Lee J, et al. 465
Sedentary Behavior as a Risk Factor for Physical Frailty Independent of Moderate 466
Activity: Results From the Osteoarthritis Initiative. American journal of public health. 467
2015;105(7):1439-45. 468
19. Dogra S, Ashe MC, Biddle SJH, Brown WJ, Buman MP, Chastin S, et al. 469
Sedentary time in older men and women: an international consensus statement and 470
research priorities. British journal of sports medicine. 2017. 471
20. Selig JP, Little TD. Autoregressive and cross-lagged panel analysis for 472
longitudinal data. Handbook of developmental research methods. New York: Guildford 473
Press; 2012. p. 265-78. 474
21
21. Newsom JT. Longitudinal structural equation modeling: A comprehensive 475
introduction. New York: Taylor & Francis; 2015. 476
22. Carcaillon L, Blanco C, Alonso-Bouzon C, Alfaro-Acha A, Garcia-Garcia FJ, 477
Rodriguez-Manas L. Sex differences in the association between serum levels of 478
testosterone and frailty in an elderly population: the Toledo Study for Healthy Aging. 479
PLoS One. 2012;7(3):e32401. 480
23. Garcia-Garcia FJ, Gutierrez Avila G, Alfaro-Acha A, Amor Andres MS, De Los 481
Angeles De La Torre Lanza M, Escribano Aparicio MV, et al. The prevalence of frailty 482
syndrome in an older population from Spain. The Toledo Study for Healthy Aging. The 483
journal of nutrition, health & aging. 2011;15(10):852-6. 484
24. Rodríguez-Gómez I, Mañas A, Losa-Reyna J, Rodríguez-Mañas L, Chastin SF, 485
Alegre LM, et al. Compositional Influence of Movement Behaviours on Bone Health 486
during Ageing. Medicine and science in sports and exercise. 2019. 487
25. Garcia-Garcia FJ, Carcaillon L, Fernandez-Tresguerres J, Alfaro A, Larrion JL, 488
Castillo C, et al. A new operational definition of frailty: the Frailty Trait Scale. Journal 489
of the American Medical Directors Association. 2014;15(5):371.e7-.e13. 490
26. Schuit AJ, Schouten EG, Westerterp KR, Saris WH. Validity of the Physical 491
Activity Scale for the Elderly (PASE): according to energy expenditure assessed by the 492
doubly labeled water method. Journal of clinical epidemiology. 1997;50(5):541-6. 493
27. del Ser Quijano T, Sanchez Sanchez F, Garcia de Yebenes MJ, Otero Puime A, 494
Zunzunegui MV, Munoz DG. [Spanish version of the 7 Minute screening 495
neurocognitive battery. Normative data of an elderly population sample over 70]. 496
Neurologia (Barcelona, Spain). 2004;19(7):344-58. 497
28. Guralnik JM, Simonsick EM, Ferrucci L, Glynn RJ, Berkman LF, Blazer DG, et 498
al. A short physical performance battery assessing lower extremity function: association 499
22
with self-reported disability and prediction of mortality and nursing home admission. 500
Journal of gerontology. 1994;49(2):M85-94. 501
29. Fowkes FG, Low LP, Tuta S, Kozak J. Ankle-brachial index and extent of 502
atherothrombosis in 8891 patients with or at risk of vascular disease: results of the 503
international AGATHA study. European heart journal. 2006;27(15):1861-7. 504
30. Jones CJ, Rikli RE, Beam WC. A 30-s chair-stand test as a measure of lower 505
body strength in community-residing older adults. Research quarterly for exercise and 506
sport. 1999;70(2):113-9. 507
31. Rodríguez-Gómez I, Mañas A, Losa-Reyna J, Rodríguez-Mañas L, Chastin SF, 508
Alegre LM, et al. Associations between sedentary time, physical activity and bone 509
health among older people using compositional data analysis. PLoS One. 510
2018;13(10):e0206013. 511
32. Colley R, Connor Gorber S, Tremblay MS. Quality control and data reduction 512
procedures for accelerometry-derived measures of physical activity. Health reports. 513
2010;21(1):63-9. 514
33. Freedson PS, Melanson E, Sirard J. Calibration of the Computer Science and 515
Applications, Inc. accelerometer. Medicine and science in sports and exercise. 516
1998;30(5):777-81. 517
34. Migueles JH, Cadenas-Sanchez C, Ekelund U, Delisle Nystrom C, Mora-518
Gonzalez J, Lof M, et al. Accelerometer Data Collection and Processing Criteria to 519
Assess Physical Activity and Other Outcomes: A Systematic Review and Practical 520
Considerations. Sports medicine (Auckland, NZ). 2017. 521
35. Tombaugh TN, McIntyre NJ. The mini-mental state examination: a 522
comprehensive review. Journal of the American Geriatrics Society. 1992;40(9):922-35. 523
36. Rosseel Y. lavaan: An R Package for Structural Equation Modeling2012. 524
23
37. Enders CK, Bandalos DL. The Relative Performance of Full Information 525
Maximum Likelihood Estimation for Missing Data in Structural Equation Models. 526
Structural Equation Modeling: A Multidisciplinary Journal. 2001;8(3):430-57. 527
38. Hu Lt, Bentler PM. Cutoff criteria for fit indexes in covariance structure 528
analysis: Conventional criteria versus new alternatives. Structural Equation Modeling: 529
A Multidisciplinary Journal. 1999;6(1):1-55. 530
39. Allison PD. Missing data techniques for structural equation modeling. Journal of 531
abnormal psychology. 2003;112(4):545-57. 532
40. Rodríguez-Gómez I, Mañas A, Losa-Reyna J, Rodríguez-Mañas L, Chastin SF, 533
Alegre LM, et al. The Impact of Movement Behaviors on Bone Health in Elderly with 534
Adequate Nutritional Status: Compositional Data Analysis Depending on the Frailty 535
Status. Nutrients. 2019;11(3):582. 536
41. Rebelo-Marques A, De Sousa Lages A, Andrade R, Ribeiro CF, Mota-Pinto A, 537
Carrilho F, et al. Aging Hallmarks: The Benefits of Physical Exercise. Frontiers in 538
endocrinology. 2018;9:258. 539
42. Xue QL, Bandeen-Roche K, Mielenz TJ, Seplaki CL, Szanton SL, Thorpe RJ, et 540
al. Patterns of 12-year change in physical activity levels in community-dwelling older 541
women: can modest levels of physical activity help older women live longer? American 542
journal of epidemiology. 2012;176(6):534-43. 543
43. Zampieri S, Pietrangelo L, Loefler S, Fruhmann H, Vogelauer M, Burggraf S, et 544
al. Lifelong physical exercise delays age-associated skeletal muscle decline. The 545
journals of gerontology Series A, Biological sciences and medical sciences. 546
2015;70(2):163-73. 547
44. Sourial N, Bergman H, Karunananthan S, Wolfson C, Guralnik J, Payette H, et 548
al. Contribution of frailty markers in explaining differences among individuals in five 549
24
samples of older persons. The journals of gerontology Series A, Biological sciences and 550
medical sciences. 2012;67(11):1197-204. 551
45. Kim Y, White T, Wijndaele K, Sharp SJ, Wareham NJ, Brage S. Adiposity and 552
grip strength as long-term predictors of objectively measured physical activity in 93 015 553
adults: the UK Biobank study. International Journal of Obesity. 2017;41(9):1361. 554
46. Cooper A, Lamb M, Sharp SJ, Simmons RK, Griffin SJ. Bidirectional 555
association between physical activity and muscular strength in older adults: Results 556
from the UK Biobank study. International journal of epidemiology. 2017;46(1):141-8. 557
47. Metti AL, Best JR, Shaaban CE, Ganguli M, Rosano C. Longitudinal changes in 558
physical function and physical activity in older adults. Age and ageing. 2018. 559
48. Puts MTE, Toubasi S, Andrew MK, Ashe MC, Ploeg J, Atkinson E, et al. 560
Interventions to prevent or reduce the level of frailty in community-dwelling older 561
adults: a scoping review of the literature and international policies. Age and ageing. 562
2017;46(3):383-92. 563
49. Yamada M, Arai H, Sonoda T, Aoyama T. Community-based exercise program 564
is cost-effective by preventing care and disability in Japanese frail older adults. Journal 565
of the American Medical Directors Association. 2012;13(6):507-11. 566
50. de Rezende LF, Rey-Lopez JP, Matsudo VK, do Carmo Luiz O. Sedentary 567
behavior and health outcomes among older adults: a systematic review. BMC public 568
health. 2014;14:333. 569
51. Manas A, Del Pozo-Cruz B, Garcia-Garcia FJ, Guadalupe-Grau A, Ara I. Role 570
of objectively measured sedentary behaviour in physical performance, frailty and 571
mortality among older adults: A short systematic review. European journal of sport 572
science. 2017;17(7):940-53. 573
25
52. Kehler DS, Hay JL, Stammers AN, Hamm NC, Kimber DE, Schultz ASH, et al. 574
A systematic review of the association between sedentary behaviors with frailty. 575
Experimental gerontology. 2018;114:1-12. 576
53. Edholm P, Nilsson A, Kadi F. Physical function in older adults: Impacts of past 577
and present physical activity behaviors. Scandinavian journal of medicine & science in 578
sports. 2018. 579
54. Marques EA, Baptista F, Santos DA, Silva AM, Mota J, Sardinha LB. Risk for 580
losing physical independence in older adults: the role of sedentary time, light, and 581
moderate to vigorous physical activity. Maturitas. 2014;79(1):91-5. 582
55. Manas A, Pozo-Cruz BD, Rodriguez-Gomez I, Losa-Reyna J, Rodriguez-Manas 583
L, Garcia-Garcia FJ, et al. Can Physical Activity Offset the Detrimental Consequences 584
of Sedentary Time on Frailty? A Moderation Analysis in 749 Older Adults Measured 585
With Accelerometers. Journal of the American Medical Directors Association. 2019. 586
56. Fried LP, Tangen CM, Walston J, Newman AB, Hirsch C, Gottdiener J, et al. 587
Frailty in older adults: evidence for a phenotype. The journals of gerontology Series A, 588
Biological sciences and medical sciences. 2001;56(3):M146-56. 589
57. Rockwood K, Song X, MacKnight C, Bergman H, Hogan DB, McDowell I, et 590
al. A global clinical measure of fitness and frailty in elderly people. CMAJ : Canadian 591
Medical Association Journal. 2005;173(5):489-95. 592
58. An HS, Kim Y, Lee JM. Accuracy of inclinometer functions of the activPAL 593
and ActiGraph GT3X+: A focus on physical activity. Gait & posture. 2017;51:174-80. 594
59. Kvaavik E, Batty GD, Ursin G, Huxley R, Gale CR. Influence of individual and 595
combined health behaviors on total and cause-specific mortality in men and women: the 596
United Kingdom health and lifestyle survey. Archives of internal medicine. 597
2010;170(8):711-8. 598
26
60. McCullough ML, Patel AV, Kushi LH, Patel R, Willett WC, Doyle C, et al. 599
Following cancer prevention guidelines reduces risk of cancer, cardiovascular disease, 600
and all-cause mortality. Cancer epidemiology, biomarkers & prevention : a publication 601
of the American Association for Cancer Research, cosponsored by the American 602
Society of Preventive Oncology. 2011;20(6):1089-97. 603
61. Stamatakis E, Johnson NA, Powell L, Hamer M, Rangul V, Holtermann A. 604
Short and sporadic bouts in the 2018 US physical activity guidelines: is high-intensity 605
incidental physical activity the new HIIT? British Journal of Sports Medicine. 606
2019:bjsports-2018-100397. 607
62. von Haehling S, Morley JE, Coats AJ, Anker SD. Ethical guidelines for 608
publishing in the Journal of Cachexia, Sarcopenia and Muscle: update 2017. Journal of 609
cachexia, sarcopenia and muscle. 2017;8(6):1081-3. 610
611
612
613
614
615
616
617
618
619
620
27
Table Legends 621
622
Table 1. Sociodemographic and descriptive data. 623
Abbreviations: BMI, body mass index; MSSE, mini-mental scale examination; MVPA, 624
moderate-to-vigorous physical activity. 625 aContinuous variable; mean (standard deviation). 626 bCategorical variable; n (%). 627 cMissing data; n (%). 628
*Significant differences between baseline vs. follow-up (p<0.05). 629 ŦTrend toward significance between baseline vs. follow-up (p<0.08>0.05) 630
631
632
633
Figure Legends 634
635
Figure 1. Flow diagram of the process for obtaining the final sample of the study. 636
637
Figure 2. Cross-lagged panel model 1: Moderate-to-vigorous physical activity 638
Abbreviations: MVPA, moderate-to-vigorous physical activity Model adjusted for age, sex, BMI, education, income, marital status and MMSE Bold indicates statistical significance (p<0.05) 639
Figure 3. Cross-lagged panel model 2: Sedentary behavior 640
Model adjusted for age, sex, BMI, education, income, marital status and MMSE Bold indicates statistical significance (p<0.05) 641
28
Supplementary Files 642
643
Supplementary File 1. Comparison of characteristics at baseline of participants 644
retained with those of participants not retained from wave1-wave2. 645
Abbreviations: BMI, body mass index; MSSE, mini-mental scale examination; MVPA, 646
moderate-to-vigorous physical activity. 647 aContinuous variable; mean (standard deviation). 648 bCategorical variable; n (%). 649 cMissing data; n (%). 650
Bold indicates statistical significance (p<0.05) and Italics a trend toward significance 651
(p<0.08>0.05). 652
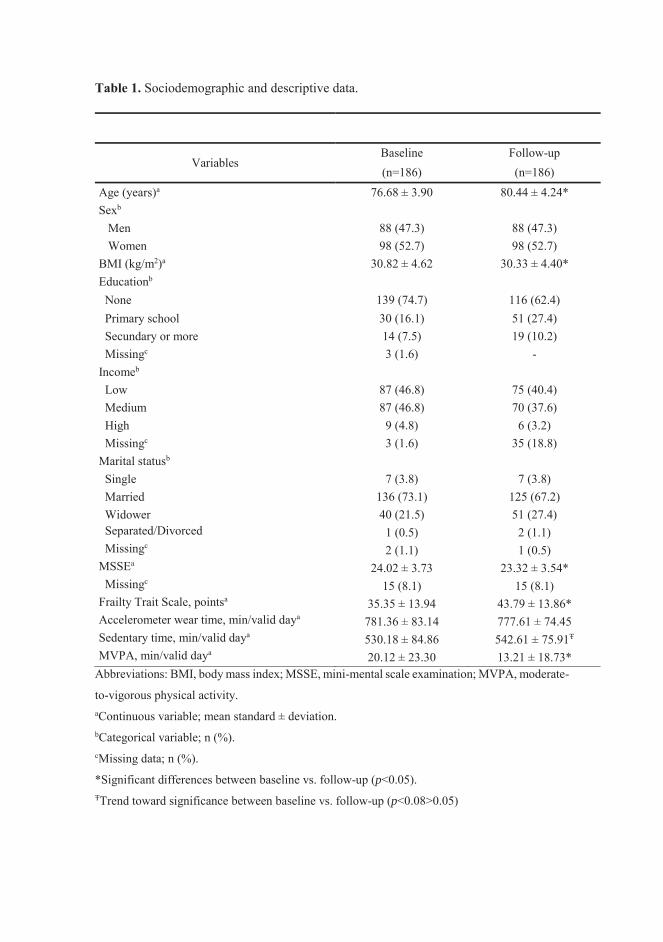
Table 1. Sociodemographic and descriptive data.
Variables Baseline Follow-up (n=186) (n=186)
Age (years)a 76.68 ± 3.90 80.44 ± 4.24* Sexb Men 88 (47.3) 88 (47.3) Women 98 (52.7) 98 (52.7) BMI (kg/m2)a 30.82 ± 4.62 30.33 ± 4.40* Educationb None 139 (74.7) 116 (62.4) Primary school 30 (16.1) 51 (27.4) Secundary or more 14 (7.5) 19 (10.2) Missingc 3 (1.6) - Incomeb Low 87 (46.8) 75 (40.4) Medium 87 (46.8) 70 (37.6) High 9 (4.8) 6 (3.2) Missingc 3 (1.6) 35 (18.8) Marital statusb Single 7 (3.8) 7 (3.8) Married 136 (73.1) 125 (67.2) Widower 40 (21.5) 51 (27.4) Separated/Divorced 1 (0.5) 2 (1.1) Missingc 2 (1.1) 1 (0.5) MSSEa 24.02 ± 3.73 23.32 ± 3.54* Missingc 15 (8.1) 15 (8.1) Frailty Trait Scale, pointsa 35.35 ± 13.94 43.79 ± 13.86* Accelerometer wear time, min/valid daya 781.36 ± 83.14 777.61 ± 74.45 Sedentary time, min/valid daya 530.18 ± 84.86 542.61 ± 75.91Ŧ MVPA, min/valid daya 20.12 ± 23.30 13.21 ± 18.73*
Abbreviations: BMI, body mass index; MSSE, mini-mental scale examination; MVPA, moderate-
to-vigorous physical activity. aContinuous variable; mean standard ± deviation. bCategorical variable; n (%). cMissing data; n (%).
*Significant differences between baseline vs. follow-up (p<0.05). ŦTrend toward significance between baseline vs. follow-up (p<0.08>0.05)
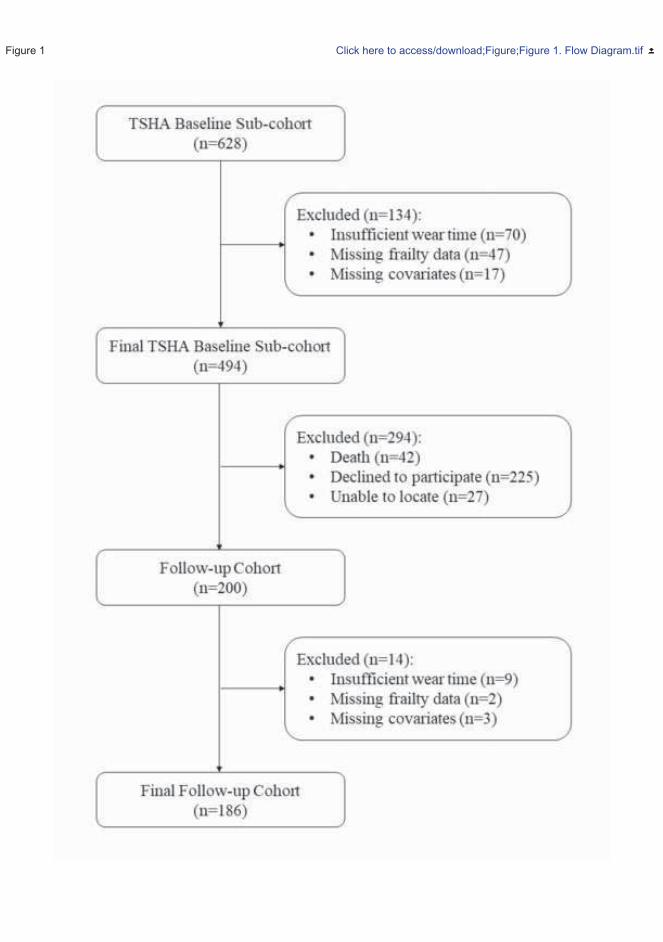
Figure 1 Click here to access/download;Figure;Figure 1. Flow Diagram.tif
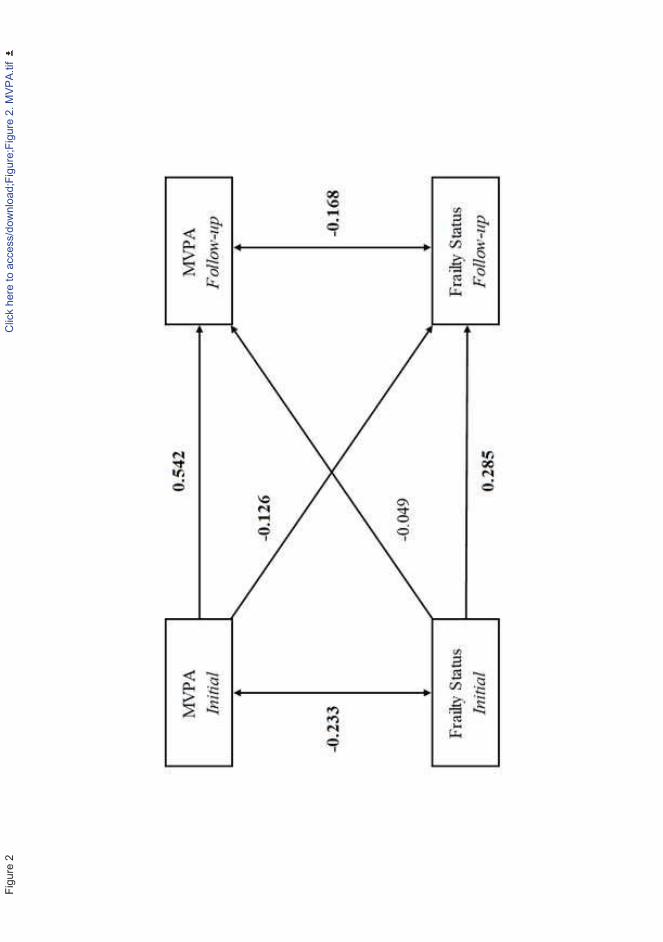
Figu
re 2
Clic
k he
re to
acc
ess/
dow
nloa
d;Fi
gure
;Fig
ure
2. M
VPA.
tif
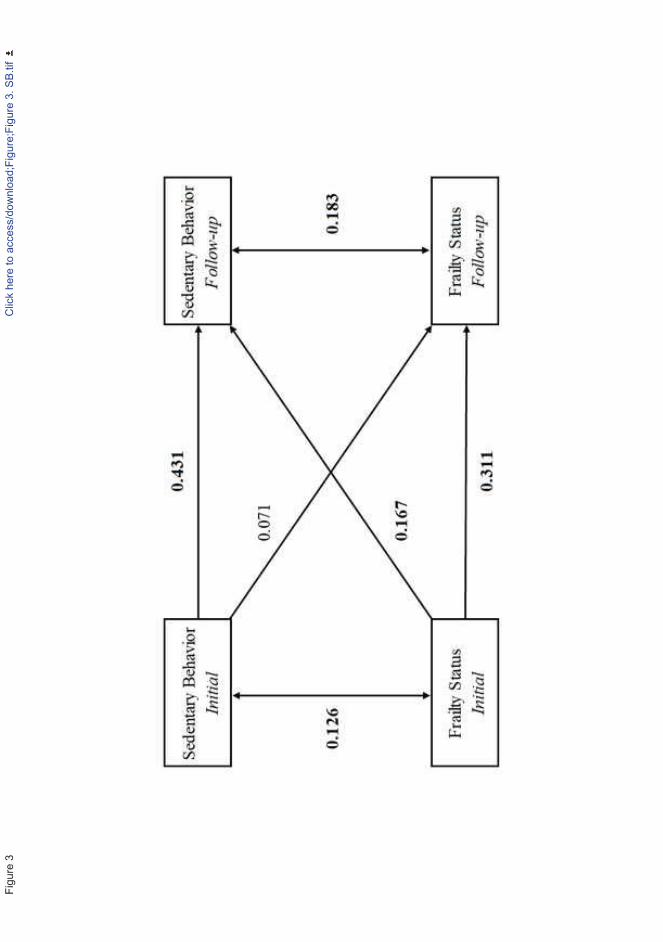
Figu
re 3
Clic
k he
re to
acc
ess/
dow
nloa
d;Fi
gure
;Fig
ure
3. S
B.tif
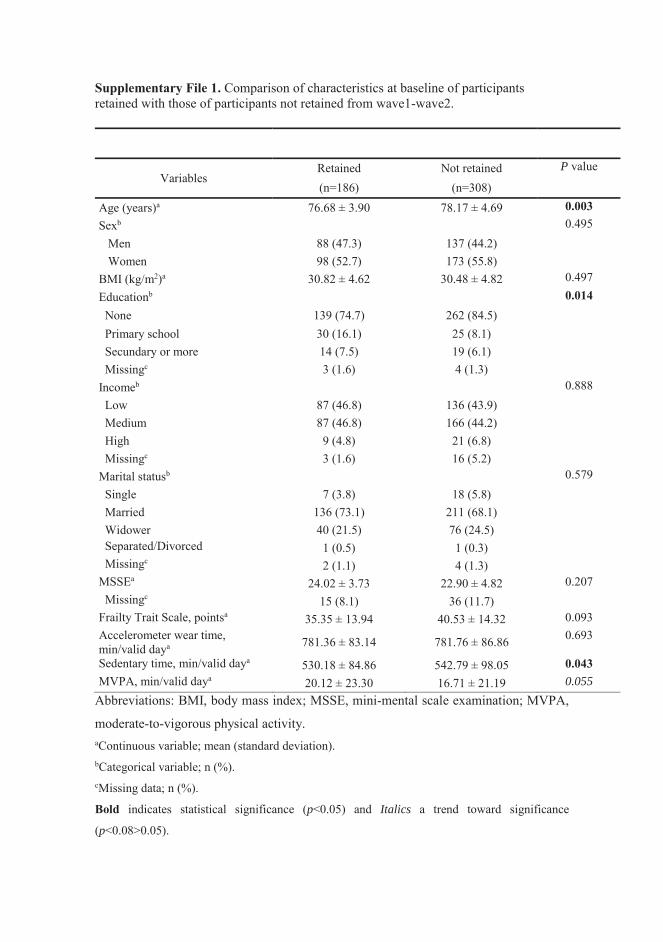
Supplementary File 1. Comparison of characteristics at baseline of participants retained with those of participants not retained from wave1-wave2.
Variables Retained Not retained P value
(n=186) (n=308)
Age (years)a 76.68 ± 3.90 78.17 ± 4.69 0.003 Sexb 0.495 Men 88 (47.3) 137 (44.2) Women 98 (52.7) 173 (55.8) BMI (kg/m2)a 30.82 ± 4.62 30.48 ± 4.82 0.497 Educationb 0.014 None 139 (74.7) 262 (84.5)
Primary school 30 (16.1) 25 (8.1) Secundary or more 14 (7.5) 19 (6.1) Missingc 3 (1.6) 4 (1.3) Incomeb 0.888 Low 87 (46.8) 136 (43.9) Medium 87 (46.8) 166 (44.2) High 9 (4.8) 21 (6.8) Missingc 3 (1.6) 16 (5.2) Marital statusb 0.579 Single 7 (3.8) 18 (5.8) Married 136 (73.1) 211 (68.1) Widower 40 (21.5) 76 (24.5) Separated/Divorced 1 (0.5) 1 (0.3) Missingc 2 (1.1) 4 (1.3) MSSEa 24.02 ± 3.73 22.90 ± 4.82 0.207 Missingc 15 (8.1) 36 (11.7) Frailty Trait Scale, pointsa 35.35 ± 13.94 40.53 ± 14.32 0.093 Accelerometer wear time, min/valid daya 781.36 ± 83.14 781.76 ± 86.86 0.693
Sedentary time, min/valid daya 530.18 ± 84.86 542.79 ± 98.05 0.043 MVPA, min/valid daya 20.12 ± 23.30 16.71 ± 21.19 0.055
Abbreviations: BMI, body mass index; MSSE, mini-mental scale examination; MVPA,
moderate-to-vigorous physical activity. aContinuous variable; mean (standard deviation). bCategorical variable; n (%). cMissing data; n (%).
Bold indicates statistical significance (p<0.05) and Italics a trend toward significance
(p<0.08>0.05).
RESULTS
249
5.7. STUDY 7
“Temporal and bidirectional
associations between breaks in
sedentary time and frailty in older
adults: A cross-lagged panel model in
the TSHA study”
RESULTS
250
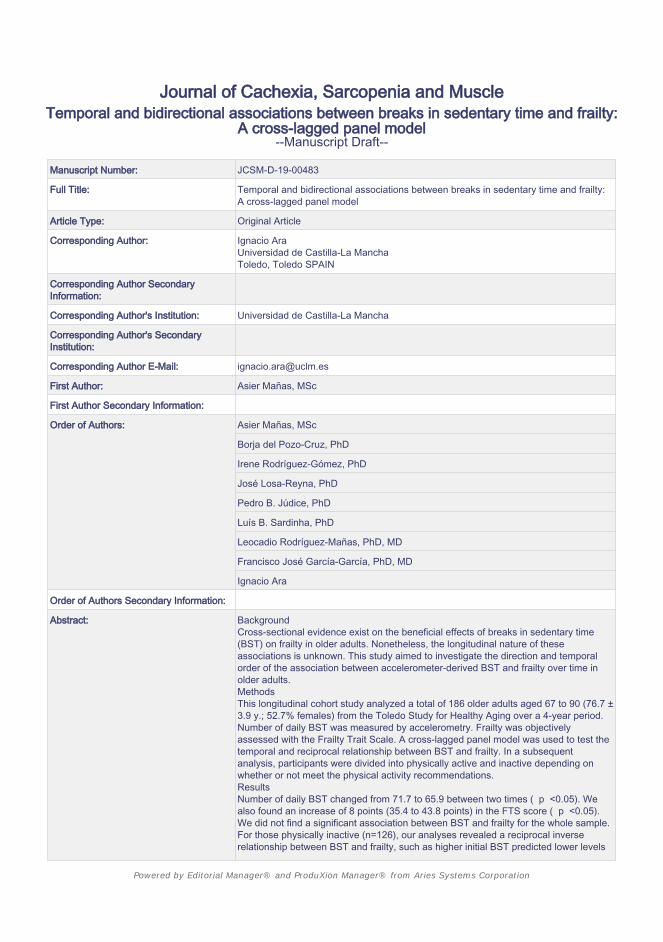
JJournal of Cachexia, Sarcopenia and Muscle
Temporal and bidirectional associations between breaks in sedentary time and frailty:A cross-lagged panel model
--Manuscript Draft--
Manuscript Number: JCSM-D-19-00483
Full Title: Temporal and bidirectional associations between breaks in sedentary time and frailty:A cross-lagged panel model
Article Type: Original Article
Corresponding Author: Ignacio AraUniversidad de Castilla-La ManchaToledo, Toledo SPAIN
Corresponding Author SecondaryInformation:
Corresponding Author's Institution: Universidad de Castilla-La Mancha
Corresponding Author's SecondaryInstitution:
Corresponding Author E-Mail: [email protected]
First Author: Asier Mañas, MSc
First Author Secondary Information:
Order of Authors: Asier Mañas, MSc
Borja del Pozo-Cruz, PhD
Irene Rodríguez-Gómez, PhD
José Losa-Reyna, PhD
Pedro B. Júdice, PhD
Luís B. Sardinha, PhD
Leocadio Rodríguez-Mañas, PhD, MD
Francisco José García-García, PhD, MD
Ignacio Ara
Order of Authors Secondary Information:
Abstract: BackgroundCross-sectional evidence exist on the beneficial effects of breaks in sedentary time(BST) on frailty in older adults. Nonetheless, the longitudinal nature of theseassociations is unknown. This study aimed to investigate the direction and temporalorder of the association between accelerometer-derived BST and frailty over time inolder adults.MethodsThis longitudinal cohort study analyzed a total of 186 older adults aged 67 to 90 (76.7 ±3.9 y.; 52.7% females) from the Toledo Study for Healthy Aging over a 4-year period.Number of daily BST was measured by accelerometry. Frailty was objectivelyassessed with the Frailty Trait Scale. A cross-lagged panel model was used to test thetemporal and reciprocal relationship between BST and frailty. In a subsequentanalysis, participants were divided into physically active and inactive depending onwhether or not meet the physical activity recommendations.ResultsNumber of daily BST changed from 71.7 to 65.9 between two times ( p <0.05). Wealso found an increase of 8 points (35.4 to 43.8 points) in the FTS score ( p <0.05).We did not find a significant association between BST and frailty for the whole sample.For those physically inactive (n=126), our analyses revealed a reciprocal inverserelationship between BST and frailty, such as higher initial BST predicted lower levels
Powered by Editorial Manager® and ProduXion Manager® from Aries Systems Corporation
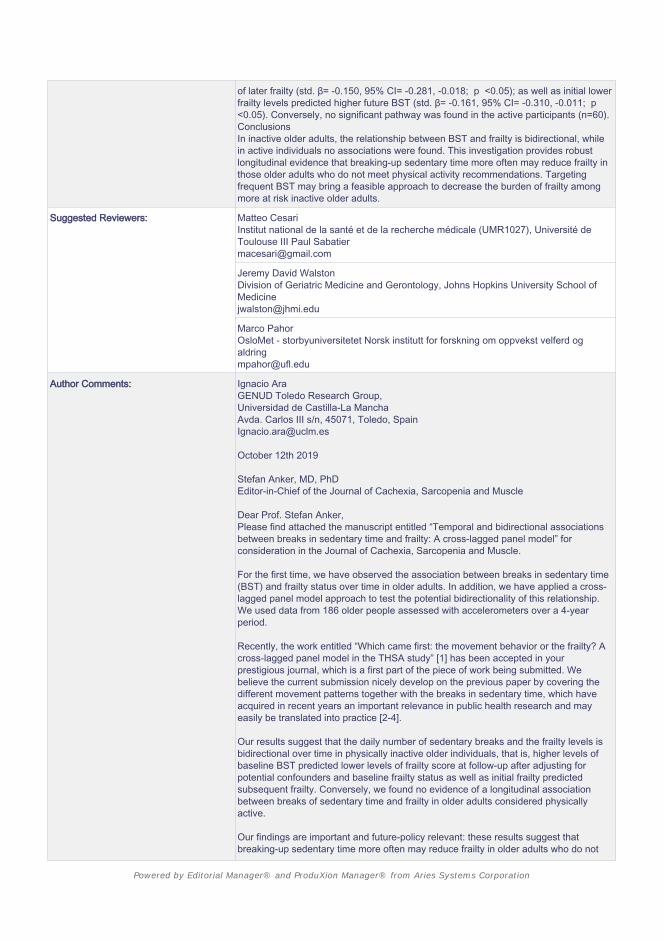
of later frailty (std. β= -0.150, 95% CI= -0.281, -0.018; p <0.05); as well as initial lowerfrailty levels predicted higher future BST (std. β= -0.161, 95% CI= -0.310, -0.011; p<0.05). Conversely, no significant pathway was found in the active participants (n=60).ConclusionsIn inactive older adults, the relationship between BST and frailty is bidirectional, whilein active individuals no associations were found. This investigation provides robustlongitudinal evidence that breaking-up sedentary time more often may reduce frailty inthose older adults who do not meet physical activity recommendations. Targetingfrequent BST may bring a feasible approach to decrease the burden of frailty amongmore at risk inactive older adults.
Suggested Reviewers: Matteo CesariInstitut national de la santé et de la recherche médicale (UMR1027), Université deToulouse III Paul [email protected]
Jeremy David WalstonDivision of Geriatric Medicine and Gerontology, Johns Hopkins University School [email protected]
Marco PahorOsloMet - storbyuniversitetet Norsk institutt for forskning om oppvekst velferd [email protected]
Author Comments: Ignacio AraGENUD Toledo Research Group,Universidad de Castilla-La ManchaAvda. Carlos III s/n, 45071, Toledo, [email protected]
October 12th 2019
Stefan Anker, MD, PhDEditor-in-Chief of the Journal of Cachexia, Sarcopenia and Muscle
Dear Prof. Stefan Anker,Please find attached the manuscript entitled “Temporal and bidirectional associationsbetween breaks in sedentary time and frailty: A cross-lagged panel model” forconsideration in the Journal of Cachexia, Sarcopenia and Muscle.
For the first time, we have observed the association between breaks in sedentary time(BST) and frailty status over time in older adults. In addition, we have applied a cross-lagged panel model approach to test the potential bidirectionality of this relationship.We used data from 186 older people assessed with accelerometers over a 4-yearperiod.
Recently, the work entitled “Which came first: the movement behavior or the frailty? Across-lagged panel model in the THSA study” [1] has been accepted in yourprestigious journal, which is a first part of the piece of work being submitted. Webelieve the current submission nicely develop on the previous paper by covering thedifferent movement patterns together with the breaks in sedentary time, which haveacquired in recent years an important relevance in public health research and mayeasily be translated into practice [2-4].
Our results suggest that the daily number of sedentary breaks and the frailty levels isbidirectional over time in physically inactive older individuals, that is, higher levels ofbaseline BST predicted lower levels of frailty score at follow-up after adjusting forpotential confounders and baseline frailty status as well as initial frailty predictedsubsequent frailty. Conversely, we found no evidence of a longitudinal associationbetween breaks of sedentary time and frailty in older adults considered physicallyactive.
Our findings are important and future-policy relevant: these results suggest thatbreaking-up sedentary time more often may reduce frailty in older adults who do not
Powered by Editorial Manager® and ProduXion Manager® from Aries Systems Corporation
meet physical activity recommendations and therefore, targeting frequent reductions insedentary time may provide with a feasible approach to reduce the burden of frailtyamong more at risk inactive older adults.
We will also take this opportunity to state that this is an original piece of research thathas never been submitted elsewhere.
We hope that you consider this submission positively and look forward to hearing fromyou.Yours sincerely,Ignacio Ara (on behalf of all authors)
References
1.Manas A, Pozo-Cruz BD, Rodriguez-Gomez I, Losa-Reyna J, Rodriguez-Manas L,Garcia-Garcia FJ, et al. Which came first: the movement behavior or the frailty? Across-lagged panel model in the TSHA study. J Cachexia Sarcopenia Muscle. 2019.2.Chastin SF, Egerton T, Leask C, Stamatakis E. Meta-analysis of the relationshipbetween breaks in sedentary behavior and cardiometabolic health. Obesity (SilverSpring, Md). 2015;23(9):1800-10.3.Healy GN, Dunstan DW, Salmon J, Cerin E, Shaw JE, Zimmet PZ, et al. Breaks insedentary time: beneficial associations with metabolic risk. Diabetes care.2008;31(4):661-6.4.Loh R, Stamatakis E, Folkerts D, Allgrove JE, Moir HJ. Effects of InterruptingProlonged Sitting with Physical Activity Breaks on Blood Glucose, Insulin andTriacylglycerol Measures: A Systematic Review and Meta-analysis. Sports medicine(Auckland, NZ). 2019.
Powered by Editorial Manager® and ProduXion Manager® from Aries Systems Corporation
Temporal and bidirectional associations between breaks in sedentary time and 1
frailty: A cross-lagged panel model 2
3
Asier Mañasa,b* MSc, [email protected] 4
Borja del Pozo-Cruzc* PhD, [email protected] 5
Irene Rodríguez-Gómeza,b PhD, [email protected] 6
José Losa-Reynaa,b,d PhD, [email protected] 7
Pedro B. Júdicee PhD, [email protected] 8
Luís B. Sardinhae PhD, [email protected] 9
Leocadio Rodríguez-Mañasb,f PhD, MD, [email protected] 10
Francisco J. García-Garcíab,dᶿ PhD, MD, [email protected] 11
Ignacio Araa,bᶿ† PhD, [email protected] 12
13
aGENUD Toledo Research Group, University of Castilla-La Mancha (Toledo, Spain). 14
bCIBER of Frailty and Healthy Aging (CIBERFES). 15
cMotivation and Behaviour Research Program, Institute for Positive Psychology and 16
Education, Faculty of Health Sciences, Australian Catholic University, Sydney, 17
Australia. 18
dGeriatric Department. Hospital Virgen del Valle (Toledo, Spain). 19
eExercise and Health Laboratory, CIPER, Faculdade de Motricidade Humana, 20
Universidade de Lisboa (Lisbon, Portugal). 21
Manuscript Click here to access/download;Manuscript;Manas et alManuscript.docx
Click here to view linked References
1 2 3 4 5 6 7 8 9 1011121314151617181920212223242526272829303132333435363738394041424344454647484950515253545556575859606162636465
fGeriatric Department. Hospital Universitario de Getafe (Getafe, Spain). 22
*These authors contributed equally to this work. 23
ᶿThese authors contributed equally to this work. 24
†Address correspondence to Ignacio Ara, GENUD Toledo Research Group, University 25
of Castilla-La Mancha, Avda. Carlos III s/n, 45071, Toledo, Spain. 26
E-mail address: [email protected] (Ignacio Ara) 27
28
Word count: 3539 29
30
31
32
33
34
35
36
37
38
39
40
41
1 2 3 4 5 6 7 8 9 1011121314151617181920212223242526272829303132333435363738394041424344454647484950515253545556575859606162636465
Abstract 42
Background: Cross-sectional evidence exist on the beneficial effects of breaks in 43
sedentary time (BST) on frailty in older adults. Nonetheless, the longitudinal nature of 44
these associations is unknown. This study aimed to investigate the direction and 45
temporal order of the association between accelerometer-derived BST and frailty over 46
time in older adults. 47
Methods: This longitudinal cohort study analyzed a total of 186 older adults aged 67 to 48
90 (76.7 ± 3.9 y.; 52.7% females) from the Toledo Study for Healthy Aging over a 4-49
year period. Number of daily BST was measured by accelerometry. Frailty was 50
objectively assessed with the Frailty Trait Scale. A cross-lagged panel model was used 51
to test the temporal and reciprocal relationship between BST and frailty. In a subsequent 52
analysis, participants were divided into physically active and inactive depending on 53
whether or not meet the physical activity recommendations. 54
Results: Number of daily BST changed from 71.7 to 65.9 between two times (p<0.05). 55
We also found an increase of 8 points (35.4 to 43.8 points) in the FTS score (p<0.05). 56
We did not find a significant association between BST and frailty for the whole sample. 57
For those physically inactive (n=126), our analyses revealed a reciprocal inverse 58
relationship between BST and frailty, such as higher initial BST predicted lower levels 59
of later frailty (std. β= -0.150, 95% CI= -0.281, -0.018; p<0.05); as well as initial lower 60
frailty levels predicted higher future BST (std. β= -0.161, 95% CI= -0.310, -0.011; 61
p<0.05). Conversely, no significant pathway was found in the active participants 62
(n=60). 63
Conclusions: In inactive older adults, the relationship between BST and frailty is 64
bidirectional, while in active individuals no associations were found. This investigation 65
1 2 3 4 5 6 7 8 9 1011121314151617181920212223242526272829303132333435363738394041424344454647484950515253545556575859606162636465
provides robust longitudinal evidence that breaking-up sedentary time more often may 66
reduce frailty in those older adults who do not meet physical activity recommendations. 67
Targeting frequent BST may bring a feasible approach to decrease the burden of frailty 68
among more at risk inactive older adults. 69
70
Keywords: Structural equation modeling; Longitudinal; Patterns; Sedentary time; 71
Ageing; Functioning and disability 72
73
Abbreviations 74
MVPA: Moderate-to-Vigorous Physical Activity 75
ST: Sedentary Time 76
BST: Breaks in Sedentary Time 77
TSHA: Toledo Study of Health Aging 78
FTS: Frailty Trait Scale 79
RMSEA: Root Mean Square Error of Approximation 80
SRMR: Standardized Root Mean Square Residual 81
CFI: Confirmatory Fit Index 82
TLI: Tucker-Lewis Index 83
CI: Confidence Interval 84
85
86
1 2 3 4 5 6 7 8 9 1011121314151617181920212223242526272829303132333435363738394041424344454647484950515253545556575859606162636465
Introduction 87
Frailty is a condition of increased vulnerability associated with aging that leads to a 88
number of adverse health outcomes, including disability, falls, hospitalization, and 89
death [1]. During the past decade, robust evidence has continued to accumulate on the 90
health benefits of optimal levels of moderate-to-vigorous physical activity (MVPA) [2-91
4], including frailty [5-8]. Consequently, physical activity, particularly of moderate-to-92
vigorous intensity is considered as one of the keystones to prevent, delay, or even 93
reverse the frailty syndrome in older adults [9]. Unfortunately, MVPA occupies 2-3% of 94
the waking day in older adults [5, 10-12]. The majority of waking time is spent in 95
sedentary behaviors (i.e., sitting or reclining). Sedentary time (ST) is increasingly 96
recognized as a novel risk factor for the wider health of individuals [13, 14], also 97
comprising frailty [15, 16]. For instance, a cross-sectional study with 3146 older people 98
in the USA showed that total time spent sitting was associated with frailty [7]. Other 99
studies seem to confirm this ST throughout the day (i.e., frequency of breaks in ST 100
(BST)) have been demonstrated to be relevant for a variety of health-related outcomes 101
including physical function, performance of activities of daily living, and disability [17-102
20]. Two studies in the field found that breaking-up ST was associated with better 103
physical function in older adults [19, 20]. However, in a sample of high functioning and 104
high active older adults, more time spent in sedentary behavior and lower BST were 105
associated with improved lower limb extensor muscle quality [21]. These findings 106
suggest that the relationship between BST and health outcomes may vary depending on 107
whether the sample is active or inactive. 108
The number of studies assessing the role of BST on frailty is scarce [15]. A recent 109
cross-sectional study with 519 participants ≥65 years old assessed with accelerometers 110
concluded that increasing daily BST was associated with less frailty in the population 111
1 2 3 4 5 6 7 8 9 1011121314151617181920212223242526272829303132333435363738394041424344454647484950515253545556575859606162636465
studied, regardless of meeting physical activity guidelines [22]. In contrast, in another 112
cross-sectional study with 2317 people from the National Health and Nutrition 113
Examination Survey (NHANES), it was found no association between the frequency of 114
BST and frailty [8]. Nonetheless, the longitudinal association of BST and frailty 115
outcomes remains unknown. In addition, there is the possibility of reverse causality, 116
such as a high level of frailty being associated with lower number of BST in the future. 117
Understanding the temporal order underpinning the relationship between BST and 118
frailty has the potential to inform future public health interventions aimed to reduce the 119
frailty burden among older adults. 120
In this study, we used a cross-lagged panel model to investigate the longitudinal and 121
temporal order of the association between the number of daily BST and frailty in a 122
sample of community-dwelling older adults assessed with accelerometers over a 4-year 123
period. Based on some literature findings [21], we conducted the analyses in the whole 124
sample as well as separately for physically inactive and active participants, to determine 125
the potential impact of BST on these two groups. We hypothesized that there will be no 126
relationship between daily BST and frailty in the whole sample or in physically active 127
individuals, while the association will be inversely reciprocal between those physically 128
inactive individuals. 129
130
Methods 131
Study Design and Participants 132
This is a longitudinal study involving two data collection time points separated by 4 133
years (3.8 ± 0.8 years). This investigation used data from the second and third waves of 134
the Toledo Study of Health Aging (TSHA). Details of the protocol of the TSHA have 135
1 2 3 4 5 6 7 8 9 1011121314151617181920212223242526272829303132333435363738394041424344454647484950515253545556575859606162636465
been described elsewhere [23, 24]. In brief, the TSHA is a population prospective 136
cohort study designed to examine the determinants and consequences of frailty in 137
community-dwelling individuals ≥65 years residing in the province of Toledo, Spain. In 138
the present study, a subsample of the TSHA with accelerometer data was included. The 139
baseline assessment for this study started in July 2012 and lasted until June 2014. A 140
total of 277 men and 351 women over 65 years of age were assessed at baseline. 141
However, 494 participants finally provided valid data for the analyses [270 females 142
(54.7%)]. Those 494 participants were contacted again in 2015 and invited to participate 143
in a follow-up study, conducted between May 2015 and July 2017 [25]. Of the 494 144
participants invited to partake in the follow-up study, 200 participants (59.5% missing) 145
completed the second evaluation. Of these, 186 participants (98 women (52.7%) with 146
complete data on all exposures, outcomes and ≥80% covariates were included in the 147
final analyses of this study. The flow of participants in the study have been described 148
elsewhere [26]. Signed informed consent was obtained from all participants prior to 149
their involvement in the study. The study was approved by the Clinical Research Ethics 150
Committee of the Toledo Hospital (approval code: 2010/93), which was conducted 151
according to the ethical standards defined in the 1964 Declaration of Helsinki. 152
Measurements 153
Frailty status 154
Frailty was assessed using the Frailty Trait Scale (FTS) [27]. The FTS includes 7 155
domains to complete a continuous frailty scale in which the more decrease in the 156
biological reserve, the closer it is to the threshold of presenting adverse effects derived 157
from it (functional deterioration, hospitalization, mortality, etc.). These domains 158
become operational through 12 items [27]: 159
1 2 3 4 5 6 7 8 9 1011121314151617181920212223242526272829303132333435363738394041424344454647484950515253545556575859606162636465
1. Body mass index, waist circumference, unintentional weight loss and serum 160
albumin level were used to assess energy balance and nutrition. 161
2. Activity was assessed using the total score of the Physical Activity Scale for the 162
Elderly [28]. 163
3. The nervous system was calculated by considering verbal fluency and balance. 164
Verbal fluency was estimated by asking the participants to give names of 165
animals during one minute [29]. Balance was measured by Romberg test[30]. 166
4. The vascular system was measured by the brachial-ankle index done with 167
Doppler ultrasound [31]. 168
5. Weakness was estimated assessing grip strength in the dominant arm and the 169
knee extension strength [24]. 170
6. Endurance was assessed by the chair stand test, which measures the number of 171
times that a person stands up in 30 seconds [32]. 172
7. Slowness was estimated by calculating the time to walk 3 m at a “normal pace” 173
according to a standard protocol [30]. 174
Each item score was obtained as recommended elsewhere [27]. The total score was 175
calculated according to the formula Total score = (Σ items score/total score possible by 176
individual)*100, standardizing the measure to a range from 0 (less frailty) to 100 (more 177
frailty). 178
To be included in the study, the participants had to overcome at least 75% (9 of the 12) 179
of the items included in the FTS [27]. 180
Physical activity and sedentary behavior assessment 181
Physical activity and ST were measured by accelerometry (ActiTrainer and wGT3X-182
BT, ActiGraph, LLC, Pensacola, FL) as previously described [5]. Briefly, all 183
1 2 3 4 5 6 7 8 9 1011121314151617181920212223242526272829303132333435363738394041424344454647484950515253545556575859606162636465
participants were asked to wear the accelerometer on the left hip during waking hours of 184
a whole week, with exception for water activities. A valid day was defined as having 185
≥480 min (≥8 h) of monitor wear, and the study included the results from participants 186
with at least four valid days [33, 34]. 187
Each minute during which the accelerometer counts were below 100 cpm was defined 188
as ST [35, 36]. BST was defined as at least 1 min where the accelerometer registers 189
≥100 cpm following a sedentary period. Number of daily BST was then calculated to be 190
used in the analyses. 191
Accelerometer counts more than or equal to 100 cpm were classified as physical activity 192
with additional separation into light-intensity (LPA: 100–1951 cpm), moderate-intensity 193
(MPA: 1952-5724 cpm), and vigorous-intensity (VPA: ≥5725 cpm) physical activity. 194
In addition, compliance with physical activity recommendations was calculated in order 195
to classify individuals as active or inactive at the baseline moment. To be active, at least 196
one of these three premises had to be met [37]: accumulate 150 minutes of moderate 197
physical activity per week; accumulate 75 minutes of vigorous physical activity per 198
week; or accumulate 150 minutes per week of an equivalent combination of MVPA. 199
Anthropometrics and confounding variables 200
Height and weight were measured using a balance-stadiometer with a precision of 100 g 201
and 1 mm, respectively (Seca 711 scales, Hamburg, Germany). Individuals removed 202
their shoes, socks and heavy clothes prior to weighing. Body mass index was 203
determined as weight (kg) divided by height squared (m2). 204
Participants were asked about their age, sex, and ethnicity. Other sociodemographic 205
variables such as education (no studies, primary school completed, secondary school 206
completed or more) and marital status (single, married/living together, widowed, 207
1 2 3 4 5 6 7 8 9 1011121314151617181920212223242526272829303132333435363738394041424344454647484950515253545556575859606162636465
divorced/separated) were also self-reported in face-to-face interviews. Mini-Mental 208
State Examination was also collected in order to evaluate objective cognitive function 209
[38]. 210
Statistical analysis 211
All analyses were conducted with the R software (R project version 3.5.1) and 212
significance level was set at usual P<0.05. Baseline participants that did and did not 213
complete the follow-up assessment were compared on their demographics and other 214
characteristics with an independent t-test or chi-square test for continuous and 215
categorical variables, respectively. The Mean ± SD and frequencies (percentages) were 216
used to describe continuous variables and categorical variables respectively. A paired t-217
test was used to compare participants retained in the study across time points of 218
assessment. An independent t-test was conducted to compare active and inactive 219
participants. 220
We addressed our main objective using a structural equation modeling framework using 221
functions from the R package Lavaan [39]. The full information maximum likelihood 222
was used to provide unbiased and efficient estimates of the parameters of interest using 223
the complete available information [40]. A cross-lagged panel model was designed to 224
test the relationships between number of daily BST and frailty status between the initial 225
assessment and the 4-year follow-up. Among the strengths of using a cross-lagged panel 226
approach is that it tolerates simultaneous analysis of the two dependent outcomes, 227
thereby allowing the identification of possible bidirectional associations over time. 228
Covariates included sex as time-invariant variable, in addition to age, education, marital 229
status, body mass index, Mini-Mental State Examination, MVPA, and accelerometer 230
wear time as time-variant. Subsequently, two more cross-lagged panel models were 231
made by stratifying the sample in those active and inactive individuals. Model fit was 232
1 2 3 4 5 6 7 8 9 1011121314151617181920212223242526272829303132333435363738394041424344454647484950515253545556575859606162636465
considered using a selection of fit indices and criteria as previously published [41]: root 233
mean square error of approximation (RMSEA) (≤0.06), standardized root mean square 234
residual (SRMR) (≤0.08), confirmatory fit index (CFI) (≥0.95), and Tucker-Lewis index 235
(TLI) (≥0.95). 236
237
Results 238
Attrition data across time points 239
Participants decreased from 494 with complete data at baseline to 186 with complete 240
data at follow-up assessment [26]. The causes and numbers who were lost to the follow-241
up assessment were death (n=42), withdrawing (n=225), and could not be located 242
(n=27). Additional missing data were lost by insufficient accelerometer wear time data 243
(n=9), missing frailty data (n=2) or losing ≥80% of the covariates (n=3). Compared with 244
the retained sample, individuals who dropped the study at 4-year follow-up were 245
significantly older, less educated and spent more time on ST (Supplementary File 1). 246
Missing data were addressed using a full information maximum likelihood algorithm, as 247
recommended elsewhere [42]. 248
Descriptive statistics 249
Table 1 displays the descriptive statistics for frailty, accelerometry variables as well as 250
confounders at each of the two measurement time-points divided into the whole sample, 251
active individuals, and inactive individuals. At baseline, the whole sample had a mean 252
age of 76.68 (SD=3.90), a mean FTS of 35.35 (SD=13.94), and a mean daily BST 253
(n/day) of 71.66 (SD=18.54). FTS score and daily BST declined significantly from 254
baseline to follow-up (P<0.05). Body mass index, MSSE, and MVPA also decreased 255
significantly between both time points (all P<0.05). According to the current physical 256
1 2 3 4 5 6 7 8 9 1011121314151617181920212223242526272829303132333435363738394041424344454647484950515253545556575859606162636465
activity guidelines [37], one third of the sample (n=60) was categorized as physically 257
active and the remaining as physically inactive (n=126). There were significant 258
differences between baseline and follow-up in body mass index, FTS, and MVPA for 259
physically active individuals (all P<0.05). For those physically inactive, significant 260
differences between baseline and follow-up were found in MSSE, FTS, and daily BST. 261
Compared to physically active participants, those physically inactive were older, had a 262
higher body mass index, greater FTS, lower accelerometer wear time, and spent more 263
time in ST and lower time in LPA and MVPA. There were not significant differences in 264
daily BST between the two groups. 265
Cross-lagged panel model 1: Total sample 266
Figure 1 shows the final cross-lagged model for the whole sample. The model fit the 267
data well (RMSEA=0.000; SRMR=0.012; CFI=1.000; TLI=1.010). Significant 268
associations were only detected in the autoregressive pathways. That is, initial daily 269
BST predicted future daily BST (standardized regression coefficient [β]=0.366, 95% 270
Confidence Interval [CI]=0.253, 0.480; P<0.01) and baseline frailty scores predicted 271
future frailty scores, respectively (β=0.320, CI=0.204, 0.436; P<0.01). The cross-lagged 272
effect from baseline daily BST to follow-up frailty status was not statistically significant 273
(β=-0.081, 95% CI=-0.182, 0.020; P=0.12). Similarly, the cross-lagged effect from 274
initial frailty status to later daily BST was also not statistically significant (β=-0.130, 275
95% CI=-0.268, 0.008; P=0.07). 276
Cross-lagged panel model 2: Physically active individuals 277
Figure 2 shows the final cross-lagged model for the physically active individuals. The 278
model fit the data well (RMSEA=0.025; SRMR=0.025; CFI=0.992; TLI=0.980). As in 279
the previous model, the autoregressive pathways were the only significant ones. 280
1 2 3 4 5 6 7 8 9 1011121314151617181920212223242526272829303132333435363738394041424344454647484950515253545556575859606162636465
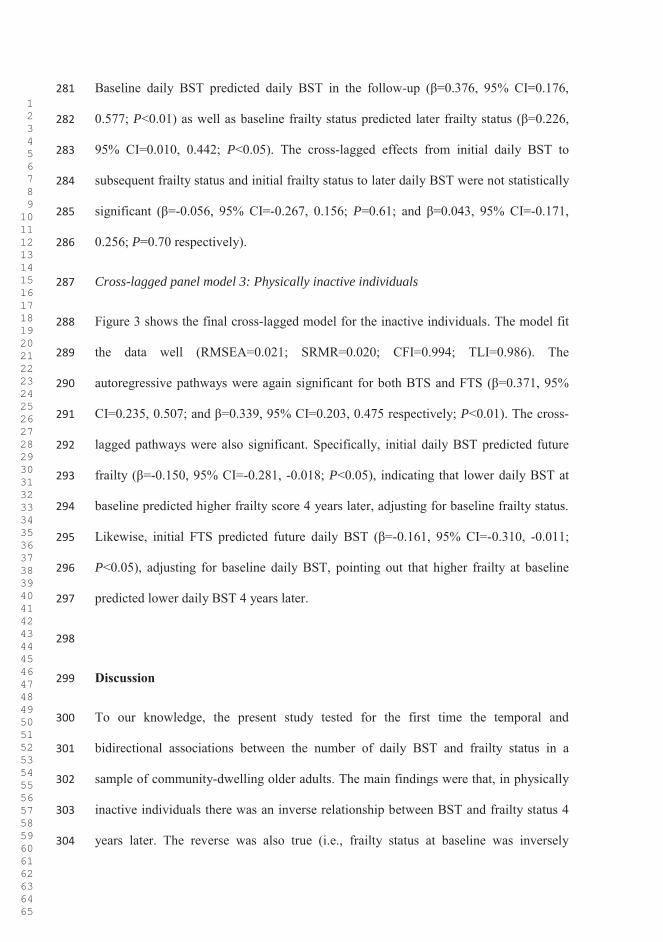
Baseline daily BST predicted daily BST in the follow-up (β=0.376, 95% CI=0.176, 281
0.577; P<0.01) as well as baseline frailty status predicted later frailty status (β=0.226, 282
95% CI=0.010, 0.442; P<0.05). The cross-lagged effects from initial daily BST to 283
subsequent frailty status and initial frailty status to later daily BST were not statistically 284
significant (β=-0.056, 95% CI=-0.267, 0.156; P=0.61; and β=0.043, 95% CI=-0.171, 285
0.256; P=0.70 respectively). 286
Cross-lagged panel model 3: Physically inactive individuals 287
Figure 3 shows the final cross-lagged model for the inactive individuals. The model fit 288
the data well (RMSEA=0.021; SRMR=0.020; CFI=0.994; TLI=0.986). The 289
autoregressive pathways were again significant for both BTS and FTS (β=0.371, 95% 290
CI=0.235, 0.507; and β=0.339, 95% CI=0.203, 0.475 respectively; P<0.01). The cross-291
lagged pathways were also significant. Specifically, initial daily BST predicted future 292
frailty (β=-0.150, 95% CI=-0.281, -0.018; P<0.05), indicating that lower daily BST at 293
baseline predicted higher frailty score 4 years later, adjusting for baseline frailty status. 294
Likewise, initial FTS predicted future daily BST (β=-0.161, 95% CI=-0.310, -0.011; 295
P<0.05), adjusting for baseline daily BST, pointing out that higher frailty at baseline 296
predicted lower daily BST 4 years later. 297
298
Discussion 299
To our knowledge, the present study tested for the first time the temporal and 300
bidirectional associations between the number of daily BST and frailty status in a 301
sample of community-dwelling older adults. The main findings were that, in physically 302
inactive individuals there was an inverse relationship between BST and frailty status 4 303
years later. The reverse was also true (i.e., frailty status at baseline was inversely 304
1 2 3 4 5 6 7 8 9 1011121314151617181920212223242526272829303132333435363738394041424344454647484950515253545556575859606162636465
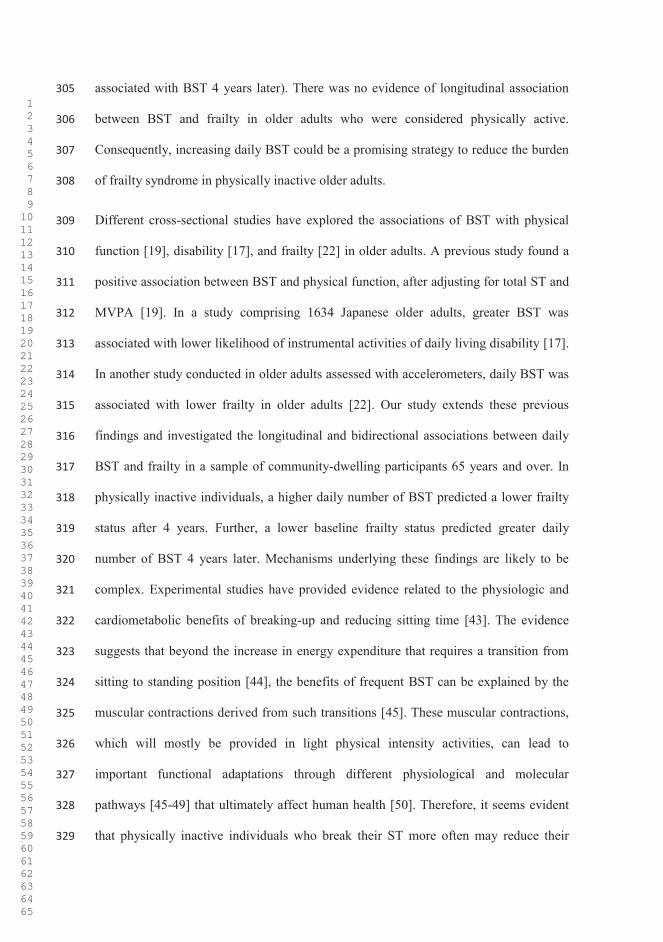
associated with BST 4 years later). There was no evidence of longitudinal association 305
between BST and frailty in older adults who were considered physically active. 306
Consequently, increasing daily BST could be a promising strategy to reduce the burden 307
of frailty syndrome in physically inactive older adults. 308
Different cross-sectional studies have explored the associations of BST with physical 309
function [19], disability [17], and frailty [22] in older adults. A previous study found a 310
positive association between BST and physical function, after adjusting for total ST and 311
MVPA [19]. In a study comprising 1634 Japanese older adults, greater BST was 312
associated with lower likelihood of instrumental activities of daily living disability [17]. 313
In another study conducted in older adults assessed with accelerometers, daily BST was 314
associated with lower frailty in older adults [22]. Our study extends these previous 315
findings and investigated the longitudinal and bidirectional associations between daily 316
BST and frailty in a sample of community-dwelling participants 65 years and over. In 317
physically inactive individuals, a higher daily number of BST predicted a lower frailty 318
status after 4 years. Further, a lower baseline frailty status predicted greater daily 319
number of BST 4 years later. Mechanisms underlying these findings are likely to be 320
complex. Experimental studies have provided evidence related to the physiologic and 321
cardiometabolic benefits of breaking-up and reducing sitting time [43]. The evidence 322
suggests that beyond the increase in energy expenditure that requires a transition from 323
sitting to standing position [44], the benefits of frequent BST can be explained by the 324
muscular contractions derived from such transitions [45]. These muscular contractions, 325
which will mostly be provided in light physical intensity activities, can lead to 326
important functional adaptations through different physiological and molecular 327
pathways [45-49] that ultimately affect human health [50]. Therefore, it seems evident 328
that physically inactive individuals who break their ST more often may reduce their 329
1 2 3 4 5 6 7 8 9 1011121314151617181920212223242526272829303132333435363738394041424344454647484950515253545556575859606162636465
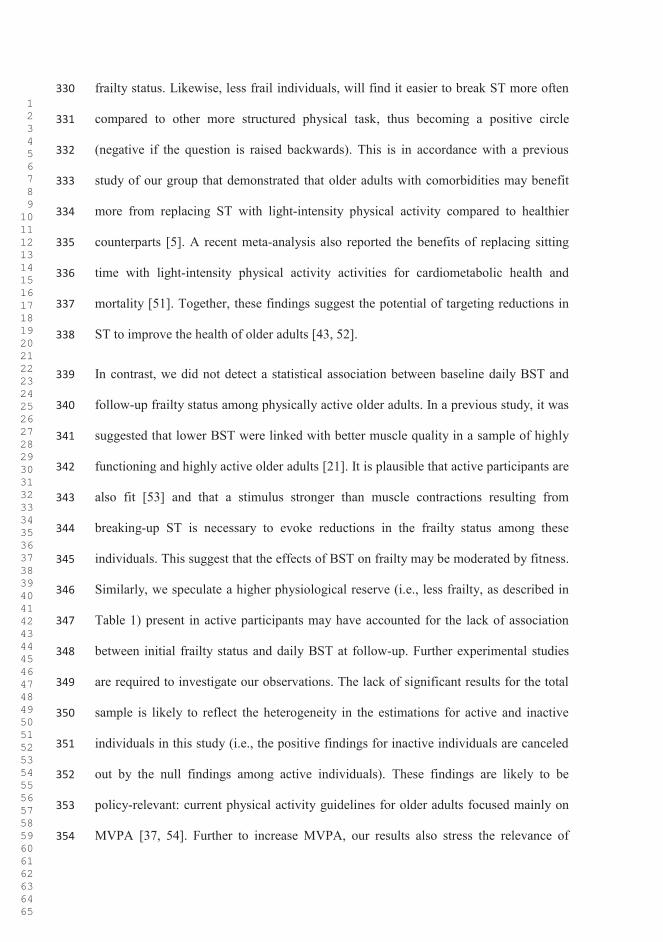
frailty status. Likewise, less frail individuals, will find it easier to break ST more often 330
compared to other more structured physical task, thus becoming a positive circle 331
(negative if the question is raised backwards). This is in accordance with a previous 332
study of our group that demonstrated that older adults with comorbidities may benefit 333
more from replacing ST with light-intensity physical activity compared to healthier 334
counterparts [5]. A recent meta-analysis also reported the benefits of replacing sitting 335
time with light-intensity physical activity activities for cardiometabolic health and 336
mortality [51]. Together, these findings suggest the potential of targeting reductions in 337
ST to improve the health of older adults [43, 52]. 338
In contrast, we did not detect a statistical association between baseline daily BST and 339
follow-up frailty status among physically active older adults. In a previous study, it was 340
suggested that lower BST were linked with better muscle quality in a sample of highly 341
functioning and highly active older adults [21]. It is plausible that active participants are 342
also fit [53] and that a stimulus stronger than muscle contractions resulting from 343
breaking-up ST is necessary to evoke reductions in the frailty status among these 344
individuals. This suggest that the effects of BST on frailty may be moderated by fitness. 345
Similarly, we speculate a higher physiological reserve (i.e., less frailty, as described in 346
Table 1) present in active participants may have accounted for the lack of association 347
between initial frailty status and daily BST at follow-up. Further experimental studies 348
are required to investigate our observations. The lack of significant results for the total 349
sample is likely to reflect the heterogeneity in the estimations for active and inactive 350
individuals in this study (i.e., the positive findings for inactive individuals are canceled 351
out by the null findings among active individuals). These findings are likely to be 352
policy-relevant: current physical activity guidelines for older adults focused mainly on 353
MVPA [37, 54]. Further to increase MVPA, our results also stress the relevance of 354
1 2 3 4 5 6 7 8 9 1011121314151617181920212223242526272829303132333435363738394041424344454647484950515253545556575859606162636465
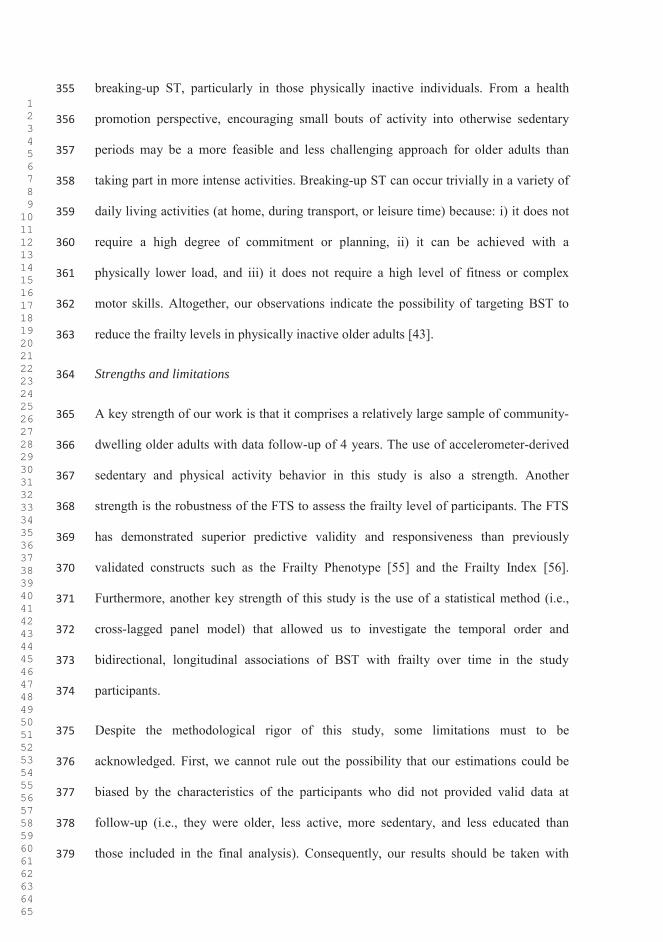
breaking-up ST, particularly in those physically inactive individuals. From a health 355
promotion perspective, encouraging small bouts of activity into otherwise sedentary 356
periods may be a more feasible and less challenging approach for older adults than 357
taking part in more intense activities. Breaking-up ST can occur trivially in a variety of 358
daily living activities (at home, during transport, or leisure time) because: i) it does not 359
require a high degree of commitment or planning, ii) it can be achieved with a 360
physically lower load, and iii) it does not require a high level of fitness or complex 361
motor skills. Altogether, our observations indicate the possibility of targeting BST to 362
reduce the frailty levels in physically inactive older adults [43]. 363
Strengths and limitations 364
A key strength of our work is that it comprises a relatively large sample of community-365
dwelling older adults with data follow-up of 4 years. The use of accelerometer-derived 366
sedentary and physical activity behavior in this study is also a strength. Another 367
strength is the robustness of the FTS to assess the frailty level of participants. The FTS 368
has demonstrated superior predictive validity and responsiveness than previously 369
validated constructs such as the Frailty Phenotype [55] and the Frailty Index [56]. 370
Furthermore, another key strength of this study is the use of a statistical method (i.e., 371
cross-lagged panel model) that allowed us to investigate the temporal order and 372
bidirectional, longitudinal associations of BST with frailty over time in the study 373
participants. 374
Despite the methodological rigor of this study, some limitations must to be 375
acknowledged. First, we cannot rule out the possibility that our estimations could be 376
biased by the characteristics of the participants who did not provided valid data at 377
follow-up (i.e., they were older, less active, more sedentary, and less educated than 378
those included in the final analysis). Consequently, our results should be taken with 379
1 2 3 4 5 6 7 8 9 1011121314151617181920212223242526272829303132333435363738394041424344454647484950515253545556575859606162636465
caution. An additional limitation is the limited ability of accelerometers to discriminate 380
between sitting and standing compared with posture-based devices [57-59]. Importantly, 381
in our study, a break in ST reflects a modification in acceleration instead of a change in 382
posture, corresponding to a transition from none or slight movement (<100 cpm) to 383
some movement (≥100 cpm). Future studies should replicate our analysis with posture-384
based devices. Lastly, experimental studies are required to confirm our observations 385
[60]. Future studies should investigate optimal strategies to increase the number of BST 386
throughout the day in older adults, particularly among those not achieving the 387
recommended level of physical activity. 388
389
Conclusion 390
According to our hypothesis, the longitudinal relationship between the daily number of 391
sedentary breaks and the frailty levels is bidirectional in physically inactive older 392
individuals. We found no evidence of a longitudinal association between BST and 393
frailty in older adults considered physically active. Our study provides robust 394
longitudinal evidence that breaking-up ST more often may reduce frailty in older adults 395
that do not meet physical activity recommendations. Pending on experimental 396
confirmation, targeting frequent reductions in ST may provide with a feasible approach 397
to reduce the burden of frailty among more at risk inactive older adults. 398
399
Acknowledgements 400
The authors would like to thank the cohort members, investigators, research associates, 401
and team members. 402
1 2 3 4 5 6 7 8 9 1011121314151617181920212223242526272829303132333435363738394041424344454647484950515253545556575859606162636465
The authors certify that they comply with the ethical guidelines for authorship and 403
publishing of the Journal of Cachexia, Sarcopenia and Muscle [61]. 404
Conflict of interest Disclosures 405
None to declare. 406
Funding 407
This work was supported by the Biomedical Research Networking Center on Frailty and 408
Healthy Aging (CIBERFES) and FEDER funds from the European Union 409
(CB16/10/00477), (CB16/10/00456) and (CB16/10/00464). It was further funded by 410
grants from the Government of Castilla-La Mancha (PI2010/020; Institute of Health 411
Sciences, Ministry of Health of Castilla-La Mancha, 03031-00), Spanish Government 412
(Spanish Ministry of Economy, “Ministerio de Economía y Competitividad,” Instituto 413
de Salud Carlos III, PI10/01532, PI031558, PI11/01068), and by European Grants 414
(Seventh Framework Programme: FRAILOMIC). Asier Mañas received a PhD grant 415
from the Universidad de Castilla-La Mancha “Contratos predoctorales para la formación 416
de personal investigador en el marco del Plan Propio de I+D+i, cofinanciados por el 417
Fondo Social Europeo” (2015/4062). Pedro B. Júdice is supported by the Portuguese 418
Foundation for Science and Technology (SFRH/BPD/115977/2016). 419
420
References 421
422
1. Clegg A, Young J, Iliffe S, Rikkert MO, Rockwood K. Frailty in elderly people. 423
Lancet (London, England). 2013;381(9868):752-62. 424
1 2 3 4 5 6 7 8 9 1011121314151617181920212223242526272829303132333435363738394041424344454647484950515253545556575859606162636465
2. Moore SC, Patel AV, Matthews CE, Berrington de Gonzalez A, Park Y, Katki 425
HA, et al. Leisure time physical activity of moderate to vigorous intensity and mortality: 426
a large pooled cohort analysis. PLoS medicine. 2012;9(11):e1001335. 427
3. Wen CP, Wai JP, Tsai MK, Yang YC, Cheng TY, Lee MC, et al. Minimum 428
amount of physical activity for reduced mortality and extended life expectancy: a 429
prospective cohort study. Lancet (London, England). 2011;378(9798):1244-53. 430
4. Hupin D, Roche F, Gremeaux V, Chatard JC, Oriol M, Gaspoz JM, et al. Even a 431
low-dose of moderate-to-vigorous physical activity reduces mortality by 22% in adults 432
aged >/=60 years: a systematic review and meta-analysis. British journal of sports 433
medicine. 2015;49(19):1262-7. 434
5. Manas A, Del Pozo-Cruz B, Guadalupe-Grau A, Marin-Puyalto J, Alfaro-Acha 435
A, Rodriguez-Manas L, et al. Reallocating Accelerometer-Assessed Sedentary Time to 436
Light or Moderate- to Vigorous-Intensity Physical Activity Reduces Frailty Levels in 437
Older Adults: An Isotemporal Substitution Approach in the TSHA Study. Journal of the 438
American Medical Directors Association. 2018;19(2):185 e1- e6. 439
6. Manas A, Pozo-Cruz BD, Rodriguez-Gomez I, Losa-Reyna J, Rodriguez-Manas 440
L, Garcia-Garcia FJ, et al. Can Physical Activity Offset the Detrimental Consequences 441
of Sedentary Time on Frailty? A Moderation Analysis in 749 Older Adults Measured 442
With Accelerometers. Journal of the American Medical Directors Association. 2019. 443
7. Blodgett J, Theou O, Kirkland S, Andreou P, Rockwood K. The association 444
between sedentary behaviour, moderate-vigorous physical activity and frailty in 445
NHANES cohorts. Maturitas. 2015;80(2):187-91. 446
8. Kehler DS, Clara I, Hiebert B, Stammers AN, Hay JL, Schultz A, et al. The 447
association between bouts of moderate to vigorous physical activity and patterns of 448
sedentary behavior with frailty. Experimental gerontology. 2018;104:28-34. 449
1 2 3 4 5 6 7 8 9 1011121314151617181920212223242526272829303132333435363738394041424344454647484950515253545556575859606162636465
9. Fried LP. Interventions for Human Frailty: Physical Activity as a Model. Cold 450
Spring Harb Perspect Med. 2016;6(6). 451
10. van Ballegooijen AJ, van der Ploeg HP, Visser M. Daily sedentary time and 452
physical activity as assessed by accelerometry and their correlates in older adults. Eur 453
Rev Aging Phys Act. 2019;16:3-. 454
11. Davis MG, Fox KR, Hillsdon M, Sharp DJ, Coulson JC, Thompson JL. 455
Objectively measured physical activity in a diverse sample of older urban UK adults. 456
Medicine and science in sports and exercise. 2011;43(4):647-54. 457
12. Berkemeyer K, Wijndaele K, White T, Cooper AJM, Luben R, Westgate K, et 458
al. The descriptive epidemiology of accelerometer-measured physical activity in older 459
adults. The international journal of behavioral nutrition and physical activity. 460
2016;13:2-. 461
13. Rezende LFM, Sa TH, Mielke GI, Viscondi JYK, Rey-Lopez JP, Garcia LMT. 462
All-Cause Mortality Attributable to Sitting Time: Analysis of 54 Countries Worldwide. 463
American journal of preventive medicine. 2016;51(2):253-63. 464
14. Biddle SJH, Bennie JA, Bauman AE, Chau JY, Dunstan D, Owen N, et al. Too 465
much sitting and all-cause mortality: is there a causal link? BMC public health. 466
2016;16:635-. 467
15. Kehler DS, Hay JL, Stammers AN, Hamm NC, Kimber DE, Schultz ASH, et al. 468
A systematic review of the association between sedentary behaviors with frailty. 469
Experimental gerontology. 2018;114:1-12. 470
16. Manas A, Del Pozo-Cruz B, Garcia-Garcia FJ, Guadalupe-Grau A, Ara I. Role 471
of objectively measured sedentary behaviour in physical performance, frailty and 472
mortality among older adults: A short systematic review. European journal of sport 473
science. 2017;17(7):940-53. 474
1 2 3 4 5 6 7 8 9 1011121314151617181920212223242526272829303132333435363738394041424344454647484950515253545556575859606162636465
17. Chen T, Narazaki K, Haeuchi Y, Chen S, Honda T, Kumagai S. Associations of 475
Sedentary Time and Breaks in Sedentary Time With Disability in Instrumental 476
Activities of Daily Living in Community-Dwelling Older Adults. Journal of physical 477
activity & health. 2016;13(3):303-9. 478
18. Sardinha LB, Ekelund U, dos Santos L, Cyrino ES, Silva AM, Santos DA. 479
Breaking-up sedentary time is associated with impairment in activities of daily living. 480
Experimental gerontology. 2015;72:57-62. 481
19. Sardinha LB, Santos DA, Silva AM, Baptista F, Owen N. Breaking-up sedentary 482
time is associated with physical function in older adults. The journals of gerontology 483
Series A, Biological sciences and medical sciences. 2015;70(1):119-24. 484
20. Davis MG, Fox KR, Stathi A, Trayers T, Thompson JL, Cooper AR. Objectively 485
measured sedentary time and its association with physical function in older adults. 486
Journal of aging and physical activity. 2014;22(4):474-81. 487
21. Chastin SF, Ferriolli E, Stephens NA, Fearon KC, Greig C. Relationship 488
between sedentary behaviour, physical activity, muscle quality and body composition in 489
healthy older adults. Age and ageing. 2012;41(1):111-4. 490
22. Del Pozo-Cruz B, Manas A, Martin-Garcia M, Marin-Puyalto J, Garcia-Garcia 491
FJ, Rodriguez-Manas L, et al. Frailty is associated with objectively assessed sedentary 492
behaviour patterns in older adults: Evidence from the Toledo Study for Healthy Aging 493
(TSHA). PLoS One. 2017;12(9):e0183911. 494
23. Carcaillon L, Blanco C, Alonso-Bouzon C, Alfaro-Acha A, Garcia-Garcia FJ, 495
Rodriguez-Manas L. Sex differences in the association between serum levels of 496
testosterone and frailty in an elderly population: the Toledo Study for Healthy Aging. 497
PLoS One. 2012;7(3):e32401. 498
1 2 3 4 5 6 7 8 9 1011121314151617181920212223242526272829303132333435363738394041424344454647484950515253545556575859606162636465
24. Garcia-Garcia FJ, Gutierrez Avila G, Alfaro-Acha A, Amor Andres MS, De Los 499
Angeles De La Torre Lanza M, Escribano Aparicio MV, et al. The prevalence of frailty 500
syndrome in an older population from Spain. The Toledo Study for Healthy Aging. The 501
journal of nutrition, health & aging. 2011;15(10):852-6. 502
25. Rodríguez-Gómez I, Mañas A, Losa-Reyna J, Rodríguez-Mañas L, Chastin SF, 503
Alegre LM, et al. Compositional Influence of Movement Behaviours on Bone Health 504
during Ageing. Medicine and science in sports and exercise. 2019. 505
26. Manas A, Pozo-Cruz BD, Rodriguez-Gomez I, Losa-Reyna J, Rodriguez-Manas 506
L, Garcia-Garcia FJ, et al. Which came first: the movement behavior or the frailty? A 507
cross-lagged panel model in the TSHA study. J Cachexia Sarcopenia Muscle. 2019. 508
27. Garcia-Garcia FJ, Carcaillon L, Fernandez-Tresguerres J, Alfaro A, Larrion JL, 509
Castillo C, et al. A new operational definition of frailty: the Frailty Trait Scale. Journal 510
of the American Medical Directors Association. 2014;15(5):371.e7-.e13. 511
28. Schuit AJ, Schouten EG, Westerterp KR, Saris WH. Validity of the Physical 512
Activity Scale for the Elderly (PASE): according to energy expenditure assessed by the 513
doubly labeled water method. Journal of clinical epidemiology. 1997;50(5):541-6. 514
29. del Ser Quijano T, Sanchez Sanchez F, Garcia de Yebenes MJ, Otero Puime A, 515
Zunzunegui MV, Munoz DG. [Spanish version of the 7 Minute screening 516
neurocognitive battery. Normative data of an elderly population sample over 70]. 517
Neurologia (Barcelona, Spain). 2004;19(7):344-58. 518
30. Guralnik JM, Simonsick EM, Ferrucci L, Glynn RJ, Berkman LF, Blazer DG, et 519
al. A short physical performance battery assessing lower extremity function: association 520
with self-reported disability and prediction of mortality and nursing home admission. 521
Journal of gerontology. 1994;49(2):M85-94. 522
1 2 3 4 5 6 7 8 9 1011121314151617181920212223242526272829303132333435363738394041424344454647484950515253545556575859606162636465
31. Fowkes FG, Low LP, Tuta S, Kozak J. Ankle-brachial index and extent of 523
atherothrombosis in 8891 patients with or at risk of vascular disease: results of the 524
international AGATHA study. European heart journal. 2006;27(15):1861-7. 525
32. Jones CJ, Rikli RE, Beam WC. A 30-s chair-stand test as a measure of lower 526
body strength in community-residing older adults. Research quarterly for exercise and 527
sport. 1999;70(2):113-9. 528
33. Chudyk AM, McAllister MM, Cheung HK, McKay HA, Ashe MC. Are we 529
missing the sitting? Agreement between accelerometer non-wear time validation 530
methods used with older adults' data. Cogent Med. 2017;4:1313505-. 531
34. Rodríguez-Gómez I, Mañas A, Losa-Reyna J, Rodríguez-Mañas L, Chastin SF, 532
Alegre LM, et al. The Impact of Movement Behaviors on Bone Health in Elderly with 533
Adequate Nutritional Status: Compositional Data Analysis Depending on the Frailty 534
Status. Nutrients. 2019;11(3):582. 535
35. Freedson PS, Melanson E, Sirard J. Calibration of the Computer Science and 536
Applications, Inc. accelerometer. Medicine and science in sports and exercise. 537
1998;30(5):777-81. 538
36. Migueles JH, Cadenas-Sanchez C, Ekelund U, Delisle Nystrom C, Mora-539
Gonzalez J, Lof M, et al. Accelerometer Data Collection and Processing Criteria to 540
Assess Physical Activity and Other Outcomes: A Systematic Review and Practical 541
Considerations. Sports medicine (Auckland, NZ). 2017. 542
37. Piercy KL, Troiano RP, Ballard RM, Carlson SA, Fulton JE, Galuska DA, et al. 543
The Physical Activity Guidelines for Americans. Jama. 2018;320(19):2020-8. 544
38. Tombaugh TN, McIntyre NJ. The mini-mental state examination: a 545
comprehensive review. Journal of the American Geriatrics Society. 1992;40(9):922-35. 546
39. Rosseel Y. lavaan: An R Package for Structural Equation Modeling2012. 547
1 2 3 4 5 6 7 8 9 1011121314151617181920212223242526272829303132333435363738394041424344454647484950515253545556575859606162636465
40. Enders CK, Bandalos DL. The Relative Performance of Full Information 548
Maximum Likelihood Estimation for Missing Data in Structural Equation Models. 549
Structural Equation Modeling: A Multidisciplinary Journal. 2001;8(3):430-57. 550
41. Hu Lt, Bentler PM. Cutoff criteria for fit indexes in covariance structure 551
analysis: Conventional criteria versus new alternatives. Structural Equation Modeling: 552
A Multidisciplinary Journal. 1999;6(1):1-55. 553
42. Allison PD. Missing data techniques for structural equation modeling. Journal of 554
abnormal psychology. 2003;112(4):545-57. 555
43. Keadle SK, Conroy DE, Buman MP, Dunstan DW, Matthews CE. Targeting 556
Reductions in Sitting Time to Increase Physical Activity and Improve Health. Medicine 557
and science in sports and exercise. 2017;49(8):1572-82. 558
44. Judice PB, Hamilton MT, Sardinha LB, Zderic TW, Silva AM. What is the 559
metabolic and energy cost of sitting, standing and sit/stand transitions? European 560
journal of applied physiology. 2016;116(2):263-73. 561
45. Hamilton MT, Hamilton DG, Zderic TW. Role of low energy expenditure and 562
sitting in obesity, metabolic syndrome, type 2 diabetes, and cardiovascular disease. 563
Diabetes. 2007;56(11):2655-67. 564
46. Hamilton MT, Healy GN, Dunstan DW, Zderic TW, Owen N. Too Little 565
Exercise and Too Much Sitting: Inactivity Physiology and the Need for New 566
Recommendations on Sedentary Behavior. Current cardiovascular risk reports. 567
2008;2(4):292-8. 568
47. Pesola AJ, Laukkanen A, Haakana P, Havu M, Saakslahti A, Sipila S, et al. 569
Muscle inactivity and activity patterns after sedentary time--targeted randomized 570
controlled trial. Medicine and science in sports and exercise. 2014;46(11):2122-31. 571
1 2 3 4 5 6 7 8 9 1011121314151617181920212223242526272829303132333435363738394041424344454647484950515253545556575859606162636465
48. Pesola AJ, Laukkanen A, Tikkanen O, Sipila S, Kainulainen H, Finni T. Muscle 572
inactivity is adversely associated with biomarkers in physically active adults. Medicine 573
and science in sports and exercise. 2015;47(6):1188-96. 574
49. Hamilton MT, Hamilton DG, Zderic TW. Exercise physiology versus inactivity 575
physiology: an essential concept for understanding lipoprotein lipase regulation. 576
Exercise and sport sciences reviews. 2004;32(4):161-6. 577
50. Katzmarzyk PT. Standing and mortality in a prospective cohort of Canadian 578
adults. Medicine and science in sports and exercise. 2014;46(5):940-6. 579
51. Del Pozo-Cruz J, Garcia-Hermoso A, Alfonso-Rosa RM, Alvarez-Barbosa F, 580
Owen N, Chastin S, et al. Replacing Sedentary Time: Meta-analysis of Objective-581
Assessment Studies. American journal of preventive medicine. 2018;55(3):395-402. 582
52. Ekelund U, Tarp J, Steene-Johannessen J, Hansen BH, Jefferis B, Fagerland 583
MW, et al. Dose-response associations between accelerometry measured physical 584
activity and sedentary time and all cause mortality: systematic review and harmonised 585
meta-analysis. BMJ (Clinical research ed). 2019;366:l4570. 586
53. Morey MC, Sloane R, Pieper CF, Peterson MJ, Pearson MP, Ekelund CC, et al. 587
Effect of physical activity guidelines on physical function in older adults. Journal of the 588
American Geriatrics Society. 2008;56(10):1873-8. 589
54. World Health Organization. Global Recommendations on Physical Activity for 590
Health. WHO Press, editor. Geneva: World Health Organization; 2010. 591
55. Fried LP, Tangen CM, Walston J, Newman AB, Hirsch C, Gottdiener J, et al. 592
Frailty in older adults: evidence for a phenotype. The journals of gerontology Series A, 593
Biological sciences and medical sciences. 2001;56(3):M146-56. 594
1 2 3 4 5 6 7 8 9 1011121314151617181920212223242526272829303132333435363738394041424344454647484950515253545556575859606162636465
56. Rockwood K, Song X, MacKnight C, Bergman H, Hogan DB, McDowell I, et 595
al. A global clinical measure of fitness and frailty in elderly people. CMAJ : Canadian 596
Medical Association Journal. 2005;173(5):489-95. 597
57. An HS, Kim Y, Lee JM. Accuracy of inclinometer functions of the activPAL 598
and ActiGraph GT3X+: A focus on physical activity. Gait & posture. 2017;51:174-80. 599
58. Judice PB, Santos DA, Hamilton MT, Sardinha LB, Silva AM. Validity of 600
GT3X and Actiheart to estimate sedentary time and breaks using ActivPAL as the 601
reference in free-living conditions. Gait & posture. 2015;41(4):917-22. 602
59. Steeves JA, Bowles HR, McClain JJ, Dodd KW, Brychta RJ, Wang J, et al. 603
Ability of thigh-worn ActiGraph and activPAL monitors to classify posture and motion. 604
Medicine and science in sports and exercise. 2015;47(5):952-9. 605
60. Wheeler MJ, Green DJ, Ellis KA, Cerin E, Heinonen I, Naylor LH, et al. 606
Distinct effects of acute exercise and breaks in sitting on working memory and 607
executive function in older adults: a three-arm, randomised cross-over trial to evaluate 608
the effects of exercise with and without breaks in sitting on cognition. British journal of 609
sports medicine. 2019. 610
61. von Haehling S, Morley JE, Coats AJ, Anker SD. Ethical guidelines for 611
publishing in the Journal of Cachexia, Sarcopenia and Muscle: update 2017. Journal of 612
cachexia, sarcopenia and muscle. 2017;8(6):1081-3. 613
614
615
1 2 3 4 5 6 7 8 9 1011121314151617181920212223242526272829303132333435363738394041424344454647484950515253545556575859606162636465
Table Legends 616
617
Table 1. Sociodemographic and descriptive data. 618
Abbreviations: BMI, body mass index; MSSE, mini-mental scale examination; LPA, light 619
physical activity; MVPA, moderate-to-vigorous physical activity; BST, number of breaks in 620
sedentary time. 621 aContinuous variable; mean ± standard deviation. 622 bCategorical variable; n (%). 623 cMissing data; n (%). 624
*Significant differences between baseline vs. follow-up (P<0.05). 625
ᶿSignificant differences between active vs. inactive individuals at baseline (P<0.05). 626 ŦTrend toward significance between baseline vs. follow-up (P<0.08>0.05). 627
628
629
630
631
632
633
634
635
636
637
638
639
640
1 2 3 4 5 6 7 8 9 1011121314151617181920212223242526272829303132333435363738394041424344454647484950515253545556575859606162636465
Figure Legends 641
642
Figure 1. Cross-lagged panel model 1: Total sample 643
Abbreviations: BST, number of daily breaks in sedentary time. 644
Model adjusted for age, sex, BMI, education, marital status, Mini-Mental State 645
Examination, MVPA, and accelerometer wear time. 646
Bold indicates statistical significance (P<0.05). 647
648
Figure 2. Cross-lagged panel model 2: Physically active individuals 649
Abbreviations: BST, daily number of breaks in sedentary time. 650
Model adjusted for age, sex, BMI, education, marital status, Mini-Mental State 651
Examination, MVPA, and accelerometer wear time. 652
Bold indicates statistical significance (P<0.05). 653
654
Figure 3. Cross-lagged panel model 3: Physically inactive individuals 655
Abbreviations: BST, daily number of breaks in sedentary time. 656
Model adjusted for age, sex, BMI, education, marital status, Mini-Mental State 657
Examination, MVPA, and accelerometer wear time. 658
Bold indicates statistical significance (P<0.05). 659
660
661
1 2 3 4 5 6 7 8 9 1011121314151617181920212223242526272829303132333435363738394041424344454647484950515253545556575859606162636465
Supplementary Material 662
663
Supplementary File 1. Comparison of characteristics at baseline of participants 664
retained with those of individuals not retained from T1-T2. 665
Abbreviations: BMI, body mass index; MSSE, mini-mental scale examination; LPA, 666
light physical activity; MVPA, moderate-to-vigorous physical activity; BST, number of 667
breaks in sedentary time. 668
aContinuous variable; mean ± standard deviation. 669
bCategorical variable; n (%). 670
cMissing data; n (%). 671
Bold indicates statistical significance (p<0.05) and Italics a trend toward significance 672
(p<0.08>0.05). 673
674
1 2 3 4 5 6 7 8 9 1011121314151617181920212223242526272829303132333435363738394041424344454647484950515253545556575859606162636465
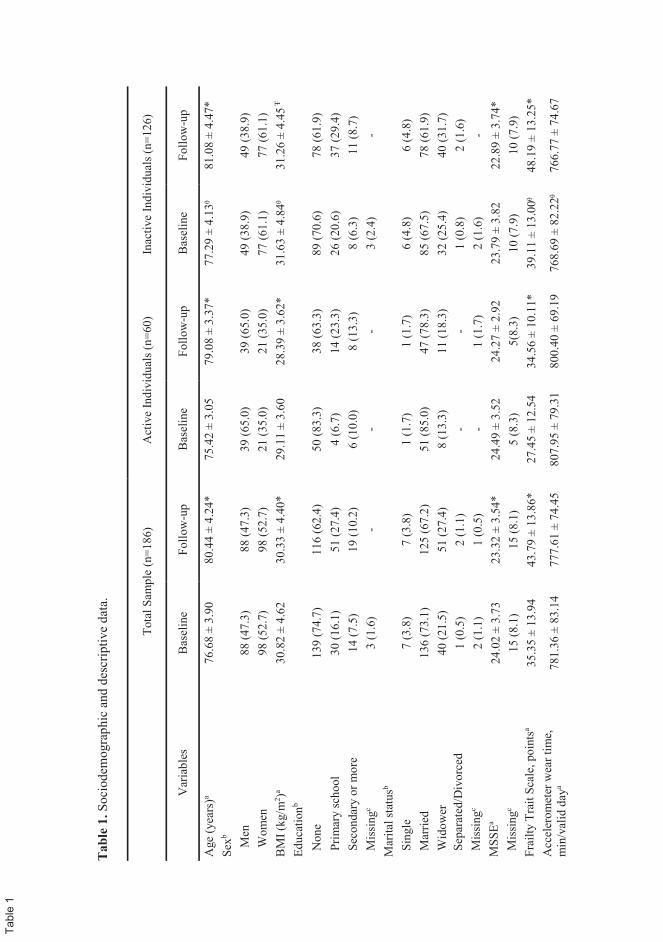
Tab
le 1
. Soc
iode
mog
raph
ic a
nd d
escr
iptiv
e da
ta.
Tota
l Sam
ple
(n=1
86)
Act
ive
Indi
vidu
als (
n=60
) In
activ
e In
divi
dual
s (n=
126)
Var
iabl
es
Bas
elin
e Fo
llow
-up
Bas
elin
e Fo
llow
-up
Bas
elin
e Fo
llow
-up
Age
(yea
rs)a
76.6
8 ±
3.90
80
.44
± 4.
24*
75.4
2 ±
3.05
79
.08
± 3.
37*
77.2
9 ±
4.13
ᶿ 81
.08
± 4.
47*
Sexb
M
en
88 (4
7.3)
88
(47.
3)
39 (6
5.0)
39
(65.
0)
49 (3
8.9)
49
(38.
9)
W
omen
98
(52.
7)
98 (5
2.7)
21
(35.
0)
21 (3
5.0)
77
(61.
1)
77 (6
1.1)
B
MI (
kg/m
2 )a 30
.82
± 4.
62
30.3
3 ±
4.40
* 29
.11
± 3.
60
28.3
9 ±
3.62
* 31
.63
± 4.
84ᶿ
31.2
6 ±
4.45
Ŧ
Educ
atio
nb
N
one
139
(74.
7)
116
(62.
4)
50 (8
3.3)
38
(63.
3)
89 (7
0.6)
78
(61.
9)
Prim
ary
scho
ol
30 (1
6.1)
51
(27.
4)
4 (6
.7)
14 (2
3.3)
26
(20.
6)
37 (2
9.4)
S
econ
dary
or m
ore
14 (7
.5)
19 (1
0.2)
6
(10.
0)
8 (1
3.3)
8
(6.3
) 11
(8.7
) M
issi
ngc
3 (1
.6)
- -
- 3
(2.4
) -
Mar
ital s
tatu
sb
S
ingl
e 7
(3.8
) 7
(3.8
) 1
(1.7
) 1
(1.7
) 6
(4.8
) 6
(4.8
) M
arrie
d 13
6 (7
3.1)
12
5 (6
7.2)
51
(85.
0)
47 (7
8.3)
85
(67.
5)
78 (6
1.9)
W
idow
er
40 (2
1.5)
51
(27.
4)
8 (1
3.3)
11
(18.
3)
32 (2
5.4)
40
(31.
7)
Sep
arat
ed/D
ivor
ced
1 (0
.5)
2 (1
.1)
- -
1 (0
.8)
2 (1
.6)
Mis
sing
c 2
(1.1
) 1
(0.5
) -
1 (1
.7)
2 (1
.6)
- M
SSEa
24.0
2 ±
3.73
23
.32
± 3.
54*
24.4
9 ±
3.52
24
.27
± 2.
92
23.7
9 ±
3.82
22
.89
± 3.
74*
Mis
sing
c 15
(8.1
) 15
(8.1
) 5
(8.3
) 5(
8.3)
10
(7.9
) 10
(7.9
) Fr
ailty
Tra
it Sc
ale,
poi
ntsa
35.3
5 ±
13.9
4 43
.79
± 13
.86*
27
.45
± 12
.54
34.5
6 ±
10.1
1*
39.1
1 ±
13.0
0ᶿ
48.1
9 ±
13.2
5*
Acc
eler
omet
er w
ear t
ime,
m
in/v
alid
day
a 78
1.36
± 8
3.14
77
7.61
± 7
4.45
80
7.95
± 7
9.31
80
0.40
± 6
9.19
76
8.69
± 8
2.22
ᶿ 76
6.77
± 7
4.67
Tabl
e 1
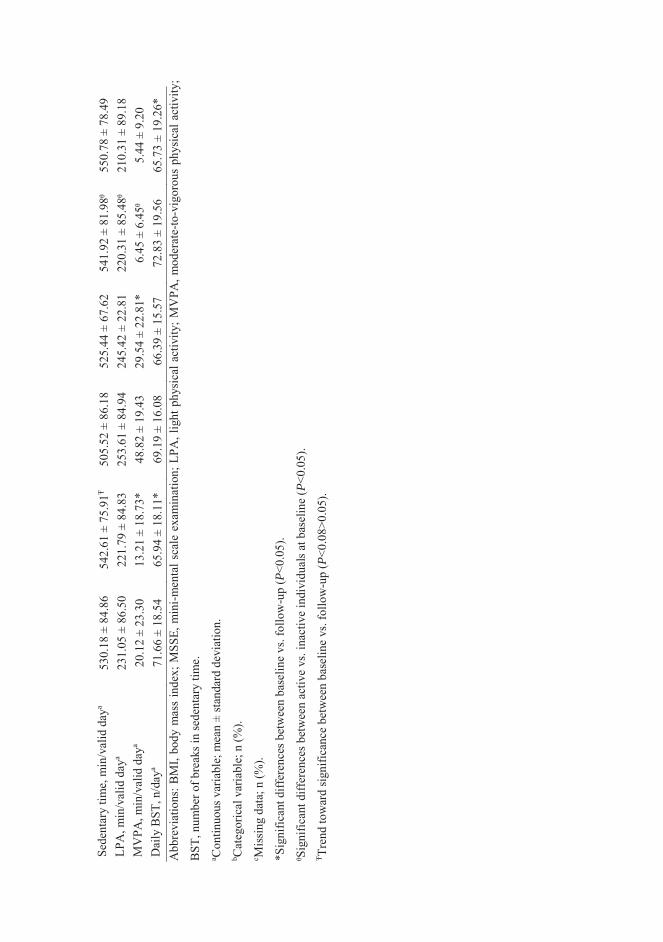
Sede
ntar
y tim
e, m
in/v
alid
day
a 53
0.18
± 8
4.86
54
2.61
± 7
5.91
Ŧ 50
5.52
± 8
6.18
52
5.44
± 6
7.62
54
1.92
± 8
1.98
ᶿ 55
0.78
± 7
8.49
LP
A, m
in/v
alid
day
a 23
1.05
± 8
6.50
22
1.79
± 8
4.83
25
3.61
± 8
4.94
24
5.42
± 2
2.81
22
0.31
± 8
5.48
ᶿ 21
0.31
± 8
9.18
M
VPA
, min
/val
id d
aya
20.1
2 ±
23.3
0 13
.21
± 18
.73*
48
.82
± 19
.43
29.5
4 ±
22.8
1*
6.45
± 6
.45ᶿ
5.
44 ±
9.2
0 D
aily
BST
, n/d
aya
71.6
6 ±
18.5
4 65
.94
± 18
.11*
69
.19
± 16
.08
66.3
9 ±
15.5
7 72
.83
± 19
.56
65.7
3 ±
19.2
6*
Abb
revi
atio
ns: B
MI,
body
mas
s in
dex;
MSS
E, m
ini-m
enta
l sca
le e
xam
inat
ion;
LPA
, lig
ht p
hysi
cal a
ctiv
ity; M
VPA
, mod
erat
e-to
-vig
orou
s ph
ysic
al a
ctiv
ity;
BST
, num
ber o
f bre
aks i
n se
dent
ary
time.
a C
ontin
uous
var
iabl
e; m
ean
± st
anda
rd d
evia
tion.
b C
ateg
oric
al v
aria
ble;
n (%
). c M
issi
ng d
ata;
n (%
).
*Sig
nific
ant d
iffer
ence
s bet
wee
n ba
selin
e vs
. fol
low
-up
(P<0
.05)
.
ᶿSig
nific
ant d
iffer
ence
s bet
wee
n ac
tive
vs. i
nact
ive
indi
vidu
als a
t bas
elin
e (P
<0.0
5).
Ŧ Tren
d to
war
d sig
nific
ance
bet
wee
n ba
selin
e vs
. fol
low
-up
(P<0
.08>
0.05
).
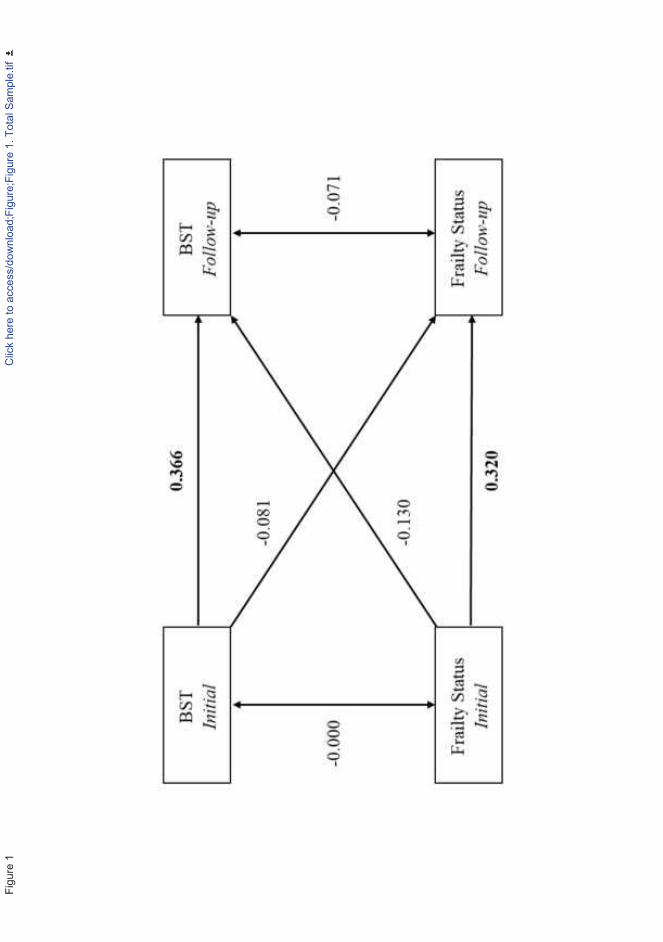
Figu
re 1
Clic
k he
re to
acc
ess/
dow
nloa
d;Fi
gure
;Fig
ure
1. T
otal
Sam
ple.
tif
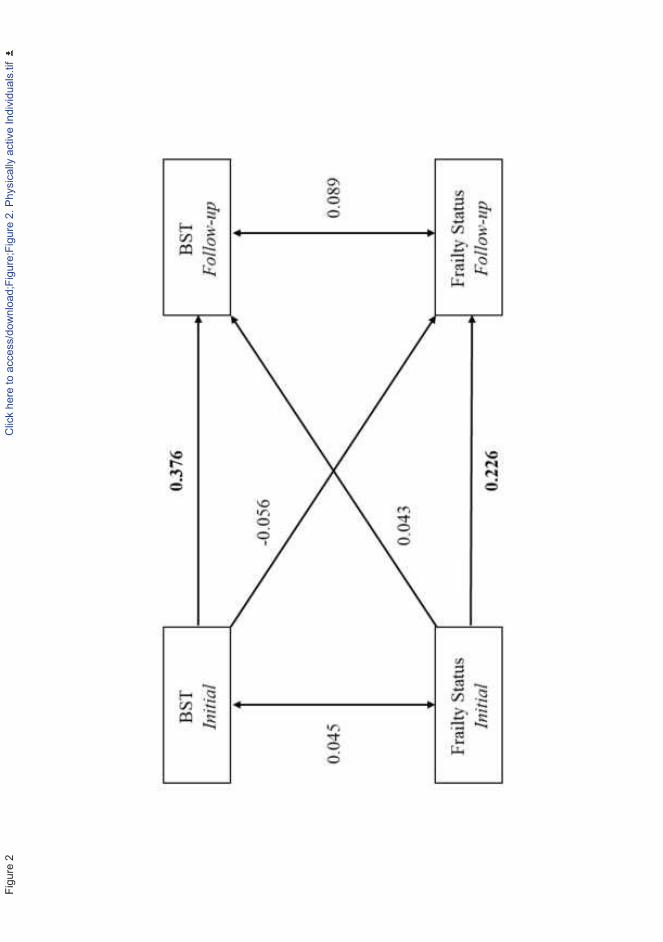
Figu
re 2
Clic
k he
re to
acc
ess/
dow
nloa
d;Fi
gure
;Fig
ure
2. P
hysi
cally
act
ive
Indi
vidu
als.
tif
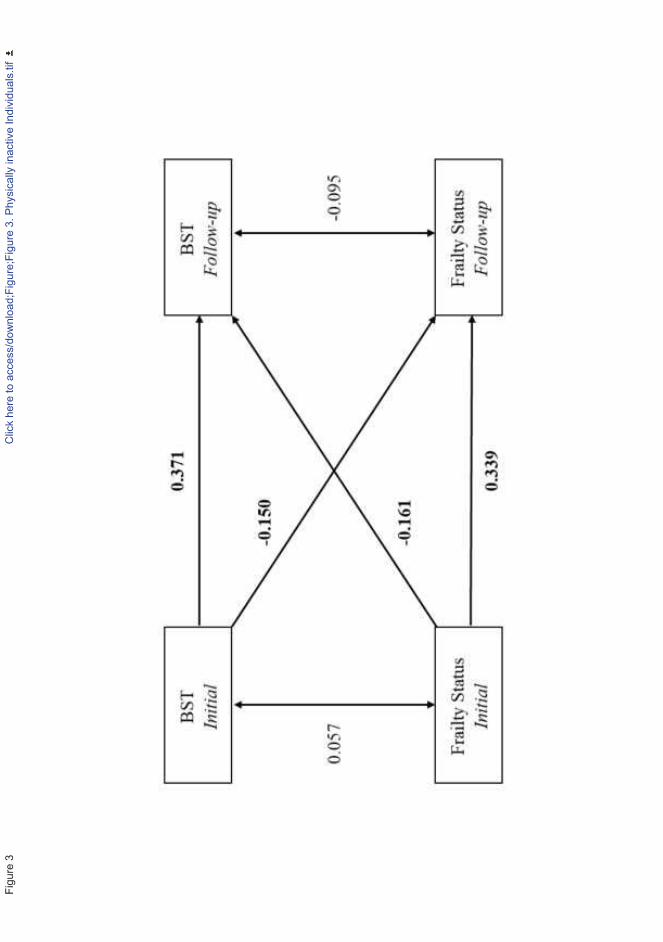
Figu
re 3
Clic
k he
re to
acc
ess/
dow
nloa
d;Fi
gure
;Fig
ure
3. P
hysi
cally
inac
tive
Indi
vidu
als.
tif
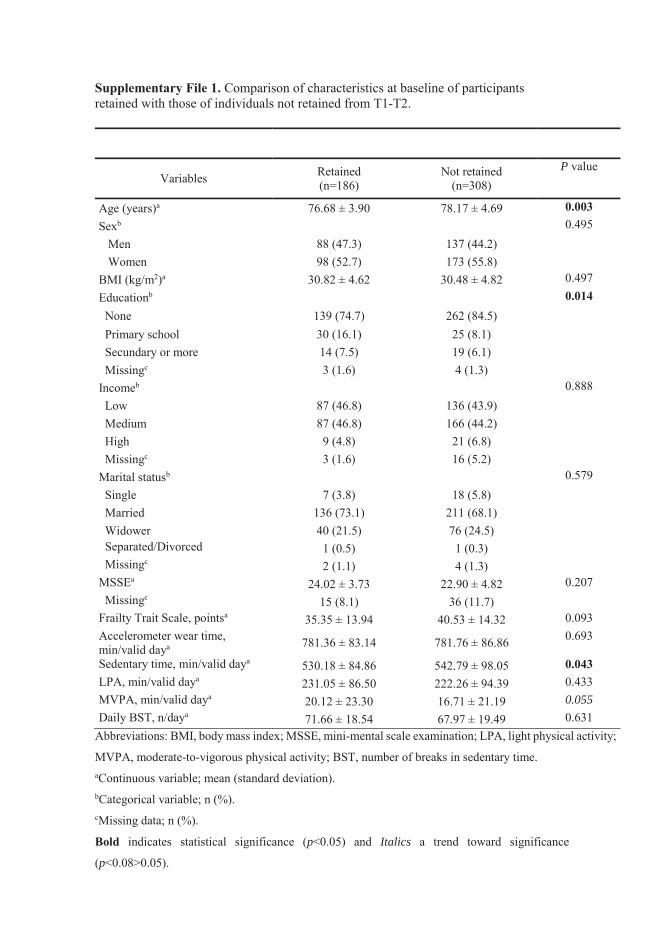
Supplementary File 1. Comparison of characteristics at baseline of participants retained with those of individuals not retained from T1-T2.
Variables Retained (n=186)
Not retained (n=308)
P value
Age (years)a 76.68 ± 3.90 78.17 ± 4.69 0.003 Sexb 0.495 Men 88 (47.3) 137 (44.2) Women 98 (52.7) 173 (55.8) BMI (kg/m2)a 30.82 ± 4.62 30.48 ± 4.82 0.497 Educationb 0.014 None 139 (74.7) 262 (84.5)
Primary school 30 (16.1) 25 (8.1) Secundary or more 14 (7.5) 19 (6.1) Missingc 3 (1.6) 4 (1.3) Incomeb 0.888 Low 87 (46.8) 136 (43.9) Medium 87 (46.8) 166 (44.2) High 9 (4.8) 21 (6.8) Missingc 3 (1.6) 16 (5.2) Marital statusb 0.579 Single 7 (3.8) 18 (5.8) Married 136 (73.1) 211 (68.1) Widower 40 (21.5) 76 (24.5) Separated/Divorced 1 (0.5) 1 (0.3) Missingc 2 (1.1) 4 (1.3) MSSEa 24.02 ± 3.73 22.90 ± 4.82 0.207 Missingc 15 (8.1) 36 (11.7) Frailty Trait Scale, pointsa 35.35 ± 13.94 40.53 ± 14.32 0.093 Accelerometer wear time, min/valid daya 781.36 ± 83.14 781.76 ± 86.86 0.693
Sedentary time, min/valid daya 530.18 ± 84.86 542.79 ± 98.05 0.043 LPA, min/valid daya 231.05 ± 86.50 222.26 ± 94.39 0.433 MVPA, min/valid daya 20.12 ± 23.30 16.71 ± 21.19 0.055 Daily BST, n/daya 71.66 ± 18.54 67.97 ± 19.49 0.631
Abbreviations: BMI, body mass index; MSSE, mini-mental scale examination; LPA, light physical activity;
MVPA, moderate-to-vigorous physical activity; BST, number of breaks in sedentary time. aContinuous variable; mean (standard deviation). bCategorical variable; n (%). cMissing data; n (%).
Bold indicates statistical significance (p<0.05) and Italics a trend toward significance
(p<0.08>0.05).

RESULTS
289

290

291
CHAPTER 6
DISCUSSION
DISCUSSION STUDY 1
292
STUDY 1 DISCUSSION
293
6.1. Study 1
To the best of our knowledge, this is the first review that examines the
association between objectively measured SB and its effects on physical
performance, frailty and mortality in older people. Although the number
of studies in which accelerometers were used in order to ascertain SB is
very limited in this population, a relationship between SB and a worsened
physical performance is observed. However, the association between SB
and frailty incidence and mortality rates remains unclear due to the
reduced number of studies available in the literature.
Effects of SB on physical performance
Earlier studies where sedentary lifestyle has been measured by auto-
reported questionnaires show that the longer time older adults spend on
SB, the higher adverse health outcomes (i.e. diabetes, cardiovascular
diseases) present, independently of MVPA [243]. Disability is a major
adverse health outcome resulting in limitations in the activities of daily
living. This is of special interest, since physical activity has been proposed
for the prevention of impaired physical functioning in older ages [244].
However, these studies do not consider ST as an independent domain of
behaviour.
In the current review, we have found a negative association between SB
and physical performance, regardless of MVPA in two of the cross-
sectional studies reviewed [245, 246]. Likewise, Fleig et al. [247] and Cooper
et al. [248] found a negative association between time spent on sedentary
DISCUSSION STUDY 1
294
activities and various physical performance tests in older adults.
Accordingly, Dunlop et al. [249] found a strong relationship between
greater time spent in SB and the presence of activities of daily living
disability, and Ikezoe et al. [250] with a slower time in the Timed Up-&-Go
test and lower muscle strength. The independent relationship of ST and
physical performance extends recent findings demonstrating that
objectively measured ST, controlled for MVPA, is related to metabolic
syndrome [251], cancer [252], and mortality [253]. In contrast,
investigations performed in adults failed to relate sitting time with
impaired muscle strength or gait/mobility [254]. These discrepancies may
be attributable, at least in part, to the heterogeneity in the participant study
samples examined.
Sedentary behaviour and physical performance have also been related
longitudinally. Seguin et al. [255] studied 62,000 woman aged 50 to 79 years
from the Women´s Health Initiative, and observed that those with the
higher auto-reported sitting time and total ST at the beginning of the study,
had the higher reduction in self-reported physical performance after 12.3
years’ follow-up. Unfortunately, self-report is susceptible to socially
desirable responding [256], and older adults have a less accurate recall
[257].
Thus, objectively assessed SB as well as home-based physical performance
tests may provide more accurate and reliable results. According to our
literature review, the randomized control trial (RCT) study performed by
Barone Gibbs et al. [258] demonstrated that a 12 week intervention aimed
to reduce SB has a higher effect on physical performance rather than on
time spent on MVPA in older sedentary but highly physically functional
adults. In agreement, Rosenberg et al. [259] showed that an 8-week
STUDY 1 DISCUSSION
295
behavioural intervention to reduce SB is feasible and effective among older
overweight and obese adults in order to increase physical performance.
The present findings highlight the need to separate SB from insufficient
MVPA patterns. This is important because it enables SB as a modifiable
additional risk factor for impaired physical performance, disability and loss
of independence. Beyond this, there seems to be a negative relationship
between spending more time on sedentary activities and physical
performance.
Moreover, it is important to discuss that the way ST is spent also matters.
For example, Sardinha et al. [218] as well as Davis et al. [260] found that
breaking-up time in SB was positively associated with physical
performance in older adults, even after controlling for overall time in
MVPA and SB. Davis et al. [260] also reported that breaking-up time in SB
predicted overall physical performance and was associated to higher scores
in selected fitness parameters like upper and lower body muscle strength.
This is not the case of high functioning older adults who spend over an
hour a day walking, where higher SB and lower breaks were associated
with an improved muscle quality [261]. Given the surprising results,
authors explain it by a higher body fat that might provide a training
stimulus to maintain muscle power.
Gennuso et al. [262] reported that longer bouts and fewer breaks in SB is
negatively associated with physical function in older adults, regardless of
participation in MVPA. This adds to previous research were the odds for
abdominal obesity decreased 7% for each additional hourly BST in older
women [263], as well as triglycerides and plasma glucose [264].
DISCUSSION STUDY 1
296
These findings represent a new challenge for public health
recommendations regarding how to break-up sedentary patterns
complementary to those for physical activity in order to improve physical
functionality.
Effects of SB on frailty status
Current scientific evidence consistently shows that changes in body
composition, especially loss of muscle mass, together with low physical
activity and high SB, could be an important contributor for developing
frailty in older adults [37]. Interestingly, regular exercise is probably the
only non-drug derived therapy effective to improve physical function,
cognitive performance and mood [191], besides sarcopenia [265], which is
the central problem in the frailty syndrome.
Despite all the potential benefits of physical activity in relation to frailty,
frail older adults spend 84.9% (about 10 hours), of their daily time in SB
[266]. Previous evidence indicates that physically inactive individuals who
have higher levels of functional disability [267], and those individuals who
have high levels of SB are more likely to be frail [268].
da Silva Coqueiro et al. [214] found a positive association between self-
reported ST and frailty in 316 community-dwelling older adults. The
authors calculated that 7 hours per day of SB was the best cut-off point to
discriminate frail individuals. However, this cut-off point is quite low in
comparison with other studies reporting objectively measured SB [266].
The only study that met the inclusion criteria in the present literature
review for the frailty section was the one recently published by Bastone
STUDY 1 DISCUSSION
297
Ade et al. [269]. This investigation found that the frail group spent more
time in SB that their robust peers. Sedentary behaviour was significantly
associated to frailty, even after adjusting by the number of chronic health
conditions, but this association disappeared when the statistical model was
adjusted by cognitive status. Bastone and coworkers did not report an
association between SB and frailty status independently of the physical
activity levels. This was the case in Blodgett et al. [207] study, where a
positive association was observed between SB and various adverse health
outcomes (frailty, self-reported health, activities of daily living disability,
healthcare utilization), independent of MVPA in a community dwelling
older adults (>50 years) sample. As a limitation, these cross-sectional
studies do not take into consideration causality. Therefore, it is not possible
to certainly know if SB causes the appearance of frailty or if frailty can cause
that individuals choose to have a more sedentary lifestyle.
Longitudinal studies like the one by Song et al. [216] support the existing
idea of a relationship among daily ST and the development of a frailty
status, regardless of MVPA. But the scarce available data prevent to
robustly demonstrate this association, and more studies using similar
methodologies both to measure SB and frailty are needed.
Effects of SB on mortality
As early as in the 1950s, we can found the first indication that SB could
markedly increase adverse health outcomes. Morris et al. [270]
demonstrated a double age-adjusted rate of fatal coronary heart disease in
bus drivers (sedentary) when compared with conductors (active) workers.
DISCUSSION STUDY 1
298
Since then, much research efforts have been focused on the relationship of
an active lifestyle and various health outcomes, even with all-cause
mortality rates [271]. However, much less attention has been devoted on
the effects of SB on mortality. Again, scientific literature relies on self-
reported questionnaires to demonstrate an association between SB and
mortality (all-cause, cardiovascular, colorectal cancer, other causes) in
adults and older adults, independently of physical activity levels [272]. This
implies the limitation that questionnaires may not correctly differentiate ST
from LPA [273], but the existing scientific literature using objective physical
activity measurements is very scarce at the moment [273].
While Ensrud et al. [274] observed that individuals in the higher SB quartile
had a higher all-cause mortality than those in the lower SB quartile, Fox et
al. [275] found that despite spending a mean time of 11 SB hours, the study
participants did not show an association among mortality rates and ST
volume.
Klenk et al. [276] found a higher mortality risk in those subjects who spent
more time in sedentary activities. However, when biomarkers were
included as a confounding variable the association disappeared.
Interestingly, a large recent review combining data from over one million
participants found that 60-75 minutes of physical activity a day eliminated
the harms of sitting when it came to measuring death from cardiovascular
disease or death by all causes [277]. Despite the large number of people
included in the review, the results should be taken with caution as they are
based on self-report physical activity and SB data. When we take into
consideration populations younger than those included in this review,
studies mainly report a significant effect of SB on mortality [253, 278].
Among those, Koster et al. [253] concluded that SB is a risk factor for
STUDY 1 DISCUSSION
299
mortality independent of MVPA. Unfortunately, drawing conclusions in
this section is complicated because of the small number of studies and the
confusing results of each of them.
Methodological issues
To date, the use of accelerometers is considered the most valid and reliable
method to assess SB, despite not all devices are able to discriminate
between sitting and standing changes in the posture [279]. In order to make
stronger the conclusions of this review, only studies using accelerometers
to assess SB were included. However, the variety of devices utilized and
the diversity in techniques regarding data extraction and analysis across
studies makes difficult drawing definitive conclusions.
Reactivity is an important point to take into account when measuring
physical activity and SB with accelerometry because it may introduce a
relevant bias. Although the Hawthorne effect has been recognized as a
potential limitation of the accelerometry method, evidence remains limited
[280]. It seems clear that in children and adolescents there may be some
reactivity [281]. However, tampering with devices seems to be less likely
among older adults [282]. None of the studies included in this review use
strategies to avoid reactivity, therefore the results and conclusions must be
interpreted with caution since the evidence in this area is still scarce.
The number of valid days and the minimum hours per day included in the
analysis from the accelerometer data is another important methodological
issue when working with these type of devices. The average number of
valid days to include accelerometer data in the analysis is 3.6 ± 1.4 days
among the studies reporting this value included in the review. However,
DISCUSSION STUDY 1
300
according to the study of Hart et al. [283] conducted in older people, at least
five days are necessary to adequately capture the SB. Thus, studies which
take less than 5 valid days for the accelerometry analysis might be
unrepresentative. Moreover, cut-offs points for sedentary strip
establishment is also important, knowing that they are dependent on the
analyses unit (i.e. epoch length and axes) [284].
The third important methodological variable to consider is the criteria for
non-wear time of the accelerometers. In that regard, published studies are
divided between the algorithm proposed by Troiano [285] or the algorithm
recommended by Choi et al. [286]. The latter incorporates improvements
for the misclassification of time intervals spent in SB that do not pass the
wear/non-wear classification criteria for the low activity counts. Thus,
studies in populations with a low physical activity and high SB patterns,
such as older adults, could likely benefit from these improvements [286].
Although according to the definition of SB [287] only SB should be
accounted during waking hours, one study in this review included the time
that individuals spend sleeping as SB [276]. This can lead to an
overestimation of ST and should be taken into account when comparing
results from studies using different approaches.
Finally, another important aspect that should be considered when studying
SB in relation to health outcomes is MVPA. This factor should be taken into
account within the covariates included in the statistical models so that the
independent effect of SB can be ascertain. The same applies with health
status, especially in older adults studies in order to avoid confounding
interactions [288].
STUDY 1 DISCUSSION
301
Although Pedisic et al. [282] concluded that accelerometer-based studies
had limitations regarding generalisability, validity, comprehensiveness,
simplicity, affordability, adaptability, between-study comparability and
sustainability, many of these methodological aspects have not yet been
homogenized. Overall, the discrepancy in the methodological aspects
across the analysed studies in this review may preclude us from drawing
definitive conclusions, although a recent review that could help researchers
to make better decisions before and after data collection using
accelerometers, in order to obtain more valid and comparable data has been
published [289]. Consistency in the methodological aspects when assessing
SB and stronger research designs are crucial points to confirm the observed
findings in this review.

DISCUSSION STUDY 1
302
STUDY 2 DISCUSSION
303
6.2. Study 2
To our knowledge, this is the first study that comprehensively analyses the
impact of objectively assessed sedentary patterns beyond total time spent
in SB on frailty in older adults. The main findings were that adjusted
models (i.e. in models adjusted by relevant demographic and medical
confounders) frailty was associated with ST per day, the proportion of the
day spent in sedentary bouts of 10 minutes or more, and time spent in BST.
These results may pose some light on the ongoing discussion regarding the
health consequences of sedentary lifestyles and could generate novel
hypotheses that could help in informing future public health interventions
in order to prevent frailty among older adults.
Sedentary behaviour patterns and frailty
Available evidence suggests that, regardless of MVPA, spending time in
sedentary activities increases the odds of being frail among older adults
[207, 214]. Our results confirm and extend those of da Silva Coqueiro et al.
[214] and Blodgett et al. [207] (i.e. frailty was associated with ST in our
sample), but also verified that the proportion of the day spent in sedentary
bouts of 10 minutes or more is a more powerful predictor of frailty than
raw ST or ST spent in 10-min blocks. The former opens the hypothesis that
health consequences of SB may be hooked on the display of other
behaviours. Compositional analysis of time spent in different behaviours is
therefore required to fully understand the impact SB may have on health,
including frailty among older adults.
DISCUSSION STUDY 2
304
In an attempt to understand more precisely how the pattern of
accumulation of ST may have an impact on frailty scores in older adults,
we combined the number and duration of bouts of 10 minutes or more time
spent in ST into a novel ST compositional score. Previous work has showed
an association between SB and frailty status among adults and older adults
[207, 214]. Similarly, in order to reflect the potential combined implication
of both duration and number of BST on frailty, a compositional score from
the number of and minutes spent in breaks of ST was created (BST-COMP).
Previous work has demonstrated that BST is associated with physical
function and disability in older adults [218, 290]. Our empirical work
extends and confirms the hypothesis that interrupting ST has the potential
of enhancing the wider health of individuals by demonstrating that not
only the number of BST but also duration of those BST may have an impact
on frailty status among older individuals. Collectively, the results from our
study support and extend to frailty the inactivity physiology hypothesis.
Future experimental research is warranted to clarify the potential
mechanisms underpinning the showed associations.
Relevance
From a public health perspective, reducing SB and engaging in LPA, for
instance, by inserting short bouts of activity into otherwise sedentary
periods, may be a more feasible and less challenging approach for older
adults than taking part in more strenuous activities in order to promote
health [291]. Our findings reveal that having fewer breaks of sedentary
periods was associated with higher frailty level among the study sample.
The reverse is also true. This is of interest, as only a minor proportion of
older adults meet the WHO physical activity recommendations (30% in our
STUDY 2 DISCUSSION
305
sample). Therefore, while efforts on MVPA promotion should be sustained,
guidelines for older adults should also reinforce the idea of breaking-up ST
more often in order to prevent frailty among this population group.
Strengths and limitations
Key strengths of the study include the relatively large sample, the objective
measures of SB patterns, and the inclusion of a novel analytical approach
by deriving new variables that reflects more accurately SB patterns and
therefore provide unique knowledge in the field with potential clinical
relevance. The cross-sectional nature of the research design used does not
allow definitive conclusions to be drawn around the causal relationship
between the variables of the study. There are some inherent issues with SB
patterns being derived from accelerometers, such as the use of <100
counts/minute as a threshold to determine sedentary activities [292] or the
use of 1-min epoch length that may impact the generalization of the results
[284]. Despite these limitations, our findings contribute to the current
literature and ongoing discussion on the impact of SB on frailty among
older adults. More research is warranted around the potential effects of
activity insertion of different intensities to prevent frailty in this population
group. Moreover, longitudinal experimental designs are necessary to
overcome some of the research-design inherent limitations of this study
and confirm the results showed here.
DISCUSSION STUDY 2
306
STUDY 3 DISCUSSION
307
6.3. Study 3
This study aimed to investigate the relationship between physical activity,
SB and frailty. We first assessed the association between these factors using
a classical approach, then using a theoretical model, to examine how the
displacement of activity of different intensities is associated with changes
in the frailty score using isotemporal substitution modelling. Our results
estimate that replacing 30 minutes of ST with an equivalent amount of
MVPA is associated with a more theoretically favourable frailty status in
older adults, regardless of comorbidity or physical function status. Equal
time-exchange of ST with LPA is predicted to reduce frailty but only in
older adults with comorbidity (52.6% in our subsample). In addition, the
modelled relationships also suggest potential benefits of LPA in those with
comorbid conditions, which may be a more feasible and less challenging
approach than more strenuous activity.
Replacing ST with MVPA
In our study, we found that replacing sitting time with MVPA resulted in
reductions in the FTS. This is consistent with previous findings where
MVPA was associated with frailty even after controlling for ST [207].
Moderate-to-vigorous physical activity is well known to affect cognitive
and physical outcomes, all known to impact frailty. Supporting our results
are the findings of Song et al. [216] and Peterson et al. [268] which show
evidence that ST negatively impacts on frailty in older adults. Likewise,
Fanning et al. [293] only found an improvement in self-regulatory
DISCUSSION STUDY 3
308
behaviour and executive functioning when 30 min of ST was replaced by
30 min of MVPA time.
Replacing ST with LPA
We have found in single and partition models that LPA has a role on frailty.
Some authors have found a positive relationship between LPA and
different outcomes regarding frailty, while others have not. Elkins [294]
showed that daily time spent in LPA is associated with lower risk of onset
and progression of disability whilst Lee et al. [295] found a positive effect
of LPA in cognitive status. Jantunen et al. [296] also showed that LPA was
positively associated with better physical performance. However, Pau et al.
[297] found that LPA is not the most adequate intensity to improve daily
static and dynamic motor tasks.
As a novelty, our grouping analysis shows that only in people reporting
comorbidities did LPA bring benefits in terms of frailty. Other studies have
shown the beneficial effects of LPA in the isotemporal substitution
analyses. Ekblom-Bak et al. [298] showed significant lower metabolic
syndrome prevalence by replacing 10 minutes of ST with the same amount
of LPA. Similarly, Fishman et al. [299] and Schmid et al. [300] found that
replacing 30 min of ST with LPA was associated with significant reduction
in mortality risk. Our findings show that in frail individuals, with low
fitness even minimal movement can positively impact health [301]. But
when a certain fitness level is reached, more strenuous activity is needed to
elicit more beneficial results.
Despite requiring between 4-5 times more LPA to elicit the same changes
in frailty compared with MVPA, according to our estimates, the benefits of
STUDY 3 DISCUSSION
309
LPA for improving frailty status in those with comorbidities is of relevance
from a public health perspective as might be a population, of those with
comorbidities, that cannot or do not find opportunities to (frail older adults
spend 84.9% of their daily time in SB [266]) become engaged in MVPA
successfully. Thus, replacing ST (e.g., television viewing, sitting) with LPA
(e.g., leisure walking, active transport) may be a more feasible strategy to
reduce the risk of frailty in older adults with additional disease. Future
longitudinal experimental studies should confirm these results.
Strengths and limitations
This study has several strengths and limitations. The sample includes a
relatively large number of community-dwelling older adults with
objectively assessed frailty and physical activity. However, when
comparing the full cohort with the included sample there were differences
in most outcomes used in this study so caution should be exercised when
interpreting the results. Although there is no established gold standard to
identify frailty, the FTS, derived from the classical model proposed by Fried
et al. [37] in combination with the positive aspects of the Frailty Index of
Rockwood et al. [302], has been suggested as a more sensitive scale for
detecting changes in the individual's biological status [59]. The validity of
this scale was evaluated by assessing its association with comorbidities,
biomarkers associated with frailty status, and by comparing its predictive
value for adverse events with the two most frequently used frailty scales:
Frailty Phenotype [37] and the Frailty Index [302]. Although accelerometry
has some advantages over questionnaires and other self-report methods
[303], it is not exempt from error. Waist-worn accelerometers are not able
to detect differences between sitting and standing positions, and therefore
DISCUSSION STUDY 3
310
the measurement of ST can be overestimated. In addition, the cut-off points
used in this study and the algorithm chosen to discard zero value periods
can affect the amount of different physical activity intensity ranges and SB.
Causal inferences are limited due to the cross-sectional nature of the study.
Moreover, isotemporal substitution models represent a mathematical way
of replacing one behaviour with another, so the results should be
interpreted with caution. There is therefore a need for more experimental
research in this area, especially in the clinical setting, in order to better
understand the impact of replacing ST with activity of different intensities
on frailty status among older adults. Another limitation of the study may
be the non-measurement of sleep, an important behaviour that may affect
the associations found in this study.
STUDY 4 DISCUSSION
311
6.4. Study 4
The way in which time packed in a given day remains relevant for a wide
range of health outcomes [304]. Previous research has identified the
cardiometabolic [230] and mortality outcomes [305] of different movement
patterns in adults and older adults, respectively. This is the first study
assessing the associations of mutually exclusive categories of
accelerometer-derived physical activity and ST with physical function and
frailty in older adults. The main findings were that participants who
engaged in ≥150 min/week of MVPA had more favourable physical
function and frailty profiles than those classified in the other movement
pattern groups, regardless of sedentary status. Our results also suggest that
engaging in more light intensity relative to ST may have a positive impact
on physical function and frailty status on the studied population, even in
those individuals already meeting the physical activity guidelines. This
might provide alternative intervention strategies to improve physical
function and prevent frailty, as light activities are more feasible than more
strenuous activity, particularly among previously inactive individuals.
Physical activity status, physical function, and frailty
Previous research have demonstrated that MVPA is effective to prevent,
delay or even reverse functional limitations and frailty among older adults
[192]. The present study provides novel data indicating that older adults
who meet recommended physical activity levels, regardless of time spent
in light-intensity activities relative to sedentary activities, have better
DISCUSSION STUDY 4
312
physical function levels and frailty status compared to older adults who do
not meet the required physical activity levels. These results emphasize the
importance of engaging in sufficient MVPA, which could buffer some of
the negative consequences of SB in preserving the physical functionality
and reduce frailty in this population group [246, 306]. A recent meta-
analysis involving more than 1 million adults has shown that engaging in
higher amounts of strenuous activity can eliminate the mortality risk
associated with too much sitting reported elsewhere [277]. The association
of more intense activity with fitness levels partially explains why meeting
the physical activity recommendations may overcome the harmful effects
of SB. Thus, cardiovascular fitness has been proposed as a plausible
mechanism mediating the relationship between SB and cardiometabolic
health in older adults [307]. More studies are required to elucidate the role
of fitness in the relationship between MVPA, SB, physical functioning and
frailty in older adults.
Sedentary status, physical function, and frailty
Contemporary experimental [308, 309] and observational [291, 310]
evidence emphasizes the health-enhancing role of light-intensity activities.
In a recent meta-analysis by Chastin et al. [311], LPA emerged as potentially
relevant for cardiometabolic health and mortality in adults and older
adults, in particular among impaired individuals. Our estimates suggest
that increasing the time in LPA relative to ST has a positive impact on frailty
levels in those considered physically inactive. Other studies have suggested
the potential benefits of replacing SB with LPA to reduce frailty in older
adults with multiple diseases [312]. It might be the case that in the more
frail and functionally compromised individuals even small stimulus from
STUDY 4 DISCUSSION
313
light intensities can benefit their wider health [312]. Collectively, these
findings are policy-relevant. Light-intensity physical activity is normally
naturally embedded into the daily living of individuals (e.g. walking a dog,
doing home chores or standing up while talking on the phone), therefore
requiring no mental or physical effort or starting level to perform such
activities, and thereby making light-intensity activities a pragmatic target
for future public interventions to reduce frailty and improve physical
function of older adults, particularly among those inactive (i.e. 83.5% in our
sample) and that also depict very high levels of ST (i.e. 63.6% in our sample)
which might also be the most impaired individuals.
Interestingly, we identified the group meeting the physical activity
guidelines (i.e. active) and showing higher levels of light intensity relative
to ST as the group with better frailty and physical function profile in our
sample. Others have found similar results for cardiometabolic health [230]
and mortality [305]. Recent epidemiologic evidence suggests that sitting
time has deleterious cardiovascular and metabolic effects that are
independent of whether or not adults meet the physical activity guidelines
[235]. Our results suggest that engaging in more light-intensity activity
relative to ST beyond meeting the physical activity recommendations can
provide with extra benefits in improving physical function and reducing
frailty in older adults. Those individuals in our sample meeting the
physical activity guidelines and engaging in more light-intensity activities
extend their total volume of physical activity as supposed to those that meet
the recommended amount of physical activity yet are sedentary, which
could partially explain the extra benefit associated to that movement
pattern [313]. Thus, promoting light-intensity activities could be a good
approach to increase the total volume of physical activity and reduce ST in
DISCUSSION STUDY 4
314
those already meeting the physical activity guidelines, thereby enhancing
their health, including increasing physical function and improving their
frailty profile.
Strengths and limitations
The present study has several strengths. First, the study includes a
relatively-large sample of community-dwelling older adults with advanced
age. Although there is no current established gold standard to determine
physical function and frailty in older adults, the short physical function
battery has positioned as one of the most used tools to objectively evaluate
functional performance among older adults [314]. Similarly, the FTS has
been suggested as a more sensitive scale for detecting changes in the
individual’s biological status than previously validated frailty instruments
[59]. We also used accelerometer-measured procedures to assess physical
activity and ST.
Our study has also limitations. Firstly, the cut-off points used in the study
to categorize the activity intensity of participants in the study can lead to a
misclassification of both physical activity and ST. However, the cut-off
points used in this study are the most commonly reported in the literature
for this age group [229], which make the results found here comparable
with other investigations. Furthermore, ActiGraph devices are not able to
discriminate between sitting and standing changes in the posture [315]. In
order to obtain the activity status, bouts of at least 10 minutes were used,
which may underestimate the time spent in MVPA. Nevertheless, further
research is needed to consider the impact of the bout duration on frailty
syndrome. Similar to what Bakrania et al. [230] reported, data could be
STUDY 4 DISCUSSION
315
overestimating the ST [316], we therefore decided to use a more
conservative approach for the extraction of sedentary status based on the
behaviour of our population, an approach used in previous studies [230].
Loprinzi et al. defined low sedentary status as a positive LPA-to-ST ratio
[232]. If we had used the Loprinzi et al. [232] method, only 2.1% of our
population would have been categorized as low sedentary status. This
procedure used may have limitations and strengths. On the one hand, it is
not influenced by the measurement of the accelerometer, but on the other
hand, because is data-driven, may not be applicable to other populations.
The use of this novel approach allows combining in mutually exclusive
categories that best represent the different plausible combinations of
physical activity and ST within waking hours. Nonetheless, the cross-
sectional nature of the research design used does not allow definitive
conclusions to be drawn around the causal relationship between the
outcomes of the study.
DISCUSSION STUDY 4
316
STUDY 5 DISCUSSION
317
6.5. Study 5
The main finding of the current study was that 27 minutes/d of MVPA
eliminated the increased risk of frailty associated with ST.
The detrimental health consequences of SB have been demonstrated for a
range of health outcomes such as metabolic syndrome, waist
circumference, and overweightness/obesity [188]. For example, Gao et al.
[317] found that greater time in television viewing was associated with high
waist-to-hip ratio and Gennuso et al. [318] found that more time spent in
objectively measured SB was associated with a high waist circumference
and BMI. This damaging effect of time spent in sedentary activities seems
to be confirmed for frailty in older adults [207, 216, 319, 320] and remains
true also in our sample. Several factors such as the loss of maximal aerobic
capacity and muscle strength, a decreased cognitive function, a dysfunction
of the immune system and a damaged metabolic function or weight gains
may partially explain these associations [321].
Moderating role of MVPA
The main contribution of our study is the confirmation of the moderating
role of physical activity on the SB-frailty association. Our results suggest
that engagement in 27 minutes per day of MVPA could eliminate the
negative consequences of spending too much time in otherwise sedentary
activities. Recent evidence in Chilean older adults also suggests that more
intense physical activity attenuates the negative effects of sitting time on
cognition [322]. This estimated protective role of physical activity has also
DISCUSSION STUDY 5
318
been confirmed in a large meta-analysis with more than 1 million adults
and older adults [277]. The former study suggests that in highly physically
active people (i.e. participants accumulating 60-75 min/day of MVPA),
sitting time was no longer a predictive factor of all-cause mortality. Also,
Theou et al. [323] reported that in active individuals over 50 years old, ST
does not affect the risk of mortality, regardless the level of frailty.
Altogether, these findings seem to reinforce the idea of increasing MVPA
to offset the harmfulness that ST may have on frailty in older adults. Future
studies need to confirm our results in longitudinal, experimental studies.
Sedentary behaviour and frailty
Despite the well-established health benefits [324, 325], engaging in more
MVPA may not be feasible among all older adults. In fact, only 28% in our
sample met the suggested threshold of 27 min/day of MVPA (which is 6
min/day above the current physical activity guidelines) necessary to
theoretically offset the impact of SB on frailty. A recent systematic review
and meta-analysis [326] concluded that replacing accelerometer-assessed
ST with light intensity activities is a feasible health enhancing strategy,
particularly among previously sedentary individuals. A previous study
also demonstrated that replacing SB with light intensity activities can
reduce the frailty levels among vulnerable older adults [312]. Our
estimations confirm the benefits of reducing SB to reduce frailty levels
among inactive older adults (i.e. 68% of the sample in the current study).
Some studies have also demonstrated that reductions in SB (i.e. short
breaks of light activity into otherwise inactive periods) are possible [327]
and that have the potential of improving the physical function of older
STUDY 5 DISCUSSION
319
individuals [218, 328-330]. Collectively, these findings indicate that both
increasing MVPA and reducing ST should be encouraged to reduce frailty
among older adults. The inclusion of strategies to reduce time spent sitting
and increase time spent in light intensity activities to reduce frailty may be
of particular interest among the most inactive older adults and could be
taken as a first, feasible step towards accumulation of more MVPA
throughout the day.
Strengths and limitations
An important strength of our study is that includes a relatively large
sample of community-dwelling older adults with accelerometer-derived
SB and physical activity estimations. Also, although there is no established
gold standard to identify frailty, the FTS has been suggested as a more
sensitive scale for detecting comorbidities, biomarkers and adverse events
associated with frailty than previously validated frailty scales such as
Frailty Phenotype [37] and the Frailty Index [302]. Some limitations have to
be acknowledged. Despite validity and widely used of accelerometers to
assess physical activity in free living conditions, these devices are not able
to discriminate between sitting and standing [315] or activity type,
therefore potentially biasing the estimations in our study. The cross-
sectional nature of the observations does not allow definitive conclusions
to be drawn around the causal relationship between the variables of
interest. Additional evidence is required to extend these findings using
longitudinal and experimental data.
DISCUSSION STUDY 5
320
STUDY 6 DISCUSSION
321
6.6. Study 6
The present study investigated the longitudinal relationships between
MVPA and SB with frailty status in a community-based sample of older
adults. As a novelty, we applied a cross-lagged panel model to test for
potential reciprocal relationships between MVPA/SB and frailty over a 4-
years period. The main finding in our study was that accelerometer-
assessed initial MVPA predicted frailty score at follow-up. However,
baseline ST was not significantly related to frailty after the follow-up. We
further found that initial frailty status predicted subsequent ST (i.e., more
frailty status was related to posterior higher levels of SB), but not of MVPA.
These results have the potential to inform future interventions that aim at
reducing the burden associated with frailty among older adults.
Longitudinal relationship between MVPA and frailty
Different cross-sectional [207, 312, 331] and longitudinal [208] studies have
linked MVPA with frailty. Blodgett et al. [207] found that MVPA was
associated with frailty in a group of community dwelling adults aged over
50 from the National Health and Nutrition Examination Survey. Other
longitudinal studies such as Rogers et al. [208] have also confirmed these
results in 8649 adults aged 50 and over an average of 10 years of follow-up.
We also found that MVPA prospectively predicted frailty levels in our
sample. There are numerous arguments supporting these findings [193,
196, 332, 333]. It has been demonstrated that physical activity, particularly
of moderate intensity plays an important role on multiple components of
DISCUSSION STUDY 6
322
the frailty syndrome including the frailty phenotype, physiologic
dysregulation, and cellular function [192]. Increases in MVPA seem to also
preserve or even improve muscle function and structure, protein synthesis,
glucose metabolism or inflammation [196]. Furthermore, regular physical
activity can maintain a set of bioenergetically functional mitochondria that,
by improving systemic mitochondrial function, contribute to reducing the
risk of morbidity and mortality throughout life [332]. Not surprisingly,
MVPA is considered a cornerstone for the prevention, delay or treatment
of frailty among older adults.
On the other hand, our results did not support the hypothesis that initial
frailty levels predict future MVPA levels. Several studies support the
predictive ability of physical functioning on subsequent MVPA levels [334-
336]. However, it may also be plausible that other, non-biological
mechanisms (e.g., behavioural) accounted for the observations of the
current study. Different intervention studies have shown the possibility of
increasing physical activity also in frail participants [337]. For example,
Yamada et al. [338] found that is possible to promote exercise of MVPA
among very frail older adults. Future studies are warranted to clarify the
role of frailty in subsequent MVPA levels in older adults.
Longitudinal relationship between SB and frailty
Sedentary behaviour has recently been considered as an important factor
for numerous health outcomes [188, 339]. A recent systematic review has
shown that SB may be associated with increased levels of frailty,
particularly among the most vulnerable population [340]. Interestingly, our
results indicate that SB was not a determinant of frailty, but rather a
STUDY 6 DISCUSSION
323
consequence of an altered state of increased frailty. A smaller study by
Edholm et al. [341] with 60 older woman found that only activities of at
least moderate intensity were associated with physical function in a
subsequent follow-up time but not activities of lighter intensity or
sedentary activities. In addition, Marques et al. [342], in a study conducted
with 131 males and 240 females aged 65-103 years, suggested that ST was
not a significant predictor of loss of physical independence in later life. In
a previous cross-sectional study, we showed that engaging in high levels
of MVPA (i.e., 27 minutes/day) could cancel out the detrimental effects of
SB on frailty, which may partly explain our current observations [233].
Given that the relationship between SB and frailty may go beyond total
accumulated time [319], future studies should enquire whether or not the
results of this, and other studies are confirmed for different patterns of
accumulation of SB.
Relevance
According to our findings, the promotion of MVPA at earlier stages will
translate into more MVPA and less frailty markers in the future. Also, the
observations of the current study point out to the possibility that the
detrimental effects on frailty are primarily defined by insufficient amounts
of MVPA rather than an excessive amount of ST. Public health
organizations should target MVPA to reduce the burden associated with
frailty in older adults.
DISCUSSION STUDY 6
324
Strengths and limitations
An important strength of our study is that includes a relatively large
sample of community-dwelling older adults with longitudinal data
separated by 4-years. It also includes accelerometer-derived sedentary and
physical activity behaviour estimations. Also, although there is no
established gold standard to identify frailty, the FTS has been suggested as
a measurement of frailty with superior predictive validity than previously
validated scales such as the Frailty Phenotype [37] and the Frailty Index
[302]. Additionally, a key strength of this study was that the statistical
analysis deployed has allowed to explore the auto-regressive and cross-
lagged pathways in exploring how frailty relates over time with both
MVPA and SB. Despite the methodological rigor of this study, some
limitations have to be acknowledged. First, we cannot rule out the
possibility that our estimations could be influenced by the characteristics
of the participants who did not provide valid data at follow-up (i.e., older,
less active, more sedentary, less educated) and therefore our results should
be interpreted with caution. A further limitation of our work was that
despite validity and widely used of accelerometers to assess physical
activity in free living conditions, these devices are not able to discriminate
between sitting and standing [315] or activity type (e.g., running vs. muscle
strength), which could potentially bias the estimations in our study. Finally,
physical activity and SB have been examined separately from other lifestyle
behaviours (e.g., diet, smoking, alcohol consumption). However, lifestyle
behaviours tend to cluster together. Therefore, it could be that our results
rather reflect the synergistic consequences of different observed (i.e.,
physical activity and SB) and unobserved (e.g., diet quality) lifestyle
behaviours [343, 344]. Future studies may want to test this hypothesis.
STUDY 7 DISCUSSION
325
6.7. Study 7
To our knowledge, the present study tested for the first time the temporal
and bidirectional associations between the number of daily BST and frailty
status in a sample of community-dwelling older adults. The main findings
were that, in physically inactive individuals there was an inverse
relationship between BST and frailty status 4 years later. The reverse was
also true (i.e., frailty status at baseline was inversely associated with BST 4
years later). There was no evidence of longitudinal association between BST
and frailty in older adults who were considered physically active.
Consequently, increasing daily BST could be a promising strategy to reduce
the burden of frailty syndrome in physically inactive older adults.
Longitudinal relationship between BST and frailty
Different cross-sectional studies have explored the associations of BST with
physical function [218], disability [220], and frailty [319] in older adults. A
previous study found a positive association between BST and physical
function, after adjusting for total ST and MVPA [218]. In a study comprising
1634 Japanese older adults, greater BST was associated with lower
likelihood of instrumental activities of daily living disability [220]. In
another study conducted in older adults assessed with accelerometers,
daily BST was associated with lower frailty in older adults [319]. Our study
extends these previous findings and investigated the longitudinal and
bidirectional associations between daily BST and frailty in a sample of
community-dwelling participants 65 years and over. In physically inactive
DISCUSSION STUDY 7
326
individuals, a higher daily number of BST predicted a lower frailty status
after 4 years. Further, a lower baseline frailty status predicted greater daily
number of BST 4 years later. Mechanisms underlying these findings are
likely to be complex. Experimental studies have provided evidence related
to the physiologic and cardiometabolic benefits of breaking-up and
reducing sitting time [345]. The evidence suggests that beyond the increase
in energy expenditure that requires a transition from sitting to standing
position [346], the benefits of frequent BST can be explained by the
muscular contractions derived from such transitions [347]. These muscular
contractions, which will mostly be provided in light physical intensity
activities, can lead to important functional adaptations through different
physiological and molecular pathways [235, 347-350] that ultimately affect
human health [351]. Therefore, it seems evident that physically inactive
individuals who break their ST more often may reduce their frailty status.
Likewise, less frail individuals, will find it easier to break ST more often
compared to other more structured physical task, thus becoming a positive
circle (negative if the question is raised backwards). This is in accordance
with a previous study of our group that demonstrated that older adults
with comorbidities may benefit more from replacing ST with LPA activity
compared to healthier counterparts [312]. A recent meta-analysis also
reported the benefits of replacing sitting time with LPA activities for
cardiometabolic health and mortality [326]. Together, these findings
suggest the potential of targeting reductions in ST to improve the health of
older adults [345, 352].
In contrast, we did not detect a statistical association between baseline daily
BST and follow-up frailty status among physically active older adults. In a
previous study, it was suggested that lower BST were linked with better
STUDY 7 DISCUSSION
327
muscle quality in a sample of highly functioning and highly active older
adults [261]. It is plausible that active participants are also fit [353] and that
a stimulus stronger than muscle contractions resulting from breaking-up
ST is necessary to evoke reductions in the frailty status among these
individuals. This suggest that the effects of BST on frailty may be
moderated by fitness. Similarly, we speculate a higher physiological
reserve (i.e., less frailty) present in active participants may have accounted
for the lack of association between initial frailty status and daily BST at
follow-up. Further experimental studies are required to investigate our
observations. The lack of significant results for the total sample is likely to
reflect the heterogeneity in the estimations for active and inactive
individuals in this study (i.e., the positive findings for inactive individuals
are cancelled out by the null findings among active individuals).
Relevance
These findings are likely to be policy-relevant: current physical activity
guidelines for older adults focused mainly on MVPA [139, 140]. Further to
increase MVPA, our results also stress the relevance of breaking-up ST,
particularly in those physically inactive individuals. From a health
promotion perspective, encouraging small bouts of activity into otherwise
sedentary periods may be a more feasible and less challenging approach
for older adults than taking part in more intense activities. Breaking-up ST
can occur trivially in a variety of daily living activities (at home, during
transport, or leisure time) because: i) it does not require a high degree of
commitment or planning, ii) it can be achieved with a physically lower
load, and iii) it does not require a high level of fitness or complex motor
DISCUSSION STUDY 7
328
skills. Altogether, our observations indicate the possibility of targeting BST
to reduce the frailty levels in physically inactive older adults [345].
Strengths and limitations
A key strength of our work is that it comprises a relatively large sample of
community-dwelling older adults with data follow-up of 4 years. The use
of accelerometer-derived sedentary and physical activity behaviour in this
study is also a strength. Another strength is the robustness of the FTS to
assess the frailty level of participants. The FTS has demonstrated superior
predictive validity and responsiveness than previously validated
constructs such as the Frailty Phenotype [37] and the Frailty Index [302].
Furthermore, another key strength of this study is the use of a statistical
method (i.e., cross-lagged panel model) that allowed us to investigate the
temporal order and bidirectional, longitudinal associations of BST with
frailty over time in the study participants.
Despite the methodological rigor of this study, some limitations must to be
acknowledged. First, we cannot rule out the possibility that our estimations
could be biased by the characteristics of the participants who did not
provided valid data at follow-up (i.e., they were older, less active, more
sedentary, and less educated than those included in the final analysis).
Consequently, our results should be taken with caution. An additional
limitation is the limited ability of accelerometers to discriminate between
sitting and standing compared with posture-based devices [315, 316, 354].
Importantly, in our study, a break in ST reflects a modification in
acceleration instead of a change in posture, corresponding to a transition
from none or slight movement (<100 cpm) to some movement (≥100 cpm).
STUDY 7 DISCUSSION
329
Future studies should replicate our analysis with posture-based devices.
Lastly, experimental studies are required to confirm our observations [355].
Future studies should investigate optimal strategies to increase the number
of BST throughout the day in older adults, particularly among those not
achieving the recommended level of physical activity.

330

331
CHAPTER 7
CONCLUSIONS
CONCLUSIONS
332
CONCLUSIONS
333
Study 1
- There is consistent evidence on the relationship between objectively
measured SB and physical performance in the elderly. The
association among sedentary lifestyle, frailty incidence and mortality
rates warrant further investigation.
- The lack of studies assessing these outcomes and the wide variety of
methodological issues reported among the reviewed studies make
difficult to draw definitive conclusions.
- Another important aspect that deserves further investigation is the
manner that SB is accumulated. Breaks in sedentary time seem to
minimize the decline of physical performance with aging. Future
research should test this hypothesis also regarding frailty and
mortality outcomes.
CONCLUSIONS
334
Study 2
- Sedentary time, breaks in sedentary time, and daily proportion of
time spent in SB bouts of 10 minutes or more are associated with
frailty in older people in the TSHA study. Altogether, these results
may point to the pathways through which engaging in frequent,
short bouts of activity insertions into otherwise continuous
sedentary periods can attenuate frailty among older adults.
- Our results suggest that interventions should therefore not only be
focused on reducing the total time spent in sedentary activities but
also on how that time is accrued in order to prevent frailty in older
people. However, longitudinal, experimental research, preferably in
form of RCT, is required to confirm the causality of the relationships
observed in the current study.
CONCLUSIONS
335
Study 3
- This study demonstrates that replacing 30 minutes/d of SB with the
same amount of MVPA could bring benefits in terms of frailty status
among older adults. Participants with comorbidities may also benefit
from the substitution of ST by LPA.
- From a public health perspective, this is an important message in
order to improve frailty status through increasing LPA, which a
priori seems to be a more feasible approach as opposed to increasing
MVPA in this specific population group. Future research should
move beyond this hypothetical, observational evidence and identify
more-robust indication of the frailty outcomes of experimentally
reallocating time spent in SB with physical activities of different
intensities.
CONCLUSIONS
336
Study 4
- We observed that physically active older adults had better physical
function and frailty profiles than those considered physically
inactive, even in the presence of high ST. Higher levels of LPA
relative to ST seems to provide additional benefits in both physical
function and frailty outcomes among those meeting the physical
activity guidelines. Lower sedentary levels were associated with
decreased frailty in physically inactive participants.
- Altogether, our findings reinforce the idea of the health-enhancing
benefits of meeting the current physical activity guidelines. Also, our
results highlight the relevance of LPA for inactive older adults. If our
results remain experimentally true, light intensity physical activity
can be promoted as a middle step intervention among inactive
individuals to achieve the recommended levels of physical activity
and improve their health. We should move beyond observational
studies and confirm our results in well-design longitudinal,
experimental studies.
CONCLUSIONS
337
Study 5
- The present study shows that MVPA is a moderator in the
relationship between ST and frailty in older adults, offsetting the
harmful effects of SB with 27 minutes per day of MVPA.
- Whenever possible, efforts should be directed towards the
promotion of MVPA in older adults. Also, reducing SB may be
beneficial, particularly in those engaging in less intense activity
throughout the day.
CONCLUSIONS
338
Study 6
- Our findings suggest that based on our longitudinal data MVPA, but
not SB, predicts frailty in older adults. In contrast, frailty seems to be
a predictor of SB but not of MVPA.
- Efforts should be directed at increasing MVPA from earlier stages.
Future experimental studies should examine the best strategies to
include MVPA in the daily lives of older people.
CONCLUSIONS
339
Study 7
- According to our hypothesis, the longitudinal relationship between
the daily number of sedentary breaks and the frailty levels is
bidirectional in physically inactive older individuals. We found no
evidence of a longitudinal association between BST and frailty in
older adults considered physically active.
- Our study provides robust longitudinal evidence that breaking-up
ST more often may reduce frailty in older adults that do not meet
physical activity recommendations. Pending on experimental
confirmation, targeting frequent reductions in ST may provide with
a feasible approach to reduce the burden of frailty among more at
risk inactive older adults.

340

341
CHAPTER 8
FUTURE
PERSPECTIVES

FUTURE PERSPECTIVES
342
FUTURE PERSPECTIVES
343
The worldwide progressive aging of population involves a significant
challenge to the long-term sustainability of public health and social care.
Today, technological, economic and social changes have completely
modified our lifestyle, with important implications for our health and well-
being. Physical activity, and recently SB, are two of the cornerstones which
are more likely to ensure a healthier aging process. From a physical and
public health perspective, the message about the use of time is clear: reduce
total ST, break-up prolonged periods of ST, and move more. In this dissertation,
we have addressed diverse questions in relation to the role played by these
three concepts (reduce, break-up, and move) in a particular health outcome
such as frailty syndrome. Specifically, the association of ST and its different
patterns with frailty has been observed. How physical activity interacts in
the SB and frailty relationship (either replacing time, combining
behaviours, or moderating the association) has also been examined. Finally,
we have tried to establish the temporal order of the associations between
ST, MVPA, and BST with frailty. Previously, the potential strengths and
limitations that the presented investigations may contain have been
discussed. Now, we will identify some of the most promising research
strategies and future directions that could extend our findings and
contribute to the development of research in the field of physical activity,
SB, and health.
A body of evidence on the relationship between SB and different health
variables has grown rapidly. Observational evidence, both transversal and
prospective, has generated and continues creating new hypotheses about
the influence of SB on health. However, experimental evidence must
provide rigorous research that addresses the hypotheses produced by
observational studies. To the best of our knowledge, no specific
FUTURE PERSPECTIVES
344
interventions aiming reductions in SB have been performed to address
frailty. Breaking-up sedentary time more frequently may be a possible first
step for those individuals with a more diminished homeostatic reserve, and
then move on to individualized physical activity programs prescribed by
professionals. Developing this type of staggered interventions will be
paramount from a public health perspective to promote successful aging.
Knowing that both the total ST and the way in which this time is
accumulated is linked to frailty, other reasonable step would be to identify
the dose-response of these relationships. Future research should address
key issues such as how much ST is too much or the adequate frequency,
duration, and intensity with which ST should be broken-up to reduce
adverse health effects.
Studies focusing on how older adults allocate their ST throughout the day,
as well as an understanding of what activities cover the spectrum of ST in
this type of population can be useful in order to design future successful
interventions aimed at reducing ST and increase the time of physical
activity. In this sense, examining the effects of the type of sedentary
activities with cognitive function may be of great interest because probably
not all sitting activities have the same impact on brain activity (e.g., reading
vs. driving), and therefore, some of them could be preventive and others
harmful to cognition.
High quality designs and measurements are necessary for the progress of
the research and its subsequent implementation in the real world. One of
the challenges in this field is to use devices that are capable of not only
capturing the intensity of the movement but also the posture. An example
of this may be inclinometers, devices that have demonstrated a high
capacity to capture postural changes compared to direct observation [356].
FUTURE PERSPECTIVES
345
In addition, other new technologies can be used to provide context for ST
such as wearable cameras and global positioning system.
Future research should study the differences in age and sex in the SB,
physical activity and frailty relationship. Thus, more tailored
recommendations can be provided, making them more attainable and
sustainable in the future.
Finally, identifying personal, social and environmental barriers to reduce
ST and increase physical activity will help create strategies and programs
with high adherence in the medium to long term. Future research should
also address fundamental questions about cost-effective and feasible
interventions. The results found by these investigations should be applied
in institutions, especially public organizations, that combine environment
and policy changes associated with individual and social interventions.
Only in this way, science can reach the real life of individuals, improving
their quality of life through healthy aging.

346

347
CHAPTER 9
ACKNOWLEDGMENTS
ACKNOWLEDGMENTS
348
ACKNOWLEDGMENTS
349
The completion of this PhD thesis has been a journey of 4 years, and it is
fair to show my deepest thanks to all those who have made it possible.
Firstly, I would like to thank my supervisors: ‘Professor’ Ignacio Ara; Dr.
Borja del Pozo Cruz; and, Dr. Amelia Guadalupe Grau. Your expertise,
confidence, and support from each have provided me with valuable
knowledge and research skills that I never could have imagined.
Many thanks to Franjo (head of the “Geriatric Department of the Hospital
Virgen del Valle” in Toledo; Spain) to open the doors of the hospital to the
exercise sciences, giving the importance it deserves in public health. Thank
you to Leocadio (head of the “Geriatric Department of the Hospital
Universitario de Getafe” in Getafe; Spain), co-director of the TSHA together
with Franjo, for allowing me to use data from the TSHA cohort in my PhD.
Additionally, thanks to all the components who are part of the “GENUD
Toledo Research Group”, the “Geriatric Department of the Hospital Virgen
del Valle” and the “Toledo Study for Healthy Aging”.
Thanks also to all the co-authors who have contributed to these studies, to
the University of Castilla-La Mancha, and to the people and research
groups that have allowed me to carry out the research stays.
Lastly, especially thanks to my family and friends, without your love and
support none of this would be possible.
At this point, I would like to show a few words of thanks to each of them
in my native language.
ACKNOWLEDGMENTS
350
Todo empezó hace ya más de 4 años, y una vez esta etapa llega a su fin, es
justo mostrar mi más sincero cariño y agradecimiento a todas aquellas
personas que han hecho posible recorrer este camino. Sirvan estas líneas de
homenaje a cada uno de vosotros.
Si en la vida tengo que agradecer algo, es de tener a mi familia. Mamá y
papá, papá y mamá. Cada día habéis dado y dais lo mejor de vosotros para
mantener esta familia. Siempre habéis sabido estar a la altura de cada
momento. Siempre habéis confiado en mí ciegamente. Me habéis sabido
inculcar valores como el respeto, el sacrificio, la humildad, la justicia, la
responsabilidad o la honestidad. Mi pasión por el ejercicio y la salud es por
vosotros. No se me olvidarán todos los entrenamientos a los que me habéis
tenido que llevar, así como todos los fines de semana malgastados para que
yo pudiera competir. Sé que, tras todo vuestro esfuerzo, nunca habéis
esperado nada a cambio, sólo mi felicidad y bienestar. Por vosotros soy lo
que soy y estoy donde estoy, me siento orgulloso de teneros como padres.
Por todo esto y mucho más que no podría expresar con palabras, gracias,
os quiero mucho. Esta tesis es más vuestra que mía.
A mi hermano pequeño, Aitor. Esta familia no sería lo mismo sin ti. Como
hermano mayor, siempre he intentado ser un ejemplo, pero siento si alguna
vez no ha sido así. En mi recuerdo, aunque espero que todavía queden más,
están todas esas madrugadas simplemente charlando y riendo. Sé que
muchas de ellas has aguantado solo porque sabías que quería desahogarme
sin decirlo. Una de mis mejores terapias para aguantar toda la presión
acumulada de años. Te quiero hermano, muchas gracias por todo.
Mil gracias Cristina. Todos los viajes que hemos hecho han sido meditados
y preparados a conciencia. Sin embargo, tú aceptaste acompañarme
durante todo este viaje, sin saber a dónde nos llevaría, pero sin dudar que
ACKNOWLEDGMENTS
351
saldría bien. Me has apoyado siempre, me has escuchado, me has
entendido, me has aconsejado. Sé que han sido muchos los momentos que
hemos perdido porque yo estaba trabajando o tenía que trabajar, y valoro
enormemente que en esos momentos, lejos de molestarte, tu respuesta
siempre fuera ¿en qué puedo ayudarte? Prometo estar más tiempo a tu
lado, disfrutar de cada momento y hacerte sonreír, al menos, tanto como tú
me has hecho sonreír a mí. Has sido, eres y serás un regalo en mi vida. Te
quiero.
Gracias a Carmen, Jose, Sonia y Miguel por haberme hecho parte de vuestra
familia. Y gracias a la alegría de la casa, Natalia. Ser tu tito Asier para mí es
algo único. Espero poder inculcarte buenos valores, especialmente el amor
por el conocimiento, la pasión por la ciencia y el entusiasmo de una vida
sana. Recuerda que podrás contar conmigo siempre que lo necesites.
No me olvido de vosotros, abuelos. Especialmente de ti, abuelo Pepe. De
pequeño soñábamos juntos que de mayor sería inventor, y aunque no lo
haya conseguido, entiendo que la ciencia es otra forma de invención. Es
verdad que sin “alambrillos”, pero planteamos cuestiones que no existían
antes para intentar responderlas. Gracias por enseñarme el camino del
trabajo duro y la constancia.
Se dice que los amigos son la familia que uno elige. Y yo elegí la mejor de
las familias. Gracias a mi familia de Valdepeñas: Yolanda, Javi, Jesús, Padi,
Ángel, Sandra, Elena, Nuria, Maroto, Raquel, Leire, Álvaro. Gracias a mi
familia de Toledo: Ángel, Marian, Víctor, Laura. La gran escritora Isabel
Allende dijo una vez, «la verdadera amistad resiste el tiempo, la distancia y el
silencio». Gracias Laura F. por resistir esta amistad. A todos vosotros os pido
disculpas si no os he dedicado el tiempo que debiera. Sabéis que sois una
ACKNOWLEDGMENTS
352
parte importante en mi vida, y a partir de ahora, intentaré pasar más tiempo
con cada uno de vosotros. Gracias chic@s, os quiero.
Profesionalmente, «si he visto más lejos es porque estoy sentado sobre los hombros
de gigantes». Nacho, tú eres ese gigante que supiste ver en mí capacidades
que incluso yo no vi. Recordaré para siempre esa revisión de examen en 3º
de carrera, y cómo a partir de ese momento me sentí parte del equipo
GENUD Toledo. Gracias por confiar en mí, por escucharme, por alentarme,
pero gracias especialmente por preocuparte por mi bienestar. Antes de
cualquier reunión en tu despacho, siempre me has preguntado por mi vida
personal, por mi salud. Supiste entender que en ciertos momentos yo
necesitaba un cambio, y nunca te estaré lo suficientemente agradecido por
dejarme hacer lo que actualmente hago.
Gracias a Amelia y Borja, mis co-directores. Por diferentes motivos, con
Amelia pasé más tiempo al principio, y con Borja al final. Sin embargo,
ambos habéis sido, en etapas diferentes, ese apoyo que le gustaría tener a
todo doctorando para construir su tesis.
A mi grupo GENUD Toledo. Gracias a cada uno de los integrantes. A la
cabeza, Nacho y Luis actuando siempre como guías de este equipo. Nunca
se agradece lo suficiente toda la gestión que vosotros hacéis para que los
demás podamos trabajar en las mejores condiciones. Gracias a Sara por
estar atenta a todo y darle el toque más social y divertido a este grupo.
Gracias Jose por mediar la relación con el hospital y que tengamos esta alta
disponibilidad de datos. Qué decir de vosotros chic@s. Recuerdo que
cuando empecé en el laboratorio solo estábamos María, Irene y yo, y ahora
somos cerca de 20 personas. Gracias a María, Irene, Julián, Carlos, Rober,
Javi, Iván y a las nuevas incorporaciones, Miguel, Coral y Héctor. Con
vosotros todo ha sido mucho más sencillo. Es una maravilla compartir sitio
ACKNOWLEDGMENTS
353
con mentes tan brillantes como las vuestras. Gracias especialmente a ti
Irene, dentro del grupo tú me has entendido mejor que nadie y has sido mi
apoyo dentro y fuera del laboratorio durante todos estos años de risas y
estrés continuo.
Gracias al Servicio de Geriatría del Hospital Virgen del Valle (Complejo
Hospitalario de Toledo). Especialmente, gracias a Franjo por confiar en
nosotros, los educadores físico-deportivos, para que tengamos cabida en el
sistema de salud a través de equipos multidisciplinares. Gracias también a
Leocadio, co-director junto a Franjo del proyecto Estudio Toledo de
Envejecimiento Saludable. Vosotros habéis permitido que esta tesis se haga
realidad. Y finalmente, gracias a vosotros, participantes. Esta tesis es
vuestra, para que podáis no sólo poner más años a la vida sino más vida a
los años. Gracias por colaborar voluntariamente con el único interés de que
la ciencia avance. Espero que ahora los hallazgos de esta tesis reporten en
vuestro beneficio.
Gracias a Borja en Australia y al profesor Sardinha en Portugal por darme
la bienvenida en sus respectivos laboratorios e involucrarme en sus
investigaciones, además de enriquecer las propias. Y muchas gracias
también a todos los co-autores de los estudios por su contribución a esta
tesis.
Gracias a la que considero mi casa, la Universidad de Castilla-La Mancha.
Casi 10 años de experiencias inolvidables, donde he crecido profesional y
personalmente. Quiero destacar haber conocido a Julián Garde, Vicerrector
de Investigación y Política Científica. En mi vida, me he encontrado con
pocas personas más honradas, humildes y trabajadoras. Personas como tú
hacen grande a esta universidad, a la investigación, y a la educación pública
española.
ACKNOWLEDGMENTS
354
Me gustaría hacer una mención especial a Vicky, Pilar y Chema. Aunque
mi trabajo con vosotros no haya sido parte de esta tesis doctoral, estoy
profundamente agradecido de haber estado a vuestro lado en esta etapa.
Mi trabajo en Red Eléctrica de España ha sido fundamental para que haya
afrontado con ilusión todos estos años. Vosotros me habéis hecho sentir
parte de una familia. Muchas gracias por confiar siempre en mí.
Gracias a mi profesión, las ciencias del ejercicio. Desde muy pequeño quise
ser parte de vuestro mundo y hoy soy muy feliz gracias a que me levanto
pensando que toca trabajar en lo que me apasiona.
Gracias a ti también, que estás leyendo esta tesis.
En definitiva, jamás podría decir que esta tesis es solo mía, pues es el
resultado del esfuerzo de todos y cada uno de vosotros. De todos aquellos
que en el camino habéis hecho posible que hoy sea la persona en la que me
he convertido, A TODOS VOSOTROS ¡MUCHAS GRACIAS!

ACKNOWLEDGMENTS
355

356

357
CHAPTER 10
REFERENCES
REFERENCES
358
REFERENCES
359
1. Kontis V, Bennett JE, Mathers CD, Li G, Foreman K, Ezzati M.
Future life expectancy in 35 industrialised countries: projections with a
Bayesian model ensemble. Lancet (London, England).
2017;389(10076):1323-35.
2. Oeppen J, Vaupel JW. Broken limits to life expectancy. Science.
2002;296(5570):1029-31.
3. Brown GC. Living too long: the current focus of medical research
on increasing the quantity, rather than the quality, of life is damaging our
health and harming the economy. EMBO Rep. 2015;16(2):137-41.
4. Vaupel JW. Biodemography of human ageing. Nature.
2010;464(7288):536-42.
5. Oeppen J, Vaupel JW. Demography. Broken limits to life
expectancy. Science. 2002;296(5570):1029-31.
6. Scully T. Demography: To the limit. Nature. 2012;492(7427):S2-3.
7. Christensen K, Doblhammer G, Rau R, Vaupel JW. Ageing
populations: the challenges ahead. Lancet (London, England).
2009;374(9696):1196-208.
8. United Nations Department of Economic and Social Affairs. World
population prospects: the 2017 revision: UN; 2017.
9. European Commission. The 2018 Ageing Report: Economic &
Budgetary Projections for the 28 EU Member States (2016-2070): European
Union; 2018.
10. Instituto Nacional de Estadistica. INEbase Proyecciones de
Población 2018 2018. Available from:
http://www.ine.es/dyngs/INEbase/es/operacion.htm?c=Estadistica_C&cid
=1254736176953&menu=ultiDatos&idp=1254735572981.
11. Eurostat. Total fertility rate: number of children per woman:
European Commission; 2019.
REFERENCES
360
12. Storeygard A, Balk D, Levy M, Deane G. The Global Distribution
of Infant Mortality: A subnational spatial view. Popul Space Place.
2008;14(3):209-29.
13. Bloom DE, Canning D, Lubet A. Global Population Aging: Facts,
Challenges, Solutions & Perspectives. Daedalus. 2015;144(2):80-92.
14. Halpern NA, Goldman DA, Tan KS, Pastores SM. Trends in Critical
Care Beds and Use Among Population Groups and Medicare and Medicaid
Beneficiaries in the United States: 2000-2010. Critical care medicine.
2016;44(8):1490-9.
15. Davis MA, Nallamothu BK, Banerjee M, Bynum JPW. Identification
Of Four Unique Spending Patterns Among Older Adults In The Last Year
Of Life Challenges Standard Assumptions. Health Aff (Millwood).
2016;35(7):1316-23.
16. Gozalo P, Plotzke M, Mor V, Miller SC, Teno JM. Changes in
Medicare costs with the growth of hospice care in nursing homes. New
England Journal of Medicine. 2015;372(19):1823-31.
17. Nakatani H. Global Strategies for the Prevention and Control of
Infectious Diseases and Non-Communicable Diseases. J Epidemiol.
2016;26(4):171-8.
18. Ten great public health achievements--worldwide, 2001-2010.
MMWR Morbidity and mortality weekly report. 2011;60(24):814-8.
19. Beltrán-Sánchez H, Soneji S, Crimmins EM. Past, Present, and
Future of Healthy Life Expectancy. Cold Spring Harb Perspect Med.
2015;5(11):a025957.
20. Klijs B, Nusselder WJ, Looman CW, Mackenbach JP. Contribution
of Chronic Disease to the Burden of Disability. PLOS ONE.
2011;6(9):e25325.
REFERENCES
361
21. Yokota RTC, Berger N, Nusselder WJ, Robine J-M, Tafforeau J,
Deboosere P, et al. Contribution of chronic diseases to the disability burden
in a population 15 years and older, Belgium, 1997-2008. BMC public health.
2015;15:229-.
22. Valderrama-Gama E, Damian J, Ruigomez A, Martin-Moreno JM.
Chronic disease, functional status, and self-ascribed causes of disabilities
among noninstitutionalized older people in Spain. The journals of
gerontology Series A, Biological sciences and medical sciences.
2002;57(11):M716-21.
23. Masnoon N, Shakib S, Kalisch-Ellett L, Caughey GE. What is
polypharmacy? A systematic review of definitions. BMC geriatrics.
2017;17(1):230-.
24. Sociedad Española de Geriatría y Gerontología. Farmacología y
envejecimiento. Los medicamentos y las personas mayores: SEGG; 2015.
25. Parry CD, Patra J, Rehm J. Alcohol consumption and non-
communicable diseases: epidemiology and policy implications. Addiction.
2011;106(10):1718-24.
26. Samokhvalov AV, Popova S, Room R, Ramonas M, Rehm J.
Disability associated with alcohol abuse and dependence. Alcohol Clin Exp
Res. 2010;34(11):1871-8.
27. Fielding RA, Guralnik JM, King AC, Pahor M, McDermott MM,
Tudor-Locke C, et al. Dose of physical activity, physical functioning and
disability risk in mobility-limited older adults: Results from the LIFE study
randomized trial. PLoS One. 2017;12(8):e0182155.
28. Pinsky JL, Branch LG, Jette AM, Haynes SG, Feinleib M, Cornoni-
huntley JC, et al. Framingham Disability Study: relationship of disability to
cardiovascular risk factors among persons free of diagnosed cardiovascular
disease. American journal of epidemiology. 1985;122(4):644-56.
REFERENCES
362
29. Foster L, Walker A. Active and successful aging: A European policy
perspective. The Gerontologist. 2014;55(1):83-90.
30. World Health Organization. Active Ageing: A policy framework:
European Commission; 2002.
31. Organization WH. WHO global strategy on people-centred and
integrated health services: interim report. World Health Organization,
2015.
32. Chatterji S, Byles J, Cutler D, Seeman T, Verdes E. Health,
functioning, and disability in older adults--present status and future
implications. Lancet (London, England). 2015;385(9967):563-75.
33. Freedman VA, Martin LG, Schoeni RF. Recent trends in disability
and functioning among older adults in the United States: a systematic
review. Jama. 2002;288(24):3137-46.
34. Morley JE, Vellas B, van Kan GA, Anker SD, Bauer JM, Bernabei R,
et al. Frailty Consensus: A Call to Action. Journal of the American Medical
Directors Association. 2013;14(6):392-7.
35. Sager MA, Rudberg MA, Jalaluddin M, Franke T, Inouye SK,
Landefeld CS, et al. Hospital admission risk profile (HARP): identifying
older patients at risk for functional decline following acute medical illness
and hospitalization. Journal of the American Geriatrics Society.
1996;44(3):251-7.
36. Corti MC, Guralnik JM, Salive ME, Sorkin JD. Serum albumin level
and physical disability as predictors of mortality in older persons. Jama.
1994;272(13):1036-42.
37. Fried LP, Tangen CM, Walston J, Newman AB, Hirsch C,
Gottdiener J, et al. Frailty in older adults: evidence for a phenotype. The
journals of gerontology Series A, Biological sciences and medical sciences.
2001;56(3):M146-56.
REFERENCES
363
38. Rockwood K, Mitnitski A. Frailty in relation to the accumulation of
deficits. The journals of gerontology Series A, Biological sciences and
medical sciences. 2007;62(7):722-7.
39. Xue QL, Bandeen-Roche K, Varadhan R, Zhou J, Fried LP. Initial
manifestations of frailty criteria and the development of frailty phenotype
in the Women's Health and Aging Study II. The journals of gerontology
Series A, Biological sciences and medical sciences. 2008;63(9):984-90.
40. Bandeen-Roche K, Xue QL, Ferrucci L, Walston J, Guralnik JM,
Chaves P, et al. Phenotype of frailty: characterization in the women's health
and aging studies. The journals of gerontology Series A, Biological sciences
and medical sciences. 2006;61(3):262-6.
41. Gill TM, Gahbauer EA, Han L, Allore HG. Trajectories of disability
in the last year of life. The New England journal of medicine.
2010;362(13):1173-80.
42. Lee L, Heckman G, Molnar FJ. Frailty: Identifying elderly patients
at high risk of poor outcomes. Canadian family physician Medecin de
famille canadien. 2015;61(3):227-31.
43. Mitnitski AB, Mogilner AJ, Rockwood K. Accumulation of deficits
as a proxy measure of aging. TheScientificWorldJournal. 2001;1:323-36.
44. Rockwood K, Rockwood MR, Mitnitski A. Physiological
redundancy in older adults in relation to the change with age in the slope
of a frailty index. Journal of the American Geriatrics Society. 2010;58(2):318-
23.
45. Searle SD, Mitnitski A, Gahbauer EA, Gill TM, Rockwood K. A
standard procedure for creating a frailty index. BMC geriatrics. 2008;8:24.
46. Romero-Ortuno R. The Frailty Instrument for primary care of the
Survey of Health, Ageing and Retirement in Europe predicts mortality
REFERENCES
364
similarly to a frailty index based on comprehensive geriatric assessment.
Geriatr Gerontol Int. 2013;13(2):497-504.
47. Romero-Ortuno R, Soraghan C. A Frailty Instrument for primary
care for those aged 75 years or more: findings from the Survey of Health,
Ageing and Retirement in Europe, a longitudinal population-based cohort
study (SHARE-FI75+). BMJ open. 2014;4(12):e006645.
48. Dent E, Perez-Zepeda M. Comparison of five indices for prediction
of adverse outcomes in hospitalised Mexican older adults: a cohort study.
Archives of gerontology and geriatrics. 2015;60(1):89-95.
49. Blodgett J, Theou O, Kirkland S, Andreou P, Rockwood K. Frailty
in NHANES: Comparing the frailty index and phenotype. Archives of
gerontology and geriatrics. 2015;60(3):464-70.
50. Theou O, Brothers TD, Mitnitski A, Rockwood K.
Operationalization of frailty using eight commonly used scales and
comparison of their ability to predict all-cause mortality. Journal of the
American Geriatrics Society. 2013;61(9):1537-51.
51. Dent E, Chapman I, Howell S, Piantadosi C, Visvanathan R. Frailty
and functional decline indices predict poor outcomes in hospitalised older
people. Age and ageing. 2014;43(4):477-84.
52. Rockwood K, Mitnitski A. Limits to deficit accumulation in elderly
people. Mechanisms of ageing and development. 2006;127(5):494-6.
53. Woo J, Leung J, Morley JE. Comparison of frailty indicators based
on clinical phenotype and the multiple deficit approach in predicting
mortality and physical limitation. Journal of the American Geriatrics
Society. 2012;60(8):1478-86.
54. Clegg A, Young J, Iliffe S, Rikkert MO, Rockwood K. Frailty in
elderly people. Lancet (London, England). 2013;381(9868):752-62.
REFERENCES
365
55. Rodríguez-Mañas L, Féart C, Mann G, Viña J, Chatterji S, Chodzko-
Zajko W, et al. Searching for an operational definition of frailty: a Delphi
method based consensus statement: the frailty operative definition-
consensus conference project. The journals of gerontology Series A,
Biological sciences and medical sciences. 2013;68(1):62-7.
56. Newman AB, Gottdiener JS, McBurnie MA, Hirsch CH, Kop WJ,
Tracy R, et al. Associations of subclinical cardiovascular disease with
frailty. The journals of gerontology Series A, Biological sciences and
medical sciences. 2001;56(3):M158-66.
57. Afilalo J, Karunananthan S, Eisenberg MJ, Alexander KP, Bergman
H. Role of frailty in patients with cardiovascular disease. The American
journal of cardiology. 2009;103(11):1616-21.
58. Alonso-Bouzon C, Carcaillon L, Garcia-Garcia FJ, Amor-Andres
MS, El Assar M, Rodriguez-Manas L. Association between endothelial
dysfunction and frailty: the Toledo Study for Healthy Aging. Age
(Dordrecht, Netherlands). 2014;36(1):495-505.
59. Garcia-Garcia FJ, Carcaillon L, Fernandez-Tresguerres J, Alfaro A,
Larrion JL, Castillo C, et al. A new operational definition of frailty: the
Frailty Trait Scale. Journal of the American Medical Directors Association.
2014;15(5):371.e7-.e13.
60. Schuit AJ, Schouten EG, Westerterp KR, Saris WH. Validity of the
Physical Activity Scale for the Elderly (PASE): according to energy
expenditure assessed by the doubly labeled water method. Journal of
clinical epidemiology. 1997;50(5):541-6.
61. del Ser Quijano T, Sanchez Sanchez F, Garcia de Yebenes MJ, Otero
Puime A, Zunzunegui MV, Munoz DG. [Spanish version of the 7 Minute
screening neurocognitive battery. Normative data of an elderly population
sample over 70]. Neurologia (Barcelona, Spain). 2004;19(7):344-58.
REFERENCES
366
62. Guralnik JM, Simonsick EM, Ferrucci L, Glynn RJ, Berkman LF,
Blazer DG, et al. A short physical performance battery assessing lower
extremity function: association with self-reported disability and prediction
of mortality and nursing home admission. Journal of gerontology.
1994;49(2):M85-94.
63. Fowkes FG, Low LP, Tuta S, Kozak J. Ankle-brachial index and
extent of atherothrombosis in 8891 patients with or at risk of vascular
disease: results of the international AGATHA study. European heart
journal. 2006;27(15):1861-7.
64. Garcia-Garcia FJ, Gutierrez Avila G, Alfaro-Acha A, Amor Andres
MS, De Los Angeles De La Torre Lanza M, Escribano Aparicio MV, et al.
The prevalence of frailty syndrome in an older population from Spain. The
Toledo Study for Healthy Aging. The journal of nutrition, health & aging.
2011;15(10):852-6.
65. Jones CJ, Rikli RE, Beam WC. A 30-s chair-stand test as a measure
of lower body strength in community-residing older adults. Research
quarterly for exercise and sport. 1999;70(2):113-9.
66. Collard RM, Boter H, Schoevers RA, Oude Voshaar RC. Prevalence
of frailty in community-dwelling older persons: a systematic review.
Journal of the American Geriatrics Society. 2012;60(8):1487-92.
67. Theou O, Brothers TD, Rockwood MR, Haardt D, Mitnitski A,
Rockwood K. Exploring the relationship between national economic
indicators and relative fitness and frailty in middle-aged and older
Europeans. Age and ageing. 2013;42(5):614-9.
68. Abizanda Soler P, Lopez-Torres Hidalgo J, Romero Rizos L, Lopez
Jimenez M, Sanchez Jurado PM, Atienzar Nunez P, et al. [Frailty and
dependence in Albacete (FRADEA study): reasoning, design and
methodology]. Rev Esp Geriatr Gerontol. 2011;46(2):81-8.
REFERENCES
367
69. Alcala MV, Puime AO, Santos MT, Barral AG, Montalvo JI,
Zunzunegui MV. [Prevalence of frailty in an elderly Spanish urban
population. Relationship with comorbidity and disability]. Atencion
primaria. 2010;42(10):520-7.
70. Fernandez-Bolanos M, Otero A, Zunzunegui MV, Beland F,
Alarcon T, de Hoyos C, et al. Sex differences in the prevalence of frailty in
a population aged 75 and older in Spain. Journal of the American Geriatrics
Society. 2008;56(12):2370-1.
71. Jurschik P, Nunin C, Botigue T, Escobar MA, Lavedan A, Viladrosa
M. Prevalence of frailty and factors associated with frailty in the elderly
population of Lleida, Spain: the FRALLE survey. Archives of gerontology
and geriatrics. 2012;55(3):625-31.
72. Ferrer A, Formiga F, Plana-Ripoll O, Tobella MA, Gil A, Pujol R.
Risk of falls in 85-year-olds is associated with functional and cognitive
status: the Octabaix Study. Archives of gerontology and geriatrics.
2012;54(2):352-6.
73. Gonzalez-Vaca J, de la Rica-Escuin M, Silva-Iglesias M, Arjonilla-
Garcia MD, Varela-Perez R, Oliver-Carbonell JL, et al. Frailty in
INstitutionalized older adults from ALbacete. The FINAL Study: rationale,
design, methodology, prevalence and attributes. Maturitas. 2014;77(1):78-
84.
74. Garrido M, Serrano MD, Bartolomé R, Martínez-Vizcaíno V.
Diferencias en la expresión del síndrome de fragilidad en varones y mujeres
mayores institucionalizados sin deterioro cognitivo grave. Revista
Española de Geriatría y Gerontología. 2012;47(6):247-53.
75. Galluzzo L, O'Caoimh R, Rodriguez-Laso A, Beltzer N, Ranhoff
AH, Van der Heyden J, et al. Incidence of frailty: a systematic review of
REFERENCES
368
scientific literature from a public health perspective. Annali dell'Istituto
superiore di sanita. 2018;54(3):239-45.
76. Chen X, Mao G, Leng SX. Frailty syndrome: an overview. Clinical
interventions in aging. 2014;9:433-41.
77. Fried LP, Hadley EC, Walston JD, Newman AB, Guralnik JM,
Studenski S, et al. From bedside to bench: research agenda for frailty.
Science of aging knowledge environment : SAGE KE. 2005;2005(31):pe24.
78. Lipsitz LA. Dynamics of stability: the physiologic basis of
functional health and frailty. The journals of gerontology Series A,
Biological sciences and medical sciences. 2002;57(3):B115-25.
79. Bortz WM, 2nd. The physics of frailty. Journal of the American
Geriatrics Society. 1993;41(9):1004-8.
80. Lipsitz LA, Goldberger AL. Loss of 'complexity' and aging.
Potential applications of fractals and chaos theory to senescence. Jama.
1992;267(13):1806-9.
81. Fuggle N, Shaw S, Dennison E, Cooper C. Sarcopenia. Best Pract
Res Clin Rheumatol. 2017;31(2):218-42.
82. Cesari M, Landi F, Vellas B, Bernabei R, Marzetti E. Sarcopenia and
physical frailty: two sides of the same coin. Front Aging Neurosci.
2014;6:192-.
83. Tieland M, Trouwborst I, Clark BC. Skeletal muscle performance
and ageing. J Cachexia Sarcopenia Muscle. 2018;9(1):3-19.
84. Leng SX, Fried LP. Inflammatory Markers and Frailty. In: Fulop T,
Franceschi C, Hirokawa K, Pawelec G, editors. Handbook on
Immunosenescence: Basic Understanding and Clinical Applications.
Dordrecht: Springer Netherlands; 2009. p. 1293-303.
85. Yao X, Li H, Leng SX. Inflammation and immune system
alterations in frailty. Clinics in geriatric medicine. 2011;27(1):79-87.
REFERENCES
369
86. Li H, Manwani B, Leng SX. Frailty, inflammation, and immunity.
Aging and disease. 2011;2(6):466-73.
87. Leng S, Chaves P, Koenig K, Walston J. Serum interleukin-6 and
hemoglobin as physiological correlates in the geriatric syndrome of frailty:
a pilot study. Journal of the American Geriatrics Society. 2002;50(7):1268-
71.
88. Leng SX, Yang H, Walston JD. Decreased cell proliferation and
altered cytokine production in frail older adults. Aging clinical and
experimental research. 2004;16(3):249-52.
89. Hubbard RE, O'Mahony MS, Savva GM, Calver BL, Woodhouse
KW. Inflammation and frailty measures in older people. Journal of cellular
and molecular medicine. 2009;13(9b):3103-9.
90. Walston J, McBurnie MA, Newman A, Tracy RP, Kop WJ, Hirsch
CH, et al. Frailty and activation of the inflammation and coagulation
systems with and without clinical comorbidities: results from the
Cardiovascular Health Study. Archives of internal medicine.
2002;162(20):2333-41.
91. Kirkwood KL. Inflammaging. Immunological Investigations.
2018;47(8):770-3.
92. Ferrucci L, Fabbri E. Inflammageing: chronic inflammation in
ageing, cardiovascular disease, and frailty. Nat Rev Cardiol. 2018;15(9):505-
22.
93. Morley JE, Baumgartner RN. Cytokine-Related Aging Process. The
Journals of Gerontology: Series A. 2004;59(9):M924-M9.
94. Van Epps P, Oswald D, Higgins PA, Hornick TR, Aung H, Banks
RE, et al. Frailty has a stronger association with inflammation than age in
older veterans. Immun Ageing. 2016;13:27-.
REFERENCES
370
95. Puts MT, Visser M, Twisk JW, Deeg DJ, Lips P. Endocrine and
inflammatory markers as predictors of frailty. Clinical endocrinology.
2005;63(4):403-11.
96. Leng SX, Cappola AR, Andersen RE, Blackman MR, Koenig K, Blair
M, et al. Serum levels of insulin-like growth factor-I (IGF-I) and
dehydroepiandrosterone sulfate (DHEA-S), and their relationships with
serum interleukin-6, in the geriatric syndrome of frailty. Aging clinical and
experimental research. 2004;16(2):153-7.
97. Leng SX, Hung W, Cappola AR, Yu Q, Xue QL, Fried LP. White
blood cell counts, insulin-like growth factor-1 levels, and frailty in
community-dwelling older women. The journals of gerontology Series A,
Biological sciences and medical sciences. 2009;64(4):499-502.
98. Shardell M, Hicks GE, Miller RR, Kritchevsky S, Andersen D,
Bandinelli S, et al. Association of low vitamin D levels with the frailty
syndrome in men and women. The journals of gerontology Series A,
Biological sciences and medical sciences. 2009;64(1):69-75.
99. Gill TM, Gahbauer EA, Allore HG, Han L. Transitions between
frailty states among community-living older persons. Archives of internal
medicine. 2006;166(4):418-23.
100. Fernandez-Garrido J, Ruiz-Ros V, Buigues C, Navarro-Martinez R,
Cauli O. Clinical features of prefrail older individuals and emerging
peripheral biomarkers: a systematic review. Archives of gerontology and
geriatrics. 2014;59(1):7-17.
101. Landi F, Laviano A, Cruz-Jentoft AJ. The anorexia of aging: Is it a
geriatric syndrome? Journal of the American Medical Directors
Association. 2010;11(3):153-6.
102. Morley JE. Undernutrition: A major problem in nursing homes.
Journal of the American Medical Directors Association. 2011;12(4):243-6.
REFERENCES
371
103. Morley JE. Weight loss in older persons: new therapeutic
approaches. Current pharmaceutical design. 2007;13(35):3637-47.
104. Milne AC, Potter J, Vivanti A, Avenell A. Protein and energy
supplementation in elderly people at risk from malnutrition. The Cochrane
database of systematic reviews. 2009(2):Cd003288.
105. Neelemaat F, Bosmans JE, Thijs A, Seidell JC, van Bokhorst-de van
der Schueren MA. Post-discharge nutritional support in malnourished
elderly individuals improves functional limitations. Journal of the
American Medical Directors Association. 2011;12(4):295-301.
106. Morley JE, Argiles JM, Evans WJ, Bhasin S, Cella D, Deutz NE, et
al. Nutritional recommendations for the management of sarcopenia.
Journal of the American Medical Directors Association. 2010;11(6):391-6.
107. Tieland M, van de Rest O, Dirks ML, van der Zwaluw N, Mensink
M, van Loon LJ, et al. Protein supplementation improves physical
performance in frail elderly people: a randomized, double-blind, placebo-
controlled trial. Journal of the American Medical Directors Association.
2012;13(8):720-6.
108. Malafarina V, Uriz-Otano F, Iniesta R, Gil-Guerrero L.
Effectiveness of nutritional supplementation on muscle mass in treatment
of sarcopenia in old age: a systematic review. Journal of the American
Medical Directors Association. 2013;14(1):10-7.
109. Cawood A, Elia M, Stratton R. Systematic review and meta-
analysis of the effects of high protein oral nutritional supplements. Ageing
research reviews. 2012;11(2):278-96.
110. Paddon-Jones D. Perspective: Exercise and protein
supplementation in frail elders. Journal of the American Medical Directors
Association. 2013;14(1):73-4.
REFERENCES
372
111. Tieland M, Dirks ML, van der Zwaluw N, Verdijk LB, Van De Rest
O, de Groot LC, et al. Protein supplementation increases muscle mass gain
during prolonged resistance-type exercise training in frail elderly people: a
randomized, double-blind, placebo-controlled trial. Journal of the
American Medical Directors Association. 2012;13(8):713-9.
112. Murad MH, Elamin KB, Abu Elnour NO, Elamin MB, Alkatib AA,
Fatourechi MM, et al. The effect of vitamin D on falls: a systematic review
and meta-analysis. The Journal of Clinical Endocrinology & Metabolism.
2011;96(10):2997-3006.
113. Bischoff-Ferrari HA, Willett WC, Orav EJ, Lips P, Meunier PJ,
Lyons RA, et al. A pooled analysis of vitamin D dose requirements for
fracture prevention. New England Journal of Medicine. 2012;367(1):40-9.
114. Rejnmark L, Avenell A, Masud T, Anderson F, Meyer HE, Sanders
KM, et al. Vitamin D with calcium reduces mortality: patient level pooled
analysis of 70,528 patients from eight major vitamin D trials. The Journal of
Clinical Endocrinology & Metabolism. 2012;97(8):2670-81.
115. Muir SW, Montero‐Odasso M. Effect of vitamin D supplementation
on muscle strength, gait and balance in older adults: a systematic review
and meta‐analysis. Journal of the American Geriatrics Society.
2011;59(12):2291-300.
116. Gnjidic D, Hilmer SN, Blyth FM, Naganathan V, Waite L, Seibel MJ,
et al. Polypharmacy cutoff and outcomes: five or more medicines were used
to identify community-dwelling older men at risk of different adverse
outcomes. Journal of clinical epidemiology. 2012;65(9):989-95.
117. Kutsal YG, Barak A, Atalay A, Baydar T, Kucukoglu S, Tuncer T, et
al. Polypharmacy in the elderly: a multicenter study. Journal of the
American Medical Directors Association. 2009;10(7):486-90.
REFERENCES
373
118. Kojima G, Bell C, Tamura B, Inaba M, Lubimir K, Blanchette PL, et
al. Reducing cost by reducing polypharmacy: the polypharmacy outcomes
project. Journal of the American Medical Directors Association.
2012;13(9):818. e11-. e15.
119. Fitzgerald SP, Bean NG. An analysis of the interactions between
individual comorbidities and their treatments—implications for guidelines
and polypharmacy. Journal of the American Medical Directors Association.
2010;11(7):475-84.
120. Morley JE. Polypharmacy in the nursing home. Journal of the
American Medical Directors Association. 2009;10(5):289-91.
121. Merle L, Laroche M-L, Dantoine T, Charmes J-P. Predicting and
preventing adverse drug reactions in the very old. Drugs & aging.
2005;22(5):375-92.
122. Gallagher P, Ryan C, Byrne S, Kennedy J, O'Mahony D. STOPP
(Screening Tool of Older Person's Prescriptions) and START (Screening
Tool to Alert doctors to Right Treatment). Consensus validation.
International journal of clinical pharmacology and therapeutics.
2008;46(2):72-83.
123. Pyszka L, Seys Ranola T, Milhans S. Identification of inappropriate
prescribing in geriatrics at a Veterans Affairs hospital using STOPP/START
screening tools. The Consultant Pharmacist®. 2010;25(6):365-73.
124. Lee P-H, Lee Y-S, Chan D-C. Interventions targeting geriatric
frailty: A systemic review. Journal of Clinical Gerontology and Geriatrics.
2012;3(2):47-52.
125. Silva RB, Aldoradin-Cabeza H, Eslick GD, Phu S, Duque G. The
Effect of Physical Exercise on Frail Older Persons: A Systematic Review.
The Journal of frailty & aging. 2017;6(2):91-6.
REFERENCES
374
126. Aguirre LE, Villareal DT. Physical Exercise as Therapy for Frailty.
Nestle Nutr Inst Workshop Ser. 2015;83:83-92.
127. Theou O, Stathokostas L, Roland KP, Jakobi JM, Patterson C,
Vandervoort AA, et al. The effectiveness of exercise interventions for the
management of frailty: a systematic review. Journal of aging research.
2011;2011:569194-.
128. Fiatarone MA, O'Neill EF, Ryan ND, Clements KM, Solares GR,
Nelson ME, et al. Exercise training and nutritional supplementation for
physical frailty in very elderly people. The New England journal of
medicine. 1994;330(25):1769-75.
129. Singh NA, Quine S, Clemson LM, Williams EJ, Williamson DA,
Stavrinos TM, et al. Effects of high-intensity progressive resistance training
and targeted multidisciplinary treatment of frailty on mortality and
nursing home admissions after hip fracture: a randomized controlled trial.
Journal of the American Medical Directors Association. 2012;13(1):24-30.
130. Yamada M, Arai H, Sonoda T, Aoyama T. Community-based
exercise program is cost-effective by preventing care and disability in
Japanese frail older adults. Journal of the American Medical Directors
Association. 2012;13(6):507-11.
131. Cesari M, Vellas B, Hsu FC, Newman AB, Doss H, King AC, et al.
A physical activity intervention to treat the frailty syndrome in older
persons-results from the LIFE-P study. The journals of gerontology Series
A, Biological sciences and medical sciences. 2015;70(2):216-22.
132. de Labra C, Guimaraes-Pinheiro C, Maseda A, Lorenzo T, Millán-
Calenti JC. Effects of physical exercise interventions in frail older adults: a
systematic review of randomized controlled trials. BMC geriatrics.
2015;15:154-.
REFERENCES
375
133. Liu CK, Fielding RA. Exercise as an intervention for frailty. Clinics
in geriatric medicine. 2011;27(1):101-10.
134. Langlois F, Vu TT, Chasse K, Dupuis G, Kergoat MJ, Bherer L.
Benefits of physical exercise training on cognition and quality of life in frail
older adults. The journals of gerontology Series B, Psychological sciences
and social sciences. 2013;68(3):400-4.
135. Cadore EL, Saez de Asteasu ML, Izquierdo M. Multicomponent
exercise and the hallmarks of frailty: Considerations on cognitive
impairment and acute hospitalization. Experimental gerontology.
2019;122:10-4.
136. Sedentary Behaviour Research Network. Letter to the editor:
standardized use of the terms "sedentary" and "sedentary behaviours".
Appl Physiol Nutr Metab. 2012;37(3):540-2.
137. U.S. Department of Health and Human Services. Physical Activity
and Health: A Report of the Surgeon General. Atlanta, GA: U.S.
Department of Health and Human Services, Centers for Disease Control
and Prevention, National Center for Chronic Disease Prevention and
Health Promotion; 1996.
138. Jette M, Sidney K, Blumchen G. Metabolic equivalents (METS) in
exercise testing, exercise prescription, and evaluation of functional
capacity. Clinical cardiology. 1990;13(8):555-65.
139. World Health Organization. Global Recommendations on Physical
Activity for Health. WHO Press, editor. Geneva: World Health
Organization; 2010.
140. Piercy KL, Troiano RP, Ballard RM, Carlson SA, Fulton JE, Galuska
DA, et al. The Physical Activity Guidelines for Americans. Jama.
2018;320(19):2020-8.
REFERENCES
376
141. Haskell WL, Lee IM, Pate RR, Powell KE, Blair SN, Franklin BA, et
al. Physical activity and public health: updated recommendation for adults
from the American College of Sports Medicine and the American Heart
Association. Medicine and science in sports and exercise. 2007;39(8):1423-
34.
142. McArdle WD, Katch FI, Katch VL. Exercise physiology: energy,
nutrition, and human physiology. Chicago, IL. 2006.
143. Caspersen CJ, Powell KE, Christenson GM. Physical activity,
exercise, and physical fitness: definitions and distinctions for health-related
research. Public Health Rep. 1985;100(2):126-31.
144. Tremblay MS, Aubert S, Barnes JD, Saunders TJ, Carson V,
Latimer-Cheung AE, et al. Sedentary Behavior Research Network (SBRN)
– Terminology Consensus Project process and outcome. International
Journal of Behavioral Nutrition and Physical Activity. 2017;14(1):75.
145. Tremblay MS, Aubert S, Barnes JD, Saunders TJ, Carson V,
Latimer-Cheung AE, et al. Sedentary Behavior Research Network (SBRN) -
Terminology Consensus Project process and outcome. The international
journal of behavioral nutrition and physical activity. 2017;14(1):75.
146. Leonard WR. Laboratory and field methods for measuring human
energy expenditure. American journal of human biology : the official
journal of the Human Biology Council. 2012;24(3):372-84.
147. Schoeller DA, van Santen E. Measurement of energy expenditure
in humans by doubly labeled water method. Journal of applied physiology:
respiratory, environmental and exercise physiology. 1982;53(4):955-9.
148. Schoeller DA, Webb P. Five-day comparison of the doubly labeled
water method with respiratory gas exchange. The American journal of
clinical nutrition. 1984;40(1):153-8.
REFERENCES
377
149. Krumbiegel P. Assessment of body composition and total energy
expenditure in humans using stable isotope techniques; IAEA Human
Health Series No. 3. Taylor & Francis; 2010.
150. Hills AP, Mokhtar N, Byrne NM. Assessment of physical activity
and energy expenditure: an overview of objective measures. Front Nutr.
2014;1:5-.
151. Schoeller DA. Measurement of energy expenditure in free-living
humans by using doubly labeled water. The Journal of nutrition.
1988;118(11):1278-89.
152. Schoeller DA. Insights into energy balance from doubly labeled
water. International journal of obesity (2005). 2008;32 Suppl 7:S72-5.
153. Speakman JR. The history and theory of the doubly labeled water
technique. The American journal of clinical nutrition. 1998;68(4):932s-8s.
154. Ainslie P, Reilly T, Westerterp K. Estimating human energy
expenditure: a review of techniques with particular reference to doubly
labelled water. Sports medicine (Auckland, NZ). 2003;33(9):683-98.
155. DeLany JP, Lovejoy JC. Energy expenditure. Endocrinology and
metabolism clinics of North America. 1996;25(4):831-46.
156. Ridgers ND, Fairclough S. Assessing free-living physical activity
using accelerometry: Practical issues for researchers and practitioners.
European journal of sport science. 2011;11(3):205-13.
157. Chen KY, Bassett DR, Jr. The technology of accelerometry-based
activity monitors: current and future. Medicine and science in sports and
exercise. 2005;37(11 Suppl):S490-500.
158. Kohl III HW, Fulton JE, Caspersen CJ. Assessment of physical
activity among children and adolescents: a review and synthesis.
Preventive medicine. 2000;31(2):S54-S76.
REFERENCES
378
159. Corder K, Brage S, Ekelund U. Accelerometers and pedometers:
methodology and clinical application. Current opinion in clinical nutrition
and metabolic care. 2007;10(5):597-603.
160. Ward DS, Evenson KR, Vaughn A, Rodgers AB, Troiano RP.
Accelerometer use in physical activity: best practices and research
recommendations. Medicine and science in sports and exercise. 2005;37(11
Suppl):S582-8.
161. Westerterp KR. Physical activity assessment with accelerometers.
International journal of obesity and related metabolic disorders : journal of
the International Association for the Study of Obesity. 1999;23 Suppl 3:S45-
9.
162. Reilly JJ, Penpraze V, Hislop J, Davies G, Grant S, Paton JY.
Objective measurement of physical activity and sedentary behaviour:
review with new data. Archives of disease in childhood. 2008;93(7):614-9.
163. Schutz Y, Weinsier RL, Hunter GR. Assessment of free-living
physical activity in humans: an overview of currently available and
proposed new measures. Obesity research. 2001;9(6):368-79.
164. Li R, Deurenberg P, Hautvast JG. A critical evaluation of heart rate
monitoring to assess energy expenditure in individuals. The American
journal of clinical nutrition. 1993;58(5):602-7.
165. Ceesay SM, Prentice AM, Day KC, Murgatroyd PR, Goldberg GR,
Scott W, et al. The use of heart rate monitoring in the estimation of energy
expenditure: a validation study using indirect whole-body calorimetry. The
British journal of nutrition. 1989;61(2):175-86.
166. Brage S, Brage N, Franks PW, Ekelund U, Wong MY, Andersen LB,
et al. Branched equation modeling of simultaneous accelerometry and
heart rate monitoring improves estimate of directly measured physical
REFERENCES
379
activity energy expenditure. Journal of applied physiology (Bethesda, Md :
1985). 2004;96(1):343-51.
167. Shephard RJ. Limits to the measurement of habitual physical
activity by questionnaires. British journal of sports medicine.
2003;37(3):197-206; discussion
168. Saint-Maurice PF, Troiano RP, Matthews CE, Kraus WE. Moderate-
to-Vigorous Physical Activity and All-Cause Mortality: Do Bouts Matter?
Journal of the American Heart Association. 2018;7(6).
169. Diaz KM, Duran AT, Colabianchi N, Judd SE, Howard VJ, Hooker
SP. Potential Effects on Mortality of Replacing Sedentary Time With Short
Sedentary Bouts or Physical Activity: A National Cohort Study. American
journal of epidemiology. 2019;188(3):537-44.
170. Matthew CE. Calibration of accelerometer output for adults.
Medicine and science in sports and exercise. 2005;37(11 Suppl):S512-22.
171. Troiano RP, Berrigan D, Dodd KW, Masse LC, Tilert T, McDowell
M. Physical activity in the United States measured by accelerometer.
Medicine and science in sports and exercise. 2008;40(1):181-8.
172. Blair SN. Physical inactivity: the biggest public health problem of
the 21st century. British Journal of Sports Medicine. 2009;43(1):1-2.
173. Organization WH. Obesity: preventing and managing the global
epidemic: World Health Organization; 2000.
174. Booth FW, Chakravarthy MV, Gordon SE, Spangenburg EE.
Waging war on physical inactivity: using modern molecular ammunition
against an ancient enemy. Journal of applied physiology (Bethesda, Md :
1985). 2002;93(1):3-30.
175. Jolliffe JA, Rees K, Taylor RS, Thompson D, Oldridge N, Ebrahim
S. Exercise-based rehabilitation for coronary heart disease. The Cochrane
database of systematic reviews. 2001(1):Cd001800.
REFERENCES
380
176. Thompson PD, Buchner D, Pina IL, Balady GJ, Williams MA,
Marcus BH, et al. Exercise and physical activity in the prevention and
treatment of atherosclerotic cardiovascular disease: a statement from the
Council on Clinical Cardiology (Subcommittee on Exercise, Rehabilitation,
and Prevention) and the Council on Nutrition, Physical Activity, and
Metabolism (Subcommittee on Physical Activity). Circulation.
2003;107(24):3109-16.
177. Albright A, Franz M, Hornsby G, Kriska A, Marrero D, Ullrich I, et
al. American College of Sports Medicine position stand. Exercise and type
2 diabetes. Medicine and science in sports and exercise. 2000;32(7):1345-60.
178. Vuori IM. Dose-response of physical activity and low back pain,
osteoarthritis, and osteoporosis. Medicine and science in sports and
exercise. 2001;33(6 Suppl):S551-86; discussion 609-10.
179. Shaw K, Gennat H, O'Rourke P, Del Mar C. Exercise for overweight
or obesity. The Cochrane database of systematic reviews.
2006(4):Cd003817.
180. Pollock KM. Exercise in treating depression: broadening the
psychotherapist's role. Journal of clinical psychology. 2001;57(11):1289-300.
181. Lee IM. Physical activity and cancer prevention--data from
epidemiologic studies. Medicine and science in sports and exercise.
2003;35(11):1823-7.
182. King AC, Oman RF, Brassington GS, Bliwise DL, Haskell WL.
Moderate-intensity exercise and self-rated quality of sleep in older adults.
A randomized controlled trial. Jama. 1997;277(1):32-7.
183. Cornelissen VA, Fagard RH. Effects of endurance training on blood
pressure, blood pressure-regulating mechanisms, and cardiovascular risk
factors. Hypertension (Dallas, Tex : 1979). 2005;46(4):667-75.
REFERENCES
381
184. Grontved A, Hu FB. Television viewing and risk of type 2 diabetes,
cardiovascular disease, and all-cause mortality: a meta-analysis. Jama.
2011;305(23):2448-55.
185. Lynch BM. Sedentary behavior and cancer: a systematic review of
the literature and proposed biological mechanisms. Cancer epidemiology,
biomarkers & prevention : a publication of the American Association for
Cancer Research, cosponsored by the American Society of Preventive
Oncology. 2010;19(11):2691-709.
186. Rhodes RE, Mark RS, Temmel CP. Adult sedentary behavior: a
systematic review. American journal of preventive medicine. 2012;42(3):e3-
28.
187. Thorp AA, Owen N, Neuhaus M, Dunstan DW. Sedentary
behaviors and subsequent health outcomes in adults a systematic review of
longitudinal studies, 1996-2011. American journal of preventive medicine.
2011;41(2):207-15.
188. de Rezende LF, Rey-Lopez JP, Matsudo VK, do Carmo Luiz O.
Sedentary behavior and health outcomes among older adults: a systematic
review. BMC public health. 2014;14:333.
189. Stamatakis E, Hamer M. Sedentary behaviour: redefining its
meaning and links to chronic disease. British journal of hospital medicine
(London, England : 2005). 2011;72(4):192-5.
190. Singh MA. Exercise to prevent and treat functional disability.
Clinics in geriatric medicine. 2002;18(3):431-62, vi-vii.
191. Landi F, Abbatecola AM, Provinciali M, Corsonello A, Bustacchini
S, Manigrasso L, et al. Moving against frailty: does physical activity matter?
Biogerontology. 2010;11(5):537-45.
192. Fried LP. Interventions for Human Frailty: Physical Activity as a
Model. Cold Spring Harb Perspect Med. 2016;6(6).
REFERENCES
382
193. Xue QL, Bandeen-Roche K, Mielenz TJ, Seplaki CL, Szanton SL,
Thorpe RJ, et al. Patterns of 12-year change in physical activity levels in
community-dwelling older women: can modest levels of physical activity
help older women live longer? American journal of epidemiology.
2012;176(6):534-43.
194. Rodriguez-Manas L, Fried LP. Frailty in the clinical scenario.
Lancet (London, England). 2015;385(9968):e7-e9.
195. Lee SY, Tung HH, Liu CY, Chen LK. Physical Activity and
Sarcopenia in the Geriatric Population: A Systematic Review. Journal of the
American Medical Directors Association. 2018;19(5):378-83.
196. Zampieri S, Pietrangelo L, Loefler S, Fruhmann H, Vogelauer M,
Burggraf S, et al. Lifelong physical exercise delays age-associated skeletal
muscle decline. The journals of gerontology Series A, Biological sciences
and medical sciences. 2015;70(2):163-73.
197. Gomez-Cabello A, Carnicero JA, Alonso-Bouzon C, Tresguerres
JA, Alfaro-Acha A, Ara I, et al. Age and gender, two key factors in the
associations between physical activity and strength during the ageing
process. Maturitas. 2014;78(2):106-12.
198. Blair SN, Kohl HW, 3rd, Barlow CE, Paffenbarger RS, Jr., Gibbons
LW, Macera CA. Changes in physical fitness and all-cause mortality. A
prospective study of healthy and unhealthy men. Jama. 1995;273(14):1093-
8.
199. King AC, Pruitt LA, Phillips W, Oka R, Rodenburg A, Haskell WL.
Comparative effects of two physical activity programs on measured and
perceived physical functioning and other health-related quality of life
outcomes in older adults. The journals of gerontology Series A, Biological
sciences and medical sciences. 2000;55(2):M74-83.
REFERENCES
383
200. Landi F, Russo A, Cesari M, Pahor M, Liperoti R, Danese P, et al.
Walking one hour or more per day prevented mortality among older
persons: results from ilSIRENTE study. Preventive medicine.
2008;47(4):422-6.
201. Rantanen T, Era P, Heikkinen E. Physical activity and the changes
in maximal isometric strength in men and women from the age of 75 to 80
years. Journal of the American Geriatrics Society. 1997;45(12):1439-45.
202. Cruz-Jentoft AJ, Baeyens JP, Bauer JM, Boirie Y, Cederholm T,
Landi F, et al. Sarcopenia: European consensus on definition and diagnosis:
Report of the European Working Group on Sarcopenia in Older People.
Age and ageing. 2010;39(4):412-23.
203. Rebelo-Marques A, De Sousa Lages A, Andrade R, Ribeiro CF,
Mota-Pinto A, Carrilho F, et al. Aging Hallmarks: The Benefits of Physical
Exercise. Frontiers in endocrinology. 2018;9:258-.
204. Kramer AF, Erickson KI. Effects of physical activity on cognition,
well-being, and brain: human interventions. Alzheimer's & dementia : the
journal of the Alzheimer's Association. 2007;3(2 Suppl):S45-51.
205. Esteban-Cornejo I, Cabanas-Sanchez V, Higueras-Fresnillo S,
Ortega FB, Kramer AF, Rodriguez-Artalejo F, et al. Cognitive Frailty and
Mortality in a National Cohort of Older Adults: the Role of Physical
Activity. Mayo Clinic proceedings. 2019;94(7):1180-9.
206. Kehler DS, Theou O. The impact of physical activity and sedentary
behaviors on frailty levels. Mechanisms of ageing and development.
2019;180:29-41.
207. Blodgett J, Theou O, Kirkland S, Andreou P, Rockwood K. The
association between sedentary behaviour, moderate-vigorous physical
activity and frailty in NHANES cohorts. Maturitas. 2015;80(2):187-91.
REFERENCES
384
208. Rogers NT, Marshall A, Roberts CH, Demakakos P, Steptoe A,
Scholes S. Physical activity and trajectories of frailty among older adults:
Evidence from the English Longitudinal Study of Ageing. PLoS One.
2017;12(2):e0170878.
209. Garcia-Esquinas E, Graciani A, Guallar-Castillon P, Lopez-Garcia
E, Rodriguez-Manas L, Rodriguez-Artalejo F. Diabetes and risk of frailty
and its potential mechanisms: a prospective cohort study of older adults.
Journal of the American Medical Directors Association. 2015;16(9):748-54.
210. Graciani A, Garcia-Esquinas E, Lopez-Garcia E, Banegas JR,
Rodriguez-Artalejo F. Ideal Cardiovascular Health and Risk of Frailty in
Older Adults. Circulation Cardiovascular quality and outcomes.
2016;9(3):239-45.
211. Savela SL, Koistinen P, Stenholm S, Tilvis RS, Strandberg AY,
Pitkala KH, et al. Leisure-time physical activity in midlife is related to old
age frailty. The journals of gerontology Series A, Biological sciences and
medical sciences. 2013;68(11):1433-8.
212. Woo J, Chan R, Leung J, Wong M. Relative contributions of
geographic, socioeconomic, and lifestyle factors to quality of life, frailty,
and mortality in elderly. PLoS One. 2010;5(1):e8775.
213. Prince SA, Adamo KB, Hamel ME, Hardt J, Connor Gorber S,
Tremblay M. A comparison of direct versus self-report measures for
assessing physical activity in adults: a systematic review. The international
journal of behavioral nutrition and physical activity. 2008;5:56.
214. da Silva Coqueiro R, D. E. Queiroz BM, Oliveira DS, D. A. S. Merces
MC, Carneiro JA, Pereira R, et al. Cross-sectional relationships between
sedentary behavior and frailty in older adults. The Journal of sports
medicine and physical fitness. 2016.
REFERENCES
385
215. Garcia-Esquinas E, Andrade E, Martinez-Gomez D, Caballero FF,
Lopez-Garcia E, Rodriguez-Artalejo F. Television viewing time as a risk
factor for frailty and functional limitations in older adults: results from 2
European prospective cohorts. The international journal of behavioral
nutrition and physical activity. 2017;14(1):54.
216. Song J, Lindquist LA, Chang RW, Semanik PA, Ehrlich-Jones LS,
Lee J, et al. Sedentary Behavior as a Risk Factor for Physical Frailty
Independent of Moderate Activity: Results From the Osteoarthritis
Initiative. American journal of public health. 2015;105(7):1439-45.
217. Manns P, Ezeugwu V, Armijo-Olivo S, Vallance J, Healy GN.
Accelerometer-Derived Pattern of Sedentary and Physical Activity Time in
Persons with Mobility Disability: National Health and Nutrition
Examination Survey 2003 to 2006. Journal of the American Geriatrics
Society. 2015;63(7):1314-23.
218. Sardinha LB, Santos DA, Silva AM, Baptista F, Owen N. Breaking-
up sedentary time is associated with physical function in older adults. The
journals of gerontology Series A, Biological sciences and medical sciences.
2015;70(1):119-24.
219. Sardinha LB, Ekelund U, dos Santos L, Cyrino ES, Silva AM, Santos
DA. Breaking-up sedentary time is associated with impairment in activities
of daily living. Experimental gerontology. 2015;72:57-62.
220. Chen T, Narazaki K, Haeuchi Y, Chen S, Honda T, Kumagai S.
Associations of Sedentary Time and Breaks in Sedentary Time With
Disability in Instrumental Activities of Daily Living in Community-
Dwelling Older Adults. Journal of physical activity & health.
2016;13(3):303-9.
221. Hutton B, Salanti G, Caldwell DM, Chaimani A, Schmid CH,
Cameron C, et al. The PRISMA extension statement for reporting of
REFERENCES
386
systematic reviews incorporating network meta-analyses of health care
interventions: checklist and explanations. Annals of internal medicine.
2015;162(11):777-84.
222. Guralnik JM, Ferrucci L, Simonsick EM, Salive ME, Wallace RB.
Lower-extremity function in persons over the age of 70 years as a predictor
of subsequent disability. The New England journal of medicine.
1995;332(9):556-61.
223. Guadalupe-Grau A, Aznar-Lain S, Manas A, Castellanos J, Alcazar
J, Ara I, et al. Short- and Long-Term Effects of Concurrent Strength and
HIIT Training in Octogenarians with COPD. Journal of aging and physical
activity. 2017;25(1):105-15.
224. Tombaugh TN, McIntyre NJ. The mini-mental state examination: a
comprehensive review. Journal of the American Geriatrics Society.
1992;40(9):922-35.
225. Charlson ME, Pompei P, Ales KL, MacKenzie CR. A new method
of classifying prognostic comorbidity in longitudinal studies: development
and validation. Journal of chronic diseases. 1987;40(5):373-83.
226. Gnjidic D, Hilmer SN, Blyth FM, Naganathan V, Waite L, Seibel MJ,
et al. Polypharmacy cutoff and outcomes: five or more medicines were used
to identify community-dwelling older men at risk of different adverse
outcomes. Journal of clinical epidemiology. 2012;65(9):989-95.
227. Colley R, Connor Gorber S, Tremblay MS. Quality control and data
reduction procedures for accelerometry-derived measures of physical
activity. Health reports. 2010;21(1):63-9.
228. Freedson PS, Melanson E, Sirard J. Calibration of the Computer
Science and Applications, Inc. accelerometer. Medicine and science in
sports and exercise. 1998;30(5):777-81.
REFERENCES
387
229. Migueles JH, Cadenas-Sanchez C, Ekelund U, Delisle Nystrom C,
Mora-Gonzalez J, Lof M, et al. Accelerometer Data Collection and
Processing Criteria to Assess Physical Activity and Other Outcomes: A
Systematic Review and Practical Considerations. Sports medicine
(Auckland, NZ). 2017.
230. Bakrania K, Edwardson CL, Bodicoat DH, Esliger DW, Gill JM,
Kazi A, et al. Associations of mutually exclusive categories of physical
activity and sedentary time with markers of cardiometabolic health in
English adults: a cross-sectional analysis of the Health Survey for England.
BMC public health. 2016;16:25.
231. Kozakova M, Palombo C, Morizzo C, Nolan JJ, Konrad T, Balkau
B, et al. Effect of sedentary behaviour and vigorous physical activity on
segment-specific carotid wall thickness and its progression in a healthy
population. European heart journal. 2010;31(12):1511-9.
232. Loprinzi PD, Lee H, Cardinal BJ. Daily movement patterns and
biological markers among adults in the United States. Preventive medicine.
2014;60:128-30.
233. Manas A, Pozo-Cruz BD, Rodriguez-Gomez I, Losa-Reyna J,
Rodriguez-Manas L, Garcia-Garcia FJ, et al. Can Physical Activity Offset
the Detrimental Consequences of Sedentary Time on Frailty? A Moderation
Analysis in 749 Older Adults Measured With Accelerometers. Journal of
the American Medical Directors Association. 2019.
234. Matthews CE, Chen KY, Freedson PS, Buchowski MS, Beech BM,
Pate RR, et al. Amount of time spent in sedentary behaviors in the United
States, 2003-2004. American journal of epidemiology. 2008;167(7):875-81.
235. Hamilton MT, Healy GN, Dunstan DW, Zderic TW, Owen N. Too
Little Exercise and Too Much Sitting: Inactivity Physiology and the Need
REFERENCES
388
for New Recommendations on Sedentary Behavior. Current cardiovascular
risk reports. 2008;2(4):292-8.
236. Hamer M, Stamatakis E, Steptoe A. Effects of substituting
sedentary time with physical activity on metabolic risk. Medicine and
science in sports and exercise. 2014;46(10):1946-50.
237. Mekary RA, Willett WC, Hu FB, Ding EL. Isotemporal substitution
paradigm for physical activity epidemiology and weight change. American
journal of epidemiology. 2009;170(4):519-27.
238. Johnson PO, Fay LC. The Johnson-Neyman technique, its theory
and application. Psychometrika. 1950;15(4):349-67.
239. Anderson JR, Calvo D, Glickman E, Gunstad J, Spitznagel MB. The
Moderating Role of Insulin-Like Growth Factor 1 in the Relationship
Between Cognitive and Aerobic Endurance Change. Journal of geriatric
psychiatry and neurology. 2017;30(2):84-9.
240. Rosseel Y. lavaan: An R Package for Structural Equation
Modeling2012.
241. Enders CK, Bandalos DL. The Relative Performance of Full
Information Maximum Likelihood Estimation for Missing Data in
Structural Equation Models. Structural Equation Modeling: A
Multidisciplinary Journal. 2001;8(3):430-57.
242. Hu Lt, Bentler PM. Cutoff criteria for fit indexes in covariance
structure analysis: Conventional criteria versus new alternatives. Structural
Equation Modeling: A Multidisciplinary Journal. 1999;6(1):1-55.
243. Wilmot EG, Edwardson CL, Achana FA, Davies MJ, Gorely T, Gray
LJ, et al. Sedentary time in adults and the association with diabetes,
cardiovascular disease and death: systematic review and meta-analysis.
Diabetologia. 2012;55(11):2895-905.
REFERENCES
389
244. Lang IA, Guralnik JM, Melzer D. Physical activity in middle-aged
adults reduces risks of functional impairment independent of its effect on
weight. Journal of the American Geriatrics Society. 2007;55(11):1836-41.
245. Rosenberg DE, Bellettiere J, Gardiner PA, Villarreal VN, Crist K,
Kerr J. Independent Associations Between Sedentary Behaviors and
Mental, Cognitive, Physical, and Functional Health Among Older Adults
in Retirement Communities. The journals of gerontology Series A,
Biological sciences and medical sciences. 2016;71(1):78-83.
246. Santos DA, Silva AM, Baptista F, Santos R, Vale S, Mota J, et al.
Sedentary behavior and physical activity are independently related to
functional fitness in older adults. Experimental gerontology.
2012;47(12):908-12.
247. Fleig L, McAllister MM, Brasher P, Cook WL, Guy P, Puyat JH, et
al. Sedentary Behavior and Physical Activity Patterns in Older Adults After
Hip Fracture: A Call to Action. Journal of aging and physical activity.
2016;24(1):79-84.
248. Cooper AJ, Simmons RK, Kuh D, Brage S, Cooper R. Physical
activity, sedentary time and physical capability in early old age: British
birth cohort study. PloS one. 2015;10(5):e0126465.
249. Dunlop DD, Song J, Arnston EK, Semanik PA, Lee J, Chang RW, et
al. Sedentary time in US older adults associated with disability in activities
of daily living independent of physical activity. Journal of physical activity
& health. 2015;12(1):93-101.
250. Ikezoe T, Asakawa Y, Shima H, Kishibuchi K, Ichihashi N. Daytime
physical activity patterns and physical fitness in institutionalized elderly
women: an exploratory study. Archives of gerontology and geriatrics.
2013;57(2):221-5.
REFERENCES
390
251. Bankoski A, Harris TB, McClain JJ, Brychta RJ, Caserotti P, Chen
KY, et al. Sedentary activity associated with metabolic syndrome
independent of physical activity. Diabetes care. 2011;34(2):497-503.
252. Lynch BM, Friedenreich CM, Winkler EA, Healy GN, Vallance JK,
Eakin EG, et al. Associations of objectively assessed physical activity and
sedentary time with biomarkers of breast cancer risk in postmenopausal
women: findings from NHANES (2003-2006). Breast cancer research and
treatment. 2011;130(1):183-94.
253. Koster A, Caserotti P, Patel KV, Matthews CE, Berrigan D, Van
Domelen DR, et al. Association of sedentary time with mortality
independent of moderate to vigorous physical activity. PloS one.
2012;7(6):e37696.
254. Reid N, Daly RM, Winkler EA, Gardiner PA, Eakin EG, Owen N,
et al. Associations of Monitor-Assessed Activity with Performance-Based
Physical Function. PloS one. 2016;11(4):e0153398.
255. Seguin R, Lamonte M, Tinker L, Liu J, Woods N, Michael YL, et al.
Sedentary Behavior and Physical Function Decline in Older Women:
Findings from the Women's Health Initiative. Journal of aging research.
2012;2012:271589.
256. Adams SA, Matthews CE, Ebbeling CB, Moore CG, Cunningham
JE, Fulton J, et al. The effect of social desirability and social approval on
self-reports of physical activity. American journal of epidemiology.
2005;161(4):389-98.
257. Bonnefoy M, Normand S, Pachiaudi C, Lacour JR, Laville M,
Kostka T. Simultaneous validation of ten physical activity questionnaires
in older men: a doubly labeled water study. Journal of the American
Geriatrics Society. 2001;49(1):28-35.
REFERENCES
391
258. Barone Gibbs B, Brach JS, Byard T, Creasy S, Davis KK, McCoy S,
et al. Reducing Sedentary Behavior Versus Increasing Moderate-to-
Vigorous Intensity Physical Activity in Older Adults: A 12-Week
Randomized, Clinical Trial. Journal of aging and health. 2016.
259. Rosenberg DE, Gell NM, Jones SM, Renz A, Kerr J, Gardiner PA, et
al. The Feasibility of Reducing Sitting Time in Overweight and Obese Older
Adults. Health education & behavior : the official publication of the Society
for Public Health Education. 2015;42(5):669-76.
260. Davis MG, Fox KR, Stathi A, Trayers T, Thompson JL, Cooper AR.
Objectively measured sedentary time and its association with physical
function in older adults. Journal of aging and physical activity.
2014;22(4):474-81.
261. Chastin SF, Ferriolli E, Stephens NA, Fearon KC, Greig C.
Relationship between sedentary behaviour, physical activity, muscle
quality and body composition in healthy older adults. Age and ageing.
2012;41(1):111-4.
262. Gennuso KP, Thraen-Borowski KM, Gangnon RE, Colbert LH.
Patterns of sedentary behavior and physical function in older adults. Aging
clinical and experimental research. 2016;28(5):943-50.
263. Judice PB, Silva AM, Santos DA, Baptista F, Sardinha LB.
Associations of breaks in sedentary time with abdominal obesity in
Portuguese older adults. Age (Dordrecht, Netherlands). 2015;37(2):23.
264. Healy GN, Dunstan DW, Salmon J, Cerin E, Shaw JE, Zimmet PZ,
et al. Breaks in sedentary time: beneficial associations with metabolic risk.
Diabetes care. 2008;31(4):661-6.
265. Gianoudis J, Bailey CA, Daly RM. Associations between sedentary
behaviour and body composition, muscle function and sarcopenia in
community-dwelling older adults. Osteoporosis international : a journal
REFERENCES
392
established as result of cooperation between the European Foundation for
Osteoporosis and the National Osteoporosis Foundation of the USA.
2015;26(2):571-9.
266. Jansen FM, Prins RG, Etman A, van der Ploeg HP, de Vries SI, van
Lenthe FJ, et al. Physical activity in non-frail and frail older adults. PloS
one. 2015;10(4):e0123168.
267. Tremblay MS, Kho ME, Tricco AC, Duggan M. Process description
and evaluation of Canadian Physical Activity Guidelines development. The
international journal of behavioral nutrition and physical activity.
2010;7:42.
268. Peterson MJ, Giuliani C, Morey MC, Pieper CF, Evenson KR,
Mercer V, et al. Physical activity as a preventative factor for frailty: the
health, aging, and body composition study. The journals of gerontology
Series A, Biological sciences and medical sciences. 2009;64(1):61-8.
269. Bastone Ade C, Ferriolli E, Teixeira CP, Dias JM, Dias RC. Aerobic
Fitness and Habitual Physical Activity in Frail and Nonfrail Community-
Dwelling Elderly. Journal of physical activity & health. 2015;12(9):1304-11.
270. Morris JN, Heady JA, Raffle PA, Roberts CG, Parks JW. Coronary
heart-disease and physical activity of work. Lancet (London, England).
1953;265(6796):1111-20; concl.
271. Bembom O, van der Laan M, Haight T, Tager I. Leisure-time
physical activity and all-cause mortality in an elderly cohort. Epidemiology
(Cambridge, Mass). 2009;20(3):424-30.
272. Dunstan DW, Barr EL, Healy GN, Salmon J, Shaw JE, Balkau B, et
al. Television viewing time and mortality: the Australian Diabetes, Obesity
and Lifestyle Study (AusDiab). Circulation. 2010;121(3):384-91.
273. Pate RR, O'Neill JR, Lobelo F. The evolving definition of
"sedentary". Exercise and sport sciences reviews. 2008;36(4):173-8.
REFERENCES
393
274. Ensrud KE, Blackwell TL, Cauley JA, Dam TT, Cawthon PM,
Schousboe JT, et al. Objective measures of activity level and mortality in
older men. Journal of the American Geriatrics Society. 2014;62(11):2079-87.
275. Fox KR, Ku PW, Hillsdon M, Davis MG, Simmonds BA, Thompson
JL, et al. Objectively assessed physical activity and lower limb function and
prospective associations with mortality and newly diagnosed disease in
UK older adults: an OPAL four-year follow-up study. Age and ageing.
2015;44(2):261-8.
276. Klenk J, Dallmeier D, Denkinger MD, Rapp K, Koenig W,
Rothenbacher D. Objectively Measured Walking Duration and Sedentary
Behaviour and Four-Year Mortality in Older People. PloS one.
2016;11(4):e0153779.
277. Ekelund U, Steene-Johannessen J, Brown WJ, Fagerland MW,
Owen N, Powell KE, et al. Does physical activity attenuate, or even
eliminate, the detrimental association of sitting time with mortality? A
harmonised meta-analysis of data from more than 1 million men and
women. Lancet (London, England). 2016;388(10051):1302-10.
278. Healy GN, Wijndaele K, Dunstan DW, Shaw JE, Salmon J, Zimmet
PZ, et al. Objectively measured sedentary time, physical activity, and
metabolic risk: the Australian Diabetes, Obesity and Lifestyle Study
(AusDiab). Diabetes care. 2008;31(2):369-71.
279. An HS, Kim Y, Lee JM. Accuracy of inclinometer functions of the
activPAL and ActiGraph GT3X+: A focus on physical activity. Gait &
posture. 2016;51:174-80.
280. Dossegger A, Ruch N, Jimmy G, Braun-Fahrlander C, Mader U,
Hanggi J, et al. Reactivity to accelerometer measurement of children and
adolescents. Medicine and science in sports and exercise. 2014;46(6):1140-6.
REFERENCES
394
281. Kremers SP, Brug J. Habit strength of physical activity and
sedentary behavior among children and adolescents. Pediatric exercise
science. 2008;20(1):5-14; discussion -7.
282. Pedisic Z, Bauman A. Accelerometer-based measures in physical
activity surveillance: current practices and issues. British journal of sports
medicine. 2015;49(4):219-23.
283. Hart TL, Swartz AM, Cashin SE, Strath SJ. How many days of
monitoring predict physical activity and sedentary behaviour in older
adults? The international journal of behavioral nutrition and physical
activity. 2011;8:62.
284. Aguilar-Farias N, Brown WJ, Peeters GM. ActiGraph GT3X+ cut-
points for identifying sedentary behaviour in older adults in free-living
environments. Journal of science and medicine in sport. 2014;17(3):293-9.
285. Troiano RP. Large-scale applications of accelerometers: new
frontiers and new questions. Medicine and science in sports and exercise.
2007;39(9):1501.
286. Choi L, Liu Z, Matthews CE, Buchowski MS. Validation of
accelerometer wear and nonwear time classification algorithm. Medicine
and science in sports and exercise. 2011;43(2):357-64.
287. Sedentary Behaviour Research N. Letter to the editor: standardized
use of the terms "sedentary" and "sedentary behaviours". Applied
physiology, nutrition, and metabolism = Physiologie appliquee, nutrition
et metabolisme. 2012;37(3):540-2.
288. Andrade C, Fernandes P. Is sitting harmful to health? It is too early
to say. Archives of internal medicine. 2012;172(16):1272-3; author reply 3.
289. Migueles JH, Cadenas-Sanchez C, Ekelund U, Delisle Nyström C,
Mora-Gonzalez J, Löf M, et al. Accelerometer Data Collection and
Processing Criteria to Assess Physical Activity and Other Outcomes: A
REFERENCES
395
Systematic Review and Practical Considerations. Sports Medicine. 2017:1-
25.
290. Sardinha LB, Ekelund U, dos Santos L, Cyrino ES, Silva AM, Santos
DA. Breaking-up sedentary time is associated with impairment in activities
of daily living. Exp Gerontol. 2015;72:278-.
291. Buman MP, Hekler EB, Haskell WL, Pruitt L, Conway TL, Cain KL,
et al. Objective light-intensity physical activity associations with rated
health in older adults. American journal of epidemiology.
2010;172(10):1155-65.
292. Chastin SF, Egerton T, Leask C, Stamatakis E. Meta-analysis of the
relationship between breaks in sedentary behavior and cardiometabolic
health. Obesity (Silver Spring, Md). 2015;23(9):1800-10.
293. Fanning J, Porter G, Awick EA, Ehlers DK, Roberts SA, Cooke G, et
al. Replacing sedentary time with sleep, light, or moderate-to-vigorous
physical activity: effects on self-regulation and executive functioning.
Journal of behavioral medicine. 2016.
294. Elkins M. Light intensity physical activity is associated with lower
disability in adults with or at risk of knee osteoarthritis. Journal of
physiotherapy. 2014;60(3):163.
295. Lee S, Yuki A, Nishita Y, Tange C, Kim H, Kozakai R, et al. Research
relationship between light-intensity physical activity and cognitive
function in a community-dwelling elderly population-an 8-year
longitudinal study. Journal of the American Geriatrics Society.
2013;61(3):452-3.
296. Jantunen H, Wasenius N, Salonen MK, Perala MM, Osmond C,
Kautiainen H, et al. Objectively measured physical activity and physical
performance in old age. Age and ageing. 2017;46(2):232-7.
REFERENCES
396
297. Pau M, Leban B, Collu G, Migliaccio GM. Effect of light and
vigorous physical activity on balance and gait of older adults. Archives of
gerontology and geriatrics. 2014;59(3):568-73.
298. Ekblom-Bak E, Ekblom O, Bergstrom G, Borjesson M. Isotemporal
substitution of sedentary time by physical activity of different intensities
and bout lengths, and its associations with metabolic risk. European journal
of preventive cardiology. 2016;23(9):967-74.
299. Fishman EI, Steeves JA, Zipunnikov V, Koster A, Berrigan D,
Harris TA, et al. Association between Objectively Measured Physical
Activity and Mortality in NHANES. Medicine and science in sports and
exercise. 2016;48(7):1303-11.
300. Schmid D, Ricci C, Baumeister SE, Leitzmann MF. Replacing
Sedentary Time with Physical Activity in Relation to Mortality. Medicine
and science in sports and exercise. 2016;48(7):1312-9.
301. Prizer LP, Gay JL, Gerst-Emerson K, Froehlich-Grobe K. The Role
of Age in Moderating the Association Between Disability and Light-
Intensity Physical Activity. American journal of health promotion : AJHP.
2016;30(3):e101-9.
302. Rockwood K, Song X, MacKnight C, Bergman H, Hogan DB,
McDowell I, et al. A global clinical measure of fitness and frailty in elderly
people. CMAJ : Canadian Medical Association Journal. 2005;173(5):489-95.
303. Warren JM, Ekelund U, Besson H, Mezzani A, Geladas N, Vanhees
L. Assessment of physical activity - a review of methodologies with
reference to epidemiological research: a report of the exercise physiology
section of the European Association of Cardiovascular Prevention and
Rehabilitation. European journal of cardiovascular prevention and
rehabilitation : official journal of the European Society of Cardiology,
REFERENCES
397
Working Groups on Epidemiology & Prevention and Cardiac
Rehabilitation and Exercise Physiology. 2010;17(2):127-39.
304. Chastin SFM, Palarea-Albaladejo J, Dontje ML, Skelton DA.
Combined Effects of Time Spent in Physical Activity, Sedentary Behaviors
and Sleep on Obesity and Cardio-Metabolic Health Markers: A Novel
Compositional Data Analysis Approach. PLoS ONE. 2015;10(10):e0139984.
305. Bayán-Bravo A, Pérez-Tasigchana RF, López-García E, Martínez-
Gómez D, Rodríguez-Artalejo F, Guallar-Castillón P. The association of
major patterns of physical activity, sedentary behavior and sleeping with
mortality in older adults. Journal of Sports Sciences. 2018:1-10.
306. Trudelle-Jackson E, Jackson AW. Do Older Adults Who Meet 2008
Physical Activity Guidelines Have Better Physical Performance Than Those
Who Do Not Meet? Journal of geriatric physical therapy (2001).
2018;41(3):180-5.
307. Pollock RD, Duggal NA, Lazarus NR, Lord JM, Harridge SDR.
Cardiorespiratory fitness not sedentary time or physical activity is
associated with cardiometabolic risk in active older adults. Scandinavian
journal of medicine & science in sports. 2018;28(6):1653-60.
308. Dunstan DW, Kingwell BA, Larsen R, Healy GN, Cerin E,
Hamilton MT, et al. Breaking up prolonged sitting reduces postprandial
glucose and insulin responses. Diabetes care. 2012;35(5):976-83.
309. McCarthy M, Edwardson CL, Davies MJ, Henson J, Bodicoat DH,
Khunti K, et al. Fitness Moderates Glycemic Responses to Sitting and Light
Activity Breaks. Medicine and science in sports and exercise.
2017;49(11):2216-22.
310. Hamer M, de Oliveira C, Demakakos P. Non-exercise physical
activity and survival: English longitudinal study of ageing. American
journal of preventive medicine. 2014;47(4):452-60.
REFERENCES
398
311. Chastin SFM, De Craemer M, De Cocker K, Powell L, Van
Cauwenberg J, Dall P, et al. How does light-intensity physical activity
associate with adult cardiometabolic health and mortality? Systematic
review with meta-analysis of experimental and observational studies.
British Journal of Sports Medicine. 2018.
312. Manas A, Del Pozo-Cruz B, Guadalupe-Grau A, Marin-Puyalto J,
Alfaro-Acha A, Rodriguez-Manas L, et al. Reallocating Accelerometer-
Assessed Sedentary Time to Light or Moderate- to Vigorous-Intensity
Physical Activity Reduces Frailty Levels in Older Adults: An Isotemporal
Substitution Approach in the TSHA Study. Journal of the American
Medical Directors Association. 2018;19(2):185 e1- e6.
313. Wolff-Hughes DL, Fitzhugh EC, Bassett DR, Churilla JR. Total
Activity Counts and Bouted Minutes of Moderate-to-Vigorous Physical
Activity: Relationships With Cardiometabolic Biomarkers Using 2003-2006
NHANES. Journal of physical activity & health. 2015;12(5):694-700.
314. Pavasini R, Guralnik J, Brown JC, di Bari M, Cesari M, Landi F, et
al. Short Physical Performance Battery and all-cause mortality: systematic
review and meta-analysis. BMC Medicine. 2016;14:215.
315. An HS, Kim Y, Lee JM. Accuracy of inclinometer functions of the
activPAL and ActiGraph GT3X+: A focus on physical activity. Gait &
posture. 2017;51:174-80.
316. Judice PB, Santos DA, Hamilton MT, Sardinha LB, Silva AM.
Validity of GT3X and Actiheart to estimate sedentary time and breaks using
ActivPAL as the reference in free-living conditions. Gait & posture.
2015;41(4):917-22.
317. Gao X, Nelson ME, Tucker KL. Television viewing is associated
with prevalence of metabolic syndrome in Hispanic elders. Diabetes care.
2007;30(3):694-700.
REFERENCES
399
318. Gennuso KP, Gangnon RE, Matthews CE, Thraen-Borowski KM,
Colbert LH. Sedentary behavior, physical activity, and markers of health in
older adults. Medicine and science in sports and exercise. 2013;45(8):1493-
500.
319. Del Pozo-Cruz B, Manas A, Martin-Garcia M, Marin-Puyalto J,
Garcia-Garcia FJ, Rodriguez-Manas L, et al. Frailty is associated with
objectively assessed sedentary behaviour patterns in older adults: Evidence
from the Toledo Study for Healthy Aging (TSHA). PLoS One.
2017;12(9):e0183911.
320. Kehler DS, Clara I, Hiebert B, Stammers AN, Hay JL, Schultz A, et
al. The association between bouts of moderate to vigorous physical activity
and patterns of sedentary behavior with frailty. Experimental gerontology.
2018;104:28-34.
321. Thyfault JP, Du M, Kraus WE, Levine JA, Booth FW. Physiology of
sedentary behavior and its relationship to health outcomes. Medicine and
science in sports and exercise. 2015;47(6):1301-5.
322. Garcia-Hermoso A, Ramirez-Velez R, Celis-Morales CA,
Olloquequi J, Izquierdo M. Can physical activity attenuate the negative
association between sitting time and cognitive function among older
adults? A mediation analysis. Experimental gerontology. 2018;106:173-7.
323. Theou O, Blodgett JM, Godin J, Rockwood K. Association between
sedentary time and mortality across levels of frailty. CMAJ : Canadian
Medical Association Journal. 2017;189(33):E1056-E64.
324. Lee IM, Shiroma EJ, Lobelo F, Puska P, Blair SN, Katzmarzyk PT.
Effect of physical inactivity on major non-communicable diseases
worldwide: an analysis of burden of disease and life expectancy. Lancet
(London, England). 2012;380(9838):219-29.
REFERENCES
400
325. Wen CP, Wu X. Stressing harms of physical inactivity to promote
exercise. Lancet (London, England). 2012;380(9838):192-3.
326. Del Pozo-Cruz J, Garcia-Hermoso A, Alfonso-Rosa RM, Alvarez-
Barbosa F, Owen N, Chastin S, et al. Replacing Sedentary Time: Meta-
analysis of Objective-Assessment Studies. American journal of preventive
medicine. 2018;55(3):395-402.
327. Gardiner PA, Eakin EG, Healy GN, Owen N. Feasibility of
reducing older adults' sedentary time. American journal of preventive
medicine. 2011;41(2):174-7.
328. Buman MP, Hekler EB, Haskell WL, Pruitt L, Conway TL, Cain KL,
et al. Objective Light-Intensity Physical Activity Associations With Rated
Health in Older Adults. American journal of epidemiology.
2010;172(10):1155-65.
329. Tse ACY, Wong TWL, Lee PH. Effect of Low-intensity Exercise on
Physical and Cognitive Health in Older Adults: a Systematic Review.
Sports Medicine - Open. 2015;1:37.
330. Brach JS, FitzGerald S, Newman AB, Kelsey S, Kuller L,
VanSwearingen JM, et al. Physical activity and functional status in
community-dwelling older women: a 14-year prospective study. Archives
of internal medicine. 2003;163(21):2565-71.
331. Rodríguez-Gómez I, Mañas A, Losa-Reyna J, Rodríguez-Mañas L,
Chastin SF, Alegre LM, et al. The Impact of Movement Behaviors on Bone
Health in Elderly with Adequate Nutritional Status: Compositional Data
Analysis Depending on the Frailty Status. Nutrients. 2019;11(3):582.
332. Rebelo-Marques A, De Sousa Lages A, Andrade R, Ribeiro CF,
Mota-Pinto A, Carrilho F, et al. Aging Hallmarks: The Benefits of Physical
Exercise. Frontiers in endocrinology. 2018;9:258.
REFERENCES
401
333. Sourial N, Bergman H, Karunananthan S, Wolfson C, Guralnik J,
Payette H, et al. Contribution of frailty markers in explaining differences
among individuals in five samples of older persons. The journals of
gerontology Series A, Biological sciences and medical sciences.
2012;67(11):1197-204.
334. Kim Y, White T, Wijndaele K, Sharp SJ, Wareham NJ, Brage S.
Adiposity and grip strength as long-term predictors of objectively
measured physical activity in 93 015 adults: the UK Biobank study.
International Journal of Obesity. 2017;41(9):1361.
335. Cooper A, Lamb M, Sharp SJ, Simmons RK, Griffin SJ. Bidirectional
association between physical activity and muscular strength in older
adults: Results from the UK Biobank study. International journal of
epidemiology. 2017;46(1):141-8.
336. Metti AL, Best JR, Shaaban CE, Ganguli M, Rosano C. Longitudinal
changes in physical function and physical activity in older adults. Age and
ageing. 2018.
337. Puts MTE, Toubasi S, Andrew MK, Ashe MC, Ploeg J, Atkinson E,
et al. Interventions to prevent or reduce the level of frailty in community-
dwelling older adults: a scoping review of the literature and international
policies. Age and ageing. 2017;46(3):383-92.
338. Yamada M, Arai H, Sonoda T, Aoyama T. Community-based
exercise program is cost-effective by preventing care and disability in
Japanese frail older adults. Journal of the American Medical Directors
Association. 2012;13(6):507-11.
339. Manas A, Del Pozo-Cruz B, Garcia-Garcia FJ, Guadalupe-Grau A,
Ara I. Role of objectively measured sedentary behaviour in physical
performance, frailty and mortality among older adults: A short systematic
review. European journal of sport science. 2017;17(7):940-53.
REFERENCES
402
340. Kehler DS, Hay JL, Stammers AN, Hamm NC, Kimber DE, Schultz
ASH, et al. A systematic review of the association between sedentary
behaviors with frailty. Experimental gerontology. 2018;114:1-12.
341. Edholm P, Nilsson A, Kadi F. Physical function in older adults:
Impacts of past and present physical activity behaviors. Scandinavian
journal of medicine & science in sports. 2018.
342. Marques EA, Baptista F, Santos DA, Silva AM, Mota J, Sardinha LB.
Risk for losing physical independence in older adults: the role of sedentary
time, light, and moderate to vigorous physical activity. Maturitas.
2014;79(1):91-5.
343. Kvaavik E, Batty GD, Ursin G, Huxley R, Gale CR. Influence of
individual and combined health behaviors on total and cause-specific
mortality in men and women: the United Kingdom health and lifestyle
survey. Archives of internal medicine. 2010;170(8):711-8.
344. McCullough ML, Patel AV, Kushi LH, Patel R, Willett WC, Doyle
C, et al. Following cancer prevention guidelines reduces risk of cancer,
cardiovascular disease, and all-cause mortality. Cancer epidemiology,
biomarkers & prevention : a publication of the American Association for
Cancer Research, cosponsored by the American Society of Preventive
Oncology. 2011;20(6):1089-97.
345. Keadle SK, Conroy DE, Buman MP, Dunstan DW, Matthews CE.
Targeting Reductions in Sitting Time to Increase Physical Activity and
Improve Health. Medicine and science in sports and exercise.
2017;49(8):1572-82.
346. Judice PB, Hamilton MT, Sardinha LB, Zderic TW, Silva AM. What
is the metabolic and energy cost of sitting, standing and sit/stand
transitions? European journal of applied physiology. 2016;116(2):263-73.
REFERENCES
403
347. Hamilton MT, Hamilton DG, Zderic TW. Role of low energy
expenditure and sitting in obesity, metabolic syndrome, type 2 diabetes,
and cardiovascular disease. Diabetes. 2007;56(11):2655-67.
348. Pesola AJ, Laukkanen A, Haakana P, Havu M, Saakslahti A, Sipila
S, et al. Muscle inactivity and activity patterns after sedentary time--
targeted randomized controlled trial. Medicine and science in sports and
exercise. 2014;46(11):2122-31.
349. Pesola AJ, Laukkanen A, Tikkanen O, Sipila S, Kainulainen H,
Finni T. Muscle inactivity is adversely associated with biomarkers in
physically active adults. Medicine and science in sports and exercise.
2015;47(6):1188-96.
350. Hamilton MT, Hamilton DG, Zderic TW. Exercise physiology
versus inactivity physiology: an essential concept for understanding
lipoprotein lipase regulation. Exercise and sport sciences reviews.
2004;32(4):161-6.
351. Katzmarzyk PT. Standing and mortality in a prospective cohort of
Canadian adults. Medicine and science in sports and exercise.
2014;46(5):940-6.
352. Ekelund U, Tarp J, Steene-Johannessen J, Hansen BH, Jefferis B,
Fagerland MW, et al. Dose-response associations between accelerometry
measured physical activity and sedentary time and all cause mortality:
systematic review and harmonised meta-analysis. BMJ (Clinical research
ed). 2019;366:l4570.
353. Morey MC, Sloane R, Pieper CF, Peterson MJ, Pearson MP, Ekelund
CC, et al. Effect of physical activity guidelines on physical function in older
adults. Journal of the American Geriatrics Society. 2008;56(10):1873-8.
354. Steeves JA, Bowles HR, McClain JJ, Dodd KW, Brychta RJ, Wang J,
et al. Ability of thigh-worn ActiGraph and activPAL monitors to classify
REFERENCES
404
posture and motion. Medicine and science in sports and exercise.
2015;47(5):952-9.
355. Wheeler MJ, Green DJ, Ellis KA, Cerin E, Heinonen I, Naylor LH,
et al. Distinct effects of acute exercise and breaks in sitting on working
memory and executive function in older adults: a three-arm, randomised
cross-over trial to evaluate the effects of exercise with and without breaks
in sitting on cognition. British journal of sports medicine. 2019.
356. Chan CS, Slaughter SE, Jones CA, Ickert C, Wagg AS. Measuring
Activity Performance of Older Adults Using the activPAL: A Rapid
Review. Healthcare (Basel, Switzerland). 2017;5(4).

REFERENCES
405

406

407
CHAPTER 11
APPENDIX
APPENDIX
408
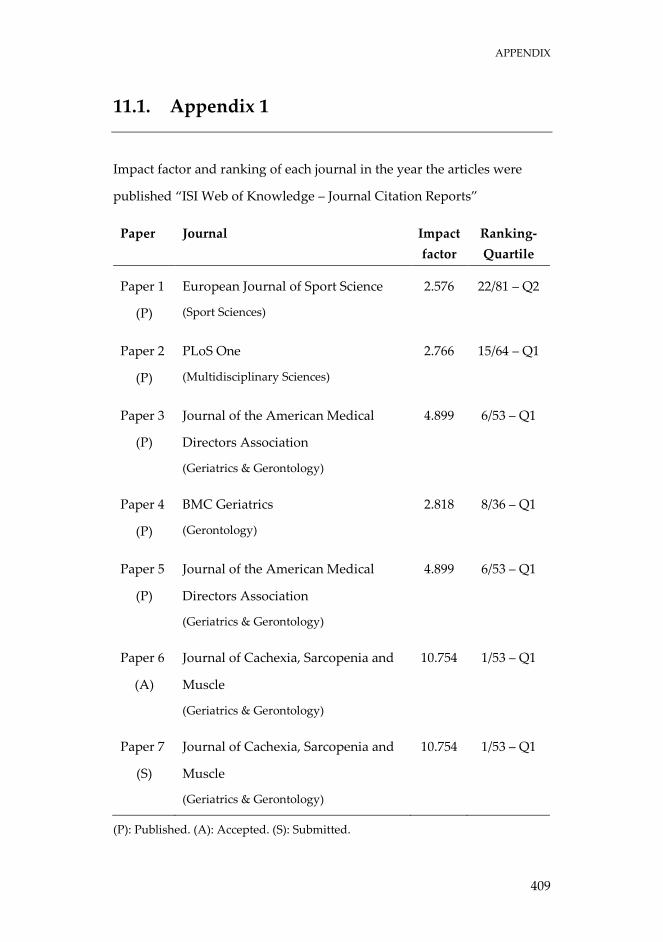
APPENDIX
409
11.1. Appendix 1
Impact factor and ranking of each journal in the year the articles were
published “ISI Web of Knowledge – Journal Citation Reports”
Paper Journal Impact
factor
Ranking-
Quartile
Paper 1
(P)
European Journal of Sport Science
(Sport Sciences)
2.576
22/81 – Q2
Paper 2
(P)
PLoS One
(Multidisciplinary Sciences)
2.766
15/64 – Q1
Paper 3
(P)
Journal of the American Medical
Directors Association
(Geriatrics & Gerontology)
4.899
6/53 – Q1
Paper 4
(P)
BMC Geriatrics
(Gerontology)
2.818
8/36 – Q1
Paper 5
(P)
Journal of the American Medical
Directors Association
(Geriatrics & Gerontology)
4.899
6/53 – Q1
Paper 6
(A)
Journal of Cachexia, Sarcopenia and
Muscle
(Geriatrics & Gerontology)
10.754
1/53 – Q1
Paper 7
(S)
Journal of Cachexia, Sarcopenia and
Muscle
(Geriatrics & Gerontology)
10.754
1/53 – Q1
(P): Published. (A): Accepted. (S): Submitted.

APPENDIX
410
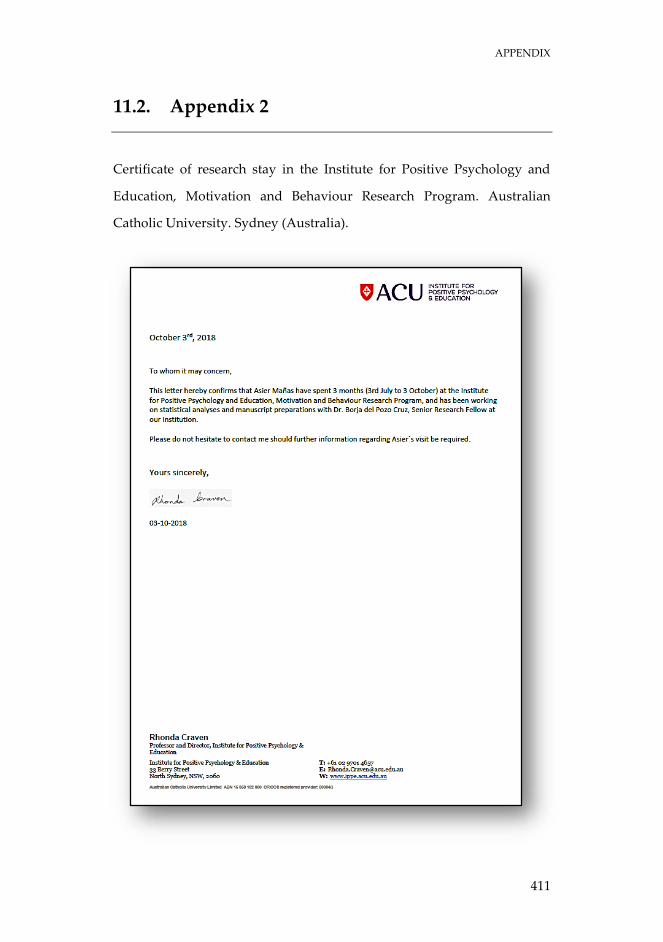
APPENDIX
411
11.2. Appendix 2
Certificate of research stay in the Institute for Positive Psychology and
Education, Motivation and Behaviour Research Program. Australian
Catholic University. Sydney (Australia).
APPENDIX
412
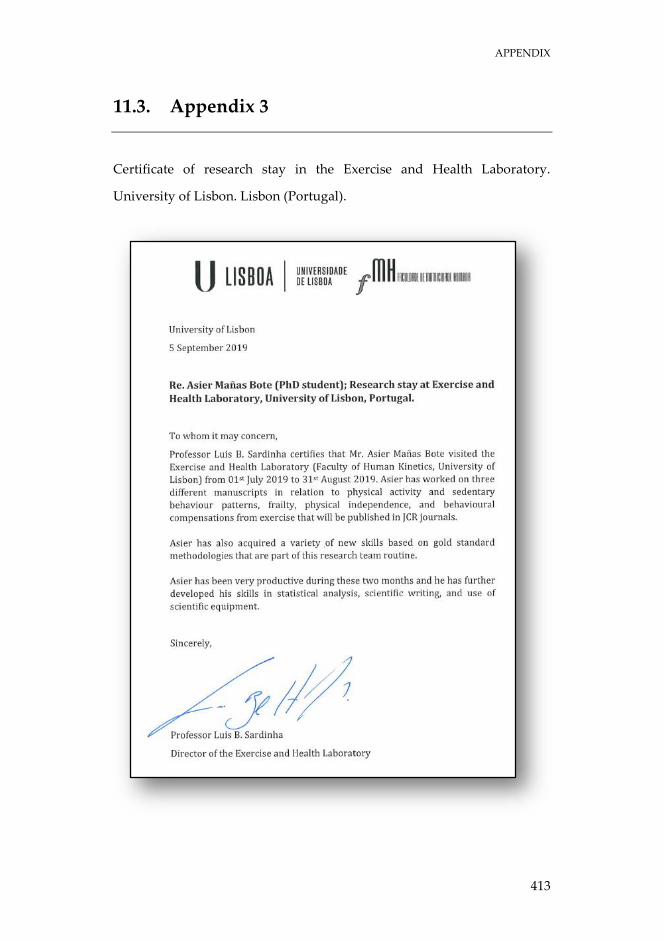
APPENDIX
413
11.3. Appendix 3
Certificate of research stay in the Exercise and Health Laboratory.
University of Lisbon. Lisbon (Portugal).


Department of Physical Activity and Sport Sciences
Universidad de Castilla-La Mancha
International PhD Thesis
Related Documents