© 2013 International Monetary Fund August 2013 IMF Country Report No. 13/248 July 29, 2012 January 29, 2001 January 29, 2001 January 29, 2001 January 29, 2001 Guatemala: Selected Issues and Analytical Notes This paper on Guatemala was prepared by a staff team of the International Monetary Fund as background documentation for the periodic consultation with the member country. It is based on the information available at the time it was completed on July 11, 2013. The views expressed in this document are those of the staff team and do not necessarily reflect the views of the government of Guatemala or the Executive Board of the IMF. The policy of publication of staff reports and other documents by the IMF allows for the deletion of market-sensitive information. Copies of this report are available to the public from International Monetary Fund Publication Services 700 19 th Street, N.W. Washington, D.C. 20431 Telephone: (202) 623-7430 Telefax: (202) 623-7201 E-mail: [email protected] Internet: http://www.imf.org International Monetary Fund Washington, D.C.

Welcome message from author
This document is posted to help you gain knowledge. Please leave a comment to let me know what you think about it! Share it to your friends and learn new things together.
Transcript
© 2013 International Monetary Fund August 2013 IMF Country Report No. 13/248
July 29, 2012 January 29, 2001 January 29, 2001 January 29, 2001 January 29, 2001
Guatemala: Selected Issues and Analytical Notes This paper on Guatemala was prepared by a staff team of the International Monetary Fund as background documentation for the periodic consultation with the member country. It is based on the information available at the time it was completed on July 11, 2013. The views expressed in this document are those of the staff team and do not necessarily reflect the views of the government of Guatemala or the Executive Board of the IMF. The policy of publication of staff reports and other documents by the IMF allows for the deletion of market-sensitive information.
Copies of this report are available to the public from
International Monetary Fund Publication Services 700 19th Street, N.W. Washington, D.C. 20431
Telephone: (202) 623-7430 Telefax: (202) 623-7201 E-mail: [email protected] Internet: http://www.imf.org
International Monetary Fund
Washington, D.C.
GUATEMALA
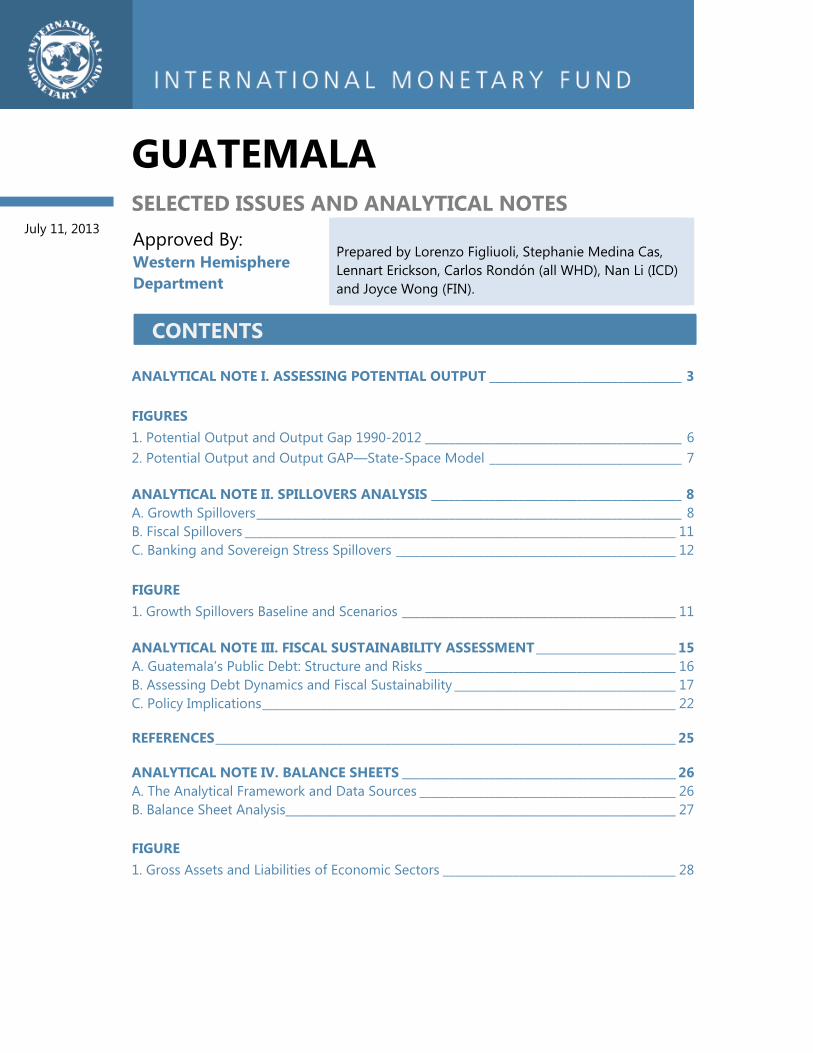
GUATEMALA SELECTED ISSUES AND ANALYTICAL NOTES Approved By: Western Hemisphere Department
Prepared by Lorenzo Figliuoli, Stephanie Medina Cas, Lennart Erickson, Carlos Rondón (all WHD), Nan Li (ICD) and Joyce Wong (FIN).
ANALYTICAL NOTE I. ASSESSING POTENTIAL OUTPUT _________________________________ 3 FIGURES 1. Potential Output and Output Gap 1990-2012 ____________________________________________ 6 2. Potential Output and Output GAP—State-Space Model _________________________________ 7
ANALYTICAL NOTE II. SPILLOVERS ANALYSIS ___________________________________________ 8 A. Growth Spillovers _________________________________________________________________________ 8 B. Fiscal Spillovers __________________________________________________________________________ 11 C. Banking and Sovereign Stress Spillovers ________________________________________________ 12 FIGURE 1. Growth Spillovers Baseline and Scenarios _______________________________________________ 11
ANALYTICAL NOTE III. FISCAL SUSTAINABILITY ASSESSMENT ________________________ 15 A. Guatemala’s Public Debt: Structure and Risks ___________________________________________ 16 B. Assessing Debt Dynamics and Fiscal Sustainability ______________________________________ 17 C. Policy Implications _______________________________________________________________________ 22
REFERENCES _______________________________________________________________________________ 25
ANALYTICAL NOTE IV. BALANCE SHEETS _______________________________________________ 26 A. The Analytical Framework and Data Sources ____________________________________________ 26 B. Balance Sheet Analysis___________________________________________________________________ 27
FIGURE 1. Gross Assets and Liabilities of Economic Sectors ________________________________________ 28
CONTENTS
July 11, 2013
GUATEMALA
2 INTERNATIONAL MONETARY FUND
TABLE 1. External and Foreign Currency Positions _________________________________________________ 30 APPENDIX
1. Net Intersectoral Asset and Liability Positions _____________________________________ 31
REFERENCES _______________________________________________________________________________ 33
ANALYTICAL NOTE V. MONETARY POLICY STANCE ____________________________________ 34
ANALYTICAL NOTE VI. BASEL III _________________________________________________________ 37

GUATEMALA
INTERNATIONAL MONETARY FUND 3
Cycle extraction filters 3.5% 0.5%Production Function Approach 3.5% 0.2%State-Space Model 3.6% -1.3%
Average 3.5% -0.2%Sources: Fund staff estimates and Estavao and Johnson (2012).
Output GAP 2012
Main Results: Summary
MethodologyAverage Growth
-2
-1
0
1
2
3
4
5
1990-1995 1996-2000 2001-2005 2006-2010 2011-2013F
TFP
Capital
Labor force
Real GDP growth
Real GDP growth (annualized percent y/y) and productivity contribution.
Sources: Country authorities and Fund staff estimates.
ANALYTICAL NOTE I. ASSESSING POTENTIAL OUTPUT1
This note estimates both Guatemala’s potential output and output gap using a wide range of econometric techniques. Results are highly robust to different methodologies and suggest that its potential output growth is about 3.5 percent and the output gap is almost closed.
1. Potential output is a critical concept for providing accurate macroeconomic policy advice. Adequate estimates of the magnitude of potential output and the output gap help formulate the adequate fiscal stance and thus necessary changes in fiscal policy. Also, under inflation targeting regimes, the output gap helps determine the necessary monetary policy adjustments to keep inflation under control. However, given the unobservable nature of these two variables, their measurement is subject to uncertainty.
2. Our analysis suggests that Guatemala’s potential output growth is about 3.5 percent for the whole sample period and the output gap is almost closed. Results are highly robust among different methodologies. Among the methods used, several well-known time series filters and two different estimations of a state-space model are included. Additionally, a test for structural breaks in the series of potential GDP is presented. For the period 1990 – 2012, Guatemala’s potential output grew at an average rate of 3.5 percent; for the period 2001-2012, output grew at an average pace of 3.4 percent. All methodologies conclude that the output gap at the end of 2012 is almost closed at -0.2 percent of potential GDP.
3. The Production Function Approach shows that the absence of productivity growth is a significant barrier to potential GDP growth. Results show that potential GDP grew at a rate of 3.5 percent between 1990 and 2012. However, in the same period, total factor productivity in Guatemala has subtracted in average 0.6 percent points from GDP growth. The lack of productivity growth is explained by low rates of investment in physical and human capital. Swiston and Barrot (2011) show that raising investment in physical and human capital to the average level of Brazil, México and Peru would raise economic growth by more than 1 percent a year.2
1 Prepared by Carlos Rondón.
GUATEMALA
4 INTERNATIONAL MONETARY FUND
1990-2012 2001-2012 2010 2011
Deterministic Drift 3.5% 0.1% -0.4% -1.6% -1.0%Mean Reversion 3.7% 1.2% -0.2% -2.0% -1.7%Sources: Fund staff estimates and Estavao and Johnson (2012).
State-Space Model
Results: State-Space ModelOutput Gap
Growth Rate
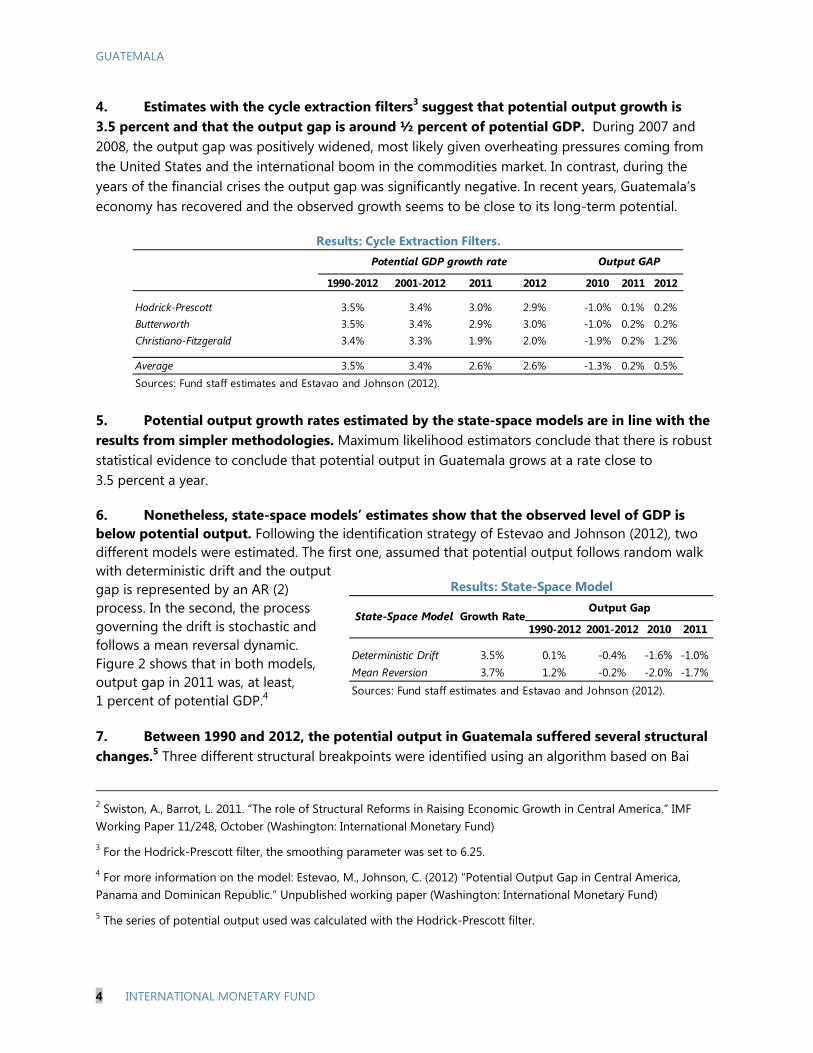
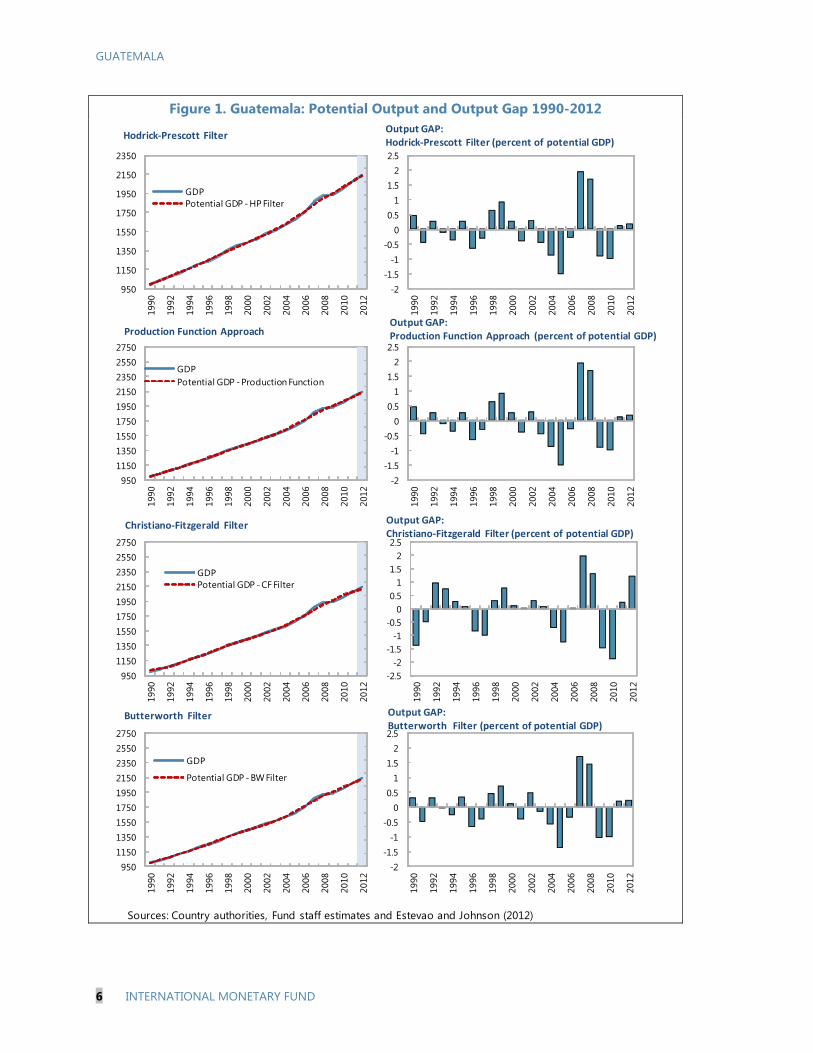
4. Estimates with the cycle extraction filters3 suggest that potential output growth is 3.5 percent and that the output gap is around ½ percent of potential GDP. During 2007 and 2008, the output gap was positively widened, most likely given overheating pressures coming from the United States and the international boom in the commodities market. In contrast, during the years of the financial crises the output gap was significantly negative. In recent years, Guatemala’s economy has recovered and the observed growth seems to be close to its long-term potential.
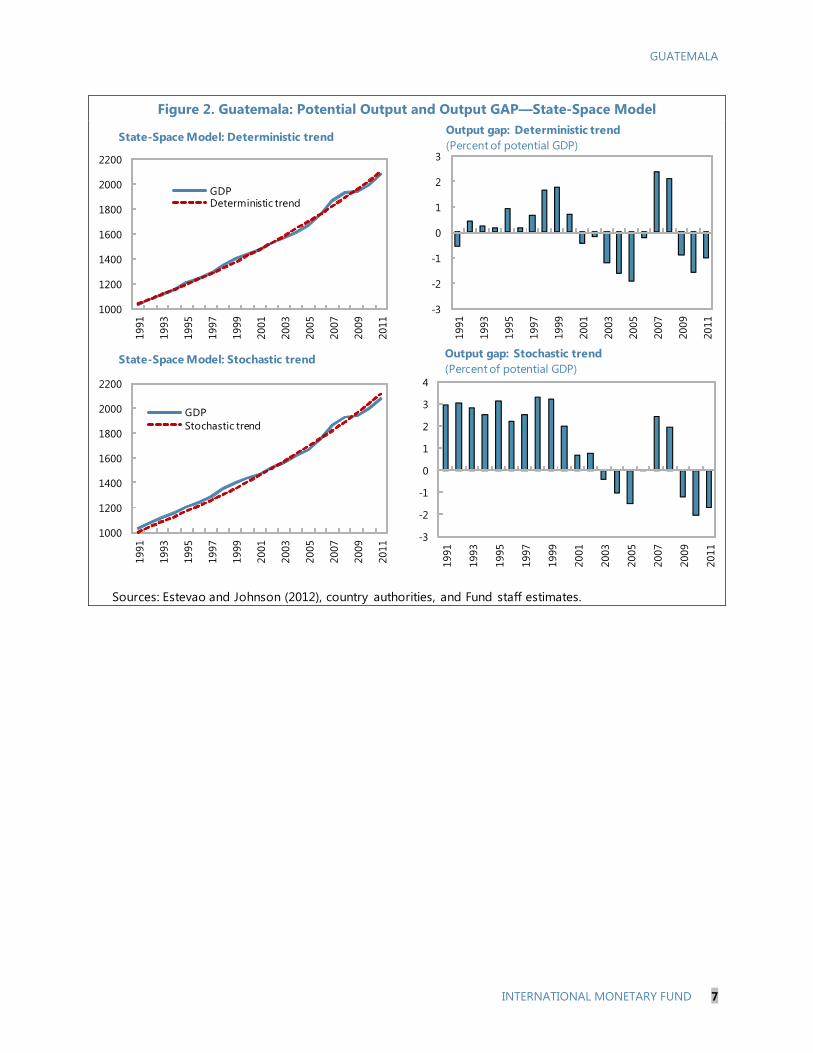
5. Potential output growth rates estimated by the state-space models are in line with the results from simpler methodologies. Maximum likelihood estimators conclude that there is robust statistical evidence to conclude that potential output in Guatemala grows at a rate close to 3.5 percent a year.
6. Nonetheless, state-space models’ estimates show that the observed level of GDP is below potential output. Following the identification strategy of Estevao and Johnson (2012), two different models were estimated. The first one, assumed that potential output follows random walk with deterministic drift and the output gap is represented by an AR (2) process. In the second, the process governing the drift is stochastic and follows a mean reversal dynamic. Figure 2 shows that in both models, output gap in 2011 was, at least, 1 percent of potential GDP.4
7. Between 1990 and 2012, the potential output in Guatemala suffered several structural changes.5 Three different structural breakpoints were identified using an algorithm based on Bai
2 Swiston, A., Barrot, L. 2011. “The role of Structural Reforms in Raising Economic Growth in Central America.” IMF Working Paper 11/248, October (Washington: International Monetary Fund)
3 For the Hodrick-Prescott filter, the smoothing parameter was set to 6.25.
4 For more information on the model: Estevao, M., Johnson, C. (2012) “Potential Output Gap in Central America, Panama and Dominican Republic.” Unpublished working paper (Washington: International Monetary Fund)
5 The series of potential output used was calculated with the Hodrick-Prescott filter.
1990-2012 2001-2012 2011 2012 2010 2011 2012
Hodrick-Prescott 3.5% 3.4% 3.0% 2.9% -1.0% 0.1% 0.2%Butterworth 3.5% 3.4% 2.9% 3.0% -1.0% 0.2% 0.2%Christiano-Fitzgerald 3.4% 3.3% 1.9% 2.0% -1.9% 0.2% 1.2%
Average 3.5% 3.4% 2.6% 2.6% -1.3% 0.2% 0.5%Sources: Fund staff estimates and Estavao and Johnson (2012).
Output GAP
Results: Cycle Extraction Filters.Potential GDP growth rate
GUATEMALA
INTERNATIONAL MONETARY FUND 5
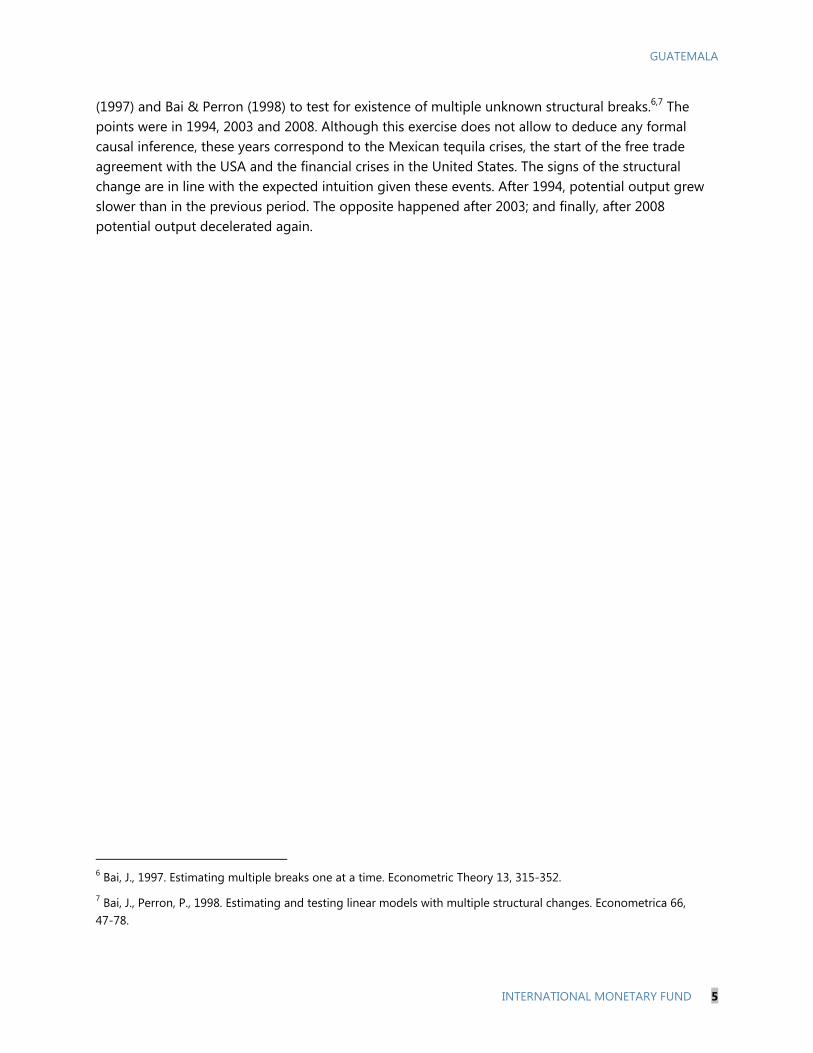
(1997) and Bai & Perron (1998) to test for existence of multiple unknown structural breaks.6,7 The points were in 1994, 2003 and 2008. Although this exercise does not allow to deduce any formal causal inference, these years correspond to the Mexican tequila crises, the start of the free trade agreement with the USA and the financial crises in the United States. The signs of the structural change are in line with the expected intuition given these events. After 1994, potential output grew slower than in the previous period. The opposite happened after 2003; and finally, after 2008 potential output decelerated again.
6 Bai, J., 1997. Estimating multiple breaks one at a time. Econometric Theory 13, 315-352.
7 Bai, J., Perron, P., 1998. Estimating and testing linear models with multiple structural changes. Econometrica 66, 47-78.
GUATEMALA
6 INTERNATIONAL MONETARY FUND
Figure 1. Guatemala: Potential Output and Output Gap 1990-2012
Sources: Country authorities, Fund staff estimates and Estevao and Johnson (2012)
950
1150
1350
1550
1750
1950
2150
235019
90
1992
1994
1996
1998
2000
2002
2004
2006
2008
2010
2012
GDPPotential GDP - HP Filter
-2-1.5
-1-0.5
00.5
11.5
22.5
1990
1992
1994
1996
1998
2000
2002
2004
2006
2008
2010
2012
950115013501550175019502150235025502750
1990
1992
1994
1996
1998
2000
2002
2004
2006
2008
2010
2012
GDPPotential GDP - Production Function
-2-1.5
-1-0.5
00.5
11.5
22.5
1990
1992
1994
1996
1998
2000
2002
2004
2006
2008
2010
2012
950115013501550175019502150235025502750
1990
1992
1994
1996
1998
2000
2002
2004
2006
2008
2010
2012
GDPPotential GDP - CF Filter
-2.5-2
-1.5-1
-0.50
0.51
1.52
2.5
1990
1992
1994
1996
1998
2000
2002
2004
2006
2008
2010
2012
950115013501550175019502150235025502750
1990
1992
1994
1996
1998
2000
2002
2004
2006
2008
2010
2012
GDP
Potential GDP - BW Filter
-2-1.5
-1-0.5
00.5
11.5
22.5
1990
1992
1994
1996
1998
2000
2002
2004
2006
2008
2010
2012
Hodrick-Prescott FilterOutput GAP: Hodrick-Prescott Filter (percent of potential GDP)
Production Function ApproachOutput GAP: Production Function Approach (percent of potential GDP)
Output GAP: Christiano-Fitzgerald Filter (percent of potential GDP)
Christiano-Fitzgerald Filter
Butterworth Filter Output GAP: Butterworth Filter (percent of potential GDP)
GUATEMALA
INTERNATIONAL MONETARY FUND 7
Figure 2. Guatemala: Potential Output and Output GAP—State-Space Model
Sources: Estevao and Johnson (2012), country authorities, and Fund staff estimates.
1000
1200
1400
1600
1800
2000
2200
1991
1993
1995
1997
1999
2001
2003
2005
2007
2009
2011
GDPDeterministic trend
-3
-2
-1
0
1
2
3
1991
1993
1995
1997
1999
2001
2003
2005
2007
2009
2011
1000
1200
1400
1600
1800
2000
2200
1991
1993
1995
1997
1999
2001
2003
2005
2007
2009
2011
GDPStochastic trend
-3
-2
-1
0
1
2
3
4
1991
1993
1995
1997
1999
2001
2003
2005
2007
2009
2011
State-Space Model: Stochastic trend
State-Space Model: Deterministic trend Output gap: Deterministic trend (Percent of potential GDP)
Output gap: Stochastic trend (Percent of potential GDP)
GUATEMALA
8 INTERNATIONAL MONETARY FUND
ANALYTICAL NOTE II. SPILLOVERS ANALYSIS1
This note assesses potential spillovers to Guatemala from possible shocks due to cross-country linkages. It reviews possible spillovers form a slowdown in the growth pace of the country’s main trading partners; analyzes the impact of global fiscal consolidation on Guatemala; and estimates the impact from potential losses in foreign financial assets on credit availability to Guatemalan borrowers.
A. Growth Spillovers
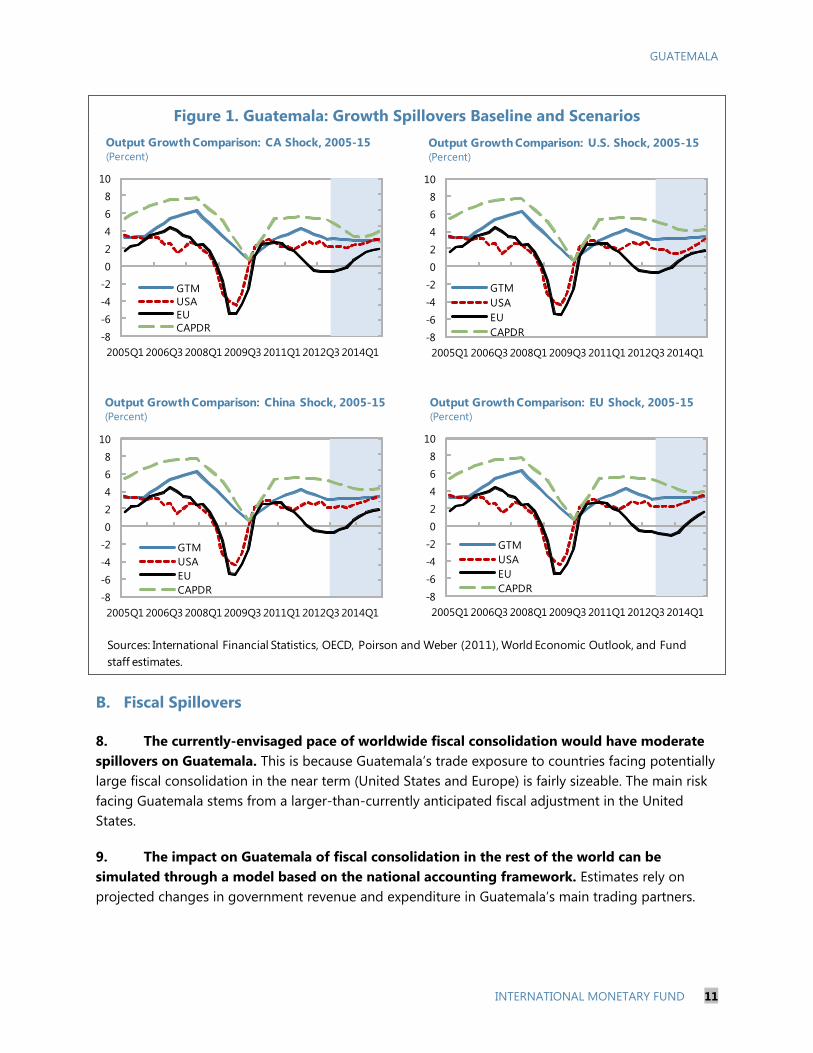
1. A multi-country VAR analysis is used to assess the risk to GDP growth of Guatemala from a decline in domestic demand in its main trading partners. Domestic components are identified following the VAR approach described in Poirson and Weber (2011), which allows decomposing the growth rate into long-run, dynamic domestic, and dynamic foreign components.
2. Four different shock scenarios are analyzed to assess the growth implications for Guatemala. The assumption underlying the first scenario is a ½ standard deviation reduction in the dynamic domestic growth component of the U.S. in 2013 compared to the implied values under the WEO projections. In the second scenario, China’s dynamic domestic growth component is lowered by ½ standard deviation. The third scenario corresponds to a shock of the same size to the dynamic domestic growth components of the main trading partners in the euro area - Italy, Spain, Germany and the Netherlands. In the fourth scenario, the dynamic domestic growth components of the trading partners within the CAPDR – Panama, Costa Rica, El Salvador, Nicaragua, the Dominican Republic and Honduras - are lowered by ½ standard deviation. In each scenario, the new growth rates for all 15 countries in the sample are computed, holding all other domestic components unchanged.2
3. Deviations from long run growth in Guatemala have been mostly driven by foreign factors. They stimulated high growth rates before 2008 and explain the growth reduction the crisis years. Most recently, foreign and domestic factors have contributed to the pickup in economic activity.
1 Prepared by Carlos Rondón, Lennart Erickson, Yulia Ustyugova and Eugenio Cerutti.
2 Results underestimate the impact on growth as there is no second-round effect on other countries’ dynamic domestic component but only on their external dynamic component. However, the approach has the advantage that it takes third country effects—e.g. the impact on Guatemala of the fall in China’s domestic demand channeled via Costa Rica — into account and is thus estimating the spillover effects consistently across the 16 countries in the sample. The foreign component includes also four exogenous shocks: a dummy for the oil shock in 1979, a dummy for LA debt crisis in 1980s, a dummy for the oil shock in 1990, and a dummy for the recent financial crisis. The sample extends from 1977Q1 to 2012Q4. The country sample includes: Canada, China, Costa Rica, the Dominican Republic, El Salvador, Germany, Guatemala, Honduras, Italy, Japan, Mexico, Netherlands, Nicaragua, Panama, Spain and the United States. Results are robust to different lag specifications and are similar if an annual sample is used.
GUATEMALA
INTERNATIONAL MONETARY FUND 9
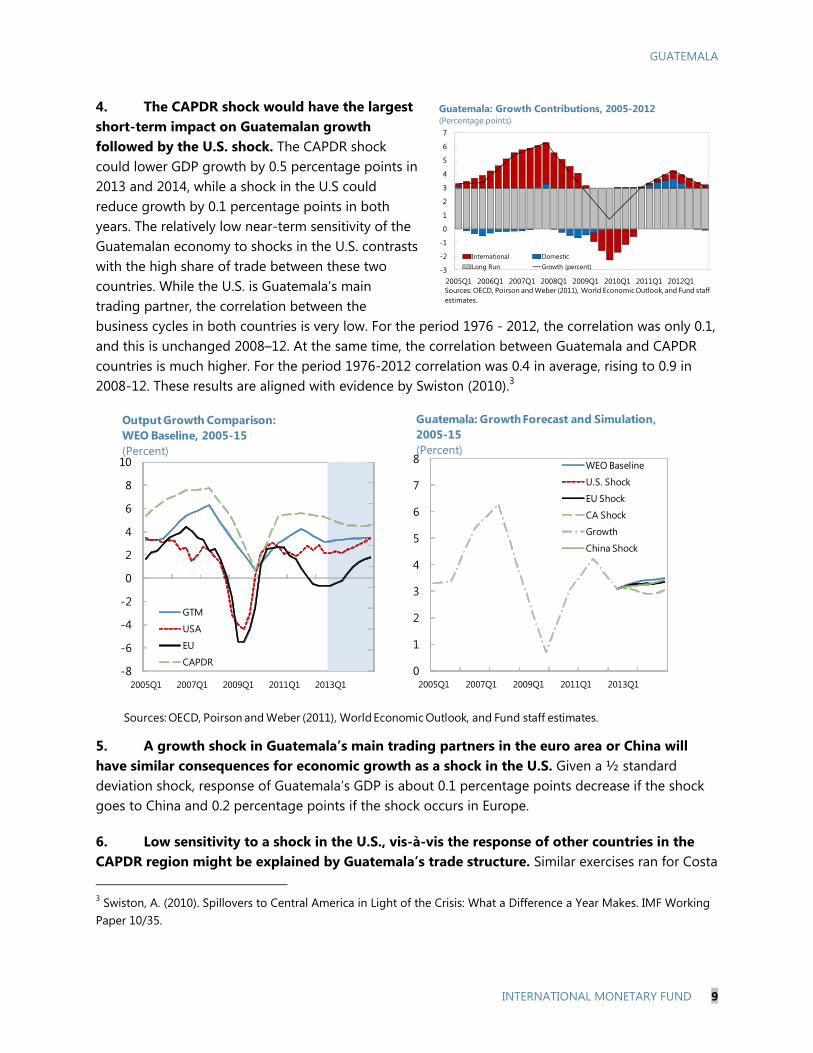
4. The CAPDR shock would have the largest short-term impact on Guatemalan growth followed by the U.S. shock. The CAPDR shock could lower GDP growth by 0.5 percentage points in 2013 and 2014, while a shock in the U.S could reduce growth by 0.1 percentage points in both years. The relatively low near-term sensitivity of the Guatemalan economy to shocks in the U.S. contrasts with the high share of trade between these two countries. While the U.S. is Guatemala’s main trading partner, the correlation between the business cycles in both countries is very low. For the period 1976 - 2012, the correlation was only 0.1, and this is unchanged 2008–12. At the same time, the correlation between Guatemala and CAPDR countries is much higher. For the period 1976-2012 correlation was 0.4 in average, rising to 0.9 in 2008-12. These results are aligned with evidence by Swiston (2010).3
5. A growth shock in Guatemala’s main trading partners in the euro area or China will have similar consequences for economic growth as a shock in the U.S. Given a ½ standard deviation shock, response of Guatemala’s GDP is about 0.1 percentage points decrease if the shock goes to China and 0.2 percentage points if the shock occurs in Europe.
6. Low sensitivity to a shock in the U.S., vis-à-vis the response of other countries in the CAPDR region might be explained by Guatemala’s trade structure. Similar exercises ran for Costa 3 Swiston, A. (2010). Spillovers to Central America in Light of the Crisis: What a Difference a Year Makes. IMF Working Paper 10/35.
Sources: OECD, Poirson and Weber (2011), World Economic Outlook, and Fund staff estimates.
-8
-6
-4
-2
0
2
4
6
8
10
2005Q1 2007Q1 2009Q1 2011Q1 2013Q1
GTM
USA
EU
CAPDR
Output Growth Comparison: WEO Baseline, 2005-15(Percent)
0
1
2
3
4
5
6
7
8
2005Q1 2007Q1 2009Q1 2011Q1 2013Q1
WEO Baseline
U.S. Shock
EU Shock
CA Shock
Growth
China Shock
Guatemala: Growth Forecast and Simulation, 2005-15(Percent)
-3
-2
-1
0
1
2
3
4
5
6
7
2005Q1 2006Q1 2007Q1 2008Q1 2009Q1 2010Q1 2011Q1 2012Q1
International DomesticLong Run Growth (percent)
Guatemala: Growth Contributions, 2005-2012(Percentage points)
Sources: OECD, Poirson and Weber (2011), World Economic Outlook, and Fund staff estimates.
GUATEMALA
10 INTERNATIONAL MONETARY FUND
Rica and El Salvador showed that a shock in the U.S. would have the largest effect over GDP growth. Differences might be associated with trade structures. According to the World Bank, Guatemala has a larger share of basic commodity exports (sugar, coffee, nuts) than Costa Rica and El Salvador. This could explain why Guatemala’s reaction during the 2009 crisis was milder than in the rest of the CAPDR countries, since a rebound was supported by the pickup in global demand for commodities.
7. Guatemala’s contained dollarization may also help explain the more muted response to U.S. shocks. Integration via dollarization is a direct channel for transmission of financial shocks in the U.S. and other countries. Higher levels of dollarization help to import tighter financial conditions from other regions and might explain why Guatemala has a lower response to shocks in the U.S. vis-à-vis the response of similar countries in the CAPDR region. For instance, in 2009, Guatemala’s loan dollarization was approximately 25 percent while this share was 50 percent for Costa Rica and 100 percent in El Salvador.
GUATEMALA
INTERNATIONAL MONETARY FUND 11
Figure 1. Guatemala: Growth Spillovers Baseline and Scenarios
B. Fiscal Spillovers
8. The currently-envisaged pace of worldwide fiscal consolidation would have moderate spillovers on Guatemala. This is because Guatemala’s trade exposure to countries facing potentially large fiscal consolidation in the near term (United States and Europe) is fairly sizeable. The main risk facing Guatemala stems from a larger-than-currently anticipated fiscal adjustment in the United States.
9. The impact on Guatemala of fiscal consolidation in the rest of the world can be simulated through a model based on the national accounting framework. Estimates rely on projected changes in government revenue and expenditure in Guatemala’s main trading partners.
Sources: International Financial Statistics, OECD, Poirson and Weber (2011), World Economic Outlook, and Fund staff estimates.
-8-6-4-202468
10
2005Q1 2006Q3 2008Q1 2009Q3 2011Q1 2012Q3 2014Q1
GTMUSAEUCAPDR
Output Growth Comparison: U.S. Shock, 2005-15(Percent)
-8-6-4-202468
10
2005Q1 2006Q3 2008Q1 2009Q3 2011Q1 2012Q3 2014Q1
GTMUSAEUCAPDR
Output Growth Comparison: China Shock, 2005-15(Percent)
-8-6-4-202468
10
2005Q1 2006Q3 2008Q1 2009Q3 2011Q1 2012Q3 2014Q1
GTMUSAEUCAPDR
Output Growth Comparison: EU Shock, 2005-15(Percent)
-8-6-4-202468
10
2005Q1 2006Q3 2008Q1 2009Q3 2011Q1 2012Q3 2014Q1
GTMUSAEUCAPDR
Output Growth Comparison: CA Shock, 2005-15(Percent)
GUATEMALA
12 INTERNATIONAL MONETARY FUND
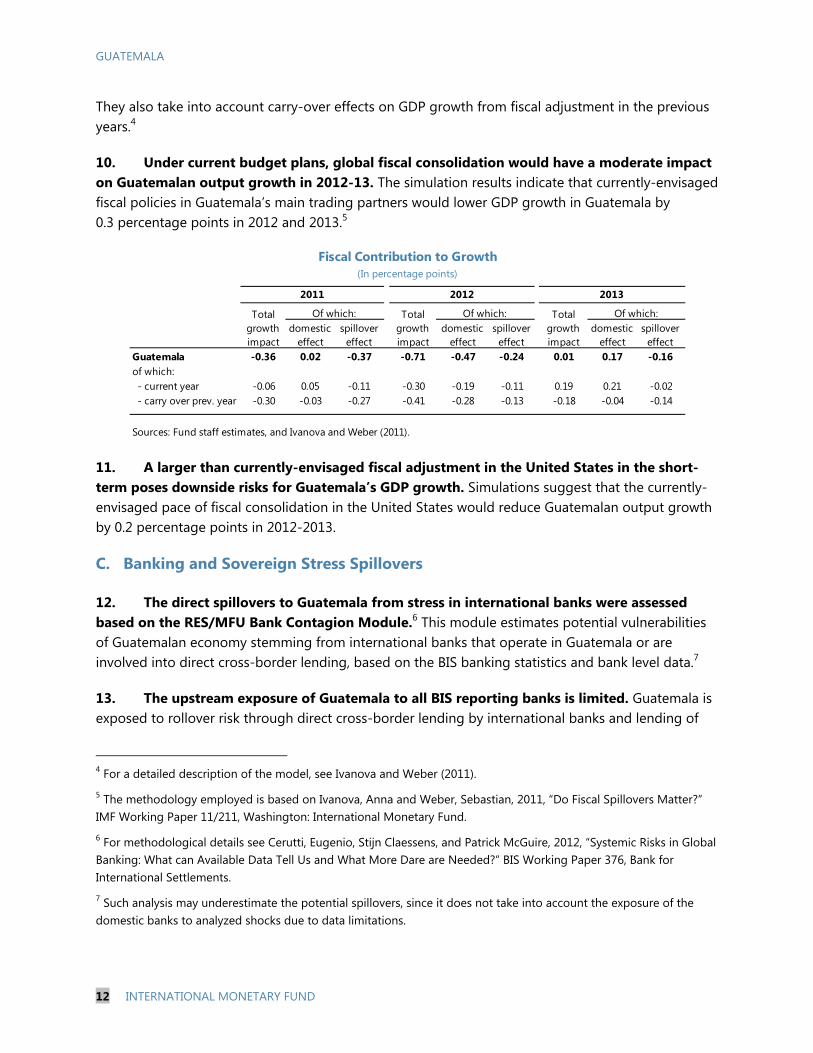
They also take into account carry-over effects on GDP growth from fiscal adjustment in the previous years.4
10. Under current budget plans, global fiscal consolidation would have a moderate impact on Guatemalan output growth in 2012-13. The simulation results indicate that currently-envisaged fiscal policies in Guatemala’s main trading partners would lower GDP growth in Guatemala by 0.3 percentage points in 2012 and 2013.5
11. A larger than currently-envisaged fiscal adjustment in the United States in the short-term poses downside risks for Guatemala’s GDP growth. Simulations suggest that the currently-envisaged pace of fiscal consolidation in the United States would reduce Guatemalan output growth by 0.2 percentage points in 2012-2013.
C. Banking and Sovereign Stress Spillovers
12. The direct spillovers to Guatemala from stress in international banks were assessed based on the RES/MFU Bank Contagion Module.6 This module estimates potential vulnerabilities of Guatemalan economy stemming from international banks that operate in Guatemala or are involved into direct cross-border lending, based on the BIS banking statistics and bank level data.7
13. The upstream exposure of Guatemala to all BIS reporting banks is limited. Guatemala is exposed to rollover risk through direct cross-border lending by international banks and lending of
4 For a detailed description of the model, see Ivanova and Weber (2011).
5 The methodology employed is based on Ivanova, Anna and Weber, Sebastian, 2011, “Do Fiscal Spillovers Matter?” IMF Working Paper 11/211, Washington: International Monetary Fund.
6 For methodological details see Cerutti, Eugenio, Stijn Claessens, and Patrick McGuire, 2012, “Systemic Risks in Global Banking: What can Available Data Tell Us and What More Dare are Needed?” BIS Working Paper 376, Bank for International Settlements.
7 Such analysis may underestimate the potential spillovers, since it does not take into account the exposure of the domestic banks to analyzed shocks due to data limitations.
domestic effect
spillover effect
domestic effect
spillover effect
domestic effect
spillover effect
Guatemala -0.36 0.02 -0.37 -0.71 -0.47 -0.24 0.01 0.17 -0.16of which: - current year -0.06 0.05 -0.11 -0.30 -0.19 -0.11 0.19 0.21 -0.02 - carry over prev. year -0.30 -0.03 -0.27 -0.41 -0.28 -0.13 -0.18 -0.04 -0.14
Sources: Fund staff estimates, and Ivanova and Weber (2011).
(In percentage points)
2013
Total growth impact
Of which: Of which: Total growth impact
Of which:
2011 2012
Total growth impact
Fiscal Contribution to Growth
GUATEMALA
INTERNATIONAL MONETARY FUND 13
foreign affiliates operating in Guatemala that are funded by their parent banking systems. The upper-bound of the rollover risks is captured by the upstream exposure of Guatemala to all BIS reporting banks, which was about 7 percent of GDP or 21 percent of net credit to the public and private sectors by the Guatemalan banking system, as of March 2013.8
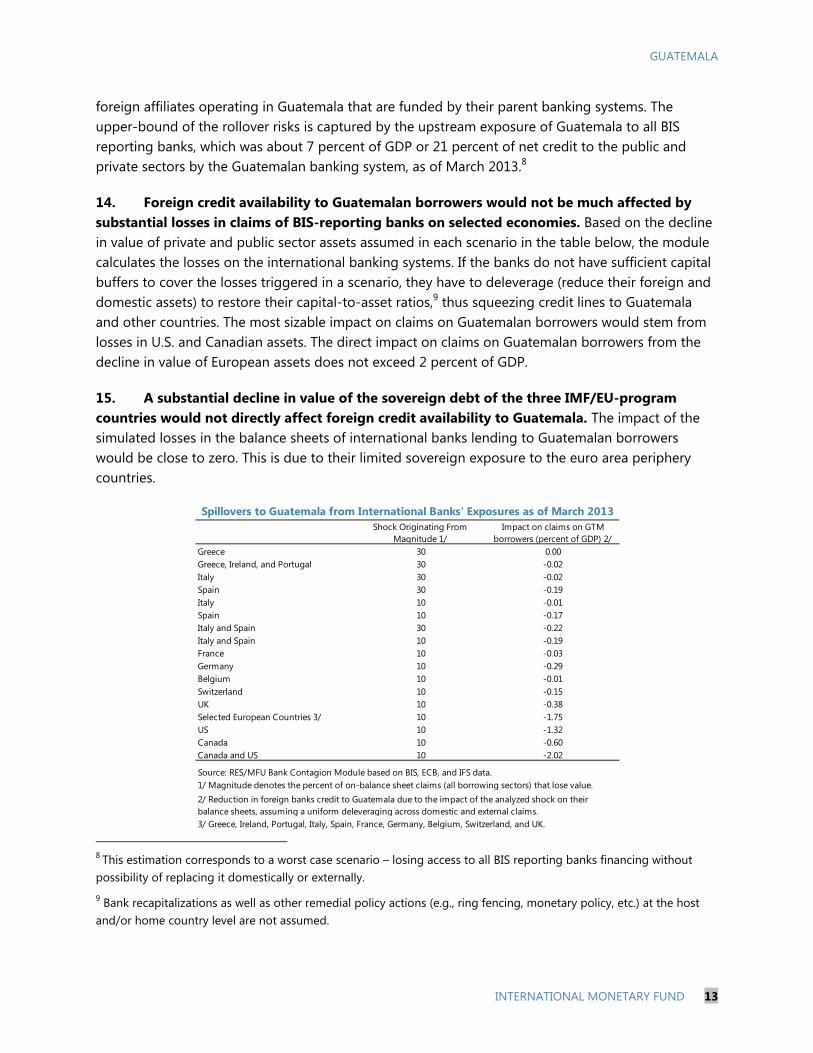
14. Foreign credit availability to Guatemalan borrowers would not be much affected by substantial losses in claims of BIS-reporting banks on selected economies. Based on the decline in value of private and public sector assets assumed in each scenario in the table below, the module calculates the losses on the international banking systems. If the banks do not have sufficient capital buffers to cover the losses triggered in a scenario, they have to deleverage (reduce their foreign and domestic assets) to restore their capital-to-asset ratios,9 thus squeezing credit lines to Guatemala and other countries. The most sizable impact on claims on Guatemalan borrowers would stem from losses in U.S. and Canadian assets. The direct impact on claims on Guatemalan borrowers from the decline in value of European assets does not exceed 2 percent of GDP.
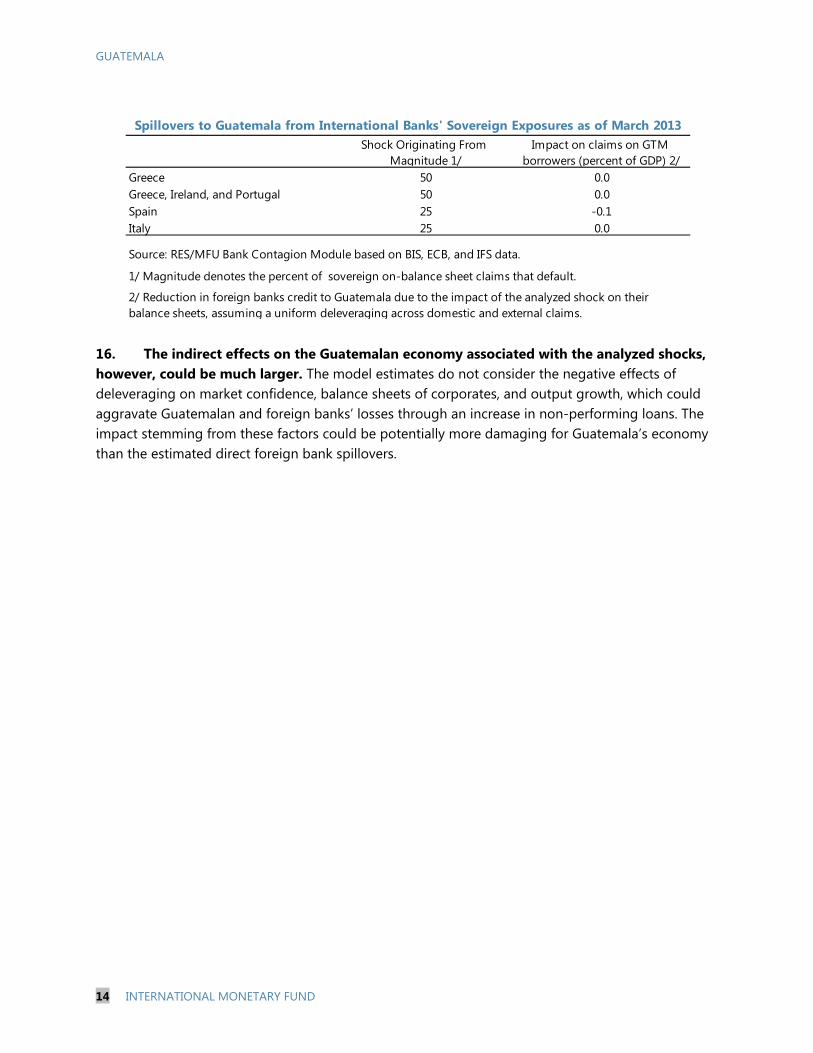
15. A substantial decline in value of the sovereign debt of the three IMF/EU-program countries would not directly affect foreign credit availability to Guatemala. The impact of the simulated losses in the balance sheets of international banks lending to Guatemalan borrowers would be close to zero. This is due to their limited sovereign exposure to the euro area periphery countries.
8 This estimation corresponds to a worst case scenario – losing access to all BIS reporting banks financing without possibility of replacing it domestically or externally.
9 Bank recapitalizations as well as other remedial policy actions (e.g., ring fencing, monetary policy, etc.) at the host and/or home country level are not assumed.
Shock Originating From Magnitude 1/
Impact on claims on GTM borrowers (percent of GDP) 2/
Greece 30 0.00Greece, Ireland, and Portugal 30 -0.02Italy 30 -0.02Spain 30 -0.19Italy 10 -0.01Spain 10 -0.17Italy and Spain 30 -0.22Italy and Spain 10 -0.19France 10 -0.03Germany 10 -0.29Belgium 10 -0.01Switzerland 10 -0.15UK 10 -0.38Selected European Countries 3/ 10 -1.75US 10 -1.32Canada 10 -0.60Canada and US 10 -2.02
Source: RES/MFU Bank Contagion Module based on BIS, ECB, and IFS data.
Spillovers to Guatemala from International Banks' Exposures as of March 2013
2/ Reduction in foreign banks credit to Guatemala due to the impact of the analyzed shock on their balance sheets, assuming a uniform deleveraging across domestic and external claims.
1/ Magnitude denotes the percent of on-balance sheet claims (all borrowing sectors) that lose value.
3/ Greece, Ireland, Portugal, Italy, Spain, France, Germany, Belgium, Switzerland, and UK.
GUATEMALA
14 INTERNATIONAL MONETARY FUND
16. The indirect effects on the Guatemalan economy associated with the analyzed shocks, however, could be much larger. The model estimates do not consider the negative effects of deleveraging on market confidence, balance sheets of corporates, and output growth, which could aggravate Guatemalan and foreign banks’ losses through an increase in non-performing loans. The impact stemming from these factors could be potentially more damaging for Guatemala’s economy than the estimated direct foreign bank spillovers.
Shock Originating From Magnitude 1/
Impact on claims on GTM borrowers (percent of GDP) 2/
Greece 50 0.0Greece, Ireland, and Portugal 50 0.0Spain 25 -0.1Italy 25 0.0
Source: RES/MFU Bank Contagion Module based on BIS, ECB, and IFS data.
1/ Magnitude denotes the percent of sovereign on-balance sheet claims that default.
Spillovers to Guatemala from International Banks' Sovereign Exposures as of March 2013
2/ Reduction in foreign banks credit to Guatemala due to the impact of the analyzed shock on their balance sheets, assuming a uniform deleveraging across domestic and external claims.
GUATEMALA
INTERNATIONAL MONETARY FUND 15
ANALYTICAL NOTE III. FISCAL SUSTAINABILITY
ASSESSMENT1
This note presents Guatemala’s short-term fiscal position and its outlook for the medium and long term, examines indicators of fiscal vulnerability, discusses the need for fiscal adjustment, and estimates the fiscal sustainability gap and examines the optimal pace of fiscal consolidation.
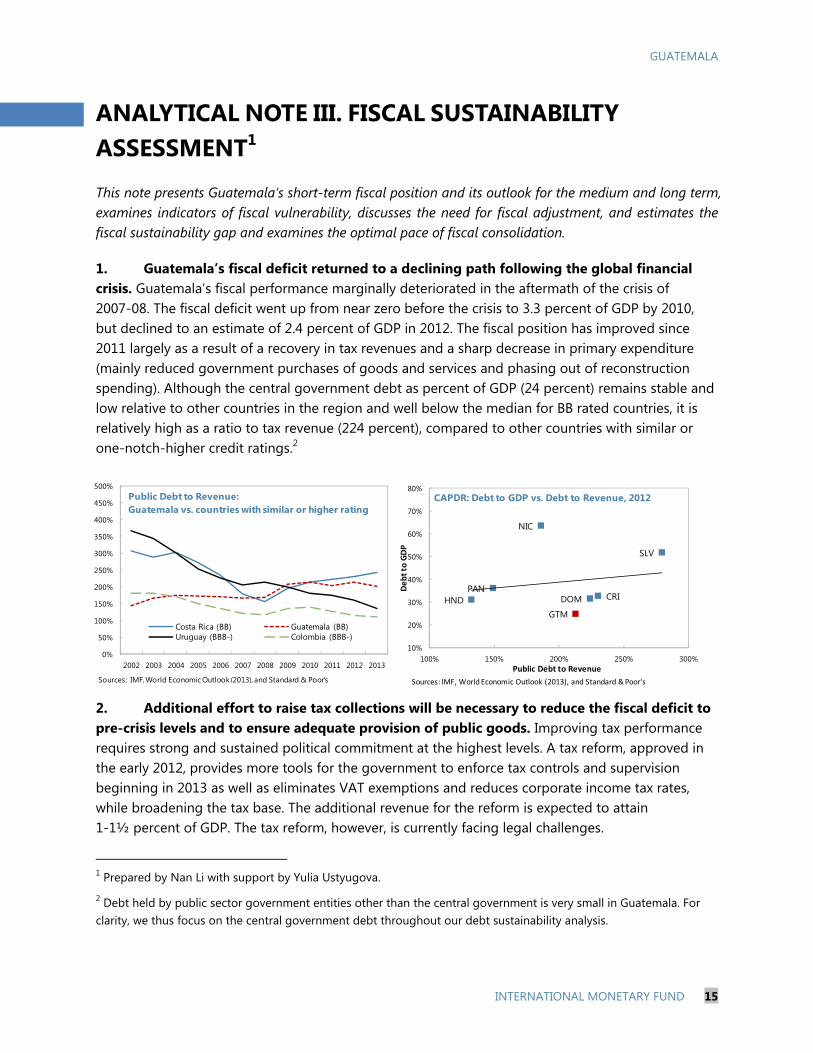
1. Guatemala’s fiscal deficit returned to a declining path following the global financial crisis. Guatemala’s fiscal performance marginally deteriorated in the aftermath of the crisis of 2007-08. The fiscal deficit went up from near zero before the crisis to 3.3 percent of GDP by 2010, but declined to an estimate of 2.4 percent of GDP in 2012. The fiscal position has improved since 2011 largely as a result of a recovery in tax revenues and a sharp decrease in primary expenditure (mainly reduced government purchases of goods and services and phasing out of reconstruction spending). Although the central government debt as percent of GDP (24 percent) remains stable and low relative to other countries in the region and well below the median for BB rated countries, it is relatively high as a ratio to tax revenue (224 percent), compared to other countries with similar or one-notch-higher credit ratings.2
2. Additional effort to raise tax collections will be necessary to reduce the fiscal deficit to pre-crisis levels and to ensure adequate provision of public goods. Improving tax performance requires strong and sustained political commitment at the highest levels. A tax reform, approved in the early 2012, provides more tools for the government to enforce tax controls and supervision beginning in 2013 as well as eliminates VAT exemptions and reduces corporate income tax rates, while broadening the tax base. The additional revenue for the reform is expected to attain 1-1½ percent of GDP. The tax reform, however, is currently facing legal challenges.
1 Prepared by Nan Li with support by Yulia Ustyugova.
2 Debt held by public sector government entities other than the central government is very small in Guatemala. For clarity, we thus focus on the central government debt throughout our debt sustainability analysis.
0%
50%
100%
150%
200%
250%
300%
350%
400%
450%
500%
2002 2003 2004 2005 2006 2007 2008 2009 2010 2011 2012 2013
Costa Rica (BB) Guatemala (BB)Uruguay (BBB-) Colombia (BBB-)
Sources: IMF, World Economic Outlook (2013), and Standard & Poor's
Public Debt to Revenue:Guatemala vs. countries with similar or higher rating
CRIDOM
SLV
GTMHND
NIC
PAN
10%
20%
30%
40%
50%
60%
70%
80%
100% 150% 200% 250% 300%
De
bt
to G
DP
Public Debt to Revenue
CAPDR: Debt to GDP vs. Debt to Revenue, 2012
Sources: IMF, World Economic Outlook (2013), and Standard & Poor's
GUATEMALA
16 INTERNATIONAL MONETARY FUND
A. Guatemala’s Public Debt: Structure and Risks
3. To assess short-term fiscal vulnerabilities, we first examine several public debt and financial market indicators. First, to evaluate Guatemala’s potential funding risks, we compute the central government’s gross financing needs (GFNs) and examine available sources and structure of financing. Second, we examine market perceptions of credit risk by analyzing Credit Default Swap (CDS) spreads on sovereign debt.
4. Public debt rollover risk in Guatemala is low, as its gross financing needs (GFNs) are small and steadily declining. Moderate fiscal deficits combined with long maturities on the domestic market and multilateral debt result in low annual gross public sector financing needs. The GFNs, computed as the sum of the projected 2013 central government deficit and public debt maturing in 2013, are estimated to be 3.4 percent of GDP in 2013, and are projected to decrease steadily over the projection period.
5. A relatively strong debt structure also mitigates risks. At end-2012, the average number of years to maturity of Guatemala’s debt portfolio was high (9.4 years);3 however, its redemption profile reveals sizeable maturity concentration in specific years, with significant spikes projected at year 2016, 2020, 2022 and 2034. A large share of this stock (80 percent of total) is issued at fixed interest rates and the average time to re-fix of the debt portfolio is 8.1 years, which limits exposure to interest rate volatility.
6. A shallow and concentrated investor base presents the main source of refinancing risk. Public Debt composition in Guatemala is almost equally split between domestic (48 percent) and external debt (52 percent). Among external debt, concessional loans account for an important share (73 percent), contributing to a lower financing cost relative to domestic debt. The investor base for domestic debt is undiversified: the three major banks and the Guatemalan Social Security, the Instituto Guatemalteco de Seguridad Social (IGSS) together hold the majority of central government domestic debt. Other traditional investors, such as private pension funds, mutual funds, and insurance companies do not play any significant role in the domestic market. IGSS is the major single investor in government debt of the country, holding about 20 percent of the stock of domestic debt, and its actuarial rate of 8.5 percent pushes its portfolio towards the long term.4 However, it may not continue to buy government securities if interest rates decline in the future, presenting potential problems.
7. Sovereign credit risk perceptions are low. Five-year credit default swap (CDS) spreads5 on Guatemalan sovereign bonds stand at about 210 basis points, about 90-110 above than those of the
3 This is driven by the high ATM of domestic debt (9.1 years) and the high ATM of external debt (9.7 years)
4 See Cabral, Brufman, Pedras and Presciuttini (2012).
5 Credit default swap (CDS) spreads measure the cost of seeking insurance against sovereign default. They are quoted as a percentage of the notional amount insured.
GUATEMALA
INTERNATIONAL MONETARY FUND 17
highest-rated countries in Latin America. These have not significantly changed in the past three years. In fact, encouraged by stronger prospects for growth and fiscal revenue, S&P upgraded Guatemala’s sovereign credit rating outlook to stable (from negative) in September 2012. Although financing needs and public debt in Guatemala are low and stable, limited fiscal flexibility stemming from low tax revenue, weak public institutions and a polarized political environment, and high poverty and income inequality continue to constrict credit quality, placing Guatemala’s ratings one or two notches below investment grade level.6
B. Assessing Debt Dynamics and Fiscal Sustainability
8. While low short-term vulnerabilities are low, it is necessary to assess long-term fiscal sustainability in Guatemala and examine the optimal path of fiscal adjustment. First, we evaluate fiscal vulnerabilities associated with growth, interest rate and exchange rate shocks by using the IMF’s debt sustainability analysis (DSA) framework and stochastic debt analysis. The sensitivity of central government debt to shocks captures how an adverse economic outlook would affect the debt to GDP (or to revenue) ratio. Second, we assess the required fiscal effort needed to meet various policy targets concerning the public debt ratio. Last, we evaluate the long-term sustainability gap in Guatemala based on the government inter-temporal budget constraint, and use an inter-temporal model to shed light on the optimal fiscal consolidation path given quadratic preferences over the sustainability and output gaps.7
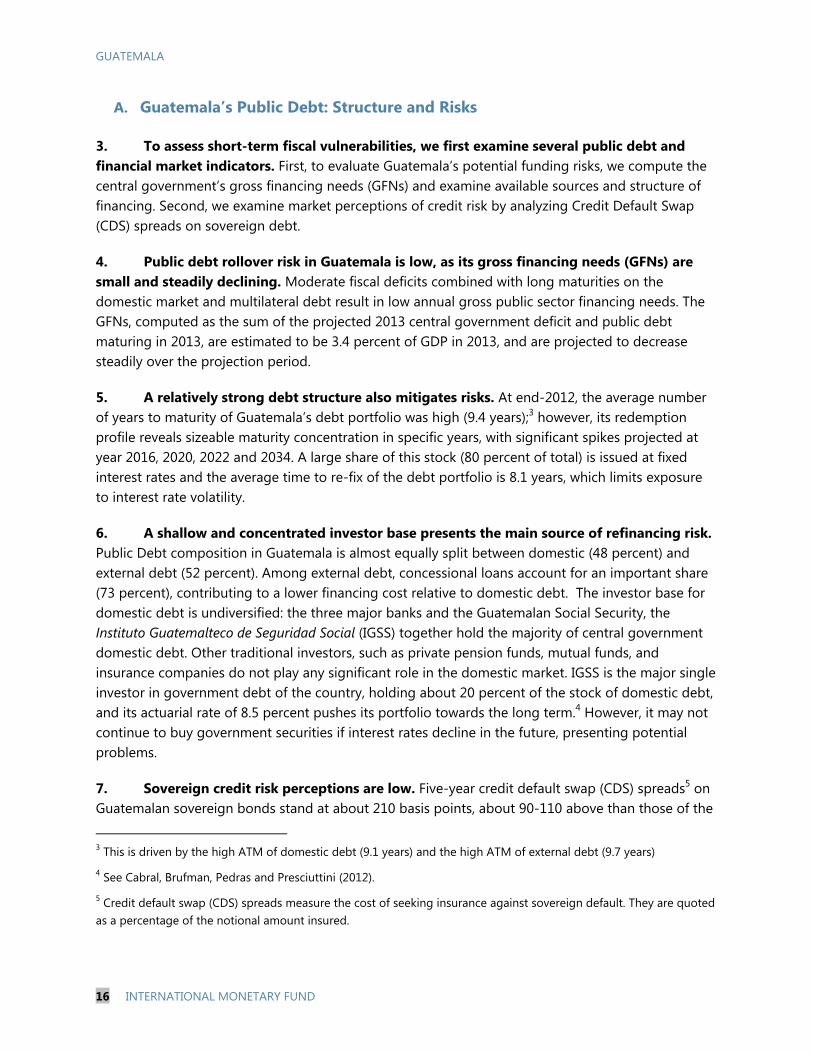
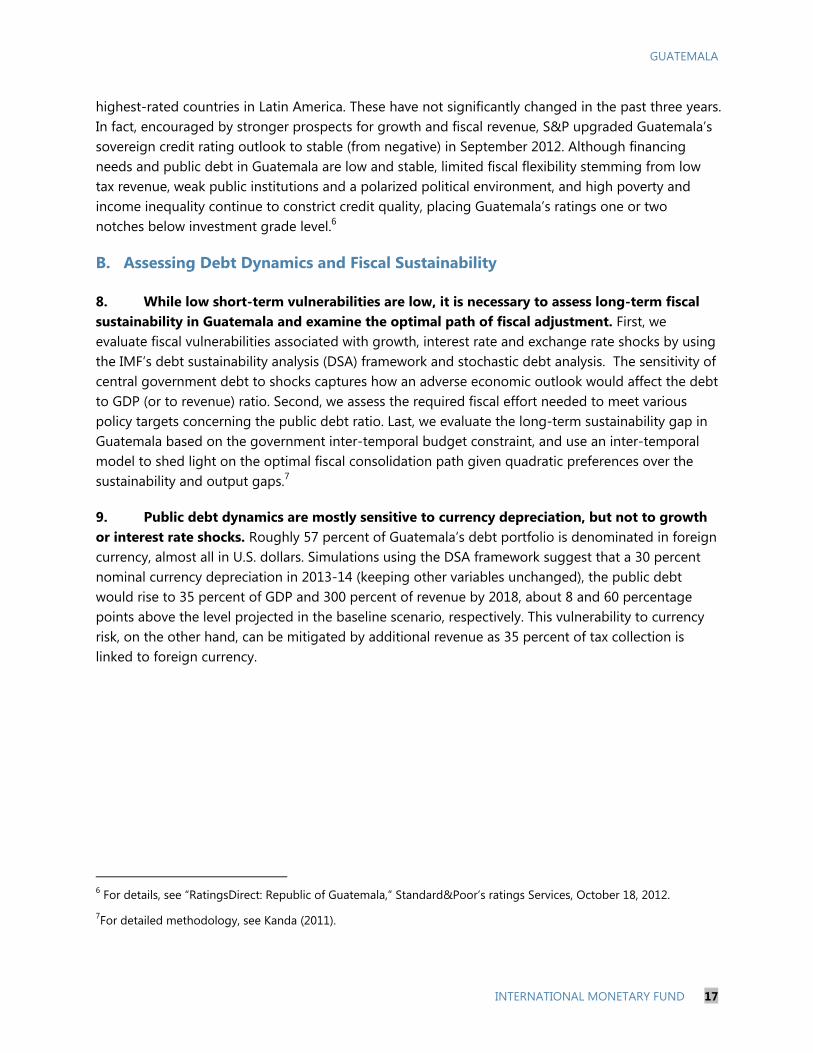
9. Public debt dynamics are mostly sensitive to currency depreciation, but not to growth or interest rate shocks. Roughly 57 percent of Guatemala’s debt portfolio is denominated in foreign currency, almost all in U.S. dollars. Simulations using the DSA framework suggest that a 30 percent nominal currency depreciation in 2013-14 (keeping other variables unchanged), the public debt would rise to 35 percent of GDP and 300 percent of revenue by 2018, about 8 and 60 percentage points above the level projected in the baseline scenario, respectively. This vulnerability to currency risk, on the other hand, can be mitigated by additional revenue as 35 percent of tax collection is linked to foreign currency.
6 For details, see “RatingsDirect: Republic of Guatemala,” Standard&Poor’s ratings Services, October 18, 2012.
7For detailed methodology, see Kanda (2011).
GUATEMALA
18 INTERNATIONAL MONETARY FUND
10. Results from a stochastic sustainability exercise for public debt suggest low medium-term risks to public debt dynamics. A stochastic simulation of the public debt path was made by (1) estimating the implicit fiscal reaction function to public debt developments and the output gap in past fiscal behavior; and (2) producing frequency distributions of debt paths under growth, interest rates and exchange rate shocks. Simulations yielded a slight upward trend in public debt-to-GDP ratio, with the median debt forecast reaching about 28 percent of GDP by 2018. The median debt forecast under the stochastic DSA is in line with the baseline projection in the medium term and the risk profile for Guatemala’s debt is estimated to be relatively narrow, especially compared to the other countries in the region. Overall, the results of the exercise suggest that achieving the baseline debt projection could be feasible under the assumption of prudent fiscal policies.
11. To ensure long-term debt sustainability and build resilience to shocks, it is estimated that Guatemala would need a 1 to 3 percentage points of GDP improvement to its primary balance, depending on the public debt target. To assess the required effort to achieve debt sustainability, we consider three possible policy goals (listed from the least to the most ambitious).8 First, maintaining the central government debt-to-GDP ratio at the 2012 level (24 percent) in 2013 and beyond would require a fiscal effort of 0.9 percent of GDP.9 Second, reducing the debt ratio to the pre-crisis level (21 percent of GDP) by 2018 would require raising the primary balance by 1.2 percent to a small surplus of 0.5 percent of GDP. Lastly, lowering the debt-to-GDP ratio to the level that could improve the sovereign credit risk rating by one notch over a period of 10 years would require a sustained improvement in primary balance by 3 percent of GDP.10 The first estimate
8 The exercise assumes that debt dynamics evolves according to the budget constraint with a constant real interest rate of 3.13 percent and real growth rate of 3.48 percent. And we assume that the fiscal adjustment is implemented in 2013 and sustained until the debt target is achieved, and does not consider additional effort that would be required to accommodate social spending.
9 This is the adjustment in the primary balance in 2013 that would stabilize the central government debt to GDP ratio at the end-2012 level, assuming that central government primary balance projected for 2013 remained thereafter.
10 See Garza, Morra and Simard (2012). For detailed methodology, refer to “A Debt Intolerant Framework Applied to Central America, Panama and the Dominican Republic” by Banister and Barrot, where they estimate a debt intolerant equation for CAPDR countries based on a dynamic panel data framework.
190
210
230
250
270
290
310
2009 2010 2011 2012 2013 2014 2015 2016 2017 2018
Guatemala:Public Sector Debt to Revenue (percent)
Baseline
Growth Shocks
30 % depreciation
Interest Rate Shocks
Source: Fund staff estimates.
15
20
25
30
35
40
45
50
2009 2010 2011 2012 2013 2014 2015 2016 2017 2018
GuatemalaPublic Debt / GDP
Baseline Projection
Stochastic Simulation
Source: Fund staff estimates
GUATEMALA
INTERNATIONAL MONETARY FUND 19
represents the minimum action that would be required to achieve fiscal sustainability, while the second and the third would aim at rebuilding or even expanding fiscal buffers. In any case, the estimates are based on an immediate adjustment in 2013.
12. Under staff’s baseline scenario, which envisages some medium-term fiscal consolidation,11 the estimated fiscal sustainability gap is virtually nil for Guatemala (1/4 percent of GDP). The fiscal sustainability gap estimate shows the change in primary balance in percent of GDP in 2013 that would be consistent with stabilizing the debt level in the very long run, in order to satisfy the inter-temporal budget constraint. It incorporates the projected path of the primary balance up to 2018. 12 Thus using staff’s baseline assumption that some fiscal consolidation will take place, the fiscal sustainability gap is estimated to be very small for Guatemala (1/4 percent of GDP), based on the assumptions that the long-run growth rate and interest rate are consistent with the projected average in the next 5 years (3.5 and 3.1 percent respectively) and that the long-run primary deficit is kept at the projected 2018 level (0.34 percent of GDP). However, if the actuarial deficit of the social security system were taken into account, the sustainability gap would be potentially larger.
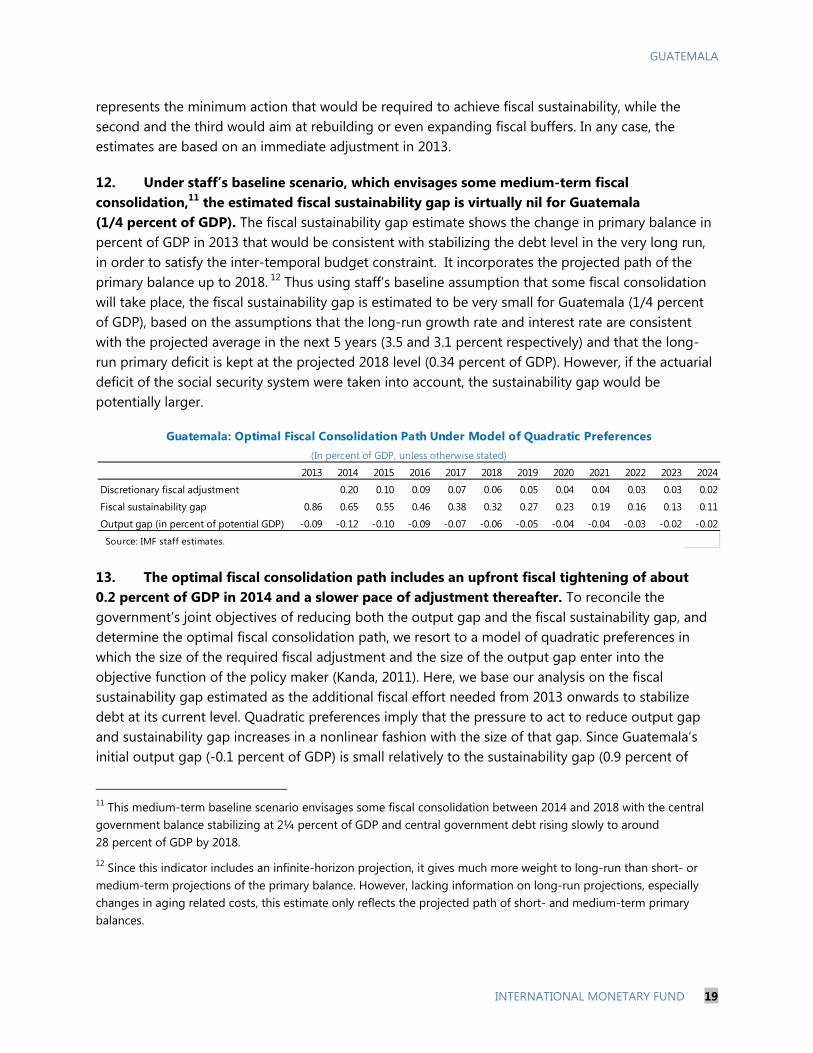
13. The optimal fiscal consolidation path includes an upfront fiscal tightening of about 0.2 percent of GDP in 2014 and a slower pace of adjustment thereafter. To reconcile the government’s joint objectives of reducing both the output gap and the fiscal sustainability gap, and determine the optimal fiscal consolidation path, we resort to a model of quadratic preferences in which the size of the required fiscal adjustment and the size of the output gap enter into the objective function of the policy maker (Kanda, 2011). Here, we base our analysis on the fiscal sustainability gap estimated as the additional fiscal effort needed from 2013 onwards to stabilize debt at its current level. Quadratic preferences imply that the pressure to act to reduce output gap and sustainability gap increases in a nonlinear fashion with the size of that gap. Since Guatemala’s initial output gap (-0.1 percent of GDP) is small relatively to the sustainability gap (0.9 percent of
11 This medium-term baseline scenario envisages some fiscal consolidation between 2014 and 2018 with the central government balance stabilizing at 2¼ percent of GDP and central government debt rising slowly to around 28 percent of GDP by 2018.
12 Since this indicator includes an infinite-horizon projection, it gives much more weight to long-run than short- or medium-term projections of the primary balance. However, lacking information on long-run projections, especially changes in aging related costs, this estimate only reflects the projected path of short- and medium-term primary balances.
2013 2014 2015 2016 2017 2018 2019 2020 2021 2022 2023 2024
Discretionary fiscal adjustment 0.20 0.10 0.09 0.07 0.06 0.05 0.04 0.04 0.03 0.03 0.02
Fiscal sustainability gap 0.86 0.65 0.55 0.46 0.38 0.32 0.27 0.23 0.19 0.16 0.13 0.11
Output gap (in percent of potential GDP) -0.09 -0.12 -0.10 -0.09 -0.07 -0.06 -0.05 -0.04 -0.04 -0.03 -0.02 -0.02
Source: IMF staff estimates.
(In percent of GDP, unless otherwise stated)
Guatemala: Optimal Fiscal Consolidation Path Under Model of Quadratic Preferences
GUATEMALA
20 INTERNATIONAL MONETARY FUND
GDP), we assume that the optimal fiscal tightening would be one that emphasizes a reduction in the sustainability gap for some initial increase in the output gap (the weight on the output gap equals 0.93 and on the fiscal gap 0.07). Under this scenario, the model suggests an optimal path with fiscal tightening of about 0.2 percent of GDP in 2014 and smaller adjustments in the following nine years. The output gap would widen to -0.12 percent of GDP in 2014 and declines steadily after that, and it is eliminated in 2033.13
13 For Guatemala, starting in year 2013, the initial sustainability gap is calculated at 0.9 percent of GDP (based on the difference between the debt-stabilizing primary balance and the current primary balance where the debt-to-GDP ratio is stabilized at the end-2012 level), while it is estimated that the (negative) output gap in 2012 was around 0.09 percent of GDP. The speed of self-correction of output gaps is calibrated to equal 0.5, implying that absent fiscal measures and ceteris paribus, an output gap of 0.09 percent of GDP is eliminated after ten years. The fiscal multiplier is taken to be 0.4, in line with the estimates provided by Estevão and Samake (2012). The real interest rate and real GDP growth rate are set at 3.13 percent and 3.48 percent respectively, consistent with the projected average for the next five years.
GUATEMALA
INTERNATIONAL MONETARY FUND 21
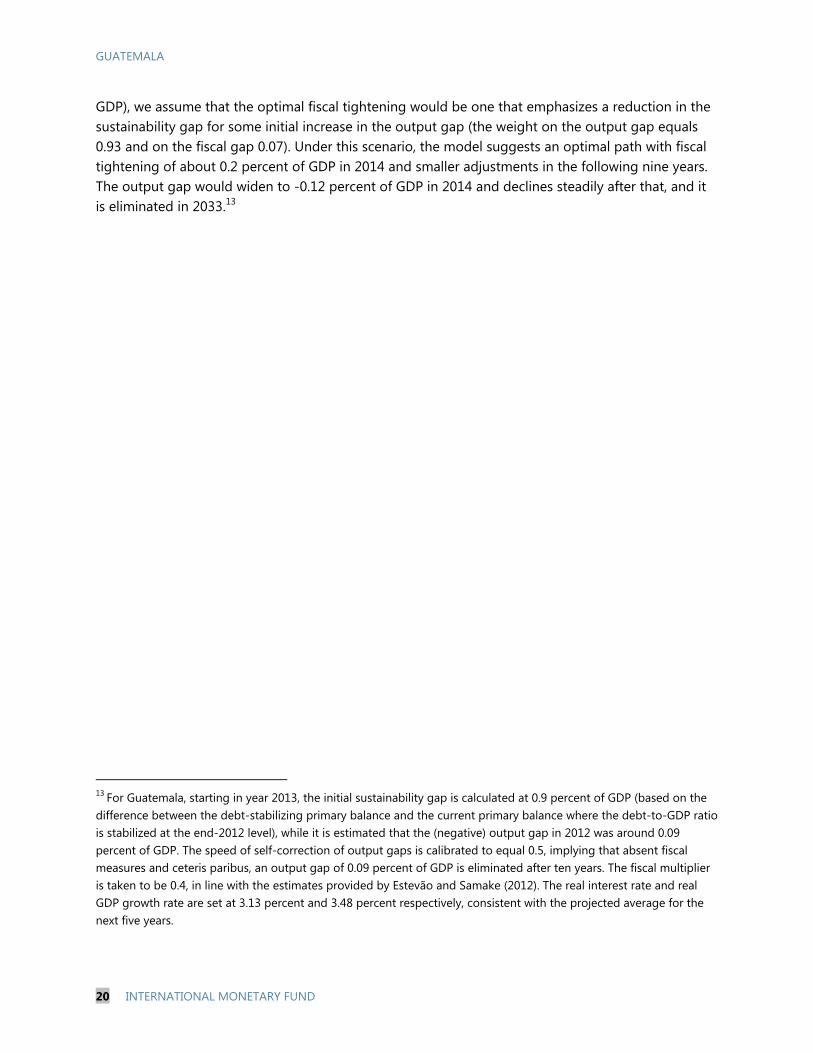
Guatemala: Long-Term Fiscal Sustainability, 2012-2042(Percent of GDP)
-1.0
-0.8
-0.6
-0.4
-0.2
0.0
0.2
0.4
2012 2017 2022 2027 2032 2037 2042
Baseline /1
Staff recommended path
Immediate adjustment /2
Primary balance
-3
-3
-2
-2
-1
-1
0
2012 2017 2022 2027 2032 2037 2042
Baseline /1
Staff recommended path
Immediate adjustment /2
Overall balance
20
22
24
26
28
30
32
34
36
38
2012 2017 2022 2027 2032 2037 2042
Baseline /1
Staff recommended path
Immediate adjustment /2
Central Government Debt
1/ This path is the baseline through 2018, with a constant primary balance thereafter.2/ Assumes an adjustment in 2014 which stabilizes the debt-to-GDP ratio. Source: Fund staff estimates.
GUATEMALA
22 INTERNATIONAL MONETARY FUND
C. Policy Implications
14. While continuing the fiscal consolidation is required to achieve long-term debt sustainability, the composition of adjustment is also important. Increasing public revenue is essential to support priority spending. Constrained by historically low tax revenue, Guatemala’s total fiscal expenditure is the lowest among CADPR countries and the lower-middle-income countries, which substantially restrict social spending that is necessary to support higher and inclusive growth.
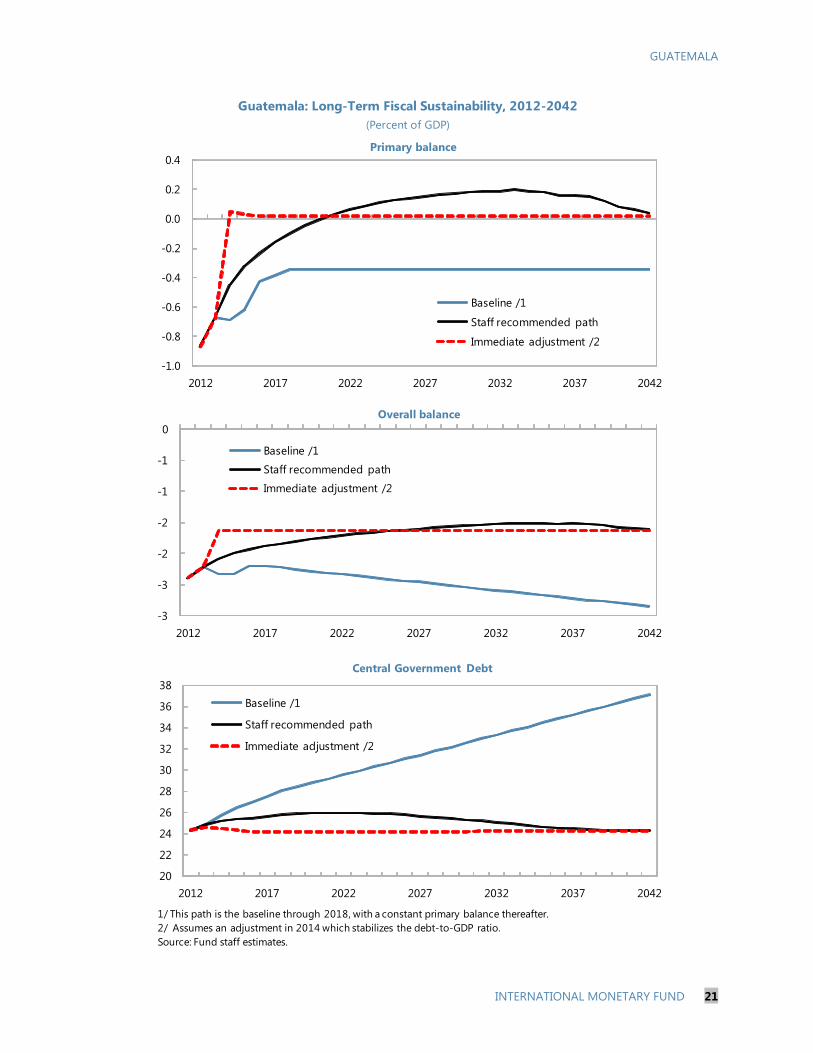
15. Guatemala has one of the lowest tax revenues (as percent of GDP) in the region and among lower-middle-income countries. Inability to collect tax revenue is a long-standing issue that limits the scope for counter-cyclical fiscal policies as well as efforts to address high infrastructure, social, and security needs. This fact is particularly relevant as the economy is heavily exposed to natural disasters and external shocks, and its levels of poverty and inequality are among the highest in the region and in the comparable income group. The low tax revenue also weighs on credit ratings and debt intolerance.14
16. As a result of the economic recovery and the tax reform passed in 2012, tax revenue is predicted to increase to 11.4 percent of GDP in 2013. This is still lower than the goals of the 1996 Peace Accords (13.2 percent of GDP). Political opposition to tax reforms, frequent recourse to temporary taxes and tax exemptions, and budgetary rigidities have lead to persistently low tax to GDP ratio. Based on the 2012 data, Guatemala’s tax “effort”—the ratio of actual revenues to potential—is the lowest in the region and among lower-middle-income peers.15 This reflects various structural shortcomings in revenue mobilization: low tax rates, a high level of tax exemptions and
14 For example, Guatemala and El Salvador have almost identical Institutional Investor’s Ratings (IIR), despite that Guatemala’s debt-to-GDP ratio is only half that of El Salvador, clearly indicating that the market perceives that significant structural issues affect adversely Guatemala’s levels of debt tolerance.
15 The tax effort is defined as the ratio of the actual revenue that a country collects to its tax capacity, which is calculated as the maximum tax revenue that a country can collect given its economic, social, institutional, and demographic characteristics (See Pessino and Fenochietto, 2010). The estimates have been recently updated to 2012.
0%
10%
20%
30%
40%
50%
60%
70%
80%
90%
Cost
a Ri
ca
Nic
arag
ua
Hon
dura
s
Pana
ma
El S
alva
dor
Dom
. Rep
Gua
tem
ala
Tax (in percent of GDP)Tax effort (percent)
CADPR: Tax Revenue and Tax Effort, 2012
Sources: World Economic Outlook and Fund staff estimates.
0
20
40
60
80
100
120Cô
te d
'lvoi
rePa
pua
New
G.
Mol
dova
Ukr
aine
Syria
n A.
R.Se
nega
lBo
livia
Mon
golia
Jord
anN
icar
agua
Hon
dura
sPa
ragu
aySr
i Lan
kaEg
ypt
Phili
ppin
esIn
done
sia
Cam
eroo
nAr
men
iaEl
Sal
vado
rIn
dia
Thai
land
Paki
stan
Chin
aG
uate
mal
a
Tax (in percent of GDP)Tax effort (percent)
Lower middle-income countries:Tax Revenue and Tax Effort, 2011
Sources: World Economic Outlook and Fund staff estimates.
GUATEMALA
INTERNATIONAL MONETARY FUND 23
incentive schemes, and weak tax administration and enforcement. The “revenue gap”—measured as the difference between the current level of tax collections and the level that would result from achieving the tax effort prevailing in comparator countries—is estimated to be about 7 percent of GDP.
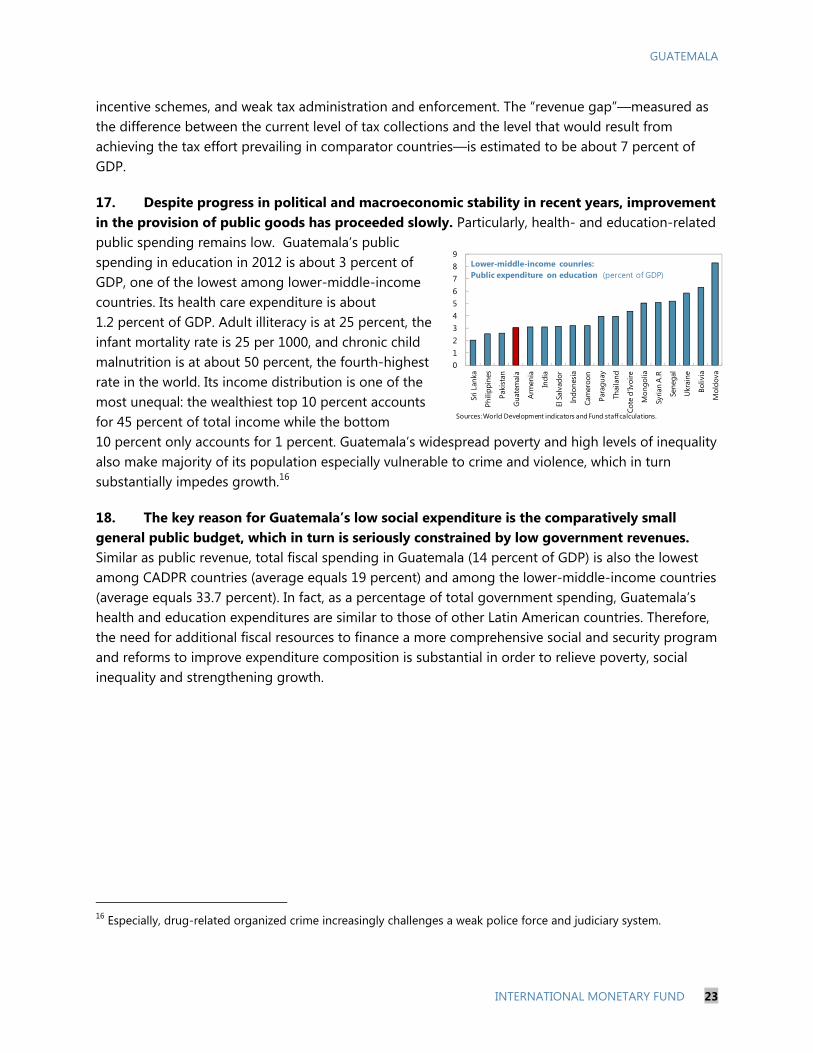
17. Despite progress in political and macroeconomic stability in recent years, improvement in the provision of public goods has proceeded slowly. Particularly, health- and education-related public spending remains low. Guatemala’s public spending in education in 2012 is about 3 percent of GDP, one of the lowest among lower-middle-income countries. Its health care expenditure is about 1.2 percent of GDP. Adult illiteracy is at 25 percent, the infant mortality rate is 25 per 1000, and chronic child malnutrition is at about 50 percent, the fourth-highest rate in the world. Its income distribution is one of the most unequal: the wealthiest top 10 percent accounts for 45 percent of total income while the bottom 10 percent only accounts for 1 percent. Guatemala’s widespread poverty and high levels of inequality also make majority of its population especially vulnerable to crime and violence, which in turn substantially impedes growth.16
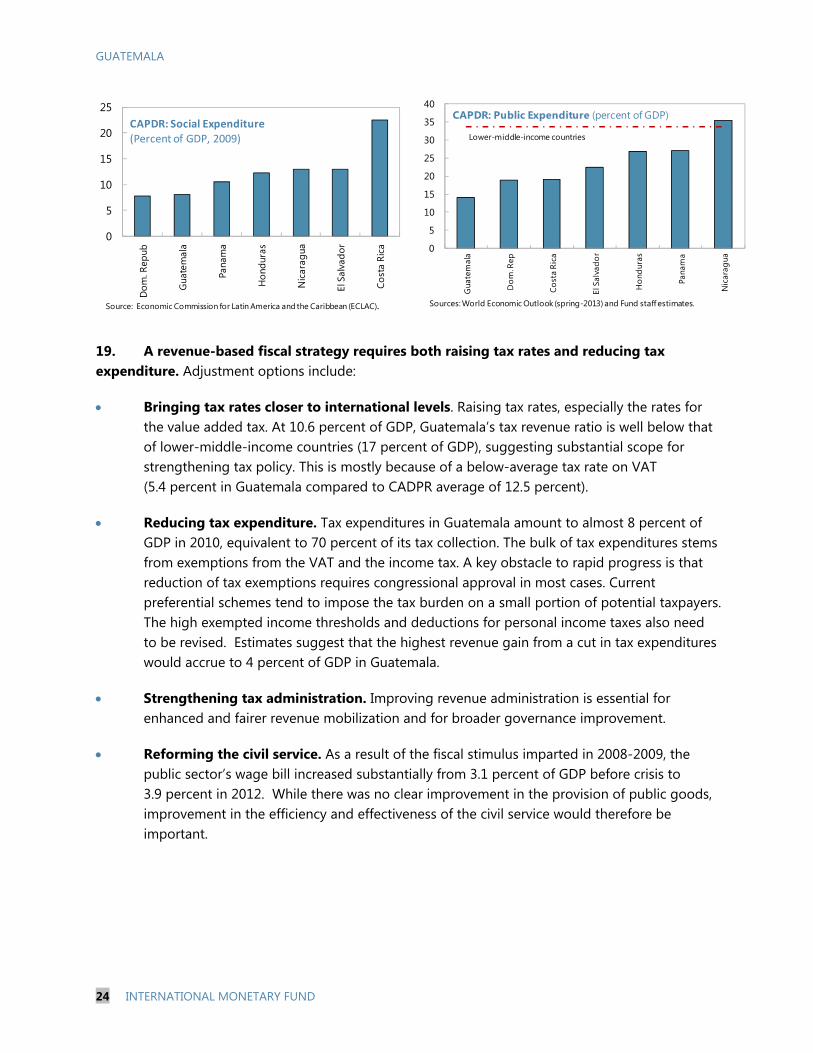
18. The key reason for Guatemala’s low social expenditure is the comparatively small general public budget, which in turn is seriously constrained by low government revenues. Similar as public revenue, total fiscal spending in Guatemala (14 percent of GDP) is also the lowest among CADPR countries (average equals 19 percent) and among the lower-middle-income countries (average equals 33.7 percent). In fact, as a percentage of total government spending, Guatemala’s health and education expenditures are similar to those of other Latin American countries. Therefore, the need for additional fiscal resources to finance a more comprehensive social and security program and reforms to improve expenditure composition is substantial in order to relieve poverty, social inequality and strengthening growth.
16 Especially, drug-related organized crime increasingly challenges a weak police force and judiciary system.
0123456789
Sri L
anka
Phili
ppin
es
Paki
stan
Gua
tem
ala
Arm
enia
Indi
a
El S
alva
dor
Indo
nesi
a
Cam
eroo
n
Para
guay
Thai
land
Cote
d'Iv
oire
Mon
golia
Syria
n A
.R
Sene
gal
Ukr
aine
Boliv
ia
Mol
dova
Lower-middle-income counries:Public expenditure on education (percent of GDP)
Sources: World Development indicators and Fund staff calculations.
GUATEMALA
24 INTERNATIONAL MONETARY FUND
19. A revenue-based fiscal strategy requires both raising tax rates and reducing tax expenditure. Adjustment options include:
Bringing tax rates closer to international levels. Raising tax rates, especially the rates for the value added tax. At 10.6 percent of GDP, Guatemala’s tax revenue ratio is well below that of lower-middle-income countries (17 percent of GDP), suggesting substantial scope for strengthening tax policy. This is mostly because of a below-average tax rate on VAT (5.4 percent in Guatemala compared to CADPR average of 12.5 percent).
Reducing tax expenditure. Tax expenditures in Guatemala amount to almost 8 percent of GDP in 2010, equivalent to 70 percent of its tax collection. The bulk of tax expenditures stems from exemptions from the VAT and the income tax. A key obstacle to rapid progress is that reduction of tax exemptions requires congressional approval in most cases. Current preferential schemes tend to impose the tax burden on a small portion of potential taxpayers. The high exempted income thresholds and deductions for personal income taxes also need to be revised. Estimates suggest that the highest revenue gain from a cut in tax expenditures would accrue to 4 percent of GDP in Guatemala.
Strengthening tax administration. Improving revenue administration is essential for enhanced and fairer revenue mobilization and for broader governance improvement.
Reforming the civil service. As a result of the fiscal stimulus imparted in 2008-2009, the public sector’s wage bill increased substantially from 3.1 percent of GDP before crisis to 3.9 percent in 2012. While there was no clear improvement in the provision of public goods, improvement in the efficiency and effectiveness of the civil service would therefore be important.
0
5
10
15
20
25
Dom
. Rep
ub
Gua
tem
ala
Pana
ma
Hon
dura
s
Nic
arag
ua
El S
alva
dor
Cost
a Ri
ca
CAPDR: Social Expenditure
(Percent of GDP, 2009)
Source: Economic Commission for Latin America and the Caribbean (ECLAC).
0
5
10
15
20
25
30
35
40
Gua
tem
ala
Dom
. Rep
Cost
a Ri
ca
El S
alva
dor
Hon
dura
s
Pana
ma
Nic
arag
ua
CAPDR: Public Expenditure (percent of GDP)
Lower-middle-income countries
Sources: World Economic Outlook (spring-2013) and Fund staff estimates.
GUATEMALA
INTERNATIONAL MONETARY FUND 25
References
Cabral, Rodrigo, Leandro Brufman, Guilherme Pedras and Gabriel Presciuttini, 2012, “Guatemala: Developing a Medium-Term Debt Management Strategy”, IMF-World Bank Working Paper.
Estevão, Marcello, and Issouf Samake, 2012, “Fiscal Multipliers in Central America,” IMF Working Paper.
Garza, Mario, Pablo Morra and Dominique Simard, 2012, “The Fiscal Position: Prospects and Options for Adjustment,” Central America, Panama and the Dominican Republic, Challenges Following the 2008-09 Global Crisis, Washington: International Monetary Fund.
Gerard, Jiri Jonas, Tidiane Kinda, Anna Shabunina, and Anke Weber, 2012, “A Toolkit to Assessing Fiscal Vulnerabilities and Risks in Advanced Economies,” IMF Working Paper 12/11, Washington: International Monetary Fund.
Kanda, Daniel, 2011, “Modeling Optimal Fiscal Consolidation Paths in a Selection of European Countries,” IMF Working Paper 11/164, Washington: International Monetary Fund.
Pession, Carola, Ricardo Fenochietto, 2010, “Determining Countries’ Tax Effort,” Revista de Economía Pública, 195: 65-87.
Schaechter, Andrea, C. Emre Alper, Elif Arbatli, Carlos Caceres, Giovanni Callegari, Marc
Gerard, Jiri Jonas, Tidiane Kinda, Anna Shabunina, and Anke Weber, 2012, “A Toolkit to Assessing Fiscal Vulnerabilities and Risks in Advanced Economies,” IMF.
GUATEMALA
26 INTERNATIONAL MONETARY FUND
ANALYTICAL NOTE IV. BALANCE SHEETS1
This note presents a balance sheet analysis of the Guatemalan economy with a focus on external positions, and currency and maturity mismatches. The study finds that financial sector is significantly vulnerable to foreign currency and liquidity risks, while the nonfinancial private sector faces substantial currency mismatches that have grown moderately in recent years. Risks to the public sector are more muted.
A. The Analytical Framework and Data Sources
1. The Balance Sheet Analysis (BSA) was developed as a useful framework to help better understand the financial crises of the late 1990s and early 2000s. It was proposed by Allen et al. (2002) and has been applied to many emerging-market countries. The BSA studies the stocks of financial assets and liabilities and analyses the maturity and currency mismatches at the aggregate economy level and at each economic sector. It can highlight a country’s vulnerabilities to liquidity or solvency problems and reveal potential spillovers across sectors that can transmit the impact of economic shocks.
2. The main instrument for this analysis is the balance sheet matrix. It typically depicts five sectors: (i) the central bank; (ii) the non-financial public sector which includes the central government, state and local governments, and public non-financial firms; (iii) the financial sector including other depository corporations and other financial firms (nonbanks); (iv) the non-financial private sector which includes non financial corporations and other domestic resident sector (largely households); and (v) the rest of the world or nonresidents. Within each sector, assets and liabilities are decomposed into foreign currency or domestic currency and some estimates can be made of maturity structure. The matrix shows the inter-sectoral claims and liabilities between each domestic sector and versus nonresidents (see Appendix for the basic structure of the matrix).
3. There has been progress with data compilation that facilitates the application of the BSA for surveillance purposes to Guatemala, though some data gaps persist. The Statistics Department of the IMF compiles balance sheet matrices for many countries, including Guatemala, using the Standardized Report forms (SRFs) that cover financial sector balance sheets. The other data sources used to fill in the rest of the matrix were public debt data, external debt data, and the International Investment Position (IIP) which covers external assets and liabilities of all sectors of the economy. Nonetheless, data gaps remain, particularly for the nonfinancial private sector. In addition, for Guatemala, coverage of the nonfinancial public sector is limited by a lack of fiscal data on state and local governments. Coverage of the financial sector has improved as the SRFs cover most other depository corporations, including the onshore and offshore banking systems and cooperatives, but other financial corporations are not yet covered by the SRFs.
1 Prepared by Stephanie Medina Cas.

GUATEMALA
INTERNATIONAL MONETARY FUND 27
4. Gross central government liabilities in the BSA matrix for 2012 exceed those reported by the Ministry of Finance by about [6.5] percent of GDP. This is mostly due the inclusion of accumulated losses of the central bank (treated as an asset on its balance sheet and a claim on the government) which have not been recognized by the government and are not treated as official public sector debt.
B. Balance Sheet Analysis
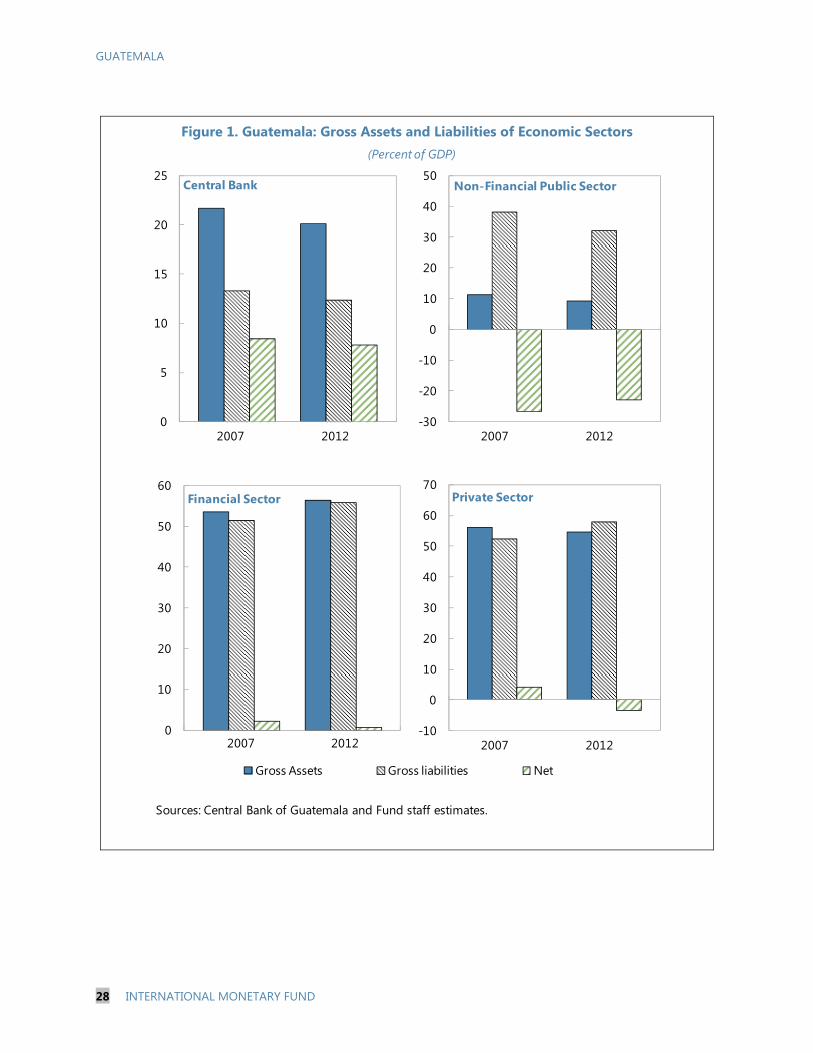
5. The overall balance sheet positions of economic sectors have changed only moderately since 2007 (Figure 1). 2 The central bank remains an overall net creditor, though its creditor position has declined somewhat. The non-financial public sector’s net debtor position has declined due to a modest fall in liabilities. The financial sector’s net creditor position has shrunk moderately to near balance. However, the private sector has turned from being a small net creditor to a modest net debtor.
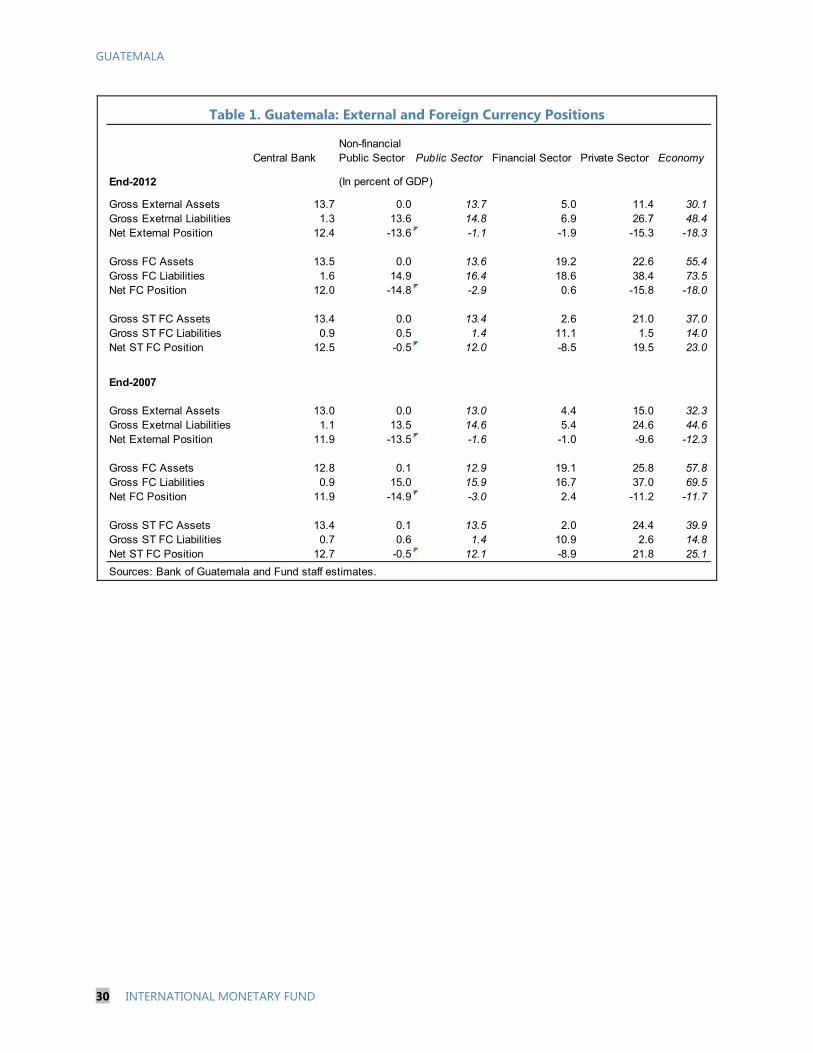
6. The aggregate economy is vulnerable to currency risk. Guatemala has a net external debtor position of about 18 percent of GDP in 2012, largely reflecting the net external debtor positions of the nonfinancial public and nonfinancial private sectors (Table 1). This gap has widened by about 6 percentage points of GDP since 2007 largely due to the nonfinancial private sector. Guatemala also has a net foreign currency debtor position of about the same magnitude in 2012.
7. The total public sector is subject to limited foreign currency and rollover risk. It has a net foreign currency debtor position of just under 3 percent of GDP in 2012, little changed since 2007, as the nonfinancial public sector’s net foreign currency liabilities are moderately higher than the central bank’s net foreign currency assets. The central bank is a net external and foreign currency creditor of around 12 percent of GDP in 2007 and 2012 due to its holding of foreign currency reserve assets. These liquid reserves are also short-term assets, giving the central bank and the total public sector a positive net short-term foreign currency position. The nonfinancial public sector is a net external debtor of about 14 percent of GDP in 2007 and 2012, and its net foreign currency debtor position is a bit worse due to domestic debt in foreign currency. Its short-term foreign currency liabilities are largely amortizing public external debt.
8. The financial sector is exposed to a significant amount of exchange rate and liquidity risk. Though the financial system has a modest net foreign currency creditor position of 0.6 percent of GDP in 2012, it has a significant amount of short-term foreign currency liabilities consisting mostly of foreign currency deposits of residents. This implies it has a net short-term foreign currency debtor position of almost 9 percent of GDP in 2012, though this has been fairly stable since 2007. The financial sector also has a net external debtor position of nearly 2 percent of GDP in 2012. Most of these financial external liabilities comprise foreign currency loans owed to nonresidents.
2 A comparison is made with 2007 since this predates the global financial crisis.
GUATEMALA
28 INTERNATIONAL MONETARY FUND
Figure 1. Guatemala: Gross Assets and Liabilities of Economic Sectors
(Percent of GDP)
Sources: Central Bank of Guatemala and Fund staff estimates.
0
5
10
15
20
25Central Bank
2007 2012-30
-20
-10
0
10
20
30
40
50Non-Financial Public Sector
2007 2012
0
10
20
30
40
50
60Financial Sector
Gross Assets Gross liabilities Net
2007 2012-10
0
10
20
30
40
50
60
70Private Sector
2007 2012

GUATEMALA
INTERNATIONAL MONETARY FUND 29
0
10
20
30
40
Central Bank Non-Fin. Public Sector
Fin. Sector Private Sector
Short-term FX liablities
Long-term FX liabilities
Sources: Central Bank of Guatemala and Fund staff estimates.
Maturity Breakdown(Percent of GDP, 2012)
9. The non-financial private sector is vulnerable to significant currency risk. It displays a net external debtor position of about 15 percent of GDP in 2012, about 4 percentage points of GDP wider than in 2007. Nonetheless, about two-thirds of external liabilities are foreign direct investment, considered less risky than debt, while the rest are largely loans owed to nonresidents. The private sector has foreign currency liabilities composed of loans owed to resident banks giving it a net foreign currency debtor position of almost 16 percent of GDP in 2012. A significant amount of short-term foreign currency assets in the form of bank deposits, and a low amount of short-term foreign currency loans implies the private sector has a short-term foreign currency creditor position of almost 20 percent of GDP in 2012. However, this maturity breakdown is based on an original maturity and does not reflect amortizing loans.3
3 This information is based on external debt data and the IIP which assess maturity only on an original maturity basis, and not on a residual basis.
GUATEMALA
30 INTERNATIONAL MONETARY FUND
Table 1. Guatemala: External and Foreign Currency Positions
Central BankNon-financial Public Sector Public Sector Financial Sector Private Sector Economy
End-2012 (In percent of GDP)
Gross External Assets 13.7 0.0 13.7 5.0 11.4 30.1Gross Exetrnal Liabilities 1.3 13.6 14.8 6.9 26.7 48.4Net External Position 12.4 -13.6 -1.1 -1.9 -15.3 -18.3
Gross FC Assets 13.5 0.0 13.6 19.2 22.6 55.4Gross FC Liabilities 1.6 14.9 16.4 18.6 38.4 73.5Net FC Position 12.0 -14.8 -2.9 0.6 -15.8 -18.0
Gross ST FC Assets 13.4 0.0 13.4 2.6 21.0 37.0Gross ST FC Liabilities 0.9 0.5 1.4 11.1 1.5 14.0Net ST FC Position 12.5 -0.5 12.0 -8.5 19.5 23.0
End-2007
Gross External Assets 13.0 0.0 13.0 4.4 15.0 32.3Gross Exetrnal Liabilities 1.1 13.5 14.6 5.4 24.6 44.6Net External Position 11.9 -13.5 -1.6 -1.0 -9.6 -12.3
Gross FC Assets 12.8 0.1 12.9 19.1 25.8 57.8Gross FC Liabilities 0.9 15.0 15.9 16.7 37.0 69.5Net FC Position 11.9 -14.9 -3.0 2.4 -11.2 -11.7
Gross ST FC Assets 13.4 0.1 13.5 2.0 24.4 39.9Gross ST FC Liabilities 0.7 0.6 1.4 10.9 2.6 14.8Net ST FC Position 12.7 -0.5 12.1 -8.9 21.8 25.1
Sources: Bank of Guatemala and Fund staff estimates.
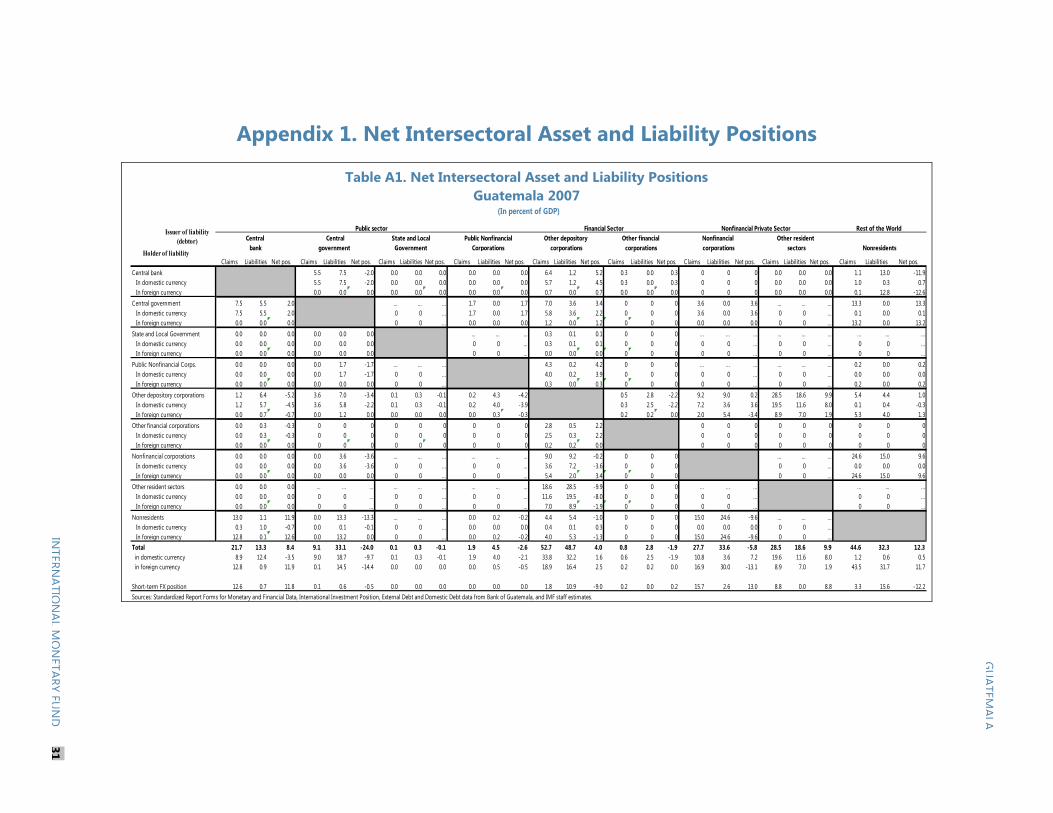
Appendix 1. Net Intersectoral Asset and Liability Positions
Table A1. Net Intersectoral Asset and Liability Positions Guatemala 2007
Financial Sector Nonfinancial Private Sector Rest of the World Central Central Other depository Other financial Nonfinancial Other resident
bank government corporations corporations corporations sectors Nonresidents
Claims Liabilities Net pos. Claims Liabilities Net pos. Claims Liabilities Net pos. Claims Liabilities Net pos. Claims Liabilities Net pos. Claims Liabilities Net pos. Claims Liabilities Net pos. Claims Liabilities Net pos. Claims Liabilities Net pos.Central bank 5.5 7.5 -2.0 0.0 0.0 0.0 0.0 0.0 0.0 6.4 1.2 5.2 0.3 0.0 0.3 0 0 0 0.0 0.0 0.0 1.1 13.0 -11.9 In domestic currency 5.5 7.5 -2.0 0.0 0.0 0.0 0.0 0.0 0.0 5.7 1.2 4.5 0.3 0.0 0.3 0 0 0 0.0 0.0 0.0 1.0 0.3 0.7 In foreign currency 0.0 0.0 0.0 0.0 0.0 0.0 0.0 0.0 0.0 0.7 0.0 0.7 0.0 0.0 0.0 0 0 0 0.0 0.0 0.0 0.1 12.8 -12.6Central government 7.5 5.5 2.0 ... ... ... 1.7 0.0 1.7 7.0 3.6 3.4 0 0 0 3.6 0.0 3.6 ... ... ... 13.3 0.0 13.3 In domestic currency 7.5 5.5 2.0 0 0 ... 1.7 0.0 1.7 5.8 3.6 2.2 0 0 0 3.6 0.0 3.6 0 0 ... 0.1 0.0 0.1 In foreign currency 0.0 0.0 0.0 0 0 ... 0.0 0.0 0.0 1.2 0.0 1.2 0 0 0 0.0 0.0 0.0 0 0 ... 13.2 0.0 13.2State and Local Government 0.0 0.0 0.0 0.0 0.0 0.0 ... ... ... 0.3 0.1 0.1 0 0 0 ... ... ... ... ... ... ... ... ... In domestic currency 0.0 0.0 0.0 0.0 0.0 0.0 0 0 ... 0.3 0.1 0.1 0 0 0 0 0 ... 0 0 ... 0 0 ... In foreign currency 0.0 0.0 0.0 0.0 0.0 0.0 0 0 ... 0.0 0.0 0.0 0 0 0 0 0 ... 0 0 ... 0 0 ...Public Nonfinancial Corps. 0.0 0.0 0.0 0.0 1.7 -1.7 ... ... ... 4.3 0.2 4.2 0 0 0 ... ... ... ... ... ... 0.2 0.0 0.2 In domestic currency 0.0 0.0 0.0 0.0 1.7 -1.7 0 0 ... 4.0 0.2 3.9 0 0 0 0 0 ... 0 0 ... 0.0 0.0 0.0 In foreign currency 0.0 0.0 0.0 0.0 0.0 0.0 0 0 ... 0.3 0.0 0.3 0 0 0 0 0 ... 0 0 ... 0.2 0.0 0.2Other depository corporations 1.2 6.4 -5.2 3.6 7.0 -3.4 0.1 0.3 -0.1 0.2 4.3 -4.2 0.5 2.8 -2.2 9.2 9.0 0.2 28.5 18.6 9.9 5.4 4.4 1.0 In domestic currency 1.2 5.7 -4.5 3.6 5.8 -2.2 0.1 0.3 -0.1 0.2 4.0 -3.9 0.3 2.5 -2.2 7.2 3.6 3.6 19.5 11.6 8.0 0.1 0.4 -0.3 In foreign currency 0.0 0.7 -0.7 0.0 1.2 0.0 0.0 0.0 0.0 0.0 0.3 -0.3 0.2 0.2 0.0 2.0 5.4 -3.4 8.9 7.0 1.9 5.3 4.0 1.3Other financial corporations 0.0 0.3 -0.3 0 0 0 0 0 0 0 0 0 2.8 0.5 2.2 0 0 0 0 0 0 0 0 0 In domestic currency 0.0 0.3 -0.3 0 0 0 0 0 0 0 0 0 2.5 0.3 2.2 0 0 0 0 0 0 0 0 0 In foreign currency 0.0 0.0 0.0 0 0 0 0 0 0 0 0 0 0.2 0.2 0.0 0 0 0 0 0 0 0 0 0Nonfinancial corporations 0.0 0.0 0.0 0.0 3.6 -3.6 ... ... ... ... ... ... 9.0 9.2 -0.2 0 0 0 ... ... ... 24.6 15.0 9.6 In domestic currency 0.0 0.0 0.0 0.0 3.6 -3.6 0 0 ... 0 0 ... 3.6 7.2 -3.6 0 0 0 0 0 ... 0.0 0.0 0.0 In foreign currency 0.0 0.0 0.0 0.0 0.0 0.0 0 0 ... 0 0 ... 5.4 2.0 3.4 0 0 0 0 0 ... 24.6 15.0 9.6Other resident sectors 0.0 0.0 0.0 ... ... ... ... ... ... ... ... ... 18.6 28.5 -9.9 0 0 0 ... ... ... ... ... ... In domestic currency 0.0 0.0 0.0 0 0 ... 0 0 ... 0 0 ... 11.6 19.5 -8.0 0 0 0 0 0 ... 0 0 ... In foreign currency 0.0 0.0 0.0 0 0 ... 0 0 ... 0 0 ... 7.0 8.9 -1.9 0 0 0 0 0 ... 0 0 ...Nonresidents 13.0 1.1 11.9 0.0 13.3 -13.3 ... ... ... 0.0 0.2 -0.2 4.4 5.4 -1.0 0 0 0 15.0 24.6 -9.6 ... ... ... In domestic currency 0.3 1.0 -0.7 0.0 0.1 -0.1 0 0 ... 0.0 0.0 0.0 0.4 0.1 0.3 0 0 0 0.0 0.0 0.0 0 0 ... In foreign currency 12.8 0.1 12.6 0.0 13.2 0.0 0 0 ... 0.0 0.2 -0.2 4.0 5.3 -1.3 0 0 0 15.0 24.6 -9.6 0 0 ...Total 21.7 13.3 8.4 9.1 33.1 -24.0 0.1 0.3 -0.1 1.9 4.5 -2.6 52.7 48.7 4.0 0.8 2.8 -1.9 27.7 33.6 -5.8 28.5 18.6 9.9 44.6 32.3 12.3 in domestic currency 8.9 12.4 -3.5 9.0 18.7 -9.7 0.1 0.3 -0.1 1.9 4.0 -2.1 33.8 32.2 1.6 0.6 2.5 -1.9 10.8 3.6 7.2 19.6 11.6 8.0 1.2 0.6 0.5 in foreign currency 12.8 0.9 11.9 0.1 14.5 -14.4 0.0 0.0 0.0 0.0 0.5 -0.5 18.9 16.4 2.5 0.2 0.2 0.0 16.9 30.0 -13.1 8.9 7.0 1.9 43.5 31.7 11.7
Short-term FX position 12.6 0.7 11.8 0.1 0.6 -0.5 0.0 0.0 0.0 0.0 0.0 0.0 1.8 10.9 -9.0 0.2 0.0 0.2 15.7 2.6 13.0 8.8 0.0 8.8 3.3 15.6 -12.2Sources: Standardized Report Forms for Monetary and Financial Data, International Investment Position, External Debt and Domestic Debt data from Bank of Guatemala, and IMF staff estimates.
Government Corporations
(In percent of GDP)
Public sector State and Local Public Nonfinancial
Holder of liability
Issuer of liability (debtor)
GU
ATEMALA
INTERN
ATION
ALM
ON
ETARYFU
ND
31
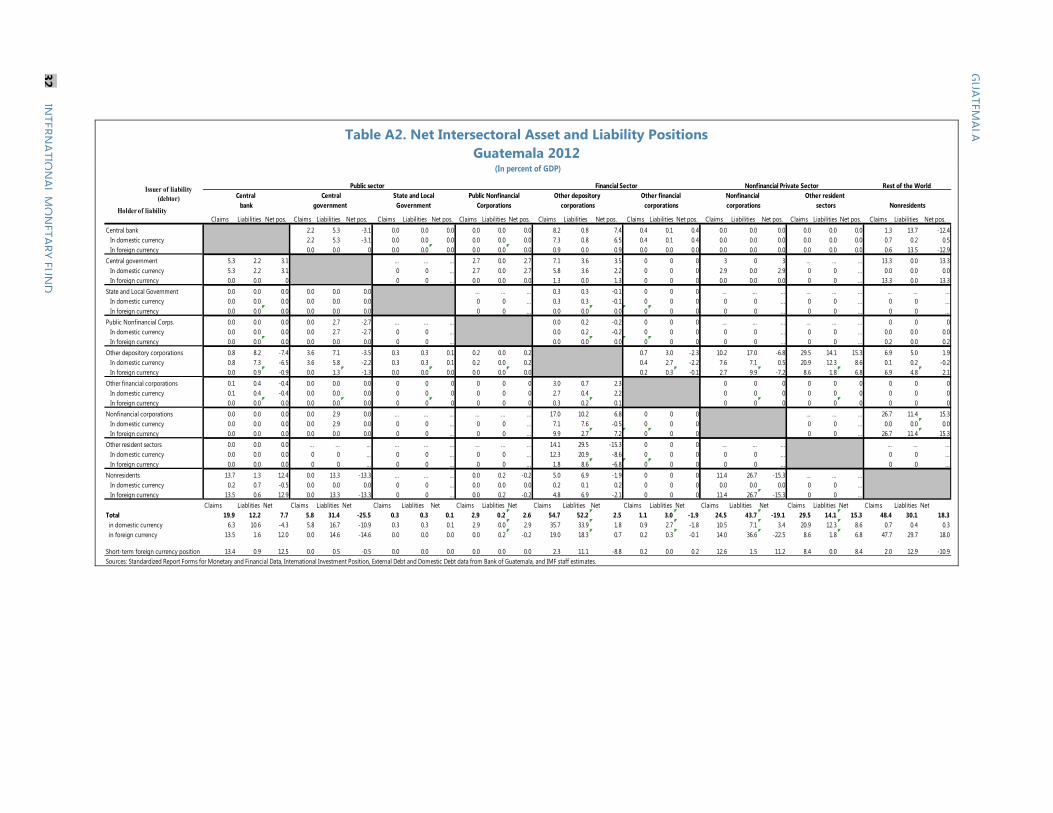
Table A2. Net Intersectoral Asset and Liability Positions Guatemala 2012
Financial Sector Nonfinancial Private Sector Rest of the World Central Central Other depository Other financial Nonfinancial Other resident
bank government corporations corporations corporations sectors Nonresidents
Claims Liabilities Net pos. Claims Liabilities Net pos. Claims Liabilities Net pos. Claims Liabilities Net pos. Claims Liabilities Net pos. Claims Liabilities Net pos. Claims Liabilities Net pos. Claims Liabilities Net pos. Claims Liabilities Net pos.Central bank 2.2 5.3 -3.1 0.0 0.0 0.0 0.0 0.0 0.0 8.2 0.8 7.4 0.4 0.1 0.4 0.0 0.0 0.0 0.0 0.0 0.0 1.3 13.7 -12.4 In domestic currency 2.2 5.3 -3.1 0.0 0.0 0.0 0.0 0.0 0.0 7.3 0.8 6.5 0.4 0.1 0.4 0.0 0.0 0.0 0.0 0.0 0.0 0.7 0.2 0.5 In foreign currency 0.0 0.0 0 0.0 0.0 0.0 0.0 0.0 0.0 0.9 0.0 0.9 0.0 0.0 0.0 0.0 0.0 0.0 0.0 0.0 0.0 0.6 13.5 -12.9Central government 5.3 2.2 3.1 ... ... ... 2.7 0.0 2.7 7.1 3.6 3.5 0 0 0 3 0 3 ... ... ... 13.3 0.0 13.3 In domestic currency 5.3 2.2 3.1 0 0 ... 2.7 0.0 2.7 5.8 3.6 2.2 0 0 0 2.9 0.0 2.9 0 0 ... 0.0 0.0 0.0 In foreign currency 0.0 0.0 0 0 0 ... 0.0 0.0 0.0 1.3 0.0 1.3 0 0 0 0.0 0.0 0.0 0 0 ... 13.3 0.0 13.3State and Local Government 0.0 0.0 0.0 0.0 0.0 0.0 ... ... ... 0.3 0.3 -0.1 0 0 0 ... ... ... ... ... ... ... ... ... In domestic currency 0.0 0.0 0.0 0.0 0.0 0.0 0 0 ... 0.3 0.3 -0.1 0 0 0 0 0 ... 0 0 ... 0 0 ... In foreign currency 0.0 0.0 0.0 0.0 0.0 0.0 0 0 ... 0.0 0.0 0.0 0 0 0 0 0 ... 0 0 ... 0 0 ...Public Nonfinancial Corps. 0.0 0.0 0.0 0.0 2.7 -2.7 ... ... ... 0.0 0.2 -0.2 0 0 0 ... ... ... ... ... ... 0 0 0 In domestic currency 0.0 0.0 0.0 0.0 2.7 -2.7 0 0 ... 0.0 0.2 -0.2 0 0 0 0 0 ... 0 0 ... 0.0 0.0 0.0 In foreign currency 0.0 0.0 0.0 0.0 0.0 0.0 0 0 ... 0.0 0.0 0.0 0 0 0 0 0 ... 0 0 ... 0.2 0.0 0.2Other depository corporations 0.8 8.2 -7.4 3.6 7.1 -3.5 0.3 0.3 0.1 0.2 0.0 0.2 0.7 3.0 -2.3 10.2 17.0 -6.8 29.5 14.1 15.3 6.9 5.0 1.9 In domestic currency 0.8 7.3 -6.5 3.6 5.8 -2.2 0.3 0.3 0.1 0.2 0.0 0.2 0.4 2.7 -2.2 7.6 7.1 0.5 20.9 12.3 8.6 0.1 0.2 -0.2 In foreign currency 0.0 0.9 -0.9 0.0 1.3 -1.3 0.0 0.0 0.0 0.0 0.0 0.0 0.2 0.3 -0.1 2.7 9.9 -7.2 8.6 1.8 6.8 6.9 4.8 2.1Other financial corporations 0.1 0.4 -0.4 0.0 0.0 0.0 0 0 0 0 0 0 3.0 0.7 2.3 0 0 0 0 0 0 0 0 0 In domestic currency 0.1 0.4 -0.4 0.0 0.0 0.0 0 0 0 0 0 0 2.7 0.4 2.2 0 0 0 0 0 0 0 0 0 In foreign currency 0.0 0.0 0.0 0.0 0.0 0.0 0 0 0 0 0 0 0.3 0.2 0.1 0 0 0 0 0 0 0 0 0Nonfinancial corporations 0.0 0.0 0.0 0.0 2.9 0.0 ... ... ... ... ... ... 17.0 10.2 6.8 0 0 0 ... ... ... 26.7 11.4 15.3 In domestic currency 0.0 0.0 0.0 0.0 2.9 0.0 0 0 ... 0 0 ... 7.1 7.6 -0.5 0 0 0 0 0 ... 0.0 0.0 0.0 In foreign currency 0.0 0.0 0.0 0.0 0.0 0.0 0 0 ... 0 0 ... 9.9 2.7 7.2 0 0 0 0 0 ... 26.7 11.4 15.3Other resident sectors 0.0 0.0 0.0 ... ... ... ... ... ... ... ... ... 14.1 29.5 -15.3 0 0 0 ... ... ... ... ... ... In domestic currency 0.0 0.0 0.0 0 0 ... 0 0 ... 0 0 ... 12.3 20.9 -8.6 0 0 0 0 0 ... 0 0 ... In foreign currency 0.0 0.0 0.0 0 0 ... 0 0 ... 0 0 ... 1.8 8.6 -6.8 0 0 0 0 0 ... 0 0 ...Nonresidents 13.7 1.3 12.4 0.0 13.3 -13.3 ... ... ... 0.0 0.2 -0.2 5.0 6.9 -1.9 0 0 0 11.4 26.7 -15.3 ... ... ... In domestic currency 0.2 0.7 -0.5 0.0 0.0 0.0 0 0 ... 0.0 0.0 0.0 0.2 0.1 0.2 0 0 0 0.0 0.0 0.0 0 0 ... In foreign currency 13.5 0.6 12.9 0.0 13.3 -13.3 0 0 ... 0.0 0.2 -0.2 4.8 6.9 -2.1 0 0 0 11.4 26.7 -15.3 0 0 ...
Claims Liablities Net Claims Liablities Net Claims Liablities Net Claims Liablities Net Claims Liablities Net Claims Liablities Net Claims Liablities Net Claims Liablities Net Claims Liablities NetTotal 19.9 12.2 7.7 5.8 31.4 -25.5 0.3 0.3 0.1 2.9 0.2 2.6 54.7 52.2 2.5 1.1 3.0 -1.9 24.5 43.7 -19.1 29.5 14.1 15.3 48.4 30.1 18.3 in domestic currency 6.3 10.6 -4.3 5.8 16.7 -10.9 0.3 0.3 0.1 2.9 0.0 2.9 35.7 33.9 1.8 0.9 2.7 -1.8 10.5 7.1 3.4 20.9 12.3 8.6 0.7 0.4 0.3 in foreign currency 13.5 1.6 12.0 0.0 14.6 -14.6 0.0 0.0 0.0 0.0 0.2 -0.2 19.0 18.3 0.7 0.2 0.3 -0.1 14.0 36.6 -22.5 8.6 1.8 6.8 47.7 29.7 18.0
Short-term foreign currency position 13.4 0.9 12.5 0.0 0.5 -0.5 0.0 0.0 0.0 0.0 0.0 0.0 2.3 11.1 -8.8 0.2 0.0 0.2 12.6 1.5 11.2 8.4 0.0 8.4 2.0 12.9 -10.9Sources: Standardized Report Forms for Monetary and Financial Data, International Investment Position, External Debt and Domestic Debt data from Bank of Guatemala, and IMF staff estimates.
Government Corporations
(In percent of GDP)
Public sector State and Local Public Nonfinancial
Holder of liability
Issuer of liability (debtor)
GU
ATEMALA
32IN
TERNATIO
NAL
MO
NETARY
FUN
D
GUATEMALA
INTERNATIONAL MONETARY FUND 33
References
Allen, Mark, Christoph Rosenberg, Christian Keller, Brad Setser and Nouriel Roubini, 2002, “A Balance Sheet Approach to Financial Crisis,” IMF Working Paper 02/210 (Washington: International Monetary Fund).
Amo-Yartey, Charles, 2012, “Barbados: Sectoral Balance Sheet Mismatches and Macroeconomic Vulnerabilities,” IMF Working Paper 12/31 (Washington: International Monetary Fund).
Imam, Patrick, and Rainer Kohler, 2010, “Balance Sheet Vulnerabilities of Mauritius During a Decade of Shocks,” IMF Working Paper 10/148 (Washington: International Monetary Fund).
Mathisen, Johan, and Anthony Pellechio, 2006, “Using the Balance Sheet Approach in Surveillance: Framework, Data Sources, and Data Availability,” IMF Working Paper 06/100 (Washington: International Monetary Fund).
Vladkova Hollar, Ivanna, 2007, “Guatemala: Balance Sheet Vulnerabilities” (unpublished; Washington: International Monetary Fund).
GUATEMALA
34 INTERNATIONAL MONETARY FUND
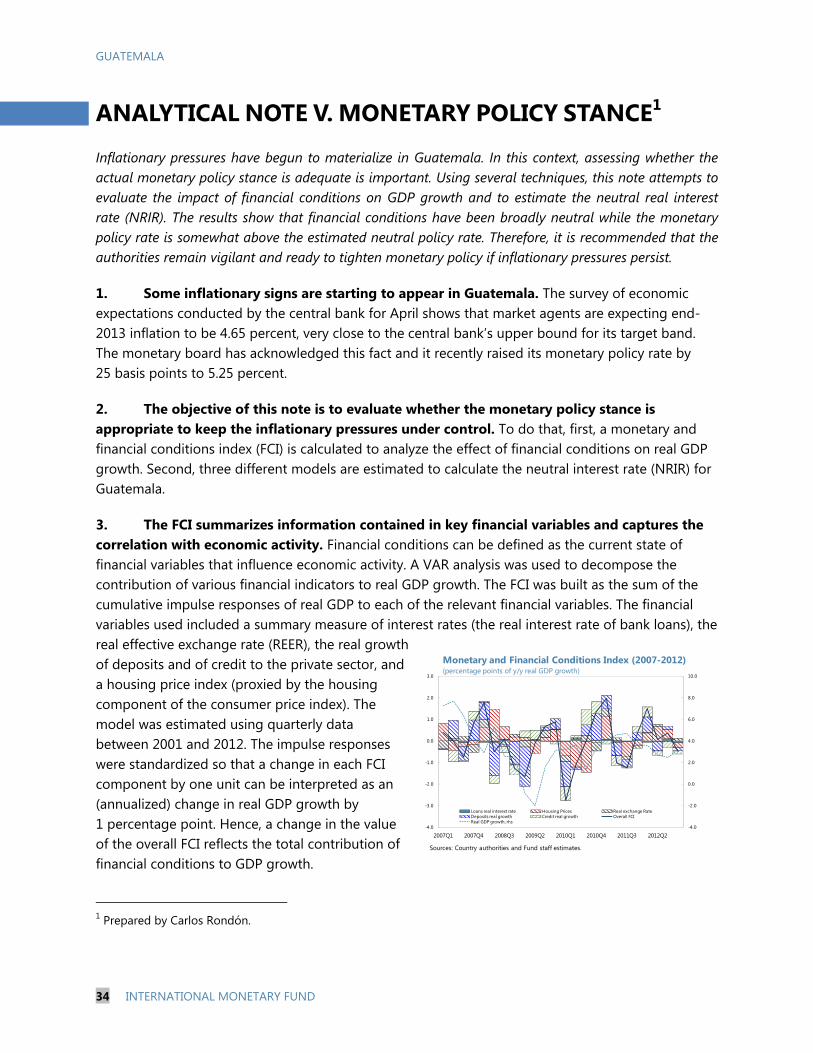
ANALYTICAL NOTE V. MONETARY POLICY STANCE1
Inflationary pressures have begun to materialize in Guatemala. In this context, assessing whether the actual monetary policy stance is adequate is important. Using several techniques, this note attempts to evaluate the impact of financial conditions on GDP growth and to estimate the neutral real interest rate (NRIR). The results show that financial conditions have been broadly neutral while the monetary policy rate is somewhat above the estimated neutral policy rate. Therefore, it is recommended that the authorities remain vigilant and ready to tighten monetary policy if inflationary pressures persist.
1. Some inflationary signs are starting to appear in Guatemala. The survey of economic expectations conducted by the central bank for April shows that market agents are expecting end-2013 inflation to be 4.65 percent, very close to the central bank’s upper bound for its target band. The monetary board has acknowledged this fact and it recently raised its monetary policy rate by 25 basis points to 5.25 percent.
2. The objective of this note is to evaluate whether the monetary policy stance is appropriate to keep the inflationary pressures under control. To do that, first, a monetary and financial conditions index (FCI) is calculated to analyze the effect of financial conditions on real GDP growth. Second, three different models are estimated to calculate the neutral interest rate (NRIR) for Guatemala.
3. The FCI summarizes information contained in key financial variables and captures the correlation with economic activity. Financial conditions can be defined as the current state of financial variables that influence economic activity. A VAR analysis was used to decompose the contribution of various financial indicators to real GDP growth. The FCI was built as the sum of the cumulative impulse responses of real GDP to each of the relevant financial variables. The financial variables used included a summary measure of interest rates (the real interest rate of bank loans), the real effective exchange rate (REER), the real growth of deposits and of credit to the private sector, and a housing price index (proxied by the housing component of the consumer price index). The model was estimated using quarterly data between 2001 and 2012. The impulse responses were standardized so that a change in each FCI component by one unit can be interpreted as an (annualized) change in real GDP growth by 1 percentage point. Hence, a change in the value of the overall FCI reflects the total contribution of financial conditions to GDP growth.
1 Prepared by Carlos Rondón.
-4.0
-2.0
0.0
2.0
4.0
6.0
8.0
10.0
-4.0
-3.0
-2.0
-1.0
0.0
1.0
2.0
3.0
2007Q1 2007Q4 2008Q3 2009Q2 2010Q1 2010Q4 2011Q3 2012Q2
Loans real interest rate Housing Prices Real exchange RateDeposits real growth Credit real growth Overall FCIReal GDP growth, rhs
Sources: Country authorities and Fund staff estimates.
Monetary and Financial Conditions Index (2007-2012)(percentage points of y/y real GDP growth)
GUATEMALA
INTERNATIONAL MONETARY FUND 35
4. The estimated FCI suggests that overall financial conditions were relatively neutral by the end of 2012.2 There were fairly loose or positive financial conditions in the first quarter which turned more negative or tighter in the rest of the year. Overall, the average contribution of the FCI for the whole of 2012 was positive and approximately 0.7 percent of GDP growth. According to the model, the main drivers of the FCI in 2012 were housing prices, credit, and the real growth of bank deposits. Changes in the real interest rate of loans contributed only marginally to the FCI. Relatively underdeveloped financial markets in Guatemala may limit the interpretation of the results of the model.
5. Another way to assess the appropriate monetary policy stance is to estimate the neutral real interest rate for Guatemala. In order to assess whether the actual policy will have an expansionary or contractionary effect, the NRIR is used to calculate the monetary policy stance, defined as the difference between the actual real policy rate and the estimated neutral real rate.
6. Following Magud and Tsounta (2012), a set of well known methodologies is used to estimate the NRIR. Three different methods are used to estimate the NRIR.3 The first one takes advantage of the uncovered interest parity condition. The second estimates the NRIR using a Taylor rule augmented for inflation expectations. The last method solves a general equilibrium model that focuses on aggregate demand-supply equilibrium. The data used corresponds to the period between 2001 and 2013.
7. According to the estimations, the NRIR is in a range between 1.4 and 2.4 percent. However, some caveats apply for each of these models and results should be interpreted with caution given the limitations of data and the incipient nature of financial markets in Guatemala. Shallow financial markets are a strong constraint for accuracy especially for dynamic general equilibrium models. With this caveat in mind, the main results can be summarized as follows (Table 1).
The uncovered interest parity condition (UIPC) estimates the NRIR for Guatemala as 1.4 percentage points. This value assumes an implicit nominal depreciation of 1.6 percent in 2013. Using expected inflation for 2013 from the April survey of economic expectations, the neutral nominal interest rate is 6.3 percent or 105 basis points higher than the current level of the monetary policy rate.
The expected-inflation augmented Taylor rule model estimates the NRIR at 2.0 percent. The yield curve can provide information about the relationship between the monetary policy rate and the NRIR. In particular, the gap between the nominal long-term interest rate and the
2 These results are restricted by the usual econometric caveats regarding endogeneity and should not be interpreted as a causal relationship. 3 For more methodological details see Magud, N., and E. Tsounta, 2012, “Too Cut or Not to Cut? That is he (Central Bank’s) Question: In Search of the Neutral Interest Rate in Latin America,” Working Paper 12/243 (Washington: International Monetary Fund).
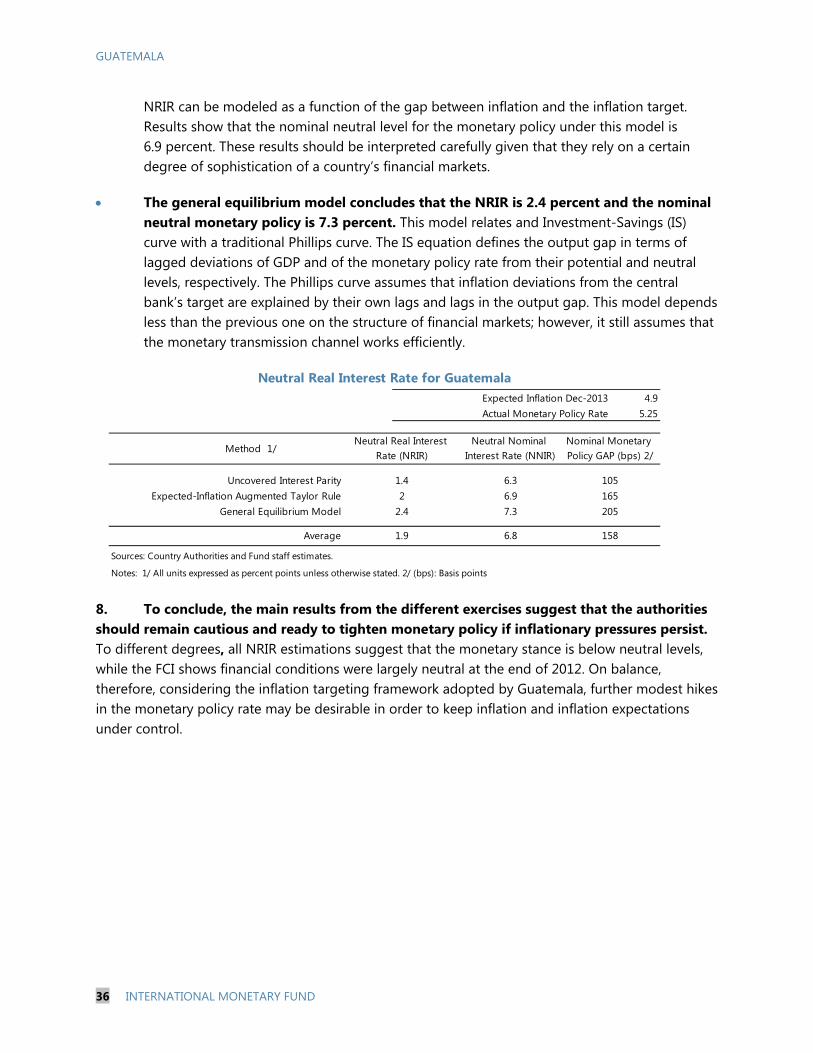
GUATEMALA
36 INTERNATIONAL MONETARY FUND
NRIR can be modeled as a function of the gap between inflation and the inflation target. Results show that the nominal neutral level for the monetary policy under this model is 6.9 percent. These results should be interpreted carefully given that they rely on a certain degree of sophistication of a country’s financial markets.
The general equilibrium model concludes that the NRIR is 2.4 percent and the nominal neutral monetary policy is 7.3 percent. This model relates and Investment-Savings (IS) curve with a traditional Phillips curve. The IS equation defines the output gap in terms of lagged deviations of GDP and of the monetary policy rate from their potential and neutral levels, respectively. The Phillips curve assumes that inflation deviations from the central bank’s target are explained by their own lags and lags in the output gap. This model depends less than the previous one on the structure of financial markets; however, it still assumes that the monetary transmission channel works efficiently.
8. To conclude, the main results from the different exercises suggest that the authorities should remain cautious and ready to tighten monetary policy if inflationary pressures persist. To different degrees, all NRIR estimations suggest that the monetary stance is below neutral levels, while the FCI shows financial conditions were largely neutral at the end of 2012. On balance, therefore, considering the inflation targeting framework adopted by Guatemala, further modest hikes in the monetary policy rate may be desirable in order to keep inflation and inflation expectations under control.
4.95.25
Sources: Country Authorities and Fund staff estimates.
Notes: 1/ All units expressed as percent points unless otherwise stated. 2/ (bps): Basis points
Neutral Real Interest Rate for Guatemala
2.4 7.3 205
Actual Monetary Policy Rate
Method 1/
Uncovered Interest ParityExpected-Inflation Augmented Taylor Rule
General Equilibrium Model2
6.36.9
105165
Expected Inflation Dec-2013
Neutral Real Interest Rate (NRIR)
Neutral Nominal Interest Rate (NNIR)
Nominal Monetary Policy GAP (bps) 2/
1.4
Average 1.9 6.8 158
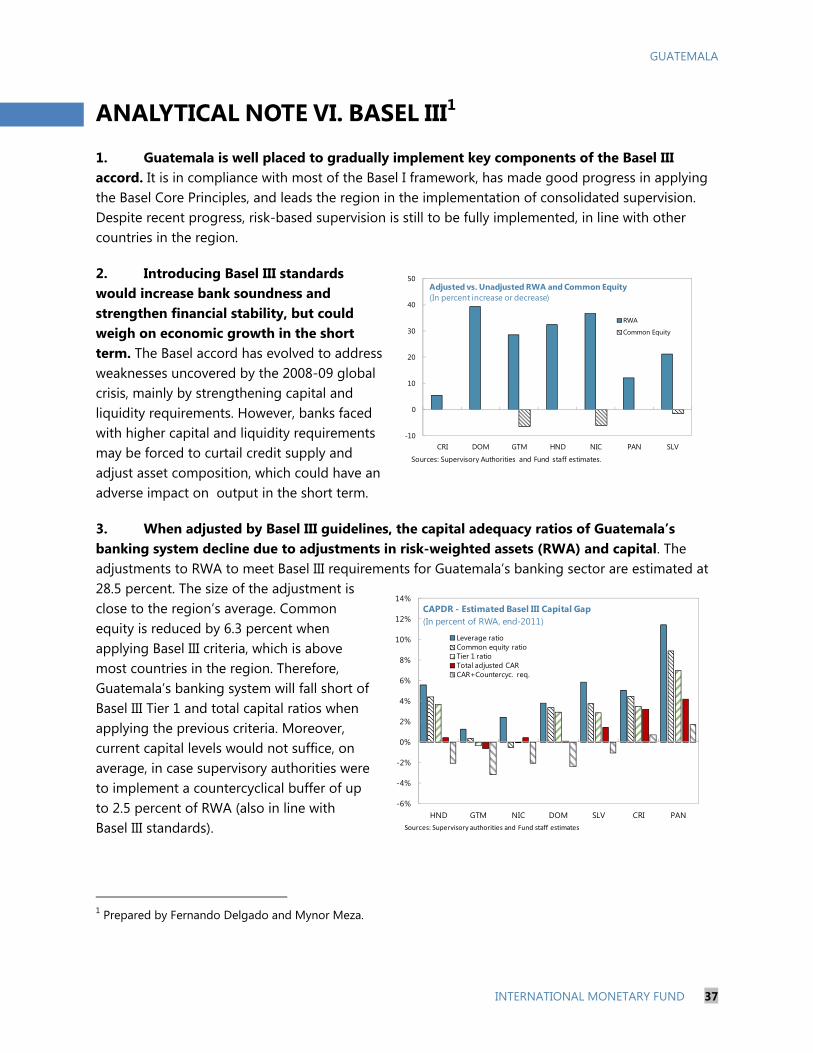
GUATEMALA
INTERNATIONAL MONETARY FUND 37
ANALYTICAL NOTE VI. BASEL III1
1. Guatemala is well placed to gradually implement key components of the Basel III accord. It is in compliance with most of the Basel I framework, has made good progress in applying the Basel Core Principles, and leads the region in the implementation of consolidated supervision. Despite recent progress, risk-based supervision is still to be fully implemented, in line with other countries in the region.
2. Introducing Basel III standards would increase bank soundness and strengthen financial stability, but could weigh on economic growth in the short term. The Basel accord has evolved to address weaknesses uncovered by the 2008-09 global crisis, mainly by strengthening capital and liquidity requirements. However, banks faced with higher capital and liquidity requirements may be forced to curtail credit supply and adjust asset composition, which could have an adverse impact on output in the short term.
3. When adjusted by Basel III guidelines, the capital adequacy ratios of Guatemala’s banking system decline due to adjustments in risk-weighted assets (RWA) and capital. The adjustments to RWA to meet Basel III requirements for Guatemala’s banking sector are estimated at 28.5 percent. The size of the adjustment is close to the region’s average. Common equity is reduced by 6.3 percent when applying Basel III criteria, which is above most countries in the region. Therefore, Guatemala’s banking system will fall short of Basel III Tier 1 and total capital ratios when applying the previous criteria. Moreover, current capital levels would not suffice, on average, in case supervisory authorities were to implement a countercyclical buffer of up to 2.5 percent of RWA (also in line with Basel III standards).
1 Prepared by Fernando Delgado and Mynor Meza.
-10
0
10
20
30
40
50
CRI DOM GTM HND NIC PAN SLV
Adjusted vs. Unadjusted RWA and Common Equity (In percent increase or decrease)
RWA
Common Equity
Sources: Supervisory Authorities and Fund staff estimates.
-6%
-4%
-2%
0%
2%
4%
6%
8%
10%
12%
14%
HND GTM NIC DOM SLV CRI PANSources: Supervisory authorities and Fund staff estimates
CAPDR - Estimated Basel III Capital Gap (In percent of RWA, end-2011)
Leverage ratioCommon equity ratioTier 1 ratioTotal adjusted CARCAR+Countercyc. req.

GUATEMALA
38 INTERNATIONAL MONETARY FUND
4. Guatemala’s banking system exceeds Basel III minimum liquidity requirements. This holds even after adjusting for the liquidity coverage ratio and net stable funding ratio methodologies. Short-term liquidity is more than twice the Basel requirements, while long-term liquidity is at 130 percent of the requirement.
5. The macroeconomic impact of the transition to Basel III total capital requirements is fairly low. The impact of the new Basel III capital requirement on short-term output growth in Guatemala was estimated using a Vector Auto Regression (VAR) model. The results suggest that the at-peak growth impact of increasing total capital ratio by 1 percentage point would amount to about -0.03 percentage points of GDP, and that growth returns to the steady state after approximately 50 quarters from the beginning of the total capital ratio increase, in line with the region. Such growth impact is in the low range of values for the macroeconomic impact of the transition to stronger capital and liquidity requirements for BIS countries compiled by the BIS Macroeconomic Analysis Group. Taking into account the negative gap vis-à-vis Basel III capital requirements, the macroeconomic impact of bringing total capital up to minimum Basel III requirements would have an at-peak impact of about -0.02 percentage points of GDP in Guatemala.
6. Guatemala would benefit from using Basel III as a guide to strengthen prudential regulation and supervision. The Basel III framework would be appropriate given the growing size and complexity of Guatemala’s financial system. Basel III implementation would help improve supervisory skills and regulatory and risk management frameworks.
7. The pragmatic approach that Guatemala has followed in the implementation of Basel standards should continue guiding the implementation of Basel III. It is more appropriate to focus on those elements of Basel III that are more relevant for Guatemala’s financial markets. The elements with the highest short-term priority should be: (i) adopting Basel III definitions of capital; (ii) implementing a capital conservation buffer; and (iii) introducing a leverage ratio. Over the medium-term, the priority should shift to: (iv) aligning liquidity requirements with Basel III; and (v) strengthening the supervisory process (Pillar II) and market discipline and transparency (Pillar III). In the long term, other elements might become important, such as: (vi) considering macroprudential instruments; and (vii) implementing capital charges for systemically important financial institutions.
8. Legal and industry-based challenges to implementing Basel III in Guatemala seem manageable. Implementing most Basel III elements require regulations that fall largely under the purview of Guatemala’s supervisory authorities. At the industry level, the weak presence of large international financial groups might represent a challenge to adopt best international standards and Basel III compliance in the short term.
Related Documents