SICREMI 2015 INTERNATIONAL MIGRATION IN THE AMERICAS

Welcome message from author
This document is posted to help you gain knowledge. Please leave a comment to let me know what you think about it! Share it to your friends and learn new things together.
Transcript
SICREMI 2015
INTERNATIONAL MIGRATIONIN THE AMERICAS
This is the third annual report of the Continuous Reporting System on International Migration in the Americas (SICREMI, for its acronym in Spanish). The report collects data from diverse sources (censuses, surveys, administrative records, etc.) in order to process and disseminate information regarding the magnitude, trends, and characteristics of international migration in the countries that participated in this third report: Argentina, Barbados, Belize, Bolivia, Brazil, Canada, Chile, Colombia, Costa Rica, Dominican Republic, Ecuador, El Salvador, Guatemala, Jamaica, Mexico, Panama, Paraguay, Peru, United States and Uruguay.
The methodology of this report is based on the Permanent Observation System on Migration (or SOPEMI) of the Organisation for Economic Co-operation and Development (OECD), adjusted to the needs of the region in accordance with a participatory process involving the countries through a network of national correspondents and the participation of national and international organizations working in the field of migration.
SICREMI is an initiative of the Organization of American States (OAS) that aims to contribute to the promotion and development of public policies that lead to improved migration management in the Americas through the facilitation of dialogue, cooperation, institutional strengthening and access to information.
This publication is available at www.migracionoea.org/sicremi
INTER
NATIO
NA
L MIG
RATIO
N IN
THE A
MER
ICAS SICR
EMI 2015
OAS
www.migracionoea.org
17th Street and Constitution Ave., N.W.Washington, D.C., U.S.A. 20006
www.oas.org
INTERNATIONAL MIGRATION IN THE AMERICAS
Third Report of the Continuous Reporting System on International Migration in the Americas (SICREMI)
2015
OAS Cataloging-in-Publication Data
International Migration in the Americas: Third Report of the Continuous Reporting System on International Migration in the Americas (SICREMI) 2015.
p.; cm. Includes bibliographical references. (OAS. Official records ; OEA/ Ser.D)
ISBN 978-0-8270-6355-6
1. Emigration and immigration--Economic aspects. 2. Emigration and immigration--Social aspects. 3. Emigration and im-migration law. 4. Alien labor. 5. Refugees.
I. Organization of American States. Department of Social Inclusion. Migration and Development Program (MIDE). II. Con-tinuous Reporting System on International Migration in the Americas (SICREMI). III. Title: Third Report of the Continuous Reporting System on International Migration in the Americas (SICREMI) 2015. IV. Series.
OEA/Ser.D/XXVI.2.3
OGRANIZATION OF AMERICAN STATES17th Street and Constitution Ave., N.W.Washington, D.C. 20006, USAwww.oas.org
All rights reserved.
The partial or complete reproduction of this document without previous authorization could result in a violation of the appli-cable law. The Organization of American States supports the dissemination of this work and will normally authorize permis-sion for its reproduction. To request permission to photocopy or reprint any part of this publication, please send a request to:
Executive Secretariat for Integral DevelopmentOrganization of American States1889 F ST N.W. Washington D.C. 20006, USAE-mail: [email protected]
This publication was designed by Miki Fernández of Ultradesigns, Inc., translated by Pablo Ros and edited by Amy Carattini.
This publication is available at www.migracionoea.org/sicremi
/ iii
The coordination and production of this Report was jointly managed by Juan Manuel Jiménez Martínez and Marcia Bebianno Simões, Specialists of the Department of Social Inclusion of the Organization of American States (OAS) and Georges Lemaître, former principal
Administrator of the International Migration Division of the Organisation for Economic Cooperation and Development (OECD). Véronique Gindrey, Statistician of the OECD provided support in statistics.
Katiuska Lourenço da Silva, Specialist of the Department of Social Inclusion of the OAS provided support in preparing the country notes and coordinating the publication process.
René Maldonado, coordinator of the MIF project “Improving Central Bank Remittance Reporting and Procedures,” in collaboration with Maria Luisa Hayem of the MIF’s Access to Finance Unit, Multilateral Investment Fund (MIF) of the Inter-American Development Bank provided the section on remittances.
The content of this report is based on the official information provided and validated by the Network of National Correspondents designated by the OAS member countries participating in this third report.
Preparation and dissemination of this document was made possible thanks to the contribution of the Agencia Española de Cooperación para el Desarrollo, AECID, and the People’s Republic of China.

/ v
FOREWORD
We are pleased to present the third report on International Migration in the Americas, based on the Continuous Reporting System on International Migration in the Americas (SICREMI for its acronym in Spanish). The report is a joint effort by the Organization of American
States (OAS) and the Organization for Economic Cooperation and Development (OECD) and aims to inform the policy debate on issues related to international migration.
International Migration in the Americas is a unique source of information on migration movements to and from countries of the Americas, with harmonised statistics compiled and published regularly. Its objective is to monitor developments in migration trends and policies affecting these movements across countries of the Americas on a regular basis, as well as to improve the availability of, and access to, data and statistics on migrants. The report is produced, among other reasons, to support the monitoring of the implementation of development goals, and we hope it will continue contributing to it following the adoption of the new Sustainable Development Goals.
This new edition of International Migration in the Americas incorporates a significant improvement in the information coverage of migration outflows from the hemisphere, including temporary migration movements to Canada and the United States as well as migration movements to other countries of the Americas.
The report shows that during the 2010-2013 period international migration into all countries of the Americas increased by 5% annually on average, although the figure jumped to 17% per year in the specific case of Latin America and the Caribbean. Most of the immigration into Latin American and Caribbean countries came from neighboring nations. This is a high rate of increase and, if maintained, it would imply that immigration would almost double in just four years.
The report analyses these developments. On the one hand, they appear to be associated with a stabilization or decline of movements from Latin America and the Caribbean to OECD countries; on the other hand, it also seems to be linked to the growing importance of regional integration processes among countries of the Americas, in particular the Southern Common Market (MERCOSUR), the Andean Community (CAN), the Caribbean Community (CARICOM) and the Central American Integration System (SICA). Other aspects of migration examined in the report are the feminization of migration movements, settlement vs. return of emigrants, and the issue of the over-qualification of highly educated emigrants in the labor markets of destination countries.
The findings on the labor market situation confronted by Latin American and Caribbean migrants in both Europe and the United States confirm rather different realities. While the United States are returning to unemployment levels close to those recorded in 2008, the labor market situation is more difficult in most European countries, most notably in Spain – which was a key destination
vi / INTERNATIONAL MIGRATION IN THE AMERICAS SICREMI 2015
country prior to the crisis. However, despite the high level of unemployment, less than 30% of migrants from the Americas have left Spain; this seems to suggest that most Latin American and Caribbean emigrants are firmly settled in their newly adopted countries and adopting the nationality of their country of residence.
The large increase in intra-regional migration observed in the Americas between 2010 and 2013 is one of the most notable trends documented by this report. Although it still only accounts for one fourth of the total emigration registered from the countries of Latin America and the Caribbean, it reflects the growing economic integration of the region. The improving labor market situation in the United States and a stronger recovery in Europe may affect these flows. But the opening of these new channels for migration suggest a new pattern for the years to come.
We hope that this publication will continue to advance our understanding of migration in the Americas, and will provide useful analysis and suggestions on how economies and societies can continue benefitting from this phenomenon.
Luis Almagro Angel Gurría Secretary General of the Secretary-General of the Organization of American States Organisation for Economic Co-operation and Development
/ vii
MEMBER STATES OF THE ORGANIZATION OF AMERICAN STATES (OAS)
Antigua and Barbuda
Argentina
Barbados
Belize
Bolivia
Brazil
Canada
Chile
Colombia
Costa Rica
Cuba
Dominica (Commonwealth of)
Dominican Republic
Ecuador
El Salvador
Grenada
Guatemala
Guyana
Haiti
Honduras
Jamaica
Mexico
Nicaragua
viii / INTERNATIONAL MIGRATION IN THE AMERICAS SICREMI 2015
Panama
Paraguay
Peru
Saint Kitts and Nevis
Saint Lucia
Saint Vincent and the Grenadines
Suriname
The Bahamas (Commonwealth of)
Trinidad and Tobago
United States of America
Uruguay
Venezuela (Bolivarian Republic of)
/ ix
MEMBER COUNTRIES OF THE ORGANISATION FOR ECONOMIC
CO-OPERATION AND DEVELOPMENT (OECD)
Australia
Austria
Belgium
Canada
Chile
Czech Republic
Denmark
Estonia
Finland
France
Germany
Greece
Hungary
Iceland
Ireland
Israel
Italy
Japan
Korea
Luxembourg

x / INTERNATIONAL MIGRATION IN THE AMERICAS SICREMI 2015
Mexico
Netherlands
New Zealand
Norway
Poland
Portugal
Slovak Republic
Slovenia
Spain
Sweden
Switzerland
Turkey
United Kingdom
United States
/ xi
NETWORK OF NATIONAL CORRESPONDENTS
SICREMI 2015
The participating organizations would like to express their special thanks to the National Correspondents of the 20 participating OAS Member States and their teams, who worked hard to produce the national reports, based in which this report was developed.
ArgentinaMartín Arias Duval, Director, Dirección Nacional de Migraciones
Federico Luis Agusti, Director, Dirección de Asuntos Internacionales y Sociales, Dirección Nacional de Migraciones
Eduardo E. Estévez, Consultant, Dirección de Asuntos Internacionales y Sociales, Dirección Nacional de Migraciones
BarbadosErine Griffith, Chief Immigration Officer, Immigration Department
Janice Robinson, Immigration and Passport Department
BelizeTiffany Vasquez, Specialist, Statistical Institute of Belize
Bolivia (Plurinational State of)German Guaygua Choqueguaita, Chief of Consular Policy Unit, Dirección General de Asuntos Consulares, Ministerio de Relaciones Exteriores
BrazilJoão Guilherme Lima Granja Xavier da Silva, Director, Departamento de Estrangeiros, Secretaria Nacional de Justiça, Ministério de Justiça
Welinton Martins Ribeiro, Chief of Nationality and Naturalization Division, Departamento de Estrangeiros, Secretaria Nacional de Justiça, Ministério de Justiça
CanadaMartha Justus, Director, Research and Evaluation, Citizenship and Immigration Canada
ChileAlejandro Marisio Cugat, Director, Dirección General de Asuntos Consulares y de Inmigración, Ministerio de Relaciones Exteriores
xii / INTERNATIONAL MIGRATION IN THE AMERICAS SICREMI 2015
Jaime Bascuñán Marin, Director of Consular Policy, Ministerio de Relaciones Exteriores
Pedro Osvaldo Hernández González, Deputy director of International Migration, Dirección de Política Consular, Ministerio de Relaciones Exteriores
ColombiaEmbajador Javier Darío Higuera Angel, Director, Dirección de Asuntos Migratorios, Consulares y Servicio al Ciudadano, Ministerio de Relaciones Exteriores
César Camilo Vallejo, Advisor, Dirección de Asuntos Migratorios, Consulares y Servicio al Ciudadano, Ministerio de Relaciones Exteriores
Costa RicaKathya Rodriguez, Director, Dirección General de Migración y Extranjería
Luis Alonso Serrano, Chief of Institutional Planning, Dirección General de Migración y Extranjería
Ada María Porras Salazar, Advisor, Dirección General de Migración y Extranjería
Dominican RepublicSanto Miguel Roman García, Deputy General Director, Departamento de Control Migratorio Dirección General de Migración
EcuadorMaría Landázuri De Mora, Viceminister of Human Mobility, Ministerio de Relaciones Exteriores y Movilidad Humana
Branly Patricio Toledo Atarihuana, Third Secretary of Foreign Service, Ministerio de Relaciones Exteriores y Movilidad Humana
El SalvadorAngélica María Andreu, Chief of Planning and Development, Dirección General de Migración y Extranjería, Ministerio de Justicia y Seguridad Pública de El Salvador
GuatemalaMariella Vélez de García, General Director of Consular Affairs and Migration, Ministerio de Relaciones Exteriores
Roque Abel Arriaga Martinez, Director of Consular Affairs and Migration, Ministerio de Relaciones Exteriores
Miriam Fabiola Mazariegos Caravantes, Second Secretary of Consular Affairs and Migration, Ministerio de Relaciones Exteriores
JamaicaToni-Shae Freckleton, Manager, Population and Health Unit, Social Policy, Planning and Research Division, Planning Institute of Jamaica
Yonique Lawrence, Senior Demographer, Planning Institute of Jamaica
Network of National Correspondents / xiii
MexicoOmar de la Torre de la Mora, General Director, Unidad de Política Migratoria, Secretaría de Gobernación de México
Paula Cristina Leite, Assistant Director, Unidad de Política Migratoria, Secretaría de Gobernación de México
PanamaDaniel Gilberto De Gracia Mendoza, Chief of International Relations, Asuntos Internacionales, Servicio Nacional de Migración Panamá
ParaguayHugo Rolando Morel Ocampos, Director, Dirección de Atención a las Comunidades Paraguayas en el Extranjero, Ministerio de Relaciones Exteriores
PeruAnibal Sánchez Aguilar, Deputy chief of Statistics, Instituto Nacional de Estadística e Informática
United StatesThe U.S. Department of Homeland Security and the U.S. Department of State through the U.S. Permanent Mission to the Organization of American States
UruguayMartín Koolhaas, Advisor, División Estadísticas Sociodemográficas, Instituto Nacional de Estadísticas
Leonardo Cuello, Analyst, División Estadísticas Sociodemográficas, Instituto Nacional de Estadísticas

/ xv
EXECUTIVE SUMMARY
Introductory overview
Economic growth in the countries of the Americas largely maintained itself throughout 2011-2013, at somewhat lower levels than the recovery year of 2010, following the economic crisis of 2008-2009. Indeed growth rates over the period for Latin American and Caribbean
countries averaged over 4% across countries, which was close to twice the rate observed for the United States and Canada.
In the context of these growth rates, international migration, counting both permanent and tempo-rary movements, increased by an average of 5% per year overall over the 2011-2013 period, but by an average of 17% per year for Latin American and Caribbean countries. At this rate of increase, the level of immigrant inflows in these countries would double in about four years.
The migration movements presented in this report are based on official statistics of authorized migration and may paint a partial picture of total movements, especially if the extent of irregular migration is large.
This report finds that the increasing levels of immigration in the countries of Latin America and the Caribbean are essentially due to increasing intra-regional migration. With the greater economic integration associated with the various regional trade agreements is coming a greater incidence of migration movements, most of them also regional in nature. The increasing importance of intra-regional migration, however, is not actually reducing the extent of immigration from outside the Americas, at least in absolute terms. The latter continued to progress over the 2010-2013 period, but by a smaller rate (12%) than immigration from other countries of the Americas, which advanced by about 46%.
The feminization of migration
For most countries of the Americas, the immigration of women from other countries of the Ameri-cas remains a minority phenomenon, with 45% of immigrants overall being women, approximately the same percentage as for immigrants from the rest of the world. Only in Chile and Costa Rica do women constitute a majority of immigrants. At the other end of the spectrum, women account for less than 40% of all immigrants in Canada, Peru and Colombia.
As family members arrive in destination countries to join the original migrant, there is a natural tendency for the balance between the two genders to equalize. A surer indication of the extent to which the traditional pattern is changing is to look at the relative presence of men and women in family and labor migration, respectively. However, here one observes the traditional pattern of a significantly greater presence of women among family migrants (59%) and a lesser presence
xvi / INTERNATIONAL MIGRATION IN THE AMERICAS SICREMI 2015
among labor migrants (32%). This traditional pattern is stronger among immigrants from the Americas than among those from the rest of the world.
Although the traditional pattern of migration into countries of the Americas is indeed changing, it is, with some exceptions, still far from a situation in which the genders are playing on average the same role.
Asylum seeking in the Americas
Asylum seeking in Latin America and the Caribbean remains generally an uncommon phenomenon, with rates on average at 18 requests per million in 2013, which are at less than one-tenth of those observed in Canada and the United States. Since 2010, the number of requests has remained less than the average recorded in the previous year, largely the consequence of a large fall in claims in Ecuador from Colombian nationals, as civil conflict in Colombia has abated in recent years.
Noteworthy is the appearance of asylum claimants in recent years from Syria, which is also the most important origin country for the OECD zone as a whole. In Latin America, Syria appears among the top three origin countries in Argentina (where it is the top country of origin), Bolivia and Chile. In the Caribbean as a whole, Syria is the second country of origin of claimants, after Cuba. Cuba appears as an important source country in many countries of the Americas.
Acquisitions of nationality
Naturalization rates in countries of the Americas tend to be low in relation to permanent immigra-tion levels. Statistics for Canada and the United States, which are long-standing immigration coun-tries, provide a useful benchmark in this regard. For both, the ratio of acquisitions to permanent immigration levels is in the vicinity of 0.7. For most Latin American and Caribbean countries, the ratio statistic is generally less than 0.3. In many of these countries there is relatively easy immi-gration to neighboring countries in the context of regional trade agreements, so there may not be a significant incentive to take out the nationality of the destination country.
Emigration from the Americas
The total number of outflows from the Americas to OECD countries and to other countries of the Americas was almost 6.5 million in the period from 2009 to 2012. This represents almost 7 persons per thousand population in the origin countries. For migration to the same destination countries, the rest of the world sends 4 persons per thousand population.
Half of the out-migration from countries of the Americas is to Canada and the United States, one quarter to the rest of the OECD outside the Americas and one quarter to other countries of the Americas. By contrast barely 2% of migration from other regions of the world is to countries of the Americas other than Canada and the United States.
Migration to Canada and the United States from other countries of the Americas has never really recovered from the effects of the 2008-2009 economic crisis. In 2012 movements were at 4% below their 2009 level at the trough of the recession. Other OECD countries outside the Americas, espe-cially in Europe, have seen a further drop of 17% in migration from countries of the Americas since 2009, a consequence of a further deterioration of economic conditions due to the budget crisis in Europe, which followed on the heels of the recession. However, migration to other countries of the Americas has taken up the slack, increasing by over 39% over the 2009-2012 period.
Excecutive Summary / xvii
Settlement or return
The percentage of all immigrants from the Americas who have been resident for more than 10 years in Europe has more than doubled over the relatively short period from 2008-2009 to 2012-2013. It stood at 30% in 2008-2009 and rose to 59% of all emigrants from the Americas over the following four years, essentially the same as that of emigrants from the rest of the world, which has also risen over the period, but from an already high level of 55%. Note that this increase has occurred precisely in the period when economic conditions in many European countries, especially Spain where many of the emigrants were resident, were deteriorating. The increase has been spectacu-lar for immigrants from the Andean Region, where the increase has been over 230%. Moreover, with each year, more and more are taking up the nationality of their countries of residence.
The increase in 10-year residents in the United States, where migration is more long-standing, has been less dramatic, and the extent of naturalization in the United States less important, due largely to a higher proportion of unauthorized migrants.
The general picture is that many immigrants from the Americas appear to be staying on, in Europe as in the United States, despite the difficult economic conditions in some countries, especially in Spain.
Although departure rates from Spain have increased strongly with the recession, they have gener-ally stabilized in recent years.
Migration to Spain from the Americas in 2013 was at 86 thousand scarcely one fourth of its peak 2007 level. Although migration itself has declined strongly in the face of adverse economic condi-tions, it has clearly not led to massive return movements, at least not yet. Although returns doubled from 2006 to 2007 and increased by 15-20% in the following two years, they have remained at close to the 135-140 thousand level since 2010. In 2013, there was a net return of about 55 thousand im-migrants per year to the countries of origin, but this is a far cry from the 215 thousand net entries which prevailed on average over the 2002-2007 period.
Immigrant and emigrant populations in the Americas
Immigrant populations
The immigrant population in the Americas has risen from about from 34 million in 1990 to 61 mil-lion in 2013, an increase of almost 78% compared to the 42% rise observed in the rest of the world.
Almost all of this increase was in Canada and the United States, where the immigrant population has nearly doubled since 1990, attaining a level of 53 million persons in 2013. By contrast, the immigrant population in Latin America and the Caribbean has increased by only 19% since 1990, reaching a level of 7.7 million in 2013. However, if the evolution is measured over the 2000-2013 period, the increase of the immigrant population in Latin America and the Caribbean for 2013 has been somewhat greater than that observed in Canada and the United States (35% vs. 31%).
Despite the increase in the number of immigrants in Latin America and the Caribbean between 1990 and 2013, immigration remains limited in this region, representing only 1.4% of the total pop-ulation in the region in 2013, compared to 14.9% for Canada and the United States.
Origin and destination countries of immigrants and emigrants
The United States is the most important destination country for migrants of the Americas, but also for migrants worldwide. Between 1990 and 2013, the population of immigrants in the United States
xviii / INTERNATIONAL MIGRATION IN THE AMERICAS SICREMI 2015
doubled. By 2013, five out of six migrants from the Americas and one in five worldwide lived in the United States.
While the United States has continued as a magnet for potential immigrants from the Americas in recent decades, many other countries have seen large increases in their own immigrant popula-tions, often from neighboring countries.
On average, 64% of immigrants in the Caribbean come from the region itself, 63% of immigrants in the Andean Region and 44% of those in the Southern Cone. In the case of Central America the aver-age is lower (32%) because of a high level of immigrants in Mexico come from the United States. Much of this, however, does not consist of non-natives but rather of children born in the United States to Mexicans who later returned to their country of origin.
On the emigration side, the United States is the main country of residence of emigrants for all but a handful of nationalities of the Americas. For Nicaraguans, it is Costa Rica; for Bolivians, Chileans, Paraguayans and Uruguayans, it is Argentina; for Colombians, Venezuela; for Argentineans, Spain; for Suriname, the Netherlands; and for citizens of the United States, Mexico. On average, the main country of destination accounts for 57% of all emigrants from a country, which is a high concentra-tion indeed.
Expatriation rates of native-born populations in the Americas
Although emigration from the Americas has decreased following the economic crisis of 2008, it is still the dominating feature of migration for Latin America and the Caribbean, as it has been since the 1960s. For the Americas, Canada and the United States show relatively low expatriation rates, at over 4% and 1% respectively. For the rest of the hemisphere, one observes a decline in expatria-tion rates as one moves south from the United States, with the highest rates in the Caribbean (15%) and the lowest in the Southern Cone (1.7%), with Central America at 9.5% and the Andean Region at 4.5%. On an individual country basis, however, there is considerable variation within regions.
On the immigration side, the various regions of Latin America and the Caribbean have more similar immigration rates, with the rates for all four regions ranging between 1% and 2%.
With few exceptions (the Bahamas, Costa Rica, Panama, Venezuela and Argentina), expatriation dominates immigration in the countries of Latin America and the Caribbean, often strongly so, and this is likely to maintain itself for some time, until economic development at home reduces the incentive to look abroad as a means of improving one’s livelihood.
The labor market situation of migrants from the Americas in Europe and the United States
The labor market situation of immigrants from the Americas in recent years has evolved largely in line with overall developments in the labor market of the main countries of destination, Spain and the United States. Spain has seen a further deterioration of the condition in its labor market from 2010-2011 to 2012-2013, with a decline in the employment rate of the native-born of 4% among men and 2% among women. The evolution for immigrants from the Americas in Spain was similar for men (5 points), but considerably larger for immigrant women (a decline of 6 percentage points). This is reflected as well in a much larger increase in the unemployment rate among immigrant women from the Americas than native-born women (8 vs. 5 percentage points). Unemployment rates for immigrants are now near the 32-35% level, compared to about 36-37% for immigrants from other continents and 23-24% for native-born workers.
Excecutive Summary / xix
The labor market situation of immigrants from the Caribbean and from Central America, on the other hand, has profited from the improvement in economic conditions in the United States since 2010-2011. Overall the employment rate has risen by 3 points for immigrant men from the Carib-bean and Central America but only by about 1 point for women from these regions. Likewise the unemployment situation has improved more for men than for women.
2014 saw the first signs of improvement in the labor market situation in Spain, but it is slow, so that the level of departures from Spain observed in 2013 may well maintain itself. Still the situation in Spain provides almost a case study in how even an exceedingly unfavorable labor market has not strongly affected the settlement intentions of migrants from the Americas, at least not to the extent which one might have expected given the circumstances.
Over-qualification of tertiary-educated migrants from the Americas
In 2011-2013 there were close to 870 thousand tertiary-educated persons from the Americas em-ployed in European OECD countries, but close to three times this number in the United States (2,633,000). Mexico represented almost a quarter of the latter and Canada about an eighth. There were more tertiary-educated employed in the European Union than in the United States only among immigrants from the Southern Cone (52%). In all other regions and indeed most countries, the tertiary-educated employed in the United States are much more numerous.
Over-qualification rates among tertiary-educated immigrants from the Americas in 2011-2013 aver-aged 36% in European Union countries and 46% in the United States, compared to 20% and 35%, re-spectively, among employed native-born tertiary-educated persons in these regions. Over-qualification rates of immigrants from countries of Latin America and the Caribbean are some 15 to 20 points higher than for native-born persons. Language proficiency is not necessarily at issue here, because the over-qualification rate in Spain is even higher at 53% than for the European Union as a whole (36%).
The implosion of the Spanish economy in 2008 in the wake of the bubble in the construction sector and the subsequent budget crisis have mortgaged the possibility of rapid progress for the tertiary-educated in the Spanish labor market. Nowhere is this more evident than in the high unemploy-ment rates in general and the high over-qualification rates among this group. Some are now re-turning to their countries of origin but many have settled for good. But only a vastly improved labor market will be able to improve their prospects. Although the signs of this are present, they are still relatively tentative, so that a significant improvement in the short-term seems unlikely.
Remittances to Latin America and the Caribbean in 2013
Prior to the international financial crisis, remittance flows into LAC countries had reached average annual growth rates of 17%. However, the 2008-2009 economic crisis provoked a major change in the trends observed until then. Remittance levels fell more than 10% in 2009, followed by a modest rise of 6% in 2011 and a levelling off at the regional level. In 2013, the inflow of remittances from outside the region reached US$ 61.3 billion, almost unchanged compared to 2012.This total reflects the increase in remittances in Central America and the Caribbean, compensating for the decline in Mexico and South American countries.

/ xxi
CONTENTS
PART I: Trends in International Migration and Labor Market Outcomes ............. 1
Introductory overview ............................................................................................................................. 3International migration by reason ....................................................................................................... 11The feminization of migration .............................................................................................................. 13Asylum seeking in the Americas ......................................................................................................... 15Acquisitions of nationality .................................................................................................................... 18Emigration from the Americas ........................................................................................................... 20Settlement or return ........................................................................................................................... 24Immigrant and emigrant populations in the Americas ...................................................................... 30
Immigrant populations ..........................................................................................................................30Origin and destination countries of immigrants and emigrants ..........................................................32Expatriation rates of native-born populations in the Americas ..........................................................35
The labor market situation of migrants from the Americas in Europe and the United States ......... 38Over-qualification of tertiary-educated migrants from the Americas ............................................... 42Remittances to Latin America and the Caribbean in 2013 ................................................................. 48The effect of the economic situation in receiving countries on remittance flows ............................. 51
Value of remittances received ...............................................................................................................51Importance of remittances on GDP of receiving countries ..................................................................52
References ............................................................................................................................................ 54Annex 1. The extent of irregular migration in the Americas .............................................................. 55
PART II: Country Notes ..................................................................................... 65
Introduction ............................................................................................................................... 67 Argentina ................................................................................................................................... 69Country note ........................................................................................................................................ 69Recent trends in migrant’s flows and stocks and in labor market outcomes of emigrants ............. 71 Barbados ................................................................................................................................... 72Country note ......................................................................................................................................... 72Recent trends in migrant’s flows and stocks and in labor market outcomes of emigrants ............. 73 Belize ......................................................................................................................................... 74Country note ........................................................................................................................................ 74Recent trends in migrant’s flows and stocks and in labor market outcomes of emigrants ............. 75
xxii / INTERNATIONAL MIGRATION IN THE AMERICAS SICREMI 2015
Bolivia ........................................................................................................................................ 76Country note ........................................................................................................................................ 76Recent trends in migrant’s flows and stocks and in labor market outcomes of emigrants ............. 78 Brazil ......................................................................................................................................... 79Country note ........................................................................................................................................ 79Recent trends in migrant’s flows and stocks and in labor market outcomes of emigrants ............. 81 Canada ....................................................................................................................................... 82Country note ........................................................................................................................................ 82Recent trends in migrant’s flows and stocks and in labor market outcomes of emigrants ............. 84 Chile .......................................................................................................................................... 85Country note ........................................................................................................................................ 85Recent trends in migrant’s flows and stocks and in labor market outcomes of emigrants ............. 87 Colombia .................................................................................................................................... 88Country note ........................................................................................................................................ 88Recent trends in migrant’s flows and stocks and in labor market outcomes of emigrants ............. 90 Costa Rica .................................................................................................................................. 91Country note ........................................................................................................................................ 91Recent trends in migrant’s flows and stocks and in labor market outcomes of emigrants ............. 93 Dominican Republic ................................................................................................................... 94Country note ........................................................................................................................................ 94Recent trends in migrant’s flows and stocks and in labor market outcomes of emigrants ............. 96 Ecuador ..................................................................................................................................... 97Country note ........................................................................................................................................ 97Recent trends in migrant’s flows and stocks and in labor market outcomes of emigrants ............. 99 El Salvador .............................................................................................................................. 100Country note ...................................................................................................................................... 100Recent trends in migrant’s flows and stocks and in labor market outcomes of emigrants ........... 101 Guatemala ............................................................................................................................... 102Country note ...................................................................................................................................... 102 Recent trends in migrant’s flows and stocks and in labor market outcomes of emigrants ........... 103 Jamaica ................................................................................................................................... 104Overview of the history of international migration ............................................................................ 104Legal Framework Governing International Migration ...................................................................... 106Recent trends in migrant’s flows and stocks and in labor market outcomes of emigrants ........... 109Bibliography ........................................................................................................................................ 110
Contents / xxiii
Mexico ..................................................................................................................................... 111Country note ...................................................................................................................................... 111Recent trends in migrant’s flows and stocks and in labor market outcomes of emigrants ........... 113 Panama .................................................................................................................................... 114Country note ...................................................................................................................................... 114Recent trends in migrant’s flows and stocks and in labor market outcomes of emigrants ........... 116 Paraguay ................................................................................................................................. 117Country note ...................................................................................................................................... 117 Recent trends in migrant’s flows and stocks and in labor market outcomes of emigrants ........... 118 Peru ......................................................................................................................................... 119Country note ...................................................................................................................................... 119Recent trends in migrant’s flows and stocks and in labor market outcomes of emigrants ........... 121 United States ........................................................................................................................... 122Country note ...................................................................................................................................... 122Recent trends in migrant’s flows and stocks and in labor market outcomes of emigrants ........... 126 Uruguay ................................................................................................................................... 127Country note ...................................................................................................................................... 127Recent trends in migrant’s flows and stocks and in labor market outcomes of emigrants ........... 129
PART III: Statistical Annex .............................................................................. 131
Introduction ........................................................................................................................................ 133The table lettering system ................................................................................................................. 133Sources and definitions ...................................................................................................................... 134Metadata ............................................................................................................................................. 138
Statistical tables
I.a.fl. Inflows of legal immigrants of foreign nationality ......................................................... 151I.a.as. Inflows of asylum seekers ............................................................................................ 152I.a.fb. The foreign-born population .......................................................................................... 153I.a.an. Acquisitions of nationality ............................................................................................. 154 I.d.fl. Inflows of legal permanent immigrants, by country of nationality ................................. 155Argentina ............................................................................................................................................ 155Barbados............................................................................................................................................. 155Belize .................................................................................................................................................. 156Bolivia (Plurinational State of) ........................................................................................................... 156Canada ................................................................................................................................................ 157Chile .................................................................................................................................................... 157Colombia ............................................................................................................................................. 158
xxiv / INTERNATIONAL MIGRATION IN THE AMERICAS SICREMI 2015
Costa Rica ........................................................................................................................................... 158Dominican Republic ........................................................................................................................... 159Ecuador ............................................................................................................................................... 159El Salvador .......................................................................................................................................... 160Mexico ................................................................................................................................................. 160Panama ............................................................................................................................................... 161Paraguay ............................................................................................................................................. 161Peru..................................................................................................................................................... 162United States ...................................................................................................................................... 162Uruguay .............................................................................................................................................. 163 I.d.an. Acquisitions of nationality by country of previous nationality ....................................... 164Barbados............................................................................................................................................. 164Belize .................................................................................................................................................. 164Bolivia (Plurinational State of) ........................................................................................................... 165Canada ................................................................................................................................................ 165Chile .................................................................................................................................................... 166Colombia ............................................................................................................................................. 166Costa Rica ........................................................................................................................................... 167Dominican Republic ........................................................................................................................... 167Ecuador ............................................................................................................................................... 168El Salvador .......................................................................................................................................... 168Guatemala .......................................................................................................................................... 169Mexico ................................................................................................................................................. 169Paraguay ............................................................................................................................................. 170Peru..................................................................................................................................................... 170United States ...................................................................................................................................... 171Uruguay .............................................................................................................................................. 171 E.a.fl. Outflows of migrants to OECD countries by country of birth .......................................... 172E.a.fb.US. The population born in the Americas living in the United States ............................. 173E.a.fb.SP. The population born in the Americas living in Spain ................................................ 174E.a.an. Acquisitions of nationality in OECD countries, by country of previous nationality ........ 175 E.d.fl. Outflows of migrants to OECD countries, by nationality and by country of destination ........ 176Antigua and Barbuda ......................................................................................................................... 176Argentina ............................................................................................................................................ 176Bahamas ............................................................................................................................................. 176Barbados............................................................................................................................................. 177Belize .................................................................................................................................................. 177Bolivia, Plurinational State of ............................................................................................................ 177Brazil ................................................................................................................................................... 178Canada ................................................................................................................................................ 178Chile .................................................................................................................................................... 179Colombia ............................................................................................................................................. 180Costa Rica ........................................................................................................................................... 180Cuba .................................................................................................................................................... 181Dominica ............................................................................................................................................. 182Dominican Republic ........................................................................................................................... 182
Ecuador ............................................................................................................................................... 182El Salvador .......................................................................................................................................... 183Grenada............................................................................................................................................... 184Guatemala .......................................................................................................................................... 184Guyana ................................................................................................................................................ 184Haiti ..................................................................................................................................................... 184Honduras ............................................................................................................................................ 185Jamaica ............................................................................................................................................... 185Mexico ................................................................................................................................................. 186Nicaragua ........................................................................................................................................... 187Panama ............................................................................................................................................... 187Paraguay ............................................................................................................................................. 188Peru..................................................................................................................................................... 188Saint Kitts and Nevis .......................................................................................................................... 189Saint Lucia .......................................................................................................................................... 189Saint Vincent and the Grenadines ...................................................................................................... 189Suriname ............................................................................................................................................ 189Trinidad and Tobago ........................................................................................................................... 189United States ...................................................................................................................................... 190Uruguay .............................................................................................................................................. 190Venezuela, Bolivarian Republic of ..................................................................................................... 191 E.d.an. Acquisitions of nationality in OECD countries, by country of previous nationality and country of acquired nationality ........................................................................ 192Antigua and Barbuda ......................................................................................................................... 192Argentina ............................................................................................................................................ 192Bahamas ............................................................................................................................................. 192Belize .................................................................................................................................................. 193Bolivia, Plurinational State of ............................................................................................................ 193Brazil ................................................................................................................................................... 193Canada ................................................................................................................................................ 194Chile .................................................................................................................................................... 194Colombia ............................................................................................................................................. 195Costa Rica ........................................................................................................................................... 195Cuba .................................................................................................................................................... 196Dominica ............................................................................................................................................. 196Ecuador ............................................................................................................................................... 197El Salvador .......................................................................................................................................... 197Grenada............................................................................................................................................... 198Guatemala .......................................................................................................................................... 198Guyana ................................................................................................................................................ 198Haiti ..................................................................................................................................................... 198Honduras ............................................................................................................................................ 199Jamaica ............................................................................................................................................... 199Mexico ................................................................................................................................................. 199Nicaragua ........................................................................................................................................... 200Panama ............................................................................................................................................... 200Paraguay ............................................................................................................................................. 200
Contents / xxv
xxvi / INTERNATIONAL MIGRATION IN THE AMERICAS SICREMI 2015
Tables
Table 1. International migration inflows in the Americas, permanent and temporary, 2008-2013 ........................................................................................................................... 5
Table 2. Women’s share of total immigration in the Americas, 2012-2013 ................................. 14Table 3. Asylum seekers in the Americas, 2001-2013 ................................................................. 16Table 4. Acquisitions of nationality, recent evolution and frequency
relative to permanent immigration, 2007-2013 .............................................................. 19Table 5. Migration movements from the Americas to OECD countries and other
countries of the Americas, permanent and temporary, 2009-2013 ............................... 22Table 6a. Residency and naturalization of immigrants from the Americas in
European Union countries, 2008-2013 ............................................................................ 25Table 6b. Residency and naturalization of immigrants from the Americas in the
United States, 2008-2013 ................................................................................................. 26Table 7. Estimates of departure rates from Spain of immigrants from the Americas,
2002-2013 ......................................................................................................................... 28Table 8. International migrant stock by country and region of residence,1990-2013 ................. 30Table 9. Distribution of immigrants in the Americas by region or continent of origin, 2013 ...... 33Table 10. The immigrant and emigrant populations in and from the Americas, 2013 ................. 35Table 11. Labor market outcomes of emigrant workers from the Americas, by country
of birth and gender, 2010-2011 and 2012-2013 averages .............................................. 40Table 12. ertiary-educated employed persons from the Americas and over-qualification rates in
Spain and other European OECD countries, 2011-2013................................................. 44Table 13. Over-qualification among employed tertiary-educated immigrants from the
Americas in the European Union and the United States, 2011-2013............................. 45Table 13. Over-qualification among employed tertiary-educated immigrants from the
Americas in the European Union and the United States, 2011-2013............................. 46Table 14. Effect of exchange rates and inflation on remittances, 2012-2013................................ 51Table A1. Indicators of migration data coverage, selected countries of the Americas
(plus Spain and Sweden) ................................................................................................ 58Table A2. Top five origin and destination countries of immigrants to and emigrants from
countries of the Americas, 2013 ...................................................................................... 59
Index of Tables and Figures
Peru..................................................................................................................................................... 201Saint Kitts and Nevis .......................................................................................................................... 201Saint Lucia .......................................................................................................................................... 201Saint Vincent and the Grenadines ...................................................................................................... 202Suriname ............................................................................................................................................ 202Trinidad and Tobago ........................................................................................................................... 202United States ...................................................................................................................................... 202Uruguay .............................................................................................................................................. 203Venezuela, Bolivarian Republic of .................................................................................................... 203
Contents / xxvii
Figures
Figure 1. Immigration levels in 2013 per thousand persons resident in the country ..................... 8Figure 2. International migrants from other countries of the Americas, by country
of destination, 2013 ........................................................................................................... 9Figure 3. Permanent migrants as a percent of all migrants, by origin, 2012-2013 ...................... 10Figure 4. International migration by type for migration, permanent and temporary, 2013 ......... 11Figure 5. Women among labor migrants in the Americas, 2012-2013 ......................................... 14Figure 6. Acquisitions of nationality by continent of previous nationality, 2000-2013 .................. 20Figure 7. Expatriation rate and population size, 2013 ................................................................... 38Figure 8. Remittances to Latin America and the Caribbean, 2001-2013 ...................................... 48Figure 9. Remittances to Latin America and the Caribbean, 2006-2013,
according to destination .................................................................................................. 49Figure 10. LAC remittances annual percentage change, 2007-2013 .............................................. 50Figure 11. Remittances to Latin America and the Caribbean as a percentage of
GDP, 2007-2013................................................................................................................ 53
Boxes
Box 1. Permanent and temporary immigration ........................................................................... 3Box 2. An improved coverage of outflows from the Americas................................................... 20Box 3. Classifying the skill level of jobs .................................................................................... 43
xxviii /
ACRONYMS
AECID Agencia Española de Cooperación para el Desarrollo
CAN Andean Community
CARICOM Caribbean Community and Common Market
EU European Union
GDP Gross Domestic Product
IDB Inter-American Development Bank
LAC Latin American and the Caribbean
MERCOSUR Southern Common Market
MIF Multilateral Investment Fund
NAFTA North American Free Trade Agreement
OAS Organization of American States
OECD Organisation for Economic Co-operation and Development
SICA Central American Integration System
SICREMI Continuous Reporting System on International Migration in the Americas
UNHCR United Nations High Commissioner for Refugees
PART I
Trends in International Migration and Labor Market Outcomes

PART I Trends in International Migration and Labor Market Outcomes / 3
Introductory overview
Economic growth in the countries of the Americas largely maintained itself throughout 2011-2013, at somewhat lower levels than the recovery year of 2010, following the economic crisis of 2008-2009. Indeed growth rates over the period for Latin American and Caribbean
countries averaged over 4% across countries, which was close to twice the rate observed for the United States and Canada.
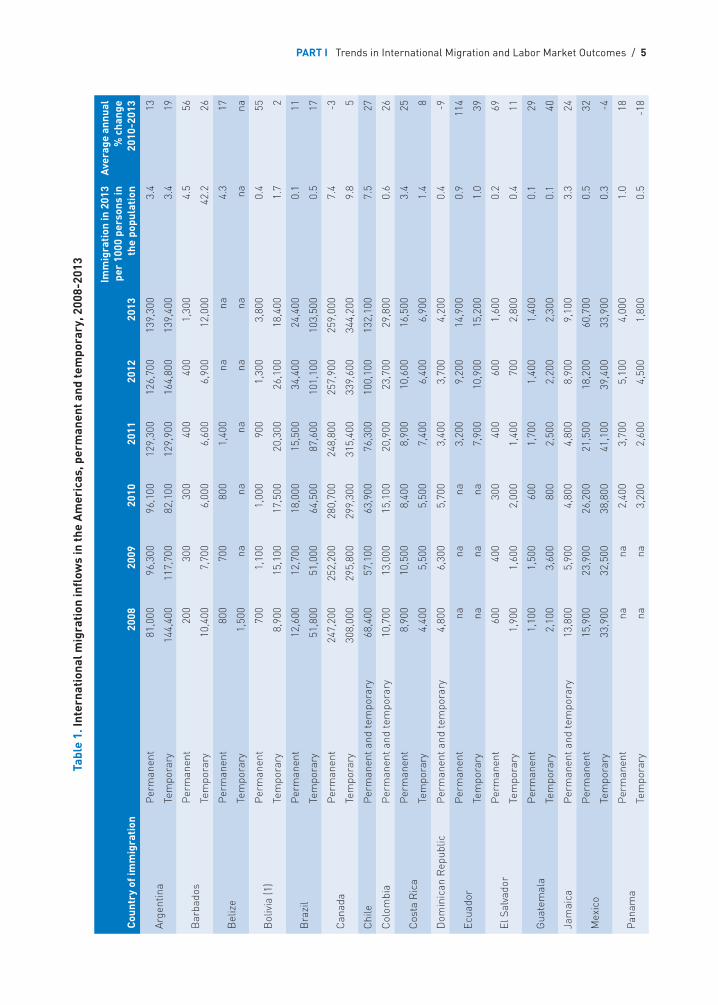
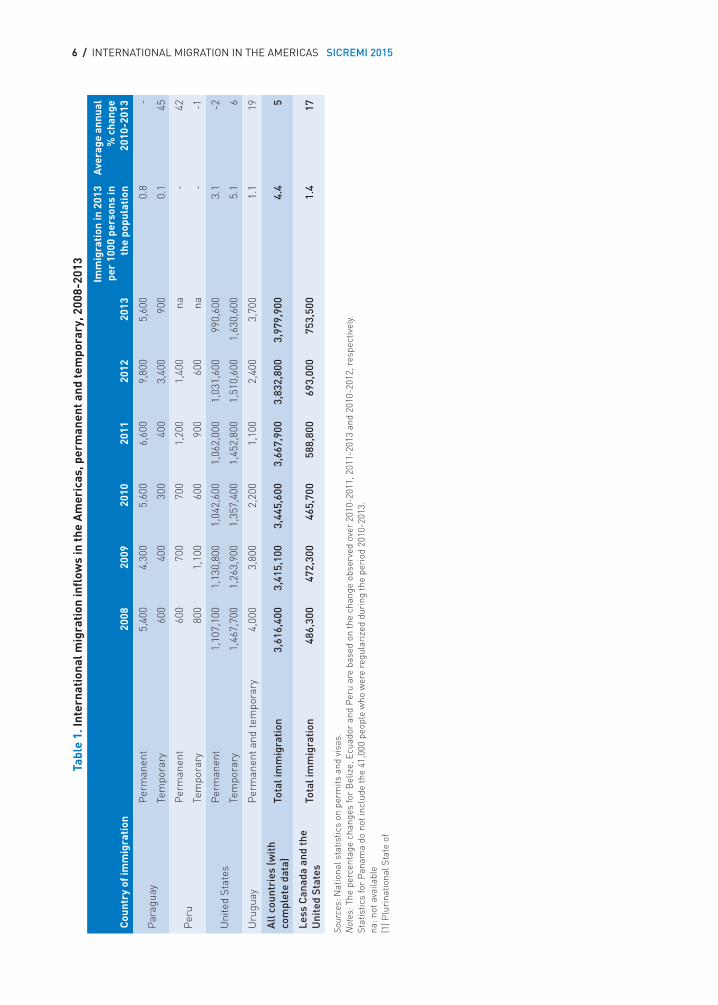
In the context of these growth rates, international migration, counting both permanent and temporary movements (see Box 1), increased by an average of 5% per year overall over the 2011-2013 period, but by an average of 17% per year for Latin American and Caribbean countries (Table 1). At this rate of increase, the level of immigrant inflows in these countries would double in about four years.
Box 1. Permanent and temporary immigration
For the purposes of this publication, a temporary immigrant is a person of foreign nationality who enters a country with a visa or who receives a permit which is either not renewable or only renewable on a limited basis. Temporary immigrants are seasonal workers, international students, service providers, persons on international exchange, etc. A permanent immigrant, on the other hand, is a person who enters with the right of permanent residence or with a visa or permit which is indefinitely renewable. Permanent immigrants would generally include marriage immigrants, family members of permanent residents, refugees, certain labor migrants, etc. Generally, tourists, diplomats, business visitors and transport crew members are excluded from either of these two groups in the definitions used in this publication.
Most countries also allow for the possibility of changes of status, that is, persons entering as temporary immigrants may be able to obtain the right of permanent residence or an indefinitely renewable permit, provided certain conditions are met. A change of status is generally an exceptional situation, that is, it is not the main avenue towards a permanent residence permit. However, there exist migration regimes (see below) which allow virtually all persons entering under certain temporary permits the possibility of changing to permanent status after a minimum number of years of residence in the country.
Under the definition presented here, a person granted a temporary permit is not necessarily a temporary immigrant, if the permit is indefinitely renewable and therefore places the migrant on what might be said to be a permanent migration “track”. For statistical purposes, persons who enter a country on a permanent migration track are counted as permanent immigrants in the year when they enter, and not in the year when they receive the right of permanent residence. Temporary immigrants who change status, however, are counted twice, once when they enter as temporary immigrants and a second time when they change to permanent status. Although this may seem like double-counting, it is deemed to be similar to a situation in which a temporary immigrant returns to the country of origin and re-migrates as a permanent immigrant, in which case the immigrant would be counted separately on each occasion.
The above perspective on immigration is based on the residence rights granted by the destination state. Other definitions commonly used elsewhere are based on the duration of the permit,
4 / INTERNATIONAL MIGRATION IN THE AMERICAS SICREMI 2015
Box 1. Permanent and temporary immigration
irrespective of residence rights, and distinguish, for example, between long-term immigrants (greater than one year) and short-term immigrants (less than one year). Although such definitions may be easier to implement in practice, they tend to confound immigrants who more often than not return to their countries of origin (international students) and others who tend to stay in the destination country (marriage immigrants), if both groups receive permits of similar duration, which is sometimes the case. This confounding is not necessarily a drawback for the purpose of demographic accounting, but tends to produce statistics which are less closely linked to migration policy concerns, where the distinctions between the rights of permanent and of temporary residence are fundamental.
The national statistics used to produce the flow numbers in Table 1 have been “harmonized” where necessary to ensure that they respect, to the extent possible, the distinction between permanent and temporary migration outlined above.
In a number of countries figuring in this publication, in particular Chile, Colombia and the Dominican Republic, virtually all immigrants are granted temporary permits upon entry and many, if not all, are allowed to apply to become permanent residents after a certain number of years of residence in the country. However, the percentage of such immigrants who remain in the country tends to be relatively low. For example, in Chile in 2010, about 64 thousand persons received temporary permits; however, two years later, when almost all would be eligible to apply and receive permanent residence, only 27 thousand did so. It therefore seems inappropriate to consider all immigrants entering under such regimes as permanent immigrants. Because it is not generally possible for such countries to distinguish between permanent and temporary immigrants on the basis of the permit granted at the time of entry, the limited duration entry permits for these countries are considered to cover both permanent and temporary immigrants in this report.
PART I Trends in International Migration and Labor Market Outcomes / 5
Tabl
e 1.
Inte
rnat
iona
l mig
rati
on in
flow
s in
the
Am
eric
as, p
erm
anen
t and
tem
pora
ry, 2
008-
2013
Cou
ntry
of i
mm
igra
tion
2008
2009
2010
2011
2012
2013
Imm
igra
tion
in 2
013
per
1000
per
sons
in
the
popu
lati
on
Ave
rage
ann
ual
% c
hang
e 20
10-2
013
Arge
ntin
aP
erm
anen
t81
,000
96,3
0096
,100
129,
300
126,
700
139,
300
3.4
13
Tem
pora
ry14
4,40
011
7,70
082
,100
129,
900
164,
800
139,
400
3.4
19
Bar
bado
sP
erm
anen
t20
030
030
040
040
01,
300
4.5
56
Tem
pora
ry10
,400
7,70
06,
000
6,60
06,
900
12,0
0042
.226
Bel
ize
Per
man
ent
800
700
800
1,40
0na
na4.
317
Tem
pora
ry1,
500
nana
nana
nana
na
Bol
ivia
(1)
Per
man
ent
700
1,10
01,
000
900
1,30
03,
800
0.4
55
Tem
pora
ry8,
900
15,1
0017
,500
20,3
0026
,100
18,4
001.
72
Bra
zil
Per
man
ent
12,6
0012
,700
18,0
0015
,500
34,4
0024
,400
0.1
11
Tem
pora
ry51
,800
51,0
0064
,500
87,6
0010
1,10
010
3,50
00.
517
Can
ada
Per
man
ent
247,
200
252,
200
280,
700
248,
800
257,
900
259,
000
7.4
-3
Tem
pora
ry30
8,00
029
5,80
029
9,30
031
5,40
033
9,60
034
4,20
09.
85
Chi
leP
erm
anen
t and
tem
pora
ry68
,400
57,1
0063
,900
76,3
0010
0,10
013
2,10
07.
527
Col
ombi
aP
erm
anen
t and
tem
pora
ry10
,700
13,0
0015
,100
20,9
0023
,700
29,8
000.
626
Cos
ta R
ica
Per
man
ent
8,90
010
,500
8,40
08,
900
10,6
0016
,500
3.4
25
Tem
pora
ry4,
400
5,50
05,
500
7,40
06,
400
6,90
01.
48
Dom
inic
an R
epub
licP
erm
anen
t and
tem
pora
ry4,
800
6,30
05,
700
3,40
03,
700
4,20
00.
4-9
Ecua
dor
Per
man
ent
nana
na3,
200
9,20
014
,900
0.9
114
Tem
pora
ryna
nana
7,90
010
,900
15,2
001.
039
El S
alva
dor
Per
man
ent
600
400
300
400
600
1,60
00.
269
Tem
pora
ry1,
900
1,60
02,
000
1,40
070
02,
800
0.4
11
Gua
tem
ala
Per
man
ent
1,10
01,
500
600
1,70
01,
400
1,40
00.
129
Tem
pora
ry2,
100
3,60
080
02,
500
2,20
02,
300
0.1
40
Jam
aica
Per
man
ent a
nd te
mpo
rary
13,8
005,
900
4,80
04,
800
8,90
09,
100
3.3
24
Mex
ico
Per
man
ent
15,9
0023
,900
26,2
0021
,500
18,2
0060
,700
0.5
32
Tem
pora
ry33
,900
32,5
0038
,800
41,1
0039
,400
33,9
000.
3-4
Pan
ama
Per
man
ent
nana
2,40
03,
700
5,10
04,
000
1.0
18
Tem
pora
ryna
na3,
200
2,60
04,
500
1,80
00.
5-1
8
6 / INTERNATIONAL MIGRATION IN THE AMERICAS SICREMI 2015
Cou
ntry
of i
mm
igra
tion
2008
2009
2010
2011
2012
2013
Imm
igra
tion
in 2
013
per
1000
per
sons
in
the
popu
lati
on
Ave
rage
ann
ual
% c
hang
e 20
10-2
013
Par
agua
yP
erm
anen
t5,
400
4,30
05,
600
6,60
09,
800
5,60
00.
8-
Tem
pora
ry60
040
030
040
03,
400
900
0.1
45
Per
uP
erm
anen
t60
070
070
01,
200
1,40
0na
-42
Tem
pora
ry80
01,
100
600
900
600
na-
-1
Uni
ted
Stat
esP
erm
anen
t1,
107,
100
1,13
0,80
01,
042,
600
1,06
2,00
01,
031,
600
990,
600
3.1
-2
Tem
pora
ry1,
467,
700
1,26
3,90
01,
357,
400
1,45
2,80
01,
510,
600
1,63
0,60
05.
16
Uru
guay
Per
man
ent a
nd te
mpo
rary
4,00
03,
800
2,20
01,
100
2,40
03,
700
1.1
19
All
cou
ntri
es (w
ith
com
plet
e da
ta)
Tota
l im
mig
rati
on
3,61
6,40
03,
415,
100
3,44
5,60
03,
667,
900
3,83
2,80
03,
979,
900
4.4
5
Less
Can
ada
and
the
Uni
ted
Stat
esTo
tal i
mm
igra
tion
486,
300
472,
300
465,
700
588,
800
693,
000
753,
500
1.4
17
Sour
ces:
Nat
iona
l sta
tistic
s on
per
mits
and
vis
as.
Not
es: T
he p
erce
ntag
e ch
ange
s fo
r B
eliz
e, E
cuad
or a
nd P
eru
are
base
d on
the
chan
ge o
bser
ved
over
201
0-20
11, 2
011-
2013
and
201
0-20
12, r
espe
ctiv
ely.
St
atis
tics
for
Pan
ama
do n
ot in
clud
e th
e 41
,000
peo
ple
who
wer
e re
gula
rize
d du
ring
the
peri
od 2
010-
2013
. na
: not
ava
ilabl
e (1
) Plu
rina
tiona
l Sta
te o
f
Tabl
e 1.
Inte
rnat
iona
l mig
rati
on in
flow
s in
the
Am
eric
as, p
erm
anen
t and
tem
pora
ry, 2
008-
2013
PART I Trends in International Migration and Labor Market Outcomes / 7
As noted in the 2012 issue of this report (OAS/OECD 2012), it is difficult to draw close links between aggregate economic push and pull factors and the level of international migration in many countries of the Americas. Migration inflows in many countries are generally very low compared to those ob-served in most OECD countries and may be affected by movements related to civil strife (for example, Colombia), natural catastrophes (Haiti) or other idiosyncratic causes. Still economic factors undoubt-edly operate at the regional level where cross-border labor markets exist. In addition, the liberaliza-tion of movements in the context of regional trade agreements (Mercosur, the Andean Pact, SICA and CARICOM) has almost certainly contributed to regional movements in recent years.
Permanent migration to the United States and Canada declined somewhat over the 2010-2013 period, but was offset by an increase of about 6% in temporary migration. Permanent migration to these countries tends to be rather stable, however, because it is subject to numerical limits or target levels, but may still move up or down in response to increases or declines in, for example, resettled or recognized refugees, whose numbers are not predictable. Temporary migration, on the other hand, tends to respond more to economic factors, because much of it tends to be labor migration, and labor migrants tend to move mainly in response to demand from employers, which varies according to the economic cycle.
Many countries of the Americas showed double-digit increases in both permanent and temporary migration over the 2009-2012 period, albeit in many cases from very low levels.1 The level of authorized migration has increased overall by over 60% between 2010 and 2013, following two years of little change. In numerical terms, most of this increase was recorded in Argentina, Brazil, Chile, Colombia and Mexico, but many smaller countries, among them Barbados, Costa Rica, Ecuador, El Salvador, Guatemala, Jamaica, Paraguay and Uruguay, recorded high annual growth rates over the period, often in excess of 25%.
Authorized immigration levels remain low in most countries, often far below the rates recorded, for example, in the United States (over 8 persons per thousand population) and Canada (17 persons per thousand population). Barbados by contrast showed very high levels of immigration on any scale, at almost 47 persons per 1,000 population. Most of this was temporary migration, and about 80% of this was about equally divided between international students and workers with short-term permits.
Barbados, Belize, Costa Rica and Argentina have levels of permanent migration (Figure 1) in proportion to their populations which are higher than those of the United States but, with the exception of Barbados, trail the latter with respect to temporary migration. These countries together with Chile can be said to have entered the mainstream of immigration countries. At the other end of the spectrum are Brazil, Peru, El Salvador and Guatemala, which have especially low rates of immigration overall relative to their populations.
The breakdown of immigration according to permanent or temporary status differs considerably across countries, with Mexico, Paraguay, Panama and Costa Rica in particular showing a higher prevalence of permanent migration in recent years and most other countries either a roughly equal balance between the two or lower levels of permanent than temporary. Generally temporary migration tends to be work- or study-related, while permanent migration is often dominated by family migration, including the accompanying family of workers, family reunification of previous migrants
1 The analyses of immigration in this report are based on the statistics of legal migration. There are indications that for many countries, this represents a fraction of total migration movements. See Annex 1 of this issue.
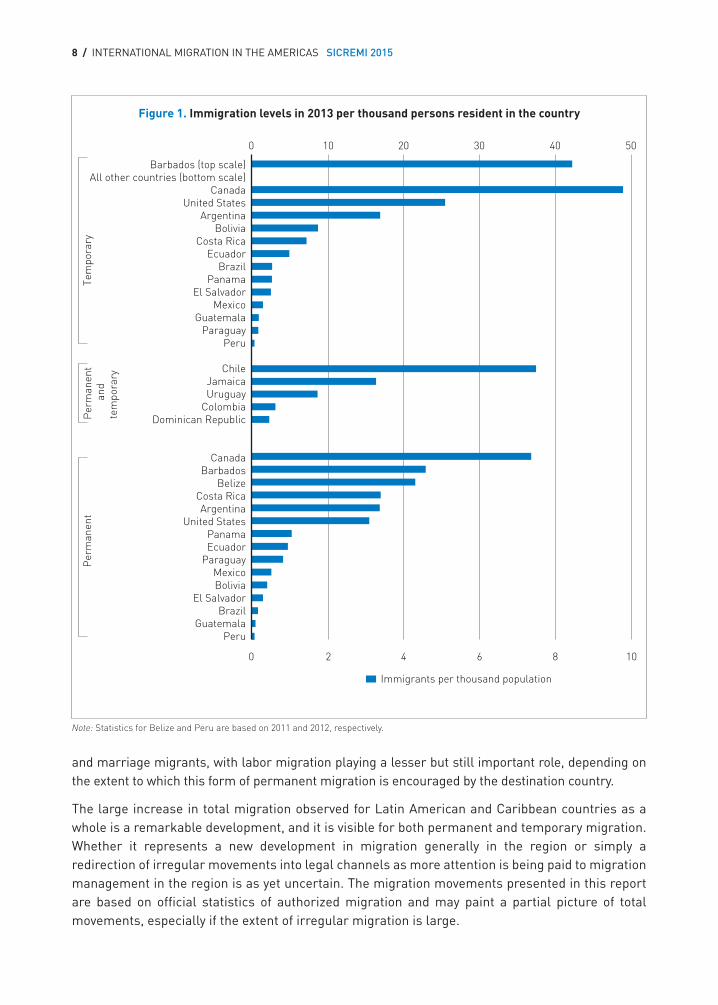
8 / INTERNATIONAL MIGRATION IN THE AMERICAS SICREMI 2015
and marriage migrants, with labor migration playing a lesser but still important role, depending on the extent to which this form of permanent migration is encouraged by the destination country.
The large increase in total migration observed for Latin American and Caribbean countries as a whole is a remarkable development, and it is visible for both permanent and temporary migration. Whether it represents a new development in migration generally in the region or simply a redirection of irregular movements into legal channels as more attention is being paid to migration management in the region is as yet uncertain. The migration movements presented in this report are based on official statistics of authorized migration and may paint a partial picture of total movements, especially if the extent of irregular migration is large.
Figure 1. Immigration levels in 2013 per thousand persons resident in the country
0 10 20 30 40 50
0 2 4 6 8 10
Peru Guatemala
Brazil El Salvador
Bolivia Mexico
Paraguay Ecuador Panama
United States Argentina
Costa Rica Belize
Barbados Canada
Dominican Republic Colombia Uruguay Jamaica
Chile
Peru Paraguay
Guatemala Mexico
El Salvador Panama
Brazil Ecuador
Costa Rica Bolivia
Argentina United States
Canada All other countries (bottom scale)
Barbados (top scale)
Per
man
ent
Per
man
ent
and
tem
pora
ry
Tem
pora
ry
Immigrants per thousand population
Note: Statistics for Belize and Peru are based on 2011 and 2012, respectively.
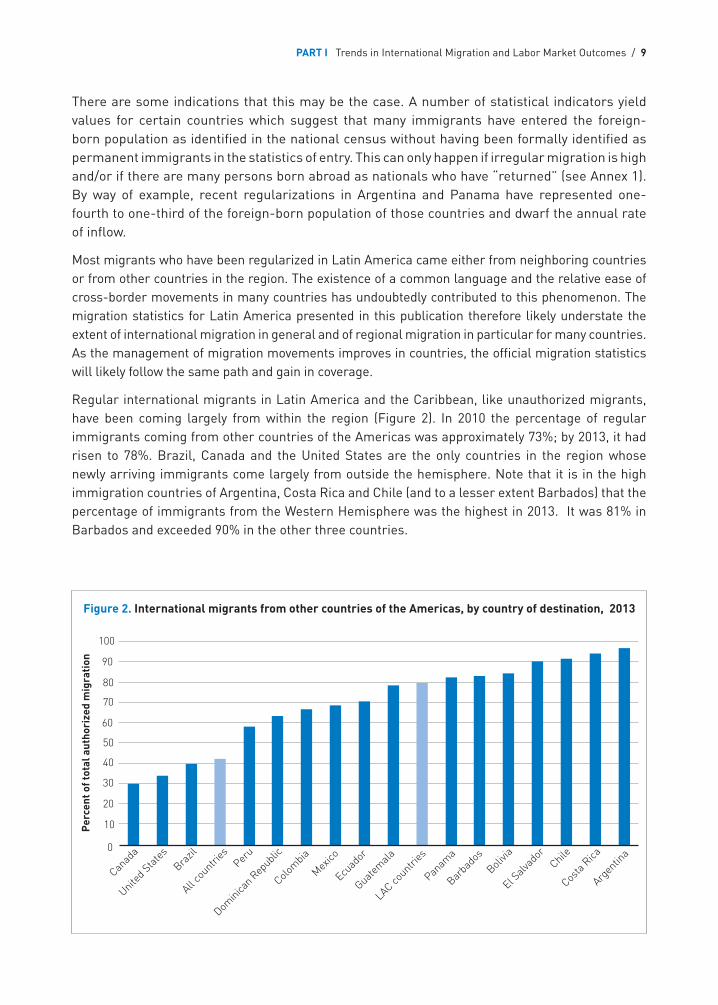
PART I Trends in International Migration and Labor Market Outcomes / 9
There are some indications that this may be the case. A number of statistical indicators yield values for certain countries which suggest that many immigrants have entered the foreign-born population as identified in the national census without having been formally identified as permanent immigrants in the statistics of entry. This can only happen if irregular migration is high and/or if there are many persons born abroad as nationals who have “returned” (see Annex 1). By way of example, recent regularizations in Argentina and Panama have represented one-fourth to one-third of the foreign-born population of those countries and dwarf the annual rate of inflow.
Most migrants who have been regularized in Latin America came either from neighboring countries or from other countries in the region. The existence of a common language and the relative ease of cross-border movements in many countries has undoubtedly contributed to this phenomenon. The migration statistics for Latin America presented in this publication therefore likely understate the extent of international migration in general and of regional migration in particular for many countries. As the management of migration movements improves in countries, the official migration statistics will likely follow the same path and gain in coverage.
Regular international migrants in Latin America and the Caribbean, like unauthorized migrants, have been coming largely from within the region (Figure 2). In 2010 the percentage of regular immigrants coming from other countries of the Americas was approximately 73%; by 2013, it had risen to 78%. Brazil, Canada and the United States are the only countries in the region whose newly arriving immigrants come largely from outside the hemisphere. Note that it is in the high immigration countries of Argentina, Costa Rica and Chile (and to a lesser extent Barbados) that the percentage of immigrants from the Western Hemisphere was the highest in 2013. It was 81% in Barbados and exceeded 90% in the other three countries.
Figure 2. International migrants from other countries of the Americas, by country of destination, 2013
0
10
20
30
40
50
60
70
80
90
100
United S
tates
Canad
aPer
uBra
zil
Dominica
n Rep
ublic
All cou
ntries
Colom
bia
Mexico
Ecuad
or
Guatem
ala
LAC countri
es
Panam
a
Barba
dos
El Salv
ador
Bolivia
Costa
RicaChile
Argen
tina
Per
cent
of t
otal
aut
hori
zed
mig
rati
on
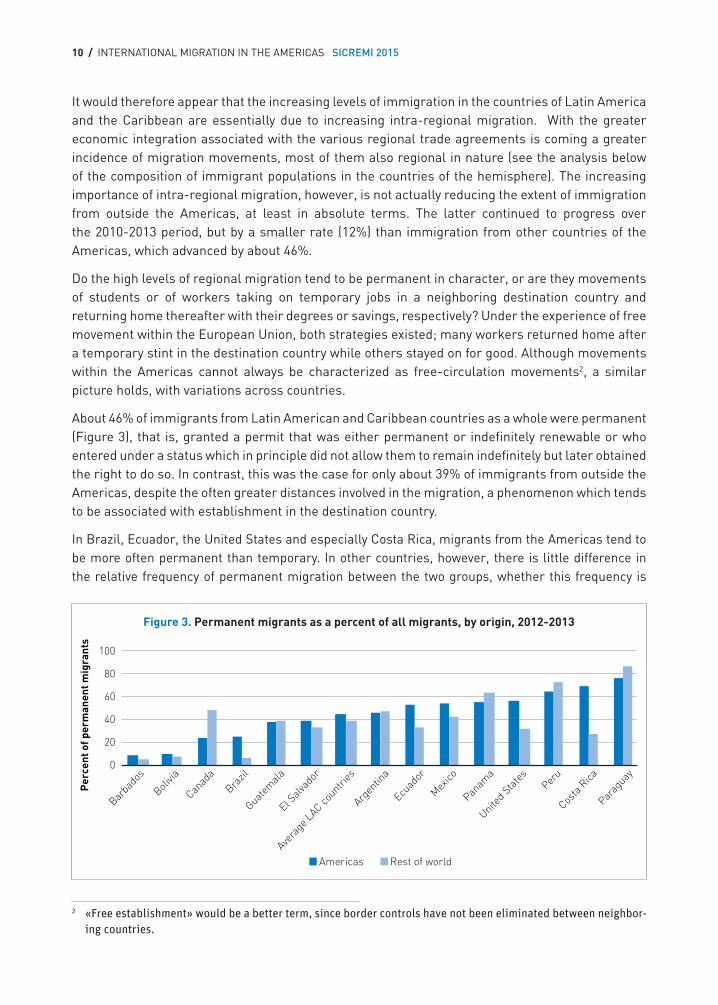
10 / INTERNATIONAL MIGRATION IN THE AMERICAS SICREMI 2015
It would therefore appear that the increasing levels of immigration in the countries of Latin America and the Caribbean are essentially due to increasing intra-regional migration. With the greater economic integration associated with the various regional trade agreements is coming a greater incidence of migration movements, most of them also regional in nature (see the analysis below of the composition of immigrant populations in the countries of the hemisphere). The increasing importance of intra-regional migration, however, is not actually reducing the extent of immigration from outside the Americas, at least in absolute terms. The latter continued to progress over the 2010-2013 period, but by a smaller rate (12%) than immigration from other countries of the Americas, which advanced by about 46%.
Do the high levels of regional migration tend to be permanent in character, or are they movements of students or of workers taking on temporary jobs in a neighboring destination country and returning home thereafter with their degrees or savings, respectively? Under the experience of free movement within the European Union, both strategies existed; many workers returned home after a temporary stint in the destination country while others stayed on for good. Although movements within the Americas cannot always be characterized as free-circulation movements2, a similar picture holds, with variations across countries.
About 46% of immigrants from Latin American and Caribbean countries as a whole were permanent (Figure 3), that is, granted a permit that was either permanent or indefinitely renewable or who entered under a status which in principle did not allow them to remain indefinitely but later obtained the right to do so. In contrast, this was the case for only about 39% of immigrants from outside the Americas, despite the often greater distances involved in the migration, a phenomenon which tends to be associated with establishment in the destination country.
In Brazil, Ecuador, the United States and especially Costa Rica, migrants from the Americas tend to be more often permanent than temporary. In other countries, however, there is little difference in the relative frequency of permanent migration between the two groups, whether this frequency is
2 «Free establishment» would be a better term, since border controls have not been eliminated between neighbor-ing countries.
Figure 3. Permanent migrants as a percent of all migrants, by origin, 2012-2013
United S
tate
s
Canad
aBra
zil
Avera
ge LAC co
untries
Parag
uay
Costa
Rica
Peru
Mexico
Ecuad
or
Guatem
ala
Panam
a
Barba
dos
Bolivia
El Salv
ador
Argen
tina
60
40
20
0
80
100
Americas Rest of world
Per
cent
of p
erm
anen
t mig
rant
s
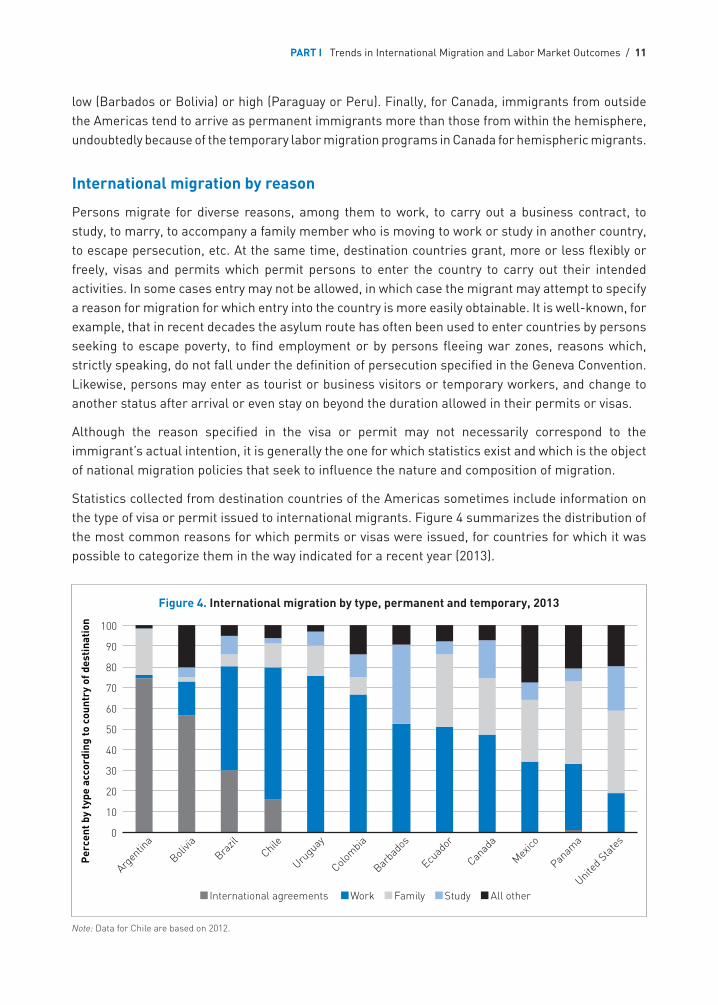
PART I Trends in International Migration and Labor Market Outcomes / 11
low (Barbados or Bolivia) or high (Paraguay or Peru). Finally, for Canada, immigrants from outside the Americas tend to arrive as permanent immigrants more than those from within the hemisphere, undoubtedly because of the temporary labor migration programs in Canada for hemispheric migrants.
International migration by reason
Persons migrate for diverse reasons, among them to work, to carry out a business contract, to study, to marry, to accompany a family member who is moving to work or study in another country, to escape persecution, etc. At the same time, destination countries grant, more or less flexibly or freely, visas and permits which permit persons to enter the country to carry out their intended activities. In some cases entry may not be allowed, in which case the migrant may attempt to specify a reason for migration for which entry into the country is more easily obtainable. It is well-known, for example, that in recent decades the asylum route has often been used to enter countries by persons seeking to escape poverty, to find employment or by persons fleeing war zones, reasons which, strictly speaking, do not fall under the definition of persecution specified in the Geneva Convention. Likewise, persons may enter as tourist or business visitors or temporary workers, and change to another status after arrival or even stay on beyond the duration allowed in their permits or visas.
Although the reason specified in the visa or permit may not necessarily correspond to the immigrant’s actual intention, it is generally the one for which statistics exist and which is the object of national migration policies that seek to influence the nature and composition of migration.
Statistics collected from destination countries of the Americas sometimes include information on the type of visa or permit issued to international migrants. Figure 4 summarizes the distribution of the most common reasons for which permits or visas were issued, for countries for which it was possible to categorize them in the way indicated for a recent year (2013).
Figure 4. International migration by type, permanent and temporary, 2013
0
10
20
30
40
50
60
70
80
90
100
Argen
tina
Bolivia
Brazil
Chile
Urugu
ay
Colom
bia
Barba
dos
Ecuad
or
Canad
a
Mexico
Panam
a
United S
tates
International agreements Work Family Study All other
Per
cent
by
type
acc
ordi
ng to
cou
ntry
of d
esti
nati
on
Note: Data for Chile are based on 2012.
12 / INTERNATIONAL MIGRATION IN THE AMERICAS SICREMI 2015
The first thing to note is the growing importance of permits granted on the basis of international agreements, in particular Mercosur, in some countries. The absence of such permits in the chart for other countries does not necessarily mean that there were no entries under international agreements, but rather that the data have not been categorized primarily in this way. It is obvious, for example, that there have been movements between Canada, Mexico and the United States under NAFTA, but such movements are showing up as migration for “work” reasons and those of the accompanying family members as migration for “family” reasons rather than as migration in the context of international agreements.
Likewise, in some countries having signed trade agreements allowing for the right of free establishment, international students may not show up as having migrated with a study permit but rather as having moved subject to an international agreement. Eventually, as migration regimes move more and more towards free circulation or establishment, visas or permits may disappear entirely for persons falling under such regimes, making the statistical task of measuring the scale and type of movements even more challenging. This has happened, for example, in certain countries in the European Union, where there are often no permits or visas required for citizens of member countries.3 In a number of countries in Figure 4, family migration levels appear low, likely because accompanying family migrants are being granted the same type of visa or permit as the principal applicant and are not identified separately. Other countries may not follow this kind of practice; for these, family migration levels appear more significant.
For all of the reasons cited here and undoubtedly others as well, the statistics presented in Figure 4 are difficult to interpret from a comparative perspective.
In Argentina and Bolivia, a majority of international migrants enter under international agreements, most of them certainly for work-related reasons. In Brazil, relatively few Mercosur migrants are granted permits in the formal work permit system, but many appear in the federal police register as Mercosur migrants. Recall that in many Latin American countries having carried out regularization programs, the large majority of persons regularized come from other countries in the Americas. The creation of formal Mercosur permits is a concrete manifestation of the more liberal migration regimes which are appearing under the wings of Mercosur. At the same time, however, some information is lost, namely that about the reason for the migration, with work, family and study migration often being confounded under the same rubric.
The distribution of migration reasons observed for countries on the right-hand side of the chart, especially for Canada and the United States, provides a useful benchmark of what to expect for countries without free establishment or free circulation regimes. The United States permanent migration regime, as is well known, emphasizes the migration of persons with family in the United States and is the most strongly family-oriented migration regime in the OECD. The Canadian permanent regime is, in certain respects, more “typical” and also, much more significant in scale, admitting roughly two and one half times more permanent immigrants per person in the population than does the United States. Much of the additional migration in Canada consists of labor migrants and their families. Indeed, it can be said that labor and study migration are the only flexible parts of a migration regime, with immediate family and humanitarian migration being largely non-
3 In other countries, free-circulation migrants may still be identifiable and countable because of a requirement to register or to carry a nominal permit, which is automatically granted to eligible persons.
PART I Trends in International Migration and Labor Market Outcomes / 13
discretionary as a result of being subject to international treaties and generally recognized human rights.4
When both temporary and permanent migration are grouped, the Canadian regime consists of 27% family migration, 19% study migration and 47% labor migration. Migration to Brazil, by contrast, consists of 6% family migration, 30% under international agreements, 9% study and 50% direct labor migration. Relative to the other kinds of migration, the family migration levels in Brazil seem rather low. However, a higher proportion of the labor migration in Brazil is temporary (97%) compared to Canada (77%), and temporary migrants tend to come less often with their families than permanent migrants.
The situation in Argentina may well reflect what can be expected in more and more Latin American countries with the liberalization of movements in the region, with fully three quarters of all migration, both permanent and temporary, falling under international agreements.
The feminization of migration
It has become relatively common to speak about the changing role of women in migration and, in particular, of the fact that they are more and more taking the lead in migration, with their spouses joining them later. This is in contrast to the traditional view of the male worker going first, becoming established and bringing in his family once the employment and living situation has stabilized and he has saved enough to pay their way. A second traditional pattern is for the family to migrate as a unit, with the male spouse being the so-called “principal migrant”, that is, the one who arrives with a job or who enters the labor market upon arrival. Such family migration patterns are of course not the only kind observed; migration also takes place among single persons, for which there is no subsequent family reunification, except perhaps in cases where the migrant returns to the origin country to find a spouse.
One reason for the perception that migration patterns are changing, aside from the fact that women are more present in the labor market generally than in the past, is the fact that certain jobs available to immigrants are in occupations which have tended to be more taken up traditionally by women than men. This is especially the case for household occupations, particularly those involving care, whether of children or the elderly, or those related to domestic service.
Still, for most countries of the Americas, the immigration of women from other countries of the Americas remains a minority phenomenon, with 45% of immigrants overall being women, approximately the same percentage as for immigrants from the rest of the world (Table 2). Only in Chile and Costa Rica do women constitute a majority of immigrants. At the other end of the spectrum, women account for less than 40% of all immigrants in Canada, Peru and Colombia.
As family members arrive in destination countries to join the original migrant, there is a natural tendency for the balance between the two genders to equalize. A surer indication of the extent to which the traditional pattern is changing is to look at the relative presence of men and women in family and labor migration, respectively. But here as well, one observes the traditional pattern of a significantly greater presence of women among family migrants (59%) and a lesser presence among labor migrants (32%, Figure 5). The traditional pattern is stronger among immigrants from
4 The right of permanent immigrants to live with their families, to marry and to adopt whom they wish.
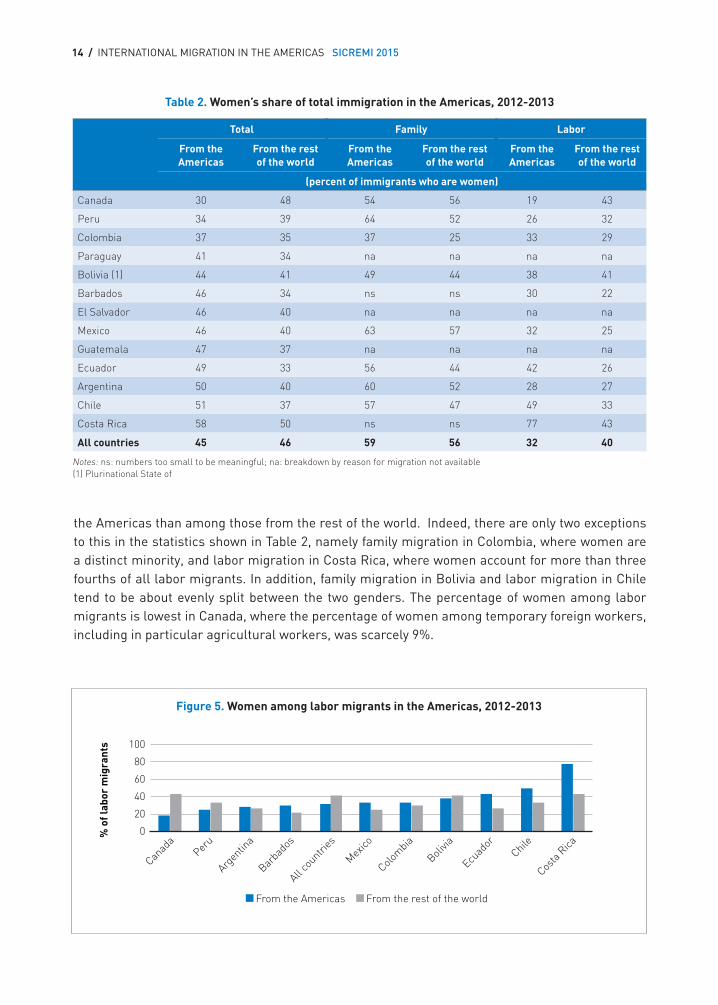
14 / INTERNATIONAL MIGRATION IN THE AMERICAS SICREMI 2015
Table 2. Women’s share of total immigration in the Americas, 2012-2013
Total Family Labor
From the Americas
From the rest of the world
From the Americas
From the rest of the world
From the Americas
From the rest of the world
(percent of immigrants who are women)
Canada 30 48 54 56 19 43
Peru 34 39 64 52 26 32
Colombia 37 35 37 25 33 29
Paraguay 41 34 na na na na
Bolivia (1) 44 41 49 44 38 41
Barbados 46 34 ns ns 30 22
El Salvador 46 40 na na na na
Mexico 46 40 63 57 32 25
Guatemala 47 37 na na na na
Ecuador 49 33 56 44 42 26
Argentina 50 40 60 52 28 27
Chile 51 37 57 47 49 33
Costa Rica 58 50 ns ns 77 43
All countries 45 46 59 56 32 40
Notes: ns: numbers too small to be meaningful; na: breakdown by reason for migration not available (1) Plurinational State of
the Americas than among those from the rest of the world. Indeed, there are only two exceptions to this in the statistics shown in Table 2, namely family migration in Colombia, where women are a distinct minority, and labor migration in Costa Rica, where women account for more than three fourths of all labor migrants. In addition, family migration in Bolivia and labor migration in Chile tend to be about evenly split between the two genders. The percentage of women among labor migrants is lowest in Canada, where the percentage of women among temporary foreign workers, including in particular agricultural workers, was scarcely 9%.
Figure 5. Women among labor migrants in the Americas, 2012-2013
0
20
40
60
80
100
Canad
a Per
u
Argen
tina
Barba
dos
All cou
ntries
Mexico
Colom
bia
Bolivia
Ecuad
or
Chile
Costa
Rica
From the Americas From the rest of the world
% o
f lab
or m
igra
nts
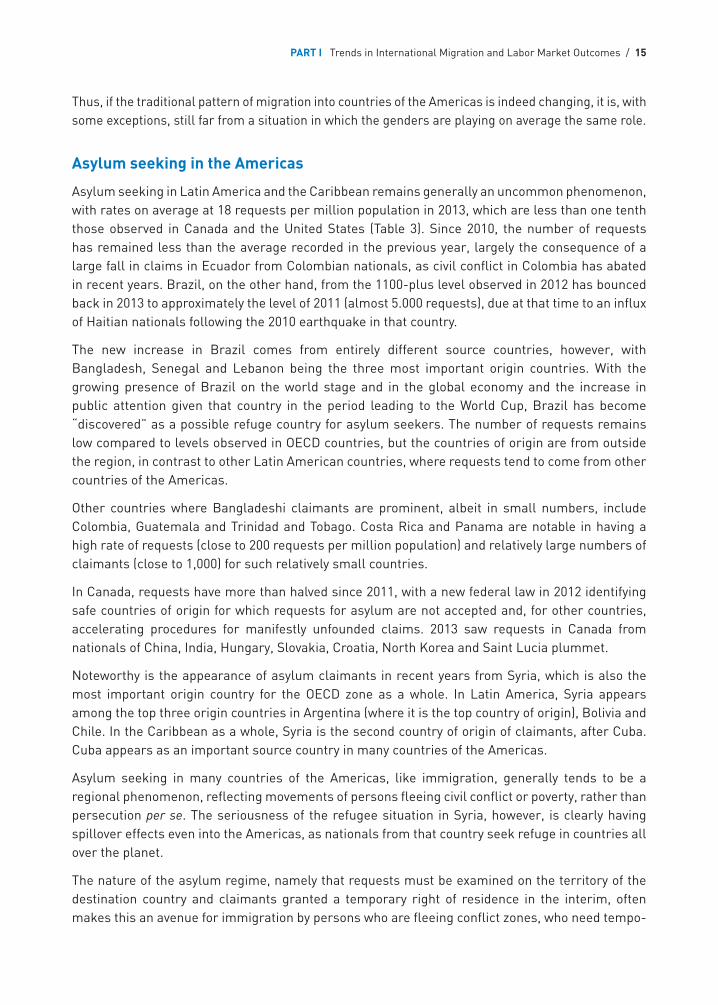
PART I Trends in International Migration and Labor Market Outcomes / 15
Thus, if the traditional pattern of migration into countries of the Americas is indeed changing, it is, with some exceptions, still far from a situation in which the genders are playing on average the same role.
Asylum seeking in the Americas
Asylum seeking in Latin America and the Caribbean remains generally an uncommon phenomenon, with rates on average at 18 requests per million population in 2013, which are less than one tenth those observed in Canada and the United States (Table 3). Since 2010, the number of requests has remained less than the average recorded in the previous year, largely the consequence of a large fall in claims in Ecuador from Colombian nationals, as civil conflict in Colombia has abated in recent years. Brazil, on the other hand, from the 1100-plus level observed in 2012 has bounced back in 2013 to approximately the level of 2011 (almost 5.000 requests), due at that time to an influx of Haitian nationals following the 2010 earthquake in that country.
The new increase in Brazil comes from entirely different source countries, however, with Bangladesh, Senegal and Lebanon being the three most important origin countries. With the growing presence of Brazil on the world stage and in the global economy and the increase in public attention given that country in the period leading to the World Cup, Brazil has become “discovered” as a possible refuge country for asylum seekers. The number of requests remains low compared to levels observed in OECD countries, but the countries of origin are from outside the region, in contrast to other Latin American countries, where requests tend to come from other countries of the Americas.
Other countries where Bangladeshi claimants are prominent, albeit in small numbers, include Colombia, Guatemala and Trinidad and Tobago. Costa Rica and Panama are notable in having a high rate of requests (close to 200 requests per million population) and relatively large numbers of claimants (close to 1,000) for such relatively small countries.
In Canada, requests have more than halved since 2011, with a new federal law in 2012 identifying safe countries of origin for which requests for asylum are not accepted and, for other countries, accelerating procedures for manifestly unfounded claims. 2013 saw requests in Canada from nationals of China, India, Hungary, Slovakia, Croatia, North Korea and Saint Lucia plummet.
Noteworthy is the appearance of asylum claimants in recent years from Syria, which is also the most important origin country for the OECD zone as a whole. In Latin America, Syria appears among the top three origin countries in Argentina (where it is the top country of origin), Bolivia and Chile. In the Caribbean as a whole, Syria is the second country of origin of claimants, after Cuba. Cuba appears as an important source country in many countries of the Americas.
Asylum seeking in many countries of the Americas, like immigration, generally tends to be a regional phenomenon, reflecting movements of persons fleeing civil conflict or poverty, rather than persecution per se. The seriousness of the refugee situation in Syria, however, is clearly having spillover effects even into the Americas, as nationals from that country seek refuge in countries all over the planet.
The nature of the asylum regime, namely that requests must be examined on the territory of the destination country and claimants granted a temporary right of residence in the interim, often makes this an avenue for immigration by persons who are fleeing conflict zones, who need tempo-
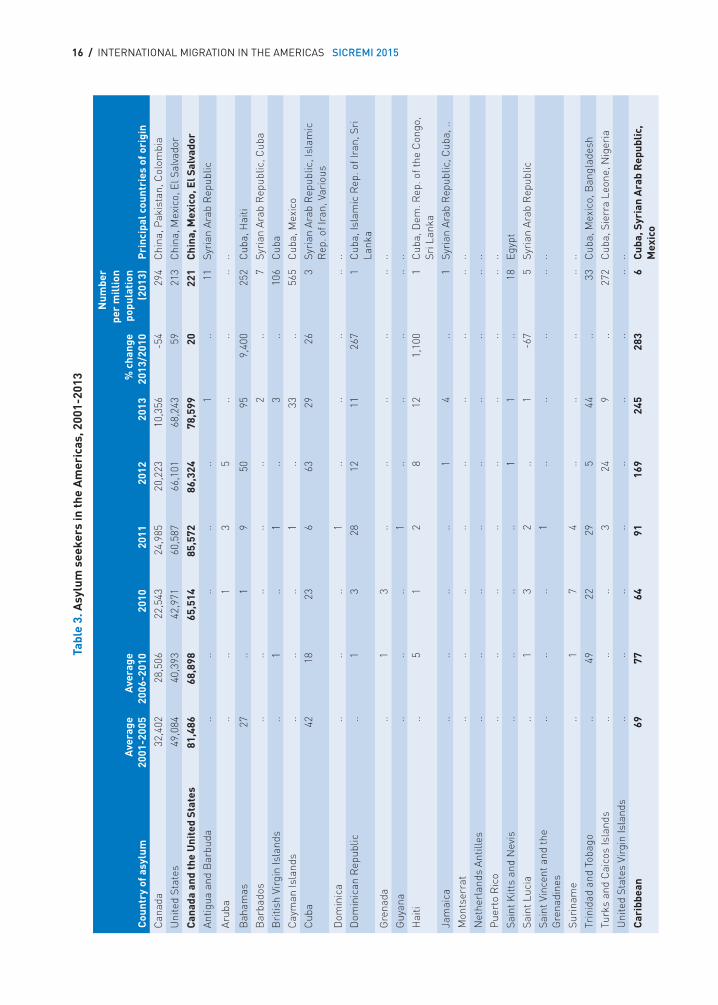
16 / INTERNATIONAL MIGRATION IN THE AMERICAS SICREMI 2015
Tabl
e 3.
Asy
lum
see
kers
in th
e A
mer
icas
, 200
1-20
13
Cou
ntry
of a
sylu
mA
vera
ge
2001
-200
5A
vera
ge
2006
-201
020
10
2011
20
12
2013
%
cha
nge
2013
/201
0
Num
ber
per
mill
ion
popu
lati
on
(201
3)P
rinc
ipal
cou
ntri
es o
f ori
gin
Can
ada
32,
402
28,
506
22,
543
24,
985
20,
223
10,
356
-54
294
Chi
na, P
akis
tan,
Col
ombi
a
Uni
ted
Stat
es 4
9,08
4 4
0,39
3 4
2,97
1 6
0,58
7 6
6,10
1 6
8,24
3 59
213
Chi
na, M
exic
o, E
l Sal
vado
r
Can
ada
and
the
Uni
ted
Stat
es 8
1,48
6 6
8,89
8 6
5,51
4 8
5,57
2 8
6,32
4 7
8,59
9 20
221
Chi
na, M
exic
o, E
l Sal
vado
rAn
tigua
and
Bar
buda
....
....
..1
..11
Syri
an A
rab
Rep
ublic
Arub
a..
..1
35
....
....
Bah
amas
27..
19
5095
9,40
025
2C
uba,
Hai
ti
Bar
bado
s..
....
....
2..
7Sy
rian
Ara
b R
epub
lic, C
uba
Bri
tish
Virg
in Is
land
s..
1..
1..
3..
106
Cub
a
Cay
man
Isla
nds
....
..1
..33
..56
5C
uba,
Mex
ico
Cub
a42
1823
663
2926
3Sy
rian
Ara
b R
epub
lic, I
slam
ic
Rep
. of I
ran,
Var
ious
Dom
inic
a..
....
1..
....
....
Dom
inic
an R
epub
lic..
13
2812
1126
71
Cub
a, Is
lam
ic R
ep. o
f Ira
n, S
ri
Lank
a
Gre
nada
..1
3..
....
....
..
Guy
ana
....
..1
....
....
..
Hai
ti..
51
28
121,
100
1C
uba,
Dem
. Rep
. of t
he C
ongo
, Sr
i Lan
ka
Jam
aica
....
....
14
..1
Syri
an A
rab
Rep
ublic
, Cub
a, ..
Mon
tser
rat
....
....
....
....
..
Net
herl
ands
Ant
illes
....
....
....
....
..
Pue
rto
Ric
o..
....
....
....
....
Sain
t Kitt
s an
d N
evis
....
....
11
..18
Egyp
t
Sain
t Luc
ia..
13
2..
1-6
75
Syri
an A
rab
Rep
ublic
Sain
t Vin
cent
and
the
Gre
nadi
nes
....
..1
....
....
..
Suri
nam
e..
17
4..
....
....
Trin
idad
and
Tob
ago
..49
2229
544
..33
Cub
a, M
exic
o, B
angl
ades
h
Turk
s an
d C
aico
s Is
land
s..
....
324
9..
272
Cub
a, S
ierr
a Le
one,
Nig
eria
Uni
ted
Stat
es V
irgi
n Is
land
s..
....
....
....
....
Car
ibbe
an69
7764
9116
924
528
36
Cub
a, S
yria
n A
rab
Rep
ublic
, M
exic
o
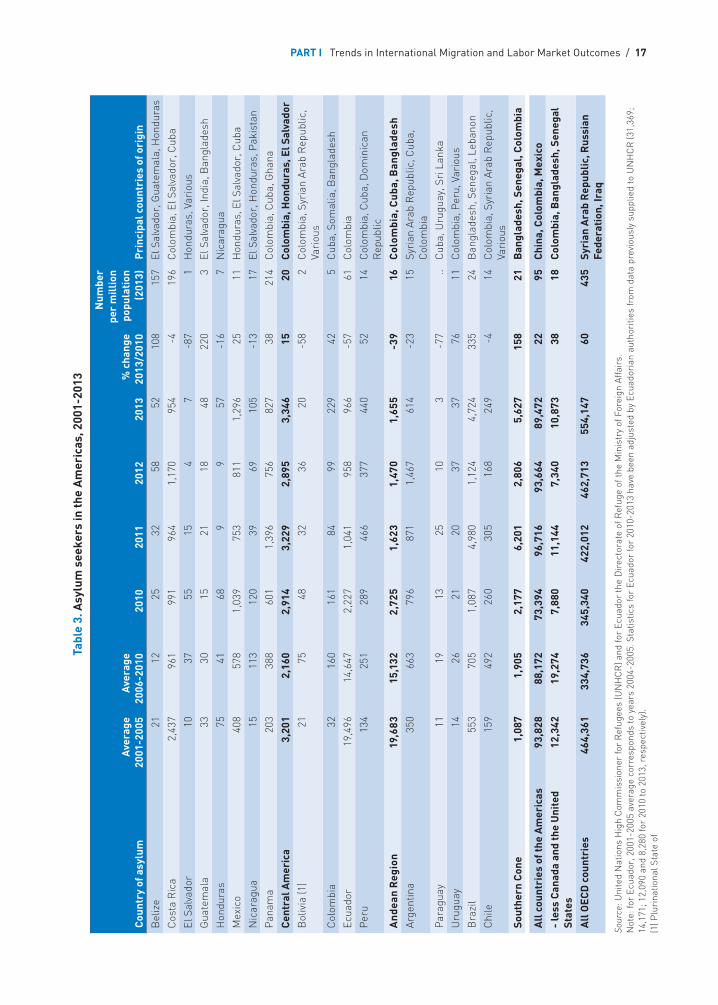
PART I Trends in International Migration and Labor Market Outcomes / 17
Tabl
e 3.
Asy
lum
see
kers
in th
e A
mer
icas
, 200
1-20
13
Cou
ntry
of a
sylu
mA
vera
ge
2001
-200
5A
vera
ge
2006
-201
020
10
2011
20
12
2013
%
cha
nge
2013
/201
0
Num
ber
per
mill
ion
popu
lati
on
(201
3)P
rinc
ipal
cou
ntri
es o
f ori
gin
Bel
ize
2112
2532
5852
108
157
El S
alva
dor,
Gua
tem
ala,
Hon
dura
s
Cos
ta R
ica
2,43
796
199
196
41,
170
954
-419
6C
olom
bia,
El S
alva
dor,
Cub
a
El S
alva
dor
1037
5515
47
-87
1H
ondu
ras,
Var
ious
Gua
tem
ala
3330
1521
1848
220
3El
Sal
vado
r, In
dia,
Ban
glad
esh
Hon
dura
s75
4168
99
57-1
67
Nic
arag
ua
Mex
ico
408
578
1,03
975
381
11,
296
2511
Hon
dura
s, E
l Sal
vado
r, C
uba
Nic
arag
ua15
113
120
3969
105
-13
17El
Sal
vado
r, H
ondu
ras,
Pak
ista
n
Pan
ama
203
388
601
1,39
675
682
738
214
Col
ombi
a, C
uba,
Gha
na
Cen
tral
Am
eric
a 3
,201
2
,160
2
,914
3
,229
2
,895
3
,346
15
20C
olom
bia,
Hon
dura
s, E
l Sal
vado
rB
oliv
ia (1
)21
7548
3236
20-5
82
Col
ombi
a, S
yria
n Ar
ab R
epub
lic,
Vari
ous
Col
ombi
a32
160
161
8499
229
425
Cub
a, S
omal
ia, B
angl
ades
h
Ecua
dor
19,
496
14,
647
2,2
27
1,0
41
958
9
66
-57
61C
olom
bia
Per
u13
425
128
946
637
744
052
14C
olom
bia,
Cub
a, D
omin
ican
R
epub
lic
And
ean
Reg
ion
19,6
83
15,
132
2,7
25
1,6
23
1,4
70
1,6
55
-39
16C
olom
bia,
Cub
a, B
angl
ades
hAr
gent
ina
350
6
63
796
8
71
1,4
67
614
-2
315
Syri
an A
rab
Rep
ublic
, Cub
a,
Col
ombi
a
Par
agua
y11
1913
2510
3-7
7..
Cub
a, U
rugu
ay, S
ri L
anka
Uru
guay
1426
2120
3737
7611
Col
ombi
a, P
eru,
Var
ious
Bra
zil
553
7
05
1,0
87
4,9
80
1,1
24
4,7
24
335
24B
angl
ades
h, S
eneg
al, L
eban
on
Chi
le 1
59
492
2
60
305
1
68
249
-4
14C
olom
bia,
Syr
ian
Arab
Rep
ublic
, Va
riou
s
Sout
hern
Con
e 1
,087
1
,905
2
,177
6
,201
2
,806
5
,627
15
821
Ban
glad
esh,
Sen
egal
, Col
ombi
a
All
cou
ntri
es o
f the
Am
eric
as 9
3,82
8 8
8,17
2 7
3,39
4 9
6,71
6 9
3,66
4 8
9,47
2 22
95C
hina
, Col
ombi
a, M
exic
o
- le
ss C
anad
a an
d th
e U
nite
d St
ates
12,
342
19,
274
7,8
80
11,
144
7,3
40
10,
873
3818
Col
ombi
a, B
angl
ades
h, S
eneg
al
All
OEC
D c
ount
ries
464
,361
3
34,7
36
345
,340
4
22,0
12
462
,713
5
54,1
47
6043
5Sy
rian
Ara
b R
epub
lic, R
ussi
an
Fede
rati
on, I
raq
Sour
ce: U
nite
d N
atio
ns H
igh
Com
mis
sion
er fo
r R
efug
ees
(UN
HC
R) a
nd fo
r Ec
uado
r th
e D
irec
tora
te o
f Ref
uge
of th
e M
inis
try
of F
orei
gn A
ffair
s.
Not
e: fo
r Ec
uado
r, 2
001-
2005
ave
rage
cor
resp
onds
to y
ears
200
4-20
05. S
tatis
tics
for
Ecua
dor
for
2010
-201
3 ha
ve b
een
adju
sted
by
Ecua
dori
an a
utho
ritie
s fr
om d
ata
prev
ious
ly s
uppl
ied
to U
NH
CR
(31,
369;
14
,171
; 12,
090
and
8,28
0 fo
r 20
10 to
201
3, r
espe
ctiv
ely)
. (1
) Plu
rina
tiona
l Sta
te o
f
18 / INTERNATIONAL MIGRATION IN THE AMERICAS SICREMI 2015
rary protection or who might otherwise find it difficult to obtain a regular visa. The asylum regime, originally instituted as a vehicle for persons fleeing persecution, has thus by the force of circum-stances been used by persons fleeing or leaving their countries of origin in much more diverse situations. This is evident in the Americas as it is elsewhere.
Acquisitions of nationality5
The acquisition by an immigrant of the nationality of the country where her/she resides can often be taken as an indication of an intention to stay for good. Because naturalization is subject to conditions, among them generally a minimum period of residence in the country and often knowledge of the language of country, persons who acquire the nationality of their country of residence will have invested a certain amount of time, effort and indeed financial resources in their adopted country. This obviously does not obviate the possibility of maintaining ties or transferring funds back to relatives in the country of origin, but because of the advantages conveyed by naturalization, it does reduce the incentive to return. Studies have shown, for example, that naturalization tends to have a beneficial outcome on labor market outcomes, even after taking into account characteristics associated with the acquisition of nationality, such as the level of educational attainment or the presence of family (OECD 2011).
Holding the nationality of the country of residence can also serve as a sort of insurance that guarantees the holder’s residence rights, should he/she wish to return to the country of origin for a period of time and be ensured of the right to re-enter. Still, the relative ease of access to citizenship in countries such as Australia and Canada has not led to higher rates of return to origin countries in those countries, suggesting that immigrants do often have permanent immigration strategies. This is all the more the case if they arrive with their families, as both Australia and Canada encourage their permanent immigrants to do.
Naturalization rates in countries of the Americas tend to be low in relation to permanent immigration levels (Table 4). Statistics for Canada and the United States, which are long-standing immigration countries, again provide a useful benchmark in this regard. For both, the ratio of acquisitions to permanent immigration levels is in the vicinity of 0.7. Since a certain proportion of permanent immigrants do not stay in the destination country, the actual naturalization rate of persons who reside in the country long enough to be naturalized is likely to be even higher. 86% of foreign-born persons in Canada, for example, have Canadian citizenship (SC 2013).
For most Latin American and Caribbean countries, the ratio statistic is generally less than 0.3. In many of these countries there is relatively easy immigration to neighboring countries in the context of regional trade agreements, so there may not be a significant incentive to take out the nationality of the destination country. A similar behavior is observed for nationals of European Union countries who emigrate to other countries of the Union (OECD 2011).
There are three exceptions to the low naturalization rates observed for Latin American and Caribbean countries, namely Barbados, Belize and Peru, but this may be related more to differences in what is recorded as an acquisition of nationality than to fundamental legal differences. In Barbados and
5 By the acquisition of nationality, it is meant the process by which an individual, generally born in another coun-try, acquires the same legal rights as persons born in the country. Although a distinction is sometimes made between “citizenship” and “nationality”, in this chapter the terms will be used interchangeably.
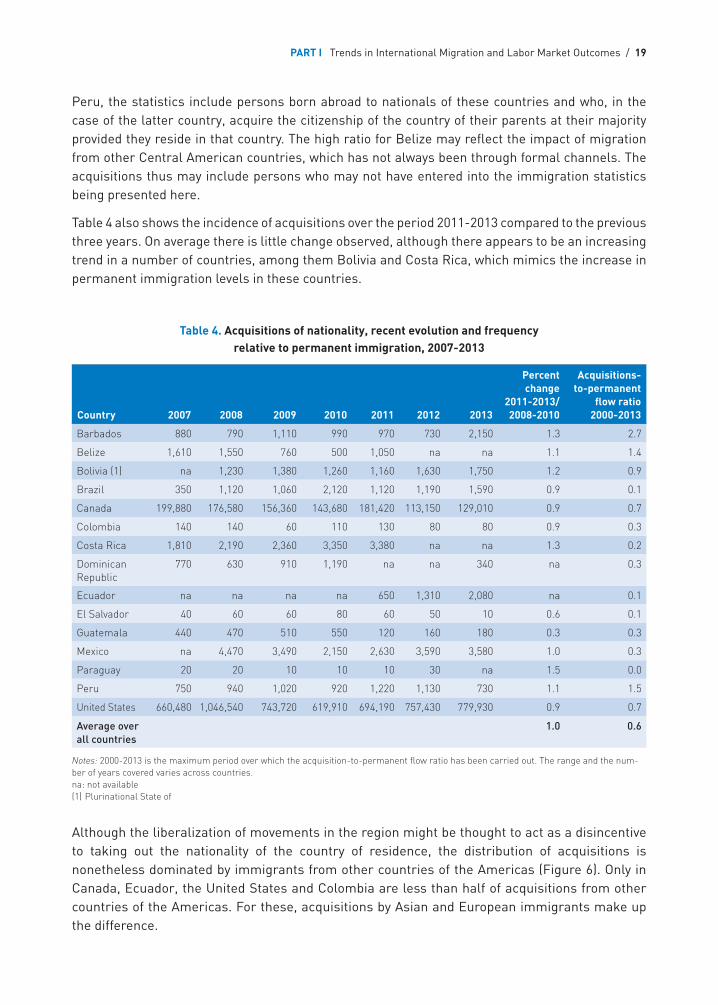
PART I Trends in International Migration and Labor Market Outcomes / 19
Peru, the statistics include persons born abroad to nationals of these countries and who, in the case of the latter country, acquire the citizenship of the country of their parents at their majority provided they reside in that country. The high ratio for Belize may reflect the impact of migration from other Central American countries, which has not always been through formal channels. The acquisitions thus may include persons who may not have entered into the immigration statistics being presented here.
Table 4 also shows the incidence of acquisitions over the period 2011-2013 compared to the previous three years. On average there is little change observed, although there appears to be an increasing trend in a number of countries, among them Bolivia and Costa Rica, which mimics the increase in permanent immigration levels in these countries.
Table 4. Acquisitions of nationality, recent evolution and frequency relative to permanent immigration, 2007-2013
Country 2007 2008 2009 2010 2011 2012 2013
Percent change
2011-2013/ 2008-2010
Acquisitions-to-permanent
flow ratio 2000-2013
Barbados 880 790 1,110 990 970 730 2,150 1.3 2.7
Belize 1,610 1,550 760 500 1,050 na na 1.1 1.4
Bolivia (1) na 1,230 1,380 1,260 1,160 1,630 1,750 1.2 0.9
Brazil 350 1,120 1,060 2,120 1,120 1,190 1,590 0.9 0.1
Canada 199,880 176,580 156,360 143,680 181,420 113,150 129,010 0.9 0.7
Colombia 140 140 60 110 130 80 80 0.9 0.3
Costa Rica 1,810 2,190 2,360 3,350 3,380 na na 1.3 0.2
Dominican Republic
770 630 910 1,190 na na 340 na 0.3
Ecuador na na na na 650 1,310 2,080 na 0.1
El Salvador 40 60 60 80 60 50 10 0.6 0.1
Guatemala 440 470 510 550 120 160 180 0.3 0.3
Mexico na 4,470 3,490 2,150 2,630 3,590 3,580 1.0 0.3
Paraguay 20 20 10 10 10 30 na 1.5 0.0
Peru 750 940 1,020 920 1,220 1,130 730 1.1 1.5
United States 660,480 1,046,540 743,720 619,910 694,190 757,430 779,930 0.9 0.7
Average over all countries
1.0 0.6
Notes: 2000-2013 is the maximum period over which the acquisition-to-permanent flow ratio has been carried out. The range and the num-ber of years covered varies across countries. na: not available (1) Plurinational State of
Although the liberalization of movements in the region might be thought to act as a disincentive to taking out the nationality of the country of residence, the distribution of acquisitions is nonetheless dominated by immigrants from other countries of the Americas (Figure 6). Only in Canada, Ecuador, the United States and Colombia are less than half of acquisitions from other countries of the Americas. For these, acquisitions by Asian and European immigrants make up the difference.
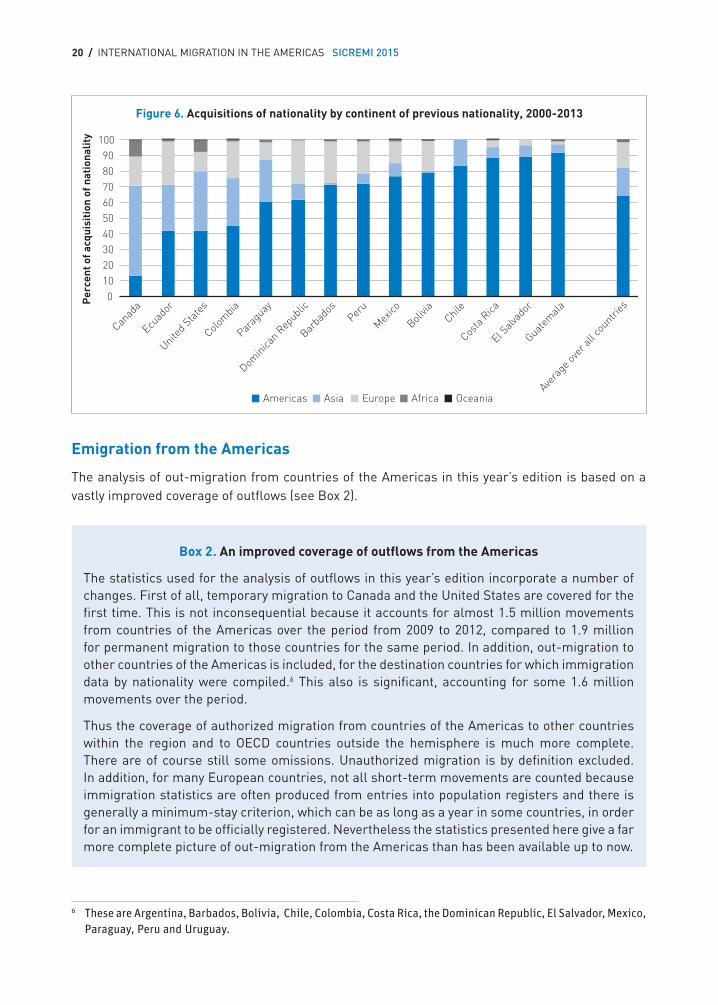
20 / INTERNATIONAL MIGRATION IN THE AMERICAS SICREMI 2015
Emigration from the Americas
The analysis of out-migration from countries of the Americas in this year’s edition is based on a vastly improved coverage of outflows (see Box 2).
Box 2. An improved coverage of outflows from the Americas
The statistics used for the analysis of outflows in this year’s edition incorporate a number of changes. First of all, temporary migration to Canada and the United States are covered for the first time. This is not inconsequential because it accounts for almost 1.5 million movements from countries of the Americas over the period from 2009 to 2012, compared to 1.9 million for permanent migration to those countries for the same period. In addition, out-migration to other countries of the Americas is included, for the destination countries for which immigration data by nationality were compiled.6 This also is significant, accounting for some 1.6 million movements over the period.
Thus the coverage of authorized migration from countries of the Americas to other countries within the region and to OECD countries outside the hemisphere is much more complete. There are of course still some omissions. Unauthorized migration is by definition excluded. In addition, for many European countries, not all short-term movements are counted because immigration statistics are often produced from entries into population registers and there is generally a minimum-stay criterion, which can be as long as a year in some countries, in order for an immigrant to be officially registered. Nevertheless the statistics presented here give a far more complete picture of out-migration from the Americas than has been available up to now.
6 These are Argentina, Barbados, Bolivia, Chile, Colombia, Costa Rica, the Dominican Republic, El Salvador, Mexico, Paraguay, Peru and Uruguay.
Figure 6. Acquisitions of nationality by continent of previous nationality, 2000-2013
0 10 20 30 40 50 60 70 80 90
100
Canad
a
Ecuad
or
United S
tate
s
Colom
bia
Parag
uay
Dominica
n Rep
ublic
Barba
dos
Peru
Mexico
Bolivia
Chile
Costa
Rica
El Salv
ador
Guatem
ala
Avera
ge ov
er al
l cou
ntries
Americas Asia Europe Africa Oceania
Per
cent
of a
cqui
siti
on o
f nat
iona
lity
PART I Trends in International Migration and Labor Market Outcomes / 21
The first thing to note is the scale of movements, almost 6.5 million, in the period from 2009 to 2012 (Table 5). This represents almost 7 persons per thousand population in the origin countries. For migration to the same destination countries, the rest of the world sends 4 persons per thousand population.
Half of the out-migration from countries of the Americas is to Canada and the United States, one quarter to the rest of the OECD outside the Americas and one quarter to other countries of the Americas. By contrast barely 2% of migration from other regions of the world is to countries of the Americas other than Canada and the United States.
Migration to Canada and the United States from other countries of the Americas has never really recovered from the effects of the 2008-2009 economic crises. In 2012 movements were at 4% below their 2009 level at the trough of the recession. Other OECD countries outside the Americas, especially in Europe, have seen a further drop of 17% in migration from countries of the Americas since 2009, a consequence of a further deterioration of economic conditions due to the budget crisis in Europe, which followed on the heels of the recession. However, migration to other countries of the Americas has taken up the slack, increasing by over 39% over the 2009-2012 period. Although the stagnation of movements to North America and other countries of the OECD outside the Americas may have something to do with the increase in movements within the Americas, the latter have also certainly been fostered by the liberalization of movements associated with the numerous regional trade agreements and their expanding membership.
The high rates of growth in outflows to the Americas are observed in all regions, especially the Caribbean, the Andean Region and the Southern Cone. The increase is less significant in Central America, where out-migration tends to be dominated by the movements of Mexicans who tend to go to the United States and where movements of Guatemalans, Hondurans and Panamanians to other countries of the Americas have all declined by some 25% to 40% over the period.
Migration from the Caribbean to other countries of the Americas aside from Canada and the United States has increased the most, by 31%, but still accounts for only about 7% of total out-migration from this region. Nationals of Caribbean countries continue to go largely (79%) north, to Canada and the United States, although migration to these two countries has declined by 9% over the period.
Caribbeans have a particularly high out-migration rate, at 2.5% for the four years in question, with movements over the period representing the equivalent of some 5% to 6% of the population in Dominica, Grenada, Guyana, Jamaica and Saint Vincent and the Grenadines.7 These are exceedingly high out-migration rates, but include temporary movements. Still out-migration has declined in all countries of the Caribbean over the 2009 to 2012 period, with only Haiti in particular and to a lesser extent Jamaica showing increasing expatriation. The increase in Haiti is almost certainly attributable to the hardships associated with the 2010 earthquake.
It is as yet too early to tell if this increase in migration within the hemisphere outside of North America will maintain itself as economic conditions improve further in the United States and Europe, in particular Spain. Higher wages and often more favorable living conditions in North America and Europe than in neighboring countries may be lures which are too difficult to resist for potential migrants looking to improve their lives and those of their families.
7 Some of the movements over the four years may be by the same persons.
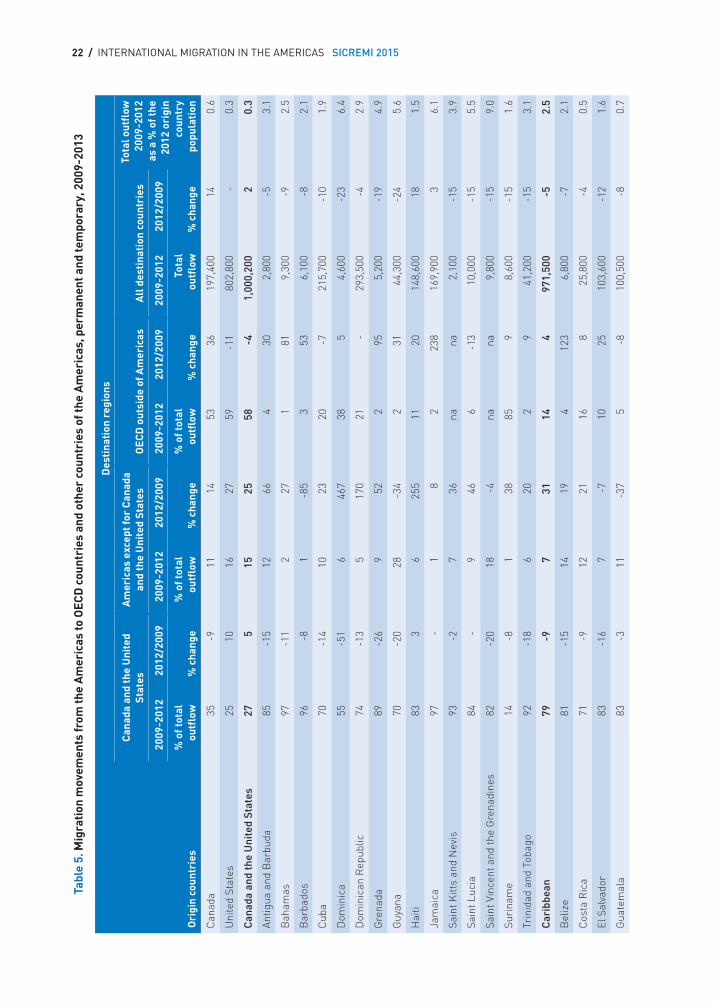
22 / INTERNATIONAL MIGRATION IN THE AMERICAS SICREMI 2015
Tabl
e 5.
Mig
ratio
n m
ovem
ents
from
the
Am
eric
as to
OEC
D c
ount
ries
and
oth
er c
ount
ries
of t
he A
mer
icas
, per
man
ent a
nd te
mpo
rary
, 200
9-20
13
Ori
gin
coun
trie
s
Des
tina
tion
reg
ions
Can
ada
and
the
Uni
ted
Stat
esA
mer
icas
exc
ept f
or C
anad
a an
d th
e U
nite
d St
ates
OEC
D o
utsi
de o
f Am
eric
asA
ll d
esti
nati
on c
ount
ries
Tota
l out
flow
20
09-2
012
as a
% o
f the
20
12 o
rigi
n co
untr
y po
pula
tion
2009
-201
220
12/2
009
2009
-201
220
12/2
009
2009
-201
220
12/2
009
2009
-201
220
12/2
009
% o
f tot
al
outfl
ow%
cha
nge
% o
f tot
al
outfl
ow%
cha
nge
% o
f tot
al
outfl
ow%
cha
nge
Tota
l ou
tflow
% c
hang
e
Can
ada
35-9
1114
5336
197,
400
140.
6
Uni
ted
Stat
es25
1016
2759
-11
802,
800
-0.
3
Can
ada
and
the
Uni
ted
Stat
es27
515
2558
-41,
000,
200
20.
3
Antig
ua a
nd B
arbu
da85
-15
1266
430
2,80
0-5
3.1
Bah
amas
97-1
12
271
819,
300
-92.
5
Bar
bado
s96
-81
-85
353
6,10
0-8
2.1
Cub
a70
-14
1023
20-7
215,
700
-10
1.9
Dom
inic
a55
-51
646
738
54,
600
-23
6.4
Dom
inic
an R
epub
lic74
-13
517
021
-29
3,50
0-4
2.9
Gre
nada
89-2
69
522
955,
200
-19
4.9
Guy
ana
70-2
028
-34
231
44,3
00-2
45.
6
Hai
ti83
36
255
1120
148,
600
181.
5
Jam
aica
97-
18
223
816
9,90
03
6.1
Sain
t Kitt
s an
d N
evis
93-2
736
nana
2,10
0-1
53.
9
Sain
t Luc
ia84
-9
466
-13
10,0
00-1
55.
5
Sain
t Vin
cent
and
the
Gre
nadi
nes
82-2
018
-4na
na9,
800
-15
9.0
Suri
nam
e14
-81
3885
98,
600
-15
1.6
Trin
idad
and
Tob
ago
92-1
86
202
941
,200
-15
3.1
Car
ibbe
an
79-9
731
144
971,
500
-52.
5
Bel
ize
81-1
514
194
123
6,80
0-7
2.1
Cos
ta R
ica
71-9
1221
168
25,8
00-4
0.5
El S
alva
dor
83-1
67
-710
2510
3,60
0-1
21.
6
Gua
tem
ala
83-3
11-3
75
-810
0,50
0-8
0.7
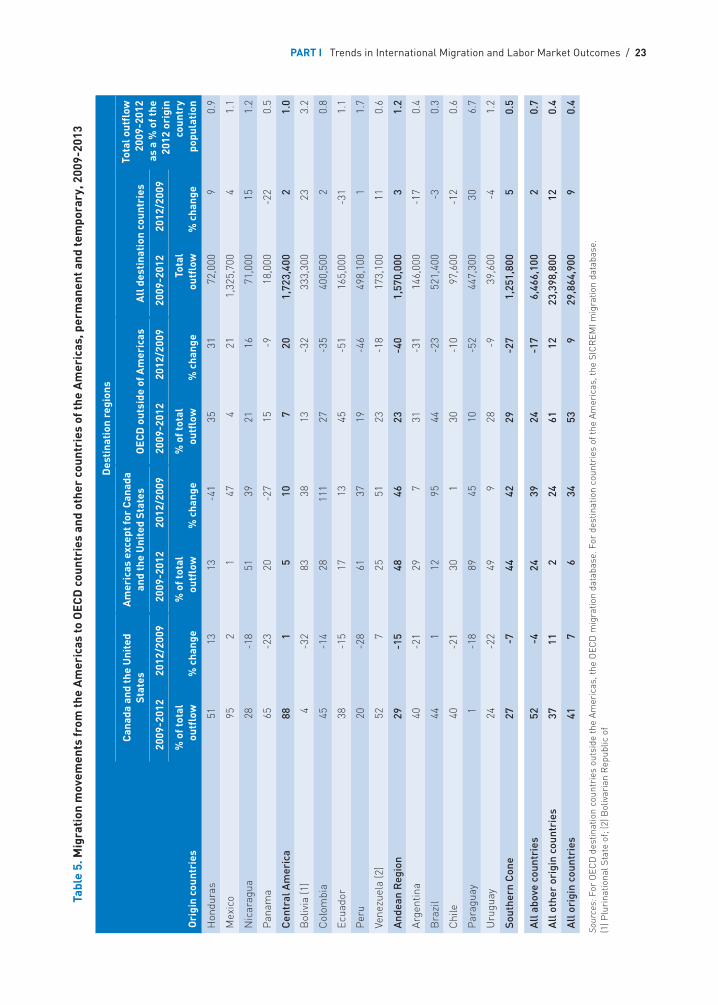
PART I Trends in International Migration and Labor Market Outcomes / 23
Ori
gin
coun
trie
s
Des
tina
tion
reg
ions
Can
ada
and
the
Uni
ted
Stat
esA
mer
icas
exc
ept f
or C
anad
a an
d th
e U
nite
d St
ates
OEC
D o
utsi
de o
f Am
eric
asA
ll d
esti
nati
on c
ount
ries
Tota
l out
flow
20
09-2
012
as a
% o
f the
20
12 o
rigi
n co
untr
y po
pula
tion
2009
-201
220
12/2
009
2009
-201
220
12/2
009
2009
-201
220
12/2
009
2009
-201
220
12/2
009
% o
f tot
al
outfl
ow%
cha
nge
% o
f tot
al
outfl
ow%
cha
nge
% o
f tot
al
outfl
ow%
cha
nge
Tota
l ou
tflow
% c
hang
e
Hon
dura
s51
1313
-41
3531
72,0
009
0.9
Mex
ico
952
147
421
1,32
5,70
04
1.1
Nic
arag
ua28
-18
5139
2116
71,0
0015
1.2
Pan
ama
65-2
320
-27
15-9
18,0
00-2
20.
5
Cen
tral
Am
eric
a88
15
107
201,
723,
400
21.
0
Bol
ivia
(1)
4-3
283
3813
-32
333,
300
233.
2
Col
ombi
a45
-14
2811
127
-35
400,
500
20.
8
Ecua
dor
38-1
517
1345
-51
165,
000
-31
1.1
Per
u20
-28
6137
19-4
649
8,10
01
1.7
Vene
zuel
a (2
)52
725
5123
-18
173,
100
110.
6
And
ean
Reg
ion
29-1
548
4623
-40
1,57
0,00
03
1.2
Arge
ntin
a40
-21
297
31-3
114
6,00
0-1
70.
4
Bra
zil
441
1295
44-2
352
1,40
0-3
0.3
Chi
le40
-21
301
30-1
097
,600
-12
0.6
Par
agua
y1
-18
8945
10-5
244
7,30
030
6.7
Uru
guay
24-2
249
928
-939
,600
-41.
2
Sout
hern
Con
e27
-744
4229
-27
1,25
1,80
05
0.5
All
abo
ve c
ount
ries
52
-424
3924
-17
6,46
6,10
02
0.7
All
oth
er o
rigi
n co
untr
ies
3711
224
6112
23,3
98,8
0012
0.4
All
ori
gin
coun
trie
s 41
76
3453
929
,864
,900
90.
4
Sour
ces:
For
OEC
D d
estin
atio
n co
untr
ies
outs
ide
the
Amer
icas
, the
OEC
D m
igra
tion
data
base
. For
des
tinat
ion
coun
trie
s of
the
Amer
icas
, the
SIC
REM
I mig
ratio
n da
taba
se.
(1) P
luri
natio
nal S
tate
of;
(2) B
oliv
aria
n R
epub
lic o
f
Tabl
e 5.
Mig
rati
on m
ovem
ents
from
the
Am
eric
as to
OEC
D c
ount
ries
and
oth
er c
ount
ries
of t
he A
mer
icas
, per
man
ent a
nd te
mpo
rary
, 200
9-20
13
24 / INTERNATIONAL MIGRATION IN THE AMERICAS SICREMI 2015
Settlement or return
In many emigration countries of the Americas, there is considerable attention given to the fate of nationals who have migrated to other countries, whether permanently or temporarily. This is both because origin countries wish to ensure that their emigrants are well treated in destination countries, but also because emigrants, through the remittances which they transfer back to origin countries or the skills and knowledge acquired abroad, can contribute to improving the lives of their families left behind and to the economic development of their countries of origin (see the chapter on remittances in OAS/OECD 2012). In addition, origin country governments wish to ensure a smooth and productive integration into the society of the country of those who do return, often with new skills and financial resources which can be put to productive use in the origin country.
But how many emigrants return or can be expected to return?
Before we consider direct measures of returns, we will first examine a number of basic indicators of settlement in the destination country. The first of these relates to the duration of residence in the destination country, the second to the acquisition of the nationality of the country of residence.
The longer an immigrant stays in a country not his/her own, the less likely he/she is to return to the country of origin. In economic terms, the immigrant will have invested a considerable amount of time, effort and indeed financial resources in the destination country, in learning the language (if necessary), work practices, social institutions and norms, not all of which will be lost upon a return to the country of origin, but are likely to be of less value and pertinence. In addition, there may be assets to dispose of and indeed considerable costs involved in the return. Finally, if migrants have families and children of school age, a return will often mean the disruption of school, the loss of friends and settlement in a new and unfamiliar environment, especially for children who may never have lived in the country of origin or who left it at a young age.
As returns begin to look more difficult and as the stay in the destination country lengthens, the issue of naturalization inevitably arises. The act of acquiring the nationality of the country of residence is generally viewed as a commitment to the destination country, while conveying additional rights on immigrants, among them access to all jobs in the civil service and to full voting rights in elections. Our interest here in the rate of naturalization, however, is its value as an indicator of the intention of long-term settlement. Paradoxically, acquiring the nationality of a country is the surest way for an immigrant to guarantee the right to leave without jeopardizing the right to come back. In practice, however, the difficulties associated with a return to the country of origin after an extended stay in the country of destination may mean that the acquisition is more often viewed by the immigrants as ensuring definitive settlement rather than a possibility of return.
Many countries of Latin America and the Caribbean saw considerable out-migration around the turn of the 21st century and thereafter. What has been the stay experience of migrants in the wake of this migration?
Table 6 provides an overview of indicators in this regard, covering separately immigrants from the Americas in the European Union (6a) and in the United States (6b). We examine the situation of immigrants to the European Union first.
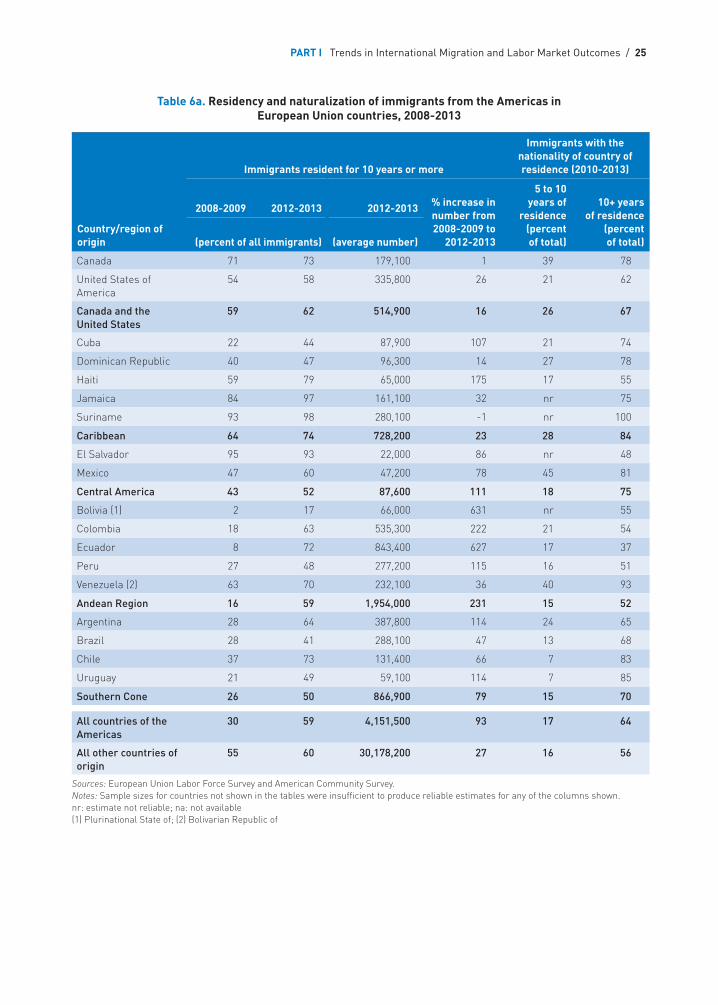
PART I Trends in International Migration and Labor Market Outcomes / 25
Table 6a. Residency and naturalization of immigrants from the Americas in European Union countries, 2008-2013
Country/region of origin
Immigrants resident for 10 years or more
Immigrants with the nationality of country of residence (2010-2013)
2008-2009 2012-2013 2012-2013 % increase in number from 2008-2009 to
2012-2013
5 to 10 years of
residence (percent of total)
10+ years of residence
(percent of total)(percent of all immigrants) (average number)
Canada 71 73 179,100 1 39 78
United States of America
54 58 335,800 26 21 62
Canada and the United States
59 62 514,900 16 26 67
Cuba 22 44 87,900 107 21 74
Dominican Republic 40 47 96,300 14 27 78
Haiti 59 79 65,000 175 17 55
Jamaica 84 97 161,100 32 nr 75
Suriname 93 98 280,100 -1 nr 100
Caribbean 64 74 728,200 23 28 84
El Salvador 95 93 22,000 86 nr 48
Mexico 47 60 47,200 78 45 81
Central America 43 52 87,600 111 18 75
Bolivia (1) 2 17 66,000 631 nr 55
Colombia 18 63 535,300 222 21 54
Ecuador 8 72 843,400 627 17 37
Peru 27 48 277,200 115 16 51
Venezuela (2) 63 70 232,100 36 40 93
Andean Region 16 59 1,954,000 231 15 52
Argentina 28 64 387,800 114 24 65
Brazil 28 41 288,100 47 13 68
Chile 37 73 131,400 66 7 83
Uruguay 21 49 59,100 114 7 85
Southern Cone 26 50 866,900 79 15 70
All countries of the Americas
30 59 4,151,500 93 17 64
All other countries of origin
55 60 30,178,200 27 16 56
Sources: European Union Labor Force Survey and American Community Survey. Notes: Sample sizes for countries not shown in the tables were insufficient to produce reliable estimates for any of the columns shown. nr: estimate not reliable; na: not available(1) Plurinational State of; (2) Bolivarian Republic of
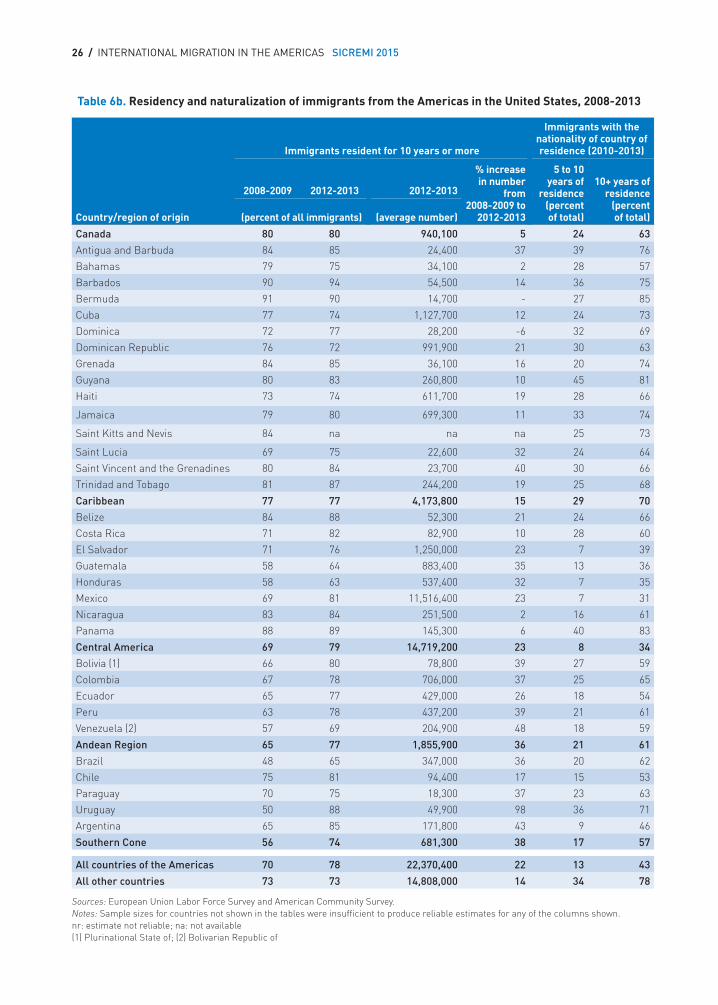
26 / INTERNATIONAL MIGRATION IN THE AMERICAS SICREMI 2015
Table 6b. Residency and naturalization of immigrants from the Americas in the United States, 2008-2013
Country/region of origin
Immigrants resident for 10 years or more
Immigrants with the nationality of country of residence (2010-2013)
2008-2009 2012-2013 2012-2013
% increase in number
from 2008-2009 to
2012-2013
5 to 10 years of
residence (percent of total)
10+ years of residence
(percent of total)(percent of all immigrants) (average number)
Canada 80 80 940,100 5 24 63
Antigua and Barbuda 84 85 24,400 37 39 76
Bahamas 79 75 34,100 2 28 57
Barbados 90 94 54,500 14 36 75
Bermuda 91 90 14,700 - 27 85
Cuba 77 74 1,127,700 12 24 73
Dominica 72 77 28,200 -6 32 69
Dominican Republic 76 72 991,900 21 30 63
Grenada 84 85 36,100 16 20 74
Guyana 80 83 260,800 10 45 81
Haiti 73 74 611,700 19 28 66
Jamaica 79 80 699,300 11 33 74
Saint Kitts and Nevis 84 na na na 25 73
Saint Lucia 69 75 22,600 32 24 64
Saint Vincent and the Grenadines 80 84 23,700 40 30 66
Trinidad and Tobago 81 87 244,200 19 25 68
Caribbean 77 77 4,173,800 15 29 70
Belize 84 88 52,300 21 24 66
Costa Rica 71 82 82,900 10 28 60
El Salvador 71 76 1,250,000 23 7 39
Guatemala 58 64 883,400 35 13 36
Honduras 58 63 537,400 32 7 35
Mexico 69 81 11,516,400 23 7 31
Nicaragua 83 84 251,500 2 16 61
Panama 88 89 145,300 6 40 83
Central America 69 79 14,719,200 23 8 34
Bolivia (1) 66 80 78,800 39 27 59
Colombia 67 78 706,000 37 25 65
Ecuador 65 77 429,000 26 18 54
Peru 63 78 437,200 39 21 61
Venezuela (2) 57 69 204,900 48 18 59
Andean Region 65 77 1,855,900 36 21 61
Brazil 48 65 347,000 36 20 62
Chile 75 81 94,400 17 15 53
Paraguay 70 75 18,300 37 23 63
Uruguay 50 88 49,900 98 36 71
Argentina 65 85 171,800 43 9 46
Southern Cone 56 74 681,300 38 17 57
All countries of the Americas 70 78 22,370,400 22 13 43
All other countries 73 73 14,808,000 14 34 78
Sources: European Union Labor Force Survey and American Community Survey. Notes: Sample sizes for countries not shown in the tables were insufficient to produce reliable estimates for any of the columns shown. nr: estimate not reliable; na: not available(1) Plurinational State of; (2) Bolivarian Republic of
PART I Trends in International Migration and Labor Market Outcomes / 27
First of all, the percentage of all immigrants from the Americas who have been resident for more than 10 years in Europe has more than doubled over the relatively short period from 2008-2009 to 2012-2013. It stood at 30% in 2008-2009 and rose to 59% of all emigrants from the Americas over the following four years, essentially the same as that of emigrants from the rest of the world, which has also risen over the period, but from an already high level of 55%. Note that this increase has occurred precisely in the period when economic conditions in many European countries, especially Spain where many of the emigrants were resident, were deteriorating. This increase, moreover, is not simply an artifact of a decline in immigration inflows as a result of the economic crisis, which would have mechanically increased the percent of long-term residents. The absolute number of immigrants resident for more than 10 years has also almost doubled over the same period, increasing by 93% from its 2008-2009 level. The increase has been spectacular for immigrants from the Andean Region, where the increase has been over 230%, due in large part to the tremendous increases observed for Bolivia and Ecuador, at over 600%. Indeed, only Haiti and Suriname among the countries figuring in Table 6 show rates of increase in 10-year residency rates In European countries of less than 25% from 2008-2009 to 2012-2013.
The large increases in long-term residency In Europe of immigrants from the Americas in recent years reflect the establishment, likely definitive, of the large waves of immigrants from the Ameri-cas who arrived around the turn of the 21st century and thereafter.
At the same time as these waves of immigrants have settled, they have also begun to acquire the nationality of their adopted countries of residence. Fully 64% of those resident for over 10 years on average in Europe over 2010-2013 possess the nationality of their countries of residence, a somewhat higher percentage than that for migrants from the rest of the world. For those with only 5 to 10 years of residence, the percentage is much lower at 17%. This evidently reflects the impact of residency requirements for the acquisition of nationality but also the time lag between arrival and the decision to naturalize, which may not be made if there are expectations of a return.
For a number of countries of origin, the acquisition rates for long-term residents are exceptionally high, such as Chile (83%), Uruguay (85%), Venezuela (93%) and Suriname (100%, rounded). For immigrants from the Andean Region, for whom the settlement in European countries is more recent, the naturalization rates are closer to 50% and in the case of Ecuador, a mere 37%. All of these are likely to increase over the next decade as more immigrants become settled and as the logic of naturalization becomes more compelling.
In the United States, the percentage of all immigrants from the Americas who have been resident for more than 10 years also increased from 2008-2009 to 2012-2013, but less spectacularly, from an already high level of 70% to 78% for the latter two years (Table 6b). The former figure evidently reflects the fact that large-scale immigration from the Americas is a more long-standing phenomenon in the United States than in the European Union, which saw the massive movements to Spain over the last fifteen years. The percentage nonetheless did increase significantly, in contrast to what was observed for immigrants from the rest of the world, where the prevalence of long-term immigrants was stable over the period at 73%.
The largest increase in the percentage of long-term residents in the United States was seen for immigrants from the Southern Cone, especially in Brazil, Uruguay and Argentina, where the percentage increased by close to 20 points or more. Their proportion was stable in Canada and the Caribbean and rose by 10 percentage points in Central America and by 12 in the Andean Region. All
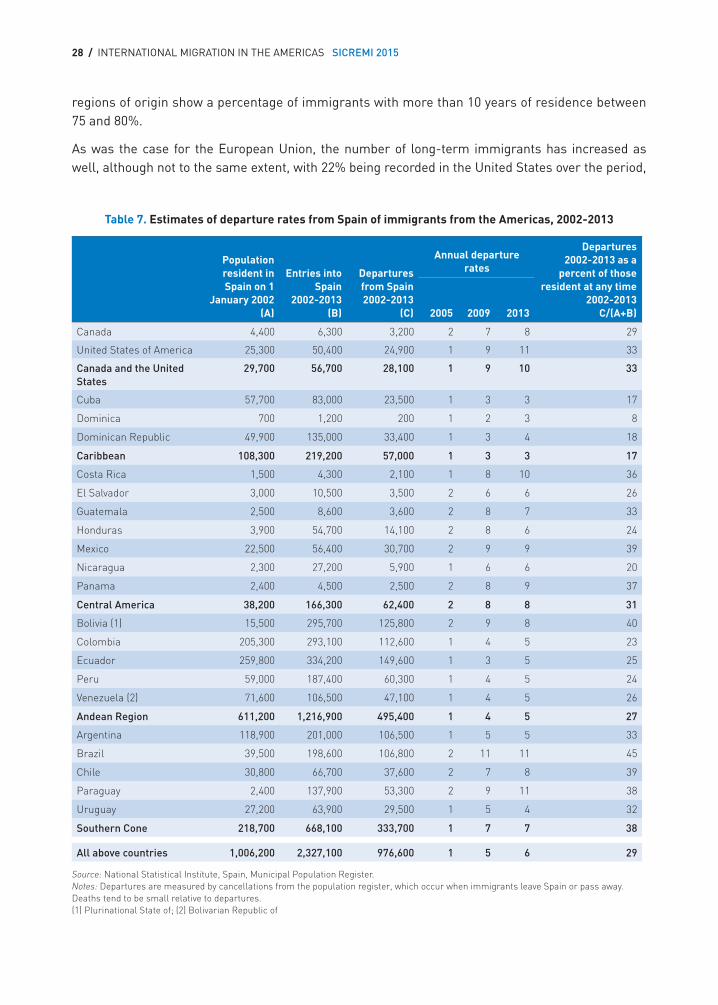
28 / INTERNATIONAL MIGRATION IN THE AMERICAS SICREMI 2015
regions of origin show a percentage of immigrants with more than 10 years of residence between 75 and 80%.
As was the case for the European Union, the number of long-term immigrants has increased as well, although not to the same extent, with 22% being recorded in the United States over the period,
Table 7. Estimates of departure rates from Spain of immigrants from the Americas, 2002-2013
Population resident in Spain on 1
January 2002 (A)
Entries into Spain
2002-2013 (B)
Departures from Spain 2002-2013
(C)
Annual departure rates
Departures 2002-2013 as a
percent of those resident at any time
2002-2013 C/(A+B)2005 2009 2013
Canada 4,400 6,300 3,200 2 7 8 29
United States of America 25,300 50,400 24,900 1 9 11 33
Canada and the United States
29,700 56,700 28,100 1 9 10 33
Cuba 57,700 83,000 23,500 1 3 3 17
Dominica 700 1,200 200 1 2 3 8
Dominican Republic 49,900 135,000 33,400 1 3 4 18
Caribbean 108,300 219,200 57,000 1 3 3 17
Costa Rica 1,500 4,300 2,100 1 8 10 36
El Salvador 3,000 10,500 3,500 2 6 6 26
Guatemala 2,500 8,600 3,600 2 8 7 33
Honduras 3,900 54,700 14,100 2 8 6 24
Mexico 22,500 56,400 30,700 2 9 9 39
Nicaragua 2,300 27,200 5,900 1 6 6 20
Panama 2,400 4,500 2,500 2 8 9 37
Central America 38,200 166,300 62,400 2 8 8 31
Bolivia (1) 15,500 295,700 125,800 2 9 8 40
Colombia 205,300 293,100 112,600 1 4 5 23
Ecuador 259,800 334,200 149,600 1 3 5 25
Peru 59,000 187,400 60,300 1 4 5 24
Venezuela (2) 71,600 106,500 47,100 1 4 5 26
Andean Region 611,200 1,216,900 495,400 1 4 5 27
Argentina 118,900 201,000 106,500 1 5 5 33
Brazil 39,500 198,600 106,800 2 11 11 45
Chile 30,800 66,700 37,600 2 7 8 39
Paraguay 2,400 137,900 53,300 2 9 11 38
Uruguay 27,200 63,900 29,500 1 5 4 32
Southern Cone 218,700 668,100 333,700 1 7 7 38
All above countries 1,006,200 2,327,100 976,600 1 5 6 29
Source: National Statistical Institute, Spain, Municipal Population Register.Notes: Departures are measured by cancellations from the population register, which occur when immigrants leave Spain or pass away. Deaths tend to be small relative to departures. (1) Plurinational State of; (2) Bolivarian Republic of
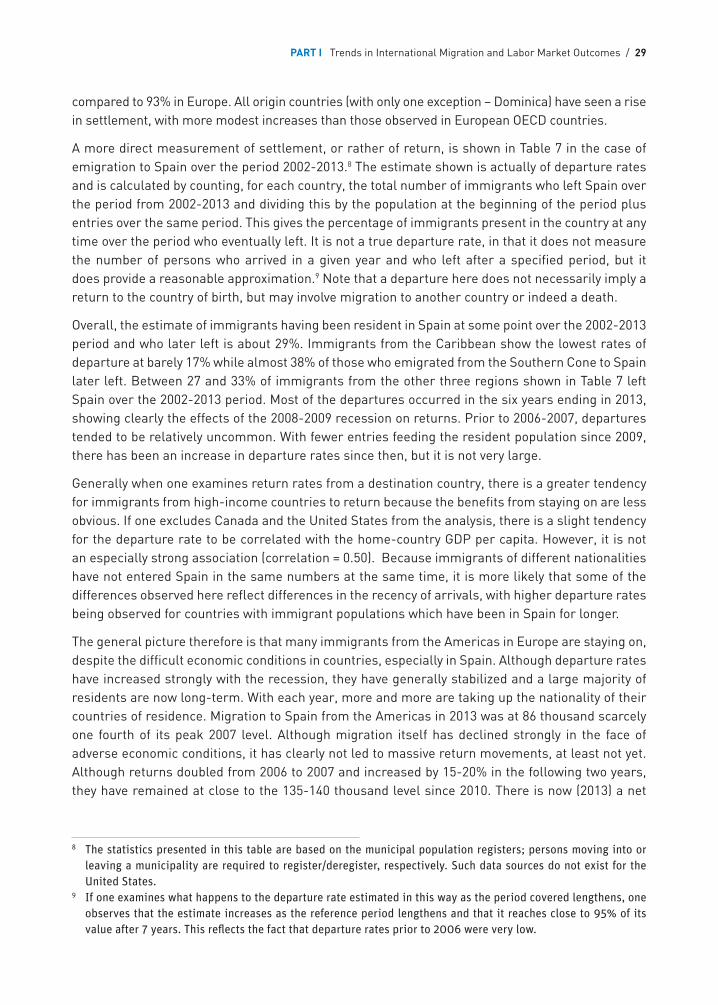
PART I Trends in International Migration and Labor Market Outcomes / 29
compared to 93% in Europe. All origin countries (with only one exception – Dominica) have seen a rise in settlement, with more modest increases than those observed in European OECD countries.
A more direct measurement of settlement, or rather of return, is shown in Table 7 in the case of emigration to Spain over the period 2002-2013.8 The estimate shown is actually of departure rates and is calculated by counting, for each country, the total number of immigrants who left Spain over the period from 2002-2013 and dividing this by the population at the beginning of the period plus entries over the same period. This gives the percentage of immigrants present in the country at any time over the period who eventually left. It is not a true departure rate, in that it does not measure the number of persons who arrived in a given year and who left after a specified period, but it does provide a reasonable approximation.9 Note that a departure here does not necessarily imply a return to the country of birth, but may involve migration to another country or indeed a death.
Overall, the estimate of immigrants having been resident in Spain at some point over the 2002-2013 period and who later left is about 29%. Immigrants from the Caribbean show the lowest rates of departure at barely 17% while almost 38% of those who emigrated from the Southern Cone to Spain later left. Between 27 and 33% of immigrants from the other three regions shown in Table 7 left Spain over the 2002-2013 period. Most of the departures occurred in the six years ending in 2013, showing clearly the effects of the 2008-2009 recession on returns. Prior to 2006-2007, departures tended to be relatively uncommon. With fewer entries feeding the resident population since 2009, there has been an increase in departure rates since then, but it is not very large.
Generally when one examines return rates from a destination country, there is a greater tendency for immigrants from high-income countries to return because the benefits from staying on are less obvious. If one excludes Canada and the United States from the analysis, there is a slight tendency for the departure rate to be correlated with the home-country GDP per capita. However, it is not an especially strong association (correlation = 0.50). Because immigrants of different nationalities have not entered Spain in the same numbers at the same time, it is more likely that some of the differences observed here reflect differences in the recency of arrivals, with higher departure rates being observed for countries with immigrant populations which have been in Spain for longer.
The general picture therefore is that many immigrants from the Americas in Europe are staying on, despite the difficult economic conditions in countries, especially in Spain. Although departure rates have increased strongly with the recession, they have generally stabilized and a large majority of residents are now long-term. With each year, more and more are taking up the nationality of their countries of residence. Migration to Spain from the Americas in 2013 was at 86 thousand scarcely one fourth of its peak 2007 level. Although migration itself has declined strongly in the face of adverse economic conditions, it has clearly not led to massive return movements, at least not yet. Although returns doubled from 2006 to 2007 and increased by 15-20% in the following two years, they have remained at close to the 135-140 thousand level since 2010. There is now (2013) a net
8 The statistics presented in this table are based on the municipal population registers; persons moving into or leaving a municipality are required to register/deregister, respectively. Such data sources do not exist for the United States.
9 If one examines what happens to the departure rate estimated in this way as the period covered lengthens, one observes that the estimate increases as the reference period lengthens and that it reaches close to 95% of its value after 7 years. This reflects the fact that departure rates prior to 2006 were very low.
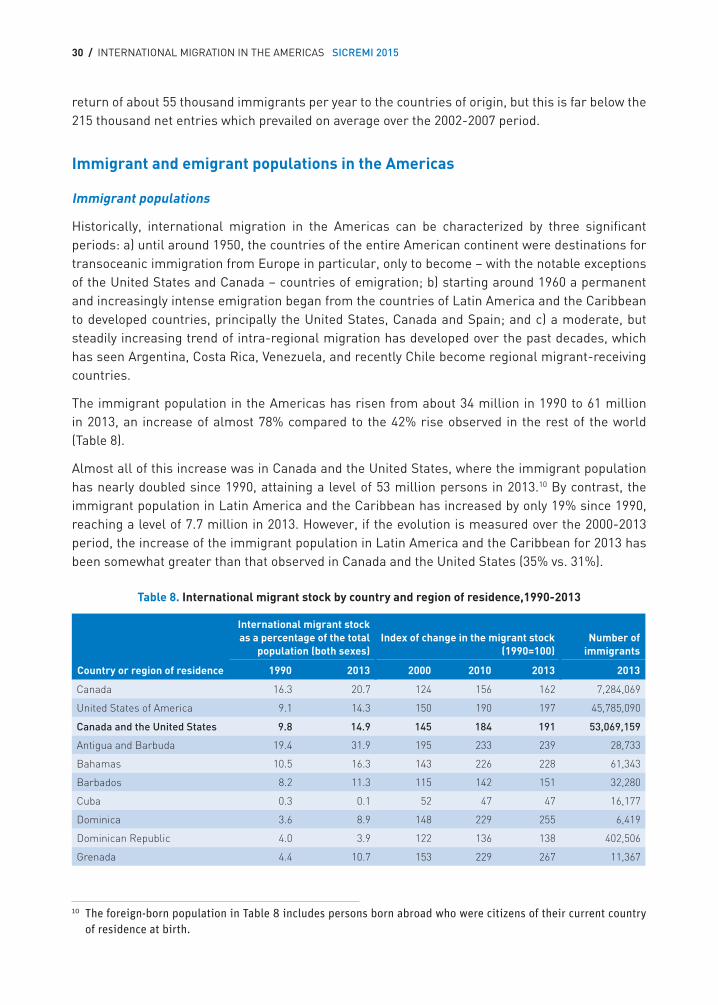
30 / INTERNATIONAL MIGRATION IN THE AMERICAS SICREMI 2015
return of about 55 thousand immigrants per year to the countries of origin, but this is far below the 215 thousand net entries which prevailed on average over the 2002-2007 period.
Immigrant and emigrant populations in the Americas
Immigrant populations
Historically, international migration in the Americas can be characterized by three significant periods: a) until around 1950, the countries of the entire American continent were destinations for transoceanic immigration from Europe in particular, only to become – with the notable exceptions of the United States and Canada – countries of emigration; b) starting around 1960 a permanent and increasingly intense emigration began from the countries of Latin America and the Caribbean to developed countries, principally the United States, Canada and Spain; and c) a moderate, but steadily increasing trend of intra-regional migration has developed over the past decades, which has seen Argentina, Costa Rica, Venezuela, and recently Chile become regional migrant-receiving countries.
The immigrant population in the Americas has risen from about 34 million in 1990 to 61 million in 2013, an increase of almost 78% compared to the 42% rise observed in the rest of the world (Table 8).
Almost all of this increase was in Canada and the United States, where the immigrant population has nearly doubled since 1990, attaining a level of 53 million persons in 2013.10 By contrast, the immigrant population in Latin America and the Caribbean has increased by only 19% since 1990, reaching a level of 7.7 million in 2013. However, if the evolution is measured over the 2000-2013 period, the increase of the immigrant population in Latin America and the Caribbean for 2013 has been somewhat greater than that observed in Canada and the United States (35% vs. 31%).
Table 8. International migrant stock by country and region of residence,1990-2013
Country or region of residence
International migrant stock as a percentage of the total
population (both sexes)Index of change in the migrant stock
(1990=100)Number of
immigrants
1990 2013 2000 2010 2013 2013
Canada 16.3 20.7 124 156 162 7,284,069
United States of America 9.1 14.3 150 190 197 45,785,090
Canada and the United States 9.8 14.9 145 184 191 53,069,159
Antigua and Barbuda 19.4 31.9 195 233 239 28,733
Bahamas 10.5 16.3 143 226 228 61,343
Barbados 8.2 11.3 115 142 151 32,280
Cuba 0.3 0.1 52 47 47 16,177
Dominica 3.6 8.9 148 229 255 6,419
Dominican Republic 4.0 3.9 122 136 138 402,506
Grenada 4.4 10.7 153 229 267 11,367
10 The foreign-born population in Table 8 includes persons born abroad who were citizens of their current country of residence at birth.
PART I Trends in International Migration and Labor Market Outcomes / 31
Country or region of residence
International migrant stock as a percentage of the total
population (both sexes)Index of change in the migrant stock
(1990=100)Number of
immigrants
1990 2013 2000 2010 2013 2013
Guyana 0.6 1.8 195 319 361 14,770
Haiti 0.3 0.4 135 184 199 38,061
Jamaica 0.9 1.3 119 156 168 34,907
Saint Kitts and Nevis 8.0 10.5 125 163 175 5,673
Saint Lucia 3.9 6.7 139 206 228 12,180
Saint Vincent and the Grenadines
3.7 9.4 159 233 256 10,260
Suriname 4.4 7.7 153 219 231 41,670
Trinidad and Tobago 4.1 2.4 82 68 64 32,488
Caribbean 1.6 2.0 125 150 154 748,834
Belize 16.2 15.3 120 152 167 50,860
Costa Rica 13.6 8.6 74 97 100 419,572
El Salvador 0.9 0.7 67 85 88 41,615
Guatemala 3.0 0.5 18 25 28 72,764
Honduras 5.5 0.3 11 10 10 27,503
Mexico 0.8 0.9 74 137 157 1,103,460
Nicaragua 1.0 0.7 75 98 102 41,482
Panama 2.5 4.1 140 229 257 158,417
Central America 1.6 1.1 60 94 104 1,915,673
Bolivia (1) 0.9 1.4 149 245 259 154,330
Colombia 0.3 0.3 105 119 124 129,632
Ecuador 0.8 2.3 129 414 457 359,315
Peru 0.3 0.3 107 168 187 104,919
Venezuela (2) 5.2 3.9 99 110 114 1,171,331
Andean Region 1.4 1.4 104 138 145 1,919,527
Argentina 5.1 4.5 93 109 114 1,885,678
Brazil 0.5 0.3 86 74 75 599,678
Chile 0.8 2.3 165 344 370 398,251
Paraguay 4.3 2.7 96 99 101 185,776
Uruguay 3.2 2.2 91 78 75 73,528
Southern Cone 1.4 1.2 94 107 111 3,142,911
Latin America and the Caribbean
1.6 1.4 88 112 119 7,726,945
Total Americas 4.7 6.2 135 171 178 60,796,104
Rest of the World 2.6 2.8 107 135 142 170,726,111
Grand Total 2.9 3.2 113 143 150 231,522,215
Source: Trends in International Migrant Stock: Migrants by Destination and Origin, 2013 Revision, United Nations Population Division.Note: Statistics include residents born abroad who were citizens at birth of their current country of residence.(1) Plurinational State of; (2) Bolivarian Republic of
Table 8. International migrant stock by country and region of residence,1990-2013
32 / INTERNATIONAL MIGRATION IN THE AMERICAS SICREMI 2015
Despite the increase in the number of immigrants in Latin America and the Caribbean between 1990 and 2013, immigration remains limited in this region, representing only 1.4% of the total population in the region in 2013, compared to 14.9% for Canada and the United States.
A number of legal, economic, social and cultural factors have influenced the growing number of immigrants in Latin America and the Caribbean between 2000 and 2013.
First of all, Latin America and the Caribbean have renewed with economic growth, creating broader employment opportunities in general. Secondly, the various free-trade regimes linking different countries of the Americas, in particular Mercosur, have expanded their membership, with signatory countries having introduced provisions facilitating entry, stay and access to employment by each other’s citizens. The result has been an increase in movements from the poorer to the (locally) richer countries of the region (Argentina, Barbados, Chile, Costa Rica), with workers drawn to the better wages available in the destination countries. These developments may well have been abetted by the often more difficult border-crossing conditions for migrants from Central America seeking to enter the United States as well as the unfavorable labor market conditions in Spain, the two main destination countries for emigrants from the Americas.
Still, as is evident from Table 8, these explanations do not do full justice to the range of increases in the immigrant population observed over the 2000-2013 period in countries of the Americas. Indeed, large increases are observed in most countries, whether rich or poor. Central America and the Andean Region in particular, have seen very large increases in their immigrant populations since the year 2000 (73% and 39%, respectively). Most of the increase in Central America was concentrated in Belize, Mexico and Panama. The increase in the Caribbean has been smaller (23%), but foreign-born populations in this region of the Americas tend to be relatively larger than elsewhere, and larger immigrant populations in countries tend to show smaller proportional increases.
The heightened mobility observed in Latin America and the Caribbean over the last decade may well reflect a loosening of entry restrictions in general, but also cheaper transportation costs and better access to information about job opportunities elsewhere. The increases, however, are from very low levels in many countries, and the immigration populations remain small overall in proportional terms. Certain countries, however, are beginning to emerge as significant destinations for emigrants from the region.
Origin and destination countries of immigrants and emigrants
The United States is of course the most important destination country for migrants of the Americas, but also for migrants worldwide. Between 1990 and 2013, the population of immigrants in the United States doubled. By 2013, five out of six migrants from the Americas and one in five worldwide lived in the United States.
Although the immigrant population in the United States of America is large in both absolute and proportions terms, several countries of the Americas have immigrant populations which are larger in relative terms. These are Antigua and Barbuda (31.9%), Canada (20.7%), Bahamas (16.3%) and Belize (15.3%).
Not all of the increase in immigration in the United States has come through formal channels. Almost half of the growth in the immigrant population since 1990 (+23.2 million) has come from
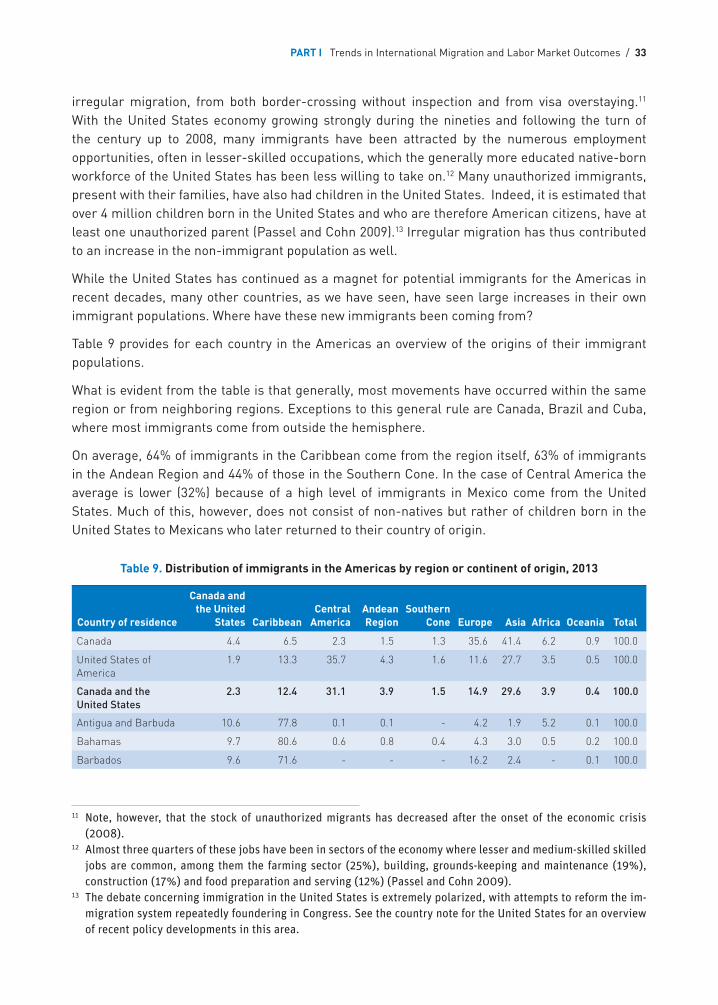
PART I Trends in International Migration and Labor Market Outcomes / 33
irregular migration, from both border-crossing without inspection and from visa overstaying.11 With the United States economy growing strongly during the nineties and following the turn of the century up to 2008, many immigrants have been attracted by the numerous employment opportunities, often in lesser-skilled occupations, which the generally more educated native-born workforce of the United States has been less willing to take on.12 Many unauthorized immigrants, present with their families, have also had children in the United States. Indeed, it is estimated that over 4 million children born in the United States and who are therefore American citizens, have at least one unauthorized parent (Passel and Cohn 2009).13 Irregular migration has thus contributed to an increase in the non-immigrant population as well.
While the United States has continued as a magnet for potential immigrants for the Americas in recent decades, many other countries, as we have seen, have seen large increases in their own immigrant populations. Where have these new immigrants been coming from?
Table 9 provides for each country in the Americas an overview of the origins of their immigrant populations.
What is evident from the table is that generally, most movements have occurred within the same region or from neighboring regions. Exceptions to this general rule are Canada, Brazil and Cuba, where most immigrants come from outside the hemisphere.
On average, 64% of immigrants in the Caribbean come from the region itself, 63% of immigrants in the Andean Region and 44% of those in the Southern Cone. In the case of Central America the average is lower (32%) because of a high level of immigrants in Mexico come from the United States. Much of this, however, does not consist of non-natives but rather of children born in the United States to Mexicans who later returned to their country of origin.
Table 9. Distribution of immigrants in the Americas by region or continent of origin, 2013
Country of residence
Canada and the United
States CaribbeanCentral
AmericaAndean Region
Southern Cone Europe Asia Africa Oceania Total
Canada 4.4 6.5 2.3 1.5 1.3 35.6 41.4 6.2 0.9 100.0
United States of America
1.9 13.3 35.7 4.3 1.6 11.6 27.7 3.5 0.5 100.0
Canada and the United States
2.3 12.4 31.1 3.9 1.5 14.9 29.6 3.9 0.4 100.0
Antigua and Barbuda 10.6 77.8 0.1 0.1 - 4.2 1.9 5.2 0.1 100.0
Bahamas 9.7 80.6 0.6 0.8 0.4 4.3 3.0 0.5 0.2 100.0
Barbados 9.6 71.6 - - - 16.2 2.4 - 0.1 100.0
11 Note, however, that the stock of unauthorized migrants has decreased after the onset of the economic crisis (2008).
12 Almost three quarters of these jobs have been in sectors of the economy where lesser and medium-skilled skilled jobs are common, among them the farming sector (25%), building, grounds-keeping and maintenance (19%), construction (17%) and food preparation and serving (12%) (Passel and Cohn 2009).
13 The debate concerning immigration in the United States is extremely polarized, with attempts to reform the im-migration system repeatedly foundering in Congress. See the country note for the United States for an overview of recent policy developments in this area.
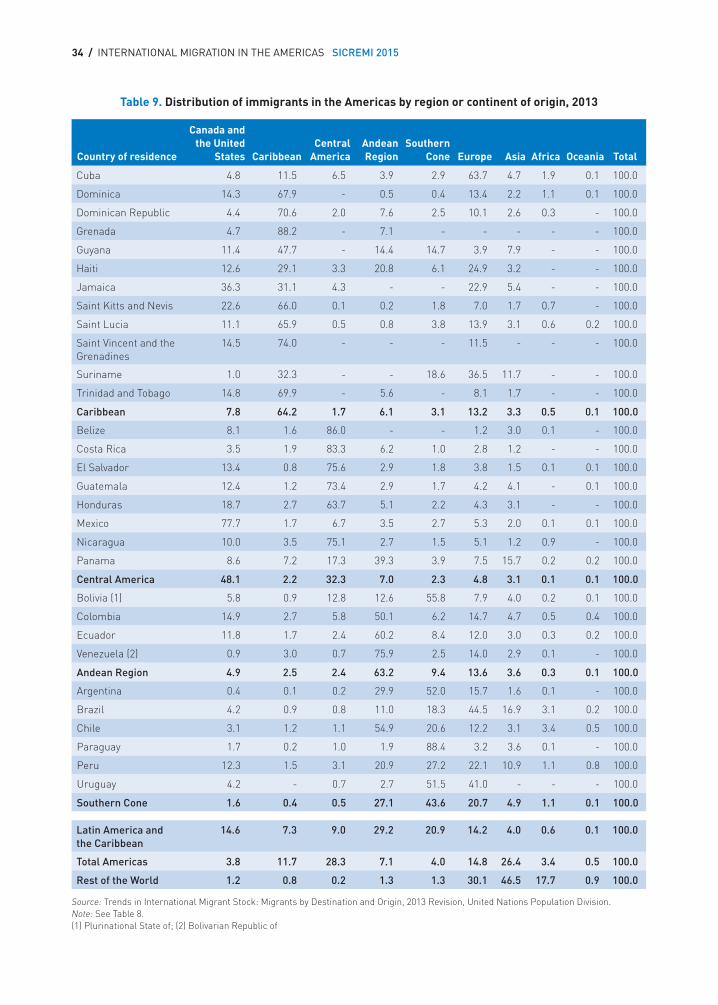
34 / INTERNATIONAL MIGRATION IN THE AMERICAS SICREMI 2015
Country of residence
Canada and the United
States CaribbeanCentral
AmericaAndean Region
Southern Cone Europe Asia Africa Oceania Total
Cuba 4.8 11.5 6.5 3.9 2.9 63.7 4.7 1.9 0.1 100.0
Dominica 14.3 67.9 - 0.5 0.4 13.4 2.2 1.1 0.1 100.0
Dominican Republic 4.4 70.6 2.0 7.6 2.5 10.1 2.6 0.3 - 100.0
Grenada 4.7 88.2 - 7.1 - - - - - 100.0
Guyana 11.4 47.7 - 14.4 14.7 3.9 7.9 - - 100.0
Haiti 12.6 29.1 3.3 20.8 6.1 24.9 3.2 - - 100.0
Jamaica 36.3 31.1 4.3 - - 22.9 5.4 - - 100.0
Saint Kitts and Nevis 22.6 66.0 0.1 0.2 1.8 7.0 1.7 0.7 - 100.0
Saint Lucia 11.1 65.9 0.5 0.8 3.8 13.9 3.1 0.6 0.2 100.0
Saint Vincent and the Grenadines
14.5 74.0 - - - 11.5 - - - 100.0
Suriname 1.0 32.3 - - 18.6 36.5 11.7 - - 100.0
Trinidad and Tobago 14.8 69.9 - 5.6 - 8.1 1.7 - - 100.0
Caribbean 7.8 64.2 1.7 6.1 3.1 13.2 3.3 0.5 0.1 100.0
Belize 8.1 1.6 86.0 - - 1.2 3.0 0.1 - 100.0
Costa Rica 3.5 1.9 83.3 6.2 1.0 2.8 1.2 - - 100.0
El Salvador 13.4 0.8 75.6 2.9 1.8 3.8 1.5 0.1 0.1 100.0
Guatemala 12.4 1.2 73.4 2.9 1.7 4.2 4.1 - 0.1 100.0
Honduras 18.7 2.7 63.7 5.1 2.2 4.3 3.1 - - 100.0
Mexico 77.7 1.7 6.7 3.5 2.7 5.3 2.0 0.1 0.1 100.0
Nicaragua 10.0 3.5 75.1 2.7 1.5 5.1 1.2 0.9 - 100.0
Panama 8.6 7.2 17.3 39.3 3.9 7.5 15.7 0.2 0.2 100.0
Central America 48.1 2.2 32.3 7.0 2.3 4.8 3.1 0.1 0.1 100.0
Bolivia (1) 5.8 0.9 12.8 12.6 55.8 7.9 4.0 0.2 0.1 100.0
Colombia 14.9 2.7 5.8 50.1 6.2 14.7 4.7 0.5 0.4 100.0
Ecuador 11.8 1.7 2.4 60.2 8.4 12.0 3.0 0.3 0.2 100.0
Venezuela (2) 0.9 3.0 0.7 75.9 2.5 14.0 2.9 0.1 - 100.0
Andean Region 4.9 2.5 2.4 63.2 9.4 13.6 3.6 0.3 0.1 100.0
Argentina 0.4 0.1 0.2 29.9 52.0 15.7 1.6 0.1 - 100.0
Brazil 4.2 0.9 0.8 11.0 18.3 44.5 16.9 3.1 0.2 100.0
Chile 3.1 1.2 1.1 54.9 20.6 12.2 3.1 3.4 0.5 100.0
Paraguay 1.7 0.2 1.0 1.9 88.4 3.2 3.6 0.1 - 100.0
Peru 12.3 1.5 3.1 20.9 27.2 22.1 10.9 1.1 0.8 100.0
Uruguay 4.2 - 0.7 2.7 51.5 41.0 - - - 100.0
Southern Cone 1.6 0.4 0.5 27.1 43.6 20.7 4.9 1.1 0.1 100.0 Latin America and the Caribbean
14.6 7.3 9.0 29.2 20.9 14.2 4.0 0.6 0.1 100.0
Total Americas 3.8 11.7 28.3 7.1 4.0 14.8 26.4 3.4 0.5 100.0
Rest of the World 1.2 0.8 0.2 1.3 1.3 30.1 46.5 17.7 0.9 100.0
Source: Trends in International Migrant Stock: Migrants by Destination and Origin, 2013 Revision, United Nations Population Division.Note: See Table 8.(1) Plurinational State of; (2) Bolivarian Republic of
Table 9. Distribution of immigrants in the Americas by region or continent of origin, 2013
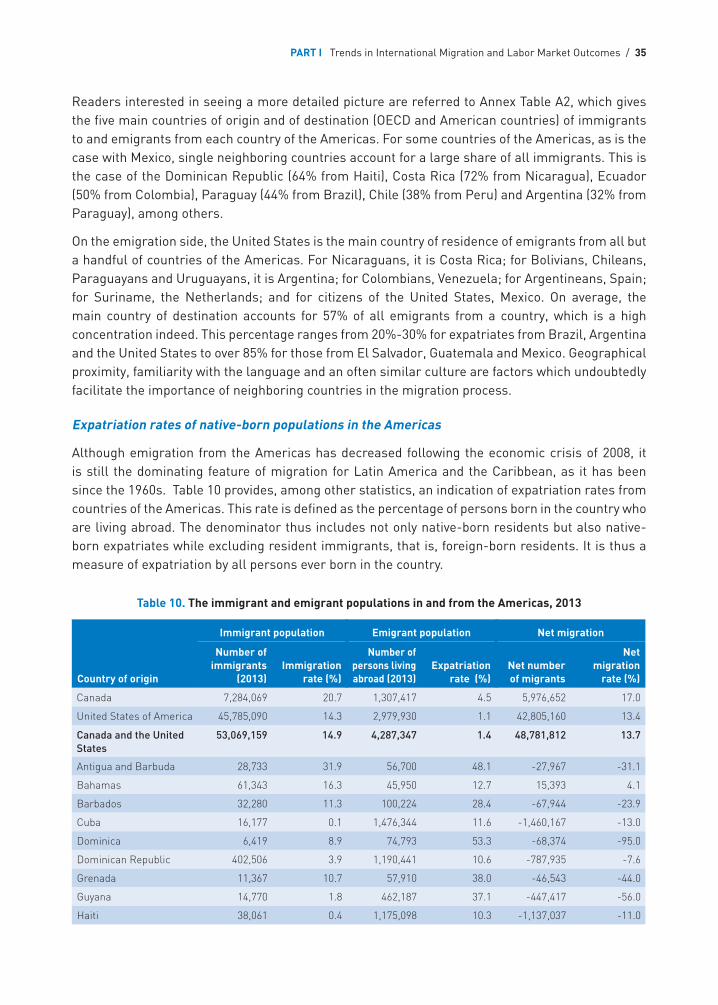
PART I Trends in International Migration and Labor Market Outcomes / 35
Readers interested in seeing a more detailed picture are referred to Annex Table A2, which gives the five main countries of origin and of destination (OECD and American countries) of immigrants to and emigrants from each country of the Americas. For some countries of the Americas, as is the case with Mexico, single neighboring countries account for a large share of all immigrants. This is the case of the Dominican Republic (64% from Haiti), Costa Rica (72% from Nicaragua), Ecuador (50% from Colombia), Paraguay (44% from Brazil), Chile (38% from Peru) and Argentina (32% from Paraguay), among others.
On the emigration side, the United States is the main country of residence of emigrants from all but a handful of countries of the Americas. For Nicaraguans, it is Costa Rica; for Bolivians, Chileans, Paraguayans and Uruguayans, it is Argentina; for Colombians, Venezuela; for Argentineans, Spain; for Suriname, the Netherlands; and for citizens of the United States, Mexico. On average, the main country of destination accounts for 57% of all emigrants from a country, which is a high concentration indeed. This percentage ranges from 20%-30% for expatriates from Brazil, Argentina and the United States to over 85% for those from El Salvador, Guatemala and Mexico. Geographical proximity, familiarity with the language and an often similar culture are factors which undoubtedly facilitate the importance of neighboring countries in the migration process.
Expatriation rates of native-born populations in the Americas
Although emigration from the Americas has decreased following the economic crisis of 2008, it is still the dominating feature of migration for Latin America and the Caribbean, as it has been since the 1960s. Table 10 provides, among other statistics, an indication of expatriation rates from countries of the Americas. This rate is defined as the percentage of persons born in the country who are living abroad. The denominator thus includes not only native-born residents but also native-born expatriates while excluding resident immigrants, that is, foreign-born residents. It is thus a measure of expatriation by all persons ever born in the country.
Table 10. The immigrant and emigrant populations in and from the Americas, 2013
Country of origin
Immigrant population Emigrant population Net migration
Number of immigrants
(2013)Immigration
rate (%)
Number of persons living abroad (2013)
Expatriation rate (%)
Net number of migrants
Net migration
rate (%)
Canada 7,284,069 20.7 1,307,417 4.5 5,976,652 17.0
United States of America 45,785,090 14.3 2,979,930 1.1 42,805,160 13.4
Canada and the United States
53,069,159 14.9 4,287,347 1.4 48,781,812 13.7
Antigua and Barbuda 28,733 31.9 56,700 48.1 -27,967 -31.1
Bahamas 61,343 16.3 45,950 12.7 15,393 4.1
Barbados 32,280 11.3 100,224 28.4 -67,944 -23.9
Cuba 16,177 0.1 1,476,344 11.6 -1,460,167 -13.0
Dominica 6,419 8.9 74,793 53.3 -68,374 -95.0
Dominican Republic 402,506 3.9 1,190,441 10.6 -787,935 -7.6
Grenada 11,367 10.7 57,910 38.0 -46,543 -44.0
Guyana 14,770 1.8 462,187 37.1 -447,417 -56.0
Haiti 38,061 0.4 1,175,098 10.3 -1,137,037 -11.0
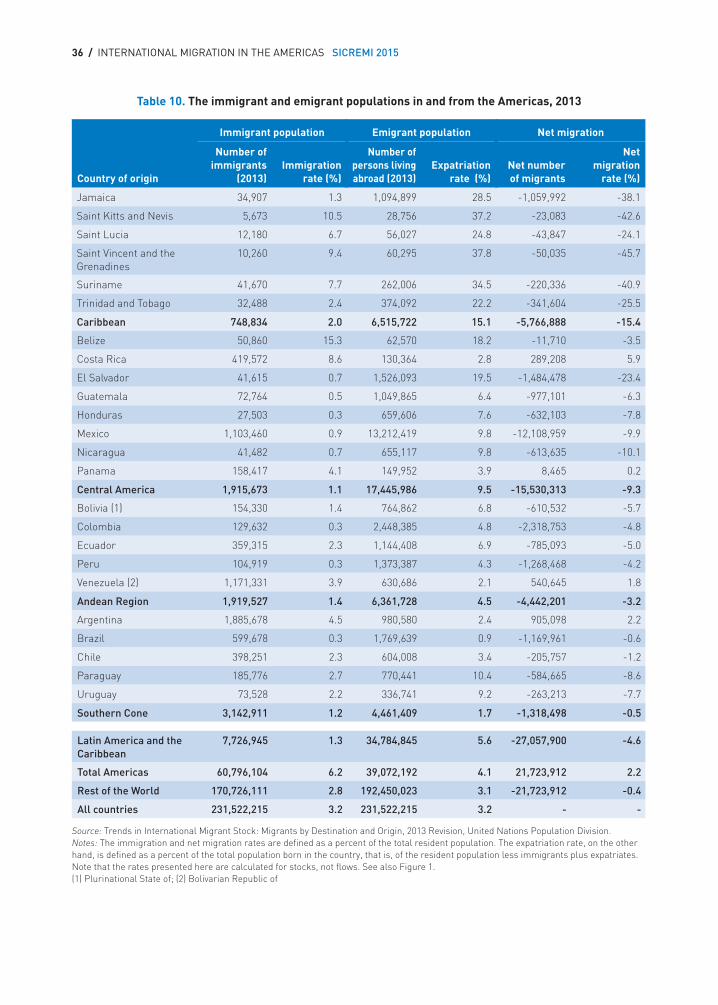
36 / INTERNATIONAL MIGRATION IN THE AMERICAS SICREMI 2015
Country of origin
Immigrant population Emigrant population Net migration
Number of immigrants
(2013)Immigration
rate (%)
Number of persons living abroad (2013)
Expatriation rate (%)
Net number of migrants
Net migration
rate (%)
Jamaica 34,907 1.3 1,094,899 28.5 -1,059,992 -38.1
Saint Kitts and Nevis 5,673 10.5 28,756 37.2 -23,083 -42.6
Saint Lucia 12,180 6.7 56,027 24.8 -43,847 -24.1
Saint Vincent and the Grenadines
10,260 9.4 60,295 37.8 -50,035 -45.7
Suriname 41,670 7.7 262,006 34.5 -220,336 -40.9
Trinidad and Tobago 32,488 2.4 374,092 22.2 -341,604 -25.5
Caribbean 748,834 2.0 6,515,722 15.1 -5,766,888 -15.4
Belize 50,860 15.3 62,570 18.2 -11,710 -3.5
Costa Rica 419,572 8.6 130,364 2.8 289,208 5.9
El Salvador 41,615 0.7 1,526,093 19.5 -1,484,478 -23.4
Guatemala 72,764 0.5 1,049,865 6.4 -977,101 -6.3
Honduras 27,503 0.3 659,606 7.6 -632,103 -7.8
Mexico 1,103,460 0.9 13,212,419 9.8 -12,108,959 -9.9
Nicaragua 41,482 0.7 655,117 9.8 -613,635 -10.1
Panama 158,417 4.1 149,952 3.9 8,465 0.2
Central America 1,915,673 1.1 17,445,986 9.5 -15,530,313 -9.3
Bolivia (1) 154,330 1.4 764,862 6.8 -610,532 -5.7
Colombia 129,632 0.3 2,448,385 4.8 -2,318,753 -4.8
Ecuador 359,315 2.3 1,144,408 6.9 -785,093 -5.0
Peru 104,919 0.3 1,373,387 4.3 -1,268,468 -4.2
Venezuela (2) 1,171,331 3.9 630,686 2.1 540,645 1.8
Andean Region 1,919,527 1.4 6,361,728 4.5 -4,442,201 -3.2
Argentina 1,885,678 4.5 980,580 2.4 905,098 2.2
Brazil 599,678 0.3 1,769,639 0.9 -1,169,961 -0.6
Chile 398,251 2.3 604,008 3.4 -205,757 -1.2
Paraguay 185,776 2.7 770,441 10.4 -584,665 -8.6
Uruguay 73,528 2.2 336,741 9.2 -263,213 -7.7
Southern Cone 3,142,911 1.2 4,461,409 1.7 -1,318,498 -0.5
Latin America and the Caribbean
7,726,945 1.3 34,784,845 5.6 -27,057,900 -4.6
Total Americas 60,796,104 6.2 39,072,192 4.1 21,723,912 2.2
Rest of the World 170,726,111 2.8 192,450,023 3.1 -21,723,912 -0.4
All countries 231,522,215 3.2 231,522,215 3.2 - -
Source: Trends in International Migrant Stock: Migrants by Destination and Origin, 2013 Revision, United Nations Population Division.Notes: The immigration and net migration rates are defined as a percent of the total resident population. The expatriation rate, on the other hand, is defined as a percent of the total population born in the country, that is, of the resident population less immigrants plus expatriates. Note that the rates presented here are calculated for stocks, not flows. See also Figure 1.(1) Plurinational State of; (2) Bolivarian Republic of
Table 10. The immigrant and emigrant populations in and from the Americas, 2013
PART I Trends in International Migration and Labor Market Outcomes / 37
For the Americas, Canada and the United States show relatively low expatriation rates, at over 4% and 1% respectively. For the rest of the hemisphere, one observes a decline in expatriation rates as one moves south from the United States, with the highest rates in the Caribbean (15%) and the lowest in the Southern Cone (1.7%), with Central America at 9.5% and the Andean Region at 4.5%. On an individual country basis, however, there is considerable variation within regions.
The small island states of the Caribbean have generally very high expatriation rates, often over 25%, with Dominica at 53% and Antigua and Barbuda at 48%, while the Bahamas, Haiti and the Dominican Republic are between 10% and 13%. In Central America the contrast is between Costa Rica and Panama at 3-4% and Belize and El Salvador at 18-19%. The Andean Region shows less variability with expatriation rates for all countries ranging from about 2 to 7%. Finally, the Southern Cone sees Brazil at a mere 0.9% and Paraguay at over 10%.
Overlying this diversity, however, is a fundamental relationship between the size of a country (measured here by its native-born population) and the expatriation rate. Indeed the correlation between (the logarithm of) the size of the native-born population and the expatriation rate for countries of Latin America and the Caribbean is fully -0.83 (Figure 7). The chart identifies a number of countries for which the expatriation rates are higher (above the line) or lower (below the line) than one would expect on the basis of the general relationship. The reason for the association between population size and expatriation is that employment opportunities tend to be more numerous and diverse in larger countries, reducing the incentive to look abroad when conditions are difficult at home.
Expatriation, in other words, is a way of effectively increasing the size of one’s home labor market and thereby, of available opportunities for employment. Nowhere is this more obvious than in the case of highly specialized and highly skilled occupations. Persons from small countries wishing to study and work in nanotechnology or robotics, to take two extreme examples, will generally have to study abroad and are unlikely to return to their countries of origin for employment after the completion of their studies because of the absence of job opportunities. These examples concern admittedly uncommon professions but reflect nonetheless a general phenomenon, namely the generally greater openness and exposure of small countries to international trade and migration, because of limited domestic markets, whether for products, services, or skills.
This is clearly not the whole story with respect to expatriation. Wage differentials evidently play an important role and can indeed overcome the standard large-country/low-expatriation relationship. The most notable example for the Americas is evidently that of Mexico, which has lost almost 10% of its population to emigration, as a result of the plentiful and relatively higher-paying jobs available in the labor market of its northern neighbor compared to the more limited opportunities available at home. In absolute terms Mexico has the largest emigrant population of the Americas (13.2 million) representing more than a third of all emigrants from the hemisphere.
At the other end of the spectrum are countries like the Bahamas, Belize, Costa Rica and Panama, whose expatriation rates are much smaller than one would expect on the basis of their populations, for reasons undoubtedly related to relatively favorable social and working conditions in those countries.
If country size appears to affect the likelihood of migrating, it is, however, wage differentials and specific employment opportunities (and knowledge of these) as well as the costs of migration that determine the country of destination. The generally lower costs involved in migrating to neighboring
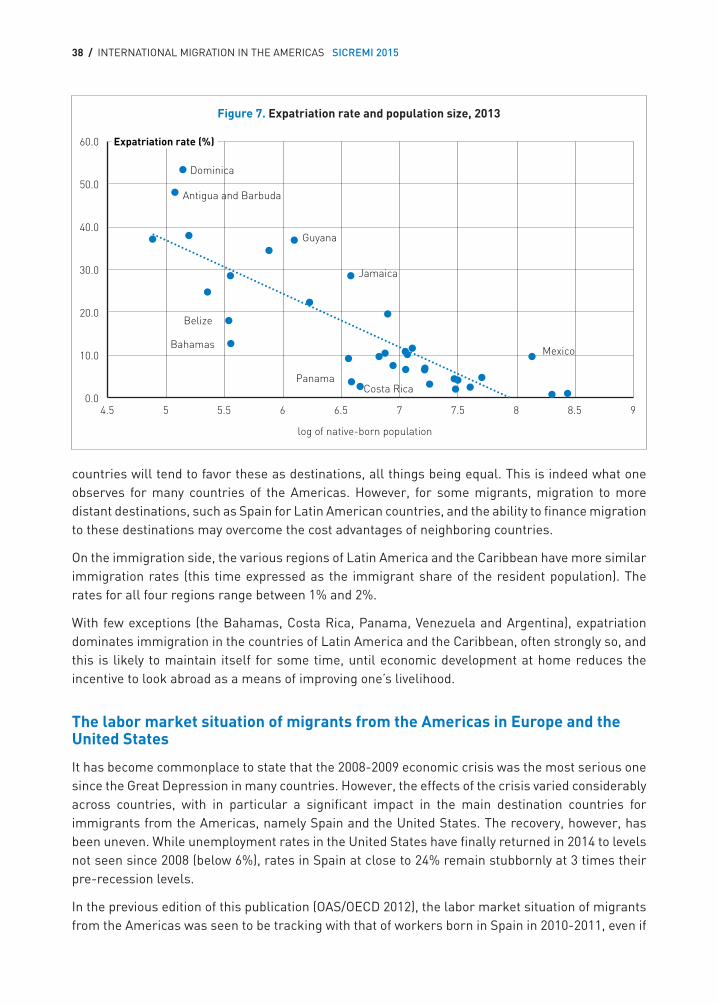
38 / INTERNATIONAL MIGRATION IN THE AMERICAS SICREMI 2015
Figure 7. Expatriation rate and population size, 2013
0.0
10.0
20.0
30.0
40.0
50.0
60.0
4.5 5 5.5 6 6.5 7 7.5 8 8.5 9
Bahamas
Costa Rica Panama
Guyana
Jamaica
Mexico
Belize
Antigua and Barbuda
Dominica
log of native-born population
Expatriation rate (%)
countries will tend to favor these as destinations, all things being equal. This is indeed what one observes for many countries of the Americas. However, for some migrants, migration to more distant destinations, such as Spain for Latin American countries, and the ability to finance migration to these destinations may overcome the cost advantages of neighboring countries.
On the immigration side, the various regions of Latin America and the Caribbean have more similar immigration rates (this time expressed as the immigrant share of the resident population). The rates for all four regions range between 1% and 2%.
With few exceptions (the Bahamas, Costa Rica, Panama, Venezuela and Argentina), expatriation dominates immigration in the countries of Latin America and the Caribbean, often strongly so, and this is likely to maintain itself for some time, until economic development at home reduces the incentive to look abroad as a means of improving one’s livelihood.
The labor market situation of migrants from the Americas in Europe and the United States
It has become commonplace to state that the 2008-2009 economic crisis was the most serious one since the Great Depression in many countries. However, the effects of the crisis varied considerably across countries, with in particular a significant impact in the main destination countries for immigrants from the Americas, namely Spain and the United States. The recovery, however, has been uneven. While unemployment rates in the United States have finally returned in 2014 to levels not seen since 2008 (below 6%), rates in Spain at close to 24% remain stubbornly at 3 times their pre-recession levels.
In the previous edition of this publication (OAS/OECD 2012), the labor market situation of migrants from the Americas was seen to be tracking with that of workers born in Spain in 2010-2011, even if
PART I Trends in International Migration and Labor Market Outcomes / 39
the signs of recovery were scarcely visible. However, the European debt crisis at about this time and thereafter, especially in the southern European countries, and the resulting austerity measures plunged the labor markets in those countries, if not always further into decline, then often further from recovery. What has been the evolution since that time?
The labor market situation of immigrants from the Americas in recent years has evolved largely in line with overall developments in the labor market of the main countries of destination, Spain and the United States. Spain has seen a further deterioration of the condition in its labor market from 2010-2011 to 2012-2013, with a decline in the employment rate of the native-born of 4 percentage points among men and 2 percentage points among women (Table 11). The evolution for immigrants from the Americas in Spain was similar for men (5 points), but considerably larger for immigrant women (a decline of 6 percentage points). This is reflected as well in a much larger increase in the unemployment rate among immigrant women from the Americas than native-born women (8 vs. 5 percentage points). Unemployment rates for immigrants are now near the 32-35% level, compared to about 36-37% for immigrants from other continents and 23-24% for native-born workers.
The shading in Table 11 allows one to take in the situation at a glance for workers from the Americas. Grey/blue shading indicates that the labor market situation of immigrants has deteriorated/improved, respectively, by at least one percentage point, whether this concerns the participation rate, the employment rate or the unemployment rate.14 While this characterization of increase/decline may be clear in the case of the employment and unemployment rates, it is less obvious in the case of the participation rate, whose evolution can be affected by the “added worker effect”. This refers to the tendency of married women to enter the labor market when their spouses lose their jobs, in order to make up for the resulting decline in family income. An increase in the participation rate can thus be less an indication of increased opportunities in the labor market than of declining family incomes.
This is observed in Table 11 for emigrants from the Southern Cone, where for almost all countries, women have maintained or increased their participation in the labor market in 2012-2013 compared to 2010-2011, in the face of deteriorating economic conditions.
The labor market situation of immigrants from the Caribbean and from Central America, on the other hand, has profited from the improvement in economic conditions in the United States since 2010-2011, which is the destination country for most of the migrants. Overall the employment rate has risen by 3 points for immigrant men from the Caribbean and Central America but only by about 1 point for women from these regions. Likewise the unemployment situation has improved more for men than for women.
By contrast, the labor market situation of immigrants from the Andean Region and the Southern Cone has tended to deteriorate from 2010-2011 to 2012-2013, reflecting the greater concentration of immigrants from these regions in Spain. There are two notable exceptions to the general pattern, however, namely for immigrant men from Colombia and Peru, who have seen significant improvements in their labor market situation, for reasons which are not entirely clear.
14 Evidently a deteriorating situation is represented, on the one hand, by a decline in the employment rate but, on the other, by an increase in the unemployment rate.
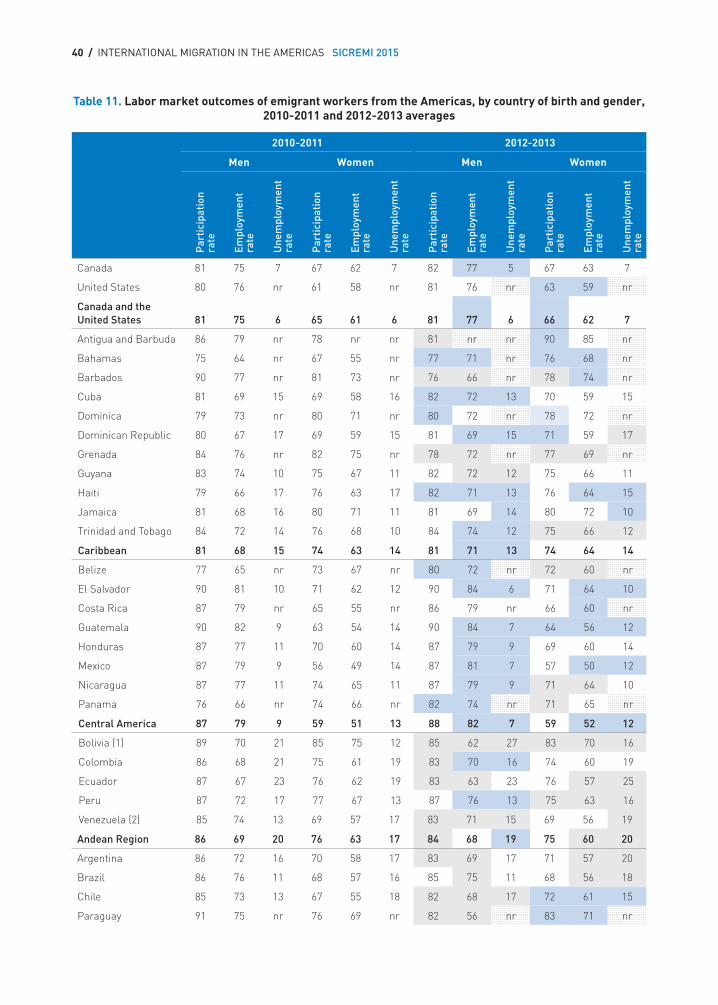
40 / INTERNATIONAL MIGRATION IN THE AMERICAS SICREMI 2015
Table 11. Labor market outcomes of emigrant workers from the Americas, by country of birth and gender, 2010-2011 and 2012-2013 averages
2010-2011 2012-2013
Men Women Men Women
Par
tici
pati
on
rate
Empl
oym
ent
rate
Une
mpl
oym
ent
rate
Par
tici
pati
on
rate
Empl
oym
ent
rate
Une
mpl
oym
ent
rate
Par
tici
pati
on
rate
Empl
oym
ent
rate
Une
mpl
oym
ent
rate
Par
tici
pati
on
rate
Empl
oym
ent
rate
Une
mpl
oym
ent
rate
Canada 81 75 7 67 62 7 82 77 5 67 63 7
United States 80 76 nr 61 58 nr 81 76 nr 63 59 nr
Canada and the United States 81 75 6 65 61 6 81 77 6 66 62 7
Antigua and Barbuda 86 79 nr 78 nr nr 81 nr nr 90 85 nr
Bahamas 75 64 nr 67 55 nr 77 71 nr 76 68 nr
Barbados 90 77 nr 81 73 nr 76 66 nr 78 74 nr
Cuba 81 69 15 69 58 16 82 72 13 70 59 15
Dominica 79 73 nr 80 71 nr 80 72 nr 78 72 nr
Dominican Republic 80 67 17 69 59 15 81 69 15 71 59 17
Grenada 84 76 nr 82 75 nr 78 72 nr 77 69 nr
Guyana 83 74 10 75 67 11 82 72 12 75 66 11
Haiti 79 66 17 76 63 17 82 71 13 76 64 15
Jamaica 81 68 16 80 71 11 81 69 14 80 72 10
Trinidad and Tobago 84 72 14 76 68 10 84 74 12 75 66 12
Caribbean 81 68 15 74 63 14 81 71 13 74 64 14
Belize 77 65 nr 73 67 nr 80 72 nr 72 60 nr
El Salvador 90 81 10 71 62 12 90 84 6 71 64 10
Costa Rica 87 79 nr 65 55 nr 86 79 nr 66 60 nr
Guatemala 90 82 9 63 54 14 90 84 7 64 56 12
Honduras 87 77 11 70 60 14 87 79 9 69 60 14
Mexico 87 79 9 56 49 14 87 81 7 57 50 12
Nicaragua 87 77 11 74 65 11 87 79 9 71 64 10
Panama 76 66 nr 74 66 nr 82 74 nr 71 65 nr
Central America 87 79 9 59 51 13 88 82 7 59 52 12
Bolivia (1) 89 70 21 85 75 12 85 62 27 83 70 16
Colombia 86 68 21 75 61 19 83 70 16 74 60 19
Ecuador 87 67 23 76 62 19 83 63 23 76 57 25
Peru 87 72 17 77 67 13 87 76 13 75 63 16
Venezuela (2) 85 74 13 69 57 17 83 71 15 69 56 19
Andean Region 86 69 20 76 63 17 84 68 19 75 60 20
Argentina 86 72 16 70 58 17 83 69 17 71 57 20
Brazil 86 76 11 68 57 16 85 75 11 68 56 18
Chile 85 73 13 67 55 18 82 68 17 72 61 15
Paraguay 91 75 nr 76 69 nr 82 56 nr 83 71 nr
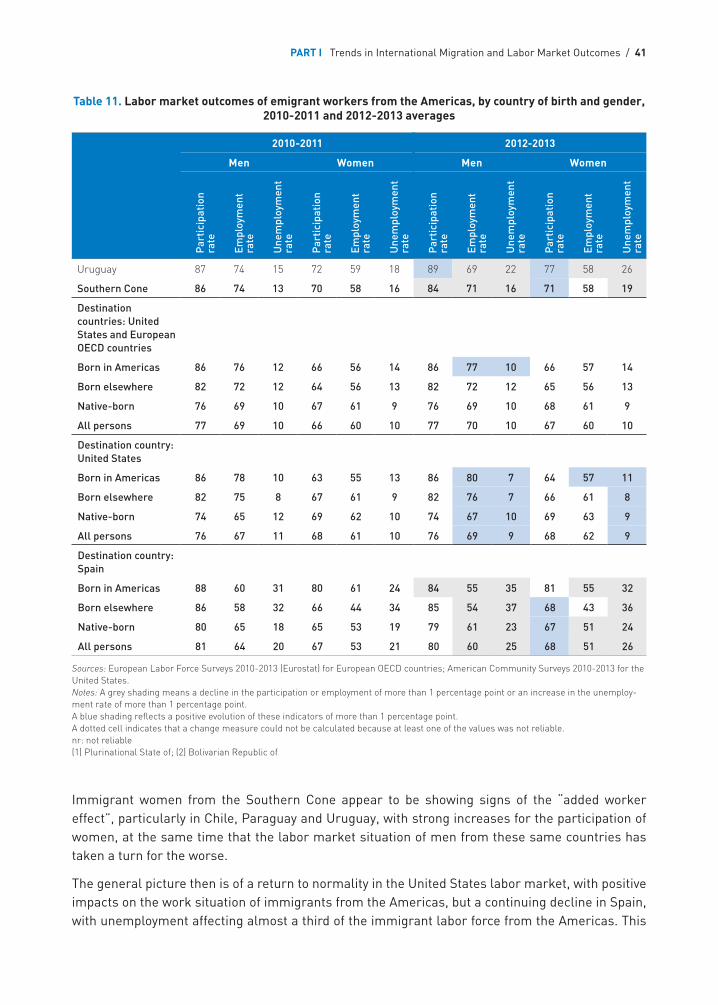
PART I Trends in International Migration and Labor Market Outcomes / 41
Immigrant women from the Southern Cone appear to be showing signs of the “added worker effect”, particularly in Chile, Paraguay and Uruguay, with strong increases for the participation of women, at the same time that the labor market situation of men from these same countries has taken a turn for the worse.
The general picture then is of a return to normality in the United States labor market, with positive impacts on the work situation of immigrants from the Americas, but a continuing decline in Spain, with unemployment affecting almost a third of the immigrant labor force from the Americas. This
Table 11. Labor market outcomes of emigrant workers from the Americas, by country of birth and gender, 2010-2011 and 2012-2013 averages
2010-2011 2012-2013
Men Women Men Women
Par
tici
pati
on
rate
Empl
oym
ent
rate
Une
mpl
oym
ent
rate
Par
tici
pati
on
rate
Empl
oym
ent
rate
Une
mpl
oym
ent
rate
Par
tici
pati
on
rate
Empl
oym
ent
rate
Une
mpl
oym
ent
rate
Par
tici
pati
on
rate
Empl
oym
ent
rate
Une
mpl
oym
ent
rate
Uruguay 87 74 15 72 59 18 89 69 22 77 58 26
Southern Cone 86 74 13 70 58 16 84 71 16 71 58 19
Destination countries: United States and European OECD countries
Born in Americas 86 76 12 66 56 14 86 77 10 66 57 14
Born elsewhere 82 72 12 64 56 13 82 72 12 65 56 13
Native-born 76 69 10 67 61 9 76 69 10 68 61 9
All persons 77 69 10 66 60 10 77 70 10 67 60 10
Destination country: United States
Born in Americas 86 78 10 63 55 13 86 80 7 64 57 11
Born elsewhere 82 75 8 67 61 9 82 76 7 66 61 8
Native-born 74 65 12 69 62 10 74 67 10 69 63 9
All persons 76 67 11 68 61 10 76 69 9 68 62 9
Destination country: Spain
Born in Americas 88 60 31 80 61 24 84 55 35 81 55 32
Born elsewhere 86 58 32 66 44 34 85 54 37 68 43 36
Native-born 80 65 18 65 53 19 79 61 23 67 51 24
All persons 81 64 20 67 53 21 80 60 25 68 51 26
Sources: European Labor Force Surveys 2010-2013 (Eurostat) for European OECD countries; American Community Surveys 2010-2013 for the United States.Notes: A grey shading means a decline in the participation or employment of more than 1 percentage point or an increase in the unemploy-ment rate of more than 1 percentage point. A blue shading reflects a positive evolution of these indicators of more than 1 percentage point. A dotted cell indicates that a change measure could not be calculated because at least one of the values was not reliable. nr: not reliable(1) Plurinational State of; (2) Bolivarian Republic of
42 / INTERNATIONAL MIGRATION IN THE AMERICAS SICREMI 2015
is evidently a rather different labor market from the one the immigrants found upon arrival and although the departure rate from Spain is more than five times what it was in 2005, the returns could not yet be characterized as massive in 2013.
2014 saw the first signs of improvement in the labor market situation in Spain, but it is slow, so that the level of departures observed in 2013 may well maintain itself. Still the situation in Spain provides almost a case study in how even an exceedingly unfavorable labor market has not strongly affected the settlement intentions of migrants from the Americas, at least not to the extent which one might have expected given the circumstances.
Over-qualification of tertiary-educated migrants from the Americas
Although emigration of migrants from the Americas is commonly associated in the public mind with lesser-skilled migration, a not inconsiderable number of tertiary-educated migrants have also migrated to OECD countries. Generally such migrants are more likely to use formal channels of migration and are also in a better position to finance their move to another country. However, recent evidence suggests that many highly educated labor migrants, at least in European countries, were recruited from within the country of destination (OECD 2014), which contradicts the standard recruitment-from-abroad model underlying much immigration regulation. Some of these may be irregular migrants, but some may have arrived as tourists or on visits to family and friends and been exposed to or sought interesting job opportunities after entry. Likewise, many highly educated migrants arrive as family or humanitarian migrants or as international students and eventually make their way into high-skilled jobs. Indeed, evidence from the same OECD study suggests that more high-skilled jobs are filled by family and humanitarian migrants and international students than by labor migrants.
Still, not all tertiary-educated15 migrants are hired into high-skilled jobs. Some may take on employment which is normally carried out by persons of a lower educational level or for which the formal educational entry requirements are lower than their own level of education (see Box 3). Such persons are said to be “overqualified” for the jobs for which they have been hired, although in practice there may be legitimate reasons for this. The proverbial example is that of a migrant with a PhD who works as a taxi driver. Such situations may occur if the migrant has only an elementary knowledge of the host-country language, enough to get by in an occupation requiring limited language proficiency, but not enough to be able to work at his/her level of education, to draft documents, do talks or presentations, negotiate with clients, etc.
However, language proficiency is not the only issue underlying over-qualification. Some workers with high credentials may prefer working in jobs which are less taxing; others may lower their expectations in the face of a difficult labor market or of financial need. It is important to note that over-qualification is also not restricted to immigrants. A significant proportion of even native-born tertiary-educated workers in all countries are overqualified for the jobs which they are doing (OECD 2014). In addition, the over-qualifications rates of immigrants, although always higher than for non-immigrants, are highly correlated across occupations to those of non-immigrants.
15 The term «tertiary» here refers not only to university education, but also to high-level technical or professional education, which can be of lesser duration than a university degree, but is considered to be university-level ed-ucation.
PART I Trends in International Migration and Labor Market Outcomes / 43
Indeed the differences in over-qualification rates across occupations are larger than those between immigrants and non-immigrants within occupations.16
Under-qualification also exists, that is, persons holding jobs for which they do not appear to have the normal required qualifications. This can occur, for example, if a person entered an occupation at a time when the entry-level qualifications were lower and acquired the skills required today through learning on the job or through experience. However, we will not be addressing under-qualification in this section, which will be focusing strictly on overqualified tertiary-educated immigrants. In addition, the emphasis will be on those employed. Although unemployment among tertiary-educated persons could be said to be the ultimate in over-qualification, our interest here is more on the situation of job-holders than on persons unemployed, a group which includes the lesser educated, who would then also be deemed overqualified if our definition were based on this status as well.
Box 3. Classifying the skill level of jobs
In order to be able to determine if a person is overqualified for a particular job, the skill level of the job must be known. How is this determined?
The statistics presented in this section are based on labor force surveys and the classification of occupations in such surveys is generally derived from a description of the occupation provided by the survey respondent and its subsequent categorization into a formal occupational classification system.
As it happens, the International Standard Classification of Occupations (ISCO) includes a skill dimension, related to the entry-level educational level required for a job (ILO 2012). Now this may vary by country to a certain unknown extent; it is assumed here that the extent of this variation is small and that the statistics are reasonably comparable across countries.
The European Union Labor Force Survey on which the statistics for European countries are based collects occupational data using the ISCO classification, so that the job skill level for statistics from the European Union comes directly from the skill level defined in ISCO. The high-skill level corresponds to jobs whose normal entry-level qualification is a tertiary degree (groups 1, 2 and 3 in the 1-digit ISCO classification).
The United States American Community Survey, however, applies a national classification system (the SOC, Standard Occupational Classification), which does not include a skill dimension per se. However, it does include a number of groups, whose occupations are held largely by persons with tertiary degrees. These are management, business and financial occupations (66% with tertiary), on the one hand, and professional and related occupations (79% with tertiary), on the other. Two other occupations groups have significant numbers of tertiary-educated jobholders, namely, sales and related occupations (35% with tertiary) and office and administrative support occupations (31% with tertiary). But without further information, it is difficult to know whether certain occupations in these large groups may or may not be high-skilled occupations.
Because of the differences in the occupational classifications in the data sources used for European Union and United States statistics, the indicators shown in Table 12 cannot be considered fully comparable. Readers are cautioned against drawing conclusions comparing directly outcomes in
16 OECD, unpublished results.
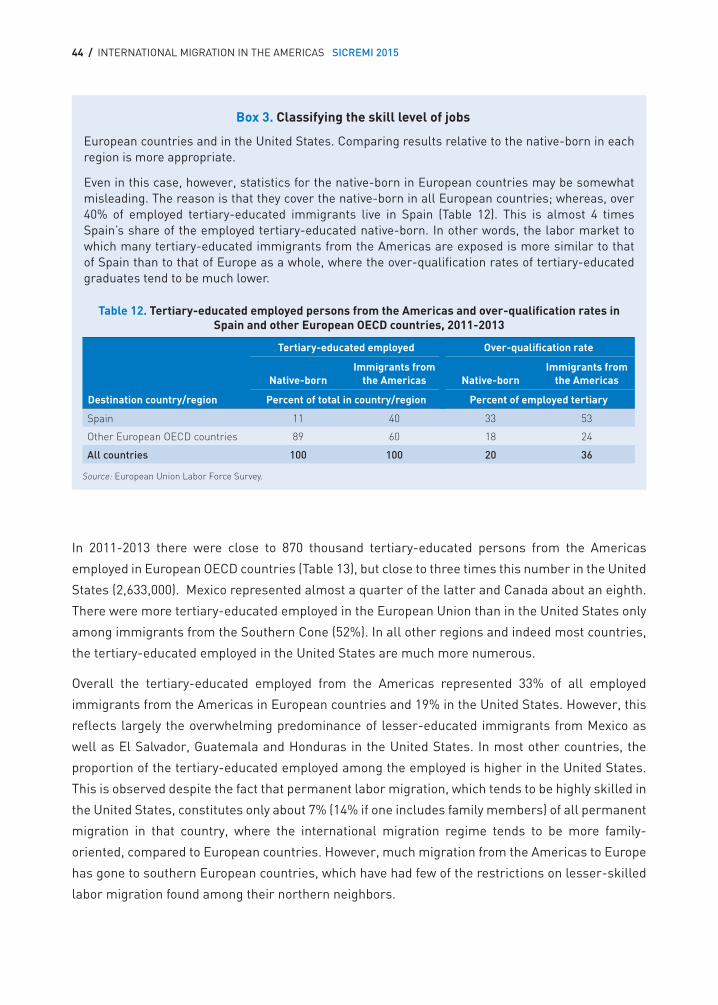
44 / INTERNATIONAL MIGRATION IN THE AMERICAS SICREMI 2015
European countries and in the United States. Comparing results relative to the native-born in each region is more appropriate.
Even in this case, however, statistics for the native-born in European countries may be somewhat misleading. The reason is that they cover the native-born in all European countries; whereas, over 40% of employed tertiary-educated immigrants live in Spain (Table 12). This is almost 4 times Spain’s share of the employed tertiary-educated native-born. In other words, the labor market to which many tertiary-educated immigrants from the Americas are exposed is more similar to that of Spain than to that of Europe as a whole, where the over-qualification rates of tertiary-educated graduates tend to be much lower.
Table 12. Tertiary-educated employed persons from the Americas and over-qualification rates in Spain and other European OECD countries, 2011-2013
Destination country/region
Tertiary-educated employed Over-qualification rate
Native-bornImmigrants from
the Americas Native-bornImmigrants from
the Americas
Percent of total in country/region Percent of employed tertiary
Spain 11 40 33 53
Other European OECD countries 89 60 18 24
All countries 100 100 20 36
Source: European Union Labor Force Survey.
Box 3. Classifying the skill level of jobs
In 2011-2013 there were close to 870 thousand tertiary-educated persons from the Americas
employed in European OECD countries (Table 13), but close to three times this number in the United
States (2,633,000). Mexico represented almost a quarter of the latter and Canada about an eighth.
There were more tertiary-educated employed in the European Union than in the United States only
among immigrants from the Southern Cone (52%). In all other regions and indeed most countries,
the tertiary-educated employed in the United States are much more numerous.
Overall the tertiary-educated employed from the Americas represented 33% of all employed
immigrants from the Americas in European countries and 19% in the United States. However, this
reflects largely the overwhelming predominance of lesser-educated immigrants from Mexico as
well as El Salvador, Guatemala and Honduras in the United States. In most other countries, the
proportion of the tertiary-educated employed among the employed is higher in the United States.
This is observed despite the fact that permanent labor migration, which tends to be highly skilled in
the United States, constitutes only about 7% (14% if one includes family members) of all permanent
migration in that country, where the international migration regime tends to be more family-
oriented, compared to European countries. However, much migration from the Americas to Europe
has gone to southern European countries, which have had few of the restrictions on lesser-skilled
labor migration found among their northern neighbors.
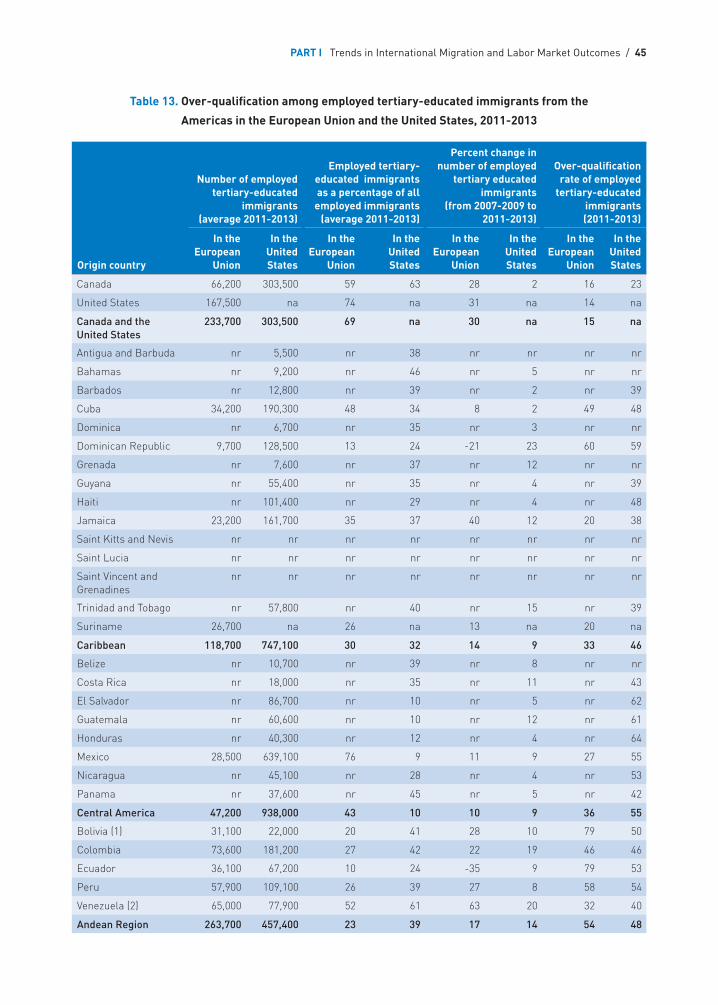
PART I Trends in International Migration and Labor Market Outcomes / 45
Table 13. Over-qualification among employed tertiary-educated immigrants from the
Americas in the European Union and the United States, 2011-2013
Origin country
Number of employed tertiary-educated
immigrants (average 2011-2013)
Employed tertiary-educated immigrants as a percentage of all
employed immigrants (average 2011-2013)
Percent change in number of employed
tertiary educated immigrants
(from 2007-2009 to 2011-2013)
Over-qualification rate of employed
tertiary-educated immigrants (2011-2013)
In the European
Union
In the United States
In the European
Union
In the United States
In the European
Union
In the United States
In the European
Union
In the United States
Canada 66,200 303,500 59 63 28 2 16 23
United States 167,500 na 74 na 31 na 14 na
Canada and the United States
233,700 303,500 69 na 30 na 15 na
Antigua and Barbuda nr 5,500 nr 38 nr nr nr nr
Bahamas nr 9,200 nr 46 nr 5 nr nr
Barbados nr 12,800 nr 39 nr 2 nr 39
Cuba 34,200 190,300 48 34 8 2 49 48
Dominica nr 6,700 nr 35 nr 3 nr nr
Dominican Republic 9,700 128,500 13 24 -21 23 60 59
Grenada nr 7,600 nr 37 nr 12 nr nr
Guyana nr 55,400 nr 35 nr 4 nr 39
Haiti nr 101,400 nr 29 nr 4 nr 48
Jamaica 23,200 161,700 35 37 40 12 20 38
Saint Kitts and Nevis nr nr nr nr nr nr nr nr
Saint Lucia nr nr nr nr nr nr nr nr
Saint Vincent and Grenadines
nr nr nr nr nr nr nr nr
Trinidad and Tobago nr 57,800 nr 40 nr 15 nr 39
Suriname 26,700 na 26 na 13 na 20 na
Caribbean 118,700 747,100 30 32 14 9 33 46
Belize nr 10,700 nr 39 nr 8 nr nr
Costa Rica nr 18,000 nr 35 nr 11 nr 43
El Salvador nr 86,700 nr 10 nr 5 nr 62
Guatemala nr 60,600 nr 10 nr 12 nr 61
Honduras nr 40,300 nr 12 nr 4 nr 64
Mexico 28,500 639,100 76 9 11 9 27 55
Nicaragua nr 45,100 nr 28 nr 4 nr 53
Panama nr 37,600 nr 45 nr 5 nr 42
Central America 47,200 938,000 43 10 10 9 36 55
Bolivia (1) 31,100 22,000 20 41 28 10 79 50
Colombia 73,600 181,200 27 42 22 19 46 46
Ecuador 36,100 67,200 10 24 -35 9 79 53
Peru 57,900 109,100 26 39 27 8 58 54
Venezuela (2) 65,000 77,900 52 61 63 20 32 40
Andean Region 263,700 457,400 23 39 17 14 54 48
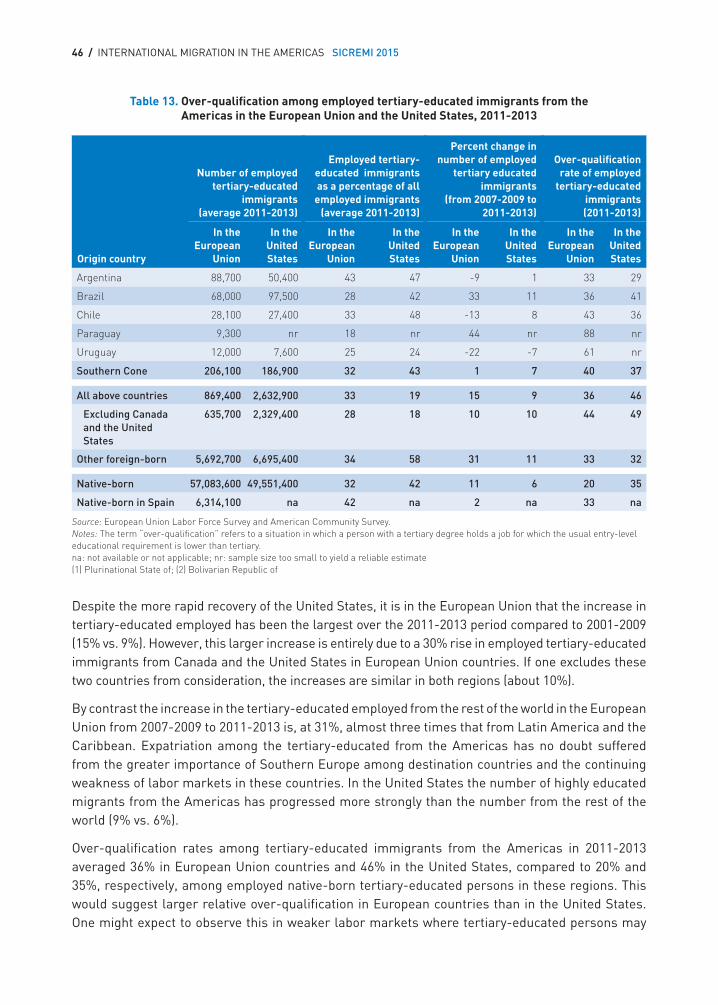
46 / INTERNATIONAL MIGRATION IN THE AMERICAS SICREMI 2015
Origin country
Number of employed tertiary-educated
immigrants (average 2011-2013)
Employed tertiary-educated immigrants as a percentage of all
employed immigrants (average 2011-2013)
Percent change in number of employed
tertiary educated immigrants
(from 2007-2009 to 2011-2013)
Over-qualification rate of employed
tertiary-educated immigrants (2011-2013)
In the European
Union
In the United States
In the European
Union
In the United States
In the European
Union
In the United States
In the European
Union
In the United States
Argentina 88,700 50,400 43 47 -9 1 33 29
Brazil 68,000 97,500 28 42 33 11 36 41
Chile 28,100 27,400 33 48 -13 8 43 36
Paraguay 9,300 nr 18 nr 44 nr 88 nr
Uruguay 12,000 7,600 25 24 -22 -7 61 nr
Southern Cone 206,100 186,900 32 43 1 7 40 37
All above countries 869,400 2,632,900 33 19 15 9 36 46
Excluding Canada and the United States
635,700 2,329,400 28 18 10 10 44 49
Other foreign-born 5,692,700 6,695,400 34 58 31 11 33 32
Native-born 57,083,600 49,551,400 32 42 11 6 20 35
Native-born in Spain 6,314,100 na 42 na 2 na 33 na
Source: European Union Labor Force Survey and American Community Survey.Notes: The term “over-qualification” refers to a situation in which a person with a tertiary degree holds a job for which the usual entry-level educational requirement is lower than tertiary. na: not available or not applicable; nr: sample size too small to yield a reliable estimate (1) Plurinational State of; (2) Bolivarian Republic of
Table 13. Over-qualification among employed tertiary-educated immigrants from the Americas in the European Union and the United States, 2011-2013
Despite the more rapid recovery of the United States, it is in the European Union that the increase in tertiary-educated employed has been the largest over the 2011-2013 period compared to 2001-2009 (15% vs. 9%). However, this larger increase is entirely due to a 30% rise in employed tertiary-educated immigrants from Canada and the United States in European Union countries. If one excludes these two countries from consideration, the increases are similar in both regions (about 10%).
By contrast the increase in the tertiary-educated employed from the rest of the world in the European Union from 2007-2009 to 2011-2013 is, at 31%, almost three times that from Latin America and the Caribbean. Expatriation among the tertiary-educated from the Americas has no doubt suffered from the greater importance of Southern Europe among destination countries and the continuing weakness of labor markets in these countries. In the United States the number of highly educated migrants from the Americas has progressed more strongly than the number from the rest of the world (9% vs. 6%).
Over-qualification rates among tertiary-educated immigrants from the Americas in 2011-2013 averaged 36% in European Union countries and 46% in the United States, compared to 20% and 35%, respectively, among employed native-born tertiary-educated persons in these regions. This would suggest larger relative over-qualification in European countries than in the United States. One might expect to observe this in weaker labor markets where tertiary-educated persons may
PART I Trends in International Migration and Labor Market Outcomes / 47
lower their expectations if they are unable to find jobs commensurate with their qualifications and accept, if only for a while, jobs which are lower paid and require lower skill levels than they possess.
In addition, many highly-educated labor migrants to Europe arrived without prior jobs, and empirical results have shown that immigrants hired under these conditions do tend to have higher over-qualification rates than persons hired from abroad, who may well condition their departure on finding a job that corresponds to their educational level (OECD 2014). Immigrants who are on site and have already defrayed the costs of migrating from their countries of origin may not always be able to afford the luxury of waiting until they can find a job that matches their skill endowments.
If one removes immigrants from Canada and the United States from the calculation of over-qualification rates, the difference in rates for immigrants from the Americas compared to the native-born becomes even larger than that mentioned above. The over-qualification rates recorded, then, for immigrants from Latin America and the Caribbean, are 44% for the European Union and 49% for the United States. If one now adjusts the over-qualification rate of the native-born in the European Union to take into account the fact that a high proportion of immigrants from the Americas are working in Spain, then the native-born over-qualification rate rises to about 24%, which is still significantly lower than that of immigrants from the Americas.
In short, over-qualification rates of immigrants from countries of Latin America and the Caribbean are some 15 to 20 points higher than for native-born persons. Language proficiency is not necessarily at issue here because the over-qualification rate in Spain is even higher at 53% than for the European Union as a whole (36%). Why might this be this so?
Migration to Southern Europe over the past decade has in general been biased towards lesser-skilled jobs. One reason for this has to do with the strong progression of educational attainment in these countries. Indeed the difference between the educational attainment of the retiring labor force cohorts and the newly entering ones in southern Europe have been exceedingly large (OECD 2014), indeed the highest by far among EU countries. On the other hand, the skill level of jobs in the economy has not progressed as strongly as the educational attainment of the youth population in these countries.
One consequence has been high levels of over-qualification among young native-born workers, on the one hand, and, on the other, a strong demand for workers to take on the lesser skilled jobs which many of the less numerous and highly educated native-born youth have been less willing to accept. Workers from Latin America were quick to take advantage of the opportunities which developed, undoubtedly with the expectation that their labor market situation would improve over time. However, the implosion of the Spanish economy in 2008 in the wake of the bubble in the construction sector and the subsequent budget crisis have mortgaged the possibility of rapid progress for the tertiary-educated. Nowhere is this more evident than in the high unemployment rates in general and the high over-qualification rates among the tertiary-educated. As we have seen, some are now returning but many have settled for good. Only a vastly improved labor market will be able to improve their prospects. Although the signs of this are present, they are still relatively tentative, so that a significant improvement in the short-term seems unlikely.
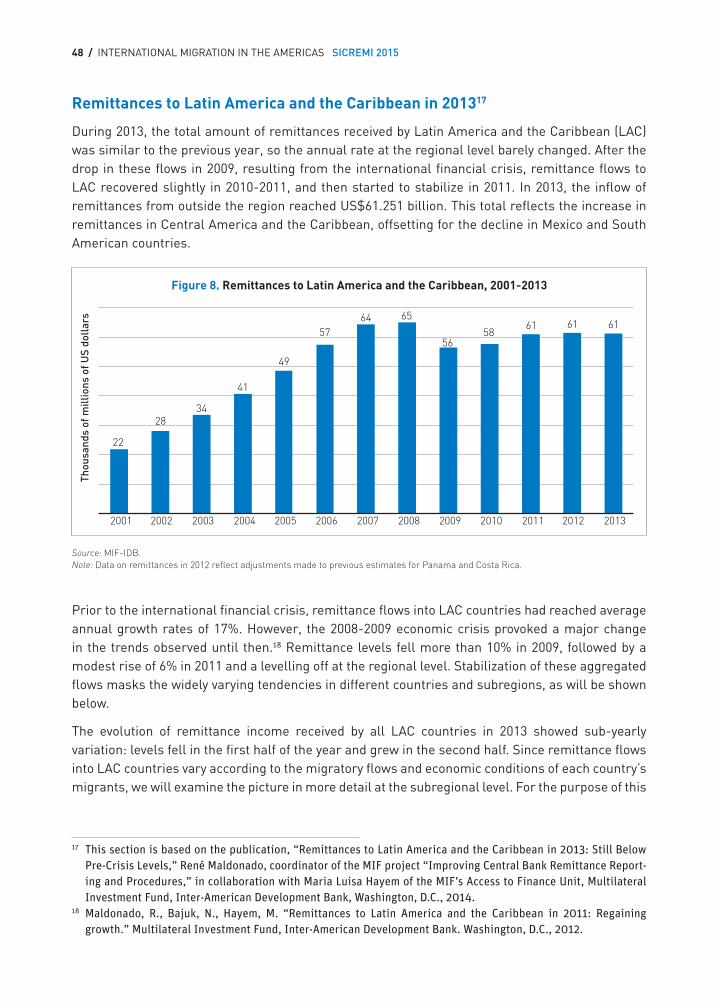
48 / INTERNATIONAL MIGRATION IN THE AMERICAS SICREMI 2015
Remittances to Latin America and the Caribbean in 201317
During 2013, the total amount of remittances received by Latin America and the Caribbean (LAC) was similar to the previous year, so the annual rate at the regional level barely changed. After the drop in these flows in 2009, resulting from the international financial crisis, remittance flows to LAC recovered slightly in 2010-2011, and then started to stabilize in 2011. In 2013, the inflow of remittances from outside the region reached US$61.251 billion. This total reflects the increase in remittances in Central America and the Caribbean, offsetting for the decline in Mexico and South American countries.
Source: MIF-IDB.Note: Data on remittances in 2012 reflect adjustments made to previous estimates for Panama and Costa Rica.
Prior to the international financial crisis, remittance flows into LAC countries had reached average annual growth rates of 17%. However, the 2008-2009 economic crisis provoked a major change in the trends observed until then.18 Remittance levels fell more than 10% in 2009, followed by a modest rise of 6% in 2011 and a levelling off at the regional level. Stabilization of these aggregated flows masks the widely varying tendencies in different countries and subregions, as will be shown below.
The evolution of remittance income received by all LAC countries in 2013 showed sub-yearly variation: levels fell in the first half of the year and grew in the second half. Since remittance flows into LAC countries vary according to the migratory flows and economic conditions of each country’s migrants, we will examine the picture in more detail at the subregional level. For the purpose of this
17 This section is based on the publication, “Remittances to Latin America and the Caribbean in 2013: Still Below Pre-Crisis Levels,” René Maldonado, coordinator of the MIF project “Improving Central Bank Remittance Report-ing and Procedures,” in collaboration with Maria Luisa Hayem of the MIF’s Access to Finance Unit, Multilateral Investment Fund, Inter-American Development Bank, Washington, D.C., 2014.
18 Maldonado, R., Bajuk, N., Hayem, M. “Remittances to Latin America and the Caribbean in 2011: Regaining growth.” Multilateral Investment Fund, Inter-American Development Bank. Washington, D.C., 2012.
Figure 8. Remittances to Latin America and the Caribbean, 2001-2013
22
2834
41
49
5764 65
5658
61 61 61
2001 2002 2003 2004 2005 2006 2007 2008 2009 2010 2011 2012 2013
Thou
sand
s of
mill
ions
of U
S do
llar
s
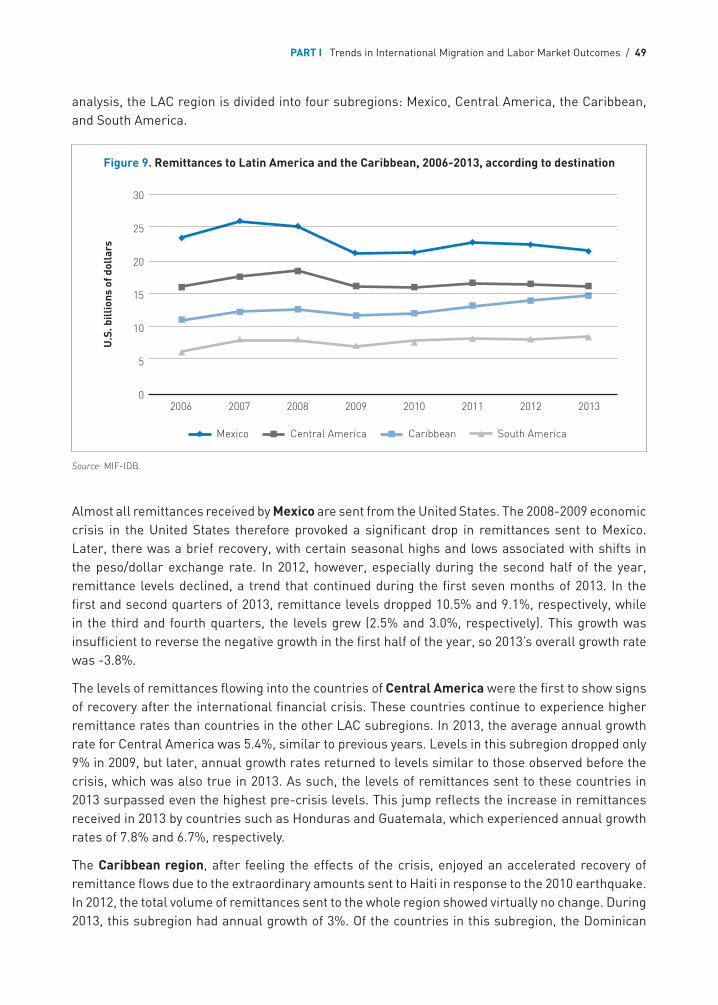
PART I Trends in International Migration and Labor Market Outcomes / 49
analysis, the LAC region is divided into four subregions: Mexico, Central America, the Caribbean, and South America.
Source: MIF-IDB.
Almost all remittances received by Mexico are sent from the United States. The 2008-2009 economic crisis in the United States therefore provoked a significant drop in remittances sent to Mexico. Later, there was a brief recovery, with certain seasonal highs and lows associated with shifts in the peso/dollar exchange rate. In 2012, however, especially during the second half of the year, remittance levels declined, a trend that continued during the first seven months of 2013. In the first and second quarters of 2013, remittance levels dropped 10.5% and 9.1%, respectively, while in the third and fourth quarters, the levels grew (2.5% and 3.0%, respectively). This growth was insufficient to reverse the negative growth in the first half of the year, so 2013’s overall growth rate was -3.8%.
The levels of remittances flowing into the countries of Central America were the first to show signs of recovery after the international financial crisis. These countries continue to experience higher remittance rates than countries in the other LAC subregions. In 2013, the average annual growth rate for Central America was 5.4%, similar to previous years. Levels in this subregion dropped only 9% in 2009, but later, annual growth rates returned to levels similar to those observed before the crisis, which was also true in 2013. As such, the levels of remittances sent to these countries in 2013 surpassed even the highest pre-crisis levels. This jump reflects the increase in remittances received in 2013 by countries such as Honduras and Guatemala, which experienced annual growth rates of 7.8% and 6.7%, respectively.
The Caribbean region, after feeling the effects of the crisis, enjoyed an accelerated recovery of remittance flows due to the extraordinary amounts sent to Haiti in response to the 2010 earthquake. In 2012, the total volume of remittances sent to the whole region showed virtually no change. During 2013, this subregion had annual growth of 3%. Of the countries in this subregion, the Dominican
Figure 9. Remittances to Latin America and the Caribbean, 2006-2013, according to destination
2006 2008 2010 20122007 2009 2011 2013
Mexico Central America Caribbean South America
U.S
. bill
ions
of d
olla
rs
30
25
20
15
10
5
0
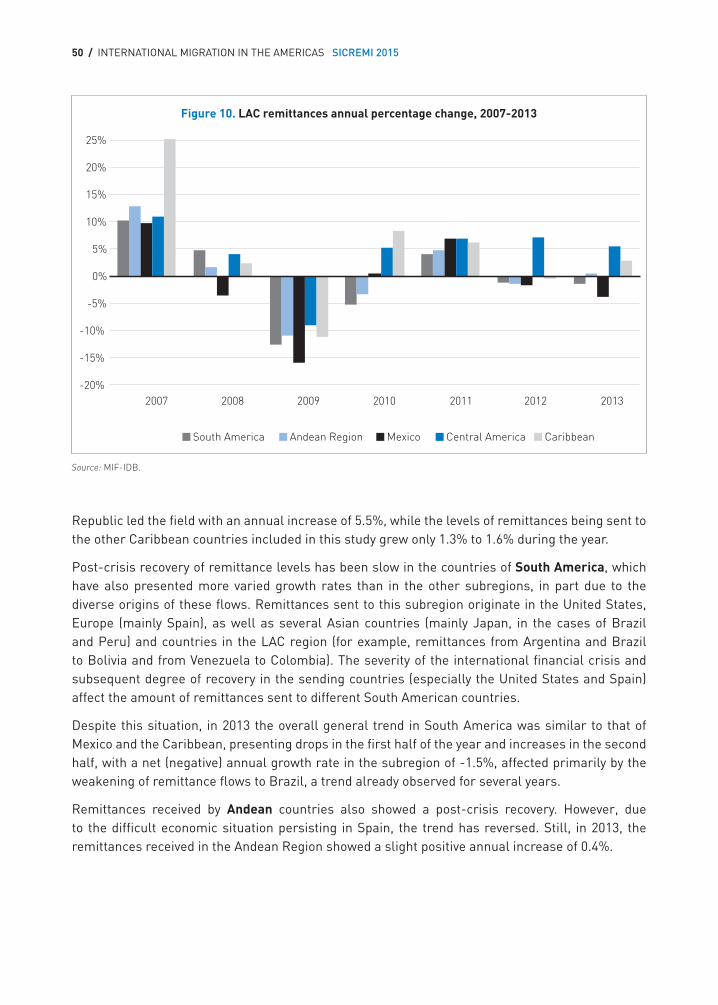
50 / INTERNATIONAL MIGRATION IN THE AMERICAS SICREMI 2015
Republic led the field with an annual increase of 5.5%, while the levels of remittances being sent to the other Caribbean countries included in this study grew only 1.3% to 1.6% during the year.
Post-crisis recovery of remittance levels has been slow in the countries of South America, which have also presented more varied growth rates than in the other subregions, in part due to the diverse origins of these flows. Remittances sent to this subregion originate in the United States, Europe (mainly Spain), as well as several Asian countries (mainly Japan, in the cases of Brazil and Peru) and countries in the LAC region (for example, remittances from Argentina and Brazil to Bolivia and from Venezuela to Colombia). The severity of the international financial crisis and subsequent degree of recovery in the sending countries (especially the United States and Spain) affect the amount of remittances sent to different South American countries.
Despite this situation, in 2013 the overall general trend in South America was similar to that of Mexico and the Caribbean, presenting drops in the first half of the year and increases in the second half, with a net (negative) annual growth rate in the subregion of -1.5%, affected primarily by the weakening of remittance flows to Brazil, a trend already observed for several years.
Remittances received by Andean countries also showed a post-crisis recovery. However, due to the difficult economic situation persisting in Spain, the trend has reversed. Still, in 2013, the remittances received in the Andean Region showed a slight positive annual increase of 0.4%.
Figure 10. LAC remittances annual percentage change, 2007-2013
-20%
-15%
-10%
-5%
0%
5%
10%
15%
20%
25%
2007 2008 2009 2010 2011 2012 2013
South America Andean Region Mexico Central America Caribbean
Source: MIF-IDB.
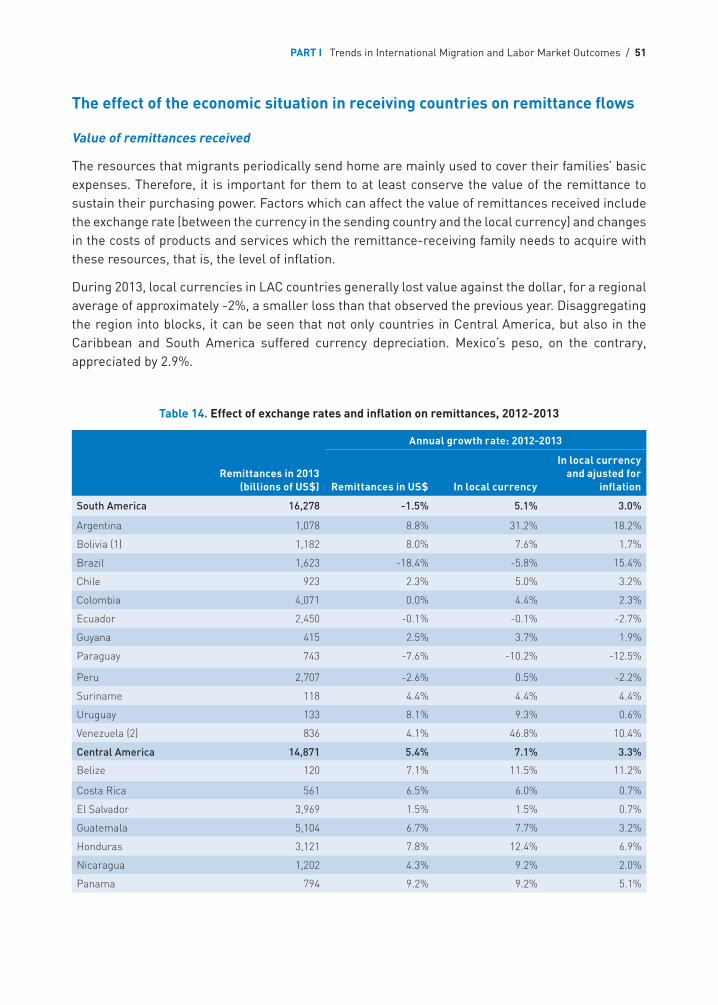
PART I Trends in International Migration and Labor Market Outcomes / 51
The effect of the economic situation in receiving countries on remittance flows
Value of remittances received
The resources that migrants periodically send home are mainly used to cover their families’ basic expenses. Therefore, it is important for them to at least conserve the value of the remittance to sustain their purchasing power. Factors which can affect the value of remittances received include the exchange rate (between the currency in the sending country and the local currency) and changes in the costs of products and services which the remittance-receiving family needs to acquire with these resources, that is, the level of inflation.
During 2013, local currencies in LAC countries generally lost value against the dollar, for a regional average of approximately -2%, a smaller loss than that observed the previous year. Disaggregating the region into blocks, it can be seen that not only countries in Central America, but also in the Caribbean and South America suffered currency depreciation. Mexico’s peso, on the contrary, appreciated by 2.9%.
Table 14. Effect of exchange rates and inflation on remittances, 2012-2013
Remittances in 2013 (billions of US$)
Annual growth rate: 2012-2013
Remittances in US$ In local currency
In local currency and ajusted for
inflation
South America 16,278 -1.5% 5.1% 3.0%
Argentina 1,078 8.8% 31.2% 18.2%
Bolivia (1) 1,182 8.0% 7.6% 1.7%
Brazil 1,623 -18.4% -5.8% 15.4%
Chile 923 2.3% 5.0% 3.2%
Colombia 4,071 0.0% 4.4% 2.3%
Ecuador 2,450 -0.1% -0.1% -2.7%
Guyana 415 2.5% 3.7% 1.9%
Paraguay 743 -7.6% -10.2% -12.5%
Peru 2,707 -2.6% 0.5% -2.2%
Suriname 118 4.4% 4.4% 4.4%
Uruguay 133 8.1% 9.3% 0.6%
Venezuela (2) 836 4.1% 46.8% 10.4%
Central America 14,871 5.4% 7.1% 3.3%
Belize 120 7.1% 11.5% 11.2%
Costa Rica 561 6.5% 6.0% 0.7%
El Salvador 3,969 1.5% 1.5% 0.7%
Guatemala 5,104 6.7% 7.7% 3.2%
Honduras 3,121 7.8% 12.4% 6.9%
Nicaragua 1,202 4.3% 9.2% 2.0%
Panama 794 9.2% 9.2% 5.1%
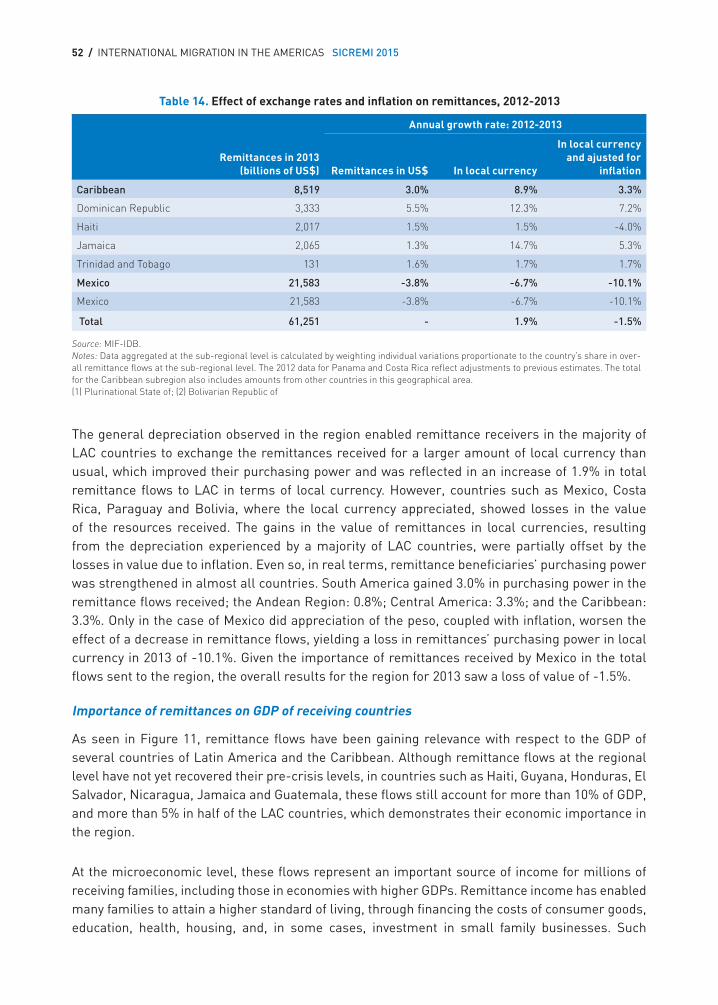
52 / INTERNATIONAL MIGRATION IN THE AMERICAS SICREMI 2015
Remittances in 2013 (billions of US$)
Annual growth rate: 2012-2013
Remittances in US$ In local currency
In local currency and ajusted for
inflation
Caribbean 8,519 3.0% 8.9% 3.3%
Dominican Republic 3,333 5.5% 12.3% 7.2%
Haiti 2,017 1.5% 1.5% -4.0%
Jamaica 2,065 1.3% 14.7% 5.3%
Trinidad and Tobago 131 1.6% 1.7% 1.7%
Mexico 21,583 -3.8% -6.7% -10.1%
Mexico 21,583 -3.8% -6.7% -10.1%
Total 61,251 - 1.9% -1.5%
Source: MIF-IDB.Notes: Data aggregated at the sub-regional level is calculated by weighting individual variations proportionate to the country’s share in over-all remittance flows at the sub-regional level. The 2012 data for Panama and Costa Rica reflect adjustments to previous estimates. The total for the Caribbean subregion also includes amounts from other countries in this geographical area. (1) Plurinational State of; (2) Bolivarian Republic of
The general depreciation observed in the region enabled remittance receivers in the majority of LAC countries to exchange the remittances received for a larger amount of local currency than usual, which improved their purchasing power and was reflected in an increase of 1.9% in total remittance flows to LAC in terms of local currency. However, countries such as Mexico, Costa Rica, Paraguay and Bolivia, where the local currency appreciated, showed losses in the value of the resources received. The gains in the value of remittances in local currencies, resulting from the depreciation experienced by a majority of LAC countries, were partially offset by the losses in value due to inflation. Even so, in real terms, remittance beneficiaries’ purchasing power was strengthened in almost all countries. South America gained 3.0% in purchasing power in the remittance flows received; the Andean Region: 0.8%; Central America: 3.3%; and the Caribbean: 3.3%. Only in the case of Mexico did appreciation of the peso, coupled with inflation, worsen the effect of a decrease in remittance flows, yielding a loss in remittances’ purchasing power in local currency in 2013 of -10.1%. Given the importance of remittances received by Mexico in the total flows sent to the region, the overall results for the region for 2013 saw a loss of value of -1.5%.
Importance of remittances on GDP of receiving countries
As seen in Figure 11, remittance flows have been gaining relevance with respect to the GDP of several countries of Latin America and the Caribbean. Although remittance flows at the regional level have not yet recovered their pre-crisis levels, in countries such as Haiti, Guyana, Honduras, El Salvador, Nicaragua, Jamaica and Guatemala, these flows still account for more than 10% of GDP, and more than 5% in half of the LAC countries, which demonstrates their economic importance in the region.
At the microeconomic level, these flows represent an important source of income for millions of receiving families, including those in economies with higher GDPs. Remittance income has enabled many families to attain a higher standard of living, through financing the costs of consumer goods, education, health, housing, and, in some cases, investment in small family businesses. Such
Table 14. Effect of exchange rates and inflation on remittances, 2012-2013
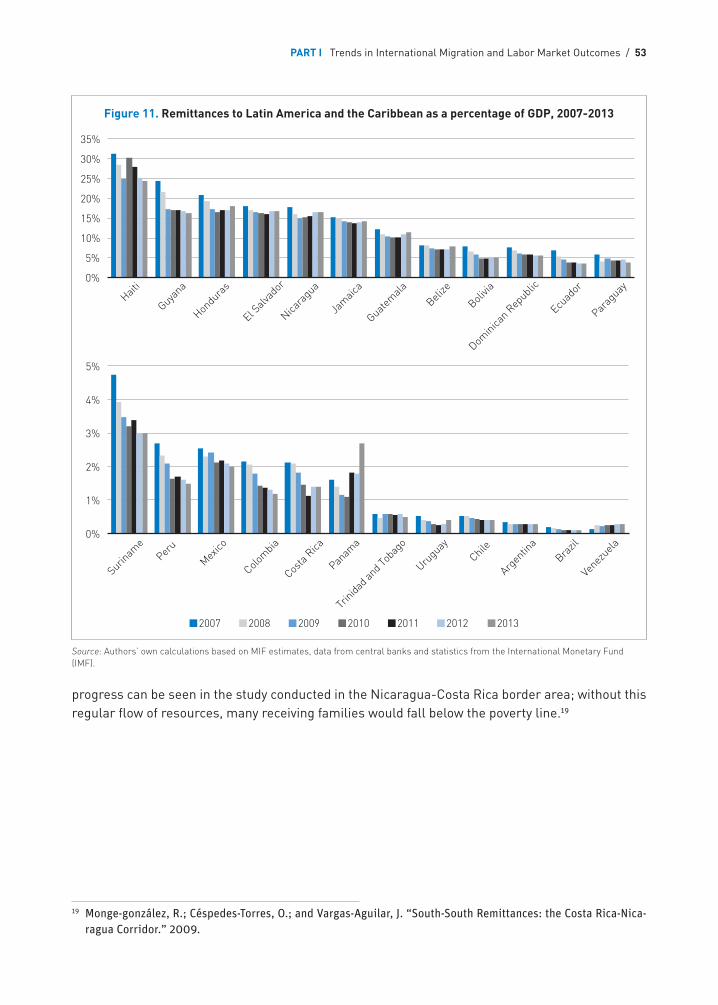
PART I Trends in International Migration and Labor Market Outcomes / 53
progress can be seen in the study conducted in the Nicaragua-Costa Rica border area; without this regular flow of resources, many receiving families would fall below the poverty line.19
19 Monge-gonzalez, R.; Céspedes-Torres, O.; and Vargas-Aguilar, J. “South-South Remittances: the Costa Rica-Nica-ragua Corridor.” 2009.
Figure 11. Remittances to Latin America and the Caribbean as a percentage of GDP, 2007-2013
0%
5%
10%
15%
20%
25%
30%
35%
Hait
i
Guyana
Hondu
ras
El Salv
ador
Nicara
gua
Jam
aica
Guatem
ala
Belize
Bolivia
Dominica
n Rep
ublic
Ecuad
or
Parag
uay
0%
1%
2%
3%
4%
5%
Surinam
ePer
u
Mexico
Colom
bia
Costa
Rica
Panam
a
Trinida
d and T
obag
o
Urugu
ayChile
Argen
tina
Brazil
Venez
uela
2007 2008 2009 2010 2011 2012 2013
Source: Authors’ own calculations based on MIF estimates, data from central banks and statistics from the International Monetary Fund (IMF).
54 / INTERNATIONAL MIGRATION IN THE AMERICAS SICREMI 2015
References
Hoefer, Michael, Nancy Rytina and Bryan C. Baker, 2012. “Estimates of the Unauthorized Immigrant Population Residing in the United States: January 2010,” Office of Immigration Statistics, Policy Directorate, U.S. Department of Homeland Security.
ILO 2012. The International Standard Classification of Occupations. International Labor Office, Geneva.
OAS/OECD 2012. International Migration in the Americas. Organization of American States, Washington, D.C. and Organisation for Economic Co-operation and Development, Paris.
OECD 2011. Naturalization: A Passport for the Better Integration of Immigrants? Organisation for Economic Co-operation and Development, Paris.
OECD 2014. Matching Economic Migration with Labor Market Needs. Organisation for Economic Co-operation and Development, Paris.
Passel, Jeffrey S. and D’Vera Cohn (2009). “A Portrait of Unauthorized Immigrants in the United States”. Pew Research Center, Washington, D.C.
SC 2013. “Obtaining Canadian Citizenship”, NHS in Brief, 2013, Statistics Canada Catalogue no. 99-010-X2011003.
PART I Trends in International Migration and Labor Market Outcomes / 55
Annex 1. The extent of irregular migration in the Americas
In all countries there exists irregular migration, that is, migration of persons who enter without going through border controls, or do so but with false documents or who enter legally but overstay the conditions imposed on them by the destination country at the time of entry.
Generally, it is difficult if not always impossible to estimate the size of the unauthorized immigrant population because, by definition, such migrants leave no administrative trail. Certain countries, among them the United States, have developed methods to estimate the size of the unauthorized foreign-born population on a regular basis (Hoefer, Rytina and Baker, 2012). The estimate of this population in 2012 in the United States was approximately 11.4 million persons, which is more than one-fourth of the foreign-born population of that country and almost 4% of the total population of the country.
The first indications about the size of this population in the United States occurred at the time of the 2000 decennial census, which uncovered some 8 million more foreign-born persons than were expected on the basis of the legal entries which had occurred over the 2000-2010 period. The census result could only be recorded if irregular migrants actually responded on the population census and indeed, in practice, this does seem to be generally the case. Irregular migrants may not necessarily view a response on the census as likely to jeopardize their status in the country or may indeed consider that responding is a behavior more likely associated with a legal presence.
In any event, the fact that irregular migrants do seem to respond to census questions can provide a way to assess the extent of irregular migration. We are assuming here that the population censuses for all countries considered provide good coverage of the immigrant population, both regular and irregular, that few temporary migrants are covered in the census and that the extent of coverage of the immigrant population is approximately the same in consecutive censuses. We are also assuming that the immigration statistics include changes of status, that is, that persons entering on a temporary status and who later change to a permanent status, are recorded in the immigration statistics as permanent immigrants in the year that they change status.
There are at least two ways in which statistics from the census on the foreign-born population and from immigration inflows can provide some indication of the extent of irregular migration.
The first is to take the ratio of the foreign-born population observed at the time of the census to a measure of the usual number of permanent immigrants entering per year at around the same time, estimated here by taking a five-year average centered on the census year. Under conditions of stationarity (that is, no change in the size of the foreign-born population), this ratio can be shown to provide a measure of the average duration of stay of immigrants, in years. The stationarity condition is of course never satisfied in practice, but as along as the flows are not changing too fast, the measure calculated can provide a reasonable approximation of the average duration of stay. What sort of average duration measure should one expect? If permanent migrants have been arriving in the same numbers each year for a long time, with an average age of 25 and a life expectancy of 75, then their estimated average duration of stay will be close to 25 years (half the expected duration of 50 years) since on average one will be observing the expected duration at its half-way point. For long-standing migration countries such as Canada, this is roughly the value one should obtain, although it will be affected by the variation over time in the size of the inflows and in departure rates of former immigrants. For more recent migration countries, the estimate should be substantially
56 / INTERNATIONAL MIGRATION IN THE AMERICAS SICREMI 2015
less. If the estimate is unrealistically high, then some persons must be entering the foreign-born population without being recorded as immigrants.
There are two ways this can happen. One is through unauthorized migration, including overstays by persons entering legally under a temporary status. The other is through the return to the country of nationals born abroad who, by virtue of their nationality, are not subject to migration control.
The second method of assessing the extent of coverage of the immigration statistics is to measure the change in the foreign-born population between two censuses and compare this to the number of permanent immigrants who have entered over the period; this latter sum should be significantly larger than the change in the foreign-born population, because of deaths and departures of both migrants who entered over the reference period but also of migrants who entered prior to the earlier census year. If the change in the foreign-born population exceeds the number of immigrants who arrived over the period, then, as was the case above, certain foreign-born persons must be entering the ranks of the foreign-born population without formally being recorded in the permanent immigrant flows.
In practice, the two sources of distortion in the estimates (unauthorized migrants and persons born abroad as nationals) cannot be distinguished without additional information. It will nonetheless be instructive to examine what these measures yield for countries of the Americas.
Annex Table A1 provides the results for both measures for a number of countries of the Americas, as well as for Spain and Sweden. For some of the countries in the table, flow measures do not exist for all intercensal years, so the earliest year has been extended backward to the earlier census year. If flows have generally been increasing, as has been the case, this will tend to upward bias the inflow estimates and downward bias the duration-of-stay estimate.
Note first of all, the duration-of-stay measure for Canada (27 years), close to the expected value, a long-standing migration country where many immigrants arrived young and have spent most of their lives in the country. For the United States, if we subtract the estimated 11.6 million unauthorized immigrants in that country in 2010 from the total foreign-born population, the calculation yields an average duration measure that is similar to that of Canada (26 years).
Spain and Sweden have been included here because unauthorized immigrants are counted in the Spanish immigration statistics and because, in the case of Sweden, statistics for immigrants and for the foreign-born population are from the same source, namely the population register, which does not register unauthorized immigrants. In other words, for these countries, the unauthorized immigrant population has no effect on the statistics in the final two columns, which indeed fall within the allowed ranges for these two countries. Spain is a recent immigration country, hence the lower duration value, while Swedish immigration statistics count as immigrants persons who intend to stay for more than one year, which can include many non-permanent immigrants, such as international students. This tends to lower the duration-of-stay measure for Sweden.
For many countries in Annex Table A1, the average duration-of-stay measures are clearly unrealistic, and the ratio of the change in the foreign-born population over the decade exceeds the number of permanent immigrant entries over the same period. Both suggest some coverage problems in the immigration statistics.
PART I Trends in International Migration and Labor Market Outcomes / 57
The case of Argentina is instructive, because its statistics for both the foreign-born population and for permanent immigrants take into account unauthorized migration; in consequence, the values in the final two columns are within sensible limits.
We will not go into explanations for the values observed for each of the countries in Annex Table A1. The reasons, as noted above, concern the fact that both unauthorized migrants and citizens at birth who were born abroad and who returned to their country of citizenship are not counted in the permanent immigrant statistics but are counted in the foreign-born population. For some countries, the size of these two populations together is evidently quite large relative to the size of the authorized permanent inflows, but it is not possible to tell just how large they are.
For one country, however, namely Mexico, we do have a measure of citizens born abroad and currently living in Mexico. It is known that some 57% of the foreign-born in Mexico are of Mexican ascendance, whose entry into Mexico was therefore not captured in the permanent immigration statistics, which concern only foreign nationals. Subtracting this population from the foreign-born reduces the average-duration-of-stay estimate to 19 years, which is within the range of reasonable values.
In summary, if the national permanent immigration statistics do indeed provide a reliable measure of legal permanent migration, the results presented in the table suggest that they convey at best a very partial picture of immigration in many countries of the Americas and that the extent of unauthorized migration in some could be quite high.
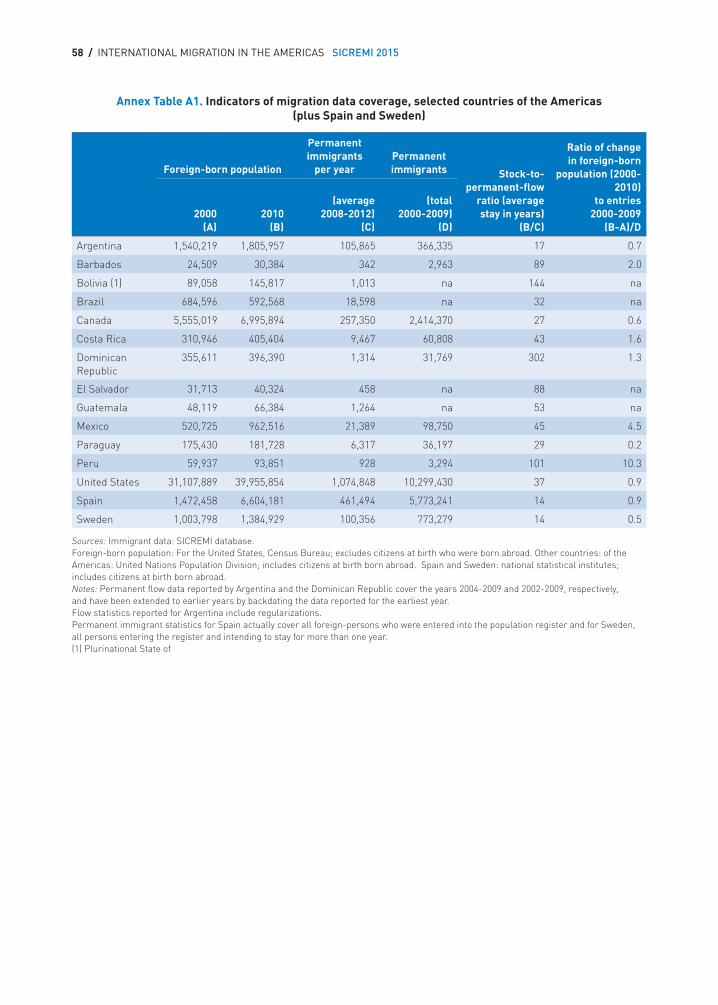
58 / INTERNATIONAL MIGRATION IN THE AMERICAS SICREMI 2015
Annex Table A1. Indicators of migration data coverage, selected countries of the Americas (plus Spain and Sweden)
Foreign-born population
Permanent immigrants
per yearPermanent immigrants Stock-to-
permanent-flow ratio (average stay in years)
(B/C)
Ratio of change in foreign-born
population (2000-2010)
to entries 2000-2009
(B-A)/D2000
(A)2010
(B)
(average 2008-2012)
(C)
(total 2000-2009)
(D)
Argentina 1,540,219 1,805,957 105,865 366,335 17 0.7
Barbados 24,509 30,384 342 2,963 89 2.0
Bolivia (1) 89,058 145,817 1,013 na 144 na
Brazil 684,596 592,568 18,598 na 32 na
Canada 5,555,019 6,995,894 257,350 2,414,370 27 0.6
Costa Rica 310,946 405,404 9,467 60,808 43 1.6
Dominican Republic
355,611 396,390 1,314 31,769 302 1.3
El Salvador 31,713 40,324 458 na 88 na
Guatemala 48,119 66,384 1,264 na 53 na
Mexico 520,725 962,516 21,389 98,750 45 4.5
Paraguay 175,430 181,728 6,317 36,197 29 0.2
Peru 59,937 93,851 928 3,294 101 10.3
United States 31,107,889 39,955,854 1,074,848 10,299,430 37 0.9
Spain 1,472,458 6,604,181 461,494 5,773,241 14 0.9
Sweden 1,003,798 1,384,929 100,356 773,279 14 0.5
Sources: Immigrant data: SICREMI database.Foreign-born population: For the United States, Census Bureau; excludes citizens at birth who were born abroad. Other countries: of the Americas: United Nations Population Division; includes citizens at birth born abroad. Spain and Sweden: national statistical institutes; includes citizens at birth born abroad. Notes: Permanent flow data reported by Argentina and the Dominican Republic cover the years 2004-2009 and 2002-2009, respectively,and have been extended to earlier years by backdating the data reported for the earliest year.Flow statistics reported for Argentina include regularizations. Permanent immigrant statistics for Spain actually cover all foreign-persons who were entered into the population register and for Sweden, all persons entering the register and intending to stay for more than one year.(1) Plurinational State of
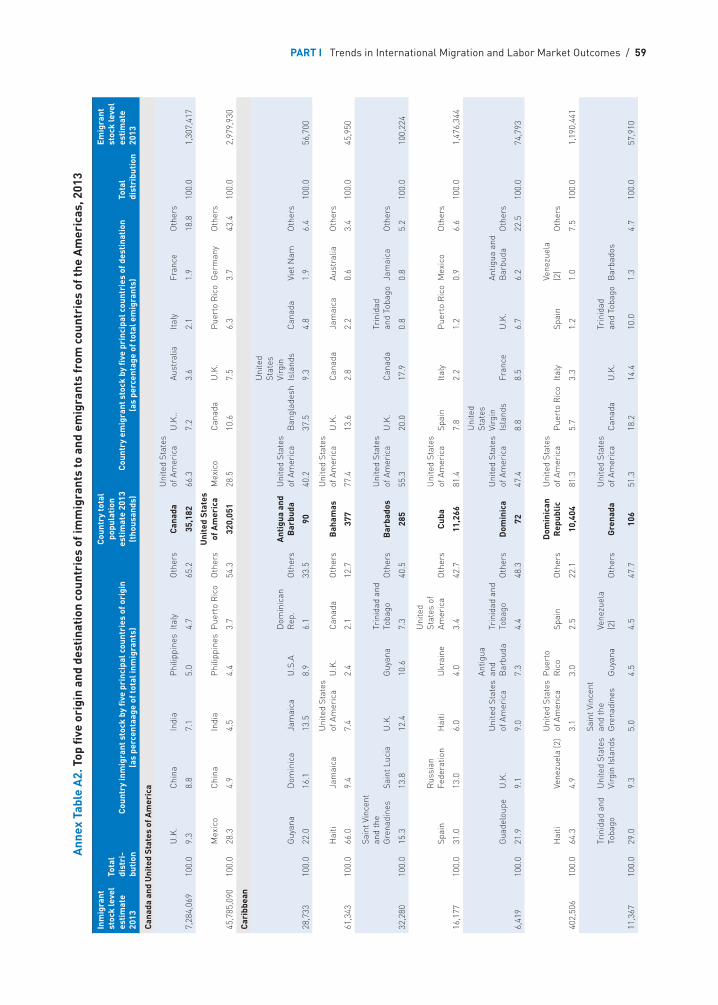
PART I Trends in International Migration and Labor Market Outcomes / 59
Inm
igra
nt
stoc
k le
vel
esti
mat
e 20
13
Tota
l di
stri
-bu
tion
Cou
ntry
inm
igra
nt s
tock
by
five
prin
cipa
l cou
ntri
es o
f ori
gin
(a
s pe
rcen
taag
e of
tota
l inm
igra
nts)
Cou
ntry
tota
l po
pula
tion
es
tim
ate
2013
(t
hous
ands
)C
ount
ry e
mig
rant
sto
ck b
y fiv
e pr
inci
pal c
ount
ries
of d
esti
nati
on
(as
perc
enta
ge o
f tot
al e
mig
rant
s)To
tal
dist
ribu
tion
Emig
rant
st
ock
leve
l es
tim
ate
2013
Can
ada
and
Uni
ted
Stat
es o
f Am
eric
a
U.K
.C
hina
Indi
aP
hilip
pine
sIta
lyO
ther
sC
anad
aU
nite
d St
ates
of
Am
eric
aU
.K..
Aust
ralia
Italy
Fran
ceO
ther
s
7,28
4,06
910
0.0
9.3
8.8
7.1
5.0
4.7
65.2
35,1
8266
.37.
23.
62.
11.
918
.810
0.0
1,30
7,41
7
Mex
ico
Chi
naIn
dia
Phi
lippi
nes
Pue
rto
Ric
oO
ther
sU
nite
d St
ates
of
Am
eric
aM
exic
oC
anad
aU
.K.
Pue
rto
Ric
oG
erm
any
Oth
ers
45,7
85,0
9010
0.0
28.3
4.9
4.5
4.4
3.7
54.3
320,
051
28.5
10.6
7.5
6.3
3.7
43.4
100.
02,
979,
930
Car
ibbe
an
Guy
ana
Dom
inic
aJa
mai
caU
.S.A
Dom
inic
an
Rep
.O
ther
sA
ntig
ua a
nd
Bar
buda
U
nite
d St
ates
of
Am
eric
aB
angl
ades
h
Uni
ted
Stat
es
Virg
in
Isla
nds
Can
ada
Viet
Nam
Oth
ers
28,7
3310
0.0
22.0
16.1
13.5
8.9
6.1
33.5
9040
.237
.59.
34.
81.
96.
410
0.0
56,7
00
Hai
tiJa
mai
caU
nite
d St
ates
of
Am
eric
aU
.K.
Can
ada
Oth
ers
Bah
amas
Uni
ted
Stat
es
of A
mer
ica
U.K
.C
anad
aJa
mai
caAu
stra
liaO
ther
s
61,3
4310
0.0
66.0
9.4
7.4
2.4
2.1
12.7
377
77.4
13.6
2.8
2.2
0.6
3.4
100.
045
,950
Sain
t Vin
cent
an
d th
e G
rena
dine
sSa
int L
ucia
U.K
.G
uyan
aTr
inid
ad a
nd
Toba
goO
ther
sB
arba
dos
Uni
ted
Stat
es
of A
mer
ica
U.K
.C
anad
aTr
inid
ad
and
Toba
goJa
mai
caO
ther
s
32,2
8010
0.0
15.3
13.8
12.4
10.6
7.3
40.5
285
55.3
20.0
17.9
0.8
0.8
5.2
100.
010
0,22
4
Spai
nR
ussi
an
Fede
ratio
nH
aiti
Ukr
aine
Uni
ted
Stat
es o
f Am
eric
aO
ther
sC
uba
Uni
ted
Stat
es
of A
mer
ica
Spai
nIta
lyP
uert
o R
ico
Mex
ico
Oth
ers
16,1
7710
0.0
31.0
13.0
6.0
4.0
3.4
42.7
11,2
6681
.47.
82.
21.
20.
96.
610
0.0
1,47
6,34
4
Gua
delo
upe
U.K
.U
nite
d St
ates
of
Am
eric
a
Antig
ua
and
Bar
buda
Trin
idad
and
To
bago
Oth
ers
Dom
inic
aU
nite
d St
ates
of
Am
eric
a
Uni
ted
Stat
es
Virg
in
Isla
nds
Fran
ceU
.K.
Antig
ua a
nd
Bar
buda
Oth
ers
6,41
910
0.0
21.9
9.1
9.0
7.3
4.4
48.3
7247
.48.
88.
56.
76.
222
.510
0.0
74,7
93
Hai
tiVe
nezu
ela
(2)
Uni
ted
Stat
es
of A
mer
ica
Pue
rto
Ric
oSp
ain
Oth
ers
Dom
inic
an
Rep
ublic
Uni
ted
Stat
es
of A
mer
ica
Pue
rto
Ric
oIta
lySp
ain
Vene
zuel
a (2
)O
ther
s
402,
506
100.
064
.34.
93.
13.
02.
522
.110
,404
81.3
5.7
3.3
1.2
1.0
7.5
100.
01,
190,
441
Trin
idad
and
To
bago
Uni
ted
Stat
es
Virg
in Is
land
s
Sain
t Vin
cent
an
d th
e G
rena
dine
sG
uyan
aVe
nezu
ela
(2)
Oth
ers
Gre
nada
Uni
ted
Stat
es
of A
mer
ica
Can
ada
U.K
.Tr
inid
ad
and
Toba
goB
arba
dos
11,3
6710
0.0
29.0
9.3
5.0
4.5
4.5
47.7
106
51.3
18.2
14.4
10.0
1.3
4.7
100.
057
,910
Ann
ex T
able
A2.
Top
five
ori
gin
and
dest
inat
ion
coun
trie
s of
imm
igra
nts
to a
nd e
mig
rant
s fr
om c
ount
ries
of t
he A
mer
icas
, 201
3
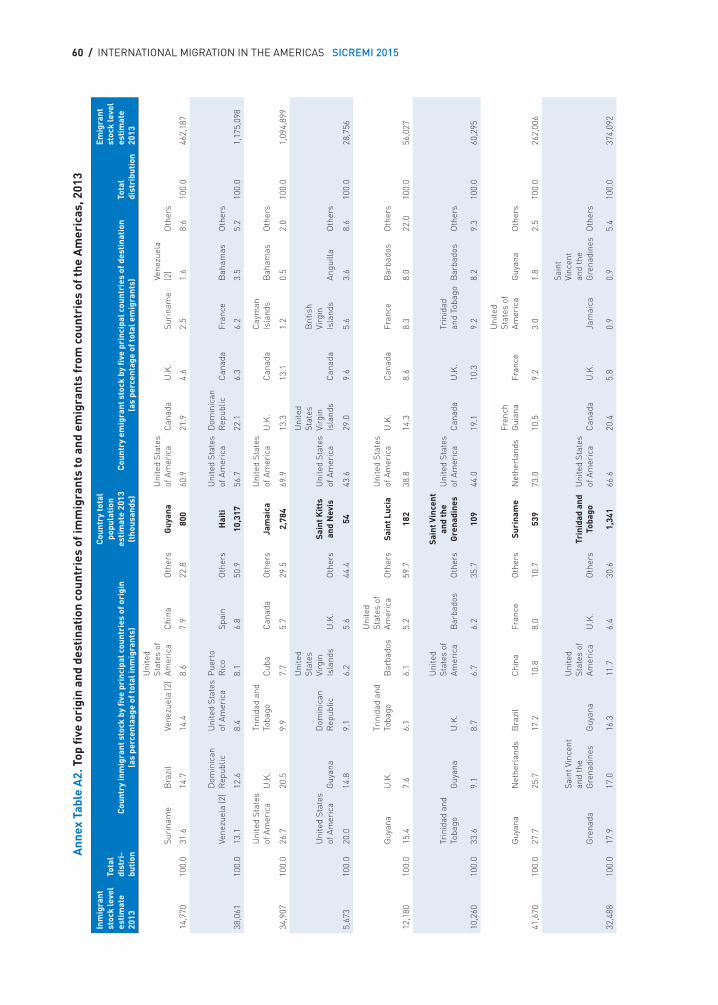
60 / INTERNATIONAL MIGRATION IN THE AMERICAS SICREMI 2015
Inm
igra
nt
stoc
k le
vel
esti
mat
e 20
13
Tota
l di
stri
-bu
tion
Cou
ntry
inm
igra
nt s
tock
by
five
prin
cipa
l cou
ntri
es o
f ori
gin
(a
s pe
rcen
taag
e of
tota
l inm
igra
nts)
Cou
ntry
tota
l po
pula
tion
es
tim
ate
2013
(t
hous
ands
)C
ount
ry e
mig
rant
sto
ck b
y fiv
e pr
inci
pal c
ount
ries
of d
esti
nati
on
(as
perc
enta
ge o
f tot
al e
mig
rant
s)To
tal
dist
ribu
tion
Emig
rant
st
ock
leve
l es
tim
ate
2013
Suri
nam
eB
razi
lVe
nezu
ela
(2)
Uni
ted
Stat
es o
f Am
eric
aC
hina
Oth
ers
Guy
ana
Uni
ted
Stat
es
of A
mer
ica
Can
ada
U.K
.Su
rina
me
Vene
zuel
a (2
)O
ther
s
14,7
7010
0.0
31.6
14.7
14.4
8.6
7.9
22.8
800
60.9
21.9
4.6
2.5
1.6
8.6
100.
046
2,18
7
Vene
zuel
a (2
)D
omin
ican
R
epub
licU
nite
d St
ates
of
Am
eric
aP
uert
o R
ico
Spai
nO
ther
sH
aiti
Uni
ted
Stat
es
of A
mer
ica
Dom
inic
an
Rep
ublic
Can
ada
Fran
ceB
aham
asO
ther
s
38,0
6110
0.0
13.1
12.6
8.4
8.1
6.8
50.9
10,3
1756
.722
.16.
36.
23.
55.
210
0.0
1,17
5,09
8
Uni
ted
Stat
es
of A
mer
ica
U.K
.Tr
inid
ad a
nd
Toba
goC
uba
Can
ada
Oth
ers
Jam
aica
Uni
ted
Stat
es
of A
mer
ica
U.K
.C
anad
aC
aym
an
Isla
nds
Bah
amas
Oth
ers
34,9
0710
0.0
26.7
20.5
9.9
7.7
5.7
29.5
2,78
469
.913
.313
.11.
20.
52.
010
0.0
1,09
4,89
9
Uni
ted
Stat
es
of A
mer
ica
Guy
ana
Dom
inic
an
Rep
ublic
Uni
ted
Stat
es
Virg
in
Isla
nds
U.K
.O
ther
sSa
int K
itts
an
d N
evis
Uni
ted
Stat
es
of A
mer
ica
Uni
ted
Stat
es
Virg
in
Isla
nds
Can
ada
Bri
tish
Virg
in
Isla
nds
Angu
illa
Oth
ers
5,67
310
0.0
20.0
14.8
9.1
6.2
5.6
44.4
5443
.629
.09.
65.
63.
68.
610
0.0
28,7
56
Guy
ana
U.K
.Tr
inid
ad a
nd
Toba
goB
arba
dos
Uni
ted
Stat
es o
f Am
eric
aO
ther
sSa
int L
ucia
Uni
ted
Stat
es
of A
mer
ica
U.K
.C
anad
aFr
ance
Bar
bado
sO
ther
s
12,1
8010
0.0
15.4
7.6
6.1
6.1
5.2
59.7
182
38.8
14.3
8.6
8.3
8.0
22.0
100.
056
,027
Trin
idad
and
To
bago
Guy
ana
U.K
.
Uni
ted
Stat
es o
f Am
eric
aB
arba
dos
Oth
ers
Sain
t Vin
cent
an
d th
e G
rena
dine
sU
nite
d St
ates
of
Am
eric
aC
anad
aU
.K.
Trin
idad
an
d To
bago
Bar
bado
sO
ther
s
10,2
6010
0.0
33.6
9.1
8.7
6.7
6.2
35.7
109
44.0
19.1
10.3
9.2
8.2
9.3
100.
060
,295
Guy
ana
Net
herl
ands
Bra
zil
Chi
naFr
ance
Oth
ers
Suri
nam
eN
ethe
rlan
dsFr
ench
G
uian
aFr
ance
Uni
ted
Stat
es o
f Am
eric
aG
uyan
aO
ther
s
41,6
7010
0.0
27.7
25.7
17.2
10.8
8.0
10.7
539
73.0
10.5
9.2
3.0
1.8
2.5
100.
026
2,00
6
Gre
nada
Sain
t Vin
cent
an
d th
e G
rena
dine
sG
uyan
a
Uni
ted
Stat
es o
f Am
eric
aU
.K.
Oth
ers
Trin
idad
and
To
bago
Uni
ted
Stat
es
of A
mer
ica
Can
ada
U.K
.Ja
mai
ca
Sain
t Vi
ncen
t an
d th
e G
rena
dine
sO
ther
s
32,4
8810
0.0
17.9
17.0
16.3
11.7
6.4
30.6
1,34
166
.620
.45.
80.
90.
95.
410
0.0
374,
092
Ann
ex T
able
A2.
Top
five
ori
gin
and
dest
inat
ion
coun
trie
s of
imm
igra
nts
to a
nd e
mig
rant
s fr
om c
ount
ries
of t
he A
mer
icas
, 201
3
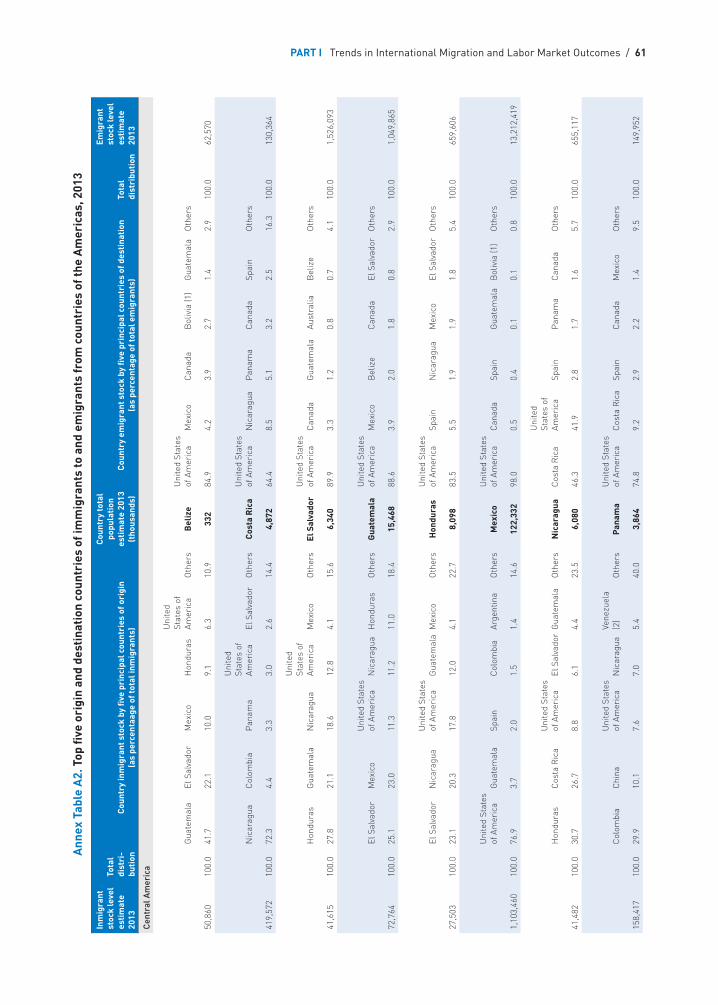
PART I Trends in International Migration and Labor Market Outcomes / 61
Inm
igra
nt
stoc
k le
vel
esti
mat
e 20
13
Tota
l di
stri
-bu
tion
Cou
ntry
inm
igra
nt s
tock
by
five
prin
cipa
l cou
ntri
es o
f ori
gin
(a
s pe
rcen
taag
e of
tota
l inm
igra
nts)
Cou
ntry
tota
l po
pula
tion
es
tim
ate
2013
(t
hous
ands
)C
ount
ry e
mig
rant
sto
ck b
y fiv
e pr
inci
pal c
ount
ries
of d
esti
nati
on
(as
perc
enta
ge o
f tot
al e
mig
rant
s)To
tal
dist
ribu
tion
Emig
rant
st
ock
leve
l es
tim
ate
2013
Cen
tral
Am
eric
a
Gua
tem
ala
El S
alva
dor
Mex
ico
Hon
dura
s
Uni
ted
Stat
es o
f Am
eric
aO
ther
sB
eliz
eU
nite
d St
ates
of
Am
eric
aM
exic
oC
anad
aB
oliv
ia (1
)G
uate
mal
aO
ther
s
50,8
6010
0.0
41.7
22.1
10.0
9.1
6.3
10.9
332
84.9
4.2
3.9
2.7
1.4
2.9
100.
062
,570
Nic
arag
uaC
olom
bia
Pan
ama
Uni
ted
Stat
es o
f Am
eric
aEl
Sal
vado
rO
ther
sC
osta
Ric
aU
nite
d St
ates
of
Am
eric
aN
icar
agua
Pan
ama
Can
ada
Spai
nO
ther
s
419,
572
100.
072
.34.
43.
33.
02.
614
.44,
872
64.4
8.5
5.1
3.2
2.5
16.3
100.
013
0,36
4
Hon
dura
sG
uate
mal
aN
icar
agua
Uni
ted
Stat
es o
f Am
eric
aM
exic
oO
ther
sEl
Sal
vado
rU
nite
d St
ates
of
Am
eric
aC
anad
aG
uate
mal
aAu
stra
liaB
eliz
eO
ther
s
41,6
1510
0.0
27.8
21.1
18.6
12.8
4.1
15.6
6,34
089
.93.
31.
20.
80.
74.
110
0.0
1,52
6,09
3
El S
alva
dor
Mex
ico
Uni
ted
Stat
es
of A
mer
ica
Nic
arag
uaH
ondu
ras
Oth
ers
Gua
tem
ala
Uni
ted
Stat
es
of A
mer
ica
Mex
ico
Bel
ize
Can
ada
El S
alva
dor
Oth
ers
72,7
6410
0.0
25.1
23.0
11.3
11.2
11.0
18.4
15,4
6888
.63.
92.
01.
80.
82.
910
0.0
1,04
9,86
5
El S
alva
dor
Nic
arag
uaU
nite
d St
ates
of
Am
eric
aG
uate
mal
aM
exic
oO
ther
sH
ondu
ras
Uni
ted
Stat
es
of A
mer
ica
Spai
nN
icar
agua
Mex
ico
El S
alva
dor
Oth
ers
27,5
0310
0.0
23.1
20.3
17.8
12.0
4.1
22.7
8,09
883
.55.
51.
91.
91.
85.
410
0.0
659,
606
Uni
ted
Stat
es
of A
mer
ica
Gua
tem
ala
Spai
nC
olom
bia
Arge
ntin
aO
ther
sM
exic
oU
nite
d St
ates
of
Am
eric
aC
anad
aSp
ain
Gua
tem
ala
Bol
ivia
(1)
Oth
ers
1,10
3,46
010
0.0
76.9
3.7
2.0
1.5
1.4
14.6
122,
332
98.0
0.5
0.4
0.1
0.1
0.8
100.
013
,212
,419
Hon
dura
sC
osta
Ric
aU
nite
d St
ates
of
Am
eric
aEl
Sal
vado
rG
uate
mal
aO
ther
sN
icar
agua
Cos
ta R
ica
Uni
ted
Stat
es o
f Am
eric
aSp
ain
Pan
ama
Can
ada
Oth
ers
41,4
8210
0.0
30.7
26.7
8.8
6.1
4.4
23.5
6,08
046
.341
.92.
81.
71.
65.
710
0.0
655,
117
Col
ombi
aC
hina
Uni
ted
Stat
es
of A
mer
ica
Nic
arag
uaVe
nezu
ela
(2)
Oth
ers
Pan
ama
Uni
ted
Stat
es
of A
mer
ica
Cos
ta R
ica
Spai
nC
anad
aM
exic
oO
ther
s
158,
417
100.
029
.910
.17.
67.
05.
440
.03,
864
74.8
9.2
2.9
2.2
1.4
9.5
100.
014
9,95
2
Ann
ex T
able
A2.
Top
five
ori
gin
and
dest
inat
ion
coun
trie
s of
imm
igra
nts
to a
nd e
mig
rant
s fr
om c
ount
ries
of t
he A
mer
icas
, 201
3
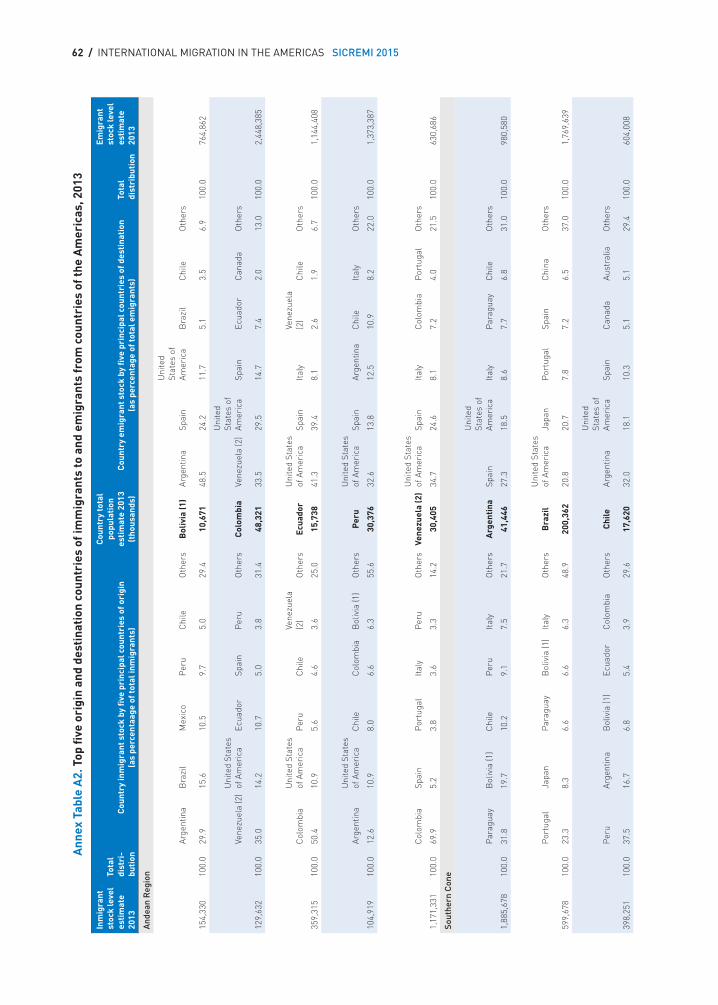
62 / INTERNATIONAL MIGRATION IN THE AMERICAS SICREMI 2015
Inm
igra
nt
stoc
k le
vel
esti
mat
e 20
13
Tota
l di
stri
-bu
tion
Cou
ntry
inm
igra
nt s
tock
by
five
prin
cipa
l cou
ntri
es o
f ori
gin
(a
s pe
rcen
taag
e of
tota
l inm
igra
nts)
Cou
ntry
tota
l po
pula
tion
es
tim
ate
2013
(t
hous
ands
)C
ount
ry e
mig
rant
sto
ck b
y fiv
e pr
inci
pal c
ount
ries
of d
esti
nati
on
(as
perc
enta
ge o
f tot
al e
mig
rant
s)To
tal
dist
ribu
tion
Emig
rant
st
ock
leve
l es
tim
ate
2013
And
ean
Reg
ion
Arge
ntin
aB
razi
lM
exic
oP
eru
Chi
leO
ther
sB
oliv
ia (1
)Ar
gent
ina
Spai
n
Uni
ted
Stat
es o
f Am
eric
aB
razi
lC
hile
Oth
ers
154,
330
100.
029
.915
.610
.59.
75.
029
.410
,671
48.5
24.2
11.7
5.1
3.5
6.9
100.
076
4,86
2
Vene
zuel
a (2
)U
nite
d St
ates
of
Am
eric
aEc
uado
rSp
ain
Per
uO
ther
sC
olom
bia
Vene
zuel
a (2
)
Uni
ted
Stat
es o
f Am
eric
aSp
ain
Ecua
dor
Can
ada
Oth
ers
129,
632
100.
035
.014
.210
.75.
03.
831
.448
,321
33.5
29.5
14.7
7.4
2.0
13.0
100.
02,
448,
385
Col
ombi
aU
nite
d St
ates
of
Am
eric
aP
eru
Chi
leVe
nezu
ela
(2)
Oth
ers
Ecua
dor
Uni
ted
Stat
es
of A
mer
ica
Spai
nIta
lyVe
nezu
ela
(2)
Chi
leO
ther
s
359,
315
100.
050
.410
.95.
64.
63.
625
.015
,738
41.3
39.4
8.1
2.6
1.9
6.7
100.
01,
144,
408
Arge
ntin
aU
nite
d St
ates
of
Am
eric
aC
hile
Col
ombi
aB
oliv
ia (1
)O
ther
sP
eru
Uni
ted
Stat
es
of A
mer
ica
Spai
nAr
gent
ina
Chi
leIta
lyO
ther
s
104,
919
100.
012
.610
.98.
06.
66.
355
.630
,376
32.6
13.8
12.5
10.9
8.2
22.0
100.
01,
373,
387
Col
ombi
aSp
ain
Por
tuga
lIta
lyP
eru
Oth
ers
Vene
zuel
a (2
)U
nite
d St
ates
of
Am
eric
aSp
ain
Italy
Col
ombi
aP
ortu
gal
Oth
ers
1,17
1,33
110
0.0
69.9
5.2
3.8
3.6
3.3
14.2
30,4
0534
.724
.68.
17.
24.
021
.510
0.0
630,
686
Sout
hern
Con
e
Par
agua
yB
oliv
ia (1
)C
hile
Per
uIta
lyO
ther
sA
rgen
tina
Spai
n
Uni
ted
Stat
es o
f Am
eric
aIta
lyP
arag
uay
Chi
leO
ther
s
1,88
5,67
810
0.0
31.8
19.7
10.2
9.1
7.5
21.7
41,4
4627
.318
.58.
67.
76.
831
.010
0.0
980,
580
Por
tuga
lJa
pan
Par
agua
yB
oliv
ia (1
)Ita
lyO
ther
sB
razi
lU
nite
d St
ates
of
Am
eric
aJa
pan
Por
tuga
lSp
ain
Chi
naO
ther
s
599,
678
100.
023
.38.
36.
66.
66.
348
.920
0,36
220
.820
.77.
87.
26.
537
.010
0.0
1,76
9,63
9
Per
uAr
gent
ina
Bol
ivia
(1)
Ecua
dor
Col
ombi
aO
ther
sC
hile
Arge
ntin
a
Uni
ted
Stat
es o
f Am
eric
aSp
ain
Can
ada
Aust
ralia
Oth
ers
398,
251
100.
037
.516
.76.
85.
43.
929
.617
,620
32.0
18.1
10.3
5.1
5.1
29.4
100.
060
4,00
8
Ann
ex T
able
A2.
Top
five
ori
gin
and
dest
inat
ion
coun
trie
s of
imm
igra
nts
to a
nd e
mig
rant
s fr
om c
ount
ries
of t
he A
mer
icas
, 201
3
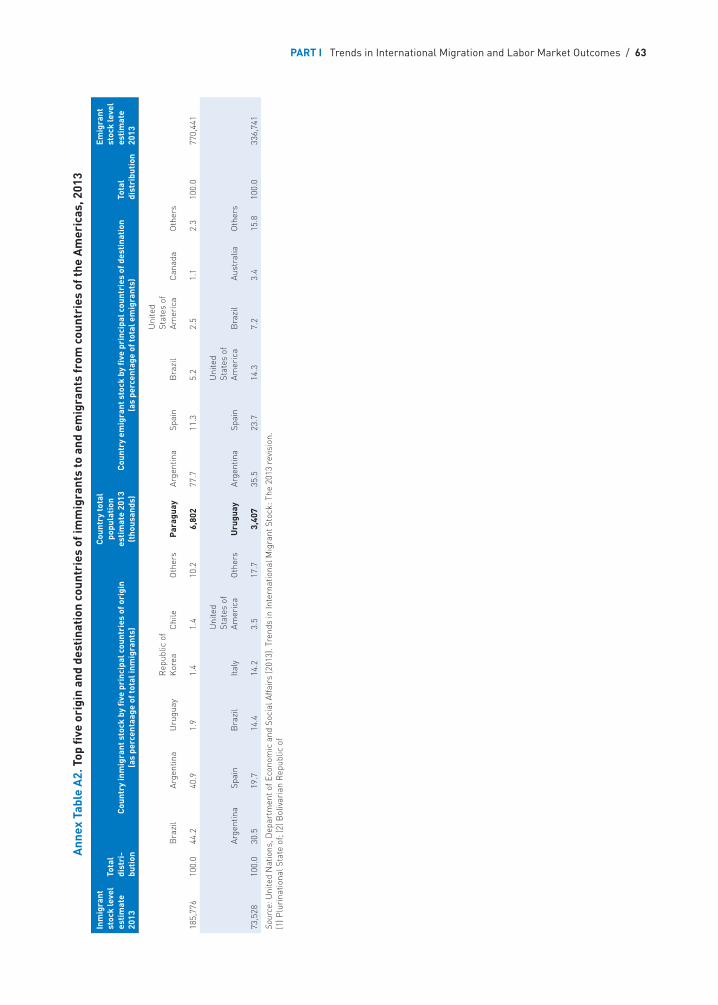
PART I Trends in International Migration and Labor Market Outcomes / 63
Inm
igra
nt
stoc
k le
vel
esti
mat
e 20
13
Tota
l di
stri
-bu
tion
Cou
ntry
inm
igra
nt s
tock
by
five
prin
cipa
l cou
ntri
es o
f ori
gin
(a
s pe
rcen
taag
e of
tota
l inm
igra
nts)
Cou
ntry
tota
l po
pula
tion
es
tim
ate
2013
(t
hous
ands
)C
ount
ry e
mig
rant
sto
ck b
y fiv
e pr
inci
pal c
ount
ries
of d
esti
nati
on
(as
perc
enta
ge o
f tot
al e
mig
rant
s)To
tal
dist
ribu
tion
Emig
rant
st
ock
leve
l es
tim
ate
2013
Bra
zil
Arge
ntin
aU
rugu
ayR
epub
lic o
f K
orea
Chi
leO
ther
sP
arag
uay
Arge
ntin
aSp
ain
Bra
zil
Uni
ted
Stat
es o
f Am
eric
aC
anad
aO
ther
s
185,
776
100.
044
.240
.91.
91.
41.
410
.26,
802
77.7
11.3
5.2
2.5
1.1
2.3
100.
077
0,44
1
Arge
ntin
aSp
ain
Bra
zil
Italy
Uni
ted
Stat
es o
f Am
eric
aO
ther
sU
rugu
ayAr
gent
ina
Spai
n
Uni
ted
Stat
es o
f Am
eric
aB
razi
lAu
stra
liaO
ther
s
73,5
2810
0.0
30.5
19.7
14.4
14.2
3.5
17.7
3,40
735
.523
.714
.37.
23.
415
.810
0.0
336,
741
Sour
ce: U
nite
d N
atio
ns, D
epar
tmen
t of E
cono
mic
and
Soc
ial A
ffair
s (2
013)
. Tre
nds
in In
tern
atio
nal M
igra
nt S
tock
: The
201
3 re
visi
on.
(1) P
luri
natio
nal S
tate
of;
(2) B
oliv
aria
n R
epub
lic o
f
Ann
ex T
able
A2.
Top
five
ori
gin
and
dest
inat
ion
coun
trie
s of
imm
igra
nts
to a
nd e
mig
rant
s fr
om c
ount
ries
of t
he A
mer
icas
, 201
3


PART I Trends in International Migration and Labor Market Outcomes / 65
PART II
Country Notes

PART II Country Notes / 67
Introduction
This part of the publication consists of summary notes and statistical tables on each participating country of the Continuous Reporting System on International Migration in the Americas (known as SICREMI, its Spanish acronym). For countries new to the publication (this year, Jamaica), the country note contains a brief history of international migration in the country since the country acquired its independence, as well as a summary of the regulatory framework governing entry and stay in the country, the acquisition of nationality and measures regarding asylum and the recognition of refugee status as well as for the regularization of unauthorized immigrants. For other countries, readers are referred to the previous edition (2012) of this publication for similar information. In this issue, the country note for countries which were covered in the previous edition contains an overview of developments in international migration movements and policies since 2010.
The note for each country is based on a report submitted to the Organization of American States by the SICREMI national correspondent for the country.
The country note table contains an overview of statistics related to international migration for the country, including total inflows of immigrants, both permanent and temporary; flows by category of entry, when available; outflows to OECD countries and to countries of the Americas; the number of asylum seekers and refugees; components of population growth; the size of the immigrant population; GDP growth and GDP per capita; and labor force characteristics of the emigrant population, both men and women.
Sources for the statistics presented in the tables are as follows:
■ Migration inflows – the national correspondents of the SICREMI network; the data are generally from permit or visa statistics.
■ Migration outflows to OECD countries and to countries of the Americas – the OECD International Migration Database and national correspondents of the SICREMI network, respectively.
■ Asylum seekers and refugees – UNHCR. The asylum seeker statistics are new requests and exclude repeat, reopened and appeal applications. The refugee statistics exclude “persons in refugee-like situations”.
■ Components of population growth – United Nations World Population Prospects: the 2012 Revision.
■ The foreign-born population – UN Population Division. Trends in International Migration Stock: the 2013 Revision, except for the United States, where Census Bureau statistics were used.
■ GDP growth and GDP/capita –World Bank statistics. The GDP growth figures are based on GDP in 2005 constant dollars. GDP per capita figures are in 2011 international constant dollars at PPPs.
■ Labor force outcomes in OECD countries – the European Labor Force Survey for European countries, the American Community Survey for the United States.
More detailed information on statistical sources and on the definitions of the statistics presented can be found in the Statistical Annex (Part III) of this publication.
Multi-year statistics are based on averages of the underlying annual data for the period shown. The abbreviation “na” means “not available”, and “nr“ means not reliable”.
68 / INTERNATIONAL MIGRATION IN THE AMERICAS SICREMI 2015
The term “nationality” as used in the country note refers to legal, administrative or passport nationality. It defines the link between a person and a particular legal system. This link of an individual with a State generates rights and reciprocal duties and depends on national legislation. Variants can be summarized in three legal principles:
(a) Jus sanguinis: the right of blood, where nationality is transmitted from the parents to their children, even when they are born abroad;
(b) Jus soli: the right of soil, where the nationality of a country is obtained on the basis of birth on the territory of the country, regardless of the nationality of the parents;
(c) Jus domicili: the right of domicile, where nationality is acquired on the basis of residence after a certain period of time or on the basis of other residence-related ties to the country of nationality (property, work, etc.).
For the purpose of this report, the terms “citizenship” and “nationality” are used interchangeably.
PART II Country Notes / 69
ARGENTINAArgentina continues to be the country in Latin America with the highest level of immigration. In 2013, Argentina was a destination for nearly 140,000 permanent immigrants and approximately the same number of temporary immigrants. From 2010 to 2013, these figures increased some 45% and 70%, respectively.
In 2013, the foreign-born population represented 4.5% of the total Argentine population, unchanged since 2010. This continues to be among the largest immigrant population in relative terms in the Latin American region.
Regarding emigration, the year 2012 saw the departure of approximately 34 thousand Argentine nationals for OECD countries and other countries of the region, a figure that has fallen some 17% since 2009, particularly to Spain (-52%), Mexico (-23%) and the United States (-21%), while movements to Chile showed an increase (18%).
For the period 2012-2013, the situation of Argentine emigrants in the labor market of OECD countries generally deteriorated relative to the period 2010-2011, and more among women than men. While the overall participation rate decreased somewhat, unemployment increased by nearly 2 percentage points. For women, it increased by around 3 percentage points, but among men by less than 1.
Regarding remittances, Argentina received 1.08 billion dollars in 2013, an increase of some 8.8% compared to 2012. Remittances represent less than two tenths of one percent of the country’s Gross Domestic Product.
For the year 2013, Argentina received 614 asylum requests, mostly from Syria, Cuba and Colombia. From 2012 to 2013, the number of applicants decreased some 58%. Today, Argentina has 3,362 refugees, mainly from Peru, Colombia and Cuba.
On the policy side, Immigration Mobile Offices have been created and the Territorial Engagement Programme (“Programa de Abordaje Territorial”) implemented, providing a one-stop shop to facilitate regularization procedures all over Argentina.
Under the Syria Programme20, effective until October 2015, the Republic offers a humanitarian visa to people of Syrian nationality and their families, as well as to people of Palestine nationality residing in Syria and having received assistance from the United Nations Relief and Works Agency for Palestine Refugees (UNRWA). Beneficiaries will obtain an entry visa into the country that will allow them temporary residence for a term of two years, renewable for one more year. At the end of three years of residence in the country, these immigrants may request permanent residence in accordance with Argentine Law.21
20 Approved by Decree DNM N°3915/2014.21 Article 22 section c) of Law Nº 25.871 and its Regulatory Decree.
70 / INTERNATIONAL MIGRATION IN THE AMERICAS SICREMI 2015
The process of regularizing the presence of foreigners of Dominican and Senegalese nationality began in 2013.22 Procedures were initiated for 1,732 Senegalese and 2,207 Dominicans, with approximately 90% of applications being accepted. In 2014, similar provisions were introduced for regularizing foreigners of Korean nationality.23
Also in 2013, use of biometrics - such as the collection of fingerprints - for registering data and for identification purposes was expanded to all airports in the country.
Regarding the planned return of Argentine emigrants, the Ministry of Science, Technology and Productive Innovation has continued to implement the Roots Programme (“Programa Raíces”), which offers mechanisms to connect Argentine scientists and experts abroad to their peers in Argentina through a network that promotes collaborative work, so they may contribute to scientific development in the country, either from abroad or upon return to the country. An extension of the RAICES Programme, the “Back to Work” Programme (“Programa ‘Volver a Trabajar’”) is still in effect; its main objective is to disseminate job opportunities to Argentine emigrants with the aim of matching them with companies potentially interested in hiring them.
22 Provision DNM No.1 and Provision DNM No.2 respectively.23 Decree DNM No. 979.
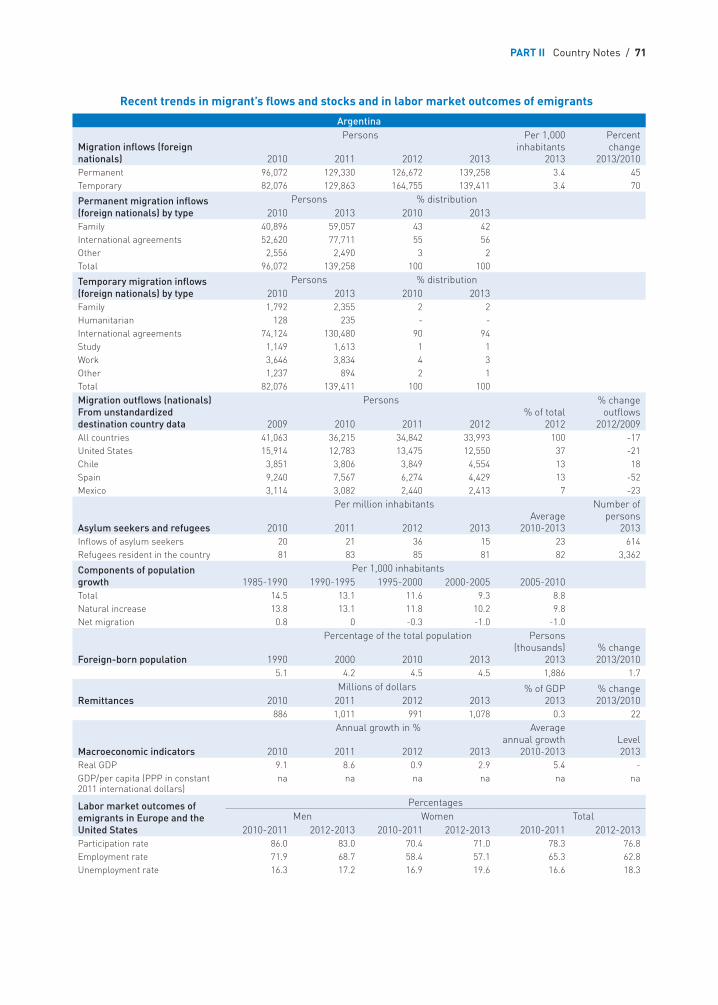
PART II Country Notes / 71
Recent trends in migrant’s flows and stocks and in labor market outcomes of emigrants
Argentina
Migration inflows (foreign nationals)
Persons Per 1,000 inhabitants
2013
Percent change
2013/20102010 2011 2012 2013Permanent 96,072 129,330 126,672 139,258 3.4 45Temporary 82,076 129,863 164,755 139,411 3.4 70
Permanent migration inflows (foreign nationals) by type
Persons % distribution2010 2013 2010 2013
Family 40,896 59,057 43 42International agreements 52,620 77,711 55 56Other 2,556 2,490 3 2Total 96,072 139,258 100 100
Temporary migration inflows (foreign nationals) by type
Persons % distribution2010 2013 2010 2013
Family 1,792 2,355 2 2Humanitarian 128 235 - -International agreements 74,124 130,480 90 94Study 1,149 1,613 1 1Work 3,646 3,834 4 3Other 1,237 894 2 1Total 82,076 139,411 100 100Migration outflows (nationals)From unstandardized destination country data
Persons% of total
2012
% change outflows
2012/20092009 2010 2011 2012All countries 41,063 36,215 34,842 33,993 100 -17United States 15,914 12,783 13,475 12,550 37 -21Chile 3,851 3,806 3,849 4,554 13 18Spain 9,240 7,567 6,274 4,429 13 -52Mexico 3,114 3,082 2,440 2,413 7 -23
Asylum seekers and refugees
Per million inhabitantsAverage
2010-2013
Number of persons
20132010 2011 2012 2013Inflows of asylum seekers 20 21 36 15 23 614 Refugees resident in the country 81 83 85 81 82 3,362
Components of population growth
Per 1,000 inhabitants1985-1990 1990-1995 1995-2000 2000-2005 2005-2010
Total 14.5 13.1 11.6 9.3 8.8Natural increase 13.8 13.1 11.8 10.2 9.8Net migration 0.8 0 -0.3 -1.0 -1.0
Foreign-born population
Percentage of the total population Persons (thousands)
2013% change 2013/20101990 2000 2010 2013
5.1 4.2 4.5 4.5 1,886 1.7
Remittances Millions of dollars % of GDP
2013% change 2013/20102010 2011 2012 2013
886 1,011 991 1,078 0.3 22
Macroeconomic indicators
Annual growth in % Average annual growth
2010-2013Level20132010 2011 2012 2013
Real GDP 9.1 8.6 0.9 2.9 5.4 -GDP/per capita (PPP in constant 2011 international dollars)
na na na na na na
Labor market outcomes of emigrants in Europe and the United States
Percentages Men Women Total
2010-2011 2012-2013 2010-2011 2012-2013 2010-2011 2012-2013Participation rate 86.0 83.0 70.4 71.0 78.3 76.8Employment rate 71.9 68.7 58.4 57.1 65.3 62.8Unemployment rate 16.3 17.2 16.9 19.6 16.6 18.3
72 / INTERNATIONAL MIGRATION IN THE AMERICAS SICREMI 2015
BARBADOSSince 2010, the number of immigrants to Barbados has increased considerably; there were four times more permanent immigrants in 2013 than in 2010, while the number of temporary immigrants doubled.
In 2013, the foreign-born population represented 11.3% of the total population, with the number of foreign-born persons having increased by almost 5% since 2010. Vincentians and Saint Lucians account for almost 30% of the foreign-born population residing in Barbados.
Migration outflows to OECD countries and to Latin American countries have decreased slightly since 2009. In 2013, the United States was the most important destination country for Barbadians, with more than half of emigration occurring to that country, closely followed by Canada with 44%. However, during the 2009-2012 period, migration to these two countries declined.
Both the participation rate and the employment rate of Barbadians in Europe and the United States have declined significantly from 2010-2011 to 2012-2013, the former by 8 percentage points, the latter by more than 4. The situation of men has deteriorated seriously (falls of 14 and 11 percentage points in the participation and employment rates, respectively), while the evolution of the labor market situation of women has been mixed, with the participation rate declining somewhat but the employment rate actually increasing over the same period.
According to the World Bank, personal remittances inflows from 2009 to 2010 have deteriorated. In 2009, Barbados received 114 million US dollars in remittances while in 2010 the amount was 82 million US dollars. Remittances outflows decreased as well, albeit at a slower pace. For the same period, the amount was 10% smaller in 2011 in comparison to 2009.24
The Constitution of Barbados, the Immigration Act (1976) and the Barbados Citizenship Act (1966) continue to be the principal legal framework for immigration to Barbados. There have been no major changes in the national legal framework in recent years.
In 2014, Barbados signed a visa waiver agreement with El Salvador. Salvadorian citizens, officials and diplomatic personnel can come to Barbados without a visa and without the pre-approval process that was part of the visa application. The agreement on visa waiver aims to promote commercial exchanges, tourism and investment between the two countries.
During the same year, Barbados signed a Mutual Visa Abolition Agreement with China. The agreement exempts visa requirements for entry or transit, facilitating the exchange of visits between the two countries.
24 World Bank staff calculation based on data from IMF Balance of Payments Statistics. There is no updated data available on the personal remittances received during the 2011-2014 period.
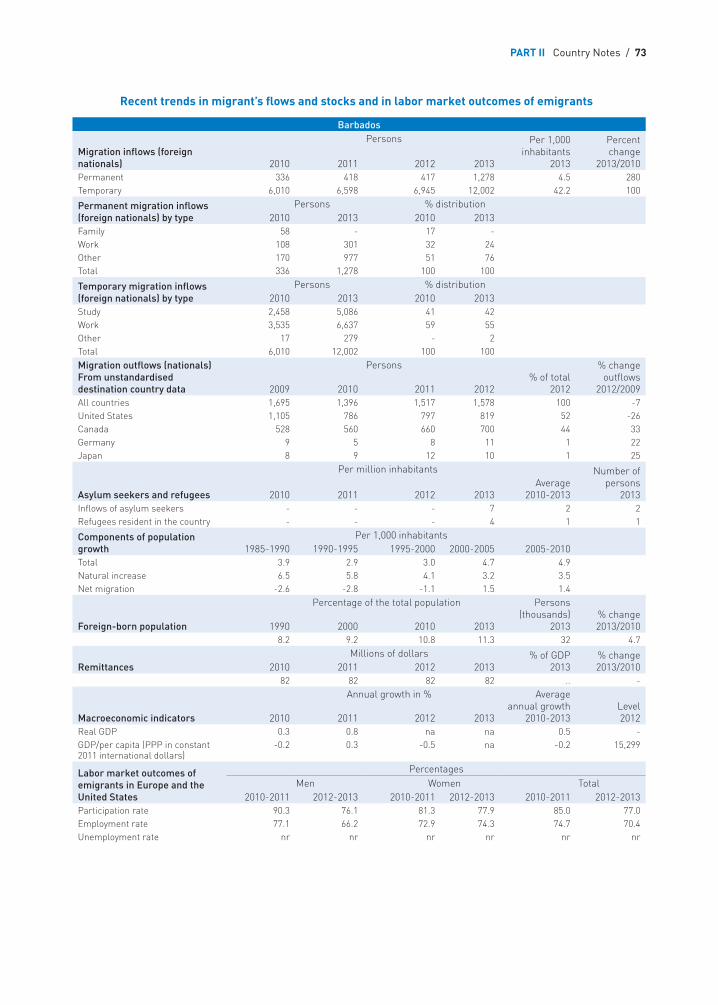
PART II Country Notes / 73
Recent trends in migrant’s flows and stocks and in labor market outcomes of emigrants
Barbados
Migration inflows (foreign nationals)
Persons Per 1,000 inhabitants
2013
Percent change
2013/20102010 2011 2012 2013Permanent 336 418 417 1,278 4.5 280Temporary 6,010 6,598 6,945 12,002 42.2 100
Permanent migration inflows (foreign nationals) by type
Persons % distribution2010 2013 2010 2013
Family 58 - 17 -Work 108 301 32 24Other 170 977 51 76Total 336 1,278 100 100
Temporary migration inflows (foreign nationals) by type
Persons % distribution2010 2013 2010 2013
Study 2,458 5,086 41 42 Work 3,535 6,637 59 55 Other 17 279 - 2 Total 6,010 12,002 100 100 Migration outflows (nationals) From unstandardised destination country data
Persons% of total
2012
% change outflows
2012/20092009 2010 2011 2012All countries 1,695 1,396 1,517 1,578 100 -7United States 1,105 786 797 819 52 -26Canada 528 560 660 700 44 33Germany 9 5 8 11 1 22Japan 8 9 12 10 1 25
Asylum seekers and refugees
Per million inhabitants Number of persons
20132010 2011 2012 2013Average
2010-2013Inflows of asylum seekers - - - 7 2 2Refugees resident in the country - - - 4 1 1
Components of population growth
Per 1,000 inhabitants1985-1990 1990-1995 1995-2000 2000-2005 2005-2010
Total 3.9 2.9 3.0 4.7 4.9Natural increase 6.5 5.8 4.1 3.2 3.5Net migration -2.6 -2.8 -1.1 1.5 1.4
Foreign-born population
Percentage of the total population Persons (thousands)
2013% change 2013/20101990 2000 2010 2013
8.2 9.2 10.8 11.3 32 4.7
Remittances Millions of dollars % of GDP
2013% change 2013/20102010 2011 2012 2013
82 82 82 82 .. -
Macroeconomic indicators
Annual growth in % Average annual growth
2010-2013Level 20122010 2011 2012 2013
Real GDP 0.3 0.8 na na 0.5 -GDP/per capita (PPP in constant 2011 international dollars)
-0.2 0.3 -0.5 na -0.2 15,299
Labor market outcomes of emigrants in Europe and the United States
Percentages Men Women Total
2010-2011 2012-2013 2010-2011 2012-2013 2010-2011 2012-2013Participation rate 90.3 76.1 81.3 77.9 85.0 77.0Employment rate 77.1 66.2 72.9 74.3 74.7 70.4Unemployment rate nr nr nr nr nr nr
74 / INTERNATIONAL MIGRATION IN THE AMERICAS SICREMI 2015
BELIZEIn relative terms, Belize is the Central American country that has had the most immigration after independence in the early 1980s. Permanent immigration flows in 2011 stood at about 4.3 per thousand population, about the same relative level as Barbados.
The foreign-born population in 2013 represented 15.3% of the total Belizean population, the highest in Central America, with Costa Rica holding a distant second place at 8.6%. Guatemalans and Salvadorians account for almost 65% of the foreign-born population residing in Belize.
The main destination country for Belizean emigrants is the United States, where almost three-quarters of emigrant Belizeans live. Although the numbers are still very low, Canada (7%) and the Russian Federation (4%) have become emerging destination countries in recent years.
The labor market outcomes for Belizean emigrants in Europe and the United States have been mixed. While the employment rate among men increased by 7 percentage points, employment among women decreased by 6 points.
Although in absolute numbers Belize receives the smallest amount of remittances in Central America (120 million dollars in 2013), they represented 58% of the Gross Domestic Product (GDP).
Asylum seeking in Belize is extremely low in absolute terms. In 2013, Belize had 52 asylum seeker requests from citizens of El Salvador, Guatemala and Honduras, and, in the same year, only 21 refugees resided in the country, all from El Salvador.
The legal framework governing immigration is the Immigration Act (Chapter 156S). A new immigration policy reform is currently being formulated; however, no details are as yet available.
As a Caribbean Community and Common Market (CARICOM) member, Belize allows for the free movement of people among CARICOM country members without the need of a tourist visa. Additionally, under the CARICOM skilled national status, any CARICOM national who wishes to work in Belize can do so by obtaining a Skills Certificate from the country of origin. The Certificate allows any CARICOM national to seek and to engage in employment without the need to obtain a work permit. For Belize, there are nine categories that qualify for free movement: university graduates, media workers, sports persons, artists, musicians, professional nurses, qualified teachers, artisans and holders of an associate degrees or equivalent.
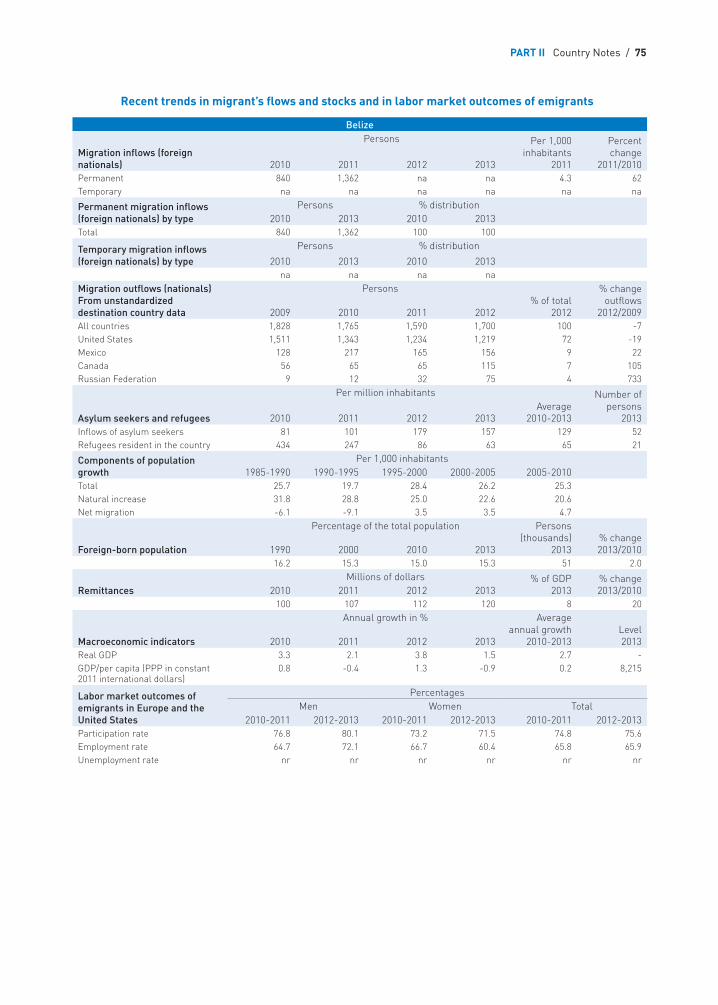
PART II Country Notes / 75
Recent trends in migrant’s flows and stocks and in labor market outcomes of emigrants
Belize
Migration inflows (foreign nationals)
Persons Per 1,000 inhabitants
2011
Percent change
2011/20102010 2011 2012 2013Permanent 840 1,362 na na 4.3 62Temporary na na na na na na
Permanent migration inflows (foreign nationals) by type
Persons % distribution2010 2013 2010 2013
Total 840 1,362 100 100
Temporary migration inflows (foreign nationals) by type
Persons % distribution
2010 2013 2010 2013na na na na
Migration outflows (nationals)From unstandardized destination country data
Persons% of total
2012
% change outflows
2012/20092009 2010 2011 2012All countries 1,828 1,765 1,590 1,700 100 -7United States 1,511 1,343 1,234 1,219 72 -19Mexico 128 217 165 156 9 22Canada 56 65 65 115 7 105Russian Federation 9 12 32 75 4 733
Asylum seekers and refugees
Per million inhabitants Number of persons
20132010 2011 2012 2013Average
2010-2013Inflows of asylum seekers 81 101 179 157 129 52Refugees resident in the country 434 247 86 63 65 21
Components of population growth
Per 1,000 inhabitants1985-1990 1990-1995 1995-2000 2000-2005 2005-2010
Total 25.7 19.7 28.4 26.2 25.3Natural increase 31.8 28.8 25.0 22.6 20.6Net migration -6.1 -9.1 3.5 3.5 4.7
Foreign-born population
Percentage of the total population Persons (thousands)
2013% change 2013/20101990 2000 2010 2013
16.2 15.3 15.0 15.3 51 2.0
Remittances Millions of dollars % of GDP
2013% change 2013/20102010 2011 2012 2013
100 107 112 120 8 20
Macroeconomic indicators
Annual growth in % Average annual growth
2010-2013Level 20132010 2011 2012 2013
Real GDP 3.3 2.1 3.8 1.5 2.7 -GDP/per capita (PPP in constant 2011 international dollars)
0.8 -0.4 1.3 -0.9 0.2 8,215
Labor market outcomes of emigrants in Europe and the United States
Percentages Men Women Total
2010-2011 2012-2013 2010-2011 2012-2013 2010-2011 2012-2013Participation rate 76.8 80.1 73.2 71.5 74.8 75.6Employment rate 64.7 72.1 66.7 60.4 65.8 65.9Unemployment rate nr nr nr nr nr nr
76 / INTERNATIONAL MIGRATION IN THE AMERICAS SICREMI 2015
PLURINATIONAL STATE OF BOLIVIATemporary immigration to Bolivia increased from 17 to 26 thousand between 2010 and 2012, falling back to 18 thousand in 2013. Nonetheless, the numbers are, much higher than permanent immigration levels, which rose from around 1,000 in 2010 to close to 3,800 in 2013. More than 50% of temporary immigration occurred in the context of international agreements, essentially Mercosur.
The foreign-born population has held steady relative to the total population, at some 1.4% of the total, a figure that corresponds to that for all of Latin America and the Caribbean.
From 2009 to 2012, emigration increased some 23% – rising by about 6,000 individuals per year – and in 2012, some 98,000 Bolivians emigrated abroad. In 2012, three fourths of Bolivians went to Argentina, followed by Chile, Spain and the United States. From 2009 to 2012, migration to Spain and the United States decreased some 36% and 30%, respectively.
The labor market situation of Bolivian migrants in Europe and the United States is not very favorable overall. Their unemployment rate has surpassed 20%, and for men during 2012-2013, it was more than 27%. The unemployment rate among Bolivian women has been lower than among men, and while it also saw an increase, it was two percentage points less than that registered for men.
Remittances represent nearly 5% of Bolivia’s Gross Domestic Product. Despite a decrease in remittances due to the 2007-2012 financial crisis, these have begun to increase again in 2014. By 2013, Bolivia received 1.2 billion dollars in remittances, an increase of 8% in comparison with 2012.
In 2012, through the “Law for Protecting Refugee Persons”, Bolivia established a set of rules for protecting refugees and those who request this status, in accordance with the Convention Relating to the Status of Refugees of 1951 and its 1967 Protocol, and other international instruments on human rights ratified by Bolivia. However, the annual number of asylum requests and the number of refugees residing in the country remain very low. For 2013, 20 asylum applications were received, and refugees in the country numbered fewer than 800, mainly from Peru and Colombia.
In 2013, a new Immigration Law25 was enacted, and a Presidential Decree26 established the regulatory framework for Bolivian immigration policy. The objective of the Law is to regulate the entry, transit, stay and departure of people in the territory of the Plurinational State of Bolivia and to establish institutional spaces of coordination that guarantee the rights of Bolivian and foreign migrant persons, in accordance with the Political Constitution of the State, International Instruments on matters of Human Rights ratified by the State, and rules in force.
The law replaces an earlier one (1996) and provides broad rights to foreigners, including the right to family reunification, to vote in municipal elections; to request and receive shelter; to freedom of movement within Bolivia; and to the assistance of an interpreter. The law also establishes that migrant associations or organizations that are legally incorporated and registered with the National Migration Directorate can act as party plaintiffs in the protection of migrant rights.
25 Law No. 370.26 Decree No. 1923.
PART II Country Notes / 77
The law establishes different stay categories: (a) transit, for a 180-day period; (b) temporary, for a maximum of 3 years; and (c) permanent, for which a prior 3-year-stay in the country is required. Additionally, the law recognizes the right of a migrant to develop any remunerative activity – by him/herself or as an employee – regardless of the category of stay. Employers, under the law, are obliged to strictly fulfil the labor legislation, regardless of the migration status of the immigrant and his/her condition – regular or irregular.
Additionally, the law introduces the recognition of “climate change migrant.”
In late 2013 a Decree was enacted based on the new law providing for the regularization of foreigners in an irregular situation in Bolivian territory. Foreigners who wish to stay in the country and to be regularized had to come forward between January 5th, 2014 when the law came into effect and June 5th of the same year.27
The new immigration law incorporates a number of policy initiatives in favor of returning Bolivians.28 Returnees with job and/or artistic skills may have skills which were acquired abroad recognized through the Plurinational System of Competency Certification of the Ministry of Education. In addition the family unit may bring into the country personal effects of normal use without having to pay an import tax.
In Bolivia, the Agreement on Residence for Nationals of States Party to Mercosur applies to all citizens of countries party to Mercosur who wish to settle in Bolivian territory. The goal is to grant legal residence to nationals of these States who wish to reside in the country. Temporary residence is granted for 2 years, after which nationals of signatory countries may acquire permanent residence. Argentina, Uruguay and Bolivia recognize the right to health and education for all under the agreement.
27 Presidential Decree Number 1800.28 It is estimated that 40% of Bolivians who went to Spain have returned (see Table 7, Part I).
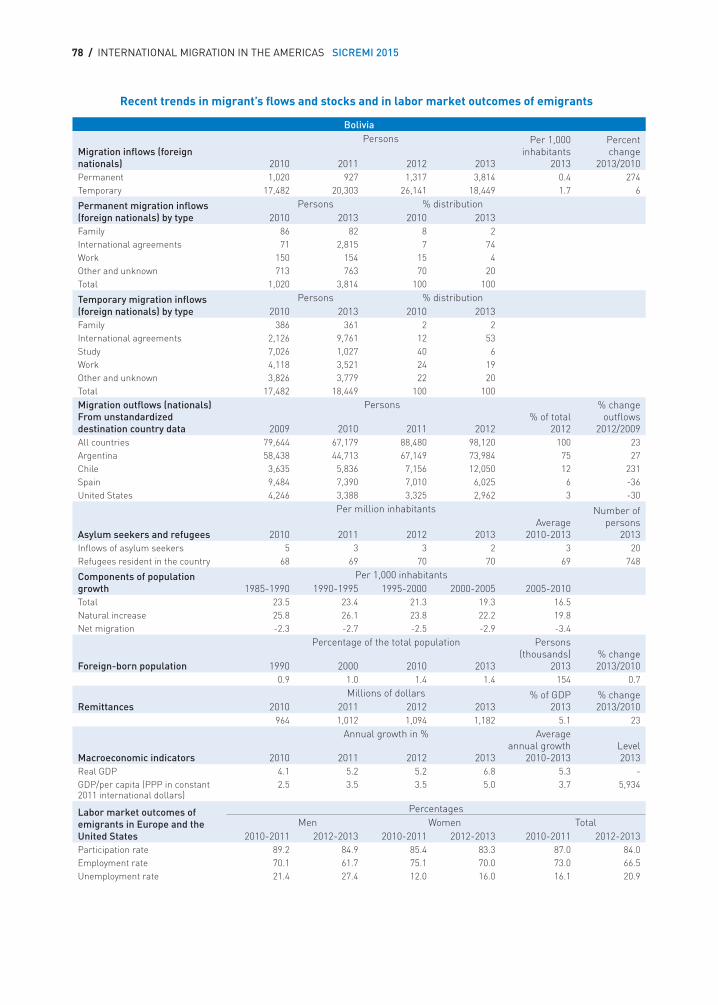
78 / INTERNATIONAL MIGRATION IN THE AMERICAS SICREMI 2015
Recent trends in migrant’s flows and stocks and in labor market outcomes of emigrants
Bolivia
Migration inflows (foreign nationals)
Persons Per 1,000 inhabitants
2013
Percent change
2013/20102010 2011 2012 2013Permanent 1,020 927 1,317 3,814 0.4 274Temporary 17,482 20,303 26,141 18,449 1.7 6
Permanent migration inflows (foreign nationals) by type
Persons % distribution2010 2013 2010 2013
Family 86 82 8 2International agreements 71 2,815 7 74Work 150 154 15 4Other and unknown 713 763 70 20Total 1,020 3,814 100 100
Temporary migration inflows (foreign nationals) by type
Persons % distribution2010 2013 2010 2013
Family 386 361 2 2International agreements 2,126 9,761 12 53Study 7,026 1,027 40 6Work 4,118 3,521 24 19Other and unknown 3,826 3,779 22 20Total 17,482 18,449 100 100Migration outflows (nationals)From unstandardized destination country data
Persons% of total
2012
% change outflows
2012/20092009 2010 2011 2012All countries 79,644 67,179 88,480 98,120 100 23Argentina 58,438 44,713 67,149 73,984 75 27Chile 3,635 5,836 7,156 12,050 12 231Spain 9,484 7,390 7,010 6,025 6 -36United States 4,246 3,388 3,325 2,962 3 -30
Asylum seekers and refugees
Per million inhabitants Number of persons
20132010 2011 2012 2013Average
2010-2013Inflows of asylum seekers 5 3 3 2 3 20Refugees resident in the country 68 69 70 70 69 748
Components of population growth
Per 1,000 inhabitants1985-1990 1990-1995 1995-2000 2000-2005 2005-2010
Total 23.5 23.4 21.3 19.3 16.5Natural increase 25.8 26.1 23.8 22.2 19.8Net migration -2.3 -2.7 -2.5 -2.9 -3.4
Foreign-born population
Percentage of the total population Persons (thousands)
2013% change 2013/20101990 2000 2010 2013
0.9 1.0 1.4 1.4 154 0.7
Remittances Millions of dollars % of GDP
2013% change 2013/20102010 2011 2012 2013
964 1,012 1,094 1,182 5.1 23
Macroeconomic indicators
Annual growth in % Average annual growth
2010-2013Level 20132010 2011 2012 2013
Real GDP 4.1 5.2 5.2 6.8 5.3 -GDP/per capita (PPP in constant 2011 international dollars)
2.5 3.5 3.5 5.0 3.7 5,934
Labor market outcomes of emigrants in Europe and the United States
Percentages Men Women Total
2010-2011 2012-2013 2010-2011 2012-2013 2010-2011 2012-2013Participation rate 89.2 84.9 85.4 83.3 87.0 84.0Employment rate 70.1 61.7 75.1 70.0 73.0 66.5Unemployment rate 21.4 27.4 12.0 16.0 16.1 20.9
PART II Country Notes / 79
BRAZILIn the year 2013, Brazil received almost 128,000 permanent and temporary immigrants, the majority of a temporary character (more than 80% of the total).
Brazil has one of the lowest permanent immigration rates in the Americas and, as well, with Colombia, Cuba and Honduras, one of the smallest immigrant populations relative to its total population size.
The United States continues to be the main destination country for emigrating Brazilians (40%), followed by Portugal, Bolivia and Canada. Brazilian emigration to Bolivia has increased almost five-fold between 2009 and 2012.
The insertion of Brazilian emigrants into the labor market in Europe and the United States took a turn for the worse from 2010 to 2013, especially for women. While the participation rate remained the same for both genders, unemployment increased by almost 3 percentage points for women but by around 1 point for men. From the onset of the financial crisis in the 2007-2008 period, to the 2012-2013 period, women’s unemployment rose from 8.5% to almost 19%, while that for men increased from 5.7% to 11.4%.
In 2013, Brazil received 1.6 billion dollars in remittances, representing less than one tenth of one percent of Gross Domestic Product. In comparison with the year 2012, remittances decreased some 18.4%. The downward trend persists since 2010.
Brazil received nearly 5,000 asylum requests in 2013, the most significant countries of origin being Bangladesh, Senegal and Lebanon. Lebanon showed an increase of 320% relative to 2012. Today there are 5,190 refugees in Brazil, mainly of Colombian and Angolan origin, followed by Syria, Liberia, Iraq and Palestine.
The Brazilian government is undertaking a reform of its immigration Law, based on the principles established in the Constitution of 1988, and on international treaties on human rights. Recently a draft bill on Immigration and the Promotion of the Rights of Immigrants was prepared by a group of experts led by the Ministry of Justice and sent to the National Congress for consideration. The bill provides for regularization procedures, facilitates family reunion and allows regular entry for those who seek employment. It also establishes a specialized national institution in charge of all aspects of immigration.
In 2012, and in preparation for the 2014 FIFA World Cup, as well as the 2016 Olympic and Paralympics Games, the National Immigration Council published normative Resolution No. 98, to grant temporary work visas to foreigners for work in the country during the preparation, organization, planning and execution of the events.
Also, in 2012, through normative Resolution No. 97 of the National Immigration Council, Brazil regularized 5,651 Haitian nationals on a humanitarian basis.
Recently, the Brazilian State has adopted provisions for extending the “Agreement on Residence for Nationals of States Party to Mercosur, Bolivia and Chile” to Peruvian and Colombian nationals residing in Brazil.

80 / INTERNATIONAL MIGRATION IN THE AMERICAS SICREMI 2015
In 2013, the government signed an Agreement with Uruguay on Permanent Residence in the context of the Free Circulation of Persons. The objective is to facilitate the movement of citizens of both countries between their respective territories to ensure effective binational integration. Permanent residence or a visa may be obtained by presenting a valid passport, current identity document or a special border document issued by the consulate of the country of origin, as well as a certificate or an affidavit attesting to the absence of a criminal record. Those requesting permanent residence will not be required to show a prior period of temporary residence. Uruguayan citizens who have obtained a permanent residence visa in Brazil or vice versa, based on this agreement, have the right to freely enter, exit, circulate and remain in the arrival country’s territory, through prior fulfilment of requirements – a valid passport and no criminal record – set in the agreement.
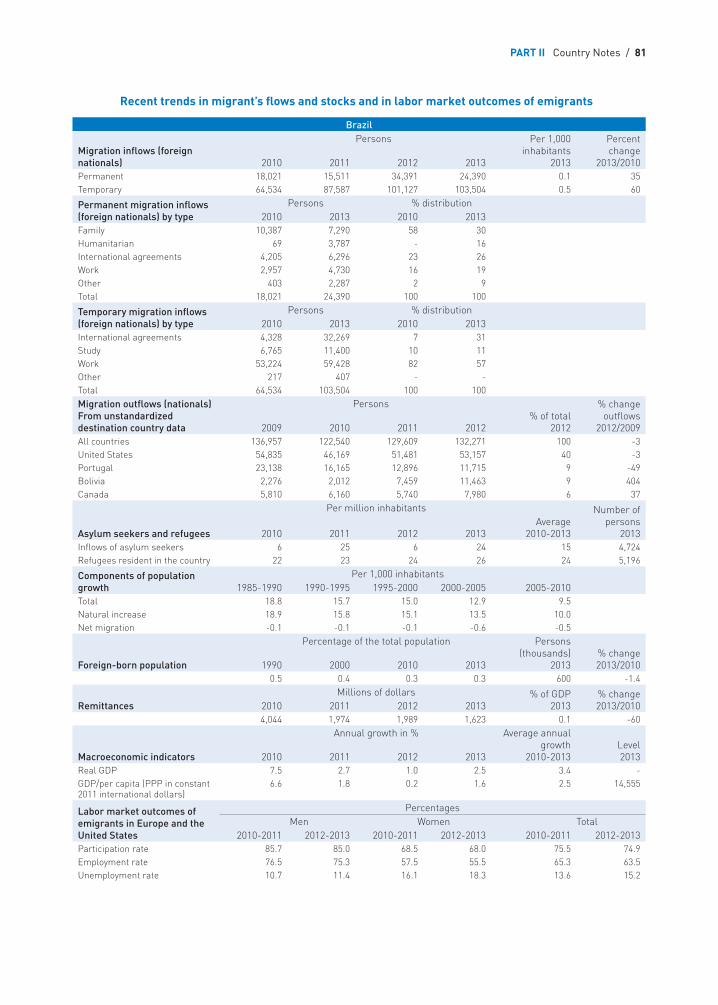
PART II Country Notes / 81
Recent trends in migrant’s flows and stocks and in labor market outcomes of emigrants
Brazil
Migration inflows (foreign nationals)
Persons Per 1,000 inhabitants
2013
Percent change
2013/20102010 2011 2012 2013Permanent 18,021 15,511 34,391 24,390 0.1 35Temporary 64,534 87,587 101,127 103,504 0.5 60
Permanent migration inflows (foreign nationals) by type
Persons % distribution2010 2013 2010 2013
Family 10,387 7,290 58 30Humanitarian 69 3,787 - 16International agreements 4,205 6,296 23 26Work 2,957 4,730 16 19Other 403 2,287 2 9Total 18,021 24,390 100 100
Temporary migration inflows (foreign nationals) by type
Persons % distribution2010 2013 2010 2013
International agreements 4,328 32,269 7 31Study 6,765 11,400 10 11Work 53,224 59,428 82 57Other 217 407 - -Total 64,534 103,504 100 100Migration outflows (nationals) From unstandardized destination country data
Persons% of total
2012
% change outflows
2012/20092009 2010 2011 2012All countries 136,957 122,540 129,609 132,271 100 -3United States 54,835 46,169 51,481 53,157 40 -3Portugal 23,138 16,165 12,896 11,715 9 -49Bolivia 2,276 2,012 7,459 11,463 9 404Canada 5,810 6,160 5,740 7,980 6 37
Asylum seekers and refugees
Per million inhabitants Number of persons
20132010 2011 2012 2013Average
2010-2013Inflows of asylum seekers 6 25 6 24 15 4,724Refugees resident in the country 22 23 24 26 24 5,196
Components of population growth
Per 1,000 inhabitants1985-1990 1990-1995 1995-2000 2000-2005 2005-2010
Total 18.8 15.7 15.0 12.9 9.5Natural increase 18.9 15.8 15.1 13.5 10.0Net migration -0.1 -0.1 -0.1 -0.6 -0.5
Foreign-born population
Percentage of the total population Persons (thousands)
2013% change 2013/20101990 2000 2010 2013
0.5 0.4 0.3 0.3 600 -1.4
Remittances Millions of dollars % of GDP
2013% change 2013/20102010 2011 2012 2013
4,044 1,974 1,989 1,623 0.1 -60
Macroeconomic indicators
Annual growth in % Average annual growth
2010-2013Level 20132010 2011 2012 2013
Real GDP 7.5 2.7 1.0 2.5 3.4 -GDP/per capita (PPP in constant 2011 international dollars)
6.6 1.8 0.2 1.6 2.5 14,555
Labor market outcomes of emigrants in Europe and the United States
Percentages Men Women Total
2010-2011 2012-2013 2010-2011 2012-2013 2010-2011 2012-2013Participation rate 85.7 85.0 68.5 68.0 75.5 74.9Employment rate 76.5 75.3 57.5 55.5 65.3 63.5Unemployment rate 10.7 11.4 16.1 18.3 13.6 15.2
82 / INTERNATIONAL MIGRATION IN THE AMERICAS SICREMI 2015
CANADACanada admitted close to 259,000 new permanent residents in 2013, equivalent to about 0.7% of the resident population and close to the average since 2005. During the last decade, the role of net migration in population growth in Canada was twice as important as natural increase.
Canada sets annual targets for the total admission of permanent residents and by single categories; its overall planned admission range for 2013 was 240,000-265,000, consistent since 2006. In 2013, admissions under each class were within the planned range except for family reunification. 57% of 2013 admissions were economic immigrants (including spouses/partners and dependants), 31% were in the family reunification category, and 12% were protected persons and other immigrants. The share of family class immigrants increased by 32% from 2010 to 2013 (from 60,225 admissions to 79,685) as a result of the accelerated processing of applications, following a temporary pause in the intake of new sponsorship applications for the Parent and Grandparents Program. As a result, it exceeded the upper bound of the admissions range. Since its launch in December 2011, 20,000 multi-entry 10-year-duration “Super Visas” were delivered to parents and grandparents with an 85% approval rate as of June 2013. The number of admissions under other grounds decreased in the same period, especially the number of family members accompanying a work permit holder.
The number of new asylum requests for Canada was halved in 2013 compared to 2012 with 10,356 new requests in 2013. Also, Canada did not reach its 2012 planned range for government-assisted refugees.
China (13.1%), India (11.8%) and the Philippines (10.6%) continue to be the leading origin countries for permanent residents to Canada (2013). The Philippines (16.7%) was the leading origin for economic migrants, China (20.8%) for family migrants and Iraq (14.7%) for humanitarian migrants.
Immigrants continue to be well qualified: in 2012, 42% (68,000) of permanent resident admissions between 25 and 64 years of age had completed tertiary education.
Canada has seen significant growth in temporary migration, which is more demand-driven than permanent resident admissions. In 2013, 344,190 new temporary foreign workers, international students and humanitarian migrants were admitted, a 15% increase from 2010, with increases in both temporary foreign workers (221,310) and international students (111,900), but a strong decline in humanitarian migrants. 27,700 Seasonal Agricultural Workers came to Canada to work in 2013, with Mexico and Jamaica accounting for 68% and 26% respectively of total admissions in this category.
In the period 2009-2012, Canadian outflows to the rest of the OECD and other American countries averaged 49,000 per year. 50,800 Canadians entered another OECD country or another American country in 2012. The United States hosts the largest Canadian community abroad with nearly 800.000 persons. Canadians form the sixth largest American-born group in the United States, overtaken in 2010 by immigrants born in the Dominican Republic or in Guatemala. Three quarters of the Canadians acquiring another OECD country nationality are becoming citizens of the United States, around 9,000 every year.
The United States remains the main destination country but the number of permanent or temporary entries of Canadians in this country decreased between 2005 and 2012, from 19,100 to 17,400,
PART II Country Notes / 83
a decrease mainly accountable to the drop in permanent entries that nearly halved in the same period (see Annex Table E.d.fl.). The United Kingdom replaced Korea as the second destination country. Germany attracted increasing numbers of Canadian citizens, but the numbers remain low (around 3,000).
The labor market outcomes of working-age Canadians living in European OECD countries or the United States are favourable as 70% are in employment and less than 6% of those in the labor force are unemployed and looking for work. These good performances remain unchanged over the recent years.
Canada passed comprehensive legislative changes to the Citizenship Act in June 2014. In order to be more responsive to labor market demand, an Expression-of-Interest application management system designed to create a pool of skilled workers who are ready to begin employment in Canada was launched in January 2015. Such labor migration systems were already implemented successfully in New Zealand and Australia in 2003 and 2012 respectively.
The Start-up Visa Programme, launched in 2013, welcomed the first successful applicant entrepreneurs in 2014. The Federal Investor and Entrepreneur programs were terminated in June 2014.
The government undertook a review of the Parent-and-Grandparent Program in 2012 with a view to reducing application backlogs and lengthy wait times, and making the Programme more fiscally sustainable over the long term. Since the launch of the new plan, the backlog and wait times have been reduced. New sponsorship criteria (in effect from 2014) require that families have the financial means to support those they sponsor.
A comprehensive overhaul of the Temporary Foreign Worker Programme was announced in June 2014. This required using wage levels instead of the national occupational classification as the main criterion of approval, a more stringent Labor Market Impact Assessment (LMIA) process, and caps on low-wage temporary foreign workers. LMIA exemptions have been consolidated in an International Mobility Program. Both programs will have stronger employer enforcement through tougher penalties and will be financed by higher compliance fees.
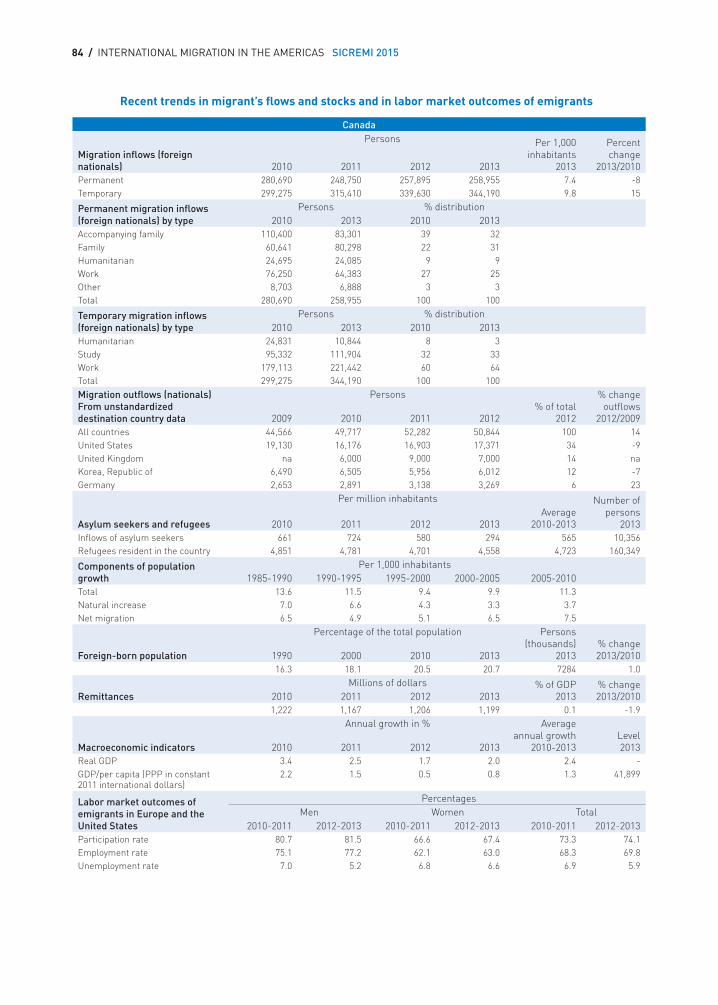
84 / INTERNATIONAL MIGRATION IN THE AMERICAS SICREMI 2015
Recent trends in migrant’s flows and stocks and in labor market outcomes of emigrants
Canada
Migration inflows (foreign nationals)
Persons Per 1,000 inhabitants
2013
Percent change
2013/20102010 2011 2012 2013Permanent 280,690 248,750 257,895 258,955 7.4 -8Temporary 299,275 315,410 339,630 344,190 9.8 15
Permanent migration inflows (foreign nationals) by type
Persons % distribution2010 2013 2010 2013
Accompanying family 110,400 83,301 39 32Family 60,641 80,298 22 31Humanitarian 24,695 24,085 9 9Work 76,250 64,383 27 25Other 8,703 6,888 3 3Total 280,690 258,955 100 100
Temporary migration inflows (foreign nationals) by type
Persons % distribution2010 2013 2010 2013
Humanitarian 24,831 10,844 8 3Study 95,332 111,904 32 33Work 179,113 221,442 60 64Total 299,275 344,190 100 100Migration outflows (nationals)From unstandardized destination country data
Persons% of total
2012
% change outflows
2012/20092009 2010 2011 2012All countries 44,566 49,717 52,282 50,844 100 14United States 19,130 16,176 16,903 17,371 34 -9United Kingdom na 6,000 9,000 7,000 14 naKorea, Republic of 6,490 6,505 5,956 6,012 12 -7Germany 2,653 2,891 3,138 3,269 6 23
Asylum seekers and refugees
Per million inhabitants Number of persons
20132010 2011 2012 2013Average
2010-2013Inflows of asylum seekers 661 724 580 294 565 10,356Refugees resident in the country 4,851 4,781 4,701 4,558 4,723 160,349
Components of population growth
Per 1,000 inhabitants1985-1990 1990-1995 1995-2000 2000-2005 2005-2010
Total 13.6 11.5 9.4 9.9 11.3Natural increase 7.0 6.6 4.3 3.3 3.7Net migration 6.5 4.9 5.1 6.5 7.5
Foreign-born population
Percentage of the total population Persons (thousands)
2013% change 2013/20101990 2000 2010 2013
16.3 18.1 20.5 20.7 7284 1.0
Remittances Millions of dollars % of GDP
2013% change 2013/20102010 2011 2012 2013
1,222 1,167 1,206 1,199 0.1 -1.9
Macroeconomic indicators
Annual growth in % Average annual growth
2010-2013Level 20132010 2011 2012 2013
Real GDP 3.4 2.5 1.7 2.0 2.4 -GDP/per capita (PPP in constant 2011 international dollars)
2.2 1.5 0.5 0.8 1.3 41,899
Labor market outcomes of emigrants in Europe and the United States
Percentages Men Women Total
2010-2011 2012-2013 2010-2011 2012-2013 2010-2011 2012-2013Participation rate 80.7 81.5 66.6 67.4 73.3 74.1Employment rate 75.1 77.2 62.1 63.0 68.3 69.8Unemployment rate 7.0 5.2 6.8 6.6 6.9 5.9
PART II Country Notes / 85
CHILEChile is attracting an increasing number of immigrants from neighboring countries. In 2013, the number of immigrants who arrived in Chile (permanent and temporary) at 123 thousand was more than twice the figure recorded in 2010.
However, the foreign-born population as a percentage of the total population remains low and has increased only slightly since 1990, from 0.8% to 2.3% in 2013.
The outflow of Chilean emigrants to OECD member states and countries of Latin America has been considerably lower over recent years than the flow of migrants into the country. Chilean emigration has decreased some 12% since 2009. The United States continues to be the most important destination country, receiving more than 30% of Chilean emigrants, although this percentage has been declining. Argentina is the second destination of preference for Chileans and this figure has grown in importance over the same period.
The outcomes of Chilean migrants in the labor markets of Europe and the United States has remained relatively stable from 2010-2011 to 2012-2013, with a small increase of 0.7 points in both the employment and unemployment rates.
In the year 2013, Chile received 249 asylum seekers, showing an increase of 48% relative to the number of asylum requests in 2012. Colombia and Syria are the most important countries of origin. For the same year, there were 1,743 refugees in the country.
Remittances grew to a total of 923 million dollars in the year 2013, which represents an increase of some 3.2% relative to the previous year. This amount represents less than 1% of the country’s Gross Domestic Product.
On June 4, 2013 a new immigrant bill was introduced to the Chamber of Deputies. This Bill seeks to replace the Decree 1094 of 1975, legislation that continued to address the national security concerns of the Cold War. A special legislative commission has approved it and at the time of the drafting of this note, it was under the First Legislative Review in the Chamber of Deputies at the Chilean Congress.
On September 22 2014, under Decree No. 1393, the Migration Policy Council was created with the aim of drafting the national migration policy as well as coordinating institutional actions, plans and programs on migration.
The main responsibilities of the Council are: to analyze migration phenomena, update the existing information regarding migration; generate proposals that regulate the migration; coordinate state agents and civil society involved with immigration policy; and propose amendments to the current legislation.
The current administration is planning to introduce changes to the Bill proposed by the previous administration. The changes to the bill cover: human rights issues, different visa categories, immigration institutions and links with nationals living abroad.
Additionally, in May 2014, President Bachelet enacted the constitutional reform that allows Chileans abroad to exercise the right to vote, in plebiscite consultations as well as presidential elections.
86 / INTERNATIONAL MIGRATION IN THE AMERICAS SICREMI 2015
The Chilean State has taken a number of initiatives to integrate immigrants to the country. First, the children of all migrants who reside in Chile are to be formally incorporated into basic and childhood education. Secondly the public healthcare system is to provide health care to all foreign children and adolescents under 18 years of age. Thirdly, access to the National Women’s Service protection network for victims of domestic violence is facilitated for immigrant women, asylum seekers and refugees residing in Chile.
Additionally, the Ministry of Foreign Affairs has implemented the Program “Network for Victims of Gender Violence” for Chileans living abroad. The program is being implemented mainly in countries with a significant presence of Chileans, starting with Argentina.
The Pacific Alliance was created on April 28, 2011, with Chile, Colombia, Mexico and Peru as founding members. Costa Rica and Panama joined as observers. The Pacific Alliance has formed the People Mobility Group to monitor mainly non-residents. The purpose of the Pacific Alliance is to make progress towards “the free movement of goods, services, capital and persons.” It established as an initial priority the movement of business people and the facilitation of migration flows and cooperation among immigration and consular police.29
29 Programs such as Holidays and Work, Academic and Student Mobility and Exchange of Immediate Information for Migration Security have been approved.
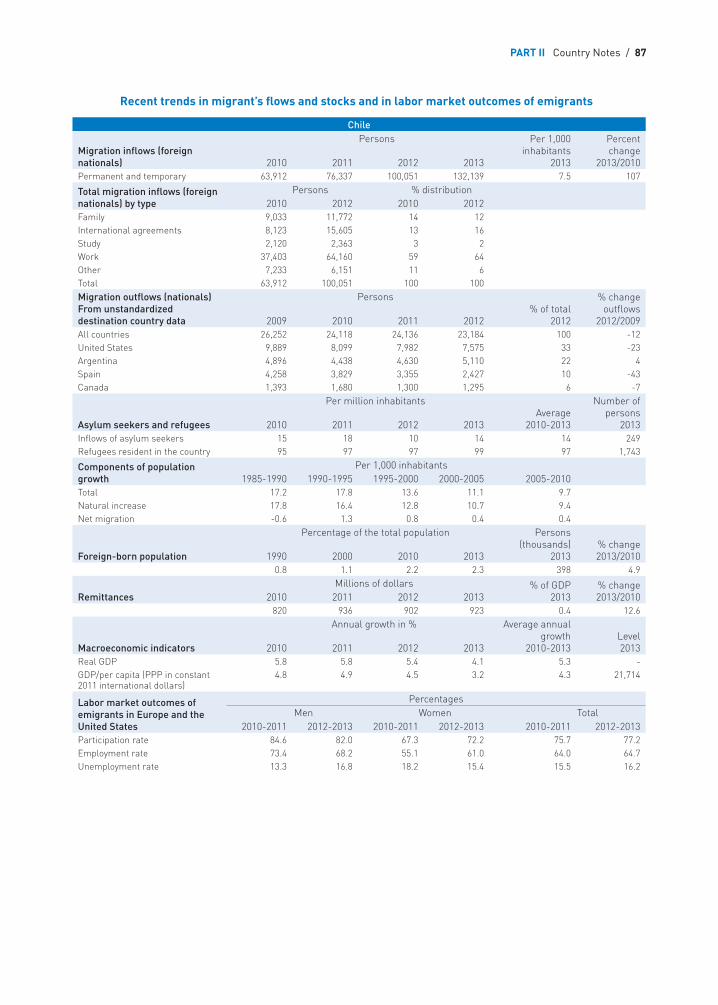
PART II Country Notes / 87
Recent trends in migrant’s flows and stocks and in labor market outcomes of emigrants
Chile
Migration inflows (foreign nationals)
Persons Per 1,000 inhabitants
2013
Percent change
2013/20102010 2011 2012 2013Permanent and temporary 63,912 76,337 100,051 132,139 7.5 107
Total migration inflows (foreign nationals) by type
Persons % distribution2010 2012 2010 2012
Family 9,033 11,772 14 12 International agreements 8,123 15,605 13 16 Study 2,120 2,363 3 2 Work 37,403 64,160 59 64 Other 7,233 6,151 11 6 Total 63,912 100,051 100 100 Migration outflows (nationals)From unstandardized destination country data
Persons% of total
2012
% change outflows
2012/20092009 2010 2011 2012All countries 26,252 24,118 24,136 23,184 100 -12United States 9,889 8,099 7,982 7,575 33 -23Argentina 4,896 4,438 4,630 5,110 22 4Spain 4,258 3,829 3,355 2,427 10 -43Canada 1,393 1,680 1,300 1,295 6 -7
Asylum seekers and refugees
Per million inhabitantsAverage
2010-2013
Number of persons
20132010 2011 2012 2013Inflows of asylum seekers 15 18 10 14 14 249Refugees resident in the country 95 97 97 99 97 1,743
Components of population growth
Per 1,000 inhabitants1985-1990 1990-1995 1995-2000 2000-2005 2005-2010
Total 17.2 17.8 13.6 11.1 9.7Natural increase 17.8 16.4 12.8 10.7 9.4Net migration -0.6 1.3 0.8 0.4 0.4
Foreign-born population
Percentage of the total population Persons (thousands)
2013% change 2013/20101990 2000 2010 2013
0.8 1.1 2.2 2.3 398 4.9
Remittances Millions of dollars % of GDP
2013% change 2013/20102010 2011 2012 2013
820 936 902 923 0.4 12.6
Macroeconomic indicators
Annual growth in % Average annual growth
2010-2013Level 20132010 2011 2012 2013
Real GDP 5.8 5.8 5.4 4.1 5.3 -GDP/per capita (PPP in constant 2011 international dollars)
4.8 4.9 4.5 3.2 4.3 21,714
Labor market outcomes of emigrants in Europe and the United States
Percentages Men Women Total
2010-2011 2012-2013 2010-2011 2012-2013 2010-2011 2012-2013Participation rate 84.6 82.0 67.3 72.2 75.7 77.2Employment rate 73.4 68.2 55.1 61.0 64.0 64.7Unemployment rate 13.3 16.8 18.2 15.4 15.5 16.2
88 / INTERNATIONAL MIGRATION IN THE AMERICAS SICREMI 2015
COLOMBIAColombia has been characterized as a country of emigration, with negative net rates of migration since the 1980s and with a foreign-born population that is less than 0.5% of the total population. However, since 2010, the country has been attracting a growing flow of immigrants, with entries almost doubling between 2010 and 2013, reaching a total of 29,840 immigrants in the year 2013, which remains a small number for a country of 48 million people.
The outflow of Colombian emigrants to OECD member states and Latin America has remained relatively constant at around 100 thousand, with a slight increase of 3% between 2009 and 2012. The United States has the greatest percentage of Colombian migrants, with 36% of the total. Since 2009, Argentina and Chile have also become destination countries for Colombians, more than doubling and tripling, respectively, their numbers of Colombian immigrants.
The labor force participation rate of Colombians in Europe and the United States fell by 1.6 percentage points between 2010-2011 and 2012-2013. During this same period, the employment rate of Colombian emigrants increased slightly (0.4%) while the unemployment rate declined by 2 percentage points to reach 17.9%.
In 2013, Colombia received 229 asylum requests, an increase of 131% relative to the number of asylum requests in 2012. The most important origin countries were Cuba, Somalia and Bangladesh. The Ministry of Foreign Affairs reports that since 2009 there have been 57 recognized refugees.30
Remittances increased to more than 4 billion dollars, rising some 2.3% from 2012 to 2013, making Colombia the largest recipient of remittances in South America, followed by Peru with 2.7 billion dollars.
In 2011, through Law Decree 4062, the Special Administrative Unit of Immigration in Colombia, referred to as “Migración Colombia,” was created as the country’s single immigration authority. The Unit, part of the Ministry of Foreign Affairs, is responsible for all immigration procedures in Colombia, such as migration control, monitoring and enforcement.
In the same year, “Migración Colombia” formulated its Institutional Strategic Plan “Fronteras en Línea 2012-2014.” The Plan establishes the guidelines for the consolidation of the new migration institutional structure with the objective of implementing a new model of migration management.
Regarding the regulations on migration, Decree 834, of April 2013, established new provisions for immigration, including specific aspects of visas, control, surveillance and monitoring, entry permits and extensions of stay, registration and documentation, and departure. The Decree adapts the Colombian visa system to international codification standards. Types of visas were reduced from seven to four and categories increased from 18 to 20. Some relevant changes to the entry and stay system are:
■ The temporary worker visa (new Visa Temporary TP-4), can now be issued without the legal requirement to practice a profession. This will be required only after the visa is issued.
30 The data differs from data supplied by the UNHCR (224 refugee in 2013).
PART II Country Notes / 89
■ Permanent residence visas, which were formerly issued for an indefinite period, are now valid for 5 years. The decree also extends the benefit of the visa to the spouse/partner, parents and children under 25 years of age who are financially dependent of the visa holder.
Colombia signed the “Agreement on Residence for Nationals of States Party to Mercosur, Bolivia and Chile” in July 2012 and began to apply it in December 1st of the same year. Mercosur citizens may settle in Colombia with minimal requirements by acquiring a two-year resident visa; at the end of this period, they may seek permanent residence. On the basis of reciprocity, Colombia, in 2013, extended the Agreement’s immigration benefits to nationals of Uruguay and Paraguay, thus bringing the number of beneficiary countries to eight, along with Argentina, Brazil, Bolivia, Chile, Ecuador and Peru.
In keeping with a Colombian policy of rapprochement to the Eurasia region, nationals of Azerbaijan, Bulgaria, Georgia and Romania are now exempt from a visa requirement for visits of up to 180 days.
Law of Return No. 1565, issued in 2012, and regulated by Decree 1000 and 2064 of 2013, specifies modalities and incentives for the return of Colombians living abroad. It provides customs, tax and financial incentives for the return of Colombians who have lived abroad for more than three years.
In December of 2012, Decree 2840 established changes to the procedures for recognizing the condition of refugees, with new guidelines for the Advisory Committee for Determining the Condition of Refugee and other provisions.
The Decree regulates the permit length in an effort to adapt to the shifting realities of refugee claims, minimizes as much as possible abuses during the procedures and protects victims of human trafficking. It also offers an alternative supplementary protection to victims who have not been granted refugee status, provided that a particular vulnerability situation that demands special attention is demonstrated. The assessment of each case is the responsibility of the Advisory Committee for Determining Refugee Status.
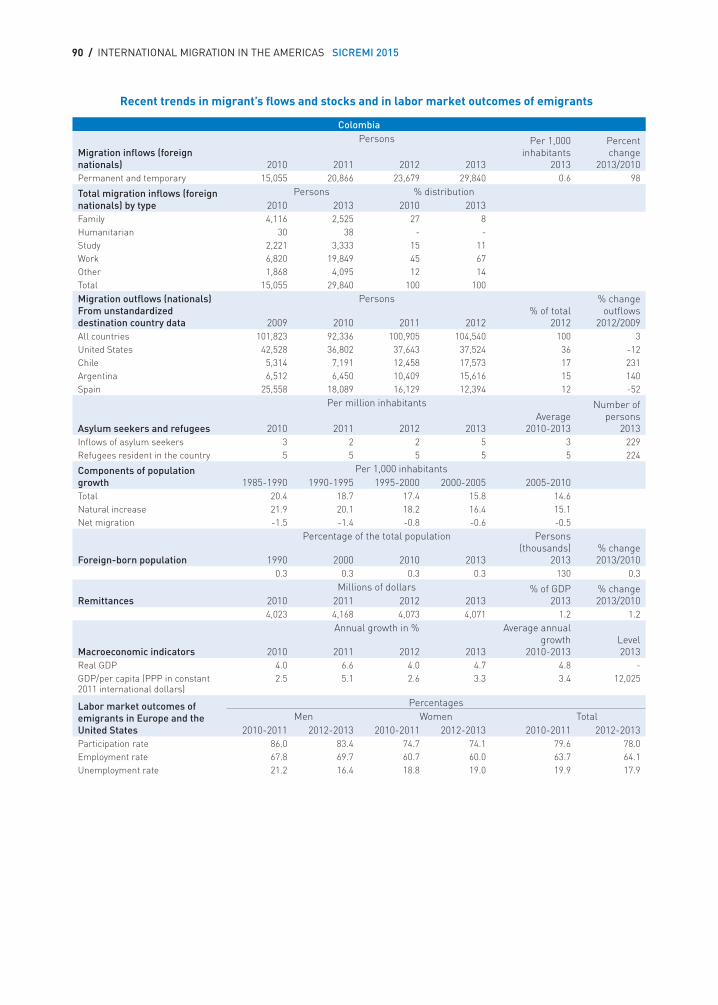
90 / INTERNATIONAL MIGRATION IN THE AMERICAS SICREMI 2015
Recent trends in migrant’s flows and stocks and in labor market outcomes of emigrants
Colombia
Migration inflows (foreign nationals)
Persons Per 1,000 inhabitants
2013
Percent change
2013/20102010 2011 2012 2013Permanent and temporary 15,055 20,866 23,679 29,840 0.6 98
Total migration inflows (foreign nationals) by type
Persons % distribution2010 2013 2010 2013
Family 4,116 2,525 27 8 Humanitarian 30 38 - - Study 2,221 3,333 15 11 Work 6,820 19,849 45 67 Other 1,868 4,095 12 14 Total 15,055 29,840 100 100 Migration outflows (nationals)From unstandardized destination country data
Persons% of total
2012
% change outflows
2012/20092009 2010 2011 2012All countries 101,823 92,336 100,905 104,540 100 3United States 42,528 36,802 37,643 37,524 36 -12Chile 5,314 7,191 12,458 17,573 17 231Argentina 6,512 6,450 10,409 15,616 15 140Spain 25,558 18,089 16,129 12,394 12 -52
Asylum seekers and refugees
Per million inhabitants Number of persons
20132010 2011 2012 2013Average
2010-2013Inflows of asylum seekers 3 2 2 5 3 229Refugees resident in the country 5 5 5 5 5 224
Components of population growth
Per 1,000 inhabitants1985-1990 1990-1995 1995-2000 2000-2005 2005-2010
Total 20.4 18.7 17.4 15.8 14.6Natural increase 21.9 20.1 18.2 16.4 15.1Net migration -1.5 -1.4 -0.8 -0.6 -0.5
Foreign-born population
Percentage of the total population Persons (thousands)
2013% change 2013/20101990 2000 2010 2013
0.3 0.3 0.3 0.3 130 0.3
Remittances Millions of dollars % of GDP
2013% change 2013/20102010 2011 2012 2013
4,023 4,168 4,073 4,071 1.2 1.2
Macroeconomic indicators
Annual growth in % Average annual growth
2010-2013Level 20132010 2011 2012 2013
Real GDP 4.0 6.6 4.0 4.7 4.8 -GDP/per capita (PPP in constant 2011 international dollars)
2.5 5.1 2.6 3.3 3.4 12,025
Labor market outcomes of emigrants in Europe and the United States
Percentages Men Women Total
2010-2011 2012-2013 2010-2011 2012-2013 2010-2011 2012-2013Participation rate 86.0 83.4 74.7 74.1 79.6 78.0Employment rate 67.8 69.7 60.7 60.0 63.7 64.1Unemployment rate 21.2 16.4 18.8 19.0 19.9 17.9
PART II Country Notes / 91
COSTA RICACosta Rica characterizes itself as a country of immigration, with close to 9% of its population born abroad in 2013, the highest level in Latin America. Immigration flows show a growing trend; the number of permanent immigrants entering the country doubled between 2010 and 2013, while temporary immigrants increased by some 26% during the same period. At the same time, emigration of Costa Ricans shows a slightly decreasing trend, registering 4% fewer exit flows between 2009 and 2012.
The entry of Costa Rican emigrants into the European and United States labor markets shows some particular characteristics. The rate of participation of women is some 20 percentage points below that of men, and their employment rate approximately 18 percentage points below that of men. While employment for men was close to 79% in the periods 2010-2011 and 2012-2013, it remained much lower, at about 55% and 60%, respectively, for women.
During the year 2013, 954 people applied for asylum in Costa Rica, most of them from Colombia, followed by El Salvador and Cuba, a figure 18% lower than that registered in 2012. Today Costa Rica has 12,749, refugees, mostly from Colombia.
The World Bank reported that, in 2013, the immigrant population in the country generated 394 million dollars in remittance outflows. On the other hand, according to the IDB data, the annual estimate of remittances entering Costa Rica was 561 million dollars.
In 2012, an executive order31 was issued, specifying the regulatory framework for the 2010 General Immigration Law (“Ley General de Migración y Extranjería”).32 These immigration regulations (“Reglamento de Extranjería”) established new requirements which foreigners must satisfy for residency or legal stay in the country, according to the different migratory categories.33
In August 2013, the National Council on Migration approved a comprehensive immigration policy (“Política Migratoria Integral”) for the period 2013-2023.34 This policy spells out the conceptual framework and steps to be followed by public institutions and civil society to achieve the integration of immigrants into Costa Rican society.
The main objectives and means of achieving them are:
■ To improve migration services by simplifying procedures, establishing interagency coordination and creating mechanisms to ensure access to these services by all migrants in order to improve migratory regularization levels and assistance to migrants, in general.
■ To promote better employment conditions and respect for migrants and refugees labor rights through informative campaigns on labor rights, through offering training at the technical and
31 Executive Order No. 37112-G.32 Law No. 8764.33 For more information, follow the link to the “Reglamento de la Ley General de Migración y Extranjería” p.11.
https://www.oas.org/dil/Migrants/Costa%20Rica/Reglamento%20de%20la%20ley%20general%20de%20mi-gracion%20y%20extranjeria,%201989.pdf
34 Published through Decree No. 38099-G, in the Official Diary la Gaceta N°245, on December 19, 2013.
92 / INTERNATIONAL MIGRATION IN THE AMERICAS SICREMI 2015
professional level regardless of their immigration status, and through strengthening labor inspection and the application of sanctions to employers, among others.
■ To improve access to health care for migrants and refugees through informative campaigns on social welfare and training programs on access to health care services for employees, employers and workers, among others, in order to increase health services coverage for migrants.
■ To improve migrants and refugees’ access to the Costa Rican education system at all levels and modalities of public education, by raising awareness among school leaders and teachers about discrimination and xenophobia, and by simplifying procedures for the certification of qualifications, among others.
According to the Reports on Migration and Integration of the General Directorate of Migration (2011 and 2012), Costa Rica has implemented the following integration programs for immigrants: (1) Neighbors Programme (“Programa entre Vecinos”), which seeks to introduce immigrants on the boards of development associations and to use arts and recreation as a means of sensitizing local populations to immigration; (2) Routes for Integration Programme (“Programa Rutas de Integración”), which has developed a “tool box” to aid non-governmental organizations that work with migrant and refugee populations as well as public officials in navigating through migration red tape and in providing aid and assistance to immigrants with regard to public programs in the areas of education, employment and health.
Additionally, immigrants can also access programs for national citizens, as is the case of the educational scholarship program “Avancemos”.
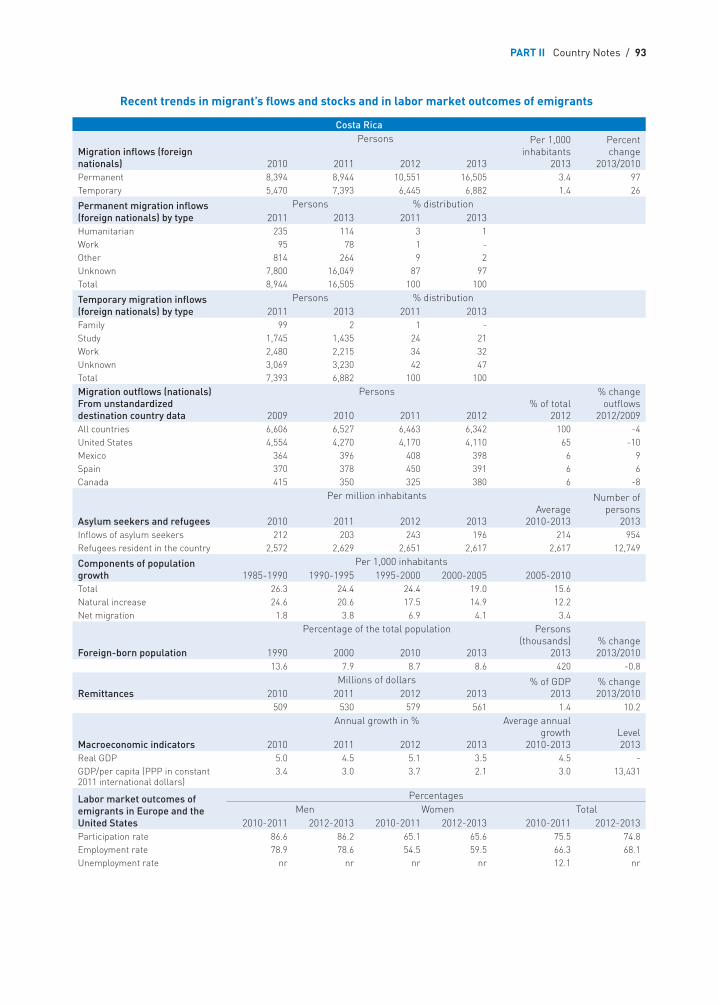
PART II Country Notes / 93
Recent trends in migrant’s flows and stocks and in labor market outcomes of emigrants
Costa Rica
Migration inflows (foreign nationals)
Persons Per 1,000 inhabitants
2013
Percent change
2013/20102010 2011 2012 2013Permanent 8,394 8,944 10,551 16,505 3.4 97Temporary 5,470 7,393 6,445 6,882 1.4 26
Permanent migration inflows (foreign nationals) by type
Persons % distribution2011 2013 2011 2013
Humanitarian 235 114 3 1 Work 95 78 1 - Other 814 264 9 2 Unknown 7,800 16,049 87 97 Total 8,944 16,505 100 100
Temporary migration inflows (foreign nationals) by type
Persons % distribution2011 2013 2011 2013
Family 99 2 1 - Study 1,745 1,435 24 21 Work 2,480 2,215 34 32 Unknown 3,069 3,230 42 47 Total 7,393 6,882 100 100 Migration outflows (nationals)From unstandardized destination country data
Persons% of total
2012
% change outflows
2012/20092009 2010 2011 2012All countries 6,606 6,527 6,463 6,342 100 -4United States 4,554 4,270 4,170 4,110 65 -10Mexico 364 396 408 398 6 9Spain 370 378 450 391 6 6Canada 415 350 325 380 6 -8
Asylum seekers and refugees
Per million inhabitants Number of persons
20132010 2011 2012 2013Average
2010-2013Inflows of asylum seekers 212 203 243 196 214 954Refugees resident in the country 2,572 2,629 2,651 2,617 2,617 12,749
Components of population growth
Per 1,000 inhabitants1985-1990 1990-1995 1995-2000 2000-2005 2005-2010
Total 26.3 24.4 24.4 19.0 15.6Natural increase 24.6 20.6 17.5 14.9 12.2Net migration 1.8 3.8 6.9 4.1 3.4
Foreign-born population
Percentage of the total population Persons (thousands)
2013% change 2013/20101990 2000 2010 2013
13.6 7.9 8.7 8.6 420 -0.8
Remittances Millions of dollars % of GDP
2013% change 2013/20102010 2011 2012 2013
509 530 579 561 1.4 10.2
Macroeconomic indicators
Annual growth in % Average annual growth
2010-2013Level 20132010 2011 2012 2013
Real GDP 5.0 4.5 5.1 3.5 4.5 -GDP/per capita (PPP in constant 2011 international dollars)
3.4 3.0 3.7 2.1 3.0 13,431
Labor market outcomes of emigrants in Europe and the United States
Percentages Men Women Total
2010-2011 2012-2013 2010-2011 2012-2013 2010-2011 2012-2013Participation rate 86.6 86.2 65.1 65.6 75.5 74.8Employment rate 78.9 78.6 54.5 59.5 66.3 68.1Unemployment rate nr nr nr nr 12.1 nr
94 / INTERNATIONAL MIGRATION IN THE AMERICAS SICREMI 2015
DOMINICAN REPUBLICThe Dominican Republic has had a net negative rate of migration in the last few decades.
For the year 2013, the number of permanent and temporary immigrants who arrived in the Dominican Republic was just over 4,000 persons, while in 2012, more than 70,000 Dominicans left to reside outside the country. The foreign born population represented 3.9% of the total population in 2013, above the 1.4% level for the Caribbean region.
The United States is the most important destination country for Dominicans, receiving some 67% of its emigrants, followed by Spain, Chile and Italy. As is the case in several countries of the region, emigration to developed countries has decreased while increasing to other countries of the Latin American and Caribbean region. Since the year 2009, emigration to the United States and Italy has fallen some 14% and 23%, respectively. In the same period, the number of Dominicans who left for Chile increased by a factor of almost eight.
The outcomes of Dominicans in the labor markets of Europe and the United States worsened slightly between 2010 and 2013. Unemployment among Dominicans increased by around half of a percentage point; among women, the increase was more significant, more than 2 percentage points.
The Dominican Republic received 3.3 billion dollars in remittances in 2013, an increase of 5.5% relative to the previous year. Remittances have gradually increased since 2009 and currently are equal to more than 5% of the country’s Gross Domestic Product.
The Dominican Republic received only 11 asylum requests in 2013, from Cuba, Iran and Sri Lanka. There are some 721 refugees residing in the country, mainly from Haiti and Cuba.
In 2013, according to the country’s migration records, the Dominican Republic received 3,293 Dominicans repatriated from the United States. In 2014, a unit to help reintegrate repatriated persons (the “Unidad de Reinserción de Repatriados”) was inaugurated, with the goal of offering support and guidance to repatriated citizens to become socially reintegrated.
A significant percentage of Haitian immigrants who live in the country do not have identity documents from their country of origin. According to the General Immigration Office, only 11,000 Haitian immigrants are legally registered in the country.
In 2011, the Application Decree of the General Law of Migration No. 285-04 (passed in 2004) was approved.35 Among the notable provisions of the decree is the requirement of a five-year period of residence on a temporary permit before a migrant can be considered eligible for permanent residence. Exceptions are investors, pensioners and retirees, all of whom can receive the right of permanent residence upon entry.
In 2013, the Constitutional Court decided that the children of persons in transit, in a strictly legal and migratory sense, may not benefit from jus soli to acquire Dominican nationality.
35 Executive Order No.631-11.
PART II Country Notes / 95
That same year, the National Regularization Plan for foreigners in the Dominican Republic in an irregular situation was established.36 The Plan establishes the basic criteria (foreigner’s time of residence in the country, ties to Dominican society, as well as employment and socio-economic conditions) for regularization, under one of the categories established in the General Law of Migration. In addition, it creates follow-up mechanisms to process the different immigration categories (permanent, temporary or non-immigrant residence), for persons who must comply with this regulation.
Criteria that show ties to Dominican society include: having children born in the country, having studied in the country, knowing how to speak and write in Spanish, having a fixed address, living with a person of Dominican nationality. Applicants must not have a criminal background.
Applicants are deemed to have employment and/or socioeconomic status within the country if they have proof of an educational degree, real estate or personal property, bank accounts or commercial references, employment during the time of stay, or a certified technical occupation.
The foreigner who wishes to be regularised must make a request within a period of 18 months of the National Plan’s enactment. Foreigners who do not do so may choose assisted repatriation, failing which they would be subject to deportation.
The Law of Naturalization was enacted in 2014.37 As a first step, the law establishes: a) a special arrangement for children of non-resident alien parents born in the country during the period from June 16, 1929 to April 18, 2007 but registered at the Dominican Registry using documents not recognized as valid at the time of registration; such children are considered Dominican nationals; b) the registration of children of parents with irregular status born in the Dominican Republic and who were not registered in the Civil Registry.
Under the naturalization law, offspring of foreigners born in the Dominican Republic and regularized in accordance with the provisions of the National Regularization Plan for Foreigners will have the option of being naturalized, once two years have passed since acquiring one of the immigration categories established in the General Law of Migration and they provide a certificate attesting to the absence of a criminal record.
36 Decree N° 327 (2013).37 Law 169-14.
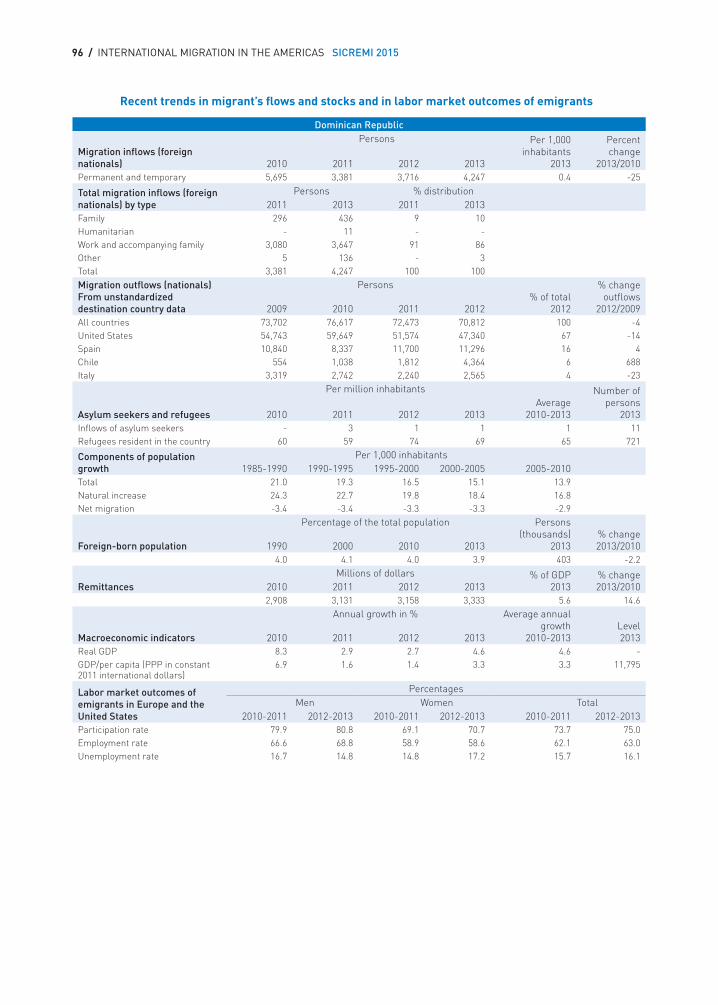
96 / INTERNATIONAL MIGRATION IN THE AMERICAS SICREMI 2015
Recent trends in migrant’s flows and stocks and in labor market outcomes of emigrants
Dominican Republic
Migration inflows (foreign nationals)
Persons Per 1,000 inhabitants
2013
Percent change
2013/20102010 2011 2012 2013Permanent and temporary 5,695 3,381 3,716 4,247 0.4 -25
Total migration inflows (foreign nationals) by type
Persons % distribution2011 2013 2011 2013
Family 296 436 9 10 Humanitarian - 11 - - Work and accompanying family 3,080 3,647 91 86 Other 5 136 - 3 Total 3,381 4,247 100 100 Migration outflows (nationals)From unstandardized destination country data
Persons% of total
2012
% change outflows
2012/20092009 2010 2011 2012All countries 73,702 76,617 72,473 70,812 100 -4United States 54,743 59,649 51,574 47,340 67 -14Spain 10,840 8,337 11,700 11,296 16 4Chile 554 1,038 1,812 4,364 6 688Italy 3,319 2,742 2,240 2,565 4 -23
Asylum seekers and refugees
Per million inhabitants Number of persons
20132010 2011 2012 2013Average
2010-2013Inflows of asylum seekers - 3 1 1 1 11Refugees resident in the country 60 59 74 69 65 721
Components of population growth
Per 1,000 inhabitants1985-1990 1990-1995 1995-2000 2000-2005 2005-2010
Total 21.0 19.3 16.5 15.1 13.9Natural increase 24.3 22.7 19.8 18.4 16.8Net migration -3.4 -3.4 -3.3 -3.3 -2.9
Foreign-born population
Percentage of the total population Persons (thousands)
2013% change 2013/20101990 2000 2010 2013
4.0 4.1 4.0 3.9 403 -2.2
Remittances Millions of dollars % of GDP
2013% change 2013/20102010 2011 2012 2013
2,908 3,131 3,158 3,333 5.6 14.6
Macroeconomic indicators
Annual growth in % Average annual growth
2010-2013Level 20132010 2011 2012 2013
Real GDP 8.3 2.9 2.7 4.6 4.6 -GDP/per capita (PPP in constant 2011 international dollars)
6.9 1.6 1.4 3.3 3.3 11,795
Labor market outcomes of emigrants in Europe and the United States
Percentages Men Women Total
2010-2011 2012-2013 2010-2011 2012-2013 2010-2011 2012-2013Participation rate 79.9 80.8 69.1 70.7 73.7 75.0Employment rate 66.6 68.8 58.9 58.6 62.1 63.0Unemployment rate 16.7 14.8 14.8 17.2 15.7 16.1
PART II Country Notes / 97
ECUADORIn the period from 2011 to 2013, Ecuador received a growing number of immigrants. Relative to 2011, the number of permanent immigrants nearly quintupled while the number of temporary immigrants doubled in the same period. Temporary movements for work-related reasons were 77% of total temporary movements. Family reunification was the motivation for more than 70% of permanent immigrants in 2013 and employment some 23%.
Since the 1990s, the stock of the foreign-born as a percentage of the total population has increased slowly, reaching 2.3% in 2013, larger than the overall percentage of the foreign-born in Latin America and the Caribbean.
During the period 2009-2012, the number of Ecuadorian emigrants fell 31%. The United States, the principal country of destination for Ecuadorians, was the destination for 39% of them in 2012. Nonetheless the percentage of expatriates moving to the United States fell by some 15 points relative to 2009, while movements to the main destination countries in Europe, Spain and Italy fell by more than half between 2009 and 2012.
Unemployment has continued to increase among Ecuadorian emigrants, particularly among women. Since 2010, it increased by 6 percentage points, while among men, the increase was less than half a point. Generally unemployment for men increased substantially in the first years following the financial crisis, while for women it increased after 2010.
In 2013, Ecuador received 966 asylum requests, a number similar to those received in 2012 For the same year, the country was home to 55,860 refugees, most of them citizens of Colombia.38
The inflow of remittances was 2.45 billion dollars in 2013, a slight decrease (0.1%) from the previous year. This change reflects both the slowing down of emigration in recent years as well as the impact of the financial crisis. Although remittances continue to be second among sources of foreign exchange, contributing about 3.5% of GDP, the levels are far below those of 2007, when they represented around 5% of GDP.
On the policy side, a fundamental reform of migration legislation (which dates back to 1970) is underway since October 2013. It is known as the Law of Human Mobility project (“Ley de Movilidad Humana”). The objective is to create a legislative framework that is compatible with the 2008 constitution. The new law will ensure the regulation of the different immigration modalities of entry at the national level and combine more than a dozen regulatory bodies into a single legal body. Above all, it will give immigrants rights-based access to the different development programs in health care, education and job placement, some of which are currently restricted to nationals.
In regards to refugees, the Executive Decree 1182 of 2012, is the new legislation that regulates asylum seeking, according to the provisions of Article 41 of the Constitution of Ecuador. It aims
38 Note that the UNHCR figures differ significantly from these numbers, with 8,280 asylum applications for 2013. The UNHCR figures include initial applications and appeals. Also, the Directorate of Refuge in Ecuador has made adjustments to the numbers provided above based on an update of cases (see text referring to changes in politi-cal refugee application). Additionally, according to UNHCR estimates, the total stock of refugees in Ecuador was 54,789 in 2013 to which UNHCR added 68,344 people in refugee-like situation.
98 / INTERNATIONAL MIGRATION IN THE AMERICAS SICREMI 2015
at responding to applications submitted in a timely manner and ensuring due process, and at identifying those manifestly unfounded, abusive and illegitimate requests. Under this decree, asylum requests must be submitted within 15 days after arrival and appeals within 3 days of the asylum decision.
Recently, in September 2014, the Constitutional Court amended these latter provisions, establishing a 3-month period after entry for asylum requests and a 15-day period for appeals.39
As with other countries of the region, the economic recession in Europe and the United States in recent years has resulted in an increase of returns of nationals living abroad to Ecuador. According to the latest Population Census of 2011, 72,000 Ecuadorians have returned to their homeland. Spanish statistics, however, show departures of almost 150 thousand Ecuadorians from 2002-2013.
The Ecuadorian State has sought to support the re-integration of returning migrants through several programs. The “Welcome Home” Program consists of several initiatives: 1) “Menaje de Casa” (household goods), 2) “Housing Bonus”, 3) Educational, health and social integration, and 4) Orientation for voluntary family return.
“Menaje de Casa” is a national government program that allows returning migrants to bring back tax-free their household goods, working tools and a vehicle Since 2007, according to the National Customs Service, they have handled more than 17,100 cases.
Housing Bonus is a financial aid provided by the national government to migrants and / or their family, as a supplement to buy, build or remodel a house.
The educational, health and social integration initiative and the orientation for voluntary family return initiative provide the necessary institutional support for comprehensive and assisted re-integration of returnees. Through the different departments and local government instances, counseling, legal advice, assistance in health, training and reference information on coordination and services with other state institutions is provided.
In 2011, the Parliament of the Andean Community of Nations (CAN) decided to adhere formally as a group to the Agreement on Residence for Nationals of States Party to Mercosur, plus Chile and Bolivia. Ecuador has ratified the Agreement. The beneficiaries of this visa category in Ecuador are nationals of Argentina, Brazil, Chile, Paraguay, Uruguay, Bolivia, Colombia and Peru. Through this Residency Agreement, the country grants temporary residence to citizens of these countries for two years, after which they may obtain the right of permanent residence.
39 Judgment no. 002-0524.
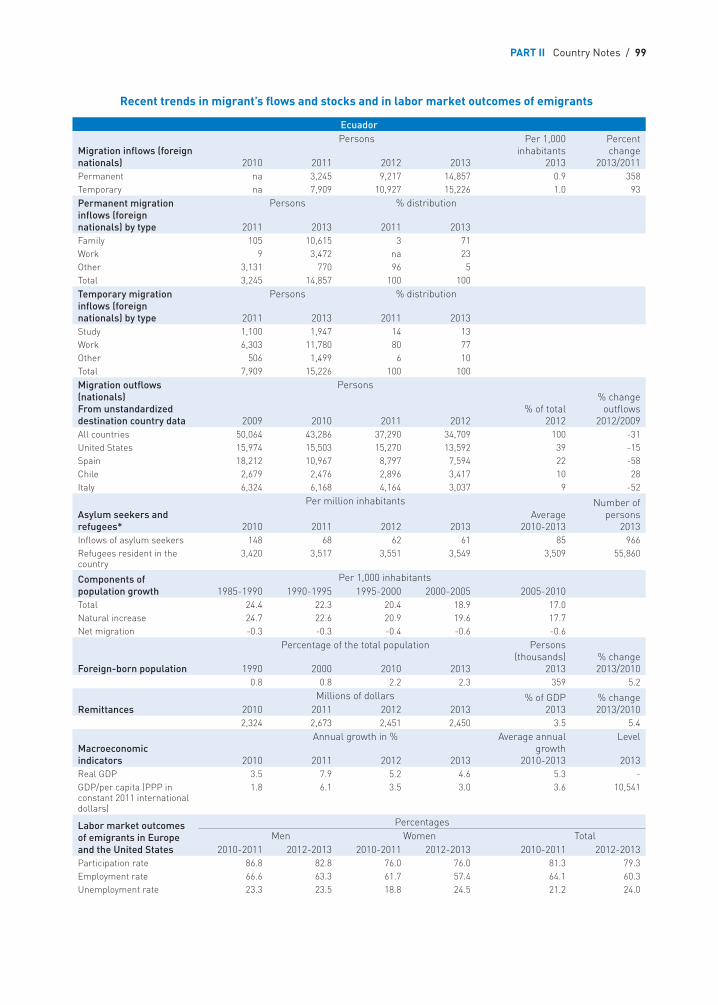
PART II Country Notes / 99
Recent trends in migrant’s flows and stocks and in labor market outcomes of emigrants
Ecuador
Migration inflows (foreign nationals)
Persons Per 1,000 inhabitants
2013
Percent change
2013/20112010 2011 2012 2013Permanent na 3,245 9,217 14,857 0.9 358Temporary na 7,909 10,927 15,226 1.0 93Permanent migration inflows (foreign nationals) by type
Persons % distribution
2011 2013 2011 2013Family 105 10,615 3 71Work 9 3,472 na 23Other 3,131 770 96 5Total 3,245 14,857 100 100Temporary migration inflows (foreign nationals) by type
Persons % distribution
2011 2013 2011 2013Study 1,100 1,947 14 13Work 6,303 11,780 80 77Other 506 1,499 6 10Total 7,909 15,226 100 100Migration outflows (nationals)From unstandardized destination country data
Persons
% of total2012
% change outflows
2012/20092009 2010 2011 2012All countries 50,064 43,286 37,290 34,709 100 -31United States 15,974 15,503 15,270 13,592 39 -15Spain 18,212 10,967 8,797 7,594 22 -58Chile 2,679 2,476 2,896 3,417 10 28Italy 6,324 6,168 4,164 3,037 9 -52
Asylum seekers and refugees*
Per million inhabitants Number of persons
20132010 2011 2012 2013Average
2010-2013Inflows of asylum seekers 148 68 62 61 85 966Refugees resident in the country
3,420 3,517 3,551 3,549 3,509 55,860
Components of population growth
Per 1,000 inhabitants1985-1990 1990-1995 1995-2000 2000-2005 2005-2010
Total 24.4 22.3 20.4 18.9 17.0Natural increase 24.7 22.6 20.9 19.6 17.7Net migration -0.3 -0.3 -0.4 -0.6 -0.6
Foreign-born population
Percentage of the total population Persons (thousands)
2013% change 2013/20101990 2000 2010 2013
0.8 0.8 2.2 2.3 359 5.2
Remittances Millions of dollars % of GDP
2013% change 2013/20102010 2011 2012 2013
2,324 2,673 2,451 2,450 3.5 5.4
Macroeconomic indicators
Annual growth in % Average annual growth
2010-2013
Level
20132010 2011 2012 2013Real GDP 3.5 7.9 5.2 4.6 5.3 -GDP/per capita (PPP in constant 2011 international dollars)
1.8 6.1 3.5 3.0 3.6 10,541
Labor market outcomes of emigrants in Europe and the United States
Percentages Men Women Total
2010-2011 2012-2013 2010-2011 2012-2013 2010-2011 2012-2013Participation rate 86.8 82.8 76.0 76.0 81.3 79.3Employment rate 66.6 63.3 61.7 57.4 64.1 60.3Unemployment rate 23.3 23.5 18.8 24.5 21.2 24.0
100 / INTERNATIONAL MIGRATION IN THE AMERICAS SICREMI 2015
EL SALVADOREl Salvador is among those countries whose immigration flows increased strongly in recent years. Between 2010 and 2013, the flow of permanent immigrants has increased by a factor of almost five. At the same time, it is also among one of the countries with the smallest foreign-born populations relative to its total population. A majority of the foreign-born are from neighboring countries, and they represent less than one percentage point of the total population.
Salvadoran emigration to OECD member countries and Latin America experienced a decrease, of 12%, between 2009 and 2012. Salvadorans go primarily to the United States (77% in 2012). Though the number remains low, Italy has received a growing number of Salvadorans since 2009, with an increase of 50% in 2013 relative to 2009.
There has been a decrease of almost 4 percentage points in the unemployment rate of Salvadorans men abroad from 2010-2011 to 2012-2013, while for women the decline was 1.7 points. The improved economic situation in the United States, where most Salvadorian expatriates live, is responsible for these improved figures.
The number of asylum seekers in El Salvador has remained extremely low, with only 7 requests in 2013, almost all of them from Honduras. By contrast, in the same year, 11,281 Salvadorans requested asylum in different countries of the same hemisphere, mainly in the United States, followed by Mexico, Costa Rica and Canada.
In 2013, El Salvador received nearly 4 billion dollars in remittances, reflecting an increase of 0.7% in comparison to the previous year. Remittances represent almost 17% of the Gross Domestic Product. El Salvador is fourth among countries receiving remittances in Latin America.
Return migration has increased in the country in recent years. Between 2012 and 2013, 64,886 Salvadorans were repatriated by air and land, mainly from the United States and Mexico due to stronger deportation regulations. In 2013, the number of repatriated individuals increased by some almost 16%, and in 2014, the increase was 37%.
El Salvador has implemented programs to assist in returnees’ reintegration into working life in the country as well as for medical, psychological and educational support. These programs include training and workshops in different areas such as cosmetology, styling and computing, among others.
March 2011 saw passage of the Special Law for the Protection and Development of Salvadoran Migrants and Their Families. The law created the National Council for the Protection and Development of Migrants and Their Families (known as CONMIGRANTES). The first meeting of CONMIGRANTES was held in 2012, with the participation of representatives of different State institutions, civil society organizations, universities, micro and small enterprises, and Salvadoran associations abroad. The Council is responsible for the development of the “Strategic Plan for the Protection and Development of the Migrant Individual and Family” which provides legal and financial support in the repatriation process, fosters ties between communities of origin and their diasporas to enhance their contribution to the communities’ development.
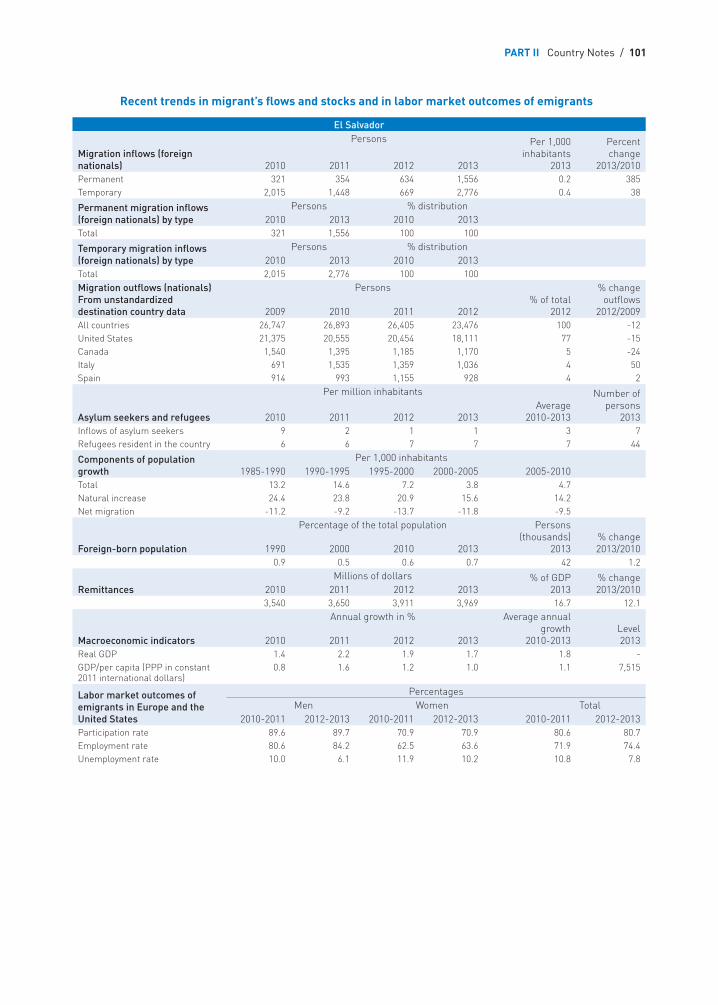
PART II Country Notes / 101
Recent trends in migrant’s flows and stocks and in labor market outcomes of emigrants
El Salvador
Migration inflows (foreign nationals)
Persons Per 1,000 inhabitants
2013
Percent change
2013/20102010 2011 2012 2013Permanent 321 354 634 1,556 0.2 385Temporary 2,015 1,448 669 2,776 0.4 38
Permanent migration inflows (foreign nationals) by type
Persons % distribution2010 2013 2010 2013
Total 321 1,556 100 100
Temporary migration inflows (foreign nationals) by type
Persons % distribution2010 2013 2010 2013
Total 2,015 2,776 100 100 Migration outflows (nationals)From unstandardized destination country data
Persons% of total
2012
% change outflows
2012/20092009 2010 2011 2012All countries 26,747 26,893 26,405 23,476 100 -12United States 21,375 20,555 20,454 18,111 77 -15Canada 1,540 1,395 1,185 1,170 5 -24Italy 691 1,535 1,359 1,036 4 50Spain 914 993 1,155 928 4 2
Asylum seekers and refugees
Per million inhabitants Number of persons
20132010 2011 2012 2013Average
2010-2013Inflows of asylum seekers 9 2 1 1 3 7Refugees resident in the country 6 6 7 7 7 44
Components of population growth
Per 1,000 inhabitants1985-1990 1990-1995 1995-2000 2000-2005 2005-2010
Total 13.2 14.6 7.2 3.8 4.7Natural increase 24.4 23.8 20.9 15.6 14.2Net migration -11.2 -9.2 -13.7 -11.8 -9.5
Foreign-born population
Percentage of the total population Persons (thousands)
2013% change 2013/20101990 2000 2010 2013
0.9 0.5 0.6 0.7 42 1.2
Remittances Millions of dollars % of GDP
2013% change 2013/20102010 2011 2012 2013
3,540 3,650 3,911 3,969 16.7 12.1
Macroeconomic indicators
Annual growth in % Average annual growth
2010-2013Level 20132010 2011 2012 2013
Real GDP 1.4 2.2 1.9 1.7 1.8 -GDP/per capita (PPP in constant 2011 international dollars)
0.8 1.6 1.2 1.0 1.1 7,515
Labor market outcomes of emigrants in Europe and the United States
Percentages Men Women Total
2010-2011 2012-2013 2010-2011 2012-2013 2010-2011 2012-2013Participation rate 89.6 89.7 70.9 70.9 80.6 80.7Employment rate 80.6 84.2 62.5 63.6 71.9 74.4Unemployment rate 10.0 6.1 11.9 10.2 10.8 7.8
102 / INTERNATIONAL MIGRATION IN THE AMERICAS SICREMI 2015
GUATEMALAImmigration in Guatemala has more than doubled since 2010. In 2013, Guatemala received more than a thousand permanent immigrants and double that number of temporary immigrants.
The foreign-born population – of 73,000 – accounted for only 0.5% of the total population of Guatemala in 2013, the same proportion as in the year 2000.
Emigration flows from Guatemala decreased some 8% between 2009 and 2012. In addition, changes were observed in Guatemalans’ main destination countries. While most still went to the United States, movements to Canada have shown a growing trend (22%), while flows to Mexico and Spain have considerably decreased (61% and 21%, respectively).
The total unemployment rate of Guatemalan expatriates decreased slightly from 2010-2011 to 2012-2013, reaching 8.6% from 10.5%, reflecting declines of about the same magnitude among both men and women.
Guatemala is the largest receiver of remittances in Central America at 5.1 billion dollars in 2013. Since 2010, remittances to Guatemala have grown continuously, registering an increase of almost 7% between 2012 and 2013.
Over 50 thousand Guatemalan emigrants to the United States returned in 2013, according to statistics from the General Office of Migration. From Mexico, almost 30 thousand emigrants returned. Altogether these returns showed a marginal increase of less than a percentage point, compared with the year 2012.
The number of asylum requests in Guatemala is very low, at only 48 in 2013, and come mainly from El Salvador, India and Bangladesh. In 2013, the country was home to 160 refugees, mostly from the neighboring countries of Nicaragua, El Salvador and Honduras.
In 2007, the “Agreement on the Creation of the Single Central American Visa for Free Movement of Foreigners among the Republics of El Salvador, Guatemala, Honduras and Nicaragua” was approved.40 It creates the CA-4 visa, allowing stay and free circulation of foreigners for tourist purposes in the territories of the respective states for 90 days.
40 Decree 37-2007.
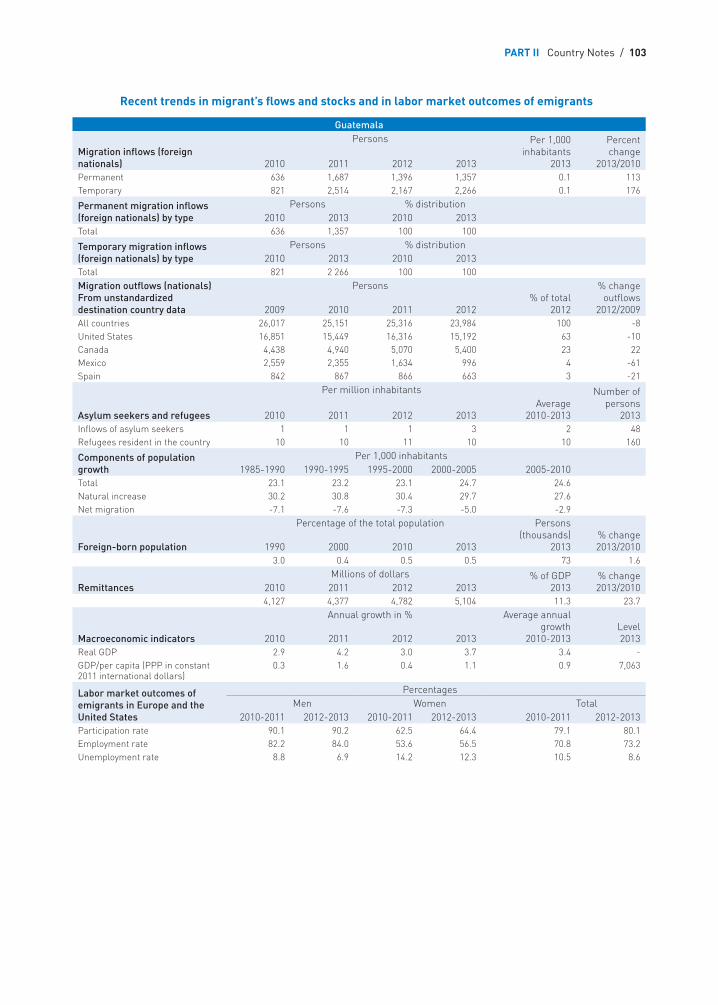
PART II Country Notes / 103
Recent trends in migrant’s flows and stocks and in labor market outcomes of emigrants
Guatemala
Migration inflows (foreign nationals)
Persons Per 1,000 inhabitants
2013
Percent change
2013/20102010 2011 2012 2013Permanent 636 1,687 1,396 1,357 0.1 113Temporary 821 2,514 2,167 2,266 0.1 176
Permanent migration inflows (foreign nationals) by type
Persons % distribution2010 2013 2010 2013
Total 636 1,357 100 100
Temporary migration inflows (foreign nationals) by type
Persons % distribution2010 2013 2010 2013
Total 821 2 266 100 100Migration outflows (nationals) From unstandardized destination country data
Persons% of total
2012
% change outflows
2012/20092009 2010 2011 2012All countries 26,017 25,151 25,316 23,984 100 -8United States 16,851 15,449 16,316 15,192 63 -10Canada 4,438 4,940 5,070 5,400 23 22Mexico 2,559 2,355 1,634 996 4 -61Spain 842 867 866 663 3 -21
Asylum seekers and refugees
Per million inhabitants Number of persons
20132010 2011 2012 2013Average
2010-2013Inflows of asylum seekers 1 1 1 3 2 48Refugees resident in the country 10 10 11 10 10 160
Components of population growth
Per 1,000 inhabitants1985-1990 1990-1995 1995-2000 2000-2005 2005-2010
Total 23.1 23.2 23.1 24.7 24.6Natural increase 30.2 30.8 30.4 29.7 27.6Net migration -7.1 -7.6 -7.3 -5.0 -2.9
Foreign-born population
Percentage of the total population Persons (thousands)
2013% change 2013/20101990 2000 2010 2013
3.0 0.4 0.5 0.5 73 1.6
Remittances Millions of dollars % of GDP
2013% change 2013/20102010 2011 2012 2013
4,127 4,377 4,782 5,104 11.3 23.7
Macroeconomic indicators
Annual growth in % Average annual growth
2010-2013Level20132010 2011 2012 2013
Real GDP 2.9 4.2 3.0 3.7 3.4 -GDP/per capita (PPP in constant 2011 international dollars)
0.3 1.6 0.4 1.1 0.9 7,063
Labor market outcomes of emigrants in Europe and the United States
Percentages Men Women Total
2010-2011 2012-2013 2010-2011 2012-2013 2010-2011 2012-2013Participation rate 90.1 90.2 62.5 64.4 79.1 80.1Employment rate 82.2 84.0 53.6 56.5 70.8 73.2Unemployment rate 8.8 6.9 14.2 12.3 10.5 8.6
104 / INTERNATIONAL MIGRATION IN THE AMERICAS SICREMI 2015
JAMAICA
Overview of the history of international migration
The ethnic composition of the Jamaican population is linked to the nation’s socio-economic history and has its roots deeply embedded in slavery and colonization. The first inhabitants were the Amerindians (Arawaks and Tainos). However, with the arrival of the Spaniards in 1494, the aboriginal population strongly decreased. In 1655, the English occupied the island. Apart from the presence of the British, immigrants from China, India and West Africa provided labor for the mercantile trade and sugar production sectors during the 17th to early 20th centuries (Thomas-Hope et al., 2009). Sugar cane was grown in plantations on the island through a system which was underpinned by the institution of slavery. Jamaica remained a British colony until it gained independence on August 6, 1962. Since independence, there has been a shift in migration patterns. Formerly an immigration country before independence, albeit in a limited way, Jamaica began losing population to emigration, with persons emigrating to destinations such as the United States of America (USA), Canada and the United Kingdom (UK), in search of greater job opportunities and the promise of a better standard of living.
Immigration
Immigration to Jamaica has been limited. Data during the years 1953 and 1955 classified immigrants into six categories according to motive: 1) Employment, 2) Study, 3) Medical Aid, 4) Holiday, 5) Business, and 6) Other. The majority of immigrants were in the Employment category and were mostly men from the United States (576), followed by the United Kingdom (558) and Canada (192). Most were professionals. Immigrants receiving work permits increased almost three times as fast as the overall labor force during this period, and men contributed most to this rapid increase (IOM, 2010). The spouses of male professionals, accounted for one third of immigrating women during this time (Roberts and Mills, 1958).
Data on the immigration of non-nationals, a category which includes Commonwealth Citizens and nationals of other countries (Aliens) has been collected on a regular basis since 1970 and the publication of aggregate data concerning this category commenced in 1998 (Thomas-Hope, 2004).
The immigration of Commonwealth Citizens and Aliens has gradually increased due in part to the revised Treaty of Chaguaramas which gave rise to the Caribbean Community (CARICOM) Single Market and Economy (CSME) and allowed for the free movement of persons within CARICOM. The treaty provides for and encourages the intra-regional movement of skilled community nationals and service providers to conduct economic activities in any CARICOM member state. More recently, increases in immigration can be attributed to the 2008 global recession, which created a further influx of Caribbean nationals to Jamaica as workers sought non-traditional job markets for employment.
The foreign-born population constituted less than 1.0% of the total population by 2011. The total foreign born population recorded for the 2011 census was 23,477, 7% below the count of 2001. Immigrants are usually highly educated (technicians, professionals and senior technicians) and
PART II Country Notes / 105
tend to be on short-term work permits. The data collected does not make it possible to determine if the permits are renewed or if short-term stays are the rule (IOM 2010).
Immigration has occurred in part because of skill shortages within certain sectors, such as the health sector, with nurses being recruited from Cuba and Nigeria to fill these vacancies. Additionally, the devastating 2010 earthquake in Haiti resulted in an influx of refugees from that country fleeing the resulting poverty and civil unrest.
Emigration
International migration has been a significant component of the historical and indeed contemporary experience of most Jamaicans. During the late 19th century into the early 20th century, emigration was a dominant feature of the country. Many Jamaicans migrated to Panama and other countries of Central America as well as Cuba. They provided labor for, among other things, the construction of the Panama Canal; the development of the trans-Isthmian railway; the plantation operations of the United Fruit Company; and the expansion of sugar production (Thomas-Hope, 2009).
The postwar flow of Caribbean immigrants to the United States, however, was limited with the passage in 1952 of the Immigration and Nationality Act, also known as the McCarran-Walter Act. This bill drastically reduced the numbers of Caribbean farm workers allowed to enter the United States, a situation that persisted until the passage of the 1965 immigration liberalization law.
Until that year, migration movements were largely towards Britain, which received approximately 300,000 Caribbean immigrants between 1948 and 1966 (African-American Migration Experience, Schomburg Center, 2005). A large number of skilled, semi-skilled and unskilled laborers were hired to work in hospitals and within the industry and transport sectors, especially during the United Kingdom’s postwar reconstruction efforts. With the implementation of restrictive immigration policies in the United Kingdom in 1962, however, a change in the selection pattern of immigrants has favored skilled laborers as opposed to immigrants selected on the basis of labor needs for reconstruction.
Amendments in Canada and United States legislation, in 1962 and 1965 respectively, stipulated that foreigners were to be allowed into these countries based on occupational and educational criteria in order to meet local labor market demand (Thomas-Hope et al., 2009).
These changes in legislation caused a reduction in the movement of Jamaicans to the United Kingdom and Western Europe but increased their movement to the United States and Canada.
Over the last four decades, the total number of emigrants to the United States has accounted for 77% of all emigrants from Jamaica while emigrants to Canada and the United Kingdom over the same period represented 17.3% and 5.7%, respectively, of all emigrants.
Data for the United States and Canada reveal that since 1970 more than 50% of all emigrants from Jamaica were women, usually of working age, 18-44 years of age in the United States and 25-44 in Canada (Thomas-Hope, 2004; PIOJ, 2014). Most of the emigrant women were nurses and teachers, for which there was a high demand in the United States and Canada, which offer better opportunities than Jamaica.
106 / INTERNATIONAL MIGRATION IN THE AMERICAS SICREMI 2015
This history of emigration has created a large Jamaican diaspora which is similar in size to the current Jamaican population (almost 3 million). Data on Jamaicans with permanent resident status in the United States indicate that the majority of Jamaicans reside in the New York and New Jersey Metropolitan areas and in Miami and Fort Lauderdale in Florida (IOM 2010). In Canada, Jamaican migrants are concentrated in Toronto and other cities of Ontario (IOM 2010), while in the United Kingdom they are located mainly in the Midlands and London.
Legal Framework Governing International Migration
The framework governing international migration in Jamaica is based on several pieces of legislation including:
■ The Jamaican Constitution ■ The Foreign Recruiting Act (1875) ■ The Emigrants Protection Act (1925) ■ The Recruiting of Workers Act (1940) ■ The Deportation (Commonwealth Citizens) Act (1942) ■ The Immigration Restriction (Commonwealth Citizens) Act (1945) ■ The Aliens Act (1946) ■ The Employment Agencies Regulations Act (1957) ■ The Criminal Justice Act (1960) ■ The Foreign Nationals and Commonwealth Citizens (Employment) Act or Work Permit Act
(1964) ■ The Passport Act ■ The Nationality Act ■ The Caribbean Community (CARICOM) Free Movement of Persons Act (1997) ■ The Child Care and Protection Act (2004) ■ The Trafficking in Persons (Prevention, Suppression and Punishment) Act (2007)
These Acts include all legislation which affect immigration, the granting of passports and the control of movements of non-Jamaicans who enter and remain in the country. These Acts also provide the general framework for border management and security in Jamaica.
Based on the Foreign Nationals and Commonwealth Citizens (Employment) Act or Work Permit Act (1964), employers can recruit workers from abroad to meet local labor market needs. The Act stipulates criteria for determining whether a person upon entry into Jamaica should be granted a stay of six months or less, landed status or a work permit.
Regulations Governing Entry and Stay
The general requirements for entry into Jamaica are: a passport with at least 6 months validity; a return ticket to the country of residence; an entry visa (where applicable); proof of financial support for the duration of the stay; and a completed Immigration card. There are two broad groups who qualify for entry and stay:
■ Jamaican passport holders – (Returning Residents and Returning Residents on a Visit)
PART II Country Notes / 107
■ Non-Jamaican passport holders – Visitors; Workers (Work Permit Holders and Work Permit Exemption Holders); Students; Persons with a Marriage Exemption; Dependents; Persons accepted for Permanent Residence or Unconditional Landing.
Permit durations and restrictions depend on the category of entry:
■ Permanent residents (this includes retired persons who have attained the age of retirement in Jamaica and can satisfactorily demonstrate their means of subsistence) – up to 24 months
■ Persons on work permits – 3 months, 1 year, 3 years ■ Students – the duration of the study program ■ Marriage exemption certificate holders – The endorsement granted in this case is renewable
every three years for men and indefinite for women.
Persons seeking to obtain a work permit are required to make an application to the Ministry of Labor and Social Security through their prospective employer or contractor, Trade and Investment Jamaica (JAMPRO, for investors), or through legal representatives. Categories of persons eligible for receiving exemptions from work permits are outlined in the Act. In cases where there is no intention to work but the applicant wishes to remain in the country for a period in excess of six months, landed status may be granted by the Ministry of National Security. Any other person may remain as a visitor, up to a maximum of six months at any one time, subject to being in possession of a Jamaican visa in those cases where the individual is a citizen of a country to which the visa requirement applies. These regulations reflect a general strategy to manage national borders while denying permission to remain in the country to any person who falls outside the guidelines governing entry related to work or visitor status.
Under the CSME Free Movement Initiative, university graduates and other designated categories of workers are permitted to move and work throughout the region. This freedom of movement is granted through a Certificate of Recognition of CARICOM Skills Qualification offered by the Ministry of Labor and Social Security. This certificate replaces the Work Permit for CARICOM nationals.
The exit regulations of the country require a completed Immigration Card, a valid passport, the applicable visas and permits for the country of destination.
Acquisition of Nationality and Citizenship
In the Jamaican context, the terms nationality and citizenship are used interchangeably. Under Chapter 2 of the Jamaican Constitution, persons born in Jamaica and persons born outside Jamaica to Jamaican parents have an automatic right to Jamaican citizenship. Women who have married Jamaican men and former citizens of the United Kingdom and its colonies who have become naturalized or registered as British subjects in Jamaica can also register as Jamaican citizens. The Jamaican Parliament is given power in the Constitution to make further provision for the acquisition, deprivation and renunciation of citizenship. The Governor-General is given power to deprive of Jamaican citizenship those Jamaican citizens who acquire citizenship or the rights of citizenship of another country.
According to Section 3 of the Nationality Act, a citizen of any country mentioned in the First Schedule, or a citizen of the Republic of Ireland, of full age and capacity, may be registered at the discretion of the Minister as a citizen of Jamaica if he/she is:
108 / INTERNATIONAL MIGRATION IN THE AMERICAS SICREMI 2015
■ ordinarily a resident in Jamaica ■ in Crown service under the Government of Jamaica ■ partly the one and partly the other, for the period of five years ending with the date of his
application, or such shorter period ending as the Minister may in the special circumstances of any case accept.
Jamaican citizenship may be granted to persons on the following basis as outlined in the Jamaican Nationality Act and Chapter 2 of the Jamaican Constitution:
■ Descent ■ Marriage ■ Naturalization (non-Commonwealth Citizens) ■ Registration (Commonwealth Citizens) ■ Registration (Minors) ■ Cases of doubt (whether on a question of fact or law or based on a certification that a person is
now a citizen of Jamaica)
Data provided by the Immigration Section of the Passport, Immigration and Citizenship Agency (PICA) indicated that 1,493 foreigners were granted Jamaican citizenship between 2006 and 2010 (IOM, 2010)
Irregular Migration
Most irregular immigrants in Jamaica entered the country legally and were officially authorized to stay based on their purpose of visit, but stayed beyond the duration of their permit. There is no information regarding any estimates of irregular immigrants in Jamaica. However, as the law now stands, any immigrant who remains in Jamaica beyond their authorized period is subject to deportation by the Immigration Section of the Passport, Immigration and Citizenship Agency.
Refugees and Complementary Protection
Jamaica has signed and is party to the 1951 Convention Relating to the Status of Refugees (the Convention) and the 1967 Protocol Relating to the Status of Refugees (The Protocol).
The Ministry of National Security has recently adopted a Refugee Policy (2009) to ensure its compliance with and meeting the obligations of the Convention and Protocol. It also has established the procedures for managing the determination of refugee status.
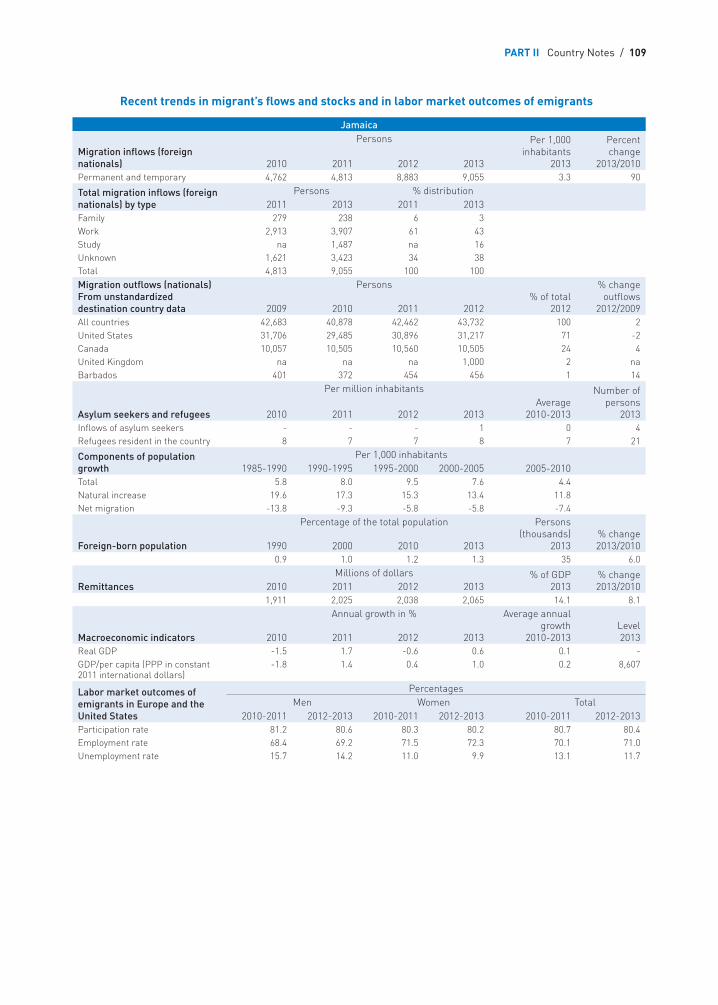
PART II Country Notes / 109
Recent trends in migrant’s flows and stocks and in labor market outcomes of emigrants
Jamaica
Migration inflows (foreign nationals)
Persons Per 1,000 inhabitants
2013
Percent change
2013/20102010 2011 2012 2013Permanent and temporary 4,762 4,813 8,883 9,055 3.3 90
Total migration inflows (foreign nationals) by type
Persons % distribution2011 2013 2011 2013
Family 279 238 6 3Work 2,913 3,907 61 43Study na 1,487 na 16Unknown 1,621 3,423 34 38Total 4,813 9,055 100 100Migration outflows (nationals)From unstandardized destination country data
Persons% of total
2012
% change outflows
2012/20092009 2010 2011 2012All countries 42,683 40,878 42,462 43,732 100 2United States 31,706 29,485 30,896 31,217 71 -2Canada 10,057 10,505 10,560 10,505 24 4United Kingdom na na na 1,000 2 naBarbados 401 372 454 456 1 14
Asylum seekers and refugees
Per million inhabitants Number of persons
20132010 2011 2012 2013Average
2010-2013Inflows of asylum seekers - - - 1 0 4Refugees resident in the country 8 7 7 8 7 21
Components of population growth
Per 1,000 inhabitants1985-1990 1990-1995 1995-2000 2000-2005 2005-2010
Total 5.8 8.0 9.5 7.6 4.4Natural increase 19.6 17.3 15.3 13.4 11.8Net migration -13.8 -9.3 -5.8 -5.8 -7.4
Foreign-born population
Percentage of the total population Persons (thousands)
2013% change 2013/20101990 2000 2010 2013
0.9 1.0 1.2 1.3 35 6.0
Remittances Millions of dollars % of GDP
2013% change 2013/20102010 2011 2012 2013
1,911 2,025 2,038 2,065 14.1 8.1
Macroeconomic indicators
Annual growth in % Average annual growth
2010-2013Level 20132010 2011 2012 2013
Real GDP -1.5 1.7 -0.6 0.6 0.1 -GDP/per capita (PPP in constant 2011 international dollars)
-1.8 1.4 0.4 1.0 0.2 8,607
Labor market outcomes of emigrants in Europe and the United States
Percentages Men Women Total
2010-2011 2012-2013 2010-2011 2012-2013 2010-2011 2012-2013Participation rate 81.2 80.6 80.3 80.2 80.7 80.4Employment rate 68.4 69.2 71.5 72.3 70.1 71.0Unemployment rate 15.7 14.2 11.0 9.9 13.1 11.7
110 / INTERNATIONAL MIGRATION IN THE AMERICAS SICREMI 2015
Bibliography
African-American Migration Experience (In Motion), 2005. Schomburg Center for Research in Black Culture. New York Public Library. Accessed online (2015) through <http://www.inmotionaame.org/home.cfm>.
IOM 2010. Migration in Jamaica: A Country Profile, International Organisation for Migration, Geneva.
Ministry of Foreign Affairs and Foreign Trade, 2014. Draft National Diaspora Policy.
Ministry of Foreign Affairs and Foreign Trade. Information Booklet for Returning Residents.
Planning Institute of Jamaica, 2014. Draft National Policy on International Migration and Development.
Thomas-Hope, Elizabeth et. al., 2009. Development on the Move: Measuring and Optimising Migration’s Economic and Social Impacts. A Study of Migration’s Impacts on Development in Jamaica and how Policy Might Respond. June 2009: Global Development Network and Institute for Public Policy Research.
www.pica.gov.jm
International Organization for Migration. Migration for Development: A Bottom-Up Approach, A Handbook for Practitioners and Policymakers. <http://www.globalmigrationgroup.org/sites/default/files/uploads/UNCT_Corner/theme7/jmdi_august_2011_handbook_migration_for_development.pdf> (accessed May 25, 2014).
International Organization for Migration [IOM] [2012]. Migration in Jamaica: A Country Profile 2010.
Planning Institute of Jamaica. “Population.” In Economic and Social Survey of Jamaica 2013, Kingston: PIOJ, 2014.
Roberts, G.W., and D.O. Mills. Study of External Migration Affecting Jamaica; 1953-1955. Catholic University of America Libraries. Washington D.C. Institute of Social and Economic Research. University College of the West Indies, Jamaica, British West Indies, 1958.
Statistical Institute of Jamaica. Population and Housing Census 2011, Jamaica Volume 5, Kingston, STATIN 2013.
Thomas-Hope, Elizabeth. Migration Situation Analysis, Policy and Programme Needs for Jamaica, Prepared for the United Nations Population Fund through The Planning Office of Jamaica.
PART II Country Notes / 111
MEXICOThough Mexico continues to be characterized by high levels of emigration and in the last two decades has been more and more a transit country for migrants travelling to the United States, immigration has increased significantly in recent years. In 2013, Mexico saw more than 60,700 permanent immigrants enter the country, almost three times the average of the three previous years. Although temporary migration has decreased, particularly in comparison to 2012, total immigrants to the country in 2013 were some 65% higher than the previous year.
The foreign-born population has grown somewhat in recent years but continued to be less than one percent of the total population in 2013.
Regular migration of Mexicans to the United States has continued to increase and in 2012 was 13% greater than in 2010. At the same time, estimates of irregular immigration show important decreases in the number of Mexicans entering the United States since the economic crisis, with a decline of approximately one million in total between 2007 and 2012, according to estimates from the Pew Hispanic Centre.41
The recovery of the economy of the United States is undoubtedly related to the positive results of the labor market outcomes for Mexican migrants observed in OECD countries in general, considering that more than 85% of Mexican emigrants reside in the United States. The unemployment rate for Mexican workers in the United States and Europe declined around 2 percentage points from 2010-2011 to 2012-2013, with falls recorded for both men and women.
Between 2012 and 2013, Mexico saw an increase of 60% in the number of asylum requests, with 1,296 requests recorded in 2013. Most petitioners were from Honduras, El Salvador and Cuba. In the same year, 1,831 refugees lived in Mexico, most of them of Salvadoran, Guatemalan and Honduran origin.
Mexico continues to be the largest recipient of remittances in all of Latin America, in absolute terms, with 21.6 billion dollars being remitted in 2013 (approximately 2% of Gross Domestic Product), almost all from the United States. Nevertheless, the amount of remittances actually declined relative to 2012, by about -3.8%.
The current government administration’s 2013-2018 National Development Plan includes a Special Migration Program 2014-2018. The program’s state aim is to promote an integral, inter-sectorial, participative immigration policy based on promoting human rights, sustainable development, gender, interculturality and human security.
From 2008 to 2013, more than 16,000 Mexicans have left Spain and returned to Mexico, according to the Spanish National Statistics Institute. Between 2010 and 2013, more than 1.5 million Mexican migrants have been repatriated by the authorities of the United States, according to Mexican government figures. Since 2014, the government, through the National Migration Institute, has implemented the “We Are Mexican” initiative (“Somos Mexicanos”), which widens the reach of the Human Repatriation Programme, implemented since 2007. The program seeks to serve the
41 Unauthorized Immigrant Population Trends for States, Birth Countries and Regions, Pew Hispanic Centre, De-cember 2014.
112 / INTERNATIONAL MIGRATION IN THE AMERICAS SICREMI 2015
immediate needs of repatriated nationals, providing them with information, orientation, food, shelter, medical assistance, telephone calls to relatives, relocation and ease of return to their communities of origin as well as employment and social integration.
The Paisano Program, established in 1989, is a program which supports Mexican migrants who temporarily visit the country to address the information needs during their entry into, transfer through or exit from Mexico. Paisano facilitates administrative migratory processing and provides information on customs regulations, the importation of vehicles, health and sanitary regulations as well as on obtaining, renewing and authenticate documents in consulates abroad.
Beginning in 2014, the government of Mexico launched the Southern Border Programme (“Frontera Sur”), which seeks to deliver Border Worker and Regional Visitor cards to citizens of Guatemala and Belize with the objective of regularizing border crossings into the country. In addition to interinstitutional actions for the protection of migrants, it also seeks to combat organized crime, prevent social crime and facilitate access to public and social services.
In November 2012, in the framework of the Pacific Alliance, Mexico announced the abolition of visas previously necessary for Colombian and Peruvian nationals to enter its territory. Under this new regulation, Colombians and Peruvians may enter and stay in Mexico for up to six months without visas, provided that the activities they conduct are non-remunerative, such as tourism, transit or business.
From May 2013, citizens of Brazil visiting the country for the same purposes (tourism, transit or business) are also exempt from any visa requirement.
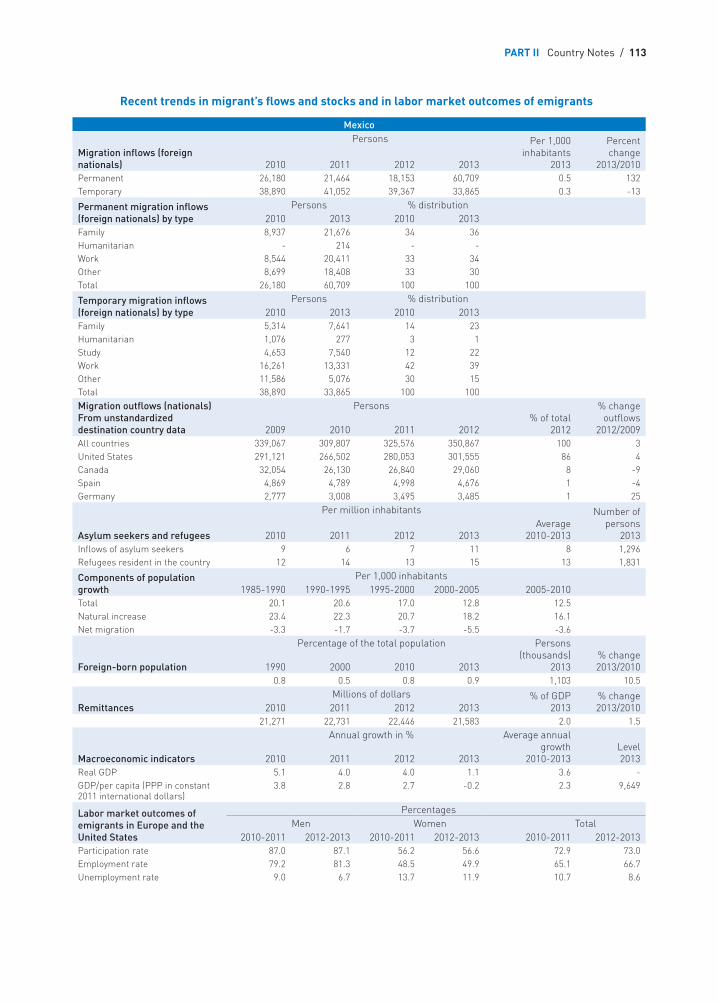
PART II Country Notes / 113
Recent trends in migrant’s flows and stocks and in labor market outcomes of emigrants
Mexico
Migration inflows (foreign nationals)
Persons Per 1,000 inhabitants
2013
Percent change
2013/20102010 2011 2012 2013Permanent 26,180 21,464 18,153 60,709 0.5 132Temporary 38,890 41,052 39,367 33,865 0.3 -13
Permanent migration inflows (foreign nationals) by type
Persons % distribution2010 2013 2010 2013
Family 8,937 21,676 34 36Humanitarian - 214 - -Work 8,544 20,411 33 34Other 8,699 18,408 33 30Total 26,180 60,709 100 100
Temporary migration inflows (foreign nationals) by type
Persons % distribution2010 2013 2010 2013
Family 5,314 7,641 14 23Humanitarian 1,076 277 3 1Study 4,653 7,540 12 22Work 16,261 13,331 42 39Other 11,586 5,076 30 15Total 38,890 33,865 100 100Migration outflows (nationals)From unstandardized destination country data
Persons% of total
2012
% change outflows
2012/20092009 2010 2011 2012All countries 339,067 309,807 325,576 350,867 100 3United States 291,121 266,502 280,053 301,555 86 4Canada 32,054 26,130 26,840 29,060 8 -9Spain 4,869 4,789 4,998 4,676 1 -4Germany 2,777 3,008 3,495 3,485 1 25
Asylum seekers and refugees
Per million inhabitants Number of persons
20132010 2011 2012 2013Average
2010-2013Inflows of asylum seekers 9 6 7 11 8 1,296Refugees resident in the country 12 14 13 15 13 1,831
Components of population growth
Per 1,000 inhabitants1985-1990 1990-1995 1995-2000 2000-2005 2005-2010
Total 20.1 20.6 17.0 12.8 12.5Natural increase 23.4 22.3 20.7 18.2 16.1Net migration -3.3 -1.7 -3.7 -5.5 -3.6
Foreign-born population
Percentage of the total population Persons (thousands)
2013% change 2013/20101990 2000 2010 2013
0.8 0.5 0.8 0.9 1,103 10.5
Remittances Millions of dollars % of GDP
2013% change 2013/20102010 2011 2012 2013
21,271 22,731 22,446 21,583 2.0 1.5
Macroeconomic indicators
Annual growth in % Average annual growth
2010-2013Level 20132010 2011 2012 2013
Real GDP 5.1 4.0 4.0 1.1 3.6 -GDP/per capita (PPP in constant 2011 international dollars)
3.8 2.8 2.7 -0.2 2.3 9,649
Labor market outcomes of emigrants in Europe and the United States
Percentages Men Women Total
2010-2011 2012-2013 2010-2011 2012-2013 2010-2011 2012-2013Participation rate 87.0 87.1 56.2 56.6 72.9 73.0Employment rate 79.2 81.3 48.5 49.9 65.1 66.7Unemployment rate 9.0 6.7 13.7 11.9 10.7 8.6
114 / INTERNATIONAL MIGRATION IN THE AMERICAS SICREMI 2015
PANAMAFrom 2010 to 2013, permanent immigration to Panama has increased over 60%.
The percentage of the foreign-born among the total population in Panama has risen continuously in recent decades, from 2.5% in 1990 to 4.1% in 2013.
By contrast, Panamanian emigration has declined steadily. Between 2009 and 2012, recorded outflows showed a decrease of more than a fifth. The United States, Spain, Chile and Mexico are the main countries of destination for Panamanian nationals, the United States predominating with more than 60% of emigrants.
The situation of Panamanians in the labor market of OECD countries has improved in recent years. Though the rate of participation has increased only slightly from 2010-2011 to 2012-2013, the rate of employment went up 3.2 percentage points.
For the year 2013, Panama received 827 asylum requests – mainly from Colombia, Cuba and Ghana – while between 2006 and 2010, the average number of requests was 388. In the same year (2013), the country was home to 2665 refugees, a majority of them from Colombia, followed by Cuba, El Salvador and Nicaragua.
Also in 2013, Panama received 794 million dollars in remittances, representing approximately 3% of the Gross Domestic Product (GDP). In comparison with 2012, the rate of growth of remittances was 9.2%.
According to statistics available from the General Administration of Financial Enterprises of the Ministry of Commerce and Industry, remittances to foreign countries have increased some 16%, reaching 374 million dollars in 2013. The main countries receiving these remittances are: Colombia, China, United States, Nicaragua and Dominican Republic, while incoming remittances are mainly from the United States, Colombia and Costa Rica.
In the year 2010, Panama began a regularization of immigrants through a programme known as “Panamá Crisol de Razas.” From 2010 to 2014, the government approved approximately 60,000 provisional legal stay permits for irregular migrants, according to figures from the National Immigration Service of the country’s Ministry of Public Safety. Colombian nationals top the number of regularized migrants, followed by Nicaraguans, Dominicans and Venezuelans. In 2012, a series of Executive Orders was approved which change the regulations concerning entry and stay in the country, facilitating access for tourists, temporary workers and foreigners who wish to remain in the country. Tourists from more than 40 countries are exempt from visa requirements, and temporary workers with a work contract now face relaxed visa requirements. In addition, provisions for granting permanent residence were introduced for professionals, nationals of specific countries that have friendly relations with Panama, and parents of Panamanian children.
With the aim of repealing “Crisol de Razas”, among other reasons, a draft bill was introduced for discussion in 2014. Under the draft bill, immigrants must communicate any change of residence to the Registry of Aliens within a one-month period. Failure to do so may lead to the cancelation of the right of residence. In addition, the draft bill proposes the establishment of a roundtable to discuss

PART II Country Notes / 115
the creation of a new Immigration Code to replace current immigration law. Lastly, the draft bill proposes the repeal of Executive Order 107, of 2011, which regulated work permits to foreigners with a temporary residence permit. The National Assembly of Panama has recently (2014) approved the bill.
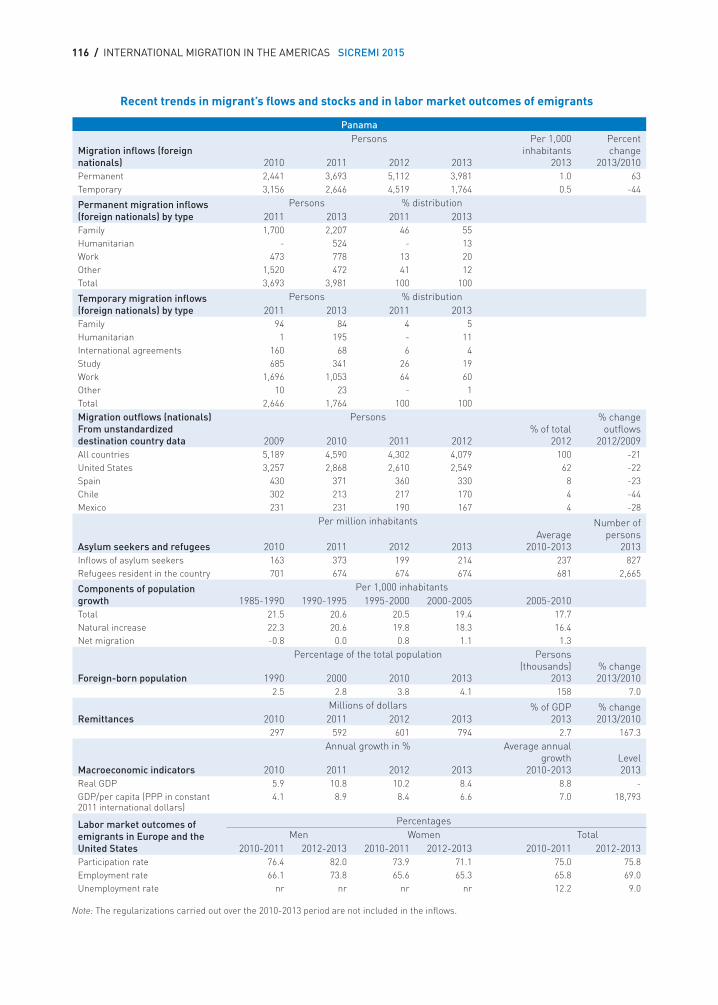
116 / INTERNATIONAL MIGRATION IN THE AMERICAS SICREMI 2015
Recent trends in migrant’s flows and stocks and in labor market outcomes of emigrants
Panama
Migration inflows (foreign nationals)
Persons Per 1,000 inhabitants
2013
Percent change
2013/20102010 2011 2012 2013Permanent 2,441 3,693 5,112 3,981 1.0 63Temporary 3,156 2,646 4,519 1,764 0.5 -44
Permanent migration inflows (foreign nationals) by type
Persons % distribution2011 2013 2011 2013
Family 1,700 2,207 46 55 Humanitarian - 524 - 13 Work 473 778 13 20 Other 1,520 472 41 12 Total 3,693 3,981 100 100
Temporary migration inflows (foreign nationals) by type
Persons % distribution2011 2013 2011 2013
Family 94 84 4 5 Humanitarian 1 195 - 11 International agreements 160 68 6 4 Study 685 341 26 19 Work 1,696 1,053 64 60 Other 10 23 - 1 Total 2,646 1,764 100 100 Migration outflows (nationals)From unstandardized destination country data
Persons% of total
2012
% change outflows
2012/20092009 2010 2011 2012All countries 5,189 4,590 4,302 4,079 100 -21United States 3,257 2,868 2,610 2,549 62 -22Spain 430 371 360 330 8 -23Chile 302 213 217 170 4 -44Mexico 231 231 190 167 4 -28
Asylum seekers and refugees
Per million inhabitants Number of persons
20132010 2011 2012 2013Average
2010-2013Inflows of asylum seekers 163 373 199 214 237 827Refugees resident in the country 701 674 674 674 681 2,665
Components of population growth
Per 1,000 inhabitants1985-1990 1990-1995 1995-2000 2000-2005 2005-2010
Total 21.5 20.6 20.5 19.4 17.7Natural increase 22.3 20.6 19.8 18.3 16.4Net migration -0.8 0.0 0.8 1.1 1.3
Foreign-born population
Percentage of the total population Persons (thousands)
2013% change 2013/20101990 2000 2010 2013
2.5 2.8 3.8 4.1 158 7.0
Remittances Millions of dollars % of GDP
2013% change 2013/20102010 2011 2012 2013
297 592 601 794 2.7 167.3
Macroeconomic indicators
Annual growth in % Average annual growth
2010-2013Level 20132010 2011 2012 2013
Real GDP 5.9 10.8 10.2 8.4 8.8 -GDP/per capita (PPP in constant 2011 international dollars)
4.1 8.9 8.4 6.6 7.0 18,793
Labor market outcomes of emigrants in Europe and the United States
Percentages Men Women Total
2010-2011 2012-2013 2010-2011 2012-2013 2010-2011 2012-2013Participation rate 76.4 82.0 73.9 71.1 75.0 75.8Employment rate 66.1 73.8 65.6 65.3 65.8 69.0Unemployment rate nr nr nr nr 12.2 9.0
Note: The regularizations carried out over the 2010-2013 period are not included in the inflows.
PART II Country Notes / 117
PARAGUAYImmigration in Paraguay is characterised by a very high percentage of permanent immigrants, over 85% on average from 2008 to 2013. This is about double the percentage one finds on average for countries of the Americas.
Between 2009 and 2012, outflows of Paraguayan emigrants towards OECD member countries and Latin America increased some 30%. Most Paraguayan emigrants went to neighboring Argentina, which received 92% of them in 2012. Since 2009, the number of Paraguayans who emigrated to Bolivia has increased by more than 250%.
In the period covered by the report, Paraguay has received very few asylum requests. In the year 2013, only 3 requests were received, and in the previous year, 10 requests were submitted. There were 136 refugees residing in the country in 2013.
The labor market situation of Paraguayans in the United States and Europe has suffered significant changes from 2010-2011 to 2012-2013. While employment decreased by almost 20 percentage points for men, women’s employment saw an increase, albeit small, of almost 2.5 percentage points.
Paraguay received 743 million dollars in remittances in 2013, a figure 12.5% lower than the amount received the previous year. This is the largest reduction in remittances among Latin American countries since 2012.
With the economic crisis in Europe, many Latin Americans have undertaken to return to their home countries, and Paraguayans are no exception. The Organisation of Ibero-American States, jointly with the European Return Fund, has put in place “one-stop shops” for returnees in Latin American countries. These are intended to facilitate re-integration into the origin country by providing psychosocial, educational and employment services in a single physical location, supported by state and/or private-sector resources.
The Paraguayan immigration law dates back to 1996 and is currently under review, with proposed reforms expected shortly. The Directorate-General for Immigration was reorganized in 2013 and its functions clarified.42 It is responsible for granting residence, permanent or temporary, to foreign citizens; processing changes of residence status (to permanent) for foreigners who are non-residents or temporary residents and wish to stay on; monitoring the registration and control of entries and departures of nationals and foreigners to and from the country; and managing procedures related to the regularization of irregular immigrants, when appropriate.
Within the framework of the Agreement on Residence for Nationals of States Party to Mercosur and the Agreement on Internal Regularization of Citizens of Mercosur, the government of Paraguay has conducted “regularization days”, offering processing services and delivery of temporary residence cards to foreigners native to Mercosur countries who reside and/or study in Paraguay and are in a situation of irregular stay. The most recent such day was in November 2014.
42 Decree Number 11.539.
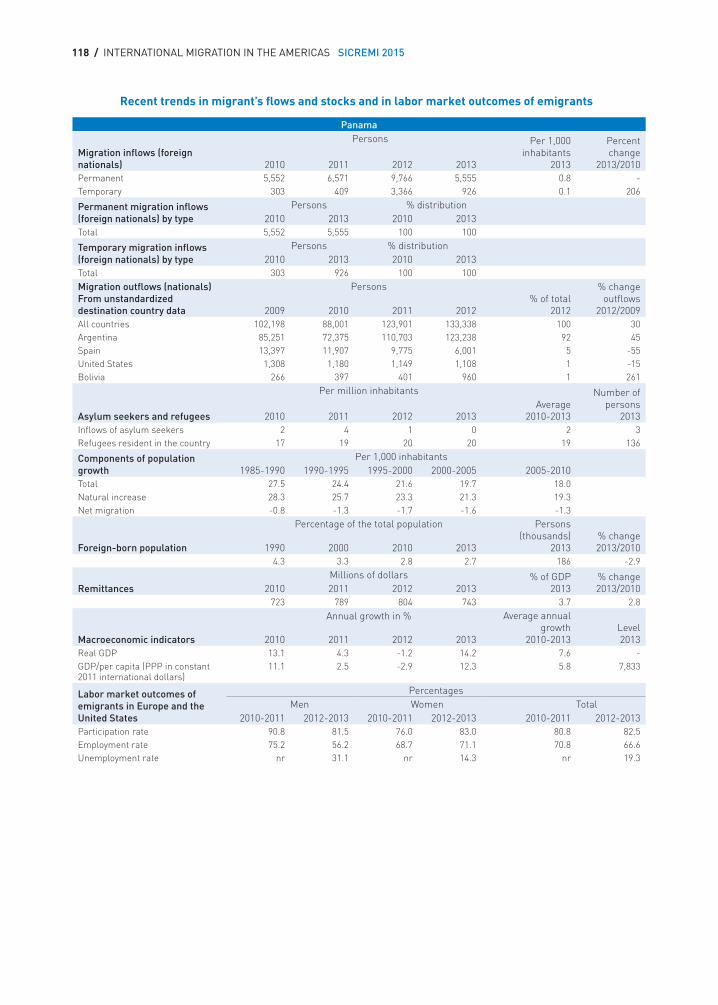
118 / INTERNATIONAL MIGRATION IN THE AMERICAS SICREMI 2015
Recent trends in migrant’s flows and stocks and in labor market outcomes of emigrants
Panama
Migration inflows (foreign nationals)
Persons Per 1,000 inhabitants
2013
Percent change
2013/20102010 2011 2012 2013Permanent 5,552 6,571 9,766 5,555 0.8 -Temporary 303 409 3,366 926 0.1 206
Permanent migration inflows (foreign nationals) by type
Persons % distribution2010 2013 2010 2013
Total 5,552 5,555 100 100
Temporary migration inflows (foreign nationals) by type
Persons % distribution2010 2013 2010 2013
Total 303 926 100 100Migration outflows (nationals) From unstandardized destination country data
Persons% of total
2012
% change outflows
2012/20092009 2010 2011 2012All countries 102,198 88,001 123,901 133,338 100 30Argentina 85,251 72,375 110,703 123,238 92 45Spain 13,397 11,907 9,775 6,001 5 -55United States 1,308 1,180 1,149 1,108 1 -15Bolivia 266 397 401 960 1 261
Asylum seekers and refugees
Per million inhabitants Number of persons
20132010 2011 2012 2013Average
2010-2013Inflows of asylum seekers 2 4 1 0 2 3Refugees resident in the country 17 19 20 20 19 136
Components of population growth
Per 1,000 inhabitants1985-1990 1990-1995 1995-2000 2000-2005 2005-2010
Total 27.5 24.4 21.6 19.7 18.0Natural increase 28.3 25.7 23.3 21.3 19.3Net migration -0.8 -1.3 -1.7 -1.6 -1.3
Foreign-born population
Percentage of the total population Persons (thousands)
2013% change 2013/20101990 2000 2010 2013
4.3 3.3 2.8 2.7 186 -2.9
Remittances Millions of dollars % of GDP
2013% change 2013/20102010 2011 2012 2013
723 789 804 743 3.7 2.8
Macroeconomic indicators
Annual growth in % Average annual growth
2010-2013Level 20132010 2011 2012 2013
Real GDP 13.1 4.3 -1.2 14.2 7.6 -GDP/per capita (PPP in constant 2011 international dollars)
11.1 2.5 -2.9 12.3 5.8 7,833
Labor market outcomes of emigrants in Europe and the United States
Percentages Men Women Total
2010-2011 2012-2013 2010-2011 2012-2013 2010-2011 2012-2013Participation rate 90.8 81.5 76.0 83.0 80.8 82.5Employment rate 75.2 56.2 68.7 71.1 70.8 66.6Unemployment rate nr 31.1 nr 14.3 nr 19.3
PART II Country Notes / 119
PERUPeru has among the lowest levels of immigration recorded in the Americas relative to its population, with less than 1,500 permanent immigrants arriving in 2012, and less than half this number of temporary immigrants. However, the observed change in the foreign-born population over the past decade is much larger than the number of recorded new immigrants, which suggests that official statistics may be missing some entries. These could include irregular immigrants but also Peruvian nationals born abroad who returned to Peru and whose entries are not recorded in the immigration numbers.
In 2013, the foreign-born population stood at 0.3% of the total resident population, a very low level indeed.
With respect to emigration, some 130,000 Peruvians, both permanent and temporary, were recorded as immigrants in 2012 in the OECD zone or in other countries of the Americas. This statistic represents essentially the same level as in 2009, following a decline to about 120,000 per year in the intervening years. Almost two thirds of this migration was to Argentina and Chile and an additional sixth to the United States. Migration to Argentina and Chile has greatly increased since 2009, as movements to the United States and Spain have declined. Note that these statistics do not normally include tourists or business visitors, transport crew-members or diplomatic personnel, nor do they cover persons whose entry in destination countries was irregular or who overstayed their visas.
Labor market outcomes of Peruvian emigrants in Europe and the United States were largely stable overall from 2010-2011 to 2012-2013, but largely as a result of offsetting movements among men and women. While both the employment and unemployment rates of Peruvian men improved, those of women took a turn for the worse, unemployment increasing by 3 points and employment declining by 4 points.
In 2013, Peru was home to 440 asylum seekers, an increase of 17% relative to asylum requests in 2012. Colombia, Cuba and the Dominican Republic were the most important countries of origin. In addition, for the same year (2012), 1,162 refugees resided in the country.
In 2013, remittances increased to 2.7 billion dollars, second only to Colombia among recipients of remittances in South America. The United States (34.5%), Spain (12.4%), Japan (8.9%) and Italy (7.8%) were the most important remitting countries, followed by Chile (7.5%) and Argentina (5.2%).
In recent years, the Peruvian State has promoted policies, such as the Law of Return (“Ley del Retorno”), aimed at assisting Peruvian migrants who return to the country. The objective of the Law of Return, or Law of Economic and Social Reintegration of the Returning Migrant (Law number 30001), is to facilitate the economic and social reintegration of returning Peruvians through diverse programs. Among them are (1) the National Employment Services, which aim to link people seeking employment with companies that require personnel through job placement services, counselling for job search, information regarding the labor market and occupational guidance; (2) Go Peru (“Vamos Perú”), a programme that to improve the employability of the unemployed or workers at risk; and (3) Micro, Small and Medium Enterprises (REMYPE) seeks to foster the creation of small or micro companies through a promotional tax regime.
120 / INTERNATIONAL MIGRATION IN THE AMERICAS SICREMI 2015
In 2013, the Law that establishes the procedures to regularize the residence of foreigners in an irregular situation (Law 30103) was approved. The regulations establish procedures for regularizing foreigners who entered the country through immigration checkpoints before December 31, 2011, and who found themselves in an irregular situation after the expiration of their authorization to stay or reside in the country. The law permits the granting of a temporary visa or resident visa (maximum of two years) under the immigration statuses of either worker, independent professional or residing family member, as appropriate. The regulations established a term of 180 days after visa approval for foreigners to present their requests for regularization.
In April 2011, the Pacific Alliance – composed of Chile, Colombia, Mexico and Peru – was created. Costa Rica and Panama joined as observers. The general purpose of the Pacific Alliance was to make progress towards “the free movement of goods, services, capital and persons” among the signatory countries. It also established as an initial priority, the movement of business people, the facilitation of migration flows and cooperation among immigration and consular police. In May 2013, based on the mandates described in the Founding Treaty of the Pacific Alliance, Peru announced the abolition of visas for business people from Chile, Colombia and Mexico for up to 183 days as long as activities conducted were non-remunerative.
In the same year, Peru signed the “Agreement on Residence for Nationals of States Party to Mercosur, Bolivia and Chile,” also ratifying the internal regulations. The objective of this Agreement is to grant legal residence to nationals of those signatory states who wish to live in the territory of another. Temporary residence is granted for 2 years, after which temporary permit-holders may opt for permanent residence. The marked increase observed in the emigration of Peruvians to Argentina and Chile after 2011 is undoubtedly linked to the signing of this agreement.
2011 also saw the Parliament of the Andean Community of Nations (CAN) approve a decision to formally propose to CAN countries that they join en bloc the Agreement on Residence of States Party to Mercosur, Bolivia and Chile. In practice, this only requires adoption by Ecuador and Colombia, which is facilitated by the fact that they have been associated with Mercosur since 2004.
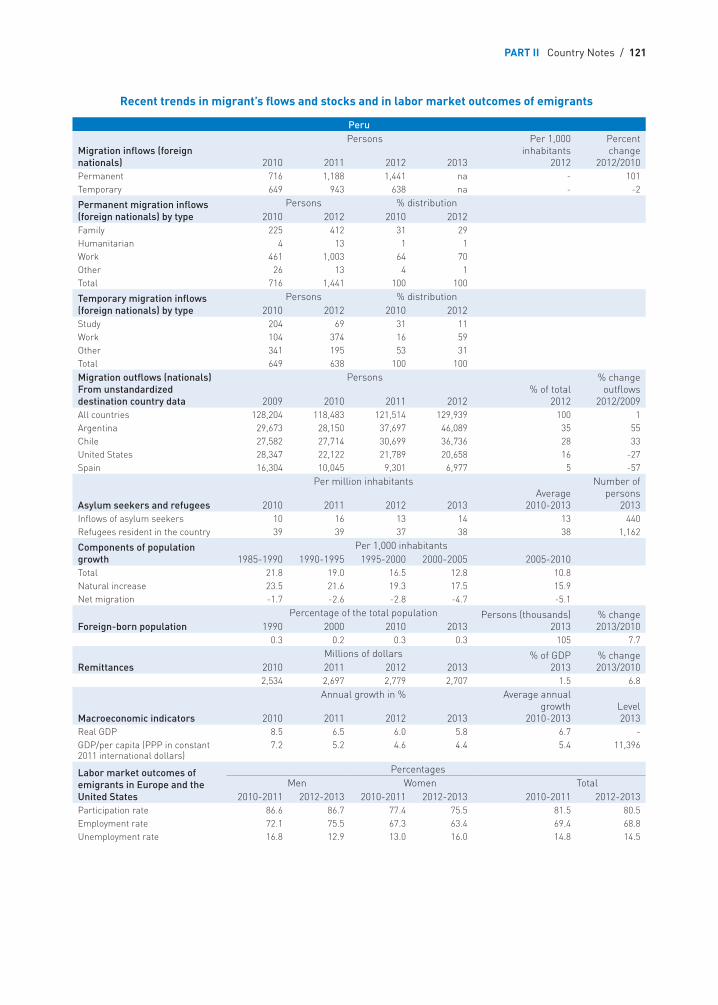
PART II Country Notes / 121
Recent trends in migrant’s flows and stocks and in labor market outcomes of emigrants
Peru
Migration inflows (foreign nationals)
Persons Per 1,000 inhabitants
2012
Percent change
2012/20102010 2011 2012 2013Permanent 716 1,188 1,441 na - 101Temporary 649 943 638 na - -2
Permanent migration inflows (foreign nationals) by type
Persons % distribution2010 2012 2010 2012
Family 225 412 31 29 Humanitarian 4 13 1 1 Work 461 1,003 64 70 Other 26 13 4 1 Total 716 1,441 100 100
Temporary migration inflows (foreign nationals) by type
Persons % distribution2010 2012 2010 2012
Study 204 69 31 11Work 104 374 16 59Other 341 195 53 31Total 649 638 100 100Migration outflows (nationals)From unstandardized destination country data
Persons% of total
2012
% change outflows
2012/20092009 2010 2011 2012All countries 128,204 118,483 121,514 129,939 100 1Argentina 29,673 28,150 37,697 46,089 35 55Chile 27,582 27,714 30,699 36,736 28 33United States 28,347 22,122 21,789 20,658 16 -27Spain 16,304 10,045 9,301 6,977 5 -57
Asylum seekers and refugees
Per million inhabitantsAverage
2010-2013
Number of persons
20132010 2011 2012 2013Inflows of asylum seekers 10 16 13 14 13 440Refugees resident in the country 39 39 37 38 38 1,162
Components of population growth
Per 1,000 inhabitants1985-1990 1990-1995 1995-2000 2000-2005 2005-2010
Total 21.8 19.0 16.5 12.8 10.8Natural increase 23.5 21.6 19.3 17.5 15.9Net migration -1.7 -2.6 -2.8 -4.7 -5.1
Foreign-born population Percentage of the total population Persons (thousands)
2013% change 2013/20101990 2000 2010 2013
0.3 0.2 0.3 0.3 105 7.7
Remittances Millions of dollars % of GDP
2013% change 2013/20102010 2011 2012 2013
2,534 2,697 2,779 2,707 1.5 6.8
Macroeconomic indicators
Annual growth in % Average annual growth
2010-2013Level 20132010 2011 2012 2013
Real GDP 8.5 6.5 6.0 5.8 6.7 -GDP/per capita (PPP in constant 2011 international dollars)
7.2 5.2 4.6 4.4 5.4 11,396
Labor market outcomes of emigrants in Europe and the United States
Percentages Men Women Total
2010-2011 2012-2013 2010-2011 2012-2013 2010-2011 2012-2013Participation rate 86.6 86.7 77.4 75.5 81.5 80.5Employment rate 72.1 75.5 67.3 63.4 69.4 68.8Unemployment rate 16.8 12.9 13.0 16.0 14.8 14.5
122 / INTERNATIONAL MIGRATION IN THE AMERICAS SICREMI 2015
UNITED STATESUnited States total immigrant admissions for lawful permanent residents in fiscal year 2013 were, at 990,600, 5% lower than the 2010 level.
Family-sponsored immigration accounted for two-thirds (649,600) of this total, while 161 000 immigrants (16%) were employment-based, a 9% increase compared to 2010. The diversity visa program granted a further 50,000 immigrant visas by lottery. The resettled refugee ceiling was set at 70,000 for 2013. In total, 119,600 persons were admitted on a humanitarian basis; this includes migrants who were granted refugee status while in the country and who became permanent residents.
In 2013, the United States issued approximately 1.6 million non-immigrant temporary visas (excluding government officials, business visitors, crew members and tourists), mainly for study or work, 20% more than in 2010.
The number of naturalizations, which peaked at 1,046,500 in 2008, dropped below 700,000 annually in the period 2009-2011, but climbed to 779,900 in 2013. Mexico was the leading nationality (13% of all naturalizations).
The foreign-born population residing in the United States in 2013 was 41.3 million, 13% of the total population. It mainly originates from other American countries, including the Caribbean, and from Asia. The main countries of birth were Mexico (11.6 million or 28%), India (2 million), the Philippines (1.8 million) and China (1.8 million). The other main American countries of birth with more than half a million persons resident in the United States in 2013 were El Salvador, Cuba, the Dominican Republic, Guatemala, Canada, Jamaica, Colombia, Haiti and Honduras.
Working-age migrant men from other countries of the Americas have particularly high participation rates in the labor market of the United States, with 86% working or looking for work in the period 2012-2013. This is 4 percentage points higher than other foreign-born and 12 points higher than the native-born. They are also less affected by unemployment than the native-born. Female migrants, on the contrary, have lower participation rates and higher unemployment rates than the other foreign-born and the native-born. The unemployment rates of American migrants decreased slightly between 2010-2011 and 2012-2013, in the same proportion as the native-born.
Emigrants from the United States living in Europe have a low employment rate (67%) and show large differences in participation rates between men and women; indeed the participation rate of women is some 17.5 percentage points lower than that of men.
Around 200,000 persons born in the United States have moved to other OECD countries or other countries of the Americas every year since 2009. Migration outflows from the United States are mainly directed to Canada and Asian or European countries like Korea, Japan, the United Kingdom, Germany and Spain. Emigration is also on the rise to some Latin American countries like Mexico and Chile where flows of persons born in the United States more than doubled between 2005 and 2012 but remain below 5,000 annually.
The largest groups of emigrants from the United States established in other OECD countries can be found in Mexico — where the United States was the main country of birth of the foreign-born
PART II Country Notes / 123
with more than 738,000 immigrants in 2010 — followed by Canada (263,000 immigrants in 2011), the United Kingdom (146,000 immigrants in 2012), Australia (96,000 immigrants in 2012) and Israel (85,000 immigrants in 2011). Many of the US-born persons living in Mexico are children of Mexican migrants to the United States who returned to Mexico.
More than 12,000 US citizens have acquired the citizenship of another OECD country annually in the period 2005-2012. The main citizenships adopted are the ones of the main countries of destinations. An increase was also observed in the acquisition of citizenships of smaller destination countries, in particular Eastern European countries after their accession to the European Union in 2007 and Luxembourg, which has allowed dual citizenship from 1 January 2009.
In the first half of 2014, police accounts and a United Nations report alerted national authorities to an increase in unaccompanied children from Central America crossing the border from Mexico. This increase may have been prompted by a combination of factors among which are the increase of violence in Central America and the prospects of immigration reforms, even though new immigrants are not covered by recent policy initiatives (see below).
The United States immigration system saw several policy initiatives over the past two years.
In 2012, President Obama, acting by executive order, announced the deferred-action-for-childhood- arrivals (DACA) policy. This policy provides for the deferral of expulsions of persons who came to the United States as children and provides them with work authorizations without providing formal lawful status. On 20 November 2014, the DACA renewal and work authorizations were extended to three-years from the former two. This change applies to first-time applications as well as applications for renewal. The initial age cap of 31 no longer applies. The eligibility cut-off date by which a DACA applicant must have been in the United States was adjusted from 15 June 2007 to 1 January 2010. Eligibility now encompasses all undocumented immigrants who entered the United States before the age of 16. Prior to 1 January 2010, around 600,000 persons are likely to benefit from this policy.
In 2013, the Obama administration submitted an immigration reform bill entitled “Border Security, Economic Opportunity, and Immigration Modernization Act” that combined provisions for border security, a path to citizenship for undocumented migrants and reforms of legal migration regulations. This very comprehensive reform bill was divided into five titles. Title I contained provisions for border security with increases in staffing and in equipment for Customs and Border Protection, the establishment of more favorable rules for migrants and for persons being removed, and the training of border and law enforcement officials in Mexico, Honduras, El Salvador and Guatemala. Title II provided for the deliverance of documents to agricultural workers unlawfully residing in the United States, the creation of a merit and points-based immigrant admission system and the extension of the waiver of inadmissibility provisions for undocumented migrants who entered the country before the age of 16 and for parents of children lawfully in the country. Title III included provisions for the elimination of the one-year time limit for filing an asylum claim and for the granting of an employment authorization 180 days after the filing of an asylum application. Title IV listed changes to the non-immigrant visa programs, namely the right to work for certain spouses of H-1B permit holders and the establishment of an EB-6 immigrant investor visa. Title V introduced a surcharge on employers’ applications for non-immigrant visas, funds from which were earmarked to a Youth Jobs fund to provide employment opportunities to low-income youth.
124 / INTERNATIONAL MIGRATION IN THE AMERICAS SICREMI 2015
The bill passed in the Senate in June 2013 but was never debated in the full House. Immigration reform in the United States thus remains deadlocked, with little prospects of a solution in sight.
Acting again by executive order, President Obama announced on 20 November 2014 the Deferred Action for Parents of Americans and Lawful Permanent Residents (DAPA). The DAPA allows individuals to apply for temporary relief from deportation if they have a son or daughter who is a United States citizen or a lawful permanent resident, have continuously resided in the United States since before 2010 and are not prioritized for removal under the new policy. Persons who apply for deferred action pursuant to these criteria shall also be eligible for work authorization. Both the deferred action and the work authorization are valid for three years. Applicants will pay the work authorization and biometric fees. The ultimate judgment as to whether an immigrant is granted deferred action will be determined on a case-by-case basis. Applicants will undergo a background check of all relevant national security and criminal databases including Department of Homeland Security and FBI databases. They have to have been physically present in the United States in November 2014. The DAPA does not apply to recent undocumented immigrants or those thinking of migrating to the United States. Indeed, the broader executive actions announced by the President include prioritizing the repatriation of recent border crossers and any person who tries to cross the border without proper documentation.
As many as five million persons living in the United States illegally are likely to benefit from this first memorandum out of a total of nearly 11 million undocumented immigrants, of which more than half are Mexicans.
A court order in February 2015 halted the expansion of DACA and the implementation of DAPA. In May 2015 the appeal court ruled against the US Justice Department which had appealed the earlier decision. The decision now stands unless appealed again to the full appeals court or the Supreme Court of the United States.
Another major memorandum issued the same day as DAPA introduces policies in support of high-skilled businesses and workers. The first provision is to assist employers in attracting and retaining highly skilled workers by ensuring that all immigrant visas authorized by Congress are issued. The United States Citizenship and Immigration Services (USCIS) is instructed to provide better guidance on the possibilities for an immigrant worker to change jobs without jeopardizing his or her ability to seek lawful permanent residence. The second provision establishes that the “Optional Practical Training”, which allows students to extend their time in the United States for temporary employment in a relevant field of study, is expanded to other degree programs and the time period offered to science, technology, engineering, and mathematics students is extended. Third, the “national interest waiver” that allows highly qualified foreigners to seek green cards without employer sponsorship is to be promoted, as it is now underutilized. Similarly, there are provisions for granting “parole status” to inventors, researchers and founders of start-up enterprises of “significant public benefit” on a case-by-case basis. This temporary status would be given to holders of promising projects, in situations where the persons concerned do not qualify for a national interest waiver. Fourth, the L-1B visa program for intracompany transferees is to be made more consistent with a better guidance on the meaning of the requirement of “specialized knowledge” for adjudication of the visa petitions. Finally, an immigrant wishing to adjust his or her status is to be allowed to change jobs or employers while his or her long-standing visa petition is being examined.
PART II Country Notes / 125
In order to secure the Southern border, three Joint Task Forces will be created: one responsible for the Southern maritime border, one focusing on the Southern land border and the West coast, and one focused on investigation. They will seek to enforce immigration laws, combat transnational criminal organizations and minimize the risk of terrorism.
Removal procedures were specified under two memoranda. The first one specifies priorities in the type of immigrants to be removed. The second one announces the discontinuation of the “Secure Communities Program”, in charge of identifying and facilitating the removal of criminal aliens, and its replacement by the “Priority Enforcement Program” (PEP), which redirects removal efforts towards those who pose a demonstrable risk to national security.
Immigration and Customs Enforcement officer jobs will be reclassified and their premium pay system improved to better remunerate them in their critical mission of removing criminals.
The provisional waiver program in place provides undocumented foreigners with some level of certainty that they will be able to return after a successful interview in the U.S. consulate of their country of citizenship. They will no longer be barred from returning for three or ten years if they can prove that the bar imposes an “extreme hardship” to a citizen or lawful permanent spouse or parent. This program will be extended to all relatives for whom an immigrant visa is immediately available. In order to broaden the use of this program, the USCIS is to clarify the meaning of “extreme hardship”.
To support the military in its recruitment efforts, the Department of Homeland Security will expand the scope of its parole-in-place memorandum of November 2013 to include family members of citizens and lawful permanent residents who seek to enlist in the U.S. Armed Forces. The current program applies only to family members of those already part of the military service or veterans. The temporary status granted applies as well to persons in the United States who have entered without inspection.
USCIS regularly grants authorizations to travel abroad called “advance parole” to temporary migrants or immigrants with pending immigration applications. A memorandum calls for a Directive to provide consistency regarding advance parole, so that travel on advance parole would not be considered as a “departure” and does not trigger the ground of inadmissibility that bars admission after the accrual of unlawful presence. This would provide greater assurance to individuals with advance parole of the consequences of their travel.
Access to naturalization will be eased with the implement of credit card payment facilities and partial fee exemptions as well as public awareness campaigns.
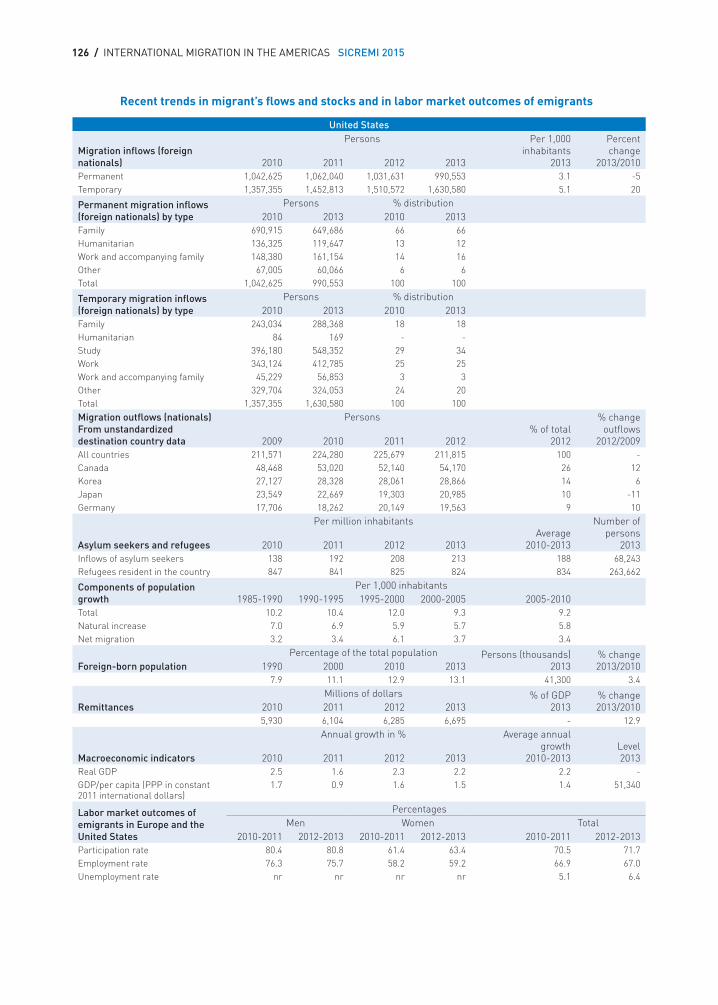
126 / INTERNATIONAL MIGRATION IN THE AMERICAS SICREMI 2015
Recent trends in migrant’s flows and stocks and in labor market outcomes of emigrants
United States
Migration inflows (foreign nationals)
Persons Per 1,000 inhabitants
2013
Percent change
2013/20102010 2011 2012 2013Permanent 1,042,625 1,062,040 1,031,631 990,553 3.1 -5Temporary 1,357,355 1,452,813 1,510,572 1,630,580 5.1 20
Permanent migration inflows (foreign nationals) by type
Persons % distribution2010 2013 2010 2013
Family 690,915 649,686 66 66Humanitarian 136,325 119,647 13 12Work and accompanying family 148,380 161,154 14 16Other 67,005 60,066 6 6Total 1,042,625 990,553 100 100
Temporary migration inflows (foreign nationals) by type
Persons % distribution2010 2013 2010 2013
Family 243,034 288,368 18 18Humanitarian 84 169 - -Study 396,180 548,352 29 34Work 343,124 412,785 25 25Work and accompanying family 45,229 56,853 3 3Other 329,704 324,053 24 20Total 1,357,355 1,630,580 100 100Migration outflows (nationals)From unstandardized destination country data
Persons% of total
2012
% change outflows
2012/20092009 2010 2011 2012All countries 211,571 224,280 225,679 211,815 100 -Canada 48,468 53,020 52,140 54,170 26 12Korea 27,127 28,328 28,061 28,866 14 6Japan 23,549 22,669 19,303 20,985 10 -11Germany 17,706 18,262 20,149 19,563 9 10
Asylum seekers and refugees
Per million inhabitantsAverage
2010-2013
Number of persons
20132010 2011 2012 2013Inflows of asylum seekers 138 192 208 213 188 68,243Refugees resident in the country 847 841 825 824 834 263,662
Components of population growth
Per 1,000 inhabitants1985-1990 1990-1995 1995-2000 2000-2005 2005-2010
Total 10.2 10.4 12.0 9.3 9.2Natural increase 7.0 6.9 5.9 5.7 5.8Net migration 3.2 3.4 6.1 3.7 3.4
Foreign-born population Percentage of the total population Persons (thousands)
2013% change 2013/20101990 2000 2010 2013
7.9 11.1 12.9 13.1 41,300 3.4
Remittances Millions of dollars % of GDP
2013% change 2013/20102010 2011 2012 2013
5,930 6,104 6,285 6,695 - 12.9
Macroeconomic indicators
Annual growth in % Average annual growth
2010-2013Level 20132010 2011 2012 2013
Real GDP 2.5 1.6 2.3 2.2 2.2 -GDP/per capita (PPP in constant 2011 international dollars)
1.7 0.9 1.6 1.5 1.4 51,340
Labor market outcomes of emigrants in Europe and the United States
Percentages Men Women Total
2010-2011 2012-2013 2010-2011 2012-2013 2010-2011 2012-2013Participation rate 80.4 80.8 61.4 63.4 70.5 71.7Employment rate 76.3 75.7 58.2 59.2 66.9 67.0Unemployment rate nr nr nr nr 5.1 6.4
PART II Country Notes / 127
URUGUAYWith an increasing permanent and temporary migration since 2010, migration inflows in Uruguay registered a 68% increase over the period covered by this report (2010-2013). At the same time, the stock of immigrants has decreased. While in 2010, Uruguay was home to 80,000 foreign-born individuals, by 2013 that figure had decreased to 74,000, representing 2.2% of the country’s total population.
In 2012, emigration by Uruguayans towards OECD countries and Latin America was double the immigration flow the country received for 2013. More than 10,000 Uruguayans left the country in 2012, of which 41% did so for neighboring Argentina. In comparison with the year 2009, emigration fell slightly, though outflows to Argentina have intensified.
The total employment rate of Uruguayans in the labor markets of the United States and Europe decreased from 65.5% to 63.3% between 2010 and 2013. The rate of participation of women increased over the same period by almost 6 points, while employment decreased by 1 percentage point.
In Uruguay, the number of asylum seekers remains very low. In 2013, there were 37 asylum requests, a figure similar to that of the previous year. The most important countries of origin continue to be Colombia and Peru. For the same year, there were 203 refugees residing in the country.
The year 2013 saw a small increase of 0.6% in remittances sent to the country, adding up to a total of 133 million dollars.
The National Institute of Statistics has produced estimates of the number of returning migrants beginning with the 2011 Census, yielding a figure of 5,000 returnees per year since 2009 (February 2013). Most of them are of an economically active age, between 30 and 39 years, and more than half live with a person born abroad. According to the INE, Spain became the first country of origin of returnees. The number of those returning from the United States also increased.
For those returnees who have lived more than two years abroad, the Office of Return and Welcome (“Oficina de Retorno y Bienvenida”) offers different special programs based on agreements between the Ministry of Foreign Affairs and other public entities. The agreements cover areas such as health care, communications, insurance and rental guarantees. Return migrants can access these programs on a one-time-only basis and within time limits established by each organisation or institution, not to exceed, in any case, one year from the returnee’s date of arrival into the country.
In 2014 the Ministry of Foreign Affairs was granted the power to process permanent residence requests in consular offices around the world. This regulation is aligned with the Agreement on Residence for Nationals of States Party to Mercosur signed in 2002 in Brazil and approved in Uruguay in 2005.
A draft bill currently under consideration would modify the law on nationality, granting the status of natural citizen to the children of a Uruguayan mother or father born outside the national territory. Also, on August 28, 2014 Law No. 19.254 was approved and grants “permanent residence” to the spouses, partners, parents, siblings and grandchildren of Uruguayans, as well as to all citizens of Mercosur countries and associated States.

128 / INTERNATIONAL MIGRATION IN THE AMERICAS SICREMI 2015
Lastly, a number of measures have been passed to facilitate administrative procedures for migrants. Specifically, the cost of the healthcare card for migrants has been reduced; the fees for processing the legalization of documents through the Foreign Affairs Ministry have been dropped; and the requirement of translating documents has been eliminated for nationals of Mercosur countries.
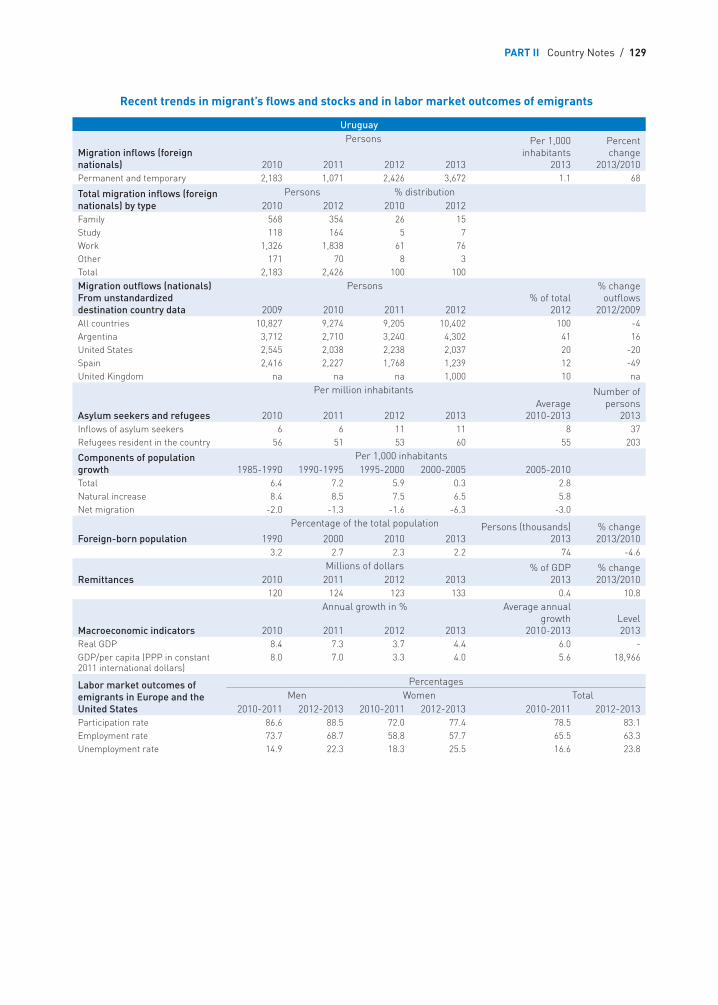
PART II Country Notes / 129
Recent trends in migrant’s flows and stocks and in labor market outcomes of emigrants
Uruguay
Migration inflows (foreign nationals)
Persons Per 1,000 inhabitants
2013
Percent change
2013/20102010 2011 2012 2013Permanent and temporary 2,183 1,071 2,426 3,672 1.1 68
Total migration inflows (foreign nationals) by type
Persons % distribution2010 2012 2010 2012
Family 568 354 26 15 Study 118 164 5 7 Work 1,326 1,838 61 76 Other 171 70 8 3 Total 2,183 2,426 100 100 Migration outflows (nationals)From unstandardized destination country data
Persons% of total
2012
% change outflows
2012/20092009 2010 2011 2012All countries 10,827 9,274 9,205 10,402 100 -4Argentina 3,712 2,710 3,240 4,302 41 16United States 2,545 2,038 2,238 2,037 20 -20Spain 2,416 2,227 1,768 1,239 12 -49United Kingdom na na na 1,000 10 na
Asylum seekers and refugees
Per million inhabitants Number of persons
20132010 2011 2012 2013Average
2010-2013Inflows of asylum seekers 6 6 11 11 8 37Refugees resident in the country 56 51 53 60 55 203
Components of population growth
Per 1,000 inhabitants1985-1990 1990-1995 1995-2000 2000-2005 2005-2010
Total 6.4 7.2 5.9 0.3 2.8Natural increase 8.4 8.5 7.5 6.5 5.8Net migration -2.0 -1.3 -1.6 -6.3 -3.0
Foreign-born population
Percentage of the total population Persons (thousands)2013
% change 2013/20101990 2000 2010 2013
3.2 2.7 2.3 2.2 74 -4.6
Remittances Millions of dollars % of GDP
2013% change 2013/20102010 2011 2012 2013
120 124 123 133 0.4 10.8
Macroeconomic indicators
Annual growth in % Average annual growth
2010-2013Level 20132010 2011 2012 2013
Real GDP 8.4 7.3 3.7 4.4 6.0 -GDP/per capita (PPP in constant 2011 international dollars)
8.0 7.0 3.3 4.0 5.6 18,966
Labor market outcomes of emigrants in Europe and the United States
Percentages Men Women Total
2010-2011 2012-2013 2010-2011 2012-2013 2010-2011 2012-2013Participation rate 86.6 88.5 72.0 77.4 78.5 83.1Employment rate 73.7 68.7 58.8 57.7 65.5 63.3Unemployment rate 14.9 22.3 18.3 25.5 16.6 23.8


PART I Trends in International Migration and Labor Market Outcomes / 131
PART III
Statistical Annex

PART III Statistical Annex / 133
Introduction
The statistics in this annex come from two main sources, namely the countries of the Americas, on the one hand, and OECD countries, on the other. There is some overlap in the two groups, namely Canada, the United States, Mexico and Chile. The objective of the annex
is to provide statistics on two aspects of international migration with regard to countries of the Americas, namely immigration into those countries and emigration from the same countries to OECD countries. The latter evidently does not cover all emigration from countries of Americas to the rest of the world, but certainly a significant proportion of it. The immigration/emigration dichotomy provides a natural structuring of the tables in this annex, for which a lettering system has been defined.
The table lettering system
The tables in this annex have been lettered systematically, to make it simpler to remember their content when referencing them. The first letter is either an “I” (for immigration) or an “E” (for emigration). The tables labeled “I” are those for which the statistics come from the countries of the Americas and concern immigrants into those countries. For those labeled “E”, the statistics come from OECD countries, to which persons who are citizens of the Americas are emigrating or have emigrated in the past and of which they are or were residents.
The second letter of the lettering system is either an “a” (for aggregate) or “d” (for detailed). Tables labeled “a” give totals for certain characteristics for each country of the Americas in a single table. Tables labeled “d” provide detail for each country of the Americas on the countries of origin of immigrants or of destination of emigrants for the American country in question, as appropriate. There is a separate table for each country of the Americas. The exact nature of the country-level detail (whether it is country of birth, country of residence, country of nationality, etc.) depends on the nature of the table. Tables on immigration, for example, give entries of immigrating persons by country of nationality; whereas tables of the foreign-born population will give statistics disaggregated by country of birth and tables on acquisition of nationality by country of previous nationality.
Finally, the third part of the lettering system gives a 2-letter acronym which serves as a reminder of the precise table content. The acronyms used thus far are the following:
■ fl, for flows, which can refer to inflows (for the I tables) or outflows (for the E tables); ■ as, for asylum seekers; ■ fb, for the foreign-born population; ■ an, for acquisitions of nationality.
Table I.a.fb., for example, describes a table giving the total foreign-born population for each country of the Americas (for which data are available) in a single table. Table E.d.an., on the other hand, refers to a set of tables, one for each country of the Americas, containing the number of citizens of that country having obtained a nationality in an OECD country, by OECD country for which the nationality was obtained.
Note that not all possible tables of the lettering system are present in this statistical annex. For example, there are as yet no E.a.as. or E.d.as. tables, which would provide statistics on asylum seekers from countries of the Americas who have made requests for asylum in OECD countries.
134 / INTERNATIONAL MIGRATION IN THE AMERICAS SICREMI 2015
The lettering system allows room for expansion, for example, to include unemployment rates of workers from the Americas in OECD countries (E.a.un., overall and E.d.un., by OECD country of residence). Such tables may be included in future editions of International Migration in the Americas.
The tables to be found in this annex are as follows:
Immigration
■ I.a.fl. Inflows of legal immigrants of foreign nationality ■ I.a.as. Inflows of asylum seekers ■ I.a.fb. The foreign-born population ■ I.a.an. Acquisitions of nationality ■ I.d.fl. Inflows of legal permanent immigrants, by country of nationality ■ I.d.an. Acquisitions of nationality, by country of previous nationality
Emigration to OECD countries
■ E.a.fl. Outflows of migrants to OECD countries ■ E.a.fb. The population born in the Americas living in OECD countries ■ E.a.an. Acquisitions of nationality in OECD countries ■ E.d.fl. Outflows of migrants to OECD countries, by country of destination ■ E.d.an. Acquisitions of nationality in OECD countries, by country of acquired nationality
Sources and definitions
Flows
Data on outflows of citizens of the Americas to OECD countries are obtained from the official statistics of the latter countries provided to the OECD. These statistics are based on national definitions and are not standardized. Although the OECD produces a set of standardized statistics on permanent immigration, the statistics of these series are not yet available by nationality of the immigrant, hence the recourse to official national statistics provided to the OECD by its member countries.
The disadvantage of this approach is that the coverage of the national statistics can vary considerably across countries. The statistics for the United States, for example, cover “green-card” migration, that is, persons who receive the right of permanent residence. Those for Germany, on the other hand, cover persons who have arrived from abroad, live in a private dwelling, intend to stay in Germany for more than a certain period of time (which varies by Land (province) but is no more than 3 months), who have registered themselves in a municipal population register and are either citizens of the European Union or have a residence permit of duration compatible with their intended stay period. The immigration statistics for Germany evidently have a much broader coverage than those of the United States because they include entries of many persons for short-term, temporary reasons, including, for example, seasonal workers, trainees, and international students. Such statistics also exist for the United States but are not commonly included with the green-card numbers, which represent the official “new permanent residents” of the United States.
PART III Statistical Annex / 135
In practice, this means that the statistics on emigration of citizens of the Americas towards OECD countries shown in this publication are partial and do not necessarily include all emigrants in all destination countries. The most glaring omission for the purposes of this publication is that of temporary movements of citizens of the Americas to the United States, although statistics on the total volume of these movements are shown in Table 1 in the opening chapter of this publication and are included in Table 5 on outflows, as well as in the outflow tables in the country note statistics. For the present, care should be exercised in interpreting the statistics on emigration to OECD countries. The statistics presented are indicative and do not present a complete picture of out-migration from countries in the Americas to OECD countries. Note that the statistics on outflows presented in this annex, in contrast to those presented in the rest of this publication, do not include outflows to other countries of the Americas except to those which are member countries of the OECD.
The reader is referred to the metadata regarding tables E.a.fl. and E.d.fl. for a description of the sources and definitions of the immigration statistics in OECD countries.
Data on inflows of immigrants into countries of the Americas are based on the statistics of the destination countries supplied to the Organization of American States. The data collected are, as for OECD countries, national statistics, but an attempt has been made to present them according to a common definition. In almost cases, the data come from administrative sources on residence permits and/or entry visas.
The data for a number of countries have been revised since the previous edition of this publication (2012). This has occurred because of changes in the provision of national data, of a better understanding of national visa and permit systems or of the implementation of new immigration laws, which have created series breaks and have required a re-examination of national statistics and concepts. Among the countries for which this has occurred are Bolivia, Colombia, the Dominican Republic, Ecuador, Paraguay and Peru.
For the purposes of harmonization of the immigration statistics, the underlying concept is that of “permanent” as opposed to “temporary” migration. A “permanent migrant” in this publication is not necessarily someone who has received the right of permanent residence, but rather someone who upon entry receives a permit which is (more or less) indefinitely renewable, even if some conditions may need to be satisfied in order for the permit to be renewed, such as the holding of a job. Persons who receive permits which are not renewable or only renewable on a limited basis are temporary migrants. The latter include such persons as seasonal workers, international students, service providers, performing artists, etc. In many countries, temporary migrants may be allowed to change status under certain conditions, that is, to move to a permanent migration track, which allows them to stay in the country indefinitely. Persons who do not fall into either of these categories are those such as tourists, persons in transit, business visitors, that is, persons whose objective is neither to establish a residence, whether temporary or permanent, in the country nor to exercise an economic activity nor to study.
Most countries of the Americas, like the United States, grant permanent permits to persons arriving who want to settle indefinitely and satisfy the required criteria or who, after arriving as temporary migrants, would like to stay on, apply to do so and are deemed to satisfy the necessary conditions. This makes it relatively easy, in principle, to standardize the national statistics along the permanent / temporary dimension. In a number of cases, however, certain categories are not explicitly identified
136 / INTERNATIONAL MIGRATION IN THE AMERICAS SICREMI 2015
as “permanent” or “temporary” and judgment was exercised on their classification. These are identified in the metadata tables. In addition, it has not always been possible to fully harmonize the statistics provided by participating countries because the statistics are not always sufficiently disaggregated by category of migration. It is expected that the process of standardization will improve over time, as more and more information becomes available on the categories of migration and on the different types of residence permits.
For a number of countries, however, there are some significant deviations from the standard permanent/temporary distinction or in the coverage of the data. These are Chile, Colombia, the Dominican Republic, Jamaica and Uruguay. The concepts underlying the statistics for these countries are specified in the metadata on inflows.
To the extent possible, diplomats, their families and employees have been excluded from the statistics of immigration into the Americas. It has been possible to do this, however, only in countries which have provided statistics on immigration by category of entry. Persons in these groups have a special status in all countries as representatives of their governments and are generally not considered residents, unless they request permission to stay on after the end of their assignments, in which case then enter into the normal statistics of immigration.
The terms “flow” or “entry” used in connection with immigration or emigration phenomena in this publication do not necessarily reflect an actual cross-border movement, but rather an entry into the official statistics as residents, which may not coincide in time with the year when the movement occurred. In some cases, this may simply reflect the interval between the movement and its registration. In other cases, however, in particular with respect to permanent migration, the registration may not be of the entry but rather of the passage from a temporary to a permanent status. The objective of the statistics is to identify the permanent/temporary status of the migrant when the entry occurred but also to allow for situations when someone initially identified as temporary at the time of entry applies for and is allowed to change to permanent status.
Asylum seekers, refugees, the foreign-born population, acquisitions of nationality
Statistics for these three groups are more straightforward than are those for inflows or outflows.
Asylum-seekers are persons who have applied for asylum or refugee status (according to the 1951 Geneva Convention), but who have not yet received a final decision on their application. The statistics given in this publication only cover persons who made their request during the specified reference year or years. Refugees, on the other hand, are persons who have been resettled from refugee camps oversees or whose claim to asylum to has been formally recognized.
The definition of a foreign-born person is self-explanatory. Note, however, that the country of birth is defined on the basis of current geographic boundaries, not those in existence at the time of the immigrant’s birth. In addition, the foreign-born population covers persons who are de jure residents, that is, persons who happen to be in the country at the time of the census and are not usually resident are not counted. In practice the population covered may include persons born abroad as nationals of the current country of residence. Persons in this group would not normally be considered immigrants of their country of residence. Series on the foreign-born population from the Americas living in OECD countries are given only for Spain and the United States, the two
PART III Statistical Annex / 137
principal countries of destination. Data for other countries are too partial to construct an aggregate series covering all OECD countries.
The statistics on the acquisitions of nationality include acquisitions on the basis of different criteria or regimes, such as by marriage, adoption, right, descent or naturalization. In cases of descent, the persons concerned are not necessarily residents of the country of acquired nationality. In practice, the statistics shown do not distinguish between these various cases, which are aggregated together to yield a total for the reference year. The term “nationality” refers to legal or passport nationality and not to membership of a particular ethnic group.
The metadata for the statistical tables are to be found on the following pages and are labeled as follows:
Immigration
■ I.fl Inflows of legal immigrants of foreign nationality. ■ I.as Inflows of asylum seekers. ■ I.fb The foreign-born population. ■ I.an Acquisitions of nationality.
Emigration to OECD countries
■ E.fl Outflows of migrants to OECD countries. ■ E.fb The population born in the Americas living in OECD countries. ■ E.an Acquisitions of nationality in OECD countries.
In the detailed tables, cells smaller than 10 have been aggregated together and appear as “Others”.
“na” means “not available”.
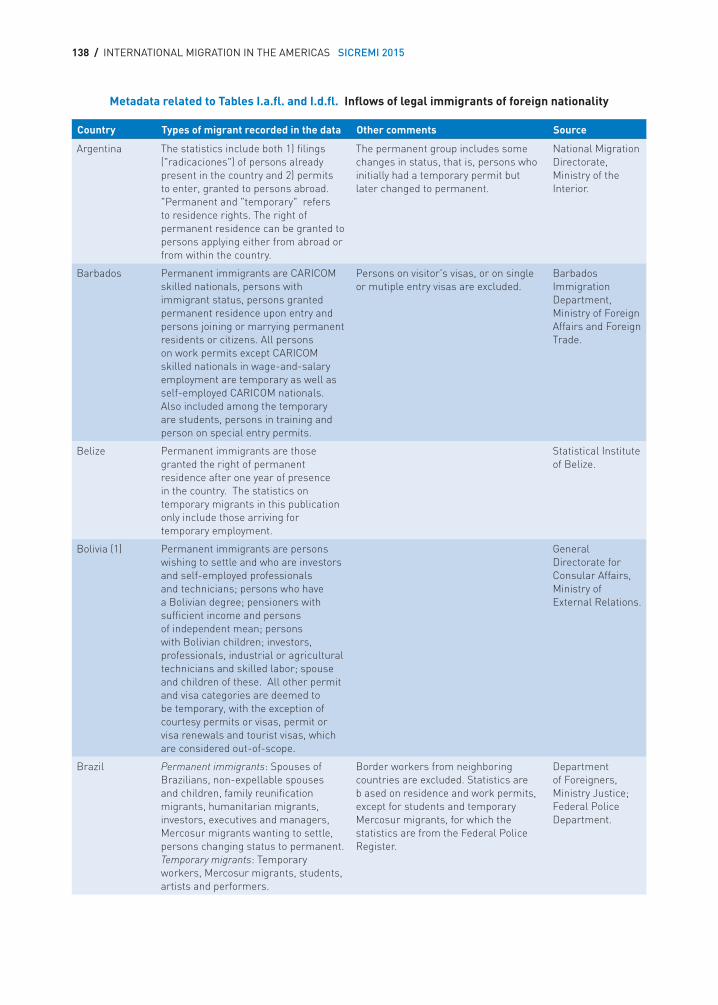
138 / INTERNATIONAL MIGRATION IN THE AMERICAS SICREMI 2015
Country Types of migrant recorded in the data Other comments Source
Argentina The statistics include both 1) filings ("radicaciones") of persons already present in the country and 2) permits to enter, granted to persons abroad. "Permanent and "temporary" refers to residence rights. The right of permanent residence can be granted to persons applying either from abroad or from within the country.
The permanent group includes some changes in status, that is, persons who initially had a temporary permit but later changed to permanent.
National Migration Directorate, Ministry of the Interior.
Barbados Permanent immigrants are CARICOM skilled nationals, persons with immigrant status, persons granted permanent residence upon entry and persons joining or marrying permanent residents or citizens. All persons on work permits except CARICOM skilled nationals in wage-and-salary employment are temporary as well as self-employed CARICOM nationals. Also included among the temporary are students, persons in training and person on special entry permits.
Persons on visitor's visas, or on single or mutiple entry visas are excluded.
Barbados Immigration Department, Ministry of Foreign Affairs and Foreign Trade.
Belize Permanent immigrants are those granted the right of permanent residence after one year of presence in the country. The statistics on temporary migrants in this publication only include those arriving for temporary employment.
Statistical Institute of Belize.
Bolivia (1) Permanent immigrants are persons wishing to settle and who are investors and self-employed professionals and technicians; persons who have a Bolivian degree; pensioners with sufficient income and persons of independent mean; persons with Bolivian children; investors, professionals, industrial or agricultural technicians and skilled labor; spouse and children of these. All other permit and visa categories are deemed to be temporary, with the exception of courtesy permits or visas, permit or visa renewals and tourist visas, which are considered out-of-scope.
General Directorate for Consular Affairs, Ministry of External Relations.
Brazil Permanent immigrants: Spouses of Brazilians, non-expellable spouses and children, family reunification migrants, humanitarian migrants, investors, executives and managers, Mercosur migrants wanting to settle, persons changing status to permanent. Temporary migrants: Temporary workers, Mercosur migrants, students, artists and performers.
Border workers from neighboring countries are excluded. Statistics are b ased on residence and work permits, except for students and temporary Mercosur migrants, for which the statistics are from the Federal Police Register.
Department of Foreigners, Ministry Justice; Federal Police Department.
Metadata related to Tables I.a.fl. and I.d.fl. Inflows of legal immigrants of foreign nationality
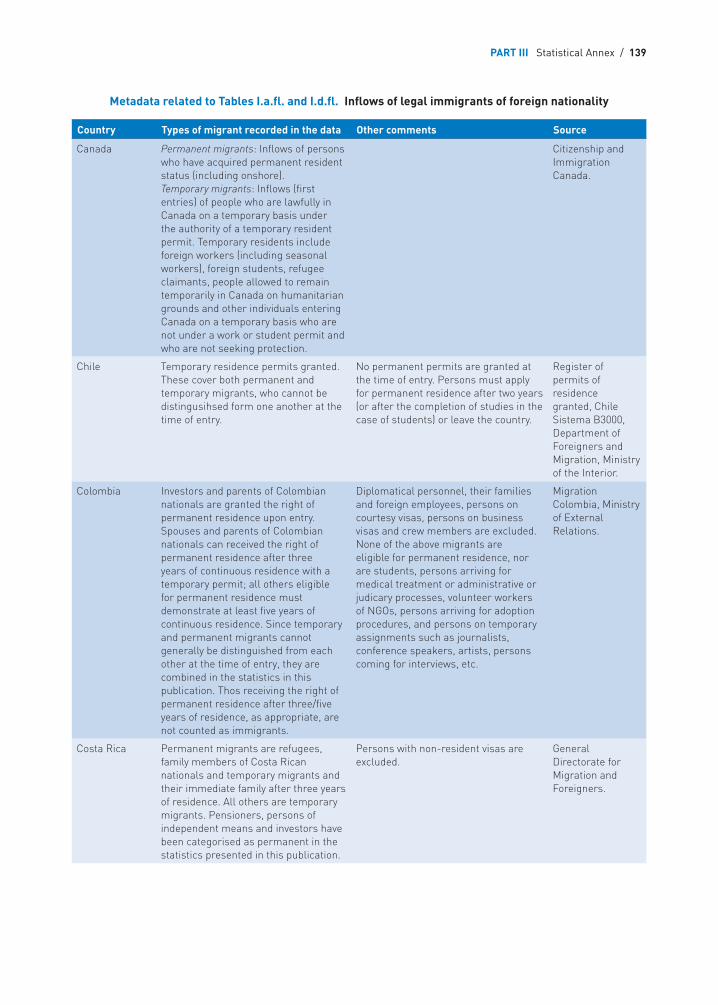
PART III Statistical Annex / 139
Country Types of migrant recorded in the data Other comments Source
Canada Permanent migrants: Inflows of persons who have acquired permanent resident status (including onshore). Temporary migrants: Inflows (first entries) of people who are lawfully in Canada on a temporary basis under the authority of a temporary resident permit. Temporary residents include foreign workers (including seasonal workers), foreign students, refugee claimants, people allowed to remain temporarily in Canada on humanitarian grounds and other individuals entering Canada on a temporary basis who are not under a work or student permit and who are not seeking protection.
Citizenship and Immigration Canada.
Chile Temporary residence permits granted. These cover both permanent and temporary migrants, who cannot be distingusihsed form one another at the time of entry.
No permanent permits are granted at the time of entry. Persons must apply for permanent residence after two years (or after the completion of studies in the case of students) or leave the country.
Register of permits of residence granted, Chile Sistema B3000, Department of Foreigners and Migration, Ministry of the Interior.
Colombia Investors and parents of Colombian nationals are granted the right of permanent residence upon entry. Spouses and parents of Colombian nationals can received the right of permanent residence after three years of continuous residence with a temporary permit; all others eligible for permanent residence must demonstrate at least five years of continuous residence. Since temporary and permanent migrants cannot generally be distinguished from each other at the time of entry, they are combined in the statistics in this publication. Thos receiving the right of permanent residence after three/five years of residence, as appropriate, are not counted as immigrants.
Diplomatical personnel, their families and foreign employees, persons on courtesy visas, persons on business visas and crew members are excluded. None of the above migrants are eligible for permanent residence, nor are students, persons arriving for medical treatment or administrative or judicary processes, volunteer workers of NGOs, persons arriving for adoption procedures, and persons on temporary assignments such as journalists, conference speakers, artists, persons coming for interviews, etc.
Migration Colombia, Ministry of External Relations.
Costa Rica Permanent migrants are refugees, family members of Costa Rican nationals and temporary migrants and their immediate family after three years of residence. All others are temporary migrants. Pensioners, persons of independent means and investors have been categorised as permanent in the statistics presented in this publication.
Persons with non-resident visas are excluded.
General Directorate for Migration and Foreigners.
Metadata related to Tables I.a.fl. and I.d.fl. Inflows of legal immigrants of foreign nationality
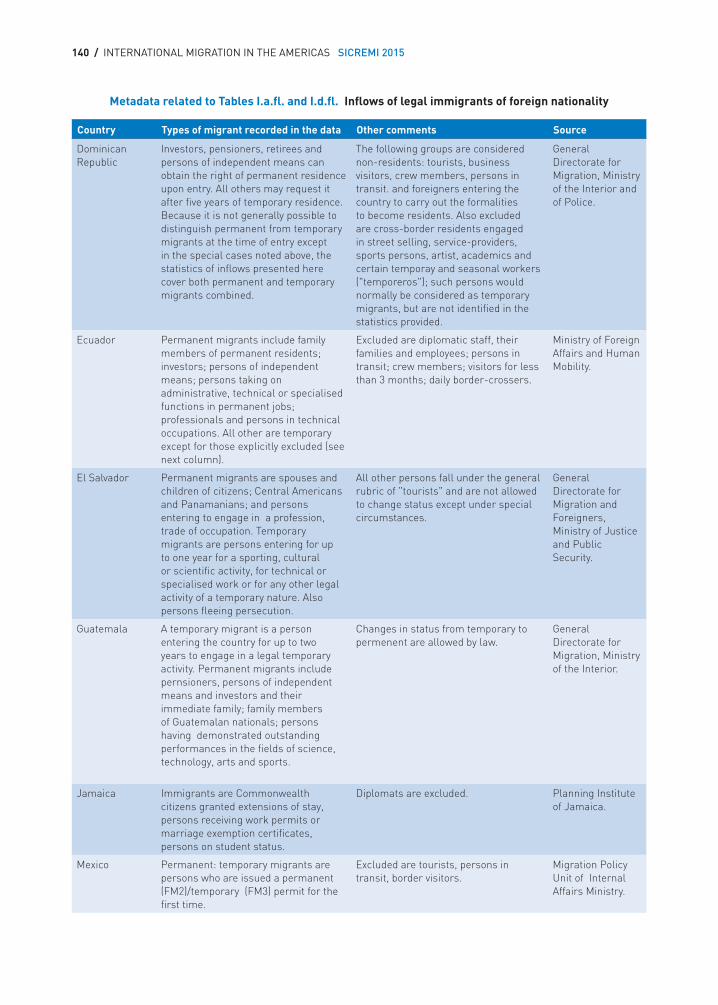
140 / INTERNATIONAL MIGRATION IN THE AMERICAS SICREMI 2015
Country Types of migrant recorded in the data Other comments Source
Dominican Republic
Investors, pensioners, retirees and persons of independent means can obtain the right of permanent residence upon entry. All others may request it after five years of temporary residence. Because it is not generally possible to distinguish permanent from temporary migrants at the time of entry except in the special cases noted above, the statistics of inflows presented here cover both permanent and temporary migrants combined.
The following groups are considered non-residents: tourists, business visitors, crew members, persons in transit. and foreigners entering the country to carry out the formalities to become residents. Also excluded are cross-border residents engaged in street selling, service-providers, sports persons, artist, academics and certain temporay and seasonal workers ("temporeros"); such persons would normally be considered as temporary migrants, but are not identified in the statistics provided.
General Directorate for Migration, Ministry of the Interior and of Police.
Ecuador Permanent migrants include family members of permanent residents; investors; persons of independent means; persons taking on administrative, technical or specialised functions in permanent jobs; professionals and persons in technical occupations. All other are temporary except for those explicitly excluded (see next column).
Excluded are diplomatic staff, their families and employees; persons in transit; crew members; visitors for less than 3 months; daily border-crossers.
Ministry of Foreign Affairs and Human Mobility.
El Salvador Permanent migrants are spouses and children of citizens; Central Americans and Panamanians; and persons entering to engage in a profession, trade of occupation. Temporary migrants are persons entering for up to one year for a sporting, cultural or scientific activity, for technical or specialised work or for any other legal activity of a temporary nature. Also persons fleeing persecution.
All other persons fall under the general rubric of "tourists" and are not allowed to change status except under special circumstances.
General Directorate for Migration and Foreigners, Ministry of Justice and Public Security.
Guatemala A temporary migrant is a person entering the country for up to two years to engage in a legal temporary activity. Permanent migrants include pernsioners, persons of independent means and investors and their immediate family; family members of Guatemalan nationals; persons having demonstrated outstanding performances in the fields of science, technology, arts and sports.
Changes in status from temporary to permenent are allowed by law.
General Directorate for Migration, Ministry of the Interior.
Jamaica Immigrants are Commonwealth citizens granted extensions of stay, persons receiving work permits or marriage exemption certificates, persons on student status.
Diplomats are excluded. Planning Institute of Jamaica.
Mexico Permanent: temporary migrants are persons who are issued a permanent (FM2)/temporary (FM3) permit for the first time.
Excluded are tourists, persons in transit, border visitors.
Migration Policy Unit of Internal Affairs Ministry.
Metadata related to Tables I.a.fl. and I.d.fl. Inflows of legal immigrants of foreign nationality
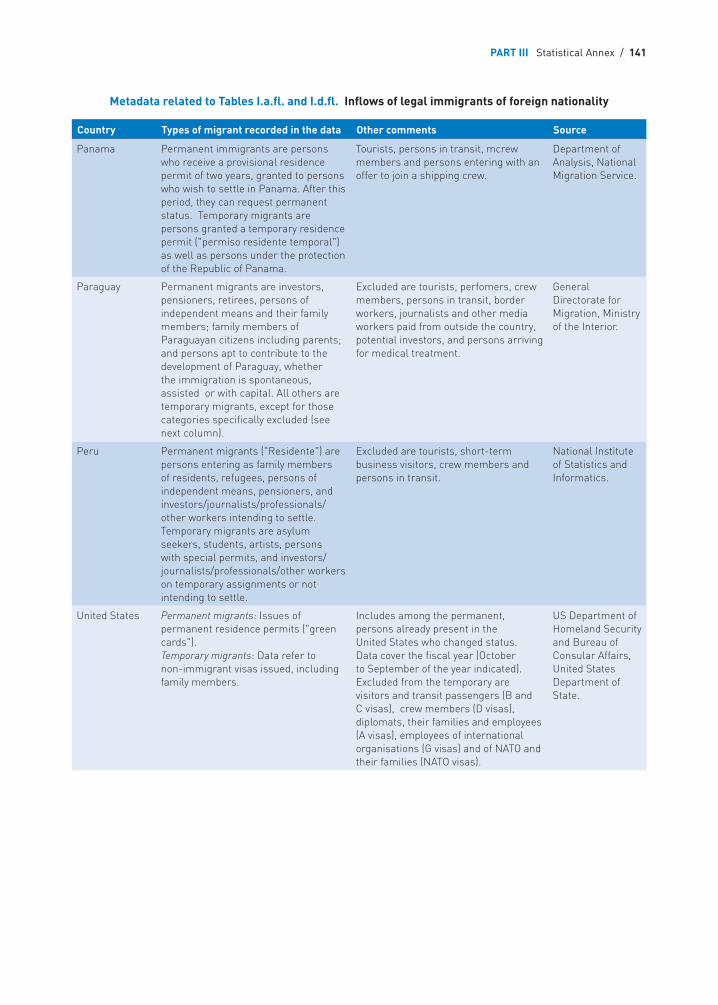
PART III Statistical Annex / 141
Country Types of migrant recorded in the data Other comments Source
Panama Permanent immigrants are persons who receive a provisional residence permit of two years, granted to persons who wish to settle in Panama. After this period, they can request permanent status. Temporary migrants are persons granted a temporary residence permit ("permiso residente temporal") as well as persons under the protection of the Republic of Panama.
Tourists, persons in transit, mcrew members and persons entering with an offer to join a shipping crew.
Department of Analysis, National Migration Service.
Paraguay Permanent migrants are investors, pensioners, retirees, persons of independent means and their family members; family members of Paraguayan citizens including parents; and persons apt to contribute to the development of Paraguay, whether the immigration is spontaneous, assisted or with capital. All others are temporary migrants, except for those categories specifically excluded (see next column).
Excluded are tourists, perfomers, crew members, persons in transit, border workers, journalists and other media workers paid from outside the country, potential investors, and persons arriving for medical treatment.
General Directorate for Migration, Ministry of the Interior.
Peru Permanent migrants ("Residente") are persons entering as family members of residents, refugees, persons of independent means, pensioners, and investors/journalists/professionals/other workers intending to settle. Temporary migrants are asylum seekers, students, artists, persons with special permits, and investors/ journalists/professionals/other workers on temporary assignments or not intending to settle.
Excluded are tourists, short-term business visitors, crew members and persons in transit.
National Institute of Statistics and Informatics.
United States Permanent migrants: Issues of permanent residence permits ("green cards"). Temporary migrants: Data refer to non-immigrant visas issued, including family members.
Includes among the permanent, persons already present in the United States who changed status. Data cover the fiscal year (October to September of the year indicated). Excluded from the temporary are visitors and transit passengers (B and C visas), crew members (D visas), diplomats, their families and employees (A visas), employees of international organisations (G visas) and of NATO and their families (NATO visas).
US Department of Homeland Security and Bureau of Consular Affairs, United States Department of State.
Metadata related to Tables I.a.fl. and I.d.fl. Inflows of legal immigrants of foreign nationality
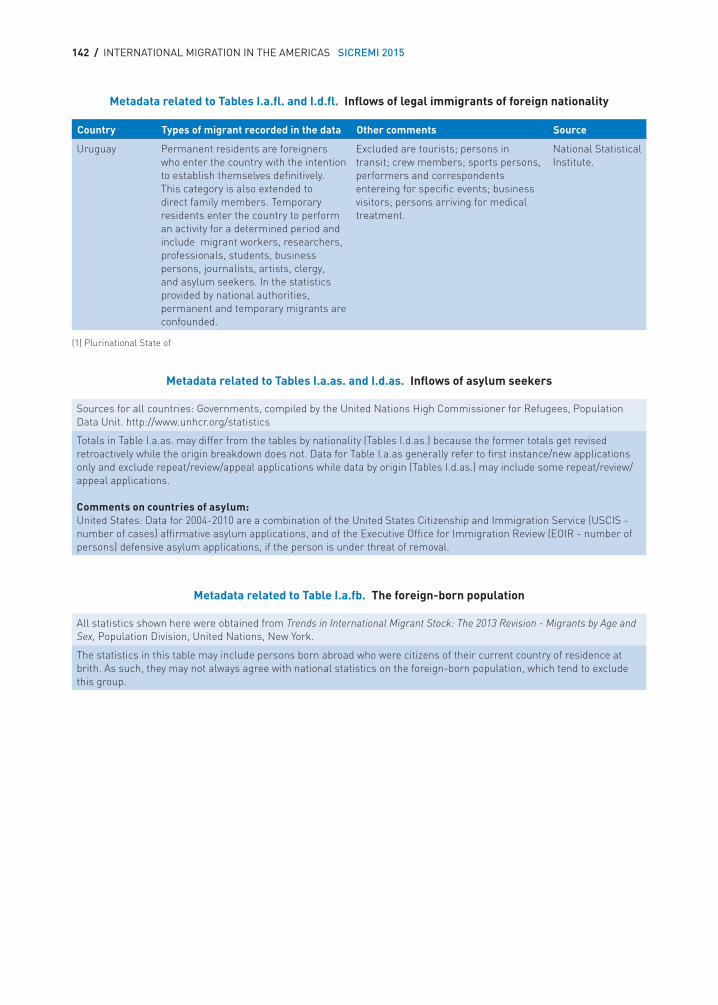
142 / INTERNATIONAL MIGRATION IN THE AMERICAS SICREMI 2015
Country Types of migrant recorded in the data Other comments Source
Uruguay Permanent residents are foreigners who enter the country with the intention to establish themselves definitively. This category is also extended to direct family members. Temporary residents enter the country to perform an activity for a determined period and include migrant workers, researchers, professionals, students, business persons, journalists, artists, clergy, and asylum seekers. In the statistics provided by national authorities, permanent and temporary migrants are confounded.
Excluded are tourists; persons in transit; crew members; sports persons, performers and correspondents entereing for specific events; business visitors; persons arriving for medical treatment.
National Statistical Institute.
(1) Plurinational State of
Metadata related to Tables I.a.fl. and I.d.fl. Inflows of legal immigrants of foreign nationality
Sources for all countries: Governments, compiled by the United Nations High Commissioner for Refugees, Population Data Unit. http://www.unhcr.org/statistics
Totals in Table I.a.as. may differ from the tables by nationality (Tables I.d.as.) because the former totals get revised retroactively while the origin breakdown does not. Data for Table I.a.as generally refer to first instance/new applications only and exclude repeat/review/appeal applications while data by origin (Tables I.d.as.) may include some repeat/review/appeal applications. Comments on countries of asylum: United States: Data for 2004-2010 are a combination of the United States Citizenship and Immigration Service (USCIS - number of cases) affirmative asylum applications, and of the Executive Office for Immigration Review (EOIR - number of persons) defensive asylum applications, if the person is under threat of removal.
All statistics shown here were obtained from Trends in International Migrant Stock: The 2013 Revision - Migrants by Age and Sex, Population Division, United Nations, New York.
The statistics in this table may include persons born abroad who were citizens of their current country of residence at brith. As such, they may not always agree with national statistics on the foreign-born population, which tend to exclude this group.
Metadata related to Tables I.a.as. and I.d.as. Inflows of asylum seekers
Metadata related to Table I.a.fb. The foreign-born population
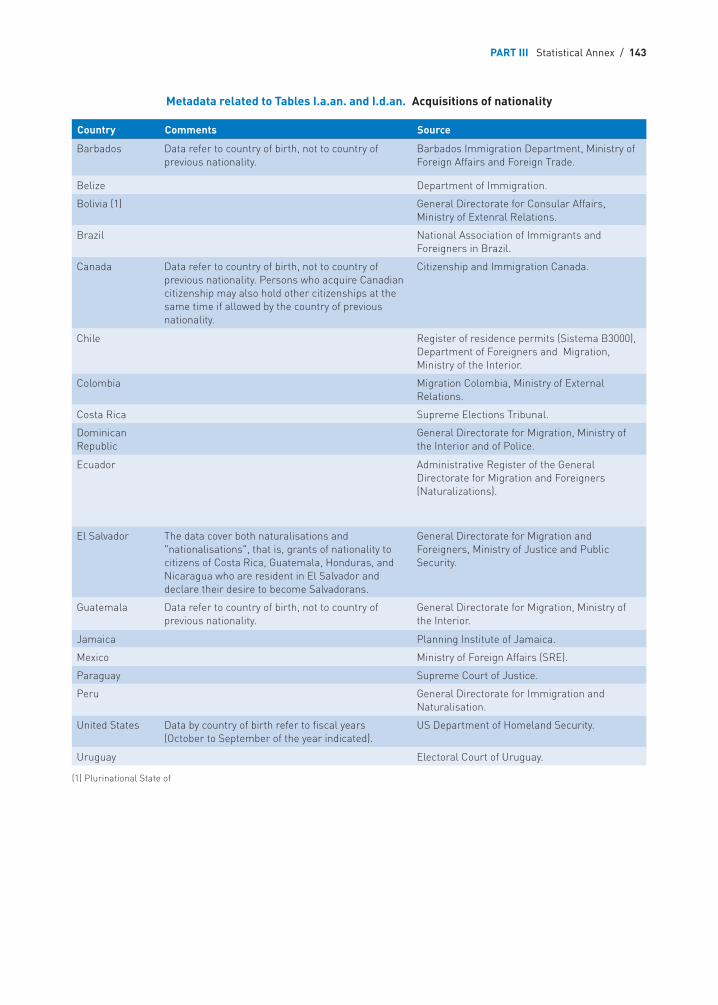
PART III Statistical Annex / 143
Country Comments Source
Barbados Data refer to country of birth, not to country of previous nationality.
Barbados Immigration Department, Ministry of Foreign Affairs and Foreign Trade.
Belize Department of Immigration.
Bolivia (1) General Directorate for Consular Affairs, Ministry of Extenral Relations.
Brazil National Association of Immigrants and Foreigners in Brazil.
Canada Data refer to country of birth, not to country of previous nationality. Persons who acquire Canadian citizenship may also hold other citizenships at the same time if allowed by the country of previous nationality.
Citizenship and Immigration Canada.
Chile Register of residence permits (Sistema B3000), Department of Foreigners and Migration, Ministry of the Interior.
Colombia Migration Colombia, Ministry of External Relations.
Costa Rica Supreme Elections Tribunal.
Dominican Republic
General Directorate for Migration, Ministry of the Interior and of Police.
Ecuador Administrative Register of the General Directorate for Migration and Foreigners (Naturalizations).
El Salvador The data cover both naturalisations and "nationalisations", that is, grants of nationality to citizens of Costa Rica, Guatemala, Honduras, and Nicaragua who are resident in El Salvador and declare their desire to become Salvadorans.
General Directorate for Migration and Foreigners, Ministry of Justice and Public Security.
Guatemala Data refer to country of birth, not to country of previous nationality.
General Directorate for Migration, Ministry of the Interior.
Jamaica Planning Institute of Jamaica.
Mexico Ministry of Foreign Affairs (SRE).
Paraguay Supreme Court of Justice.
Peru General Directorate for Immigration and Naturalisation.
United States Data by country of birth refer to fiscal years (October to September of the year indicated).
US Department of Homeland Security.
Uruguay Electoral Court of Uruguay.
(1) Plurinational State of
Metadata related to Tables I.a.an. and I.d.an. Acquisitions of nationality
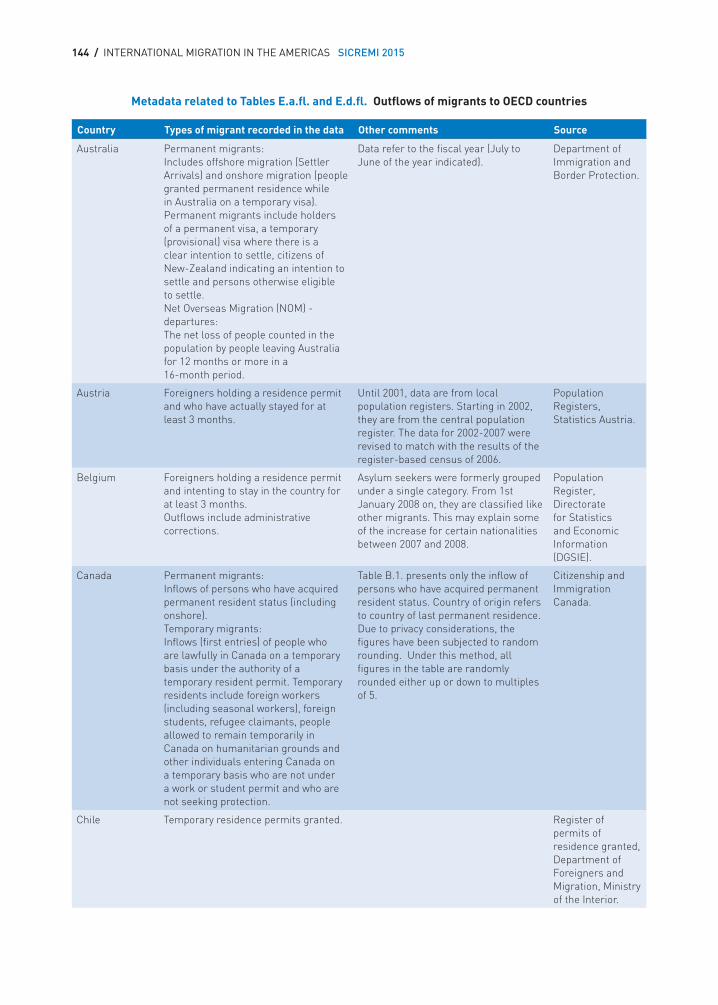
144 / INTERNATIONAL MIGRATION IN THE AMERICAS SICREMI 2015
Country Types of migrant recorded in the data Other comments Source
Australia Permanent migrants: Includes offshore migration (Settler Arrivals) and onshore migration (people granted permanent residence while in Australia on a temporary visa). Permanent migrants include holders of a permanent visa, a temporary (provisional) visa where there is a clear intention to settle, citizens of New-Zealand indicating an intention to settle and persons otherwise eligible to settle. Net Overseas Migration (NOM) - departures: The net loss of people counted in the population by people leaving Australia for 12 months or more in a 16-month period.
Data refer to the fiscal year (July to June of the year indicated).
Department of Immigration and Border Protection.
Austria Foreigners holding a residence permit and who have actually stayed for at least 3 months.
Until 2001, data are from local population registers. Starting in 2002, they are from the central population register. The data for 2002-2007 were revised to match with the results of the register-based census of 2006.
Population Registers, Statistics Austria.
Belgium Foreigners holding a residence permit and intenting to stay in the country for at least 3 months. Outflows include administrative corrections.
Asylum seekers were formerly grouped under a single category. From 1st January 2008 on, they are classified like other migrants. This may explain some of the increase for certain nationalities between 2007 and 2008.
Population Register, Directorate for Statistics and Economic Information (DGSIE).
Canada Permanent migrants: Inflows of persons who have acquired permanent resident status (including onshore). Temporary migrants: Inflows (first entries) of people who are lawfully in Canada on a temporary basis under the authority of a temporary resident permit. Temporary residents include foreign workers (including seasonal workers), foreign students, refugee claimants, people allowed to remain temporarily in Canada on humanitarian grounds and other individuals entering Canada on a temporary basis who are not under a work or student permit and who are not seeking protection.
Table B.1. presents only the inflow of persons who have acquired permanent resident status. Country of origin refers to country of last permanent residence. Due to privacy considerations, the figures have been subjected to random rounding. Under this method, all figures in the table are randomly rounded either up or down to multiples of 5.
Citizenship and Immigration Canada.
Chile Temporary residence permits granted. Register of permits of residence granted, Department of Foreigners and Migration, Ministry of the Interior.
Metadata related to Tables E.a.fl. and E.d.fl. Outflows of migrants to OECD countries
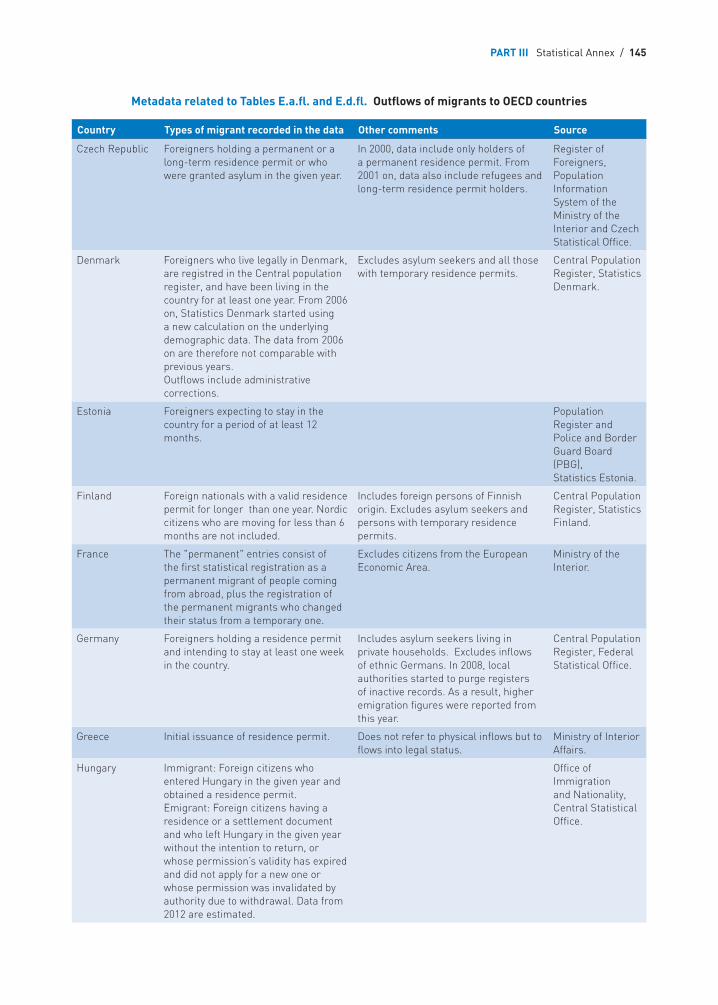
PART III Statistical Annex / 145
Country Types of migrant recorded in the data Other comments Source
Czech Republic Foreigners holding a permanent or a long-term residence permit or who were granted asylum in the given year.
In 2000, data include only holders of a permanent residence permit. From 2001 on, data also include refugees and long-term residence permit holders.
Register of Foreigners, Population Information System of the Ministry of the Interior and Czech Statistical Office.
Denmark Foreigners who live legally in Denmark, are registred in the Central population register, and have been living in the country for at least one year. From 2006 on, Statistics Denmark started using a new calculation on the underlying demographic data. The data from 2006 on are therefore not comparable with previous years. Outflows include administrative corrections.
Excludes asylum seekers and all those with temporary residence permits.
Central Population Register, Statistics Denmark.
Estonia Foreigners expecting to stay in the country for a period of at least 12 months.
Population Register and Police and Border Guard Board (PBG), Statistics Estonia.
Finland Foreign nationals with a valid residence permit for longer than one year. Nordic citizens who are moving for less than 6 months are not included.
Includes foreign persons of Finnish origin. Excludes asylum seekers and persons with temporary residence permits.
Central Population Register, Statistics Finland.
France The "permanent" entries consist of the first statistical registration as a permanent migrant of people coming from abroad, plus the registration of the permanent migrants who changed their status from a temporary one.
Excludes citizens from the European Economic Area.
Ministry of the Interior.
Germany Foreigners holding a residence permit and intending to stay at least one week in the country.
Includes asylum seekers living in private households. Excludes inflows of ethnic Germans. In 2008, local authorities started to purge registers of inactive records. As a result, higher emigration figures were reported from this year.
Central Population Register, Federal Statistical Office.
Greece Initial issuance of residence permit. Does not refer to physical inflows but to flows into legal status.
Ministry of Interior Affairs.
Hungary Immigrant: Foreign citizens who entered Hungary in the given year and obtained a residence permit. Emigrant: Foreign citizens having a residence or a settlement document and who left Hungary in the given year without the intention to return, or whose permission’s validity has expired and did not apply for a new one or whose permission was invalidated by authority due to withdrawal. Data from 2012 are estimated.
Office of Immigration and Nationality, Central Statistical Office.
Metadata related to Tables E.a.fl. and E.d.fl. Outflows of migrants to OECD countries
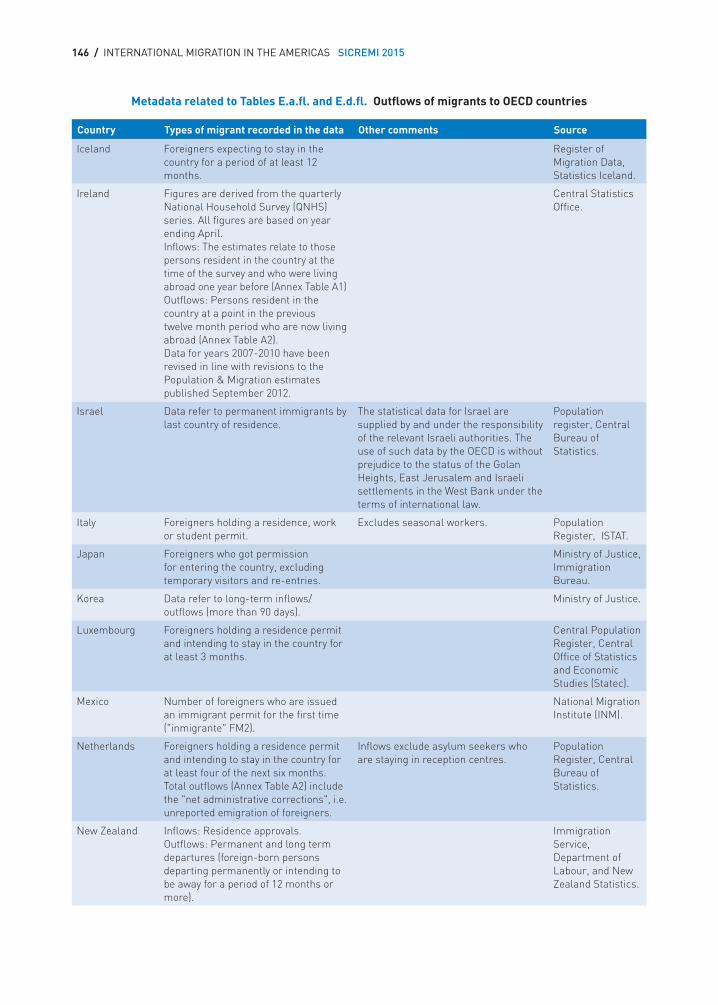
146 / INTERNATIONAL MIGRATION IN THE AMERICAS SICREMI 2015
Country Types of migrant recorded in the data Other comments Source
Iceland Foreigners expecting to stay in the country for a period of at least 12 months.
Register of Migration Data, Statistics Iceland.
Ireland Figures are derived from the quarterly National Household Survey (QNHS) series. All figures are based on year ending April. Inflows: The estimates relate to those persons resident in the country at the time of the survey and who were living abroad one year before (Annex Table A1) Outflows: Persons resident in the country at a point in the previous twelve month period who are now living abroad (Annex Table A2). Data for years 2007-2010 have been revised in line with revisions to the Population & Migration estimates published September 2012.
Central Statistics Office.
Israel Data refer to permanent immigrants by last country of residence.
The statistical data for Israel are supplied by and under the responsibility of the relevant Israeli authorities. The use of such data by the OECD is without prejudice to the status of the Golan Heights, East Jerusalem and Israeli settlements in the West Bank under the terms of international law.
Population register, Central Bureau of Statistics.
Italy Foreigners holding a residence, work or student permit.
Excludes seasonal workers. Population Register, ISTAT.
Japan Foreigners who got permission for entering the country, excluding temporary visitors and re-entries.
Ministry of Justice, Immigration Bureau.
Korea Data refer to long-term inflows/outflows (more than 90 days).
Ministry of Justice.
Luxembourg Foreigners holding a residence permit and intending to stay in the country for at least 3 months.
Central Population Register, Central Office of Statistics and Economic Studies (Statec).
Mexico Number of foreigners who are issued an immigrant permit for the first time ("inmigrante" FM2).
National Migration Institute (INM).
Netherlands Foreigners holding a residence permit and intending to stay in the country for at least four of the next six months. Total outflows (Annex Table A2) include the "net administrative corrections", i.e. unreported emigration of foreigners.
Inflows exclude asylum seekers who are staying in reception centres.
Population Register, Central Bureau of Statistics.
New Zealand Inflows: Residence approvals. Outflows: Permanent and long term departures (foreign-born persons departing permanently or intending to be away for a period of 12 months or more).
Immigration Service, Department of Labour, and New Zealand Statistics.
Metadata related to Tables E.a.fl. and E.d.fl. Outflows of migrants to OECD countries
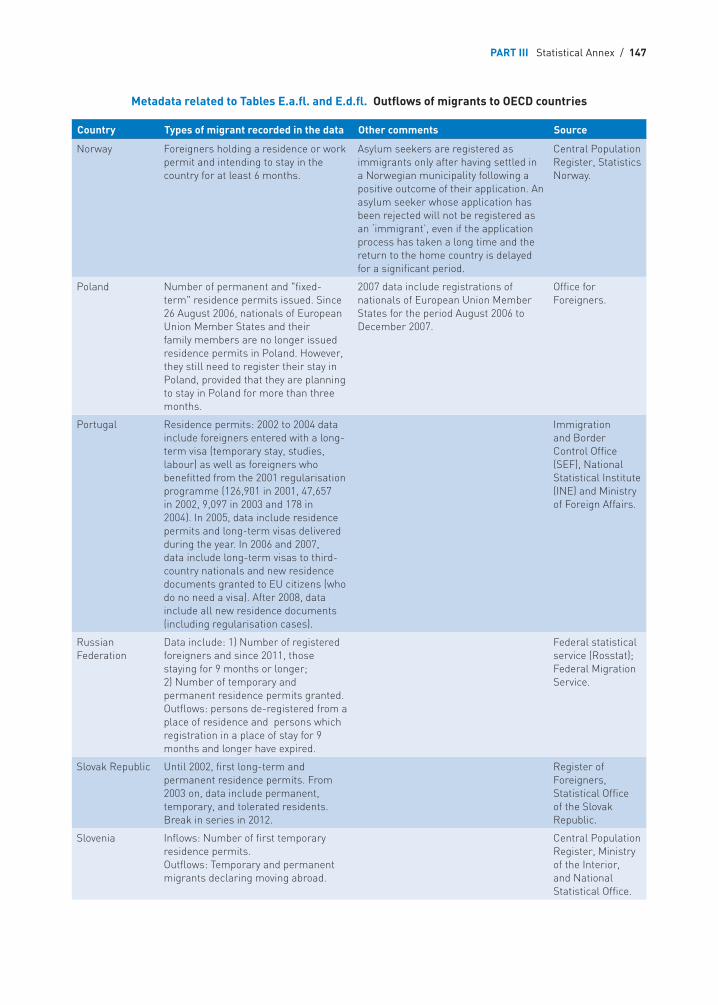
PART III Statistical Annex / 147
Country Types of migrant recorded in the data Other comments Source
Norway Foreigners holding a residence or work permit and intending to stay in the country for at least 6 months.
Asylum seekers are registered as immigrants only after having settled in a Norwegian municipality following a positive outcome of their application. An asylum seeker whose application has been rejected will not be registered as an ‘immigrant’, even if the application process has taken a long time and the return to the home country is delayed for a significant period.
Central Population Register, Statistics Norway.
Poland Number of permanent and "fixed-term" residence permits issued. Since 26 August 2006, nationals of European Union Member States and their family members are no longer issued residence permits in Poland. However, they still need to register their stay in Poland, provided that they are planning to stay in Poland for more than three months.
2007 data include registrations of nationals of European Union Member States for the period August 2006 to December 2007.
Office for Foreigners.
Portugal Residence permits: 2002 to 2004 data include foreigners entered with a long-term visa (temporary stay, studies, labour) as well as foreigners who benefitted from the 2001 regularisation programme (126,901 in 2001, 47,657 in 2002, 9,097 in 2003 and 178 in 2004). In 2005, data include residence permits and long-term visas delivered during the year. In 2006 and 2007, data include long-term visas to third-country nationals and new residence documents granted to EU citizens (who do no need a visa). After 2008, data include all new residence documents (including regularisation cases).
Immigration and Border Control Office (SEF), National Statistical Institute (INE) and Ministry of Foreign Affairs.
Russian Federation
Data include: 1) Number of registered foreigners and since 2011, those staying for 9 months or longer; 2) Number of temporary and permanent residence permits granted. Outflows: persons de-registered from a place of residence and persons which registration in a place of stay for 9 months and longer have expired.
Federal statistical service (Rosstat); Federal Migration Service.
Slovak Republic Until 2002, first long-term and permanent residence permits. From 2003 on, data include permanent, temporary, and tolerated residents. Break in series in 2012.
Register of Foreigners, Statistical Office of the Slovak Republic.
Slovenia Inflows: Number of first temporary residence permits. Outflows: Temporary and permanent migrants declaring moving abroad.
Central Population Register, Ministry of the Interior, and National Statistical Office.
Metadata related to Tables E.a.fl. and E.d.fl. Outflows of migrants to OECD countries
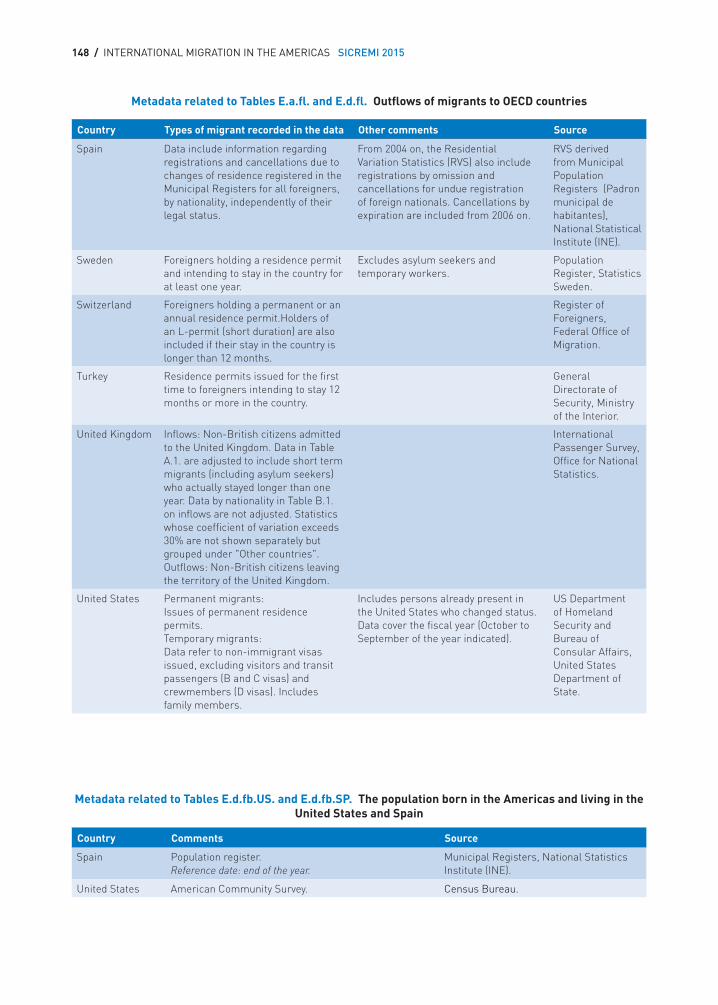
148 / INTERNATIONAL MIGRATION IN THE AMERICAS SICREMI 2015
Country Types of migrant recorded in the data Other comments Source
Spain Data include information regarding registrations and cancellations due to changes of residence registered in the Municipal Registers for all foreigners, by nationality, independently of their legal status.
From 2004 on, the Residential Variation Statistics (RVS) also include registrations by omission and cancellations for undue registration of foreign nationals. Cancellations by expiration are included from 2006 on.
RVS derived from Municipal Population Registers (Padron municipal de habitantes), National Statistical Institute (INE).
Sweden Foreigners holding a residence permit and intending to stay in the country for at least one year.
Excludes asylum seekers and temporary workers.
Population Register, Statistics Sweden.
Switzerland Foreigners holding a permanent or an annual residence permit.Holders of an L-permit (short duration) are also included if their stay in the country is longer than 12 months.
Register of Foreigners, Federal Office of Migration.
Turkey Residence permits issued for the first time to foreigners intending to stay 12 months or more in the country.
General Directorate of Security, Ministry of the Interior.
United Kingdom Inflows: Non-British citizens admitted to the United Kingdom. Data in Table A.1. are adjusted to include short term migrants (including asylum seekers) who actually stayed longer than one year. Data by nationality in Table B.1. on inflows are not adjusted. Statistics whose coefficient of variation exceeds 30% are not shown separately but grouped under "Other countries". Outflows: Non-British citizens leaving the territory of the United Kingdom.
International Passenger Survey, Office for National Statistics.
United States Permanent migrants: Issues of permanent residence permits. Temporary migrants: Data refer to non-immigrant visas issued, excluding visitors and transit passengers (B and C visas) and crewmembers (D visas). Includes family members.
Includes persons already present in the United States who changed status. Data cover the fiscal year (October to September of the year indicated).
US Department of Homeland Security and Bureau of Consular Affairs, United States Department of State.
Metadata related to Tables E.a.fl. and E.d.fl. Outflows of migrants to OECD countries
Country Comments Source
Spain Population register. Reference date: end of the year.
Municipal Registers, National Statistics Institute (INE).
United States American Community Survey. Census Bureau.
Metadata related to Tables E.d.fb.US. and E.d.fb.SP. The population born in the Americas and living in the United States and Spain
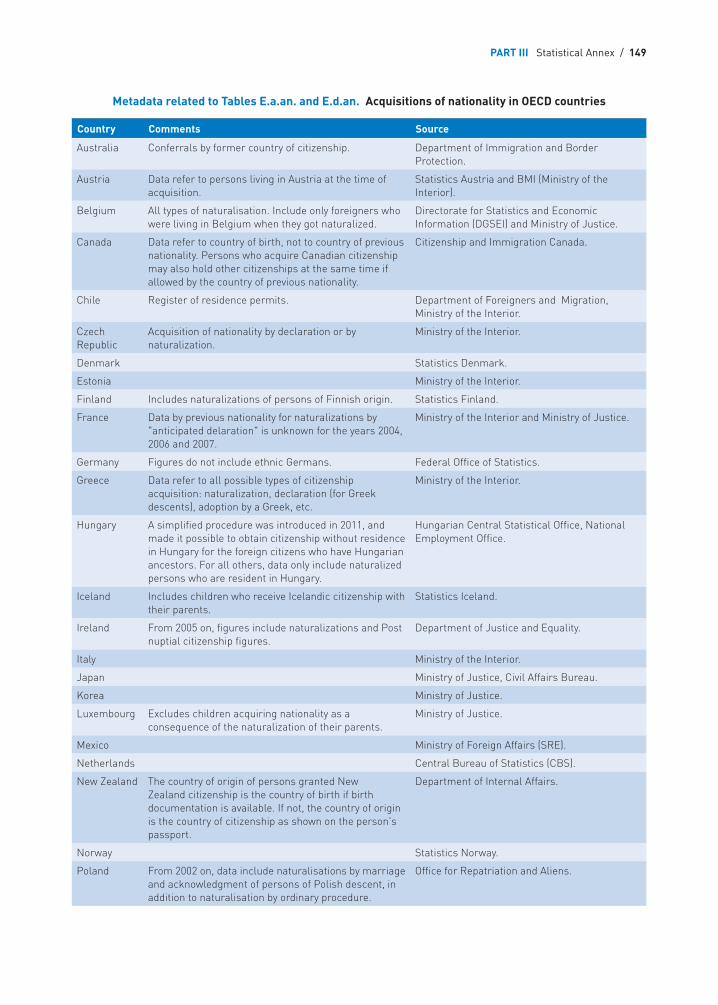
PART III Statistical Annex / 149
Country Comments Source
Australia Conferrals by former country of citizenship. Department of Immigration and Border Protection.
Austria Data refer to persons living in Austria at the time of acquisition.
Statistics Austria and BMI (Ministry of the Interior).
Belgium All types of naturalisation. Include only foreigners who were living in Belgium when they got naturalized.
Directorate for Statistics and Economic Information (DGSEI) and Ministry of Justice.
Canada Data refer to country of birth, not to country of previous nationality. Persons who acquire Canadian citizenship may also hold other citizenships at the same time if allowed by the country of previous nationality.
Citizenship and Immigration Canada.
Chile Register of residence permits. Department of Foreigners and Migration, Ministry of the Interior.
Czech Republic
Acquisition of nationality by declaration or by naturalization.
Ministry of the Interior.
Denmark Statistics Denmark.
Estonia Ministry of the Interior.
Finland Includes naturalizations of persons of Finnish origin. Statistics Finland.
France Data by previous nationality for naturalizations by "anticipated delaration" is unknown for the years 2004, 2006 and 2007.
Ministry of the Interior and Ministry of Justice.
Germany Figures do not include ethnic Germans. Federal Office of Statistics.
Greece Data refer to all possible types of citizenship acquisition: naturalization, declaration (for Greek descents), adoption by a Greek, etc.
Ministry of the Interior.
Hungary A simplified procedure was introduced in 2011, and made it possible to obtain citizenship without residence in Hungary for the foreign citizens who have Hungarian ancestors. For all others, data only include naturalized persons who are resident in Hungary.
Hungarian Central Statistical Office, National Employment Office.
Iceland Includes children who receive Icelandic citizenship with their parents.
Statistics Iceland.
Ireland From 2005 on, figures include naturalizations and Post nuptial citizenship figures.
Department of Justice and Equality.
Italy Ministry of the Interior.
Japan Ministry of Justice, Civil Affairs Bureau.
Korea Ministry of Justice.
Luxembourg Excludes children acquiring nationality as a consequence of the naturalization of their parents.
Ministry of Justice.
Mexico Ministry of Foreign Affairs (SRE).
Netherlands Central Bureau of Statistics (CBS).
New Zealand The country of origin of persons granted New Zealand citizenship is the country of birth if birth documentation is available. If not, the country of origin is the country of citizenship as shown on the person's passport.
Department of Internal Affairs.
Norway Statistics Norway.
Poland From 2002 on, data include naturalisations by marriage and acknowledgment of persons of Polish descent, in addition to naturalisation by ordinary procedure.
Office for Repatriation and Aliens.
Metadata related to Tables E.a.an. and E.d.an. Acquisitions of nationality in OECD countries
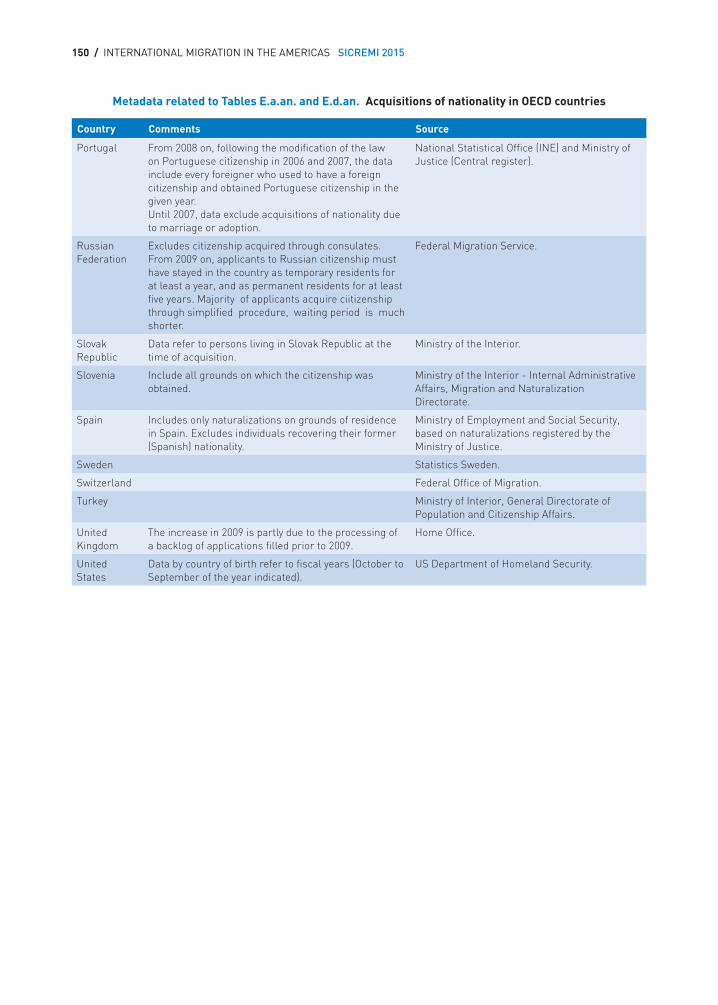
150 / INTERNATIONAL MIGRATION IN THE AMERICAS SICREMI 2015
Country Comments Source
Portugal From 2008 on, following the modification of the law on Portuguese citizenship in 2006 and 2007, the data include every foreigner who used to have a foreign citizenship and obtained Portuguese citizenship in the given year. Until 2007, data exclude acquisitions of nationality due to marriage or adoption.
National Statistical Office (INE) and Ministry of Justice (Central register).
Russian Federation
Excludes citizenship acquired through consulates. From 2009 on, applicants to Russian citizenship must have stayed in the country as temporary residents for at least a year, and as permanent residents for at least five years. Majority of applicants acquire ciitizenship through simplified procedure, waiting period is much shorter.
Federal Migration Service.
Slovak Republic
Data refer to persons living in Slovak Republic at the time of acquisition.
Ministry of the Interior.
Slovenia Include all grounds on which the citizenship was obtained.
Ministry of the Interior - Internal Administrative Affairs, Migration and Naturalization Directorate.
Spain Includes only naturalizations on grounds of residence in Spain. Excludes individuals recovering their former (Spanish) nationality.
Ministry of Employment and Social Security, based on naturalizations registered by the Ministry of Justice.
Sweden Statistics Sweden.
Switzerland Federal Office of Migration.
Turkey Ministry of Interior, General Directorate of Population and Citizenship Affairs.
United Kingdom
The increase in 2009 is partly due to the processing of a backlog of applications filled prior to 2009.
Home Office.
United States
Data by country of birth refer to fiscal years (October to September of the year indicated).
US Department of Homeland Security.
Metadata related to Tables E.a.an. and E.d.an. Acquisitions of nationality in OECD countries
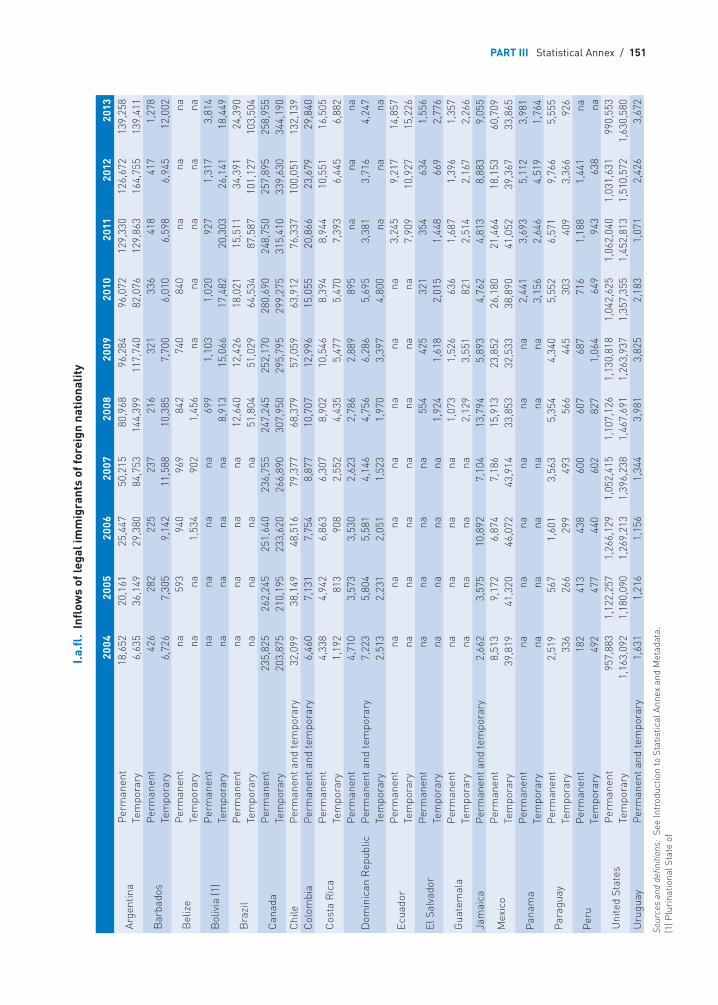
PART III Statistical Annex / 151
I.a.
fl.
Infl
ows
of le
gal i
mm
igra
nts
of fo
reig
n na
tion
alit
y
2004
2005
2006
2007
2008
2009
2010
2011
2012
2013
Arge
ntin
aP
erm
anen
t18
,652
20,1
6125
,447
50,2
1580
,968
96,2
8496
,072
129,
330
126,
672
139,
258
Tem
pora
ry6,
635
36,1
4929
,380
84,7
5314
4,39
911
7,74
082
,076
129,
863
164,
755
139,
411
Bar
bado
sP
erm
anen
t42
628
222
523
721
632
133
641
841
71,
278
Tem
pora
ry6,
726
7,30
59,
142
11,5
8810
,385
7,70
06,
010
6,59
86,
945
12,0
02
Bel
ize
Per
man
ent
na59
3 94
0 96
9 84
2 74
0 84
0na
nana
Tem
pora
ryna
na1,
534
902
1,45
6na
nana
nana
Bol
ivia
(1)
Per
man
ent
nana
nana
699
1,10
31,
020
927
1,31
73,
814
Tem
pora
ryna
nana
na8,
913
15,0
6617
,482
20,3
0326
,141
18,4
49
Bra
zil
Per
man
ent
nana
nana
12,6
4012
,426
18,0
2115
,511
34,3
9124
,390
Tem
pora
ryna
nana
na51
,804
51
,029
64,5
3487
,587
101,
127
103,
504
Can
ada
Per
man
ent
235,
825
262,
245
251,
640
236,
755
247,
245
252,
170
280,
690
248,
750
257,
895
258,
955
Tem
pora
ry20
3,87
521
0,19
523
3,62
026
6,89
030
7,95
029
5,79
529
9,27
531
5,41
033
9,63
034
4,19
0C
hile
Per
man
ent a
nd te
mpo
rary
32,0
9938
,149
48,5
1679
,377
68,3
7957
,059
63,9
1276
,337
100,
051
132,
139
Col
ombi
aP
erm
anen
t and
tem
pora
ry6,
460
7,13
17,
754
8,87
710
,707
12,9
9615
,055
20,8
6623
,679
29,8
40
Cos
ta R
ica
Per
man
ent
4,33
84,
942
6,86
36,
307
8,90
210
,546
8,39
48,
944
10,5
5116
,505
Tem
pora
ry1,
192
813
908
2,55
24,
435
5,47
75,
470
7,39
36,
445
6,88
2
Dom
inic
an R
epub
licP
erm
anen
t4,
710
3,57
33,
530
2,62
32,
786
2,88
989
5na
nana
Per
man
ent a
nd te
mpo
rary
7,22
35,
804
5,58
14,
146
4,75
66,
286
5,69
53,
381
3,71
64,
247
Tem
pora
ry2,
513
2,23
12,
051
1,52
31,
970
3,39
74,
800
nana
na
Ecua
dor
Per
man
ent
nana
nana
nana
na3,
245
9,21
714
,857
Tem
pora
ryna
nana
nana
nana
7,90
910
,927
15,2
26
El S
alva
dor
Per
man
ent
nana
nana
554
425
321
354
634
1,55
6Te
mpo
rary
nana
nana
1,92
41,
618
2,01
51,
448
669
2,77
6
Gua
tem
ala
Per
man
ent
nana
nana
1,07
31,
526
636
1,68
71,
396
1,35
7Te
mpo
rary
nana
nana
2,12
93,
551
821
2,51
42,
167
2,26
6Ja
mai
caP
erm
anen
t and
tem
pora
ry2,
662
3,57
510
,892
7,10
413
,794
5,89
34,
762
4,81
38,
883
9,05
5
Mex
ico
Per
man
ent
8,51
39,
172
6,87
47,
186
15,9
1323
,852
26,1
8021
,464
18,1
5360
,709
Tem
pora
ry39
,819
41,3
2046
,072
43,9
1433
,853
32,5
3338
,890
41,0
5239
,367
33,8
65
Pan
ama
Per
man
ent
nana
nana
nana
2,44
13,
693
5,11
23,
981
Tem
pora
ryna
nana
nana
na3,
156
2,64
64,
519
1,76
4
Par
agua
yP
erm
anen
t2,
519
567
1,60
13,
563
5,35
44,
340
5,55
26,
571
9,76
65,
555
Tem
pora
ry33
626
629
949
356
644
530
340
93,
366
926
Per
uP
erm
anen
t18
241
343
860
060
768
771
61,
188
1,44
1na
Tem
pora
ry49
247
744
060
282
71,
064
649
943
638
na
Uni
ted
Stat
esP
erm
anen
t95
7,88
31,
122,
257
1,26
6,12
91,
052,
415
1,10
7,12
61,
130,
818
1,04
2,62
51,
062,
040
1,03
1,63
199
0,55
3Te
mpo
rary
1,16
3,09
21,
180,
090
1,26
9,21
31,
396,
238
1,46
7,69
11,
263,
937
1,35
7,35
51,
452,
813
1,51
0,57
21,
630,
580
Uru
guay
Per
man
ent a
nd te
mpo
rary
1,63
11,
216
1,15
61,
344
3,98
13,
825
2,18
31,
071
2,42
63,
672
Sour
ces
and
defin
ition
s: S
ee In
trod
uctio
n to
Sta
tistic
al A
nnex
and
Met
adat
a.
(1) P
luri
natio
nal S
tate
of
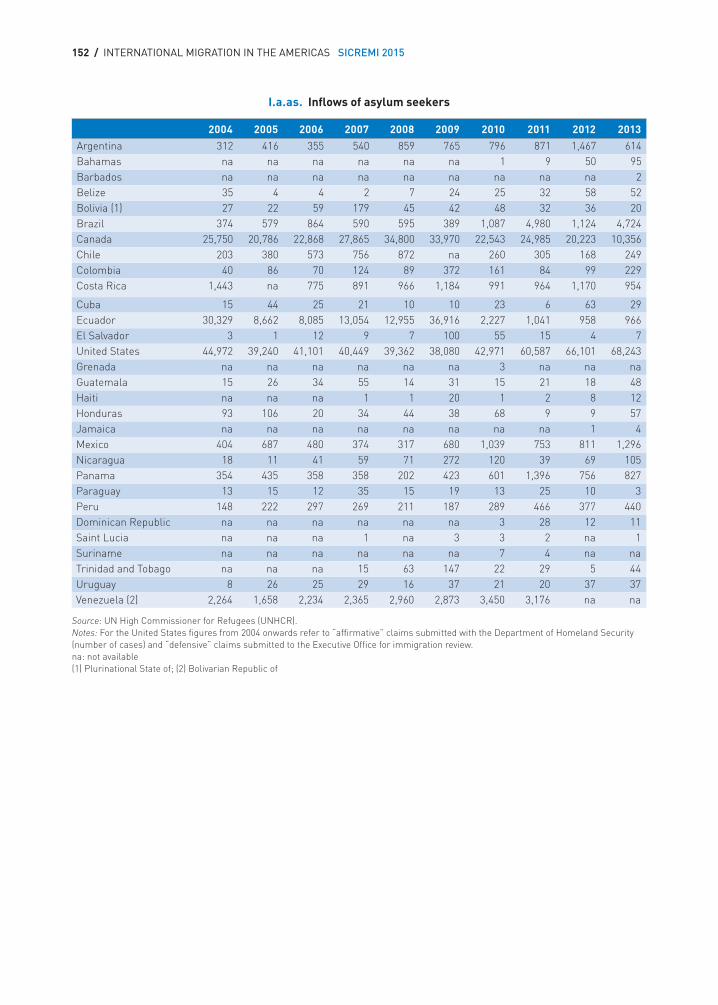
152 / INTERNATIONAL MIGRATION IN THE AMERICAS SICREMI 2015
I.a.as. Inflows of asylum seekers
2004 2005 2006 2007 2008 2009 2010 2011 2012 2013
Argentina 312 416 355 540 859 765 796 871 1,467 614Bahamas na na na na na na 1 9 50 95Barbados na na na na na na na na na 2Belize 35 4 4 2 7 24 25 32 58 52Bolivia (1) 27 22 59 179 45 42 48 32 36 20Brazil 374 579 864 590 595 389 1,087 4,980 1,124 4,724Canada 25,750 20,786 22,868 27,865 34,800 33,970 22,543 24,985 20,223 10,356Chile 203 380 573 756 872 na 260 305 168 249Colombia 40 86 70 124 89 372 161 84 99 229Costa Rica 1,443 na 775 891 966 1,184 991 964 1,170 954
Cuba 15 44 25 21 10 10 23 6 63 29Ecuador 30,329 8,662 8,085 13,054 12,955 36,916 2,227 1,041 958 966El Salvador 3 1 12 9 7 100 55 15 4 7United States 44,972 39,240 41,101 40,449 39,362 38,080 42,971 60,587 66,101 68,243Grenada na na na na na na 3 na na naGuatemala 15 26 34 55 14 31 15 21 18 48Haiti na na na 1 1 20 1 2 8 12Honduras 93 106 20 34 44 38 68 9 9 57Jamaica na na na na na na na na 1 4Mexico 404 687 480 374 317 680 1,039 753 811 1,296Nicaragua 18 11 41 59 71 272 120 39 69 105Panama 354 435 358 358 202 423 601 1,396 756 827Paraguay 13 15 12 35 15 19 13 25 10 3Peru 148 222 297 269 211 187 289 466 377 440Dominican Republic na na na na na na 3 28 12 11Saint Lucia na na na 1 na 3 3 2 na 1Suriname na na na na na na 7 4 na naTrinidad and Tobago na na na 15 63 147 22 29 5 44Uruguay 8 26 25 29 16 37 21 20 37 37Venezuela (2) 2,264 1,658 2,234 2,365 2,960 2,873 3,450 3,176 na na
Source: UN High Commissioner for Refugees (UNHCR).Notes: For the United States figures from 2004 onwards refer to “affirmative” claims submitted with the Department of Homeland Security (number of cases) and “defensive” claims submitted to the Executive Office for immigration review. na: not available(1) Plurinational State of; (2) Bolivarian Republic of
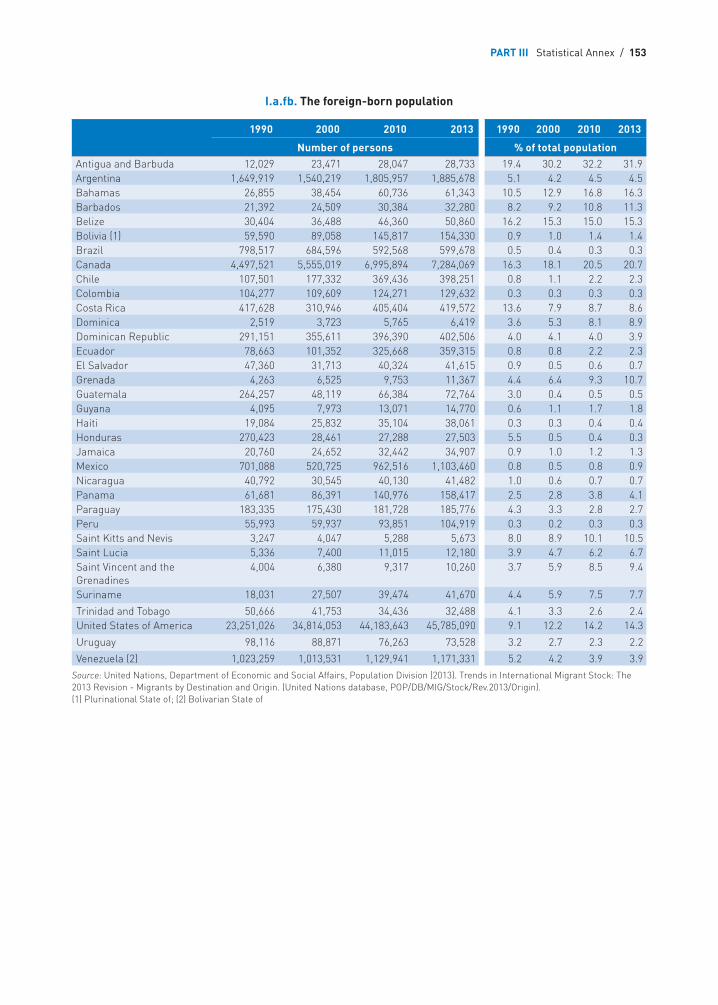
PART III Statistical Annex / 153
I.a.fb. The foreign-born population
1990 2000 2010 2013 1990 2000 2010 2013
Number of persons % of total populationAntigua and Barbuda 12,029 23,471 28,047 28,733 19.4 30.2 32.2 31.9Argentina 1,649,919 1,540,219 1,805,957 1,885,678 5.1 4.2 4.5 4.5Bahamas 26,855 38,454 60,736 61,343 10.5 12.9 16.8 16.3Barbados 21,392 24,509 30,384 32,280 8.2 9.2 10.8 11.3Belize 30,404 36,488 46,360 50,860 16.2 15.3 15.0 15.3Bolivia (1) 59,590 89,058 145,817 154,330 0.9 1.0 1.4 1.4Brazil 798,517 684,596 592,568 599,678 0.5 0.4 0.3 0.3Canada 4,497,521 5,555,019 6,995,894 7,284,069 16.3 18.1 20.5 20.7Chile 107,501 177,332 369,436 398,251 0.8 1.1 2.2 2.3Colombia 104,277 109,609 124,271 129,632 0.3 0.3 0.3 0.3Costa Rica 417,628 310,946 405,404 419,572 13.6 7.9 8.7 8.6Dominica 2,519 3,723 5,765 6,419 3.6 5.3 8.1 8.9Dominican Republic 291,151 355,611 396,390 402,506 4.0 4.1 4.0 3.9Ecuador 78,663 101,352 325,668 359,315 0.8 0.8 2.2 2.3El Salvador 47,360 31,713 40,324 41,615 0.9 0.5 0.6 0.7Grenada 4,263 6,525 9,753 11,367 4.4 6.4 9.3 10.7Guatemala 264,257 48,119 66,384 72,764 3.0 0.4 0.5 0.5Guyana 4,095 7,973 13,071 14,770 0.6 1.1 1.7 1.8Haiti 19,084 25,832 35,104 38,061 0.3 0.3 0.4 0.4Honduras 270,423 28,461 27,288 27,503 5.5 0.5 0.4 0.3Jamaica 20,760 24,652 32,442 34,907 0.9 1.0 1.2 1.3Mexico 701,088 520,725 962,516 1,103,460 0.8 0.5 0.8 0.9Nicaragua 40,792 30,545 40,130 41,482 1.0 0.6 0.7 0.7Panama 61,681 86,391 140,976 158,417 2.5 2.8 3.8 4.1Paraguay 183,335 175,430 181,728 185,776 4.3 3.3 2.8 2.7Peru 55,993 59,937 93,851 104,919 0.3 0.2 0.3 0.3Saint Kitts and Nevis 3,247 4,047 5,288 5,673 8.0 8.9 10.1 10.5Saint Lucia 5,336 7,400 11,015 12,180 3.9 4.7 6.2 6.7Saint Vincent and the Grenadines
4,004 6,380 9,317 10,260 3.7 5.9 8.5 9.4
Suriname 18,031 27,507 39,474 41,670 4.4 5.9 7.5 7.7
Trinidad and Tobago 50,666 41,753 34,436 32,488 4.1 3.3 2.6 2.4United States of America 23,251,026 34,814,053 44,183,643 45,785,090 9.1 12.2 14.2 14.3
Uruguay 98,116 88,871 76,263 73,528 3.2 2.7 2.3 2.2
Venezuela (2) 1,023,259 1,013,531 1,129,941 1,171,331 5.2 4.2 3.9 3.9Source: United Nations, Department of Economic and Social Affairs, Population Division (2013). Trends in International Migrant Stock: The 2013 Revision - Migrants by Destination and Origin. (United Nations database, POP/DB/MIG/Stock/Rev.2013/Origin).(1) Plurinational State of; (2) Bolivarian State of
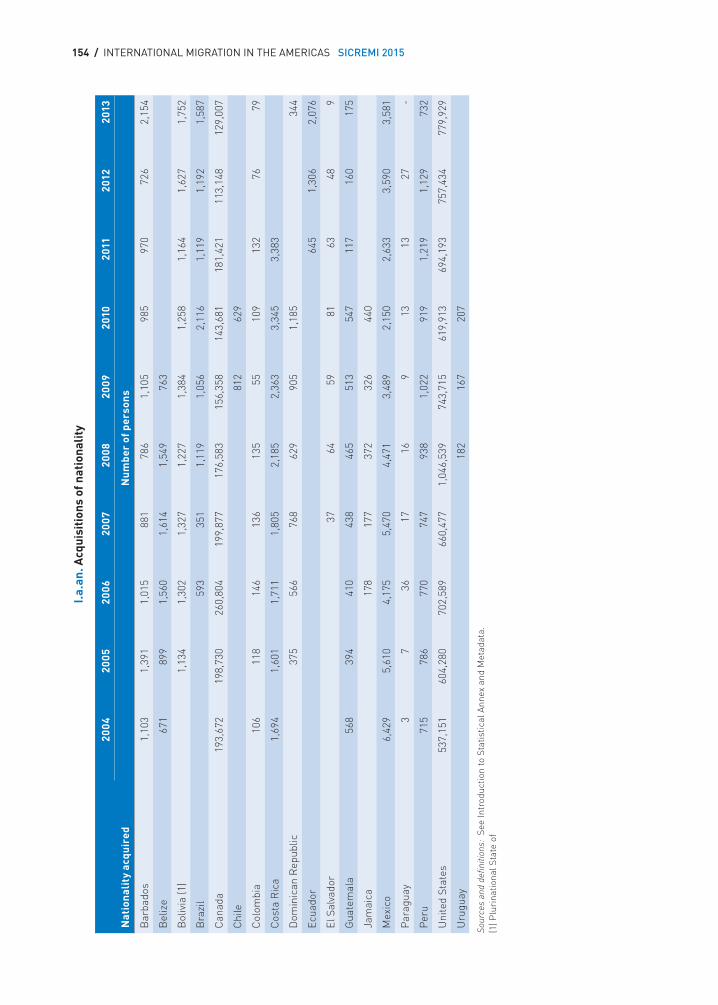
154 / INTERNATIONAL MIGRATION IN THE AMERICAS SICREMI 2015
I.a.
an. A
cqui
siti
ons
of n
atio
nalit
y
Nat
iona
lity
acq
uire
d
2004
2005
2006
2007
2008
2009
2010
2011
2012
2013
Num
ber
of p
erso
ns
Bar
bado
s1,
103
1,39
11,
015
881
786
1,10
598
597
072
62,
154
Bel
ize
671
899
1,56
01,
614
1,54
976
3
Bol
ivia
(1)
1,13
41,
302
1,32
71,
227
1,38
41,
258
1,16
41,
627
1,75
2
Bra
zil
593
351
1,11
91,
056
2,11
61,
119
1,19
21,
587
Can
ada
193,
672
198,
730
260,
804
199,
877
176,
583
156,
358
143,
681
181,
421
113,
148
129,
007
Chi
le81
262
9
Col
ombi
a10
611
814
613
613
555
109
132
7679
Cos
ta R
ica
1,69
41,
601
1,71
11,
805
2,18
52,
363
3,34
53,
383
Dom
inic
an R
epub
lic37
556
676
862
990
51,
185
344
Ecua
dor
645
1,30
62,
076
El S
alva
dor
3764
5981
6348
9
Gua
tem
ala
568
394
410
438
465
513
547
117
160
175
Jam
aica
178
177
372
326
440
Mex
ico
6,42
95,
610
4,17
55,
470
4,47
13,
489
2,15
02,
633
3,59
03,
581
Par
agua
y3
736
1716
913
1327
-
Per
u71
578
677
074
793
81,
022
919
1,21
91,
129
732
Uni
ted
Stat
es53
7,15
160
4,28
070
2,58
966
0,47
71,
046,
539
743,
715
619,
913
694,
193
757,
434
779,
929
Uru
guay
182
167
207
Sour
ces
and
defin
ition
s: S
ee In
trod
uctio
n to
Sta
tistic
al A
nnex
and
Met
adat
a.
(1) P
luri
natio
nal S
tate
of
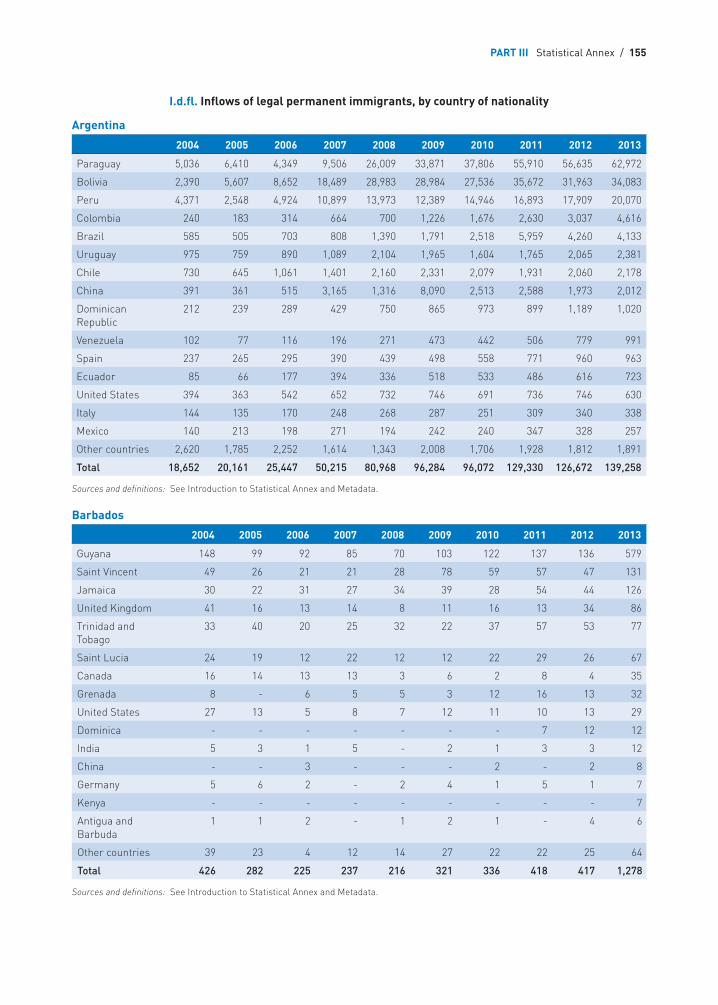
PART III Statistical Annex / 155
Argentina
2004 2005 2006 2007 2008 2009 2010 2011 2012 2013
Paraguay 5,036 6,410 4,349 9,506 26,009 33,871 37,806 55,910 56,635 62,972
Bolivia 2,390 5,607 8,652 18,489 28,983 28,984 27,536 35,672 31,963 34,083
Peru 4,371 2,548 4,924 10,899 13,973 12,389 14,946 16,893 17,909 20,070
Colombia 240 183 314 664 700 1,226 1,676 2,630 3,037 4,616
Brazil 585 505 703 808 1,390 1,791 2,518 5,959 4,260 4,133
Uruguay 975 759 890 1,089 2,104 1,965 1,604 1,765 2,065 2,381
Chile 730 645 1,061 1,401 2,160 2,331 2,079 1,931 2,060 2,178
China 391 361 515 3,165 1,316 8,090 2,513 2,588 1,973 2,012
Dominican Republic
212 239 289 429 750 865 973 899 1,189 1,020
Venezuela 102 77 116 196 271 473 442 506 779 991
Spain 237 265 295 390 439 498 558 771 960 963
Ecuador 85 66 177 394 336 518 533 486 616 723
United States 394 363 542 652 732 746 691 736 746 630
Italy 144 135 170 248 268 287 251 309 340 338
Mexico 140 213 198 271 194 242 240 347 328 257
Other countries 2,620 1,785 2,252 1,614 1,343 2,008 1,706 1,928 1,812 1,891
Total 18,652 20,161 25,447 50,215 80,968 96,284 96,072 129,330 126,672 139,258
Sources and definitions: See Introduction to Statistical Annex and Metadata.
Barbados
2004 2005 2006 2007 2008 2009 2010 2011 2012 2013
Guyana 148 99 92 85 70 103 122 137 136 579
Saint Vincent 49 26 21 21 28 78 59 57 47 131
Jamaica 30 22 31 27 34 39 28 54 44 126
United Kingdom 41 16 13 14 8 11 16 13 34 86
Trinidad and Tobago
33 40 20 25 32 22 37 57 53 77
Saint Lucia 24 19 12 22 12 12 22 29 26 67
Canada 16 14 13 13 3 6 2 8 4 35
Grenada 8 - 6 5 5 3 12 16 13 32
United States 27 13 5 8 7 12 11 10 13 29
Dominica - - - - - - - 7 12 12
India 5 3 1 5 - 2 1 3 3 12
China - - 3 - - - 2 - 2 8
Germany 5 6 2 - 2 4 1 5 1 7
Kenya - - - - - - - - - 7
Antigua and Barbuda
1 1 2 - 1 2 1 - 4 6
Other countries 39 23 4 12 14 27 22 22 25 64
Total 426 282 225 237 216 321 336 418 417 1,278
Sources and definitions: See Introduction to Statistical Annex and Metadata.
I.d.fl. Inflows of legal permanent immigrants, by country of nationality
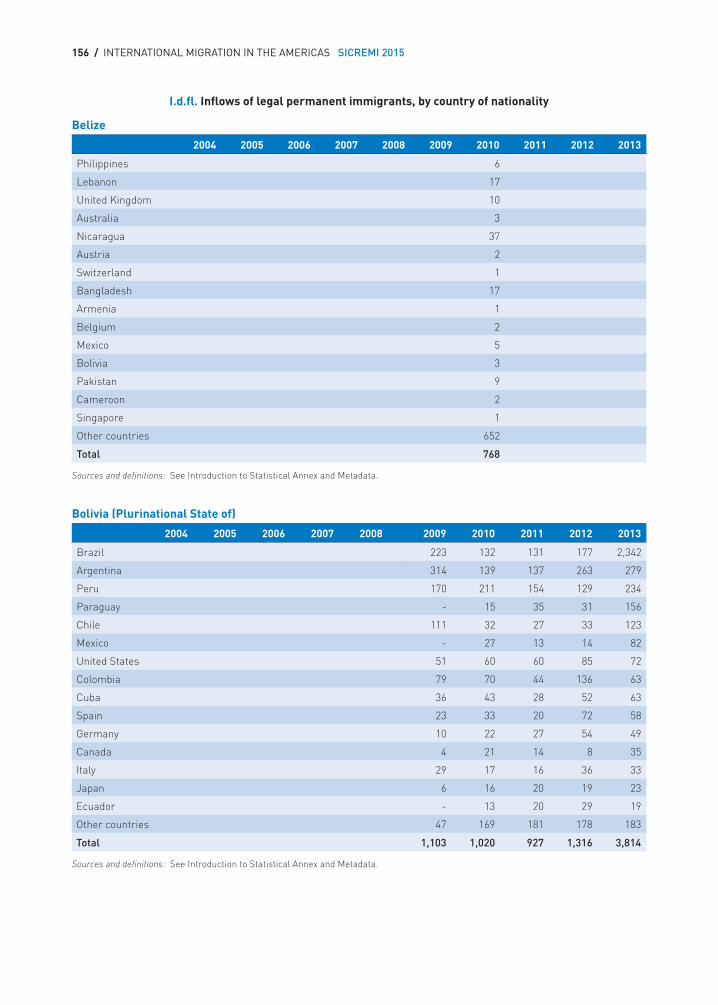
156 / INTERNATIONAL MIGRATION IN THE AMERICAS SICREMI 2015
Belize
2004 2005 2006 2007 2008 2009 2010 2011 2012 2013
Philippines 6
Lebanon 17
United Kingdom 10
Australia 3
Nicaragua 37
Austria 2
Switzerland 1
Bangladesh 17
Armenia 1
Belgium 2
Mexico 5
Bolivia 3
Pakistan 9
Cameroon 2
Singapore 1
Other countries 652
Total 768
Sources and definitions: See Introduction to Statistical Annex and Metadata.
Bolivia (Plurinational State of)
2004 2005 2006 2007 2008 2009 2010 2011 2012 2013
Brazil 223 132 131 177 2,342
Argentina 314 139 137 263 279
Peru 170 211 154 129 234
Paraguay - 15 35 31 156
Chile 111 32 27 33 123
Mexico - 27 13 14 82
United States 51 60 60 85 72
Colombia 79 70 44 136 63
Cuba 36 43 28 52 63
Spain 23 33 20 72 58
Germany 10 22 27 54 49
Canada 4 21 14 8 35
Italy 29 17 16 36 33
Japan 6 16 20 19 23
Ecuador - 13 20 29 19
Other countries 47 169 181 178 183
Total 1,103 1,020 927 1,316 3,814
Sources and definitions: See Introduction to Statistical Annex and Metadata.
I.d.fl. Inflows of legal permanent immigrants, by country of nationality
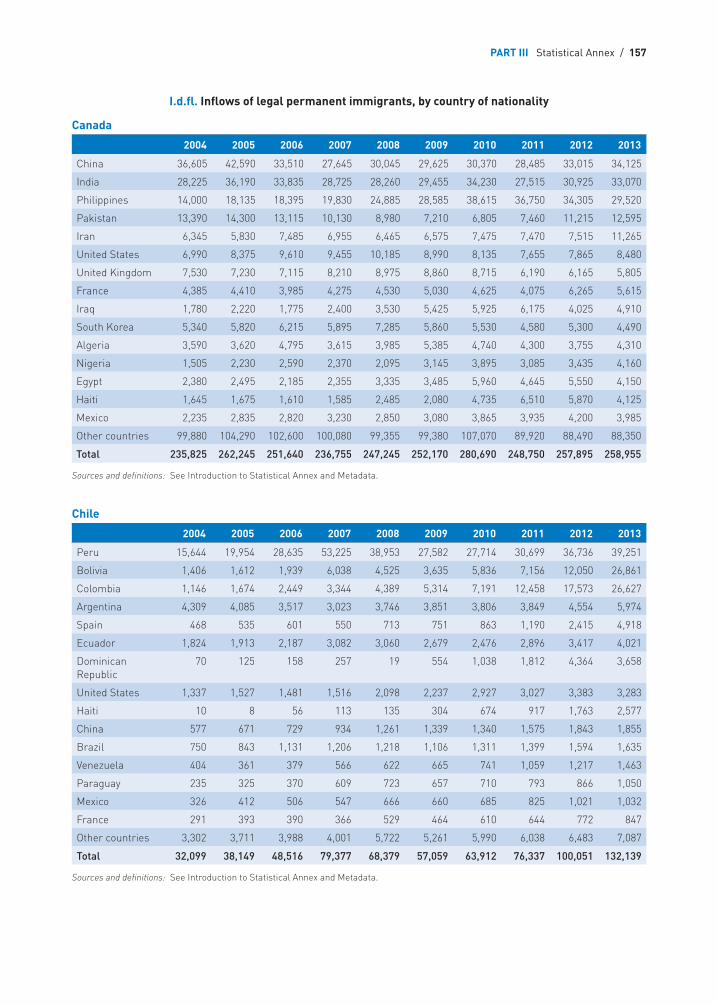
PART III Statistical Annex / 157
Canada
2004 2005 2006 2007 2008 2009 2010 2011 2012 2013
China 36,605 42,590 33,510 27,645 30,045 29,625 30,370 28,485 33,015 34,125
India 28,225 36,190 33,835 28,725 28,260 29,455 34,230 27,515 30,925 33,070
Philippines 14,000 18,135 18,395 19,830 24,885 28,585 38,615 36,750 34,305 29,520
Pakistan 13,390 14,300 13,115 10,130 8,980 7,210 6,805 7,460 11,215 12,595
Iran 6,345 5,830 7,485 6,955 6,465 6,575 7,475 7,470 7,515 11,265
United States 6,990 8,375 9,610 9,455 10,185 8,990 8,135 7,655 7,865 8,480
United Kingdom 7,530 7,230 7,115 8,210 8,975 8,860 8,715 6,190 6,165 5,805
France 4,385 4,410 3,985 4,275 4,530 5,030 4,625 4,075 6,265 5,615
Iraq 1,780 2,220 1,775 2,400 3,530 5,425 5,925 6,175 4,025 4,910
South Korea 5,340 5,820 6,215 5,895 7,285 5,860 5,530 4,580 5,300 4,490
Algeria 3,590 3,620 4,795 3,615 3,985 5,385 4,740 4,300 3,755 4,310
Nigeria 1,505 2,230 2,590 2,370 2,095 3,145 3,895 3,085 3,435 4,160
Egypt 2,380 2,495 2,185 2,355 3,335 3,485 5,960 4,645 5,550 4,150
Haiti 1,645 1,675 1,610 1,585 2,485 2,080 4,735 6,510 5,870 4,125
Mexico 2,235 2,835 2,820 3,230 2,850 3,080 3,865 3,935 4,200 3,985
Other countries 99,880 104,290 102,600 100,080 99,355 99,380 107,070 89,920 88,490 88,350
Total 235,825 262,245 251,640 236,755 247,245 252,170 280,690 248,750 257,895 258,955
Sources and definitions: See Introduction to Statistical Annex and Metadata.
Chile
2004 2005 2006 2007 2008 2009 2010 2011 2012 2013
Peru 15,644 19,954 28,635 53,225 38,953 27,582 27,714 30,699 36,736 39,251
Bolivia 1,406 1,612 1,939 6,038 4,525 3,635 5,836 7,156 12,050 26,861
Colombia 1,146 1,674 2,449 3,344 4,389 5,314 7,191 12,458 17,573 26,627
Argentina 4,309 4,085 3,517 3,023 3,746 3,851 3,806 3,849 4,554 5,974
Spain 468 535 601 550 713 751 863 1,190 2,415 4,918
Ecuador 1,824 1,913 2,187 3,082 3,060 2,679 2,476 2,896 3,417 4,021
Dominican Republic
70 125 158 257 19 554 1,038 1,812 4,364 3,658
United States 1,337 1,527 1,481 1,516 2,098 2,237 2,927 3,027 3,383 3,283
Haiti 10 8 56 113 135 304 674 917 1,763 2,577
China 577 671 729 934 1,261 1,339 1,340 1,575 1,843 1,855
Brazil 750 843 1,131 1,206 1,218 1,106 1,311 1,399 1,594 1,635
Venezuela 404 361 379 566 622 665 741 1,059 1,217 1,463
Paraguay 235 325 370 609 723 657 710 793 866 1,050
Mexico 326 412 506 547 666 660 685 825 1,021 1,032
France 291 393 390 366 529 464 610 644 772 847
Other countries 3,302 3,711 3,988 4,001 5,722 5,261 5,990 6,038 6,483 7,087
Total 32,099 38,149 48,516 79,377 68,379 57,059 63,912 76,337 100,051 132,139
Sources and definitions: See Introduction to Statistical Annex and Metadata.
I.d.fl. Inflows of legal permanent immigrants, by country of nationality
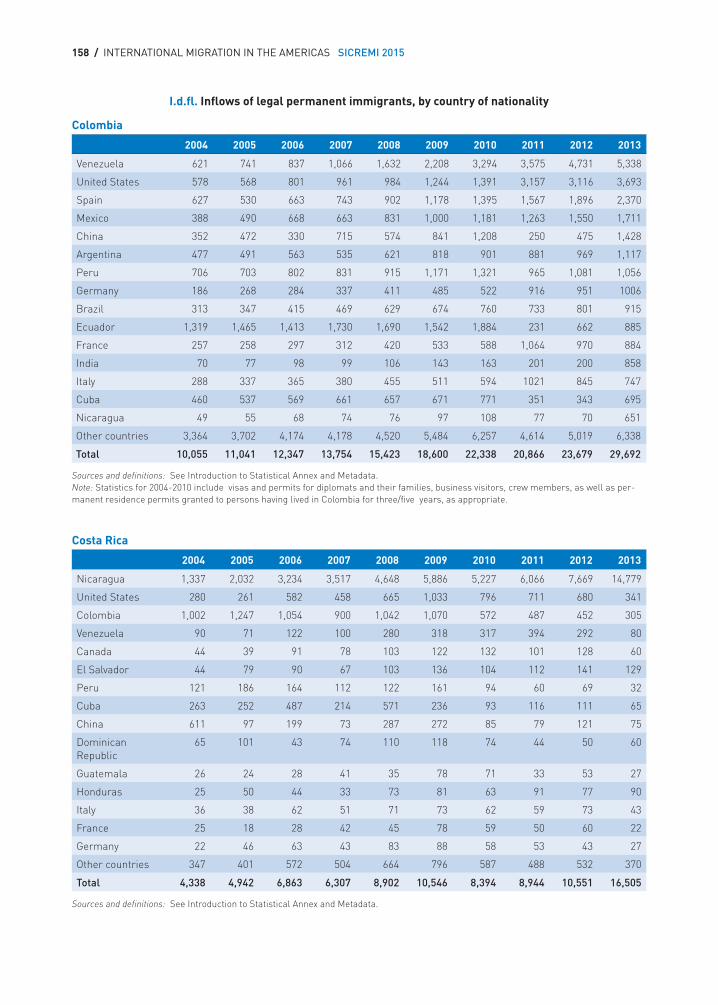
158 / INTERNATIONAL MIGRATION IN THE AMERICAS SICREMI 2015
Colombia
2004 2005 2006 2007 2008 2009 2010 2011 2012 2013
Venezuela 621 741 837 1,066 1,632 2,208 3,294 3,575 4,731 5,338
United States 578 568 801 961 984 1,244 1,391 3,157 3,116 3,693
Spain 627 530 663 743 902 1,178 1,395 1,567 1,896 2,370
Mexico 388 490 668 663 831 1,000 1,181 1,263 1,550 1,711
China 352 472 330 715 574 841 1,208 250 475 1,428
Argentina 477 491 563 535 621 818 901 881 969 1,117
Peru 706 703 802 831 915 1,171 1,321 965 1,081 1,056
Germany 186 268 284 337 411 485 522 916 951 1006
Brazil 313 347 415 469 629 674 760 733 801 915
Ecuador 1,319 1,465 1,413 1,730 1,690 1,542 1,884 231 662 885
France 257 258 297 312 420 533 588 1,064 970 884
India 70 77 98 99 106 143 163 201 200 858
Italy 288 337 365 380 455 511 594 1021 845 747
Cuba 460 537 569 661 657 671 771 351 343 695
Nicaragua 49 55 68 74 76 97 108 77 70 651
Other countries 3,364 3,702 4,174 4,178 4,520 5,484 6,257 4,614 5,019 6,338
Total 10,055 11,041 12,347 13,754 15,423 18,600 22,338 20,866 23,679 29,692
Sources and definitions: See Introduction to Statistical Annex and Metadata.Note: Statistics for 2004-2010 include visas and permits for diplomats and their families, business visitors, crew members, as well as per-manent residence permits granted to persons having lived in Colombia for three/five years, as appropriate.
Costa Rica
2004 2005 2006 2007 2008 2009 2010 2011 2012 2013
Nicaragua 1,337 2,032 3,234 3,517 4,648 5,886 5,227 6,066 7,669 14,779
United States 280 261 582 458 665 1,033 796 711 680 341
Colombia 1,002 1,247 1,054 900 1,042 1,070 572 487 452 305
Venezuela 90 71 122 100 280 318 317 394 292 80
Canada 44 39 91 78 103 122 132 101 128 60
El Salvador 44 79 90 67 103 136 104 112 141 129
Peru 121 186 164 112 122 161 94 60 69 32
Cuba 263 252 487 214 571 236 93 116 111 65
China 611 97 199 73 287 272 85 79 121 75
Dominican Republic
65 101 43 74 110 118 74 44 50 60
Guatemala 26 24 28 41 35 78 71 33 53 27
Honduras 25 50 44 33 73 81 63 91 77 90
Italy 36 38 62 51 71 73 62 59 73 43
France 25 18 28 42 45 78 59 50 60 22
Germany 22 46 63 43 83 88 58 53 43 27
Other countries 347 401 572 504 664 796 587 488 532 370
Total 4,338 4,942 6,863 6,307 8,902 10,546 8,394 8,944 10,551 16,505
Sources and definitions: See Introduction to Statistical Annex and Metadata.
I.d.fl. Inflows of legal permanent immigrants, by country of nationality
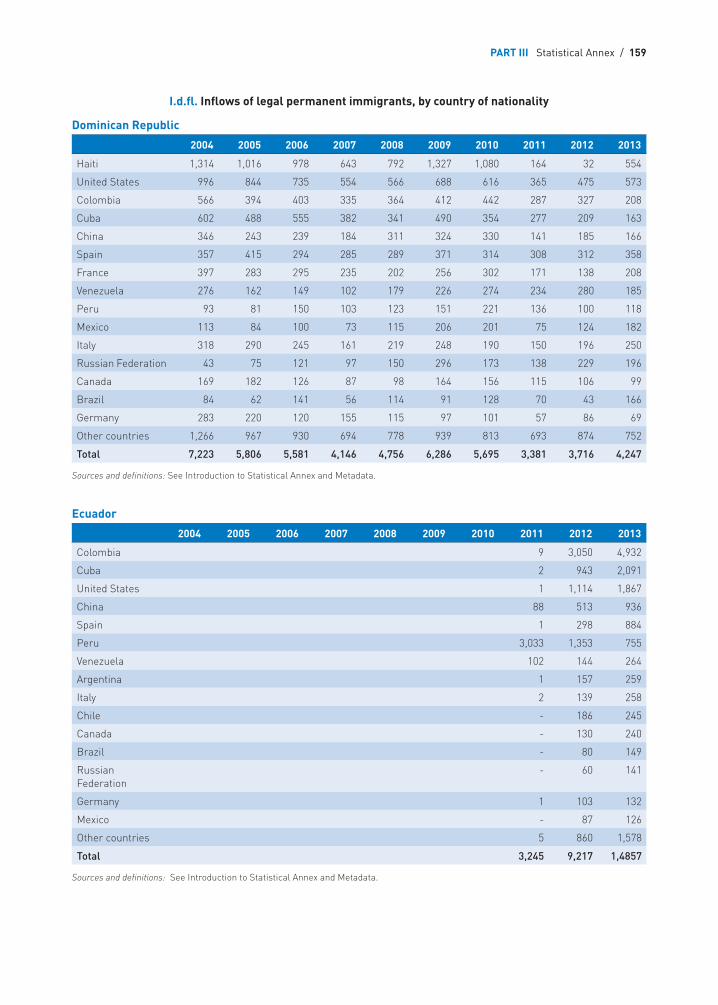
PART III Statistical Annex / 159
Dominican Republic
2004 2005 2006 2007 2008 2009 2010 2011 2012 2013
Haiti 1,314 1,016 978 643 792 1,327 1,080 164 32 554
United States 996 844 735 554 566 688 616 365 475 573
Colombia 566 394 403 335 364 412 442 287 327 208
Cuba 602 488 555 382 341 490 354 277 209 163
China 346 243 239 184 311 324 330 141 185 166
Spain 357 415 294 285 289 371 314 308 312 358
France 397 283 295 235 202 256 302 171 138 208
Venezuela 276 162 149 102 179 226 274 234 280 185
Peru 93 81 150 103 123 151 221 136 100 118
Mexico 113 84 100 73 115 206 201 75 124 182
Italy 318 290 245 161 219 248 190 150 196 250
Russian Federation 43 75 121 97 150 296 173 138 229 196
Canada 169 182 126 87 98 164 156 115 106 99
Brazil 84 62 141 56 114 91 128 70 43 166
Germany 283 220 120 155 115 97 101 57 86 69
Other countries 1,266 967 930 694 778 939 813 693 874 752
Total 7,223 5,806 5,581 4,146 4,756 6,286 5,695 3,381 3,716 4,247
Sources and definitions: See Introduction to Statistical Annex and Metadata.
Ecuador
2004 2005 2006 2007 2008 2009 2010 2011 2012 2013
Colombia 9 3,050 4,932
Cuba 2 943 2,091
United States 1 1,114 1,867
China 88 513 936
Spain 1 298 884
Peru 3,033 1,353 755
Venezuela 102 144 264
Argentina 1 157 259
Italy 2 139 258
Chile - 186 245
Canada - 130 240
Brazil - 80 149
Russian Federation
- 60 141
Germany 1 103 132
Mexico - 87 126
Other countries 5 860 1,578
Total 3,245 9,217 1,4857
Sources and definitions: See Introduction to Statistical Annex and Metadata.
I.d.fl. Inflows of legal permanent immigrants, by country of nationality
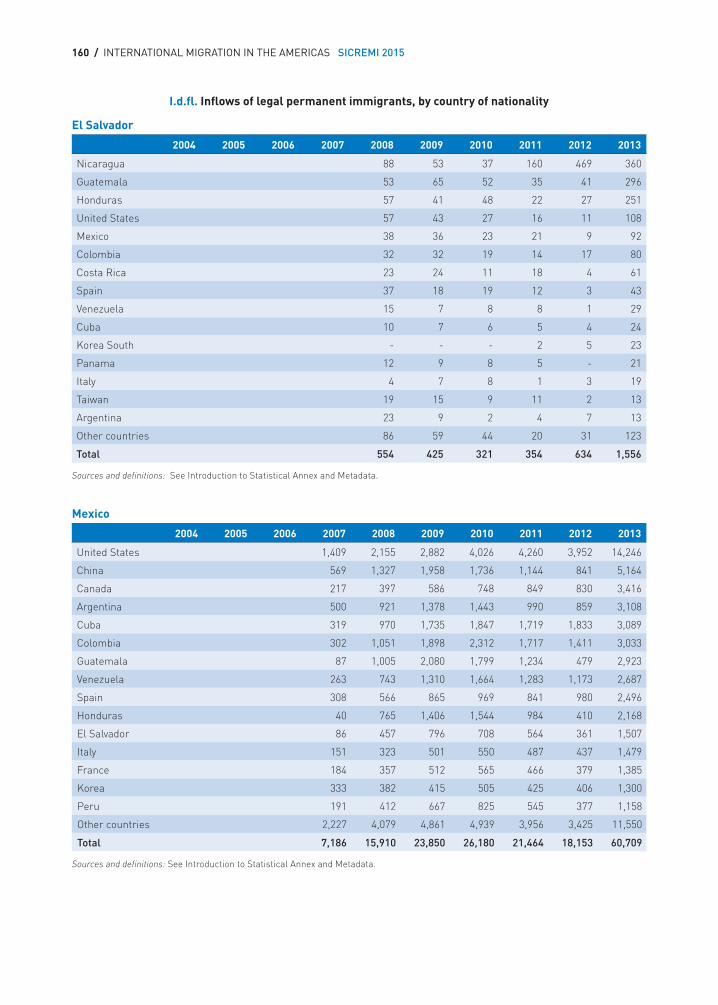
160 / INTERNATIONAL MIGRATION IN THE AMERICAS SICREMI 2015
El Salvador
2004 2005 2006 2007 2008 2009 2010 2011 2012 2013
Nicaragua 88 53 37 160 469 360
Guatemala 53 65 52 35 41 296
Honduras 57 41 48 22 27 251
United States 57 43 27 16 11 108
Mexico 38 36 23 21 9 92
Colombia 32 32 19 14 17 80
Costa Rica 23 24 11 18 4 61
Spain 37 18 19 12 3 43
Venezuela 15 7 8 8 1 29
Cuba 10 7 6 5 4 24
Korea South - - - 2 5 23
Panama 12 9 8 5 - 21
Italy 4 7 8 1 3 19
Taiwan 19 15 9 11 2 13
Argentina 23 9 2 4 7 13
Other countries 86 59 44 20 31 123
Total 554 425 321 354 634 1,556
Sources and definitions: See Introduction to Statistical Annex and Metadata.
Mexico
2004 2005 2006 2007 2008 2009 2010 2011 2012 2013
United States 1,409 2,155 2,882 4,026 4,260 3,952 14,246
China 569 1,327 1,958 1,736 1,144 841 5,164
Canada 217 397 586 748 849 830 3,416
Argentina 500 921 1,378 1,443 990 859 3,108
Cuba 319 970 1,735 1,847 1,719 1,833 3,089
Colombia 302 1,051 1,898 2,312 1,717 1,411 3,033
Guatemala 87 1,005 2,080 1,799 1,234 479 2,923
Venezuela 263 743 1,310 1,664 1,283 1,173 2,687
Spain 308 566 865 969 841 980 2,496
Honduras 40 765 1,406 1,544 984 410 2,168
El Salvador 86 457 796 708 564 361 1,507
Italy 151 323 501 550 487 437 1,479
France 184 357 512 565 466 379 1,385
Korea 333 382 415 505 425 406 1,300
Peru 191 412 667 825 545 377 1,158
Other countries 2,227 4,079 4,861 4,939 3,956 3,425 11,550
Total 7,186 15,910 23,850 26,180 21,464 18,153 60,709
Sources and definitions: See Introduction to Statistical Annex and Metadata.
I.d.fl. Inflows of legal permanent immigrants, by country of nationality
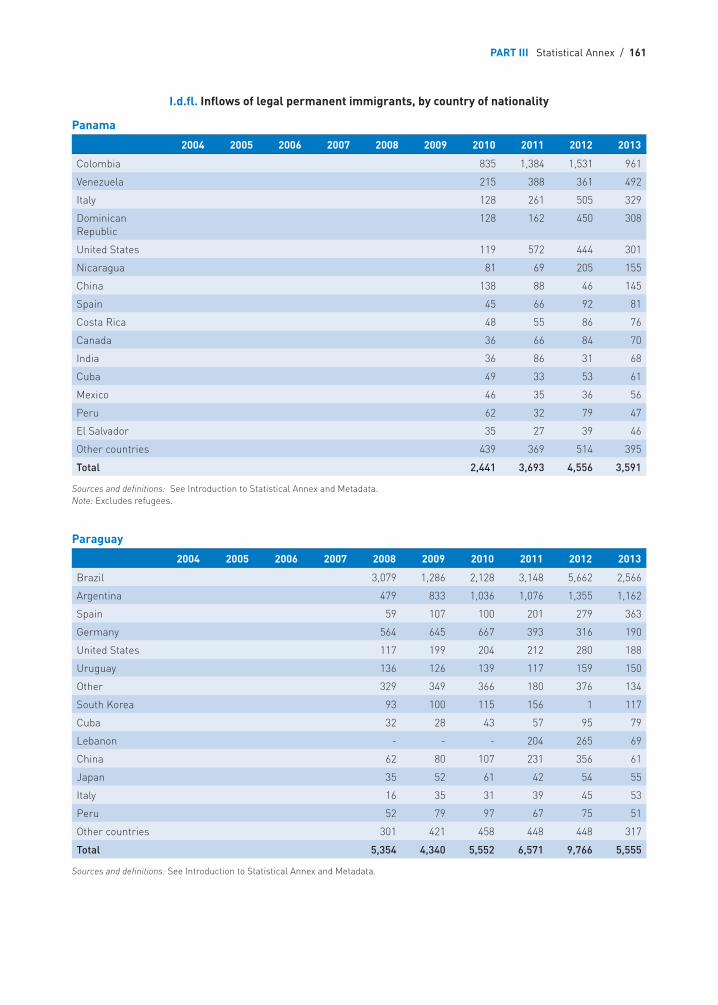
PART III Statistical Annex / 161
Panama
2004 2005 2006 2007 2008 2009 2010 2011 2012 2013
Colombia 835 1,384 1,531 961
Venezuela 215 388 361 492
Italy 128 261 505 329
Dominican Republic
128 162 450 308
United States 119 572 444 301
Nicaragua 81 69 205 155
China 138 88 46 145
Spain 45 66 92 81
Costa Rica 48 55 86 76
Canada 36 66 84 70
India 36 86 31 68
Cuba 49 33 53 61
Mexico 46 35 36 56
Peru 62 32 79 47
El Salvador 35 27 39 46
Other countries 439 369 514 395
Total 2,441 3,693 4,556 3,591
Sources and definitions: See Introduction to Statistical Annex and Metadata.Note: Excludes refugees.
Paraguay
2004 2005 2006 2007 2008 2009 2010 2011 2012 2013
Brazil 3,079 1,286 2,128 3,148 5,662 2,566
Argentina 479 833 1,036 1,076 1,355 1,162
Spain 59 107 100 201 279 363
Germany 564 645 667 393 316 190
United States 117 199 204 212 280 188
Uruguay 136 126 139 117 159 150
Other 329 349 366 180 376 134
South Korea 93 100 115 156 1 117
Cuba 32 28 43 57 95 79
Lebanon - - - 204 265 69
China 62 80 107 231 356 61
Japan 35 52 61 42 54 55
Italy 16 35 31 39 45 53
Peru 52 79 97 67 75 51
Other countries 301 421 458 448 448 317
Total 5,354 4,340 5,552 6,571 9,766 5,555
Sources and definitions: See Introduction to Statistical Annex and Metadata.
I.d.fl. Inflows of legal permanent immigrants, by country of nationality
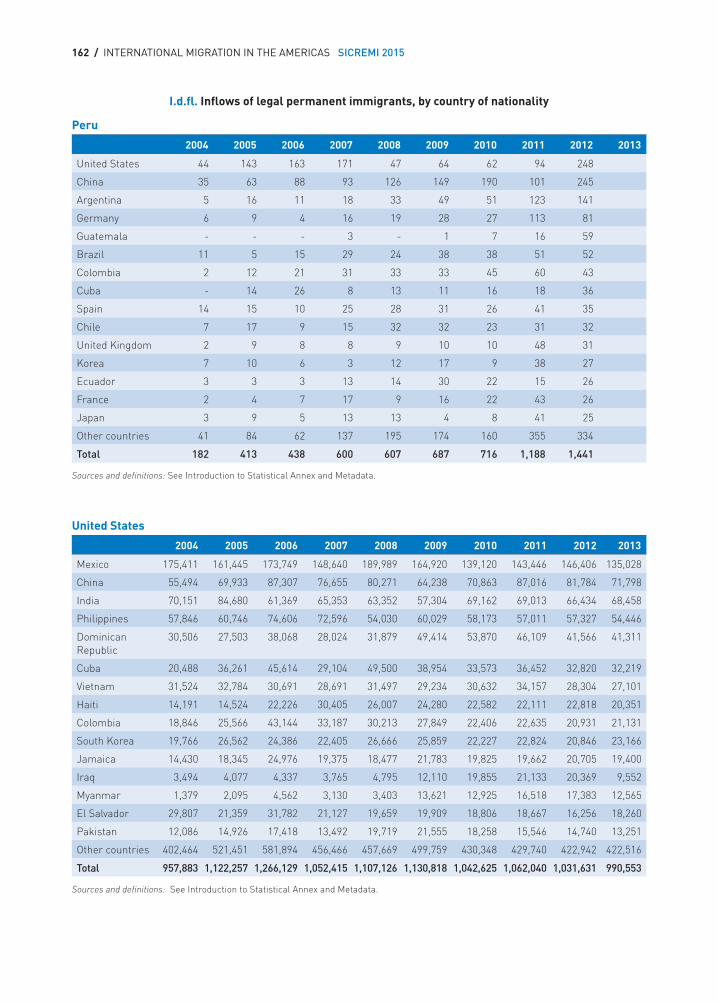
162 / INTERNATIONAL MIGRATION IN THE AMERICAS SICREMI 2015
Peru
2004 2005 2006 2007 2008 2009 2010 2011 2012 2013
United States 44 143 163 171 47 64 62 94 248
China 35 63 88 93 126 149 190 101 245
Argentina 5 16 11 18 33 49 51 123 141
Germany 6 9 4 16 19 28 27 113 81
Guatemala - - - 3 - 1 7 16 59
Brazil 11 5 15 29 24 38 38 51 52
Colombia 2 12 21 31 33 33 45 60 43
Cuba - 14 26 8 13 11 16 18 36
Spain 14 15 10 25 28 31 26 41 35
Chile 7 17 9 15 32 32 23 31 32
United Kingdom 2 9 8 8 9 10 10 48 31
Korea 7 10 6 3 12 17 9 38 27
Ecuador 3 3 3 13 14 30 22 15 26
France 2 4 7 17 9 16 22 43 26
Japan 3 9 5 13 13 4 8 41 25
Other countries 41 84 62 137 195 174 160 355 334
Total 182 413 438 600 607 687 716 1,188 1,441
Sources and definitions: See Introduction to Statistical Annex and Metadata.
United States
2004 2005 2006 2007 2008 2009 2010 2011 2012 2013
Mexico 175,411 161,445 173,749 148,640 189,989 164,920 139,120 143,446 146,406 135,028
China 55,494 69,933 87,307 76,655 80,271 64,238 70,863 87,016 81,784 71,798
India 70,151 84,680 61,369 65,353 63,352 57,304 69,162 69,013 66,434 68,458
Philippines 57,846 60,746 74,606 72,596 54,030 60,029 58,173 57,011 57,327 54,446
Dominican Republic
30,506 27,503 38,068 28,024 31,879 49,414 53,870 46,109 41,566 41,311
Cuba 20,488 36,261 45,614 29,104 49,500 38,954 33,573 36,452 32,820 32,219
Vietnam 31,524 32,784 30,691 28,691 31,497 29,234 30,632 34,157 28,304 27,101
Haiti 14,191 14,524 22,226 30,405 26,007 24,280 22,582 22,111 22,818 20,351
Colombia 18,846 25,566 43,144 33,187 30,213 27,849 22,406 22,635 20,931 21,131
South Korea 19,766 26,562 24,386 22,405 26,666 25,859 22,227 22,824 20,846 23,166
Jamaica 14,430 18,345 24,976 19,375 18,477 21,783 19,825 19,662 20,705 19,400
Iraq 3,494 4,077 4,337 3,765 4,795 12,110 19,855 21,133 20,369 9,552
Myanmar 1,379 2,095 4,562 3,130 3,403 13,621 12,925 16,518 17,383 12,565
El Salvador 29,807 21,359 31,782 21,127 19,659 19,909 18,806 18,667 16,256 18,260
Pakistan 12,086 14,926 17,418 13,492 19,719 21,555 18,258 15,546 14,740 13,251
Other countries 402,464 521,451 581,894 456,466 457,669 499,759 430,348 429,740 422,942 422,516
Total 957,883 1,122,257 1,266,129 1,052,415 1,107,126 1,130,818 1,042,625 1,062,040 1,031,631 990,553
Sources and definitions: See Introduction to Statistical Annex and Metadata.
I.d.fl. Inflows of legal permanent immigrants, by country of nationality
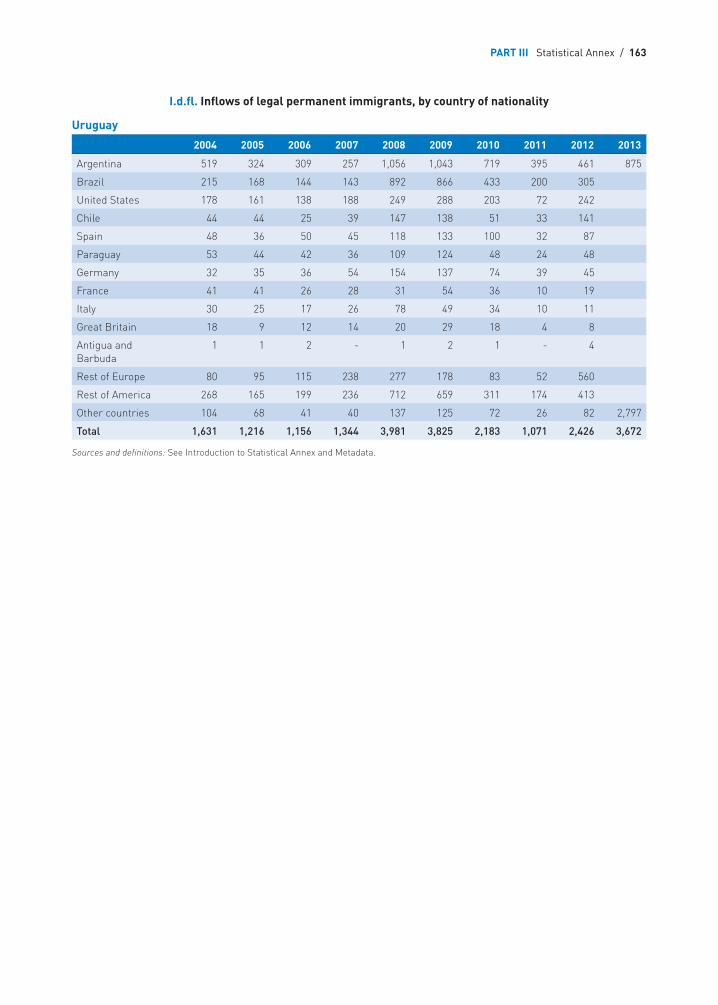
PART III Statistical Annex / 163
Uruguay
2004 2005 2006 2007 2008 2009 2010 2011 2012 2013
Argentina 519 324 309 257 1,056 1,043 719 395 461 875
Brazil 215 168 144 143 892 866 433 200 305
United States 178 161 138 188 249 288 203 72 242
Chile 44 44 25 39 147 138 51 33 141
Spain 48 36 50 45 118 133 100 32 87
Paraguay 53 44 42 36 109 124 48 24 48
Germany 32 35 36 54 154 137 74 39 45
France 41 41 26 28 31 54 36 10 19
Italy 30 25 17 26 78 49 34 10 11
Great Britain 18 9 12 14 20 29 18 4 8
Antigua and Barbuda
1 1 2 - 1 2 1 - 4
Rest of Europe 80 95 115 238 277 178 83 52 560
Rest of America 268 165 199 236 712 659 311 174 413
Other countries 104 68 41 40 137 125 72 26 82 2,797
Total 1,631 1,216 1,156 1,344 3,981 3,825 2,183 1,071 2,426 3,672
Sources and definitions: See Introduction to Statistical Annex and Metadata.
I.d.fl. Inflows of legal permanent immigrants, by country of nationality
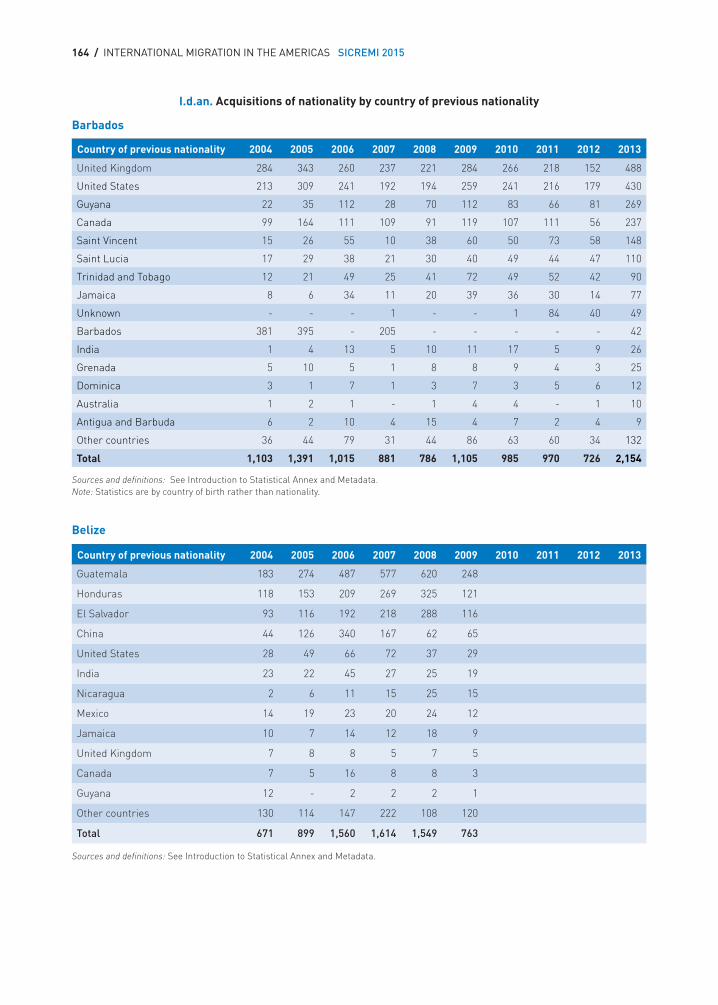
164 / INTERNATIONAL MIGRATION IN THE AMERICAS SICREMI 2015
Barbados
Country of previous nationality 2004 2005 2006 2007 2008 2009 2010 2011 2012 2013
United Kingdom 284 343 260 237 221 284 266 218 152 488
United States 213 309 241 192 194 259 241 216 179 430
Guyana 22 35 112 28 70 112 83 66 81 269
Canada 99 164 111 109 91 119 107 111 56 237
Saint Vincent 15 26 55 10 38 60 50 73 58 148
Saint Lucia 17 29 38 21 30 40 49 44 47 110
Trinidad and Tobago 12 21 49 25 41 72 49 52 42 90
Jamaica 8 6 34 11 20 39 36 30 14 77
Unknown - - - 1 - - 1 84 40 49
Barbados 381 395 - 205 - - - - - 42
India 1 4 13 5 10 11 17 5 9 26
Grenada 5 10 5 1 8 8 9 4 3 25
Dominica 3 1 7 1 3 7 3 5 6 12
Australia 1 2 1 - 1 4 4 - 1 10
Antigua and Barbuda 6 2 10 4 15 4 7 2 4 9
Other countries 36 44 79 31 44 86 63 60 34 132
Total 1,103 1,391 1,015 881 786 1,105 985 970 726 2,154
Sources and definitions: See Introduction to Statistical Annex and Metadata.Note: Statistics are by country of birth rather than nationality.
Belize
Country of previous nationality 2004 2005 2006 2007 2008 2009 2010 2011 2012 2013
Guatemala 183 274 487 577 620 248
Honduras 118 153 209 269 325 121
El Salvador 93 116 192 218 288 116
China 44 126 340 167 62 65
United States 28 49 66 72 37 29
India 23 22 45 27 25 19
Nicaragua 2 6 11 15 25 15
Mexico 14 19 23 20 24 12
Jamaica 10 7 14 12 18 9
United Kingdom 7 8 8 5 7 5
Canada 7 5 16 8 8 3
Guyana 12 - 2 2 2 1
Other countries 130 114 147 222 108 120
Total 671 899 1,560 1,614 1,549 763
Sources and definitions: See Introduction to Statistical Annex and Metadata.
I.d.an. Acquisitions of nationality by country of previous nationality
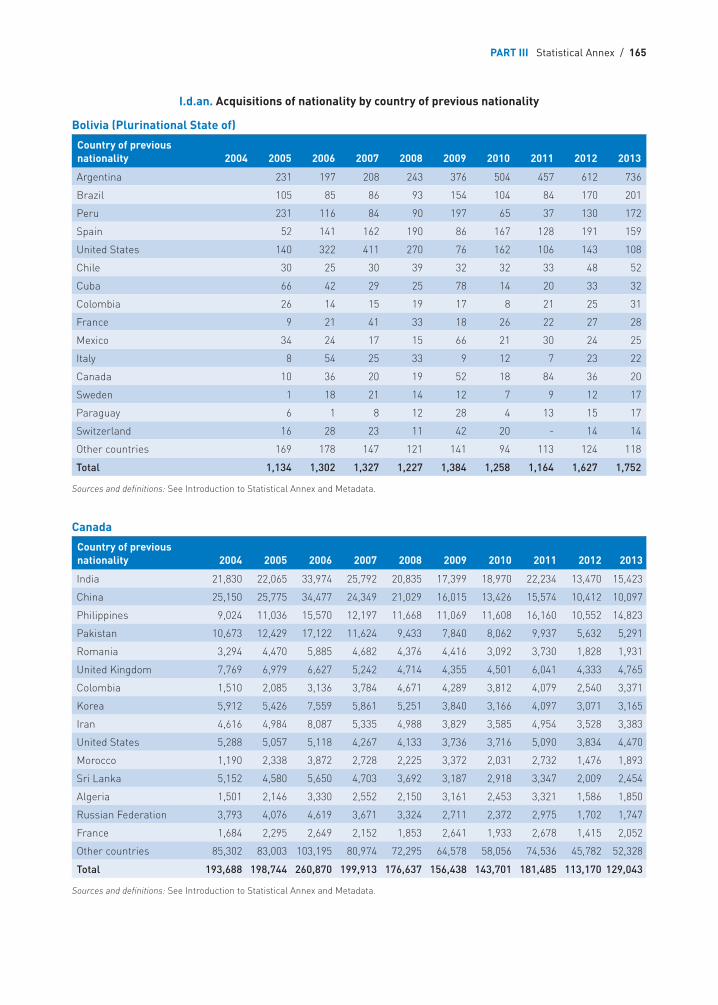
PART III Statistical Annex / 165
Bolivia (Plurinational State of)
Country of previous nationality 2004 2005 2006 2007 2008 2009 2010 2011 2012 2013
Argentina 231 197 208 243 376 504 457 612 736
Brazil 105 85 86 93 154 104 84 170 201
Peru 231 116 84 90 197 65 37 130 172
Spain 52 141 162 190 86 167 128 191 159
United States 140 322 411 270 76 162 106 143 108
Chile 30 25 30 39 32 32 33 48 52
Cuba 66 42 29 25 78 14 20 33 32
Colombia 26 14 15 19 17 8 21 25 31
France 9 21 41 33 18 26 22 27 28
Mexico 34 24 17 15 66 21 30 24 25
Italy 8 54 25 33 9 12 7 23 22
Canada 10 36 20 19 52 18 84 36 20
Sweden 1 18 21 14 12 7 9 12 17
Paraguay 6 1 8 12 28 4 13 15 17
Switzerland 16 28 23 11 42 20 - 14 14
Other countries 169 178 147 121 141 94 113 124 118
Total 1,134 1,302 1,327 1,227 1,384 1,258 1,164 1,627 1,752
Sources and definitions: See Introduction to Statistical Annex and Metadata.
Canada
Country of previous nationality 2004 2005 2006 2007 2008 2009 2010 2011 2012 2013
India 21,830 22,065 33,974 25,792 20,835 17,399 18,970 22,234 13,470 15,423
China 25,150 25,775 34,477 24,349 21,029 16,015 13,426 15,574 10,412 10,097
Philippines 9,024 11,036 15,570 12,197 11,668 11,069 11,608 16,160 10,552 14,823
Pakistan 10,673 12,429 17,122 11,624 9,433 7,840 8,062 9,937 5,632 5,291
Romania 3,294 4,470 5,885 4,682 4,376 4,416 3,092 3,730 1,828 1,931
United Kingdom 7,769 6,979 6,627 5,242 4,714 4,355 4,501 6,041 4,333 4,765
Colombia 1,510 2,085 3,136 3,784 4,671 4,289 3,812 4,079 2,540 3,371
Korea 5,912 5,426 7,559 5,861 5,251 3,840 3,166 4,097 3,071 3,165
Iran 4,616 4,984 8,087 5,335 4,988 3,829 3,585 4,954 3,528 3,383
United States 5,288 5,057 5,118 4,267 4,133 3,736 3,716 5,090 3,834 4,470
Morocco 1,190 2,338 3,872 2,728 2,225 3,372 2,031 2,732 1,476 1,893
Sri Lanka 5,152 4,580 5,650 4,703 3,692 3,187 2,918 3,347 2,009 2,454
Algeria 1,501 2,146 3,330 2,552 2,150 3,161 2,453 3,321 1,586 1,850
Russian Federation 3,793 4,076 4,619 3,671 3,324 2,711 2,372 2,975 1,702 1,747
France 1,684 2,295 2,649 2,152 1,853 2,641 1,933 2,678 1,415 2,052
Other countries 85,302 83,003 103,195 80,974 72,295 64,578 58,056 74,536 45,782 52,328
Total 193,688 198,744 260,870 199,913 176,637 156,438 143,701 181,485 113,170 129,043
Sources and definitions: See Introduction to Statistical Annex and Metadata.
I.d.an. Acquisitions of nationality by country of previous nationality
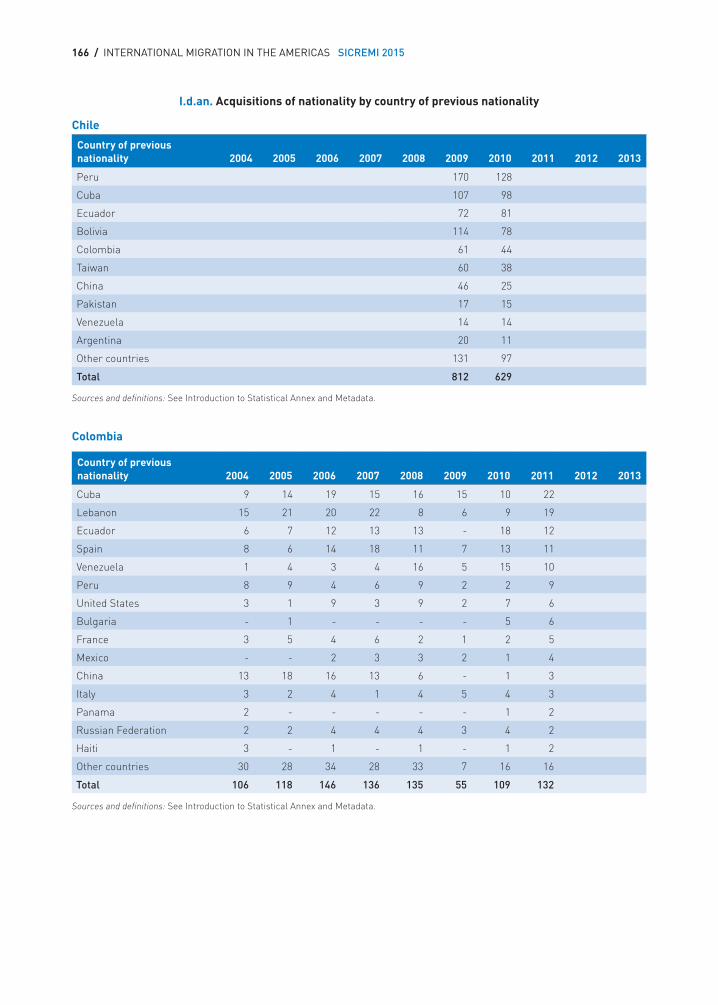
166 / INTERNATIONAL MIGRATION IN THE AMERICAS SICREMI 2015
Chile
Country of previous nationality 2004 2005 2006 2007 2008 2009 2010 2011 2012 2013
Peru 170 128
Cuba 107 98
Ecuador 72 81
Bolivia 114 78
Colombia 61 44
Taiwan 60 38
China 46 25
Pakistan 17 15
Venezuela 14 14
Argentina 20 11
Other countries 131 97
Total 812 629
Sources and definitions: See Introduction to Statistical Annex and Metadata.
Colombia
Country of previous nationality 2004 2005 2006 2007 2008 2009 2010 2011 2012 2013
Cuba 9 14 19 15 16 15 10 22
Lebanon 15 21 20 22 8 6 9 19
Ecuador 6 7 12 13 13 - 18 12
Spain 8 6 14 18 11 7 13 11
Venezuela 1 4 3 4 16 5 15 10
Peru 8 9 4 6 9 2 2 9
United States 3 1 9 3 9 2 7 6
Bulgaria - 1 - - - - 5 6
France 3 5 4 6 2 1 2 5
Mexico - - 2 3 3 2 1 4
China 13 18 16 13 6 - 1 3
Italy 3 2 4 1 4 5 4 3
Panama 2 - - - - - 1 2
Russian Federation 2 2 4 4 4 3 4 2
Haiti 3 - 1 - 1 - 1 2
Other countries 30 28 34 28 33 7 16 16
Total 106 118 146 136 135 55 109 132
Sources and definitions: See Introduction to Statistical Annex and Metadata.
I.d.an. Acquisitions of nationality by country of previous nationality
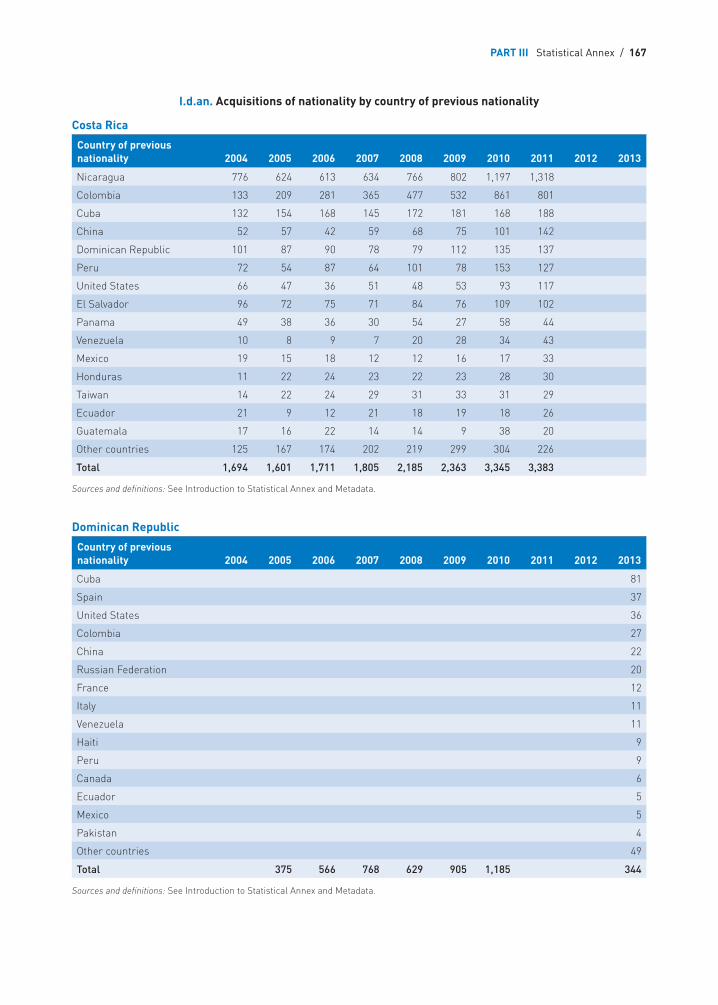
PART III Statistical Annex / 167
Costa Rica
Country of previous nationality 2004 2005 2006 2007 2008 2009 2010 2011 2012 2013
Nicaragua 776 624 613 634 766 802 1,197 1,318
Colombia 133 209 281 365 477 532 861 801
Cuba 132 154 168 145 172 181 168 188
China 52 57 42 59 68 75 101 142
Dominican Republic 101 87 90 78 79 112 135 137
Peru 72 54 87 64 101 78 153 127
United States 66 47 36 51 48 53 93 117
El Salvador 96 72 75 71 84 76 109 102
Panama 49 38 36 30 54 27 58 44
Venezuela 10 8 9 7 20 28 34 43
Mexico 19 15 18 12 12 16 17 33
Honduras 11 22 24 23 22 23 28 30
Taiwan 14 22 24 29 31 33 31 29
Ecuador 21 9 12 21 18 19 18 26
Guatemala 17 16 22 14 14 9 38 20
Other countries 125 167 174 202 219 299 304 226
Total 1,694 1,601 1,711 1,805 2,185 2,363 3,345 3,383
Sources and definitions: See Introduction to Statistical Annex and Metadata.
Dominican Republic
Country of previous nationality 2004 2005 2006 2007 2008 2009 2010 2011 2012 2013
Cuba 81
Spain 37
United States 36
Colombia 27
China 22
Russian Federation 20
France 12
Italy 11
Venezuela 11
Haiti 9
Peru 9
Canada 6
Ecuador 5
Mexico 5
Pakistan 4
Other countries 49
Total 375 566 768 629 905 1,185 344
Sources and definitions: See Introduction to Statistical Annex and Metadata.
I.d.an. Acquisitions of nationality by country of previous nationality
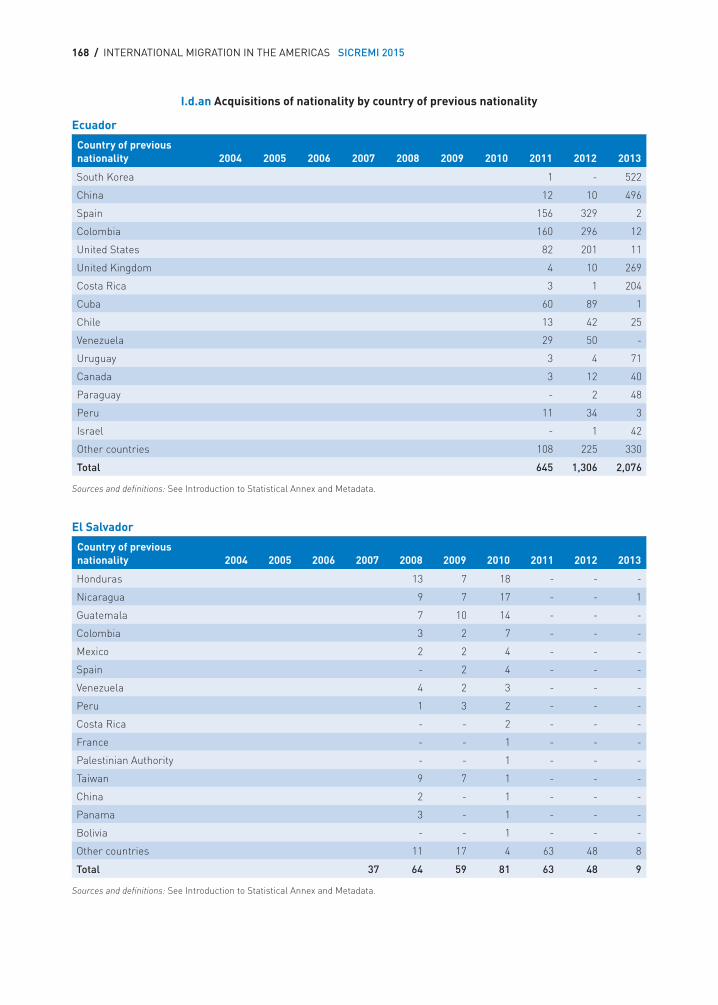
168 / INTERNATIONAL MIGRATION IN THE AMERICAS SICREMI 2015
Ecuador
Country of previous nationality 2004 2005 2006 2007 2008 2009 2010 2011 2012 2013
South Korea 1 - 522
China 12 10 496
Spain 156 329 2
Colombia 160 296 12
United States 82 201 11
United Kingdom 4 10 269
Costa Rica 3 1 204
Cuba 60 89 1
Chile 13 42 25
Venezuela 29 50 -
Uruguay 3 4 71
Canada 3 12 40
Paraguay - 2 48
Peru 11 34 3
Israel - 1 42
Other countries 108 225 330
Total 645 1,306 2,076
Sources and definitions: See Introduction to Statistical Annex and Metadata.
El Salvador
Country of previous nationality 2004 2005 2006 2007 2008 2009 2010 2011 2012 2013
Honduras 13 7 18 - - -
Nicaragua 9 7 17 - - 1
Guatemala 7 10 14 - - -
Colombia 3 2 7 - - -
Mexico 2 2 4 - - -
Spain - 2 4 - - -
Venezuela 4 2 3 - - -
Peru 1 3 2 - - -
Costa Rica - - 2 - - -
France - - 1 - - -
Palestinian Authority - - 1 - - -
Taiwan 9 7 1 - - -
China 2 - 1 - - -
Panama 3 - 1 - - -
Bolivia - - 1 - - -
Other countries 11 17 4 63 48 8
Total 37 64 59 81 63 48 9
Sources and definitions: See Introduction to Statistical Annex and Metadata.
I.d.an Acquisitions of nationality by country of previous nationality
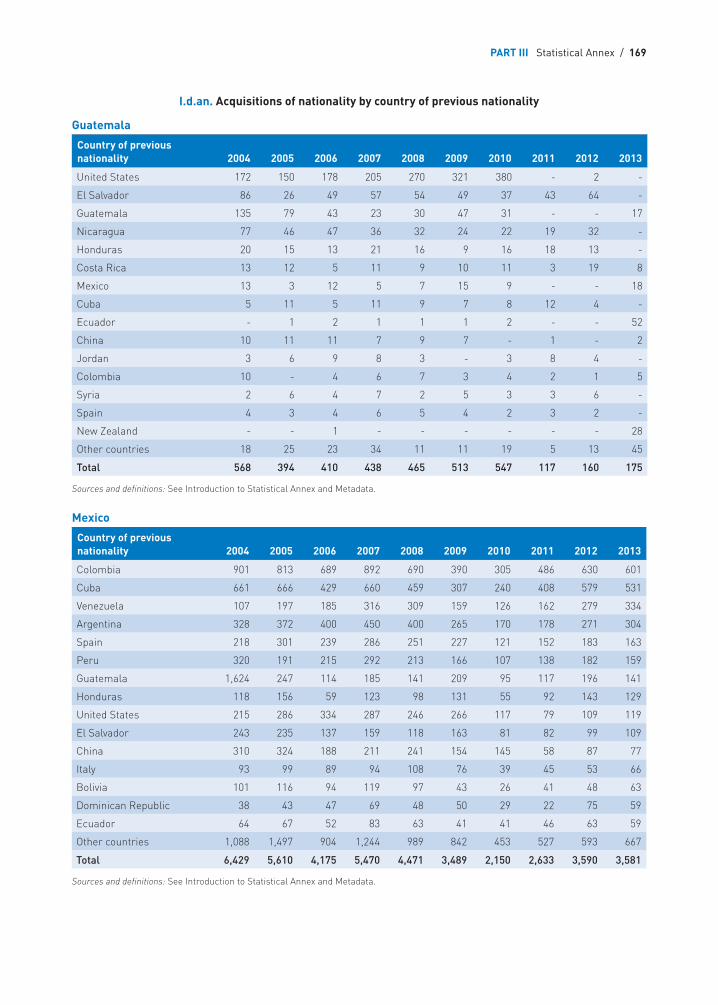
PART III Statistical Annex / 169
Guatemala
Country of previous nationality 2004 2005 2006 2007 2008 2009 2010 2011 2012 2013
United States 172 150 178 205 270 321 380 - 2 -
El Salvador 86 26 49 57 54 49 37 43 64 -
Guatemala 135 79 43 23 30 47 31 - - 17
Nicaragua 77 46 47 36 32 24 22 19 32 -
Honduras 20 15 13 21 16 9 16 18 13 -
Costa Rica 13 12 5 11 9 10 11 3 19 8
Mexico 13 3 12 5 7 15 9 - - 18
Cuba 5 11 5 11 9 7 8 12 4 -
Ecuador - 1 2 1 1 1 2 - - 52
China 10 11 11 7 9 7 - 1 - 2
Jordan 3 6 9 8 3 - 3 8 4 -
Colombia 10 - 4 6 7 3 4 2 1 5
Syria 2 6 4 7 2 5 3 3 6 -
Spain 4 3 4 6 5 4 2 3 2 -
New Zealand - - 1 - - - - - - 28
Other countries 18 25 23 34 11 11 19 5 13 45
Total 568 394 410 438 465 513 547 117 160 175
Sources and definitions: See Introduction to Statistical Annex and Metadata.
Mexico
Country of previous nationality 2004 2005 2006 2007 2008 2009 2010 2011 2012 2013
Colombia 901 813 689 892 690 390 305 486 630 601
Cuba 661 666 429 660 459 307 240 408 579 531
Venezuela 107 197 185 316 309 159 126 162 279 334
Argentina 328 372 400 450 400 265 170 178 271 304
Spain 218 301 239 286 251 227 121 152 183 163
Peru 320 191 215 292 213 166 107 138 182 159
Guatemala 1,624 247 114 185 141 209 95 117 196 141
Honduras 118 156 59 123 98 131 55 92 143 129
United States 215 286 334 287 246 266 117 79 109 119
El Salvador 243 235 137 159 118 163 81 82 99 109
China 310 324 188 211 241 154 145 58 87 77
Italy 93 99 89 94 108 76 39 45 53 66
Bolivia 101 116 94 119 97 43 26 41 48 63
Dominican Republic 38 43 47 69 48 50 29 22 75 59
Ecuador 64 67 52 83 63 41 41 46 63 59
Other countries 1,088 1,497 904 1,244 989 842 453 527 593 667
Total 6,429 5,610 4,175 5,470 4,471 3,489 2,150 2,633 3,590 3,581
Sources and definitions: See Introduction to Statistical Annex and Metadata.
I.d.an. Acquisitions of nationality by country of previous nationality
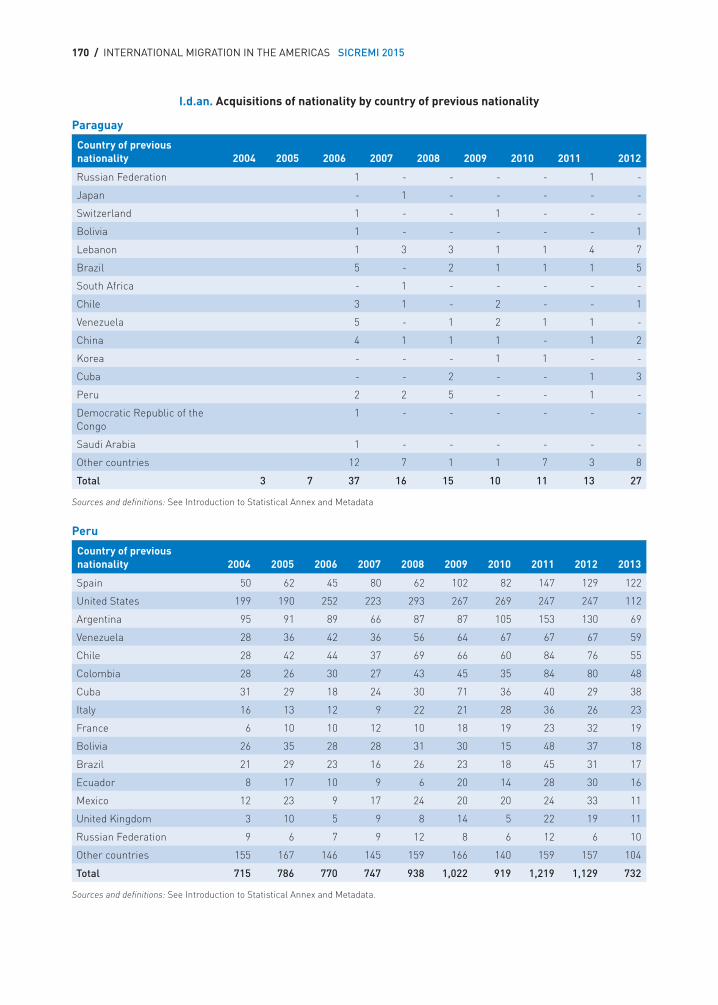
170 / INTERNATIONAL MIGRATION IN THE AMERICAS SICREMI 2015
Paraguay
Country of previous nationality 2004 2005 2006 2007 2008 2009 2010 2011 2012
Russian Federation 1 - - - - 1 -
Japan - 1 - - - - -
Switzerland 1 - - 1 - - -
Bolivia 1 - - - - - 1
Lebanon 1 3 3 1 1 4 7
Brazil 5 - 2 1 1 1 5
South Africa - 1 - - - - -
Chile 3 1 - 2 - - 1
Venezuela 5 - 1 2 1 1 -
China 4 1 1 1 - 1 2
Korea - - - 1 1 - -
Cuba - - 2 - - 1 3
Peru 2 2 5 - - 1 -
Democratic Republic of the Congo
1 - - - - - -
Saudi Arabia 1 - - - - - -
Other countries 12 7 1 1 7 3 8
Total 3 7 37 16 15 10 11 13 27
Sources and definitions: See Introduction to Statistical Annex and Metadata
Peru
Country of previous nationality 2004 2005 2006 2007 2008 2009 2010 2011 2012 2013
Spain 50 62 45 80 62 102 82 147 129 122
United States 199 190 252 223 293 267 269 247 247 112
Argentina 95 91 89 66 87 87 105 153 130 69
Venezuela 28 36 42 36 56 64 67 67 67 59
Chile 28 42 44 37 69 66 60 84 76 55
Colombia 28 26 30 27 43 45 35 84 80 48
Cuba 31 29 18 24 30 71 36 40 29 38
Italy 16 13 12 9 22 21 28 36 26 23
France 6 10 10 12 10 18 19 23 32 19
Bolivia 26 35 28 28 31 30 15 48 37 18
Brazil 21 29 23 16 26 23 18 45 31 17
Ecuador 8 17 10 9 6 20 14 28 30 16
Mexico 12 23 9 17 24 20 20 24 33 11
United Kingdom 3 10 5 9 8 14 5 22 19 11
Russian Federation 9 6 7 9 12 8 6 12 6 10
Other countries 155 167 146 145 159 166 140 159 157 104
Total 715 786 770 747 938 1,022 919 1,219 1,129 732
Sources and definitions: See Introduction to Statistical Annex and Metadata.
I.d.an. Acquisitions of nationality by country of previous nationality
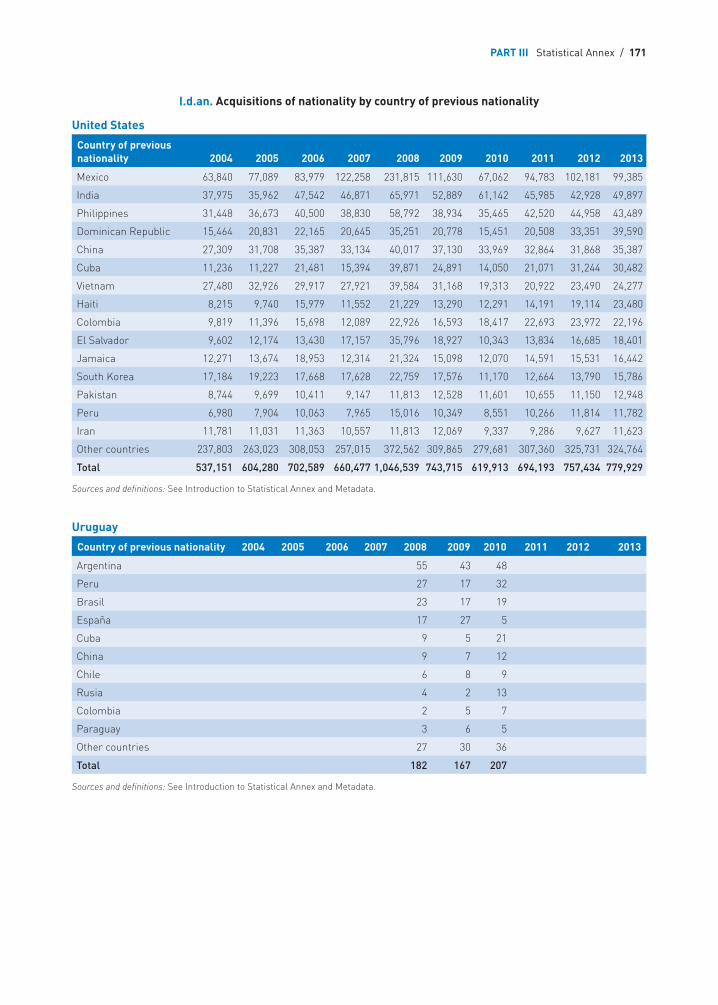
PART III Statistical Annex / 171
United States
Country of previous nationality 2004 2005 2006 2007 2008 2009 2010 2011 2012 2013
Mexico 63,840 77,089 83,979 122,258 231,815 111,630 67,062 94,783 102,181 99,385
India 37,975 35,962 47,542 46,871 65,971 52,889 61,142 45,985 42,928 49,897
Philippines 31,448 36,673 40,500 38,830 58,792 38,934 35,465 42,520 44,958 43,489
Dominican Republic 15,464 20,831 22,165 20,645 35,251 20,778 15,451 20,508 33,351 39,590
China 27,309 31,708 35,387 33,134 40,017 37,130 33,969 32,864 31,868 35,387
Cuba 11,236 11,227 21,481 15,394 39,871 24,891 14,050 21,071 31,244 30,482
Vietnam 27,480 32,926 29,917 27,921 39,584 31,168 19,313 20,922 23,490 24,277
Haiti 8,215 9,740 15,979 11,552 21,229 13,290 12,291 14,191 19,114 23,480
Colombia 9,819 11,396 15,698 12,089 22,926 16,593 18,417 22,693 23,972 22,196
El Salvador 9,602 12,174 13,430 17,157 35,796 18,927 10,343 13,834 16,685 18,401
Jamaica 12,271 13,674 18,953 12,314 21,324 15,098 12,070 14,591 15,531 16,442
South Korea 17,184 19,223 17,668 17,628 22,759 17,576 11,170 12,664 13,790 15,786
Pakistan 8,744 9,699 10,411 9,147 11,813 12,528 11,601 10,655 11,150 12,948
Peru 6,980 7,904 10,063 7,965 15,016 10,349 8,551 10,266 11,814 11,782
Iran 11,781 11,031 11,363 10,557 11,813 12,069 9,337 9,286 9,627 11,623
Other countries 237,803 263,023 308,053 257,015 372,562 309,865 279,681 307,360 325,731 324,764
Total 537,151 604,280 702,589 660,477 1,046,539 743,715 619,913 694,193 757,434 779,929
Sources and definitions: See Introduction to Statistical Annex and Metadata.
Uruguay
Country of previous nationality 2004 2005 2006 2007 2008 2009 2010 2011 2012 2013
Argentina 55 43 48
Peru 27 17 32
Brasil 23 17 19
España 17 27 5
Cuba 9 5 21
China 9 7 12
Chile 6 8 9
Rusia 4 2 13
Colombia 2 5 7
Paraguay 3 6 5
Other countries 27 30 36
Total 182 167 207
Sources and definitions: See Introduction to Statistical Annex and Metadata.
I.d.an. Acquisitions of nationality by country of previous nationality
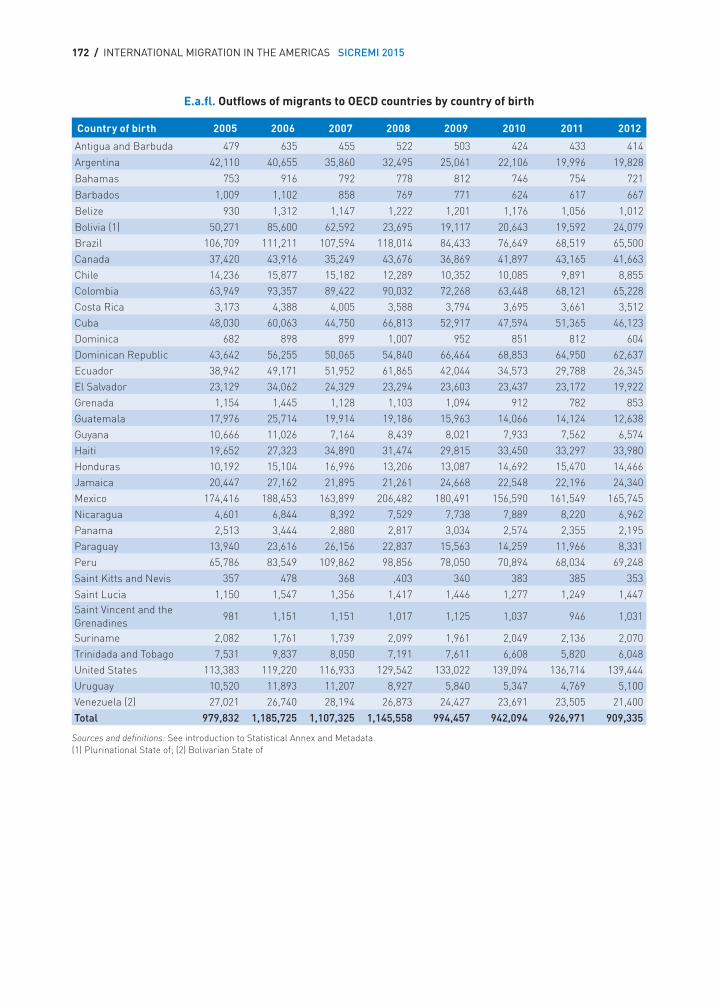
172 / INTERNATIONAL MIGRATION IN THE AMERICAS SICREMI 2015
E.a.fl. Outflows of migrants to OECD countries by country of birth
Country of birth 2005 2006 2007 2008 2009 2010 2011 2012
Antigua and Barbuda 479 635 455 522 503 424 433 414
Argentina 42,110 40,655 35,860 32,495 25,061 22,106 19,996 19,828
Bahamas 753 916 792 778 812 746 754 721
Barbados 1,009 1,102 858 769 771 624 617 667
Belize 930 1,312 1,147 1,222 1,201 1,176 1,056 1,012Bolivia (1) 50,271 85,600 62,592 23,695 19,117 20,643 19,592 24,079Brazil 106,709 111,211 107,594 118,014 84,433 76,649 68,519 65,500Canada 37,420 43,916 35,249 43,676 36,869 41,897 43,165 41,663Chile 14,236 15,877 15,182 12,289 10,352 10,085 9,891 8,855Colombia 63,949 93,357 89,422 90,032 72,268 63,448 68,121 65,228Costa Rica 3,173 4,388 4,005 3,588 3,794 3,695 3,661 3,512Cuba 48,030 60,063 44,750 66,813 52,917 47,594 51,365 46,123Dominica 682 898 899 1,007 952 851 812 604Dominican Republic 43,642 56,255 50,065 54,840 66,464 68,853 64,950 62,637Ecuador 38,942 49,171 51,952 61,865 42,044 34,573 29,788 26,345El Salvador 23,129 34,062 24,329 23,294 23,603 23,437 23,172 19,922Grenada 1,154 1,445 1,128 1,103 1,094 912 782 853Guatemala 17,976 25,714 19,914 19,186 15,963 14,066 14,124 12,638Guyana 10,666 11,026 7,164 8,439 8,021 7,933 7,562 6,574Haiti 19,652 27,323 34,890 31,474 29,815 33,450 33,297 33,980Honduras 10,192 15,104 16,996 13,206 13,087 14,692 15,470 14,466Jamaica 20,447 27,162 21,895 21,261 24,668 22,548 22,196 24,340Mexico 174,416 188,453 163,899 206,482 180,491 156,590 161,549 165,745Nicaragua 4,601 6,844 8,392 7,529 7,738 7,889 8,220 6,962Panama 2,513 3,444 2,880 2,817 3,034 2,574 2,355 2,195Paraguay 13,940 23,616 26,156 22,837 15,563 14,259 11,966 8,331Peru 65,786 83,549 109,862 98,856 78,050 70,894 68,034 69,248Saint Kitts and Nevis 357 478 368 ,403 340 383 385 353Saint Lucia 1,150 1,547 1,356 1,417 1,446 1,277 1,249 1,447Saint Vincent and the Grenadines
981 1,151 1,151 1,017 1,125 1,037 946 1,031
Suriname 2,082 1,761 1,739 2,099 1,961 2,049 2,136 2,070Trinidada and Tobago 7,531 9,837 8,050 7,191 7,611 6,608 5,820 6,048United States 113,383 119,220 116,933 129,542 133,022 139,094 136,714 139,444Uruguay 10,520 11,893 11,207 8,927 5,840 5,347 4,769 5,100Venezuela (2) 27,021 26,740 28,194 26,873 24,427 23,691 23,505 21,400Total 979,832 1,185,725 1,107,325 1,145,558 994,457 942,094 926,971 909,335
Sources and definitions: See introduction to Statistical Annex and Metadata.(1) Plurinational State of; (2) Bolivarian State of
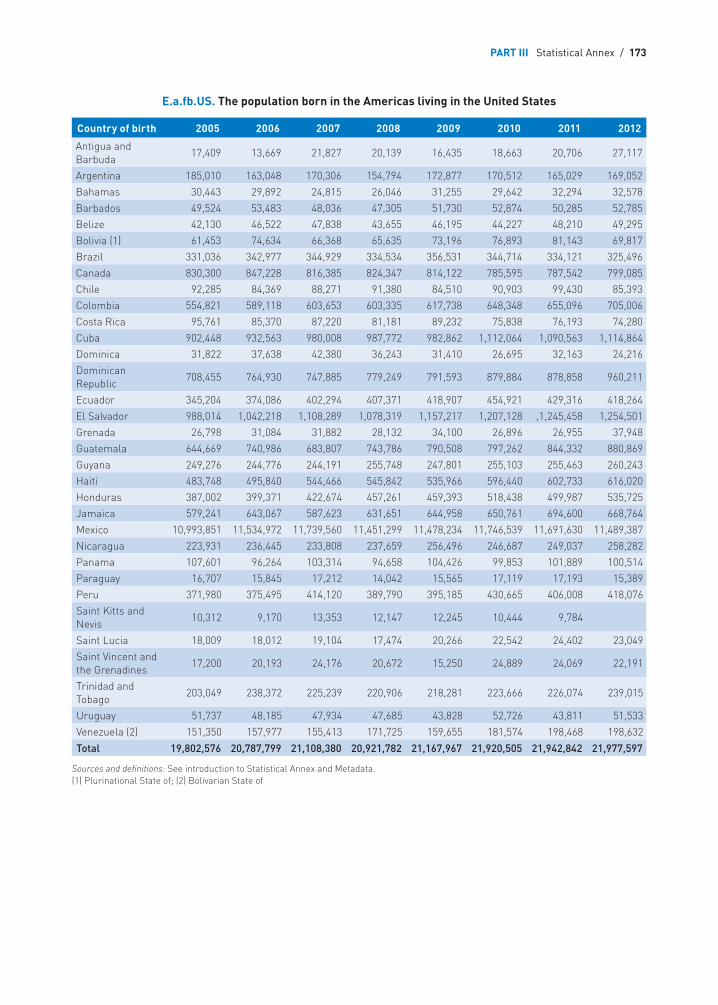
PART III Statistical Annex / 173
E.a.fb.US. The population born in the Americas living in the United States
Country of birth 2005 2006 2007 2008 2009 2010 2011 2012
Antigua and Barbuda
17,409 13,669 21,827 20,139 16,435 18,663 20,706 27,117
Argentina 185,010 163,048 170,306 154,794 172,877 170,512 165,029 169,052
Bahamas 30,443 29,892 24,815 26,046 31,255 29,642 32,294 32,578
Barbados 49,524 53,483 48,036 47,305 51,730 52,874 50,285 52,785
Belize 42,130 46,522 47,838 43,655 46,195 44,227 48,210 49,295
Bolivia (1) 61,453 74,634 66,368 65,635 73,196 76,893 81,143 69,817
Brazil 331,036 342,977 344,929 334,534 356,531 344,714 334,121 325,496
Canada 830,300 847,228 816,385 824,347 814,122 785,595 787,542 799,085
Chile 92,285 84,369 88,271 91,380 84,510 90,903 99,430 85,393
Colombia 554,821 589,118 603,653 603,335 617,738 648,348 655,096 705,006
Costa Rica 95,761 85,370 87,220 81,181 89,232 75,838 76,193 74,280
Cuba 902,448 932,563 980,008 987,772 982,862 1,112,064 1,090,563 1,114,864
Dominica 31,822 37,638 42,380 36,243 31,410 26,695 32,163 24,216
Dominican Republic
708,455 764,930 747,885 779,249 791,593 879,884 878,858 960,211
Ecuador 345,204 374,086 402,294 407,371 418,907 454,921 429,316 418,264
El Salvador 988,014 1,042,218 1,108,289 1,078,319 1,157,217 1,207,128 ,1,245,458 1,254,501
Grenada 26,798 31,084 31,882 28,132 34,100 26,896 26,955 37,948
Guatemala 644,669 740,986 683,807 743,786 790,508 797,262 844,332 880,869
Guyana 249,276 244,776 244,191 255,748 247,801 255,103 255,463 260,243
Haiti 483,748 495,840 544,466 545,842 535,966 596,440 602,733 616,020
Honduras 387,002 399,371 422,674 457,261 459,393 518,438 499,987 535,725
Jamaica 579,241 643,067 587,623 631,651 644,958 650,761 694,600 668,764
Mexico 10,993,851 11,534,972 11,739,560 11,451,299 11,478,234 11,746,539 11,691,630 11,489,387
Nicaragua 223,931 236,445 233,808 237,659 256,496 246,687 249,037 258,282
Panama 107,601 96,264 103,314 94,658 104,426 99,853 101,889 100,514
Paraguay 16,707 15,845 17,212 14,042 15,565 17,119 17,193 15,389
Peru 371,980 375,495 414,120 389,790 395,185 430,665 406,008 418,076
Saint Kitts and Nevis
10,312 9,170 13,353 12,147 12,245 10,444 9,784
Saint Lucia 18,009 18,012 19,104 17,474 20,266 22,542 24,402 23,049
Saint Vincent and the Grenadines
17,200 20,193 24,176 20,672 15,250 24,889 24,069 22,191
Trinidad and Tobago
203,049 238,372 225,239 220,906 218,281 223,666 226,074 239,015
Uruguay 51,737 48,185 47,934 47,685 43,828 52,726 43,811 51,533
Venezuela (2) 151,350 157,977 155,413 171,725 159,655 181,574 198,468 198,632
Total 19,802,576 20,787,799 21,108,380 20,921,782 21,167,967 21,920,505 21,942,842 21,977,597
Sources and definitions: See introduction to Statistical Annex and Metadata.(1) Plurinational State of; (2) Bolivarian State of
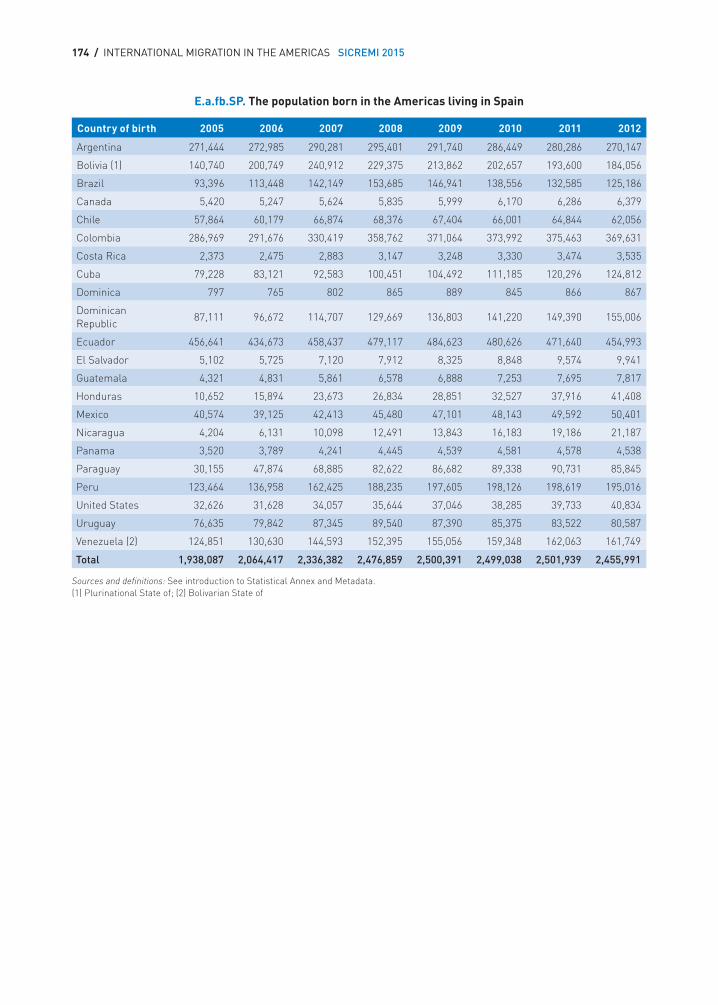
174 / INTERNATIONAL MIGRATION IN THE AMERICAS SICREMI 2015
E.a.fb.SP. The population born in the Americas living in Spain
Country of birth 2005 2006 2007 2008 2009 2010 2011 2012
Argentina 271,444 272,985 290,281 295,401 291,740 286,449 280,286 270,147
Bolivia (1) 140,740 200,749 240,912 229,375 213,862 202,657 193,600 184,056
Brazil 93,396 113,448 142,149 153,685 146,941 138,556 132,585 125,186
Canada 5,420 5,247 5,624 5,835 5,999 6,170 6,286 6,379
Chile 57,864 60,179 66,874 68,376 67,404 66,001 64,844 62,056
Colombia 286,969 291,676 330,419 358,762 371,064 373,992 375,463 369,631
Costa Rica 2,373 2,475 2,883 3,147 3,248 3,330 3,474 3,535
Cuba 79,228 83,121 92,583 100,451 104,492 111,185 120,296 124,812
Dominica 797 765 802 865 889 845 866 867
Dominican Republic
87,111 96,672 114,707 129,669 136,803 141,220 149,390 155,006
Ecuador 456,641 434,673 458,437 479,117 484,623 480,626 471,640 454,993
El Salvador 5,102 5,725 7,120 7,912 8,325 8,848 9,574 9,941
Guatemala 4,321 4,831 5,861 6,578 6,888 7,253 7,695 7,817
Honduras 10,652 15,894 23,673 26,834 28,851 32,527 37,916 41,408
Mexico 40,574 39,125 42,413 45,480 47,101 48,143 49,592 50,401
Nicaragua 4,204 6,131 10,098 12,491 13,843 16,183 19,186 21,187
Panama 3,520 3,789 4,241 4,445 4,539 4,581 4,578 4,538
Paraguay 30,155 47,874 68,885 82,622 86,682 89,338 90,731 85,845
Peru 123,464 136,958 162,425 188,235 197,605 198,126 198,619 195,016
United States 32,626 31,628 34,057 35,644 37,046 38,285 39,733 40,834
Uruguay 76,635 79,842 87,345 89,540 87,390 85,375 83,522 80,587
Venezuela (2) 124,851 130,630 144,593 152,395 155,056 159,348 162,063 161,749
Total 1,938,087 2,064,417 2,336,382 2,476,859 2,500,391 2,499,038 2,501,939 2,455,991
Sources and definitions: See introduction to Statistical Annex and Metadata.(1) Plurinational State of; (2) Bolivarian State of
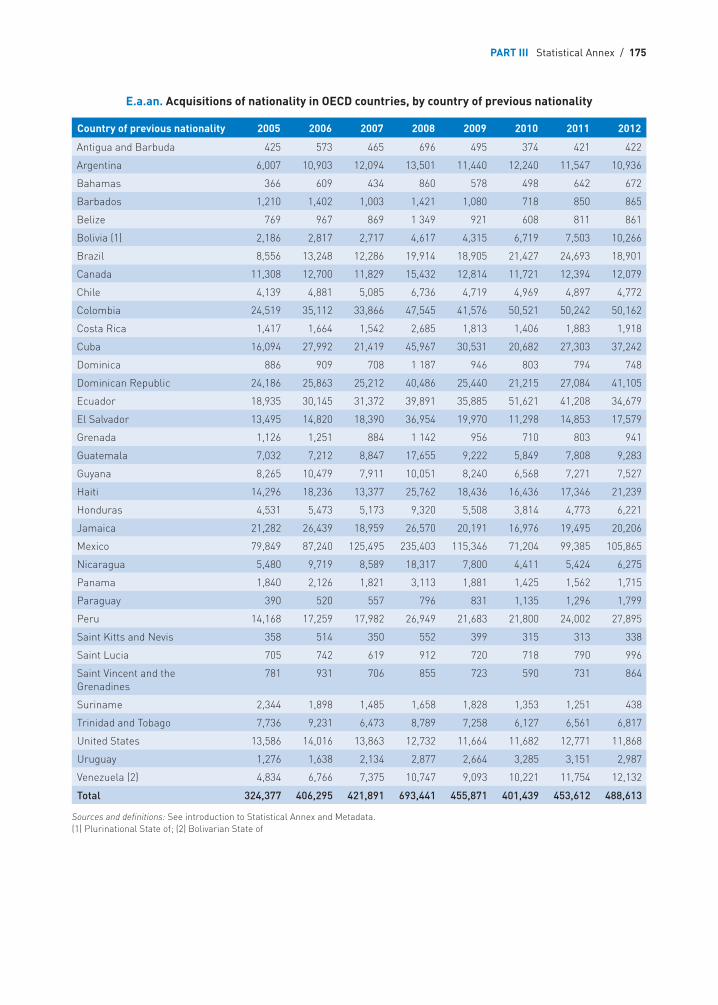
PART III Statistical Annex / 175
E.a.an. Acquisitions of nationality in OECD countries, by country of previous nationality
Country of previous nationality 2005 2006 2007 2008 2009 2010 2011 2012
Antigua and Barbuda 425 573 465 696 495 374 421 422
Argentina 6,007 10,903 12,094 13,501 11,440 12,240 11,547 10,936
Bahamas 366 609 434 860 578 498 642 672
Barbados 1,210 1,402 1,003 1,421 1,080 718 850 865
Belize 769 967 869 1 349 921 608 811 861
Bolivia (1) 2,186 2,817 2,717 4,617 4,315 6,719 7,503 10,266
Brazil 8,556 13,248 12,286 19,914 18,905 21,427 24,693 18,901
Canada 11,308 12,700 11,829 15,432 12,814 11,721 12,394 12,079
Chile 4,139 4,881 5,085 6,736 4,719 4,969 4,897 4,772
Colombia 24,519 35,112 33,866 47,545 41,576 50,521 50,242 50,162
Costa Rica 1,417 1,664 1,542 2,685 1,813 1,406 1,883 1,918
Cuba 16,094 27,992 21,419 45,967 30,531 20,682 27,303 37,242
Dominica 886 909 708 1 187 946 803 794 748
Dominican Republic 24,186 25,863 25,212 40,486 25,440 21,215 27,084 41,105
Ecuador 18,935 30,145 31,372 39,891 35,885 51,621 41,208 34,679
El Salvador 13,495 14,820 18,390 36,954 19,970 11,298 14,853 17,579
Grenada 1,126 1,251 884 1 142 956 710 803 941
Guatemala 7,032 7,212 8,847 17,655 9,222 5,849 7,808 9,283
Guyana 8,265 10,479 7,911 10,051 8,240 6,568 7,271 7,527
Haiti 14,296 18,236 13,377 25,762 18,436 16,436 17,346 21,239
Honduras 4,531 5,473 5,173 9,320 5,508 3,814 4,773 6,221
Jamaica 21,282 26,439 18,959 26,570 20,191 16,976 19,495 20,206
Mexico 79,849 87,240 125,495 235,403 115,346 71,204 99,385 105,865
Nicaragua 5,480 9,719 8,589 18,317 7,800 4,411 5,424 6,275
Panama 1,840 2,126 1,821 3,113 1,881 1,425 1,562 1,715
Paraguay 390 520 557 796 831 1,135 1,296 1,799
Peru 14,168 17,259 17,982 26,949 21,683 21,800 24,002 27,895
Saint Kitts and Nevis 358 514 350 552 399 315 313 338
Saint Lucia 705 742 619 912 720 718 790 996
Saint Vincent and the Grenadines
781 931 706 855 723 590 731 864
Suriname 2,344 1,898 1,485 1,658 1,828 1,353 1,251 438
Trinidad and Tobago 7,736 9,231 6,473 8,789 7,258 6,127 6,561 6,817
United States 13,586 14,016 13,863 12,732 11,664 11,682 12,771 11,868
Uruguay 1,276 1,638 2,134 2,877 2,664 3,285 3,151 2,987
Venezuela (2) 4,834 6,766 7,375 10,747 9,093 10,221 11,754 12,132
Total 324,377 406,295 421,891 693,441 455,871 401,439 453,612 488,613
Sources and definitions: See introduction to Statistical Annex and Metadata.(1) Plurinational State of; (2) Bolivarian State of
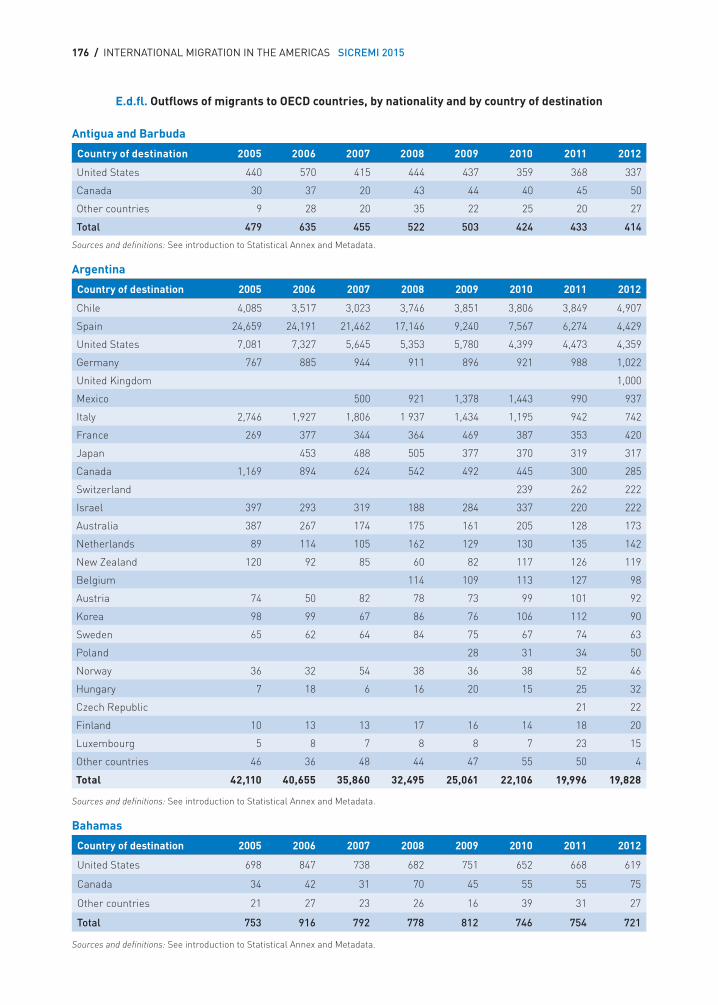
176 / INTERNATIONAL MIGRATION IN THE AMERICAS SICREMI 2015
E.d.fl. Outflows of migrants to OECD countries, by nationality and by country of destination
Antigua and Barbuda
Country of destination 2005 2006 2007 2008 2009 2010 2011 2012
United States 440 570 415 444 437 359 368 337
Canada 30 37 20 43 44 40 45 50
Other countries 9 28 20 35 22 25 20 27
Total 479 635 455 522 503 424 433 414
Sources and definitions: See introduction to Statistical Annex and Metadata.
Argentina
Country of destination 2005 2006 2007 2008 2009 2010 2011 2012
Chile 4,085 3,517 3,023 3,746 3,851 3,806 3,849 4,907
Spain 24,659 24,191 21,462 17,146 9,240 7,567 6,274 4,429
United States 7,081 7,327 5,645 5,353 5,780 4,399 4,473 4,359
Germany 767 885 944 911 896 921 988 1,022
United Kingdom 1,000
Mexico 500 921 1,378 1,443 990 937
Italy 2,746 1,927 1,806 1 937 1,434 1,195 942 742
France 269 377 344 364 469 387 353 420
Japan 453 488 505 377 370 319 317
Canada 1,169 894 624 542 492 445 300 285
Switzerland 239 262 222
Israel 397 293 319 188 284 337 220 222
Australia 387 267 174 175 161 205 128 173
Netherlands 89 114 105 162 129 130 135 142
New Zealand 120 92 85 60 82 117 126 119
Belgium 114 109 113 127 98
Austria 74 50 82 78 73 99 101 92
Korea 98 99 67 86 76 106 112 90
Sweden 65 62 64 84 75 67 74 63
Poland 28 31 34 50
Norway 36 32 54 38 36 38 52 46
Hungary 7 18 6 16 20 15 25 32
Czech Republic 21 22
Finland 10 13 13 17 16 14 18 20
Luxembourg 5 8 7 8 8 7 23 15
Other countries 46 36 48 44 47 55 50 4
Total 42,110 40,655 35,860 32,495 25,061 22,106 19,996 19,828
Sources and definitions: See introduction to Statistical Annex and Metadata.
Bahamas
Country of destination 2005 2006 2007 2008 2009 2010 2011 2012
United States 698 847 738 682 751 652 668 619
Canada 34 42 31 70 45 55 55 75
Other countries 21 27 23 26 16 39 31 27
Total 753 916 792 778 812 746 754 721
Sources and definitions: See introduction to Statistical Annex and Metadata.
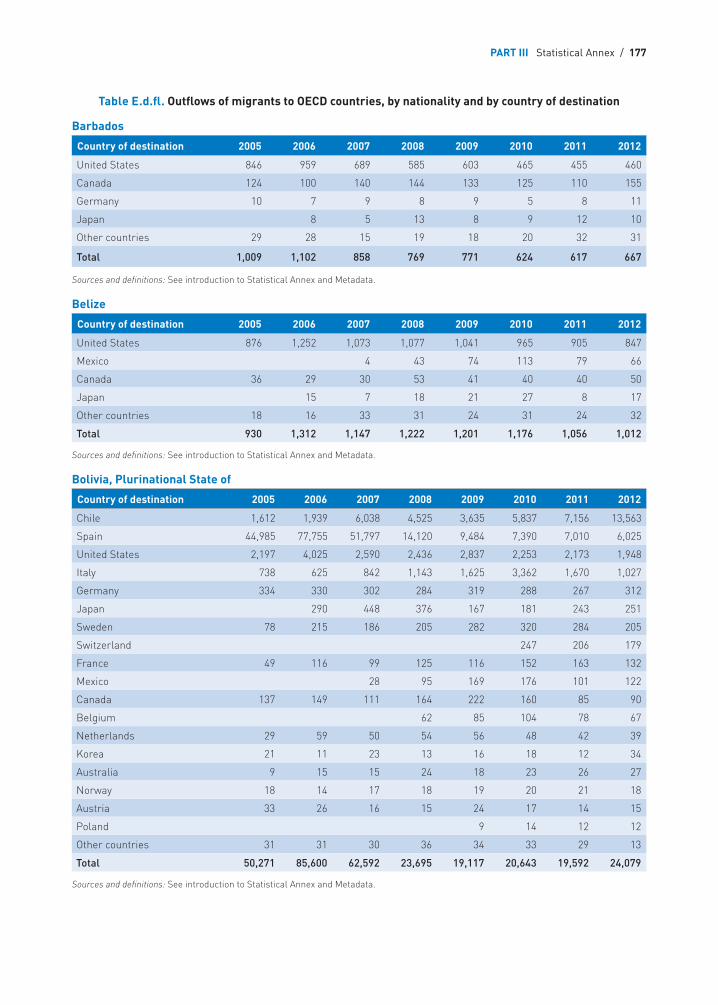
PART III Statistical Annex / 177
Barbados
Country of destination 2005 2006 2007 2008 2009 2010 2011 2012
United States 846 959 689 585 603 465 455 460
Canada 124 100 140 144 133 125 110 155
Germany 10 7 9 8 9 5 8 11
Japan 8 5 13 8 9 12 10
Other countries 29 28 15 19 18 20 32 31
Total 1,009 1,102 858 769 771 624 617 667
Sources and definitions: See introduction to Statistical Annex and Metadata.
Belize
Country of destination 2005 2006 2007 2008 2009 2010 2011 2012
United States 876 1,252 1,073 1,077 1,041 965 905 847
Mexico 4 43 74 113 79 66
Canada 36 29 30 53 41 40 40 50
Japan 15 7 18 21 27 8 17
Other countries 18 16 33 31 24 31 24 32
Total 930 1,312 1,147 1,222 1,201 1,176 1,056 1,012
Sources and definitions: See introduction to Statistical Annex and Metadata.
Bolivia, Plurinational State of
Country of destination 2005 2006 2007 2008 2009 2010 2011 2012
Chile 1,612 1,939 6,038 4,525 3,635 5,837 7,156 13,563
Spain 44,985 77,755 51,797 14,120 9,484 7,390 7,010 6,025
United States 2,197 4,025 2,590 2,436 2,837 2,253 2,173 1,948
Italy 738 625 842 1,143 1,625 3,362 1,670 1,027
Germany 334 330 302 284 319 288 267 312
Japan 290 448 376 167 181 243 251
Sweden 78 215 186 205 282 320 284 205
Switzerland 247 206 179
France 49 116 99 125 116 152 163 132
Mexico 28 95 169 176 101 122
Canada 137 149 111 164 222 160 85 90
Belgium 62 85 104 78 67
Netherlands 29 59 50 54 56 48 42 39
Korea 21 11 23 13 16 18 12 34
Australia 9 15 15 24 18 23 26 27
Norway 18 14 17 18 19 20 21 18
Austria 33 26 16 15 24 17 14 15
Poland 9 14 12 12
Other countries 31 31 30 36 34 33 29 13
Total 50,271 85,600 62,592 23,695 19,117 20,643 19,592 24,079
Sources and definitions: See introduction to Statistical Annex and Metadata.
Table E.d.fl. Outflows of migrants to OECD countries, by nationality and by country of destination
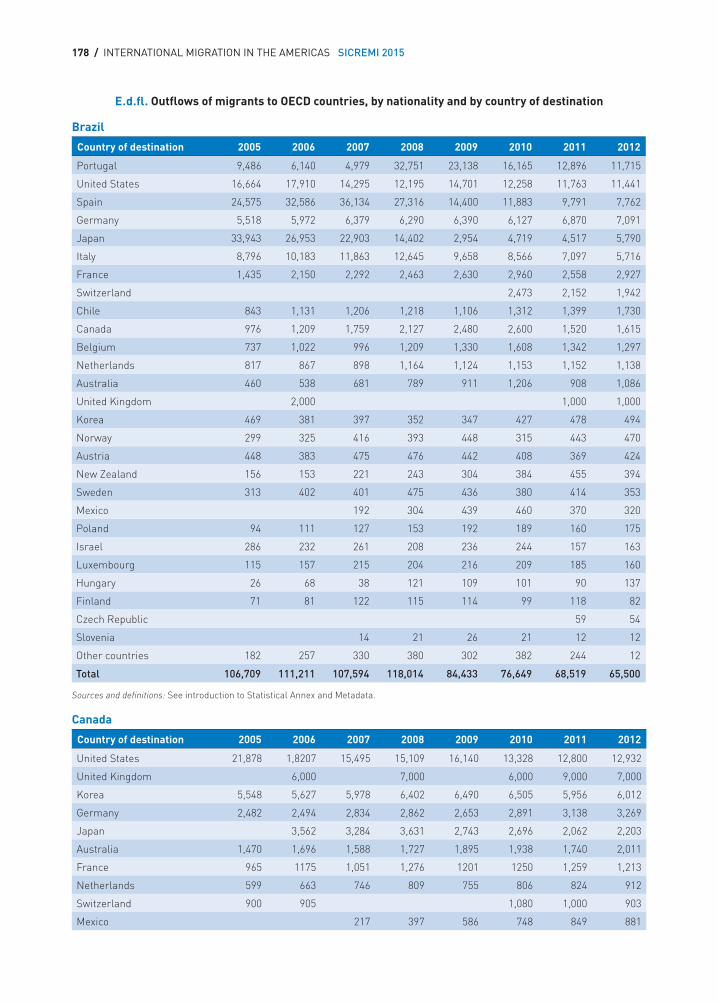
178 / INTERNATIONAL MIGRATION IN THE AMERICAS SICREMI 2015
Brazil
Country of destination 2005 2006 2007 2008 2009 2010 2011 2012
Portugal 9,486 6,140 4,979 32,751 23,138 16,165 12,896 11,715
United States 16,664 17,910 14,295 12,195 14,701 12,258 11,763 11,441
Spain 24,575 32,586 36,134 27,316 14,400 11,883 9,791 7,762
Germany 5,518 5,972 6,379 6,290 6,390 6,127 6,870 7,091
Japan 33,943 26,953 22,903 14,402 2,954 4,719 4,517 5,790
Italy 8,796 10,183 11,863 12,645 9,658 8,566 7,097 5,716
France 1,435 2,150 2,292 2,463 2,630 2,960 2,558 2,927
Switzerland 2,473 2,152 1,942
Chile 843 1,131 1,206 1,218 1,106 1,312 1,399 1,730
Canada 976 1,209 1,759 2,127 2,480 2,600 1,520 1,615
Belgium 737 1,022 996 1,209 1,330 1,608 1,342 1,297
Netherlands 817 867 898 1,164 1,124 1,153 1,152 1,138
Australia 460 538 681 789 911 1,206 908 1,086
United Kingdom 2,000 1,000 1,000
Korea 469 381 397 352 347 427 478 494
Norway 299 325 416 393 448 315 443 470
Austria 448 383 475 476 442 408 369 424
New Zealand 156 153 221 243 304 384 455 394
Sweden 313 402 401 475 436 380 414 353
Mexico 192 304 439 460 370 320
Poland 94 111 127 153 192 189 160 175
Israel 286 232 261 208 236 244 157 163
Luxembourg 115 157 215 204 216 209 185 160
Hungary 26 68 38 121 109 101 90 137
Finland 71 81 122 115 114 99 118 82
Czech Republic 59 54
Slovenia 14 21 26 21 12 12
Other countries 182 257 330 380 302 382 244 12
Total 106,709 111,211 107,594 118,014 84,433 76,649 68,519 65,500
Sources and definitions: See introduction to Statistical Annex and Metadata.
Canada
Country of destination 2005 2006 2007 2008 2009 2010 2011 2012
United States 21,878 1,8207 15,495 15,109 16,140 13,328 12,800 12,932
United Kingdom 6,000 7,000 6,000 9,000 7,000
Korea 5,548 5,627 5,978 6,402 6,490 6,505 5,956 6,012
Germany 2,482 2,494 2,834 2,862 2,653 2,891 3,138 3,269
Japan 3,562 3,284 3,631 2,743 2,696 2,062 2,203
Australia 1,470 1,696 1,588 1,727 1,895 1,938 1,740 2,011
France 965 1175 1,051 1,276 1201 1250 1,259 1,213
Netherlands 599 663 746 809 755 806 824 912
Switzerland 900 905 1,080 1,000 903
Mexico 217 397 586 748 849 881
E.d.fl. Outflows of migrants to OECD countries, by nationality and by country of destination
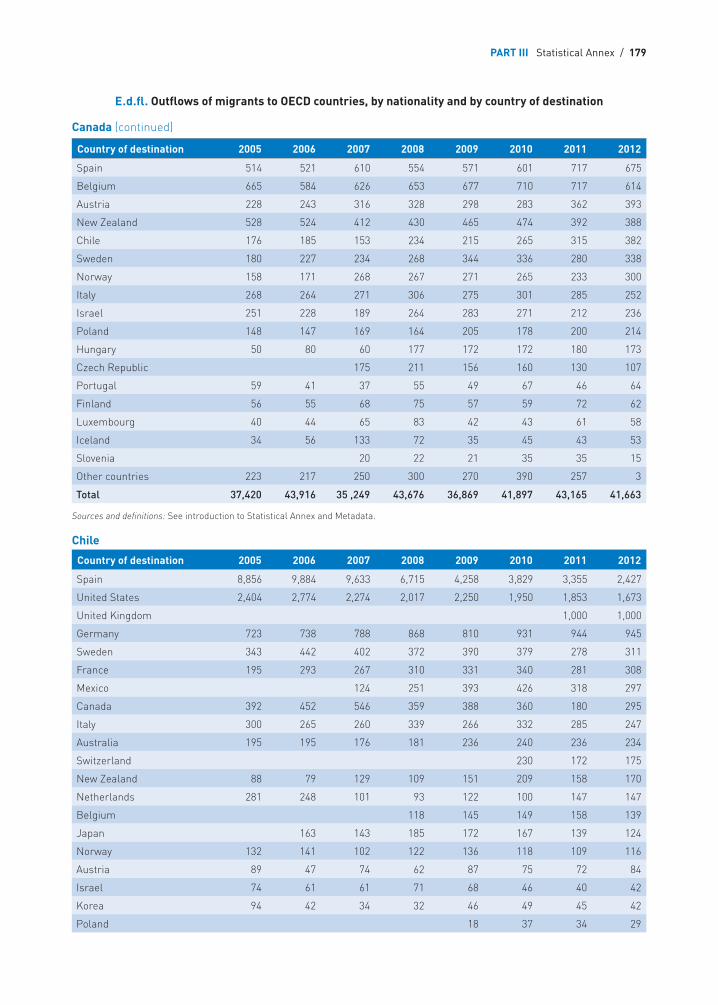
PART III Statistical Annex / 179
Country of destination 2005 2006 2007 2008 2009 2010 2011 2012
Spain 514 521 610 554 571 601 717 675
Belgium 665 584 626 653 677 710 717 614
Austria 228 243 316 328 298 283 362 393
New Zealand 528 524 412 430 465 474 392 388
Chile 176 185 153 234 215 265 315 382
Sweden 180 227 234 268 344 336 280 338
Norway 158 171 268 267 271 265 233 300
Italy 268 264 271 306 275 301 285 252
Israel 251 228 189 264 283 271 212 236
Poland 148 147 169 164 205 178 200 214
Hungary 50 80 60 177 172 172 180 173
Czech Republic 175 211 156 160 130 107
Portugal 59 41 37 55 49 67 46 64
Finland 56 55 68 75 57 59 72 62
Luxembourg 40 44 65 83 42 43 61 58
Iceland 34 56 133 72 35 45 43 53
Slovenia 20 22 21 35 35 15
Other countries 223 217 250 300 270 390 257 3
Total 37,420 43,916 35 ,249 43,676 36,869 41,897 43,165 41,663
Sources and definitions: See introduction to Statistical Annex and Metadata.
Chile
Country of destination 2005 2006 2007 2008 2009 2010 2011 2012
Spain 8,856 9,884 9,633 6,715 4,258 3,829 3,355 2,427
United States 2,404 2,774 2,274 2,017 2,250 1,950 1,853 1,673
United Kingdom 1,000 1,000
Germany 723 738 788 868 810 931 944 945
Sweden 343 442 402 372 390 379 278 311
France 195 293 267 310 331 340 281 308
Mexico 124 251 393 426 318 297
Canada 392 452 546 359 388 360 180 295
Italy 300 265 260 339 266 332 285 247
Australia 195 195 176 181 236 240 236 234
Switzerland 230 172 175
New Zealand 88 79 129 109 151 209 158 170
Netherlands 281 248 101 93 122 100 147 147
Belgium 118 145 149 158 139
Japan 163 143 185 172 167 139 124
Norway 132 141 102 122 136 118 109 116
Austria 89 47 74 62 87 75 72 84
Israel 74 61 61 71 68 46 40 42
Korea 94 42 34 32 46 49 45 42
Poland 18 37 34 29
E.d.fl. Outflows of migrants to OECD countries, by nationality and by country of destination
Canada (continued)
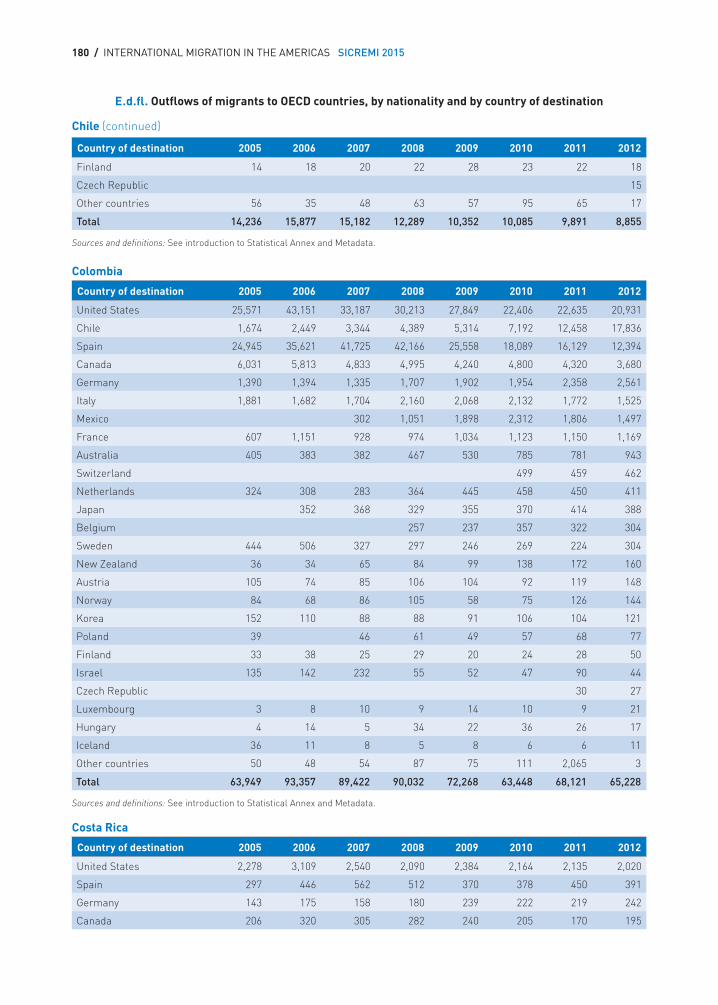
180 / INTERNATIONAL MIGRATION IN THE AMERICAS SICREMI 2015
Country of destination 2005 2006 2007 2008 2009 2010 2011 2012
Finland 14 18 20 22 28 23 22 18
Czech Republic 15
Other countries 56 35 48 63 57 95 65 17
Total 14,236 15,877 15,182 12,289 10,352 10,085 9,891 8,855
Sources and definitions: See introduction to Statistical Annex and Metadata.
Colombia
Country of destination 2005 2006 2007 2008 2009 2010 2011 2012
United States 25,571 43,151 33,187 30,213 27,849 22,406 22,635 20,931
Chile 1,674 2,449 3,344 4,389 5,314 7,192 12,458 17,836
Spain 24,945 35,621 41,725 42,166 25,558 18,089 16,129 12,394
Canada 6,031 5,813 4,833 4,995 4,240 4,800 4,320 3,680
Germany 1,390 1,394 1,335 1,707 1,902 1,954 2,358 2,561
Italy 1,881 1,682 1,704 2,160 2,068 2,132 1,772 1,525
Mexico 302 1,051 1,898 2,312 1,806 1,497
France 607 1,151 928 974 1,034 1,123 1,150 1,169
Australia 405 383 382 467 530 785 781 943
Switzerland 499 459 462
Netherlands 324 308 283 364 445 458 450 411
Japan 352 368 329 355 370 414 388
Belgium 257 237 357 322 304
Sweden 444 506 327 297 246 269 224 304
New Zealand 36 34 65 84 99 138 172 160
Austria 105 74 85 106 104 92 119 148
Norway 84 68 86 105 58 75 126 144
Korea 152 110 88 88 91 106 104 121
Poland 39 46 61 49 57 68 77
Finland 33 38 25 29 20 24 28 50
Israel 135 142 232 55 52 47 90 44
Czech Republic 30 27
Luxembourg 3 8 10 9 14 10 9 21
Hungary 4 14 5 34 22 36 26 17
Iceland 36 11 8 5 8 6 6 11
Other countries 50 48 54 87 75 111 2,065 3
Total 63,949 93,357 89,422 90,032 72,268 63,448 68,121 65,228
Sources and definitions: See introduction to Statistical Annex and Metadata.
Costa Rica
Country of destination 2005 2006 2007 2008 2009 2010 2011 2012
United States 2,278 3,109 2,540 2,090 2,384 2,164 2,135 2,020
Spain 297 446 562 512 370 378 450 391
Germany 143 175 158 180 239 222 219 242
Canada 206 320 305 282 240 205 170 195
E.d.fl. Outflows of migrants to OECD countries, by nationality and by country of destination
Chile (continued)
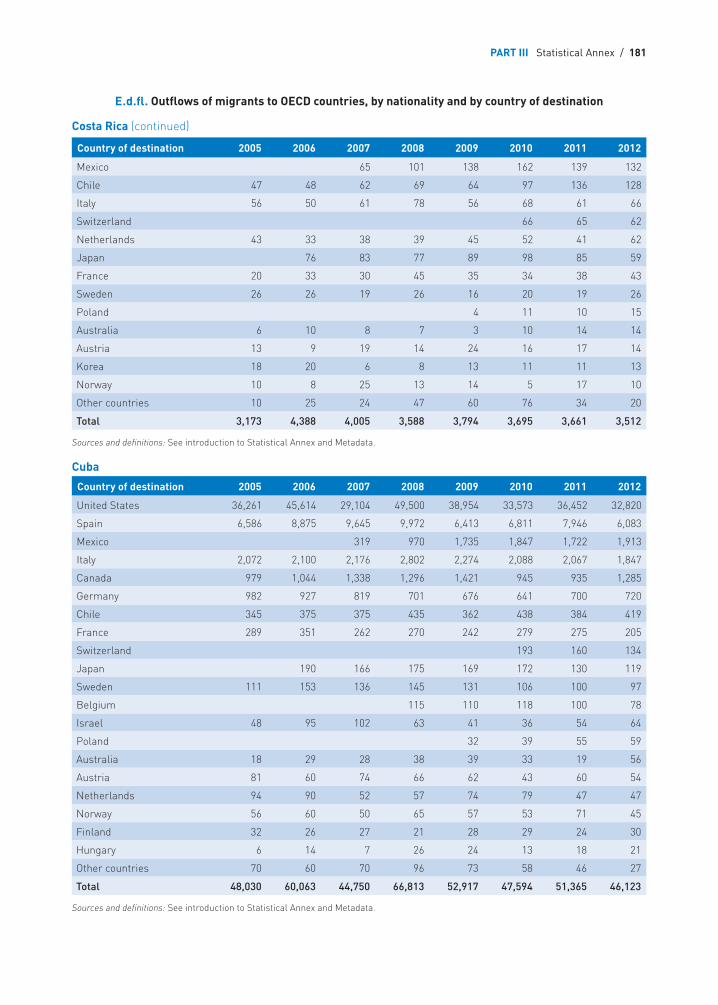
PART III Statistical Annex / 181
Country of destination 2005 2006 2007 2008 2009 2010 2011 2012
Mexico 65 101 138 162 139 132
Chile 47 48 62 69 64 97 136 128
Italy 56 50 61 78 56 68 61 66
Switzerland 66 65 62
Netherlands 43 33 38 39 45 52 41 62
Japan 76 83 77 89 98 85 59
France 20 33 30 45 35 34 38 43
Sweden 26 26 19 26 16 20 19 26
Poland 4 11 10 15
Australia 6 10 8 7 3 10 14 14
Austria 13 9 19 14 24 16 17 14
Korea 18 20 6 8 13 11 11 13
Norway 10 8 25 13 14 5 17 10
Other countries 10 25 24 47 60 76 34 20
Total 3,173 4,388 4,005 3,588 3,794 3,695 3,661 3,512
Sources and definitions: See introduction to Statistical Annex and Metadata.
Cuba
Country of destination 2005 2006 2007 2008 2009 2010 2011 2012
United States 36,261 45,614 29,104 49,500 38,954 33,573 36,452 32,820
Spain 6,586 8,875 9,645 9,972 6,413 6,811 7,946 6,083
Mexico 319 970 1,735 1,847 1,722 1,913
Italy 2,072 2,100 2,176 2,802 2,274 2,088 2,067 1,847
Canada 979 1,044 1,338 1,296 1,421 945 935 1,285
Germany 982 927 819 701 676 641 700 720
Chile 345 375 375 435 362 438 384 419
France 289 351 262 270 242 279 275 205
Switzerland 193 160 134
Japan 190 166 175 169 172 130 119
Sweden 111 153 136 145 131 106 100 97
Belgium 115 110 118 100 78
Israel 48 95 102 63 41 36 54 64
Poland 32 39 55 59
Australia 18 29 28 38 39 33 19 56
Austria 81 60 74 66 62 43 60 54
Netherlands 94 90 52 57 74 79 47 47
Norway 56 60 50 65 57 53 71 45
Finland 32 26 27 21 28 29 24 30
Hungary 6 14 7 26 24 13 18 21
Other countries 70 60 70 96 73 58 46 27
Total 48,030 60,063 44,750 66,813 52,917 47,594 51,365 46,123
Sources and definitions: See introduction to Statistical Annex and Metadata.
E.d.fl. Outflows of migrants to OECD countries, by nationality and by country of destination
Costa Rica (continued)
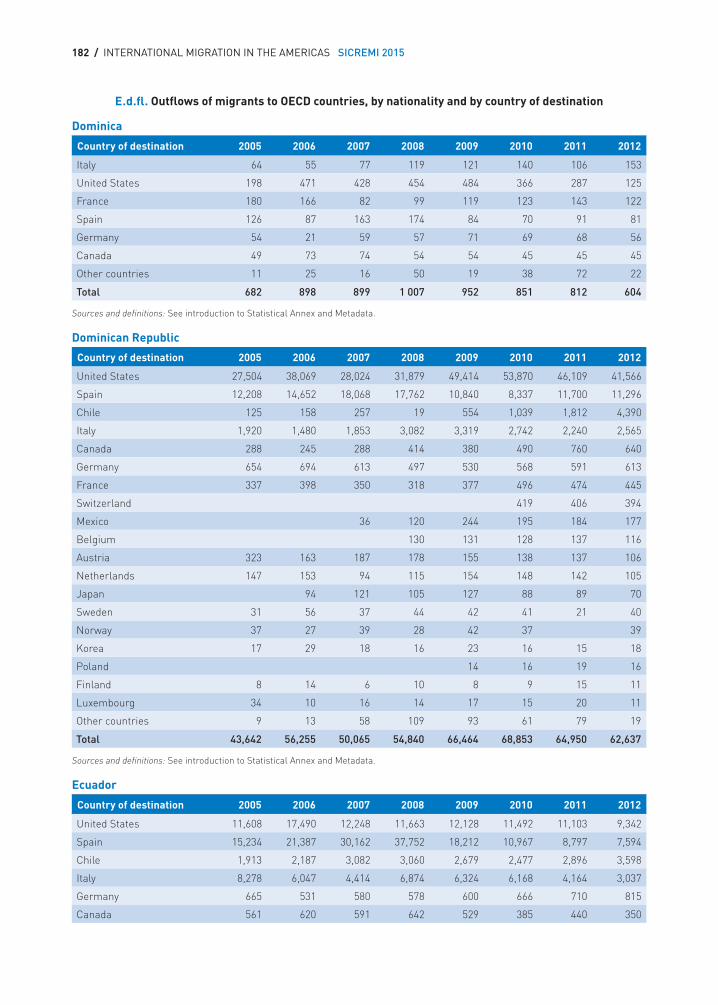
182 / INTERNATIONAL MIGRATION IN THE AMERICAS SICREMI 2015
Dominica
Country of destination 2005 2006 2007 2008 2009 2010 2011 2012
Italy 64 55 77 119 121 140 106 153
United States 198 471 428 454 484 366 287 125
France 180 166 82 99 119 123 143 122
Spain 126 87 163 174 84 70 91 81
Germany 54 21 59 57 71 69 68 56
Canada 49 73 74 54 54 45 45 45
Other countries 11 25 16 50 19 38 72 22
Total 682 898 899 1 007 952 851 812 604
Sources and definitions: See introduction to Statistical Annex and Metadata.
Dominican Republic
Country of destination 2005 2006 2007 2008 2009 2010 2011 2012
United States 27,504 38,069 28,024 31,879 49,414 53,870 46,109 41,566
Spain 12,208 14,652 18,068 17,762 10,840 8,337 11,700 11,296
Chile 125 158 257 19 554 1,039 1,812 4,390
Italy 1,920 1,480 1,853 3,082 3,319 2,742 2,240 2,565
Canada 288 245 288 414 380 490 760 640
Germany 654 694 613 497 530 568 591 613
France 337 398 350 318 377 496 474 445
Switzerland 419 406 394
Mexico 36 120 244 195 184 177
Belgium 130 131 128 137 116
Austria 323 163 187 178 155 138 137 106
Netherlands 147 153 94 115 154 148 142 105
Japan 94 121 105 127 88 89 70
Sweden 31 56 37 44 42 41 21 40
Norway 37 27 39 28 42 37 39
Korea 17 29 18 16 23 16 15 18
Poland 14 16 19 16
Finland 8 14 6 10 8 9 15 11
Luxembourg 34 10 16 14 17 15 20 11
Other countries 9 13 58 109 93 61 79 19
Total 43,642 56,255 50,065 54,840 66,464 68,853 64,950 62,637
Sources and definitions: See introduction to Statistical Annex and Metadata.
Ecuador
Country of destination 2005 2006 2007 2008 2009 2010 2011 2012
United States 11,608 17,490 12,248 11,663 12,128 11,492 11,103 9,342
Spain 15,234 21,387 30,162 37,752 18,212 10,967 8,797 7,594
Chile 1,913 2,187 3,082 3,060 2,679 2,477 2,896 3,598
Italy 8,278 6,047 4,414 6,874 6,324 6,168 4,164 3,037
Germany 665 531 580 578 600 666 710 815
Canada 561 620 591 642 529 385 440 350
E.d.fl. Outflows of migrants to OECD countries, by nationality and by country of destination
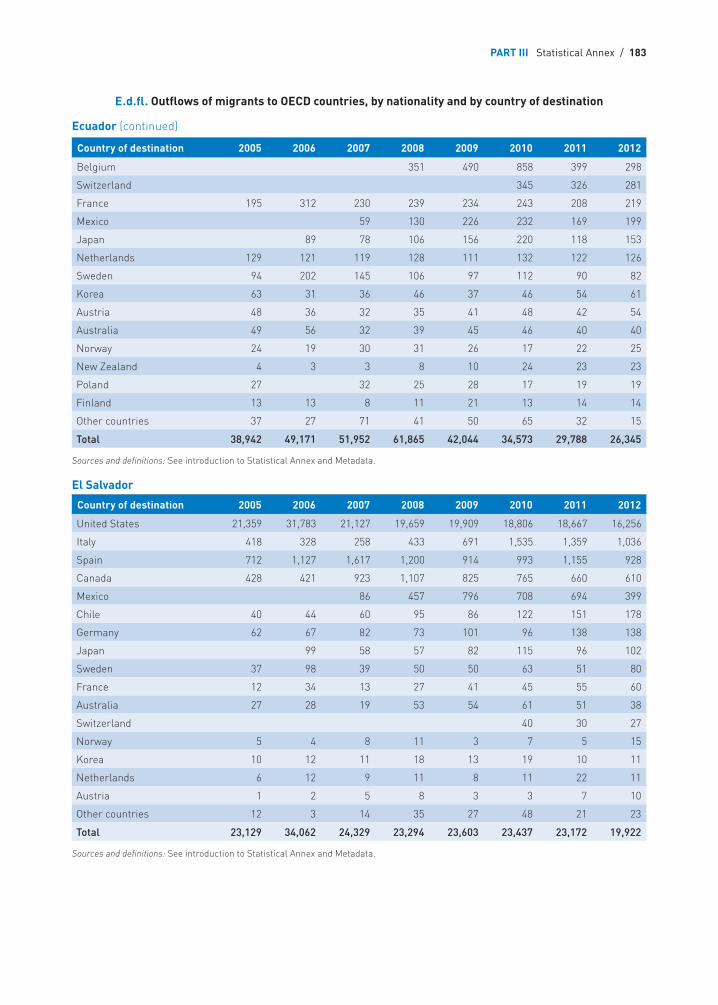
PART III Statistical Annex / 183
Country of destination 2005 2006 2007 2008 2009 2010 2011 2012
Belgium 351 490 858 399 298
Switzerland 345 326 281
France 195 312 230 239 234 243 208 219
Mexico 59 130 226 232 169 199
Japan 89 78 106 156 220 118 153
Netherlands 129 121 119 128 111 132 122 126
Sweden 94 202 145 106 97 112 90 82
Korea 63 31 36 46 37 46 54 61
Austria 48 36 32 35 41 48 42 54
Australia 49 56 32 39 45 46 40 40
Norway 24 19 30 31 26 17 22 25
New Zealand 4 3 3 8 10 24 23 23
Poland 27 32 25 28 17 19 19
Finland 13 13 8 11 21 13 14 14
Other countries 37 27 71 41 50 65 32 15
Total 38,942 49,171 51,952 61,865 42,044 34,573 29,788 26,345
Sources and definitions: See introduction to Statistical Annex and Metadata.
El Salvador
Country of destination 2005 2006 2007 2008 2009 2010 2011 2012
United States 21,359 31,783 21,127 19,659 19,909 18,806 18,667 16,256
Italy 418 328 258 433 691 1,535 1,359 1,036
Spain 712 1,127 1,617 1,200 914 993 1,155 928
Canada 428 421 923 1,107 825 765 660 610
Mexico 86 457 796 708 694 399
Chile 40 44 60 95 86 122 151 178
Germany 62 67 82 73 101 96 138 138
Japan 99 58 57 82 115 96 102
Sweden 37 98 39 50 50 63 51 80
France 12 34 13 27 41 45 55 60
Australia 27 28 19 53 54 61 51 38
Switzerland 40 30 27
Norway 5 4 8 11 3 7 5 15
Korea 10 12 11 18 13 19 10 11
Netherlands 6 12 9 11 8 11 22 11
Austria 1 2 5 8 3 3 7 10
Other countries 12 3 14 35 27 48 21 23
Total 23,129 34,062 24,329 23,294 23,603 23,437 23,172 19,922
Sources and definitions: See introduction to Statistical Annex and Metadata.
E.d.fl. Outflows of migrants to OECD countries, by nationality and by country of destination
Ecuador (continued)
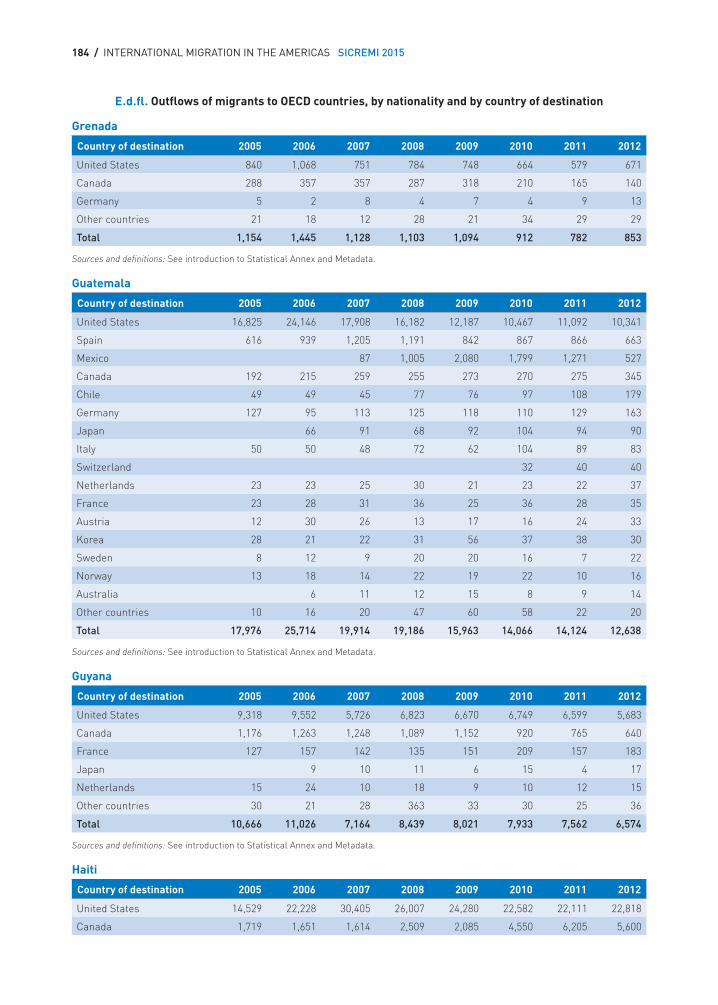
184 / INTERNATIONAL MIGRATION IN THE AMERICAS SICREMI 2015
Grenada
Country of destination 2005 2006 2007 2008 2009 2010 2011 2012
United States 840 1,068 751 784 748 664 579 671
Canada 288 357 357 287 318 210 165 140
Germany 5 2 8 4 7 4 9 13
Other countries 21 18 12 28 21 34 29 29
Total 1,154 1,445 1,128 1,103 1,094 912 782 853
Sources and definitions: See introduction to Statistical Annex and Metadata.
Guatemala
Country of destination 2005 2006 2007 2008 2009 2010 2011 2012
United States 16,825 24,146 17,908 16,182 12,187 10,467 11,092 10,341
Spain 616 939 1,205 1,191 842 867 866 663
Mexico 87 1,005 2,080 1,799 1,271 527
Canada 192 215 259 255 273 270 275 345
Chile 49 49 45 77 76 97 108 179
Germany 127 95 113 125 118 110 129 163
Japan 66 91 68 92 104 94 90
Italy 50 50 48 72 62 104 89 83
Switzerland 32 40 40
Netherlands 23 23 25 30 21 23 22 37
France 23 28 31 36 25 36 28 35
Austria 12 30 26 13 17 16 24 33
Korea 28 21 22 31 56 37 38 30
Sweden 8 12 9 20 20 16 7 22
Norway 13 18 14 22 19 22 10 16
Australia 6 11 12 15 8 9 14
Other countries 10 16 20 47 60 58 22 20
Total 17,976 25,714 19,914 19,186 15,963 14,066 14,124 12,638
Sources and definitions: See introduction to Statistical Annex and Metadata.
Guyana
Country of destination 2005 2006 2007 2008 2009 2010 2011 2012
United States 9,318 9,552 5,726 6,823 6,670 6,749 6,599 5,683
Canada 1,176 1,263 1,248 1,089 1,152 920 765 640
France 127 157 142 135 151 209 157 183
Japan 9 10 11 6 15 4 17
Netherlands 15 24 10 18 9 10 12 15
Other countries 30 21 28 363 33 30 25 36
Total 10,666 11,026 7,164 8,439 8,021 7,933 7,562 6,574
Sources and definitions: See introduction to Statistical Annex and Metadata.
Haiti
Country of destination 2005 2006 2007 2008 2009 2010 2011 2012
United States 14,529 22,228 30,405 26,007 24,280 22,582 22,111 22,818
Canada 1,719 1,651 1,614 2,509 2,085 4,550 6,205 5,600
E.d.fl. Outflows of migrants to OECD countries, by nationality and by country of destination
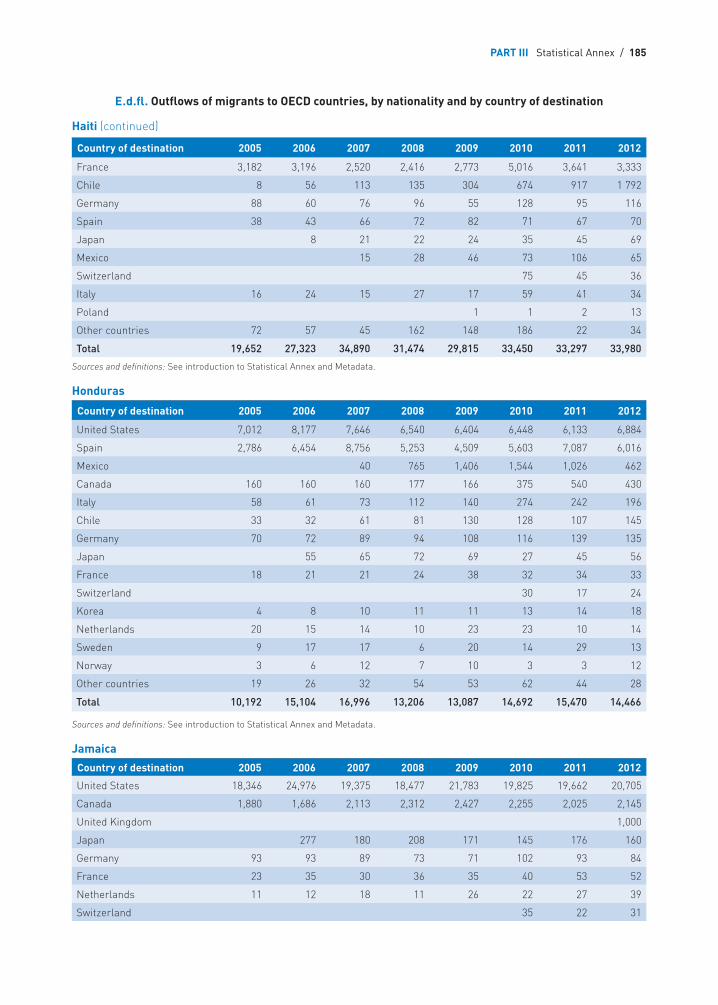
PART III Statistical Annex / 185
Country of destination 2005 2006 2007 2008 2009 2010 2011 2012
France 3,182 3,196 2,520 2,416 2,773 5,016 3,641 3,333
Chile 8 56 113 135 304 674 917 1 792
Germany 88 60 76 96 55 128 95 116
Spain 38 43 66 72 82 71 67 70
Japan 8 21 22 24 35 45 69
Mexico 15 28 46 73 106 65
Switzerland 75 45 36
Italy 16 24 15 27 17 59 41 34
Poland 1 1 2 13
Other countries 72 57 45 162 148 186 22 34
Total 19,652 27,323 34,890 31,474 29,815 33,450 33,297 33,980
Sources and definitions: See introduction to Statistical Annex and Metadata.
Honduras
Country of destination 2005 2006 2007 2008 2009 2010 2011 2012
United States 7,012 8,177 7,646 6,540 6,404 6,448 6,133 6,884
Spain 2,786 6,454 8,756 5,253 4,509 5,603 7,087 6,016
Mexico 40 765 1,406 1,544 1,026 462
Canada 160 160 160 177 166 375 540 430
Italy 58 61 73 112 140 274 242 196
Chile 33 32 61 81 130 128 107 145
Germany 70 72 89 94 108 116 139 135
Japan 55 65 72 69 27 45 56
France 18 21 21 24 38 32 34 33
Switzerland 30 17 24
Korea 4 8 10 11 11 13 14 18
Netherlands 20 15 14 10 23 23 10 14
Sweden 9 17 17 6 20 14 29 13
Norway 3 6 12 7 10 3 3 12
Other countries 19 26 32 54 53 62 44 28
Total 10,192 15,104 16,996 13,206 13,087 14,692 15,470 14,466
Sources and definitions: See introduction to Statistical Annex and Metadata.
Jamaica
Country of destination 2005 2006 2007 2008 2009 2010 2011 2012
United States 18,346 24,976 19,375 18,477 21,783 19,825 19,662 20,705
Canada 1,880 1,686 2,113 2,312 2,427 2,255 2,025 2,145
United Kingdom 1,000
Japan 277 180 208 171 145 176 160
Germany 93 93 89 73 71 102 93 84
France 23 35 30 36 35 40 53 52
Netherlands 11 12 18 11 26 22 27 39
Switzerland 35 22 31
E.d.fl. Outflows of migrants to OECD countries, by nationality and by country of destination
Haiti (continued)
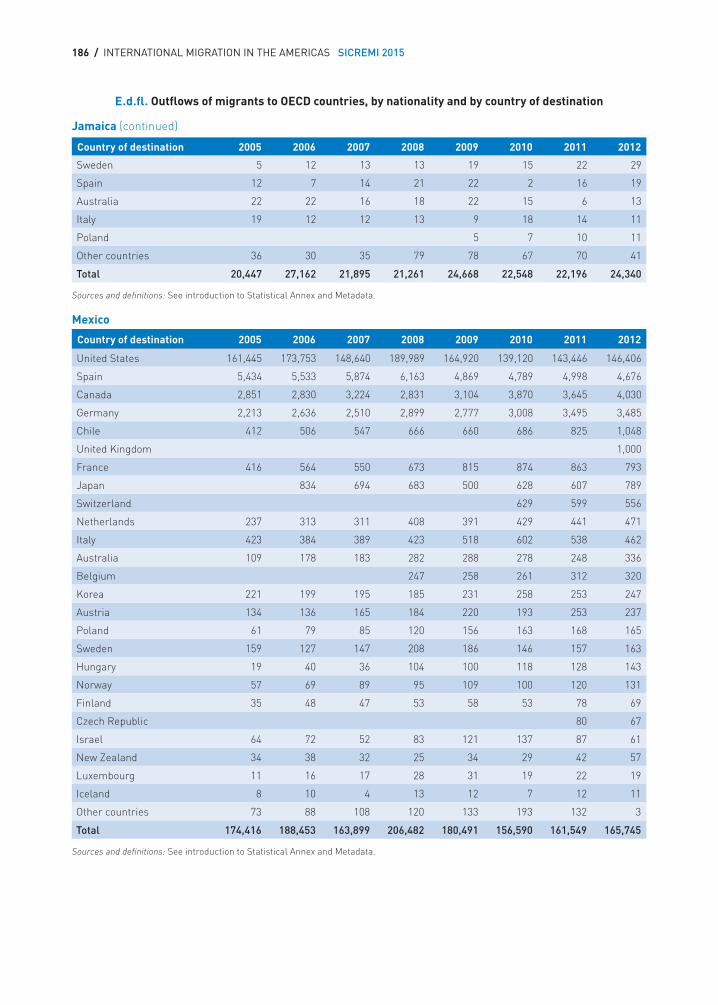
186 / INTERNATIONAL MIGRATION IN THE AMERICAS SICREMI 2015
Country of destination 2005 2006 2007 2008 2009 2010 2011 2012
Sweden 5 12 13 13 19 15 22 29
Spain 12 7 14 21 22 2 16 19
Australia 22 22 16 18 22 15 6 13
Italy 19 12 12 13 9 18 14 11
Poland 5 7 10 11
Other countries 36 30 35 79 78 67 70 41
Total 20,447 27,162 21,895 21,261 24,668 22,548 22,196 24,340
Sources and definitions: See introduction to Statistical Annex and Metadata.
Mexico
Country of destination 2005 2006 2007 2008 2009 2010 2011 2012
United States 161,445 173,753 148,640 189,989 164,920 139,120 143,446 146,406
Spain 5,434 5,533 5,874 6,163 4,869 4,789 4,998 4,676
Canada 2,851 2,830 3,224 2,831 3,104 3,870 3,645 4,030
Germany 2,213 2,636 2,510 2,899 2,777 3,008 3,495 3,485
Chile 412 506 547 666 660 686 825 1,048
United Kingdom 1,000
France 416 564 550 673 815 874 863 793
Japan 834 694 683 500 628 607 789
Switzerland 629 599 556
Netherlands 237 313 311 408 391 429 441 471
Italy 423 384 389 423 518 602 538 462
Australia 109 178 183 282 288 278 248 336
Belgium 247 258 261 312 320
Korea 221 199 195 185 231 258 253 247
Austria 134 136 165 184 220 193 253 237
Poland 61 79 85 120 156 163 168 165
Sweden 159 127 147 208 186 146 157 163
Hungary 19 40 36 104 100 118 128 143
Norway 57 69 89 95 109 100 120 131
Finland 35 48 47 53 58 53 78 69
Czech Republic 80 67
Israel 64 72 52 83 121 137 87 61
New Zealand 34 38 32 25 34 29 42 57
Luxembourg 11 16 17 28 31 19 22 19
Iceland 8 10 4 13 12 7 12 11
Other countries 73 88 108 120 133 193 132 3
Total 174,416 188,453 163,899 206,482 180,491 156,590 161,549 165,745
Sources and definitions: See introduction to Statistical Annex and Metadata.
E.d.fl. Outflows of migrants to OECD countries, by nationality and by country of destination
Jamaica (continued)
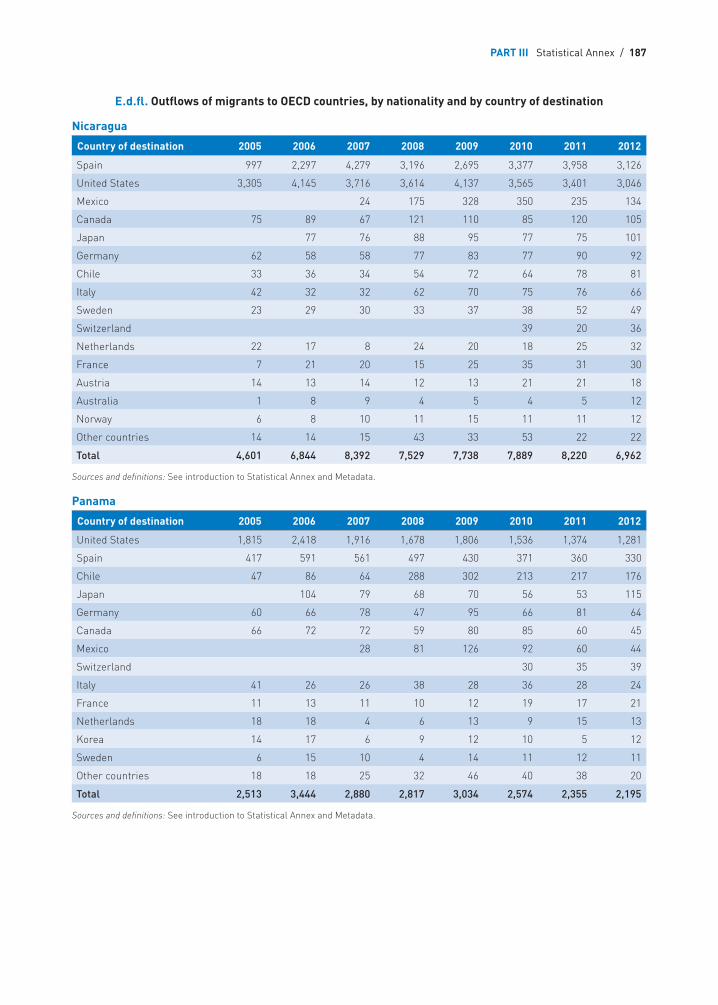
PART III Statistical Annex / 187
Nicaragua
Country of destination 2005 2006 2007 2008 2009 2010 2011 2012
Spain 997 2,297 4,279 3,196 2,695 3,377 3,958 3,126
United States 3,305 4,145 3,716 3,614 4,137 3,565 3,401 3,046
Mexico 24 175 328 350 235 134
Canada 75 89 67 121 110 85 120 105
Japan 77 76 88 95 77 75 101
Germany 62 58 58 77 83 77 90 92
Chile 33 36 34 54 72 64 78 81
Italy 42 32 32 62 70 75 76 66
Sweden 23 29 30 33 37 38 52 49
Switzerland 39 20 36
Netherlands 22 17 8 24 20 18 25 32
France 7 21 20 15 25 35 31 30
Austria 14 13 14 12 13 21 21 18
Australia 1 8 9 4 5 4 5 12
Norway 6 8 10 11 15 11 11 12
Other countries 14 14 15 43 33 53 22 22
Total 4,601 6,844 8,392 7,529 7,738 7,889 8,220 6,962
Sources and definitions: See introduction to Statistical Annex and Metadata.
Panama
Country of destination 2005 2006 2007 2008 2009 2010 2011 2012
United States 1,815 2,418 1,916 1,678 1,806 1,536 1,374 1,281
Spain 417 591 561 497 430 371 360 330
Chile 47 86 64 288 302 213 217 176
Japan 104 79 68 70 56 53 115
Germany 60 66 78 47 95 66 81 64
Canada 66 72 72 59 80 85 60 45
Mexico 28 81 126 92 60 44
Switzerland 30 35 39
Italy 41 26 26 38 28 36 28 24
France 11 13 11 10 12 19 17 21
Netherlands 18 18 4 6 13 9 15 13
Korea 14 17 6 9 12 10 5 12
Sweden 6 15 10 4 14 11 12 11
Other countries 18 18 25 32 46 40 38 20
Total 2,513 3,444 2,880 2,817 3,034 2,574 2,355 2,195
Sources and definitions: See introduction to Statistical Annex and Metadata.
E.d.fl. Outflows of migrants to OECD countries, by nationality and by country of destination
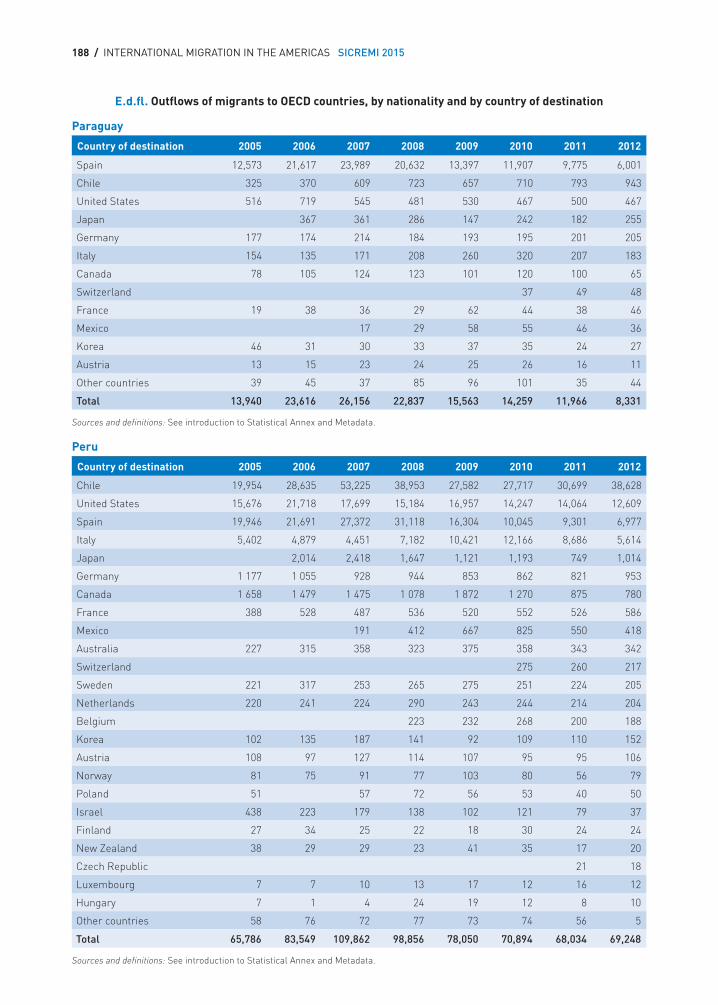
188 / INTERNATIONAL MIGRATION IN THE AMERICAS SICREMI 2015
Paraguay
Country of destination 2005 2006 2007 2008 2009 2010 2011 2012
Spain 12,573 21,617 23,989 20,632 13,397 11,907 9,775 6,001
Chile 325 370 609 723 657 710 793 943
United States 516 719 545 481 530 467 500 467
Japan 367 361 286 147 242 182 255
Germany 177 174 214 184 193 195 201 205
Italy 154 135 171 208 260 320 207 183
Canada 78 105 124 123 101 120 100 65
Switzerland 37 49 48
France 19 38 36 29 62 44 38 46
Mexico 17 29 58 55 46 36
Korea 46 31 30 33 37 35 24 27
Austria 13 15 23 24 25 26 16 11
Other countries 39 45 37 85 96 101 35 44
Total 13,940 23,616 26,156 22,837 15,563 14,259 11,966 8,331
Sources and definitions: See introduction to Statistical Annex and Metadata.
Peru
Country of destination 2005 2006 2007 2008 2009 2010 2011 2012
Chile 19,954 28,635 53,225 38,953 27,582 27,717 30,699 38,628
United States 15,676 21,718 17,699 15,184 16,957 14,247 14,064 12,609
Spain 19,946 21,691 27,372 31,118 16,304 10,045 9,301 6,977
Italy 5,402 4,879 4,451 7,182 10,421 12,166 8,686 5,614
Japan 2,014 2,418 1,647 1,121 1,193 749 1,014
Germany 1 177 1 055 928 944 853 862 821 953
Canada 1 658 1 479 1 475 1 078 1 872 1 270 875 780
France 388 528 487 536 520 552 526 586
Mexico 191 412 667 825 550 418
Australia 227 315 358 323 375 358 343 342
Switzerland 275 260 217
Sweden 221 317 253 265 275 251 224 205
Netherlands 220 241 224 290 243 244 214 204
Belgium 223 232 268 200 188
Korea 102 135 187 141 92 109 110 152
Austria 108 97 127 114 107 95 95 106
Norway 81 75 91 77 103 80 56 79
Poland 51 57 72 56 53 40 50
Israel 438 223 179 138 102 121 79 37
Finland 27 34 25 22 18 30 24 24
New Zealand 38 29 29 23 41 35 17 20
Czech Republic 21 18
Luxembourg 7 7 10 13 17 12 16 12
Hungary 7 1 4 24 19 12 8 10
Other countries 58 76 72 77 73 74 56 5
Total 65,786 83,549 109,862 98,856 78,050 70,894 68,034 69,248
Sources and definitions: See introduction to Statistical Annex and Metadata.
E.d.fl. Outflows of migrants to OECD countries, by nationality and by country of destination
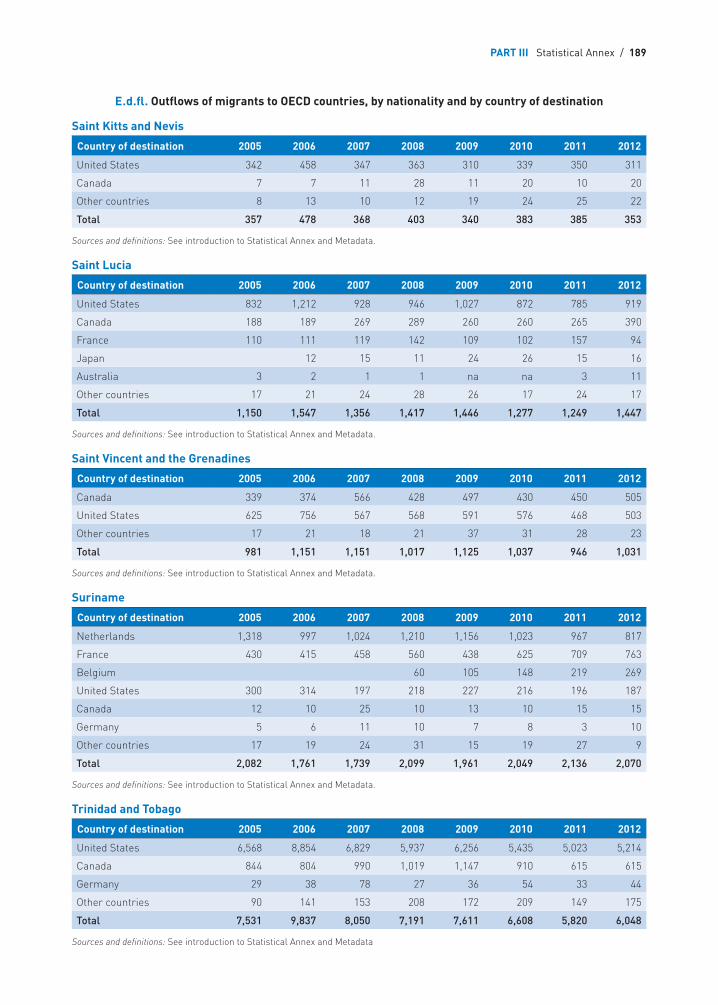
PART III Statistical Annex / 189
Saint Kitts and Nevis
Country of destination 2005 2006 2007 2008 2009 2010 2011 2012
United States 342 458 347 363 310 339 350 311
Canada 7 7 11 28 11 20 10 20
Other countries 8 13 10 12 19 24 25 22
Total 357 478 368 403 340 383 385 353
Sources and definitions: See introduction to Statistical Annex and Metadata.
Saint Lucia
Country of destination 2005 2006 2007 2008 2009 2010 2011 2012
United States 832 1,212 928 946 1,027 872 785 919
Canada 188 189 269 289 260 260 265 390
France 110 111 119 142 109 102 157 94
Japan 12 15 11 24 26 15 16
Australia 3 2 1 1 na na 3 11
Other countries 17 21 24 28 26 17 24 17
Total 1,150 1,547 1,356 1,417 1,446 1,277 1,249 1,447
Sources and definitions: See introduction to Statistical Annex and Metadata.
Saint Vincent and the Grenadines
Country of destination 2005 2006 2007 2008 2009 2010 2011 2012
Canada 339 374 566 428 497 430 450 505
United States 625 756 567 568 591 576 468 503
Other countries 17 21 18 21 37 31 28 23
Total 981 1,151 1,151 1,017 1,125 1,037 946 1,031
Sources and definitions: See introduction to Statistical Annex and Metadata.
Suriname
Country of destination 2005 2006 2007 2008 2009 2010 2011 2012
Netherlands 1,318 997 1,024 1,210 1,156 1,023 967 817
France 430 415 458 560 438 625 709 763
Belgium 60 105 148 219 269
United States 300 314 197 218 227 216 196 187
Canada 12 10 25 10 13 10 15 15
Germany 5 6 11 10 7 8 3 10
Other countries 17 19 24 31 15 19 27 9
Total 2,082 1,761 1,739 2,099 1,961 2,049 2,136 2,070
Sources and definitions: See introduction to Statistical Annex and Metadata.
Trinidad and Tobago
Country of destination 2005 2006 2007 2008 2009 2010 2011 2012
United States 6,568 8,854 6,829 5,937 6,256 5,435 5,023 5,214
Canada 844 804 990 1,019 1,147 910 615 615
Germany 29 38 78 27 36 54 33 44
Other countries 90 141 153 208 172 209 149 175
Total 7,531 9,837 8,050 7,191 7,611 6,608 5,820 6,048
Sources and definitions: See introduction to Statistical Annex and Metadata
E.d.fl. Outflows of migrants to OECD countries, by nationality and by country of destination
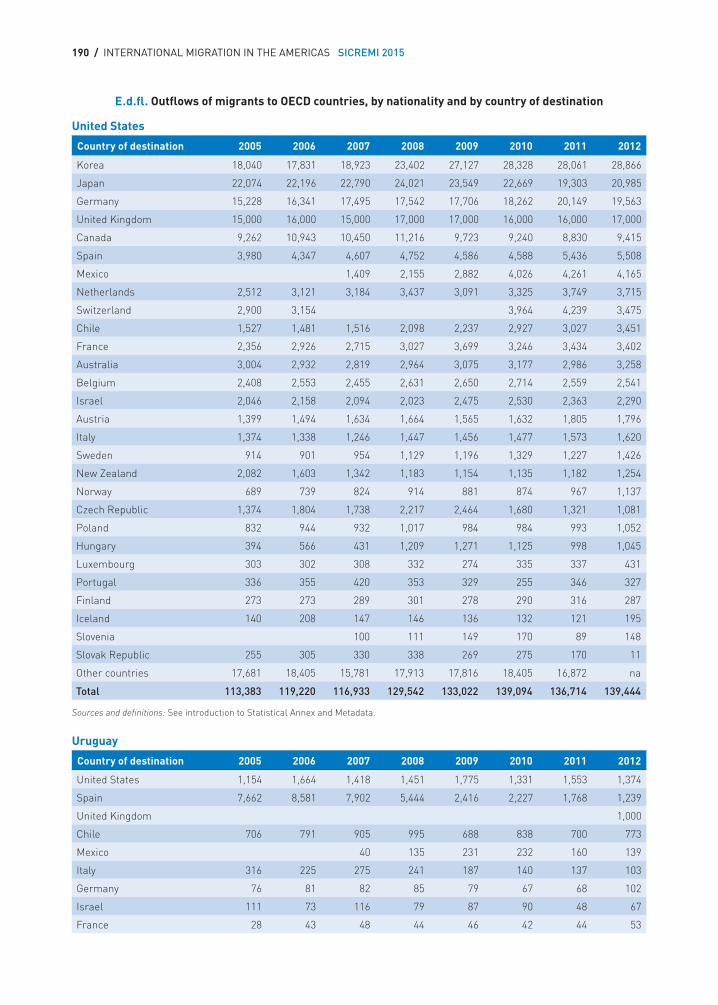
190 / INTERNATIONAL MIGRATION IN THE AMERICAS SICREMI 2015
United States
Country of destination 2005 2006 2007 2008 2009 2010 2011 2012
Korea 18,040 17,831 18,923 23,402 27,127 28,328 28,061 28,866
Japan 22,074 22,196 22,790 24,021 23,549 22,669 19,303 20,985
Germany 15,228 16,341 17,495 17,542 17,706 18,262 20,149 19,563
United Kingdom 15,000 16,000 15,000 17,000 17,000 16,000 16,000 17,000
Canada 9,262 10,943 10,450 11,216 9,723 9,240 8,830 9,415
Spain 3,980 4,347 4,607 4,752 4,586 4,588 5,436 5,508
Mexico 1,409 2,155 2,882 4,026 4,261 4,165
Netherlands 2,512 3,121 3,184 3,437 3,091 3,325 3,749 3,715
Switzerland 2,900 3,154 3,964 4,239 3,475
Chile 1,527 1,481 1,516 2,098 2,237 2,927 3,027 3,451
France 2,356 2,926 2,715 3,027 3,699 3,246 3,434 3,402
Australia 3,004 2,932 2,819 2,964 3,075 3,177 2,986 3,258
Belgium 2,408 2,553 2,455 2,631 2,650 2,714 2,559 2,541
Israel 2,046 2,158 2,094 2,023 2,475 2,530 2,363 2,290
Austria 1,399 1,494 1,634 1,664 1,565 1,632 1,805 1,796
Italy 1,374 1,338 1,246 1,447 1,456 1,477 1,573 1,620
Sweden 914 901 954 1,129 1,196 1,329 1,227 1,426
New Zealand 2,082 1,603 1,342 1,183 1,154 1,135 1,182 1,254
Norway 689 739 824 914 881 874 967 1,137
Czech Republic 1,374 1,804 1,738 2,217 2,464 1,680 1,321 1,081
Poland 832 944 932 1,017 984 984 993 1,052
Hungary 394 566 431 1,209 1,271 1,125 998 1,045
Luxembourg 303 302 308 332 274 335 337 431
Portugal 336 355 420 353 329 255 346 327
Finland 273 273 289 301 278 290 316 287
Iceland 140 208 147 146 136 132 121 195
Slovenia 100 111 149 170 89 148
Slovak Republic 255 305 330 338 269 275 170 11
Other countries 17,681 18,405 15,781 17,913 17,816 18,405 16,872 na
Total 113,383 119,220 116,933 129,542 133,022 139,094 136,714 139,444
Sources and definitions: See introduction to Statistical Annex and Metadata.
Uruguay
Country of destination 2005 2006 2007 2008 2009 2010 2011 2012
United States 1,154 1,664 1,418 1,451 1,775 1,331 1,553 1,374
Spain 7,662 8,581 7,902 5,444 2,416 2,227 1,768 1,239
United Kingdom 1,000
Chile 706 791 905 995 688 838 700 773
Mexico 40 135 231 232 160 139
Italy 316 225 275 241 187 140 137 103
Germany 76 81 82 85 79 67 68 102
Israel 111 73 116 79 87 90 48 67
France 28 43 48 44 46 42 44 53
E.d.fl. Outflows of migrants to OECD countries, by nationality and by country of destination
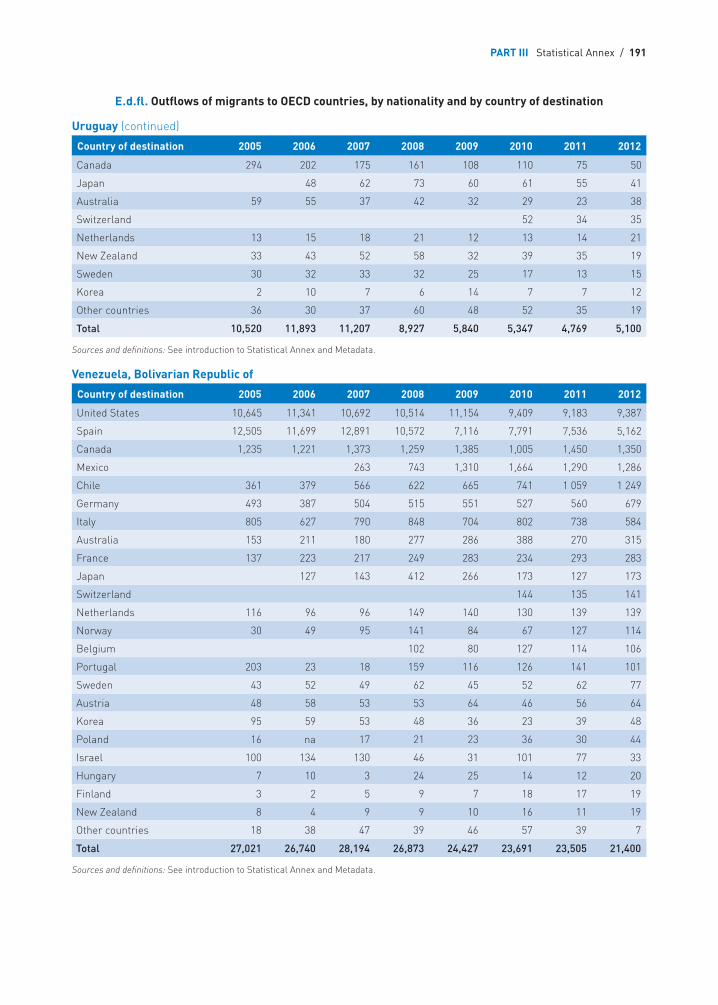
PART III Statistical Annex / 191
Country of destination 2005 2006 2007 2008 2009 2010 2011 2012
Canada 294 202 175 161 108 110 75 50
Japan 48 62 73 60 61 55 41
Australia 59 55 37 42 32 29 23 38
Switzerland 52 34 35
Netherlands 13 15 18 21 12 13 14 21
New Zealand 33 43 52 58 32 39 35 19
Sweden 30 32 33 32 25 17 13 15
Korea 2 10 7 6 14 7 7 12
Other countries 36 30 37 60 48 52 35 19
Total 10,520 11,893 11,207 8,927 5,840 5,347 4,769 5,100
Sources and definitions: See introduction to Statistical Annex and Metadata.
Venezuela, Bolivarian Republic of
Country of destination 2005 2006 2007 2008 2009 2010 2011 2012
United States 10,645 11,341 10,692 10,514 11,154 9,409 9,183 9,387
Spain 12,505 11,699 12,891 10,572 7,116 7,791 7,536 5,162
Canada 1,235 1,221 1,373 1,259 1,385 1,005 1,450 1,350
Mexico 263 743 1,310 1,664 1,290 1,286
Chile 361 379 566 622 665 741 1 059 1 249
Germany 493 387 504 515 551 527 560 679
Italy 805 627 790 848 704 802 738 584
Australia 153 211 180 277 286 388 270 315
France 137 223 217 249 283 234 293 283
Japan 127 143 412 266 173 127 173
Switzerland 144 135 141
Netherlands 116 96 96 149 140 130 139 139
Norway 30 49 95 141 84 67 127 114
Belgium 102 80 127 114 106
Portugal 203 23 18 159 116 126 141 101
Sweden 43 52 49 62 45 52 62 77
Austria 48 58 53 53 64 46 56 64
Korea 95 59 53 48 36 23 39 48
Poland 16 na 17 21 23 36 30 44
Israel 100 134 130 46 31 101 77 33
Hungary 7 10 3 24 25 14 12 20
Finland 3 2 5 9 7 18 17 19
New Zealand 8 4 9 9 10 16 11 19
Other countries 18 38 47 39 46 57 39 7
Total 27,021 26,740 28,194 26,873 24,427 23,691 23,505 21,400
Sources and definitions: See introduction to Statistical Annex and Metadata.
E.d.fl. Outflows of migrants to OECD countries, by nationality and by country of destination
Uruguay (continued)
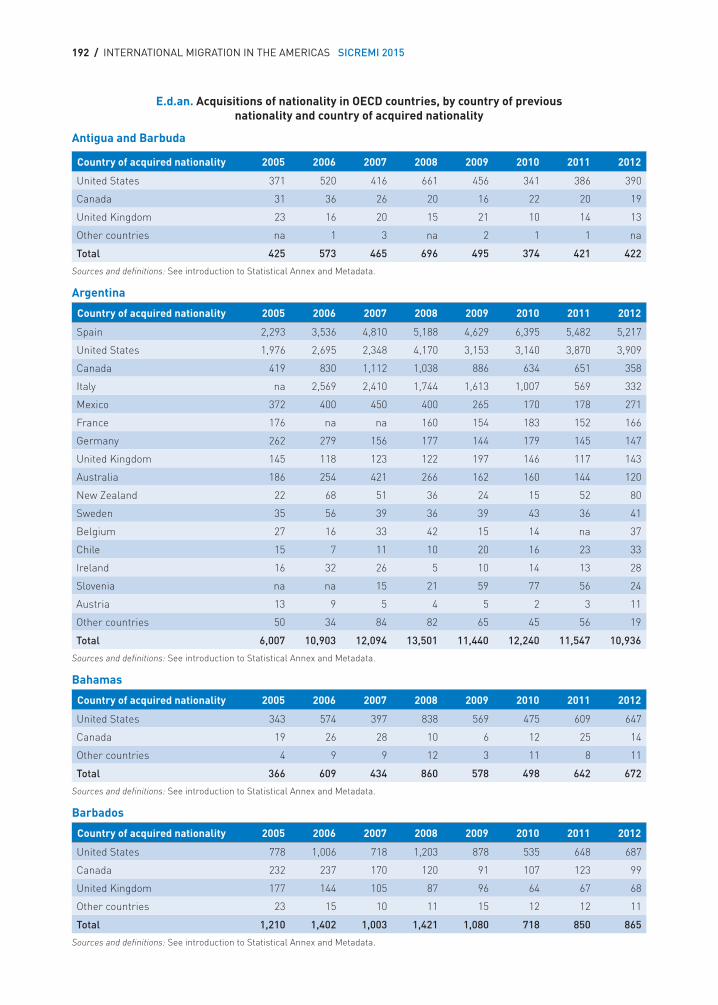
192 / INTERNATIONAL MIGRATION IN THE AMERICAS SICREMI 2015
E.d.an. Acquisitions of nationality in OECD countries, by country of previous nationality and country of acquired nationality
Antigua and Barbuda
Country of acquired nationality 2005 2006 2007 2008 2009 2010 2011 2012
United States 371 520 416 661 456 341 386 390
Canada 31 36 26 20 16 22 20 19
United Kingdom 23 16 20 15 21 10 14 13
Other countries na 1 3 na 2 1 1 na
Total 425 573 465 696 495 374 421 422
Sources and definitions: See introduction to Statistical Annex and Metadata.
Argentina
Country of acquired nationality 2005 2006 2007 2008 2009 2010 2011 2012
Spain 2,293 3,536 4,810 5,188 4,629 6,395 5,482 5,217
United States 1,976 2,695 2,348 4,170 3,153 3,140 3,870 3,909
Canada 419 830 1,112 1,038 886 634 651 358
Italy na 2,569 2,410 1,744 1,613 1,007 569 332
Mexico 372 400 450 400 265 170 178 271
France 176 na na 160 154 183 152 166
Germany 262 279 156 177 144 179 145 147
United Kingdom 145 118 123 122 197 146 117 143
Australia 186 254 421 266 162 160 144 120
New Zealand 22 68 51 36 24 15 52 80
Sweden 35 56 39 36 39 43 36 41
Belgium 27 16 33 42 15 14 na 37
Chile 15 7 11 10 20 16 23 33
Ireland 16 32 26 5 10 14 13 28
Slovenia na na 15 21 59 77 56 24
Austria 13 9 5 4 5 2 3 11
Other countries 50 34 84 82 65 45 56 19
Total 6,007 10,903 12,094 13,501 11,440 12,240 11,547 10,936
Sources and definitions: See introduction to Statistical Annex and Metadata.
Bahamas
Country of acquired nationality 2005 2006 2007 2008 2009 2010 2011 2012
United States 343 574 397 838 569 475 609 647
Canada 19 26 28 10 6 12 25 14
Other countries 4 9 9 12 3 11 8 11
Total 366 609 434 860 578 498 642 672
Sources and definitions: See introduction to Statistical Annex and Metadata.
Barbados
Country of acquired nationality 2005 2006 2007 2008 2009 2010 2011 2012
United States 778 1,006 718 1,203 878 535 648 687
Canada 232 237 170 120 91 107 123 99
United Kingdom 177 144 105 87 96 64 67 68
Other countries 23 15 10 11 15 12 12 11
Total 1,210 1,402 1,003 1,421 1,080 718 850 865
Sources and definitions: See introduction to Statistical Annex and Metadata.
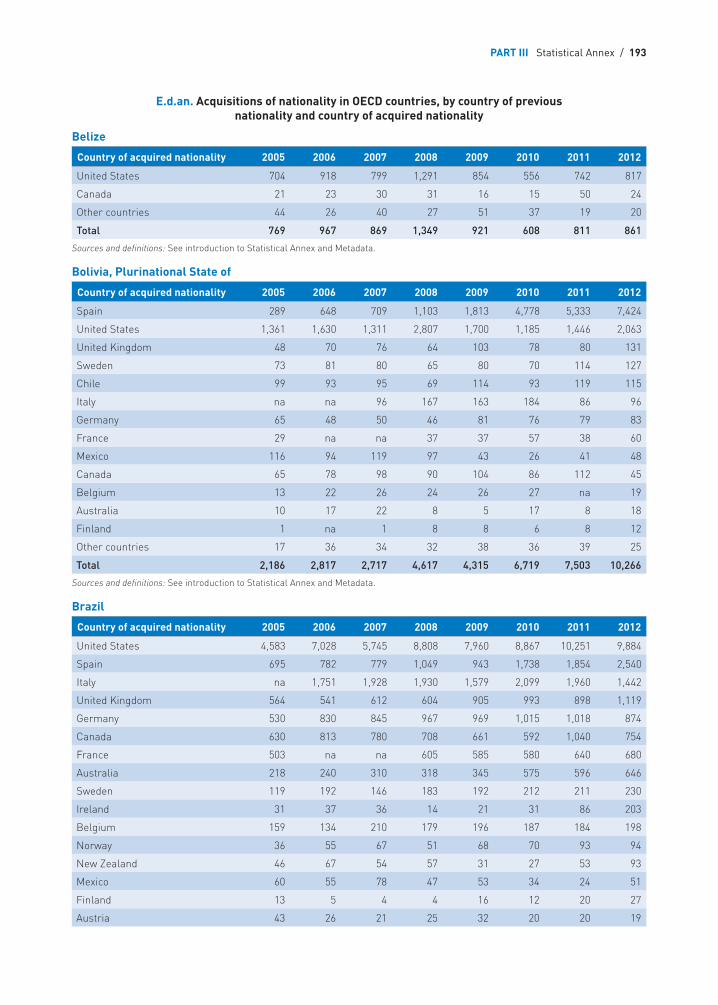
PART III Statistical Annex / 193
Belize
Country of acquired nationality 2005 2006 2007 2008 2009 2010 2011 2012
United States 704 918 799 1,291 854 556 742 817
Canada 21 23 30 31 16 15 50 24
Other countries 44 26 40 27 51 37 19 20
Total 769 967 869 1,349 921 608 811 861
Sources and definitions: See introduction to Statistical Annex and Metadata.
Bolivia, Plurinational State of
Country of acquired nationality 2005 2006 2007 2008 2009 2010 2011 2012
Spain 289 648 709 1,103 1,813 4,778 5,333 7,424
United States 1,361 1,630 1,311 2,807 1,700 1,185 1,446 2,063
United Kingdom 48 70 76 64 103 78 80 131
Sweden 73 81 80 65 80 70 114 127
Chile 99 93 95 69 114 93 119 115
Italy na na 96 167 163 184 86 96
Germany 65 48 50 46 81 76 79 83
France 29 na na 37 37 57 38 60
Mexico 116 94 119 97 43 26 41 48
Canada 65 78 98 90 104 86 112 45
Belgium 13 22 26 24 26 27 na 19
Australia 10 17 22 8 5 17 8 18
Finland 1 na 1 8 8 6 8 12
Other countries 17 36 34 32 38 36 39 25
Total 2,186 2,817 2,717 4,617 4,315 6,719 7,503 10,266
Sources and definitions: See introduction to Statistical Annex and Metadata.
Brazil
Country of acquired nationality 2005 2006 2007 2008 2009 2010 2011 2012
United States 4,583 7,028 5,745 8,808 7,960 8,867 10,251 9,884
Spain 695 782 779 1,049 943 1,738 1,854 2,540
Italy na 1,751 1,928 1,930 1,579 2,099 1,960 1,442
United Kingdom 564 541 612 604 905 993 898 1,119
Germany 530 830 845 967 969 1,015 1,018 874
Canada 630 813 780 708 661 592 1,040 754
France 503 na na 605 585 580 640 680
Australia 218 240 310 318 345 575 596 646
Sweden 119 192 146 183 192 212 211 230
Ireland 31 37 36 14 21 31 86 203
Belgium 159 134 210 179 196 187 184 198
Norway 36 55 67 51 68 70 93 94
New Zealand 46 67 54 57 31 27 53 93
Mexico 60 55 78 47 53 34 24 51
Finland 13 5 4 4 16 12 20 27
Austria 43 26 21 25 32 20 20 19
E.d.an. Acquisitions of nationality in OECD countries, by country of previous nationality and country of acquired nationality
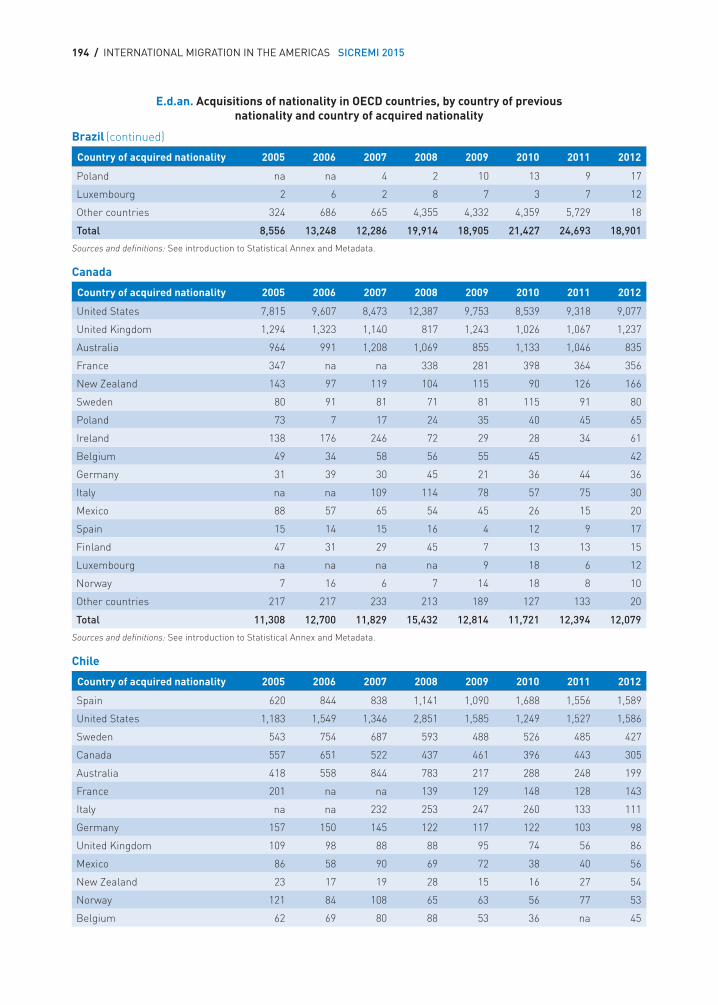
194 / INTERNATIONAL MIGRATION IN THE AMERICAS SICREMI 2015
Brazil
Country of acquired nationality 2005 2006 2007 2008 2009 2010 2011 2012
Poland na na 4 2 10 13 9 17
Luxembourg 2 6 2 8 7 3 7 12
Other countries 324 686 665 4,355 4,332 4,359 5,729 18
Total 8,556 13,248 12,286 19,914 18,905 21,427 24,693 18,901
Sources and definitions: See introduction to Statistical Annex and Metadata.
Canada
Country of acquired nationality 2005 2006 2007 2008 2009 2010 2011 2012
United States 7,815 9,607 8,473 12,387 9,753 8,539 9,318 9,077
United Kingdom 1,294 1,323 1,140 817 1,243 1,026 1,067 1,237
Australia 964 991 1,208 1,069 855 1,133 1,046 835
France 347 na na 338 281 398 364 356
New Zealand 143 97 119 104 115 90 126 166
Sweden 80 91 81 71 81 115 91 80
Poland 73 7 17 24 35 40 45 65
Ireland 138 176 246 72 29 28 34 61
Belgium 49 34 58 56 55 45 42
Germany 31 39 30 45 21 36 44 36
Italy na na 109 114 78 57 75 30
Mexico 88 57 65 54 45 26 15 20
Spain 15 14 15 16 4 12 9 17
Finland 47 31 29 45 7 13 13 15
Luxembourg na na na na 9 18 6 12
Norway 7 16 6 7 14 18 8 10
Other countries 217 217 233 213 189 127 133 20
Total 11,308 12,700 11,829 15,432 12,814 11,721 12,394 12,079
Sources and definitions: See introduction to Statistical Annex and Metadata.
Chile
Country of acquired nationality 2005 2006 2007 2008 2009 2010 2011 2012
Spain 620 844 838 1,141 1,090 1,688 1,556 1,589
United States 1,183 1,549 1,346 2,851 1,585 1,249 1,527 1,586
Sweden 543 754 687 593 488 526 485 427
Canada 557 651 522 437 461 396 443 305
Australia 418 558 844 783 217 288 248 199
France 201 na na 139 129 148 128 143
Italy na na 232 253 247 260 133 111
Germany 157 150 145 122 117 122 103 98
United Kingdom 109 98 88 88 95 74 56 86
Mexico 86 58 90 69 72 38 40 56
New Zealand 23 17 19 28 15 16 27 54
Norway 121 84 108 65 63 56 77 53
Belgium 62 69 80 88 53 36 na 45
E.d.an. Acquisitions of nationality in OECD countries, by country of previous nationality and country of acquired nationality
(continued)
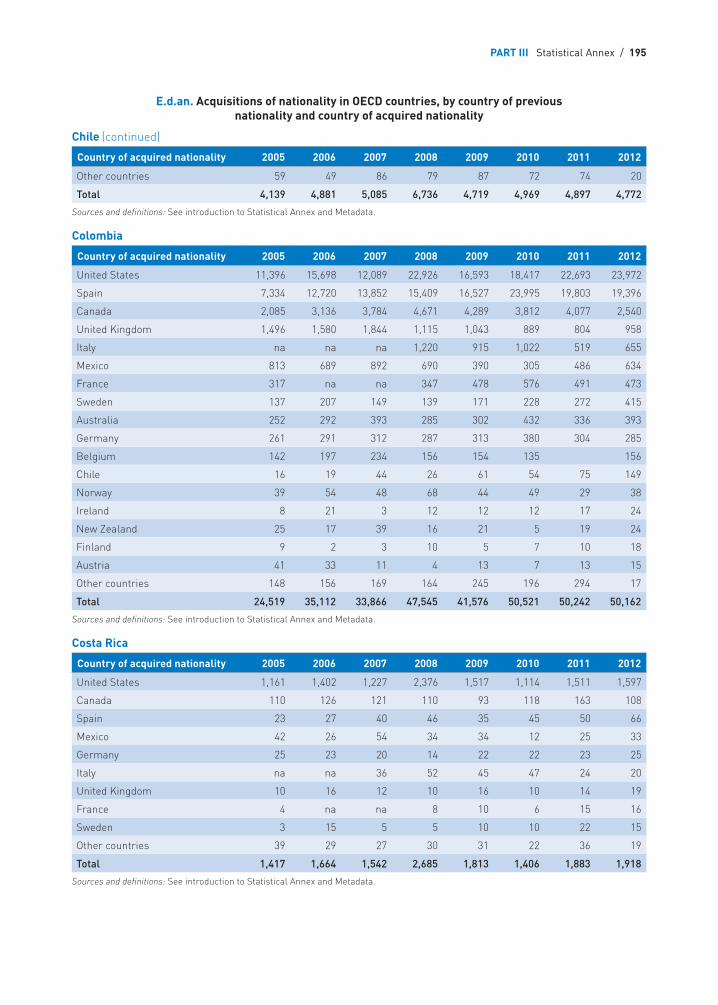
PART III Statistical Annex / 195
(continued)Chile
Country of acquired nationality 2005 2006 2007 2008 2009 2010 2011 2012
Other countries 59 49 86 79 87 72 74 20
Total 4,139 4,881 5,085 6,736 4,719 4,969 4,897 4,772
Sources and definitions: See introduction to Statistical Annex and Metadata.
Colombia
Country of acquired nationality 2005 2006 2007 2008 2009 2010 2011 2012
United States 11,396 15,698 12,089 22,926 16,593 18,417 22,693 23,972
Spain 7,334 12,720 13,852 15,409 16,527 23,995 19,803 19,396
Canada 2,085 3,136 3,784 4,671 4,289 3,812 4,077 2,540
United Kingdom 1,496 1,580 1,844 1,115 1,043 889 804 958
Italy na na na 1,220 915 1,022 519 655
Mexico 813 689 892 690 390 305 486 634
France 317 na na 347 478 576 491 473
Sweden 137 207 149 139 171 228 272 415
Australia 252 292 393 285 302 432 336 393
Germany 261 291 312 287 313 380 304 285
Belgium 142 197 234 156 154 135 156
Chile 16 19 44 26 61 54 75 149
Norway 39 54 48 68 44 49 29 38
Ireland 8 21 3 12 12 12 17 24
New Zealand 25 17 39 16 21 5 19 24
Finland 9 2 3 10 5 7 10 18
Austria 41 33 11 4 13 7 13 15
Other countries 148 156 169 164 245 196 294 17
Total 24,519 35,112 33,866 47,545 41,576 50,521 50,242 50,162
Sources and definitions: See introduction to Statistical Annex and Metadata.
Costa Rica
Country of acquired nationality 2005 2006 2007 2008 2009 2010 2011 2012
United States 1,161 1,402 1,227 2,376 1,517 1,114 1,511 1,597
Canada 110 126 121 110 93 118 163 108
Spain 23 27 40 46 35 45 50 66
Mexico 42 26 54 34 34 12 25 33
Germany 25 23 20 14 22 22 23 25
Italy na na 36 52 45 47 24 20
United Kingdom 10 16 12 10 16 10 14 19
France 4 na na 8 10 6 15 16
Sweden 3 15 5 5 10 10 22 15
Other countries 39 29 27 30 31 22 36 19
Total 1,417 1,664 1,542 2,685 1,813 1,406 1,883 1,918
Sources and definitions: See introduction to Statistical Annex and Metadata.
E.d.an. Acquisitions of nationality in OECD countries, by country of previous nationality and country of acquired nationality
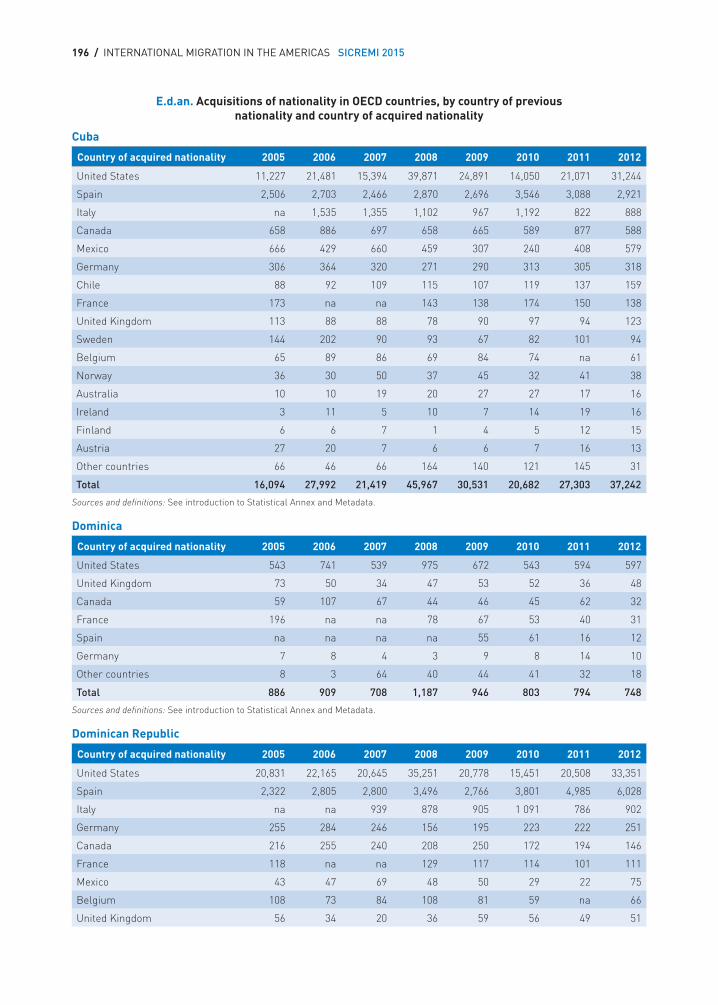
196 / INTERNATIONAL MIGRATION IN THE AMERICAS SICREMI 2015
Cuba
Country of acquired nationality 2005 2006 2007 2008 2009 2010 2011 2012
United States 11,227 21,481 15,394 39,871 24,891 14,050 21,071 31,244
Spain 2,506 2,703 2,466 2,870 2,696 3,546 3,088 2,921
Italy na 1,535 1,355 1,102 967 1,192 822 888
Canada 658 886 697 658 665 589 877 588
Mexico 666 429 660 459 307 240 408 579
Germany 306 364 320 271 290 313 305 318
Chile 88 92 109 115 107 119 137 159
France 173 na na 143 138 174 150 138
United Kingdom 113 88 88 78 90 97 94 123
Sweden 144 202 90 93 67 82 101 94
Belgium 65 89 86 69 84 74 na 61
Norway 36 30 50 37 45 32 41 38
Australia 10 10 19 20 27 27 17 16
Ireland 3 11 5 10 7 14 19 16
Finland 6 6 7 1 4 5 12 15
Austria 27 20 7 6 6 7 16 13
Other countries 66 46 66 164 140 121 145 31
Total 16,094 27,992 21,419 45,967 30,531 20,682 27,303 37,242
Sources and definitions: See introduction to Statistical Annex and Metadata.
Dominica
Country of acquired nationality 2005 2006 2007 2008 2009 2010 2011 2012
United States 543 741 539 975 672 543 594 597
United Kingdom 73 50 34 47 53 52 36 48
Canada 59 107 67 44 46 45 62 32
France 196 na na 78 67 53 40 31
Spain na na na na 55 61 16 12
Germany 7 8 4 3 9 8 14 10
Other countries 8 3 64 40 44 41 32 18
Total 886 909 708 1,187 946 803 794 748
Sources and definitions: See introduction to Statistical Annex and Metadata.
Dominican Republic
Country of acquired nationality 2005 2006 2007 2008 2009 2010 2011 2012
United States 20,831 22,165 20,645 35,251 20,778 15,451 20,508 33,351
Spain 2,322 2,805 2,800 3,496 2,766 3,801 4,985 6,028
Italy na na 939 878 905 1 091 786 902
Germany 255 284 246 156 195 223 222 251
Canada 216 255 240 208 250 172 194 146
France 118 na na 129 117 114 101 111
Mexico 43 47 69 48 50 29 22 75
Belgium 108 73 84 108 81 59 na 66
United Kingdom 56 34 20 36 59 56 49 51
E.d.an. Acquisitions of nationality in OECD countries, by country of previousnationality and country of acquired nationality
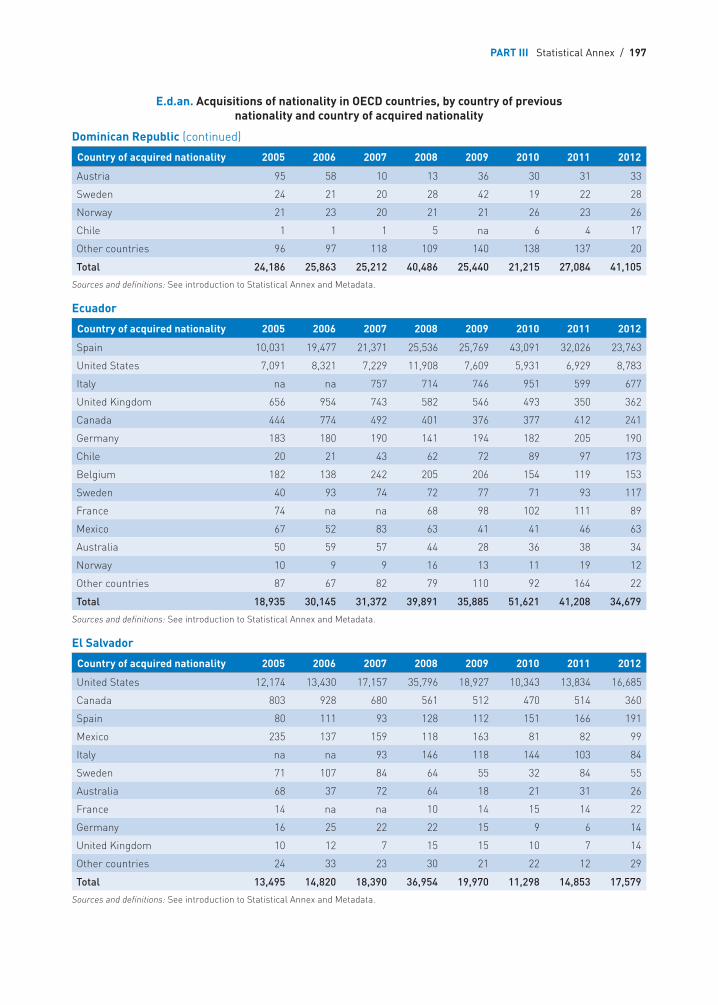
PART III Statistical Annex / 197
Dominican Republic (continued)
Country of acquired nationality 2005 2006 2007 2008 2009 2010 2011 2012
Austria 95 58 10 13 36 30 31 33
Sweden 24 21 20 28 42 19 22 28
Norway 21 23 20 21 21 26 23 26
Chile 1 1 1 5 na 6 4 17
Other countries 96 97 118 109 140 138 137 20
Total 24,186 25,863 25,212 40,486 25,440 21,215 27,084 41,105
Sources and definitions: See introduction to Statistical Annex and Metadata.
Ecuador
Country of acquired nationality 2005 2006 2007 2008 2009 2010 2011 2012
Spain 10,031 19,477 21,371 25,536 25,769 43,091 32,026 23,763
United States 7,091 8,321 7,229 11,908 7,609 5,931 6,929 8,783
Italy na na 757 714 746 951 599 677
United Kingdom 656 954 743 582 546 493 350 362
Canada 444 774 492 401 376 377 412 241
Germany 183 180 190 141 194 182 205 190
Chile 20 21 43 62 72 89 97 173
Belgium 182 138 242 205 206 154 119 153
Sweden 40 93 74 72 77 71 93 117
France 74 na na 68 98 102 111 89
Mexico 67 52 83 63 41 41 46 63
Australia 50 59 57 44 28 36 38 34
Norway 10 9 9 16 13 11 19 12
Other countries 87 67 82 79 110 92 164 22
Total 18,935 30,145 31,372 39,891 35,885 51,621 41,208 34,679
Sources and definitions: See introduction to Statistical Annex and Metadata.
El Salvador
Country of acquired nationality 2005 2006 2007 2008 2009 2010 2011 2012
United States 12,174 13,430 17,157 35,796 18,927 10,343 13,834 16,685
Canada 803 928 680 561 512 470 514 360
Spain 80 111 93 128 112 151 166 191
Mexico 235 137 159 118 163 81 82 99
Italy na na 93 146 118 144 103 84
Sweden 71 107 84 64 55 32 84 55
Australia 68 37 72 64 18 21 31 26
France 14 na na 10 14 15 14 22
Germany 16 25 22 22 15 9 6 14
United Kingdom 10 12 7 15 15 10 7 14
Other countries 24 33 23 30 21 22 12 29
Total 13,495 14,820 18,390 36,954 19,970 11,298 14,853 17,579
Sources and definitions: See introduction to Statistical Annex and Metadata.
E.d.an. Acquisitions of nationality in OECD countries, by country of previousnationality and country of acquired nationality
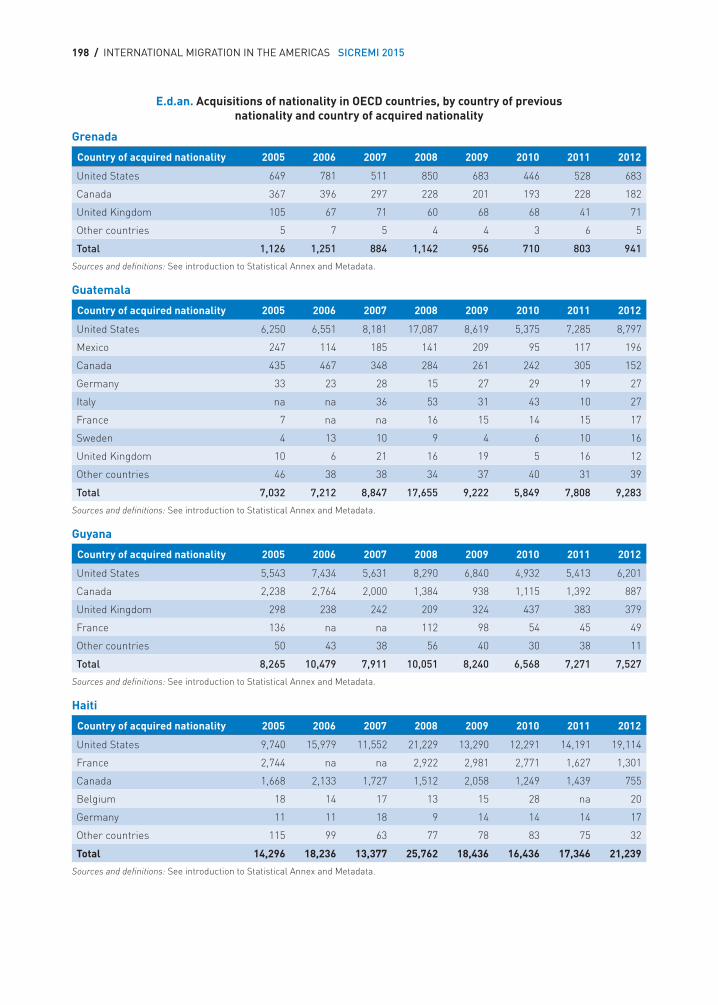
198 / INTERNATIONAL MIGRATION IN THE AMERICAS SICREMI 2015
Grenada
Country of acquired nationality 2005 2006 2007 2008 2009 2010 2011 2012
United States 649 781 511 850 683 446 528 683
Canada 367 396 297 228 201 193 228 182
United Kingdom 105 67 71 60 68 68 41 71
Other countries 5 7 5 4 4 3 6 5
Total 1,126 1,251 884 1,142 956 710 803 941
Sources and definitions: See introduction to Statistical Annex and Metadata.
Guatemala
Country of acquired nationality 2005 2006 2007 2008 2009 2010 2011 2012
United States 6,250 6,551 8,181 17,087 8,619 5,375 7,285 8,797
Mexico 247 114 185 141 209 95 117 196
Canada 435 467 348 284 261 242 305 152
Germany 33 23 28 15 27 29 19 27
Italy na na 36 53 31 43 10 27
France 7 na na 16 15 14 15 17
Sweden 4 13 10 9 4 6 10 16
United Kingdom 10 6 21 16 19 5 16 12
Other countries 46 38 38 34 37 40 31 39
Total 7,032 7,212 8,847 17,655 9,222 5,849 7,808 9,283
Sources and definitions: See introduction to Statistical Annex and Metadata.
Guyana
Country of acquired nationality 2005 2006 2007 2008 2009 2010 2011 2012
United States 5,543 7,434 5,631 8,290 6,840 4,932 5,413 6,201
Canada 2,238 2,764 2,000 1,384 938 1,115 1,392 887
United Kingdom 298 238 242 209 324 437 383 379
France 136 na na 112 98 54 45 49
Other countries 50 43 38 56 40 30 38 11
Total 8,265 10,479 7,911 10,051 8,240 6,568 7,271 7,527
Sources and definitions: See introduction to Statistical Annex and Metadata.
Haiti
Country of acquired nationality 2005 2006 2007 2008 2009 2010 2011 2012
United States 9,740 15,979 11,552 21,229 13,290 12,291 14,191 19,114
France 2,744 na na 2,922 2,981 2,771 1,627 1,301
Canada 1,668 2,133 1,727 1,512 2,058 1,249 1,439 755
Belgium 18 14 17 13 15 28 na 20
Germany 11 11 18 9 14 14 14 17
Other countries 115 99 63 77 78 83 75 32
Total 14,296 18,236 13,377 25,762 18,436 16,436 17,346 21,239
Sources and definitions: See introduction to Statistical Annex and Metadata.
E.d.an. Acquisitions of nationality in OECD countries, by country of previous nationality and country of acquired nationality
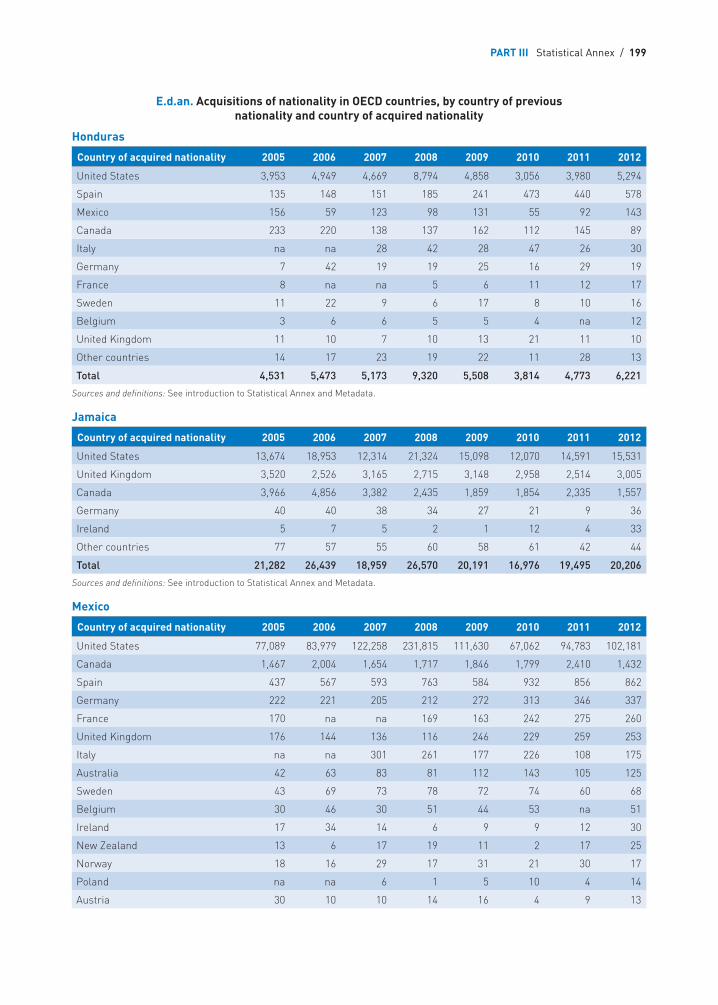
PART III Statistical Annex / 199
Honduras
Country of acquired nationality 2005 2006 2007 2008 2009 2010 2011 2012
United States 3,953 4,949 4,669 8,794 4,858 3,056 3,980 5,294
Spain 135 148 151 185 241 473 440 578
Mexico 156 59 123 98 131 55 92 143
Canada 233 220 138 137 162 112 145 89
Italy na na 28 42 28 47 26 30
Germany 7 42 19 19 25 16 29 19
France 8 na na 5 6 11 12 17
Sweden 11 22 9 6 17 8 10 16
Belgium 3 6 6 5 5 4 na 12
United Kingdom 11 10 7 10 13 21 11 10
Other countries 14 17 23 19 22 11 28 13
Total 4,531 5,473 5,173 9,320 5,508 3,814 4,773 6,221
Sources and definitions: See introduction to Statistical Annex and Metadata.
Jamaica
Country of acquired nationality 2005 2006 2007 2008 2009 2010 2011 2012
United States 13,674 18,953 12,314 21,324 15,098 12,070 14,591 15,531
United Kingdom 3,520 2,526 3,165 2,715 3,148 2,958 2,514 3,005
Canada 3,966 4,856 3,382 2,435 1,859 1,854 2,335 1,557
Germany 40 40 38 34 27 21 9 36
Ireland 5 7 5 2 1 12 4 33
Other countries 77 57 55 60 58 61 42 44
Total 21,282 26,439 18,959 26,570 20,191 16,976 19,495 20,206
Sources and definitions: See introduction to Statistical Annex and Metadata.
Mexico
Country of acquired nationality 2005 2006 2007 2008 2009 2010 2011 2012
United States 77,089 83,979 122,258 231,815 111,630 67,062 94,783 102,181
Canada 1,467 2,004 1,654 1,717 1,846 1,799 2,410 1,432
Spain 437 567 593 763 584 932 856 862
Germany 222 221 205 212 272 313 346 337
France 170 na na 169 163 242 275 260
United Kingdom 176 144 136 116 246 229 259 253
Italy na na 301 261 177 226 108 175
Australia 42 63 83 81 112 143 105 125
Sweden 43 69 73 78 72 74 60 68
Belgium 30 46 30 51 44 53 na 51
Ireland 17 34 14 6 9 9 12 30
New Zealand 13 6 17 19 11 2 17 25
Norway 18 16 29 17 31 21 30 17
Poland na na 6 1 5 10 4 14
Austria 30 10 10 14 16 4 9 13
E.d.an. Acquisitions of nationality in OECD countries, by country of previous nationality and country of acquired nationality
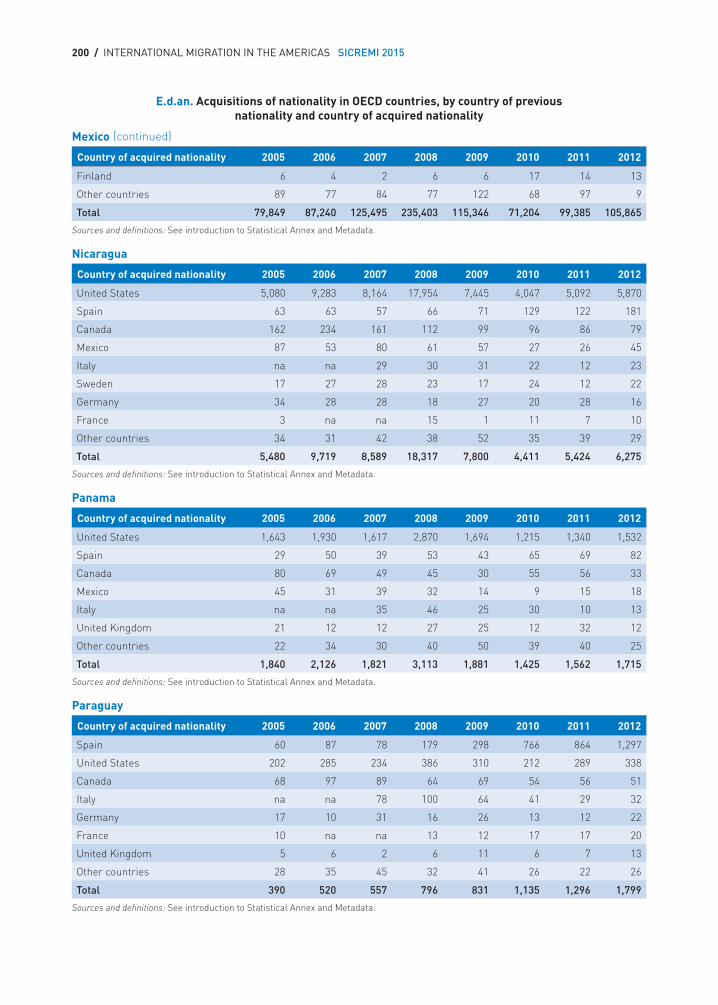
200 / INTERNATIONAL MIGRATION IN THE AMERICAS SICREMI 2015
Mexico
Country of acquired nationality 2005 2006 2007 2008 2009 2010 2011 2012
Finland 6 4 2 6 6 17 14 13
Other countries 89 77 84 77 122 68 97 9
Total 79,849 87,240 125,495 235,403 115,346 71,204 99,385 105,865
Sources and definitions: See introduction to Statistical Annex and Metadata.
Nicaragua
Country of acquired nationality 2005 2006 2007 2008 2009 2010 2011 2012
United States 5,080 9,283 8,164 17,954 7,445 4,047 5,092 5,870
Spain 63 63 57 66 71 129 122 181
Canada 162 234 161 112 99 96 86 79
Mexico 87 53 80 61 57 27 26 45
Italy na na 29 30 31 22 12 23
Sweden 17 27 28 23 17 24 12 22
Germany 34 28 28 18 27 20 28 16
France 3 na na 15 1 11 7 10
Other countries 34 31 42 38 52 35 39 29
Total 5,480 9,719 8,589 18,317 7,800 4,411 5,424 6,275
Sources and definitions: See introduction to Statistical Annex and Metadata.
Panama
Country of acquired nationality 2005 2006 2007 2008 2009 2010 2011 2012
United States 1,643 1,930 1,617 2,870 1,694 1,215 1,340 1,532
Spain 29 50 39 53 43 65 69 82
Canada 80 69 49 45 30 55 56 33
Mexico 45 31 39 32 14 9 15 18
Italy na na 35 46 25 30 10 13
United Kingdom 21 12 12 27 25 12 32 12
Other countries 22 34 30 40 50 39 40 25
Total 1,840 2,126 1,821 3,113 1,881 1,425 1,562 1,715
Sources and definitions: See introduction to Statistical Annex and Metadata.
Paraguay
Country of acquired nationality 2005 2006 2007 2008 2009 2010 2011 2012
Spain 60 87 78 179 298 766 864 1,297
United States 202 285 234 386 310 212 289 338
Canada 68 97 89 64 69 54 56 51
Italy na na 78 100 64 41 29 32
Germany 17 10 31 16 26 13 12 22
France 10 na na 13 12 17 17 20
United Kingdom 5 6 2 6 11 6 7 13
Other countries 28 35 45 32 41 26 22 26
Total 390 520 557 796 831 1,135 1,296 1,799
Sources and definitions: See introduction to Statistical Annex and Metadata.
E.d.an. Acquisitions of nationality in OECD countries, by country of previous nationality and country of acquired nationality
(continued)
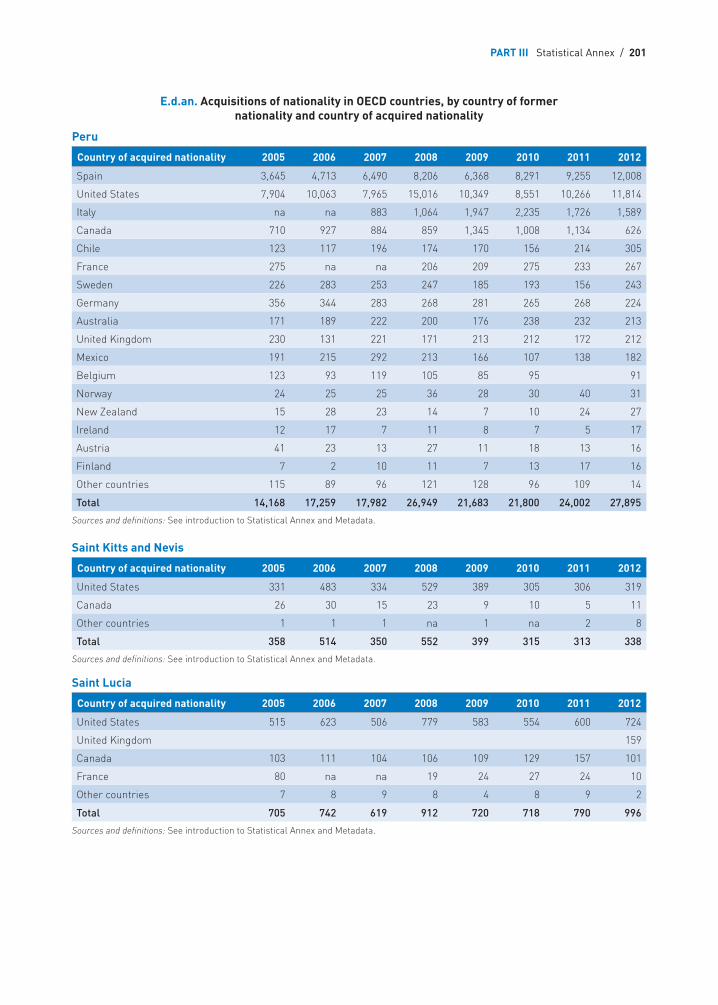
PART III Statistical Annex / 201
Peru
Country of acquired nationality 2005 2006 2007 2008 2009 2010 2011 2012
Spain 3,645 4,713 6,490 8,206 6,368 8,291 9,255 12,008
United States 7,904 10,063 7,965 15,016 10,349 8,551 10,266 11,814
Italy na na 883 1,064 1,947 2,235 1,726 1,589
Canada 710 927 884 859 1,345 1,008 1,134 626
Chile 123 117 196 174 170 156 214 305
France 275 na na 206 209 275 233 267
Sweden 226 283 253 247 185 193 156 243
Germany 356 344 283 268 281 265 268 224
Australia 171 189 222 200 176 238 232 213
United Kingdom 230 131 221 171 213 212 172 212
Mexico 191 215 292 213 166 107 138 182
Belgium 123 93 119 105 85 95 91
Norway 24 25 25 36 28 30 40 31
New Zealand 15 28 23 14 7 10 24 27
Ireland 12 17 7 11 8 7 5 17
Austria 41 23 13 27 11 18 13 16
Finland 7 2 10 11 7 13 17 16
Other countries 115 89 96 121 128 96 109 14
Total 14,168 17,259 17,982 26,949 21,683 21,800 24,002 27,895
Sources and definitions: See introduction to Statistical Annex and Metadata.
Saint Kitts and Nevis
Country of acquired nationality 2005 2006 2007 2008 2009 2010 2011 2012
United States 331 483 334 529 389 305 306 319
Canada 26 30 15 23 9 10 5 11
Other countries 1 1 1 na 1 na 2 8
Total 358 514 350 552 399 315 313 338
Sources and definitions: See introduction to Statistical Annex and Metadata.
Saint Lucia
Country of acquired nationality 2005 2006 2007 2008 2009 2010 2011 2012
United States 515 623 506 779 583 554 600 724
United Kingdom 159
Canada 103 111 104 106 109 129 157 101
France 80 na na 19 24 27 24 10
Other countries 7 8 9 8 4 8 9 2
Total 705 742 619 912 720 718 790 996
Sources and definitions: See introduction to Statistical Annex and Metadata.
E.d.an. Acquisitions of nationality in OECD countries, by country of former nationality and country of acquired nationality
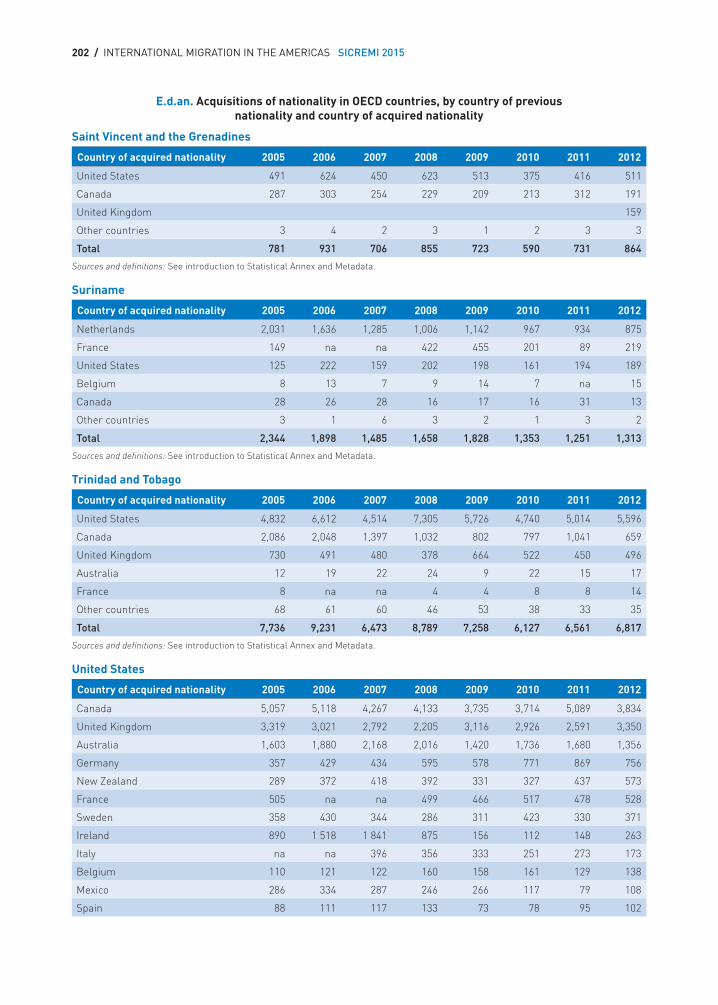
202 / INTERNATIONAL MIGRATION IN THE AMERICAS SICREMI 2015
Saint Vincent and the Grenadines
Country of acquired nationality 2005 2006 2007 2008 2009 2010 2011 2012
United States 491 624 450 623 513 375 416 511
Canada 287 303 254 229 209 213 312 191
United Kingdom 159
Other countries 3 4 2 3 1 2 3 3
Total 781 931 706 855 723 590 731 864
Sources and definitions: See introduction to Statistical Annex and Metadata.
Suriname
Country of acquired nationality 2005 2006 2007 2008 2009 2010 2011 2012
Netherlands 2,031 1,636 1,285 1,006 1,142 967 934 875
France 149 na na 422 455 201 89 219
United States 125 222 159 202 198 161 194 189
Belgium 8 13 7 9 14 7 na 15
Canada 28 26 28 16 17 16 31 13
Other countries 3 1 6 3 2 1 3 2
Total 2,344 1,898 1,485 1,658 1,828 1,353 1,251 1,313
Sources and definitions: See introduction to Statistical Annex and Metadata.
Trinidad and Tobago
Country of acquired nationality 2005 2006 2007 2008 2009 2010 2011 2012
United States 4,832 6,612 4,514 7,305 5,726 4,740 5,014 5,596
Canada 2,086 2,048 1,397 1,032 802 797 1,041 659
United Kingdom 730 491 480 378 664 522 450 496
Australia 12 19 22 24 9 22 15 17
France 8 na na 4 4 8 8 14
Other countries 68 61 60 46 53 38 33 35
Total 7,736 9,231 6,473 8,789 7,258 6,127 6,561 6,817
Sources and definitions: See introduction to Statistical Annex and Metadata.
United States
Country of acquired nationality 2005 2006 2007 2008 2009 2010 2011 2012
Canada 5,057 5,118 4,267 4,133 3,735 3,714 5,089 3,834
United Kingdom 3,319 3,021 2,792 2,205 3,116 2,926 2,591 3,350
Australia 1,603 1,880 2,168 2,016 1,420 1,736 1,680 1,356
Germany 357 429 434 595 578 771 869 756
New Zealand 289 372 418 392 331 327 437 573
France 505 na na 499 466 517 478 528
Sweden 358 430 344 286 311 423 330 371
Ireland 890 1 518 1 841 875 156 112 148 263
Italy na na 396 356 333 251 273 173
Belgium 110 121 122 160 158 161 129 138
Mexico 286 334 287 246 266 117 79 108
Spain 88 111 117 133 73 78 95 102
E.d.an. Acquisitions of nationality in OECD countries, by country of previous nationality and country of acquired nationality
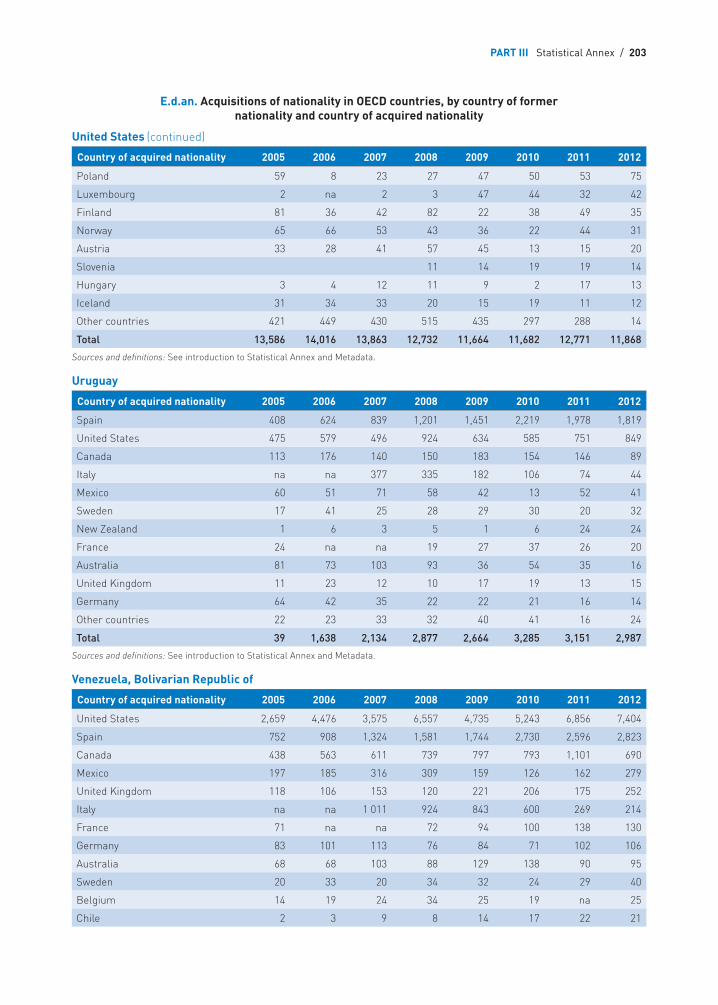
PART III Statistical Annex / 203
United States
Country of acquired nationality 2005 2006 2007 2008 2009 2010 2011 2012
Poland 59 8 23 27 47 50 53 75
Luxembourg 2 na 2 3 47 44 32 42
Finland 81 36 42 82 22 38 49 35
Norway 65 66 53 43 36 22 44 31
Austria 33 28 41 57 45 13 15 20
Slovenia 11 14 19 19 14
Hungary 3 4 12 11 9 2 17 13
Iceland 31 34 33 20 15 19 11 12
Other countries 421 449 430 515 435 297 288 14
Total 13,586 14,016 13,863 12,732 11,664 11,682 12,771 11,868
Sources and definitions: See introduction to Statistical Annex and Metadata.
Uruguay
Country of acquired nationality 2005 2006 2007 2008 2009 2010 2011 2012
Spain 408 624 839 1,201 1,451 2,219 1,978 1,819
United States 475 579 496 924 634 585 751 849
Canada 113 176 140 150 183 154 146 89
Italy na na 377 335 182 106 74 44
Mexico 60 51 71 58 42 13 52 41
Sweden 17 41 25 28 29 30 20 32
New Zealand 1 6 3 5 1 6 24 24
France 24 na na 19 27 37 26 20
Australia 81 73 103 93 36 54 35 16
United Kingdom 11 23 12 10 17 19 13 15
Germany 64 42 35 22 22 21 16 14
Other countries 22 23 33 32 40 41 16 24
Total 39 1,638 2,134 2,877 2,664 3,285 3,151 2,987
Sources and definitions: See introduction to Statistical Annex and Metadata.
Venezuela, Bolivarian Republic of
Country of acquired nationality 2005 2006 2007 2008 2009 2010 2011 2012
United States 2,659 4,476 3,575 6,557 4,735 5,243 6,856 7,404
Spain 752 908 1,324 1,581 1,744 2,730 2,596 2,823
Canada 438 563 611 739 797 793 1,101 690
Mexico 197 185 316 309 159 126 162 279
United Kingdom 118 106 153 120 221 206 175 252
Italy na na 1 011 924 843 600 269 214
France 71 na na 72 94 100 138 130
Germany 83 101 113 76 84 71 102 106
Australia 68 68 103 88 129 138 90 95
Sweden 20 33 20 34 32 24 29 40
Belgium 14 19 24 34 25 19 na 25
Chile 2 3 9 8 14 17 22 21
(continued)
E.d.an. Acquisitions of nationality in OECD countries, by country of former nationality and country of acquired nationality

204 / INTERNATIONAL MIGRATION IN THE AMERICAS SICREMI 2015
Venezuela, Bolivarian Republic of
Country of acquired nationality 2005 2006 2007 2008 2009 2010 2011 2012
Ireland 5 6 3 2 4 3 14 14
Norway 10 13 13 13 8 4 18 10
Other countries 397 285 100 190 204 147 182 29
Total 4,834 6,766 7,375 10,747 9,093 10,221 11,754 12,132
Sources and definitions: See introduction to Statistical Annex and Metadata.
(continued)
E.d.an. Acquisitions of nationality in OECD countries, by country of previous nationality and country of acquired nationality
SICREMI 2015
INTERNATIONAL MIGRATIONIN THE AMERICAS
This is the third annual report of the Continuous Reporting System on International Migration in the Americas (SICREMI, for its acronym in Spanish). The report collects data from diverse sources (censuses, surveys, administrative records, etc.) in order to process and disseminate information regarding the magnitude, trends, and characteristics of international migration in the countries that participated in this third report: Argentina, Barbados, Belize, Bolivia, Brazil, Canada, Chile, Colombia, Costa Rica, Dominican Republic, Ecuador, El Salvador, Guatemala, Jamaica, Mexico, Panama, Paraguay, Peru, United States and Uruguay.
The methodology of this report is based on the Permanent Observation System on Migration (or SOPEMI) of the Organisation for Economic Co-operation and Development (OECD), adjusted to the needs of the region in accordance with a participatory process involving the countries through a network of national correspondents and the participation of national and international organizations working in the field of migration.
SICREMI is an initiative of the Organization of American States (OAS) that aims to contribute to the promotion and development of public policies that lead to improved migration management in the Americas through the facilitation of dialogue, cooperation, institutional strengthening and access to information.
This publication is available at www.migracionoea.org/sicremi
INTER
NATIO
NA
L MIG
RATIO
N IN
THE A
MER
ICAS SICR
EMI 2015
OAS
www.migracionoea.org
17th Street and Constitution Ave., N.W.Washington, D.C., U.S.A. 20006
www.oas.org
Related Documents