International Migration in Ireland, 2011 * Philip J. O’Connell, Corona Joyce and Mairéad Finn * This is the Irish report to the OECD Continuous Reporting System on Migration (SOPEMI). The principal reference year is 2010. The research for the report was funded in part by a grant from the Department of Justice and Equality. We wish to thanks officials of the Department of Justice and Equality; the Department of Enterprise, Jobs and Innovation; and the Central Statistics Office for their assistance in compiling this report. ESRI working papers represent un-refereed work-in-progress by researchers who are solely responsible for the content and any views expressed therein. Any comments on these papers will be welcome and should be sent to the author(s) by email. Papers may be downloaded for personal use only. Working Paper No. 434 May 2012

Welcome message from author
This document is posted to help you gain knowledge. Please leave a comment to let me know what you think about it! Share it to your friends and learn new things together.
Transcript
International Migration in Ireland, 2011*
Philip J. O’Connell, Corona Joyce and Mairéad Finn
* This is the Irish report to the OECD Continuous Reporting System on Migration (SOPEMI). The principal
reference year is 2010. The research for the report was funded in part by a grant from the Department of Justice and Equality. We wish to thanks officials of the Department of Justice and Equality; the Department of Enterprise, Jobs and Innovation; and the Central Statistics Office for their assistance in compiling this report.
ESRI working papers represent un-refereed work-in-progress by researchers who are solely responsible for the content and any views expressed therein. Any comments on these papers will be welcome and should be sent to the author(s) by email. Papers may be downloaded for personal use only.
Working Paper No. 434
May 2012
2
International Migration in Ireland, 2011
1. Introduction
The population of Ireland (Republic) continued to increase during 2010, to an estimated 4,484,300 in April 2011. However, in the context of the economic crisis, immigration declined to 31,000 in the twelve months to April 2010 and increased slightly to 42,300 in the twelve months to April 2011. Migratory outflows have also increased in recent years, as returning immigrants have added their numbers to emigrating Irish nationals. In the twelve months to April 2011, the inflow of 42,000 was offset by an estimated outflow of over 76,000, resulting in net outward migration of 34,100. In terms of non-Irish nationals relative to nationals, by the second quarter of 2011 the impact of the recession is evident and the total number of non-Irish nationals in the adult population had fallen to 374,000 or 10.7%.
With regard to inward migration, it has declined since 2007. The gross migratory inflow increased from around 20,000-25,000 per annum in the late 1980s to almost 110,000 in the year to April 2007, before declining with the deterioration in the labour market to 31,000 in the year to April 2010 and then increasing somewhat to 42,300 in the year to 2011. Compared to 2010, the slight increase in immigration relates to returning Irish nationals, perhaps returning from temporary excursions, such as work-study visits to Australia, and to some growth in immigration form from the new EU Member States and the Rest of the World (18%). Inflows from non-EEA countries have dropped steadily since 2004. The modest decline, from 25,000 in 2003 to 21,000 in 2007, reflected Irish policy of seeking to meet labour needs from within the enlarged EU. The subsequent decline in the numbers from USA and the rest of the world, to a low of less than 5,000 in 2010, reflects the Irish labour market crisis. In terms of age distribution, the decline in immigrant numbers can be observed in each age group. Recent figures suggest that emigrants from Ireland (who at this stage are not necessarily all of Irish nationality) now tend to travel to a diverse range of countries.
Outward migration increased to 76,400 in the twelve months to April 2011. Emigration of Irish nationals increased sharply in that year, to over 40,000 individuals, which represented well over half of total emigration. This represents a substantial increase over previous years. Citizens of the new EU Member States accounted for less than 20% of all outflows. This was a substantial reduction in the outflow of new Member State nationals, who emigrated in large numbers in the first two years of the recession. However, when we compare these estimates of net and gross outflow estimates of new EU Member States with estimates of the decline in their population stock (see below) it suggests that the outflow estimates may be conservative, and the true outflow of nationals of the new Member States may well exceed these estimates.
There was a small decrease in both overall employment permits (2.6%) issued year-on-year in 2010 as well as new permits issued (7.6%).The number of permits renewed in 2010 rose slightly by 2.4%. All categories of employment permits, with the exception of Spousal/Dependant permits, saw a fall in numbers during 2010. In terms of overall numbers, the largest year-on-year fall concerned work permits, where some 783 less were issued during 2010, mainly renewals. They cover occupations offering a salary of €30,000 or less per annum, and are
3
targeted at workers mainly in skilled and low-skilled sectors. As in 2009, work permits issued to spouses and dependants of certain categories of employment permits saw a dramatic increase during 2010 in terms of renewals (from 1,576 in 2009 to 2,445 in 2010), although the number of new permits dropped slightly from 764 in 2009 to 702 in 2010.
There were a total of 1,939 applications for asylum in 2010, the lowest since 1996 and a decrease of 27.9% year-on-year. This annual influx for 2010 represents less than 5% of the estimate of total gross inward migration in the twelve months to April 2011. In 2010, Nigeria continued to be the stated country of nationality of the largest number of applicants for asylum and for appeal.
During 2010, decisions were made on 520 applications for subsidiary protection status, with three applicants granted subsidiary protection status and 517 applications refused. A total of 3,464 applications for General Permission to Remain in Ireland were made during 2010, with 1.494 approved and 493 refused during the year. In 2010, some 188 persons were granted leave to remain in Ireland under Section 3 of the Immigration Act, 1999 (as amended). Ireland continued to participate in the Resettlement Programme for vulnerable refugees in conjunction with UNHCR during 2010 with an annual quota of 200 persons.
Looking at return from Ireland, during 2010 a total of 292 deportation orders were effected, with an additional 51 persons who were under pending orders facilitating their own return from Ireland. The number of deportation orders issued during 2010 remained broadly stable (from 1,077 in 2009 to 1,034). Some 461 persons were assisted to return home voluntarily, either via the International Organization for Migration (IOM) mission in Ireland (376) or via governmental administrative assistance (85). Some 24 persons were removed to other EU States in accordance with the provisions of the European Communities (Free Movement of Persons) Regulations 2006 and 2008, a slight decrease on 2009 figures when 29 persons were removed. A total of 142 transfers under the Dublin Regulation to other EU member states took place during 2010.
In 2010 a total of 162,398 Certificates of Registration (referring to new registrations and renewals) were issued, representing a slight decrease of 2% on comparable figures for 2009 when 166,387 Certificates were issued. In 2010 notable increases in the numbers of Stamps for categories 5 and 4 EUFAM occurred, while numbers of registration under Stamp 1 decreased by 34%. A total of 6,786 persons changed status during the year, with the largest overall number changing from remunerated activities (3,196).
Some 25,796 applications for naturalisation were received during 2010, with some 20,723 applications processed during the year. Of this number, 15,083 were deemed to be ineligible or invalid. Of the 5,669 applications for naturalisation processed to completion in 2010, a total of 4,539 were approved. Some 6,394 certificates of naturalisation were issued during 2010. Some 2,539 applications for leave to remain in Ireland under the European Communities (Free Movement of Persons Regulations 2006 and 2008) were made in 2010.
The Department of Justice and Equality received 323 applications for family reunification in 2010, a year-on-year decrease of 28.2%.
4
Regarding major policy developments, the Immigration, Residence and Protection Bill 2010 was published in June 2010. As with the 2007 and 2008 Immigration, Residence and Protection Bills, the 2010 Bill sets out a legislative framework for the management of inward migration to Ireland. It lays down a number of important principles governing the presence in the State of foreign nationals, including the obligation on a foreign national who is unlawfully in the State to leave. It sets out statutory processes for applying for a visa, for entry to the State, for residence in the State and for deportation.
Ireland ratified both the UN Protocol to Prevent, Suppress and Punish Trafficking in Persons especially Women and Children supplementing the UN Convention against Transnational Organized Crime (17 July 2010) and the Council of Europe Convention on Action against Trafficking in Human Beings (1 November 2010).
The Civil Law (Miscellaneous Provisions) Act, 2010 contains a number of provisions with regard to citizenship and naturalisation, including a new statutory framework to facilitate the holding of citizenship ceremonies. Improved recognition of the position of civil partners within the naturalisation and citizenship context are included, as is a flexible system of fees for citizenship applications. In addition, a ‘non-national’ is defined as excluding Irish citizens and persons exercising EU treaty rights of free movement.
A number of developments introduced during 2009, particularly regarding employment permit holders, continued to have effect during 2010 including Green Card restrictions. In addition, during 2010 new arrangements regarding non-EEA doctors, Green Card holders and redundant workers were introduced. Ireland continued to apply restrictions on access to the labour market for Romanian and Bulgarian nationals during 2010. In general, nationals of such countries must hold an employment permit to access the labour market at first instance.
Regarding the recognition of qualifications, in 2010 provisions were made for the introduction of a Qualifications and Quality Assurance (Education and Training) Bill under which an amalgamated qualifications and quality assurance agency, provisionally titled the Qualifications and Quality Assurance Ireland (QCAI), will be established. The Qualifications and Quality Assurance (Education and Training) Bill 2011 was subsequently introduced in July 2011.
In September 2010, a new five-year strategy document framework, Investing in Global Relationships, was launched. Seeking to ‘enhance Ireland’s competitive position as a centre for international education’, the document sets an objective of increased international student numbers in both overall higher education and English language schools by 50% and 25% respectively by 2015. In this context, a related new immigration regime for international students was announced in September 2010. These recommendations include the introduction of a differentiated approach as between ‘Degree Programme’ courses and those at the ‘Language or Non Degree Programme’ level, and the introduction of maximum periods of residence in the State on foot of a student permission according to type of course followed. In general, non-EEA student permission will be limited to seven years in total.
In the context of stated governmental concern regarding ‘marriages of conveniences’ taking place under the auspices of EU free movement rights for non-EEA spouses of EU nationals contained within the European Communities (Free Movement of Persons Regulations 2006 and
5
2008), in 2010 new guidelines for registrars conducting marriage ceremonies were introduced and contained new identification requirements, restrictions on the use of interpreters and the number of persons who may be admitted to a registrar’s office. The Department of Justice and Equality introduced interviews of selected applicants and their spouses with a view to establishing if the marriage between the parties was entered into solely with the intention of seeking residence rights during 2011 also.
In June 2011 the first Irish Short-Stay Visa Waiver Programme was launched under the governmental ‘Jobs Initiative’. With the aim of increasing tourism, the Programme will run from July 2011 until October 2012 and cover the 2012 London Olympics. Under the programme, tourists, business persons and long-term residents who have lawfully entered the UK, including Northern Ireland, on a valid UK visa will be able to travel on to Ireland without the requirement to obtain an Irish visa. Nationals of sixteen ‘emerging’ economies are included under the Programme: India, Kazakhstan, Peoples Republic of China, Uzbekistan, Bahrain, Kuwait, Oman, Qatar, Saudi Arabia, the United Arab Emirates, Belarus, Montenegro, Russian Federation, Serbia, Turkey and Ukraine.
In June 2011, a package of measures aimed at reforming the processing of naturalisation applications was introduced by the Minister for Justice and Equality. Both a simplified form and faster processing time (six months) are provided for, as is the introduction of a citizenship ceremony. In addition, ‘streamlined and accelerated’ procedures for certain categories of applicants are outlined such as long-term residents and spouses of Irish citizens.
2. Major Developments in Migration and Integration Policy
Publication of Immigration, Residence and Protection Bill, 2010
The Immigration, Residence and Protection Bill 2010 was published in June 2010. The 2010 Bill saw the Immigration, Residence and Protection Bill 2008 withdrawn from the legislative process the following month. As with the 2007 and 2008 Immigration, Residence and Protection Bills, the 2010 Bill sets out a legislative framework for the management of inward migration to Ireland. It lays down a number of important principles governing the presence in the State of foreign nationals, including the obligation on a foreign national who is unlawfully in the State to leave. It sets out statutory processes for applying for a visa, for entry to the State, for residence in the State and for deportation. The Bill would impose an immediate and continuing obligation on a foreign national unlawfully present in the State to leave the State. It sets out statutory procedures to be followed in dealing with visa and residence permit applications. The Bill provides for the introduction of a single procedure whereby all grounds for an applicant remaining in the State (protection or otherwise) will be addressed together. The Bill also contains provisions in relation to the powers of immigration officers, exchange of information, provision by carriers of advance passenger information, ‘marriages of convenience’, special provisions on judicial review and requirements in relation to the departure of foreign nationals from the State. The Bill also lays down new rules relating to the suppression of migrant smuggling and trafficking in persons.
6
The Bill is broadly similar to the Immigration, Residence and Protection Bill 2008, however a number of differences do exist. The provision in the 2008 Bill allowing for the detention of protection applicants pending the issue of a protection application entry permit has been removed, with the 2010 Bill allowing for a requirement that the applicant remain in a specified place until the issue of the permit. Under the 2008 Bill, access to State and semi-State services by migrants unlawfully present in Ireland was restricted. The 2010 Bill now provides that goods and services from semi-State bodies are no longer included in the restrictions, and clarifies that access to education will not be denied to migrant children. Furthermore, the 2008 Bill contained a provision prohibiting asylum seekers and anyone unlawfully resident in the State from getting married in Ireland, even if they wanted to marry an Irish or EEA/Swiss citizen. This ban has been removed from the 2010 Bill and has been replaced with a ‘marriage of convenience’ test. The 2008 Bill also contained provisions allowing the Minister to refuse a residence permit to a person who had been convicted of an offence in another country. The 2010 Bill now provides that overseas convictions would only be considered relevant if the offence committed would constitute an offence in Ireland. The 2008 Bill provided for a recovery and reflection period of 45 days for victims of trafficking. The 2010 Bill provides for a longer recovery and reflection period of 60 days. The new Bill also provides that the Minister may make regulations prescribing a recovery and reflection period exceeding 60 days for child victims of trafficking.
Ratification of Counter-Trafficking Legislation
During 2010, Ireland ratified both the UN Protocol to Prevent, Suppress and Punish Trafficking in Persons especially Women and Children supplementing the UN Convention against Transnational Organized Crime (17 July 2010) and the Council of Europe Convention on Action against Trafficking in Human Beings (1 November 2010). The UN Protocol to Prevent, Suppress and Punish Trafficking in Persons, especially Women and Children adds to the UN Convention against Transnational Organized Crime, adopted by UN General Assembly Resolution A/RES/55/25 of 15 November 2000. Ireland signed the Convention in 2005 and ratified it on 13 July 2010. The Convention entered into force in September 2003, with the Protocol subsequently following later that year. The intention behind a common definition within the Protocol is to facilitate convergence in national approaches with regard to the establishment of domestic criminal offences that would support efficient international cooperation in investigating and prosecuting trafficking in persons cases. An additional objective is to protect and assist the victims of trafficking in persons with full respect for their human rights.
On 3 May 2005, the Committee of Ministers of the Council of Europe adopted the Convention on Action against Trafficking in Human Beings. The Council of Europe Convention is a comprehensive treaty focusing mainly on the protection of victims of trafficking and the safeguard of their rights. It also aims to prevent trafficking and to prosecute traffickers.
Economic Policy
Stated government policy in Ireland is to limit the issuance of new employment permits to highly-skilled, highly-paid positions; non-EEA nationals who are already legally resident in the
7
State on valid employment permits; or where there is an officially recognised scarcity of workers of a particular type or qualification.
A number of developments introduced during 2009, particularly regarding employment permit holders, continued to have effect during 2010.
Revised fees for employment permits were introduced in April 2009, the same month in which changes to arrangements for work permits and the ‘Green Card’ scheme were also announced. All taking effect from 1 June 2009, changes concerned revised eligibility requirements for new work permits (and in cases of Green Cards, certain categories removed) to apply to prospective first-time entrants to the Irish labour market from 1 June 2009; revised renewal procedures and fees; changes to eligibility for employment permits under the Spousal/Dependent Scheme; and the reintroduction of a Labour Market Needs Test. New arrangements regarding work permit holders on short-term assignments were also announced. Work permits for jobs paying less than €30,000 per annum will only be granted in ‘exceptional’ cases and with regard to dependents, spouses and dependants of first-time work permit applicants whose applications were received on or after 1 June 2009 cannot be considered for an employment permit under the Spousal/Dependant Scheme. In cases where the application for the principal permit holder’s first employment permit was received on or after 1 June 2009, spouses/dependants of Green Card holders and Researchers only are eligible to apply for a Spousal/Dependant Permit. In addition, changes regarding the reintroduction of a Labour Market Needs Test were announced during 2009, with all vacancies for which an application for a work permit is made requiring advertisement with the FÁS/EURES employment network for at least eight weeks, in addition to local and national newspapers for six days.
Ireland continued to apply restrictions on access to the labour market for Romanian and Bulgarian nationals during 2010. In general, nationals of such countries must hold an employment permit to access the labour market at first instance.
In addition, during 2010 new arrangements regarding non-EEA doctors, Green Card holders and redundant workers were introduced.
Operational from June 2010, new arrangements were announced concerning the issuing of employment permits for non-EEA doctors recruited to the Irish Public Health Service.1 Certain categories of doctors (specifically, non-internship registrations within the Trainee Specialist category and non-Consultant Hospital Doctors with a job offer as a Senior House Officer or Registrar in the Public Health Service) will no longer require a work permit. No labour market needs test will apply for recruitment of doctors, with all arrangements to be subject to review in 2011.
New renewal arrangements for Green Card holders were announced with effect from 30 August 2010. In certain circumstances, holders of Green Card permits for a period of two years or those who have been issued with a ‘Stamp 4’2 for twelve months as a prior Green Card
1 Department of Enterprise, Trade and Innovation (2010). ‘New Procedures for Employment Permits for
Doctors’. Available at www.deti.ie. 2 This person is permitted to remain in Ireland until a specified date.
8
holder may be eligible for a granting of a ‘Stamp 4’ permit for a two-year duration. This permit will allow them to remain in the State and obtain employment without the requirement of an employment permit.3
In November 2010 updated immigration arrangements concerning those eligible under the five year worker and redundancy policy were introduced with immediate effect.4 Initial arrangements for both groups were introduced in October 2009 and concerned persons working in Ireland in possession of a work permit for at least five years and those made redundant. The 2010 updated arrangements saw a consolidated set of policies introduced, with a general scheme for current holders of work permits (including Spousal/Dependent permits) and work authorisations/visas for at least five consecutive years exempted from the requirement to hold a work permit on the next renewal of their immigration registration. Qualifying persons are to be issued with a ‘Stamp 4’5 immigration permission on a one-year renewable basis. This applies equally to those who are still in employment and to those with a work permit who, having completed five years work, have since been made redundant. It is also applicable irrespective of whether a person has submitted an application for Long-Term Residence permission. In the case of persons working in Ireland on a work permit for less than five continuous years and who have become redundant involuntarily, and those with five or more years residency but not eligible for the aforementioned waiver, a six-month ‘grace period’ will be available under which they can seek alternative work without a labour market needs test being applied.
No review of occupations for which new work permits will not be issued took place during 2010, with a National Skills Bulletin 20106 published during the year. The 2010 Bulletin showed most of the skills shortages from 2009 persisting in ‘small magnitude’, particularly in the area of
3 Department of Enterprise, Trade and Innovation (2010). ‘Revised renewal immigration arrangements for
Green Card Holders’. Available at http://www.deti.ie/labour/workpermits/greencardholderimportant notice.htm.
4 Department of Justice and Law Reform (2010). ‘Policy for 5 year workers and redundant workers’. Available at http://www.inis.gov.ie/en/INIS/Pages/Policy%20for%205%20year%20workers%20and%20redundant%20workers.
5 Persons who satisfy the eligibility criteria for this concession will be issued a Stamp 4 immigration permission for 1 year signifying the right to be present in Ireland and to be employed without a work permit. Terms and conditions include:
• Permissions granted may be renewed annually. • Persons granted the permission are expected to work and to support themselves and any dependents
and, if made redundant, the person concerned must seek new employment. • The holder of this permission cannot become an undue burden on the State. • The holder of this permission will be free to work in any employment and will no longer be limited to
the current employer. Should they subsequently be made redundant they are free to seek other employment.
• It is not long term residence and it cannot be seen as any guarantee of permanent status. • The Stamp 4 in this situation allows the person to establish a business or become self-employed. • The concession is being made irrespective of whether the person is currently an applicant for Long Term
Residence. See:http://www.inis.gov.ie/en/INIS/Pages/Policy%20for%205%20year%20workers%20and%20redundant%20workers.
6 Expert Group on Future Skills Needs (2010). National Skills Bulletin 2010. FÁS: Dublin.
9
specialised high skills area in the area of IT, engineering, finance, sales, healthcare and management.
Recognition of Qualifications
Regarding the recognition of qualifications, in 2010 provisions were made for the introduction of a Qualifications and Quality Assurance (Education and Training) Bill under which an amalgamated qualifications and quality assurance agency, provisionally titled the Qualifications and Quality Assurance Ireland (QCAI), will be established. This new agency will serve to bring together the National Qualification Authority of Ireland (NQAI); the Further Education and Training Awards Council (FETAC); and the Higher Education and Training Awards Council (HETAC) under one organisation. At present, the National Qualifications Authority of Ireland (NQAI) is responsible for the recognition of international qualifications. An International Qualifications Database is maintained which contains information regarding foreign qualifications, education and training systems. It lists the foreign qualifications that have been processed to date by the NQAI and states the advice that has been issued regarding the comparability of the qualifications in Ireland. The NQAI has established a National Framework of Qualifications which facilitates the recognition process with each foreign qualification compared to an Irish qualification when recognised.7 The Qualifications and Quality Assurance (Education and Training) Bill 2011 was subsequently introduced in July 2011.8
Non-EEA Student Immigration
On 1 September 2009, the Department of Justice and Equality published a set of proposals for reform of non-EEA student immigration and launched a public consultation process on the issue.9 The proposals contained more than 20 discussion items including capping the length of time a person can spend in Ireland as a student at no more than five years in further education or two years at English language classes; introducing a two-tier system to facilitate the targeting of incentives towards the upper end of the academic spectrum; a stronger inspection process; possible changes in respect of visas; and new guidelines on work placement or internship.
In September 2010, a new five-year strategy document framework, Investing in Global Relationships, was launched.10 Seeking to ‘enhance Ireland’s competitive position as a centre for international education’, the document sets an objective of increased international student numbers in both overall higher education and English language schools by 50% and 25% respectively by 2015. Estimating that approximately 9,000 non-EEA students were studying in 7 www.nfq.ie. 8 http://www.oireachtas.ie/documents/bills28/bills/2011/4111/B4111S.pdf. 9 Department of Justice, Equality and Law Reform (1 September 2009). ‘Ahern to overhaul student immigration
regime’. Press Release. Available at: http://www.justice.ie/en/JELR/Pages/Ahern%20to%20overhaul%20student%20immigration%20regime. 10 Department of Education and Skills (September 2010). Investing in Global Relationships. Available at
www.education.ie.
10
further education institutions during 2009, the strategy document sets a target of increasing the economic impact of the international education sector for Ireland by some €300 million to approximately €1.2 billion by 2015.
Regarding international students, a ‘strengthened immigration and visa regime’ is envisioned with strategic partner countries and agreed jointly between the education and immigration authorities. The alignment of immigration rules with specific courses will be introduced, with visas for degree programmes fast-tracked. Students on short-term English language courses will be viewed as ‘educational tourists’ and will not be required to fulfil standard student conditions for entry.
Regarding access to the labour market, plans were outlined to extend the Graduate Work Scheme to all graduates above a certain level and for up to one year, with the Scheme subsequently extended during 2010.11 An overall review by the Interdepartmental Committee on Student Immigration of access to the labour market by non-EEA students is proposed for 2011. In a further change from previous practice, the strategy document provides for the education of children of PhD candidate programme or certain other agreed programmes in State-funded schools. Other students who choose to pay an ‘immigration levy’ to cover associated State costs may also place their children in State-funded schools while in Ireland.
In this context, a related new immigration regime for international students was announced in September 2010. A New Immigration Regime for Full Time non-EEA Students12 report from the Interdepartmental Committee on Student Immigration contained more than 20 recommendations designed to ‘reform the student immigration regime in a manner that is better integrated with Ireland's immigration policy generally while providing a stronger regulatory framework for the sustainable development of the international education sector’, with a number of recommendations to come into effect from 1 January 2011. These recommendations include the introduction of a differentiated approach as between ‘Degree Programme’ courses and those at the ‘Language or Non Degree Programme’ level, and the introduction of maximum periods of residence in the State on foot of a student permission according to type of course followed. In general, non-EEA student permission will be limited to seven years in total.13 Eligible education providers must be included on a State-administered ‘Internationalisation Register’. Interim arrangements for current students affected by the change were also announced, including a six month concession period applicable in cases for timed-out students to regularise their status. 14
11 The Graduate Scheme has recently been extended to twelve months for those at level 8 or above of the
National Framework of Qualifications. The six-month period still applies to those with level 7 qualifications based on the Framework.
12 Department of Justice and Law Reform (2010). New Immigration Regime for Full Time Non-EEA Students. Available at http://www.inis.gov.ie/en/JELR/BookletA4.pdf/Files/BookletA4.pdf.
13 Except in cases where the course is at PhD level or a programme of study of long duration or where the Minister of Justice and Law Reform is satisfied that ‘special circumstances exist’.
14 Department of Justice and Law Reform (December 2010). ‘Internationalisation Register New Arrangements to Apply from 01 January’. Available at www.inis.gov.ie.
11
Integration Policies
In September 2010 a national Intercultural Education Strategy, 2010-15 was launched with the aim of ensuring that ‘inclusion and integration within an intercultural learning environment becomes the norm’.15 The Strategy operates on a five year timeline and contains ten key components and five high-level goals of intercultural education. A more intercultural learning environment is promoted via the adoption of a ‘whole [of] institution approach’. The Strategy recommends that cultural diversity, inclusion and integration should be included in the school environment, with specific anti-bullying policies introduced. The development of guidelines on best practice for institutions on the teaching and learning of the language of instruction as an additional language by the Department of Education and Skills is also recommended, alongside a recognition that student language learning should not preclude exclusion from mainstream environments. The need for a wide range of teaching and learning methods used for the acquisition of the language of instruction is identified, as is the development of the ‘Accessing Intercultural Materials’ (AIM) information portal on the topic of immigrants, for use by students, parents, educators, researchers and policymakers. The development of a post-graduate qualification in English as an additional language is encouraged, as is the engagement and effective communication of schools with migrant parents.
Ministerial Council on Migrant Integration
Following on from a commitment made in the Migration Nation integration strategy in 2008, in June 2010 it was announced that a Ministerial Council on Migrant Integration was to be established. Set up on a regional basis (Dublin, Rest of Leinster, Munster and Connacht/Ulster), and with the aim of reflecting migrants’ experiences of integration ‘at a local level’ and to provide advice on issues faced by migrants, the meetings are to be chaired by the Minister for Integration and aim to be held two to three times per year in each region.16 Approximately fifteen to twenty members will constitute each regional forum, with persons appointed for a five year time period.17 Applications were sought from migrants who have been legally resident in Ireland for at least two years; applications from international protection applicants were not eligible. Almost 500 applications for membership of the Council were received, representing 76 nationalities,18 with eventual selection considering a balance between countries of origin, geographical residence in Ireland and gender. By early 2011, all four regional councils had met.
15 Department of Education and Skills and the Office of the Minister for Integration (2010). Intercultural
Education Strategy, 2010-15. Available at http://www.education.ie/servlet/blobservlet/mig_intercultural_ education_strategy.pdf 16 Office of the Minister for Integration (June 2010). ‘Ministerial Council on Integration – Announcement’. Press
Release. Available at www.integration.ie. 17 Each forum consisted of the following: - A Connacht/ Ulster forum which will consist of 15 members - A Dublin forum which will consist of 20 members - A Rest of Leinster forum which will consist of 20 members - A Munster forum which will consist of 20 members. 18 Office of the Minister for Integration (18 January 2011). ‘Minister White chairs meeting of Inter-Departmental
Group on Integration’. Press Release. Available at www.integration.ie.
12
‘Marriages of Convenience’
In the context of stated governmental concern regarding ‘marriages of conveniences’ taking place under the auspices of EU free movement rights for non-EEA spouses of EU nationals contained within the European Communities (Free Movement of Persons Regulations 2006 and 2008), in 2010 new guidelines for registrars conducting marriage ceremonies were introduced containing new identification requirements, restrictions on the use of interpreters and the number of persons who may be admitted to a registrar’s office. During 2011 it was noted that the Department of Justice and Equality had introduced interviews of selected applicants and their spouses with a view to establishing if the marriage between the parties was entered into solely with the intention of seeking residence rights.19
Short-Stay Visa Programme
In June 2011 the first Irish Short-Stay Visa Waiver Programme was launched under the governmental ‘Jobs Initiative’. With the aim of increasing tourism and estimating up to 1 million eligible persons, the Programme will run from July 2011 until October 2012 and cover the 2012 London Olympics. Under the programme, tourists or business people who have lawfully entered the UK, including Northern Ireland, on a valid UK visa will be able to travel on to Ireland without the requirement to obtain an Irish visa. They will be allowed to stay in Ireland for up to 3 months or until their UK visa runs out, whichever comes first. Nationals of sixteen ‘emerging’ economies are included under the Programme: India, Kazakhstan, Peoples Republic of China, Uzbekistan, Bahrain, Kuwait, Oman, Qatar, Saudi Arabia, the United Arab Emirates, Belarus, Montenegro, Russian Federation, Serbia, Turkey and Ukraine. Nationals of the listed countries who are long-term legal residents in the UK will also not be requested to pay for a visa for Ireland under the Programme.
Citizenship and Naturalisation
The Civil Law (Miscellaneous Provisions) Act 2010 contains a number of provisions with regard to citizenship and naturalisation, including a new statutory framework to facilitate the holding of citizenship ceremonies. Improved recognition of the position of civil partners within the naturalisation and citizenship context are included, as is a flexible system of fees for citizenship applications. In addition, a ‘non-national’ is defined as excluding Irish citizens and persons exercising EU treaty rights of free movement. A provision for statutory legal advice in relation to criminal matters for alleged victims of human trafficking is also outlined.
In Ireland the granting of naturalisation is set out in the Irish Nationality and Citizenship Act 1956, as amended. The principal statutory requirements for a non-national in applying for naturalisation is 5 years reckonable residence, including 1 year’s continuous residence immediately prior to the date of application and that the applicant is of good character. In June 2011 a package of measures aimed at reforming the processing of naturalisation applications
19 Department of Justice and Equality (2010). ‘Sham marriages leading to abuses of EU freedom of movement
rights’. Available at http://www.inis.gov.ie/en/INIS/Pages/PR11000007.
13
was introduced by the Minister for Justice and Equality. Both a simplified form and faster processing time (six months) are provided for, as is the introduction of a ‘citizenship ceremony’. In addition, ‘streamlined and accelerated’ procedures for certain categories of applicants are outlined such as long-term residents and spouses of Irish citizens.20
In November 2010 it was stated that almost half of the 26,100 persons who applied for Irish citizenship in the 12 months up to 30 June 2010 had their forms returned due to incorrect completion. It was also noted that the average processing times for applications for citizenship was 26 months. In November 2011, amended legislation was introduced regarding changes to forms, in particular to facilitate civil partners of Irish citizens. The Irish Nationality and Citizenship Regulations 2011 (S.I. No. 569/11) also provides for an application fee of €175 for all applications for a certificate of naturalisation and takes effect from 10th November 2011.
International Readmission Agreements
Ireland continued to participate in a bilateral readmission agreement with Nigeria during 2010.
20 Department of Justice and Equality (2011). ‘Minister Shatter introduces major changes to citizenship
application processing regime’. Available at http://www.inis.gov.ie/en/INIS/Pages/PR11000033.
14
3. Migration Movements
Overall Trends
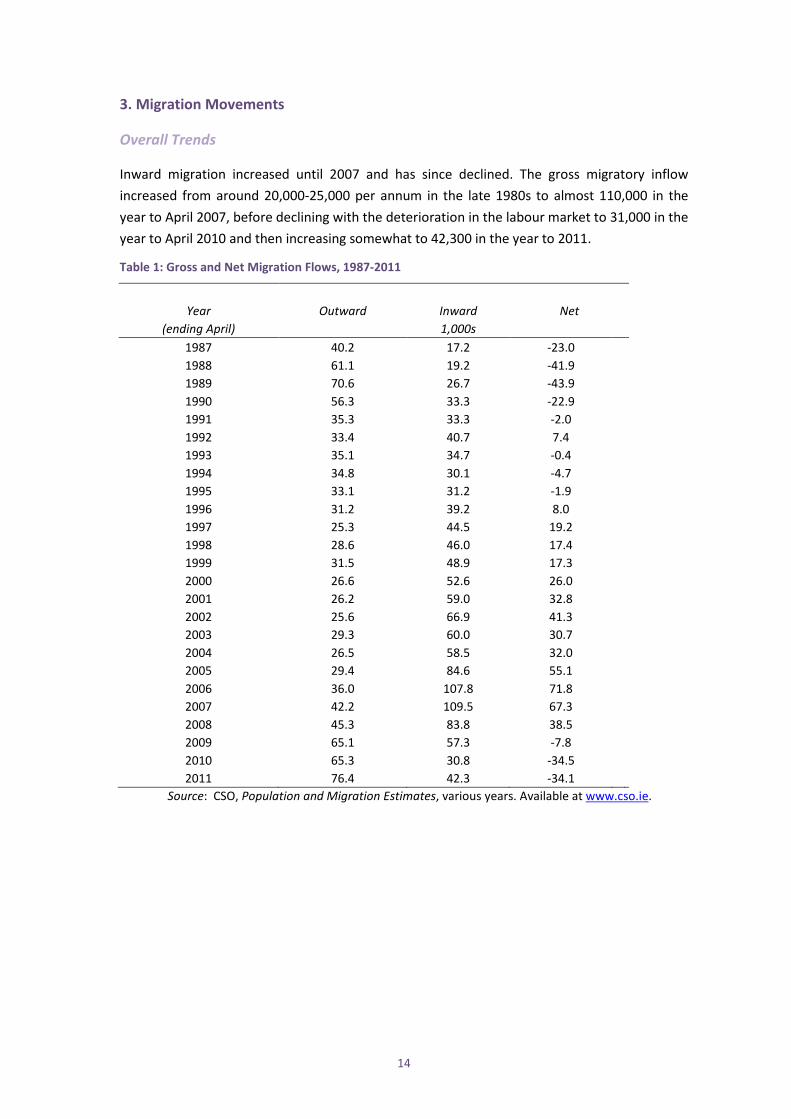
Inward migration increased until 2007 and has since declined. The gross migratory inflow increased from around 20,000-25,000 per annum in the late 1980s to almost 110,000 in the year to April 2007, before declining with the deterioration in the labour market to 31,000 in the year to April 2010 and then increasing somewhat to 42,300 in the year to 2011.
Table 1: Gross and Net Migration Flows, 1987-2011
Year Outward Inward Net
(ending April) 1,000s 1987 40.2 17.2 -23.0 1988 61.1 19.2 -41.9 1989 70.6 26.7 -43.9 1990 56.3 33.3 -22.9 1991 35.3 33.3 -2.0 1992 33.4 40.7 7.4 1993 35.1 34.7 -0.4 1994 34.8 30.1 -4.7 1995 33.1 31.2 -1.9 1996 31.2 39.2 8.0 1997 25.3 44.5 19.2 1998 28.6 46.0 17.4 1999 31.5 48.9 17.3 2000 26.6 52.6 26.0 2001 26.2 59.0 32.8 2002 25.6 66.9 41.3 2003 29.3 60.0 30.7 2004 26.5 58.5 32.0 2005 29.4 84.6 55.1 2006 36.0 107.8 71.8 2007 42.2 109.5 67.3 2008 45.3 83.8 38.5 2009 65.1 57.3 -7.8 2010 65.3 30.8 -34.5 2011 76.4 42.3 -34.1
Source: CSO, Population and Migration Estimates, various years. Available at www.cso.ie.
15
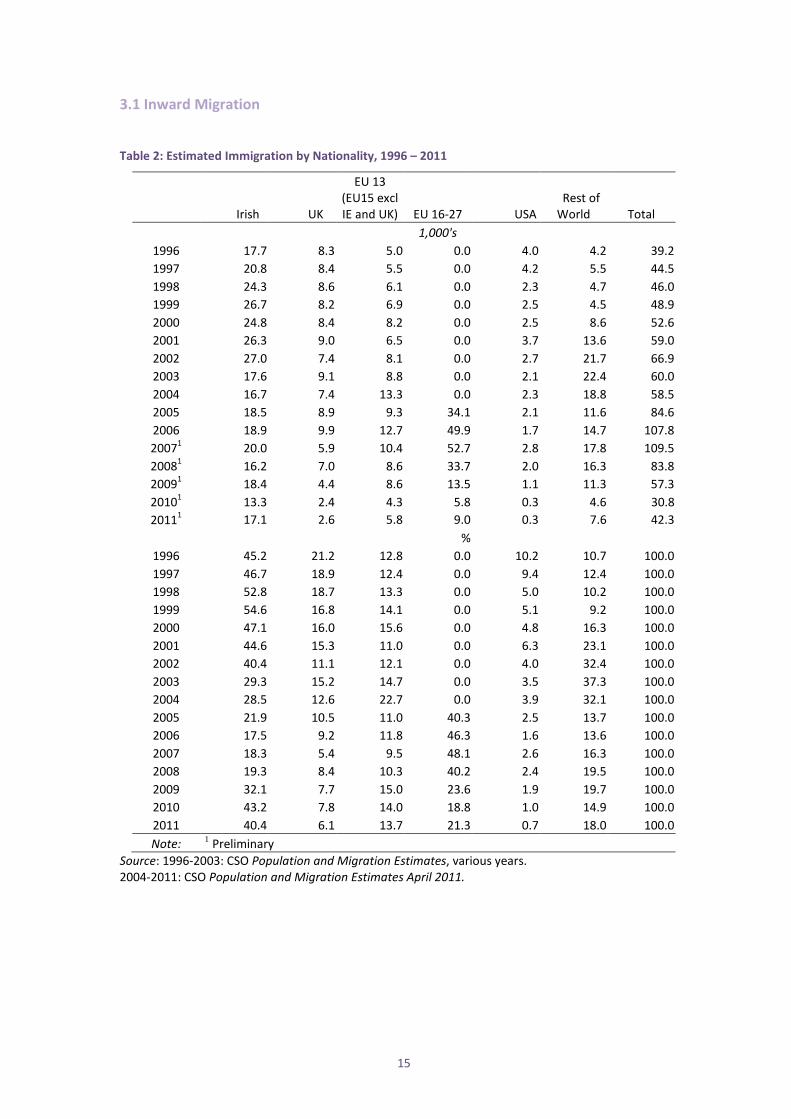
3.1 Inward Migration
Table 2: Estimated Immigration by Nationality, 1996 – 2011
Irish UK
EU 13 (EU15 excl IE and UK) EU 16-27 USA
Rest of World Total
1,000's 1996 17.7 8.3 5.0 0.0 4.0 4.2 39.2 1997 20.8 8.4 5.5 0.0 4.2 5.5 44.5 1998 24.3 8.6 6.1 0.0 2.3 4.7 46.0 1999 26.7 8.2 6.9 0.0 2.5 4.5 48.9 2000 24.8 8.4 8.2 0.0 2.5 8.6 52.6 2001 26.3 9.0 6.5 0.0 3.7 13.6 59.0 2002 27.0 7.4 8.1 0.0 2.7 21.7 66.9 2003 17.6 9.1 8.8 0.0 2.1 22.4 60.0 2004 16.7 7.4 13.3 0.0 2.3 18.8 58.5 2005 18.5 8.9 9.3 34.1 2.1 11.6 84.6 2006 18.9 9.9 12.7 49.9 1.7 14.7 107.8 20071 20.0 5.9 10.4 52.7 2.8 17.8 109.5 20081 16.2 7.0 8.6 33.7 2.0 16.3 83.8 20091 18.4 4.4 8.6 13.5 1.1 11.3 57.3 20101 13.3 2.4 4.3 5.8 0.3 4.6 30.8 20111 17.1 2.6 5.8 9.0 0.3 7.6 42.3
% 1996 45.2 21.2 12.8 0.0 10.2 10.7 100.0 1997 46.7 18.9 12.4 0.0 9.4 12.4 100.0 1998 52.8 18.7 13.3 0.0 5.0 10.2 100.0 1999 54.6 16.8 14.1 0.0 5.1 9.2 100.0 2000 47.1 16.0 15.6 0.0 4.8 16.3 100.0 2001 44.6 15.3 11.0 0.0 6.3 23.1 100.0 2002 40.4 11.1 12.1 0.0 4.0 32.4 100.0 2003 29.3 15.2 14.7 0.0 3.5 37.3 100.0 2004 28.5 12.6 22.7 0.0 3.9 32.1 100.0 2005 21.9 10.5 11.0 40.3 2.5 13.7 100.0 2006 17.5 9.2 11.8 46.3 1.6 13.6 100.0 2007 18.3 5.4 9.5 48.1 2.6 16.3 100.0 2008 19.3 8.4 10.3 40.2 2.4 19.5 100.0 2009 32.1 7.7 15.0 23.6 1.9 19.7 100.0 2010 43.2 7.8 14.0 18.8 1.0 14.9 100.0 2011 40.4 6.1 13.7 21.3 0.7 18.0 100.0 Note: 1 Preliminary
Source: 1996-2003: CSO Population and Migration Estimates, various years. 2004-2011: CSO Population and Migration Estimates April 2011.
16
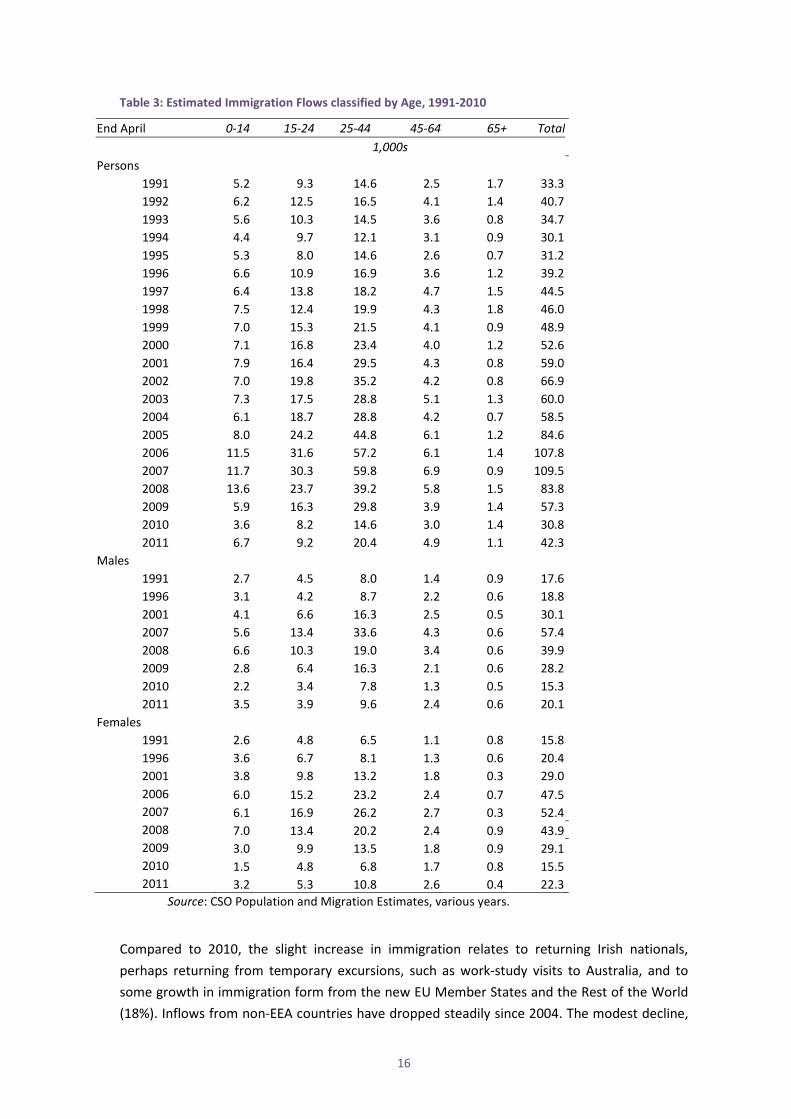
Table 3: Estimated Immigration Flows classified by Age, 1991-2010
End April 0-14 15-24 25-44 45-64 65+ Total 1,000s Persons
1991 5.2 9.3 14.6 2.5 1.7 33.3 1992 6.2 12.5 16.5 4.1 1.4 40.7 1993 5.6 10.3 14.5 3.6 0.8 34.7 1994 4.4 9.7 12.1 3.1 0.9 30.1 1995 5.3 8.0 14.6 2.6 0.7 31.2 1996 6.6 10.9 16.9 3.6 1.2 39.2 1997 6.4 13.8 18.2 4.7 1.5 44.5 1998 7.5 12.4 19.9 4.3 1.8 46.0 1999 7.0 15.3 21.5 4.1 0.9 48.9 2000 7.1 16.8 23.4 4.0 1.2 52.6 2001 7.9 16.4 29.5 4.3 0.8 59.0 2002 7.0 19.8 35.2 4.2 0.8 66.9 2003 7.3 17.5 28.8 5.1 1.3 60.0 2004 6.1 18.7 28.8 4.2 0.7 58.5 2005 8.0 24.2 44.8 6.1 1.2 84.6 2006 11.5 31.6 57.2 6.1 1.4 107.8 2007 11.7 30.3 59.8 6.9 0.9 109.5 2008 13.6 23.7 39.2 5.8 1.5 83.8 2009 5.9 16.3 29.8 3.9 1.4 57.3 2010 3.6 8.2 14.6 3.0 1.4 30.8 2011 6.7 9.2 20.4 4.9 1.1 42.3
Males 1991 2.7 4.5 8.0 1.4 0.9 17.6 1996 3.1 4.2 8.7 2.2 0.6 18.8 2001 4.1 6.6 16.3 2.5 0.5 30.1 2007 5.6 13.4 33.6 4.3 0.6 57.4 2008 6.6 10.3 19.0 3.4 0.6 39.9 2009 2.8 6.4 16.3 2.1 0.6 28.2 2010 2.2 3.4 7.8 1.3 0.5 15.3 2011 3.5 3.9 9.6 2.4 0.6 20.1
Females 1991 2.6 4.8 6.5 1.1 0.8 15.8 1996 3.6 6.7 8.1 1.3 0.6 20.4 2001 3.8 9.8 13.2 1.8 0.3 29.0 2006 6.0 15.2 23.2 2.4 0.7 47.5 2007 6.1 16.9 26.2 2.7 0.3 52.4 2008 7.0 13.4 20.2 2.4 0.9 43.9 2009 3.0 9.9 13.5 1.8 0.9 29.1 2010 1.5 4.8 6.8 1.7 0.8 15.5 2011 3.2 5.3 10.8 2.6 0.4 22.3
Source: CSO Population and Migration Estimates, various years. Compared to 2010, the slight increase in immigration relates to returning Irish nationals, perhaps returning from temporary excursions, such as work-study visits to Australia, and to some growth in immigration form from the new EU Member States and the Rest of the World (18%). Inflows from non-EEA countries have dropped steadily since 2004. The modest decline,
17
from 25,000 in 2003 to 21,000 in 2007, reflected Irish policy of seeking to meet labour needs from within the enlarged EU. The subsequent decline in the numbers from USA and the rest of the world, to a low of less than 5,000 in 2010, reflects the Irish labour market crisis.
In terms of age distribution, the decline in immigrant numbers can be observed in each age group. Those aged 25-44 years currently constitute almost half of the total inflow and over a quarter of the gross inflow relates to young people aged 15-24 years. About 15% of inward migrants in 2010 were children aged less than 15 years. Immigrants in the age group 45 years and over currently make over 14% of the inflow, and this proportion has grown in recent years.
Other Indicators of Immigration
PPSN Allocations
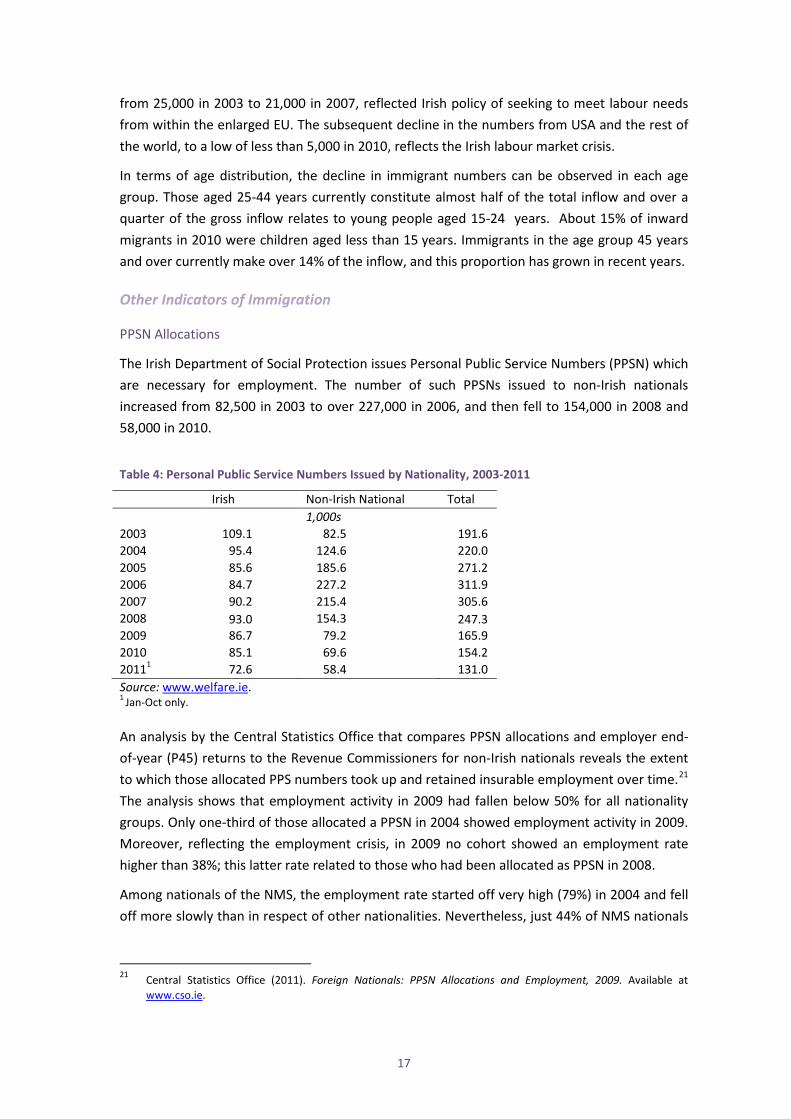
The Irish Department of Social Protection issues Personal Public Service Numbers (PPSN) which are necessary for employment. The number of such PPSNs issued to non-Irish nationals increased from 82,500 in 2003 to over 227,000 in 2006, and then fell to 154,000 in 2008 and 58,000 in 2010.
Table 4: Personal Public Service Numbers Issued by Nationality, 2003-2011
Irish Non-Irish National Total 1,000s 2003 109.1 82.5 191.6 2004 95.4 124.6 220.0 2005 85.6 185.6 271.2 2006 84.7 227.2 311.9 2007 90.2 215.4 305.6 2008 93.0 154.3 247.3 2009 86.7 79.2 165.9 2010 85.1 69.6 154.2 20111 72.6 58.4 131.0 Source: www.welfare.ie. 1 Jan-Oct only. An analysis by the Central Statistics Office that compares PPSN allocations and employer end-of-year (P45) returns to the Revenue Commissioners for non-Irish nationals reveals the extent to which those allocated PPS numbers took up and retained insurable employment over time.21 The analysis shows that employment activity in 2009 had fallen below 50% for all nationality groups. Only one-third of those allocated a PPSN in 2004 showed employment activity in 2009. Moreover, reflecting the employment crisis, in 2009 no cohort showed an employment rate higher than 38%; this latter rate related to those who had been allocated as PPSN in 2008.
Among nationals of the NMS, the employment rate started off very high (79%) in 2004 and fell off more slowly than in respect of other nationalities. Nevertheless, just 44% of NMS nationals
21 Central Statistics Office (2011). Foreign Nationals: PPSN Allocations and Employment, 2009. Available at
www.cso.ie.
18
allocated PPSNs in 2004 were economically active in 2009, compared to the average of 33% for all nationalities.
Visas
During 2010, some 133,598 visas were issued by Ireland. Of this number, 64,493 were re-entry visas, which are issued to nationals of visa required countries who are legally present in Ireland and wish to leave temporarily (holidays, business, visit relatives etc.) and to re-enter the State.
As of March 2010 Ireland began collecting biometric data in the form of fingerprints as part of the visa application process. This process initially began in Nigeria and is expected to extend to other locations at a later date. All visa applicants aged six years and over and who are residing in Nigeria (irrespective of nationality) must present in person to one of the Ireland Visa Application Centres (VAC) in Abuja or Lagos.
A total of 3,031 persons were refused leave to land at Irish ports during 2010.
Inflows of Workers from Non-EEA Countries
It is possible to derive information on the trends in the numbers of non-EEA nationals22 entering the country to take up employment by analysing the annual figures for the numbers of employment permits issued and renewed by the Department of Enterprise, Trade and Employment. This programme is based on the provisions of the 2003 Employment Permits Act and, since January 2007, the 2006 Employment Permits Act.23 Work and employment permits apply to all engagements for financial gain involving non-EEA citizens, including those of short duration. The system is employer-based and the initiative must be taken by the employer in the first instance to obtain the permit prior to the entry of the employee into the State. The application must relate to a specific job and to a named individual. In the period leading up to EU enlargement on 1 May 2004, the Department of Enterprise, Trade and Innovation, in accordance with the EU Accession Treaty, encouraged employers to source their potential work permit requirements from the EU-25 countries.
22 EU citizens and citizens of Norway, Iceland and Liechtenstein do not require Employment Permits in order to
take up employment in Ireland. 23 It was previously based on the Aliens Act 1935.
19
Table 5: Employment Permits Issued and Renewed, 1993-2011
Year New Permits Issued Permits Renewed Permits Issued (including Group Permits)
1993 1,077 24 1,104 1994 1,829 672 2,612 1995 2,563 1,646 4,409 1996 2,137 1,397 3,780 1997 2,668 1,617 4,544 1998 3,589 1,886 5,714 1999 4,323 1,652 6,244 2000 16,712 2,246 19,256 2001 33,296 6,475 40,128 2002 26,019 16,547 42,997 2003 24,073 25,111 49,744 2004 2,894 23,347 26,241 2005 10,475 19,502 29,997 2006 10,246 16,530 26,776 2007 9,943 13,166 23,109 2008 8,372 4,964 13,336 2009 3,832 3,842 7,674 2010 3,541 3,935 7,476
Source: Derived from data supplied by the Department of Jobs, Trade and Innovation. Note: 2000-2006 inclusive includes Work Authorisations and Visas. Note: Data may differ from published figures as per Department of Jobs, Enterprise and Innovation website www.deji.ie.
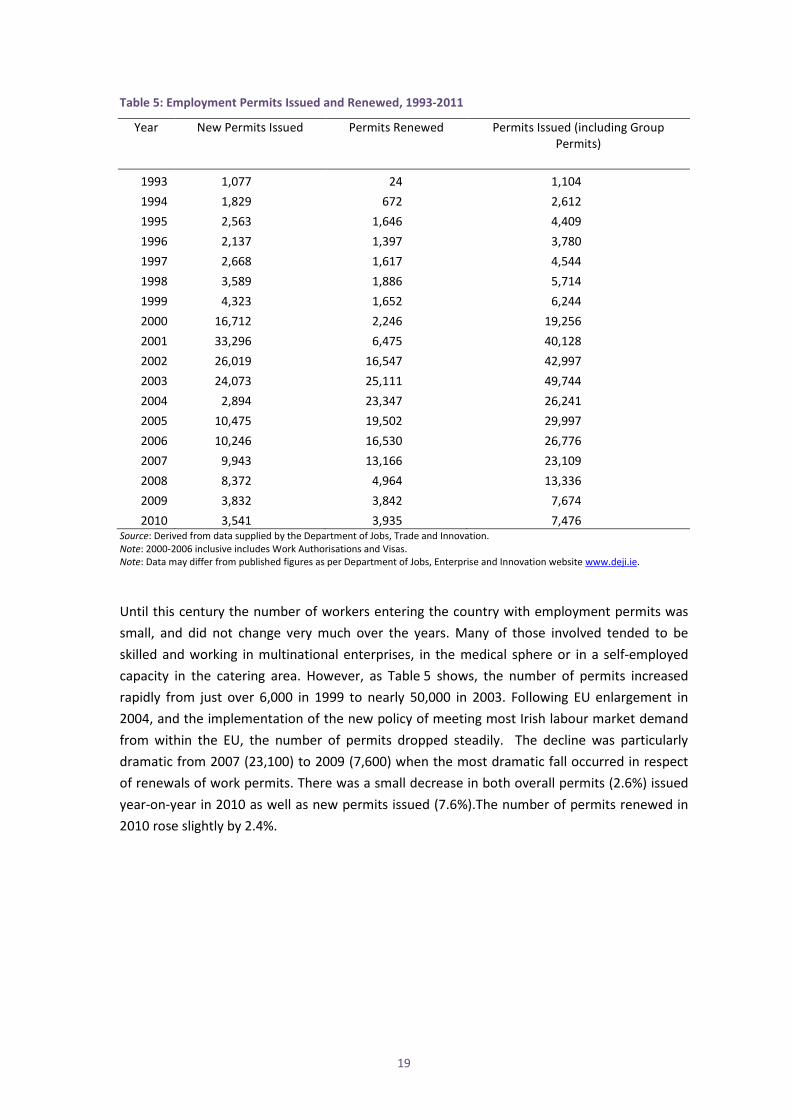
Until this century the number of workers entering the country with employment permits was small, and did not change very much over the years. Many of those involved tended to be skilled and working in multinational enterprises, in the medical sphere or in a self-employed capacity in the catering area. However, as Table 5 shows, the number of permits increased rapidly from just over 6,000 in 1999 to nearly 50,000 in 2003. Following EU enlargement in 2004, and the implementation of the new policy of meeting most Irish labour market demand from within the EU, the number of permits dropped steadily. The decline was particularly dramatic from 2007 (23,100) to 2009 (7,600) when the most dramatic fall occurred in respect of renewals of work permits. There was a small decrease in both overall permits (2.6%) issued year-on-year in 2010 as well as new permits issued (7.6%).The number of permits renewed in 2010 rose slightly by 2.4%.
20
Table 6: Employment Permits, 2009 and 2010
Year Type of Permit New Renewal Total
2010 3,541 3,935 7,476
Work Permit 2,011 1,418 3,429
Green Card 561 1 562
Intra-Company Transfer (ICT) 263 69 332
Spousal/Dependant 702 2,445 3,147
Training 4 2 6
2009 3,832 3,842 7,674
Work Permit 2,043 2,169 4,212
Green Card 727 2 729
Intra-Company Transfer (ICT) 286 91 377
Spousal/Dependent 764 1,576 2,340
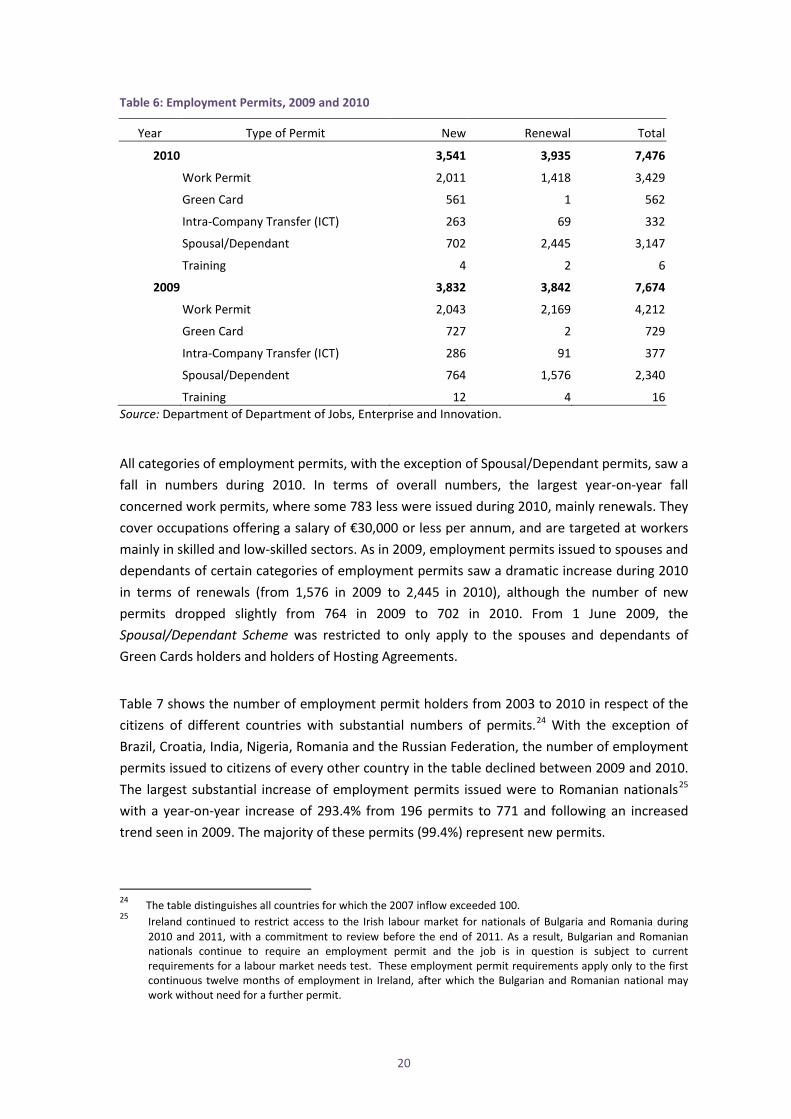
Training 12 4 16 Source: Department of Department of Jobs, Enterprise and Innovation. All categories of employment permits, with the exception of Spousal/Dependant permits, saw a fall in numbers during 2010. In terms of overall numbers, the largest year-on-year fall concerned work permits, where some 783 less were issued during 2010, mainly renewals. They cover occupations offering a salary of €30,000 or less per annum, and are targeted at workers mainly in skilled and low-skilled sectors. As in 2009, employment permits issued to spouses and dependants of certain categories of employment permits saw a dramatic increase during 2010 in terms of renewals (from 1,576 in 2009 to 2,445 in 2010), although the number of new permits dropped slightly from 764 in 2009 to 702 in 2010. From 1 June 2009, the Spousal/Dependant Scheme was restricted to only apply to the spouses and dependants of Green Cards holders and holders of Hosting Agreements.
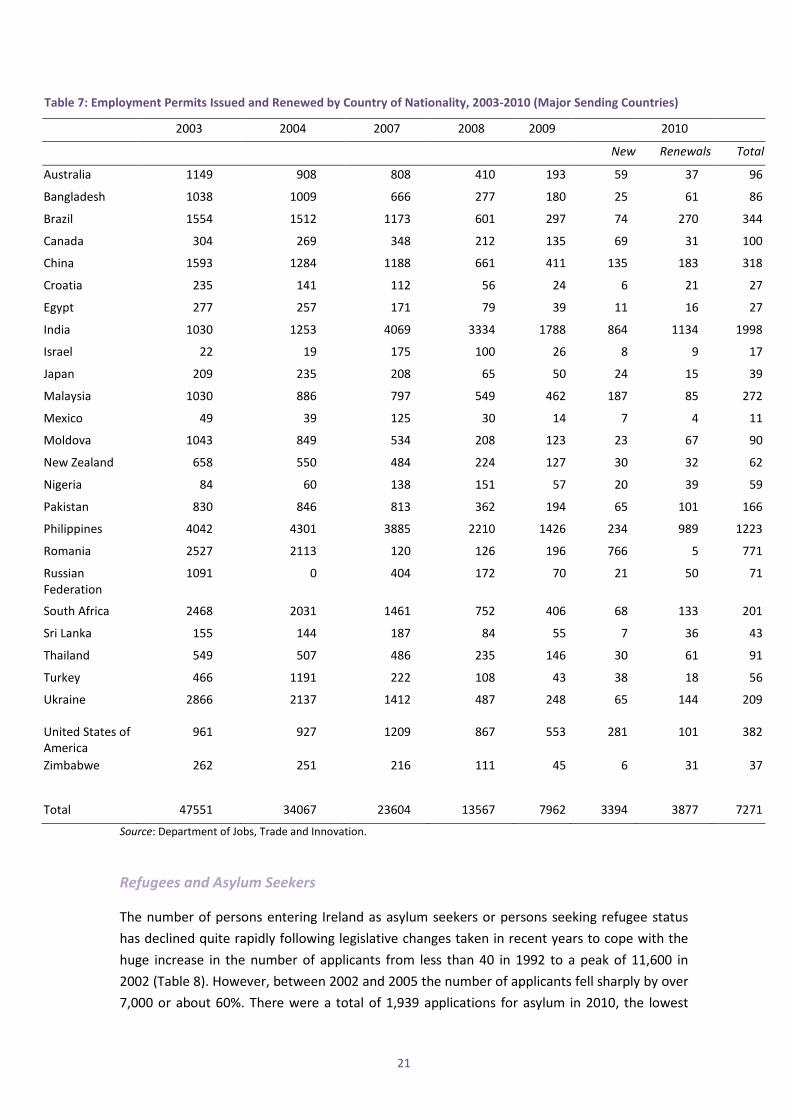
Table 7 shows the number of employment permit holders from 2003 to 2010 in respect of the citizens of different countries with substantial numbers of permits.24 With the exception of Brazil, Croatia, India, Nigeria, Romania and the Russian Federation, the number of employment permits issued to citizens of every other country in the table declined between 2009 and 2010. The largest substantial increase of employment permits issued were to Romanian nationals25 with a year-on-year increase of 293.4% from 196 permits to 771 and following an increased trend seen in 2009. The majority of these permits (99.4%) represent new permits.
24 The table distinguishes all countries for which the 2007 inflow exceeded 100. 25 Ireland continued to restrict access to the Irish labour market for nationals of Bulgaria and Romania during
2010 and 2011, with a commitment to review before the end of 2011. As a result, Bulgarian and Romanian nationals continue to require an employment permit and the job is in question is subject to current requirements for a labour market needs test. These employment permit requirements apply only to the first continuous twelve months of employment in Ireland, after which the Bulgarian and Romanian national may work without need for a further permit.
21
Table 7: Employment Permits Issued and Renewed by Country of Nationality, 2003-2010 (Major Sending Countries)
2003 2004 2007 2008 2009 2010
New Renewals Total
Australia 1149 908 808 410 193 59 37 96
Bangladesh 1038 1009 666 277 180 25 61 86
Brazil 1554 1512 1173 601 297 74 270 344
Canada 304 269 348 212 135 69 31 100
China 1593 1284 1188 661 411 135 183 318
Croatia 235 141 112 56 24 6 21 27
Egypt 277 257 171 79 39 11 16 27
India 1030 1253 4069 3334 1788 864 1134 1998
Israel 22 19 175 100 26 8 9 17
Japan 209 235 208 65 50 24 15 39
Malaysia 1030 886 797 549 462 187 85 272
Mexico 49 39 125 30 14 7 4 11
Moldova 1043 849 534 208 123 23 67 90
New Zealand 658 550 484 224 127 30 32 62
Nigeria 84 60 138 151 57 20 39 59
Pakistan 830 846 813 362 194 65 101 166
Philippines 4042 4301 3885 2210 1426 234 989 1223
Romania 2527 2113 120 126 196 766 5 771
Russian Federation
1091 0 404 172 70 21 50 71
South Africa 2468 2031 1461 752 406 68 133 201
Sri Lanka 155 144 187 84 55 7 36 43
Thailand 549 507 486 235 146 30 61 91
Turkey 466 1191 222 108 43 38 18 56
Ukraine 2866 2137 1412 487 248 65 144 209
United States of America
961 927 1209 867 553 281 101 382
Zimbabwe 262 251 216 111 45 6 31 37
Total 47551 34067 23604 13567 7962 3394 3877 7271
Source: Department of Jobs, Trade and Innovation.
Refugees and Asylum Seekers
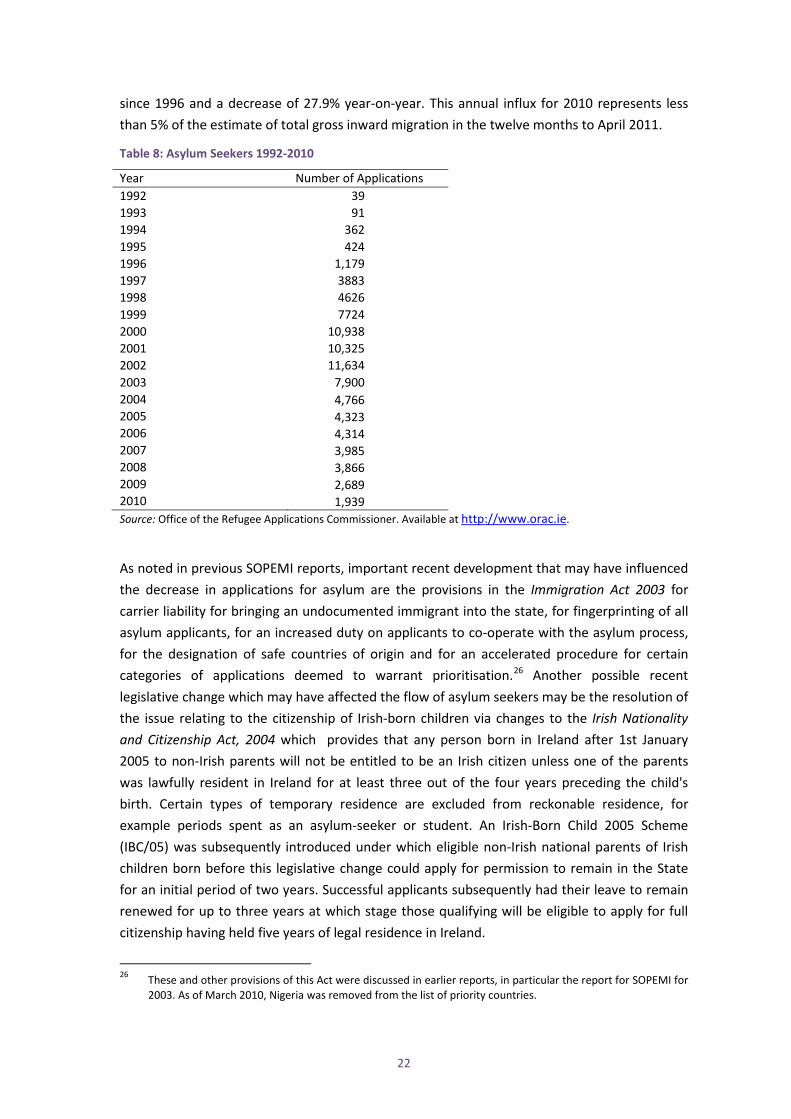
The number of persons entering Ireland as asylum seekers or persons seeking refugee status has declined quite rapidly following legislative changes taken in recent years to cope with the huge increase in the number of applicants from less than 40 in 1992 to a peak of 11,600 in 2002 (Table 8). However, between 2002 and 2005 the number of applicants fell sharply by over 7,000 or about 60%. There were a total of 1,939 applications for asylum in 2010, the lowest
22
since 1996 and a decrease of 27.9% year-on-year. This annual influx for 2010 represents less than 5% of the estimate of total gross inward migration in the twelve months to April 2011.
Table 8: Asylum Seekers 1992-2010
Year Number of Applications 1992 39 1993 91 1994 362 1995 424 1996 1,179 1997 3883 1998 4626 1999 7724 2000 10,938 2001 10,325 2002 11,634 2003 7,900 2004 4,766 2005 4,323 2006 4,314 2007 3,985 2008 3,866 2009 2,689 2010 1,939 Source: Office of the Refugee Applications Commissioner. Available at http://www.orac.ie. As noted in previous SOPEMI reports, important recent development that may have influenced the decrease in applications for asylum are the provisions in the Immigration Act 2003 for carrier liability for bringing an undocumented immigrant into the state, for fingerprinting of all asylum applicants, for an increased duty on applicants to co-operate with the asylum process, for the designation of safe countries of origin and for an accelerated procedure for certain categories of applications deemed to warrant prioritisation.26 Another possible recent legislative change which may have affected the flow of asylum seekers may be the resolution of the issue relating to the citizenship of Irish-born children via changes to the Irish Nationality and Citizenship Act, 2004 which provides that any person born in Ireland after 1st January 2005 to non-Irish parents will not be entitled to be an Irish citizen unless one of the parents was lawfully resident in Ireland for at least three out of the four years preceding the child's birth. Certain types of temporary residence are excluded from reckonable residence, for example periods spent as an asylum-seeker or student. An Irish-Born Child 2005 Scheme (IBC/05) was subsequently introduced under which eligible non-Irish national parents of Irish children born before this legislative change could apply for permission to remain in the State for an initial period of two years. Successful applicants subsequently had their leave to remain renewed for up to three years at which stage those qualifying will be eligible to apply for full citizenship having held five years of legal residence in Ireland.
26 These and other provisions of this Act were discussed in earlier reports, in particular the report for SOPEMI for
2003. As of March 2010, Nigeria was removed from the list of priority countries.
23
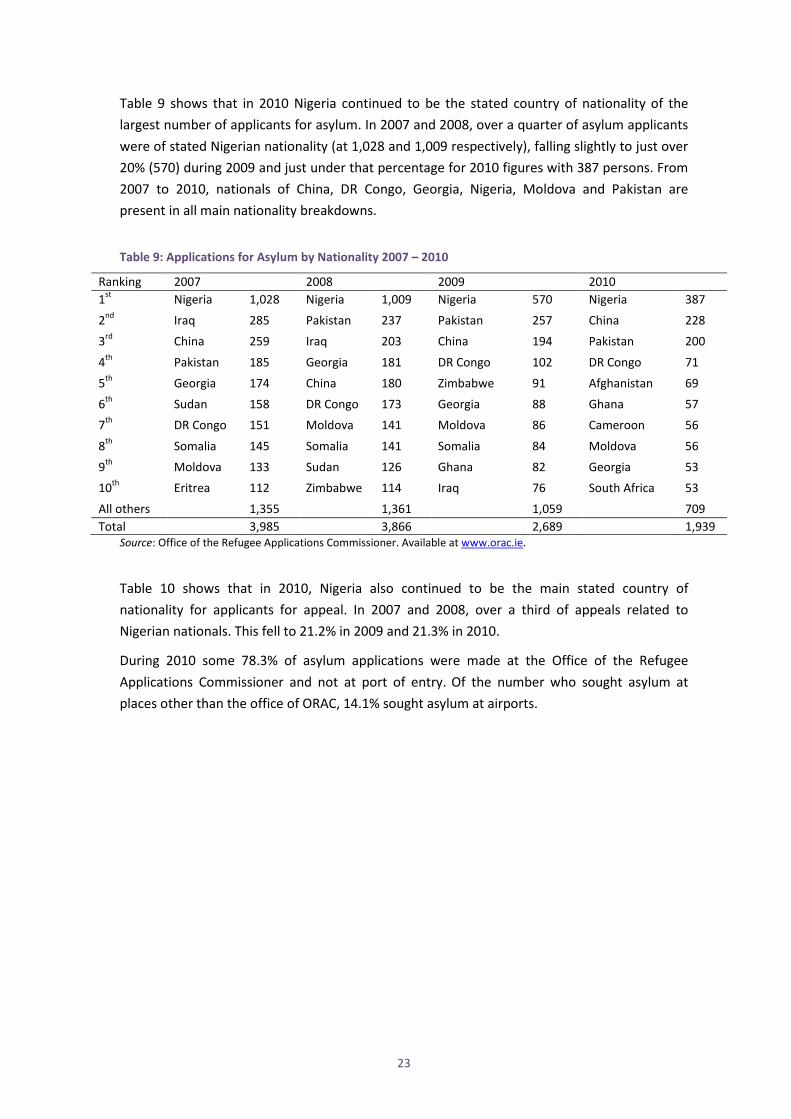
Table 9 shows that in 2010 Nigeria continued to be the stated country of nationality of the largest number of applicants for asylum. In 2007 and 2008, over a quarter of asylum applicants were of stated Nigerian nationality (at 1,028 and 1,009 respectively), falling slightly to just over 20% (570) during 2009 and just under that percentage for 2010 figures with 387 persons. From 2007 to 2010, nationals of China, DR Congo, Georgia, Nigeria, Moldova and Pakistan are present in all main nationality breakdowns.
Table 9: Applications for Asylum by Nationality 2007 – 2010
Ranking 2007 2008 2009 2010 1st Nigeria 1,028 Nigeria 1,009 Nigeria 570 Nigeria 387 2nd Iraq 285 Pakistan 237 Pakistan 257 China 228 3rd China 259 Iraq 203 China 194 Pakistan 200
4th Pakistan 185 Georgia 181 DR Congo 102 DR Congo 71 5th Georgia 174 China 180 Zimbabwe 91 Afghanistan 69 6th Sudan 158 DR Congo 173 Georgia 88 Ghana 57 7th DR Congo 151 Moldova 141 Moldova 86 Cameroon 56
8th Somalia 145 Somalia 141 Somalia 84 Moldova 56 9th Moldova 133 Sudan 126 Ghana 82 Georgia 53 10th Eritrea 112 Zimbabwe 114 Iraq 76 South Africa 53 All others 1,355 1,361 1,059 709 Total 3,985 3,866 2,689 1,939
Source: Office of the Refugee Applications Commissioner. Available at www.orac.ie.
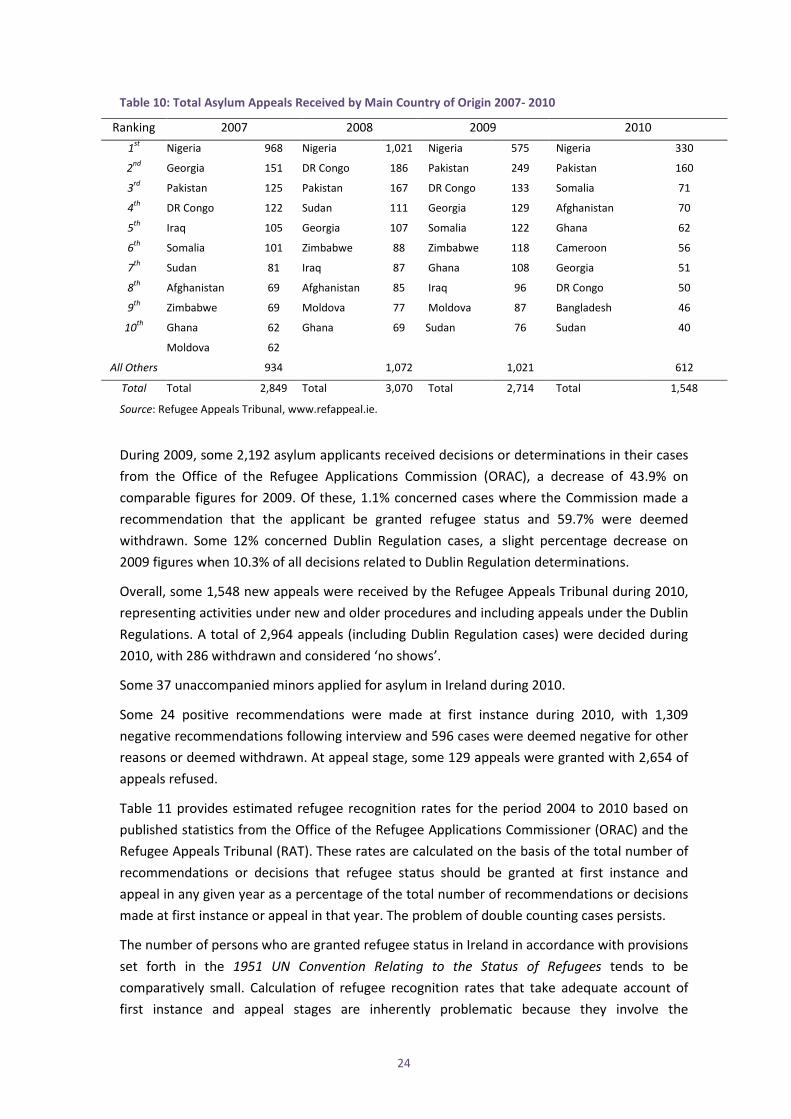
Table 10 shows that in 2010, Nigeria also continued to be the main stated country of nationality for applicants for appeal. In 2007 and 2008, over a third of appeals related to Nigerian nationals. This fell to 21.2% in 2009 and 21.3% in 2010.
During 2010 some 78.3% of asylum applications were made at the Office of the Refugee Applications Commissioner and not at port of entry. Of the number who sought asylum at places other than the office of ORAC, 14.1% sought asylum at airports.
24
Table 10: Total Asylum Appeals Received by Main Country of Origin 2007- 2010
Ranking 2007 2008 2009 2010 1st Nigeria 968 Nigeria 1,021 Nigeria 575 Nigeria 330
2nd Georgia 151 DR Congo 186 Pakistan 249 Pakistan 160
3rd Pakistan 125 Pakistan 167 DR Congo 133 Somalia 71
4th DR Congo 122 Sudan 111 Georgia 129 Afghanistan 70
5th Iraq 105 Georgia 107 Somalia 122 Ghana 62
6th Somalia 101 Zimbabwe 88 Zimbabwe 118 Cameroon 56
7th Sudan 81 Iraq 87 Ghana 108 Georgia 51
8th Afghanistan 69 Afghanistan 85 Iraq 96 DR Congo 50
9th Zimbabwe 69 Moldova 77 Moldova 87 Bangladesh 46
10th Ghana 62 Ghana 69 Sudan 76 Sudan 40
Moldova 62
All Others 934 1,072 1,021 612
Total Total 2,849 Total 3,070 Total 2,714 Total 1,548
Source: Refugee Appeals Tribunal, www.refappeal.ie.
During 2009, some 2,192 asylum applicants received decisions or determinations in their cases from the Office of the Refugee Applications Commission (ORAC), a decrease of 43.9% on comparable figures for 2009. Of these, 1.1% concerned cases where the Commission made a recommendation that the applicant be granted refugee status and 59.7% were deemed withdrawn. Some 12% concerned Dublin Regulation cases, a slight percentage decrease on 2009 figures when 10.3% of all decisions related to Dublin Regulation determinations.
Overall, some 1,548 new appeals were received by the Refugee Appeals Tribunal during 2010, representing activities under new and older procedures and including appeals under the Dublin Regulations. A total of 2,964 appeals (including Dublin Regulation cases) were decided during 2010, with 286 withdrawn and considered ‘no shows’.
Some 37 unaccompanied minors applied for asylum in Ireland during 2010.
Some 24 positive recommendations were made at first instance during 2010, with 1,309 negative recommendations following interview and 596 cases were deemed negative for other reasons or deemed withdrawn. At appeal stage, some 129 appeals were granted with 2,654 of appeals refused.
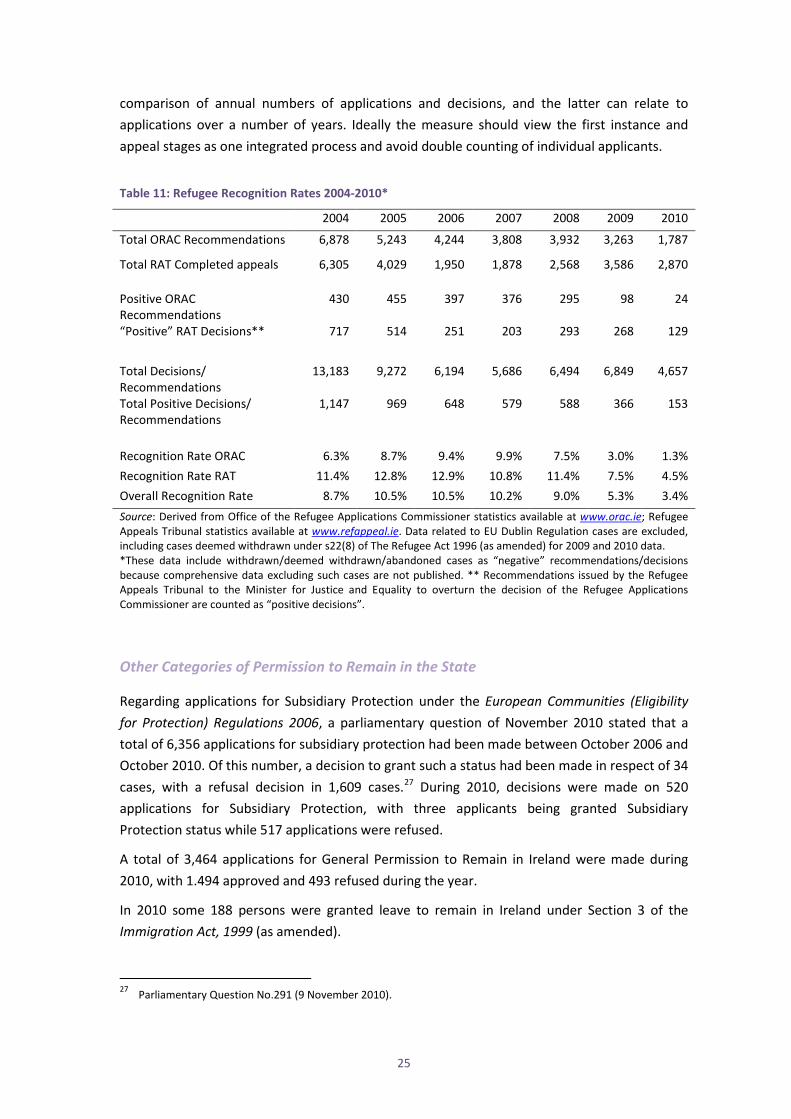
Table 11 provides estimated refugee recognition rates for the period 2004 to 2010 based on published statistics from the Office of the Refugee Applications Commissioner (ORAC) and the Refugee Appeals Tribunal (RAT). These rates are calculated on the basis of the total number of recommendations or decisions that refugee status should be granted at first instance and appeal in any given year as a percentage of the total number of recommendations or decisions made at first instance or appeal in that year. The problem of double counting cases persists.
The number of persons who are granted refugee status in Ireland in accordance with provisions set forth in the 1951 UN Convention Relating to the Status of Refugees tends to be comparatively small. Calculation of refugee recognition rates that take adequate account of first instance and appeal stages are inherently problematic because they involve the
25
comparison of annual numbers of applications and decisions, and the latter can relate to applications over a number of years. Ideally the measure should view the first instance and appeal stages as one integrated process and avoid double counting of individual applicants.
Table 11: Refugee Recognition Rates 2004-2010*
2004 2005 2006 2007 2008 2009 2010
Total ORAC Recommendations 6,878 5,243 4,244 3,808 3,932 3,263 1,787
Total RAT Completed appeals 6,305 4,029 1,950 1,878 2,568 3,586 2,870 Positive ORAC Recommendations
430 455 397 376 295 98 24
“Positive” RAT Decisions** 717 514 251 203 293 268 129 Total Decisions/ Recommendations
13,183 9,272 6,194 5,686 6,494 6,849 4,657
Total Positive Decisions/ Recommendations
1,147 969 648 579 588 366 153
Recognition Rate ORAC 6.3% 8.7% 9.4% 9.9% 7.5% 3.0% 1.3% Recognition Rate RAT 11.4% 12.8% 12.9% 10.8% 11.4% 7.5% 4.5% Overall Recognition Rate 8.7% 10.5% 10.5% 10.2% 9.0% 5.3% 3.4% Source: Derived from Office of the Refugee Applications Commissioner statistics available at www.orac.ie; Refugee Appeals Tribunal statistics available at www.refappeal.ie. Data related to EU Dublin Regulation cases are excluded, including cases deemed withdrawn under s22(8) of The Refugee Act 1996 (as amended) for 2009 and 2010 data. *These data include withdrawn/deemed withdrawn/abandoned cases as “negative” recommendations/decisions because comprehensive data excluding such cases are not published. ** Recommendations issued by the Refugee Appeals Tribunal to the Minister for Justice and Equality to overturn the decision of the Refugee Applications Commissioner are counted as “positive decisions”.
Other Categories of Permission to Remain in the State
Regarding applications for Subsidiary Protection under the European Communities (Eligibility for Protection) Regulations 2006, a parliamentary question of November 2010 stated that a total of 6,356 applications for subsidiary protection had been made between October 2006 and October 2010. Of this number, a decision to grant such a status had been made in respect of 34 cases, with a refusal decision in 1,609 cases.27 During 2010, decisions were made on 520 applications for Subsidiary Protection, with three applicants being granted Subsidiary Protection status while 517 applications were refused.
A total of 3,464 applications for General Permission to Remain in Ireland were made during 2010, with 1.494 approved and 493 refused during the year.
In 2010 some 188 persons were granted leave to remain in Ireland under Section 3 of the Immigration Act, 1999 (as amended).
27 Parliamentary Question No.291 (9 November 2010).
26
Ireland continued to participate in the Resettlement Programme for vulnerable refugees in conjunction with UNHCR during 2010 with an annual quota of 200 persons. Refugees are selected for resettlement during the quota year but in many cases may not arrive in Ireland until the following year. During 2010 some 20 refugees were admitted to Ireland under the Resettlement Programme with the majority approved for resettlement during 2010 (17 cases). An additional three Burmese-Karen nationals approved during 2009 were resettled during the year. Some 28 persons were approved or are pending approval under the Resettlement Programme for 2010, with the majority from Iraq (22 persons) followed by Ethiopian nationals (5 persons) and Syrian nationals (1 person). All of the 2010 resettlement figures involved medical cases.
Following on from significant case law and the subsequent introduction of the European Communities (Free Movement of Persons) (Amendment) Regulations 2008 (S.I. No. 310 of 2008) in 2008, during 2010 there were 1,900 applications for residence in Ireland by spouses of an EU national under the EU Free Movement Directive 2004/38/EC. This represents a slight decrease on corresponding figures during 2009 when 2,070 applications were submitted. The largest main applicant country during 2010 continued to be Pakistan, with almost 20% of all applications.
During 2010, 69 incidents of alleged human trafficking involving 78 victims were reported to An Garda Síochána.
Family Reunification
The Department of Justice and Equality received 323 applications for family reunification in 2010, a year-on-year decrease of 28.2%.
27
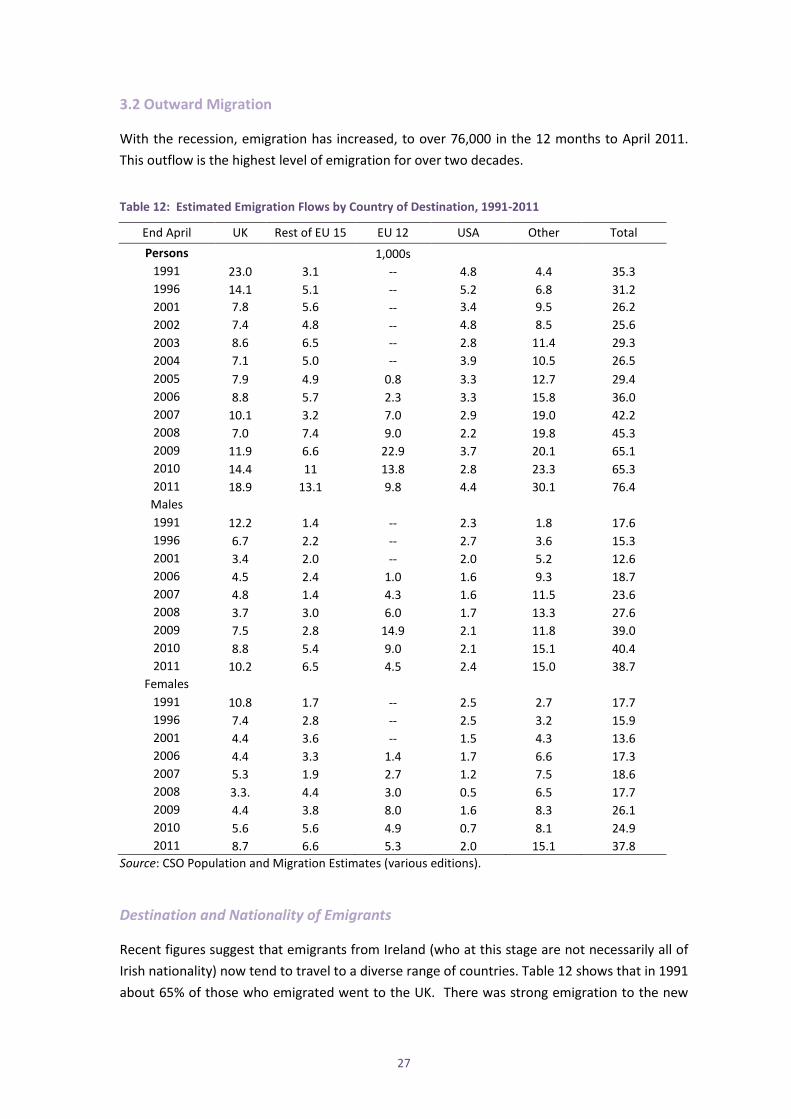
3.2 Outward Migration
With the recession, emigration has increased, to over 76,000 in the 12 months to April 2011. This outflow is the highest level of emigration for over two decades.
Table 12: Estimated Emigration Flows by Country of Destination, 1991-2011
End April UK Rest of EU 15 EU 12 USA Other Total Persons 1,000s
1991 23.0 3.1 -- 4.8 4.4 35.3 1996 14.1 5.1 -- 5.2 6.8 31.2 2001 7.8 5.6 -- 3.4 9.5 26.2 2002 7.4 4.8 -- 4.8 8.5 25.6 2003 8.6 6.5 -- 2.8 11.4 29.3 2004 7.1 5.0 -- 3.9 10.5 26.5 2005 7.9 4.9 0.8 3.3 12.7 29.4 2006 8.8 5.7 2.3 3.3 15.8 36.0 2007 10.1 3.2 7.0 2.9 19.0 42.2 2008 7.0 7.4 9.0 2.2 19.8 45.3 2009 11.9 6.6 22.9 3.7 20.1 65.1 2010 14.4 11 13.8 2.8 23.3 65.3 2011 18.9 13.1 9.8 4.4 30.1 76.4 Males 1991 12.2 1.4 -- 2.3 1.8 17.6 1996 6.7 2.2 -- 2.7 3.6 15.3 2001 3.4 2.0 -- 2.0 5.2 12.6 2006 4.5 2.4 1.0 1.6 9.3 18.7 2007 4.8 1.4 4.3 1.6 11.5 23.6 2008 3.7 3.0 6.0 1.7 13.3 27.6 2009 7.5 2.8 14.9 2.1 11.8 39.0 2010 8.8 5.4 9.0 2.1 15.1 40.4 2011 10.2 6.5 4.5 2.4 15.0 38.7
Females 1991 10.8 1.7 -- 2.5 2.7 17.7 1996 7.4 2.8 -- 2.5 3.2 15.9 2001 4.4 3.6 -- 1.5 4.3 13.6 2006 4.4 3.3 1.4 1.7 6.6 17.3 2007 5.3 1.9 2.7 1.2 7.5 18.6 2008 3.3. 4.4 3.0 0.5 6.5 17.7 2009 4.4 3.8 8.0 1.6 8.3 26.1 2010 5.6 5.6 4.9 0.7 8.1 24.9 2011 8.7 6.6 5.3 2.0 15.1 37.8
Source: CSO Population and Migration Estimates (various editions).
Destination and Nationality of Emigrants
Recent figures suggest that emigrants from Ireland (who at this stage are not necessarily all of Irish nationality) now tend to travel to a diverse range of countries. Table 12 shows that in 1991 about 65% of those who emigrated went to the UK. There was strong emigration to the new
28
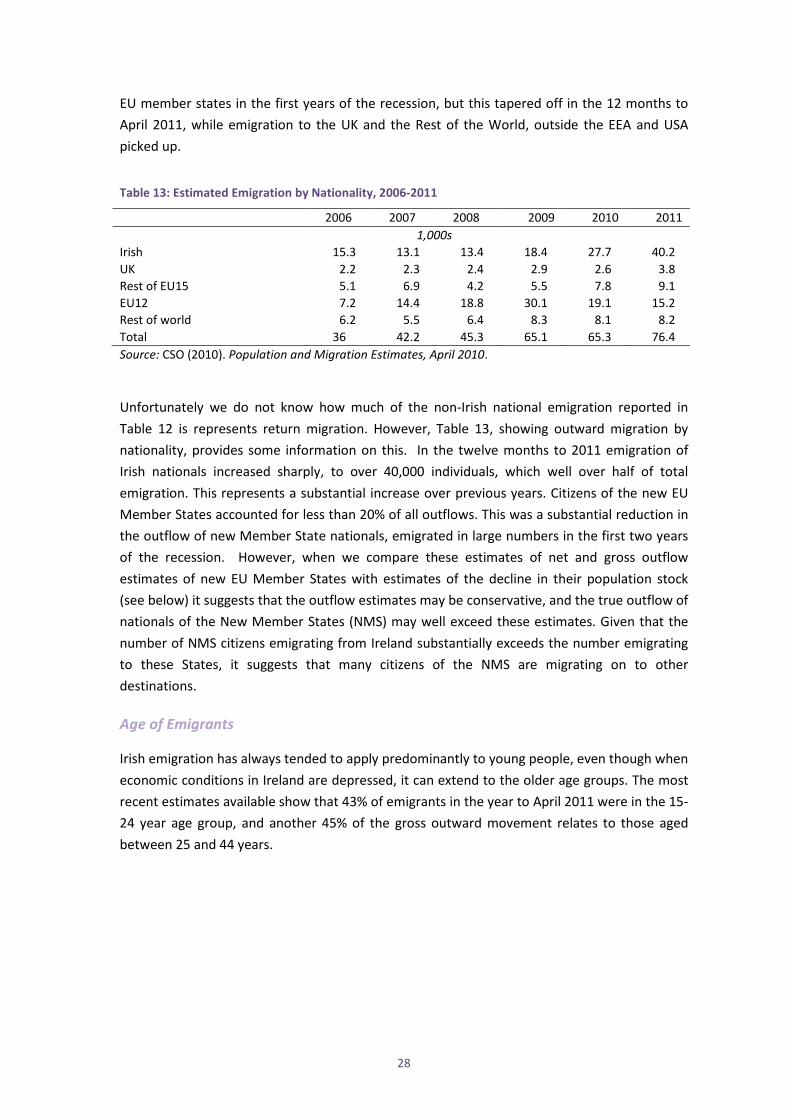
EU member states in the first years of the recession, but this tapered off in the 12 months to April 2011, while emigration to the UK and the Rest of the World, outside the EEA and USA picked up.
Table 13: Estimated Emigration by Nationality, 2006-2011
2006 2007 2008 2009 2010 2011 1,000s Irish 15.3 13.1 13.4 18.4 27.7 40.2 UK 2.2 2.3 2.4 2.9 2.6 3.8 Rest of EU15 5.1 6.9 4.2 5.5 7.8 9.1 EU12 7.2 14.4 18.8 30.1 19.1 15.2 Rest of world 6.2 5.5 6.4 8.3 8.1 8.2 Total 36 42.2 45.3 65.1 65.3 76.4 Source: CSO (2010). Population and Migration Estimates, April 2010. Unfortunately we do not know how much of the non-Irish national emigration reported in Table 12 is represents return migration. However, Table 13, showing outward migration by nationality, provides some information on this. In the twelve months to 2011 emigration of Irish nationals increased sharply, to over 40,000 individuals, which well over half of total emigration. This represents a substantial increase over previous years. Citizens of the new EU Member States accounted for less than 20% of all outflows. This was a substantial reduction in the outflow of new Member State nationals, emigrated in large numbers in the first two years of the recession. However, when we compare these estimates of net and gross outflow estimates of new EU Member States with estimates of the decline in their population stock (see below) it suggests that the outflow estimates may be conservative, and the true outflow of nationals of the New Member States (NMS) may well exceed these estimates. Given that the number of NMS citizens emigrating from Ireland substantially exceeds the number emigrating to these States, it suggests that many citizens of the NMS are migrating on to other destinations.
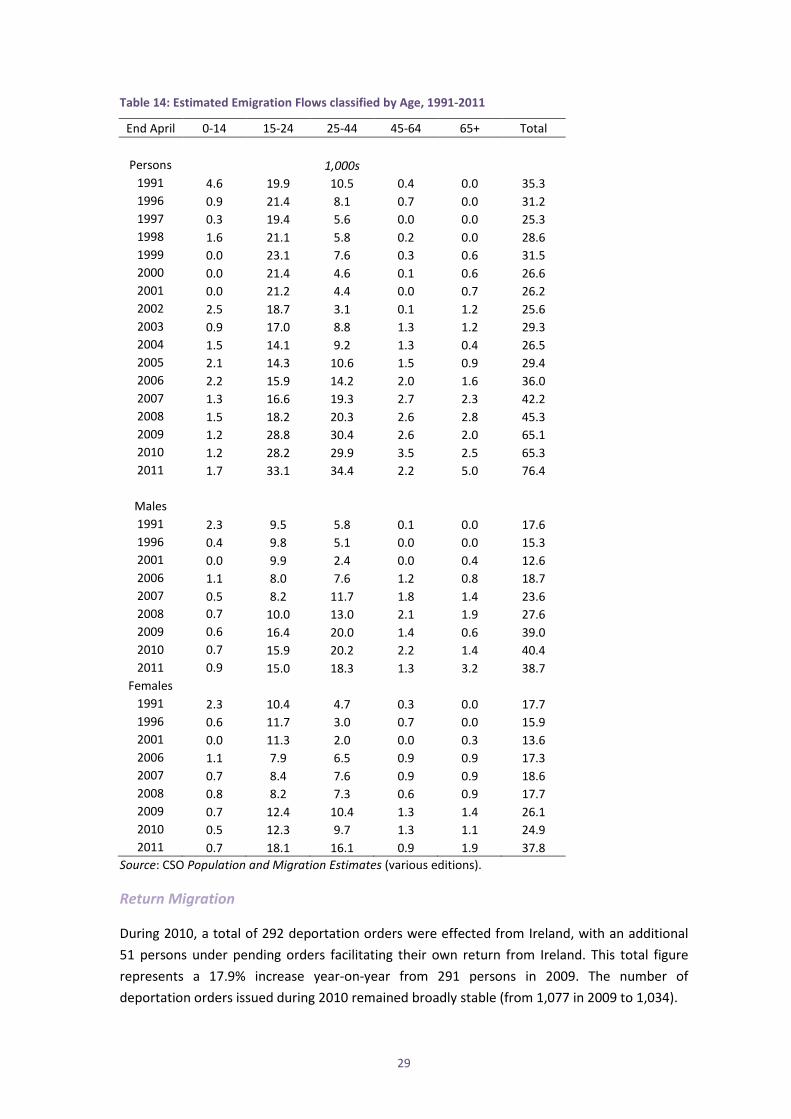
Age of Emigrants
Irish emigration has always tended to apply predominantly to young people, even though when economic conditions in Ireland are depressed, it can extend to the older age groups. The most recent estimates available show that 43% of emigrants in the year to April 2011 were in the 15-24 year age group, and another 45% of the gross outward movement relates to those aged between 25 and 44 years.
29
Table 14: Estimated Emigration Flows classified by Age, 1991-2011
End April 0-14 15-24 25-44 45-64 65+ Total
Persons 1,000s 1991 4.6 19.9 10.5 0.4 0.0 35.3 1996 0.9 21.4 8.1 0.7 0.0 31.2 1997 0.3 19.4 5.6 0.0 0.0 25.3 1998 1.6 21.1 5.8 0.2 0.0 28.6 1999 0.0 23.1 7.6 0.3 0.6 31.5 2000 0.0 21.4 4.6 0.1 0.6 26.6 2001 0.0 21.2 4.4 0.0 0.7 26.2 2002 2.5 18.7 3.1 0.1 1.2 25.6 2003 0.9 17.0 8.8 1.3 1.2 29.3 2004 1.5 14.1 9.2 1.3 0.4 26.5 2005 2.1 14.3 10.6 1.5 0.9 29.4 2006 2.2 15.9 14.2 2.0 1.6 36.0 2007 1.3 16.6 19.3 2.7 2.3 42.2 2008 1.5 18.2 20.3 2.6 2.8 45.3 2009 1.2 28.8 30.4 2.6 2.0 65.1 2010 1.2 28.2 29.9 3.5 2.5 65.3 2011 1.7 33.1 34.4 2.2 5.0 76.4
Males 1991 2.3 9.5 5.8 0.1 0.0 17.6 1996 0.4 9.8 5.1 0.0 0.0 15.3 2001 0.0 9.9 2.4 0.0 0.4 12.6 2006 1.1 8.0 7.6 1.2 0.8 18.7 2007 0.5 8.2 11.7 1.8 1.4 23.6 2008 0.7 10.0 13.0 2.1 1.9 27.6 2009 0.6 16.4 20.0 1.4 0.6 39.0 2010 0.7 15.9 20.2 2.2 1.4 40.4 2011 0.9 15.0 18.3 1.3 3.2 38.7
Females 1991 2.3 10.4 4.7 0.3 0.0 17.7 1996 0.6 11.7 3.0 0.7 0.0 15.9 2001 0.0 11.3 2.0 0.0 0.3 13.6 2006 1.1 7.9 6.5 0.9 0.9 17.3 2007 0.7 8.4 7.6 0.9 0.9 18.6 2008 0.8 8.2 7.3 0.6 0.9 17.7 2009 0.7 12.4 10.4 1.3 1.4 26.1 2010 0.5 12.3 9.7 1.3 1.1 24.9 2011 0.7 18.1 16.1 0.9 1.9 37.8
Source: CSO Population and Migration Estimates (various editions).
Return Migration
During 2010, a total of 292 deportation orders were effected from Ireland, with an additional 51 persons under pending orders facilitating their own return from Ireland. This total figure represents a 17.9% increase year-on-year from 291 persons in 2009. The number of deportation orders issued during 2010 remained broadly stable (from 1,077 in 2009 to 1,034).
30
Some 461 persons were assisted to return home voluntarily, either via the International Organization for Migration (IOM) mission in Ireland (376) or via governmental administrative assistance (85). This represents a decrease of 14.5% on 2009 figures when 539 voluntary returns took place.
Some 24 persons were removed to other EU States in accordance with the provisions of the European Communities (Free Movement of Persons) Regulations 2006 and 2008, a slight decrease on 2009 figures when 29 persons were removed.
A total of 142 transfers under the Dublin Regulation to other EU member states took place during 2010, a decrease of 41.6% on 2009 figures when 243 transfers took place.
4. Population Trends
Overall Trends
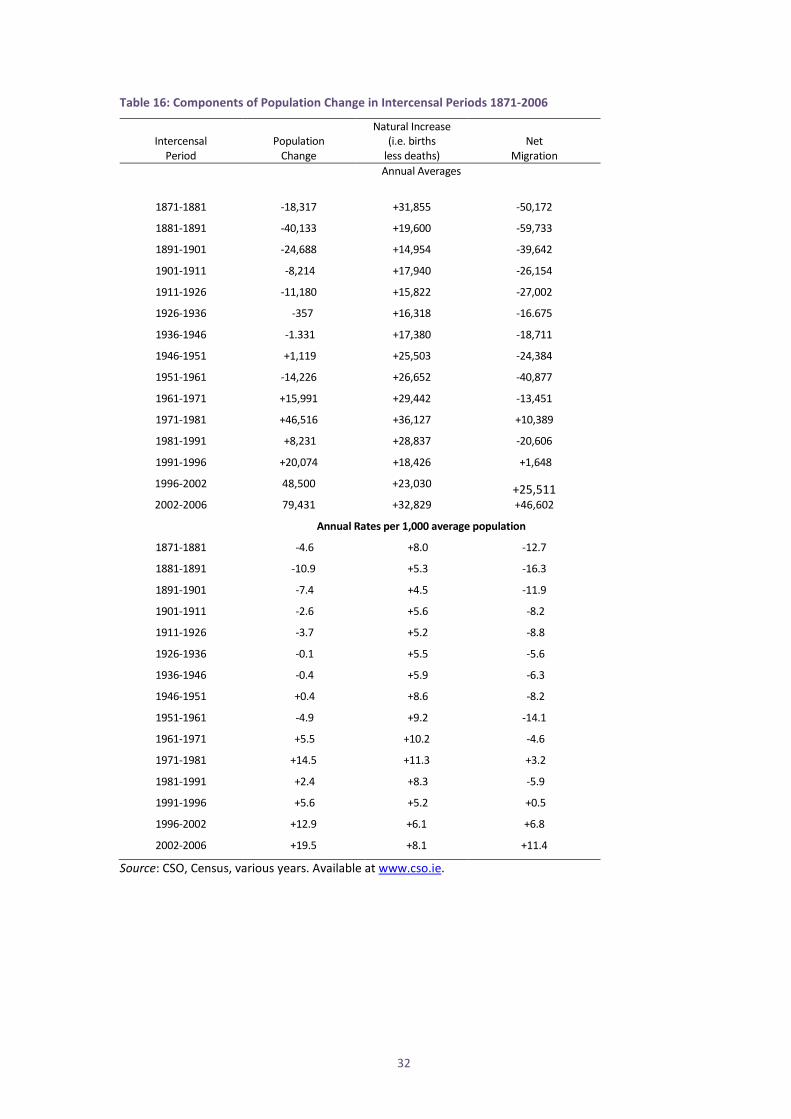
The history of population and migration trends in Ireland since the early part of the nineteenth century has been outlined in earlier SOPEMI Reports. Tables 15 and 16 show historical population and migration statistics extending back to the middle of the last century. Table 2 provides annual average figures for the components of population change for intercensal periods over the time span from 1871 to 2006. This shows how both net migration and the natural increase in the population have influenced long-term demographic changes in Ireland.
The population of Ireland continued to increase during 2010, to an estimated 4,484,300 in April 2011. It should be noted that the preliminary population estimate derived from the 2011 Census was 4,580,000, some 97,000 greater than these estimates. This under-estimate of the population may be due to underestimation of either the true population in 2006 or of subsequent inward migration. It is planned to publish revised population estimates for the years 2007-2011 following further analysis of the 2011 Census.
Table 1 shows annual gross and net migration, between 1987 and 2011.28 This period was characterised by considerable volatility in regard to migration flows. There were substantial population losses due to emigration in the late 1980s: the annual outflow peaked at over 70,000 in 1989. However the position stabilised in the early 1990s when migration inflows and outflows were more or less in balance. Inward migration grew steadily since the mid-1990s, to well over 100,000 per annum in 2006 and 2007. However, in the context of the economic crisis, immigration declined to 31,000 in the twelve months to April 2010 and increased slightly to 42,300 in the twelve months to April 2011. Migratory outflows have also increased in recent years, as returning immigrants have added their numbers to emigrating Irish nationals. In the twelve months to April 2011, the inflow of 42,000 was offset by an estimated outflow of over 76,000, resulting in net outward migration of 34,100.
28 Migration and population data are estimated for twelve month periods to April of each year.
31
Foreign Nationals in Ireland
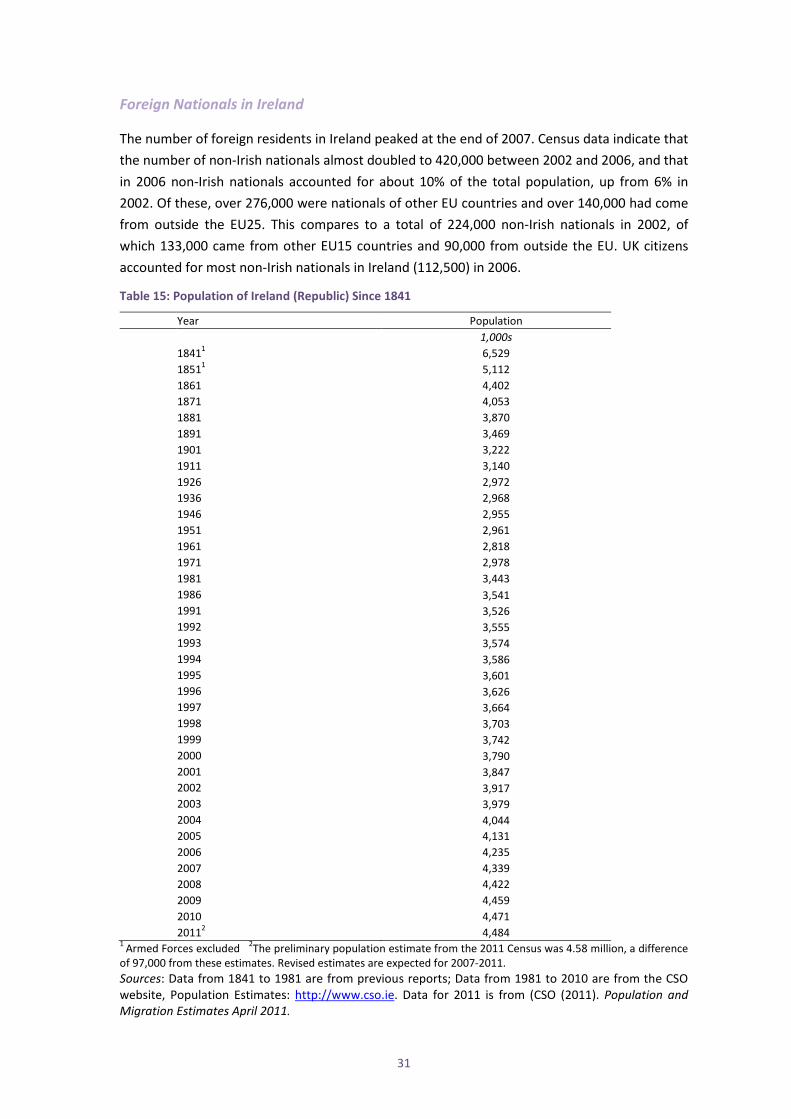
The number of foreign residents in Ireland peaked at the end of 2007. Census data indicate that the number of non-Irish nationals almost doubled to 420,000 between 2002 and 2006, and that in 2006 non-Irish nationals accounted for about 10% of the total population, up from 6% in 2002. Of these, over 276,000 were nationals of other EU countries and over 140,000 had come from outside the EU25. This compares to a total of 224,000 non-Irish nationals in 2002, of which 133,000 came from other EU15 countries and 90,000 from outside the EU. UK citizens accounted for most non-Irish nationals in Ireland (112,500) in 2006.
Table 15: Population of Ireland (Republic) Since 1841
Year Population 1,000s 18411 6,529 18511 5,112 1861 4,402 1871 4,053 1881 3,870 1891 3,469 1901 3,222 1911 3,140 1926 2,972 1936 2,968 1946 2,955 1951 2,961 1961 2,818 1971 2,978 1981 3,443 1986 3,541 1991 3,526 1992 3,555 1993 3,574 1994 3,586 1995 3,601 1996 3,626 1997 3,664 1998 3,703 1999 3,742 2000 3,790 2001 3,847 2002 3,917 2003 3,979 2004 4,044 2005 4,131 2006 4,235 2007 4,339 2008 4,422 2009 4,459 2010 4,471 20112 4,484 1 Armed Forces excluded 2The preliminary population estimate from the 2011 Census was 4.58 million, a difference of 97,000 from these estimates. Revised estimates are expected for 2007-2011. Sources: Data from 1841 to 1981 are from previous reports; Data from 1981 to 2010 are from the CSO website, Population Estimates: http://www.cso.ie. Data for 2011 is from (CSO (2011). Population and Migration Estimates April 2011.
32
Table 16: Components of Population Change in Intercensal Periods 1871-2006
Intercensal
Period
Population
Change
Natural Increase (i.e. births
less deaths)
Net
Migration Annual Averages
1871-1881 -18,317 +31,855 -50,172
1881-1891 -40,133 +19,600 -59,733
1891-1901 -24,688 +14,954 -39,642
1901-1911 -8,214 +17,940 -26,154
1911-1926 -11,180 +15,822 -27,002
1926-1936 -357 +16,318 -16.675
1936-1946 -1.331 +17,380 -18,711
1946-1951 +1,119 +25,503 -24,384
1951-1961 -14,226 +26,652 -40,877
1961-1971 +15,991 +29,442 -13,451
1971-1981 +46,516 +36,127 +10,389
1981-1991 +8,231 +28,837 -20,606
1991-1996 +20,074 +18,426 +1,648
1996-2002 48,500 +23,030 +25,511 2002-2006 79,431 +32,829 +46,602
Annual Rates per 1,000 average population
1871-1881 -4.6 +8.0 -12.7
1881-1891 -10.9 +5.3 -16.3
1891-1901 -7.4 +4.5 -11.9
1901-1911 -2.6 +5.6 -8.2
1911-1926 -3.7 +5.2 -8.8
1926-1936 -0.1 +5.5 -5.6
1936-1946 -0.4 +5.9 -6.3
1946-1951 +0.4 +8.6 -8.2
1951-1961 -4.9 +9.2 -14.1
1961-1971 +5.5 +10.2 -4.6
1971-1981 +14.5 +11.3 +3.2
1981-1991 +2.4 +8.3 -5.9
1991-1996 +5.6 +5.2 +0.5
1996-2002 +12.9 +6.1 +6.8
2002-2006 +19.5 +8.1 +11.4
Source: CSO, Census, various years. Available at www.cso.ie.
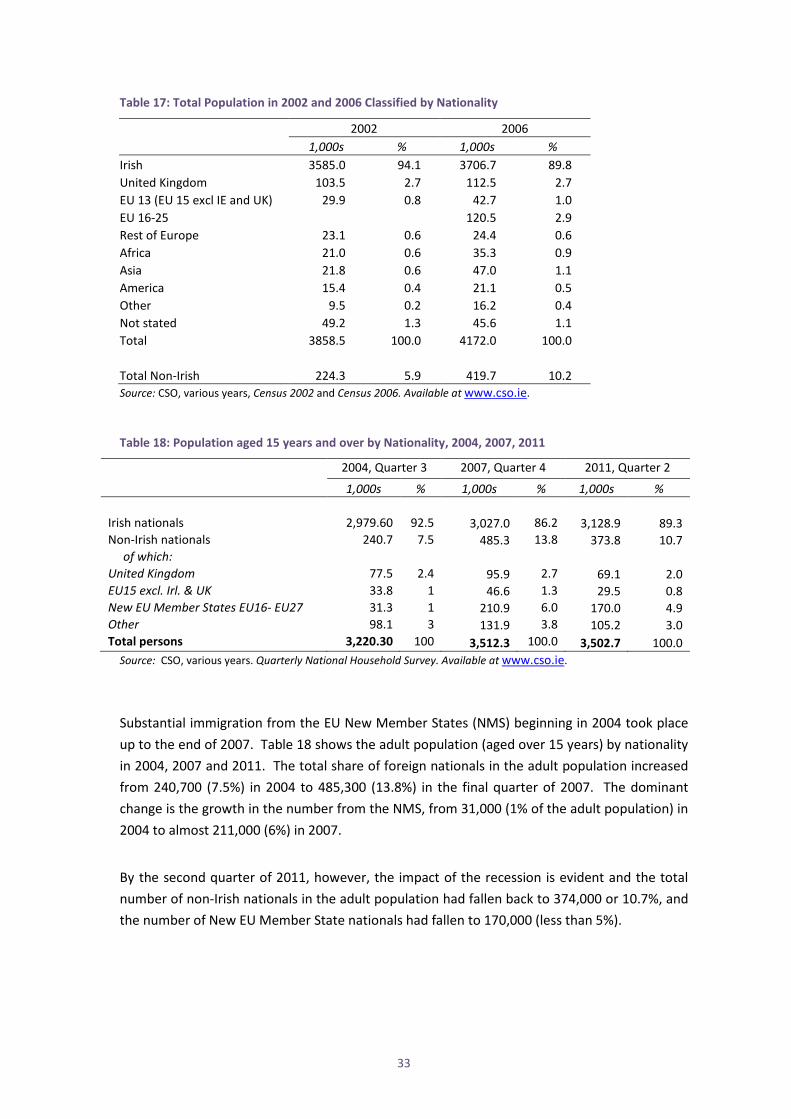
33
Table 17: Total Population in 2002 and 2006 Classified by Nationality
2002 2006 1,000s % 1,000s % Irish 3585.0 94.1 3706.7 89.8 United Kingdom 103.5 2.7 112.5 2.7 EU 13 (EU 15 excl IE and UK) 29.9 0.8 42.7 1.0 EU 16-25 120.5 2.9 Rest of Europe 23.1 0.6 24.4 0.6 Africa 21.0 0.6 35.3 0.9 Asia 21.8 0.6 47.0 1.1 America 15.4 0.4 21.1 0.5 Other 9.5 0.2 16.2 0.4 Not stated 49.2 1.3 45.6 1.1 Total 3858.5 100.0 4172.0 100.0 Total Non-Irish 224.3 5.9 419.7 10.2 Source: CSO, various years, Census 2002 and Census 2006. Available at www.cso.ie. Table 18: Population aged 15 years and over by Nationality, 2004, 2007, 2011
2004, Quarter 3 2007, Quarter 4 2011, Quarter 2 1,000s % 1,000s % 1,000s % Irish nationals 2,979.60 92.5 3,027.0 86.2 3,128.9 89.3 Non-Irish nationals 240.7 7.5 485.3 13.8 373.8 10.7 of which: United Kingdom 77.5 2.4 95.9 2.7 69.1 2.0 EU15 excl. Irl. & UK 33.8 1 46.6 1.3 29.5 0.8 New EU Member States EU16- EU27 31.3 1 210.9 6.0 170.0 4.9 Other 98.1 3 131.9 3.8 105.2 3.0 Total persons 3,220.30 100 3,512.3 100.0 3,502.7 100.0
Source: CSO, various years. Quarterly National Household Survey. Available at www.cso.ie. Substantial immigration from the EU New Member States (NMS) beginning in 2004 took place up to the end of 2007. Table 18 shows the adult population (aged over 15 years) by nationality in 2004, 2007 and 2011. The total share of foreign nationals in the adult population increased from 240,700 (7.5%) in 2004 to 485,300 (13.8%) in the final quarter of 2007. The dominant change is the growth in the number from the NMS, from 31,000 (1% of the adult population) in 2004 to almost 211,000 (6%) in 2007.
By the second quarter of 2011, however, the impact of the recession is evident and the total number of non-Irish nationals in the adult population had fallen back to 374,000 or 10.7%, and the number of New EU Member State nationals had fallen to 170,000 (less than 5%).
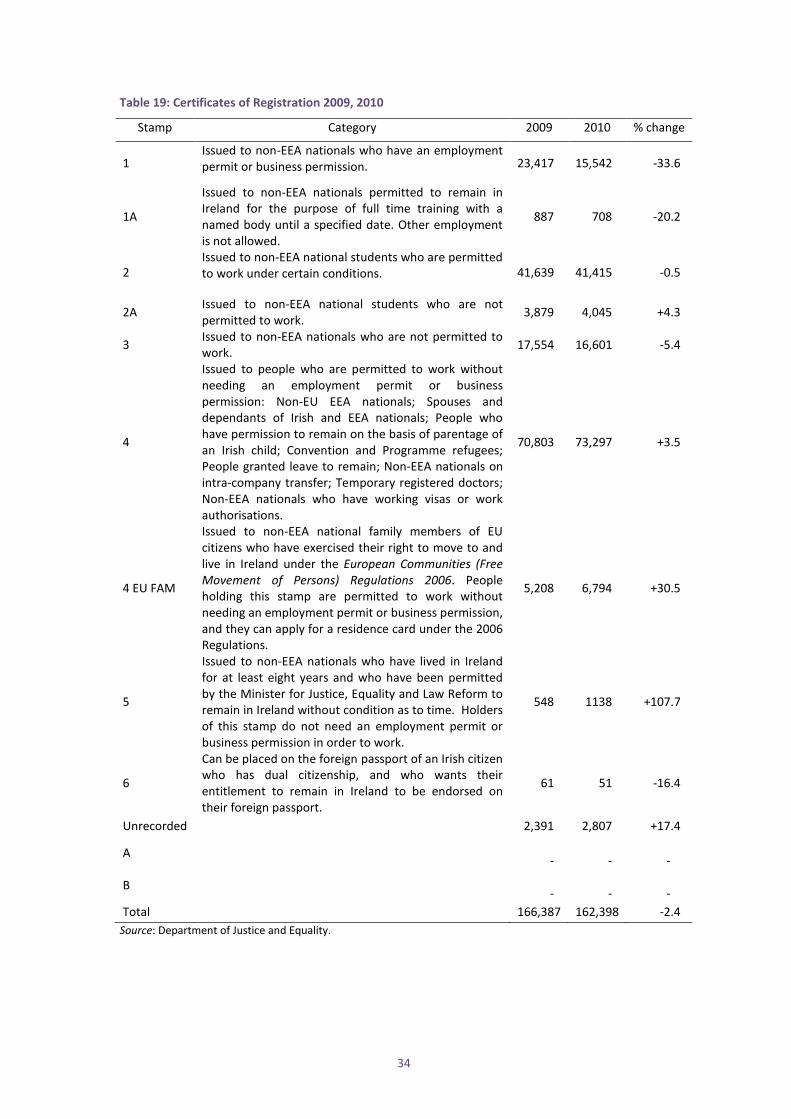
34
Table 19: Certificates of Registration 2009, 2010
Stamp Category 2009 2010 % change
1 Issued to non-EEA nationals who have an employment permit or business permission. 23,417 15,542 -33.6
1A
Issued to non-EEA nationals permitted to remain in Ireland for the purpose of full time training with a named body until a specified date. Other employment is not allowed.
887 708 -20.2
2 Issued to non-EEA national students who are permitted to work under certain conditions. 41,639 41,415 -0.5
2A Issued to non-EEA national students who are not permitted to work. 3,879 4,045 +4.3
3 Issued to non-EEA nationals who are not permitted to work. 17,554 16,601 -5.4
4
Issued to people who are permitted to work without needing an employment permit or business permission: Non-EU EEA nationals; Spouses and dependants of Irish and EEA nationals; People who have permission to remain on the basis of parentage of an Irish child; Convention and Programme refugees; People granted leave to remain; Non-EEA nationals on intra-company transfer; Temporary registered doctors; Non-EEA nationals who have working visas or work authorisations.
70,803 73,297 +3.5
4 EU FAM
Issued to non-EEA national family members of EU citizens who have exercised their right to move to and live in Ireland under the European Communities (Free Movement of Persons) Regulations 2006. People holding this stamp are permitted to work without needing an employment permit or business permission, and they can apply for a residence card under the 2006 Regulations.
5,208 6,794 +30.5
5
Issued to non-EEA nationals who have lived in Ireland for at least eight years and who have been permitted by the Minister for Justice, Equality and Law Reform to remain in Ireland without condition as to time. Holders of this stamp do not need an employment permit or business permission in order to work.
548 1138 +107.7
6
Can be placed on the foreign passport of an Irish citizen who has dual citizenship, and who wants their entitlement to remain in Ireland to be endorsed on their foreign passport.
61 51 -16.4
Unrecorded 2,391 2,807 +17.4
A - - -
B - - - Total 166,387 162,398 -2.4
Source: Department of Justice and Equality.
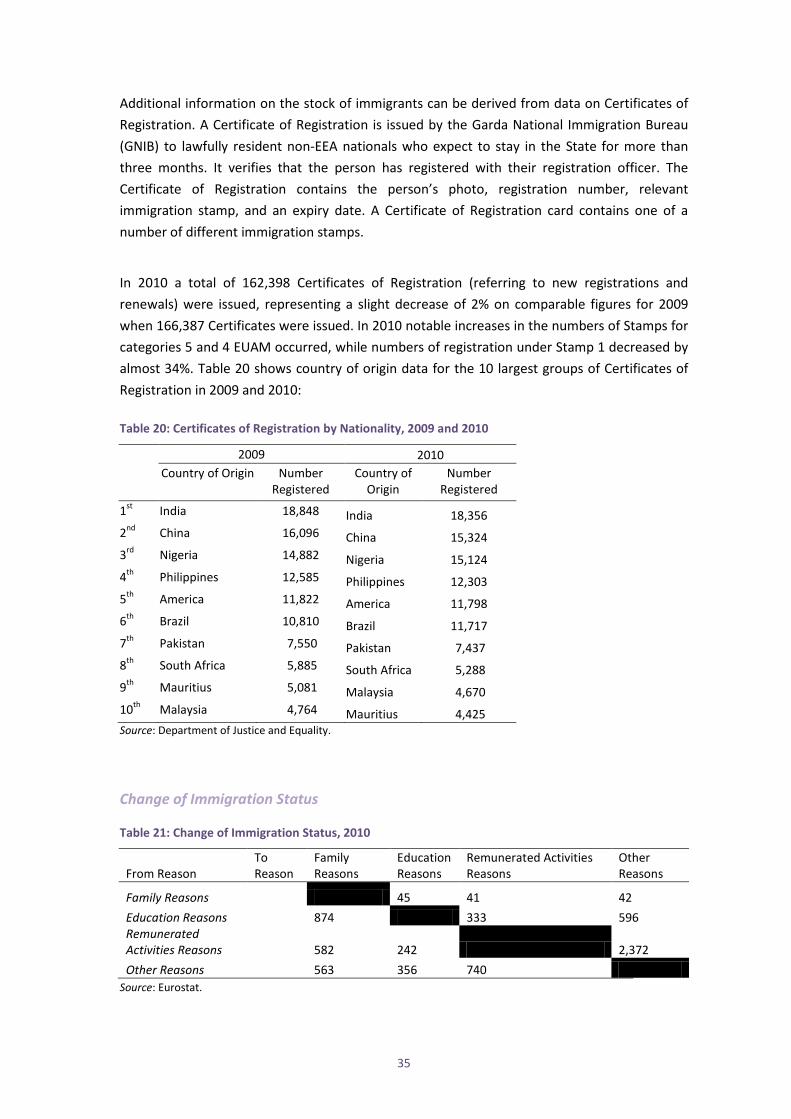
35
Additional information on the stock of immigrants can be derived from data on Certificates of Registration. A Certificate of Registration is issued by the Garda National Immigration Bureau (GNIB) to lawfully resident non-EEA nationals who expect to stay in the State for more than three months. It verifies that the person has registered with their registration officer. The Certificate of Registration contains the person’s photo, registration number, relevant immigration stamp, and an expiry date. A Certificate of Registration card contains one of a number of different immigration stamps.
In 2010 a total of 162,398 Certificates of Registration (referring to new registrations and renewals) were issued, representing a slight decrease of 2% on comparable figures for 2009 when 166,387 Certificates were issued. In 2010 notable increases in the numbers of Stamps for categories 5 and 4 EUAM occurred, while numbers of registration under Stamp 1 decreased by almost 34%. Table 20 shows country of origin data for the 10 largest groups of Certificates of Registration in 2009 and 2010: Table 20: Certificates of Registration by Nationality, 2009 and 2010
2009 2010 Country of Origin Number
Registered Country of
Origin Number
Registered
1st India 18,848 India 18,356 2nd China 16,096 China 15,324 3rd Nigeria 14,882 Nigeria 15,124 4th Philippines 12,585 Philippines 12,303 5th America 11,822 America 11,798 6th Brazil 10,810 Brazil 11,717 7th Pakistan 7,550 Pakistan 7,437 8th South Africa 5,885 South Africa 5,288 9th Mauritius 5,081 Malaysia 4,670 10th Malaysia 4,764 Mauritius 4,425 Source: Department of Justice and Equality.
Change of Immigration Status
Table 21: Change of Immigration Status, 2010
From Reason To Reason
Family Reasons
Education Reasons
Remunerated Activities Reasons
Other Reasons
Family Reasons
45 41 42 Education Reasons
874 333 596
Remunerated Activities Reasons
582 242 2,372
Other Reasons
563 356 740 Source: Eurostat.
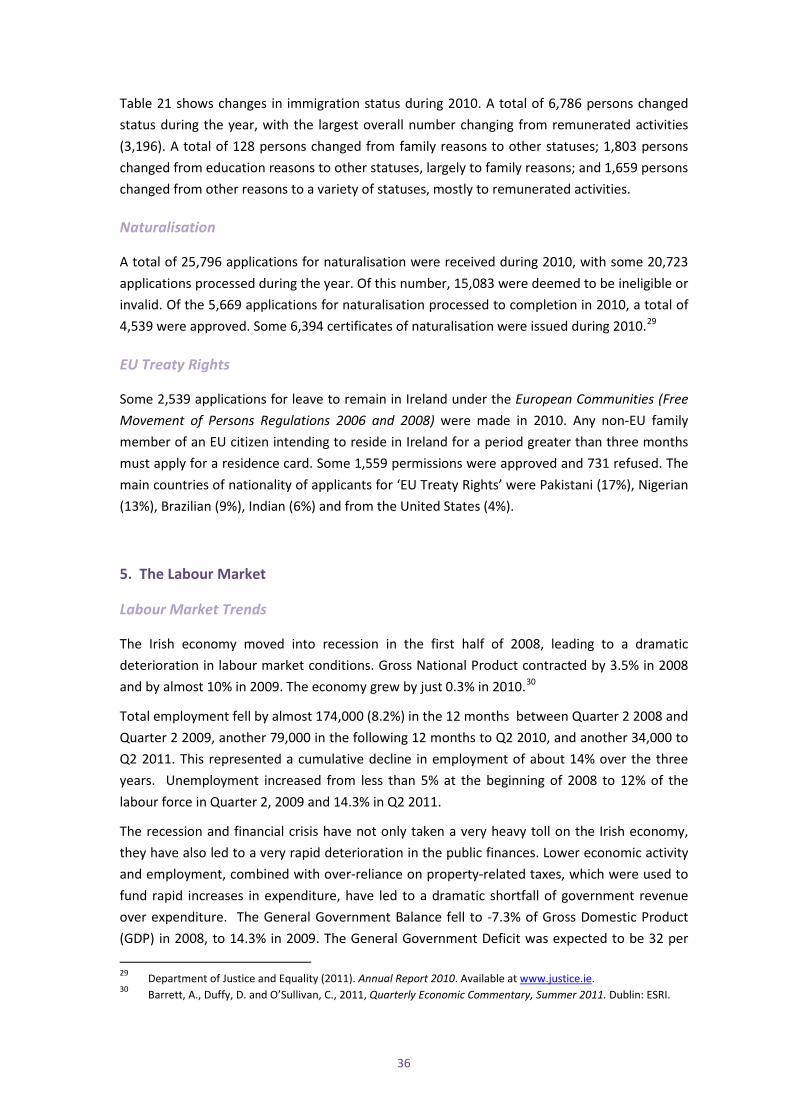
36
Table 21 shows changes in immigration status during 2010. A total of 6,786 persons changed status during the year, with the largest overall number changing from remunerated activities (3,196). A total of 128 persons changed from family reasons to other statuses; 1,803 persons changed from education reasons to other statuses, largely to family reasons; and 1,659 persons changed from other reasons to a variety of statuses, mostly to remunerated activities.
Naturalisation
A total of 25,796 applications for naturalisation were received during 2010, with some 20,723 applications processed during the year. Of this number, 15,083 were deemed to be ineligible or invalid. Of the 5,669 applications for naturalisation processed to completion in 2010, a total of 4,539 were approved. Some 6,394 certificates of naturalisation were issued during 2010.29
EU Treaty Rights
Some 2,539 applications for leave to remain in Ireland under the European Communities (Free Movement of Persons Regulations 2006 and 2008) were made in 2010. Any non-EU family member of an EU citizen intending to reside in Ireland for a period greater than three months must apply for a residence card. Some 1,559 permissions were approved and 731 refused. The main countries of nationality of applicants for ‘EU Treaty Rights’ were Pakistani (17%), Nigerian (13%), Brazilian (9%), Indian (6%) and from the United States (4%).
5. The Labour Market
Labour Market Trends
The Irish economy moved into recession in the first half of 2008, leading to a dramatic deterioration in labour market conditions. Gross National Product contracted by 3.5% in 2008 and by almost 10% in 2009. The economy grew by just 0.3% in 2010.30
Total employment fell by almost 174,000 (8.2%) in the 12 months between Quarter 2 2008 and Quarter 2 2009, another 79,000 in the following 12 months to Q2 2010, and another 34,000 to Q2 2011. This represented a cumulative decline in employment of about 14% over the three years. Unemployment increased from less than 5% at the beginning of 2008 to 12% of the labour force in Quarter 2, 2009 and 14.3% in Q2 2011.
The recession and financial crisis have not only taken a very heavy toll on the Irish economy, they have also led to a very rapid deterioration in the public finances. Lower economic activity and employment, combined with over-reliance on property-related taxes, which were used to fund rapid increases in expenditure, have led to a dramatic shortfall of government revenue over expenditure. The General Government Balance fell to -7.3% of Gross Domestic Product (GDP) in 2008, to 14.3% in 2009. The General Government Deficit was expected to be 32 per 29 Department of Justice and Equality (2011). Annual Report 2010. Available at www.justice.ie. 30 Barrett, A., Duffy, D. and O’Sullivan, C., 2011, Quarterly Economic Commentary, Summer 2011. Dublin: ESRI.
37
cent of GDP in 2010, a truly dramatic figure. Of course, about two-thirds of this is a one-off extraordinary item related to the banking bailout. The long-run implications for the economy and the public finances of government actions to resolve the banking crisis through the National Management Asset Management Agency (NAMA) remain uncertain. In response to the severe fiscal crisis, government has introduced a series of expenditure cuts as well as tax increases and a levy on public sector incomes. Further severe austerity measures over the four years to 2014 are planned in conjunction with the bailout by the IMF and ECB.
In this context, according to the annual Population and Migration Estimates, April 2011, published by the Central Statistics Office (CSO), immigration declined from a high of 110,000 in the twelve months to April 2007 to 342,300 in the year to April 2011. Emigration increased to over 76,000 in the twelve months to April 2011. As a result Ireland registered net outward migration, of 7,800 in the 12 months to April 2009, for the first year since 1995. Net outward migration is estimated at 34,100 in the year to April 2011 in the Population and Migration Estimates, April 2010. There is reason to suspect, however, that this is an underestimate of net outward migration. Another source of data on migration, the Quarterly National Household Survey (QNHS), which is also published by the CSO, suggests that the number of non-national adults living in Ireland fell by 52,800 between Q2 2009 and Q2 2010. The figures in the Population and Migration Estimates refer to the full population, whereas the QNHS counts people over the age of 15 years.31 According to the Population and Migration Estimates, the net outflow of 34,500 was made up of a net outflow of 14,400 Irish nationals and 20,100 non-nationals. However, if we compare the estimates, the discrepancy between the two sources (20,100 versus 52,800) is suggestive of a higher net outflow relative to the level reported in the Population and Migration Estimates. Given the economic climate it is likely that the underestimate of net migration is due to an undercount of outward migration.
Table 22 shows annual figures for employment, unemployment and net external migration over an extended period from 1983 to 2011. The time series suggests a strong association between Irish migration patterns and economic conditions, particularly in the labour market. For example, the global downturn that occurred in the early 1980s had a particularly severe impact on the Irish economy, resulting in the country languishing in recession until well into the second half of the decade.32 By 1986 the unemployment rate had reached over 17 per cent. This created a sharp divergence in labour market conditions between Ireland and other countries, particularly the UK, which led to a sharp rise in emigration. The net outflows were substantial at the end of the decade - almost 45,000 in 1988/89, or 13.0 per thousand of the population.
This position stabilised in the early 1990s. Unemployment decreased and the net migratory balance hovered close to zero. The emigration option was less attractive because of less favourable labour market conditions abroad. As a result, the pressure of labour force expansion caused unemployment in Ireland to rise. This position was compounded by a sizeable return flow of former emigrants. Even though employment did not actually decline in Ireland during
31 It is also the case that the time period covered differs slightly. 32 Earlier SOPEMI reports contain more detailed descriptions of these events.
38
this period, by April 1993 the unemployment rate had increased again to nearly 16 per cent compared with 13 per cent in 1990.
The economic circumstances in Ireland in the period 1995-2000 improved. GNP growth averaged almost 9 per cent and, as Table 22 shows, the estimated increase in total employment in the same period totalled 389,000, or over 5 per cent on an annual average basis. Even though the labour force continued to expand throughout this period, this occurred at a much slower pace, and by April 2000 the unemployment rate had fallen to 4.3 per cent. This unprecedented employment growth eventually gave rise to significant labour shortages across many areas of economic activity, both skilled and unskilled. One consequence of this was a rapid increase in the influx of foreign workers. As the population figures have already indicated, these came not only from the EU15 (the citizens of which enjoy freedom of movement within Member States under EU law) but also from a wide range of other countries, mainly under the terms of the existing work permit system.
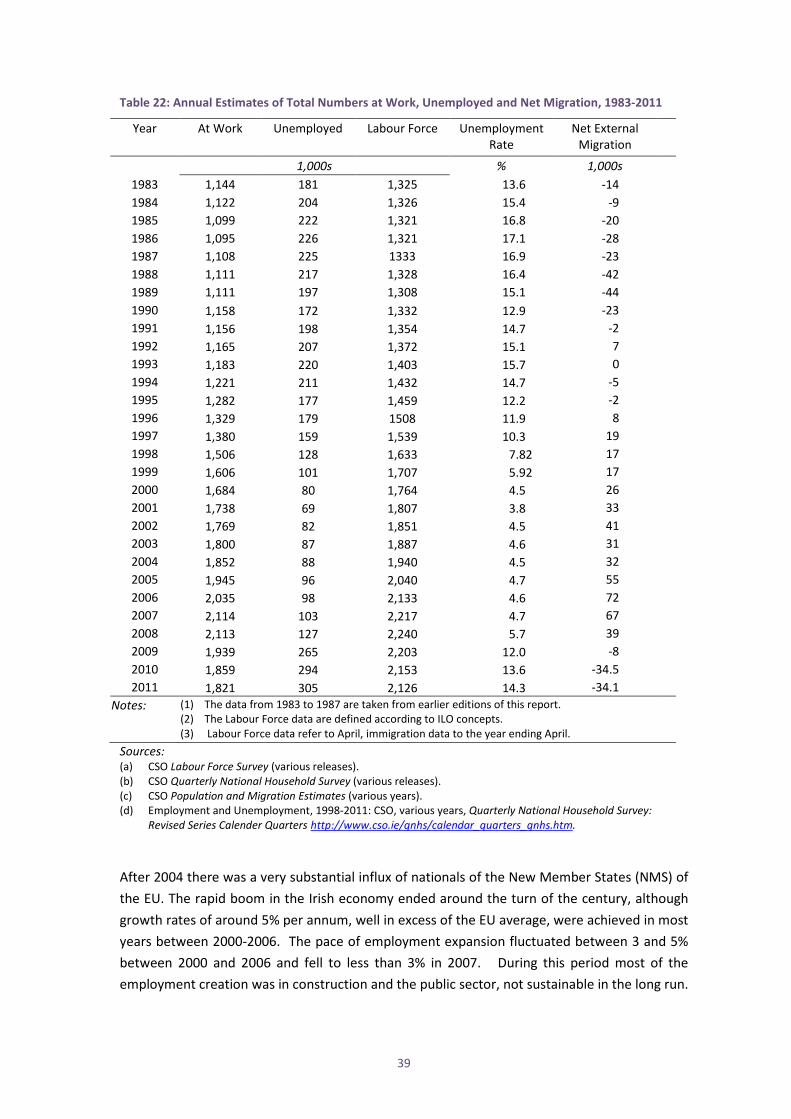
39
Table 22: Annual Estimates of Total Numbers at Work, Unemployed and Net Migration, 1983-2011
Year At Work Unemployed Labour Force Unemployment Rate
Net External Migration
1,000s % 1,000s 1983 1,144 181 1,325 13.6 -14 1984 1,122 204 1,326 15.4 -9 1985 1,099 222 1,321 16.8 -20 1986 1,095 226 1,321 17.1 -28 1987 1,108 225 1333 16.9 -23 1988 1,111 217 1,328 16.4 -42 1989 1,111 197 1,308 15.1 -44 1990 1,158 172 1,332 12.9 -23 1991 1,156 198 1,354 14.7 -2 1992 1,165 207 1,372 15.1 7 1993 1,183 220 1,403 15.7 0 1994 1,221 211 1,432 14.7 -5 1995 1,282 177 1,459 12.2 -2 1996 1,329 179 1508 11.9 8 1997 1,380 159 1,539 10.3 19 1998 1,506 128 1,633 7.82 17 1999 1,606 101 1,707 5.92 17 2000 1,684 80 1,764 4.5 26 2001 1,738 69 1,807 3.8 33 2002 1,769 82 1,851 4.5 41 2003 1,800 87 1,887 4.6 31 2004 1,852 88 1,940 4.5 32 2005 1,945 96 2,040 4.7 55 2006 2,035 98 2,133 4.6 72 2007 2,114 103 2,217 4.7 67 2008 2,113 127 2,240 5.7 39 2009 1,939 265 2,203 12.0 -8 2010 1,859 294 2,153 13.6 -34.5 2011 1,821 305 2,126 14.3 -34.1
Notes: (1) The data from 1983 to 1987 are taken from earlier editions of this report. (2) The Labour Force data are defined according to ILO concepts. (3) Labour Force data refer to April, immigration data to the year ending April.
Sources: (a) CSO Labour Force Survey (various releases). (b) CSO Quarterly National Household Survey (various releases). (c) CSO Population and Migration Estimates (various years). (d) Employment and Unemployment, 1998-2011: CSO, various years, Quarterly National Household Survey: Revised Series Calender Quarters http://www.cso.ie/qnhs/calendar_quarters_qnhs.htm. After 2004 there was a very substantial influx of nationals of the New Member States (NMS) of the EU. The rapid boom in the Irish economy ended around the turn of the century, although growth rates of around 5% per annum, well in excess of the EU average, were achieved in most years between 2000-2006. The pace of employment expansion fluctuated between 3 and 5% between 2000 and 2006 and fell to less than 3% in 2007. During this period most of the employment creation was in construction and the public sector, not sustainable in the long run.
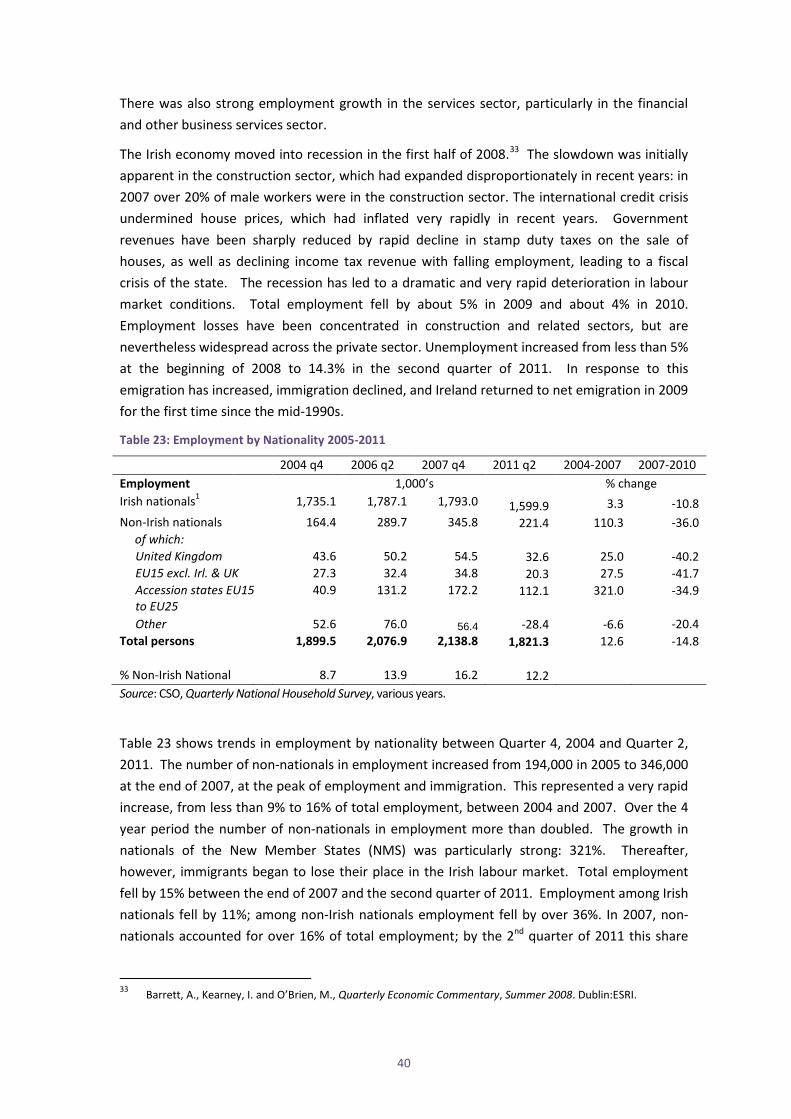
40
There was also strong employment growth in the services sector, particularly in the financial and other business services sector.
The Irish economy moved into recession in the first half of 2008.33 The slowdown was initially apparent in the construction sector, which had expanded disproportionately in recent years: in 2007 over 20% of male workers were in the construction sector. The international credit crisis undermined house prices, which had inflated very rapidly in recent years. Government revenues have been sharply reduced by rapid decline in stamp duty taxes on the sale of houses, as well as declining income tax revenue with falling employment, leading to a fiscal crisis of the state. The recession has led to a dramatic and very rapid deterioration in labour market conditions. Total employment fell by about 5% in 2009 and about 4% in 2010. Employment losses have been concentrated in construction and related sectors, but are nevertheless widespread across the private sector. Unemployment increased from less than 5% at the beginning of 2008 to 14.3% in the second quarter of 2011. In response to this emigration has increased, immigration declined, and Ireland returned to net emigration in 2009 for the first time since the mid-1990s.
Table 23: Employment by Nationality 2005-2011
2004 q4 2006 q2 2007 q4 2011 q2 2004-2007 2007-2010 Employment 1,000’s % change Irish nationals1 1,735.1 1,787.1 1,793.0 1,599.9 3.3 -10.8 Non-Irish nationals 164.4 289.7 345.8 221.4 110.3 -36.0 of which: United Kingdom 43.6 50.2 54.5 32.6 25.0 -40.2 EU15 excl. Irl. & UK 27.3 32.4 34.8 20.3 27.5 -41.7 Accession states EU15
to EU25 40.9 131.2 172.2 112.1 321.0 -34.9
Other 52.6 76.0 56.4 -28.4 -6.6 -20.4 Total persons 1,899.5 2,076.9 2,138.8 1,821.3 12.6 -14.8 % Non-Irish National 8.7 13.9 16.2 12.2 Source: CSO, Quarterly National Household Survey, various years. Table 23 shows trends in employment by nationality between Quarter 4, 2004 and Quarter 2, 2011. The number of non-nationals in employment increased from 194,000 in 2005 to 346,000 at the end of 2007, at the peak of employment and immigration. This represented a very rapid increase, from less than 9% to 16% of total employment, between 2004 and 2007. Over the 4 year period the number of non-nationals in employment more than doubled. The growth in nationals of the New Member States (NMS) was particularly strong: 321%. Thereafter, however, immigrants began to lose their place in the Irish labour market. Total employment fell by 15% between the end of 2007 and the second quarter of 2011. Employment among Irish nationals fell by 11%; among non-Irish nationals employment fell by over 36%. In 2007, non-nationals accounted for over 16% of total employment; by the 2nd quarter of 2011 this share
33 Barrett, A., Kearney, I. and O’Brien, M., Quarterly Economic Commentary, Summer 2008. Dublin:ESRI.
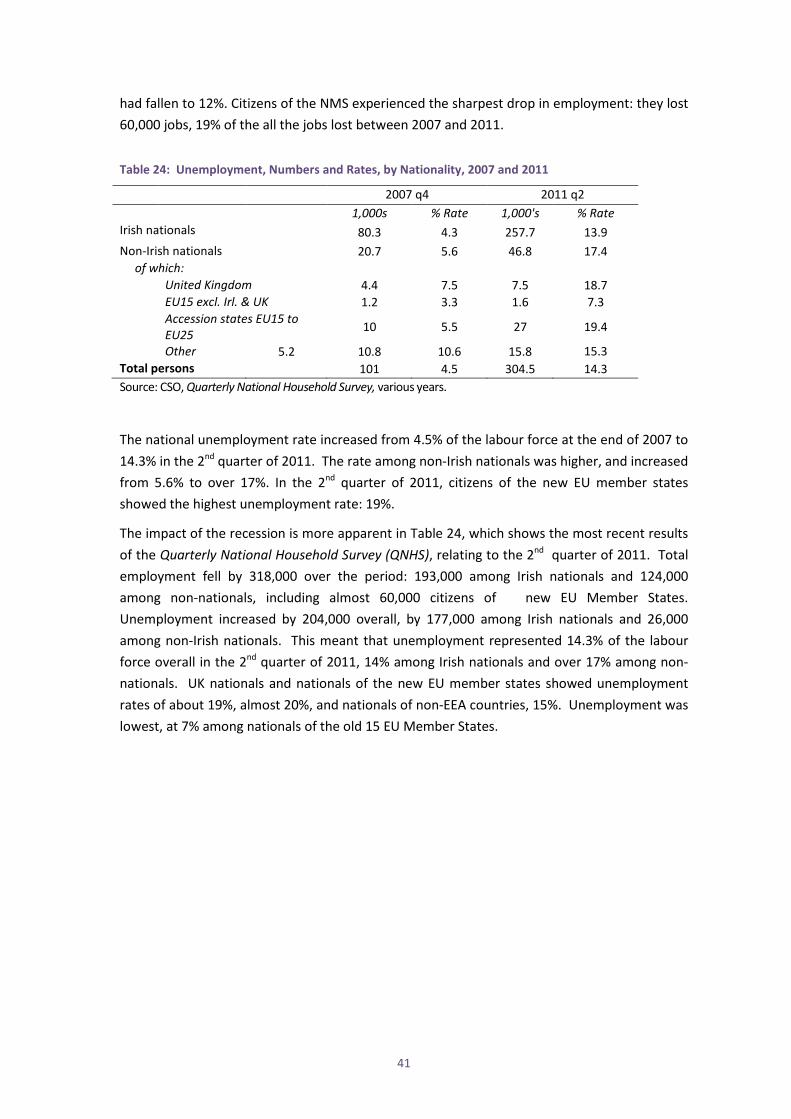
41
had fallen to 12%. Citizens of the NMS experienced the sharpest drop in employment: they lost 60,000 jobs, 19% of the all the jobs lost between 2007 and 2011.
Table 24: Unemployment, Numbers and Rates, by Nationality, 2007 and 2011
2007 q4 2011 q2 1,000s % Rate 1,000's % Rate Irish nationals 80.3 4.3 257.7 13.9 Non-Irish nationals 20.7 5.6 46.8 17.4 of which: United Kingdom 4.4 7.5 7.5 18.7 EU15 excl. Irl. & UK 1.2 3.3 1.6 7.3 Accession states EU15 to
EU25 10 5.5 27 19.4
Other 5.2 10.8 10.6 15.8 15.3 Total persons 101 4.5 304.5 14.3 Source: CSO, Quarterly National Household Survey, various years. The national unemployment rate increased from 4.5% of the labour force at the end of 2007 to 14.3% in the 2nd quarter of 2011. The rate among non-Irish nationals was higher, and increased from 5.6% to over 17%. In the 2nd quarter of 2011, citizens of the new EU member states showed the highest unemployment rate: 19%.
The impact of the recession is more apparent in Table 24, which shows the most recent results of the Quarterly National Household Survey (QNHS), relating to the 2nd quarter of 2011. Total employment fell by 318,000 over the period: 193,000 among Irish nationals and 124,000 among non-nationals, including almost 60,000 citizens of new EU Member States. Unemployment increased by 204,000 overall, by 177,000 among Irish nationals and 26,000 among non-Irish nationals. This meant that unemployment represented 14.3% of the labour force overall in the 2nd quarter of 2011, 14% among Irish nationals and over 17% among non-nationals. UK nationals and nationals of the new EU member states showed unemployment rates of about 19%, almost 20%, and nationals of non-EEA countries, 15%. Unemployment was lowest, at 7% among nationals of the old 15 EU Member States.
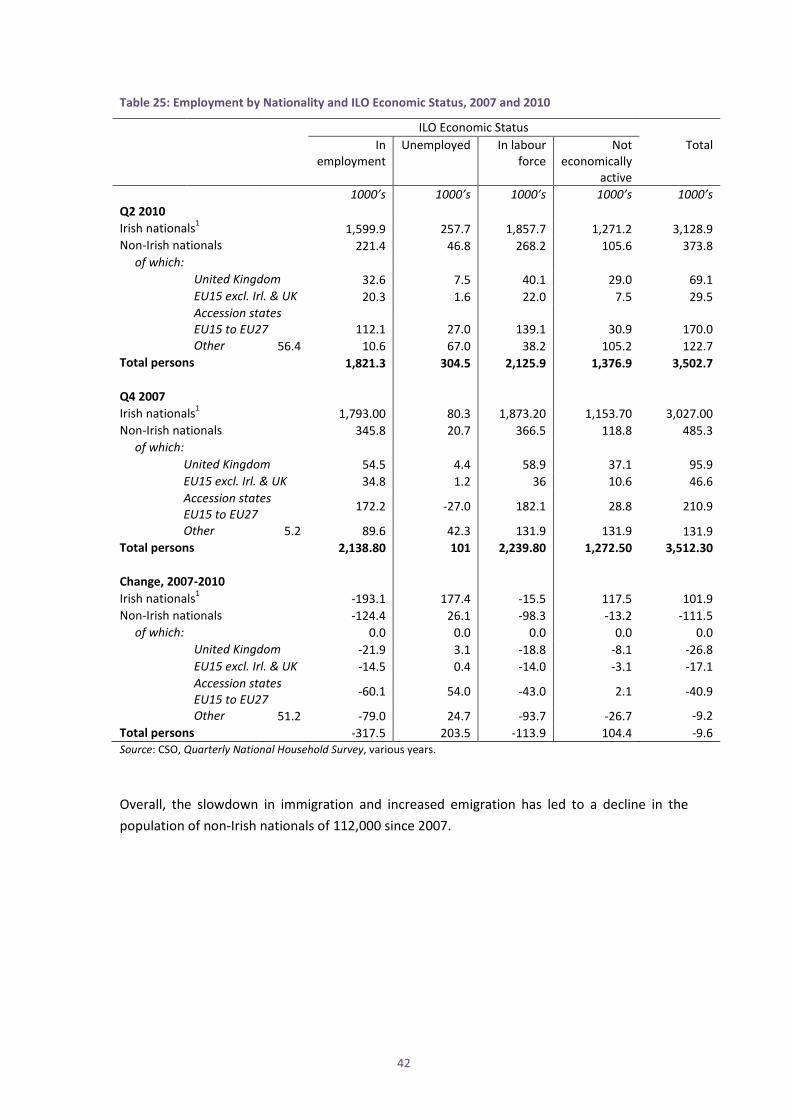
42
Table 25: Employment by Nationality and ILO Economic Status, 2007 and 2010
ILO Economic Status In
employment Unemployed In labour
force Not
economically active
Total
1000’s 1000’s 1000’s 1000’s 1000’s Q2 2010 Irish nationals1 1,599.9 257.7 1,857.7 1,271.2 3,128.9 Non-Irish nationals 221.4 46.8 268.2 105.6 373.8 of which: United Kingdom 32.6 7.5 40.1 29.0 69.1 EU15 excl. Irl. & UK 20.3 1.6 22.0 7.5 29.5 Accession states
EU15 to EU27 112.1 27.0 139.1 30.9 170.0 Other 56.4 10.6 67.0 38.2 105.2 122.7 Total persons 1,821.3 304.5 2,125.9 1,376.9 3,502.7 Q4 2007 Irish nationals1 1,793.00 80.3 1,873.20 1,153.70 3,027.00 Non-Irish nationals 345.8 20.7 366.5 118.8 485.3 of which: United Kingdom 54.5 4.4 58.9 37.1 95.9 EU15 excl. Irl. & UK 34.8 1.2 36 10.6 46.6 Accession states
EU15 to EU27 172.2 -27.0 182.1 28.8 210.9
Other 5.2 89.6 42.3 131.9 131.9 131.9 Total persons 2,138.80 101 2,239.80 1,272.50 3,512.30 Change, 2007-2010 Irish nationals1 -193.1 177.4 -15.5 117.5 101.9 Non-Irish nationals -124.4 26.1 -98.3 -13.2 -111.5 of which: 0.0 0.0 0.0 0.0 0.0 United Kingdom -21.9 3.1 -18.8 -8.1 -26.8 EU15 excl. Irl. & UK -14.5 0.4 -14.0 -3.1 -17.1 Accession states
EU15 to EU27 -60.1 54.0 -43.0 2.1 -40.9
Other 51.2 -79.0 24.7 -93.7 -26.7 -9.2 Total persons -317.5 203.5 -113.9 104.4 -9.6 Source: CSO, Quarterly National Household Survey, various years. Overall, the slowdown in immigration and increased emigration has led to a decline in the population of non-Irish nationals of 112,000 since 2007.
43
6. Special Focus: Fiscal Aspects of Migration
Social Transfers
Addressing immigrant receipt of social welfare, Barrett et al. (2011)34 used EU-SILC 200835 data and found a lower rate of welfare receipt among non-Irish nationals. Using statistics on receipt of unemployment payments to explore the rates of receipt of welfare for non-Irish nationals and Irish nationals, they also found that while the numbers of non-Irish nationals claiming unemployment-related payments surged at the beginning of the recession (Q3 2008), a fast stabilisation occurred in the number of non-Irish nationals versus nationals claiming such benefits. In addition, in the years preceding the recession non-Irish nationals were less likely to be in receipt of welfare payments regardless of adjusted or unadjusted data. Citing earlier work36 that found a disproportionate effect of the recession upon non-Irish nationals (with annual job losses in 2009 of 20% versus 7% for non-Irish nationals in comparison to nationals), Barrett et al. found that there was an overall lower rate of welfare receipt among non-Irish nationals. Using Live Register37 data, the rate of increase in the numbers of non-nationals exceeded that of nationals up to early 2009 and was also rising at a faster pace; by late 2009 the rate of increase for nationals exceed that of non-nationals and from mid-2010, the number of non-nationals was declining in the context of continued increases for nationals. Looking at the microanalysis of EU-SILC data for Ireland, Barrett et al. found that 66.1% of nationals versus 63.3% of non-Irish nationals received a payment under unemployment benefits and assistance, disability benefits and assistance and family benefits. Looking at unemployment and disability payments combined, 16.7% of all non-Irish nationals versus 27.5% of nationals received some form of payment in 2007. In terms of those unemployed, non-Irish nationals are less likely to receive benefits relative to nationals.
This arguably may be attributed to the introduction of a Habitual Residency Condition (HRC) on 1 May 2004 which resulted in new eligibility conditions for many welfare payments for all nationalities (including Irish nationals) whereby access was conditional on a period of residence within Ireland or the UK. In the context of concerns regarding undue demands being placed on the welfare system following Ireland’s opening of its labour market to EU10 nationals in 2004, the original Social Welfare (Miscellaneous Provisions) Act, 2004 (Section 17) (Commencement) 34 Barrett et al. (Forthcoming 2011). ‘Immigrants and Welfare Receipt in Ireland’. International Journal of
Manpower. IZA: Germany. 35 EU Survey on Income and Living Conditions for 2008. This refers to income in the 12 months preceding the
survey. 36 Barrett and Kelly (2010). ‘The Impact of Ireland’s Recession on the Labour Market Outcomes of its Immigrants.’
ESRI Working Paper No.355. ESRI: Dublin. 37 The Live Register is compiled from returns made for each local office by the Department of Social Protection to
the Central Statistics office (CSO). It includes persons under 65 years old who are: - All claimants for Jobseekers Benefit (JB) excluding systematic short-term workers - Applicants for Jobseeker’s Allowance (JA) excluding smallholders/farm assists and other self-employed
persons - Other registrants including applicants for credited social welfare contributions but excluding those
directly involved in an industrial dispute. See www.cso.ie for further details.
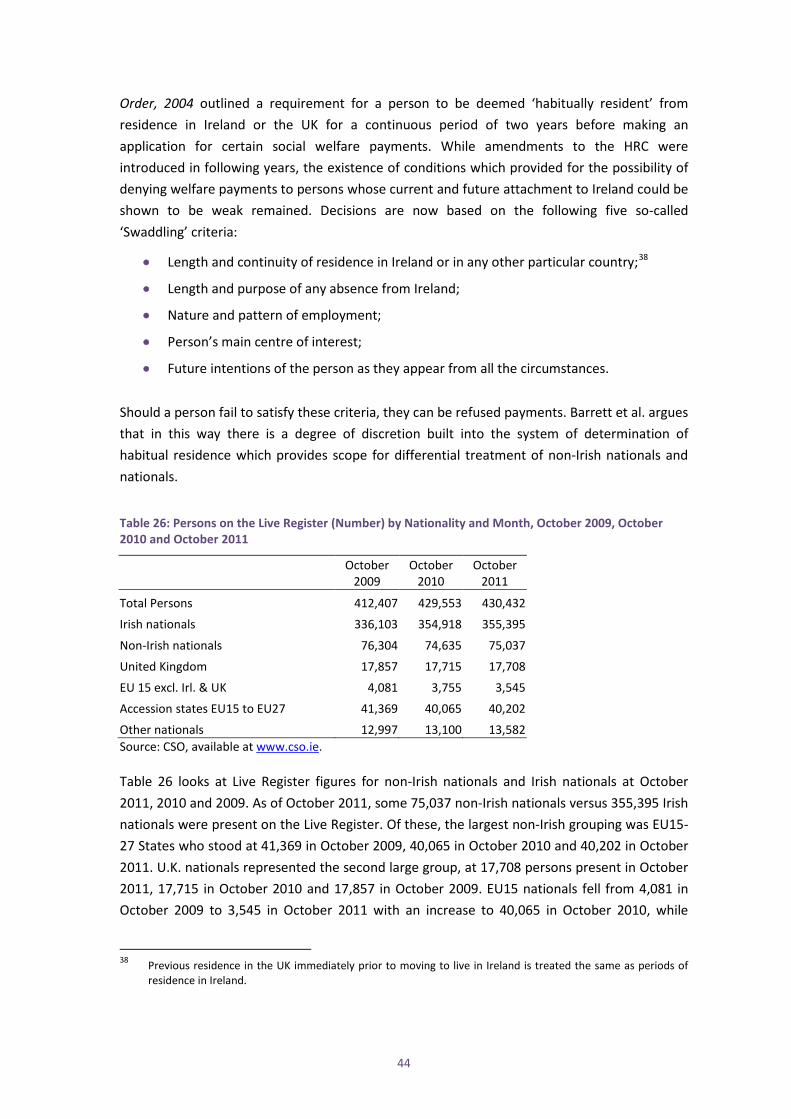
44
Order, 2004 outlined a requirement for a person to be deemed ‘habitually resident’ from residence in Ireland or the UK for a continuous period of two years before making an application for certain social welfare payments. While amendments to the HRC were introduced in following years, the existence of conditions which provided for the possibility of denying welfare payments to persons whose current and future attachment to Ireland could be shown to be weak remained. Decisions are now based on the following five so-called ‘Swaddling’ criteria:
• Length and continuity of residence in Ireland or in any other particular country;38
• Length and purpose of any absence from Ireland;
• Nature and pattern of employment;
• Person’s main centre of interest;
• Future intentions of the person as they appear from all the circumstances.
Should a person fail to satisfy these criteria, they can be refused payments. Barrett et al. argues that in this way there is a degree of discretion built into the system of determination of habitual residence which provides scope for differential treatment of non-Irish nationals and nationals.
Table 26: Persons on the Live Register (Number) by Nationality and Month, October 2009, October 2010 and October 2011
October 2009
October 2010
October 2011
Total Persons 412,407 429,553 430,432
Irish nationals 336,103 354,918 355,395
Non-Irish nationals 76,304 74,635 75,037
United Kingdom 17,857 17,715 17,708
EU 15 excl. Irl. & UK 4,081 3,755 3,545
Accession states EU15 to EU27 41,369 40,065 40,202
Other nationals 12,997 13,100 13,582 Source: CSO, available at www.cso.ie. Table 26 looks at Live Register figures for non-Irish nationals and Irish nationals at October 2011, 2010 and 2009. As of October 2011, some 75,037 non-Irish nationals versus 355,395 Irish nationals were present on the Live Register. Of these, the largest non-Irish grouping was EU15-27 States who stood at 41,369 in October 2009, 40,065 in October 2010 and 40,202 in October 2011. U.K. nationals represented the second large group, at 17,708 persons present in October 2011, 17,715 in October 2010 and 17,857 in October 2009. EU15 nationals fell from 4,081 in October 2009 to 3,545 in October 2011 with an increase to 40,065 in October 2010, while
38 Previous residence in the UK immediately prior to moving to live in Ireland is treated the same as periods of
residence in Ireland.
45
‘other’ rose from 12,997 in October 2009 to 13,100 in October 2010 and 13,582 in October 2011.
7. Research on Migration, Asylum and Integration
There have been a number of significant contributions by researchers in the field of immigration on the subject of the labour market, social welfare, integration and asylum. Research in these areas in 2010 and 2011 in the Irish context primarily examined the earnings differentials, occupational distribution and work experiences of migrants in the labour market, explored their interactions with the welfare system and experiences of integration, and investigated the provision of health and social services to asylum seekers living in direct provision centres.
Immigrants in the Irish Labour Market
Research on immigrants in the labour market in 2010 and 2011 examined their earnings differentials (Barrett et al., Forthcoming 2011)39, occupational distribution (Turner, 2010)40, and recruitment and work experiences (Doyle and Timonen, 200941, McGinnity and Lunn, 201142, Moriarty et al, Forthcoming 2011)43. Statistical studies have drawn on the 2006 Census and the National Employment Survey (NES) from the same year (Barrett et al, 2011, Turner, 2010) and valuable primary data has been collected on the experiences of migrants in various sectors of the labour market (Doyle and Timonen, 2009, McGinnity and Lunn, 2011, Moriarty et al, 2011). These topics have built on existing studies exploring the broad labour market experience of immigrants.44
Turner (2010) analyses the occupational distribution of immigrants in Ireland, drawing on the work of Borjas (2006)45 on the impact of immigration on native jobs. Turner’s analysis of the 39 Barrett, A., McGuinness, S. and O'Brien, M. (forthcoming). ‘The Immigrant Earnings Disadvantage across the
Earnings and Skills Distributions: The Case of Immigrants from the EU's New Member States’. British Journal of Industrial Relations.
40 Turner, T. (2010). ‘The Jobs Immigrants Do: Issues of Displacement and Marginalisation in the Irish Labour Market’. Work, Employment and Society, 24: 2: 318 – 336.
41 Doyle, Martha and Virpi, Timonen (2009). ‘The Different Faces of Care Work: Understanding the Experiences of the Multicultural Care Workforce’, Ageing and Society, 29(3): 337-350.
42 McGinnity, F. and Lunn, P. (2011). ‘Measuring discrimination facing ethnic minority job applicants: an Irish experiment’. Work, Employment and Society, 25: 4: 693 – 708.
43 Moriarty, E. Wickham, J. Krings, T. Salamonska, J. and Bobek, A. (2011). ‘Taking on Almost Everyone? Migrant and Employer Recruitment Employer Strategies in a Booming Labour Market’. The International Journal of Human Resource Management, 1 – 17.
44 Barrett, A. (2009). "EU Enlargement and Ireland's Labour Market" in Kahanec, M. and Zimmermann, K. F. (eds.) EU Labor Markets after Post-Enlargement Migration. London: Springer.
O’Connell, P. and McGinnity, F. (2008). Immigrants at Work: Ethnicity and Nationality in the Irish Labour Market. Dublin: ESRI/The Equality Authority.
Barrett, A. and Duffy, D. (2008). ‘Are Ireland’s Immigrants Integrating into its Labour Market?’ International Migration Review, 42: 3: 597–619.
45 Borjas, G.J. (2006). ‘The Impact of Immigration and the Labour Market’, paper presented at the Conference on Labor and Capital Flows, International Monetary Fund, jointly hosted by the Vienna Institute and the National Bank of Poland, 30-31 January, Warsaw, Poland.
46
2002 and 2006 Census and the 5% sample of anonymised records demonstrates that between these years there was an increase in the over-representation of non-nationals in low-skilled jobs and an under-representation in high-skilled jobs. The shift downward over this time period corresponds to the influx of migrant workers from the New Member States (NMS) into the lower end of the labour market, following the enlargement of the EU in 2004. Of all new jobs created, Irish nationals were more likely to be employed in high-skill sectors, with immigrants filling both low-skill jobs and specific shortages in high-skill sectors. In this case, it is not evident that there was a displacement of Irish workers but seems that immigrant workers were complementary to the workforce, relieving bottlenecks in the Irish labour market.
Turner’s analysis of immigrant workers across the skill distribution is complemented by recent analysis of the 2006 NES exploring the earnings differentials for different nationalities within occupations (Barrett et al., 2011). This study seeks to build on earlier work on the immigrant earnings disadvantage in Ireland by looking at the structure of the pay gap, and by extension, the possible factors underlying the earnings differential experienced by immigrants. Overall, immigrant workers earn 14% less than comparable Irish employees, with the earnings disadvantage seen to be greatest at the higher end of the earnings distribution. The pay gap was greatest among NMS nationals, who earned 18% less than comparable Irish employees, while employees from the UK and non-EU/English speaking countries do not suffer any earnings disadvantage. Immigrants are also less likely to receive training from employers (Barrett et al. 2011)46 with NMS nationals experiencing a particular disadvantage. This is related in part to less NMS nationals holding jobs in training-oriented firms and in part to their lower participation in training, in firms which do provide training, than comparable Irish employees.
Timonen and Doyle (2010), Walsh and O’Shea (2010), Moriarty et al. (2011) and Krings et al. (2011)47 explore the working conditions and career aspirations of migrant workers in a number of sectors, including care work, construction, financial services and hospitality. While migrants experience sub-optimal working conditions in the care sector, these conditions tend to characterise the entire care sector – a disadvantaged sector with disadvantaged workers - with poor pay and conditions, under-funding, poor career pathways, inadequate training and deficient regulatory structures, and workers perceiving obstacles and discrimination in their workplace exacerbated by discrimination or a precarious legal status (Doyle and Timonen, 2009, Walsh and O’Shea, 2010)48. Focusing their analysis on the firm, Moriarty et al. (2011) and Krings et al. (2011) reveal how a firm’s main exposure to migrant labour was through subcontractors and agency labour, with widespread use of subcontracting arrangements. Despite the working conditions revealed in these studies, there was optimism about career progression, confidence of access to work and career mobility, and experiences of continued employment leading into the recession. These studies reveal mixed experiences across a range
46 Barrett, A., McGuinness, S. O'Brien, M. and O’Connell, P. (2011). ‘Immigrants and Employer Provided Training’.
Dublin: ESRI Working Paper 313. 47 Krings, T. Bobek, A. Moriarty, E. Salamonska, J. and Wickham, J. (2011). ‘From boom to bust: Migrant labour
and employers in the Irish construction industry.’ Economic and Industrial Democracy, 32: 3: 459 – 476. 48 Walsh, K. and O’Shea, E. (2010). ‘Marginalised Care: Migrant Workers Caring for Older People in Ireland’
Population Ageing, 3: 17 – 37.
47
of occupations which occur within a context of greater informality and casualisation in recruitment and working conditions. The experiences of migrant workers frequently reflects those of workers in secondary labour markets.
The Recruitment of Immigrants into the Labour Market
Mixed evidence has emerged on the nature of the recruitment of immigrants. A study measuring discrimination using matched equivalent applications with Irish and ethnic minority names found that candidates with Irish names were twice as likely to be called for interview as those with German, Polish or Nigerian names. There was no difference in probability of being called for interview among these three nationalities, nor was there variation in discrimination across occupations (lower administration, lower accountancy and retail sales) (McGinnity and Lunn, 2011). This finding was different from that of a qualitative panel study on Polish migrant workers, carried out as part of the Trinity Immigration Initiative. Interviews with employers revealed that they preferred migrant employees over Irish ones in terms of cost, obedience and general soft skills such as attitude, work ethic and potential. Recruitment was through subcontractors and agencies, with widespread informal practices and an elaborate system of collaboration between recruitment agents in Poland and in Ireland, in particular in bottom to mid-level jobs in financial services and software (Krings et al, 2011). One possible explanation for these divergent results may lie in the different data collection methods used, bringing to mind the work of La Piere in 1934,49 in which it was found that employers verbally stated they did not favour native over migrant workers but later were in practice found to do so. Alternatively, the variation could reflect sampling differences, with the research by Krings et al. (2011) capturing only workplaces which were open to recruitment abroad and McGinnity and Lunn (2011) sampling a broader range of organisations advertising in Ireland.
Immigrant Workers in the Recession
Immigrant workers experienced huge job losses at the start of the recession by comparison to natives (Barrett and Kelly, 2012)50, although simplistic assumptions of immigrants leaving Ireland with the onset of the recession are misplaced, with some continued employment, links to the social welfare system and social integration (Krings et al., 2009)51. Immigrants experienced an annual rate of job loss of close to 20% in 2009, against 7% for natives, and this higher rate remains when controlling for demographic factors such as age and education. NMS nationals were particularly badly hit, which is to be expected given their concentration in low-skilled sectors with informal contractual arrangements.
49 La Piere, R. (1934). ‘Attitudes vs Actions’ Social Forces, 13: 230 – 237. 50 Barrett, E. And Kelly, E. (2012). ‘The Impact of Ireland’s Recession on the Labour Market Outcomes of its
Immigrants’ European Journal of Population, 28: 91 -111. 51 Krings, T. Bobek, A. Moriarty, E. Salamonska, J. and Wickham, J. (2009). ‘Migration and Recession: Polish
Migrants in Post-Celtic Tiger Ireland’. Sociological Research Online 14 (2/3).
48
Social Welfare
Studies on immigrant’s interactions with the welfare system illustrate that there is no evidence to suggest that migration poses a burden on welfare systems. Using EU-SILC data for a comparative study of migrant intentions towards welfare state incentives, with Britain and Ireland as test cases, Corrigan (2010)52 disaggregates the concept of welfare utilisation into categories of ‘usage’, ‘participation’ and ‘dependency’. His inclusion of Ireland as a test case reveals that migrants in Ireland are not found to have a greater likelihood of welfare dependency compared to migrants in Britain, despite Ireland’s relatively more generous welfare system. In fact, migrants in Ireland have a lower usage of welfare (defined as welfare as a proportion of total income) than similar migrants in Britain, controlling for characteristics. However, in Ireland’s more generous system simple participation (defined as any form of social transfer payment) is higher, which Corrigan concludes hints at the possibility that migrants in Ireland are availing of social transfers to facilitate part-time work. A 2008 qualitative study, involving interviews with 40 migrant care workers, explored migrant workers’ conceptualisation of ‘social protection’ and their relationship with the Irish welfare state. Its findings revealed that participants were very poorly anchored into the Irish welfare state, with some even completely detached from it (Timonen and Doyle, 2009)53. The findings of these studies compliment the work of Barrett et al (2011), discussed in Section 6, above, which found a lower rate of welfare receipt among non-Irish nationals.
Integration
In April 2011, a first Annual Monitoring Report on Integration (McGinnity et al., 2011)54 was published by the Integration Centre in collaboration with the ESRI. The monitor is framed within four categories for assessing integration: employment, education, social inclusion and active citizenship. These categories were proposed at the European Ministerial Conference on Integration in Zaragoza in 2010, at which conclusions were reached at the European level on agreed indicators and monitoring of the outcome of integration policies for immigrants in the EU Member States. The monitor draws on statistics from the QNHS, the EU-SILC and the NCPP Employee Survey in constructing an integration index with indicators in line with the Zaragoza Framework. Its first report places a special focus on immigrants in the workplace, with subsequent monitors to focus on other themes.
Research on integration in the qualitative domain has examined elements of social integration from the perspectives of young people (Gilligan et al., 2010)55 and of workers in a range of
52 Corrigan, O. (2010). ‘Migrants, Welfare Systems and Social Citizenship in Ireland and Britain: Users or
Abusers?’. Journal of Social Policy, 39: 3: 415 – 437. 53 Timonen, Virpi and Doyle, M. (2009). ‘In Search of Security: Migrant Care Workers’ Understandings,
Experiences and Expectations Regarding ‘Social Protection’. Journal of Social Policy, 38: 1: 157-75. 54 McGinnity, F. Quinn, E. O'Connell, P. and Donnelly, N. (2011). Annual Monitoring Report on Integration. Dublin:
ESRI/The Integration Centre. 55 Gilligan, R. Curry, P. McGrath, J. Murphy, D. Ní Raghallaigh, M. Rogers, M., Scholtz, J. and Quinn, A. (2010). On
the Front Line of Integration: Young People Managing Migration to Ireland. Dublin: Children’s Research Centre.
49
sectors (Fanning et al., 2010)56. These two studies relied on focus groups for data collection and drew attention to elements of social integration in terms of rules and expectations in schools; relations with teachers and peers; and racial harassment in schools, the workplace and the community.
A large scale study of primary and secondary level school provision for immigrant students was carried out by the ESRI, comprising a postal survey of school principals (Smyth et al., 2009.57 Byrne et al., 2010).58 Immigrant children are found to be over-represented in larger schools, schools in urban locations, and in schools with a socio-economically disadvantaged intake. However, the degree of segregation witnessed in other European countries is not replicated in Ireland. This particular research provides an in-depth profile of the schools catering for newcomer students in terms of school characteristics, the nationalities of newcomer students and school admission policies.
Asylum
Research on immigrants in the asylum system in Ireland focuses largely on the needs and characteristics of this group of immigrants and on the provision of services to residents in direct provision centres, notably in relation to health and social care services59. Overall, the studies assess the special health and social care needs of children and adults in the asylum system, such as providing language interpretation and a culturally sensitive service in health care. White (2011)60 and AkiDwA (2010)61, in separate studies, explore the experiences of children and women seeking asylum. Using child-centred research methods including drawing exercises, play, map-making, interviews and discussion, and ethnographic observations, White explored the childen’s use of space in institutional settings and their daily lives in multilingual and familial setting. AkiDwa’s study explored participant’s experiences of asylum processes - their treatment in direct provision, access to rights and services, and involvement in volunteering, education and training – drawing on interviews with 121 women living in direct provision centres.
56 Fanning, B. Killoran, B. Ní Bhroin, S. and McEvoy, G. (2011). Taking Racism Seriously: Migrants Experiences of
Violence, Harassment and Anti-Social Behaviour in the Dublin Area. Dublin: Immigrant Council of Ireland. 57 Smyth, E. Darmody, M. McGinnity, F. And Byrne, D. (2009). Adapting to Diversity: Irish Schools and Newcomer
Students. Dublin: ESRI. 58 Byrne, D. McGinnity, F. Smyth, E and Darmody, M. (2010). ‘Immigration and School Composition in Ireland’.
Irish Education Studies, 29: 3: 271 - 288. 59 Abunimah, A. and Blower S. (2010). ‘The Circumstances and Needs of Separated Children Seeking Asylum in
Ireland’. Child Care in Practice, 16: 2: 129 – 146. Dolan, N. and Sherlock, C. (2010). ‘Family Support through Childcare Services: Meeting the Needs of Asylum-
seeking and Refugee Families’ Child Care in Practice, 16: 2: 147 – 165. McFarlane, A. Dzebisova, Z. Karapish, D. Kovacevic, B. And Ogbebor, F. (2009). ‘Arranging and negotiating the
use of informal interpreters in general practice consultations: Experiences of refugees and asylum seekers in the west of Ireland’ Social Science and Medicine, 29: 2: 210 – 214.
Radford, K. (2010). ‘Unkind Cuts: Health Policy and Practice versus the Health and Emotional Well-Being of Asylum Seekers and Refugees in Ireland’. Journal of Ethnic and Migration Studies, 36: 6: 2010.
60 White, A. (2011). ‘ ‘Every Wednesday I am Happy’: Childhoods in an Irish Asylum Centre’. Population, Space and Place, 18: 314 – 326.
61 AkiDwA. (2010). Am Only Saying it Now. Experiences of Women Seeking Asylum in Ireland. Dublin: AkiDwA. http://www.migrantwomennetwork.org/IMG/pdf/AmOnlySayingItNowAkiDwA.pdf.
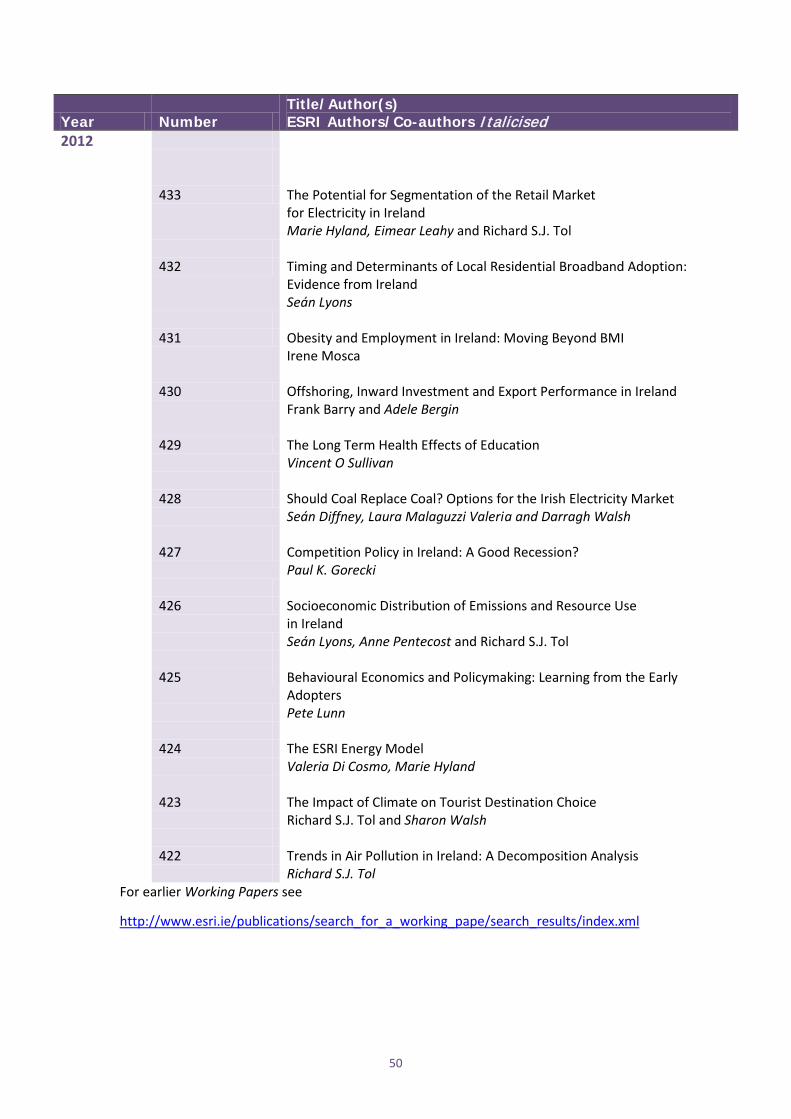
50
Year Number Title/Author(s) ESRI Authors/Co-authors Italicised
2012 433 The Potential for Segmentation of the Retail Market
for Electricity in Ireland Marie Hyland, Eimear Leahy and Richard S.J. Tol
432 Timing and Determinants of Local Residential Broadband Adoption:
Evidence from Ireland Seán Lyons
431 Obesity and Employment in Ireland: Moving Beyond BMI
Irene Mosca
430 Offshoring, Inward Investment and Export Performance in Ireland Frank Barry and Adele Bergin
429 The Long Term Health Effects of Education Vincent O Sullivan
428 Should Coal Replace Coal? Options for the Irish Electricity Market
Seán Diffney, Laura Malaguzzi Valeria and Darragh Walsh 427 Competition Policy in Ireland: A Good Recession?
Paul K. Gorecki 426 Socioeconomic Distribution of Emissions and Resource Use
in Ireland Seán Lyons, Anne Pentecost and Richard S.J. Tol 425 Behavioural Economics and Policymaking: Learning from the Early
Adopters Pete Lunn 424 The ESRI Energy Model Valeria Di Cosmo, Marie Hyland 423 The Impact of Climate on Tourist Destination Choice Richard S.J. Tol and Sharon Walsh 422 Trends in Air Pollution in Ireland: A Decomposition Analysis Richard S.J. Tol
For earlier Working Papers see
http://www.esri.ie/publications/search_for_a_working_pape/search_results/index.xml
Related Documents