Logo adapted from Pine Tree clip art (Polyvore) Presented by Abbey Bryant-Searl Word Count: 1945 words (not including in-text citations) Russia Product Launch 1

Welcome message from author
This document is posted to help you gain knowledge. Please leave a comment to let me know what you think about it! Share it to your friends and learn new things together.
Transcript
Logo
ada
pted
from
Pin
e Tr
ee c
lip a
rt (P
olyv
ore)
Presented by Abbey Bryant-Searl
Word Count: 1945 words (not including in-text citations)
Russia Product Launch
1
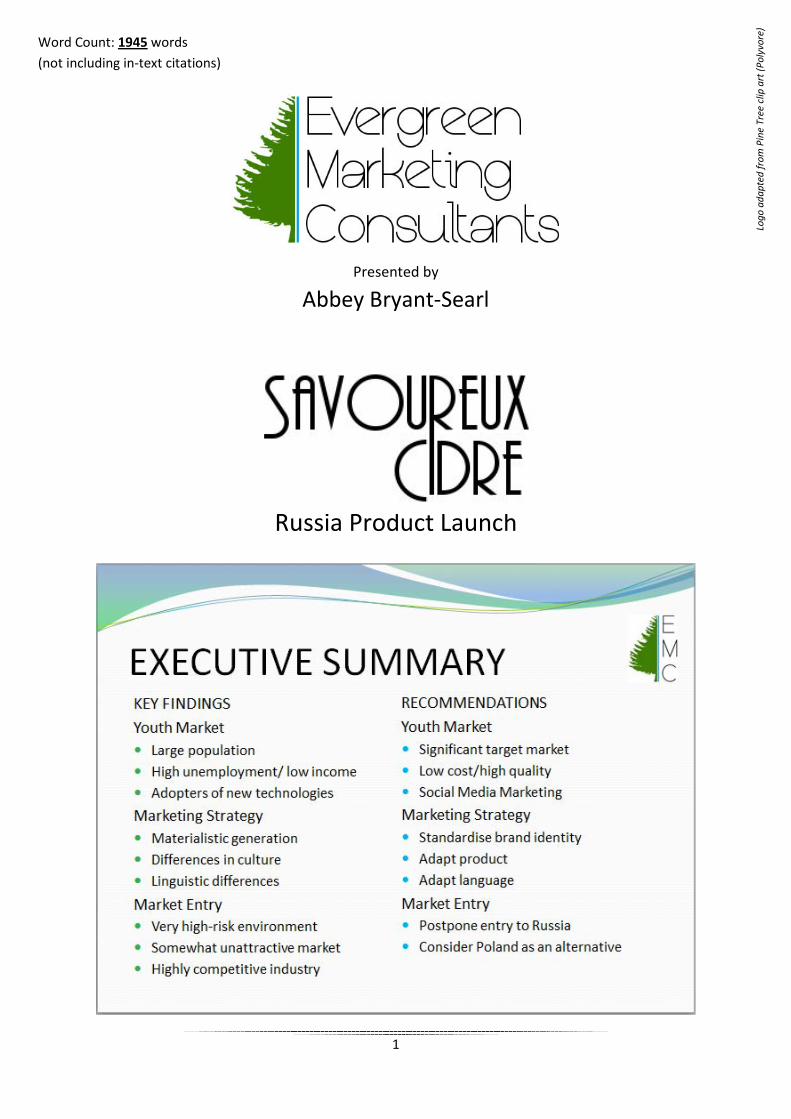
Youth Market 1: Definition
Youth is more difficult to define than other fixed age groups as it is considered a fluid
category, generally the period of time between leaving childhood and entering adulthood
(United Nations 2013). The age range of the youth market defined by Elder (2010) is 15-24
year olds. In 1995, the world youth population was estimated to be 1.03 billion, accounting
for 18% of the total world population (United Nations, 2013a).
Youths across cultures are by no means a homogenous group – there are a number of needs
and concerns which must be considered (Singh 2014). “The definition of youth perhaps
changes with circumstances, especially with the changes in demographic, financial, economic
and socio-cultural settings” (United Nations, 2013a).
2
Although several sources describe youths as 15-24 year olds, our analysis will focus on 18-24
year olds (See appendix 1.1 for further justification).
3
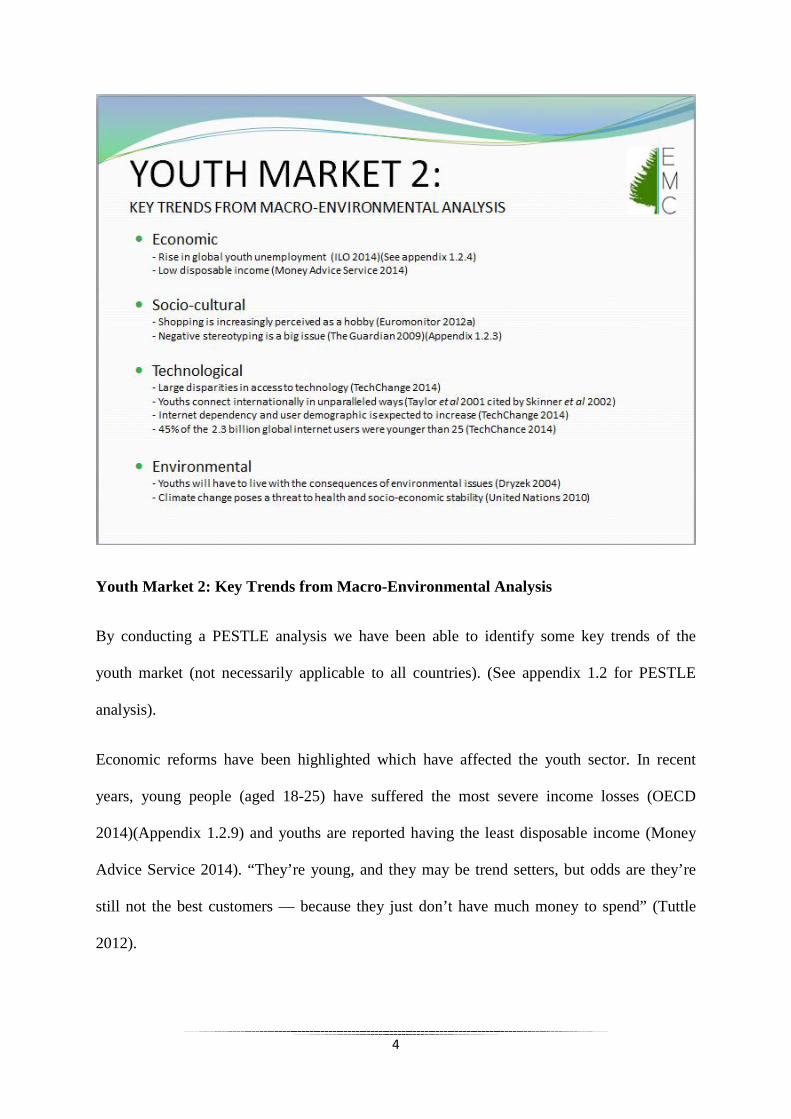
Youth Market 2: Key Trends from Macro-Environmental Analysis
By conducting a PESTLE analysis we have been able to identify some key trends of the
youth market (not necessarily applicable to all countries). (See appendix 1.2 for PESTLE
analysis).
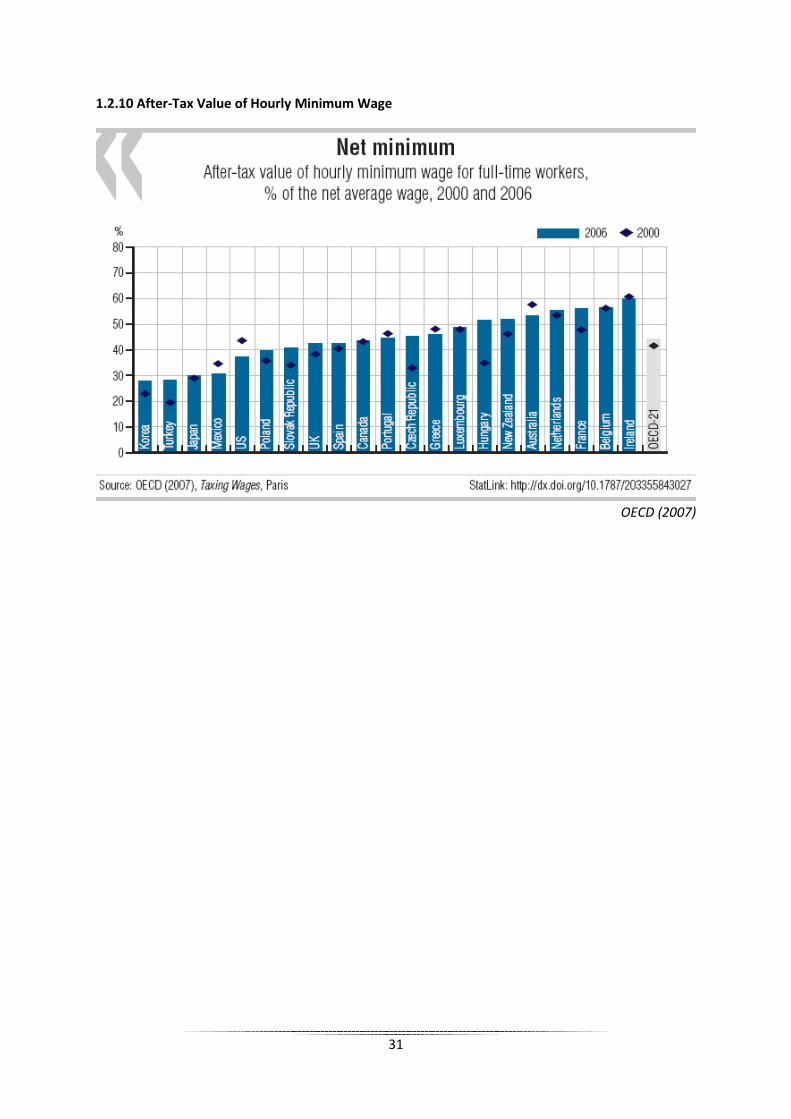
Economic reforms have been highlighted which have affected the youth sector. In recent
years, young people (aged 18-25) have suffered the most severe income losses (OECD
2014)(Appendix 1.2.9) and youths are reported having the least disposable income (Money
Advice Service 2014). “They’re young, and they may be trend setters, but odds are they’re
still not the best customers — because they just don’t have much money to spend” (Tuttle
2012).
4
The number of young people (aged 15-29) that are neither in employment, education or
training (NEET) has risen in 75% of countries (for which data are available)(ILO
2014)(Appendix 1.2.5). The global youth unemployment rate rose to 13.1% in 2013 (ILO
2014)(Appendix 1.2.4).
“Young people are usually the early adopters of new technologies” (Taylor et al 2001, cited
by Skinner et al 2002) and 75% of youths feel they "couldn't live" without the internet (BBC
News 2009). Internet-equipped mobile phones are four times as likely to be owned by youths
(40%) than consumers aged 60+ (12%), (Euromonitor International 2012a). However, there
are large disparities in global youths’ access to technology; 9% of Africans compared to 79%
of Europeans (TechChange 2014).
Environmental issues affect young people as they have to live with the consequences;
increasing environmental awareness is fundamental and heightened awareness can easily be
achieved by youths (Dryzek, 2004).
5
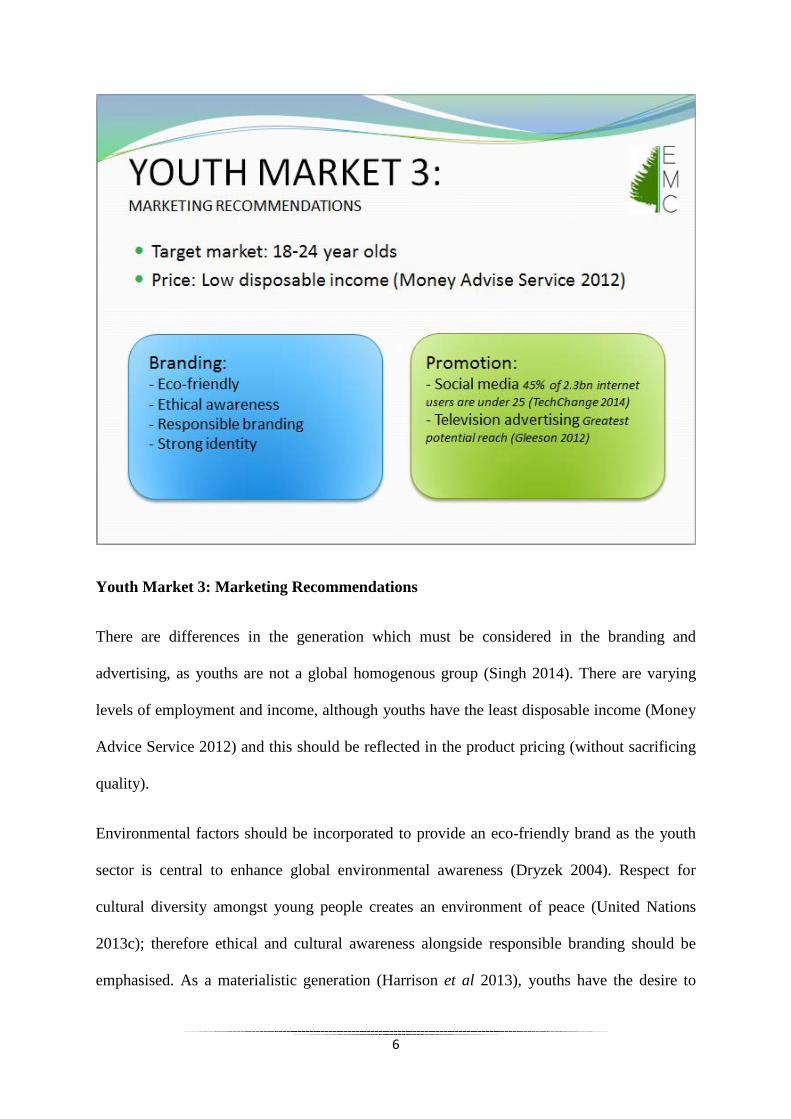
Youth Market 3: Marketing Recommendations
There are differences in the generation which must be considered in the branding and
advertising, as youths are not a global homogenous group (Singh 2014). There are varying
levels of employment and income, although youths have the least disposable income (Money
Advice Service 2012) and this should be reflected in the product pricing (without sacrificing
quality).
Environmental factors should be incorporated to provide an eco-friendly brand as the youth
sector is central to enhance global environmental awareness (Dryzek 2004). Respect for
cultural diversity amongst young people creates an environment of peace (United Nations
2013c); therefore ethical and cultural awareness alongside responsible branding should be
emphasised. As a materialistic generation (Harrison et al 2013), youths have the desire to
6
purchase established brands (Santisi et al 2014); therefore a strong brand identity should be
developed making the product recognisable.
There is no denying that social media has taken the world by storm, as there are 2.3bn global
internet users, and almost half of these are younger than 25 (TechChange 2012). This
demographic is expected to increase; this should be acknowledged and a strong online
presence on the internet and social media facilitated.
Television has the greatest potential reach and allows for cost effective advertising (Gleeson
2012)(Appendix 1.3.1); social media and television advertising could be used simultaneously.
“Overlap [between television and internet] can provide opportunity for a powerful integrated
campaign” (Gleeson 2012).
However, controversial products should be cautiously advertised to avoid breaking legal and
social guidelines (Shao and Hill 1994).
7
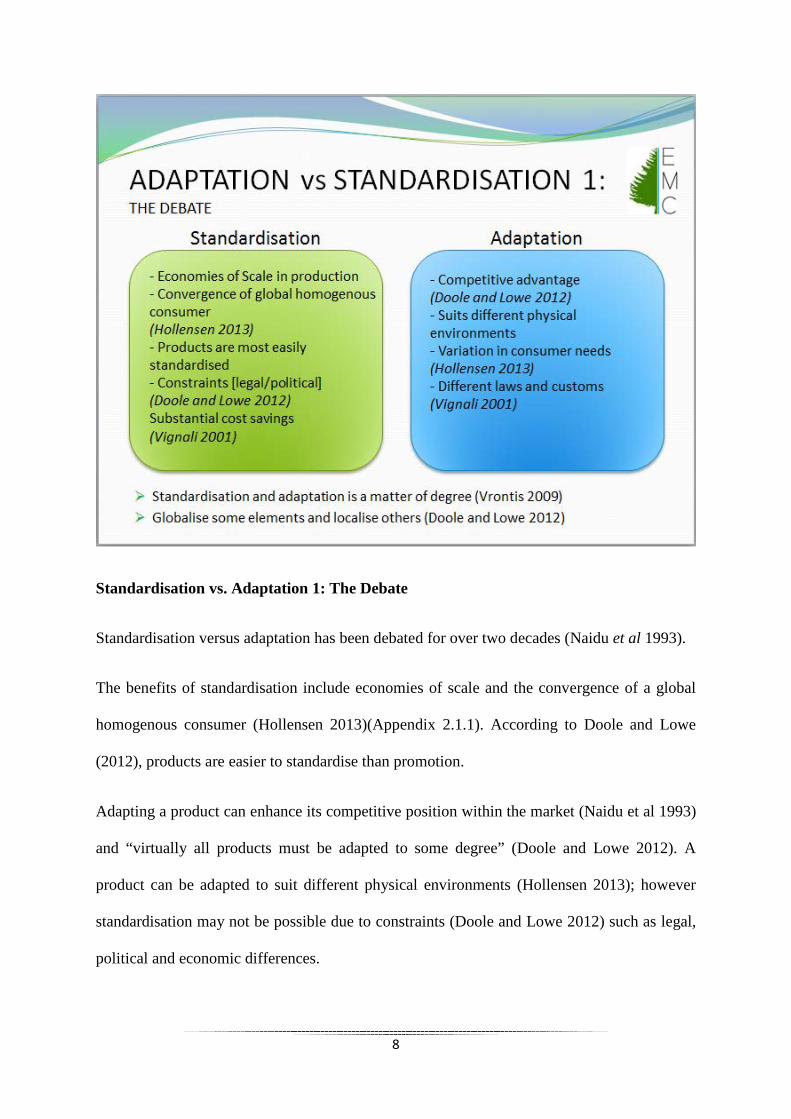
Standardisation vs. Adaptation 1: The Debate
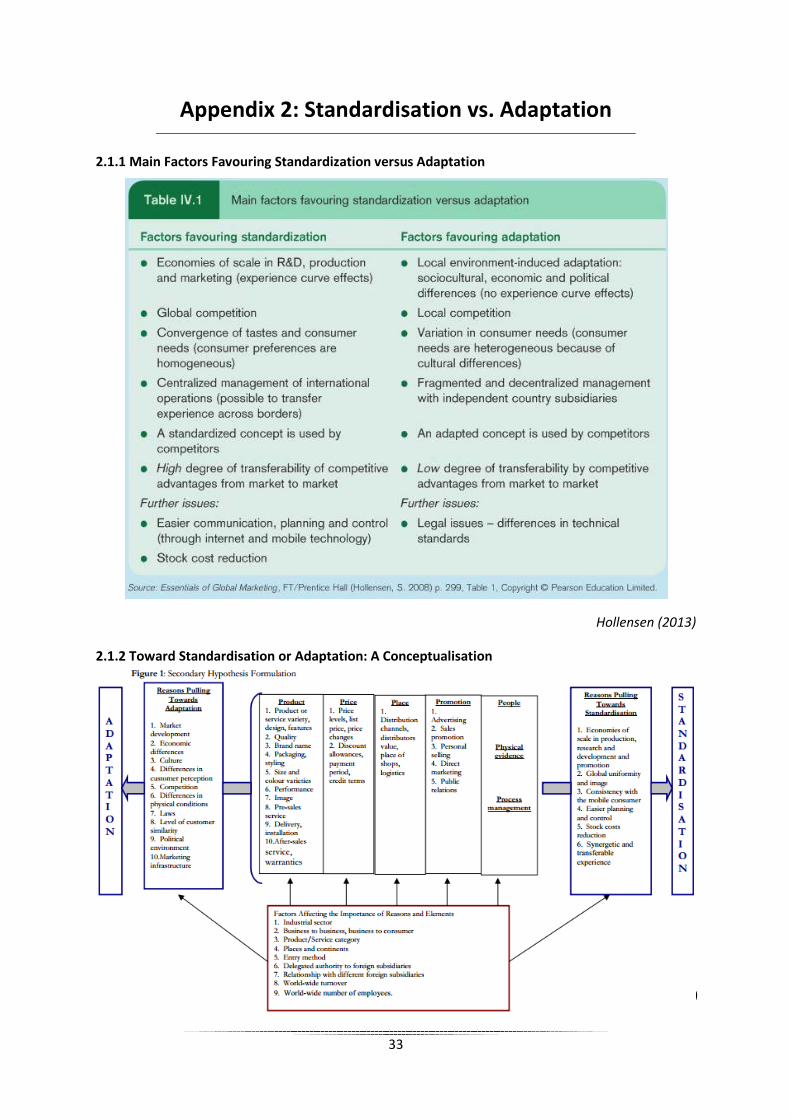
Standardisation versus adaptation has been debated for over two decades (Naidu et al 1993).
The benefits of standardisation include economies of scale and the convergence of a global
homogenous consumer (Hollensen 2013)(Appendix 2.1.1). According to Doole and Lowe
(2012), products are easier to standardise than promotion.
Adapting a product can enhance its competitive position within the market (Naidu et al 1993)
and “virtually all products must be adapted to some degree” (Doole and Lowe 2012). A
product can be adapted to suit different physical environments (Hollensen 2013); however
standardisation may not be possible due to constraints (Doole and Lowe 2012) such as legal,
political and economic differences.
8
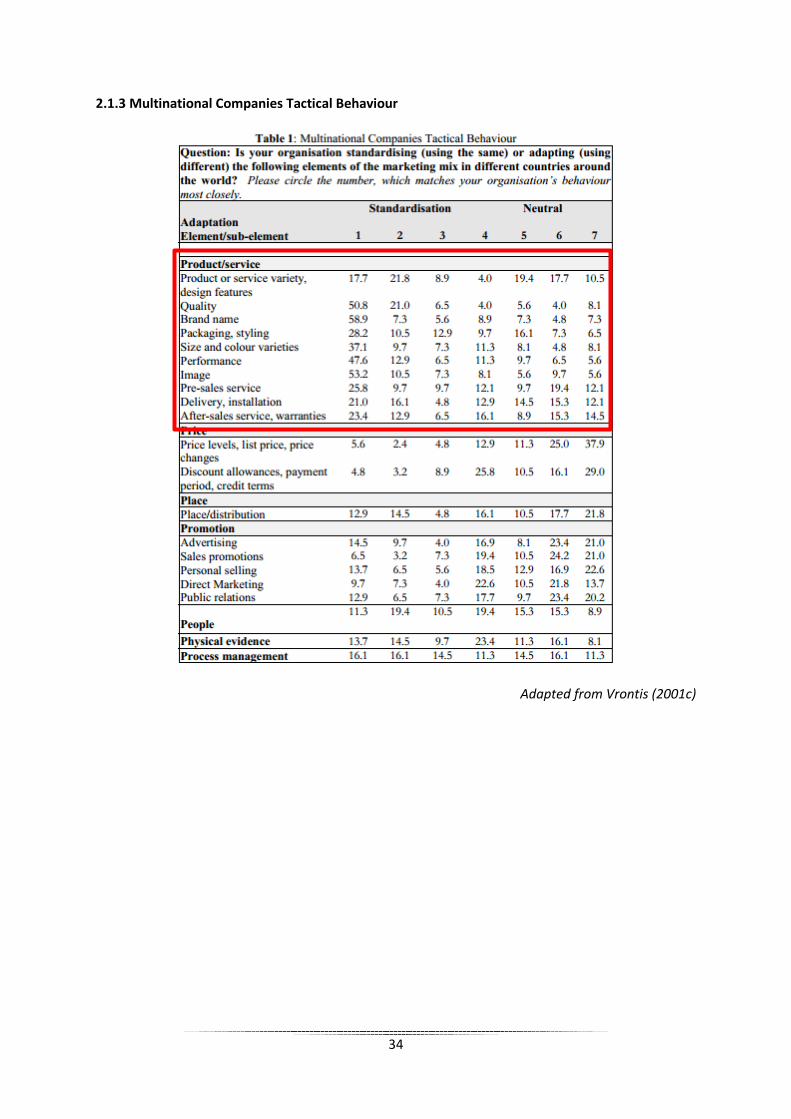
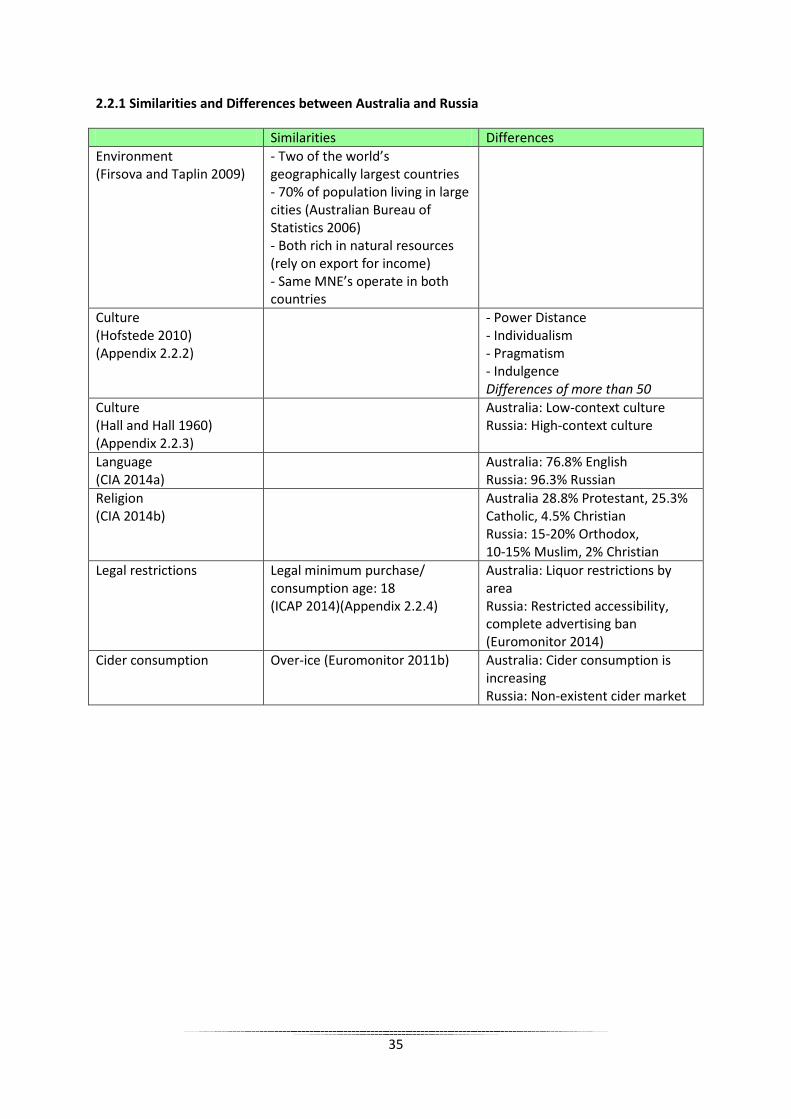
Vrontis’ Multinational Companies Tactical Behaviour table can be used to assess the level of
standardisation and adaptation according to different elements of the product (Appendix
2.1.3). Vrontis (2003) advises that companies favour standardisation and only use adaptation
where necessary, although it is a matter of degree (Cited by Vrontis 2009)(See Appendix
2.1.2 for Vrontis’ conceptualisation framework).
9
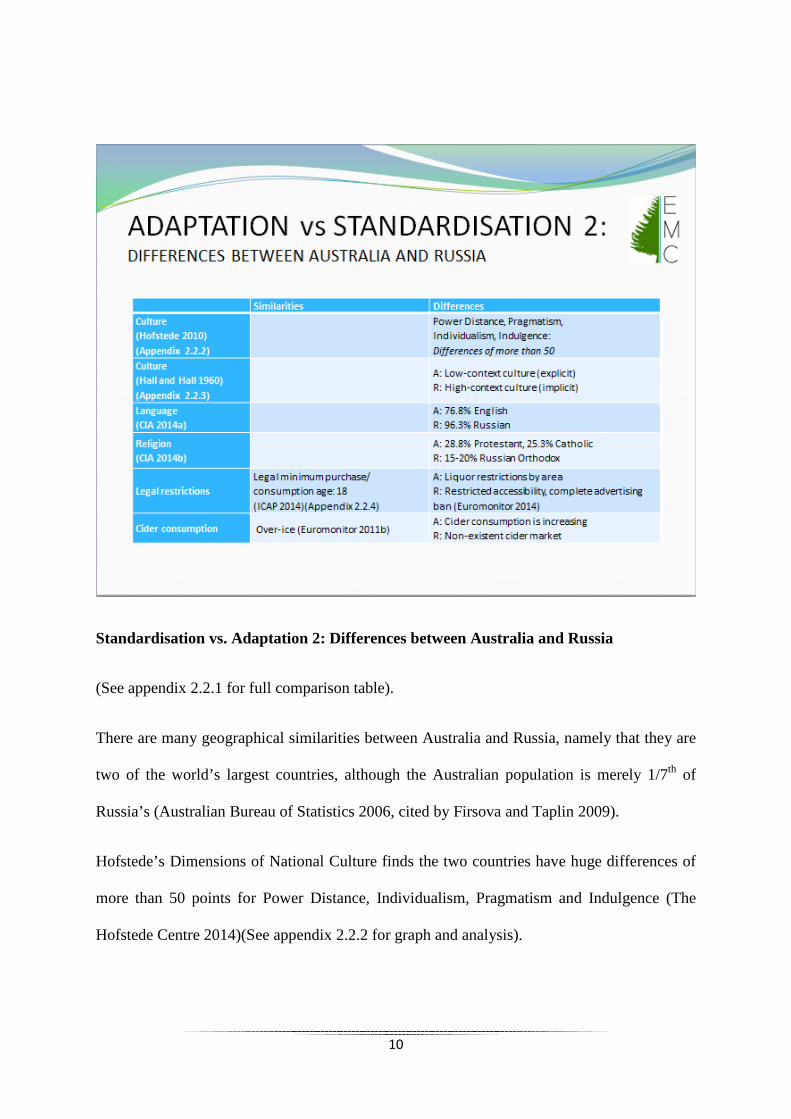
Standardisation vs. Adaptation 2: Differences between Australia and Russia
(See appendix 2.2.1 for full comparison table).
There are many geographical similarities between Australia and Russia, namely that they are
two of the world’s largest countries, although the Australian population is merely 1/7th of
Russia’s (Australian Bureau of Statistics 2006, cited by Firsova and Taplin 2009).
Hofstede’s Dimensions of National Culture finds the two countries have huge differences of
more than 50 points for Power Distance, Individualism, Pragmatism and Indulgence (The
Hofstede Centre 2014)(See appendix 2.2.2 for graph and analysis).
10
Due to the small power distance, the product can become more widely available and accepted
by a much broader audience. Russia’s collectivist society gives the product potential to be
associated with social encounters, emanating a sense of sharing and the desire to
communicate whilst using the product. Russia’s pragmatic society could see
parents/managers influencing the young target audience; and the lack of indulgence could
reduce demand for the product due to the restraint from purchasing in indulgent goods.
Using Hall and Hall’s (1960) cultural context concept, Hooker (2008) found that Australia
has a low-context culture, whereas Russia is considered high-context. Low-context cultures
are more explicit in their spoken and written language to convey meaning (Hollensen 2013);
high-context cultures use background information to develop understanding (Hooker 2008).
This difference in culture could cause confusion or problems for a standardised product.
The main language in Australia is English; with less than 10% of Russia’s population
speaking an ‘other’ language (CIA 2014), linguistic differences must be considered.
According to Drinks International (2010), Russia currently has a non-existent cider market,
but the growth in youth population has the potential to make it the next key market. In
comparison, Roy Morgan Research (Cited by AGN 2013) found that “the number of young
Australians drinking cider in an average four week period has almost doubled in the last two
years”.
11
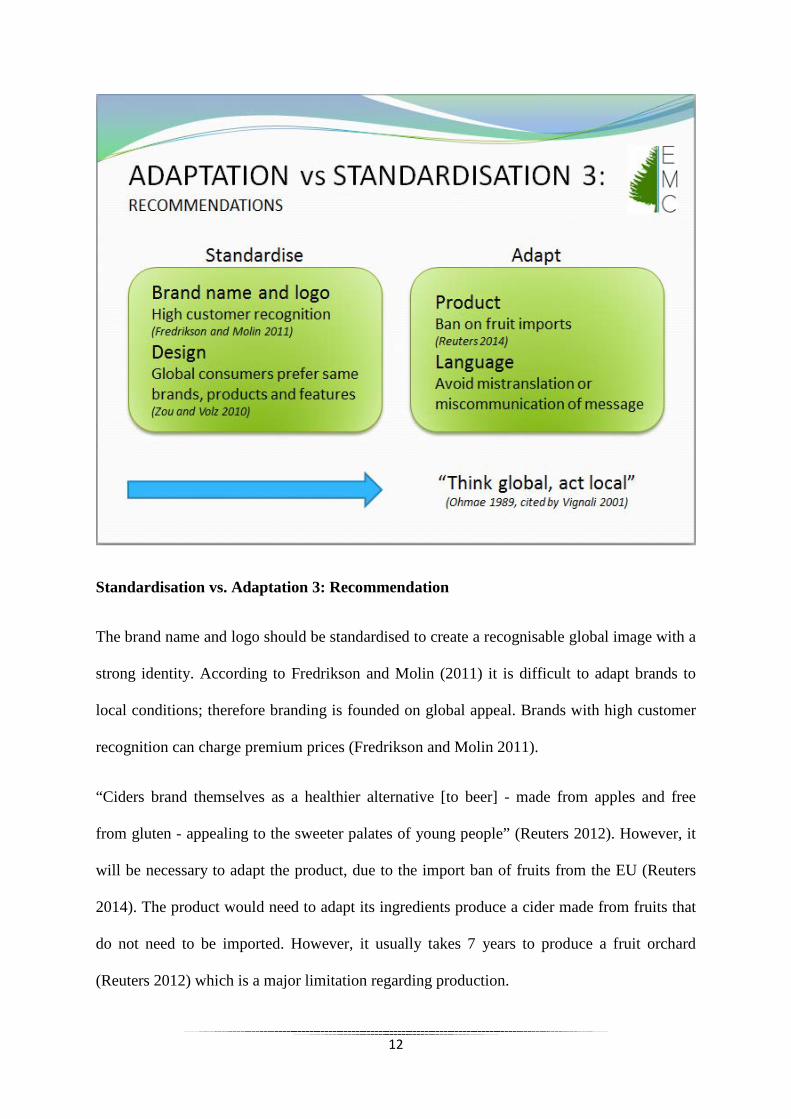
Standardisation vs. Adaptation 3: Recommendation
The brand name and logo should be standardised to create a recognisable global image with a
strong identity. According to Fredrikson and Molin (2011) it is difficult to adapt brands to
local conditions; therefore branding is founded on global appeal. Brands with high customer
recognition can charge premium prices (Fredrikson and Molin 2011).
“Ciders brand themselves as a healthier alternative [to beer] - made from apples and free
from gluten - appealing to the sweeter palates of young people” (Reuters 2012). However, it
will be necessary to adapt the product, due to the import ban of fruits from the EU (Reuters
2014). The product would need to adapt its ingredients produce a cider made from fruits that
do not need to be imported. However, it usually takes 7 years to produce a fruit orchard
(Reuters 2012) which is a major limitation regarding production.
12
The language used on the product should be adapted to ensure no mistranslation or
miscommunication in message, although the rest of the design features should remain the
same as global consumers increasingly prefer the same products and their features (Zou and
Volz 2010).
Our recommendation is to “think global, act local” (Ohmae 1989) by standardising some
elements and adapting others. This falls into Strategy 2 of Sandler and Shani’s (1991)
classification of branding decisions (Appendix 2.3.1)(cited by Vignali 2001).
13
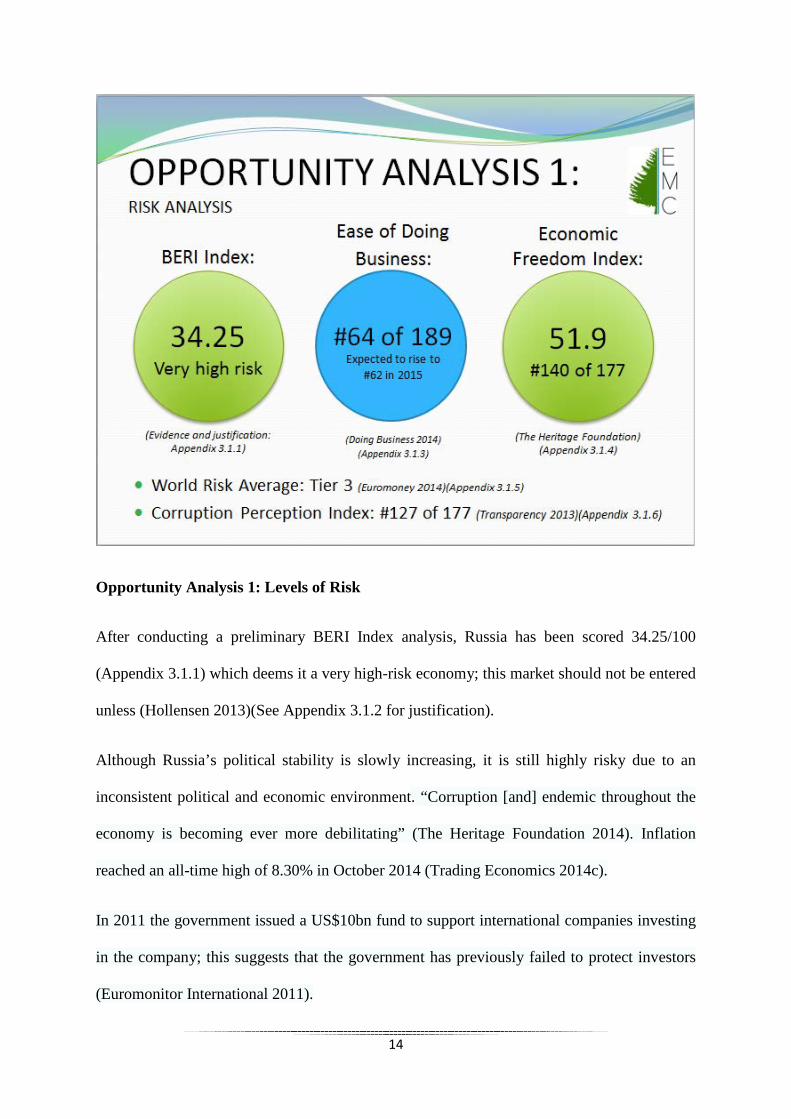
Opportunity Analysis 1: Levels of Risk
After conducting a preliminary BERI Index analysis, Russia has been scored 34.25/100
(Appendix 3.1.1) which deems it a very high-risk economy; this market should not be entered
unless (Hollensen 2013)(See Appendix 3.1.2 for justification).
Although Russia’s political stability is slowly increasing, it is still highly risky due to an
inconsistent political and economic environment. “Corruption [and] endemic throughout the
economy is becoming ever more debilitating” (The Heritage Foundation 2014). Inflation
reached an all-time high of 8.30% in October 2014 (Trading Economics 2014c).
In 2011 the government issued a US$10bn fund to support international companies investing
in the company; this suggests that the government has previously failed to protect investors
(Euromonitor International 2011).
14
Russia is an advanced country regarding communications, with 61.4% of the population
using the internet (The World Bank 2014).
Other risk-evaluating indicators have been acknowledged and found Russia #64/89 for ease
of doing business (Doing Business 2014)(Appendix 3.1.3). The Economic Freedom Index
score for Russia is #140/177 (The Heritage Foundation 2014)(Appendix 3.1.4). According to
Euromoney (2014) the World Risk Average is ranked in Tier 3 (Appendix 3.1.5).
15
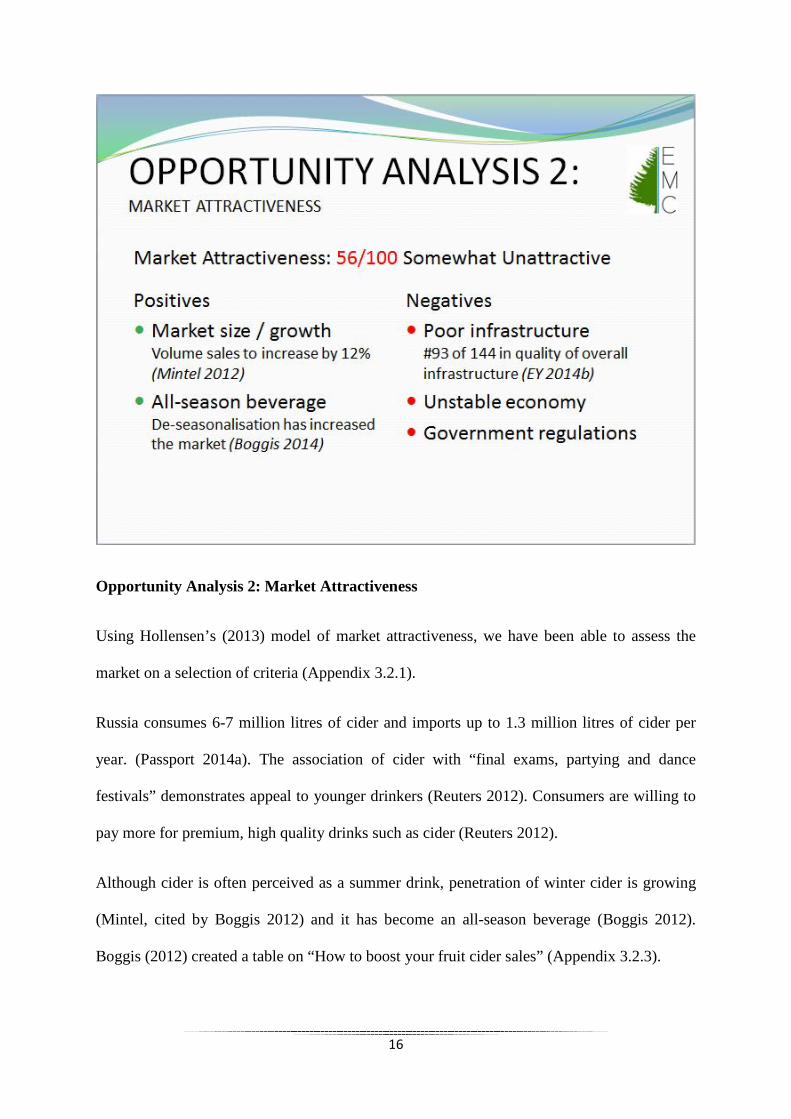
Opportunity Analysis 2: Market Attractiveness
Using Hollensen’s (2013) model of market attractiveness, we have been able to assess the
market on a selection of criteria (Appendix 3.2.1).
Russia consumes 6-7 million litres of cider and imports up to 1.3 million litres of cider per
year. (Passport 2014a). The association of cider with “final exams, partying and dance
festivals” demonstrates appeal to younger drinkers (Reuters 2012). Consumers are willing to
pay more for premium, high quality drinks such as cider (Reuters 2012).
Although cider is often perceived as a summer drink, penetration of winter cider is growing
(Mintel, cited by Boggis 2012) and it has become an all-season beverage (Boggis 2012).
Boggis (2012) created a table on “How to boost your fruit cider sales” (Appendix 3.2.3).
16
Russia has fallen to #93 of 144 in quality of overall infrastructure in The Global
Competitiveness Report 2013–2014 (EY 2014b) which has caused a barrier to growth
(Reuters 2013b).
As previously discussed, Russia has high political and economic stability (Appendix 3.1.2)
and has a high psychic distance; Russians are extremely pragmatic, have an implicit
communication style and controlled indulgence of desires (The Hofstede Centre
2014)(Appendix 2.2.2).
Russia has a legal drinking age of 18 (ICAP 2013) and a complete ban on alcohol advertising
(Euromonitor 2014).
Taking all these factors into account, the market attractiveness has been scored 56/100,
making it somewhat unattractive.
17
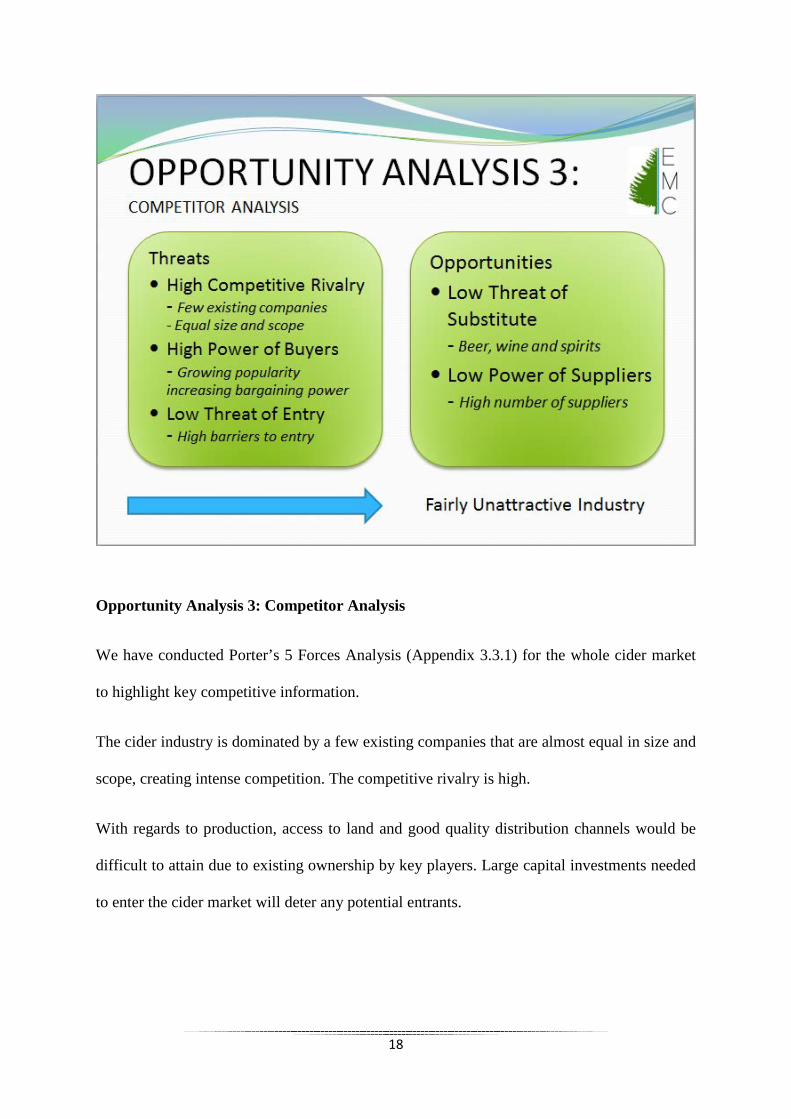
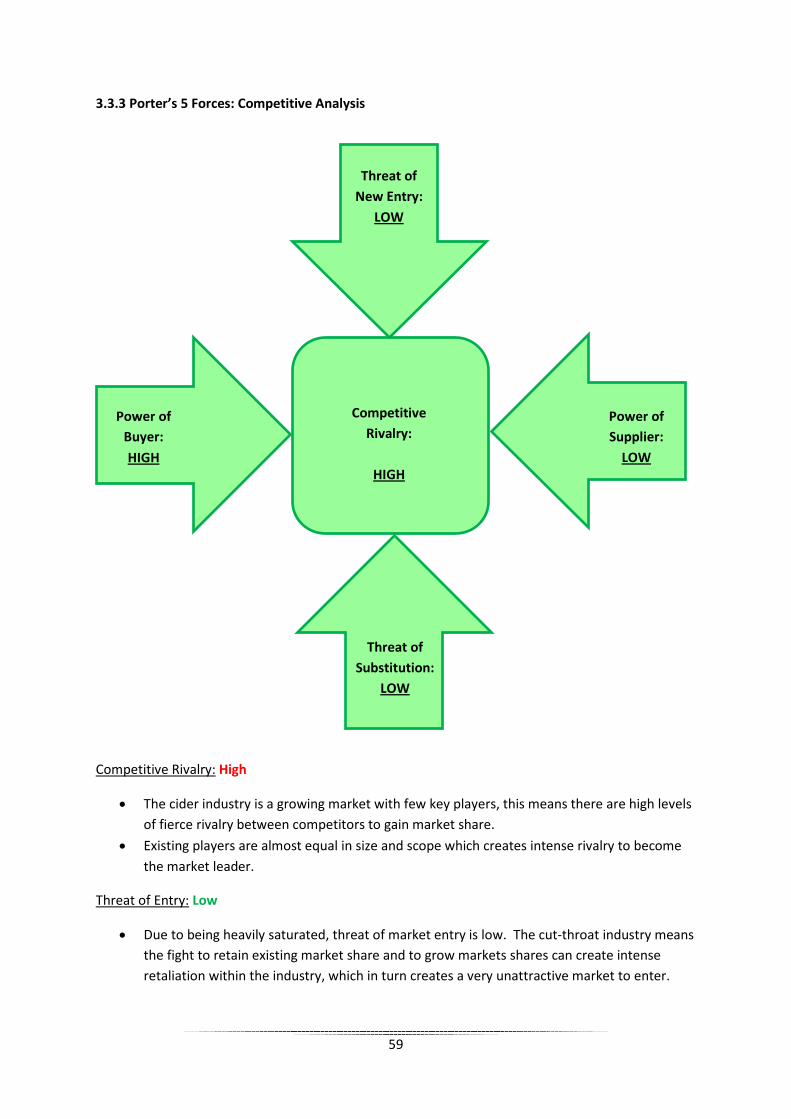
Opportunity Analysis 3: Competitor Analysis
We have conducted Porter’s 5 Forces Analysis (Appendix 3.3.1) for the whole cider market
to highlight key competitive information.
The cider industry is dominated by a few existing companies that are almost equal in size and
scope, creating intense competition. The competitive rivalry is high.
With regards to production, access to land and good quality distribution channels would be
difficult to attain due to existing ownership by key players. Large capital investments needed
to enter the cider market will deter any potential entrants.
18
Popularity of cider is growing within the EU which is increasing the bargaining power of
buys due to growing demand. The small number of key players within the industry means
suppliers are in demand of their business, in turn increasing buyer power.
Beer, wine and spirits offer differentiation within the alcohol industry, which threatens as a
substitute. Other threats include non-alcoholic ciders and home-brewed cider.
Government regulations can restrict the power of suppliers with regards to pricing and
taxation. High numbers of suppliers within the industry also reduces supplier power.
Taking this information into consideration, we have established that cider is a highly
competitive industry and is fairly unattractive.
19
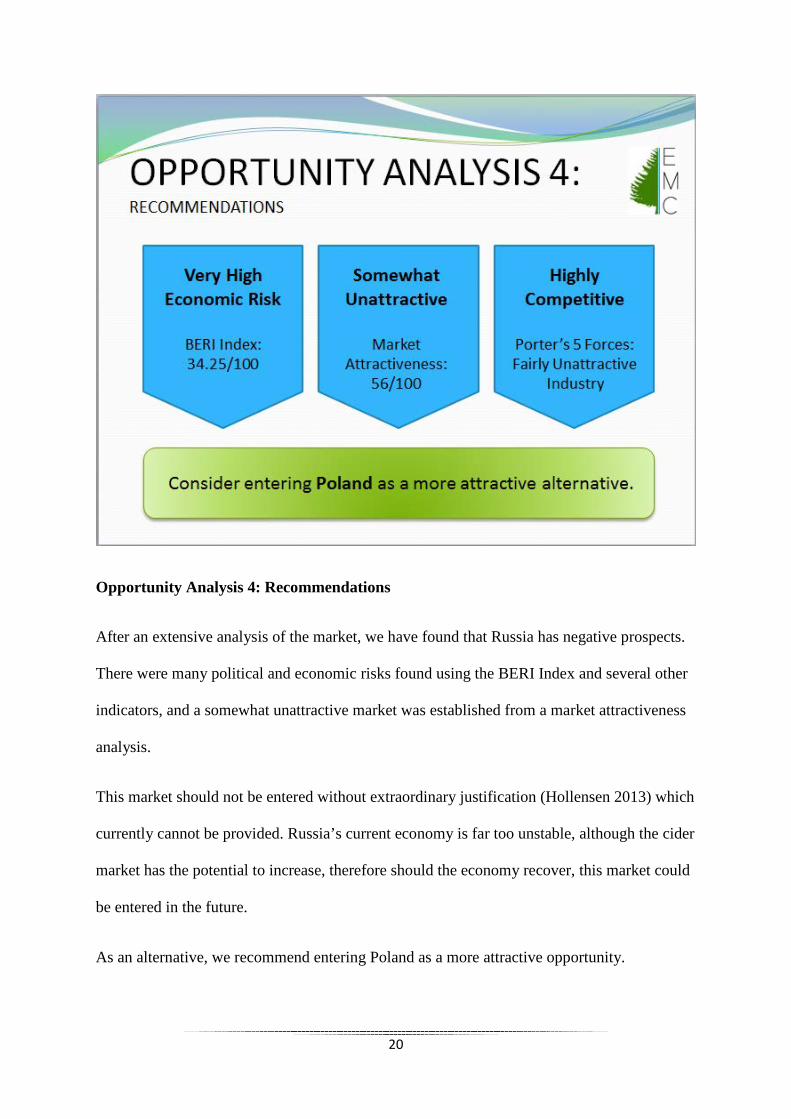
Opportunity Analysis 4: Recommendations
After an extensive analysis of the market, we have found that Russia has negative prospects.
There were many political and economic risks found using the BERI Index and several other
indicators, and a somewhat unattractive market was established from a market attractiveness
analysis.
This market should not be entered without extraordinary justification (Hollensen 2013) which
currently cannot be provided. Russia’s current economy is far too unstable, although the cider
market has the potential to increase, therefore should the economy recover, this market could
be entered in the future.
As an alternative, we recommend entering Poland as a more attractive opportunity.
20
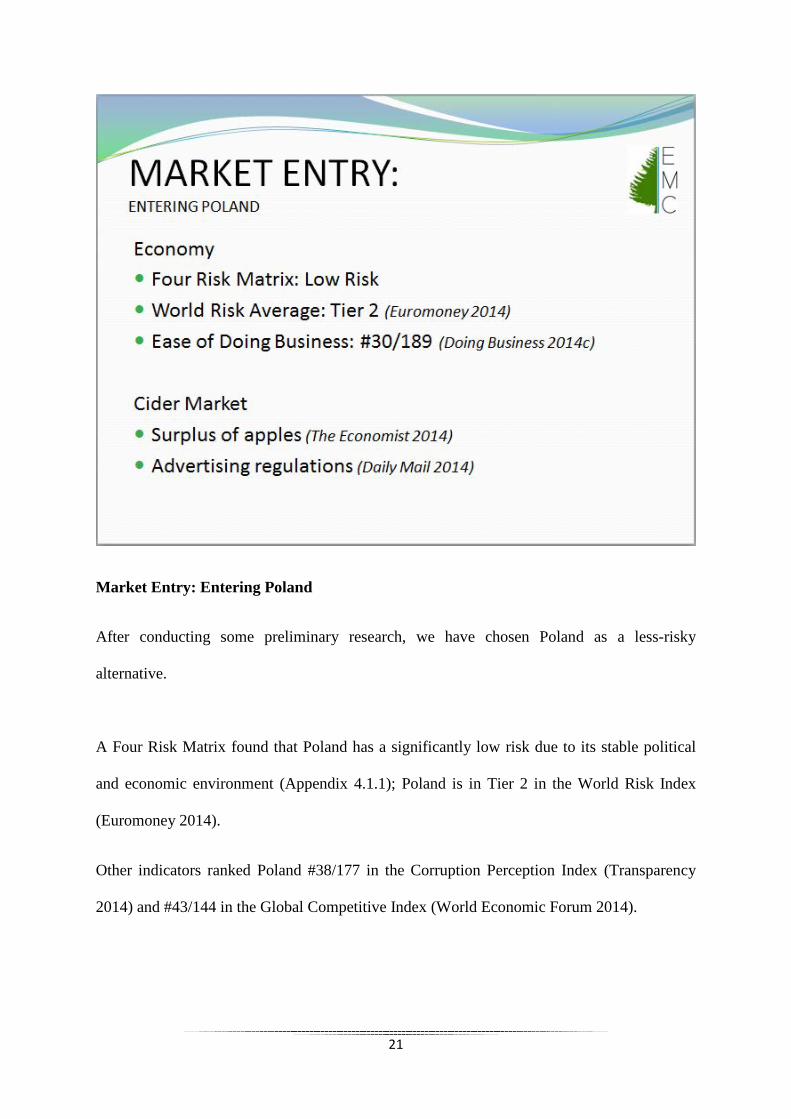
Market Entry: Entering Poland
After conducting some preliminary research, we have chosen Poland as a less-risky
alternative.
A Four Risk Matrix found that Poland has a significantly low risk due to its stable political
and economic environment (Appendix 4.1.1); Poland is in Tier 2 in the World Risk Index
(Euromoney 2014).
Other indicators ranked Poland #38/177 in the Corruption Perception Index (Transparency
2014) and #43/144 in the Global Competitive Index (World Economic Forum 2014).
21

56% of Poland’s apple exports went to Russia last year; however, the Russian ban on EU
imports will leave Poland with a huge surplus of apples (The Economist 2014). Poland’s
Economic Ministry has suggested exempting cider from alcohol advertising restrictions
(Daily Mail 2014) to encourage the consumption of cider.
The healthy economy combined with a surplus of raw materials available to manufacture this
product provides a promising venture for Savoureux Cidre in Poland.
22
Appendix 1: Global Youth Market
1.1.1 Youth Definition Justification
“Many countries also draw a line on youth at the age at which a person is given equal treatment under the law – often referred to as the "age of majority’. This age is often 18 in many countries, and once a person passes this age, they are considered to be an adult. However, the operational definition and nuances of the term ‘youth’ often vary from country to country, depending on the specific socio-cultural, institutional, economic and political factors” (United Nations, n.d.).
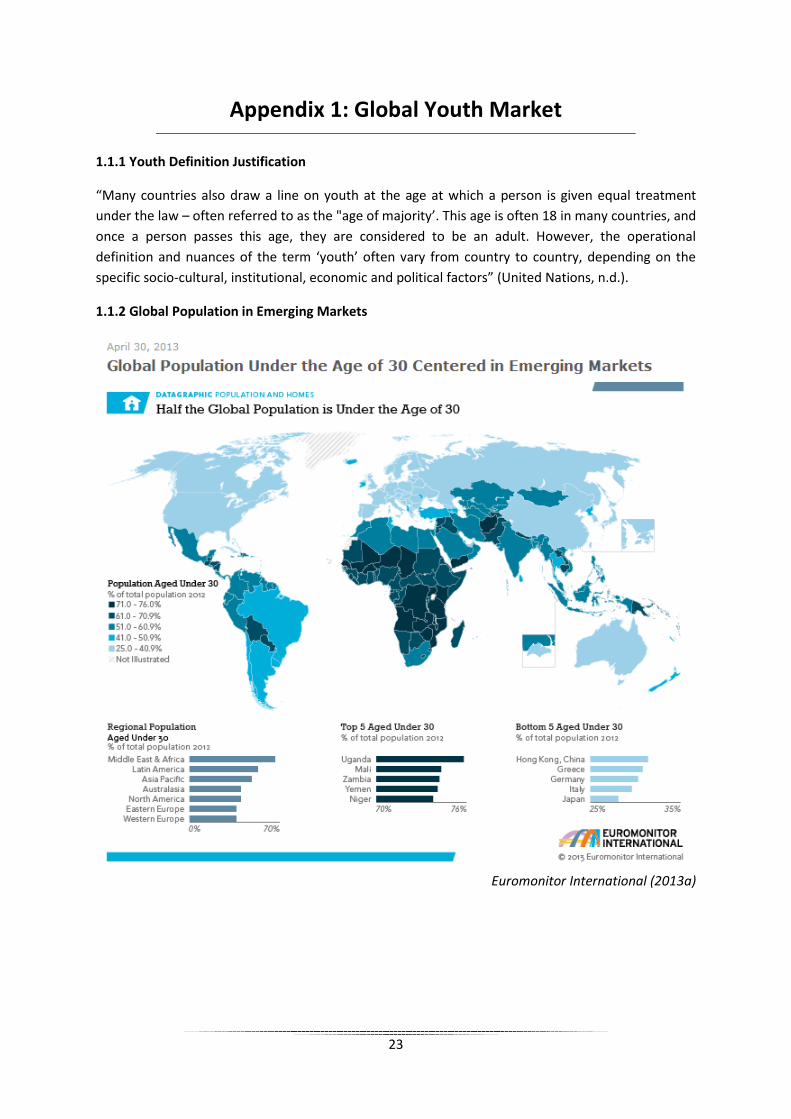
1.1.2 Global Population in Emerging Markets
Euromonitor International (2013a)
23
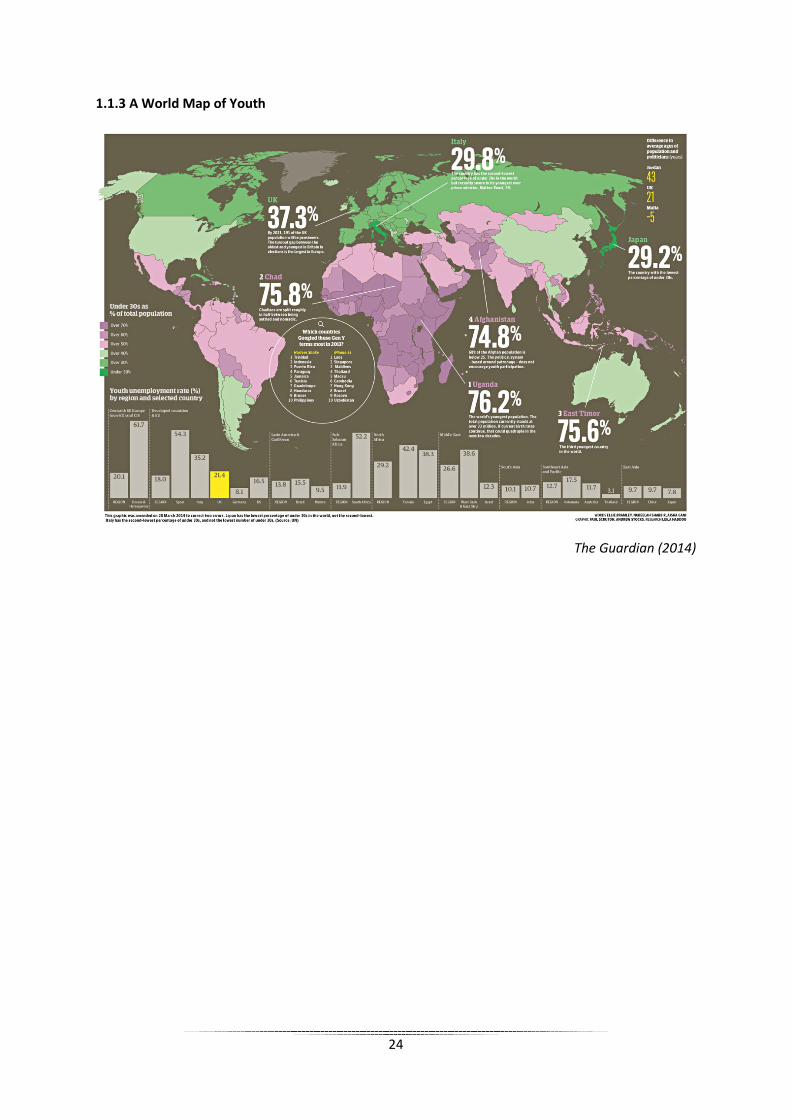
1.1.3 A World Map of Youth
The Guardian (2014)
24
1.2.1 Macro-Environmental Analysis of the Youth Market
Political • “Several political scientists have argued that there is a connection between a "youth bulge"
and increased unrest” (The Guardian 2014). • 1.65% of parliamentarians around the world are in their 20s and 11.87 % are in their 30s
(United Nations 2013b). • Legal voting age ranges from 16-21 years of age, with the vast majority being age 18 (White
2014)(See appendix 1.2.8). • 21 of the OECD’s 30 member countries have statutory minimum wages, and in just over half
of these countries minimum wages have risen slightly faster than average wage levels in recent years (Martin 2007)(See appendix 1.2.10).
• Low levels of electoral turnout among young voters - apathetic and part of a generation that does not care about political issues (Harrison et al 2013).
Economic • The labour market outlook for young people worsened in nearly every region of the world.
The global youth unemployment rate rose to 13.1% in 2013 (ILO 2014)(See appendix 1.2.4). • The share of young people (aged 15–29) that are neither in employment, nor in education or
training (NEET) has risen in 30 out of the 40 countries for which data are available for 2007 and 2011–12 (ILO 2014)(See appendix 1.2.5).
• The high cost of living, job losses, mounting student loans and the need to save more for first homes are pushing more young adults into delaying taking the steps that traditionally represent movement into adult life (Euromonitor International 2012a).
• As of April 2014, of 198 countries, 122 countries (62%) have a National Youth Policy, up from 99 (50%) in 2013 (See appendix 1.2.6)(Youth Policy 2014).
• Over the four years since the onset of the crisis, young people (aged 18 to 25) suffered the most severe income losses (OECD 2014)(See appendix 1.2.9).
• “Analysts cited by Bloomberg are saying that it may be time to ease off targeting the youth market. They’re young, and they may be trend setters, but odds are they’re still not the best customers — because they just don’t have much money to spend” (Tuttle 2012).
• Young people reported having the least disposable income, with 18-24 year-olds averaging £174.20 – some 22% below the overall UK average (Money Advice Service 2014).
Socio-cultural • The biggest issue facing young people is negative stereotyping (The Guardian 2009)(See
appendix 1.2.3). • “As youth populations rise, the argument goes, job prospects, resources and the opportunity
for social mobility fall. This can lead to social discontent, and then to unrest” (The Guardian 2014).
• Transmitting heritage values to young people favours intercultural understanding, respect for cultural diversity and helps create an environment propitious to a culture of peace (United Nations 2013c).
• Shopping is increasingly perceived as a hobby by youth rather than a necessity (Euromonitor 2012a).
• In all regions, by the age of 24, young women’s labour force participation trails young men’s (World Bank 2010, cited by UNESCO 2013).
Technological • 75% of 16-24 year olds feel they couldn't live without the internet (BBC News 2009). • “The Internet, in particular, enables youth to connect locally, nationally and internationally
in unparalleled ways. Young people are usually the early adopters of new technologies” (Taylor et al 2001 cited by Skinner et al 2002).
25
• Youth in emerging and developed economies alike are increasingly dependent on the internet; by the end of 2011, 45% of the 2.3 billion global internet users were younger than 25, and this demographic is projected to increase” (TechChange 2014).
• Large economic and regional disparities in global youths’ access to ICT - in 2012, just over 9% of Africans aged 15-24 had used the internet for five years, compared to 79% of European youths (TechChange 2014).
• Young adults are four times as likely as consumers aged 60+ to own internet-equipped mobile phones (40% versus 12%) (Euromonitor International 2012a).
• Kids are not addicted to technology; it's their friends and groups they're addicted to (Howe 2012, cited by Euromonitor International 2012a).
• The debate about what ICT represents for young people typically moves between two polarities; technology enthusiasts who believe that ICT will revolutionize every aspect of the world versus those who perceive ICT as a source of cultural invasion (Suoronta 2014).
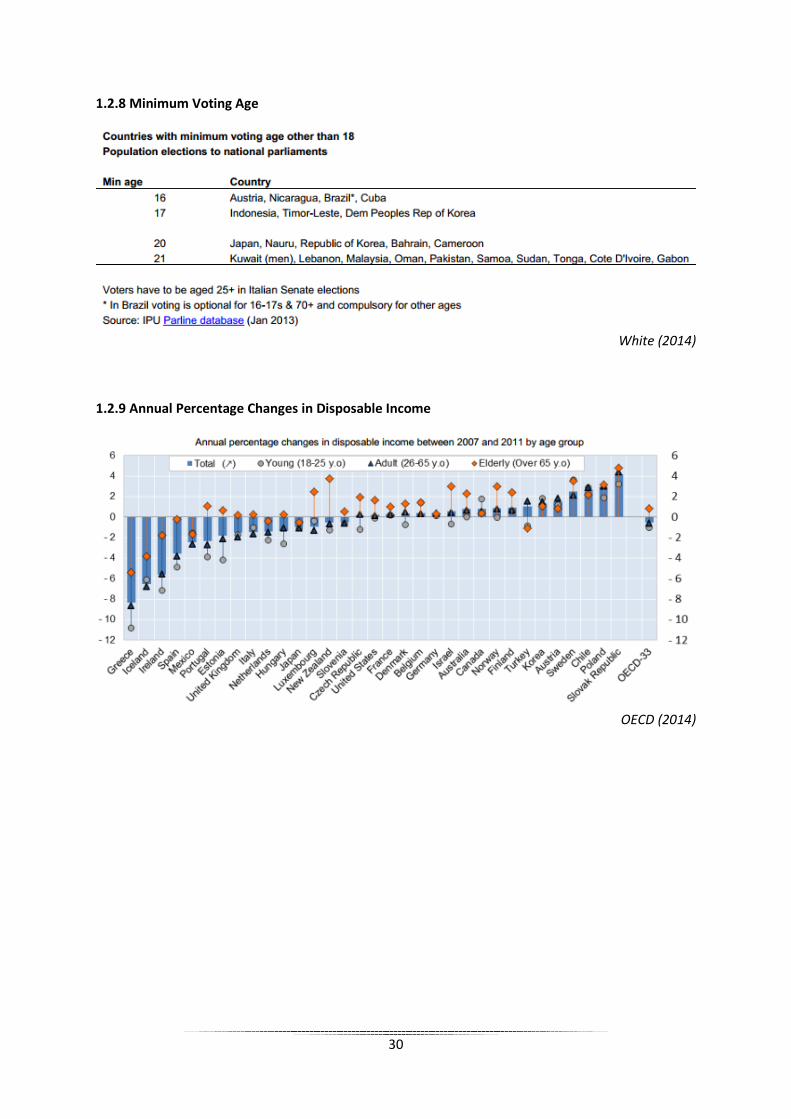
Legal • Youth crime is not transnational in its scope but it’s an international problem which raises
cross-national concerns (Hazel 2008). • The age of criminal responsibility ranges from 6-18 years old. The most common age (mode)
is 14 for 25% of countries (See appendix 1.2.7)(Hazel 2008). Environmental
• Environmental risks disproportionately affect young people, who have to live with the deteriorating environment bequeathed to them by earlier generations (Dryzek 2004).
• The role of youth is central to enhance global environmental awareness, for it is in the rising generations that heightened awareness can more easily be achieved (Dryzek 2004).
• Climate change potentially represents a major threat to the health and socio-economic stability of youth, particularly in developing countries (United Nations 2010).
26
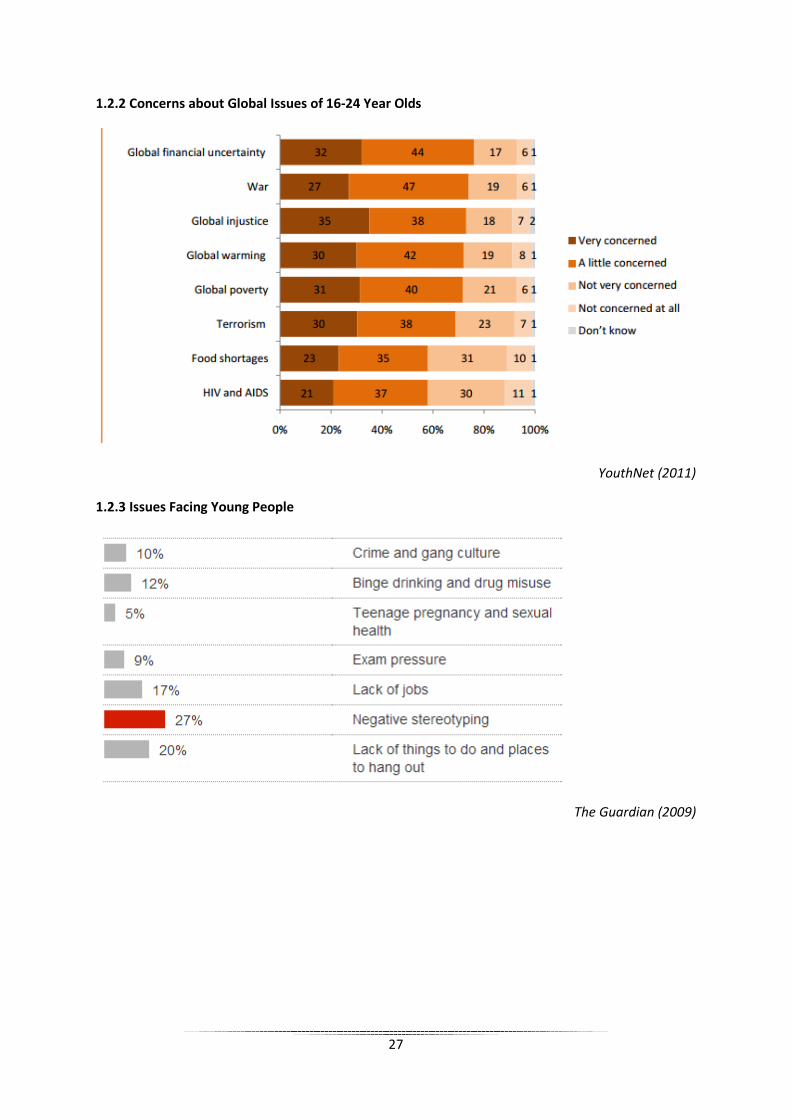
1.2.2 Concerns about Global Issues of 16-24 Year Olds
YouthNet (2011)
1.2.3 Issues Facing Young People
The Guardian (2009)
27
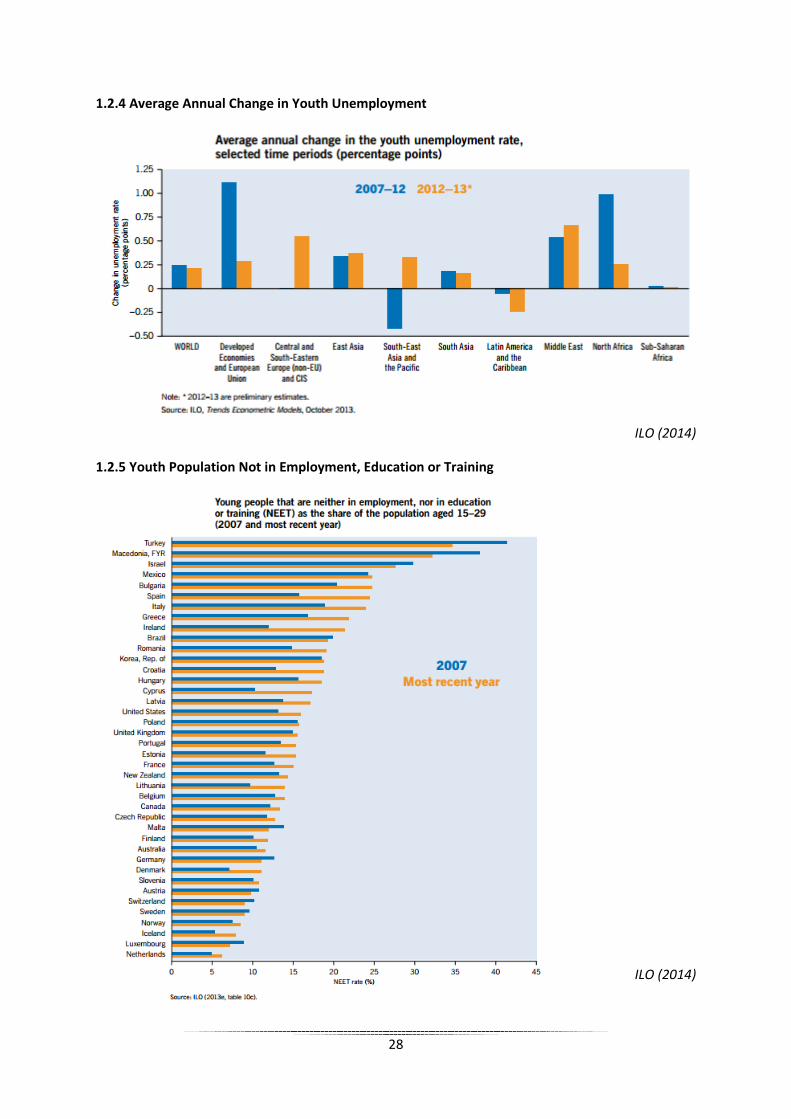
1.2.4 Average Annual Change in Youth Unemployment
ILO (2014)
1.2.5 Youth Population Not in Employment, Education or Training
ILO (2014)
28
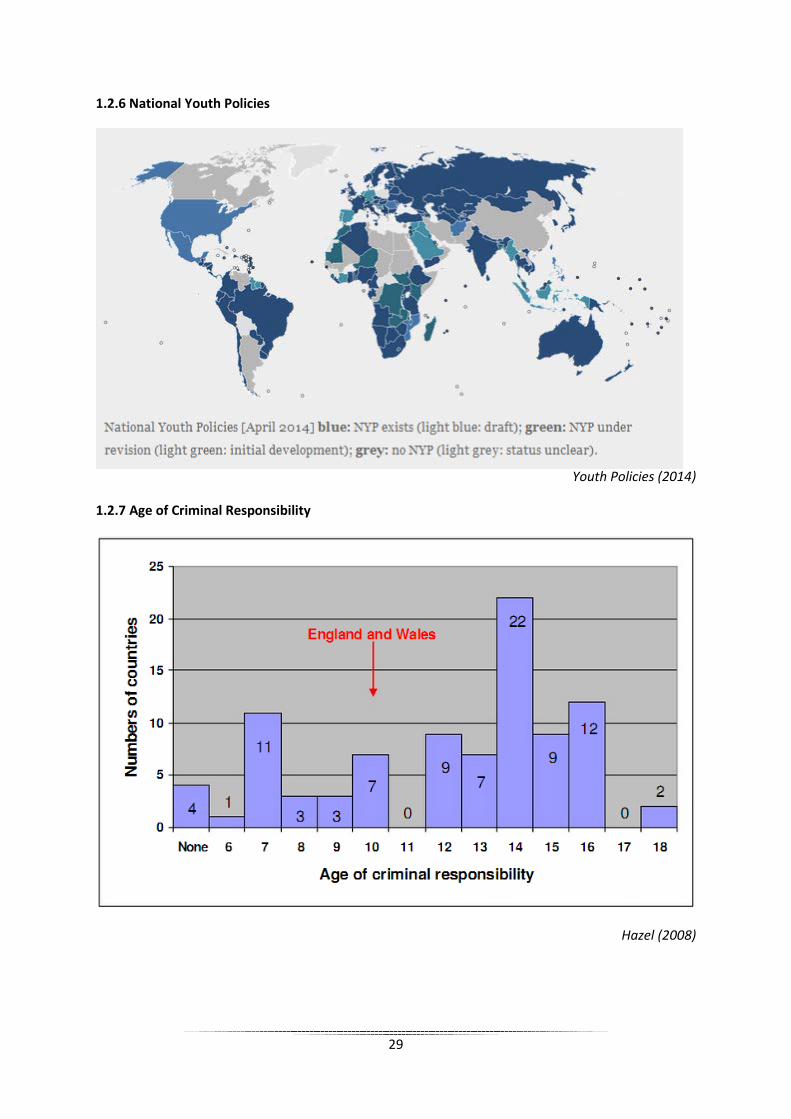
1.2.6 National Youth Policies
Youth Policies (2014)
1.2.7 Age of Criminal Responsibility
Hazel (2008)
29
1.2.8 Minimum Voting Age
White (2014)
1.2.9 Annual Percentage Changes in Disposable Income
OECD (2014)
30
1.2.10 After-Tax Value of Hourly Minimum Wage
OECD (2007)
31
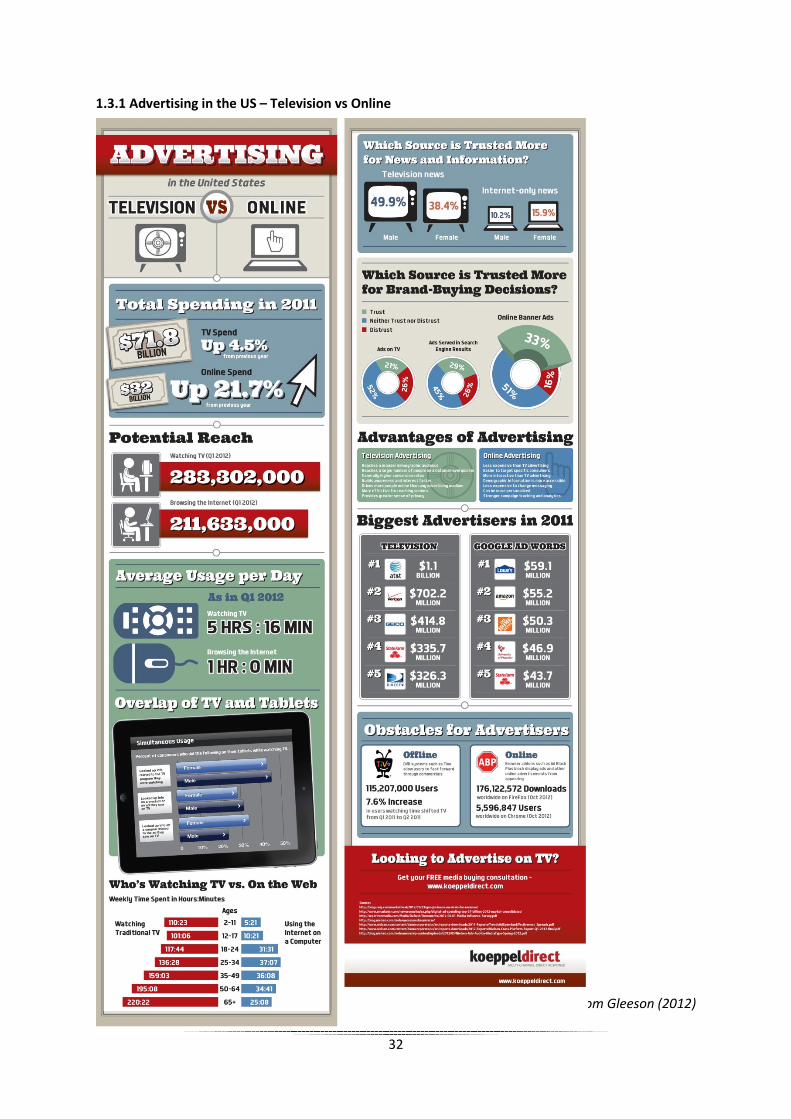
1.3.1 Advertising in the US – Television vs Online
Adapted from Gleeson (2012)
32
Appendix 2: Standardisation vs. Adaptation
2.1.1 Main Factors Favouring Standardization versus Adaptation
Hollensen (2013)
2.1.2 Toward Standardisation or Adaptation: A Conceptualisation
Vrontis (2001b)
33
2.1.3 Multinational Companies Tactical Behaviour
Adapted from Vrontis (2001c)
34
2.2.1 Similarities and Differences between Australia and Russia
Similarities Differences Environment (Firsova and Taplin 2009)
- Two of the world’s geographically largest countries - 70% of population living in large cities (Australian Bureau of Statistics 2006) - Both rich in natural resources (rely on export for income) - Same MNE’s operate in both countries
Culture (Hofstede 2010) (Appendix 2.2.2)
- Power Distance - Individualism - Pragmatism - Indulgence Differences of more than 50
Culture (Hall and Hall 1960) (Appendix 2.2.3)
Australia: Low-context culture Russia: High-context culture
Language (CIA 2014a)
Australia: 76.8% English Russia: 96.3% Russian
Religion (CIA 2014b)
Australia 28.8% Protestant, 25.3% Catholic, 4.5% Christian Russia: 15-20% Orthodox, 10-15% Muslim, 2% Christian
Legal restrictions Legal minimum purchase/ consumption age: 18 (ICAP 2014)(Appendix 2.2.4)
Australia: Liquor restrictions by area Russia: Restricted accessibility, complete advertising ban (Euromonitor 2014)
Cider consumption Over-ice (Euromonitor 2011b) Australia: Cider consumption is increasing Russia: Non-existent cider market
35
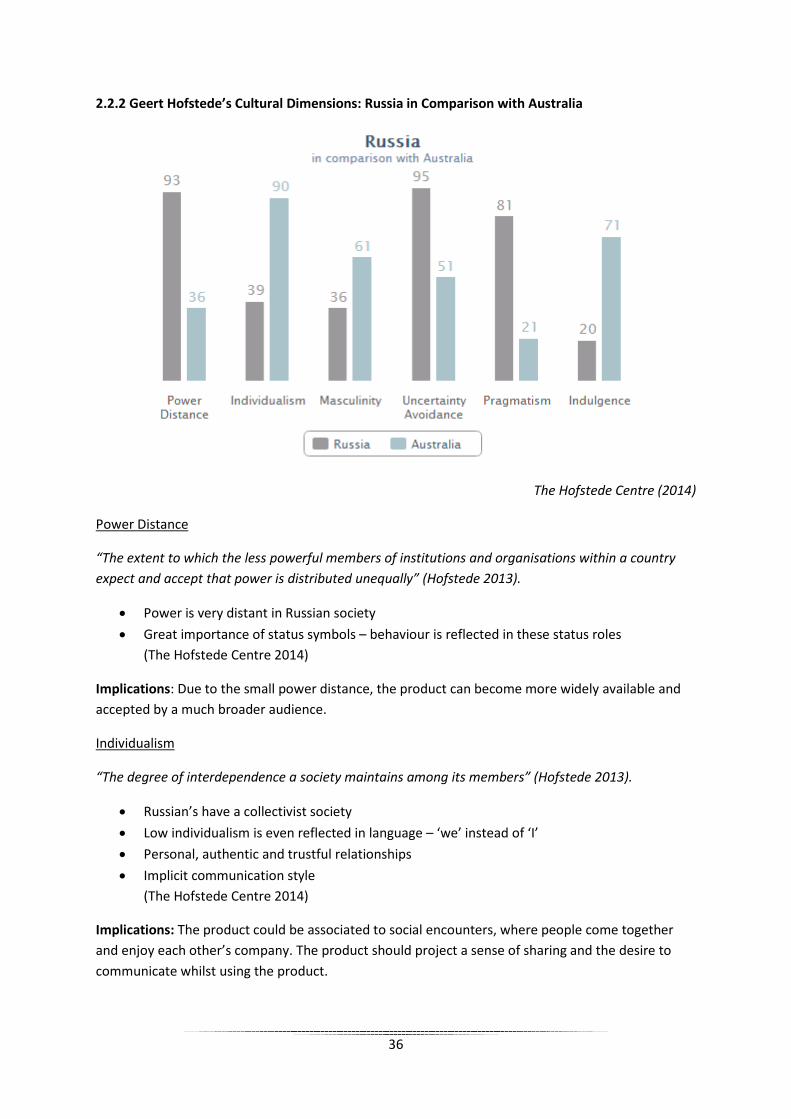
2.2.2 Geert Hofstede’s Cultural Dimensions: Russia in Comparison with Australia
The Hofstede Centre (2014)
Power Distance
“The extent to which the less powerful members of institutions and organisations within a country expect and accept that power is distributed unequally” (Hofstede 2013).
• Power is very distant in Russian society • Great importance of status symbols – behaviour is reflected in these status roles
(The Hofstede Centre 2014)
Implications: Due to the small power distance, the product can become more widely available and accepted by a much broader audience.
Individualism
“The degree of interdependence a society maintains among its members” (Hofstede 2013).
• Russian’s have a collectivist society • Low individualism is even reflected in language – ‘we’ instead of ‘I’ • Personal, authentic and trustful relationships • Implicit communication style
(The Hofstede Centre 2014)
Implications: The product could be associated to social encounters, where people come together and enjoy each other’s company. The product should project a sense of sharing and the desire to communicate whilst using the product.
36
Masculinity
“The fundamental issue here is what motivates people, wanting to be the best (masculine) or liking what you do (feminine)” (Hofstede 2013).
• Russian’s have a fairly feminine society • Modest about achievements • Dominant behaviour is not appreciated • Quality of life is a sign of success
(The Hofstede Centre 2014)
Implications: The product should recognise what type of society Russia is and create a more laid back, carefree message.
Uncertainty Avoidance
“The extent to which the members of a culture feel threatened by ambiguous or unknown situations and have created beliefs and institutions that try to avoid these” (Hofstede 2013).
• Russian’s avoid uncertainty – threatened by ambiguous situations • Appreciate context and background information • Formality is a sign of respect
(The Hofstede Centre 2014)
Implications: This could influence drinking behaviour; the product usage could be associated with certain occasions or events to give a sense of product context and structure.
Pragmatism
“How every society has to maintain some links with its own past while dealing with the challenges of the present and future” (Hofstede 2013).
• Russia is extremely pragmatic • Encourage education to prepare for the future • Perseverance in achieving results
(The Hofstede Centre 2014)
Implications: Strong influence from parent/managers could deter the young target audience.
Indulgence
“The extent to which people try to control their desires and impulses” (Hofstede 2013).
• Russia has a very restrained culture • Controlled gratification of desires • Actions are restrained by social norms – do not tend to indulge
(The Hofstede Centre)
Implications: Lack of indulgence may reduce demand for the product.
37
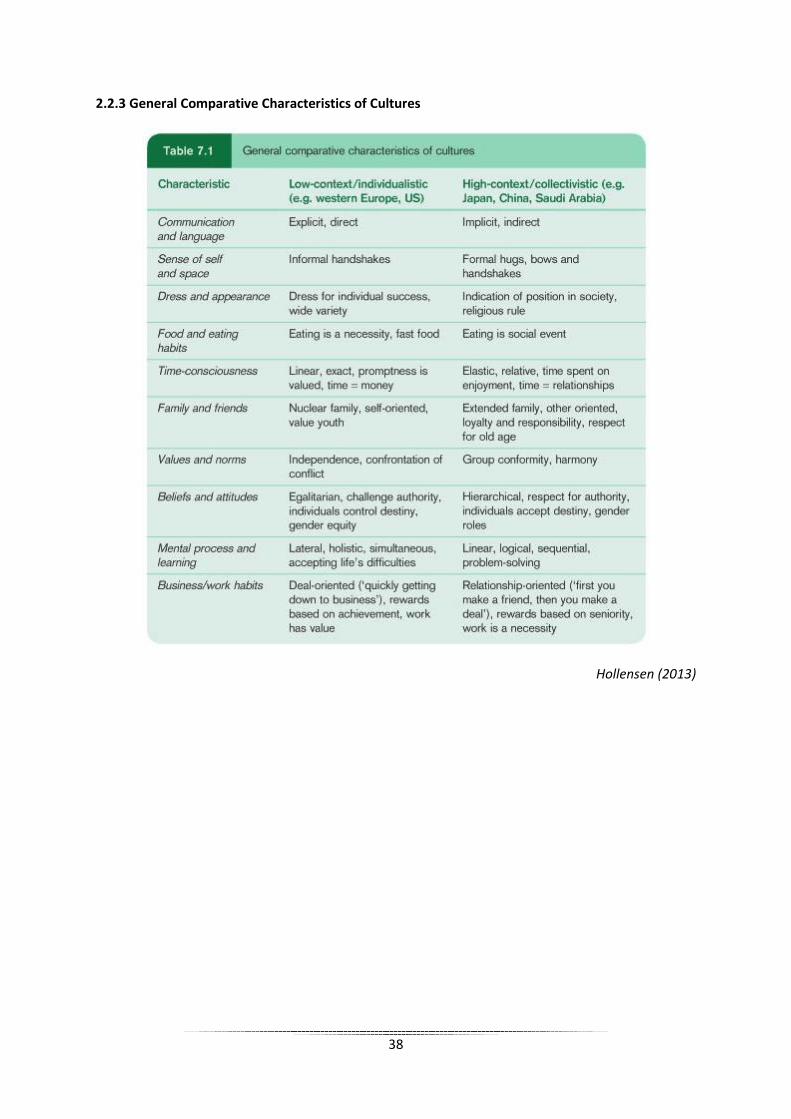
2.2.3 General Comparative Characteristics of Cultures
Hollensen (2013)
38
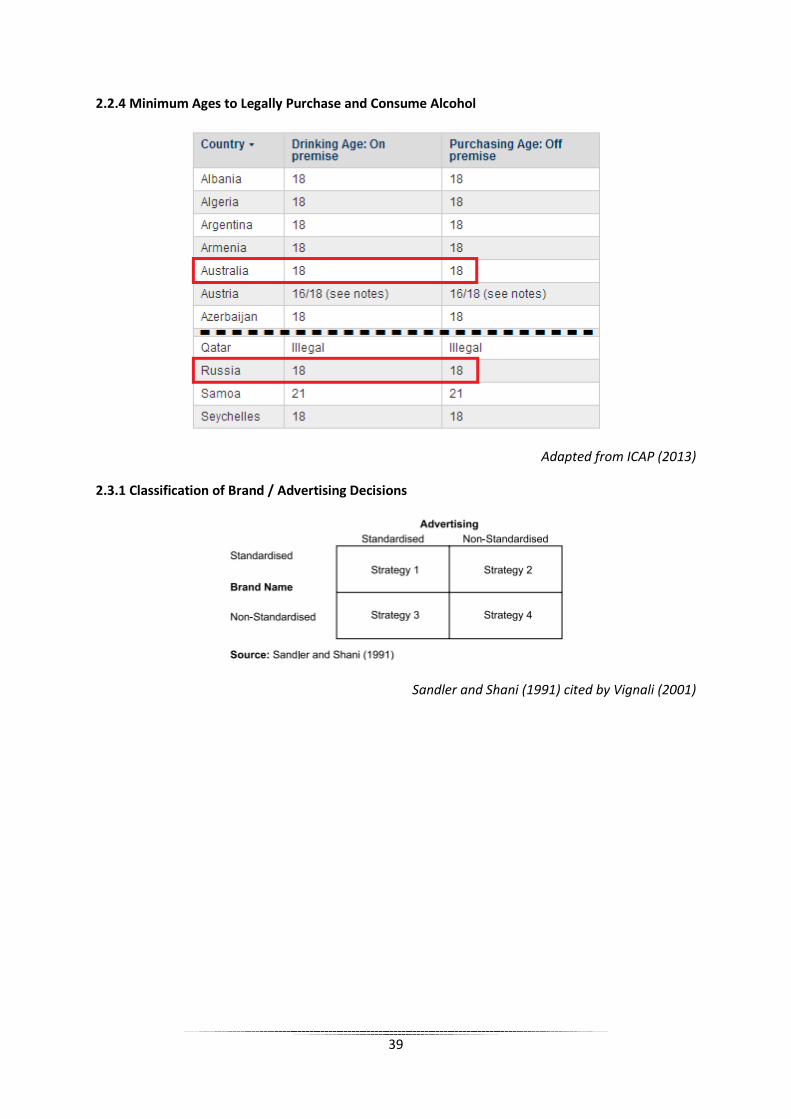
2.2.4 Minimum Ages to Legally Purchase and Consume Alcohol
Adapted from ICAP (2013)
2.3.1 Classification of Brand / Advertising Decisions
Sandler and Shani (1991) cited by Vignali (2001)
39
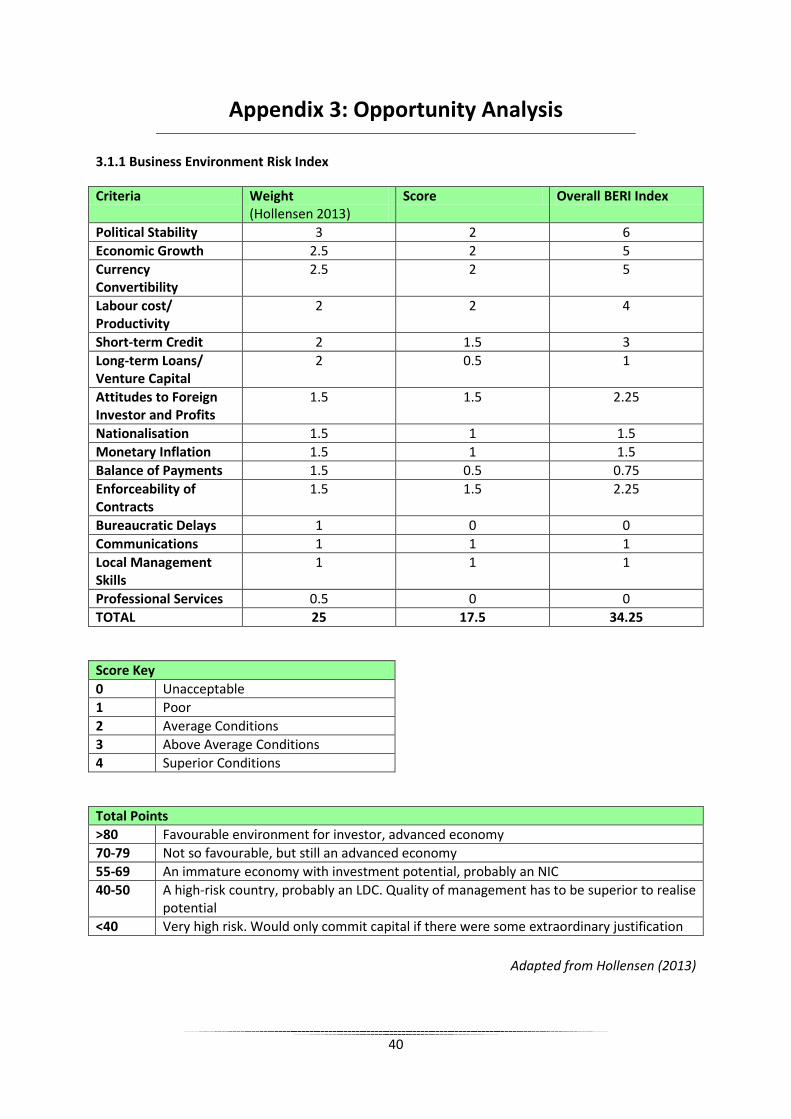
Appendix 3: Opportunity Analysis
3.1.1 Business Environment Risk Index
Criteria Weight (Hollensen 2013)
Score Overall BERI Index
Political Stability 3 2 6 Economic Growth 2.5 2 5 Currency Convertibility
2.5 2 5
Labour cost/ Productivity
2 2 4
Short-term Credit 2 1.5 3 Long-term Loans/ Venture Capital
2 0.5 1
Attitudes to Foreign Investor and Profits
1.5 1.5 2.25
Nationalisation 1.5 1 1.5 Monetary Inflation 1.5 1 1.5 Balance of Payments 1.5 0.5 0.75 Enforceability of Contracts
1.5 1.5 2.25
Bureaucratic Delays 1 0 0 Communications 1 1 1 Local Management Skills
1 1 1
Professional Services 0.5 0 0 TOTAL 25 17.5 34.25
Score Key 0 Unacceptable 1 Poor 2 Average Conditions 3 Above Average Conditions 4 Superior Conditions
Total Points >80 Favourable environment for investor, advanced economy 70-79 Not so favourable, but still an advanced economy 55-69 An immature economy with investment potential, probably an NIC 40-50 A high-risk country, probably an LDC. Quality of management has to be superior to realise
potential <40 Very high risk. Would only commit capital if there were some extraordinary justification
Adapted from Hollensen (2013)
40
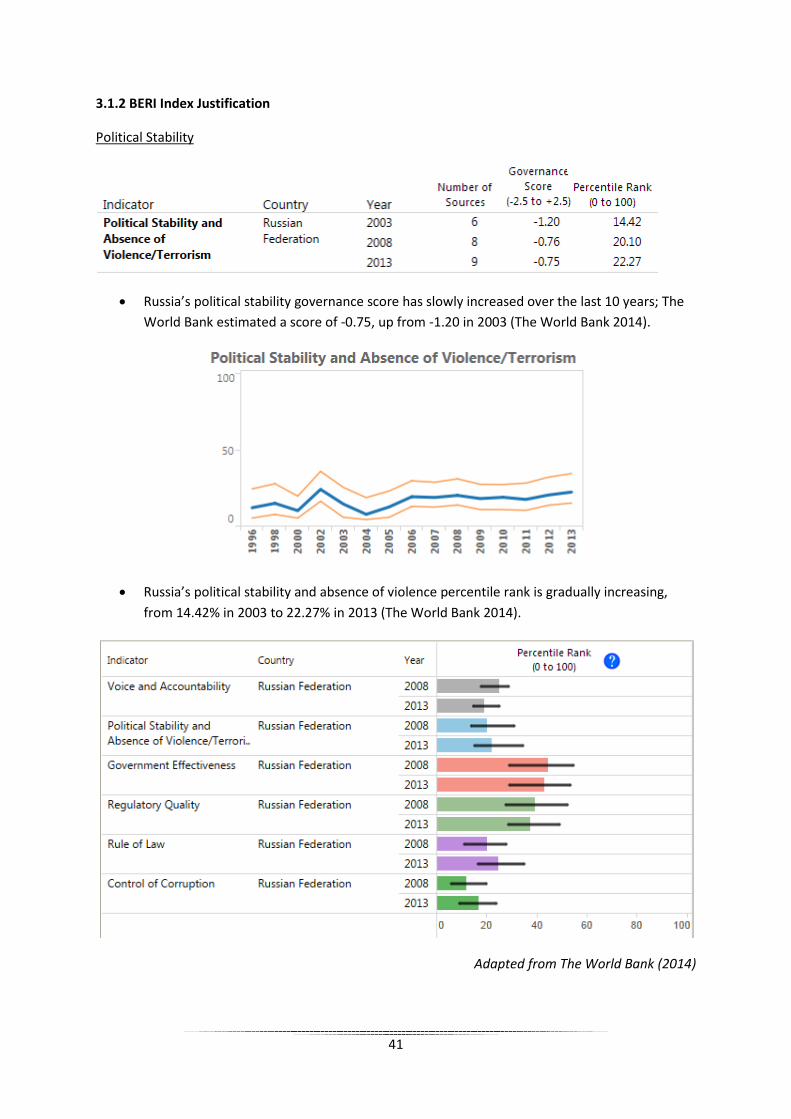
3.1.2 BERI Index Justification
Political Stability
• Russia’s political stability governance score has slowly increased over the last 10 years; The World Bank estimated a score of -0.75, up from -1.20 in 2003 (The World Bank 2014).
• Russia’s political stability and absence of violence percentile rank is gradually increasing, from 14.42% in 2003 to 22.27% in 2013 (The World Bank 2014).
Adapted from The World Bank (2014)
41
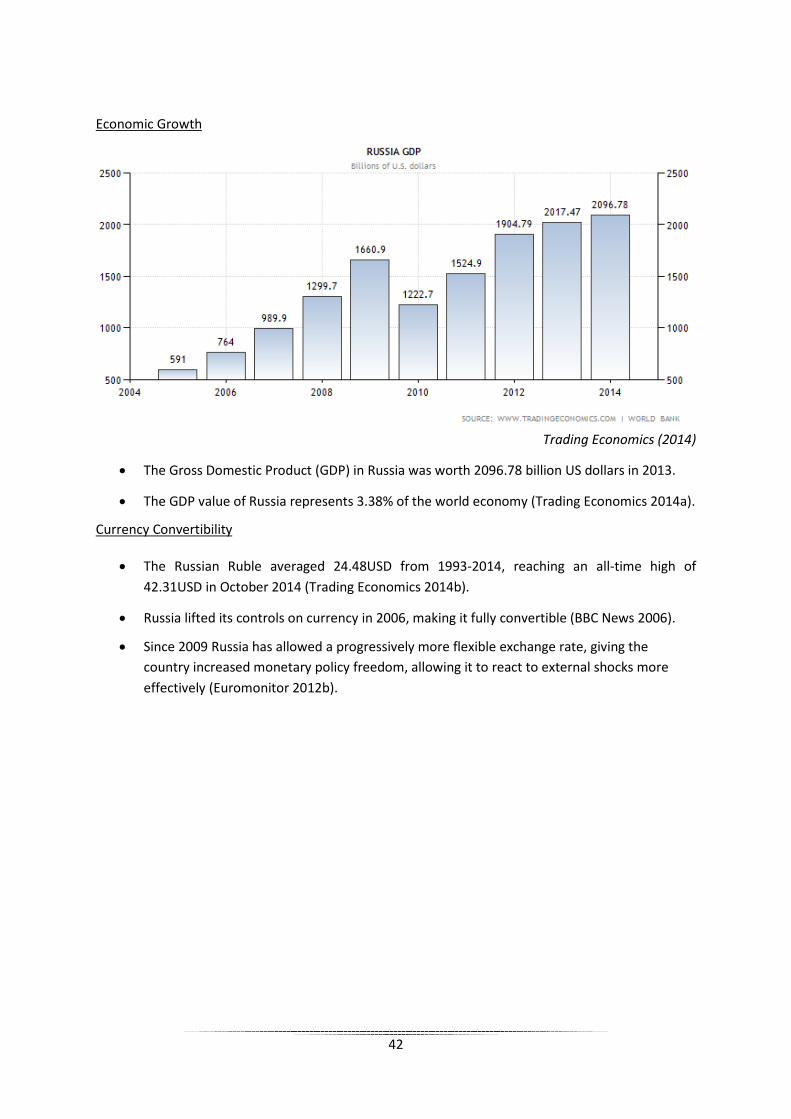
Economic Growth
Trading Economics (2014)
• The Gross Domestic Product (GDP) in Russia was worth 2096.78 billion US dollars in 2013.
• The GDP value of Russia represents 3.38% of the world economy (Trading Economics 2014a).
Currency Convertibility
• The Russian Ruble averaged 24.48USD from 1993-2014, reaching an all-time high of 42.31USD in October 2014 (Trading Economics 2014b).
• Russia lifted its controls on currency in 2006, making it fully convertible (BBC News 2006).
• Since 2009 Russia has allowed a progressively more flexible exchange rate, giving the country increased monetary policy freedom, allowing it to react to external shocks more effectively (Euromonitor 2012b).
42
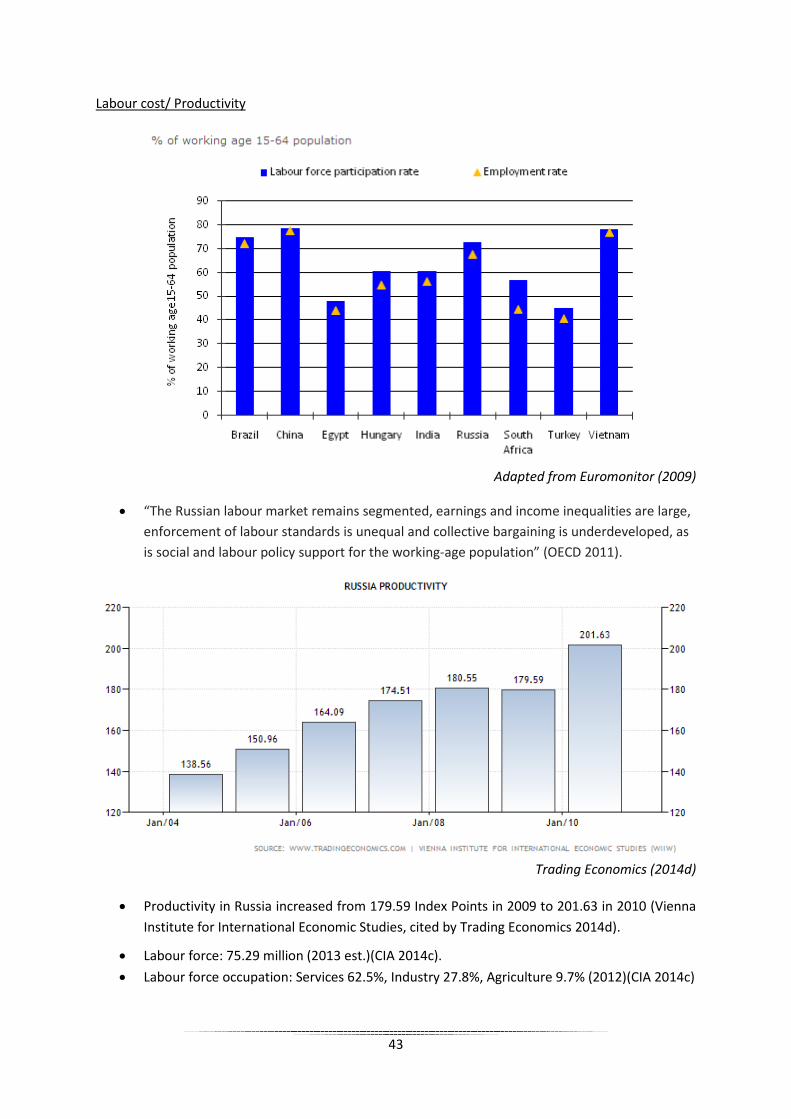
Labour cost/ Productivity
Adapted from Euromonitor (2009)
• “The Russian labour market remains segmented, earnings and income inequalities are large, enforcement of labour standards is unequal and collective bargaining is underdeveloped, as is social and labour policy support for the working-age population” (OECD 2011).
Trading Economics (2014d)
• Productivity in Russia increased from 179.59 Index Points in 2009 to 201.63 in 2010 (Vienna Institute for International Economic Studies, cited by Trading Economics 2014d).
• Labour force: 75.29 million (2013 est.)(CIA 2014c). • Labour force occupation: Services 62.5%, Industry 27.8%, Agriculture 9.7% (2012)(CIA 2014c)
43
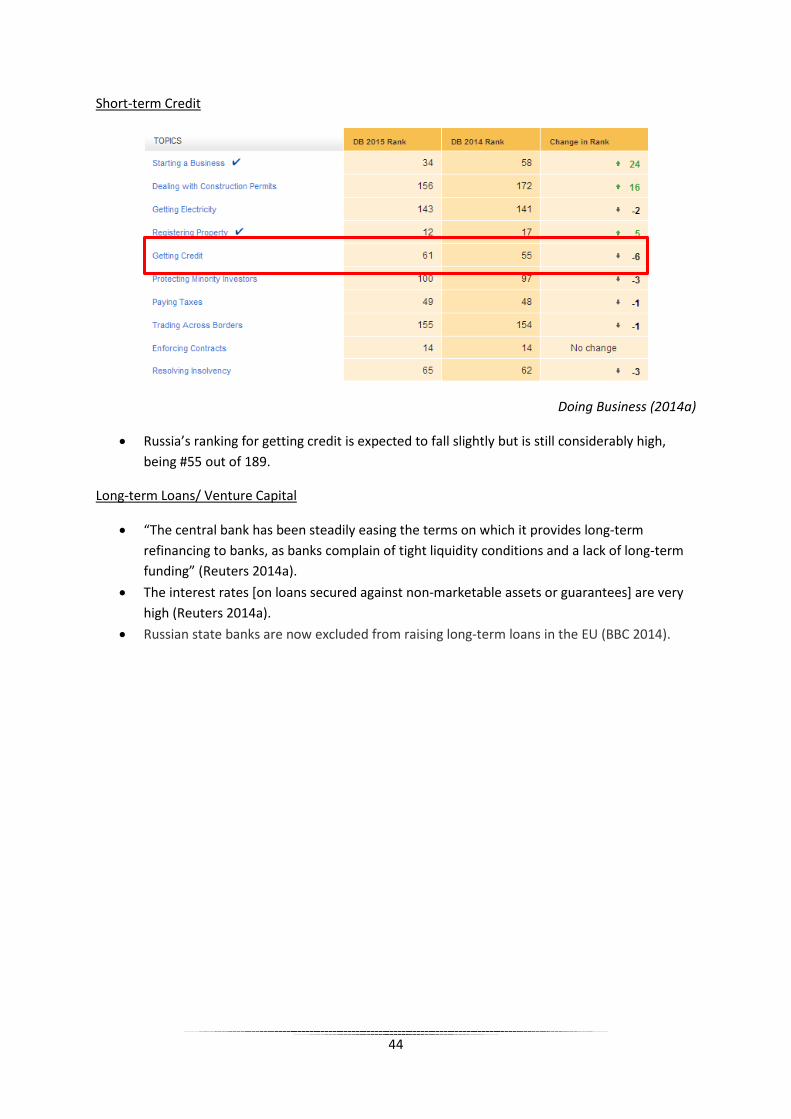
Short-term Credit
Doing Business (2014a)
• Russia’s ranking for getting credit is expected to fall slightly but is still considerably high, being #55 out of 189.
Long-term Loans/ Venture Capital
• “The central bank has been steadily easing the terms on which it provides long-term refinancing to banks, as banks complain of tight liquidity conditions and a lack of long-term funding” (Reuters 2014a).
• The interest rates [on loans secured against non-marketable assets or guarantees] are very high (Reuters 2014a).
• Russian state banks are now excluded from raising long-term loans in the EU (BBC 2014).
44
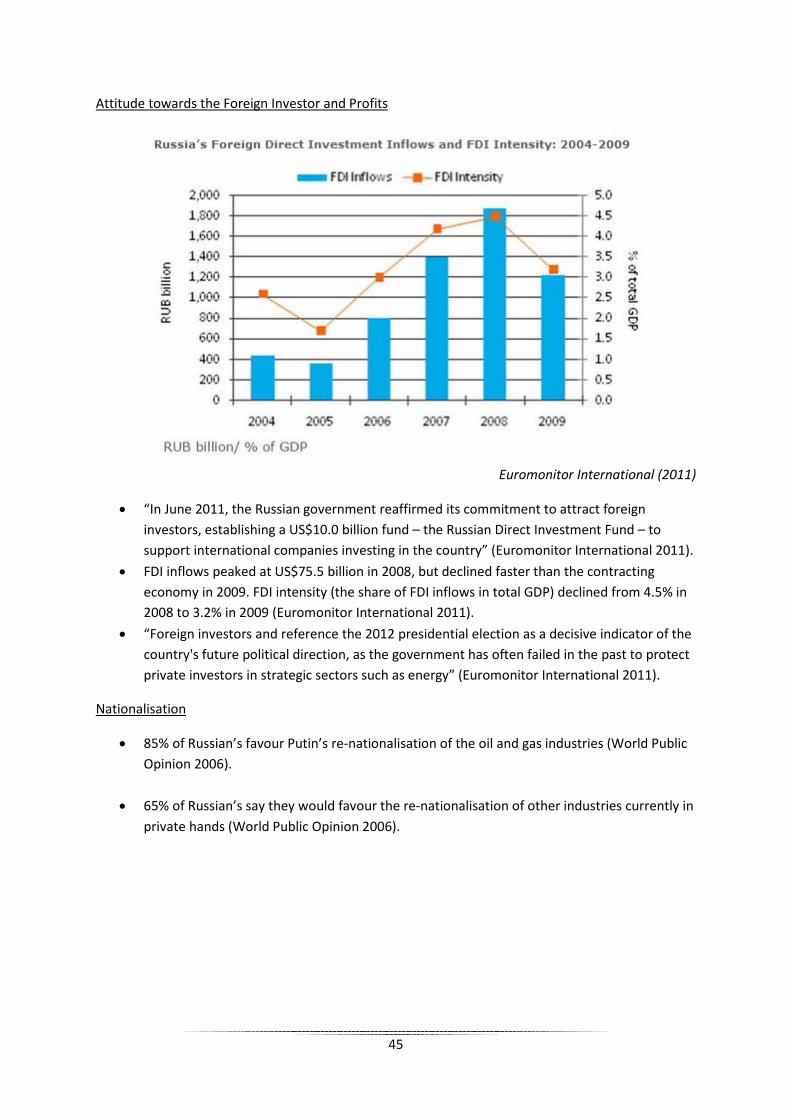
Attitude towards the Foreign Investor and Profits
Euromonitor International (2011)
• “In June 2011, the Russian government reaffirmed its commitment to attract foreign investors, establishing a US$10.0 billion fund – the Russian Direct Investment Fund – to support international companies investing in the country” (Euromonitor International 2011).
• FDI inflows peaked at US$75.5 billion in 2008, but declined faster than the contracting economy in 2009. FDI intensity (the share of FDI inflows in total GDP) declined from 4.5% in 2008 to 3.2% in 2009 (Euromonitor International 2011).
• “Foreign investors and reference the 2012 presidential election as a decisive indicator of the country's future political direction, as the government has often failed in the past to protect private investors in strategic sectors such as energy” (Euromonitor International 2011).
Nationalisation
• 85% of Russian’s favour Putin’s re-nationalisation of the oil and gas industries (World Public Opinion 2006).
• 65% of Russian’s say they would favour the re-nationalisation of other industries currently in private hands (World Public Opinion 2006).
45
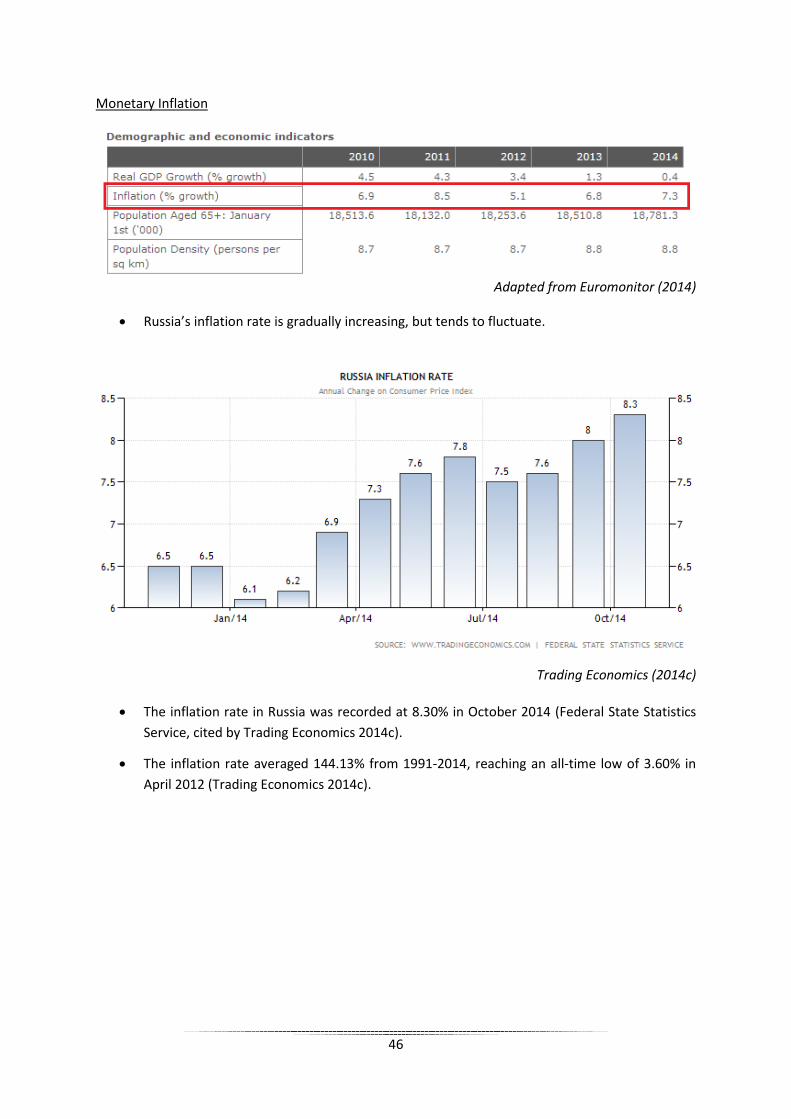
Monetary Inflation
Adapted from Euromonitor (2014)
• Russia’s inflation rate is gradually increasing, but tends to fluctuate.
Trading Economics (2014c)
• The inflation rate in Russia was recorded at 8.30% in October 2014 (Federal State Statistics Service, cited by Trading Economics 2014c).
• The inflation rate averaged 144.13% from 1991-2014, reaching an all-time low of 3.60% in April 2012 (Trading Economics 2014c).
46
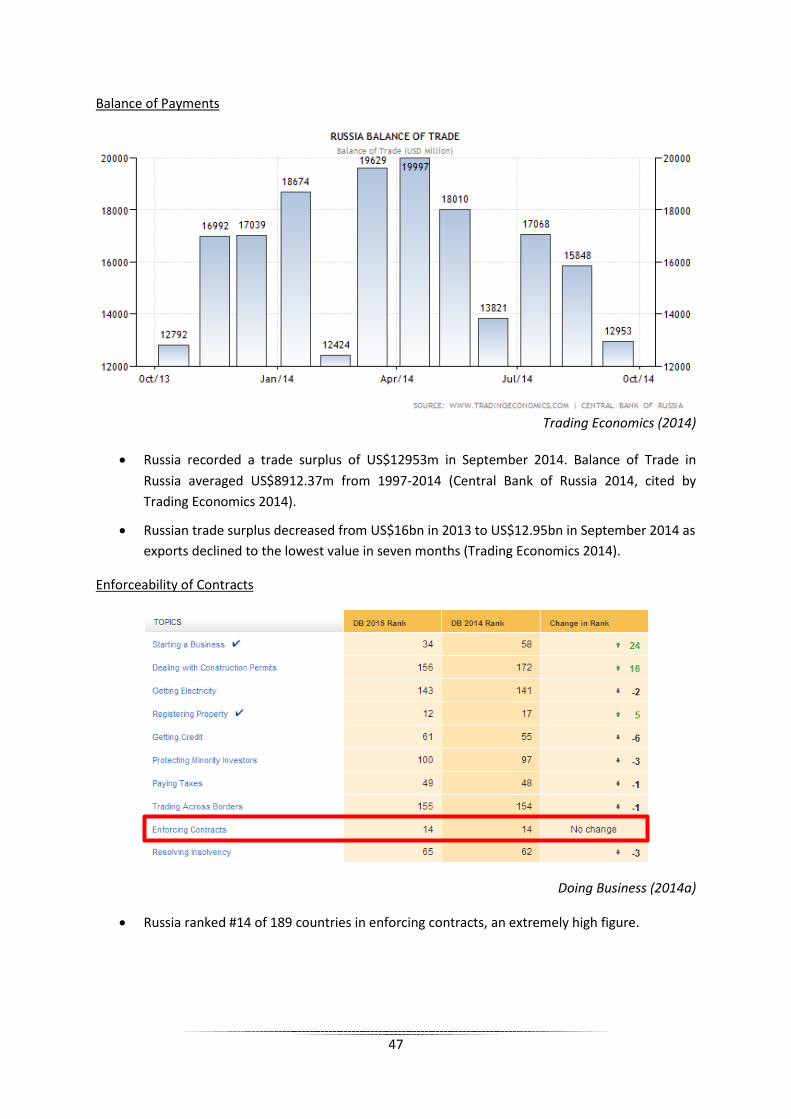
Balance of Payments
Trading Economics (2014)
• Russia recorded a trade surplus of US$12953m in September 2014. Balance of Trade in Russia averaged US$8912.37m from 1997-2014 (Central Bank of Russia 2014, cited by Trading Economics 2014).
• Russian trade surplus decreased from US$16bn in 2013 to US$12.95bn in September 2014 as exports declined to the lowest value in seven months (Trading Economics 2014).
Enforceability of Contracts
Doing Business (2014a)
• Russia ranked #14 of 189 countries in enforcing contracts, an extremely high figure.
47
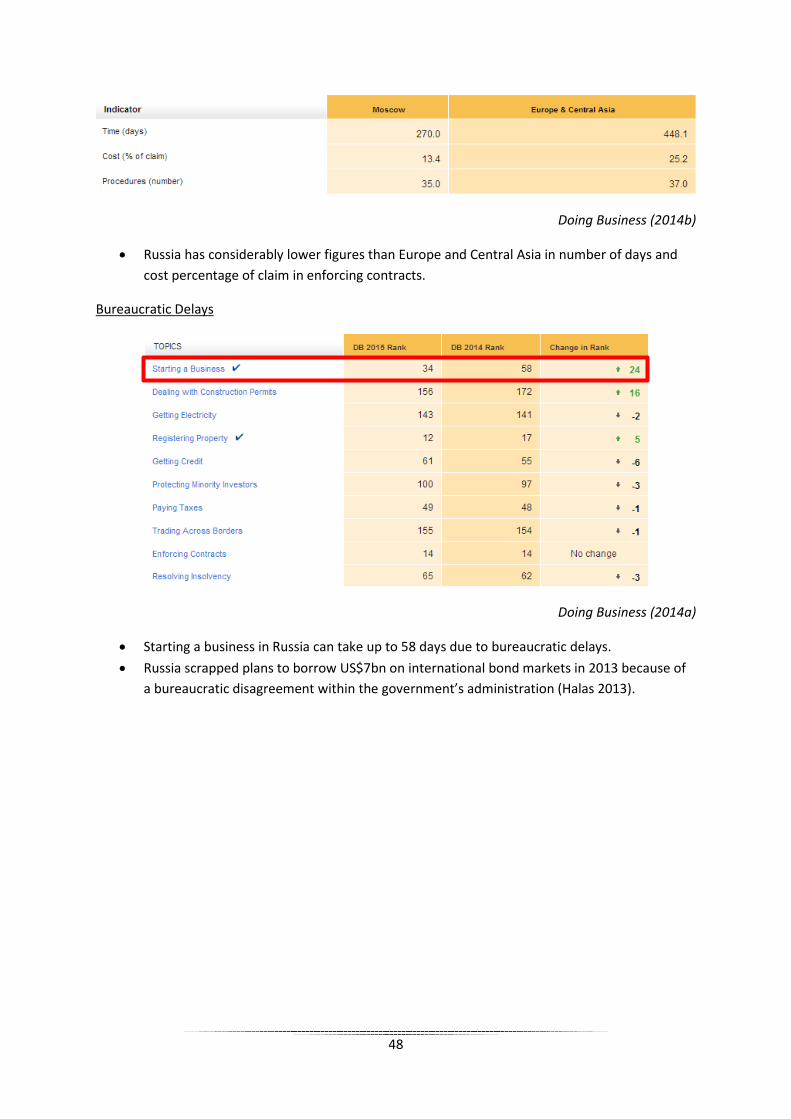
Doing Business (2014b)
• Russia has considerably lower figures than Europe and Central Asia in number of days and cost percentage of claim in enforcing contracts.
Bureaucratic Delays
Doing Business (2014a)
• Starting a business in Russia can take up to 58 days due to bureaucratic delays. • Russia scrapped plans to borrow US$7bn on international bond markets in 2013 because of
a bureaucratic disagreement within the government’s administration (Halas 2013).
48
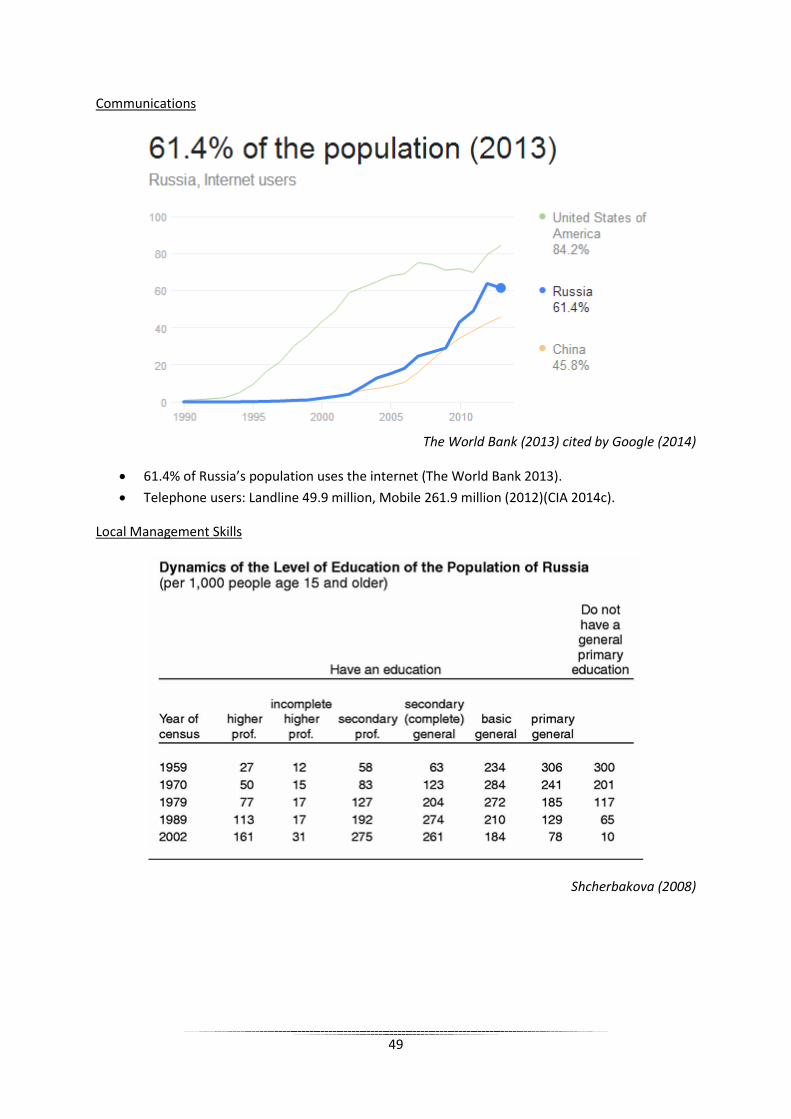
Communications
The World Bank (2013) cited by Google (2014)
• 61.4% of Russia’s population uses the internet (The World Bank 2013). • Telephone users: Landline 49.9 million, Mobile 261.9 million (2012)(CIA 2014c).
Local Management Skills
Shcherbakova (2008)
49
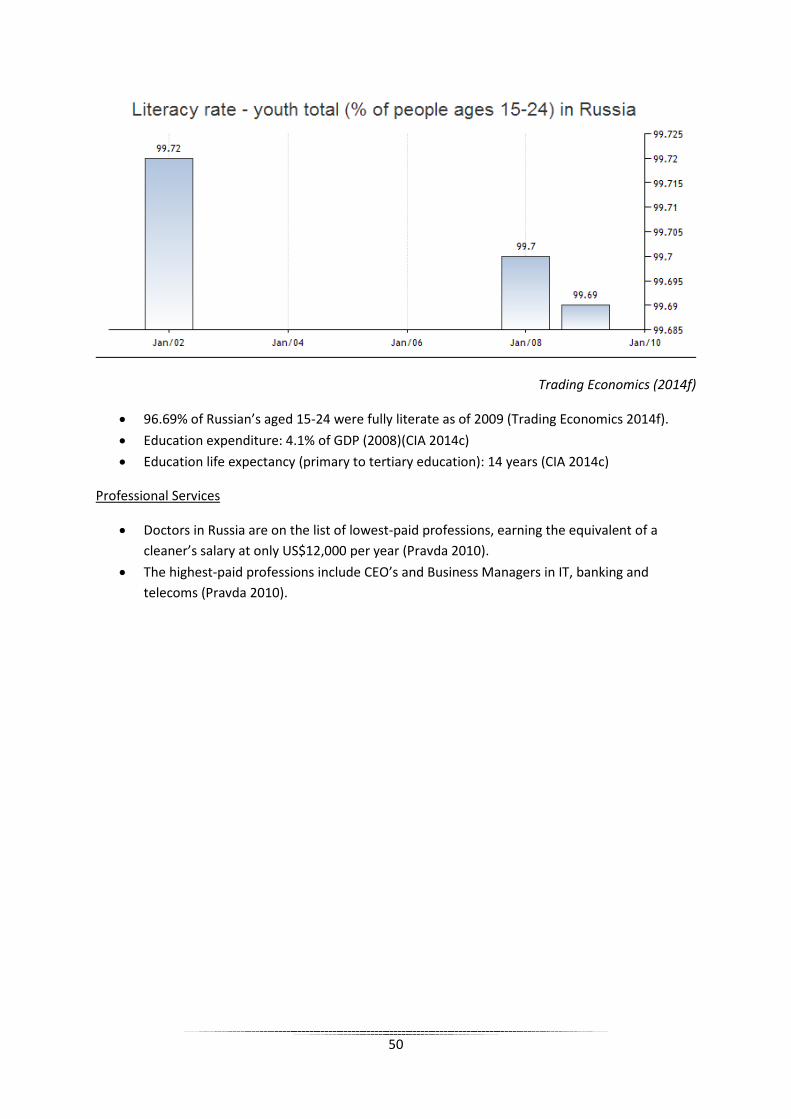
Trading Economics (2014f)
• 96.69% of Russian’s aged 15-24 were fully literate as of 2009 (Trading Economics 2014f). • Education expenditure: 4.1% of GDP (2008)(CIA 2014c) • Education life expectancy (primary to tertiary education): 14 years (CIA 2014c)
Professional Services
• Doctors in Russia are on the list of lowest-paid professions, earning the equivalent of a cleaner’s salary at only US$12,000 per year (Pravda 2010).
• The highest-paid professions include CEO’s and Business Managers in IT, banking and telecoms (Pravda 2010).
50
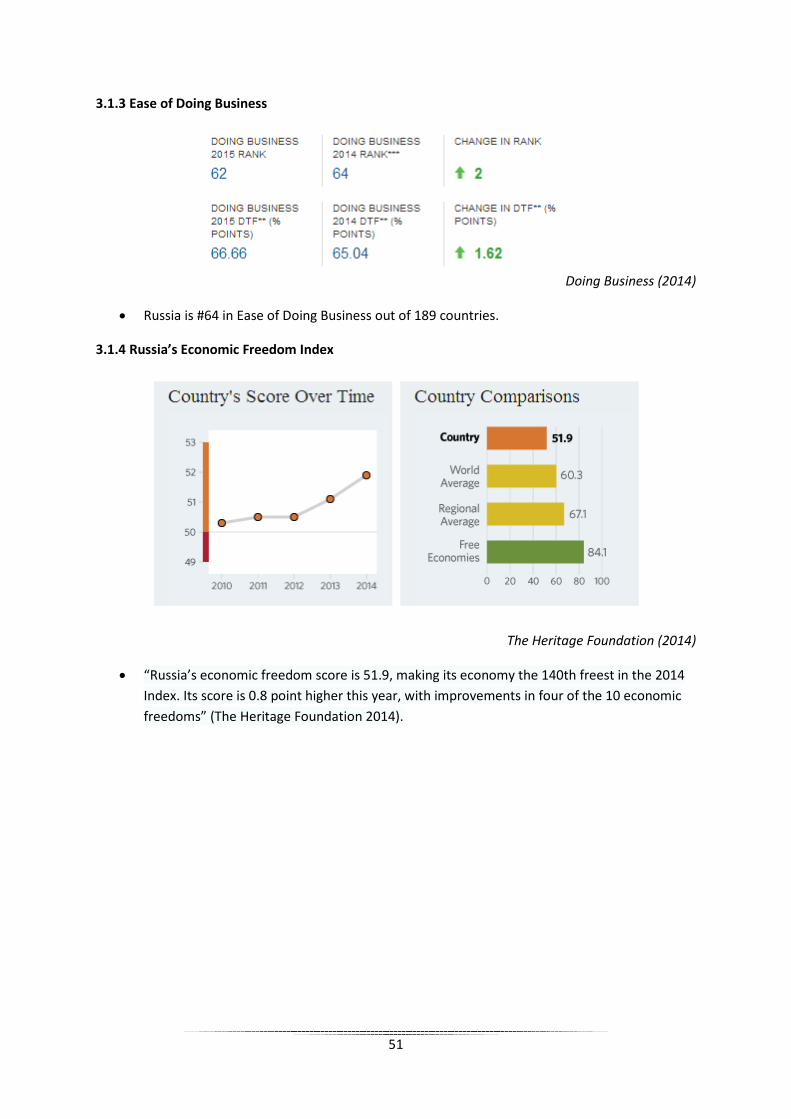
3.1.3 Ease of Doing Business
Doing Business (2014)
• Russia is #64 in Ease of Doing Business out of 189 countries.
3.1.4 Russia’s Economic Freedom Index
The Heritage Foundation (2014)
• “Russia’s economic freedom score is 51.9, making its economy the 140th freest in the 2014 Index. Its score is 0.8 point higher this year, with improvements in four of the 10 economic freedoms” (The Heritage Foundation 2014).
51
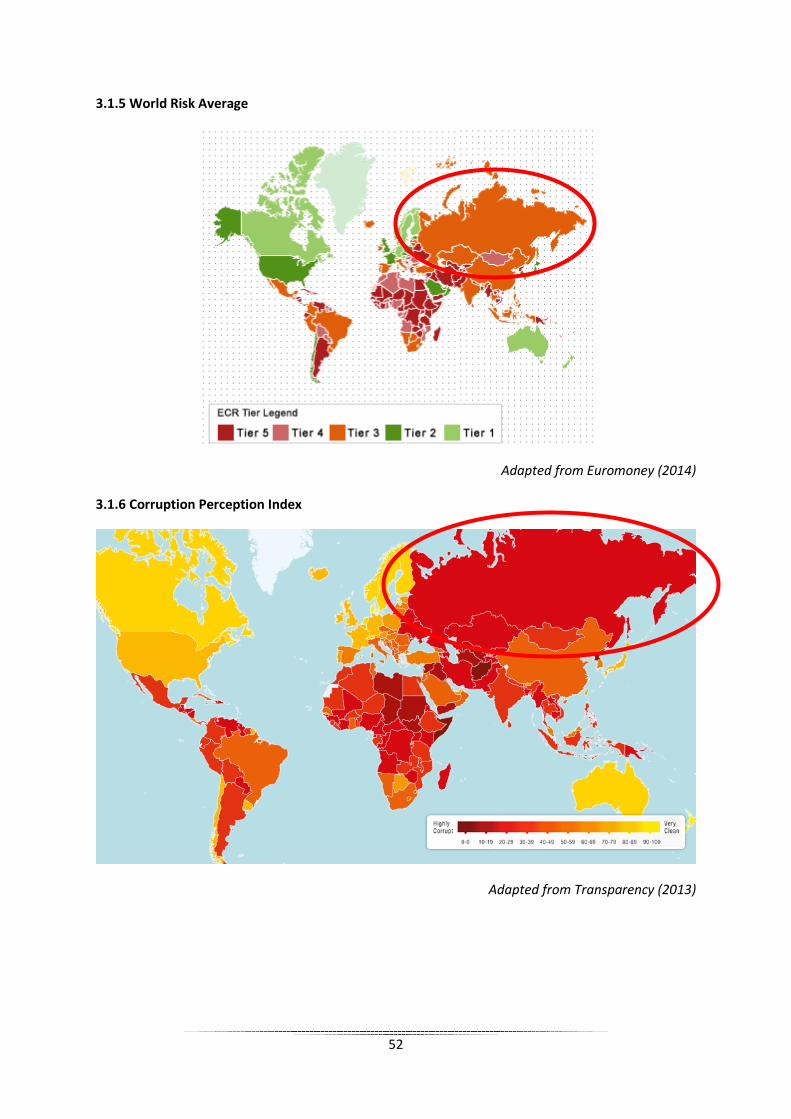
3.1.5 World Risk Average
Adapted from Euromoney (2014)
3.1.6 Corruption Perception Index
Adapted from Transparency (2013)
52
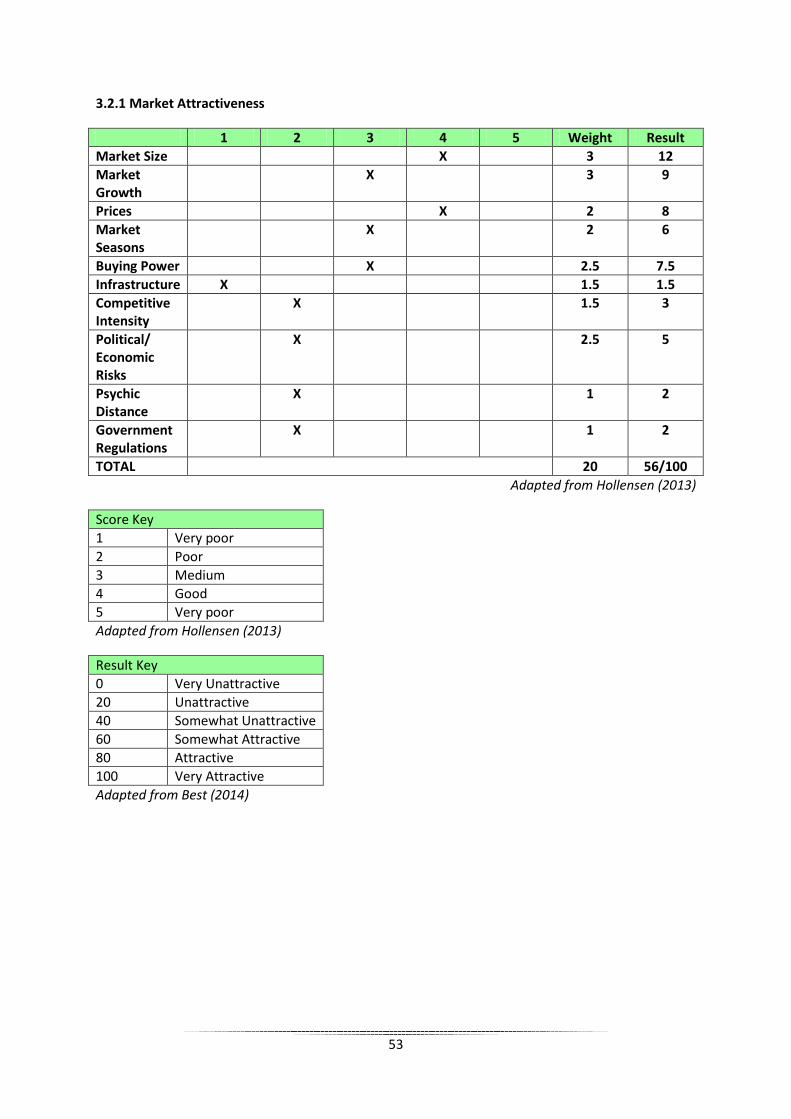
3.2.1 Market Attractiveness
1 2 3 4 5 Weight Result Market Size X 3 12 Market Growth
X 3 9
Prices X 2 8 Market Seasons
X 2 6
Buying Power X 2.5 7.5 Infrastructure X 1.5 1.5 Competitive Intensity
X 1.5 3
Political/ Economic Risks
X 2.5 5
Psychic Distance
X 1 2
Government Regulations
X 1 2
TOTAL 20 56/100 Adapted from Hollensen (2013)
Score Key 1 Very poor 2 Poor 3 Medium 4 Good 5 Very poor Adapted from Hollensen (2013)
Result Key 0 Very Unattractive 20 Unattractive 40 Somewhat Unattractive 60 Somewhat Attractive 80 Attractive 100 Very Attractive Adapted from Best (2014)
53
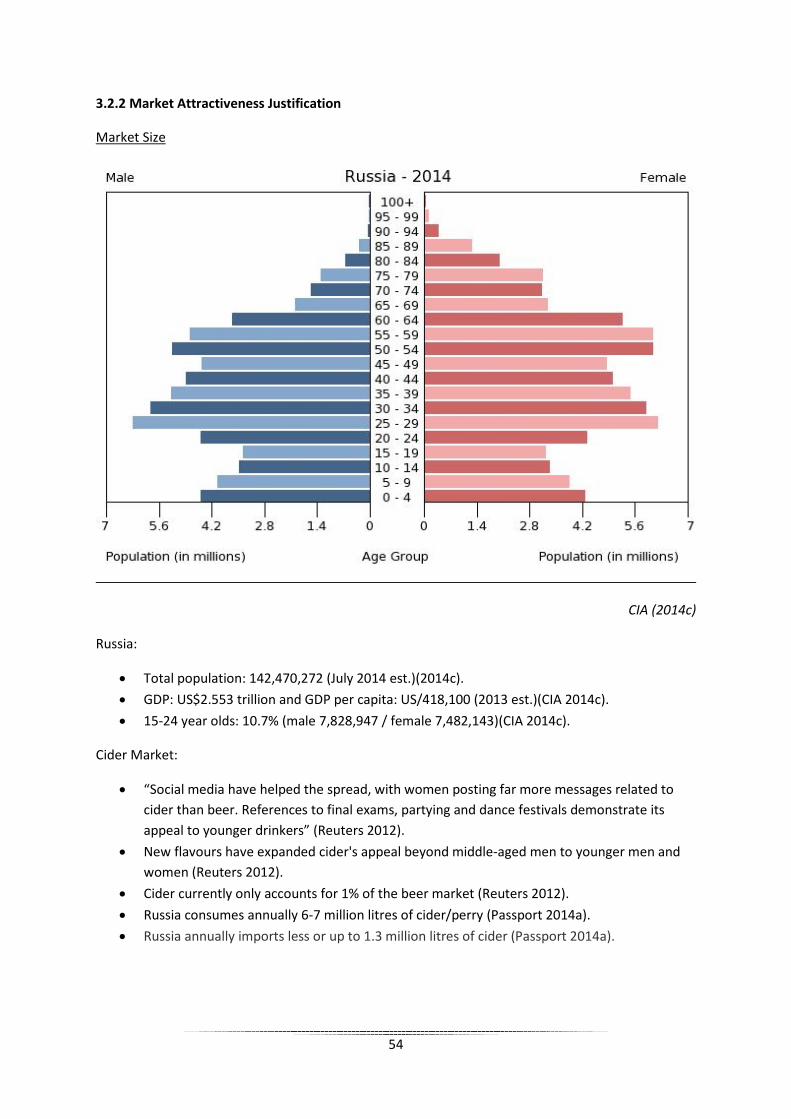
3.2.2 Market Attractiveness Justification
Market Size
CIA (2014c)
Russia:
• Total population: 142,470,272 (July 2014 est.)(2014c). • GDP: US$2.553 trillion and GDP per capita: US/418,100 (2013 est.)(CIA 2014c). • 15-24 year olds: 10.7% (male 7,828,947 / female 7,482,143)(CIA 2014c).
Cider Market:
• “Social media have helped the spread, with women posting far more messages related to cider than beer. References to final exams, partying and dance festivals demonstrate its appeal to younger drinkers” (Reuters 2012).
• New flavours have expanded cider's appeal beyond middle-aged men to younger men and women (Reuters 2012).
• Cider currently only accounts for 1% of the beer market (Reuters 2012). • Russia consumes annually 6-7 million litres of cider/perry (Passport 2014a). • Russia annually imports less or up to 1.3 million litres of cider (Passport 2014a).
54
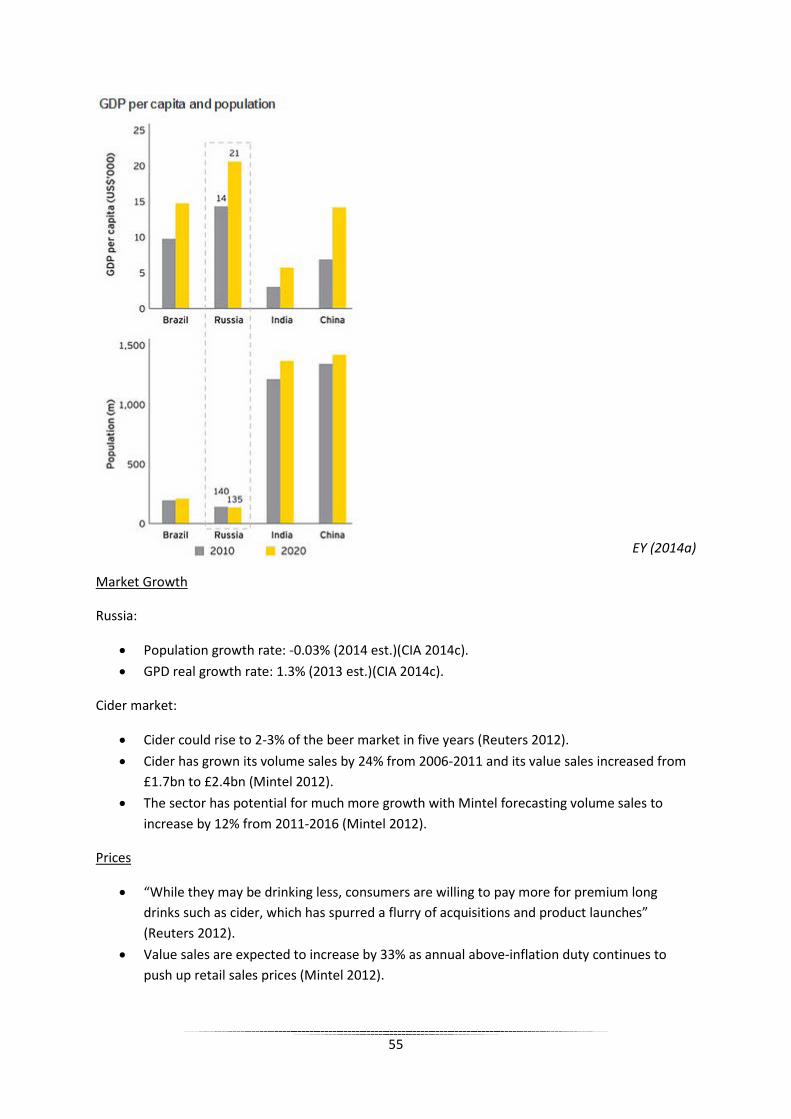
EY (2014a)
Market Growth
Russia:
• Population growth rate: -0.03% (2014 est.)(CIA 2014c). • GPD real growth rate: 1.3% (2013 est.)(CIA 2014c).
Cider market:
• Cider could rise to 2-3% of the beer market in five years (Reuters 2012). • Cider has grown its volume sales by 24% from 2006-2011 and its value sales increased from
£1.7bn to £2.4bn (Mintel 2012). • The sector has potential for much more growth with Mintel forecasting volume sales to
increase by 12% from 2011-2016 (Mintel 2012).
Prices
• “While they may be drinking less, consumers are willing to pay more for premium long drinks such as cider, which has spurred a flurry of acquisitions and product launches” (Reuters 2012).
• Value sales are expected to increase by 33% as annual above-inflation duty continues to push up retail sales prices (Mintel 2012).
55
Market Seasons
• New flavours have made it an all-season beverage, not just a summer drink (Reuters 2012). • Cider is the category that is most responsive to warmer weather. But producers say fruit
ciders are becoming an all-year-round drink (Boggis 2014). • “Mintel’s annual cider report demonstrated that penetration of winter cider is growing, so
these two factors give us confidence that this will be a real growth area in the coming years” (Boggis 2014).
• “Deseasonalisation of cider has played its part in the overall growth of the market, as cider drinking becomes a year-round occasion thanks to a change of perception by the consumer” (Adams 2014, cited by Boggis 2014).
Buying Power
• “Russia's economy and GDP are driven primarily by consumption" (Smith 2013, cited by Reuters 2013a).
• “Consumer-oriented sectors already account for two-thirds of Russia's GDP and have contributed 80% of Russia's economic growth since 2004. Consumer spending could almost double to US$3 trillion by 2025” (Reuters 2013a).
• 73% of the population is urban and accounts for 85% of the purchasing power (EY 2014a).
Infrastructure
• Russia has fallen to #93 of 144 in quality of overall infrastructure in The Global Competitiveness Report 2013–2014 (The World Economic Forum, cited by EY 2014b).
• Only the quality of railway infrastructure in Russia is at a relatively high level; all other areas need improvement (EY 2014b).
• "The world's population is growing, and it will need raw materials... But the materials can't be shipped out. Why? Ports are closed and railway yards haven't been built" (Filatov 2013, cited by Reuters 2013).
• “The barrier to growth caused by creaking infrastructure has been recognised by President Vladimir Putin, who unveiled a $13 billion investment plan to build new roads and railways” (Reuters 2013b)
Competitive Intensity
• Cider has had the advantage of a lower tax than many competitors which it has invested wisely (Mintel 2012).
• The biggest global alcohol is Baijiu (1.3bn gallons sold per year); Vodka is second, (925m gallons); and whiskey is third, with 766m gallons (Drinks International 2014, cited by Lossan 2014)
• In 2014, vodka sales in Russia amounted to 142m gallons. The share of beer in Russians' alcohol consumption grew from 37.3% to 39.9% (Lossan 2014).
56
Political/ Economic Risks
This was fully analysed in the BERI Index (Appendix 3.1.2). It was found that Russia is fraught with political and economic risks and is very unstable.
Psychic Distance
• Extremely different regarding Power Distance, Individualism, Pragmatism and Indulgence • Great importance of status symbols, implicit communication styles • Controlled gratification of desires
(The Hofstede Centre 2014)(Appendix 2.2.2)
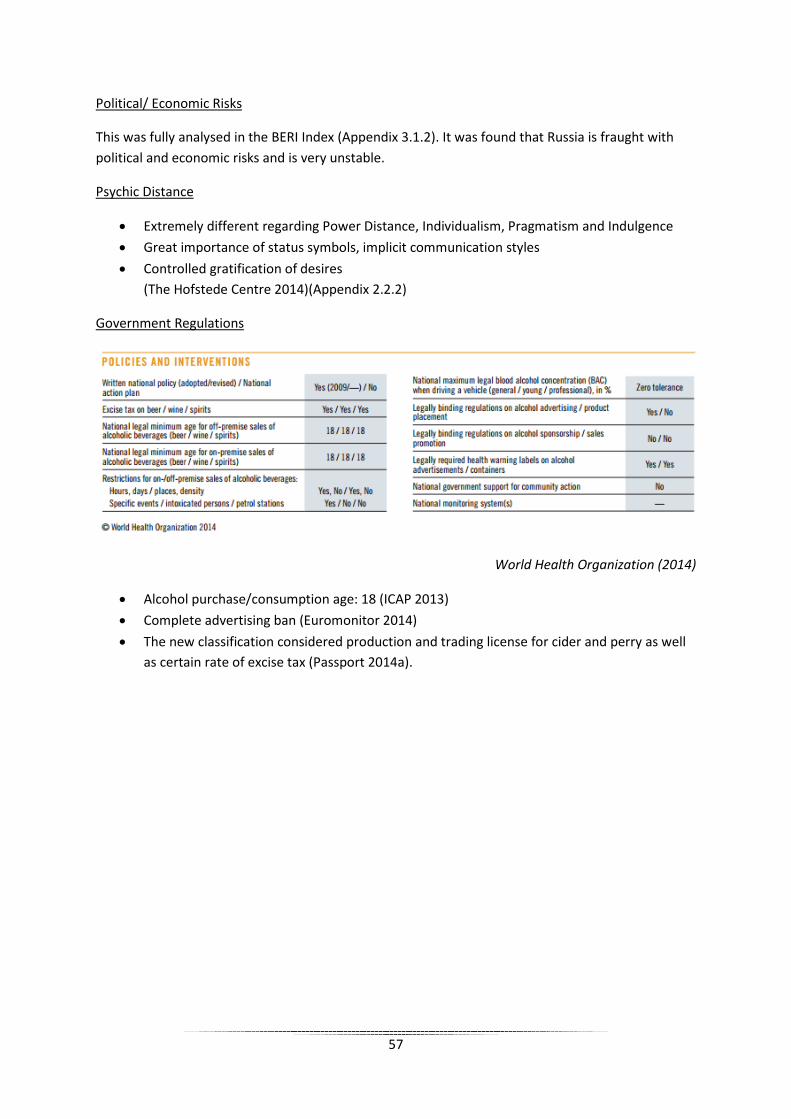
Government Regulations
World Health Organization (2014)
• Alcohol purchase/consumption age: 18 (ICAP 2013) • Complete advertising ban (Euromonitor 2014) • The new classification considered production and trading license for cider and perry as well
as certain rate of excise tax (Passport 2014a).
57
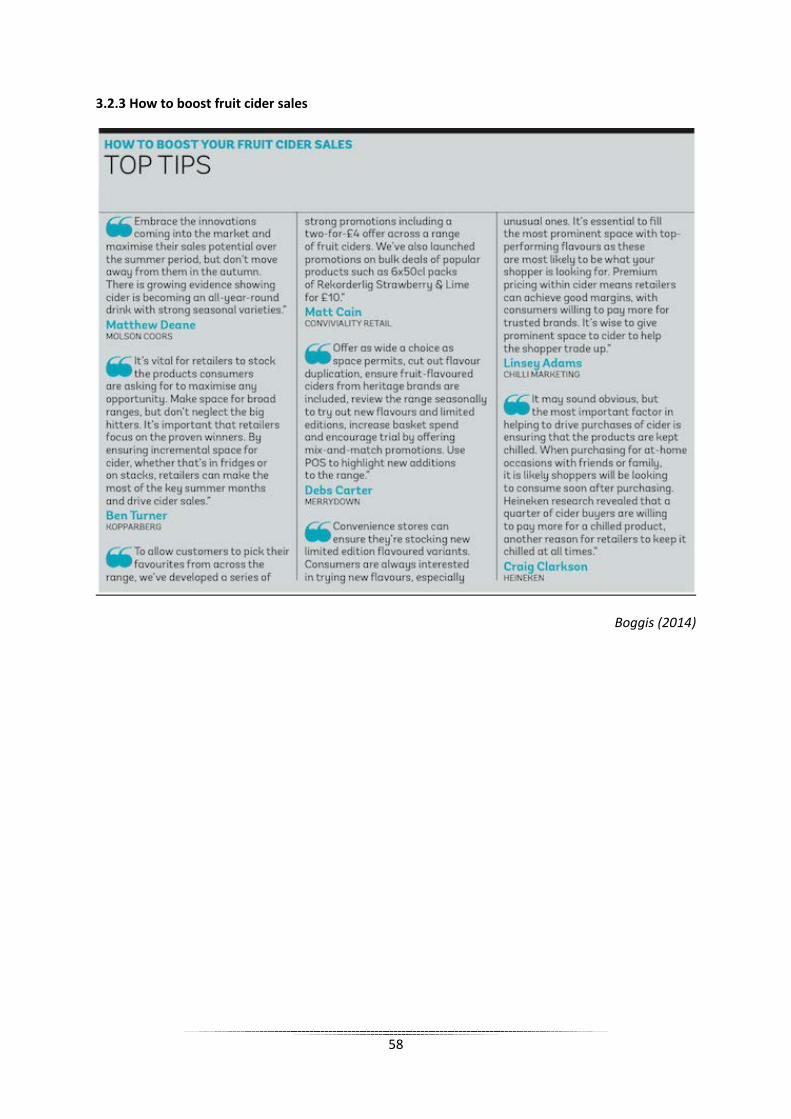
3.2.3 How to boost fruit cider sales
Boggis (2014)
58
3.3.3 Porter’s 5 Forces: Competitive Analysis
Competitive Rivalry: High
• The cider industry is a growing market with few key players, this means there are high levels of fierce rivalry between competitors to gain market share.
• Existing players are almost equal in size and scope which creates intense rivalry to become the market leader.
Threat of Entry: Low
• Due to being heavily saturated, threat of market entry is low. The cut-throat industry means the fight to retain existing market share and to grow markets shares can create intense retaliation within the industry, which in turn creates a very unattractive market to enter.
Threat of
New Entry: LOW
Power of
Buyer: HIGH
Threat of Substitution:
LOW
Competitive Rivalry:
HIGH
Power of Supplier:
LOW
59
• Within the apple fermenting industry, access to land and good quality distribution channels would be difficult to attain. Existing players have great access and even ownership over the best distribution channels and access to prime locations for apple growing would be difficult to achieve.
• In addition to this the production period and orchard growth takes a very long time, this presents long waits and miss of revenue and potentially very high loses in terms of costs.
• The large capital investment needed to enter the market therefore will deter any potential entrants thus reducing the threat of entry.
• New cider brands lack authenticity (Drinks Int 2010). • Market consolidation has been limited allowing new entrants (Euromonitor Int 2014b).
Power of Buyers: High
• Growing popularity of cider within the EU market means the bargaining power of buyers is growing due to growing demand of the market.
• There are few key players within the industry which means buyer power is increased as suppliers are in demand for their business.
• Purchasing power drove category sales - other spirits saw a strong bounce back due to affordability credentials (Euromonitor 2010).
Threat of Substitutes: Low
• Potential substitutes may include non-alcoholic ciders with the same great taste and available at a cheaper end price.
• Beer, spirits and wines also act as substitutes that offer an aspect of differentiation, which could attract the demand of the market.
• The growing trend of home brewing presents a threat as potential substitutes within the industry.
• Mixed beers and radlers could be a barrier to cider (Euromonitor Int 2014b). • In 2010; beer volume sales improved and spirits posted their best performance over the last
decade (Euromonitor 2010).
Power of Suppliers: Low
• High involvement of government regulations means suppliers of cider have little power; their inability to increase prices is due to the control of taxes within the alcohol industry.
• Lack of differentiation of cider means that suppliers cannot sell it at a premium price as buyers will simply look elsewhere for products at a cheaper price and therefore not inflicting on the buyers potential profits.
• High numbers of suppliers within industry also means supplier power is reduced. • Limited harvest capacity restricts production volumes (Euromonitor International 2014b).
60
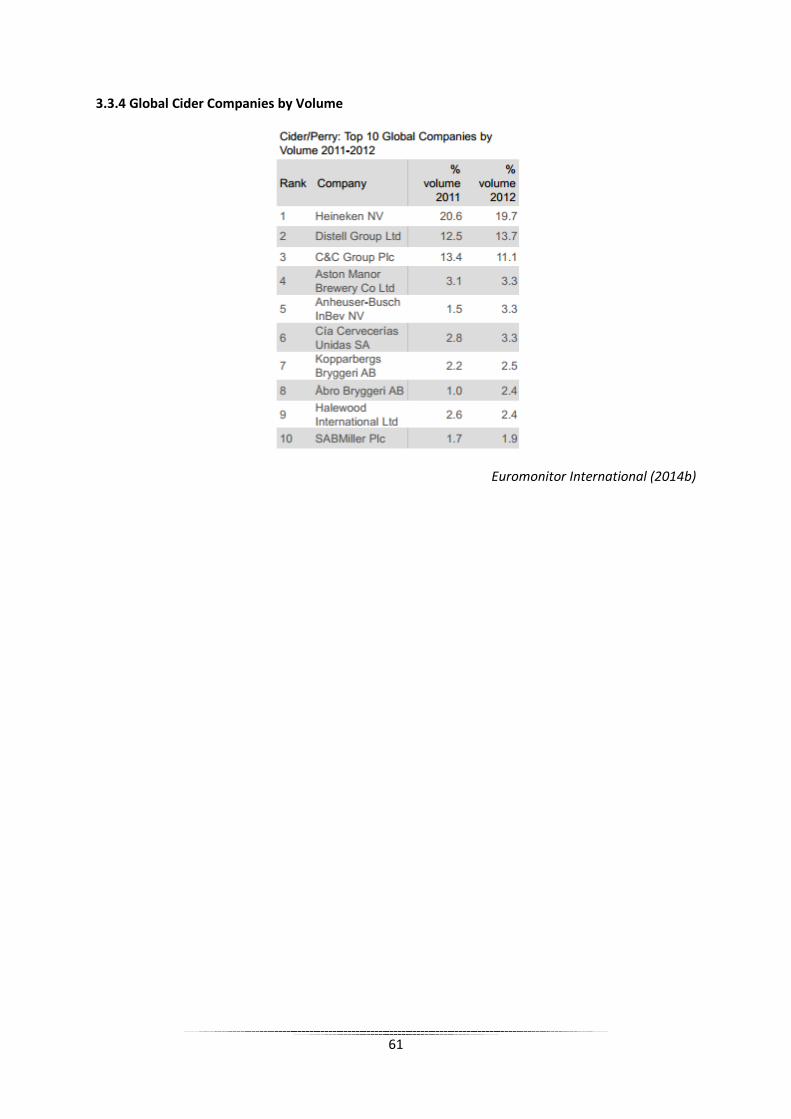
3.3.4 Global Cider Companies by Volume
Euromonitor International (2014b)
61
Appendix 4: Market Entry
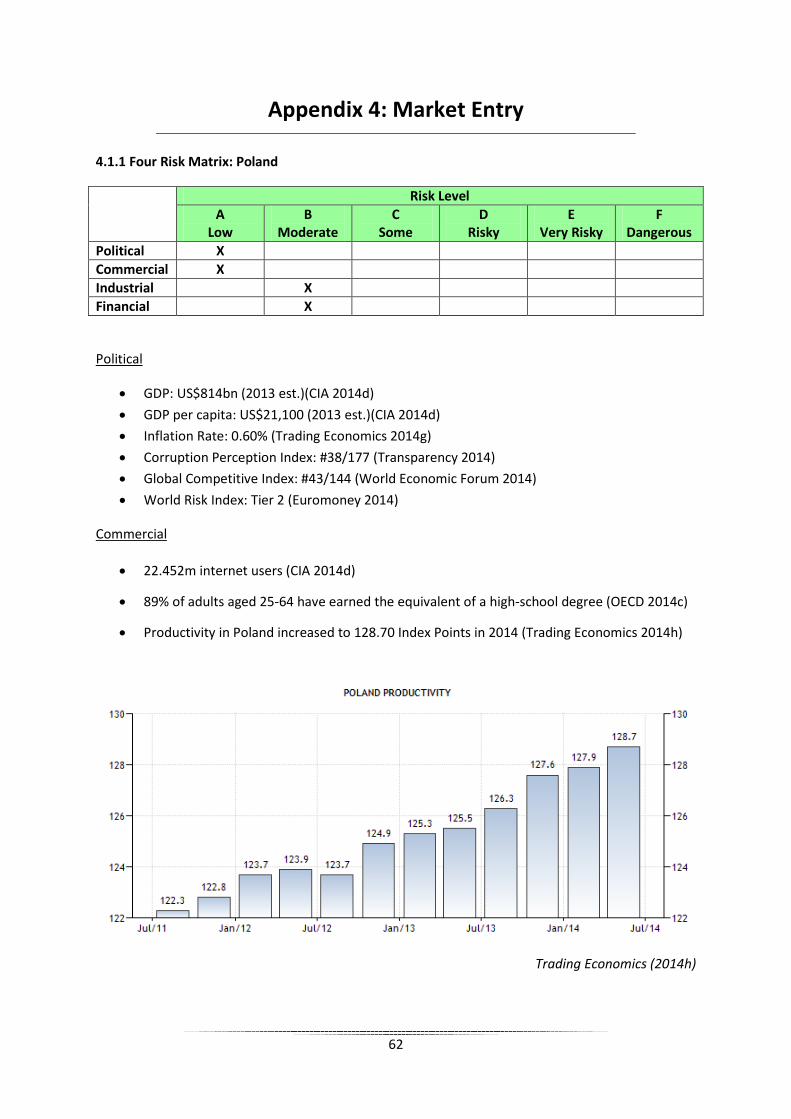
4.1.1 Four Risk Matrix: Poland
Risk Level A
Low B
Moderate C
Some D
Risky E
Very Risky F
Dangerous Political X Commercial X Industrial X Financial X
Political
• GDP: US$814bn (2013 est.)(CIA 2014d) • GDP per capita: US$21,100 (2013 est.)(CIA 2014d) • Inflation Rate: 0.60% (Trading Economics 2014g) • Corruption Perception Index: #38/177 (Transparency 2014) • Global Competitive Index: #43/144 (World Economic Forum 2014) • World Risk Index: Tier 2 (Euromoney 2014)
Commercial
• 22.452m internet users (CIA 2014d)
• 89% of adults aged 25-64 have earned the equivalent of a high-school degree (OECD 2014c)
• Productivity in Poland increased to 128.70 Index Points in 2014 (Trading Economics 2014h)
Trading Economics (2014h)
62
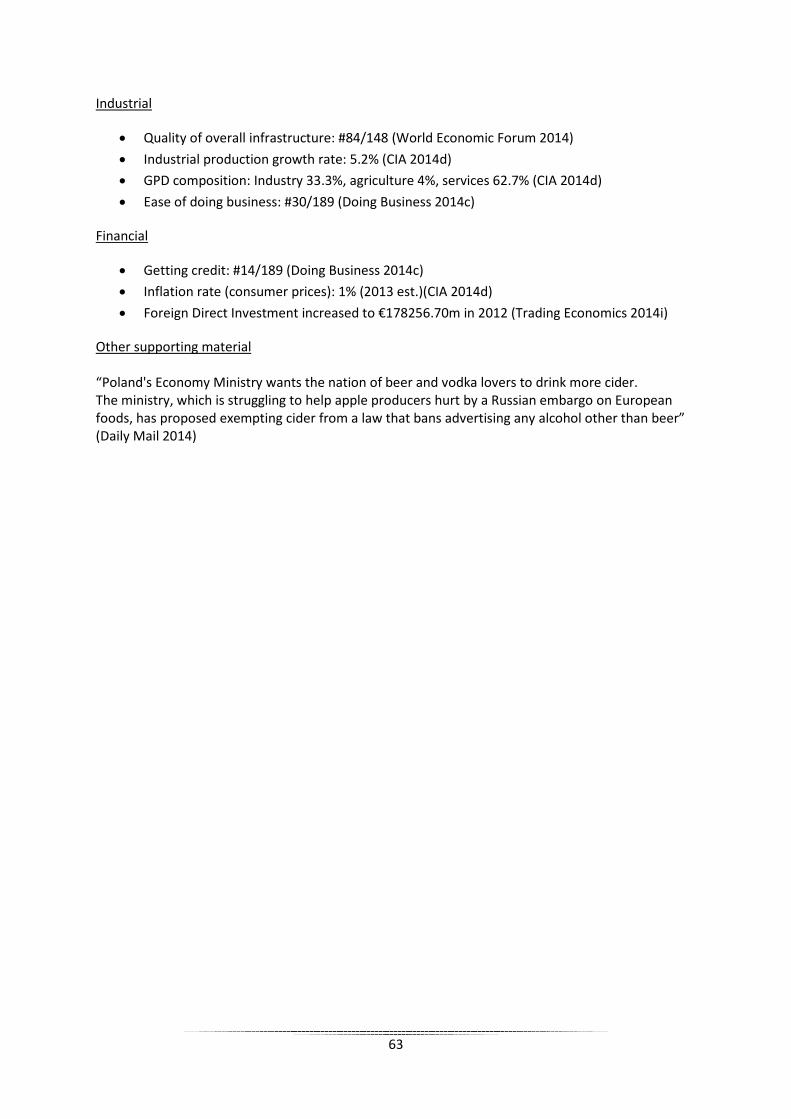
Industrial
• Quality of overall infrastructure: #84/148 (World Economic Forum 2014) • Industrial production growth rate: 5.2% (CIA 2014d) • GPD composition: Industry 33.3%, agriculture 4%, services 62.7% (CIA 2014d) • Ease of doing business: #30/189 (Doing Business 2014c)
Financial
• Getting credit: #14/189 (Doing Business 2014c) • Inflation rate (consumer prices): 1% (2013 est.)(CIA 2014d) • Foreign Direct Investment increased to €178256.70m in 2012 (Trading Economics 2014i)
Other supporting material “Poland's Economy Ministry wants the nation of beer and vodka lovers to drink more cider. The ministry, which is struggling to help apple producers hurt by a Russian embargo on European foods, has proposed exempting cider from a law that bans advertising any alcohol other than beer” (Daily Mail 2014)
63
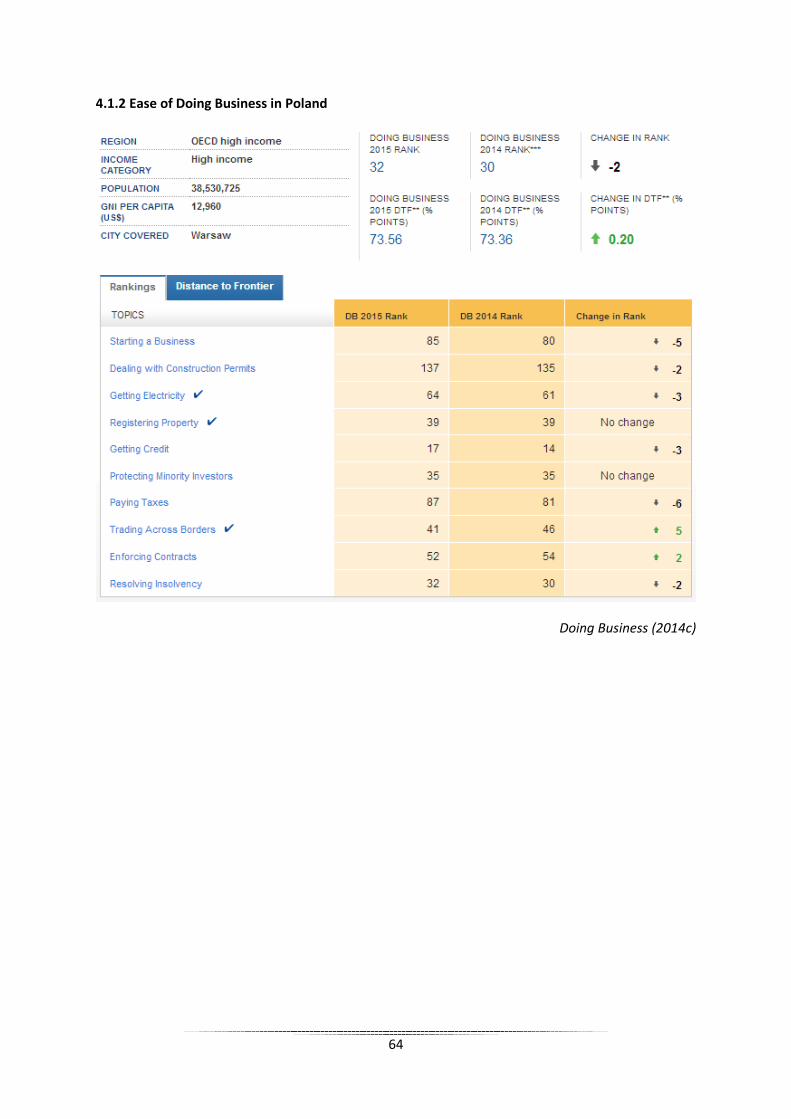
4.1.2 Ease of Doing Business in Poland
Doing Business (2014c)
64
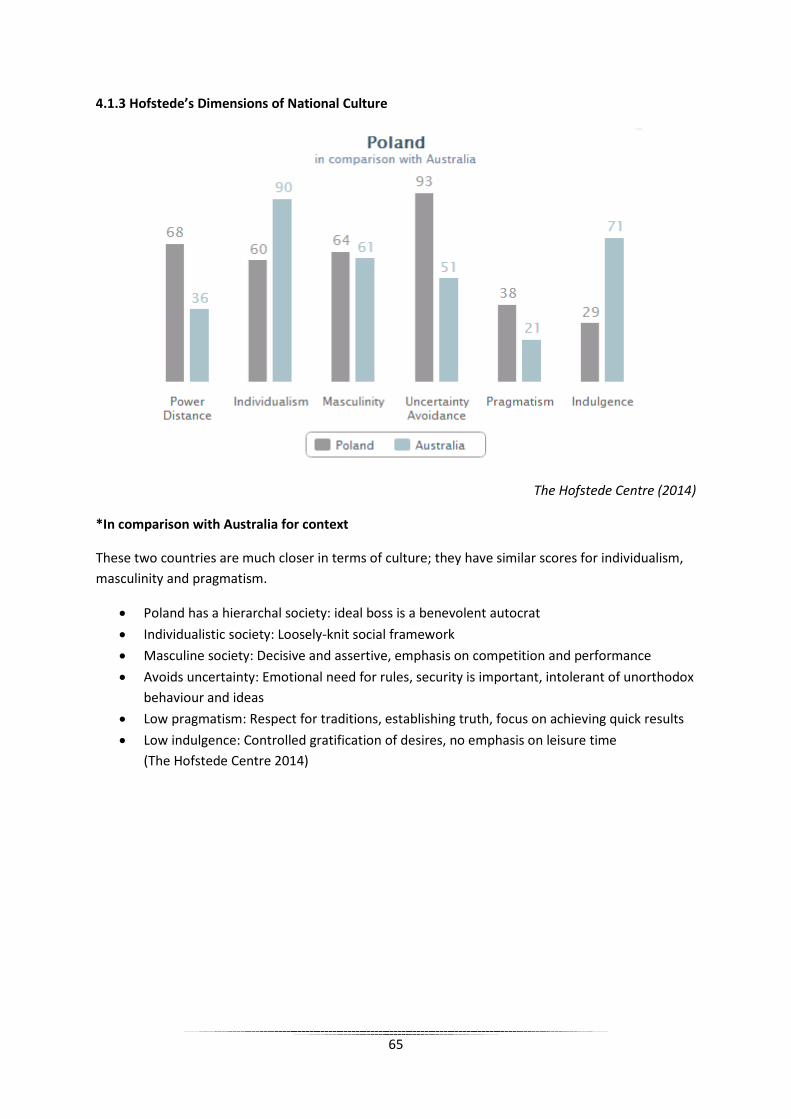
4.1.3 Hofstede’s Dimensions of National Culture
The Hofstede Centre (2014)
*In comparison with Australia for context
These two countries are much closer in terms of culture; they have similar scores for individualism, masculinity and pragmatism.
• Poland has a hierarchal society: ideal boss is a benevolent autocrat • Individualistic society: Loosely-knit social framework • Masculine society: Decisive and assertive, emphasis on competition and performance • Avoids uncertainty: Emotional need for rules, security is important, intolerant of unorthodox
behaviour and ideas • Low pragmatism: Respect for traditions, establishing truth, focus on achieving quick results • Low indulgence: Controlled gratification of desires, no emphasis on leisure time
(The Hofstede Centre 2014)
65
References
BBC News, 2006. Russia Lifts Controls on Currency [online]. BBC News. Available from: http://news.bbc.co.uk/1/hi/business/5135946.stm [Accessed 18 November 2014]. BBC News, 2009. Youth ‘cannot live’ without web [online]. BBC News. Available at: http://news.bbc.co.uk/1/hi/technology/8305731.stm [Accessed 03 November 2014]. BBC News, 2014. How far do EU-US sanctions on Russia go? [online]. BBC News. Available from: http://www.bbc.co.uk/news/world-europe-28400218 [Accessed 18 November 2014]. Best, R.J., 2014. Market Attractiveness Index, Competitive Advantage Index, and Strategic Market Planning Portfolio [online]. Market Based Management. Available from: http://www.rogerjbest.com/mbm4/nav.cfm?A=N&C=11&P=0 [Accessed 20 November 2014]. Boggis, C., 2014. Fruit cider – a sip for all seasons [online]. Off Licence News. Available from: http://www.offlicencenews.co.uk/news/fullstory.php/aid/14294/Fruit_cider_-_a_sip_for_all_seasons.html [Accessed 20 November 2014]. Bramley, E., Shabbir, N., Gani, A., Scruton, P., Stocks A., Haddou, L., 2014. A World Map of Youth [map]. Guardian.co.uk. Available at: http://www.theguardian.com/world/graphic/2014/mar/19/world-map-of-youth-youth-bulge?CMP=twt_gu# [Accessed 03 November 2014]. CIA, 2014a. The World Fact Book: Languages [online]. Central Intelligence Agency. Available from: https://www.cia.gov/library/publications/the-world-factbook/fields/2098.html [Accessed 14 November 2014]. CIA, 2014b. The World Fact Book: Religions [online]. Central Intelligence Agency. Available from: https://www.cia.gov/library/publications/the-world-factbook/fields/2122.html [Accessed 14 November 2014]. CIA, 2014c. The World Fact Book: Russia [online]. Central Intelligence Agency. Available from: https://www.cia.gov/library/publications/the-world-factbook/geos/rs.html [Accessed 20 November 2014]. CIA, 2014d. The World Fact Book: Poland [online] Central Intelligence Agency. Available from: https://www.cia.gov/library/publications/the-world-factbook/geos/pl.html [Accessed 20 November 2014].
66
Daily Mail, 2014. Russian ban on Polish apples sparks cider debate [online]. Daily Mail. Available from: http://www.dailymail.co.uk/wires/ap/article-2731802/Russian-ban-Polish-apples-sparks-cider-debate.html#ixzz3Jbt7HNIc [Accessed 20 November 2014]. Di Antonio, E., 2011. Concerns about Global Issues [graph]. Youthnet.org. Available at: http://www.youthnet.org/wp-content/uploads/2011/10/Fear_and_hoping.pdf [Accessed 03 November 2014]. Di Antonio, E., 2011. Fear and hoping in the UK: Today and tomorrow through young peoples’ eyes [online]. YouthNet. Available at: http://www.youthnet.org/wp-content/uploads/2011/10/Fear_and_hoping.pdf [Accessed 03 November 2014]. Doing Business, 2014a. Ease of Doing Business in: Russian Federation [online]. Doing Business. Available from: http://www.doingbusiness.org/data/exploreeconomies/russia [Accessed 18 November 2014]. Doing Business, 2014b. Russia Enforcing Contracts [online]. Trading Economics. Available from: http://www.doingbusiness.org/data/exploreeconomies/russia#enforcing-contracts [Accessed 18 November 2014]. Doing Business, 2014c. Ease of Doing Business in: Poland [online]. Doing Business. Available from: http://www.doingbusiness.org/data/exploreeconomies/poland [Accessed 20 November 2014]. Doole, I. and Lowe, R., 2012. International Marketing Strategy. 6th Ed. Andover: Cengage Learning. Drinks International, 2010. Cider in Russia [online]. Drinks Int. Available from: http://www.drinksint.com/news/fullstory.php/aid/1862/Cider_in_Russia.html [Accessed 14 November 2014]. Dryzek, R., 2004. World Youth Report 2003: Chapter 5. Youth and the Environment [online]. New York: United Nations. Elder, S., 2010. Global Employment Trends for Youth [online]. Geneva: International Labour Office. Euromoney, 2014. World Risk Average [online]. Euromoney. Available from: http://www.euromoneycountryrisk.com/ [Accessed 19 November 2014]. Euromonitor International, 2009. Labour force participation rate and employment rate in selected emerging market economies: 2009 [graph]. Euromonitor International: blog.euromonitor.com. Available from: http://blog.euromonitor.com/2011/01/emerging-market-economies-particularly-in-asia-and-latin-america-are-showing-encouraging-signs-of-employment-recovery-from.html [Accessed 18 November 2014]. Euromonitor International, 2010. Alcoholic Drinks Overview: A Tentative Recovery and the Great Regional Divide [online]. London: Euromonitor International.
67
Euromonitor International, 2011a. Russia Attempts to Boost Foreign Investors’ Interest [online]. London: Euromonitor International. Euromonitor International, 2011b. Cider/Perry: Higher-End Momentum Against All Odds [online]. London: Euromonitor International. Euromonitor International, 2012a. Youth – Future Imperfect [online]. London: Euromonitor International. Euromonitor International, 2012b. Russia’s Resource Curse: Oil Price Dependency Weighs on Economy [online]. London: Euromonitor International. Euromonitor International, 2013a. Global Population Under the Age of 30 Centred in Emerging Markets [map]. Blog.euromonitor.com. Available at: http://blog.euromonitor.com/2013/04/global-population-under-the-age-of-30-centered-in-emerging-markets.html [Accessed 03 November 2014]. Euromonitor International, 2014. Alcoholic Drinks in Russia [online]. London: Euromonitor International. Euromonitor International, 2014a. Russia: Country Factfile [online]. London: Euromonitor International. Euromonitor International 2014b. Cider and Perry: A Manifest Frontier [online]. London: Euromonitor International. EY, 2014a. Making it work in Russia: Middle-class consumer profile [online]. EY. Available from: http://www.ey.com/GL/en/Industries/Consumer-Products/Making-it-work-in-Russia---Middle-class-consumer-profile [Accessed 20 November 2014].
EY, 2014b. Russian infrastructure in the global context [online]. EY. Available from: http://www.ey.com/RU/En/Issues/Business-environment/EY-road-to-2030-russian-infrastructure-in-global-context [Accessed 20 November 2014]. Firvosa, A. and Taplin, R., 2009. Australia and Russia: How do their environmental policy processes differ? Environment, Development & Sustainability [online], 11 (2), 407-426. Fredrikson, K. and Molin, C., 2011. Standardize or Adapt? Building a Successful Brand. Thesis (Bachelor). Uppsala University.
Friese, B. and Grube, J.W., n.d. Minimum Purchase Age [table]. America: Pacific Institute for Research and Evaluation. Available at: http://resources.prev.org/documents/ESPAD.pdf [Accessed 04 November 2014]. Friese, B. and Grube, J.W., n.d. Youth Drinking Rates and Problems: A Comparison of European
68
Countries and the United States [online]. America: Pacific Institute for Research and Evaluation. Gleeson, B., 2012. TV Advertising vs Digital Marketing [online]. Forbes. Available from: http://www.forbes.com/sites/brentgleeson/2012/11/20/tv-advertising-vs-digital-marketing/ [Accessed 12 November 2014]. Gleeson, B., 2012. Advertising in the United States: Television vs Online [image]. Forbes: forbes.com. Available from: http://www.forbes.com/sites/brentgleeson/2012/11/20/tv-advertising-vs-digital-marketing/ [Accessed 12 November 2014]. Goldin, N., 2014. Information and Communications Technology in the Global Youth Wellbeing Index. TechChange [online], 18 June 2014. Available at: http://techchange.org/2014/06/18/ict-global-youth-wellbeing-index-csis-iyf/ [Accessed 03 November 2014]. Google, 2014. Internet users as a percentage of population [online]. Google. Available from: https://www.google.co.uk/publicdata/explore?ds=d5bncppjof8f9_&met_y=it_net_user_p2&idim=country:RUS:USA:CHN&hl=en&dl=en [Accessed 18 November 2014]. Halas, S., 2013. Russia Delays $7 Bln Borrowing Plans after Bureaucratic Spat [online]. USA: The Wall Street Journal. Harrison, S., Cammaerts, B., Bruter, M., Banaji, S. and Anstead, N., 2013. The Myth of Youth Apathy: Young Europeans’ Critical Attitudes Toward Democratic Life. American Behavioural Scientist [online], 58 (5), 645-664. Hazel, N., 2008. Cross-national Comparison of Youth Justice [online]. The University of Salford: Youth Justice Board. Hazel, N., 2008. Age of Criminal Responsibility [graph]. The University of Salford: Academia.edu. Available at: http://www.academia.edu/1621782/Cross-national_comparison_of_youth_justice [Accessed 04 November 2014]. Hollensen, S., 2013. Global Marketing. 6th Ed. Harlow: Pearson. Hooker, J., 2008. Cultural Differences in Business Communication [online]. USA: Tepper School of Business. ICAP, 2013. Minimum Ages to Legally Purchase and Consume Alcohol [table]. Icap.org. Available from: http://www.icap.org/table/minimumagelimitsworldwide [Accessed 17 November 2014].
International Labour Organization, 2014. Global Employment Trends 2014: Risk of a jobless recovery? [online]. Geneva: International Labour Office. Kingsley, P., 2014. Does a growing global youth population fuel political unrest? The Guardian [online], 19 March 2014. Available at: http://www.theguardian.com/world/2014/mar/19/growing-
69
youth-population-fuel-political-unrest-middle-east-south-america [Accessed 03 November 2014]. Langley, S., 2013. Boom cider growth in young Australians market [online]. Aus Food News. Available from: http://ausfoodnews.com.au/2013/08/21/boom-cider-growth-in-young-australians-market.html [Accessed 14 November 2014]. Lossan, A., 2014. Is vodka losing the global battle with whiskey? [online]. Russia Beyond the Headlines. Available from: http://rbth.co.uk/business/2014/07/15/is_vodka_losing_the_global_battle_with_whiskey_38223.html [Accessed 20 November 2014]. Martin, J., 2007. The minimum wage: Making it pay [online]. OECD. Available at: http://www.oecdobserver.org/news/archivestory.php/aid/2217/The_minimum_wage:_Making_it_pay.html [Accessed 05 November 2014]. Mintel, 2012. A refreshing change: The first time cider becomes as popular as lager with Brits [online]. Mintel. Available from: http://www.mintel.com/press-centre/food-and-drink/a-refreshing-change-for-first-time-cider-becomes-as-popular-as-lager-with-brits [Accessed 20 November 2012]. Naidu, G.M., Zou, S. and Cavusgil, S.T., 1993. Product and Promotion Adaptation in Export Ventures: An Empirical Investigation. Journal of International Business Studies [online], 24 (3), 479-506. OECD, 2007. After-tax value of hourly minimum wage [graph]. OECD: Oecd.org. Available at: http://www.oecdobserver.org/images//2218.photo.jpg [Accessed 05 November 2014]. OECD, 2011. OECD Reviews of Labour Market and Social Policies: Russian Federation [online]. UK: OECD. OECD, 2014a. Rising inequality: youth and poor fall further behind [online]. UK: OECD Income Distribution Database. OECD, 2014b. Annual percentage change in disposable income by age [graph]. OECD: Oecd.org. Available at: http://www.oecd.org/els/soc/OECD2014-Income-Inequality-Update.pdf [Accessed 04 November 2014]. OECD, 2014c. Better Life Index: Poland [online]. OECD. Available from: http://www.oecdbetterlifeindex.org/countries/poland/ [Accessed 20 November 2014]. Passport, 2014. Cider/Perry in Russia [online]. Euromonitor International. Available from: https://www.portal.euromonitor.com/portal/analysis/relatedtab [Accessed 20 November 2014]. Polyvore, n.d. Pine Tree clip art [clip art]. Polyvore: polyvore.com. Available from: http://www.polyvore.com/pine_tree_clip_art/thing?id=57963802 [Accessed 02 October 2014]. Pravda, 2010. Doctors: Impoverished in Russia, fabulously wealthy in USA [online]. Available from:
70
http://english.pravda.ru/society/stories/18-10-2010/115411-doctors_russia_usa-0/ [Accessed 19 November 2014]. Reuters, 2012. Insight: Cider, the golden apple of brewers’ eyes [online]. Reuters. Available from: http://uk.reuters.com/article/2012/12/20/us-brewing-cider-idUSBRE8BJ0AX20121220 [Accessed 20 November 2014]. Reuters, 2013a. Consumers to power Russian economy, stock market-study [online]. Reuters. Available from: http://www.reuters.com/article/2013/02/05/russia-consumers-idUSL5N0B587R20130205 [Accessed 20 November 2014]. Reuters, 2013b. Russia’s roads, trains, planes frustrate business [online]. Reuters. Available from: http://uk.reuters.com/article/2013/09/27/russia-investment-infrastructure-reuters-idUKL5N0HG0JF20130927 [Accessed 20 November 2014]. Reuters, 2014a. Russian central bank extends terms of long-term credits to help lenders [online]. Reuters. Available from: http://www.reuters.com/article/2014/06/27/russia-cenbank-loans-idUSL6N0P82SV20140627 [Accessed 18 November 2014]. Reuters, 2014b. Russia bans fruit, veg, meat, fish, dairy imports from U.S., EU [online]. Reuters. Available from: http://uk.reuters.com/article/2014/08/07/uk-ukraine-crisis-russia-sanctions-idUKKBN0G70JG20140807 [Accessed 19 November 2014]. Santisi, G., Platania, S. and Hichy, Z., A lifestyle analysis of young consumers: a study in Italian context. Young Consumers [online], 15 (1), 94-104. Shao, A.T. and Hill, J.S., 1994. Global Television Advertising Restrictions: The Case Study of Socially Sensitive Products. International Journal of Advertising [online], 13 (4), 347-366. Shcherbakova, E.M., 2008. The Trend of Education in Russia. Russian Education and Society [online], 50 (4), 26-41. Singh, J., 2014. National Youth Policy 2014 [online]. India: Government of India. Skinner, H., Lombardo, C., Zakus, D., 2002. Youth social action: building a global latticework through information and communication technologies. Oxford Journals [online], 17 (4), 363-371. Suoronta, J., 2004. World Youth Report 2003: Chapter 12. Youth and Information and Communication Technologies [online]. New York: United Nations. The Economist, 2014. Eat apples to annoy Putin [online]. The Economist. Available from: http://www.economist.com/blogs/easternapproaches/2014/08/poland-and-russia [Accessed 20 November 2014].
71
The Guardian, 2009. What is the biggest issue facing young people today? [graph]. Theguardian.com. Available at: http://www.theguardian.com/society/poll/2009/apr/15/young-people-poll [Accessed 03 November 2014]. The Heritage Foundation, 2014. Index of Economic Freedom: Russia [online]. The Heritage Foundation. Available from: http://www.heritage.org/index/country/russia [Accessed 19 November 2014]. The Hofstede Centre, 2014. Russia in comparison with Australia [online]. Geert Hofstede. Available from: http://geert-hofstede.com/russia.html [Accessed 14 November 2014]. The Money Advice Service, 2014. One in 11 Britons has less than £10 a month disposable income [online]. The Money Advice Service. Available at: https://www.moneyadviceservice.org.uk/en/news/one-in-11-britons-has-less-than-gbp10-a-month-disposable-income-02102013 [Accessed 05 November 2014]. The World Bank, 2014. Political Stability and Absence of Violence [graph]. The World Bank: info.worldbank.org. Available from: http://info.worldbank.org/governance/wgi/index.aspx#reports [Accessed 18 November 2014]. Trading Economics, 2014a. Russia GDP [online]. Trading Economics. Available from: http://www.tradingeconomics.com/russia/gdp [Accessed 18 November 2014]. Trading Economics, 2014b. Russian Ruble [online]. Trading Economics. Available from: http://www.tradingeconomics.com/russia/currency [Accessed 18 November 2014]. Trading Economics, 2014c. Russia Inflation Rate [online]. Trading Economics. Available from: http://www.tradingeconomics.com/russia/inflation-cpi [Accessed 18 November 2014].
Trading Economics, 2014d. Russia Productivity [online]. Available from: http://www.tradingeconomics.com/russia/productivity [Accessed 18 November 2014]. Trading Economics, 2014e. Russia Balance of Trade [online]. Trading Economics. Available from: http://www.tradingeconomics.com/russia/balance-of-trade [Accessed 18 November 2014]. Trading Economics, 2014f. Literacy Rate – Youth Total in Russia [online]. Trading Economics. Available from: http://www.tradingeconomics.com/russia/literacy-rate-youth-total-percent-of-people-ages-15-24-wb-data.html [Accessed 19 November 2014]. Trading Economics, 2014g. Poland Inflation Rate [online]. Trading Economics. Available from: http://www.tradingeconomics.com/poland/inflation-cpi [Accessed 20 November 2014]. Trading Economics, 2014h. Poland Productivity [online]. Trading Economics. Available from: http://www.tradingeconomics.com/poland/productivity [Accessed 20 November 2014]. Trading Economics, 2014i. Poland Foreign Direct Investment [online]. Trading Economics. Available from: http://www.tradingeconomics.com/poland/foreign-direct-investment [Accessed 20 November
72
2014]. Transparency, 2013. Corruption Perception Index 2013 [online]. Transparency. Available from: http://www.transparency.org/cpi2013/results [Accessed 19 November 2014]. Transparency 2014. Corruption Perception Index: Poland [online]. Transparency. Available from: http://www.transparency.org/country/#POL [Accessed 20 November 2014]. Tuttle, B., 2012. The Declining Economic Might of the Once Coveted 18-to-34 Demographic [online]. Business Time. Available at: http://business.time.com/2012/03/16/the-declining-economic-might-of-the-18-to-34-demographic/ [Accessed 05 November 2014]. UNESCO, 2013. Statistics on Youth [online]. UNESCO. Available from: http://www.unesco.org/new/en/unesco/events/prizes-and-celebrations/celebrations/international-days/world-radio-day-2013/statistics-on-youth/ [Accessed 10 November 2014]. United Nations, 2004. World Youth Report 2003: The global situation of young people [online]. New York: United Nations. United Nations, 2010. World Youth Report: Youth and Climate Change [online]. New York: United Nations. United Nations Youth, 2013a. Definition of Youth [online]. United Nations. Available from: http://www.un.org/esa/socdev/documents/youth/fact-sheets/youth-definition.pdf [Accessed 30 October 2014]. United Nations Youth, 2013b. Youth, Political Participation and Decision-Making [online]. United Nations. Available from: http://www.un.org/esa/socdev/documents/youth/fact-sheets/youth-political-participation.pdf [Accessed 03 November 2014]. United Nations Youth, 2013c. Culture and Youth Development [online]. United Nations. Available from: http://www.un.org/esa/socdev/documents/youth/fact-sheets/youth-cultureasavector.pdf [Accessed 03 November 2014]. United Nations, n.d. Social Policy and Development Division: Youth FAQs [online]. United Nations. Available from: http://undesadspd.org/youth/faqs.aspx [Accessed 30 October 2014]. Vignali, C., 2001. McDonald’s: “think global, act local” – the marketing mix. British Food Journal [online], 103 (2), 97-111. Vrontis, D., 2001a. Integrating Adaptation and Standardisation in International Marketing: The AdaptStand Modelling Process [online]. Manchester: Manchester Metropolitan University Business School. Vrontis, D., 2001b. Toward standardisation and adaptation: a conceptualisation [framework]. Manchester: Manchester Metropolitan University Business School. Available from: http://www.ribm.mmu.ac.uk/wps/papers/01-17.pdf [Accessed 18 November 2014]. Vrontis, D., 2001c. Multinational Companies Tactical Behaviour [table]. Manchester: Manchester Metropolitan University Business School. Available from: http://www.ribm.mmu.ac.uk/wps/papers/01-17.pdf [Accessed 18 November 2014].
73
Vrontis, D., 2009. International marketing adaptation versus standardisation of multinational companies. International Marketing Review [online], 26 (4-5), 477-500. White, I., 2014. Countries with minimum voting age other than 18 [table]. UK: House of Commons. Available at: www.parliament.uk/briefing-papers/sn01747.pdf [Accessed 04 November 2014]. World Economic Forum, 2014. The Global Competitiveness Report 2014-2015 [online]. New York: World Economic Forum. World Health Organization, 2014. Russian Federation: Global Alcohol Report [online]. World Health Organization. Available from: http://www.who.int/substance_abuse/publications/global_alcohol_report/profiles/rus.pdf [Accessed 20 November 2014]. World Public Opinion, 2006. Russian’s support Putin’s re-nationalisation of oil [online]. World Public Opinion. Available from: http://www.worldpublicopinion.org/pipa/articles/breuropera/224.php?lb=breu [Accessed 18 November 2014]. Youth Policy, 2014. The state of youth policy in 2014 [online]. Youth Policy. Available at: http://www.youthpolicy.org/blog/2014/05/state-of-youth-policy-2014/ [Accessed 04 November 2014]. Zou, S. and Volz, Y.Z., 2010. An Integrated Theory of Global Advertising. International Journal of Advertising [online], 18 (1), 57-84.
74
Related Documents