1 Chapter 10 International Maritime Freight Transport and Logistics Jean-Paul Rodrigue a , Michael Browne b a Department of Economics & Geography, Hofstra University, Hempstead, New York 11549, USA b School of Architecture and the Built Environment, University of Westminster, UK For TRANSPORT GEOGRAPHIES: AN INTRODUCTION, Blackwell Publishing Edited by Richard Knowles, Jon Shaw and Iain Docherty Abstract Maritime transport remains the dominant mode for international trade both for bulk transport of commodities and containerized break-bulk cargo. The economics of bulk transport still influence trade patterns and industrial location. Intermodal transport has become a global phenomenon as mechanized handling and containerization have reduced handling costs between modes and promoted their efficiency. Ports have become elements in global commodity chains controlled by logistics companies, maritime shipping lines, freight forwarders and transport operators. Their strategies and the allocation of their assets have shaped the structure of maritime transport networks in terms of ports of call, hierarchy and frequency of services. Post-Panamax container ships encourage pendulum services and the setting of high capacity inland corridors. Keywords: Maritime Transport, Bulk, Containerization, Ports, Logistics. 1. Freight Transport, Maritime Transport and the Global Economy A Changing Economic and Spatial Context Few transport systems have been more impacted by globalization than freight transportation. Paradoxically, in a field dominated by passengers, freight remains fairly unnoticed by the general public, albeit manufacturers and retailers are keenly aware of the benefits derived from efficient distribution. In fact, the profit margin of many retailers and manufacturers is directly dependent on efficient distribution strategies encompassing a wide array of global suppliers. As such, in the last decades, international trade has systematically expanded at a rate faster than economic growth, an outcome of an international division of the production and massive accumulation of new manufacturing activities in developing countries. Maritime transportation is at the core of global freight distribution in terms of its unparallel physical capacity and ability to carry freight over long distances and at low costs. Aside from these well known characteristics, the maritime industry has substantially changed in recent decades. From an industry that was always international in its character, maritime transportation has become a truly global entity with routes that spans across hemispheres, forwarding raw materials, parts and finished goods. In fact, it is one of the most globalized industries around: “A Greek owned vessel, built in Korea, may be chartered to a Danish operator, who employs Philippine seafarers via a Cypriot crewing agent, is registered in Panama, insured in the UK, and transports German made cargo in the name of a Swiss freight forwarder from a Dutch port to Argentina, through terminals that are concessioned to port operators from Hong Kong and Australia” (Kumar and Hoffmann, 2002, p. 36)

Welcome message from author
This document is posted to help you gain knowledge. Please leave a comment to let me know what you think about it! Share it to your friends and learn new things together.
Transcript

1
Chapter 10
International Maritime Freight Transport and Logistics
Jean-Paul Rodrigue a, Michael Browne
b
a Department of Economics & Geography, Hofstra University, Hempstead, New York 11549, USA
b School of Architecture and the Built Environment, University of Westminster, UK
For TRANSPORT GEOGRAPHIES: AN INTRODUCTION, Blackwell Publishing
Edited by Richard Knowles, Jon Shaw and Iain Docherty
Abstract
Maritime transport remains the dominant mode for international trade both for bulk transport of
commodities and containerized break-bulk cargo. The economics of bulk transport still influence trade
patterns and industrial location. Intermodal transport has become a global phenomenon as mechanized
handling and containerization have reduced handling costs between modes and promoted their efficiency.
Ports have become elements in global commodity chains controlled by logistics companies, maritime
shipping lines, freight forwarders and transport operators. Their strategies and the allocation of their assets
have shaped the structure of maritime transport networks in terms of ports of call, hierarchy and frequency
of services. Post-Panamax container ships encourage pendulum services and the setting of high capacity
inland corridors.
Keywords: Maritime Transport, Bulk, Containerization, Ports, Logistics.
1. Freight Transport, Maritime Transport and the Global Economy
A Changing Economic and Spatial Context
Few transport systems have been more impacted by globalization than freight transportation.
Paradoxically, in a field dominated by passengers, freight remains fairly unnoticed by the general
public, albeit manufacturers and retailers are keenly aware of the benefits derived from efficient
distribution. In fact, the profit margin of many retailers and manufacturers is directly dependent
on efficient distribution strategies encompassing a wide array of global suppliers. As such, in the
last decades, international trade has systematically expanded at a rate faster than economic
growth, an outcome of an international division of the production and massive accumulation of
new manufacturing activities in developing countries. Maritime transportation is at the core of
global freight distribution in terms of its unparallel physical capacity and ability to carry freight
over long distances and at low costs. Aside from these well known characteristics, the maritime
industry has substantially changed in recent decades. From an industry that was always
international in its character, maritime transportation has become a truly global entity with routes
that spans across hemispheres, forwarding raw materials, parts and finished goods. In fact, it is
one of the most globalized industries around:
“A Greek owned vessel, built in Korea, may be chartered to a Danish operator, who employs
Philippine seafarers via a Cypriot crewing agent, is registered in Panama, insured in the UK,
and transports German made cargo in the name of a Swiss freight forwarder from a Dutch port
to Argentina, through terminals that are concessioned to port operators from Hong Kong and
Australia” (Kumar and Hoffmann, 2002, p. 36)
2
International maritime freight transport is composed of two main segments, the modes which are
flexible in their spatial allocation, and the terminals, as locations, which are not. Shipping lines
have a level of flexibility in terms of route selection, frequency and levels of service, but port
terminals have a fixed capacity that if not used can imply serious financial consequences.
Reconciling these two segments remains a challenge, particularly since the volume of maritime
freight is steadily growing and since freight distribution is getting more complex as it services
many origins, destinations and supply chains. Logistics has done a lot to reconcile the strategies
of the maritime actors and in many cases shipping lines have taken matters into their own hands
by investing directly in terminal facilities and securing access to hinterlands. Global port
operators such as Hutchinson Port Holdings, APM Terminal, Port of Singapore Authority and
Dubai Ports International are now managing terminal facilities in almost every single major port
around the world.
The Enduring Relevance of Port Sites
Ports as locations where maritime and land traffic converges are crucial facilities in the global
economy. There are more than commercial 4,500 ports around the world, but only a small share
handle a significant amount of traffic (NGIA, 2005). The geography of these ports conditions the
global geography of trade and flows since they are locations that cannot be easily by-passed.
Ports remain points of convergence and divergence of traffic and their location is constrained by
the physical characteristics of their sites. The first physical constraint involves land access and the
second concerns maritime access. Both must be jointly satisfied as they are crucial for port
operations and the efficiency of the maritime / land interface. Thus, poor land and maritime
access can impair port operations and port development. However, maritime access is the
attribute that can be mitigated the least. Activities such as dredging and the construction of
facilities such as docks are very expensive, underlining the enduring importance of a good port
site, albeit inland access also endures as a factor of importance for maritime freight distribution.
Global Commodity Chains and Logistical Strategies
Global production, transportation and distribution require the setting of freight management
strategies. As such, logistics concern all the activities required for goods to be made available on
markets, including purchase, order processing, inventory management and transportation among
the most relevant. The expansion of production in the global realm induced transport systems to
adapt to a new environment in freight distribution where the reliable and timely deliveries can be
as important as costs. Logistics has consequently taken an increasingly important role in the
global economy, supporting a wide array of commodity chains (Hesse and Rodrigue, 2004, 2006).
This is the setting in which maritime transportation is increasingly embedded. At the core of this
relationship, Global Commodity Chains (GCC) can be considered as functionally integrated
networks of production, trade and service activities that cover all the stages in a supply chain,
from the transformation of raw materials, through intermediate manufacturing stages, to the
delivery of a finished good to a market (e.g. Gereffi, 1999). The development of global
transportation and telecommunication networks, information technologies, the liberalization of
trade and multinational corporations are all factors that have substantially impacted GCC (Dicken,
2003).
In such a new environment, the precepts of international freight transportation are being re-
defined, both for bulk and for break-bulk cargo. The former comprises homogeneous materials
without packaging (ores, coal, grain, raw sugar, cement, crude oil and oil products, etc.) usually
for a single consignee and destination, while the latter, often known as general cargo, consists of
an almost infinite variety of freight, usually in small consignments for numerous consignees and

3
packaged in a variety of bags, bales, boxes, crates and drums of diverse shape and size. However,
containers account for the majority of the break-bulk cargo being carried.
2. Bulk Maritime Freight
Characteristics
The marine industry is an essential link in international trade, with ocean-going vessels
representing the most efficient, and often the only method of transporting large volumes of basic
commodities and finished products (Gardiner, 1992). In 2005, approximately 2.9 billion tons of
drybulk cargo was transported by sea, comprising more than one-third of all international
seaborne trade. Bulk freight represents the “traditional” segment of maritime freight distribution
with a wide variety of physical characteristics of the cargoes. Each has specific requirements with
respect to stowage in the ship, methods of transhipment, and inland transport (Table 1).
Geographically, bulk cargo shows a remarkable stability, particularly in terms of its origins. The
extraction and shipment of natural resources, such as minerals and oil, is bound to the geological
setting, require massive capital investments and takes place over decades. The maritime traffic
associated with these activities is thus highly consistent and varies according to cyclic demand
patterns. The same applies for agricultural commodities since agricultural regions are long
standing entities with a reasonably consistent output. What is changing more rapidly concerns the
destinations of bulk freight as they reflect changes in economic development and the setting of
new markets and industrial regions. A remarkable shift thus involved growing demands from the
industrializing countries of Pacific Asia and the related changes in the volume of bulk shipping
routes.
Table 1 Types of Maritime Cargo
Rail wagon, lorryRoll-on/roll-offCars, lorries, rail wagonsWheeled Units
Rail wagon, lorryLift-on/lift-offMeat, fruit, dairy produceRefrigerated/chilled
cargo
Barge, rail wagon, lorryLift-on/lift-off, roll-on/roll-offForest products, steel products,
baled scrapNeo Bulk
Conveyor, barge, rail wagon,
lorry
Grab, conveyorCoal, iron ores, non-ferrous
ores, phosphate rock
B) Irregular
Pipes, conveyors, barge, rail
wagon, lorry
Pneumatic / suction, conveyor,
grabs
Grain, sugar, powders
(alumina, cement)
A) Flowing
Dry Bulk
Temperature controlled
pipelines
Pumps, temperature controlled
pipelines
Liquefied gases (LNG), heavy
oils, latex, bitumen, vegetable
oils
B) Other pressure and
temperature
PipelinePump/pipeCrude oil, most oil products,
wine, slurried coal
A) Normal pressure and
temperature
Liquid
Inland distributionMaritime TransshipmentExamplesCommodity type
Source: adapted from D. Hilling and M. Browne (1998) “Ships, Ports and Bulk Freight Transport” in B. Hoyle and
R.D. Knowles (eds), Modern Transport Geography, London: Wiley.
Drybulk cargo is shipped in large quantities and can be easily stowed in a single hold with little
risk of cargo damage. It is generally categorized as either major bulk or minor bulk. Major bulk
cargo constitutes the vast majority of drybulk cargo by weight, and includes, among other things,
iron ore, coal and grain. Minor bulk cargo includes products such as agricultural products,

4
mineral cargoes (including metal concentrates), cement, forest products and steel products and
represents the balance of the drybulk industry. In terms of seaborne trade volumes (and the
shipping ton-miles generated), the dominant influence is that of the major bulk trades.
The cargo type is reflected in the associated port activity. For the higher unit value containerized
break-bulk cargo, a port is usually the gateway through which the cargo passes to the hinterland,
while for the bulk cargo it acts as a terminal - the cargo is stored and often processed before
onward movement. In the case of many bulk cargo, the port site in often an industrial site linked
with the transformation and processing of those commodities. While for a break-bulk flows can
be bi-directional (inward and outward), bulk flows are dominantly directional (inward or
outward). Bulk cargo is thus imported and processed with the output commonly belonging to a
different transport chain that cannot be serviced by the original maritime equipment. Even if the
unit and possibly the total value of bulk cargoes may not compare with those of general cargo, the
sheer volumes involved give them a special significance in transport systems (Figure 1).
0 5,000 10,000 15,000 20,000 25,000 30,000 35,000
1970
1980
1985
1990
1995
2000
2005
Oil
Iron Ore
Coal
Grain
Containers and other
Figure 1 Ton-miles Shipped by Maritime Transportation, 1970-2005 (in billions)
Oil, iron ore, grain and coal accounted for the great majority of ton-miles shipped, about 70% in
2005. Containers and other goods composed the remaining 30%. While the share of containerized
traffic has increased significantly, bulk still dominates maritime shipping. It may be argued that
raw materials play only a small part in influencing industrial location in general. Nevertheless,
there are a number of basic heavy industries - mineral and chemical refining most obviously -
where the volume of bulk materials does have a profound impact on the location of processing
industries and also on shipping markets, patterns of trade and port activity.
Transport of Bulk Cargo
Much of the conventional port industry is a consequence of servicing commodities moving in
bulk. For the maritime cargo to be moved specific conditions have to be satisfied (Stopford,
1997):
• Transportability. The commodity must have physical characteristics that allow it to be
handled and moved in bulk. Liquids such as oil require entirely different, and non-
convertible, equipment than solids. Technical improvements have recently permitted the

5
potential to move natural gas in large quantities through the use of LNG carriers, but it
still remains an expensive and technically challenging endeavor.
• Costs. The demand and the price for the commodity must be such that the cost of
specialized ships and handling equipment is justified. The smallest practicable
consignment size will effectively be that of the smallest bulk carrier available. A figure of
1,000 tons has been suggested as a minimum threshold for bulk handling and this has not
changed greatly in recent years.
• Compatibility. The bulk-shipping operation must be adapted to the overall transport
system, so as there is the possibility to move commodities along multimodal transport
chains. In many cases, this requires specialized terminals.
• Load size. The individual consignment size must be geared to the stocks that can be held
at either end of the transport link. This is related to the actual demand at the consuming
end, to the storage space available at each end and to the frequency of shipment.
The availability of storage space is an important determinant of the efficiency and productivity of
any port since there is an almost inevitable mismatch between the rate of cargo transshipment and
the rate at which it enters and leaves the port on the landward side (Takel, 1981). Storage space
acts as the essential buffer to balance the flows on the sea and land sides. This is important for
general cargoes, but it becomes critical for large volumes of bulk cargo. The amount of space for
storage is a function of the density of the commodity where it must allow for access and handling
equipment such as stackers, cranes, conveyors and reclaimers. Additional storage space will be
needed where materials are sorted by grade or type (e.g. coals, ores and crude oils) and possibly
to accommodate changes consequent upon conditions (e.g. wet and dry ores or coal). A regular
flow of bulk raw materials is essential for any industrial process. Storage is vital in reducing the
effects of flow variations but storage replenishment for a given tonnage can be either by frequent
small shipments or by less frequent large shipments. This clearly involves the question of vessel
size and choice is influenced by the interplay between economies of scale, consignment size and
the physical constraints provided by the routes, ports and handling equipment (Stopford, 1997).
Shipping is less limited by size constraints than other modes and is able to capitalize on what has
been called the “cube law”; for a doubling of a ships' dimensions the carrying capacity is cubed.
Also, the design, construction and operating costs (crew, fuel) do not increase in proportion with
size. A 300,000 ton tanker is able to operate with a crew no larger than that needed for a
significantly smaller vessel, although there will be variations depending on national flag
regulations, level of automation and company organization (e.g. the amount of emphasis on
shipboard maintenance). The same rationale applies for containerships where increasing sizes do
not require additional labor and in many cases newer containerships have actually a smaller crew.
There is thus a strong rationale in maritime shipping to achieve economies of scale since they are
linked with lower operating costs, particularly for bulk carriers, containerships and tankers.
Many bulk trades are effectively one-way traffic with return voyages in ballast. However, while
consignments of such size may be available from oil and ore producers and acceptable at the
processing plant, this would not be the case for all bulk trades. Also, there is no financial
advantage in using large vessels if the loading and unloading rate is slow and the vessel is kept
unduly long in port. The ultimate constraint on vessel size remains the physical characteristics of
the port (channel depths, turning circles, lock gate dimensions, and berth lengths) and the routes
along which ships operate, particularly strategic passages. This has lead to well known capacity
standards such as Panamax1, and Suezmax
2. A VLCC
3 of 300,000 deadweight tons can transit the
1 The largest vessel that can transit the Panama Canal (draught of 12 meters), a bulk carrier of about 65,000
deadweight tons.

6
Strait of Malacca but any larger vessel would have to make a much longer voyage by way of the
deeper Lombok Strait. These standards have for long shaped global bulk trades and more recently
containerized maritime shipping.
Seasonal demand fluctuations influence many of the bulk trades. Steam coal is linked to the
energy markets and in general encounters upswings towards the end of the year in anticipation of
the forthcoming winter period (in the northern hemisphere) as power supply companies try to
increase their stocks, or during hot summer periods when increased electricity demand is required
for air conditioning and refrigeration purposes. Grain production is highly seasonal and driven by
the harvest cycle of the northern and southern hemispheres. However, with four nations and the
European Union representing the largest grain producers (the United States, Canada and the
European Union in the northern hemisphere and Argentina and Australia in the southern
hemisphere), harvests and crops reach seaborne markets throughout the year. It becomes a matter
of fleet reassignment to follow the seasonality.
Petroleum Trade
Petroleum transportation concerns a tightly integrated distribution system that maintains a
continuous flow from the oil fields to the final consumption, most of it concerning fuel for
transportation. There is limited storage taking place outside the maintenance of strategic reserves.
The volume of international oil trade increased as a result of world economic growth and
additional demands in energy. Although developed countries such as the United States Western
Europe and Japan account for about 75% of global crude oil imports, the largest growth in
demand is mainly attributed to China and India. As of 2004, China became the world’s second
largest oil importer behind the United States. International oil trade is necessary to compensate
the spatial imbalances between supply and demand. Unlike most other countries, which either
consume almost their entire production (United States and China) or have privileged partners
(Russia and Western Europe), a major portion of OPEC’s oil is traded on international markets.
Each year, about 2.4 billion tons of petroleum are shipped by maritime transportation, which is
roughly 62% of all the petroleum produced. The remaining 38% uses pipelines, trains or trucks
over shorter distances. Most of the petroleum follows a set of maritime routes between producers
and consumers. More than 100 million tons of oil is shipped each day by tankers, about half of
which is loaded in the Middle East and then shipped to Japan, the United States and Europe.
Tankers bound for Japan use the Strait of Malacca while tankers bound for Europe and the United
States use either the Suez Canal or the Cape of Good Hope, pending the tanker’s size and its
specific destination.
Different tanker sizes are used for different routes, namely because of distance and port access
constraints. There is thus a specialization of maritime oil transportation in terms of ship size
according to the markets being serviced. VLCCs are mainly used from the Middle East over long
distances (Western Europe, United States and Pacific Asia). “Suezmax”4 tankers are mainly used
for long to medium hauls between West Africa and Western Europe and the United States, while
“Aframax”5 tankers are used for short to medium hauls such as between Latin America and the
United States. Transport costs have a significant impact on market selection. For instance, three
quarters of American oil imports are coming from the Atlantic Basin (including Western Africa)
with journeys of less than 20 days. Venezuelan oil takes about 8 days to reach the United States
2 Draught of 16 m which can accommodate a loaded tanker of about 200,000 deadweight tons. 3 Very Large Crude Carrier. 4 Between 125,000 and 180,000 deadweight tons. 5 Approximately 80,000 deadweight tons.

7
while Saudi oil takes 6 weeks. The great majority of Asian oil imports are coming from the
Middle East, a 3 week journey. In addition, due to environmental and security considerations,
single-hulled tankers are gradually phased out to be replaced by double-hulled tankers (Rodrigue,
2004).
Coal trade
Coal is an abundant commodity which is mined in more than 50 countries with no world
dependence in any one region. Coking coal is used to produce coke to feed blast furnaces in the
production of steel. An increase in seaborne transportation of coking coal has been primarily
driven by an increase in steel production. The increase in import activity has occurred in a
number of regions. Currently, Asia and Western Europe are major importers of coking coal.
Australia and Indonesia provide a significant amount of coking coal to Asia, while South Africa
and the United States are major sources for Western Europe. Steam coal is primarily used for
power generation. A number of developing countries have decided to capitalize on the recent
dramatic increase in oil and gas prices to build new power plants that utilize coal. This has
resulted in significant growth in the steam coal trade. The most dramatic growth has occurred in
China and Indonesia, both of which have increased their export capacity in the intra-Asian market
(World Coal Institute, 2005).
Coal is traded all over the world, with coal shipped long distances by sea to reach markets.
Overall international trade in coal reached 755 Mt in 2004 (compared with 383 Mt in 1994).
While this is a significant amount of coal it still only accounts for about 16% of total coal
consumed. Transportation costs account for a large share of the total delivered price of coal, and
as a result international trade in steam coal is effectively divided into two regional markets; the
Atlantic and the Pacific, The Pacific market currently accounts for about 50% of world steam coal
trade. Australia is the world’s largest coal exporter, exporting over 218 Mt of hard coal in 2004,
out of its total production of 285 Mt. Australia is also the largest supplier of coking coal,
accounting for 52% of world exports (World Coal Institute, 2005). The USA and Canada are
significant exporters and China is emerging as an important supplier. Coking coal is more
expensive than steam coal, which means that Australia is able to afford the high freight rates
involved in exporting coking coal worldwide.
Grain trade
World grain shipments, which reached 250 million tons in 2004, were almost equally split
between wheat and coarse grains such as maize, barley, soybeans, sorghum, oats and rye. Grains
include wheat, coarse grains (corn, barley, oats, rye and sorghum) and oil seeds extracted from
different crops such as soybeans and cottonseeds. In general, wheat is used for human
consumption, while coarse grains are used as feed for livestock. Oil seeds are used to
manufacture vegetable oil for human consumption or for industrial use, while their protein-rich
residue is used as a raw material in animal feed. Total grain production is dominated by the
United States. Argentina is the second largest producer followed by Canada and Australia. In
terms of imports, the Asia/Pacific region (excluding Japan) ranks first, followed by Latin
America, Africa and the Middle East. The principal vessel classes used in the grain trade are
Panamax and Handymax (vessels of 30-60,000 dwt).
The grain market is volatile and highly dependent upon weather patterns and yearly harvest
changes. This in turn influences the price of grain and indeed freight rates. The ongoing growth of
the global population let foresee a continuing growth of the maritime grain trade, particularly
imports from newly industrializing countries, many of which are expected to see a net negative
balance in grain production.

8
3. Containerized Maritime Freight
The Containerization of Maritime Transportation
The maritime industry has been transformed by more than 50 years of containerization since the
first containerized maritime shipment set sail from Port Newark, New Jersey in 1956. It does not
come as a surprise that maritime transportation was the first mode to pursue containerization
since it is the most constrained by loading and unloading operations. Containerization permits the
mechanized handling of cargoes of diverse types and dimensions that are placed into boxes of
standard size. Thus, non standard traffic that would have required significant and labor intensive
transshipment activities becomes standardized with time consuming and costly stevedoring
reduced. Instead of taking days to be loaded or unloaded, cargo can now be handled in a much
shorter time period as a modern container crane can accommodate about two movements per
minute. The most common container is 40 foot in length, the equivalent of two TEUs6. Separate
transport systems are becoming integrated by intermodal transportation, where each mode tends
to be used in the most productive manner. Thus, the line-haul economies of maritime shipping
can be combined with the hinterland access provided by rail and trucking. The entire transport
sequence is now seen as a whole, rather than as a series of stages, which is changing the role and
function of freight forwarders, transport companies, terminal operators and third party-logistics
providers7.
Containerization has been brought about in part by technology and has substantially impacted
maritime design with the creation of the containership. While the first containerships were
converted cargo vessels, by the late 1960s the containerized market has grown enough to justify
the creation of ships entirely designed for such a purpose. Since that time, the construction of
containerships has followed incremental improvements in design with economies of scale being
the main rationale (Table 2); the larger the ship, the cheaper the transport costs per TEU
(Cullinane and Khanna, 2000). By the late 1980s, the limitations of the Panama Canal of about
4,000 TEU were surpassed, creating a new class of “post-panamax” containerships that have a
higher capacity but whose draft and transshipment requirements precludes a number of ports
(McLellan, 1997). Once this threshold was overcome, the size of containerships entering service
quickly increased. In about a decade containership design went from a maximum capacity of
6,700 TEU to 14,500 TEU. Design constraints are now limited by the capacity of port channels to
accommodate containership drafts and as well as the availability of cranes large enough to unload
them. In addition, they cause additional pressure on inland transport systems to accommodate the
large volume of containers they can transship. Speed-wise, a threshold of about 25 knots has been
reached as energy consumption would forbid higher operational speeds.
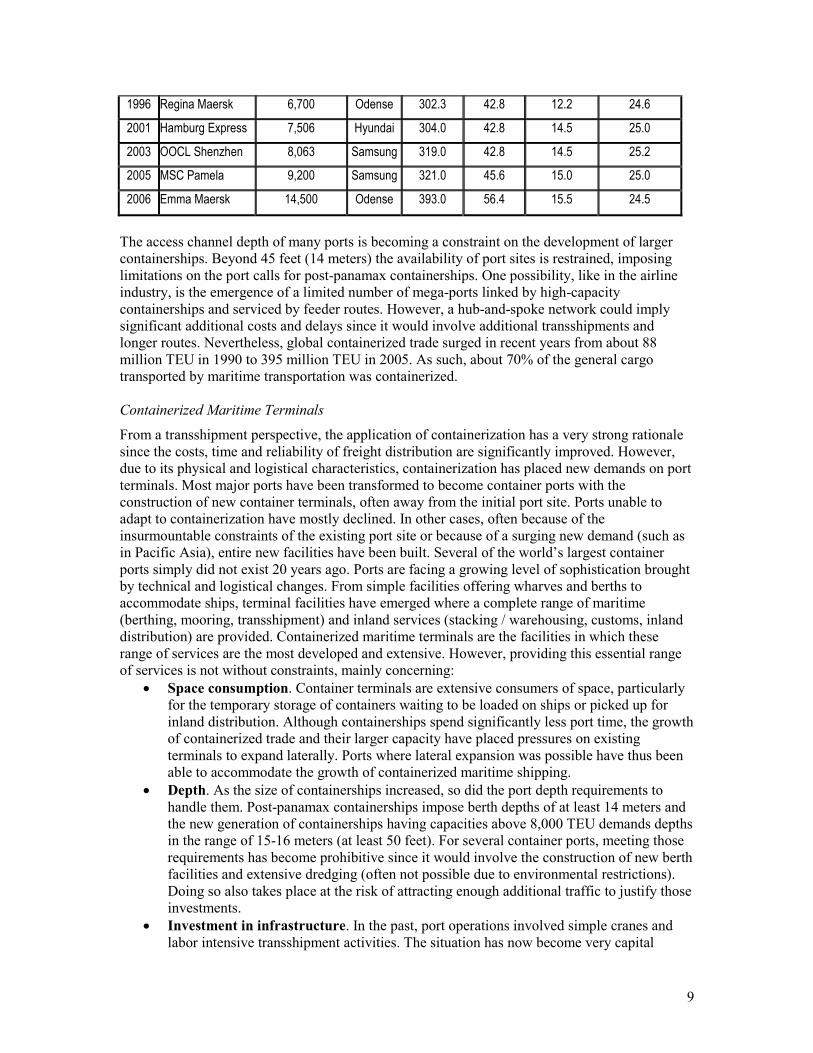
Table 2 Some Major Landmarks in Containerships Construction
Year Name Capacity (TEU) Yard Length (m) Width (m) Draft (m) Speed (knots)
1956 Ideal X 58 US 174.2 23.6 ? 18.0
1968 Elbe Express 730 B&V 171.0 24.5 7.9 20.0
1981 Frankfurt Express 3,430 HDW 271.0 32.3 11.5 23.0
1991 Hanover Express 4,407 Samsung 281.6 32.3 13.5 23.0
1995 APL China 4,832 HDW 262.0 40.0 12.0 24.6
6 Twenty Foot Equivalent Units; a standard unit of container traffic measurement. 7 A third-party logistics provider is an asset based company that offers, often through contractual
agreements, logistics and supply chain management services to its customers.
9
1996 Regina Maersk 6,700 Odense 302.3 42.8 12.2 24.6
2001 Hamburg Express 7,506 Hyundai 304.0 42.8 14.5 25.0
2003 OOCL Shenzhen 8,063 Samsung 319.0 42.8 14.5 25.2
2005 MSC Pamela 9,200 Samsung 321.0 45.6 15.0 25.0
2006 Emma Maersk 14,500 Odense 393.0 56.4 15.5 24.5
The access channel depth of many ports is becoming a constraint on the development of larger
containerships. Beyond 45 feet (14 meters) the availability of port sites is restrained, imposing
limitations on the port calls for post-panamax containerships. One possibility, like in the airline
industry, is the emergence of a limited number of mega-ports linked by high-capacity
containerships and serviced by feeder routes. However, a hub-and-spoke network could imply
significant additional costs and delays since it would involve additional transshipments and
longer routes. Nevertheless, global containerized trade surged in recent years from about 88
million TEU in 1990 to 395 million TEU in 2005. As such, about 70% of the general cargo
transported by maritime transportation was containerized.
Containerized Maritime Terminals
From a transshipment perspective, the application of containerization has a very strong rationale
since the costs, time and reliability of freight distribution are significantly improved. However,
due to its physical and logistical characteristics, containerization has placed new demands on port
terminals. Most major ports have been transformed to become container ports with the
construction of new container terminals, often away from the initial port site. Ports unable to
adapt to containerization have mostly declined. In other cases, often because of the
insurmountable constraints of the existing port site or because of a surging new demand (such as
in Pacific Asia), entire new facilities have been built. Several of the world’s largest container
ports simply did not exist 20 years ago. Ports are facing a growing level of sophistication brought
by technical and logistical changes. From simple facilities offering wharves and berths to
accommodate ships, terminal facilities have emerged where a complete range of maritime
(berthing, mooring, transshipment) and inland services (stacking / warehousing, customs, inland
distribution) are provided. Containerized maritime terminals are the facilities in which these
range of services are the most developed and extensive. However, providing this essential range
of services is not without constraints, mainly concerning:
• Space consumption. Container terminals are extensive consumers of space, particularly
for the temporary storage of containers waiting to be loaded on ships or picked up for
inland distribution. Although containerships spend significantly less port time, the growth
of containerized trade and their larger capacity have placed pressures on existing
terminals to expand laterally. Ports where lateral expansion was possible have thus been
able to accommodate the growth of containerized maritime shipping.
• Depth. As the size of containerships increased, so did the port depth requirements to
handle them. Post-panamax containerships impose berth depths of at least 14 meters and
the new generation of containerships having capacities above 8,000 TEU demands depths
in the range of 15-16 meters (at least 50 feet). For several container ports, meeting those
requirements has become prohibitive since it would involve the construction of new berth
facilities and extensive dredging (often not possible due to environmental restrictions).
Doing so also takes place at the risk of attracting enough additional traffic to justify those
investments.
• Investment in infrastructure. In the past, port operations involved simple cranes and
labor intensive transshipment activities. The situation has now become very capital
10
intensive while labor requirements have been reduced. Modern containerized operations
require a limited amount of labor, but the skill level of this labor is much higher. Each
new generation of containerships, in addition to their draft, require larger and more
efficient cranes. The level of capital investment becomes very demanding. This takes
place in the context of growing hinterland competition where ports are less secure about
the stability of their customer base.
• Inland connections. Traditionally inland access was of lesser importance because most
of the warehousing was directly adjacent to port terminals. These facilities stored the
freight related to maritime shipping and this freight moved inland as orders were being
filled. The situation substantially changed with containerization. Containers are bound
directly to their destinations with only temporary stacking at port terminals. The
importance has shifted to the capacity of inland transport systems to handle high
container throughputs related to port terminals. For large ports, providing inland
distribution capacities has become one of the most serious challenges with initiative such
as on-dock rail access and transshipments to/from barges.
Figure 2 reveals an emerging geography of containerized maritime terminals. Aside from the
conventional port clusters in Europe and North America many corresponding to older ports partly
or wholly converted to containerization, new regions and new port clusters have emerged, mainly
in Pacific Asia. The most substantial growth took place along the Tokyo – Singapore corridor,
where economies have followed the export-oriented model, producing consumption goods highly
prone to the use of containerization and bound for the global market.

11
Fig
ure 2
The W
orld
’s 50 L
arg
est Conta
iner P
orts, 2
004
Dubai
Tacoma
Santos
Jeddah
Durban
Seattle
Salalah
Oakland
Colombo
Melbourne
Long Beach
Charleston
Nhava Sheva
Los Angeles
New York/New Jersey
Kobe
TokyoOsaka
BusanNingbo
Nagoya
Manila
Dalian
Yanti an
Tianjin
Keelung
Yokohama
ShenzhenShanghai
Quingdao
Singapore
Kaohsiung
Hong Kong
GuangzhouPort Kalang
Laem Chabang
Tanjung Priok
Tanjung Pelepas
LeHavre
Hamburg
Antwerp
Valencia
Rotterdam
Barcelona
Algeciras
Felixstowe
Gioia Tauro
Bremen/Bremerhafen
Pacific Asia Europe
Traffic 2004 (TEU)
Less than 2 million
2 to 4 million
4 to 7 million
7 to 10 million
More than 10 million

12
Global Port Operators
A significant trend in container port operations has been the increase of the role of private
operators (Olivier and Slack, 2006; Slack and Fremont, 2005). In an era characterized by lower
levels of direct public involvement in the management of transport terminals, specialized port
operators have emerged. Concession agreements in which subdiary companies (commonly joint
ventures) are established have been the major tool for port operators to take control of terminals.
A concession agreement is a long-term lease of port facilities involving the requirement that the
concessionaire undertakes capital investments to build, expand, or maintain the cargo-handling
facilities, equipment, and infrastructure. This enables port authorities to secure additional revenue
and minimize risk by leasing some of their facilities. Elsewhere, a simple minority stake was
acquired by shipping lines, enough to secure handling capacity for their vessels.
A total of 24 major port holdings where in operation in 2005, handling about 267 million TEUs.
Four in particular have substantial global assets of about 30-40 dedicated port terminals each;
APM Terminals (controlled by the Danish maritime shipper Maersk), Dubai Ports World (DPW),
Hutchison Port Holdings (Hong Kong), and the Port of Singapore Authority (PSA). Jointly, they
controlled 143 dedicated maritime container terminals in 2007. Several other port holdings exist,
owned by specialized private companies (such as SSA for North America or Eurogate for Europe)
or by ocean carriers (Hanjin and Evergreen have notable assets), but their focus is mostly
regional. A concentration of ownership among four major port holdings is taking place, such as in
2006 when DPW acquired the terminal assets of P&O (Peninsular & Oriental Ports) further
consolidating its global holdings. However, DPW was constrained to renege the American assets
of this transaction (Baltimore, Miami, New Orleans, New York and Philadelphia) to the holding
AIG due to a political controversy; a Middle Eastern holding operating major American port
terminals was perceived negatively in the post 9-11 setting. Port holdings are thus the outcome of
horizontal integration through expansion and mergers with the process leading to a high level of
concentration of the global containerized throughput. For instance, HPH accounted for 26% of
world container port capacity with a container throughput of around 51.8 million TEUs in 2005.
PSA ranked second, at 19%, handling 41.2 million TEUs for the same year. The main rationale
behind the emergence of large port holdings includes:
• Financial assets. Port holdings have the financial means to invest in infrastructures as
they have a wide variety of assets and the capacity to borrow large quantities of capital.
They can use the profits generated by their efficient terminals to invest and subsidize the
development of new ones, thus expanding their asset base and their operating revenues.
Most are listed on equity markets, giving the opportunity to access global capital, which
realized in the last decade that the freight transport sector was a good source of returns
driven by the fundamentals of a growth in international shipments. This financial
advantage cannot be matched by port authorities even those heavily subsidized by public
funds.
• Managerial expertise. Port holdings excel in establishing procedures to handle complex
tasks such the loading and unloading sequence of containerships and all the intricacies of
port operations. Many have accumulated substantial experience in the management of
containerized operations in a wide array of settings. Being private entities, they tend to
have better customer service and have much flexibility to meet the needs of their clients.
This also includes the use of well developed information systems networks and the
capacity to quickly comply with legal procedures related to customs, clearance and
security.
• Gateway access. From a geographical standpoint, most port holdings follow a strategy
aimed at establishing privileged positions to access hinterlands. Doing so they secure a

13
market share and can guarantee a level of port and often inland transport service to their
customers. It can also be seen as a port competition strategy where a “stronghold” is
established, limiting the presence of other competitors. Gateway access thus provides a
more stable flow of containerized shipments. The acquisition of a new port terminal is
often accompanied by the development of related inland logistics activities by companies
related to the port holding.
• Leverage. A port holding is able to negotiate with maritime shippers and inland freight
transport companies favorable conditions, namely rates, access and level of service. Some
are subdiaries of global maritime shipping lines (such as the A.P. Moller group controlled
by the shipper Maesrk) while others are directly controlled by them (such as Hanjin or
Evergreen) so they can offer a complete logistical solution to international freight
transportation. The “footloose” character of maritime shipping lines has for long been
recognized (Slack, 1994), with a balance of power more in their favor than of the port
authorities they negotiate with.
• Traffic capture. Because of their privileged relationships with maritime shipping lines,
port holdings are able to capture and maintain traffic for their terminals. The decision to
invest is often related to the knowledge that the terminal will handle a relatively secure
number of port calls. Consequently, a level of traffic and revenue can be secured more
effectively.
• Global perspective. Port holdings have a comprehensive view of the state of the industry
and are able to interpret political and price signals to their advantage. They are thus in
position to influence the direction of the industry and anticipate developments and
opportunities. Under such circumstances they can allocate new investments (or divest) to
take advantages of new growth opportunities and new markets.
The main strategy of port holdings consists in the establishment of a network of port terminals
capturing the export-oriented traffic of Asia, offshore transshipments opportunities for long
distance trade and improving hinterland access for import markets, particularly at the major
continental gateways of Western Europe and North America (Figure 3). The issue of port
competition has been rendered more complex by this emerging ownership structure. In some
ports, the holding controls the entire facility and is thus the port’s sole client while other holdings
and shipping lines may face a more difficult access in terms of berthing and efficient
transshipment. The approach in port competition, notably from other port holdings, thus becomes
a strategy of establishing a handhold on a nearby facility that shares a similar hinterland. For
instance, A.P. Moller went to the port of Tanjung Pelepas near Singapore, because the later is
controlled by PSA. For other ports, particularly large ones, intense competition is the trend as
often more than two holdings are present, each owning their own terminals within the port
complex (e.g. Rotterdam, Antwerp, Laem Chabang, Hong Kong and New York). This strategy is
likely to make shipping lines less “footloose” since they now have vested long term interests at
specific port terminals and selling those interests is much more difficult than negotiating a short
term service contract with a port authority.

14
Fig
ure 3
Majo
r Port H
old
ings, 2
007
Pacific AsiaPacific AsiaPacific AsiaPacific Asia EuropeEuropeEuropeEurope
APM Terminals
Dubai Ports World
Hutchison Port Holdings
Port of Singapore Authority
Eurogate
Stevedoring Services of America
Dedicated Maritime Container Terminals

15
Offshore Terminals
In a conventional pendulum container service, a maritime range such as the American East Coast
could involve several port calls. Pendulum services involve a set of sequential port calls along a
maritime range, commonly including a transoceanic service from ports in another range and
structured as a continuous loop (Slack, 1998). They are almost exclusively used for container
transportation with the purpose of servicing a market by balancing the number of port calls and
the frequency of services. If the volume is not sufficient, this may impose additional costs for
maritime companies that are facing the dilemma between market coverage and operational
efficiency. By using an offshore hub terminal in conjunction with short sea shipping services, it is
possible to reduce the number of port calls and increase the throughput of the port calls left
(Baird, 2006). Offshore terminals can thus become effective competitive tools since the frequency
and possibly the timeliness of services can be improved. An outcome has been the growing share
of transshipments in regard to the totality of containerized traffic, from around 11% in 1980 to
about 28% in 2005 (Drewry Shipping Consultants, 2006). The world’s leading offshore hub is the
port of Singapore, where about 91% of its 19.1 million TEU volume was transshipped in 2004.
This is mainly attributable to its strategic location at the outlet of the Strait of Malacca, the
world’s most heavily used shipping route that transits about 30% of the world trade. Other major
offshore hubs are Freeport (Bahamas), Salalah (Oman), Tanjung Pelepas (Malaysia) or Gioia
Tauro (Italy), Algeciras (Spain), Marsaxlokk (Malta), Taranto (Italy) and Cagliari (Italy). These
hubs particularly owe their emergence to the following factors:
• Location. Offshore hubs have emerged on island locations or on locations without a
significant local hinterland to fulfill a role of intermediacy within global maritime networks
(Fleming and Hayuth, 1994). They are close to points of convergence of maritime shipping
routes where traffic bound to different routes can be transloaded. Offshore hubs tend to be
located nearby major bottlenecks in global maritime networks (Strait of Malacca,
Mediterranean or the Caribbean) as they take advantage of the convergence effect.
• Depth. Offshore terminals tend to have greater depth since they were built recently in view to
accommodate modern containership drafts, placing them at a technical advantage over many
older ports. Their selection often involves a long term consideration of growing containership
drafts and the future capacity, in terms of transshipment and warehousing, of the hub to
accommodate such growth.
• Land availability. The sites of offshore terminals tend to be less crowded and outside the
traditional coastal areas that have see a large accumulation of economic activities. They often
have land for future expansion, which is a positive factor to help securing existing and future
traffic.
• Labor costs. Labor costs tend to be lower, since offshore terminals are located at the
periphery and they tend to have less labor regulations (e.g. unions), particularly if it concerns
a new terminal facility.
• Hinterland access. Limited inland investments are required since most of the cargo is
transshipped from ship to ship with temporary storage on the port facilities. The footprint
offshore terminals have on the local or regional transport system is thus limited. In addition,
the port operator does not have to wait for local/regional transport agencies to provide better
accessibility to the terminal, which is often a source of conflict between the port and the
city/region.
• Ownership. Terminals are owned, in whole or in part, by port holdings or carriers which are
efficiently using these facilities and are free to decide future developments or
reconfigurations. Offshore terminals are avoiding a legacy of governance structure controlled
by port authorities. They thus tend to be responsive and adaptable to market changes.
16
In an initial phase offshore terminals solely focus on accommodating transshipment flows and
many have a transshipment share exceeding 80% of their container volume. As the transshipment
business remains highly volatile, offshore hubs can eventually develop services that add value to
the cargo instead of simply moving containers between vessels. This strategy could trigger the
creation of logistics zones within or in the vicinity of the port area, in many cases implemented as
Free Trade Zone.
4. Logistics and the Maritime / Land Interface
Maritime Logistics
Although maritime companies have always managed their fleet from an operational standpoint,
such as scheduling, ports serviced and cargo handling, containerization truly permitted the
convergence of maritime shipping and logistics. As such, maritime shipping lines are more
related to the requirements of their customers, in terms of price, timing, frequency and level of
service. Maritime logistics is thus the convergence of several integration processes including
intermodal, economic and organizational in order to add value along the maritime transport chain
(Panayides, 2006). Among the many strategies behind freight integration, the provision of “door
to door” services is privileged, which favors a higher application level of maritime logistics.
Thus, new forms of cooperation are emerging in the maritime industry, amongshipping lines, but
also with actors involved in other modes and other transport services. This cooperation can take
many forms, including mergers and acquisitions, joint ventures, contractual agreements and
minority stakes. In such a setting, shipping lines each adopt strategies that fit their goals and the
management of their assets. Maritime logistics confers a level of flexibility such as how maritime
companies allocate their containerships, manage their containers, have access to specific port
terminals and inland transport systems and perform a range of value-added activities (Notteboom
and Merckx, 2006). Maritime logistics is thus becoming closely integrated with inland logistics.
New Services and Networks
In an environment of substantial growth in international trade, a small group of very large
shipping lines has emerged, along with a concentration of the traffic. While the top 20 carriers
controlled 26% of the world slot capacity in 1980, this figure moved to 42% in 1992 and to 58%
in 2003. These carriers are also integrated horizontally, mainly through agreements such as liner
conferences, operating agreements (vessel sharing, slot chartering, consortia and strategic
alliances) and mergers and acquisitions. Mergers and alliances have been particularly prevalent in
the maritime industry. The main rationale in mergers and the formation of alliances is rather
simple; increase income and reduce costs. Each member is able to provide exiting assets that
would be complementary to those in the alliance. Of particular relevance is a geographical
complementarity where respective networks and markets are brought together. As private
ventures, they aim to establish and maintain profitable routes in a competitive environment. This
involves three major decisions about how such a maritime network takes shape (Notteboom,
2004, 2006):
• Frequency of service. Frequency is linked with more timely services since the same port
will be called at more often. A weekly call is considered to be the minimum level of
service but since a growing share of production is time dependent, there is a pressure
from customers to have a higher frequency of service. For a similar total traffic, a trade-
off between the frequency and the capacity of service is commonly observed. This trade-
off is often mitigated on routes that service significant markets since larger ships can be
used with the benefits of economies of scale.
17
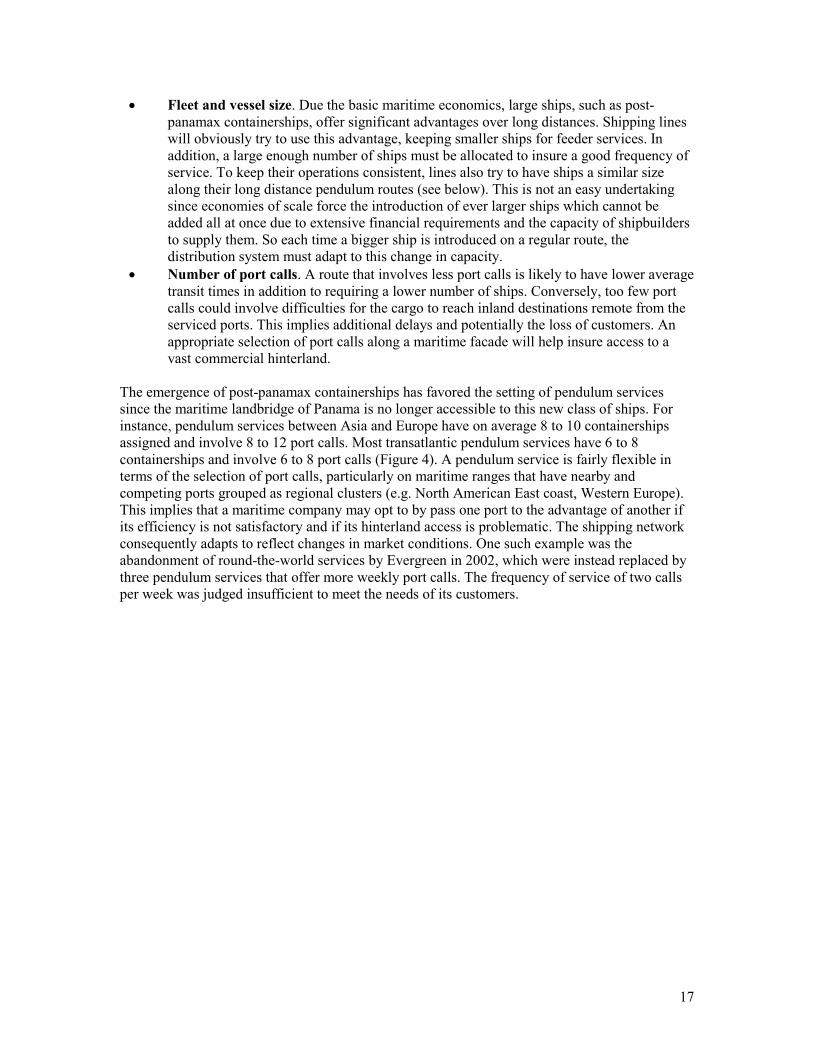
• Fleet and vessel size. Due the basic maritime economics, large ships, such as post-
panamax containerships, offer significant advantages over long distances. Shipping lines
will obviously try to use this advantage, keeping smaller ships for feeder services. In
addition, a large enough number of ships must be allocated to insure a good frequency of
service. To keep their operations consistent, lines also try to have ships a similar size
along their long distance pendulum routes (see below). This is not an easy undertaking
since economies of scale force the introduction of ever larger ships which cannot be
added all at once due to extensive financial requirements and the capacity of shipbuilders
to supply them. So each time a bigger ship is introduced on a regular route, the
distribution system must adapt to this change in capacity.
• Number of port calls. A route that involves less port calls is likely to have lower average
transit times in addition to requiring a lower number of ships. Conversely, too few port
calls could involve difficulties for the cargo to reach inland destinations remote from the
serviced ports. This implies additional delays and potentially the loss of customers. An
appropriate selection of port calls along a maritime facade will help insure access to a
vast commercial hinterland.
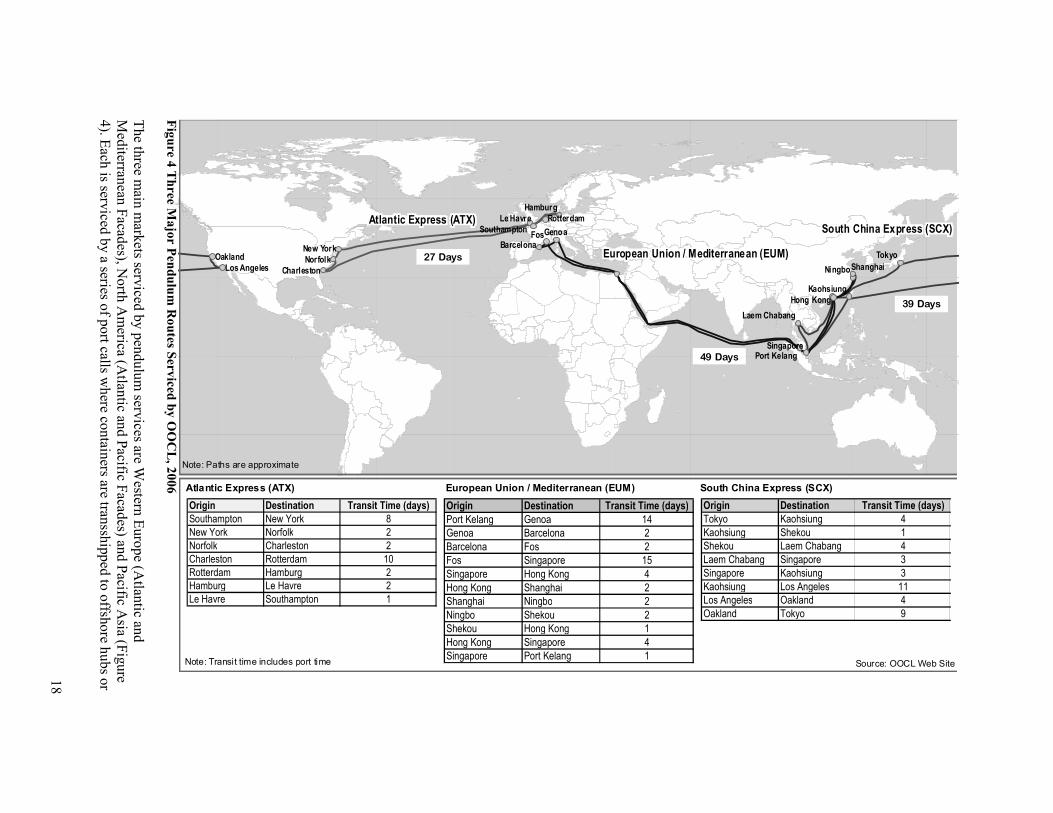
The emergence of post-panamax containerships has favored the setting of pendulum services
since the maritime landbridge of Panama is no longer accessible to this new class of ships. For
instance, pendulum services between Asia and Europe have on average 8 to 10 containerships
assigned and involve 8 to 12 port calls. Most transatlantic pendulum services have 6 to 8
containerships and involve 6 to 8 port calls (Figure 4). A pendulum service is fairly flexible in
terms of the selection of port calls, particularly on maritime ranges that have nearby and
competing ports grouped as regional clusters (e.g. North American East coast, Western Europe).
This implies that a maritime company may opt to by pass one port to the advantage of another if
its efficiency is not satisfactory and if its hinterland access is problematic. The shipping network
consequently adapts to reflect changes in market conditions. One such example was the
abandonment of round-the-world services by Evergreen in 2002, which were instead replaced by
three pendulum services that offer more weekly port calls. The frequency of service of two calls
per week was judged insufficient to meet the needs of its customers.
18
Fig
ure 4
Three M
ajo
r Pen
dulu
m R
outes S
erviced
by O
OC
L, 2
006
The th
ree main markets serv
iced by pendulum serv
ices are Western
Europe (A
tlantic an
d
Mediterran
ean Facad
es), North America (A
tlantic an
d Pacific F
acades) an
d Pacific A
sia (Figure
4). E
ach is serv
iced by a series o
f port calls w
here co
ntain
ers are transshipped to offsh
ore h
ubs or
Fos
Tokyo
Genoa
Ningbo
Hamburg
Shanghai
Le Havre
Kaohsiung
Hong Kong
Singapore
Barcelona
Rotterdam
Port Kelang
Southampton
Laem Chabang
Oakland
Los AngelesNorfolk
New York
Charleston
Origin Destination Transit Time (days)
Southampton New York 8
New York Norfolk 2
Norfolk Charleston 2
Charleston Rotterdam 10
Rotterdam Hamburg 2
Hamburg Le Havre 2
Le Havre Southampton 1
Origin Destination Transit Time (days)
Tokyo Kaohsiung 4
Kaohsiung Shekou 1
Shekou Laem Chabang 4
Laem Chabang Singapore 3
Singapore Kaohsiung 3
Kaohsiung Los Angeles 11
Los Angeles Oakland 4
Oakland Tokyo 9
Origin Destination Transit Time (days)
Port Kelang Genoa 14
Genoa Barcelona 2
Barcelona Fos 2
Fos Singapore 15
Singapore Hong Kong 4
Hong Kong Shanghai 2
Shanghai Ningbo 2
Ningbo Shekou 2
Shekou Hong Kong 1
Hong Kong Singapore 4
Singapore Port Kelang 1
Atlantic Express (ATX) European Union / Mediterranean (EUM) South China Express (SCX)
Note: Transit time includes port time Source: OOCL Web Site
27 Days
49 Days
39 Days
Note: Paths are approximate
Atlantic Express (ATX)
European Union / Mediterranean (EUM)
South China Express (SCX)

19
to hinterlands, depending on the function of the port. The itinerary of a pendulum service is thus
carefully selected to insure distribution strategies that reflect the global and regional framework
of trade. For instance, in a pendulum service, most of the traffic is bound to the other end of the
pendulum. This is particularly the case for the United States where cabotage regulations (Jones
Act) would forbid a foreign owned shipping lines to carry traffic between American ports. In
addition, large high capacity ships can be used for pendulum services (such as across the Pacific)
since they are not required to transit through the Panama Canal and that the Suez Canal can
accommodate the current generation of very large containerships (up to 16 meters / 12,000 TEU).
Because of the capacity limits of the Panama Canal, many shipping companies have changed the
configuration of their routes. This became increasingly apparent as a growing share of the global
containership fleet was at a size beyond its capacity. The increasing usage of those ships along
the Pacific Asia / Suez canal / Mediterranean route as well as the development of the North
American rail landbrige have created a substantial competition to the canal as an intermediate
location in global maritime shipping. In addition, estimates indicate that the Panama Canal may
reach capacity by 2009-12. There are thus plans to increase its capacity and accommodate larger
containerships, a decision which was finally reached in 2006 by the Panamanian government. The
expansion project involves building a new set of locks on both the Atlantic and Pacific sides of
the canal to support a depth of 60 feet, a width of 190 feet and a length of 1,400 feet, which
would accommodate ships up to 14,000 TEU. The dredging of access channels as well as the
widening of several sections of the existing canal will also be required. This would allow
Aframax and Suezmax vessels to pass through the canal, thus permitting new opportunities for
container services such as the re-emergence of round-the-world services.
Containerized Flows and their Global Imbalances
The production and distribution environment in which maritime transportation evolves is also
characterized by distortions in international trade patterns caused by globalization and the
relocation / development of new manufacturing activities in emerging industrial regions. The
Pacific Asian maritime range has been the major recipient of this industrial accumulation, mainly
due to the ability to gain from comparative advantages. Container flows are quite representative
of global trade imbalances, which have become more acute in recent years (Figure 5).
1.8 (-18%)
4.3 (+30%)USA
6.1
Asia13.9 (+148%)
23.8
8.9
3.3 (+14%)
9.9 (+120%)
5.6 (+55%)
17.2
11.7
9.9
Europe
Million TEUs
Growth (2000-2005)
Imports (Million TEUs)
Exports (Million TEUs)
Figure 5 Containerized Cargo Flows along Major Trade Routes, 2005 (in million TEU)

20
While American containerized imports from Asia increased by 148% between 2000 and 2005,
opposite flows have grown to a much lesser extent (30%); there are 3 times as many containers
moving from Asia to the United States than there are in the opposite direction. An imbalance
between Asia and Europe is also observed, but to a lesser degree. Thus, production and trade
imbalances in the global economy are clearly reflected in imbalances in physical flows and
transport rates. On the Pacific, it costs about twice as much per TEU for westbound flows than for
eastbound flows, making freight planning a complex task for container shipping companies. In
addition, there has been a notable growth in the movement of empty containers.
Empty containers (“empties”) account for about 21% of the volume of global port handling (Boile
et al., 2006). They pose a logistical challenge to both the maritime and inland segment of freight
distribution, an issue being underlined by the fact that at any given time about 2.5 million TEU of
containers are being stored empty, waiting to be used. The maritime industry has been hard
pressed to address these imbalances but little can be done since they reflect macro-economic
issues outside their control. Among the strategies been considered is the immediate repositioning
of containers that have just been emptied to nearby export-based activities. The use of foldable
containers is also a possibility since it reduces the repositioning costs (Konings and Remmelt,
2001). However, no immediate solution is possible since the core of the issue remains macro
economic imbalances.
The Convergence of Inland and Maritime Logistics
There is a clear trend involving the growing level of integration between maritime transport and
inland freight transport systems (Heaver, 2005; Robinson, 2002; Panayides, 2006). Until recently,
these systems evolved separately but the development of intermodal transportation and
deregulation provided new opportunities which in turn significantly impacted both maritime and
inland logistics. One particular aspect concerns high inland transport costs, since they account
anywhere between 40% and 80% of the total costs of container shipping, depending on the
transport chain. Under such circumstances, there is a greater involvement of maritime actors (e.g.
port holdings) in inland transport systems. The maritime / land interface thus appears to be
increasingly blurred (Notteboom and Rodrigue, 2005). Corridors are becoming the main structure
behind inland accessibility and through which port terminals gain access to inland distribution
systems. Since transshipment is a fundamental component of intermodal transportation, the
maritime / land interface relies in the improvement of terminals activities along those corridors.
Strategies are increasingly relying on the control of distribution channels to ensure an unimpeded
circulation of containerized freight, which include both maritime and land transport systems. The
continuity of the maritime space to insure a better level of service takes different forms depending
on the region. For North America, rail transportation has seen the emergence of long distance
corridors, better known as landbrigdes. The North American landbridge is mainly composed of
three longitudinal corridors and is the outcome of growing transpacific trade and the requirement
to ship containerized freight across the continent. For Western Europe, barge systems are
complementing trucking with inland waterways accounting for between 30 and 40% of the
containers going through major gateways such as Rotterdam and Antwerp. Localized alternatives
to improve inland distribution, such as the Alameda corridor8, are implemented in addition to
trans-continental strategies such as the existing North American landbridge and the planned
8 The Alameda Corridor is a 20-mile rail freight expressway linking the port cluster of Long Beach and Los
Angeles to the transcontinental rail terminals near downtown Los Angeles. It was built to provide better rail
access to the port cluster, which is the most important in North America in terms of the volume and value
of its containerized traffic. The Alameda Corridor consists in a series of bridges, underpasses, overpasses,
and street improvements that separate rail freight circulation from local road circulation.

21
Northern East-West Freight Corridor spanning across the trans-Siberian to the port of Narvik in
Norway with an oceanic leg across the Atlantic.
5. Conclusion: Ports as Elements of Global Logistical Chains
The development of bulk and containerized maritime transportation has been strongly influenced
by technology (Pinder and Slack, 2004). Economies of scale have been achieved through the
construction of larger ships and this in turn has affected the optimum shipment size, vessel
routings and port selection. While this process is mostly over for bulk transport, it continues
unabated for containerized shipping with the introduction of larger ships. Port selection is
especially relevant because of the strong link between ports and industrial activity, but
particularly between the port and its hinterland. However, technology and vessel design are by no
means the only factors at work to influence the patterns of the world maritime shipping;
government policy, commercial buying practices and physical constraints such as water depth in
ports also play a key role.
Until recently the individual elements of the transport chain, while functionally related, were
operated in a largely disparate way. In the bulk trades, as in maritime transport in general, there is
now a realization that the integration of supply chains requires a high level of organizational
interdependence. Maritime transportation and inland transportation must increasingly be seen as
functionally integrated. In bulk as in containerized trades the reduction of inventory and storage
costs by just-in-time (JIT) shipments and door-to-door services are increasing in significance.
Freight transportation becomes focused on providing the most extensive services possible within
expected cost and reliability parameters. In such a context of flexible maritime networks, such as
pendulum services and economies of scale, ports are hard pressed to act as efficient nodes in
global logistical chains. Their responses have involved establishing better hinterland connections
and in many cases private terminal operators have stepped in to directly manage the facilities. The
global port and maritime landscape is thus adapting to new environment reflecting economic,
technological and political changes.
6. References
Baird, A.J. (2006) “Optimizing the Container Transhipment Hub Location in Northern Europe”, Journal of
Transport Geography, Vol. 14, No. 3, pp. 195-214.
Bird J.H. (1971) Seaports and Seaport Terminals, London: Hutchison.
Boile, M., S. Theofanis , M. Golias and N. Mittal (2006) "Empty Marine Container Management:
Addressing Locally a Global Problem" Proceedings of the 85th Annual Meeting of the Transportation
Research Board, January 23-26, Washington, DC.
Cullinane, KPB and Khanna, M. (2000) “Economies of scale in large containerships: Optimal size and
geographical implications”, Journal of Transport Geography, Vol 8, pp. 181–195.
Dicken, P. (2003) Global Shift. 4th Ed. London: Sage.
Drewry Shipping Consultants (2006) Annual Review of Global Terminal Operators.
Fleming, D.K. and Y. Hayuth (1994) “Spatial characteristics of transportation hubs: centrality and
intermediacy”, Journal of Transport Geography, Vol. 2, No. 1, pp. 3-18.
Gardiner, R. (ed.) (1992) The Shipping Revolution, London: Conway.
Gereffi, G. (1999) “International trade and industrial upgrading in the apparel commodity chain”, Journal
of International Economics, Vol. 48, pp. 37-70.
Konings, R. and T. Remmelt (2001) “Foldable Containers: a New Perspective on Reducing Container-
Repositioning Costs”, European Journal of Transport and Infrastructure Research, Vol. 1, No. 4
(2001), pp. 333-352

22
Kumar, S. and J. Hoffmann (2002) “Globalization: The Maritime Nexus”, in C. Grammenos (ed) The
Handbook of Maritime Economics and Business, London: Lloyd’s, pp. 35-62.
Heaver, T. (2002) “The evolving roles of shipping lines in international logistics”, International Journal of
Maritime Economics, Vol. 4, pp. 210-230.
Hesse, M. and J-P Rodrigue (2004) “The Transport Geography of Logistics and Freight Distribution”,
Journal of Transport Geography, Vol. 12, No. 3, pp. 171-184.
Hesse, M. and J-P Rodrigue (2006) “Transportation and Global Production Networks”, Growth and
Change, Vol 37, No. 4, pp. 599-609.
McLellan, R.G. (1997) “Bigger vessels: how big is too big?”, Maritime Policy and Management, Vol. 24,
No. 2, pp. 193-211.
National Geospatial-intelligence Agency (2005) World Port Index, Eighteenth Edition.
Notteboom, T. (2004) "Container Shipping and Ports: An Overview", Review of Network Economics, Vol.
3, No.2, pp. 86-106.
Notteboom, T. (2006) "The Time Factor in Liner Shipping Services", Maritime Economics & Logistics,
Vol. 8, pp. 19-39.
Notteboom and F. Merckx (2006) “Freight Integration in Liner Shipping: A Strategy Serving Global
Production Networks”, Growth and Change, Vol. 37, No. 4, pp. 550-569.
Notteboom, T. and J-P Rodrigue (2005) “Port Regionalization: Towards a New Phase in Port
Development”, Maritime Policy and Management, Vol. 32, No. 3, pp. 297-313.
Olivier, D. and B. Slack (2006) “Rethinking the Port”, Environment and Planning A, Vol. 38, pp. 1409 -
1427.
Panayides, P.H. (2006) “Maritime Logistics and Global Supply Chains: Towards a Research Agenda”,
Maritime Economics & Logistics, Vol. 8, pp. 3-18.
Pinder, D. and B. Slack (eds) (2004) Shipping and Ports in the Twenty-first Century: Globalisation,
Technological Change and the Environment, London: Routledge.
Robinson, R. (2002) “Ports as elements in value-driven chain systems: the new paradigm”, Maritime Policy
and Management, Vol. 29, pp. 241-255.
Rodrigue, J-P (2004) “Straits, Passages and Chokepoints: A Maritime Geostrategy of Petroleum
Distribution”, Les Cahiers de Geographie du Quebec, Vol. 48, No. 135, pp. 357-374.
Slack, B. and A. Fremont (2005) “Transformation of Port Terminal Operations: From the Local to the
Global”, Transport Reviews, Vol. 25, No. 1, pp. 117-130.
Slack, B. (1998) "Intermodal Transportation" in B.S. Hoyle and R. Knowles (eds) Modern Transport
Geography, Wiley: Chichester. Second Edition, pp. 263-290.
Slack, B. (1994) “Pawns in the Game: Ports in a Global Transport System”, Growth and Change, Vol. 24,
pp. 597-98.
Stopford, M. (1997) Maritime Economics, Second Edition, London: Routledge.
Takel, R.E. (1981), “The spatial demands of ports and related industry and their relationship with the
community”, in B.S. Hoyle and D.A. Pinder (eds), Cityport industrialisation and regional
development: spatial analysis and planning strategies (Oxford: Pergamon), pp. 47-68.
World Coal Institute (2005) Coal facts 2005 (October) London. UK
UNCTAD (2006) Review of Maritime Transport, Geneva: Switzerland.
Related Documents