An experimental and computational study of laminated paperboard creasing and folding L.A.A. Beex, R.H.J. Peerlings * Department of Mechanical Engineering, Eindhoven University of Technology, P.O. Box 513, 5600 MB Eindhoven, The Netherlands article info Article history: Received 9 January 2009 Received in revised form 9 July 2009 Available online 25 August 2009 Keywords: Paperboard Creasing Folding Experimental mechanics Numerical simulation Finite element method Delamination Plasticity abstract Laminated paperboard is often used as a packaging material for products such as toys, tea and frozenfoods. To make the paperboard packages appealing for consumers, the fold lines must be both neat and undam- aged. The quality of the folds depends on two converting processes: the manufacture of fold lines (creas- ing) and the subsequent folding. A good crease contains some delamination, initiated during creasing, to reduce the bending stiffness and to prevent the board from breaking during folding. However, for boards of high grammage breaking of the top layer is nevertheless a frequent problem. The mechanisms that operate in the creasing zone during creasing and folding, and that may thus result in breaking of the top layer, are studied in this contribution on the basis of idealized small-scale creasing and folding experiments. How- ever, since experimental observations are only limited means to study the paperboard’s behavior, a mechanical model is proposed to obtain more detailed insight. Although the material and delamination descriptions used in the mechanical model are both relatively straightforward, comparisons between the model and the experimental data show that the model predicts the paperboard’s response well. The mechanical model shows – in combination with experimental strain fields – that multiple delaminations are initiated in the shear regions. Moreover, only the mechanical model reveals the mechanism that is responsible for the failure of the top layer if a crease is too shallow. Finally, the model also demonstrates that not only delamination but also plastic behavior must occur during creasing if breaking of the top layer is to be avoided. Ó 2009 Elsevier Ltd. All rights reserved. 1. Introduction Laminated paperboard is a widely used packaging material. Its use is increasing every year, mostly because it is almost 100% recy- clable and inexpensive. Paperboard can be converted into packages by relatively straightforward operations such as cutting, folding and glueing. However, a difficulty in paperboard converting is the cracking of boards of high grammage during folding. Cracked folds render packages less appealing to consumers and also com- promise their strength. The quality of folds and the likelihood of cracking depend on the previous definition of fold lines by creasing (or scoring). Both pro- cesses must therefore be taken into account in studying folding with a view to preventing cracking. In practice, both are optimized using empirical knowledge, but systematic studies of the mechan- ics underlying both processes – particularly cracking – are scarce. Nagasawa et al. (2003) investigated the influence of different creasing settings on the subsequent folding response in an experi- mental parameter study. They have shown that the maximum bending moment during folding depends on the nominal shearing strain that occurs during creasing. Computational models for creas- ing and folding were proposed by Xia et al. (2002) and Choi et al. (2007). The model proposed by Xia et al. (2002) uses a complex and detailed material and delamination model. The material description is orthotropic; the principal directions are given by the machine direction (MD), cross-fiber-direction (CD) and thick- ness direction (ZD). The delamination description differentiates be- tween normal and tangential opening behavior, and allows the latter to be dependent of the normal compression. The mechanical model of Choi et al. (2007) uses a material description that combines the Ramberg–Osgood model (Ramberg and Osgood, 1943) and the model of Karafillis and Boyce (1993) as proposed earlier by Mäkelä and Östlund (2003). Choi et al. (2007) extended this description with a non-linear elastic response in ZD. It is unclear how delamination is incorporated in their mod- el. The model is qualitatively validated using experimental creas- ing strain fields. In other studies, that are not directly related to laminated paperboard creasing, material models for paper have been pro- posed by Stenberg (2003) for the out-of-plane behavior and by Sawyer et al. (1998) and Castro and Ostoja-Starzewski (2003) for the in-plane behavior. Damage-based material descriptions for pa- per were developed in the studies of Isaksson et al. (2004) and 0020-7683/$ - see front matter Ó 2009 Elsevier Ltd. All rights reserved. doi:10.1016/j.ijsolstr.2009.08.012 * Corresponding author. Tel.: +31 40 247 2788; fax: +31 40 244 7355. E-mail address: [email protected] (R.H.J. Peerlings). International Journal of Solids and Structures 46 (2009) 4192–4207 Contents lists available at ScienceDirect International Journal of Solids and Structures journal homepage: www.elsevier.com/locate/ijsolstr

Welcome message from author
This document is posted to help you gain knowledge. Please leave a comment to let me know what you think about it! Share it to your friends and learn new things together.
Transcript
International Journal of Solids and Structures 46 (2009) 4192–4207
Contents lists available at ScienceDirect
International Journal of Solids and Structures
journal homepage: www.elsevier .com/locate / i jsolst r
An experimental and computational study of laminated paperboard creasingand folding
L.A.A. Beex, R.H.J. Peerlings *
Department of Mechanical Engineering, Eindhoven University of Technology, P.O. Box 513, 5600 MB Eindhoven, The Netherlands
a r t i c l e i n f o a b s t r a c t
Article history:Received 9 January 2009Received in revised form 9 July 2009Available online 25 August 2009
Keywords:PaperboardCreasingFoldingExperimental mechanicsNumerical simulationFinite element methodDelaminationPlasticity
0020-7683/$ - see front matter � 2009 Elsevier Ltd. Adoi:10.1016/j.ijsolstr.2009.08.012
* Corresponding author. Tel.: +31 40 247 2788; faxE-mail address: [email protected] (R.H.J. Peerli
Laminated paperboard is often used as a packaging material for products such as toys, tea and frozenfoods.To make the paperboard packages appealing for consumers, the fold lines must be both neat and undam-aged. The quality of the folds depends on two converting processes: the manufacture of fold lines (creas-ing) and the subsequent folding. A good crease contains some delamination, initiated during creasing, toreduce the bending stiffness and to prevent the board from breaking during folding. However, for boards ofhigh grammage breaking of the top layer is nevertheless a frequent problem. The mechanisms that operatein the creasing zone during creasing and folding, and that may thus result in breaking of the top layer, arestudied in this contribution on the basis of idealized small-scale creasing and folding experiments. How-ever, since experimental observations are only limited means to study the paperboard’s behavior, amechanical model is proposed to obtain more detailed insight. Although the material and delaminationdescriptions used in the mechanical model are both relatively straightforward, comparisons betweenthe model and the experimental data show that the model predicts the paperboard’s response well. Themechanical model shows – in combination with experimental strain fields – that multiple delaminationsare initiated in the shear regions. Moreover, only the mechanical model reveals the mechanism that isresponsible for the failure of the top layer if a crease is too shallow. Finally, the model also demonstratesthat not only delamination but also plastic behavior must occur during creasing if breaking of the top layeris to be avoided.
� 2009 Elsevier Ltd. All rights reserved.
1. Introduction
Laminated paperboard is a widely used packaging material. Itsuse is increasing every year, mostly because it is almost 100% recy-clable and inexpensive. Paperboard can be converted into packagesby relatively straightforward operations such as cutting, foldingand glueing. However, a difficulty in paperboard converting isthe cracking of boards of high grammage during folding. Crackedfolds render packages less appealing to consumers and also com-promise their strength.
The quality of folds and the likelihood of cracking depend on theprevious definition of fold lines by creasing (or scoring). Both pro-cesses must therefore be taken into account in studying foldingwith a view to preventing cracking. In practice, both are optimizedusing empirical knowledge, but systematic studies of the mechan-ics underlying both processes – particularly cracking – are scarce.
Nagasawa et al. (2003) investigated the influence of differentcreasing settings on the subsequent folding response in an experi-mental parameter study. They have shown that the maximumbending moment during folding depends on the nominal shearing
ll rights reserved.
: +31 40 244 7355.ngs).
strain that occurs during creasing. Computational models for creas-ing and folding were proposed by Xia et al. (2002) and Choi et al.(2007). The model proposed by Xia et al. (2002) uses a complexand detailed material and delamination model. The materialdescription is orthotropic; the principal directions are given bythe machine direction (MD), cross-fiber-direction (CD) and thick-ness direction (ZD). The delamination description differentiates be-tween normal and tangential opening behavior, and allows thelatter to be dependent of the normal compression.
The mechanical model of Choi et al. (2007) uses a materialdescription that combines the Ramberg–Osgood model (Rambergand Osgood, 1943) and the model of Karafillis and Boyce (1993)as proposed earlier by Mäkelä and Östlund (2003). Choi et al.(2007) extended this description with a non-linear elastic responsein ZD. It is unclear how delamination is incorporated in their mod-el. The model is qualitatively validated using experimental creas-ing strain fields.
In other studies, that are not directly related to laminatedpaperboard creasing, material models for paper have been pro-posed by Stenberg (2003) for the out-of-plane behavior and bySawyer et al. (1998) and Castro and Ostoja-Starzewski (2003) forthe in-plane behavior. Damage-based material descriptions for pa-per were developed in the studies of Isaksson et al. (2004) and
L.A.A. Beex, R.H.J. Peerlings / International Journal of Solids and Structures 46 (2009) 4192–4207 4193
Isaksson and Hägglund (2005). Moreover, Isaksson and Hägglund(2005) use the crack tip energy release rate as a failure criterionfor delamination. Beldie (2001), Barbier et al. (2004) and Thakkaret al. (2008) used conventional Hill-plasticity to simulate the re-sponses of both paperboard and corrugated board.
A study that reveals and explains the quintessential aspects oflaminated paperboard’s behavior in the creasing zone duringcreasing and folding and captures them in a model of limited com-plexity, seems to be missing. Our study tries to fill this gap by pro-posing a finite element (FE) model of three-layered paperboardthat describes paperboard’s behavior during creasing and folding.The FE model is based on experimental observations obtainedusing a lab-scale creasing and folding tool. It includes a continuummodel to describe the material behavior of paper while a delamina-tion model describes the opening behavior between different pa-per plies. The material and delamination model are both fairlystraightforward so as to keep the model simple, which in turn min-imizes the experimental parameter identification. All material anddelamination parameters were separately determined for everypaper layer in independent experiments. This ensures that thenumerical simulations using the model are accurate predictions.Consequently, the model cannot only be used to explain the mech-anisms within paperboard as observed in the creasing and foldingexperiments, but it can also be used to predict the paperboard’s re-sponse for different creasing settings. The model was quantita-tively validated by the use of: (1) experimental strain fields andforce–crease depth curves during creasing and (2) moment–anglecurves during folding. The behavior of paperboard during thecreasing and folding processes is discussed in detail, and finallythe mechanism responsible for breaking of the top layer is revealedfor shallow creasing.
The structure of this paper is as follows. Section 2 discusses thesetup used in the small-scale creasing and folding experiments onwhich the model is based, as well as preliminary observationsmade during the experiments. The mechanical model includingthe material model and delamination model are described in Sec-tion 3. Experimental and numerical results of creasing and foldingare presented and compared in Section 4. Finally, conclusions ofour study are presented in Section 5.
2. Creasing and folding experiments
2.1. Experimental setup
The purpose of the creasing and folding experiments is to dis-cover general mechanisms and to provide a reference for compar-ison with predictions of the mechanical model. A miniaturizedexperimental tool has been developed which allows us to definea single fold line by creasing and subsequently folding the boardsample along the crease. Because most problems with breakingof top layers occur if the creasing rule is placed parallel to theCD, this situation is taken in the experiments.
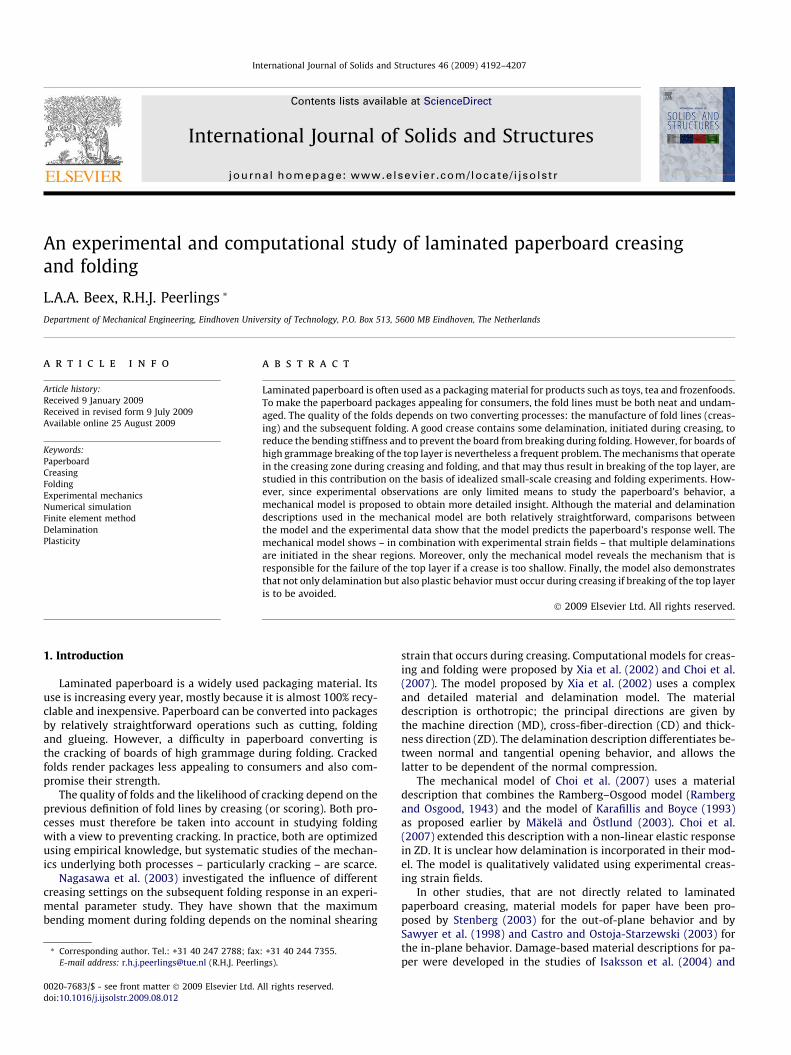
Fig. 1 is a schematic representation of the experimental tool.The samples are cut out of paperboard sheets which were kindlyprovided by Mayr-Melnhof Eerbeek. They have a thickness of900 lm and consist of a bottom layer of 50 lm thickness, a midlay-er of 800 lm and a top layer of 50 lm. The midlayer containsfresh-fiber mechanical pulp while the outer layers contain chemi-cal pulp comprising a mixture of recycled and virgin fibers. The toplayer is bleached to give a shiny appearance. The width of the sam-ples in the direction of the creasing channel as shown in Fig. 1 is20 mm, while the length of the samples perpendicular to the direc-tion of the creasing channel is 28 mm. The width is sufficientlylarge to create plane strain conditions. Two holders are used to pre-vent the sample from moving upwards but not to clamp it horizon-
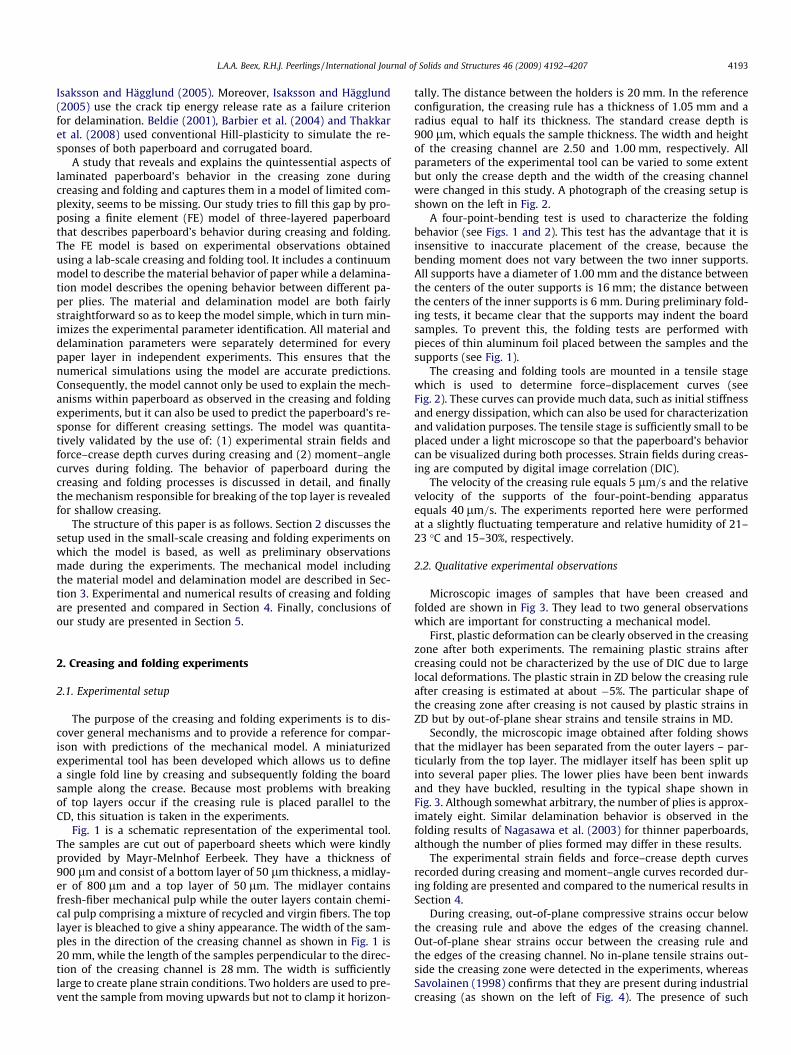
tally. The distance between the holders is 20 mm. In the referenceconfiguration, the creasing rule has a thickness of 1.05 mm and aradius equal to half its thickness. The standard crease depth is900 lm, which equals the sample thickness. The width and heightof the creasing channel are 2.50 and 1.00 mm, respectively. Allparameters of the experimental tool can be varied to some extentbut only the crease depth and the width of the creasing channelwere changed in this study. A photograph of the creasing setup isshown on the left in Fig. 2.
A four-point-bending test is used to characterize the foldingbehavior (see Figs. 1 and 2). This test has the advantage that it isinsensitive to inaccurate placement of the crease, because thebending moment does not vary between the two inner supports.All supports have a diameter of 1.00 mm and the distance betweenthe centers of the outer supports is 16 mm; the distance betweenthe centers of the inner supports is 6 mm. During preliminary fold-ing tests, it became clear that the supports may indent the boardsamples. To prevent this, the folding tests are performed withpieces of thin aluminum foil placed between the samples and thesupports (see Fig. 1).
The creasing and folding tools are mounted in a tensile stagewhich is used to determine force–displacement curves (seeFig. 2). These curves can provide much data, such as initial stiffnessand energy dissipation, which can also be used for characterizationand validation purposes. The tensile stage is sufficiently small to beplaced under a light microscope so that the paperboard’s behaviorcan be visualized during both processes. Strain fields during creas-ing are computed by digital image correlation (DIC).
The velocity of the creasing rule equals 5 lm=s and the relativevelocity of the supports of the four-point-bending apparatusequals 40 lm=s. The experiments reported here were performedat a slightly fluctuating temperature and relative humidity of 21–23 �C and 15–30%, respectively.
2.2. Qualitative experimental observations
Microscopic images of samples that have been creased andfolded are shown in Fig 3. They lead to two general observationswhich are important for constructing a mechanical model.
First, plastic deformation can be clearly observed in the creasingzone after both experiments. The remaining plastic strains aftercreasing could not be characterized by the use of DIC due to largelocal deformations. The plastic strain in ZD below the creasing ruleafter creasing is estimated at about �5%. The particular shape ofthe creasing zone after creasing is not caused by plastic strains inZD but by out-of-plane shear strains and tensile strains in MD.
Secondly, the microscopic image obtained after folding showsthat the midlayer has been separated from the outer layers – par-ticularly from the top layer. The midlayer itself has been split upinto several paper plies. The lower plies have been bent inwardsand they have buckled, resulting in the typical shape shown inFig. 3. Although somewhat arbitrary, the number of plies is approx-imately eight. Similar delamination behavior is observed in thefolding results of Nagasawa et al. (2003) for thinner paperboards,although the number of plies formed may differ in these results.
The experimental strain fields and force–crease depth curvesrecorded during creasing and moment–angle curves recorded dur-ing folding are presented and compared to the numerical results inSection 4.
During creasing, out-of-plane compressive strains occur belowthe creasing rule and above the edges of the creasing channel.Out-of-plane shear strains occur between the creasing rule andthe edges of the creasing channel. No in-plane tensile strains out-side the creasing zone were detected in the experiments, whereasSavolainen (1998) confirms that they are present during industrialcreasing (as shown on the left of Fig. 4). The presence of such
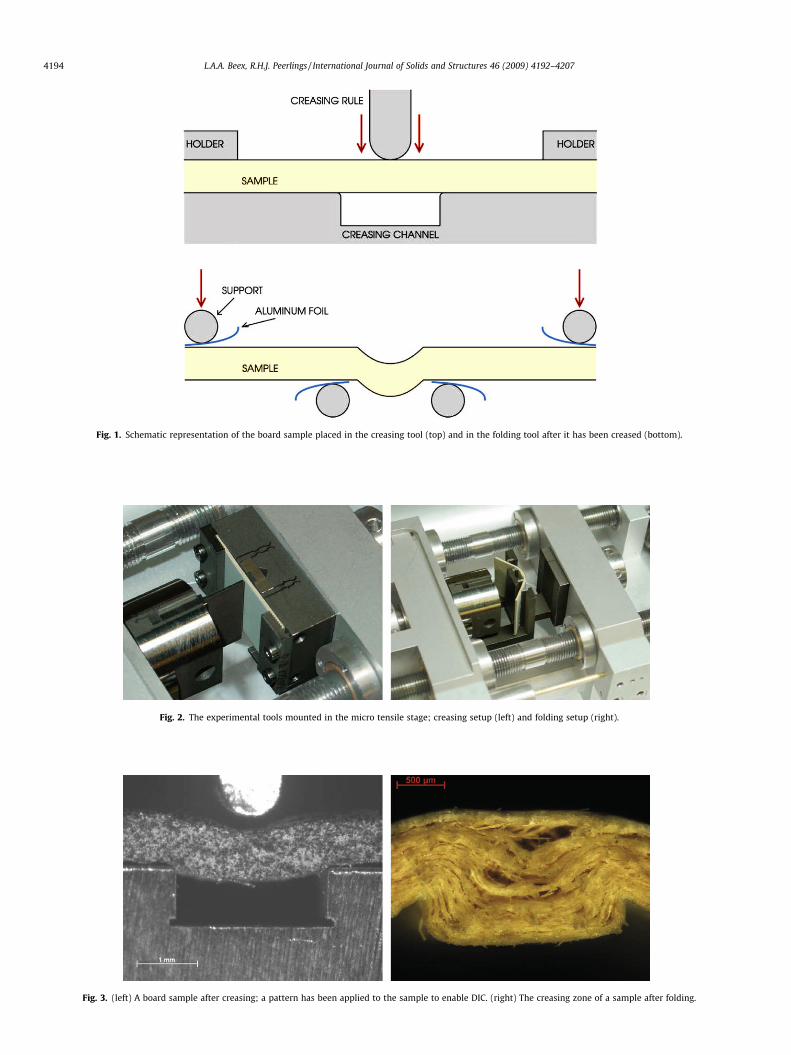
Fig. 1. Schematic representation of the board sample placed in the creasing tool (top) and in the folding tool after it has been creased (bottom).
Fig. 2. The experimental tools mounted in the micro tensile stage; creasing setup (left) and folding setup (right).
Fig. 3. (left) A board sample after creasing; a pattern has been applied to the sample to enable DIC. (right) The creasing zone of a sample after folding.
4194 L.A.A. Beex, R.H.J. Peerlings / International Journal of Solids and Structures 46 (2009) 4192–4207
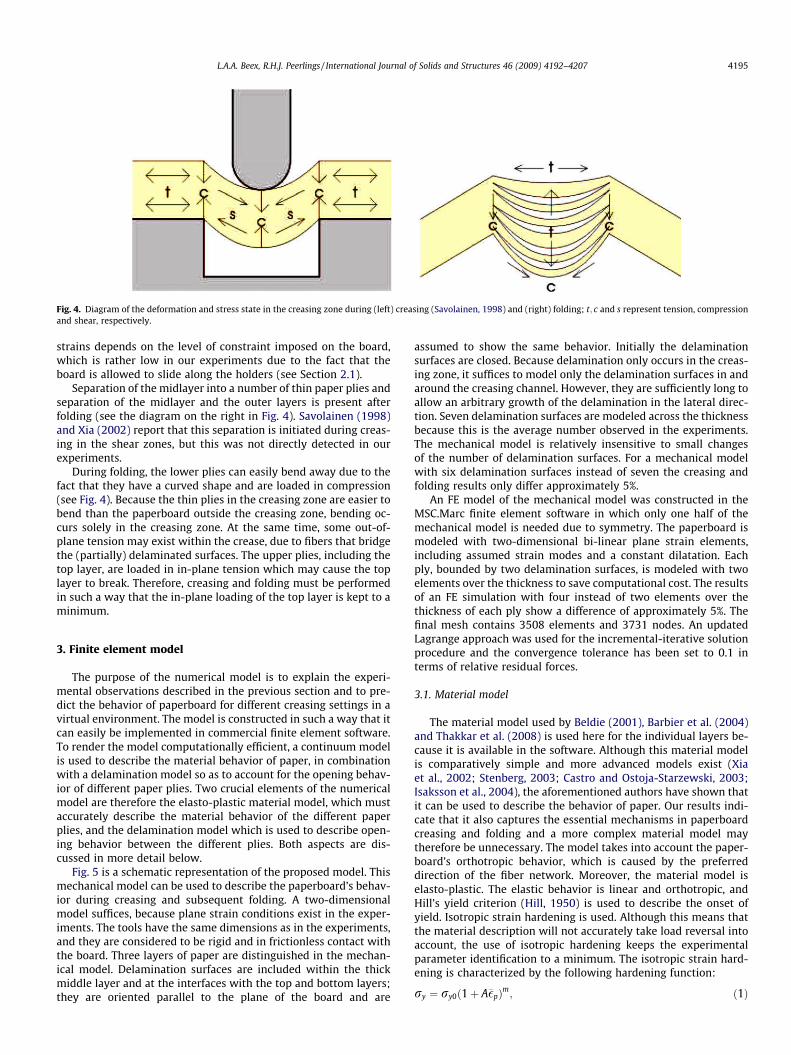
Fig. 4. Diagram of the deformation and stress state in the creasing zone during (left) creasing (Savolainen, 1998) and (right) folding; t; c and s represent tension, compressionand shear, respectively.
L.A.A. Beex, R.H.J. Peerlings / International Journal of Solids and Structures 46 (2009) 4192–4207 4195
strains depends on the level of constraint imposed on the board,which is rather low in our experiments due to the fact that theboard is allowed to slide along the holders (see Section 2.1).
Separation of the midlayer into a number of thin paper plies andseparation of the midlayer and the outer layers is present afterfolding (see the diagram on the right in Fig. 4). Savolainen (1998)and Xia (2002) report that this separation is initiated during creas-ing in the shear zones, but this was not directly detected in ourexperiments.
During folding, the lower plies can easily bend away due to thefact that they have a curved shape and are loaded in compression(see Fig. 4). Because the thin plies in the creasing zone are easier tobend than the paperboard outside the creasing zone, bending oc-curs solely in the creasing zone. At the same time, some out-of-plane tension may exist within the crease, due to fibers that bridgethe (partially) delaminated surfaces. The upper plies, including thetop layer, are loaded in in-plane tension which may cause the toplayer to break. Therefore, creasing and folding must be performedin such a way that the in-plane loading of the top layer is kept to aminimum.
3. Finite element model
The purpose of the numerical model is to explain the experi-mental observations described in the previous section and to pre-dict the behavior of paperboard for different creasing settings in avirtual environment. The model is constructed in such a way that itcan easily be implemented in commercial finite element software.To render the model computationally efficient, a continuum modelis used to describe the material behavior of paper, in combinationwith a delamination model so as to account for the opening behav-ior of different paper plies. Two crucial elements of the numericalmodel are therefore the elasto-plastic material model, which mustaccurately describe the material behavior of the different paperplies, and the delamination model which is used to describe open-ing behavior between the different plies. Both aspects are dis-cussed in more detail below.
Fig. 5 is a schematic representation of the proposed model. Thismechanical model can be used to describe the paperboard’s behav-ior during creasing and subsequent folding. A two-dimensionalmodel suffices, because plane strain conditions exist in the exper-iments. The tools have the same dimensions as in the experiments,and they are considered to be rigid and in frictionless contact withthe board. Three layers of paper are distinguished in the mechan-ical model. Delamination surfaces are included within the thickmiddle layer and at the interfaces with the top and bottom layers;they are oriented parallel to the plane of the board and are
assumed to show the same behavior. Initially the delaminationsurfaces are closed. Because delamination only occurs in the creas-ing zone, it suffices to model only the delamination surfaces in andaround the creasing channel. However, they are sufficiently long toallow an arbitrary growth of the delamination in the lateral direc-tion. Seven delamination surfaces are modeled across the thicknessbecause this is the average number observed in the experiments.The mechanical model is relatively insensitive to small changesof the number of delamination surfaces. For a mechanical modelwith six delamination surfaces instead of seven the creasing andfolding results only differ approximately 5%.
An FE model of the mechanical model was constructed in theMSC.Marc finite element software in which only one half of themechanical model is needed due to symmetry. The paperboard ismodeled with two-dimensional bi-linear plane strain elements,including assumed strain modes and a constant dilatation. Eachply, bounded by two delamination surfaces, is modeled with twoelements over the thickness to save computational cost. The resultsof an FE simulation with four instead of two elements over thethickness of each ply show a difference of approximately 5%. Thefinal mesh contains 3508 elements and 3731 nodes. An updatedLagrange approach was used for the incremental-iterative solutionprocedure and the convergence tolerance has been set to 0.1 interms of relative residual forces.
3.1. Material model
The material model used by Beldie (2001), Barbier et al. (2004)and Thakkar et al. (2008) is used here for the individual layers be-cause it is available in the software. Although this material modelis comparatively simple and more advanced models exist (Xiaet al., 2002; Stenberg, 2003; Castro and Ostoja-Starzewski, 2003;Isaksson et al., 2004), the aforementioned authors have shown thatit can be used to describe the behavior of paper. Our results indi-cate that it also captures the essential mechanisms in paperboardcreasing and folding and a more complex material model maytherefore be unnecessary. The model takes into account the paper-board’s orthotropic behavior, which is caused by the preferreddirection of the fiber network. Moreover, the material model iselasto-plastic. The elastic behavior is linear and orthotropic, andHill’s yield criterion (Hill, 1950) is used to describe the onset ofyield. Isotropic strain hardening is used. Although this means thatthe material description will not accurately take load reversal intoaccount, the use of isotropic hardening keeps the experimentalparameter identification to a minimum. The isotropic strain hard-ening is characterized by the following hardening function:
ry ¼ ry0ð1þ A��pÞm; ð1Þ
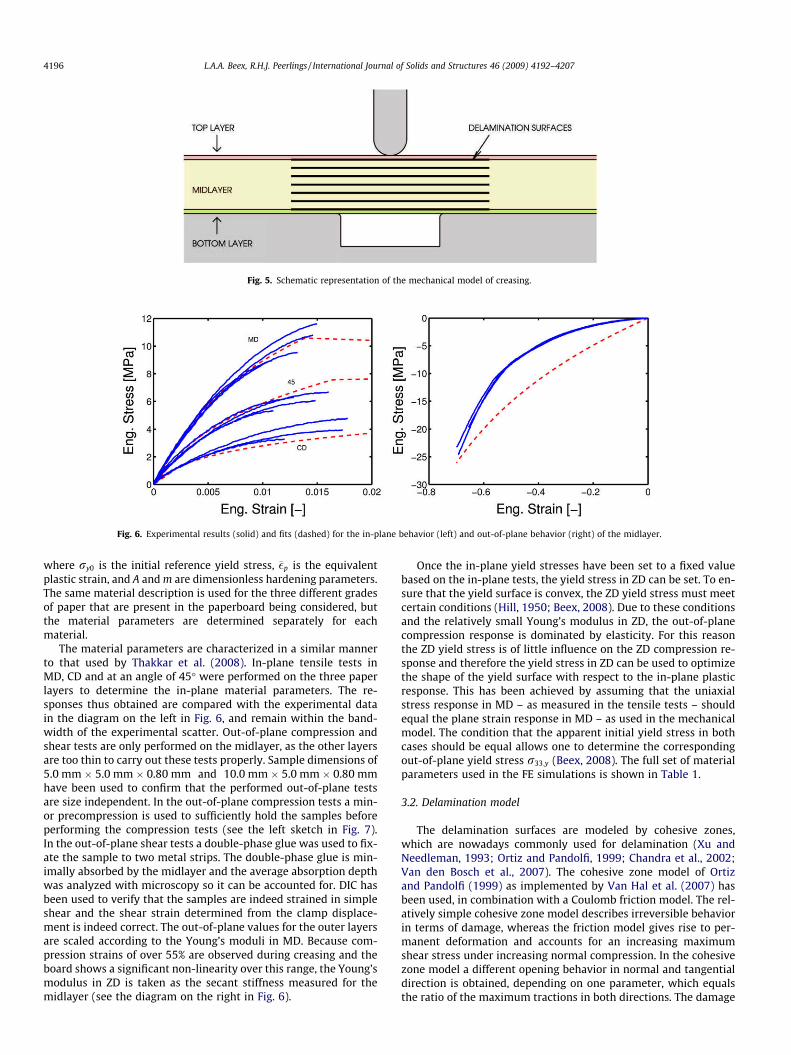
Fig. 5. Schematic representation of the mechanical model of creasing.
Fig. 6. Experimental results (solid) and fits (dashed) for the in-plane behavior (left) and out-of-plane behavior (right) of the midlayer.
4196 L.A.A. Beex, R.H.J. Peerlings / International Journal of Solids and Structures 46 (2009) 4192–4207
where ry0 is the initial reference yield stress, ��p is the equivalentplastic strain, and A and m are dimensionless hardening parameters.The same material description is used for the three different gradesof paper that are present in the paperboard being considered, butthe material parameters are determined separately for eachmaterial.
The material parameters are characterized in a similar mannerto that used by Thakkar et al. (2008). In-plane tensile tests inMD, CD and at an angle of 45� were performed on the three paperlayers to determine the in-plane material parameters. The re-sponses thus obtained are compared with the experimental datain the diagram on the left in Fig. 6, and remain within the band-width of the experimental scatter. Out-of-plane compression andshear tests are only performed on the midlayer, as the other layersare too thin to carry out these tests properly. Sample dimensions of5.0 mm � 5.0 mm � 0.80 mm and 10.0 mm � 5.0 mm � 0.80 mmhave been used to confirm that the performed out-of-plane testsare size independent. In the out-of-plane compression tests a min-or precompression is used to sufficiently hold the samples beforeperforming the compression tests (see the left sketch in Fig. 7).In the out-of-plane shear tests a double-phase glue was used to fix-ate the sample to two metal strips. The double-phase glue is min-imally absorbed by the midlayer and the average absorption depthwas analyzed with microscopy so it can be accounted for. DIC hasbeen used to verify that the samples are indeed strained in simpleshear and the shear strain determined from the clamp displace-ment is indeed correct. The out-of-plane values for the outer layersare scaled according to the Young’s moduli in MD. Because com-pression strains of over 55% are observed during creasing and theboard shows a significant non-linearity over this range, the Young’smodulus in ZD is taken as the secant stiffness measured for themidlayer (see the diagram on the right in Fig. 6).
Once the in-plane yield stresses have been set to a fixed valuebased on the in-plane tests, the yield stress in ZD can be set. To en-sure that the yield surface is convex, the ZD yield stress must meetcertain conditions (Hill, 1950; Beex, 2008). Due to these conditionsand the relatively small Young’s modulus in ZD, the out-of-planecompression response is dominated by elasticity. For this reasonthe ZD yield stress is of little influence on the ZD compression re-sponse and therefore the yield stress in ZD can be used to optimizethe shape of the yield surface with respect to the in-plane plasticresponse. This has been achieved by assuming that the uniaxialstress response in MD – as measured in the tensile tests – shouldequal the plane strain response in MD – as used in the mechanicalmodel. The condition that the apparent initial yield stress in bothcases should be equal allows one to determine the correspondingout-of-plane yield stress r33;y (Beex, 2008). The full set of materialparameters used in the FE simulations is shown in Table 1.
3.2. Delamination model
The delamination surfaces are modeled by cohesive zones,which are nowadays commonly used for delamination (Xu andNeedleman, 1993; Ortiz and Pandolfi, 1999; Chandra et al., 2002;Van den Bosch et al., 2007). The cohesive zone model of Ortizand Pandolfi (1999) as implemented by Van Hal et al. (2007) hasbeen used, in combination with a Coulomb friction model. The rel-atively simple cohesive zone model describes irreversible behaviorin terms of damage, whereas the friction model gives rise to per-manent deformation and accounts for an increasing maximumshear stress under increasing normal compression. In the cohesivezone model a different opening behavior in normal and tangentialdirection is obtained, depending on one parameter, which equalsthe ratio of the maximum tractions in both directions. The damage
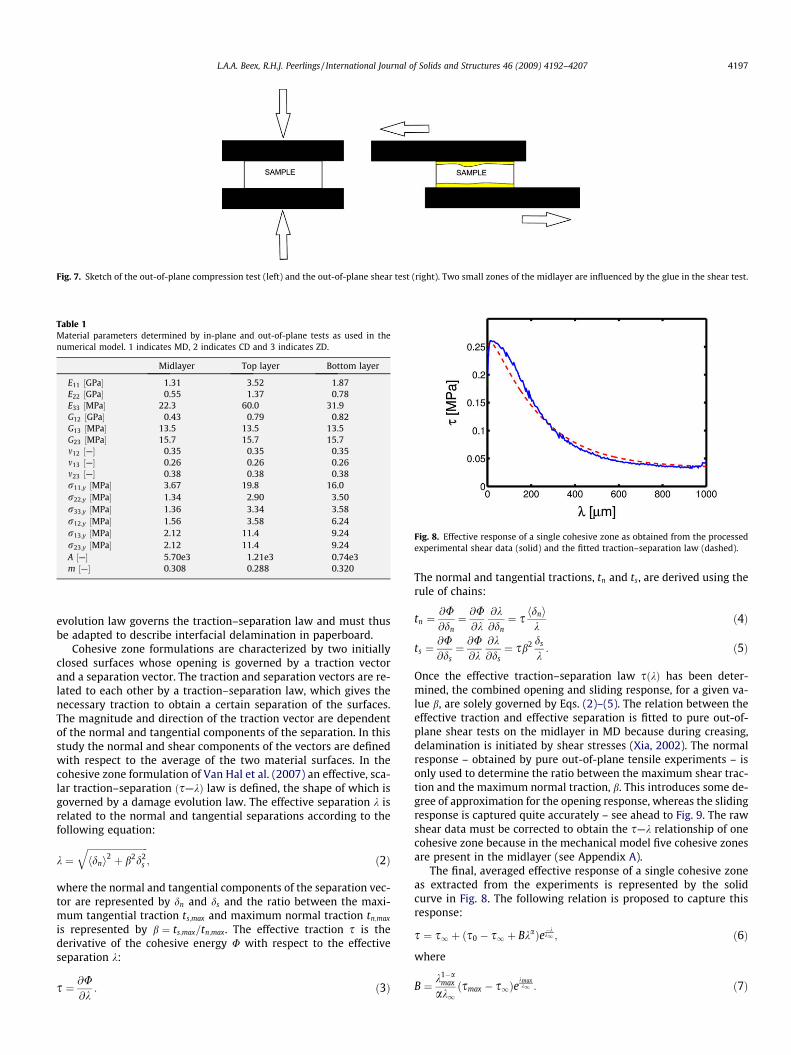
Fig. 7. Sketch of the out-of-plane compression test (left) and the out-of-plane shear test (right). Two small zones of the midlayer are influenced by the glue in the shear test.
Fig. 8. Effective response of a single cohesive zone as obtained from the processedexperimental shear data (solid) and the fitted traction–separation law (dashed).
Table 1Material parameters determined by in-plane and out-of-plane tests as used in thenumerical model. 1 indicates MD, 2 indicates CD and 3 indicates ZD.
Midlayer Top layer Bottom layer
E11 ½GPa� 1.31 3.52 1.87E22 ½GPa� 0.55 1.37 0.78E33 ½MPa� 22.3 60.0 31.9G12 ½GPa� 0.43 0.79 0.82G13 ½MPa� 13.5 13.5 13.5G23 ½MPa� 15.7 15.7 15.7m12 ½—� 0.35 0.35 0.35m13 ½—� 0.26 0.26 0.26m23 ½—� 0.38 0.38 0.38r11;y ½MPa� 3.67 19.8 16.0r22;y ½MPa� 1.34 2.90 3.50r33;y ½MPa� 1.36 3.34 3.58r12;y ½MPa� 1.56 3.58 6.24r13;y ½MPa� 2.12 11.4 9.24r23;y ½MPa� 2.12 11.4 9.24A ½—� 5.70e3 1.21e3 0.74e3m ½—� 0.308 0.288 0.320
L.A.A. Beex, R.H.J. Peerlings / International Journal of Solids and Structures 46 (2009) 4192–4207 4197
evolution law governs the traction–separation law and must thusbe adapted to describe interfacial delamination in paperboard.
Cohesive zone formulations are characterized by two initiallyclosed surfaces whose opening is governed by a traction vectorand a separation vector. The traction and separation vectors are re-lated to each other by a traction–separation law, which gives thenecessary traction to obtain a certain separation of the surfaces.The magnitude and direction of the traction vector are dependentof the normal and tangential components of the separation. In thisstudy the normal and shear components of the vectors are definedwith respect to the average of the two material surfaces. In thecohesive zone formulation of Van Hal et al. (2007) an effective, sca-lar traction–separation ðs—kÞ law is defined, the shape of which isgoverned by a damage evolution law. The effective separation k isrelated to the normal and tangential separations according to thefollowing equation:
k ¼ffiffiffiffiffiffiffiffiffiffiffiffiffiffiffiffiffiffiffiffiffiffiffiffiffiffihdni2 þ b2d2
s
q; ð2Þ
where the normal and tangential components of the separation vec-tor are represented by dn and ds and the ratio between the maxi-mum tangential traction ts;max and maximum normal traction tn;max
is represented by b ¼ ts;max=tn;max. The effective traction s is thederivative of the cohesive energy U with respect to the effectiveseparation k:
s ¼ @U@k
: ð3Þ
The normal and tangential tractions, tn and ts, are derived using therule of chains:
tn ¼@U@dn¼ @U@k
@k@dn¼ s hdni
kð4Þ
ts ¼@U@ds¼ @U@k
@k@ds¼ sb2 ds
k: ð5Þ
Once the effective traction–separation law sðkÞ has been deter-mined, the combined opening and sliding response, for a given va-lue b, are solely governed by Eqs. (2)–(5). The relation between theeffective traction and effective separation is fitted to pure out-of-plane shear tests on the midlayer in MD because during creasing,delamination is initiated by shear stresses (Xia, 2002). The normalresponse – obtained by pure out-of-plane tensile experiments – isonly used to determine the ratio between the maximum shear trac-tion and the maximum normal traction, b. This introduces some de-gree of approximation for the opening response, whereas the slidingresponse is captured quite accurately – see ahead to Fig. 9. The rawshear data must be corrected to obtain the s—k relationship of onecohesive zone because in the mechanical model five cohesive zonesare present in the midlayer (see Appendix A).
The final, averaged effective response of a single cohesive zoneas extracted from the experiments is represented by the solidcurve in Fig. 8. The following relation is proposed to capture thisresponse:
s ¼ s1 þ s0 � s1 þ Bkað Þe�kk1 ; ð6Þ
where
B ¼ k1�amax
ak1ðsmax � s1Þe
kmaxk1 : ð7Þ
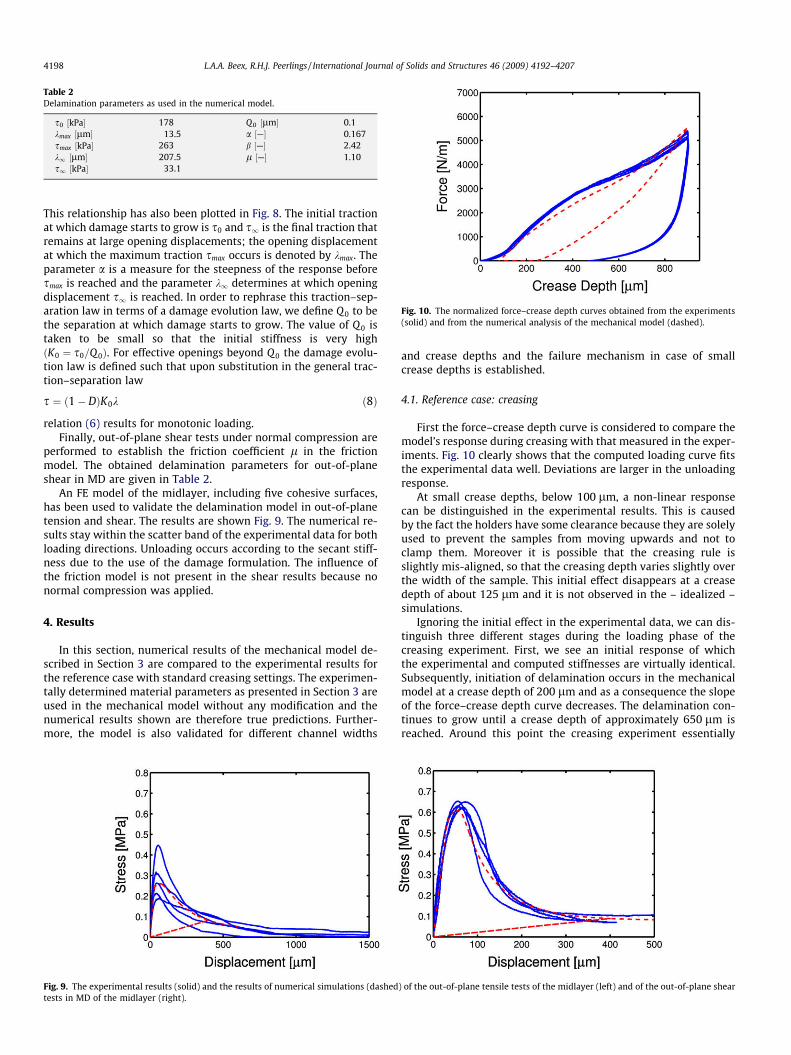
Table 2Delamination parameters as used in the numerical model.
s0 ½kPa� 178 Q0 ½lm� 0.1kmax ½lm� 13.5 a ½—� 0.167smax ½kPa� 263 b ½—� 2.42k1 ½lm� 207.5 l ½—� 1.10s1 ½kPa� 33.1
Fig. 10. The normalized force–crease depth curves obtained from the experiments(solid) and from the numerical analysis of the mechanical model (dashed).
4198 L.A.A. Beex, R.H.J. Peerlings / International Journal of Solids and Structures 46 (2009) 4192–4207
This relationship has also been plotted in Fig. 8. The initial tractionat which damage starts to grow is s0 and s1 is the final traction thatremains at large opening displacements; the opening displacementat which the maximum traction smax occurs is denoted by kmax. Theparameter a is a measure for the steepness of the response beforesmax is reached and the parameter k1 determines at which openingdisplacement s1 is reached. In order to rephrase this traction–sep-aration law in terms of a damage evolution law, we define Q0 to bethe separation at which damage starts to grow. The value of Q0 istaken to be small so that the initial stiffness is very highðK0 ¼ s0=Q0Þ. For effective openings beyond Q0 the damage evolu-tion law is defined such that upon substitution in the general trac-tion–separation law
s ¼ ð1� DÞK0k ð8Þ
relation (6) results for monotonic loading.Finally, out-of-plane shear tests under normal compression are
performed to establish the friction coefficient l in the frictionmodel. The obtained delamination parameters for out-of-planeshear in MD are given in Table 2.
An FE model of the midlayer, including five cohesive surfaces,has been used to validate the delamination model in out-of-planetension and shear. The results are shown Fig. 9. The numerical re-sults stay within the scatter band of the experimental data for bothloading directions. Unloading occurs according to the secant stiff-ness due to the use of the damage formulation. The influence ofthe friction model is not present in the shear results because nonormal compression was applied.
4. Results
In this section, numerical results of the mechanical model de-scribed in Section 3 are compared to the experimental results forthe reference case with standard creasing settings. The experimen-tally determined material parameters as presented in Section 3 areused in the mechanical model without any modification and thenumerical results shown are therefore true predictions. Further-more, the model is also validated for different channel widths
Fig. 9. The experimental results (solid) and the results of numerical simulations (dashedtests in MD of the midlayer (right).
and crease depths and the failure mechanism in case of smallcrease depths is established.
4.1. Reference case: creasing
First the force–crease depth curve is considered to compare themodel’s response during creasing with that measured in the exper-iments. Fig. 10 clearly shows that the computed loading curve fitsthe experimental data well. Deviations are larger in the unloadingresponse.
At small crease depths, below 100 lm, a non-linear responsecan be distinguished in the experimental results. This is causedby the fact the holders have some clearance because they are solelyused to prevent the samples from moving upwards and not toclamp them. Moreover it is possible that the creasing rule isslightly mis-aligned, so that the creasing depth varies slightly overthe width of the sample. This initial effect disappears at a creasedepth of about 125 lm and it is not observed in the – idealized –simulations.
Ignoring the initial effect in the experimental data, we can dis-tinguish three different stages during the loading phase of thecreasing experiment. First, we see an initial response of whichthe experimental and computed stiffnesses are virtually identical.Subsequently, initiation of delamination occurs in the mechanicalmodel at a crease depth of 200 lm and as a consequence the slopeof the force–crease depth curve decreases. The delamination con-tinues to grow until a crease depth of approximately 650 lm isreached. Around this point the creasing experiment essentially
) of the out-of-plane tensile tests of the midlayer (left) and of the out-of-plane shear
L.A.A. Beex, R.H.J. Peerlings / International Journal of Solids and Structures 46 (2009) 4192–4207 4199
turns into an out-of-plane compression test, which leads to anincreasing slope of the force–crease depth response.
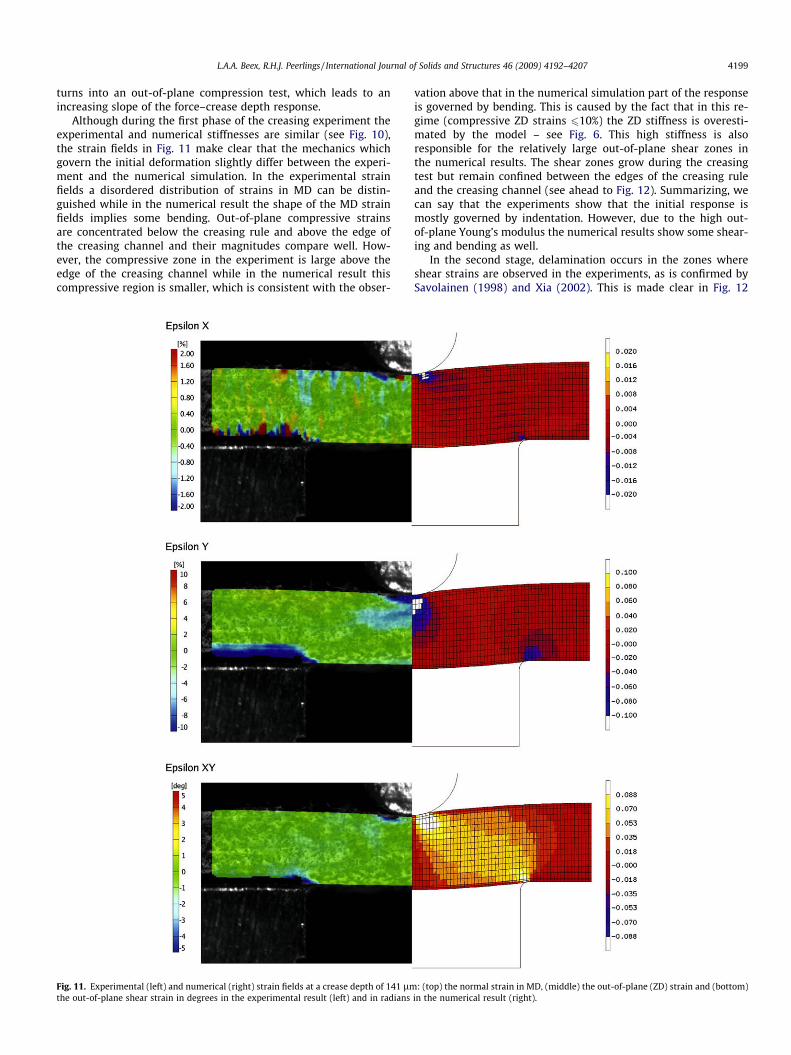
Although during the first phase of the creasing experiment theexperimental and numerical stiffnesses are similar (see Fig. 10),the strain fields in Fig. 11 make clear that the mechanics whichgovern the initial deformation slightly differ between the experi-ment and the numerical simulation. In the experimental strainfields a disordered distribution of strains in MD can be distin-guished while in the numerical result the shape of the MD strainfields implies some bending. Out-of-plane compressive strainsare concentrated below the creasing rule and above the edge ofthe creasing channel and their magnitudes compare well. How-ever, the compressive zone in the experiment is large above theedge of the creasing channel while in the numerical result thiscompressive region is smaller, which is consistent with the obser-
Fig. 11. Experimental (left) and numerical (right) strain fields at a crease depth of 141 lmthe out-of-plane shear strain in degrees in the experimental result (left) and in radians
vation above that in the numerical simulation part of the responseis governed by bending. This is caused by the fact that in this re-gime (compressive ZD strains 610%) the ZD stiffness is overesti-mated by the model – see Fig. 6. This high stiffness is alsoresponsible for the relatively large out-of-plane shear zones inthe numerical results. The shear zones grow during the creasingtest but remain confined between the edges of the creasing ruleand the creasing channel (see ahead to Fig. 12). Summarizing, wecan say that the experiments show that the initial response ismostly governed by indentation. However, due to the high out-of-plane Young’s modulus the numerical results show some shear-ing and bending as well.
In the second stage, delamination occurs in the zones whereshear strains are observed in the experiments, as is confirmed bySavolainen (1998) and Xia (2002). This is made clear in Fig. 12
: (top) the normal strain in MD, (middle) the out-of-plane (ZD) strain and (bottom)in the numerical result (right).
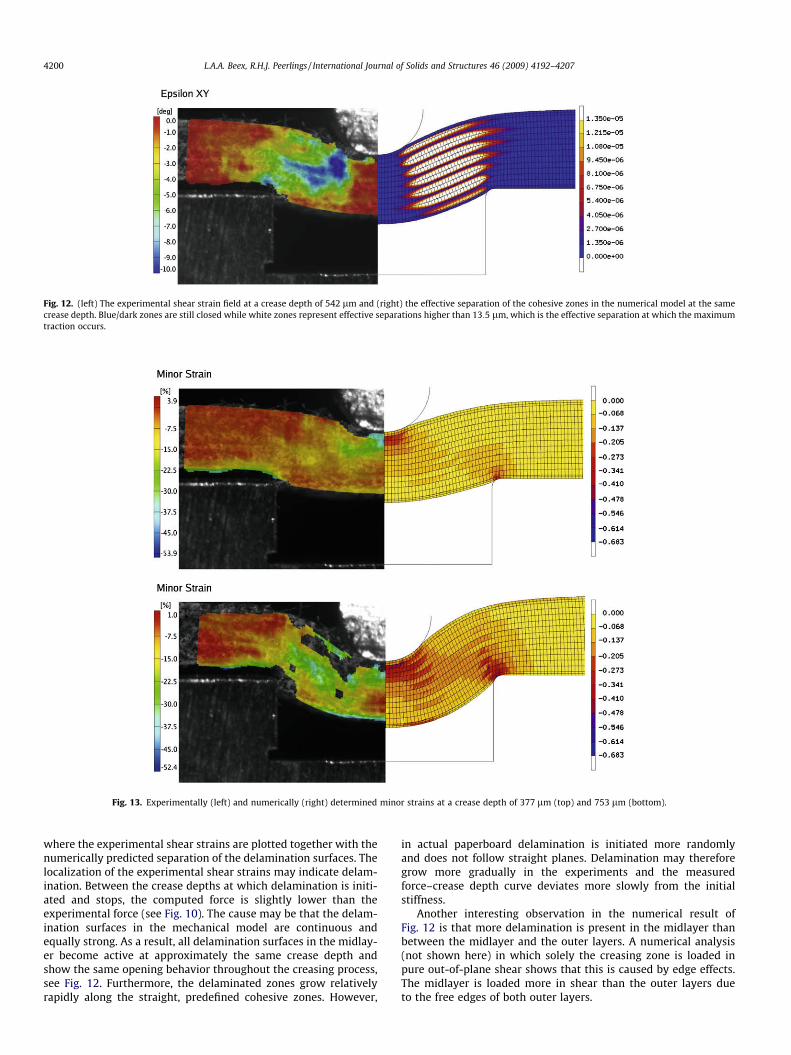
Fig. 12. (left) The experimental shear strain field at a crease depth of 542 lm and (right) the effective separation of the cohesive zones in the numerical model at the samecrease depth. Blue/dark zones are still closed while white zones represent effective separations higher than 13:5 lm, which is the effective separation at which the maximumtraction occurs.
Fig. 13. Experimentally (left) and numerically (right) determined minor strains at a crease depth of 377 lm (top) and 753 lm (bottom).
4200 L.A.A. Beex, R.H.J. Peerlings / International Journal of Solids and Structures 46 (2009) 4192–4207
where the experimental shear strains are plotted together with thenumerically predicted separation of the delamination surfaces. Thelocalization of the experimental shear strains may indicate delam-ination. Between the crease depths at which delamination is initi-ated and stops, the computed force is slightly lower than theexperimental force (see Fig. 10). The cause may be that the delam-ination surfaces in the mechanical model are continuous andequally strong. As a result, all delamination surfaces in the midlay-er become active at approximately the same crease depth andshow the same opening behavior throughout the creasing process,see Fig. 12. Furthermore, the delaminated zones grow relativelyrapidly along the straight, predefined cohesive zones. However,
in actual paperboard delamination is initiated more randomlyand does not follow straight planes. Delamination may thereforegrow more gradually in the experiments and the measuredforce–crease depth curve deviates more slowly from the initialstiffness.
Another interesting observation in the numerical result ofFig. 12 is that more delamination is present in the midlayer thanbetween the midlayer and the outer layers. A numerical analysis(not shown here) in which solely the creasing zone is loaded inpure out-of-plane shear shows that this is caused by edge effects.The midlayer is loaded more in shear than the outer layers dueto the free edges of both outer layers.
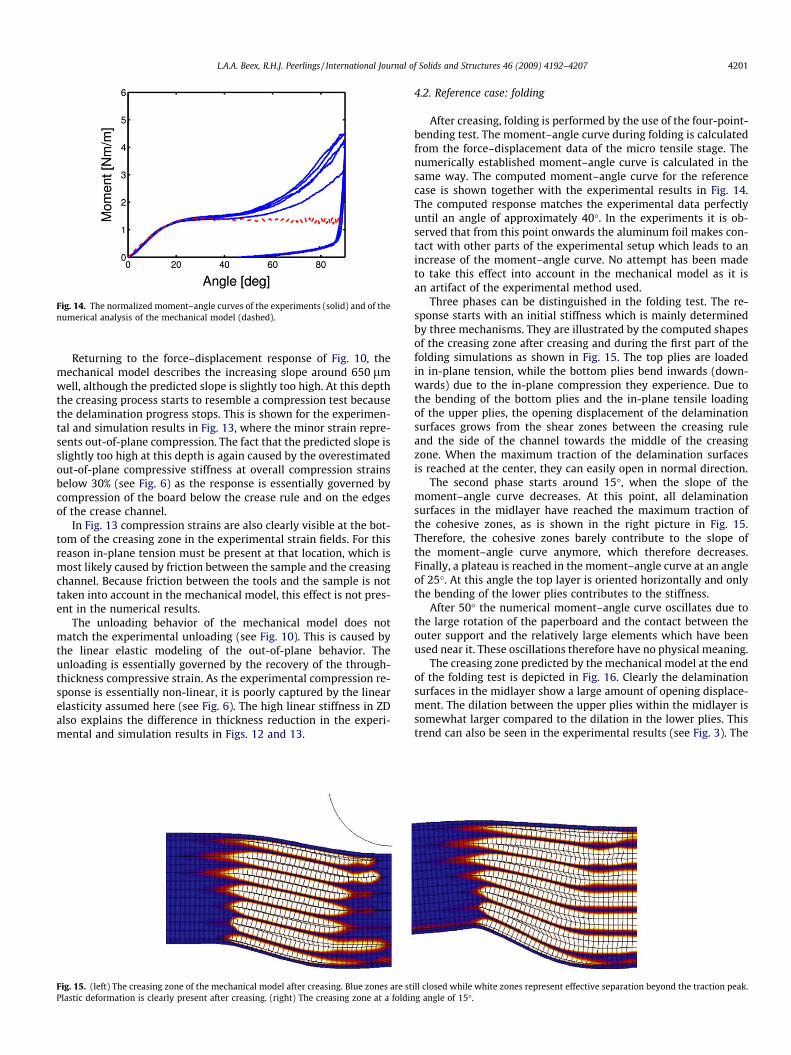
Fig. 14. The normalized moment–angle curves of the experiments (solid) and of thenumerical analysis of the mechanical model (dashed).
L.A.A. Beex, R.H.J. Peerlings / International Journal of Solids and Structures 46 (2009) 4192–4207 4201
Returning to the force–displacement response of Fig. 10, themechanical model describes the increasing slope around 650 lmwell, although the predicted slope is slightly too high. At this depththe creasing process starts to resemble a compression test becausethe delamination progress stops. This is shown for the experimen-tal and simulation results in Fig. 13, where the minor strain repre-sents out-of-plane compression. The fact that the predicted slope isslightly too high at this depth is again caused by the overestimatedout-of-plane compressive stiffness at overall compression strainsbelow 30% (see Fig. 6) as the response is essentially governed bycompression of the board below the crease rule and on the edgesof the crease channel.
In Fig. 13 compression strains are also clearly visible at the bot-tom of the creasing zone in the experimental strain fields. For thisreason in-plane tension must be present at that location, which ismost likely caused by friction between the sample and the creasingchannel. Because friction between the tools and the sample is nottaken into account in the mechanical model, this effect is not pres-ent in the numerical results.
The unloading behavior of the mechanical model does notmatch the experimental unloading (see Fig. 10). This is caused bythe linear elastic modeling of the out-of-plane behavior. Theunloading is essentially governed by the recovery of the through-thickness compressive strain. As the experimental compression re-sponse is essentially non-linear, it is poorly captured by the linearelasticity assumed here (see Fig. 6). The high linear stiffness in ZDalso explains the difference in thickness reduction in the experi-mental and simulation results in Figs. 12 and 13.
Fig. 15. (left) The creasing zone of the mechanical model after creasing. Blue zones are stPlastic deformation is clearly present after creasing. (right) The creasing zone at a foldin
4.2. Reference case: folding
After creasing, folding is performed by the use of the four-point-bending test. The moment–angle curve during folding is calculatedfrom the force–displacement data of the micro tensile stage. Thenumerically established moment–angle curve is calculated in thesame way. The computed moment–angle curve for the referencecase is shown together with the experimental results in Fig. 14.The computed response matches the experimental data perfectlyuntil an angle of approximately 40�. In the experiments it is ob-served that from this point onwards the aluminum foil makes con-tact with other parts of the experimental setup which leads to anincrease of the moment–angle curve. No attempt has been madeto take this effect into account in the mechanical model as it isan artifact of the experimental method used.
Three phases can be distinguished in the folding test. The re-sponse starts with an initial stiffness which is mainly determinedby three mechanisms. They are illustrated by the computed shapesof the creasing zone after creasing and during the first part of thefolding simulations as shown in Fig. 15. The top plies are loadedin in-plane tension, while the bottom plies bend inwards (down-wards) due to the in-plane compression they experience. Due tothe bending of the bottom plies and the in-plane tensile loadingof the upper plies, the opening displacement of the delaminationsurfaces grows from the shear zones between the creasing ruleand the side of the channel towards the middle of the creasingzone. When the maximum traction of the delamination surfacesis reached at the center, they can easily open in normal direction.
The second phase starts around 15�, when the slope of themoment–angle curve decreases. At this point, all delaminationsurfaces in the midlayer have reached the maximum traction ofthe cohesive zones, as is shown in the right picture in Fig. 15.Therefore, the cohesive zones barely contribute to the slope ofthe moment–angle curve anymore, which therefore decreases.Finally, a plateau is reached in the moment–angle curve at an angleof 25�. At this angle the top layer is oriented horizontally and onlythe bending of the lower plies contributes to the stiffness.
After 50� the numerical moment–angle curve oscillates due tothe large rotation of the paperboard and the contact between theouter support and the relatively large elements which have beenused near it. These oscillations therefore have no physical meaning.
The creasing zone predicted by the mechanical model at the endof the folding test is depicted in Fig. 16. Clearly the delaminationsurfaces in the midlayer show a large amount of opening displace-ment. The dilation between the upper plies within the midlayer issomewhat larger compared to the dilation in the lower plies. Thistrend can also be seen in the experimental results (see Fig. 3). The
ill closed while white zones represent effective separation beyond the traction peak.g angle of 15�.
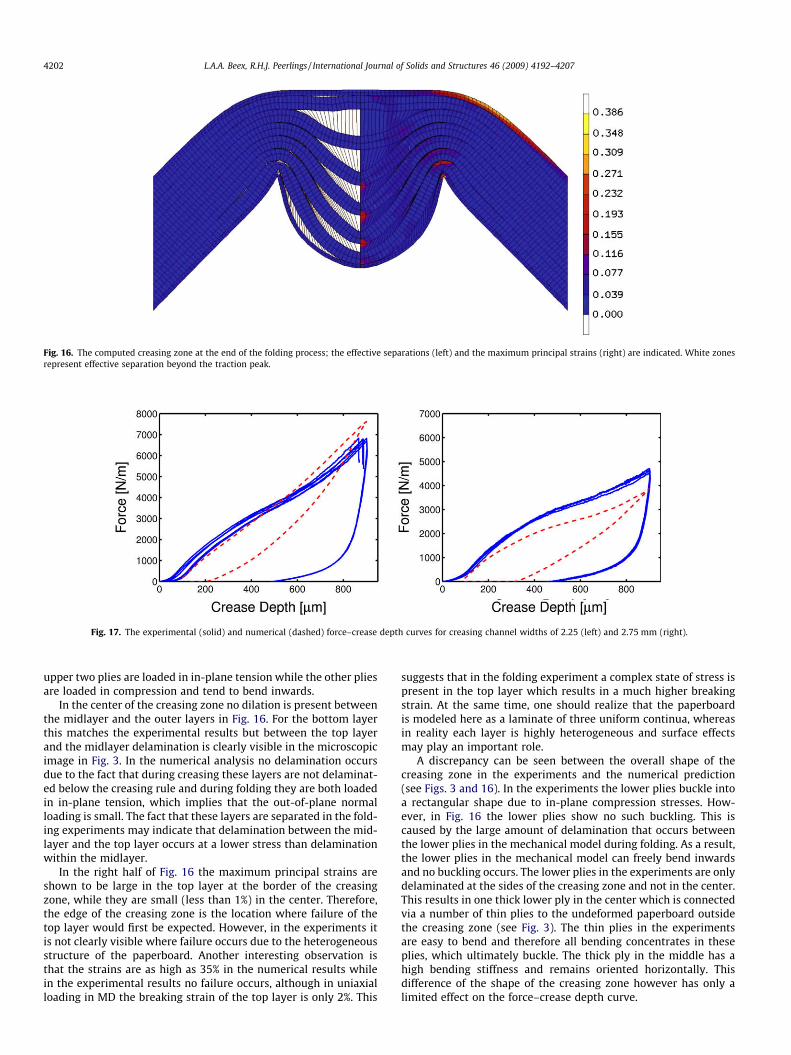
Fig. 16. The computed creasing zone at the end of the folding process; the effective separations (left) and the maximum principal strains (right) are indicated. White zonesrepresent effective separation beyond the traction peak.
Fig. 17. The experimental (solid) and numerical (dashed) force–crease depth curves for creasing channel widths of 2.25 (left) and 2.75 mm (right).
4202 L.A.A. Beex, R.H.J. Peerlings / International Journal of Solids and Structures 46 (2009) 4192–4207
upper two plies are loaded in in-plane tension while the other pliesare loaded in compression and tend to bend inwards.
In the center of the creasing zone no dilation is present betweenthe midlayer and the outer layers in Fig. 16. For the bottom layerthis matches the experimental results but between the top layerand the midlayer delamination is clearly visible in the microscopicimage in Fig. 3. In the numerical analysis no delamination occursdue to the fact that during creasing these layers are not delaminat-ed below the creasing rule and during folding they are both loadedin in-plane tension, which implies that the out-of-plane normalloading is small. The fact that these layers are separated in the fold-ing experiments may indicate that delamination between the mid-layer and the top layer occurs at a lower stress than delaminationwithin the midlayer.
In the right half of Fig. 16 the maximum principal strains areshown to be large in the top layer at the border of the creasingzone, while they are small (less than 1%) in the center. Therefore,the edge of the creasing zone is the location where failure of thetop layer would first be expected. However, in the experiments itis not clearly visible where failure occurs due to the heterogeneousstructure of the paperboard. Another interesting observation isthat the strains are as high as 35% in the numerical results whilein the experimental results no failure occurs, although in uniaxialloading in MD the breaking strain of the top layer is only 2%. This
suggests that in the folding experiment a complex state of stress ispresent in the top layer which results in a much higher breakingstrain. At the same time, one should realize that the paperboardis modeled here as a laminate of three uniform continua, whereasin reality each layer is highly heterogeneous and surface effectsmay play an important role.
A discrepancy can be seen between the overall shape of thecreasing zone in the experiments and the numerical prediction(see Figs. 3 and 16). In the experiments the lower plies buckle intoa rectangular shape due to in-plane compression stresses. How-ever, in Fig. 16 the lower plies show no such buckling. This iscaused by the large amount of delamination that occurs betweenthe lower plies in the mechanical model during folding. As a result,the lower plies in the mechanical model can freely bend inwardsand no buckling occurs. The lower plies in the experiments are onlydelaminated at the sides of the creasing zone and not in the center.This results in one thick lower ply in the center which is connectedvia a number of thin plies to the undeformed paperboard outsidethe creasing zone (see Fig. 3). The thin plies in the experimentsare easy to bend and therefore all bending concentrates in theseplies, which ultimately buckle. The thick ply in the middle has ahigh bending stiffness and remains oriented horizontally. Thisdifference of the shape of the creasing zone however has only alimited effect on the force–crease depth curve.
L.A.A. Beex, R.H.J. Peerlings / International Journal of Solids and Structures 46 (2009) 4192–4207 4203
4.3. Influence of channel width
The force–displacement response is different for differentwidths of the creasing channel. In Fig. 17 the numerical and exper-imental force–crease depth curves are presented for channelwidths of 2.25 and 2.75 mm, respectively, as opposed to 2.50 mmin the reference case. The initial stiffness of the experimental re-sults, after 125 lm, does not change substantially because mostlythe out-of-plane compression zones underneath the creasing ruleand above the edge of the creasing channel determine this partof the response. Delamination is initiated in both cases, as can beconcluded by the subsequent change of slope. Once the delamina-tion stops, the paperboard is loaded in out-of-plane compressionagain. Because the contact area of the creasing rule with the boardis larger for smaller channel widths, the response is stiffer at theend of the creasing experiment.
The numerical force–crease depth curves for different channelwidths deviate somewhat from the experimental data (seeFig. 17). The first part of the numerical response for a width of2.25 mm fits the experimental results well although no distinctivedecrease of slope is present when delamination is initiated. At thecrease depth at which delamination stops, the numerical responseis stiffer due to the too large out-of-plane stiffness. Interesting isthat the numerical response fits the experimental results betterthan for the wider creasing channels. The cause of this is that forsmaller widths out-of-plane shear is less important compared tolarger widths. Therefore, delamination, which is initiated by out-of-plane shear, has less influence on the force–crease depth curvesand the stiffness deviates less from the initial stiffness whendelamination occurs. This is also the reason that the response ob-tained with a wider creasing channel is lower relative to the re-sponse at standard creasing settings. The crease depth at whichthe delamination stops is larger for a wider creasing channel be-cause the shear zones are larger. Due to this effect the compres-sion-dominated phase starts at a larger crease depth, whichcontributes to a larger deviation at the end of the creasing test.
Quantitatively the mechanical model predicts paperboard’sbehavior better for smaller creasing channels (see also Fig. 10).However, qualitatively the numerical results deviate more fromthe experimental force–crease depth curves for a smaller creasingchannel because the decrease of the slope which occurs at about adepth of 200 lm is not correctly predicted. These results show thatthe way delamination is incorporated in the mechanical modelsomewhat restricts the use of the model as it overpredicts thetrends observed in the experiments.
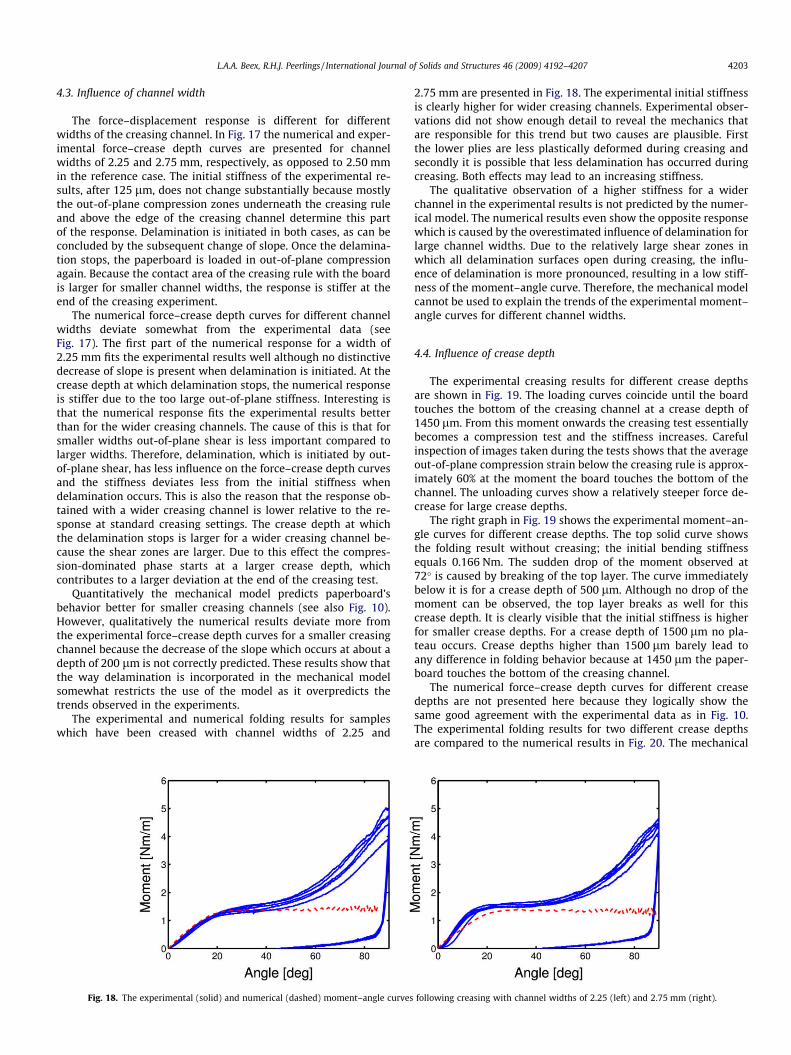
The experimental and numerical folding results for sampleswhich have been creased with channel widths of 2.25 and
Fig. 18. The experimental (solid) and numerical (dashed) moment–angle curves
2.75 mm are presented in Fig. 18. The experimental initial stiffnessis clearly higher for wider creasing channels. Experimental obser-vations did not show enough detail to reveal the mechanics thatare responsible for this trend but two causes are plausible. Firstthe lower plies are less plastically deformed during creasing andsecondly it is possible that less delamination has occurred duringcreasing. Both effects may lead to an increasing stiffness.
The qualitative observation of a higher stiffness for a widerchannel in the experimental results is not predicted by the numer-ical model. The numerical results even show the opposite responsewhich is caused by the overestimated influence of delamination forlarge channel widths. Due to the relatively large shear zones inwhich all delamination surfaces open during creasing, the influ-ence of delamination is more pronounced, resulting in a low stiff-ness of the moment–angle curve. Therefore, the mechanical modelcannot be used to explain the trends of the experimental moment–angle curves for different channel widths.
4.4. Influence of crease depth
The experimental creasing results for different crease depthsare shown in Fig. 19. The loading curves coincide until the boardtouches the bottom of the creasing channel at a crease depth of1450 lm. From this moment onwards the creasing test essentiallybecomes a compression test and the stiffness increases. Carefulinspection of images taken during the tests shows that the averageout-of-plane compression strain below the creasing rule is approx-imately 60% at the moment the board touches the bottom of thechannel. The unloading curves show a relatively steeper force de-crease for large crease depths.
The right graph in Fig. 19 shows the experimental moment–an-gle curves for different crease depths. The top solid curve showsthe folding result without creasing; the initial bending stiffnessequals 0.166 Nm. The sudden drop of the moment observed at72� is caused by breaking of the top layer. The curve immediatelybelow it is for a crease depth of 500 lm. Although no drop of themoment can be observed, the top layer breaks as well for thiscrease depth. It is clearly visible that the initial stiffness is higherfor smaller crease depths. For a crease depth of 1500 lm no pla-teau occurs. Crease depths higher than 1500 lm barely lead toany difference in folding behavior because at 1450 lm the paper-board touches the bottom of the creasing channel.
The numerical force–crease depth curves for different creasedepths are not presented here because they logically show thesame good agreement with the experimental data as in Fig. 10.The experimental folding results for two different crease depthsare compared to the numerical results in Fig. 20. The mechanical
following creasing with channel widths of 2.25 (left) and 2.75 mm (right).
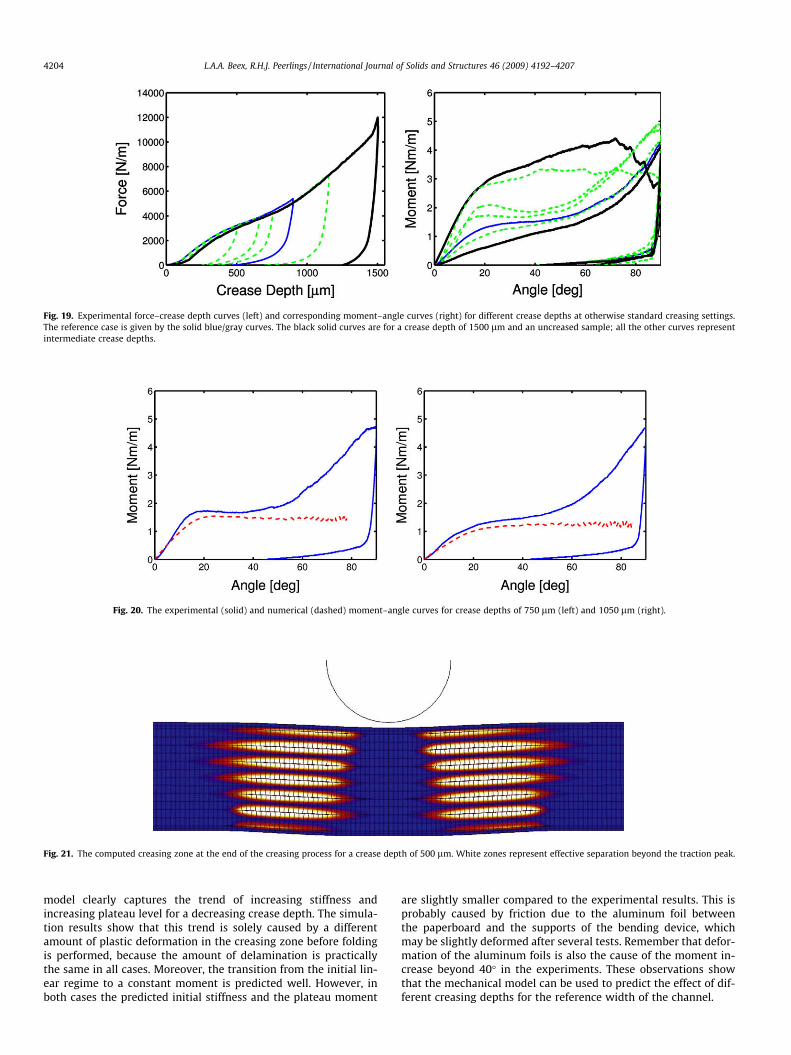
Fig. 20. The experimental (solid) and numerical (dashed) moment–angle curves for crease depths of 750 lm (left) and 1050 lm (right).
Fig. 19. Experimental force–crease depth curves (left) and corresponding moment–angle curves (right) for different crease depths at otherwise standard creasing settings.The reference case is given by the solid blue/gray curves. The black solid curves are for a crease depth of 1500 lm and an uncreased sample; all the other curves representintermediate crease depths.
Fig. 21. The computed creasing zone at the end of the creasing process for a crease depth of 500 lm. White zones represent effective separation beyond the traction peak.
4204 L.A.A. Beex, R.H.J. Peerlings / International Journal of Solids and Structures 46 (2009) 4192–4207
model clearly captures the trend of increasing stiffness andincreasing plateau level for a decreasing crease depth. The simula-tion results show that this trend is solely caused by a differentamount of plastic deformation in the creasing zone before foldingis performed, because the amount of delamination is practicallythe same in all cases. Moreover, the transition from the initial lin-ear regime to a constant moment is predicted well. However, inboth cases the predicted initial stiffness and the plateau moment
are slightly smaller compared to the experimental results. This isprobably caused by friction due to the aluminum foil betweenthe paperboard and the supports of the bending device, whichmay be slightly deformed after several tests. Remember that defor-mation of the aluminum foils is also the cause of the moment in-crease beyond 40� in the experiments. These observations showthat the mechanical model can be used to predict the effect of dif-ferent creasing depths for the reference width of the channel.
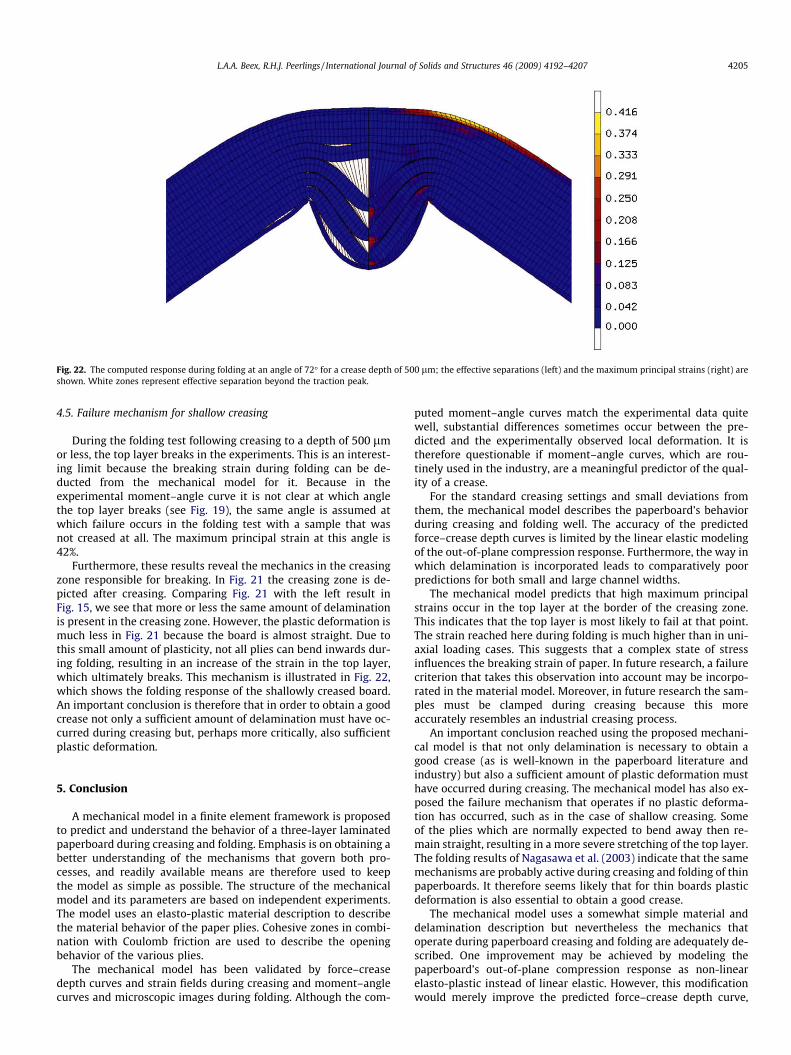
Fig. 22. The computed response during folding at an angle of 72� for a crease depth of 500 lm; the effective separations (left) and the maximum principal strains (right) areshown. White zones represent effective separation beyond the traction peak.
L.A.A. Beex, R.H.J. Peerlings / International Journal of Solids and Structures 46 (2009) 4192–4207 4205
4.5. Failure mechanism for shallow creasing
During the folding test following creasing to a depth of 500 lmor less, the top layer breaks in the experiments. This is an interest-ing limit because the breaking strain during folding can be de-ducted from the mechanical model for it. Because in theexperimental moment–angle curve it is not clear at which anglethe top layer breaks (see Fig. 19), the same angle is assumed atwhich failure occurs in the folding test with a sample that wasnot creased at all. The maximum principal strain at this angle is42%.
Furthermore, these results reveal the mechanics in the creasingzone responsible for breaking. In Fig. 21 the creasing zone is de-picted after creasing. Comparing Fig. 21 with the left result inFig. 15, we see that more or less the same amount of delaminationis present in the creasing zone. However, the plastic deformation ismuch less in Fig. 21 because the board is almost straight. Due tothis small amount of plasticity, not all plies can bend inwards dur-ing folding, resulting in an increase of the strain in the top layer,which ultimately breaks. This mechanism is illustrated in Fig. 22,which shows the folding response of the shallowly creased board.An important conclusion is therefore that in order to obtain a goodcrease not only a sufficient amount of delamination must have oc-curred during creasing but, perhaps more critically, also sufficientplastic deformation.
5. Conclusion
A mechanical model in a finite element framework is proposedto predict and understand the behavior of a three-layer laminatedpaperboard during creasing and folding. Emphasis is on obtaining abetter understanding of the mechanisms that govern both pro-cesses, and readily available means are therefore used to keepthe model as simple as possible. The structure of the mechanicalmodel and its parameters are based on independent experiments.The model uses an elasto-plastic material description to describethe material behavior of the paper plies. Cohesive zones in combi-nation with Coulomb friction are used to describe the openingbehavior of the various plies.
The mechanical model has been validated by force–creasedepth curves and strain fields during creasing and moment–anglecurves and microscopic images during folding. Although the com-
puted moment–angle curves match the experimental data quitewell, substantial differences sometimes occur between the pre-dicted and the experimentally observed local deformation. It istherefore questionable if moment–angle curves, which are rou-tinely used in the industry, are a meaningful predictor of the qual-ity of a crease.
For the standard creasing settings and small deviations fromthem, the mechanical model describes the paperboard’s behaviorduring creasing and folding well. The accuracy of the predictedforce–crease depth curves is limited by the linear elastic modelingof the out-of-plane compression response. Furthermore, the way inwhich delamination is incorporated leads to comparatively poorpredictions for both small and large channel widths.
The mechanical model predicts that high maximum principalstrains occur in the top layer at the border of the creasing zone.This indicates that the top layer is most likely to fail at that point.The strain reached here during folding is much higher than in uni-axial loading cases. This suggests that a complex state of stressinfluences the breaking strain of paper. In future research, a failurecriterion that takes this observation into account may be incorpo-rated in the material model. Moreover, in future research the sam-ples must be clamped during creasing because this moreaccurately resembles an industrial creasing process.
An important conclusion reached using the proposed mechani-cal model is that not only delamination is necessary to obtain agood crease (as is well-known in the paperboard literature andindustry) but also a sufficient amount of plastic deformation musthave occurred during creasing. The mechanical model has also ex-posed the failure mechanism that operates if no plastic deforma-tion has occurred, such as in the case of shallow creasing. Someof the plies which are normally expected to bend away then re-main straight, resulting in a more severe stretching of the top layer.The folding results of Nagasawa et al. (2003) indicate that the samemechanisms are probably active during creasing and folding of thinpaperboards. It therefore seems likely that for thin boards plasticdeformation is also essential to obtain a good crease.
The mechanical model uses a somewhat simple material anddelamination description but nevertheless the mechanics thatoperate during paperboard creasing and folding are adequately de-scribed. One improvement may be achieved by modeling thepaperboard’s out-of-plane compression response as non-linearelasto-plastic instead of linear elastic. However, this modificationwould merely improve the predicted force–crease depth curve,
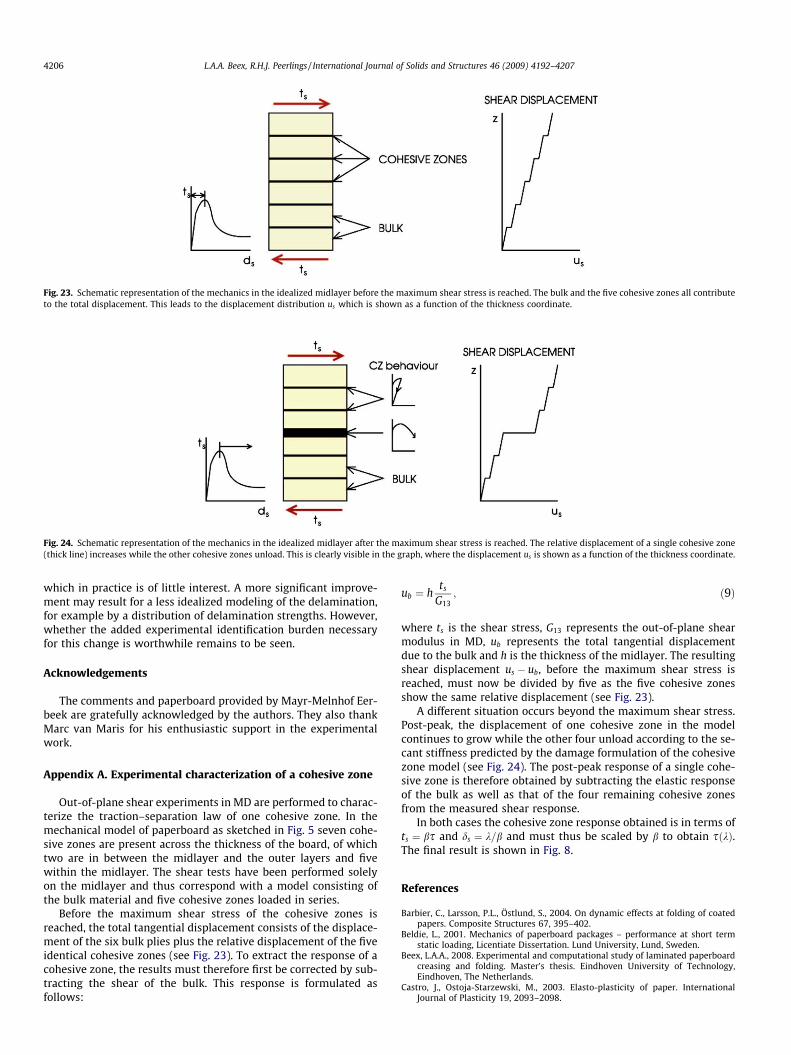
Fig. 23. Schematic representation of the mechanics in the idealized midlayer before the maximum shear stress is reached. The bulk and the five cohesive zones all contributeto the total displacement. This leads to the displacement distribution us which is shown as a function of the thickness coordinate.
Fig. 24. Schematic representation of the mechanics in the idealized midlayer after the maximum shear stress is reached. The relative displacement of a single cohesive zone(thick line) increases while the other cohesive zones unload. This is clearly visible in the graph, where the displacement us is shown as a function of the thickness coordinate.
4206 L.A.A. Beex, R.H.J. Peerlings / International Journal of Solids and Structures 46 (2009) 4192–4207
which in practice is of little interest. A more significant improve-ment may result for a less idealized modeling of the delamination,for example by a distribution of delamination strengths. However,whether the added experimental identification burden necessaryfor this change is worthwhile remains to be seen.
Acknowledgements
The comments and paperboard provided by Mayr-Melnhof Eer-beek are gratefully acknowledged by the authors. They also thankMarc van Maris for his enthusiastic support in the experimentalwork.
Appendix A. Experimental characterization of a cohesive zone
Out-of-plane shear experiments in MD are performed to charac-terize the traction–separation law of one cohesive zone. In themechanical model of paperboard as sketched in Fig. 5 seven cohe-sive zones are present across the thickness of the board, of whichtwo are in between the midlayer and the outer layers and fivewithin the midlayer. The shear tests have been performed solelyon the midlayer and thus correspond with a model consisting ofthe bulk material and five cohesive zones loaded in series.
Before the maximum shear stress of the cohesive zones isreached, the total tangential displacement consists of the displace-ment of the six bulk plies plus the relative displacement of the fiveidentical cohesive zones (see Fig. 23). To extract the response of acohesive zone, the results must therefore first be corrected by sub-tracting the shear of the bulk. This response is formulated asfollows:
ub ¼ hts
G13; ð9Þ
where ts is the shear stress, G13 represents the out-of-plane shearmodulus in MD, ub represents the total tangential displacementdue to the bulk and h is the thickness of the midlayer. The resultingshear displacement us � ub, before the maximum shear stress isreached, must now be divided by five as the five cohesive zonesshow the same relative displacement (see Fig. 23).
A different situation occurs beyond the maximum shear stress.Post-peak, the displacement of one cohesive zone in the modelcontinues to grow while the other four unload according to the se-cant stiffness predicted by the damage formulation of the cohesivezone model (see Fig. 24). The post-peak response of a single cohe-sive zone is therefore obtained by subtracting the elastic responseof the bulk as well as that of the four remaining cohesive zonesfrom the measured shear response.
In both cases the cohesive zone response obtained is in terms ofts ¼ bs and ds ¼ k=b and must thus be scaled by b to obtain sðkÞ.The final result is shown in Fig. 8.
References
Barbier, C., Larsson, P.L., Östlund, S., 2004. On dynamic effects at folding of coatedpapers. Composite Structures 67, 395–402.
Beldie, L., 2001. Mechanics of paperboard packages – performance at short termstatic loading, Licentiate Dissertation. Lund University, Lund, Sweden.
Beex, L.A.A., 2008. Experimental and computational study of laminated paperboardcreasing and folding. Master’s thesis. Eindhoven University of Technology,Eindhoven, The Netherlands.
Castro, J., Ostoja-Starzewski, M., 2003. Elasto-plasticity of paper. InternationalJournal of Plasticity 19, 2093–2098.
L.A.A. Beex, R.H.J. Peerlings / International Journal of Solids and Structures 46 (2009) 4192–4207 4207
Chandra, N., Li, H., Shet, C., Ghonem, H., 2002. Some issues in the application ofcohesive zone models for metal–ceramic interfaces. International Journal ofSolids and Structures 39, 2827–2855.
Choi, D.D., Lavrykov, S.A., Ramarao, B.V., 2007. Simulation studies of delaminationeffects in the scoring and folding of paperboard. In: Proceedings: 61st AppitaAnnual Conference and Exhibition, Gold Coast, Australia, 6–9 April 2006.Carlton, Vic., Appita Inc., pp. 209–216.
Hill, R., 1950. Mathematical Theory of Plasticity. Cardon Press, Oxford, UnitedKingdom.
Isaksson, P., Hägglund, R., Gradin, P., 2004. Continuum damage mechanics appliedto paper. International Journal of Solids and Structures 41, 4731–4755.
Isaksson, P., Hägglund, R., 2005. A mechanical model of damage and delamination ofcorrugated board during folding. Engineering Fracture Mechanics 72, 2299–2315.
Karafillis, A.P., Boyce, M.C., 1993. A general anisotropic yield criterion using boundsand a transformation weighting tensor. Journal of the Mechanics and Physics ofSolids 41, 1859–1882.
Mäkelä, P., Östlund, S., 2003. Orthotropic elastic–plastic material model forpaper materials. International Journal of Solids and Structures 40, 5599–5620.
Nagasawa, S., Fukuzawa, Y., Yamaguchi, T., Tsukatani, S., Katayami, I., 2003.Effect of crease depth and crease deviation on folding deformationcharacteristics of coated paperboard. Journal of Materials ProcessingTechnology 140, 157–162.
Ortiz, M., Pandolfi, A., 1999. Finite-deformation irreversible cohesive elements forthree-dimensional crack-propagation analysis. International Journal ofNumerical Methods in Engineering 44, 1267–1282.
Ramberg, W., Osgood, W.R., 1943. Description of Stress–Strain Curves by ThreeParameters, Technical Note No. 902, NACA (National Advisory Committee forAeronautics).
Savolainen, A., 1998. Paper and Paperboard Converting, Finnish Paper Engineers’Association. Fapet Oy, Jyväskylä, Finland.
Sawyer, J.P.G., Jones, R., MacKinlay, P.R., 1998. A unified constitutive theory forpaper. Composite Structures 42, 93–100.
Stenberg, N., 2003. A model for the through-thickness elastic–plastic materialbehaviour of paper. International Journal of Solids and Structures 40, 7483–7498.
Thakkar, B.K., Gooren, L.G.J., Peerlings, R.H.J., Geers, M.G.D., 2008. Experimental andnumerical investigation of creasing in corrugated paperboard. PhilosophicalMagazine 88, 3299–3310.
Van den Bosch, M.J., Schreurs, P.J.G., Geers, M.G.D., 2007. A cohesive zone model forwith a large deformation formulation accounting for interfacial fibrilation.European Journal of Mechanics A/Solids 26, 1–19.
Van Hal, B.A.E., Peerlings, R.H.J., Geers, M.G.D., Sluis van der, O., 2007. Cohesive zonemodeling for structural integrity analysis of IC interconnects. MicroelectronicsReliability 47, 1251–1261.
Xia, Q.S., Boyce, M.C., Parks, D.M., 2002. A constitutive model for the anisotropicelastic–plastic deformation of paper and paperboard. International Journal ofSolids and Structures 39, 4053–4071.
Xia, Q.S., 2002. Mechanics of inelastic deformation and delamination in paperboard,Ph.D. thesis. Massachusetts Institute of Technology, Massachusetts, UnitedStates of America.
Xu, X.P., Needleman, A., 1993. Void nucleation by inclusion debonding in a crystalmatrix. Modelling and Simulation in Materials Science and Engineering 1, 111–132.
Related Documents