ISSN: 0976-6669 International Journal of Management Research Volume 4, Number 1 & 2 December 2013 Editor Dr. D. K. Malhotra, Philadelphia University (USA) Managing Editor Dr. Srirang Jha, Apeejay School of Management, New Delhi (India) Assistant Editors Dr. Garima Mittal, Apeejay School of Management, New Delhi (India) Dr. Amiya Kumar Mohapatra, Apeejay School of Management, New Delhi (India) Editorial Advisory Board Dr. Russel Kershaw, Clark H. Byrum School of Business, Marain University, Indiana (USA) Dr. Vivek Bhargava, Alcorn State University, Missisippi (USA) Dr. Mukesh Chaturvedi, Birla Institute of Management Technology, Gr. Noida (India) Dr. Lloyd Russow, Philadelphia University, Philadelphia (USA) Dr. C. P. Gupta, University of Delhi, Delhi (India) Dr. Rashmi Malhotra, Saint Joseph’s University, Philadelphia (USA) Dr. Rand Martin, Bloomsburg University, Pennsylvania, (USA) Dr. Alok Saklani, Apeejay School of Management, New Delhi (India) Dr. Shailendra Singh, Indian Institute of Management, Lucknow (India) Dr. D. P. S. Verma, Formerly with University of Delhi, Delhi (India) Dr. Narender Singh, Formerly with Institute of Technology Management (India) Dr. Harish Chandra Chaudhary, Banaras Hindu University, Varanasi (India)

Welcome message from author
This document is posted to help you gain knowledge. Please leave a comment to let me know what you think about it! Share it to your friends and learn new things together.
Transcript
ISSN: 0976-6669
International Journal of Management Research Volume 4, Number 1 & 2 December 2013
Editor Dr. D. K. Malhotra, Philadelphia University (USA) Managing Editor Dr. Srirang Jha, Apeejay School of Management, New Delhi (India) Assistant Editors Dr. Garima Mittal, Apeejay School of Management, New Delhi (India) Dr. Amiya Kumar Mohapatra, Apeejay School of Management, New Delhi (India) Editorial Advisory Board Dr. Russel Kershaw, Clark H. Byrum School of Business, Marain University, Indiana (USA) Dr. Vivek Bhargava, Alcorn State University, Missisippi (USA) Dr. Mukesh Chaturvedi, Birla Institute of Management Technology, Gr. Noida (India) Dr. Lloyd Russow, Philadelphia University, Philadelphia (USA) Dr. C. P. Gupta, University of Delhi, Delhi (India) Dr. Rashmi Malhotra, Saint Joseph’s University, Philadelphia (USA) Dr. Rand Martin, Bloomsburg University, Pennsylvania, (USA) Dr. Alok Saklani, Apeejay School of Management, New Delhi (India) Dr. Shailendra Singh, Indian Institute of Management, Lucknow (India) Dr. D. P. S. Verma, Formerly with University of Delhi, Delhi (India) Dr. Narender Singh, Formerly with Institute of Technology Management (India) Dr. Harish Chandra Chaudhary, Banaras Hindu University, Varanasi (India)

International Journal of Management Research, Vol. 4, No. 1 & 2 December 2013
2
International Journal of Management Research (IJMR) is a peer-reviewed biannual journal published jointly by Apeejay School of Management, New Delhi (India) and Philadelphia University, Philadelphia (USA). IJMR is published in June and December every year. IJMR aims at providing an intellectual platform for high quality research encompassing all the sub-domains of Management. In the process, as a joint academic initiative, it would not only cause dissemination of knowledge across the world but also foster collaborative research. Poised to nurture creativity, innovation and forward-looking management practices it aspires to improve the quality of life of people across the globe. Subscription Rate (Overseas)
Subscription Period
Institutional Subscription
Institutional Subscription
with Shipping Charges
Individual Subscription
Individual Subscription
with Shipping Charges
1 Year $ 50 $ 55 $20 $ 25
2 Years $ 90 $ 100 $ 35 $ 45
3 Years $ 120 $ 135 $ 40 $ 55
Subscription Rate (Domestic)
Subscription Period Institutional Subscription for India
Individual Subscription for India
1 Year Rs. 800.00 Rs. 300.00
2 Years Rs. 1500.00 Rs. 500.00
3 Years Rs. 2000.00 Rs. 700.00
Editorial & Subscription Enquires: [email protected] © Apeejay School of Management, New Delhi (India) (2011) All rights reserved. No part of this publication can be reproduced without written permission of the Editor/Publisher except for purpose of quotes in research papers. Disclaimer: The views expressed in the articles/reviews are those of the contributors and not necessarily of the Editorial Board or Apeejay Education Society/Philadelphia University. Articles/reviews are published in good faith and the contributors will be liable for any copyright infringements. Published by the Director, Apeejay School of Management, Sector 8, Institutional Area, Dwarka, New Delhi –110077.
International Journal of Management Research, Vol. 4, No. 1 & 2 December 2013
3
Contents
Editorial 4-5 Corporate Governance Practices in the Fashion and Retail Industry in the United States Nioka Wyatt, Natalie W. Nixon & D. K. Malhotra 6-21 Institutional Theory and the Evolution of Marketing Channels in Emerging Economies: Setting a Research Agenda Birud Sindhav 22-28 Towards a Model for Adoption of Green IS Practices Babita Gupta & G. P. Sahu 29-42 Decoding Wellbeing-Oriented Business Model of Fabindia Sunita Gupta Konwar 43-53 Impact of Quality of Work-Life on Employee Trust Shivani Agarwal, Pooja Garg & Renu Rastogi 54-65 Monthly Effect in Stock Market Returns and Volatility: Evidences from Indian Stock Market Sunita Mehla & S. K. Goyal 66-78
International Journal of Management Research, Vol. 4, No. 1 & 2 December 2013
4
Editorial
We are happy to present Volume 4 of International Journal of Management Research, which is a collaborative publication of Apeejay School of Management and Philadelphia University, USA. In this issue, we are publishing six research papers on various aspects of contemporary management practices. Themes of the selected research papers are quite diverse but relevant for the contemporary management discourses. Nioka Wyatt, Natalie W. Nixon & D. K. Malhotra have meticulously examined in recent trends in corporate (mis-)governance in the fashion and apparel industry in their research paper titled ‘Corporate Governance Practices in the Fashion and Retail Industry in the United States’. They have carefully looked into board issues, audit committees, poison pills, and executive compensation as tools to evaluate the quality of corporate governance among fashion firms in the United States. Birud Sindhav has examined the evolution of marketing institutions in emerging markets in his article titled ‘Institutional Theory and the Evolution of Marketing Channels in Emerging Economies: Setting a Research Agenda’. Marketing scholars and professionals typically rely on models and theories devised in the developed economies to study the marketing channels in emerging economies, and these include theories based on political economy-based frameworks that emphasize power and dependence. In this paper the author argues that often the institutional drives to gain legitimacy provide a powerful lens to understand the evolution of marketing channels and thus provides a framework for research agenda for the future. Babita Gupta & G. P. Sahu have examined the significant factors that facilitate adoption of environmentally-friendly IS practices in organizational context in their research paper titled ‘Towards a Model for Adoption of Green IS Practices’. This research paper is primarily based on Technology-Organization-Environment theory framework which considers such factors as relative advantage/usefulness, compatibility, complexity, observability, technology competence/IT Support, organizational context/ corporate social responsibility, environmental context/partners readiness, cost involved, competitive pressure, top management attitude, government framework (strategy/policy), customer/stakeholders/investors attitude, and skilled manpower. Sunita Gupta Konwar has presented an incisive account of well-being oriented business model practiced by Fabindia in her case-based article titled ‘Decoding Wellbeing-Oriented Business Model of Fabindia’. Fabindia’s unique business model - with a mission to provide work and employment to India’s skilled rural artisans and thus protect traditional weaving and printing skills – has led to its enormous growth and expansion. This research paper provides practical insight into developing social entrepreneurship in the 21st century especially in the developing countries. Shivani Agarwal, Pooja Garg & Renu Rastogi have examined the quality of work-life and level of employee trust in the organizations in their empirical research titled ‘Impact of Quality

International Journal of Management Research, Vol. 4, No. 1 & 2 December 2013
5
of Work-Life on Employee Trust’. The authors have prodded the effect of quality of work-life on core dimensions of trust such as cognition-based trust and affect-based trust. Sunita Mehla & S. K. Goyal have investigated seasonality in the stock returns and volatility in Indian stock market by using close monthly return data on three selected indices of Bombay Stock Exchange in their empirical research titled ‘Monthly Effect in Stock Market Returns & Volatility: Evidence from Indian Stock Market’. The data has been analyzed using GARCH (1, 1) model on returns and conditional variance (volatility) by introducing intercept in the dummy variables. The study indicates that month of the year anomaly is absent in returns of all the three indices of BSE. Therefore, the weak form of efficiency shows its presence in the returns of Indian stock market and thus it cannot be out-performed by the investors. Readers are invited to send their comments on the published research papers and contribute original empirical/theoretical/conceptual papers for the forthcoming issues of the journal.
–Editors
International Journal of Management Research, Vol. 4, No. 1 & 2 December 2013
6
Corporate Governance Practices in the Fashion and Retail Industry in the United States
Nioka Wyatt, Natalie W. Nixon & D. K. Malhotra
School of Business Administration, Philadelphia University, Philadelphia Email: [email protected], [email protected], [email protected]
Abstract
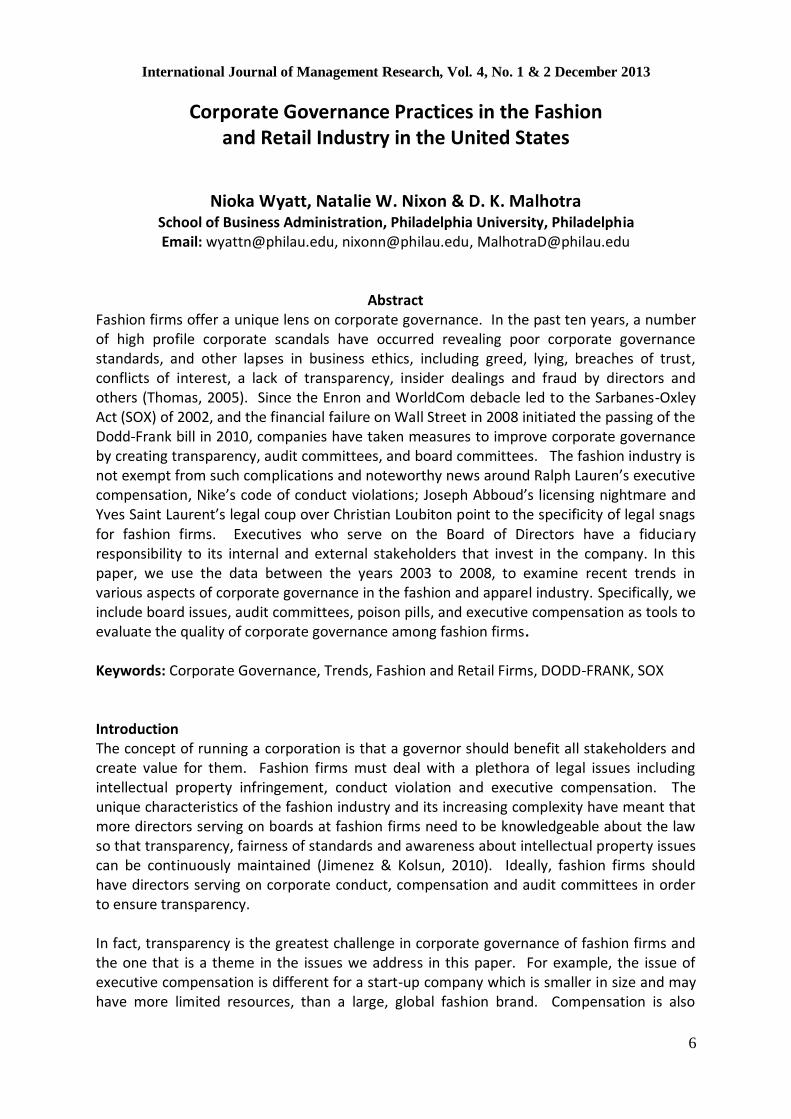
Fashion firms offer a unique lens on corporate governance. In the past ten years, a number of high profile corporate scandals have occurred revealing poor corporate governance standards, and other lapses in business ethics, including greed, lying, breaches of trust, conflicts of interest, a lack of transparency, insider dealings and fraud by directors and others (Thomas, 2005). Since the Enron and WorldCom debacle led to the Sarbanes-Oxley Act (SOX) of 2002, and the financial failure on Wall Street in 2008 initiated the passing of the Dodd-Frank bill in 2010, companies have taken measures to improve corporate governance by creating transparency, audit committees, and board committees. The fashion industry is not exempt from such complications and noteworthy news around Ralph Lauren’s executive compensation, Nike’s code of conduct violations; Joseph Abboud’s licensing nightmare and Yves Saint Laurent’s legal coup over Christian Loubiton point to the specificity of legal snags for fashion firms. Executives who serve on the Board of Directors have a fiduciary responsibility to its internal and external stakeholders that invest in the company. In this paper, we use the data between the years 2003 to 2008, to examine recent trends in various aspects of corporate governance in the fashion and apparel industry. Specifically, we include board issues, audit committees, poison pills, and executive compensation as tools to evaluate the quality of corporate governance among fashion firms. Keywords: Corporate Governance, Trends, Fashion and Retail Firms, DODD-FRANK, SOX
Introduction The concept of running a corporation is that a governor should benefit all stakeholders and create value for them. Fashion firms must deal with a plethora of legal issues including intellectual property infringement, conduct violation and executive compensation. The unique characteristics of the fashion industry and its increasing complexity have meant that more directors serving on boards at fashion firms need to be knowledgeable about the law so that transparency, fairness of standards and awareness about intellectual property issues can be continuously maintained (Jimenez & Kolsun, 2010). Ideally, fashion firms should have directors serving on corporate conduct, compensation and audit committees in order to ensure transparency. In fact, transparency is the greatest challenge in corporate governance of fashion firms and the one that is a theme in the issues we address in this paper. For example, the issue of executive compensation is different for a start-up company which is smaller in size and may have more limited resources, than a large, global fashion brand. Compensation is also

International Journal of Management Research, Vol. 4, No. 1 & 2 December 2013
7
treated differently for those fashion firms that are private versus those that are publicly held. Additionally, press reports have recently highlighted the total compensation of Ralph Lauren, the founder, chairman and chief executive officer of Polo Ralph Lauren Corp. In 2010, increases in his stock options were responsible for a 7% boost to his overall compensation to just over $29 million (Karr, 2011). While his base salary remained unchanged at $1.25 million, details of the compensation document highlight the fortuitousness of sound legal counsel for Ralph Lauren, given that his is an industry fraught with bad press about disparity in compensation between the executive ranks and the common worker. Such a high compensation could be called into question and thus transparency, which only comes from sound legal guidance and oversight committees, is essential (Heide, 2011; Traub, 2011). There are three major characteristics unique to the fashion industry which makes the issues around corporate governance particularly interesting. These include its 1) global nature, 2) the legacy of a “mom-and-pop” family business culture in some firms, and 3) the challenges of scaling up (Heide, 2011; Traub, 2011). First, apparel fashion firms are part of a complex international value chain and supply chain, where public policies and laws spanning multiple countries must be adhered to in order for the execution of manufacturing, sourcing, branding and retail initiatives to succeed. Second, many fashion firms- both large and established ones as well as small and emerging ones- started as family run businesses, where documentation of procedures and allowances was not necessarily objective, formalized or consistently maintained. As a result, a lack of clarity exists in such cases, such that when an external legal advisor attempts to assist with a problem there is very little recourse. Additionally, the cost of setting up and managing all of the legal protocol is expensive for the smaller and less-financially endowed fashion firms. Third, there are issues around strategy and execution for fashion firms when they are ready to expand through scale and scope. For example, one of the most popular ways that fashion firms expand internationally is through licensing. Licensing must be carefully managed in order to avoid dilution of brand value and to vet laws around ownership of licenses to avoid loss of brand control in the manufacturing country. In this paper we have surveyed a number of fashion and apparel firms to identify the most common types of oversight committees and develop models of boundaries that fashion firms use to establish transparency in corporate governance. This study examines the most recent developments in corporate governance in the fashion industry. In section II, we discuss previous studies on various aspects of corporate governance. We use previous studies to postulate the pillars of corporate governance in section IV. In section V, we discuss our data sources and an empirical analysis of the recent trends in corporate governance and section V summarizes and concludes our study. Literature Review Previous scandals in the fashion industry at Nike Inc., Gap Inc., Wal-Mart, and Levi’s have prompted the industry to adopt models of corporate practices to sustain the organizational structure of the company. Studies on corporate governance have focused on board of directors, executive compensation, audit related issues, takeover defenses and corporate social responsibility. When the Sarbanes-Oxley Act (SOX) went into effect in 2002, it prompted corporations to standardize and update their procedures for documentation
International Journal of Management Research, Vol. 4, No. 1 & 2 December 2013
8
compliance. Although the SOX is a key focus for many organizations, private, public and nonprofit organizations are expanding their risk management efforts into areas such as holistic risk assessments, company-level governance programs and executive risk management training (Meiselman, 2007). While SOX was implemented because of Enron, WorldCom, Tyco and other financial scandals, the DODD-FRANK Act was enacted into legislation because of the financial meltdown in 2008. The fairly new Dodd-Frank Wall Street Reform and Consumer Protection Act (“Dodd-Frank Act”) was signed into law in July 2010 and is the latest doctrine supported by President Barack Obama. The purpose of the bill is to protect consumer’s rights, highlight rules for executive compensation, and whistle blowing. As an extension of SOX, DODD-FRANK has resulted in changes to the regulatory framework, operations and supervision of the financial services industry. A few of these changes include the new Financial Stability Oversight Council, the new Consumer Financial Protection Bureau, and a new mechanism for seizing and liquidating large financial companies on the verge of failure. (Wilmarth, 2011). Meiselman (2007) reported that one of the methods that senior management will implement is to identify formal training programs for internal audit committees. Meiselman (2007) also stated that the newly issued Committee of Sponsoring Organizations (COSO) Internal Control over Financial Reporting will conduct a comprehensive fraud risk assessment to identify the various ways that fraud and misconduct can occur. Initially, COSO was for small public companies, however, larger and non-profit organizations will adopt the principles of COSO by creating online self-study programs and integrated framework presentations at board meetings and formal classroom training. When corporate fraud occurs, enforcement can come from multiple sources, including the Securities Exchange Commission (SEC), state and federal prosecutors, and class-action lawsuits by private plaintiffs. Several titles of SOX strengthen the SEC’s ability to obtain meaningful remedies, expand its authorities and add new criminal sanctions to the SEC’s enforcement arsenal including (Marden and Edwards, 2005):
The Corporate Responsibility Act (Title MI)
The Corporate and Criminal Fraud Accountability Act (Title VIII)
The White-Collar Crime Penalty Enhancement Act of 2002 ( Title IX)
The Corporate Fraud Responsibility Act (Title III) Nakano (2007) has posited trends in the ethical enigma of corporate governance. Arguments were actually put forward for the need to create an ethical organizational culture in America from the mid-1990s onwards. These arguments began when people started to realize that even though business ethics systems had been created at most major companies, these systems did not necessarily function effectively within those organizations. Shortridge and Yu (2011) define control systems as a group of principles and processes that result in an environment which encourages executives, managers, and employees to focus on value creation for company owners and other stakeholders. The researchers find that high-quality corporate governance helps assure shareholders that executives make choices to maximize owners' interests when creating management control systems. The audit committee is responsible for providing oversight of the financial reporting process and

International Journal of Management Research, Vol. 4, No. 1 & 2 December 2013
9
internal controls, and managing the relationship with the external auditor. In a recent study by Zheng and Cullinan (2010), they found that the size and independence of audit committees is associated with positive outcomes, such as financial reporting quality. The Shortridge-Yu study reports that the three main themes necessary for developing good corporate governance and management control systems include: (1) the independence of the board, (2) the attentiveness of the board and (3) the quality of the audit committee. Further, for management control systems to work efficiently, it's necessary for the board of directors to be actively involved in establishing the tone and culture of the organization through strong corporate governance practices. On the other hand, Zhao (2006) notes that anti-takeover provisions such as classified boards, poison pills1, and golden parachutes2 insulate managers from external market control while reducing shareholders’ chances of receiving valuable takeover offers and introducing more efficient management teams. An agency relationship exists between the two parties whenever one party (the principal) delegates decision making authority to another (the agent). Zhao also studied the agency theory which focuses on the effectiveness of the control mechanisms that align the interests of principals and agents. One of the challenges of implementing corporate governance is moving from silo to holistic programs. Integrating sustainable governance structures begins with the support and leadership of upper management. The type of leadership should conform to what would make organizations more responsive to society’s requirements (Shahin and Zairi, 2007). According to Wilson (2000), new rules of corporate conduct should include legitimacy, governance, ethics, equity, environment, employment and public/private sector relationships. Due to the number of allegations against fashion companies accused of engaging in child labor and sweatshops, Wilson’s rules could support not only corporate governance structures, but could also infuse a model for holistic corporate sustainability practices at fashion companies. Studies reveal that major retailers no longer own manufacturing facilities but contract with multiple suppliers, usually in less developed countries (LDCs), and often play them against each other to achieve the best price, highest quality, and quickest delivery (Lim and Phillips, 2007). As the supply chain is extended through multiple resources, selecting the appropriate leadership, authority structure, partnerships and codes of conduct are integral to corporate governance structures. Over the past few years, companies such as Nike have implemented activities of Corporate Social Responsibility (CSR) and Codes of Conduct that serve as guidelines for factories and employees to follow. The first significant CSR critique of Nike’s suppliers appeared in a 1992 Harper’s Monthly article by Jeff Ballinger, the country Program Director for the Asian-American Free Labor Institute in Indonesia (Ballinger, 1992). Nike had to face labor activists accusing them of contributing to child labor. As a result, a series of code of conduct directives were developed to facilitate CSR and to highlight their fiduciary responsibility to stakeholders. Recognizing the need for public relations management, Nike distributed its initial Codes of Conduct Memorandum of Understanding in 1992 (Lim and Phillips, 2007).

International Journal of Management Research, Vol. 4, No. 1 & 2 December 2013
10
Miles et al. (2006) argue that strategic conversations and collaboration with stakeholders are a fundamental mechanism for better shaping and integrating CSR in the companies’ strategic intent. The researchers discussed a three stage module of postures3 that could create consistency in outlining factors of change for managers and researchers in analyzing the current situation of firms and helping firms to further develop CSR. CSR is seen as a tool to protect reputational value. In the risk management posture, firms start to develop the first technologies to measure and control environmental and societal issues. While technology serves as a driver for CSR, audit programs, codes of conduct, measurement systems and CSR-specific policies are also key trends in corporate governance (Castello and Lozano, 2009). Our research highlights recent trends in corporate governance practices in the fashion industry in the United States which includes a series of models and illustrations. We extend previous studies on corporate governance by analyzing the recent trends in various aspects of governance in the fashion and retail industry using available data between the years 2003 to 2008. Empirical Analysis Based on previous studies and Dodd-Frank, we can postulate that effective corporate governance is driven by the board of directors, audit committees, and takeover defenses. Figure 1 illustrates the four boundaries enclosing corporate governance. Out of the four drivers of corporate governance listed in Figure 1, previous studies on corporate governance consider the corporate board as the single most important variable that can distinguish good governance from bad governance. All other variables of corporate governance such as disclosure and transparency, financial reporting, takeover defenses, and executive compensation are to some extent dependent on the board of directors and the composition of the board. In this paper, we evaluate trends in corporate governance on the basis of the data on the four walls (or boundaries) of governance collected by Institutional Shareholder Services (ISS). ISS collects data from SEC EDGAR filings (i.e. Proxy Statement, 10K, 8K, Guideline Press Releases and Company web sites). We have compiled data on the four broad drivers of corporate governance—board of directors, audit committee, takeover defenses, and executive and director compensation between December 31, 2003 to December 31, 2008. Corporate governance begins with the establishment of a governance committee. The governance committee ensures that the company has appropriate checks and balances to avoid many of the pitfalls of doing business today. Table 1 shows the percentage of firms in the fashion industry that adopted governance committee during the period 2003 to 2008. As shown in Table 1, there was an explosion in the adoption of governance committees among fashion firms. In 2003, 58.49% of the firms did not have a governance committee. In 2008, there was a marked difference in the corporate culture on this issue with 70.33% of the firms reporting that they did have a governance committee and that it had met in the last year. The corporate board is the first and most important pillar of effective governance. Independence of the board members is the most critical aspect of effective corporate

International Journal of Management Research, Vol. 4, No. 1 & 2 December 2013
11
governance. Directors with ties to management may be less willing and less able to effectively evaluate and scrutinize company strategy and performance. Furthermore, boards without adequate independence from management may have inherent conflicts of interest. The first step toward board independence is the nomination of directors on the board. Director independence and improved corporate governance can be ensured if directors are nominated by a committee that consists of independent external directors. Table 2 shows that the percentage of fashion firms that use nominating committees consisting solely of independent external directors had gone up by slightly less than three folds from about 26% in 2003 to 72% in 2008. Also, in 2003, 43% of the firms did not have a nominating committee, but in 2008 this percentage declined to 15.31%. Similarly, the percentage of firms with insiders on the nominating committee has gone down significantly in 2008.
Another variable that impacts the quality of governance is embedded in representation of external directors on the board. We analyze the representation of outside directors on the board based on the following criteria:
A majority of independent external directors (50% < IO <= 66.7%)
A supermajority of independent external directors (66.7% < IO <= 75%)
A supermajority of independent external directors (75% < IO <= 90%)
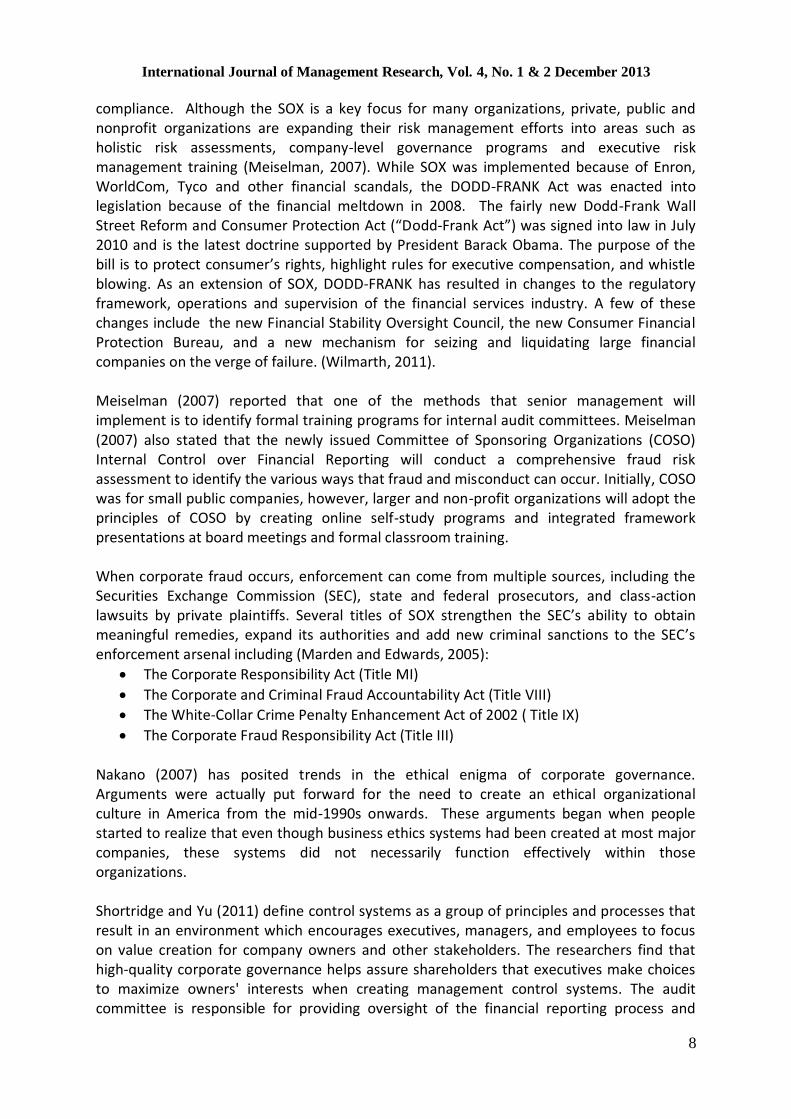
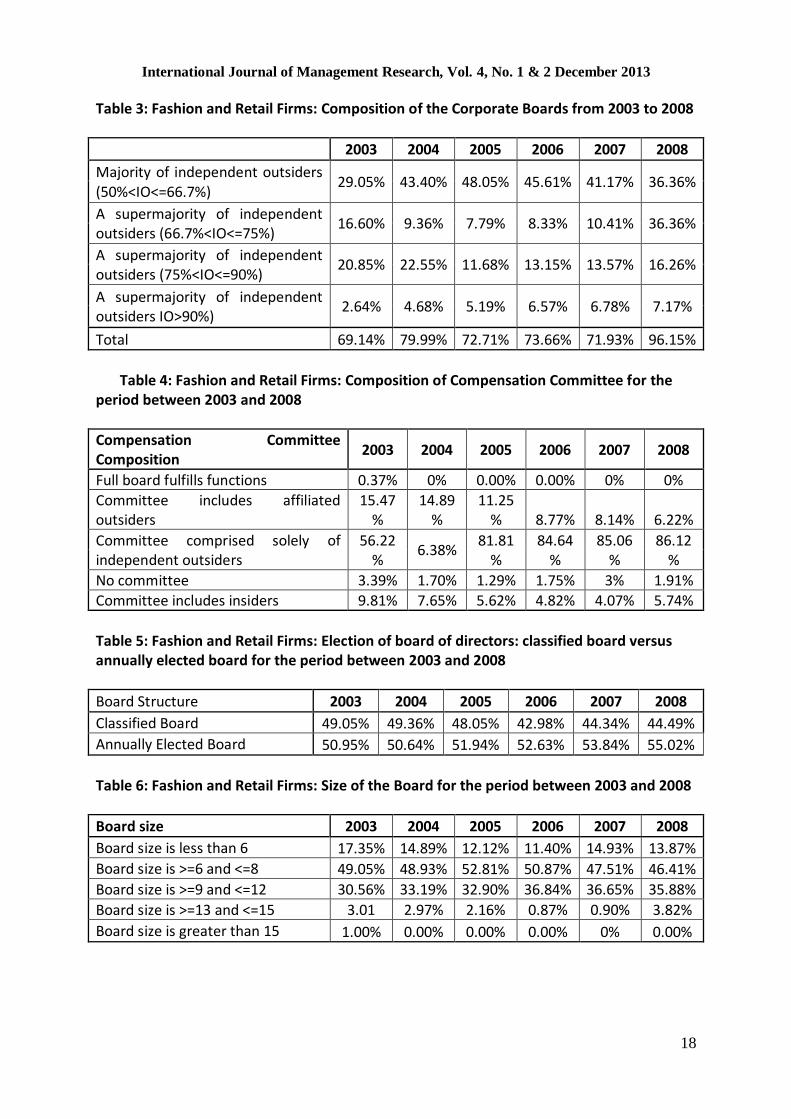
A supermajority of independent external directors (IO > 90%) Table 3 shows that the majority of firms in the fashion and retail industry ranging from 69% in 2003 to 96% in 2008 have more than 50% of their directors serving as external directors. The percentage of outside directors increased significantly from 69.14% in 2003 to 79.99% in 2004. However, there is a significant drop in the percentage of firms that have more than 50% outside directors in 2005 and the percentage continues to decline in 2006, 2007. In 2008, there is a huge increase in the percentage of fashion and retail firms that have more than 50% of their directors as outside directors. There is a significant increase in the supermajority of independent outsiders (more than 90%) that served on corporate boards from 2.64% in 2003 to 7.17% in 2008. Executive compensation is another important issue relating to governance in fashion and retail firms. Therefore, the board committee that determines the executive compensation should consist of independent directors. There has been a significant improvement in this area. Table 4 shows that more than 86% of the firms have a committee that consists of independent external directors to decide on the executive compensation.
The board structure committee reviews how the board is elected. For example, “Are they elected annually or in a classified manner?” A firm that has a classified board is one in which directors are divided into 3 classes, with each class serving a three year term. Each class is on a different re-election cycle. Annually-elected boards are comprised entirely of members who serve one year terms and each member stands for election each year. It is more difficult to change the control of a company with a classified board because only a minority of directors is elected each year. Usually, annual election boards receive better governance grades in comparison to the classified method of electing board members.

International Journal of Management Research, Vol. 4, No. 1 & 2 December 2013
12
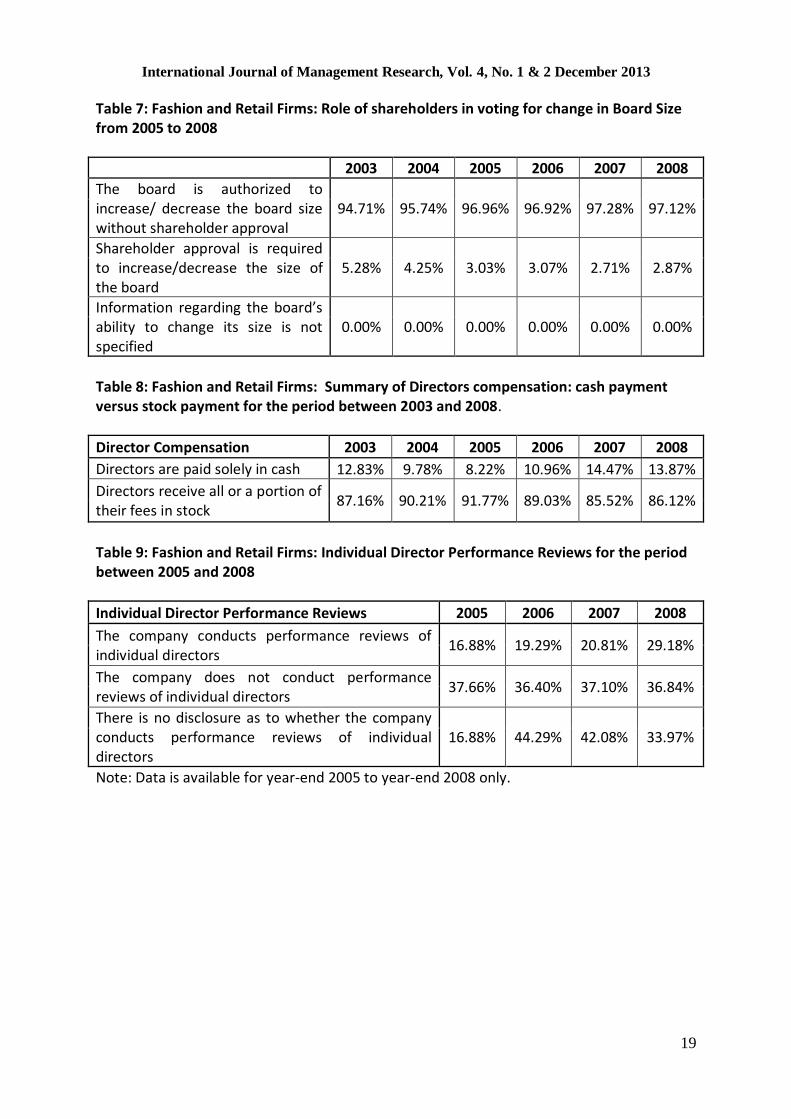
As shown in Table 5, the annual election of board members, an indicator of good governance, has been gaining popularity since 2003. In the year 2003, 50.95% of the fashion companies surveyed had board members annually elected and 49.05% members were elected through a classified process. This number increased slightly in 2008 with 55.02% of the companies following annual election of board members. This is consistent with the reporting of The Wall Street Journal that shareholders are pressuring boards of directors to declassify board elections and move towards annually elected boards4. The board size represents the number of directors serving on the board. Boards that become too large may find it difficult to effectively conduct the business of the board. On the other hand, if the board is too small, they may lack the necessary skills to fulfill all the responsibilities. Table 6 shows that more than 70 percent of the firms in our sample have maintained a board size in the range of 6 to 12 board members. The size of boards is getting slightly bigger with 31.30% of the firms reporting a board size between 9 and 12 in 2008 in contrast to 28.27% of the firms in 2003. There is also a small increase in the percentage of firms with a board size between 13 and 15. The percentage of firms with a board size less than 8 (considered too small) and a board size of more than 15 (considered too large) is on the decline. In an effective governance environment, shareholders should have the right to vote to make changes (expand or contract the size of the board) in the board. More than 95 percent of fashion firms do not require shareholder approval to make changes in the board size. Table 7 shows that the percentage of firms that required shareholder approvals to make changes in board size has gone down significantly from 3.03 percent in 2005 to 2.87 percent in 2008. Table 8 shows that a review of director compensation shows that the percentage of firms paying directors in cash has gone up and payment of directors’ fees in stock has gone down from 2003 to 2008. Similarly, as shown in Table 9, fashion firms that conduct an annual review of directors performance has also gone up significantly from 2005 and at the same time, the percentage of firms that did not engage in any disclosure as to whether the company conducts performance reviews doubled since 2005. Another important aspect of corporate governance relates to the role of internal and external auditors. Audit variables include evaluation along the following lines:
Audit Committee
Audit Fees
Auditor Rotation
Auditor Ratification Table 10 shows that about 94% of the retail and fashion firms in 2008 had an audit nominating committee represented solely by independent outsiders. This is a significant improvement since 2003 when only 64.15% of the firms had committee comprised solely of independent outsiders. Therefore, companies are realizing the significance of independent audit committees in corporate governance.
In order to maintain the independence of the auditors, consulting fees should be less than the audit fees. Are shareholders permitted to ratify the selection of auditors? The entire audit committee should consist of financial experts who understand the financial issues. In

International Journal of Management Research, Vol. 4, No. 1 & 2 December 2013
13
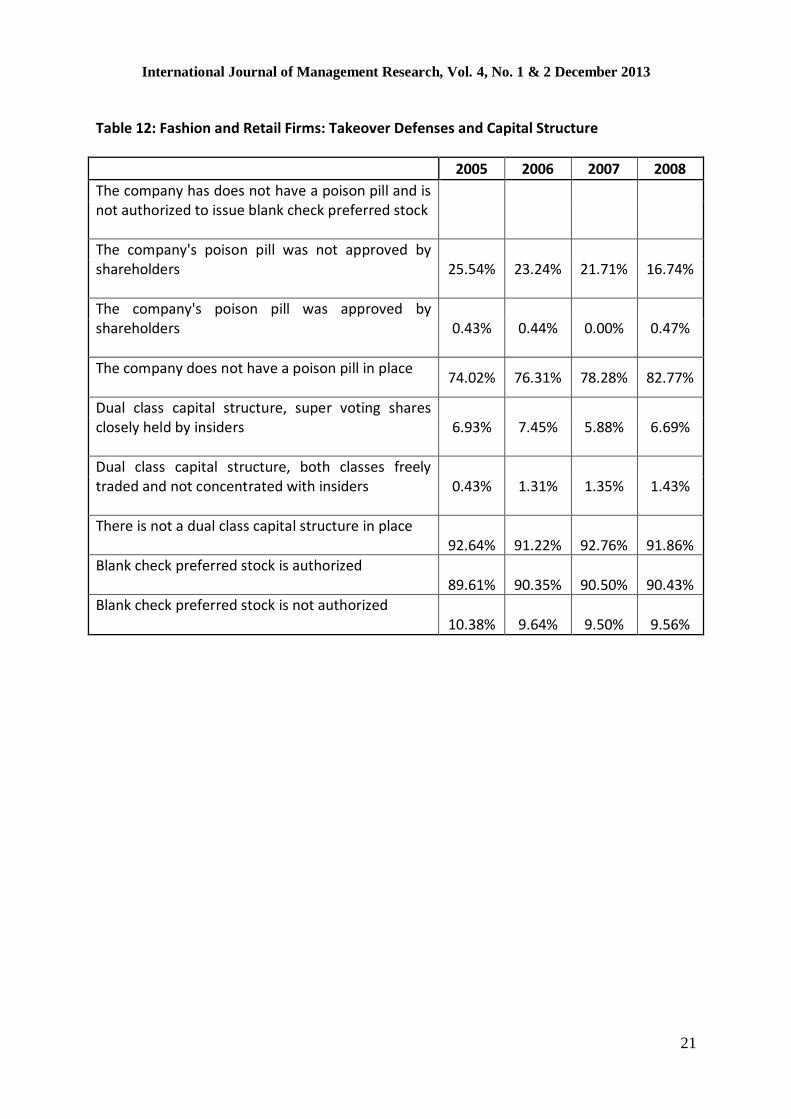
2008, more than 99% of the fashion firms were maintaining independence of the auditors by paying less than 50% of the total fees for non-audit related issues. Also, more than 80% of the firms had auditors that were ratified at the most recent annual meeting in comparison to 66.23% in 2005. Another method to evaluate an effective governance record is to examine the adoption of poison pills and whether bylaws give power to management to amend the charter without shareholder approval. In 2005, 74.02% of the firms did not have a poison pill in place and this percentage has gone up to 82.77% in 2008. Therefore, shareholder activism was forcing management to get rid of poison pills. Investors and shareholders view tiered boards and poison pills as formidable defenses against corporate takeover maneuvers. Additional roadblocks to hostile takeovers include the prevalent practice among U.S. firms to stagger the elections of board members5. Since shareholders are forcing management to move away from classified boards and adopt more annually-elected boards, it is now easier for disgruntled shareholders to get rid of takeover defenses and wrest control of firms. However, in those cases, where poison has been adopted, the percentage of firms in which poison pill was approved by shareholders is still low at 0.47%. Companies usually protect against hostile takeovers by issuing dual class shares that have super voting power. These shares are tightly held by a controlling family or a group of investors. The risk is that these shares can be used to prevent hostile takeovers by an outsider or even by other disgruntled shareholders of the firm and may weaken governance in the firm. More than 90 percent of the retail firms do not have dual class capital structure in place and there has been a marginal increase in the percentage of firms that do not have a dual class capital structure, a sign of small improvement in corporate governance. Another tool that is used by the board to prevent hostile takeover is by issuing blank check preferred stocks. In a blank check preferred stock, the board has the authority to determine voting, dividend, conversion, and other rights. It can also be used to meet special financial needs of a firm. In 2008, about 90 percent of the firms show blank check provisions in place. Therefore, the board has the authority to issue this special class of shares without any approval from shareholders. In fact, this percentage has marginally gone up since 2005. Summary and Conclusions Fashion and retail firms continue to target board-related issues so as to advance their governance quotient. A significant majority of firms (96%) in our sample have outside directors (more than 50%) on their board and this is a considerable improvement over the previous year percentage of around 71%. With regard to the election of the board, there is only a slight change towards annual board elections instead of classified board elections. Similarly, board compensation in the form of cash payment has gone up slightly. Furthermore, with regard to takeover defenses also, the results are mixed for the fashion industry firms. While the percentage of firms that do not have a poison pill has gone up, blank check preferred stock authorization percentage is still very high and is slightly gone up. When fashion and retail firms integrate corporate governance structures, this process will increase transparency and improve the quality of communication throughout the company. In turn, shareholders and others that have a fiduciary role in the company can experience rewarding results.
International Journal of Management Research, Vol. 4, No. 1 & 2 December 2013
14
Acknowledgements The authors wish to acknowledge Nannette Heide, Partner at Duane Morris, LLP and Felicia Traub. Special Counsel at Duane Morris, LLP for participating in a telephone interview on August 12, 2011. End Notes 1 A poison pill is when a targeted company in a hostile takeover attempts to make its stock look less attractive in order to discourage the takeover. 2 A clause in a contract stating that if the company is acquired, the employee will receive large benefits such as: stock options, bonus or severance pay 3 The postures studied in Castello and Lozano’s research were: risk management, integrated posture and citizenship posture. 4 The Wall Street Journal, June 8, 2005. 5 The Wall Street Journal, June 2005 References Adams, R. & Ferreira, D. (2009). Women in the boardroom and their impact on governance
and performance. Journal of Financial Economics, 94 (2), 291-309. Ballinger, J. (1992). The new free-trade heel. Harper’s Magazine, 285 (1701). Baue, W. (2003). The key to director independence: Equal access to corporate board
elections. SRI World Group. Belkhir, M. (2009). Board structure, ownership structure and firm performance: Evidence
from banking. Applied Financial Economics, 19 (19), 1581-1593. Cadbury, A. (1999). What are the trends in corporate governance? How will they impact
your company? Long Range Planning, 32 (1), 12-19. Castello, I & Lozano¸ J. (2009). From risk management to citizenship corporate social responsibility: analysis of strategic drivers of change. Corporate Governance, 9 (4), 373-385. Causey, D. (2008). The Worth of Good Corporate Governance. Community Banker, 17
(8), 50-52. Cheeseman, H. (2006). Business Law, Prentice Hall, New Jersey. Chen, Y. & Chuang, W. (2009). Alignment or entrenchment? Corporate governance and cash
holdings in growing firms. Journal of Business Research, 62 (11), 1200-1206 Chhaochharia, V. & Grinstein, Y. (2007). The Changing structure of US corporate boards:
1997-2003. Corporate Governance: An International Review, 15 (6), 1215-1223 Desender, K. (2009). The relationship between the ownership structure and the role of the
board. SSRN Working Paper Series. Farinha, J. & Viana, L. (2009). Board structure and modified audit opinions: Evidence from
the Portuguese Stock Exchange. International Journal of Auditing, 13 (3), 237-258 Florou, A. & Pope, P. (2008). Are boards and institutional investors active monitors?
Evidence from CEO dismissal. Managerial Auditing Journal, 23 (9), 862-872 Heide, Nanette. Partner, Duane Morris, LLP. Telephone Interview. 12 August 2011. Hermalin, B. (2005). Trends in corporate governance. The Journal of Finance, 60 (5), 2351-
2384 Jackling, B. & Johl, S. (2009). Board structure and firm performance: Evidence from India's
top companies. Corporate Governance : An International Review, 17 (4), 492-509

International Journal of Management Research, Vol. 4, No. 1 & 2 December 2013
15
Jimenez, Guillermo C. and Barbara Kolsun (2010). Fashion law- A guide for designers, fashion executives and attorneys. New York: Fairchild Books.
Karr, Arnold J. (2011). Ralph Lauren pay package up 7.2%.” retrieved September 6, 2011, from http://www.wwd.com/business-news/financial/ralph-lauren-s-pay-package-up-7-2--3682132
Kaur, G. & Mishra, R. (2009). Corporate governance-regulatory & cultural issues. SSRN Working Paper Series.
Krivogorsky, V. (2006). Ownership, board structure, and performance in continental Europe. The International Journal of Accounting, 41 (2), 176-197
Leahy, J. (2009). Better governance pays off in India, S&P study finds. Financial Times, October 2, p. 20.
Lim, S., & Phillips, J. (2008). Embedding CSR values: The global footwear industry's evolving governance structure. Journal of Business Ethics, 81 (1), 143-156. Marden, R. & Edwards, R. (2005). The Sarbanes-Oxley ‘Ax’ . The CPA Journal. New York; 75 (4), 6. McCabe, M. & Nowak, M. (2008). The independent director on the board of company
directors. Managerial Auditing Journal, 23 (6), 545-566 Meiselman, J. (2007). Risk, governance and compliance trends for 2007. Risk Management, 54 (2), 40. Miles, M., Munilla, L. & Darroch, J. (2006). The role of strategic conversations with stakeholders in the formation of corporate social responsibility strategy. The Journal of Business Ethics, 69: 195-2005. Mintz, S. & Krishnan, S. (2009). A comparison of corporate governance in China and India
with the U.S. The Business Review, Cambridge, 13 (1), 60-67. Murray, A. (2007). Revolt in the boardroom: The new rules of power in corporate America.
HarperCollins, New York. Murti, B. (2005). More boards may end staggered terms. The Wall Street Journal (Eastern
Edition), June 8, p. 1. Nakano, C (2007). The significance and limitations of corporate governance from the perspectives of business ethics: Towards the creation of an ethical organizational culture. Asian Business and Management. 6 (2). O’Donovan, G. (2003). Change management – A board culture of corporate governance.
Mondaq Business Briefing, Issue 3. O'Toole, J. & Bennis, W. (2009). What's needed next: A culture of candor. Harvard Business
Review, 87 (6), 54-58. Persons, O. (2009). Audit committee characteristics and earlier voluntary ethics disclosure
among fraud and no-fraud firms. International Journal of Disclosure and Governance, 6 (4), 284-297.
Roosenboom, P. & Goot, T. (2005). The effect of ownership and control on market valuation: Evidence from initial public offerings in The Netherlands. International Review of Financial Analysis, 14(1), 43-59.
Shahin, A. & Zairi, M. (2007). Corporate governance as a critical element for driving excellence in corporate social responsibility. The International Journal of Quality Reliability Management. Bradford: 24 (7). Switzer, L. & Tang, M. (2009). The impact of corporate governance on the performance of
U.S. small-cap firms. International Journal of Business, 14 (4), 341-355. Traub, Felicia. Special Counsel, Duane Morris, LLP. Telephone Interview. 12 August 2011.

International Journal of Management Research, Vol. 4, No. 1 & 2 December 2013
16
Verschoor, C. (2006). Tyco: An ethical metamorphosis. Strategic Finance, 87: 10-15. Webb, E. (2006). Relationships between board structure and takeover defenses. Corporate
Governance, 6 (3), 268-280. Webb, E. (2008). Sarbanes-Oxley compliance and violation: An empirical study. Review of
Accounting & Finance, 7 (1), 5-23. Wegman, J. (2006). Sarbanes-Oxley: A new era of government regulation of
accountants. Allied Academies International Conference.Academy of Legal, Ethical and Regulatory Issues Proceedings, 10 (2), 35-39.
Wei, J. & Anandarajan, A. (2009). Shareholder rights, corporate governance and earnings quality :The influence of institutional investors. Managerial Auditing Journal, 24 (8), 767-791.
Wilmarth, A. E. (2011). The Dodd-Frank Act's expansion of state authority to protect consumers of financial services. Journal of Corporation Law, 36 (4), 893-893-954. Wilson, I. (2000). The new rules: Ethics, social responsibility and strategy. Strategy and
Leadership, 28, 12-16. Zheng, X. & Cullinan, C. (2010). The Compensation/ audit committee overlap and the design of compensation systems. International Journal of Disclosure and Governance, 7 ( 2), 136-152.

International Journal of Management Research, Vol. 4, No. 1 & 2 December 2013
17
Figures & Tables Figure 1: Four drivers of corporate governance
Table 1: Fashion and Retail Firms: Governance committee composition for the period between 2003 and 2008 Governance committee composition 2003 2004 2005 2006 2007 2008
Number of Firms 265 235 231 228 221 209 Governance committee exists and met in the past year
26.79% 47.08% 50.64% 64.91% 66.96% 70.33%
No governance committee or panel 58.49% 37.44% 30.30% 27.19% 26.24% 22.96% Table 2: Fashion and Retail Firms: Board of directors nominating committee composition for the period between 2003 and 2008 Nominating committee composition 2003 2004 2005 2006 2007 2008 Full board fulfills function 0% 0% 0.00% 0.00% 0% 0%
Committee includes affiliated outsiders 9.05% 14.04% 11.25% 8.33% 6.33% 7.65% Committee comprised solely of independent outsiders
26.03% 2.26% 64.06% 67.54% 71.49% 72.24%
No committee 43.01% 22.97% 20.34% 19.29% 19% 15.31%
Committee includes insiders 9.81% 5.96% 4.39% 4.82% 3.16% 4.78%
International Journal of Management Research, Vol. 4, No. 1 & 2 December 2013
18
Table 3: Fashion and Retail Firms: Composition of the Corporate Boards from 2003 to 2008
2003 2004 2005 2006 2007 2008
Majority of independent outsiders (50%<IO<=66.7%)
29.05% 43.40% 48.05% 45.61% 41.17% 36.36%
A supermajority of independent outsiders (66.7%<IO<=75%)
16.60% 9.36% 7.79% 8.33% 10.41% 36.36%
A supermajority of independent outsiders (75%<IO<=90%)
20.85% 22.55% 11.68% 13.15% 13.57% 16.26%
A supermajority of independent outsiders IO>90%)
2.64% 4.68% 5.19% 6.57% 6.78% 7.17%
Total 69.14% 79.99% 72.71% 73.66% 71.93% 96.15%
Table 4: Fashion and Retail Firms: Composition of Compensation Committee for the
period between 2003 and 2008
Compensation Committee Composition
2003 2004 2005 2006 2007 2008
Full board fulfills functions 0.37% 0% 0.00% 0.00% 0% 0%
Committee includes affiliated outsiders
15.47%
14.89%
11.25% 8.77% 8.14% 6.22%
Committee comprised solely of independent outsiders
56.22%
6.38% 81.81
% 84.64
% 85.06
% 86.12
%
No committee 3.39% 1.70% 1.29% 1.75% 3% 1.91%
Committee includes insiders 9.81% 7.65% 5.62% 4.82% 4.07% 5.74%
Table 5: Fashion and Retail Firms: Election of board of directors: classified board versus annually elected board for the period between 2003 and 2008
Board Structure 2003 2004 2005 2006 2007 2008
Classified Board 49.05% 49.36% 48.05% 42.98% 44.34% 44.49%
Annually Elected Board 50.95% 50.64% 51.94% 52.63% 53.84% 55.02%
Table 6: Fashion and Retail Firms: Size of the Board for the period between 2003 and 2008
Board size 2003 2004 2005 2006 2007 2008
Board size is less than 6 17.35% 14.89% 12.12% 11.40% 14.93% 13.87%
Board size is >=6 and <=8 49.05% 48.93% 52.81% 50.87% 47.51% 46.41%
Board size is >=9 and <=12 30.56% 33.19% 32.90% 36.84% 36.65% 35.88%
Board size is >=13 and <=15 3.01 2.97% 2.16% 0.87% 0.90% 3.82%
Board size is greater than 15 1.00% 0.00% 0.00% 0.00% 0% 0.00%
International Journal of Management Research, Vol. 4, No. 1 & 2 December 2013
19
Table 7: Fashion and Retail Firms: Role of shareholders in voting for change in Board Size from 2005 to 2008
2003 2004 2005 2006 2007 2008
The board is authorized to increase/ decrease the board size without shareholder approval
94.71% 95.74% 96.96% 96.92% 97.28% 97.12%
Shareholder approval is required to increase/decrease the size of the board
5.28% 4.25% 3.03% 3.07% 2.71% 2.87%
Information regarding the board’s ability to change its size is not specified
0.00% 0.00% 0.00% 0.00% 0.00% 0.00%
Table 8: Fashion and Retail Firms: Summary of Directors compensation: cash payment versus stock payment for the period between 2003 and 2008.
Director Compensation 2003 2004 2005 2006 2007 2008
Directors are paid solely in cash 12.83% 9.78% 8.22% 10.96% 14.47% 13.87%
Directors receive all or a portion of their fees in stock
87.16% 90.21% 91.77% 89.03% 85.52% 86.12%
Table 9: Fashion and Retail Firms: Individual Director Performance Reviews for the period between 2005 and 2008
Individual Director Performance Reviews 2005 2006 2007 2008
The company conducts performance reviews of individual directors
16.88% 19.29% 20.81% 29.18%
The company does not conduct performance reviews of individual directors
37.66% 36.40% 37.10% 36.84%
There is no disclosure as to whether the company conducts performance reviews of individual directors
16.88% 44.29% 42.08% 33.97%
Note: Data is available for year-end 2005 to year-end 2008 only.

International Journal of Management Research, Vol. 4, No. 1 & 2 December 2013
20
Table 10: Appointment of Audit Committee for period between 2003 and 2008
Table 11: Fashion and Retail Firms: Audit Fees and other auditor related issues
2005 2006 2007 2008
Non-audit related & other fees represent more than 50% of the total fees paid to the audit firm
1.29% 0.43% 0.45% 0.47%
Auditors ratified at most recent annual meeting
66.23% 71.05% 76.92% 80.38%
Auditors not ratified at most recent annual meeting
33.76% 28.94% 23.07% 19.61%
All of the audit committee members are financial experts
11.25% 11.84% 14.02% 14.83%
One or more of the audit committee members are financial experts
79.22% 80.26% 78.28% 77.99%
There are no financial experts in the audit committee
9.52% 7.89% 7.69% 7.17%
Audit Committee 2003 2004 2005 2006 2007 2008
Full board fulfills functions 0% 0% 0.00% 0.00% 0% 0%
Committee includes affiliated outsiders 18.11% 12.76% 6.49% 4.38% 3.61% 3.34%
Committee comprised solely of independent outsiders
64.15% 8.93% 92.20% 93.85% 94.11% 94.73%
No committee 0.00% 0.00% 0.00% 0.87% 1.81% 1.43%
Committee includes insiders 3.01% 0.85% 1.29% 64.91% 0.45% 0.47%
International Journal of Management Research, Vol. 4, No. 1 & 2 December 2013
21
Table 12: Fashion and Retail Firms: Takeover Defenses and Capital Structure
2005 2006 2007 2008
The company has does not have a poison pill and is not authorized to issue blank check preferred stock
The company's poison pill was not approved by shareholders
25.54% 23.24% 21.71% 16.74%
The company's poison pill was approved by shareholders
0.43% 0.44% 0.00% 0.47%
The company does not have a poison pill in place
74.02% 76.31% 78.28% 82.77%
Dual class capital structure, super voting shares closely held by insiders
6.93% 7.45% 5.88% 6.69%
Dual class capital structure, both classes freely traded and not concentrated with insiders
0.43% 1.31% 1.35% 1.43%
There is not a dual class capital structure in place 92.64% 91.22% 92.76% 91.86%
Blank check preferred stock is authorized 89.61% 90.35% 90.50% 90.43%
Blank check preferred stock is not authorized 10.38% 9.64% 9.50% 9.56%
International Journal of Management Research, Vol. 4, No. 1 & 2 December 2013
22
Institutional Theory and the Evolution of Marketing Channels in Emerging Economies: Setting a Research Agenda
Birud Sindhav
College of Business Administration University of Nebraska at Omaha, Omaha, USA Email: [email protected]
Abstract
The story of the growth of emerging economies is about the growth of their marketing institutions. Marketing channels are the key marketing institution in enabling the flow of goods and services. However, marketing scholars typically rely on models and theories devised in the developed economies to study the marketing channels in emerging economies, and these include theories based on political economy-based frameworks that emphasize power and dependence. We argue that often the institutional drives to gain legitimacy provide a powerful lens to understand the evolution of marketing channels. In this conceptual paper, we illustrate our arguments through a few examples, and provide an agenda for future research. Keywords: Marketing Channels, Emerging Economies, Institutional Theory
Introduction Emerging economies are often characterized by their relatively higher and sustainable growth rates. The attendant economic conditions usually include increase in productivity and GDP at rates higher than those in the developed economies. These developments affect many facets of economy. For example, the increased variety and flow of goods and services result in the development and evolution of marketing channels. This is an expected outcome because growing economy and the increase in consumption go hand in hand and the marketing channels are made of interdependent organizations (channel members) that link the marketer with the end consumer. Wholesalers, agents, brokers, insurers, retailers, warehouses, transporters, specialized delivery vehicles, road, rail, ports, waterways, and the electronic data network – these all are vital ingredients of a marketing channel system that keeps the economy humming. Despite the central role of marketing channels (or simply “channels”) in connecting the marketers and consumers, surprisingly little attention is paid to understanding how marketing channels evolve in emerging economies and if the dominant frameworks and model used to understand the channels in developed economies are appropriate in understanding the evolution of channels in emerging economies. Usually, the models from the mature economies are deemed relevant for the emerging economies as well (e.g., Dong, Tse, and Hung 2010; Kale 1986). It is our thesis that the neoclassical theory based efficiency centered framework or the political economy-based models, the dominant theoretical frameworks through which the functioning of channels is examined in developed markets,
International Journal of Management Research, Vol. 4, No. 1 & 2 December 2013
23
do an incomplete job of explaining the functioning and evolution of channels in emerging economies. In the developed economies, the marketing channels are sophisticated in nature as they serve a mature economy. Following the lead of other social scientists, the efforts to understand the marketing channels traditionally have been rooted into the neoclassical framework where efficiency is the goal and transactions happen without frictions and information is ubiquitous. Since these assumptions do not reflect real life conditions, scholars adopted the political economy framework where the economic actions are steeped into political concerns of power and dependence (e.g., Frazier and Summers 1986). The dominant themes in the literature addressing channel concerns have been governance mechanisms (Yang, Su, and Fam 2012), agency relationships (Vermillion, Lassar, and Winsor 2002), power equations among channel members (Frazier 1983), various types of influence attempts they bring in to achieve the desired outcomes (Scheer and Stern 1992), and the relational bonds they establish with each other (Zhuang and Xubing 2011). All these issues are vital in capturing the nature of a marketing channel from various angles, however, we argue that they miss an important piece of the puzzle – how various institutions within the society shape the evolution of the marketing channels. The institutional view examines the dynamics of marketing channels as the channel development gets informed by the constraints put on it by various institutions (Grewal and Dharwadkar 2002; Varman and Costa 2009; Yang, Su, and Fam 2012). This view looks at market development “as a political and social process…as a process of legitimation” (Humphreys 2010). Our aim is to highlight the kinds of issues related to marketing channels to be explored through further conceptual and empirical studies. Why Institutional Theory Matters in Examining the Channel in Emerging Economies Our context of emerging economies does not mean that institutional theory cannot be applied in the developed economies context. Indeed, the institutional theory has been applied in understanding the marketing organizations in developed economies as well (e.g., McFarland, Bloodgood, and Payan 2008). Further, the “recurrence of earlier patterns” and studying “inter-institutional strife” have often remained the focus of the investigation (Brown 1987). While the usefulness of the institutional theory is highlighted when it comes to understanding change in economic environment (e.g., Scott 2004), there is still need for a bit detailed discussion. The channels are made of dyads and the neoclassical theory assumes frictionless transactions. In reality, transactions are fraught with uncertainty and mediated through various institutions designed to reduce this uncertainty (North 1991). If we take an example of a remote rural community in an emerging country like India, a farmer may provide vegetables to end consumers in the local community in cash- or barter-based transactions. This is the simplest and shortest form of marketing channel, where the transaction is personal in nature. It is most likely that the buyer and the seller know each other and have engaged in repeated transactions in the past. The presence of the interpersonal trust suffices in enabling the transaction.
International Journal of Management Research, Vol. 4, No. 1 & 2 December 2013
24
However, as the economy grows, it is characterized by specialization of actors and division of labor. The mass production means the production and consumption are separated geographically, setting the stage for introducing more actors in the marketing channels (e.g., regional distributors) and making the transactions impersonal in nature. The impossibility of knowing everyone involved in the channel personally means the interpersonal trust is not a viable mechanism to reduce the uncertainty in the transaction (e.g., the quality of products may be unknown). Typically, contracts are drawn to reduce the uncertainty about the transactions. However, just writing a contract is not enough, as without the threat of enforcement, they may remain toothless. Various institutions play role in reducing the uncertainty, enforcing the contract if need be, and enabling the transaction. Table 1 describes the mechanisms employed in enforcing the contracts at various levels of complexity in the transactions. The mediation of transactions by the institutions introduces “friction”, challenging one major assumption of the neoclassical frameworks. The political economy-based models take into account such “imperfections” in the market, and focus on how constructs such as power and negotiations strategies affect the outcomes, including economic ones, of a marketing channel. However, in emerging economies, the channels often function within extra-economic context. Examples of Marketing Channels with Extra- Economic Context A few of the examples of the marketing/distribution channels with the extra-economic context are listed here:
1. Coarse grain distribution centers are often awarded to needy individuals where need-based considerations supersede merit-based considerations. Similar considerations are at the heart of the Gramin Bank model, which distributes micro loans. The Shakti initiative by HLL has dual bottom lines as they choose underprivileged rural females as beneficiaries. These social welfare expectations from a channel are likely to be found more readily in emerging rather than mature economies.
2. Often new marketing channel arrangements are pursued in emerging economies not necessarily for its economic feasibility but because it rubs off on the firm in a positive manner. Amul was pioneer in adopting the Internet as a marketing channel in its goal to be known as an “IT company in the food business”.
3. The political institutions generally overpower the economic efficiency considerations, greatly affecting the type of channels that can evolve in a given economy. Further, political willingness to enact laws to allow market-based exchanges to flourish (e.g., antitrust laws) and create a powerful judiciary to make contracts enforceable is critical in setting a stage for economy to take off. This is highlighted by the case of the Latin American countries where they liberally borrowed from the constitution of the United States in a hope to mimic its economic success. However, the lack of institutions that can make contracts enforceable and support private property rights has resulted into dysfunctional economies for the better part of the last century (De Soto 2003).
4. The polity supersedes economics in that the competing interests in politics do not let the pure market equilibrium presumed by the neoclassical theory to realize. In India, the congress party was defeated even after putting the country to the path of
International Journal of Management Research, Vol. 4, No. 1 & 2 December 2013
25
enhanced growth rate. The message - if the fruits of economic growth were not enjoyed by all, there will be consequences. This made the political parties to re-evaluate their stance towards liberalization such as disallowing the FDI in FMCG retailing, greatly affecting how marketing channels would have evolved.
5. The general suboptimal state of physical infrastructure (e.g., investment banking) in emerging economies is often compensated by substituting the influence of caste and community-based institutions. For example, the great construction boom in many parts of India is financed by temples in a transaction between the builder-devotee and the religious head that does not always show up on the financial documents.
6. Emerging economies are often characterized by “dual economies” of relatively free- and the controlled- segments. Within the “controlled segment”, there are about half a million Fair Price Shops (FPS) in India, run by the Public Distribution System (PDS). The aim of these shops is ensure food security for the poor populace, and therefore, efficiency and market forces take a backseat. The institutional theory may be a proper tool to understand the functioning of this channel as legitimacy is a more immediate concern than efficiency (cf. Grewal and Dharwadkar 2002).
The other argument about using institutional theory in understanding the evolution of marketing channel in emerging economies comes from the inherent nature of the emerging economies – they are usually associated with the lack of competitive structure and disregard for efficiency and the preference for the welfare or autocratic state. When the growth path is sought, it is through the establishment of market institutions (emphasis added, McMillan and Barry 1996). Therefore, understanding the change through institutional theory is an appropriate choice. The Potential Research Agenda In light of the issues we highlighted so far, we argue for a greater consideration of the context, particularly the immediate institutional environment in examining the marketing channels in emerging economies. Society and culture play dominant roles in how we frame our sense making endeavors. The neoclassical theory is devoid of accounting for such idiosyncrasies, though, it is doubtful if we can simply wish these away as noise. Further, the national economies are path dependent. Their current bearings are a result of the journey made in the past. For example, the escape-from-monarchy ideology, the frontier mentality, and the lack of ancient history has provided for a very unique context to the American economy compared to the European and the Asian economies. The post-independence Indian economy is relatively young, but already includes two major inflection points. One, immediately after the independence, conscious choice was made to be self-sufficient, probably as a response to the just endured slavery to the British. This guiding principle led to emulating the socialist structure of the soviet economy, with centralized planning as a key feature. The second inflection point came roughly four decades later, when in 1991 India had to put aside its national pride and fly gold to London to ensure liquidity in the international trade. The resultant liberalization of economy is still work in progress. Consequently, our inquiries should take into consideration the evolving nature of the economy (and parts of economy such as marketing channels) in framing the questions. Some indicative questions are mentioned below:
International Journal of Management Research, Vol. 4, No. 1 & 2 December 2013
26
1. As the erstwhile third world countries are reclassified as emerging economies, they make transition from the centrally controlled economy to the market-based economy. As the public distribution of goods and services get eclipsed by the market-based system, what are the implications for the marketing channels in terms of how their performance is measured?
2. What types of formal and informal institutions affect the marketing channels? How? Are one type of institutions more like to affect than the other? Why?
3. Infrastructure development is the backbone of any robust marketing channel. The legal and social arrangements affect how the hard infrastructure evolves. The adoption of VAT (software) encourages adoption of more efficient hub-and-spoke model of warehouses. How does evolving institutional environment affect the development of infrastructure?
4. What are the factors affecting the evolution of the institutional environment for marketing channels (e.g., the changing perceptions of the role of the government versus private enterprises in creating jobs)? Which factors are more important than the others and how do we know that?
5. Technology is brought in to harvest the productivity gains within economy/marketing channels, but that alone is not enough. It is the technology nestled within the institutional arrangement to make the impersonal transactions possible that sets the stage for the productivity gains. How does technology interact with the evolution of the institutions in affecting the channel performance? Would M-Pesa like system be possible without the widespread adoption of the wireless technology?
6. How institutional and economics-related factors interact to affect the evolution of marketing channels? Chi-Hsing and Kuo (2008) provide a promising start with examining the case of a computer manufacturer, however, more robust methodology is needed to gain deeper insights.
These issues are illustrative in nature, but do lay out an agenda for understanding the unique role of institutional environment in the functioning and evolution of marketing channels in emerging economies. While there are some initiatives in marketing to apply institutional theory in understanding the evolution and functioning of marketing channels (e.g., Richey et al 2005), much needs to be done to fully harness the explanatory power if this theory. Conclusion Marketing channels interact with the economy in which they reside as a mini system. Channel development is a very organic process where the marketers try to devise a best way to deliver value to customers within the constraints they have to face. On the other hand, they also go beyond these constraints by bringing in new technology, riding on the infrastructure development, and implementing the innovations within the system. This constant process of adjusting-and-readjusting, give-and-take forms the cutting edge of the channel evolution. This process may be different in emerging economies (e.g., India) compared to the developed economy (e.g., USA), because the channel evolution has a larger gap to overcome in the former. The channel evolution process in emerging economies is dynamic
International Journal of Management Research, Vol. 4, No. 1 & 2 December 2013
27
and complex. Martinsons (2008) alludes to these differences while discussing electronic markets in China. Further, we do not believe the channels evolve and work similarly in all emerging economies, partly because the institutional environments are not always comparable. The Indian economy presents an interesting mix of free market and socialism, rising modernism and resurging religious fervor, and both political will and opposition for market reforms. All of these conflicting and complementing dynamics make for an interesting research agenda for scholars interested in understanding the channels in emerging economies in general and India in particular. References Brown, Stephen. (1987). Institutional change in retailing: A review and synthesis. European
Journal of Marketing, 21 (6), pp. 5-36. Chi-Hsing Tseng, and Hsin-Chih Kuo. (2008). The influence of institutions and transaction
cost on channel structure: The case of asus in mainland china. Proceedings for the Northeast Region Decision Sciences Institute (NEDSI), pp. 80-5.
De Soto, Hernando. (2003). The mystery of capital: Why capitalism triumphs in the west and fails everywhere else, Basic books.
Dong, Maggie Chuoyan, David K. Tse, and Kineta Hung. (2010). Effective distributor governance in emerging markets: The salience of distributor role, relationship stages, and market uncertainty. Journal of International Marketing, 18 (3), pp. 1-17.
Frazier, Gary L. (1983). On the measurement of interfirm power in channels of distribution. Journal of Marketing Research, 20 (2) pp. 158-66.
Frazier, G. and Summers, J (1986). Perceptions of Interfirm Power and Its Use within a Franchise Channel of Distribution. Journal of Marketing Research, 23(May), 169‐76.
Grewal, R. and Dharwadkar, R. (2002).The role of institutional environment in marketing channels. Journal of Marketing, 66, pp. 82-97.
Humphreys, Ashlee. (2010). Megamarketing: The creation of markets as a social process. Journal of Marketing, 74 (2), pp. 1-19.
Kale, S.H. (1986). Dealer Perceptions of Manufacturer Power and Influence Strategies in a Developing Country." Journal of Marketing Research, 23, 387-93.
Martinsons, Maris G. (2008). Relationship-based e-Commerce: Theory and evidence from China. Information Systems Journal 18 (4), pp. 331-56.
McFarland, Richard G., James M. Bloodgood, and Janice M. Payan. (2008). Supply chain contagion. Journal of Marketing, 72 (2), pp. 63-79.
McMillan, John and Barry Naughton. (1996). Reforming Asian Socialism: The Growth of Market Institutions. University of Michigan Press.
North, D. (1991). Institutions. The Journal of Economic Perspectives, 5 (1), pp. 97-112. Richey, G, Tokman, M., Wright, R., and Harvey M. (2005). Monitoring reverse logistics
programs: a roadmap to sustainable development in emerging markets. The International Business Review, 13 (3), pp. 41-65.
Scheer, Lisa K., and Louis W. Stern. (1992). The effect of influence type and performance outcomes on attitude toward the influencer. Journal of Marketing Research, 29 (1), pp. 128-42.
Scott, Richard. (2004). Institutional theory: Contributing to a theoretical research program in great minds in management: The process of theory development, Ken G. Smith and Michael A. Hitt, eds. Oxford UK: Oxford University Press.

International Journal of Management Research, Vol. 4, No. 1 & 2 December 2013
28
Varman, Rohit, and Janeen Arnold Costa. (2009). Competitive and cooperative behavior in embedded markets: Developing an institutional perspective on bazaars. Journal of Retailing, 85 (4 ) pp. 453-67.
Vermillion, Leslie J., Walfried M. Lassar, and Robert D. Winsor. (2002). The Hunt-Vitell general theory of marketing ethics: Can it enhance our understanding of principal-agent relationships in channels of distribution? Journal of Business Ethics, 41 (3). pp. 267-85.
Yang, Zhilin, Chenting Su, and Kim-Shyan Fam. (2012). Dealing with institutional distances in international marketing channels: Governance strategies that engender legitimacy and efficiency. Journal of Marketing, 76 (3), pp. 41-55.
Zhuang, Guijun, and Xubing Zhang. Impact of relationship marketing orientation on the exercise of interfirm power and relational governance in marketing channels: Empirical evidence from China. Journal of Marketing Channels, 18 (4).
Table 1: Uncertainty Reduction in Transactions through Contract Enforcement
Type of Contract Enforcement
Means of Enforcement
Examples Remarks
1 First Party Self-declaration that “I will act morally”
A personal oath Relies on a discretion of an individual
2 Second Party Retaliation Threat of violence
Law is bypassed
3 Third Party (informal)
Societal sanctions Threat of making one an outcast
Higher transaction cost as many individuals are involved
4 Third party (formal)
Legal court Legal penalty Could be costly but is efficient and scalable

International Journal of Management Research, Vol. 4, No. 1 & 2 December 2013
29
Towards a Model for Adoption of Green IS Practices
Babita Gupta School of Business, California State University, Monterey Bay, USA
E-mail: [email protected]
G. P. Sahu M .N. National Institute of Technology Allahabad, India
E-mail: [email protected]
Abstract
In the fast changing global business, green information systems (IS) have emerged as an integral part of business strategy. Many business organizations have adopted green IS and are in the process of its implementation. This research-in-progress paper identifies factors for the adoption of green IS practices in the organizational context. We present research methodology for initial pilot study using the following adoption factors using Technology-Organization-Environment (TOE) theory framework: relative advantage/usefulness, compatibility, complexity, observability, technology competence/IT Support, organizational context/ corporate social responsibility, environmental context/partners readiness, cost involved, competitive pressure, top management attitude, government framework (strategy/policy), customer/stakeholders/investors attitude, and skilled manpower. Keywords: Environmentally Sustainable Information Technology, Technology-Organization-Environment Theory
Introduction Information technology (IT) systems are ubiquitous now to most organizations and provide significant productivity gains. However, IT systems also require power and produce heat, CO2 emissions, and hazardous waste. Escalating power demands of the computing technologies and the growing awareness of the need for green environmental practices among consumers is motivating organizations to reduce energy consumption and the e-waste1 while maintaining profitability. Use of information and communication technologies account for approximately 2% of global CO2 emissions, which is almost equivalent to the amount generated by the aviation industry (Molla et al., 2008). Current estimates indicate that IT budgets within enterprises are increasing at about 6% per year while the facilities budget, which supports IT equipment location, storage, cooling, etc., is increasing at about 16% a year due to rising energy costs2. Energy demands of the data center3 equipment alone are estimated to account for 10% of the IT budget. This portion is expected to grow to 50% of the IT budget in near future. One estimate suggests that globally, for every $1 spent on IT hardware, additional $0.50 is spent in power consumption (Halpin, 2008). In the past, the focus was on Information Technology (IT) equipment processing power and associated equipment spending while infrastructure that includes power, cooling and data
International Journal of Management Research, Vol. 4, No. 1 & 2 December 2013
30
center space was assumed to be available, ready, and affordable. Today, climate change, rising energy costs and resource constraints are increasingly becoming global issues for governments and businesses. These global issues are driving new trends in the development of green or environmentally sustainable technologies. Renewable energy sources, advanced water management, efficient resource recycling, waste reduction, intelligent utility networks, intelligent transportation systems, and energy efficiency in data center are gaining interest and support from both the public and private sector. Organizations are recognizing the need for adopting information technologies that are responsive to the sustainability of the natural environment. Green IS is emerging as a viable strategy for reducing energy inefficiencies and e-waste while improving IT systems’ performance in a cost-effective manner as well creating environmentally sustainable practices for the profitability of the business. Green IS is different from the Green Information Technology (IT) in the scope. There are a number of definitions of green IT (also known as green computing) in literature (Elliot, 2011; Brooks et al., 2010; Schmidt et al., 2010) but they generally agree that green IT refers to the use of IT equipment that is energy efficient to reduce the energy consumption for operating information technologies. Green IS refers to the design and management of environmentally sustainable business practices (Cardoso et al., 2010; Watson et al., 2008). It is worth noting that many times in literature, terms green IS and green IT are used interchangeably. In this research, Green IS refers to a cumulative set of applications and practices to reduce impact on the natural environmental through the following:
Use of assets such as the computers, servers, chips and other IT devices and peripherals that are built using eco-friendly material requiring less power consumption, emitting less pollution such as heat and CO2, and reducing hazardous material as waste,
Measures that protect the health of organizations’ occupants as well as of the natural environment, and
Organizational policies that motivate, facilitate, and reward adoption of best practices to achieve energy efficiencies.
Thus green IS embodies the philosophy that economic profitability, environmental soundness and social responsibility can be integrated to achieve environmentally sustainable development (Keeyoon, 2010). Some aspects of green IS strategy implementations include the following (Jenkin et al., 2011; Molla, 2009; Watson et al., 2008):
Use of technologies such as cloud computing and virtualization that improve energy efficiencies. These technologies can improve IT resource utilization, provide collaborative opportunities using the Internet, and decrease costs by providing reduced IT infrastructure and maintenance needs for an organization.
Use of power monitoring systems that dynamically adjust energy consumption of IT devices in an organization.
Adoption of policies and procedures throughout the organization to create a green culture. These could be: reducing paper printing, turning off devices when not in use, sharing facilities, better recycling, telecommuting, utilizing Internet based tools to
International Journal of Management Research, Vol. 4, No. 1 & 2 December 2013
31
improve procurement, collaboration and delivery of services, and training employees to change their energy consumption behavior.
Communication with stakeholders such as the consumers, suppliers, and partners to enable them to adopt environmentally sustainable practices successfully.
Green IS benefits the environment by improving energy efficiency, lowering greenhouse gas emissions, using less harmful materials, and encouraging reuse and recycling. Factors such as environmental legislation, the rising cost of waste disposal, corporate images, and public perception give further impetus to the green IS initiative. Many organizations have already adopted green computing practices because of the derived economic benefits such as cost savings from reduced consumption of electricity and fuel, reduced hardware expenditures, reduced e-waste, improved employee morale, and improved brand image and differentiation (Molla, 2009). Organizations that have adopted green IS practices have been able to achieve significant cost savings of 10% to 25% in the first year of implementation (Brandel, 2008). Green IS can also provide competitive advantage to companies (Vykoukal et al., 2009). Some recent examples of the adoption of green IS practices in government and public organizations are:
GSA Office of Citizens Services, USA.gov and GobiernoUSA.gov (the official Spanish-language web portal of the United States Government) are developing green IS infrastructure in response to the Executive Order dated Oct 5, 2009 to “establish an integrated strategy towards sustainability in the Federal Government and to make reduction of greenhouse gas emissions a priority for Federal agencies4”,
California State University East Bay has set the goal of reducing computing power consumption by 50% by 2010 (Potes-Fellow, 2005),
Office of Sustainability at the United States Postal Service has stated goals to reduce energy use by 30% by 2015, and by 2009, had already accrued saving of millions of dollars with green initiatives5,
The municipal government in San Francisco adopted energy efficiency approaches in 20026 and,
Miami-Dade County Public Schools expect to save about $2 million in energy use by reducing the amount of time PCs are on (Schwartz, 2008).
A number of factors that affect organizations to adopt technologies have been identified in previous studies (Williams et al., 2009). However, there is as yet little research focusing on identifying the factors that motivate organizations to adopt green IS practices. This study aims to identify, collate, integrate and empirically examine motivating factors in acceptance or rejection of green IS practices in organizations. Thus the main contribution of this research (upon completion) will be to develop a comprehensive model to assist research and practice for adoption of green IS practices in organizations. The remaining paper is organized as follows: next section identifies and presents adoption factors examined in existing studies related to green IS practices. The following section proposes a conceptual model by integrating identified adoption factors followed by the section that provides an overview of the proposed research methodology. The last section of this paper l outlines summary and limitations of the proposed study.
International Journal of Management Research, Vol. 4, No. 1 & 2 December 2013
32
Adoption Factors for Examining Green IS Practices The extant literature on green IS academic research is limited. There are some studies that have empirically examined factors influencing adoption of green IS practices. Schmidt et al. (2010) tested a framework that included factors such as perception of the importance of green IT and uncertainty. Their empirical works shows that corporate management, environmental engagement, and experience are predictors for the importance of green IT and that experience, measurement of green IT success, green IT standards and the initiative from the IT staff decrease the uncertainty about green IT. Schmidt et al. (2010) also show that considering green IT as hype increases the uncertainty. Dangelico and Pujari (2010) study shows that environmental regulations don’t just represent constraints or regulatory compliance, but can also offer opportunities for risk minimization, preservation of revenues and reputation, or for new business creation. Molla (2009) developed a matrix framework to evaluate organizational motivation for green IT. Molla (2009) framework, based on their empirical study of 143 senior IT/IS managers to understand the green IT diffusion, has two dimensions: green IT each (how much environmental considerations are given from IT product/services creation to end-of-life) and green IT Richness (practice, policy and technology). Mann et al. (2009) developed framework for adopting green IT with three steps. First step is to determine external and internal factors, second is to determine the sophistication of the strategy, technology and processes, and third step is to measure sustainability of the proposed venture. Sayeed and Gill (2009) used qualitative approach with structured interviews to demonstrate that organizations mobilizing their dynamic resources while implementing green IT are better able to take advantage of green IT for strategic purposes. Sarkar and Young (2009) analyzed four cases to explore actors that motivate top management attitudes towards the implementation of a green IT policy: economic, socio-political, and institutional influences. Their findings suggest that a sound cost model highlighting the relationship between potential cost savings and long-term awareness programs recognizing green IT benefits are necessary to form positive managerial attitude towards green IT initiatives and for transform attitudes into action. They also proposed a model based on Institutional Theory (INT) and the Theory of Reasoned Action (TRA) proposing that government regulations and the customer requirements form part of the External Influence which along with managerial attitudes in turn affects incorporation of green IT into corporate policy. Molla et al. (2008) proposed the g-readiness framework to evaluate readiness of organizations’ adoptions of green IT with five factors – attitude, policy, practice, technology and governance. Branzei et al. (2004) empirical study of Chinese firms using control theory found that top executives who champion new strategic initiatives are more likely to monitor early success or failure, and adjust their efforts to match early performance feedback. This feedback provides information to stakeholders at all levels of the organization, and perception of satisfactory performance strengthens leaders’ efforts, while perceptions of unsatisfactory performance weaken the efforts.

International Journal of Management Research, Vol. 4, No. 1 & 2 December 2013
33
Based on the above and the technology adoption and diffusion work, we identify the following factors for this study: benefit, cost, technology capability (Shiau et al., 2009); image, result demonstrability (Van Slyke et al., 2010); technical motives, experience, resources (Kamhawi, 2008); corporate social responsibility (Hendry and Vesilind, 2005), stakeholder influence (Sen et al. 2006, Rao and Holt 2005, and Rao 2004); top management attitude (Molla and Licker, 2005a); and skilled manpower and government policy (Molla and Licker 2005b). The list of aforementioned factors indicates that adoption barriers and drivers are associated with technology (i.e. green IS), organization (i.e. management attitude, resources, corporate social responsibility) and environment (i.e. government policy and stakeholders influence). Considering multidimensional nature of the subject under investigation, it was thought to be appropriate to utilize a theory or framework that enables integration and synthesis of all three types of factors in a single model. Although, a number of theories and models (for example, Diffusion of Innovation, Technology Acceptance Model, Theory of Reasoned Action, Theory of Planned Behavior) are available for examining technology adoption related issues, majority of them focused on examining individual/user level factors. In contrast, Technology-Organization-Environment (TOE) framework provides flexibility to integrate three different types of factors within one model and therefore considered most appropriate for this research. The relevant factors were collated from theories and existing studies on this topic (see Table 1), and then organized within TOE framework. The resulting research model is illustrated in Figure 1. A further description of model, definitions of independent and dependent constructs and relationships between them is described in next section. Research Model The proposed research model in Figure 1 postulates that the three types of independent variables (i.e. technological, organizational and environmental) may influence the adoption of green IS practices. The proposed conceptual model is illustrated in Figure 1. Research Methodology A research methodology is a strategy of inquiry which moves from the underlying philosophical assumptions to research design and data collection. Therefore, based on the literature study in the research area, factors are identified for the adoption of green IS practices. From these factors a research model is developed that would address the following issues:
1) What is the current state of green IS in organizations? 2) What are factors that are the drivers (or predictor) of green IS adoption? 3) What are the major challenges to the successful adoption of green IS? 4) What are the solutions to overcoming these challenges?
In this study, first phase of the research methodology is to conduct an exploratory study as a combination of qualitative and quantitative pilot study. In the quantitative pilot study, aim is to collect about 100 valid data points from across diverse set of organizations using the survey instrument designed on the basis of the proposed research model in Figure 1. In the qualitative pilot study, aim is to interview about 10-12 individuals in 5-6 organizations using semi-structured and open ended interviews to gain an understanding of how and why

International Journal of Management Research, Vol. 4, No. 1 & 2 December 2013
34
organizations are engaging in the green IS adoption process. The qualitative methodology of the pilot study would help identify any constructs or issues overlooked in the research model and therefore the pilot survey. Then from these data the factors that influence the adoption of green IS practices are identified. Here SAP-LAP methodology is proposed to be used for the case study. Sushil (2000) has recommended SAP-LAP as a formal analysis methodology for examining a case study. This methodology consists of two phases SAP analysis and LAP analysis. In SAP analysis case are described through three basic components which are situation, actor, and process (SAP). In LAP analysis Learning, Action and Performance are deduced from the previously done SAP analysis. Second phase is to synthesize the responses from the pilot survey study and case study to identify the factors influencing adoption of green IS practices, and to refine the survey instrument based on the data analyses of the pilot study data to ensure that the measures had the desirable reliability and validity. These analyses would help us refine the research model and help develop a set of hypotheses that would be then tested using empirical survey methodology. The finalized survey would be administered with the aim to collect at least 400 data points to test the hypotheses. This entire process of the research methodology is summarized in Figure 2. Instrument Design and Validation A questionnaire based survey approach is used with the objective to collect data to test the proposed relationships between independent and dependent constructs. Questions or items for measuring influence of each factor are in the statement format, which seeks opinion in terms of level of agreement or disagreement of the respondent. Questions are prepared on the basis of the literature study related to the factors provided in earlier section. The questions in the questionnaire include both multiple choice and seven point Likert scale types. In the questionnaire the personal information such as age, gender, work experience, education etc. are asked to understand the respondents’ demographic profile. Open ended questions are avoided due to the difficulty in handling and processing of the data and it is not included in the scope of the study. In order to convey the intent quickly and successfully, the questions have been kept simple and easy to understand. It is proposed to collect 400 questionnaire responses from the executives (holding managerial position) working in the various organizations that use information technologies in India. A convenience sampling technique will be used to collect these responses. The questionnaire responses will be statistically analyzed using statistical tools and techniques. To validate the questionnaire, Cronbach’s alpha and Confirmatory Factor Analysis would be done. Through this process, the convergent validity of all the questions of given factors will tested. Then regression analysis will be carried out to test the proposed relationships. Regression analysis is most widely used and versatile dependence technique, applicable in every facet of business decision making. Multiple regression analysis is a

International Journal of Management Research, Vol. 4, No. 1 & 2 December 2013
35
general statistical technique used to analyse the relationship between a single dependent variables and several independent variables. Path coefficient is to be studied for the acceptance or rejection of the hypotheses (Hair et al. 1998). Statistical Package for Social Sciences (SPSS) (version 18) is to be used for the purpose of computation and analysis. Summary This paper is a modest attempt to understand the factors influencing green IS adoption. The literature presents a brief description of the models like Diffusion of Innovation (DOI), Technology Organization Environment (TOE), Technology Acceptance Model (TAM), and Theory of Reasoned Action. A research model on green IS adoption is developed based on the factors identified from literature review. In this paper the detailed research methodology is also proposed to validate the research model empirically. Proposed Contribution to the Practice, Policy and Research Upon completion this study will contribute to practice, policy and research in the area of green IS Adoption. Validated model will be useful for managers to guide strategy to implement green IS in their organizations. It may also be useful for policy makers and other relevant stakeholders to influence organizations to adopt green ARE practices. In terms of research, this study will contribute to IT/IS adoption and diffusion in general and green IS adoption literature in particular. The study will contribute toward development of TOE framework. Specific contributions and implications will be presented after completion of this research. Limitations Convenience sampling is proposed to be used for this research due to the following reasons:
1. It is difficult to find out the accurate representation of the population, 2. Respondents may avoid participating in the questionnaire survey due to their busy
schedules, and 3. Due to cost limitations, authors are limited to certain geographic areas for interviews
in the proposed qualitative data collection. End Notes 1 E-waste or electronic waste refers to the electronic devices that are no longer useful and their disposal. 2 http://www.cioinsight.com/c/a/Expert-Voices/Wild-Cost-Of-Data-Centers/1/ 3 A data center is a facility used to house critical IT systems and associated hardware for an organization. 4 http://www.whitehouse.gov/ 5 http://www.usps.com 6 http://www.unc.edu/~jrhester/policy.html References Ajzen, I. & Fishbein, M. (1980). Understanding Attitude and Predicting Social Behaviour,
Prentice-Hall, Englewood Cliffs, New Jersey. Brandel, M. (2008). THE GREEN MAZ, Computerworld, Feb 18, 2008. Vol. 42, Iss. 8; pg. 47,
pgs. Available at http://www.computerworld.com/s/article/ 311803/The_Green_Maze? taxonomyId = 154&page Number=3.
International Journal of Management Research, Vol. 4, No. 1 & 2 December 2013
36
Branzei, O., Ursacki-Bryant, T., Vertinsky, I., Zhang. W. (2004). The formation of green strategies in Chinese firms: matching corporate environmental responses and individual principles. Strategic Management Journal, 25(11),p p. 1075-1095.Brooks, S., Wang, X., and Sarker, S., (2010). Unpacking Green IT: A Review of the Existing Literature, AMCIS 2010 Proceedings. Paper 398.
Cardoso, AC, (2010). Green Information Systems: The Use Of Information Systems To Enhance Sustainable Development, MIS Quarterly. 34(1), pp. 23-38.
Carroll, A. (1991). The pyramid of corporate social responsibility: Toward the moral management of organizational stakeholder, Business Horizon, July – August, pp 39-48.
Dangelico, R.M. and Pujari, D. (2010). Mainstreaming Green Product Innovation: Why and How Companies Integrate Environmental Sustainability. Journal of Business Ethics. 95(3), pp. 471-486.
Davis, F. D. (1989). Perceived usefulness, perceived ease of use, end user acceptance of Information technology, MIS Quarterly, 13, pp 318-339.
Elliot, S. (2011). Transdisciplinary Perspectives On Environmental Sustainability: A Resource Base And Framework For It-Enabled Business Transformation. MIS Quarterly, 35(1), pp. 197-236.
Hair, J. F., Tatham, R. L., Anderson, R. E. and Black, W. (1998). Multivariate Data Analysis, (5th Edition) Prentice Hall Englewood Cliffs, New Jersey.
Halpin, L. (2008), Green IT: Helping to Keep You in the Black, Accountancy Ireland, 40 (6), pp. 44-45.
He, Q., Y. Duan, Z. Fu, and D. Li (2006). An Innovation Adoption Study of Online E-Payment in Chinese Companies, Journal of Electronic Commerce in Organizations, 4 (1); pp. 48-69.
Hendry J. R and Vesilind A. P, (2005). Ethical Motivation for Green Business and Engineering. Clean Technologies and Environmental Policy (7:4), pp 252-258. Jenkin, T. A., Webster, J., and McShane, L. (2011). An agenda for ‘Green’ information
technology and systems research, Information and Organization, 2, pp 17–40. Kamhawi, E.M. (2008). Enterprise Resource-Planning Systems Adoption in Bahrain: Motives,
Benefits, and Barriers. Journal of Enterprise Information Management. 21(3), pp 310-334.
Keeyoon, K. (2010). Cooperation on Acquiring Green Technology: Focusing on Renewable Energy. SERI Quarterly, 3 (1), pp. 28- 37.
Mann, H., Grant, G., and Singh Mann, I. J. (2009). Green IT: An Implementation Framework, AMCIS 2009 Proceedings. Paper 121.
McGillicuddy, S. (2007). Green computing slow to take hold in US businesses, CIO News: Headlines, from SearchCIO.com, May 23, available at: http://searchcio.techtarget.com/ originalContent / 0,289142,sid19_gci1256091,00.htm
Molla, A. & Licker P. (2005a). E-Commerce adoption in developing countries: A model and instrument, Information & Management, 42(6), pp 877-899.
Molla, A. & Licker P. (2005b). Perceived e-readiness factors in e-commerce adoption: An empirical investigation in a developing country, International Journal of Electronic Commerce, 10(1), pp 83-110.
Molla, A. (2009). The Reach and Richness of Green IT, 20th Australasian Conference on Information Systems, 2-4 Dec 2009, Melbourne, pp 754-764.
International Journal of Management Research, Vol. 4, No. 1 & 2 December 2013
37
Molla, A., Cooper, V., Corbitt, B., Deng, H., Peszynski, K., Pittayachawan, S. and Teoh, S. Y. (2008). E-Readiness to G-Readiness: Developing a Green Information Technology Readiness Framework, ACIS 2008 Proceedings. Paper 35.
Potes-Fellow, C. (2005). CSU Moves to Greener Policy, Retrieved on 2/25/2010 from http://www.calstate.edu/pa/news/2005/green.shtml
Rao, P. & Holt, D. (2005). Do green supply chains lead to competitiveness and economic performance?, International Journal of Operations & Production Management, 25(9), pp 898-916.
Rao, P. (2004). Greening Production: A Southeast asian experience, International Journal of Operations &Production Management, 24(3), 289-320.
Ricoh (2007). Available at: www.ricoh.com/environment/green/index.html, accessed on December 10, 2010.
Rogers , E. M.(1995). Diffusion of Innovations, 4th ed. New York: Free Press, 1995. Sarkar, P. and Young, L. (2009). Managerial Attitudes Towards Green IT: An Explorative
Study of Policy Drivers, PACIS 2009 Proceedings. Paper 95. Sayeed, L. and Gill, S. (2009). Implementation of Green IT: Implications for a Dynamic
Resource, AMCIS 2009 Proceedings. Paper 381. Schmidt, N., Koray, E., Kolbe, L. M., and Zarnekow, R., (2010). Predictors of Green IT
Adoption: Implications from an Empirical Investigation, AMCIS 2010 Proceedings. Paper 367.
Schwartz. E. (April 21, 2008). Miami-Dade pinches PC power consumption., InfoWorld, Retrieved on 2/25/2010 from http://www.infoworld.com/t/green-it/miami-dade-pinches-pc-power-consumption-633.
Sen S, Bhatacharya C. B., Korschun D (2006). The role of corporate social responsibilities in strengthing multiple stakeholders relationship: A field experiment. Journal of Academy of Marketing and Science, Spring (34), 99, pp.158-166.
Shiau W., Hsu P., and Wang, J. (2009). Development of Measures to Assess the ERP Adoption of Small and Medium Enterprises. Journal of Enterprise Information Management, 22 (1/2), pp. 99-118.
Sushil, (2000). SAP-LAP Models of Enquiry. Management Decision, 38(5), pp. 347-353. Tornatzky, L. G. & Fleischer, M. (1990). The Process of Technological Innovation, Lexington,
MA: Lexington Books. Van Slyke, C., Lou, H., Belanger, F. and Sridhar, V (2010). The influence of culture on
consumer-oriented electronic commerce adoption. Journal of Electronic Commerce Research, 18 (3), pp 30-40.
Vykoukal, J., Wolf, M., and Beck, R. (2009) Does Green IT Matter? Analysis of the Relationship between Green IT and Grid Technology from a Resource-Based View Perspective, PACIS 2009 Proceedings. Paper 51.
Watson, R.T., Boudreau, M., Chen, A. and Huber, M. (2008). Green IS: Building Sustainable Business Practices. Information Systems. Global Text Project. Athens, Georgia.
Williams, M. D., Dwivedi, Y. K., Lal, B. and A. Schwarz (2009). Contemporary trends and issues in IT adoption and diffusion research. Journal of Information Technology. 24 (1), pp 1-10.
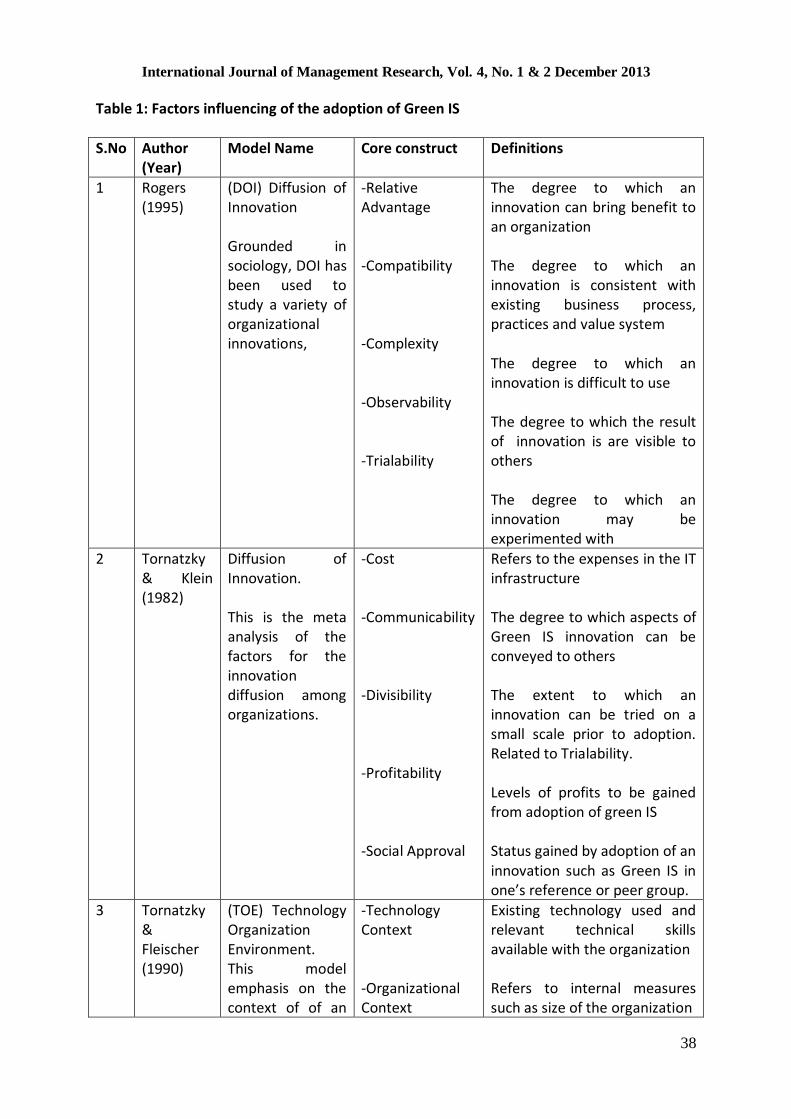
International Journal of Management Research, Vol. 4, No. 1 & 2 December 2013
38
Table 1: Factors influencing of the adoption of Green IS
S.No Author (Year)
Model Name Core construct Definitions
1 Rogers (1995)
(DOI) Diffusion of Innovation Grounded in sociology, DOI has been used to study a variety of organizational innovations,
-Relative Advantage -Compatibility -Complexity -Observability -Trialability
The degree to which an innovation can bring benefit to an organization The degree to which an innovation is consistent with existing business process, practices and value system The degree to which an innovation is difficult to use The degree to which the result of innovation is are visible to others The degree to which an innovation may be experimented with
2 Tornatzky & Klein (1982)
Diffusion of Innovation. This is the meta analysis of the factors for the innovation diffusion among organizations.
-Cost -Communicability -Divisibility -Profitability -Social Approval
Refers to the expenses in the IT infrastructure The degree to which aspects of Green IS innovation can be conveyed to others The extent to which an innovation can be tried on a small scale prior to adoption. Related to Trialability. Levels of profits to be gained from adoption of green IS Status gained by adoption of an innovation such as Green IS in one’s reference or peer group.
3 Tornatzky & Fleischer (1990)
(TOE) Technology Organization Environment. This model emphasis on the context of of an
-Technology Context -Organizational Context
Existing technology used and relevant technical skills available with the organization Refers to internal measures such as size of the organization

International Journal of Management Research, Vol. 4, No. 1 & 2 December 2013
39
innovation related to technology, organization and environment.
-Environmental Context
Refers to the external arena in which the an organization conducts its business
4 Fred Davis & Richard Bagozzi
(TAM) Technology Acceptance Model It was designed to predict information technology acceptance and usage on the job.
-Perceived Usefulness -Perceived Ease of Use -Subjective Norm
the degree to which a person believes that using a particular system would enhance his or her job performance the degree to which a person believes that using a particular system would be free of effort. the person’s perception that most people who are important to him think he should or should not perform the behavior in question
5 Ajzen & Fishbein (1980)
(TRA) Theory of Reasoned Action Drawn from social psychology, it has been used to predict a wide range of behaviors to individual acceptance of technology and found that the
-Attitude Toward Behavior -Subjective Norm
an individual’s positive or negative feelings (evaluative affect) about performing the target behavior the person’s perception that most people who are important to him think he should or should not perform the behavior in question
6 Molla, et al., 2008 Davis,1989
TAM/Green IS Readiness framework.
Top Management Attitude
Senior management level of the organization

International Journal of Management Research, Vol. 4, No. 1 & 2 December 2013
40
7 Molla,et al. 2008
Green IS Readiness framework. This model describes the readiness of individual organization adopting the green IS concept.
Government framework (strategy/Policy)
Set of specific rules and regulations drafted by the government for organizations related to green IS adoption
8 Rao (2004); Rao & Holt (2005), Sen et al., (2006)
- Customer/Stake holders/investors attitude
Parties involved externally in the business operations with the organization.
9 Carroll (1991), Rao & Holt (2005)
- Corporate Social Responsibility
Organization social and moral orientation towards the society at large.
10 Molla & Licker (2005b)
- Skilled manpower
Trained human capital within the organization
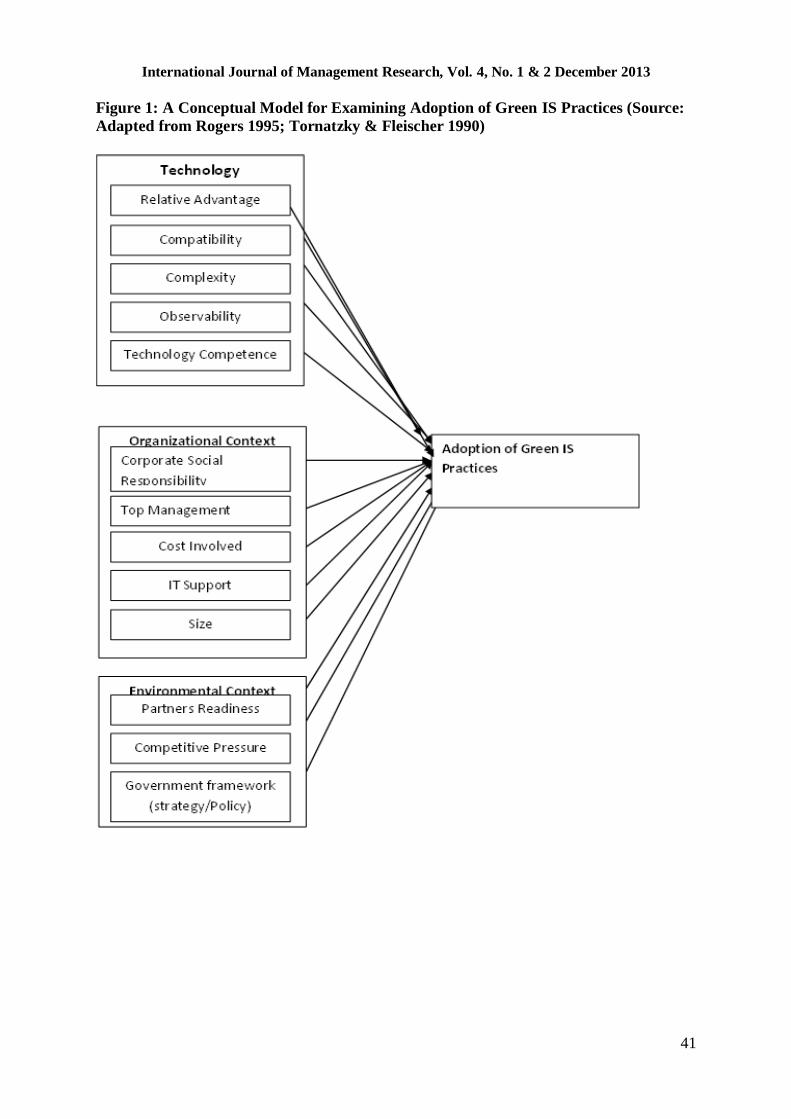
International Journal of Management Research, Vol. 4, No. 1 & 2 December 2013
41
Figure 1: A Conceptual Model for Examining Adoption of Green IS Practices (Source:
Adapted from Rogers 1995; Tornatzky & Fleischer 1990)
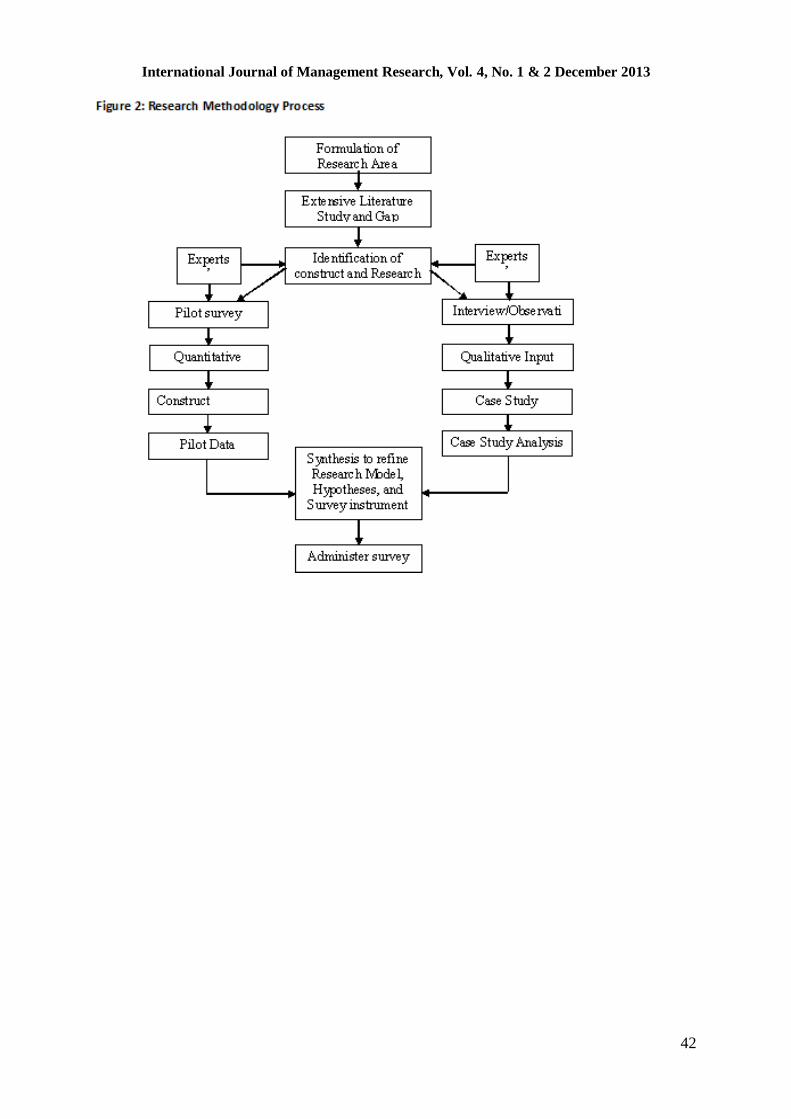
International Journal of Management Research, Vol. 4, No. 1 & 2 December 2013
42

International Journal of Management Research, Vol. 4, No. 1 & 2 December 2013
43
Decoding Wellbeing-Oriented Business Model of Fabindia
Sunita Gupta Konwar Pearl Academy of Fashion, New Delhi
E-mail: [email protected]
Abstract
This paper aims at understanding the business model followed by Fabindia which ensures the wellbeing of all its artisans. Primary research for this paper was conducted using in-depth interviews of the store and brand managers, store observations and focus group discussions with the customers. The USP of Fabindia product mix is that it had to have at least one handmade element – fabric is either hand-woven or if the cloth is manufactured in a mill it had to be block printed by hand, by skilled printers or finely hand embroidered by artisans. In the supply chain many problems are kept under control by upholding the ‘trust’ variable. The value of ‘trust’ variable is very high because many suppliers have flourished and grown with the firm. It was found that social gain and profit are positively correlated. Originality/Values - Fabindia’s unique business model - with a mission to provide work and employment to India’s skilled rural artisans and thus protect traditional weaving and printing skills – has led to its enormous growth and expansion. This paper provides insight into developing social entrepreneurship in the 21st century especially for the developing countries. Key words: inclusive capitalism, unique business model, correlation between social gain and profit.
Introduction For many urban Indians today, the first and the last stop for ethnic Indian fabrics, is Fabindia. Fabindia has become synonymous with ethnic trends – a style statement for urban India – and as a case study at Harvard Business School too. The retail chain describes its merchandise as crafts-based, hand-processed, natural and contemporary. Though the initial customer base for Fabindia was mostly abroad, over the years almost all upwardly mobile Indians, from the nation’s top politicians to the trendy college-goers, have sported Fabindia at some point. William Bissell – Managing Director of Fabindia, continues his father, John Bissel’s tradition of empowering craftsmen, a core belief for the company. William has ably demonstrated that entrepreneurship and ethics can not only coexist but flourish. Fabindia is known for its handcrafted Jewellery and kurtas, besides household furnishing, pottery, organic food and handicrafts. It operates close to 170 outlets across 74 major cities and small towns. It sells 66,000 products sourced from India’s 212 districts. (Economic Times – 1st march 2012) Private equity funds like Premji Invest and L capital have invested in Fabindia. When asked why they did so, the answer was, ‘we invested in Fabindia as it blends commercial interest

International Journal of Management Research, Vol. 4, No. 1 & 2 December 2013
44
with social objective’ – Ravi Thakran, managing partner of L capital Asia. ‘It has the potential to become a global leader and we will be glad if we could help it scale to that level’ he added. (ibid) Business models of many companies are turning from pure profit orientation to also ensuring the wellbeing of people associated with its growth. For example at John Lewis, the largest partnership in the world, all employees are partners of the company, and yet it is one of the most successful year-on-year UK retailers. It is a cooperative, and a complete socialistic dream, owned by the workers, profits are shared in equal portion, there is 15% disbursement of profits, the MD gets 15%, and the packing boy gets 15%. It is an amazing concept that outperforms other companies only because it attracts to it the quality person, both in the management and who run the company on a daily basis. (Bhargava, 2008) In this competitive world it is interesting to note that Fabindia spends nothing on advertising in the mass media, relying instead on in-store promotions and exhibitions. “Our promotions are based on our ideology of promoting Indian handicrafts and helping craftspeople. So, we organize ‘crafts mornings’ where we invite artisans to speak about their art to an audience. We also invite experts to speak about themes like environment protection and organic foods, which our products relate to,” says Sunil Chainani, Director, Fabindia (Business Today – 16 November 2008 – pg 78). Fabindia’s unique business model has led to its enormous growth and expansion. The following section concentrates on the strategy adopted by the two giants of this company, John Bissell and William Bissell. Origin of Fabindia John Bissell – ‘The relationship Builder’: Fabindia was a dream of one man – an American, a Yale graduate, John Bissell. After his first job as a management trainee with the toy department at Macy’s in New York, he arrived in India on 15 August 1958. He came to India to source Indian textiles for retail chains in the US and stayed back having fallen in love with India, her weavers and textile traditions. John came to India as a consultant to the Central Cottage Industries Corporation - CCIC. He was brought in on a grant by the Ford Foundation, to make Indian crafts and textiles more exportable. As soon as he came, he spent three weeks travelling to Calicut, Travancore and Cochin. He strongly felt that he could not learn anything about India if he lived in luxury. Two years spent travelling through India, convinced John that the handloom process was just as valuable as the product. John Bissell started Fabindia in 1960 in the two small rooms adjoining his bedroom in his Golf Links flat, by the name “Fabindia Inc.”, as it was incorporated in Connecticut. He used his recently deceased grandmother's $20,000 legacy as start-up capital. John led a remarkably philanthropic life. He believed in fair and equitable relationship to the extent that the entire costing process was displayed for all to see. John believed in having entire families work under the same roof, he believed in relationship building. He was often seen in a plain kurta, Nehru jacket and sandals – a walking ad for the Fabindia look (Singh, 2010).
International Journal of Management Research, Vol. 4, No. 1 & 2 December 2013
45
The initial years were a struggle. The turning point came when he forged a link with the Khera family – who had a carpet business in Panipat and decided to manufacture for Fabindia. The supply mainly went to Terence Conran of Habitat, a leading European alternate retail chain. These partnerships put Fabindia on the success path. The more he travelled in India, the more John realized that there was a vacuum between the people producing these fabrics and the final products that went into the market. He wanted to create a channel right from the village weavers to the export market so that the cash would flow back to these families. John Bissell spurred Indian handlooms picking up intensely intricate weavers and found a market for them as durries, bedspreads, curtains or cloths. But to him it was also imperative that India’s weavers and artisans profit from their time-honored skills. Abdul Ghani, one of the oldest block printers in Jaipur, approached John to provide Fabindia with hand blocks and gradually moved on to printing fabrics for them. “Thanks to the Bissell, there is no dearth of business and the payments are made on time” (Singh, 2010). John helped not only artisans but also young designers looking out for independent ventures. Bissell himself initiated Archana Shah who used to sell her sketches for durries to Fabindia, into Bandhej. “John Bissell asked me to start manufacturing and not just sell designs. He also provided me the capital to start a business and that’s how Bandej came into place” says Shah, who started selling out from an old haveli in Ahmedabad (ibid) On 2 March 1998, John Bissell, remembered as ‘relationship builder’, passed away. Singh mentions in her book that even during his illness (he met with a cerebral stroke), he dropped money on the way and donated his month’s salary to charity. “There was not a single person associated with him, who did not mourn his death”. John’s son William took over Fabindia in 1999 and became the company’s managing director and went on to become an ‘empire builder’. William Bissell – ‘The Empire Builder’: William was an undergraduate from Wesleyan University, who had majored in philosophy, political science and government, and had spent several years in Jodhpur, since completing his education in 1988. William, working with rural artisans and crafts co-operatives across Rajasthan, was successful in the setting up of various weavers' cooperatives. His strong belief that middle class Indian consumers could be nudged towards better appreciation of India’s traditional crafts and skills prompted Fabindia in 1992-93 to shift focus from the export market to the domestic one. This strategy has resulted in Fabindia growing from a one-store show in mid-1990s to 170 stores in 74 cities in the year 2013. Bissell's working style and his vision for Fabindia are a curious mix of a Fabian mission with capitalist goals. Personally he works with American professionalism, has a Marwari's acute sense of business and also possesses unparalleled compassion that endears him to the artisans who work for Fabindia. His vision is that in the ensuing months, the team at Fabindia work towards weaving 'trust' into Fabindia's business model in a way that works for employees, artisans and, the company's bottom line.
International Journal of Management Research, Vol. 4, No. 1 & 2 December 2013
46
William is of a strong belief that inclusive growth holds great promise. Fabindia converted the entire supply chain to COCs – Community Owned Companies - within just 18 months. Willam is a staunch believer in “intellectual capital”. “Physical capital” has become a commodity, he says. In research, design, invention, intellectual capital is far more important (Kaushal, 2010). Retail was a small part of Fabindia’s business until the mid-to-late 1990s when William Bissell took over the company from his father John Bissell and transformed it into a national retail brand. This paper now concentrates on various aspects that show the enormous growth that this company has seen over the last five decades (see Exhibit 4) Fabindia – Five decades of doing business with a difference Inclusive Capitalism: What is fascinating about Fabindia’s growth model? The answer to this question lies in their ability to pursue the conflicting goals of profitability and social mission together. Its founding mission of creating sustainable employment for weavers and traditional handicraft artisans in rural India, William Bissell created a unique Community Owned Companies (COC) business model. It is the second big revolution in India after Amul. It empowered the suppliers, and enabled their growth, along with the growth of the company. William calls this model as ‘Inclusive capitalism’ (COCs, converting artisans into assets, and sharing the growth and wealth with them). “If capitalism is inclusive, its chances of getting a bad name go down,” says William. “I always felt that people undersold their skills. Today, even an unskilled worker can get NREGA work, which pays Rs. 120-125, or even Rs 150 a day. For a person who is a craftsman that becomes his baseline”. William is of the view that if they convert their suppliers or artisans into COCs it will be a strong asset for Fabindia. It also helps the company pare its logistics cost and source material from several warehouses from where goods go directly to Fabindia stores (Choudhury, 2012). William conceptualized the COC concept in 2007, when Fabindia was faced with the logistical nightmare of sourcing products from thousands of artisans scattered across the country. The artisans were then organized into 17 COCs based on their geographical locations. Fabindia now sources all its products only from these companies. And each of these companies in turn sources from artisans in their respective regions. He formed the Artisans Micro Finance Private Limited (AMFPL) venture fund, which is a fully owned subsidiary of Fabindia. Through this fund, he set up Supply Region Companies (SRC) which is owned partly (49 percent) by Fabindia through AMFPL, and also partly, (26 percent) by the rural artisans (These artisans are the main suppliers of Fabindia). (see Exhibit 3) This ownership structure is mutually beneficial for the artisans as well as the company. Benefits for the Artisans:
Sustained employment, higher wages
Additional income as dividend
Capital appreciation Benefits for Fabindia
Supply chain less unwieldy, closer to sourcing of better quality
International Journal of Management Research, Vol. 4, No. 1 & 2 December 2013
47
Larger artisan base, variety in products
Happier suppliers
Satisfaction of leading a movement for change The 17 COCs are in the following areas: Faridabad, Jaipur, Jodhpur, Bikaner, West Bengal, Bhuj, Chanderi, Ahmedabad, Amroha, Bijnor, Delhi(A), Mumbai, Bangalore, Andhra Pradesh, Chennai, Delhi(B) and Ghaziabad. COC model links 80,000 craft-based rural artisans to the modern market. Although these SRCs are not listed on stock exchange, Fabindia provides an internal mechanism to trade in these shares, thus ensuring liquidity of shares for the artisans. This model empowers the stakeholders of the company. Diversification in the Merchandise Mix: Fabindia products are divided into three broad categories – basic, handmade and artisan. The basic category offers only essentials like a simple kurta. The second category of handmade products, which forms the bulk of Fabindia, offers stuff from reasonable skilled craftsman, while the artisan stores sells works of master craftsman. Over its fabulous fifty years Fabindia has diversified into newer and innovative products. “We have tied up with some Delhi publishers to get children’s book; that goes well with our range of children’s wear,” says Bissell (Kumar & Tarafdar, 2010). Fabindia is gambling on diversification from its core business of Indian textiles and home products including furniture, lights and lamps, stationary, home accessories, pottery and cutlery. “Diversification can harm the basic core of any business, but not for us,” says Shilpa Sharma, head of product design and buying. “Our base for the organic food business is low but has shown 100 times growth in past two years. Keeping this in mind, we are trying to promote our organic and body care product line more aggressively. Crucially, organic products fetch a 20 – 30 percent higher price than inorganic products in the world market”. Sharma firmly believes that anyone buying clothes from Fabindia will also try out its organic products and other items. “I pitched for jewellery last year and kept in mind that it should complement our range of textiles – this completes the ensemble and is well within our parameter. So, like jewellery, our range of organic food products is also a natural extension” (Kumar & Tarafdar, 2010). Fabindia’s product range varies from textile based to non- textile introductions (see Exhibit 1) The expansion in merchandize mix is mainly done through customer feedback especially that of its loyal customers. Fabindia - Consumer mindset: Fabindia believes, “A delighted Customer is our Best Brand Ambassador”. Instead of following the customer acquisition, it focuses on customer retention strategy. William Bissell is clear about one thing: the consumer decides how profitable this company is going to be. “There are many customers who have grown up with Fabindia. Markets vary with consumer mindset. While the Kerala market makes good sales, Ludhiana does not invoke as much profit.” But there is one thing he firmly believes in: the key is to make full use of what is intrinsic to India. With the wide range of products, Fabindia introduced shopping on a wider canvas and bring a sense of Indian-ness to everyday things (Kumar, 2010). Bissell is proud to have esblished a successful retail engine and an engine of trust.
International Journal of Management Research, Vol. 4, No. 1 & 2 December 2013
48
Fabindia – Growth and Recognitions: Fabindia has 1,200-odd employees and 17 community-owned companies or supplier region companies (SRCs), as they are called, employing 86,000 artisans at the grassroots. It's a revolutionary business idea wherein eventually, the artisans own a piece of Fabindia, either directly or through the SRCs or the clusters they belong to. On its 50th anniversary, Fabindia took the leap of making all the employees as its shareholders. Bissell wants to reverse the traditional models of capitalism by widening the base of shareholders and what that means is his own stake is diluted every time the number of shareholders goes up. With the company touching Rs 1,000 crore in annual sales, Bissell feels the time is just right for another breakthrough. While margins, unlike in John Bissell’s famous openly displayed account sheets, are no longer in the public domain, the company officially says it is more focused on profitable growth than chasing top line. In 2010 the company was recognized as one of the most innovative models by a Monitor- Business Today survey conducted across industry. In 2009 the company was featured as an example of Game-changers by Business Week, the international business magazine. In 2008 Fabindia was named one of India's Top Marketers by Business Today, India's leading business magazine. In 2004, Fabindia was featured as part of a CNBC special TV report on India. Fabindia was awarded ‘Best Retail Brand’ in 2004 by The Economic Times of India. (www.fabindia.com) Recent Developments Armed with a degree in philosophy, political science and governance from Wesleyan University in the US, Bissell knows the value market-based mechanisms can trigger at the bottom of the pyramid (where artisans form the base of his supply chain). There are new Private Equity players who have posited faith in Bissell's model of inclusive capitalism. LVMH’s PE buys 8% in Fabindia: Private equity firm L Capital – backed by Louis Vuitton Moet Hennessy (LVMH), the world’s biggest luxury goods group, has bought an 8% stake held by Wolfensohn Capital Parteners in unlisted Indian ethnic wear chain Fabindia. The valuation and terms of the agreement were not immediately available. Media reports have valued Fabindia at about Rs.1.400 crores ($283 million). L capital Asia launched a $640 million fund in the year 2011 targeting emerging economies including China and India. (Economic Times – 16th February 2012) Premji Fund – picks up 7% in Fabindia: The investment fund owned by Wipro’s billionaire Chairman, Azim Premji has acquired a 7 % stake in Fabindia for Rs 100 – 125 crores, valuing the company at over Rs 1,500 crores. William Bissell says, “We chose Premji investment because we share a similar ethos”, (Economic Times – 1 March 2012). The PE companies bring a different kind of legitimacy to Bissell's business model, with financial recognition, good management practices, tech transfers, and in some cases, like in the case of PremjiInvest, a huge amount of credibility. Despite Fabindia's business model having a social ring to it, investors flocked. That's heartening for Bissell who is now well set on expansion and raring to take a dilution of his family's majority stake in the company. “Actually, when it comes to taking a dilution to admit the poor, then you are voting with your wallet. Voting with your wallet is much more serious than voting with your tongue, and they (PE investors) voted with their wallet,” he says.

International Journal of Management Research, Vol. 4, No. 1 & 2 December 2013
49
Fabindia launches its latest range from Trishla Jains’s art: Fabindia has teamed up with artist Trishla Jain for a limited edition collection of furniture, furnishings, giftware, ceramics and garments inspired by the young painter’s art. “It is good to be a leader in trends. We decided early in 2012 to make 2013 the year of the artist and the makers. We wanted to feature people who are at the cusp of art, design and craft” says William Bissell. (Economic Times 27 February 2013). Jain, a Stanford University graduate and a self-taught artist, started painting at the age of seven. She always wanted to create everyday objects inspired by her art. “Fabindia has greatly expanded the technical and aesthetic possibilities of my art. These art objects give my work a utilitarian aspect as well as allows me to reach a larger public” says Jain (ibid). It took almost a year for Fabindia to translate Jain’s artwork into products. After the Fabindia designs conceptualized Jain’s artwork and came up with the product designs, the production was done by a wide network of Fabindia artisans and crafts-people sread across the country. The products are priced from Rs. 60 to Rs. 25,000. As a limited-edition collection, the products are priced at about 20% premium. A spectacular five decades journey of Fabindia makes one believe in the fact that in the future not only will its stores be available at a location near you, but also Fabindia craftsmen and stakeholders will spread across the country. Future Challenges It is a big challenge for William to always keep the founding mission of Fabindia in mind, balancing social and business interests. He has to wrestle with the task of reconciling the interest of two diverse sets of shareholders – poor artisans on the one hand and a global luxury brand on the other. The artisans, though not shareholders as yet, have helped Fabindia become one of the most profitable retailers in the country. On the other hand, L capital – the private equity arm of LVMH that has bought 8% stake in Fablindia. The two are as incompatible as roti and caviar. Though it may just be a question of perception management, but the biggest query that is coming up is will Private equity dilute Fabindia’s values and social objects? Besides there are issues on having to make some compromise: for instance, the senior management team had been involved in discussions on whether the use of polyester thread to sew the garments was aligned with Fabindia ideology. So there are certain compromises that the company has had to make. With foreign brands entering the Indian markets competitive landscape has rapidly changed. The newly burgeoning middle class with unprecedented disposable income – the western brand-conscious consumer - has made it attractive for the western brands to enter the Indian market. As a result, Fabindia faces stiff competition, especially in the apparel segment. Besides western brands, some competitors are backed by powerful Indian conglomerates such as the Tata Group, ITC and Reliance. Fabindia also faces competition from the mom-and-pop stores that are deeply imbedded in local communities and tailors – especially in the smaller towns of India. Unfortunately Fabindia is not alone in the niche of traditional weaves and prints. Its main competitors in that niche are Khadi, Anokhi, Good Earth and Cottons (Khaire, 2007).
International Journal of Management Research, Vol. 4, No. 1 & 2 December 2013
50
In the domestic furnishings sector also Fabindia faces stiff competition. Furnishing giants such as Welspun and Spaces focused their attention on the domestic market. S Kumars developed a home-textile brand – Carmichael House, which was one of the many competitors of Fabindia. One of the challenges for Fabindia is to make larger number of the customer aware of its social mission. They need to start investing in advertisement and brand building around its social commitment. To increase the customer base, it has to create awareness about its products. Conclusion Indian businesses have realized the importance of doing business differently and a step in this direction is sharing wealth with company employees. There is an increased focus on making employees an equal partner in the company’s shareholding. “Companies find inclusive capitalism a good business model where profits soar as employees put in their best, knowing they own the firm”, says Shallesh Harbhakti, member, corporate governance committee, CII and Assocham (Kaushal, 2010). The cases of inclusive capitalism are on the rise. We have to forget the five-year old ways of doing business. Businesses have to become more equitable. For example modern garment retailer Koutons sees this is a sustainable long-term strategy. According to D.P.S Kohli – Chairman, Koutons India, “the employee equity run businesses are the most apt in today’s world. Even I see my company following the same in the coming few years”. ‘Equitable distribution of wealth’, will be the mantra for the 21st century. As William puts it, “I believe that the only way to alleviate rural poverty is to generate sustainable employment, and the only way to do that is if we run our business in a profitable manner. It seems contradictory that we pursue both a social goal and profit, but I believe that is the only way to do it”. References Alluri, A. (May-June 2011). John Bissell and his Fab dream. Housecalls Vol. 13, issue 2 , 70-
76. Bajaj, K. (2008, November 16). Style, substance and purpose. Business Today , p. 78. Bajpai, N. (2009, May 3). Prints os Success. The Week , pp. 58-61. Bhargava, A. (2008, June 18). The amazing success story of Fabindia. Retrieved June 5, 2013,
from Business Standards: http://specials.rediff.com/money/2008/jun/18s14.htm Bissell, W. (2009). Making India Work. New Delhi: Penguin. Chatterjee, P. and Chakravarty, C. (2012, March 1). Premji Fund Picks up 7% in Fabindia. The
Economic Times . Choudhury, M. (2012, September 10). The fabulous story behind Fabindia. The Viewspaper . Desai, A. V. (2010, April 20). Idealist Entrepreneur. The Telegraph . Fabindia Fashions Latest Range From Trishla's Art. (2013, February 27). The Economic Times Gopal, P. (2011, January 28). Fab fifty. The Hindu . Kaushal, R. (2010, January 1). Inclusive growth comes to India Inc. Mail Today . Khaire, M. and Kothandaraman, P. (March 20, 2007). Fabindia Overseas Pvt. Ltd. Harvard
Business School , 9-807-113. Kumar, R. and Tarafdar, S. . (2010, October 17). Fabulous Fifty. Business India , pp. 170 - 174. LVMH's PE Arm Buys 8% in Fabindia. (2012, February 16). The Economic Times .

International Journal of Management Research, Vol. 4, No. 1 & 2 December 2013
51
Pande, B. and Chakrabarty, C. (2010, October 12). Fruits of the loom. The Economic Times . Pandey, B. (2012, July 25). Not Easy to Balance Social, Biz Interest. The Economic Times . Panicker, L. (2010, November 27). Weaving the threads of a sucess story. HIndustan Times . Singh, R. (2010). The Fabric of our lives - The story of Fabindia. New Delhi: Penguin Exhibit 1 – Product Diversification at Fabindia
Exhibit 2 – Price range of products at Fabindia
Accessories(Rs.150-25000)
Price Range
Organics(Rs.150-Rs.1500)
PersonalCare(Rs.100-Rs.1500)
Garments(Rs.290-Rs.14000)
Home Products
Soft HomeRs.45-Rs .15000
Hard HomeRs.500-
Rs70,000
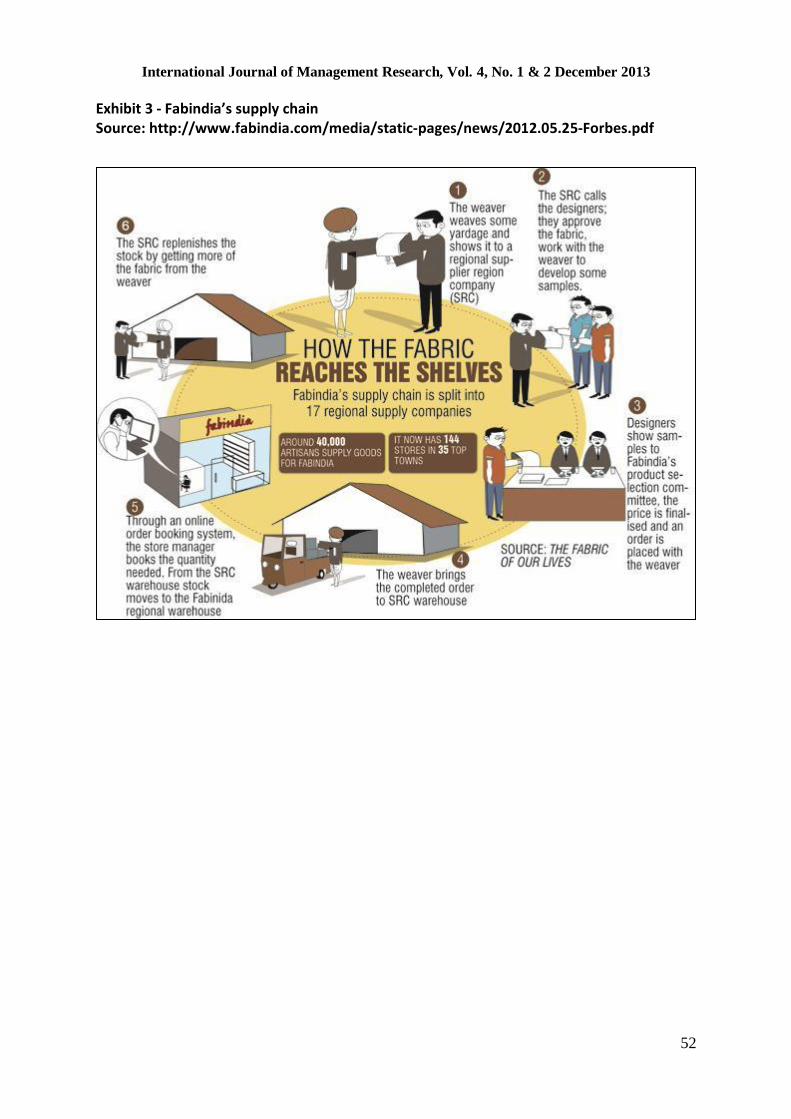
International Journal of Management Research, Vol. 4, No. 1 & 2 December 2013
52
Exhibit 3 - Fabindia’s supply chain Source: http://www.fabindia.com/media/static-pages/news/2012.05.25-Forbes.pdf

International Journal of Management Research, Vol. 4, No. 1 & 2 December 2013
53
Exhibit 4 - Fifty Years of Fabindia
1958
John Bissell arrives in
India on 15th
August on a
two-year contract from
Food Foundation to work
with the nascent Indian
crafts set up
1960
Fabindia founded by
Bissell, incorporated
as Fabindia Inc in the
US in November
1965
Panipat`s A.S. Khera
becomes a supplier of
carpets – a connection
that will be crucial to
the Fabindia growth
story
1958-60
Travels across the
country, meeting
craftsmen
1967
Fabindia is making
upholstery and
durries and trying
out Kurtas, Kaftans
and shirts
1976
Due to regulations,
registers as an Indian
company; 40% of the
company is with
shareholders, and 60%
with Bissell`s family
and friends
1976
First retail store
in Greater
Kailash I, Delhi
1976-90
Fabindia became a
global name, known for
garments made from
hand woven and hand
printed fabrics
1980
Ready-to-wear
garments introduced
in the early part of
the decade
1994
Second store
at Vasant Kunj,
Delhi
1966
Bissell meets Terence
Conran, whose
company Habitat is a
major customer for
more than two
decades
1990-98
Transition
years
1998
John Bissell
dies
1999
William takeover
as MD, refocuses
on domestic
market
2000
First foray beyond
textiles and home
furnishing into
home products
2003
Vision plan to
make Fabindia a 1
billion INR
company in 4 yrs,
achieved in 2 yrs.
2004
Organic food
added to the
product offering
2004
Fabindia opens
outlet in Dubai
2006
Personal care
products
introduced
2007
Welfensohn capital
partners, a private equity
firm funded by former
World Bank president
James Welfensohn,
acquires 6% stake in
Fabindia for 11$ million
2010
Fabindia
crosses 100
stores
2009
Fabindia acquires
25% stake in UK
retail chain, East
2007
Fabindia hives off section to
form Artisans Microfinance,
a firm investing in
community based
companies or supplier-
region companies (SRC)
2008
Handcrafted
jewellery becomes
part of Fabindia
offering

International Journal of Management Research, Vol. 4, No. 1 & 2 December 2013
54
Impact of Quality of Work Life on Employee Trust
Shivani Agarwal, Pooja Garg & Renu Rastogi
Indian Institute of Technology, Roorkee (India) E-mail: [email protected], [email protected], [email protected]
Abstract
The purpose of the study is to focus on the relationship between quality of work life and trust and examining how the quality of work life affects the core dimensions of trust (cognition based trust and affect based trust).A total of 213 managers were surveyed with a questionnaire that assessed and revealed a strong significant relationship among the stated variables. Correlation and Stepwise regression analysis were employed to test the proposed hypotheses. Throughout the study, promising developments are highlighted, limitations are noted, and suggestions for future research are provided. Keywords: Quality of work life, Trust, Managers, IT sector
Introduction In today’s dynamic environment, work is the theme of season, people are more and more getting workaholic as work is the integral part of our everyday life, as it is our livelihood or career or business. We spend twelve hours at our workplace daily on an average i.e. one- third of our entire life. Many authors have noted that workers are becoming better educated and that they now consider work as a tool for personal growth and social support rather than merely a means of achieving financial independence (Kerce and Booth-Kewley, 1993). A high Quality of work life is essential for organizations to continue, to attract and retain employees (Sandrick, 2003). Many factors contribute to QWL which includes adequate and fair remuneration, safe and healthy working conditions and social integration in the work organization that enables an individual to develop and use all his or her capacities: it holds that people are the most important resource in the organization as they are trustworthy, responsible and capable of making valuable contribution and they should be treated with dignity and respect (Straw, R.J. and C.C. Heckscher, 1984).
QWL programs were originally based on the intellectual and practical pioneering of Eric Trist and his colleagues at Tavistock Institute in London. Current programs are based on the efforts of American quality control experts working in Japan after World War II with William Deming. In early 1960 the concept of Quality of work life was first came into the light but it was probably coined originally at the first international conference on Quality of work life at Arden House in 1972 (Louis Davis & Cherns, 1975). The concept has definitely led organizations to become innovative, flexible, productive and responsive for their survival and success. Recent studies found evidence that QWL is related to job satisfaction and also appear to capture the essence in human performance. Moreover, the concept is particularly important in the manufacturing sectors and has been
International Journal of Management Research, Vol. 4, No. 1 & 2 December 2013
55
implemented in auto, steels and in many other organizations. But the concept has been neglected in the study of IT industry. Smart managers know that their brainpower alone is not enough, they also know that capital investment alone is not enough and Psychologists have also assumed that to meet the new standards (i.e. “To get your work done in very efficient manner, much before deadlines, meeting all expectations, and avoiding unnecessary work”.) that have been set for IT industry, personnel must go well beyond formal relationship (i.e. they need Social support). The concept of Quality of work life has created waves in the field of organizational behavior. Research in organizational psychology and organizational behaviour literature has identified the existence of multiple dimensions of QWL and found different relationships between these dimensions and important organizational factors and outcomes. In an attempt to add to the efforts to clarify these relationships, this study focuses on the relationships between QWL and organizational Trust. Conceptualizing the Variables Quality of work life: QWL is a comprehensive, department- wide program designated to improve employee satisfaction, strengthening workplace learning and helping employees (Anonymous 2005).
Besides this, Angus S. McDonald (2001) provided a multi-dimensional scale consisted of seven dimensions that make up this construct. The seven dimensions identified by McDonald (2001) are:
Support from manager/Supervisor (SMS): The ease with which employees feel they can talk to their manager/supervisor. Whether they receive sufficient supervision and feel that they have adequate knowledge to guide and advise them.
Freedom from work related stress (FWS): The extent to which employees feel their workload is generally reasonable. Whether their physical health may suffer due to their working environment
Salary and additional benefits (SAB): Perceptions of adequacy of salary level in terms of the work and their education, previous work experience and responsibilities at work.
Job satisfaction, challenge, use of skills and autonomy (JSCA): Whether work is perceived enjoyable, challenging, stimulating and offering variety. The degree to which employees feel they are generally told what to do at work, and not offered sufficient autonomy. The degree to which employees uses their skills and learn new ones.
Relationship with work colleague (RWC): The extent to which there are opportunities to develop good working relationship and sometimes colleague can be a source of stress.
Involvement and responsibility at work (IRW): The extent to which employees would like to given more responsibility for their own work and to become involved in different aspects of organization’s work.
Communication, Decision making and job security (CDJ): The extent to which employees feel they are well informed about the work. Perceived job security and whether organizational changes may make employees feel that they will need to look for other employment.
International Journal of Management Research, Vol. 4, No. 1 & 2 December 2013
56
Trust: According to Möllering et al., (2004), the word “trust” dates back to the 13th century and has its roots in expressions symbolizing faithfulness and loyalty, but the concept of trust is probably as old as the earliest forms of human association. Trust is a multidimensional construct (Cufaude, 1999; Maren et al., 1999; Sparks, 2000) involving interpersonal trust (Davis, 1999; Gomez and Rosen, 2001; Mikulincer, 1997; Omodei and McLennan, 2000) or dyadic trust (Gurtman, 1992; Larzelere and Huston, 1980; Matthews and Shimoff, 1979), inter-organizational trust (Bell et al., 2002; Davenport et al., 1999; Huff and Kelley, forthcoming), political trust (Hetherington, 1998; Parker, 1989; Parker and Parker, 1993), societal trust (Muller and Mitchell, 1994; Oxendinea et al., 2003; Shah et al., 2001), peer trust in the workplace (Ammeter, 2000; Holton, 2001; McAllister, 1995), trust between superiors and subordinates (Barling et al., 2003; Cherry, 2000; Costigan et al., 1998; Dirks and Ferrin, 2002; Korsgaard et al., 2002; Velez, 2000), and organizational trust (Armstrong-Stassen et al., 2001; Courtney, 1998; Daley and Vasu, 1998; Gilbert and Tang, 1998; Shockley-Zalabak et al., 2000). Daniel J. McAllister defined trust as “The extent to which a person is confident in and willing to act on the basis of, the words, actions and decisions, of another”. It has two dimensions. These are:-
Cognition based trust: The basis of cognition-based trust is cognitive reasoning i.e. trust based on evidence and judgments about the competence and reliability of a person. It is built by self-perception and self-interest through direct interactions with a partner. Cognition based trust is based on the factual knowledge the trustor has of the trustee.
Affect based trust: It is built by a social emotional bond that goes beyond a regular business or professional relationship. The emotional ties linking individuals provide the basis for affect-based trust. Affect-based trust is developed through the indirect interactions with the trustee, such as input from others’ recommendation, rather than the trustee. It is worthy of note that affect-based trust is a further development of cognitive trust (Chen et al., 1998).
Literature Review Quality of work life: QWL have been divergent views as to what really it is. It has become an umbrella term for a host of activities that has been defined differently by different people at different times. The concept of QWL is considered as multi- dimensional (Davis and Cherns, 1975; Lee and Kanungo, 1984; Mirves and Lawler, 1984). Lawler (1984) suggested that QWL was associated with satisfaction with wages, hours and working conditions, describing the “basic elements of a good quality of work life” as: safe work environment, equitable wages, equal employment opportunities and opportunities for advancement. Sirgy et al.; (2001) suggested that the key factors in QWL are: Need satisfaction based on job requirements, Need satisfaction based on Work environment, Need satisfaction based on supervisory behaviour, Need satisfaction based on Ancillary programmes, Organizational commitment. The empirical study was done to predict QWL in relation to career-related dimensions (Raduan Che Rose et al. 2007). The results indicate that three variables are significant: career satisfaction, career achievement, career balance, with 63 percent of the variance in QWL.

International Journal of Management Research, Vol. 4, No. 1 & 2 December 2013
57
Burton J. Cohen, Susan C. Kinnevy, and Melissa E. Dichter (2007), in their study, compare the quality of work life of child protective investigators in two very different organizational settings:(A public child welfare agency and A law enforcement agency). The finding indicates that while both groups had similar demographic characteristics and perceptions if their role, the investigators who worked for the public child welfare agency experienced a higher quality of work life than those who worked for the law enforcement agency. Trust: Researches related to trust, in organizational relationships, the basis of trust must be extended beyond personal and individual relationships (Blomqvist & Stahle, 2000). It is important to note that many scholars believe that interpersonal and inter-organizational trusts are related but they are different constructs. The link between personal and organizational trust has not been clear. It would seem logical to say that it is always the people and not organizations that trust each other. Exchanges between firms are exchanges between individuals or small groups of individuals (e.g., Blomqvist & Stahle, 2000; Barney & Hansen, 1994; Creed & Miles, 1996; Möllering et al., 2004; Zaheer et al., 1998). Cook et al. (2005) suggested some support for this, saying that “when supervisors treat workers as if they are reliable, workers are more likely to become reliable”. Webber and Klimoski (2004) reported that reliable employee performance can yield increases in trust. Though these findings suggest a reverse causal ordering of the trust and behaviour variables, Webber and Klimoski added that causality could not be established with their research design Research on trust has commonly been related to positive organizational outcomes, like increased competitiveness (Seppänen et al.,2007), higher organizational performance (Child and Möllering,2003), reduced transaction costs (Dyer and Chu, 2003), increased communication and knowledge exchange (Andrews and Delahaye, 2000), enhanced mutual learning (Bakker et al., 2006; Gubbins and MacCurtain, 2008; Nonaka and Takeuchi, 1995) and to have a positive impact on safety culture and safety performance (Burns et al., 2006; Conchie et al., 2006; Conchie and Donald, 2006, 2008; Hale, 2000; Reason, 1997). Hypotheses The study has been initiated to verify the following hypotheses: H1: There is significant relationship between Quality of work life and trust. Also, there is a significant relationship between dimensions of Quality of work life and dimensions of trust (Cognition based trust and Affect based trust). H2: Quality of work life will significantly predict trust. H3: Quality of work life will significantly predict dimensions of trust (Cognition based trust). H4: Quality of work life will significantly predict dimensions of trust (Affect based trust). Research Methodology Sample: The sample consisted of 213 employees working at different managerial levels from IT industries. A total of 300 survey instrument were distributed out of which 248 were returned. Out of these questionnaires, 35 had to be rejected because of high number of missing data. Questionnaire was distributed among employees through personal contacts with prior permission from the organizations. Accompanying each questionnaire will be a letter explaining the purpose of the study. Along with the questionnaires there will be a
International Journal of Management Research, Vol. 4, No. 1 & 2 December 2013
58
Performa which will be completed by the employees regarding demographic variables as: Name; Age; Sex; Educational Qualification; Tenure; Rank; Salary and Marital Status. Instruments used: Quality of work life (QWL): To measure QWL, scale developed by Angus S. McDonald (2001) was used. The items in the scale are designed to measure seven dimensions of QWL identified as Support from manager/supervisor; Freedom from work-related stress; Salary and additional benefits; Job satisfaction, challenge, use of skills and autonomy; Relationship with work colleague; Involvement and responsibility at work; and Communication, decision making and job security. The items will be rated on a 6-point scale with the reliability co-efficient of the scale as .94. Trust: To measure trust, scale developed by McAllister (1995) will be used. The items in the scale are designed to measure two dimensions of trust identified as affect- and cognition-based trust levels was developed and consisted of 11 Likert-type items, 6 assessing levels of cognition based trust(0.91) , and 5 assessing affect-based trust(0.89) will respond on a 7-point format, ranging from 1= Strongly Disagree to 6=Strongly Agree. The internal consistencies of the dimensions have been defined within the parentheses. Analysis of results: For the analysis of results, means and SDs was calculated. Furthermore, Pearson correlation and Stepwise Regression Analysis was used to study the relationships between the variables. For the analysis of data SPSS v. 17 was used. Results & Analysis Descriptive statistics of the variables that have been examined in the study are reported in Table 1, including sum, means and standard deviation. H1: There is significant relationship between Quality of work life and trust. Also, there is a significant relationship between dimensions of Quality of work life and dimensions of trust (Cognition based trust and Affect based trust). Table 2 represents a significant relationship between Quality of work life and trust (on over-all basis) with the calculated r=-.26(significant at .01 level).The correlation between the dimensions of Quality of work life and dimensions of trust has been discussed separately in a more detailed fashion in Table 1, under the pertinent headings. Table 1 contains the means, standard deviations and Pearson correlations of the independent and dependent variables. It represents a significant relationship between Quality of work life (QWL) and Trust (on over-all basis) with the calculated r=0.26 (significant at .01 level). There is significant, although moderate correlation of support from supervisor (SMS) with affect based trust, with the calculated correlation value as: .17 (sig. at .05 level). It can also be noted that there is significant correlation between SMS and cognition based trust, with the calculated r as .22 (sig. at .01 level).Another dimension, i.e., FWS is significantly correlated with Trust, with the calculated correlation values as: .29, .31 respectively, for affect based trust and cognition based trust (significant at 0.01 level). It can also be noted that the correlation between SAB and affect based trust and cognition based trust is low with the calculated r-value as: .02 and .08. There is significant correlation JSCA
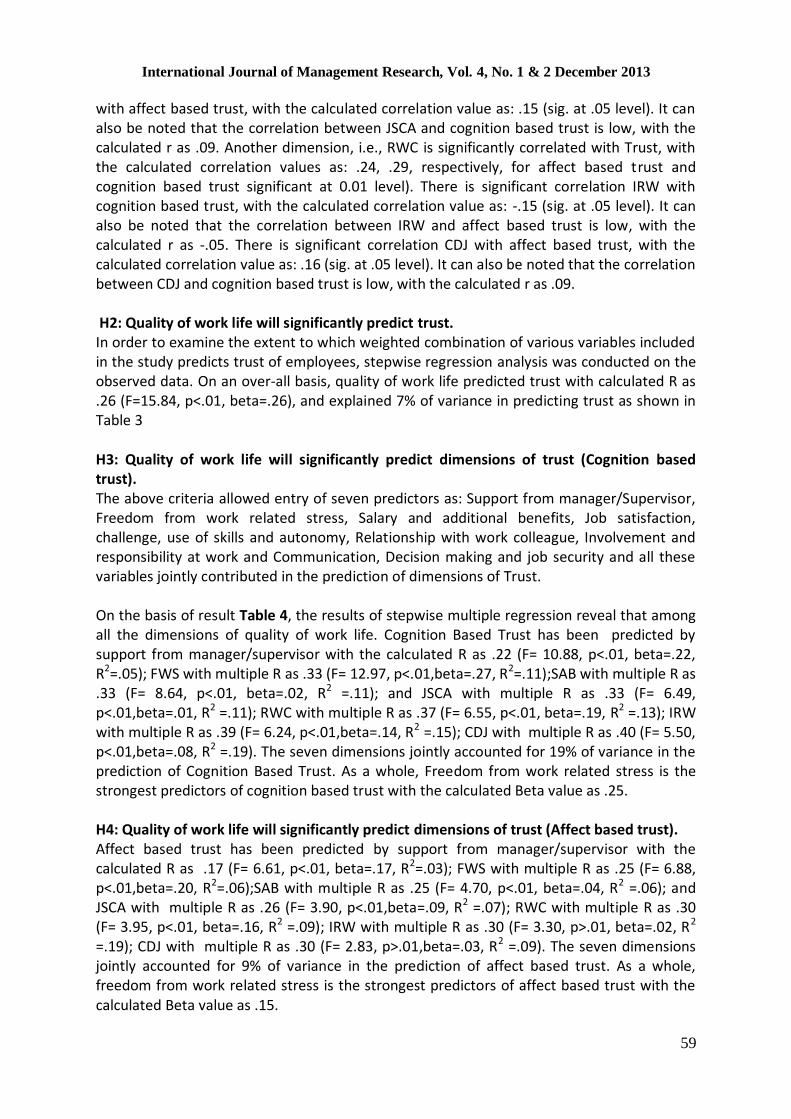
International Journal of Management Research, Vol. 4, No. 1 & 2 December 2013
59
with affect based trust, with the calculated correlation value as: .15 (sig. at .05 level). It can also be noted that the correlation between JSCA and cognition based trust is low, with the calculated r as .09. Another dimension, i.e., RWC is significantly correlated with Trust, with the calculated correlation values as: .24, .29, respectively, for affect based trust and cognition based trust significant at 0.01 level). There is significant correlation IRW with cognition based trust, with the calculated correlation value as: -.15 (sig. at .05 level). It can also be noted that the correlation between IRW and affect based trust is low, with the calculated r as -.05. There is significant correlation CDJ with affect based trust, with the calculated correlation value as: .16 (sig. at .05 level). It can also be noted that the correlation between CDJ and cognition based trust is low, with the calculated r as .09. H2: Quality of work life will significantly predict trust. In order to examine the extent to which weighted combination of various variables included in the study predicts trust of employees, stepwise regression analysis was conducted on the observed data. On an over-all basis, quality of work life predicted trust with calculated R as .26 (F=15.84, p<.01, beta=.26), and explained 7% of variance in predicting trust as shown in Table 3 H3: Quality of work life will significantly predict dimensions of trust (Cognition based trust). The above criteria allowed entry of seven predictors as: Support from manager/Supervisor, Freedom from work related stress, Salary and additional benefits, Job satisfaction, challenge, use of skills and autonomy, Relationship with work colleague, Involvement and responsibility at work and Communication, Decision making and job security and all these variables jointly contributed in the prediction of dimensions of Trust. On the basis of result Table 4, the results of stepwise multiple regression reveal that among all the dimensions of quality of work life. Cognition Based Trust has been predicted by support from manager/supervisor with the calculated R as .22 (F= 10.88, p<.01, beta=.22, R2=.05); FWS with multiple R as .33 (F= 12.97, p<.01,beta=.27, R2=.11);SAB with multiple R as .33 (F= 8.64, p<.01, beta=.02, R2 =.11); and JSCA with multiple R as .33 (F= 6.49, p<.01,beta=.01, R2 =.11); RWC with multiple R as .37 (F= 6.55, p<.01, beta=.19, R2 =.13); IRW with multiple R as .39 (F= 6.24, p<.01,beta=.14, R2 =.15); CDJ with multiple R as .40 (F= 5.50, p<.01,beta=.08, R2 =.19). The seven dimensions jointly accounted for 19% of variance in the prediction of Cognition Based Trust. As a whole, Freedom from work related stress is the strongest predictors of cognition based trust with the calculated Beta value as .25. H4: Quality of work life will significantly predict dimensions of trust (Affect based trust). Affect based trust has been predicted by support from manager/supervisor with the calculated R as .17 (F= 6.61, p<.01, beta=.17, R2=.03); FWS with multiple R as .25 (F= 6.88, p<.01,beta=.20, R2=.06);SAB with multiple R as .25 (F= 4.70, p<.01, beta=.04, R2 =.06); and JSCA with multiple R as .26 (F= 3.90, p<.01,beta=.09, R2 =.07); RWC with multiple R as .30 (F= 3.95, p<.01, beta=.16, R2 =.09); IRW with multiple R as .30 (F= 3.30, p>.01, beta=.02, R2 =.19); CDJ with multiple R as .30 (F= 2.83, p>.01,beta=.03, R2 =.09). The seven dimensions jointly accounted for 9% of variance in the prediction of affect based trust. As a whole, freedom from work related stress is the strongest predictors of affect based trust with the calculated Beta value as .15.

International Journal of Management Research, Vol. 4, No. 1 & 2 December 2013
60
Discussion The study examined the relationship between quality of work life and Trust among IT employees. The results revealed that there is a positive relationship between quality of work life and Trust and also overall QWL has proved to be a significant predictor of Trust. A plausible explanation may be that, positive job experiences (freedom, low stress, support and supervision of the senior officers and participation in decision making procedures) leads to amplified the level of trust among IT employees and feel empowered for decision making, and experience autonomy which further generate the feelings of being accepted, continued growth, perceive purpose in life and more participation in professional and personal domains of life. Evidence of such a relationship among QWL and Trust can also be found in the study conducted by (Robyn Peterson, 1999). In recent years, researchers have increasingly stressed the role of supportive relations in facilitating work-recovery processes and reducing the harmful effects of a heavy workload (Sonnentag & Zijlstra, 2006). i.e. quality and trust are inextricably linked with each other and the organizations should work on building cultures of trust, not cultures of distrust for their own continuing well-being. In summary, results suggested that among all the dimensions of Quality of work life, freedom from work related stress plays a significant role i.e. Positive experiences at workplace also direct employees to thrive and experience progress and momentum marked by a sense of learning (greater understanding and knowledge) (Johnson, et al., 1998), and sense of vitality (aliveness) and such behaviors allow individuals to judge what they are doing and how they are doing and help them to develop in a positive direction and finally spurts one’s self-development, emotional literacy and emotional alchemy which enable them to realize their full potential which helps organizations in winning the “War for Talent”. Conclusion, Limitations and Recommendations In this cut throat competition arena, multinational organization needs to conducts its operation based on the doctrine of developing and nurturing its people anchored on the principles of quality of work life. Trust is considered at the interpersonal level, reflecting the relationship between employer and employee (Marlow & Patton, 2002). The study extends the QWL and Trust literature by examining a wide range of factors which may affect IT professionals’ towards their work life and non-work life domain. Results of this study have practical implications for the organizations interested in implementing quality of work life programmes, as the variables QWL and Trust, in this fashion will definitely create an opportunity for HR managers to consider the essence of QWL within organizations which can lead to instigation of Trust among employees from the over-all life-satisfaction perspective. The sample size is low and sample has been selected from a particular region of NCR, India. It would be more appropriate and interesting to select a diverse sample from other states and cultures which can depict a clear picture of the IT organizations. It is recommended to present a comparison between QWL and Trust in these findings can be extended to other professionals and non-professionals employed in other industries.
International Journal of Management Research, Vol. 4, No. 1 & 2 December 2013
61
References Ammeter, A.P.F. (2000). Determinants of interpersonal trust in workgroup relationships.
Dissertation Abstracts International, UMI No. 3004207. Andrews, K.M., Delahaye, B.L. (2000). Influences of knowledge process in organizational
learning: The psychological filter. Journal of Management Studies, Vol. 37, No. 6, pp. 797-811.
Armstrong-Stassen, M., Cameron, S.J., Mantler, J. and Horsburgh, M. E. (2001). The impact of hospital amalgamation on the job attitudes of nurses. Revue Canadienne des Sciences de l’ Administration, Vol. 18, No. 3, pp. 149-62.
Barling, J., Kelloway, E. K. and Iverson, R. D. (2003). Accidental outcomes: Attitudinal consequences of workplace injuries. Journal of Occupational Health Psychology, Vol. 8, No. 1, pp. 74-85.
Barney J. B., & Hansen M. H. (1994). Trustworthiness as a source of competitive advantage. Strategic Management Journal, Vol. 15, pp. 175-190.
Bell, G. G., Oppenheimer, R.J. and Bastein, A. (2002). Trust deterioration in an international buyer-supplier relationship. Journal of Business Ethics, Vol. 36, No. 1/2, pp. 65-78.
Blomqvist, K., & Stahle, P. (2000). Building organizational trust. Paper presented at the 16th Annual IMP Conference, Bath, UK.
Burns, C., Mearns, K., Mcgeorge, P. (2006). Explicit and implicit trust within safety culture. Risk Analysis, Vol. 26, No. 5, pp. 1139-1150.
Burton J. Cohen, Susan C. Kinnevy, and Melissa E. Dichter (2007). The quality of work life of child protective investigators: A comparison of two work environments. Children and Youth Services Review, Vol. 29, pp. 474-489.
Cherry, B.W. (2000). The antecedents of trust in a manager: The subordinate tells the story of time. Dissertation Abstracts International, UMI No. 9965903.
Child J, Mollering G. (2003). Contextual confidence and active trust development in the Chinese business environment. Organ Sci. Vol. 14, No. 1, pp. 69-80.
Costigan, R. D., Ilter, S. S. and Berman, J. J. (1998). A multi-dimensional study of trust in organizations. Journal of Managerial Issues, Vol. 10, No. 3, pp. 303-17.
Courtney, S.L (1998). Impact of trust on employee perceptions of organizational and leader effectiveness. Dissertation Abstracts International, UMI No. 9821684.
Creed, W. E. D., & Miles, R. E. (1996). Trust in organizations: A conceptual framework linking organizational forms, managerial philosophies, and the opportunity costs of controls. In R.M. Kramer & T.R. Tyler (Eds.), Trust in organizations: Fronteirs of theory and research. Thousand Oaks, CA: Sage Publications.
Cronchie, S. M., Donals, I. J. (2008). The functions and development of safety- specific trust and dis-trust. Safety Science, Vol. 46, pp. 92-103.
Cronchie, S. M., Donals, I. J., Taylor, P. J. (2006). Trust: Misiing Piece(s) in the safety Puzzle. Risk Analysis, Vol. 26, No. 5, pp. 1097-1104.
Cufaude, J. (1999). Creating organizational trust. Association Management, Vol. 51, No. 7, pp. 26-35.
Daley, D. M. and Vasu, M. L. (1998). Fostering organizational trust in North Carolina: The pivotal role of administrators and political leaders. Administration and Society, Vol. 30, No. 1, pp. 61-85.
Davenport, S, Davies, J. and Grimes, C. (1999). Collaborative research programmes: Building trust from difference. Technovation, Vol. 19, pp. 31-40.

International Journal of Management Research, Vol. 4, No. 1 & 2 December 2013
62
Davis Louis F, Cherns. Albert B. (1975). The Quality of Working life II New York: The free press, pp 349.
Davis, G. M. W. (1999). A test of an interpersonal trust model. Dissertation Abstracts International, UMI No. 9935685.
Dirks, K. T. & Ferrin, D. L. (2002). Trust in leadership: Meta-analytic findings and implications for research and practice. Journal of Applied Psychology, Vol. 87, No. 4, pp. 611-28.
Dyer J. H. & Chu W. (2000). The determinants of trust in supplier- automaker relationships in the US. Japan and Korea. J Int Stud. Vol. 21 No. 2, pp. 259-85.
Gilbert, J. A. and Tang, T. L. (1998). An examination of organizational trust antecedents”, Public Personnel Management, Vol. 27, No. 3, pp. 321-38.
Gomez, C. and Rosen, B. (2001). The leader-member exchange as a link between managerial trust and employee empowerment. Group and Organizational Management, Vol. 26, No.1, pp. 53-69.
Gubbins, C., & MacCurtain, S. (2008). Understanding the dynamics of collective learning: The role of trust and social capital. Advances in Developing Human Resources, Vol. 10, pp. 578-599.
Gurtman, M. B (1992). Trust, distrust, and interpersonal problems: a circumplex analysis. Journal of Personality and Social Psychology, Vol. 62, No. 6, pp. 989-1002.
Hale, A. (2000). Editorial: Cultures confusion. Safety Science, Vol. 34, pp. 1-14. Hetherington, M. J. (1998). The political relevance of political trust. The American Political
Science Review, Vol. 92, No. 4, pp. 791-808. Holton, J. A. (2001). Building trust and collaboration in a virtual team. Team Performance
Management: An International Journal, Vol. 7 No. 3/4, pp. 36-47. Johnson, S. D., Johnson, D. M., & Golden, P. A. (1996). Enhancing perceived learning within
the simulated marketing environment. Marketing Education Review, 6, 1-9. Kerce, E.W. and S. Booth-Kewley (1993). Quality of work life surveys in organizations:
Methods and benefits, in Sage Focus (eds.), Improving Organizational Surveys: New Directions, Methods, and Applications (Sage Publications, Thousand Oaks, CA), pp. 188-209.
Korsgaard, M.A., Brodt, S. E. & Whitener, E. M. (2002). Trust in the face of conflict: the role of managerial trustworthy behavior and organizational context. Journal of Applied Psychology, Vol. 87, No. 2, pp. 312-9.
Larzelere, R. E. & Huston, T. L. (1980). The dyadic trust scale: Toward understanding interpersonal trust in close relationships. Journal of Marriage and the Family, Vol. 42, No. 3, pp. 595-604.
Lawler, E. E. (1982). Strategies for improving the quality of work life. American Psychologist, Vol. 37, pp. 486-693.
Louis, Davis & Cherns Albert, B. (1975). The Quality of working Life. Vol. 1, Free Press, New York.
Maren, R. S., Wicks, A. C. & Huber. V. L. (1999). Cooperating with the disempowered using ESOPS to forge a stakeholder relationship by anchoring employee trust in workplace participation programs. Business and Society, Vol. 38 No. 1, pp. 51-83.
Matthews, B. A. & Shimoff, E. (1979). Expansion of exchange: Monitoring trust levels in ongoing exchange relations. Journal of Conflict Resolution, Vol. 23, No. 3, pp. 538-60.
Mc Allister, D. J. (1995). Affect- and cognition-based trust as foundations for interpersonal cooperation in organizations. Academy of Management Journal, Vol. 38 No. 1, pp. 24-59.

International Journal of Management Research, Vol. 4, No. 1 & 2 December 2013
63
Mikulincer, M. (1997). Attachment working models and the sense of trust: An exploration of interaction goals and affect regulation. Journal of Personality and Social Psychology, Vol. 74, No. 5, pp. 1209-24.
Mirvis, P. H. & Lawler, E. E. (1984). Accounting for the Quality of Working life. Journal of Occupational Behaviour, pp.197-212.
Mollering, G., Bachman, R., & Lee, S. H. (2004). Understanding organizational trust – foundations, constellations, and issues of operationalization. Journal of Managerial Psychology. Vol. 19, No. 6, pp. 556-570.
Muller, E. N. & Mitchell, A. S. (1994). Civic culture and democracy: The question of casual relationships. American Political Science Review, Vol. 88 No. 3, pp. 635-53.
Nonaka, I. & Takeuchi, H. (1995). The knowledge creating company. New York: Oxford University Press.
Omodei, M. M. & McLennan, J. (2000). Conceptualizing and measuring global interpersonal mistrust-trust. The Journal of Social Psychology, Vol. 40, No. 3, pp. 279.
Oxendinea, A., Borgidab, E., Sullivana, J. L. and Jackson, M. S. (2003). The importance of trust and community in developing and maintaining a community of electronic network. International Journal of Human-Computer Studies, Vol. 58, pp. 671-96.
Parker, G. R. (1989). The role of constituent trust in congressional elections. Public Opinion Quarterly, Vol. 53, No. 2, pp. 175-96.
Parker, S. L. & Parker, G. R. (1993). Why do we trust our congressmen? The Journal of Politics, Vol. 55, No. 2, pp. 442-53.
Radaun che Rose & Naresh Kumar (2007). Blockade for career Advancement in Japanese Organization Abroad: The Case of Malaysian Subsidiaries. American Journal of Applied Sciences, Vol. 4 No. 1, pp. 8-13.
Reason, J. (1997). Managing the Risk of Organizational Accidents. Ashgate, USA. Robyn Peterson, (1998). Trust for quality. The TQM Magazine, Vol. 10, No.6, pp. 413-416. Sandrick K. (2003). Putting the emphasis on employees as an award. Winning employer,
Baptist health care has distant memories of the workforce shortage, Trustee. pp. 6-10.
Seppanen, R., Blomqvist, K., Sundqvist, S. (2007). Measuring inter-organizational trust- A critical review of the empirical research in 1990-2003. Industrial Marketing Management, Vol. 36, pp. 249-265.
Shah, D. V., Kwak, N. & Holbert, R. L. (2011). Connecting’ and ‘disconnecting’ with civic life: Patterns of internet use and the production of social capital. Political Communication, Vol. 18, No. 2, pp. 141-62.
Shockley-Zalabak, P., Ellis, K. and Winograd, G. (2000). Organizational trust: What it means, why it matters. Organizational Development Journal, Vol. 18, No. 4, pp. 35-48.
Sirgy, M. J., Efraty., D., Siegel, P. & Lee, D. (2001). A new measure of quality of work life (QoWL) based on need satisfaction and spillover theories. Social Indicators Research, Vol.55, pp. 241-302.
Sonnentag, S. (2001). Work, recovery activities and individual well-being: A diary study. Journal of Occupational Health Psychology, Vol. 6, pp. 196-210
Sparks, J. (2000). Exploring trust: A dynamic and multidimensional model of interpersonal trust development in a task setting. Dissertation Abstracts International, UMI No. 3059879.
Straw, R. J. and C. C. Heckscher. (1984). QWL: New working relationships in the communication industry. Labor Studies J., Vol. 9, pp. 261-274.
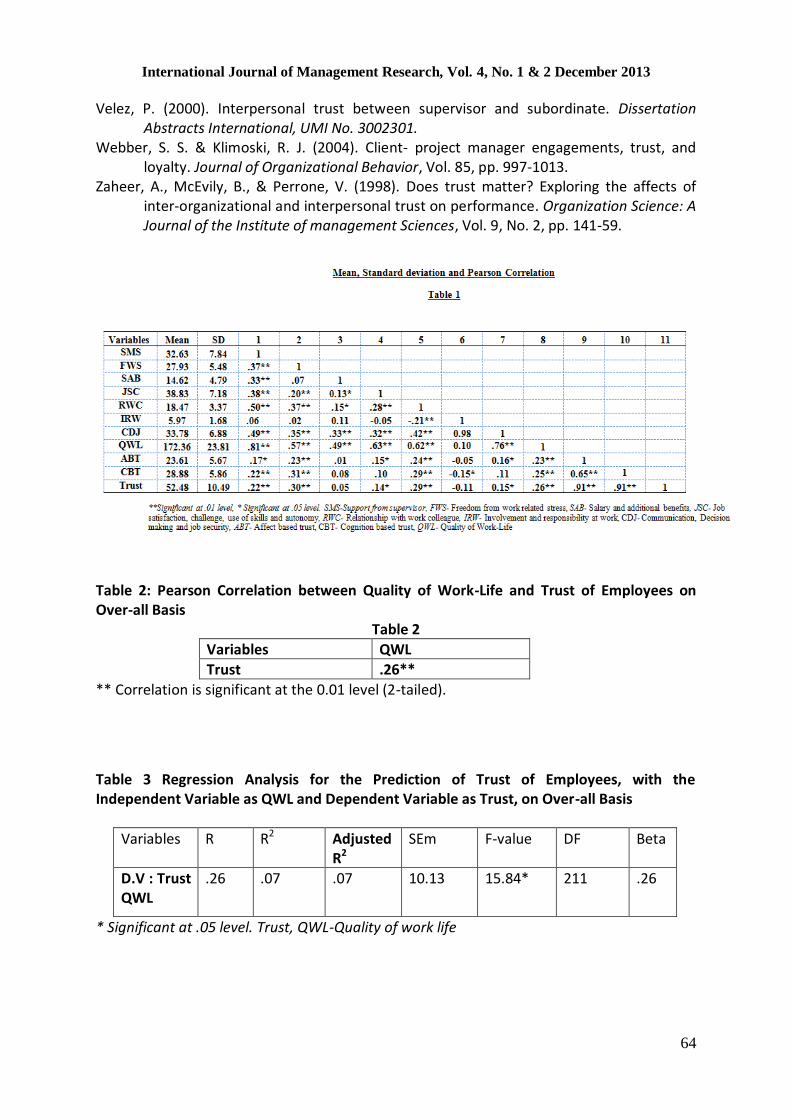
International Journal of Management Research, Vol. 4, No. 1 & 2 December 2013
64
Velez, P. (2000). Interpersonal trust between supervisor and subordinate. Dissertation Abstracts International, UMI No. 3002301.
Webber, S. S. & Klimoski, R. J. (2004). Client- project manager engagements, trust, and loyalty. Journal of Organizational Behavior, Vol. 85, pp. 997-1013.
Zaheer, A., McEvily, B., & Perrone, V. (1998). Does trust matter? Exploring the affects of inter-organizational and interpersonal trust on performance. Organization Science: A Journal of the Institute of management Sciences, Vol. 9, No. 2, pp. 141-59.
Table 2: Pearson Correlation between Quality of Work-Life and Trust of Employees on Over-all Basis
Table 2
Variables QWL
Trust .26**
** Correlation is significant at the 0.01 level (2-tailed).
Table 3 Regression Analysis for the Prediction of Trust of Employees, with the Independent Variable as QWL and Dependent Variable as Trust, on Over-all Basis
Variables R R2 Adjusted R2
SEm F-value DF Beta
D.V : Trust QWL
.26 .07 .07 10.13 15.84* 211 .26
* Significant at .05 level. Trust, QWL-Quality of work life

International Journal of Management Research, Vol. 4, No. 1 & 2 December 2013
65
Table 4: Stepwise Regression Analysis for the Prediction of Trust of Employees, with the Independent Variable as QWL and Dependent Variable as Trust
Variables R R2 Adj R2
SEm
F-value
DF Beta
D.V: Affect-Based Trust SMS
.17
.03
.03
5.60
6.61*
1,211
.17
SMS, FWS .25
.06
.05
5.52
6.88* 1,210
.11, .20
SMS, FWS, SAB .25
.06
.05
5.53
4.70* 1,209
.12, .19, .04
SMS, FWS, SAB,JSC SMS, FWS, SAB,JSC,RWC SMS, FWS, SAB,JSC,RWC,IRW SMS,FWS,SAB,JSC,RWC,IRW,CDJ
.26 .30 .30 .30
.07 .09 .09 .09
.05 .07 .06 .06
5.52 5.48 5.50 5.51
3.90* 3.95* 3.30 2.83
1,208 1,207 1,206 1,205
.09, .18, .04, .09
.03,.15,.04,.07,.16
.03,.15,.04,.07,.15,.02
.02,.15,.05,.07,.14,.02,
.03
D.V: Cognition- Based Trust SMS
.22
.05
.05
5.72
10.88*
1,211
.22
SMS, FWS .33
.11
.10
5.55
12.97*
1,210
.12, .27
SMS, FWS, SAB . 33
.11
.10
5.57
8.64* 1,209
.12, .27, .02
SMS, FWS, SAB,JSC SMS, FWS, SAB,JSC,RWC SMS, FWS, SAB,JSC,RWC,IRW SMS,FWS,SAB,JSC,RWC,IRW,CDJ
.33 .37 .39 .40
.11 .13 .15 .19
.10 .12 .13 .13
5.58 5.51 5.47 5.47
6.49* 6.55 6.24 5.50
1,208 1,207 1,206 1,205
.12, .27, .02, .01
.04,.23,.02,.02,.19
.07,.24,.04,.03,.15,
.14
.08,.25,.05,.02,.17,
.13,.08
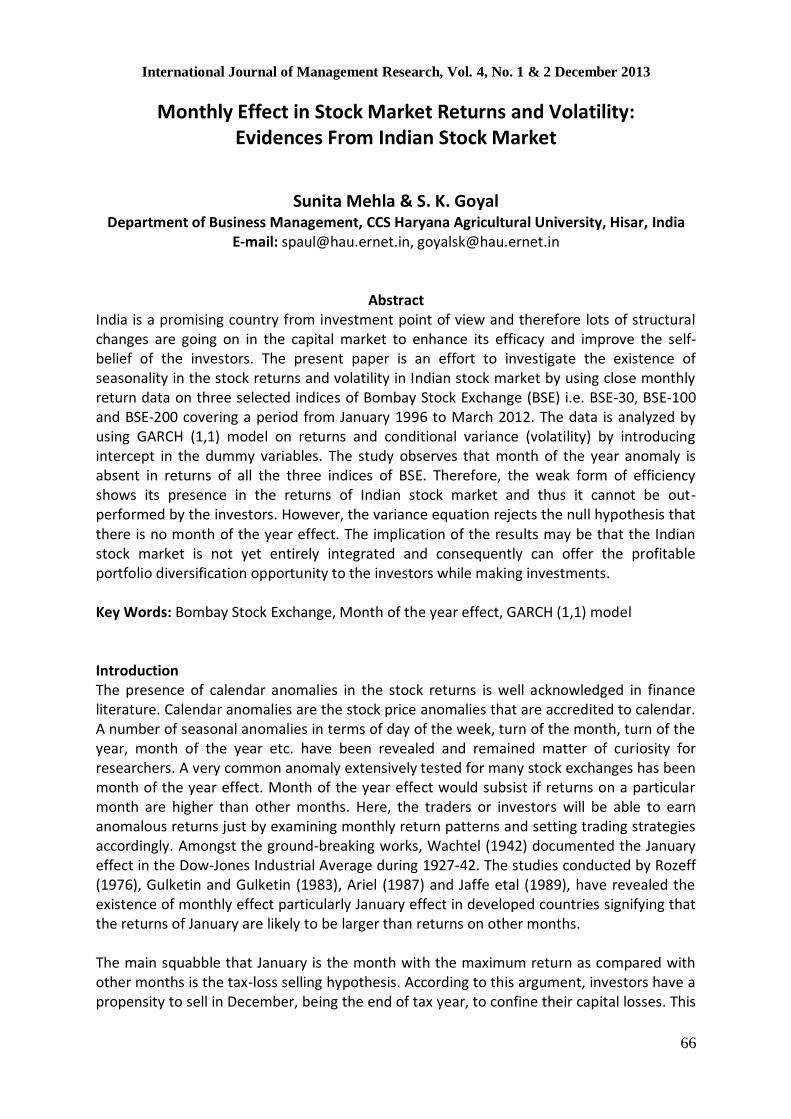
International Journal of Management Research, Vol. 4, No. 1 & 2 December 2013
66
Monthly Effect in Stock Market Returns and Volatility: Evidences From Indian Stock Market
Sunita Mehla & S. K. Goyal
Department of Business Management, CCS Haryana Agricultural University, Hisar, India E-mail: [email protected], [email protected]
Abstract
India is a promising country from investment point of view and therefore lots of structural changes are going on in the capital market to enhance its efficacy and improve the self-belief of the investors. The present paper is an effort to investigate the existence of seasonality in the stock returns and volatility in Indian stock market by using close monthly return data on three selected indices of Bombay Stock Exchange (BSE) i.e. BSE-30, BSE-100 and BSE-200 covering a period from January 1996 to March 2012. The data is analyzed by using GARCH (1,1) model on returns and conditional variance (volatility) by introducing intercept in the dummy variables. The study observes that month of the year anomaly is absent in returns of all the three indices of BSE. Therefore, the weak form of efficiency shows its presence in the returns of Indian stock market and thus it cannot be out-performed by the investors. However, the variance equation rejects the null hypothesis that there is no month of the year effect. The implication of the results may be that the Indian stock market is not yet entirely integrated and consequently can offer the profitable portfolio diversification opportunity to the investors while making investments. Key Words: Bombay Stock Exchange, Month of the year effect, GARCH (1,1) model
Introduction The presence of calendar anomalies in the stock returns is well acknowledged in finance literature. Calendar anomalies are the stock price anomalies that are accredited to calendar. A number of seasonal anomalies in terms of day of the week, turn of the month, turn of the year, month of the year etc. have been revealed and remained matter of curiosity for researchers. A very common anomaly extensively tested for many stock exchanges has been month of the year effect. Month of the year effect would subsist if returns on a particular month are higher than other months. Here, the traders or investors will be able to earn anomalous returns just by examining monthly return patterns and setting trading strategies accordingly. Amongst the ground-breaking works, Wachtel (1942) documented the January effect in the Dow-Jones Industrial Average during 1927-42. The studies conducted by Rozeff (1976), Gulketin and Gulketin (1983), Ariel (1987) and Jaffe etal (1989), have revealed the existence of monthly effect particularly January effect in developed countries signifying that the returns of January are likely to be larger than returns on other months. The main squabble that January is the month with the maximum return as compared with other months is the tax-loss selling hypothesis. According to this argument, investors have a propensity to sell in December, being the end of tax year, to confine their capital losses. This

International Journal of Management Research, Vol. 4, No. 1 & 2 December 2013
67
helps them in dropping tax paid by them on their gains. As a result of this sliding trend in market, stock prices go down. With the start of new tax year in January, investors again procure the securities and this upward trend pushes the stock prices up (Branch (1977), Reinganum (1983) and Ritter (1988). Primarily the tax loss hypothesis is supported in most countries where the tax year ends in December (Agathee, 2008). Ignatius (1998) gave evidence for the December effect by examining seasonality in Bombay Stock Exchange index and in the Standard and Poor’s 500 stock indexes for the period 1979-1990. Ignatius found that December generated the highest mean returns, and that April and June generated high returns in the Indian stock index. Pandey (2002) confirmed a tax-loss-selling hypothesis in the Indian market explaining the presence of abnormal returns in April. On the other hand, Roll (1983) argued that there was support of January effect in other countries where there was no tax binding on capital gains and also in countries where tax year does not commence in January. His words were reinforced by Brown etal (1983) who showed a January effect in Australia though the tax year ends in June. Further, Kato and Schallheim (1985) argued that in Japan neither capital gains tax nor tax benefits on losses existed, the country still demonstrated a January effect. Another perception on January anomaly is based on the window dressing activity of institutional investors. Fund managers at the end of the year rebalance their portfolios by selling small and dicey stocks held by them to keep themselves away from such stocks at year end. They continue with only good return stocks in their portfolio. The fund managers reverse the course of action and start selling winners detained by them in the month of January. It implies an upward demand in the market and so haughty returns in January (Lakonishok, 1988). This hypothesis has been supported by Sias and Starks (1997), Musto (1999), Meier and Schaumburg (2004), and Sias (2007). While investigating January effect for polish stock exchange, Henke (2003) also documented that since no taxes are levied on capital gains, tax loss selling hypothesis is out of question and window dressing by institutional investors is the only basis for boost in trading volume during December and January. Another justification to elucidate the January anomaly is the declaration of new information by the firms (Rozeff and Kinney, 1976). When new affirmative information reaches the market, investors show signs of enthusiasm to buy the scraps, thereby, pushing the prices bullish and providing lofty returns to investors. India is an emerging capital market and there are many institutional reforms going on to meet the requirements of growing internationalization of the world market. Due to increased attention accorded by capital market analyst and portfolio managers towards Indian capital market, the present study makes an attempt to examine whether India, offers evidences for month of the year anomaly. Selected indices of Bombay Stock Exchange have been used for the analysis. The Bombay Stock Exchange is the oldest exchange in Asia. The equity market capitalization of the companies listed on the BSE was US$1 trillion as on December 2011, making it the 6th largest stock exchange in Asia and the 14th largest in the world. The BSE has the largest number of listed companies in the world. There are over 5,133 listed Indian companies and over 8,196 securities on the stock exchange as on March 2012 (Wikipedia).
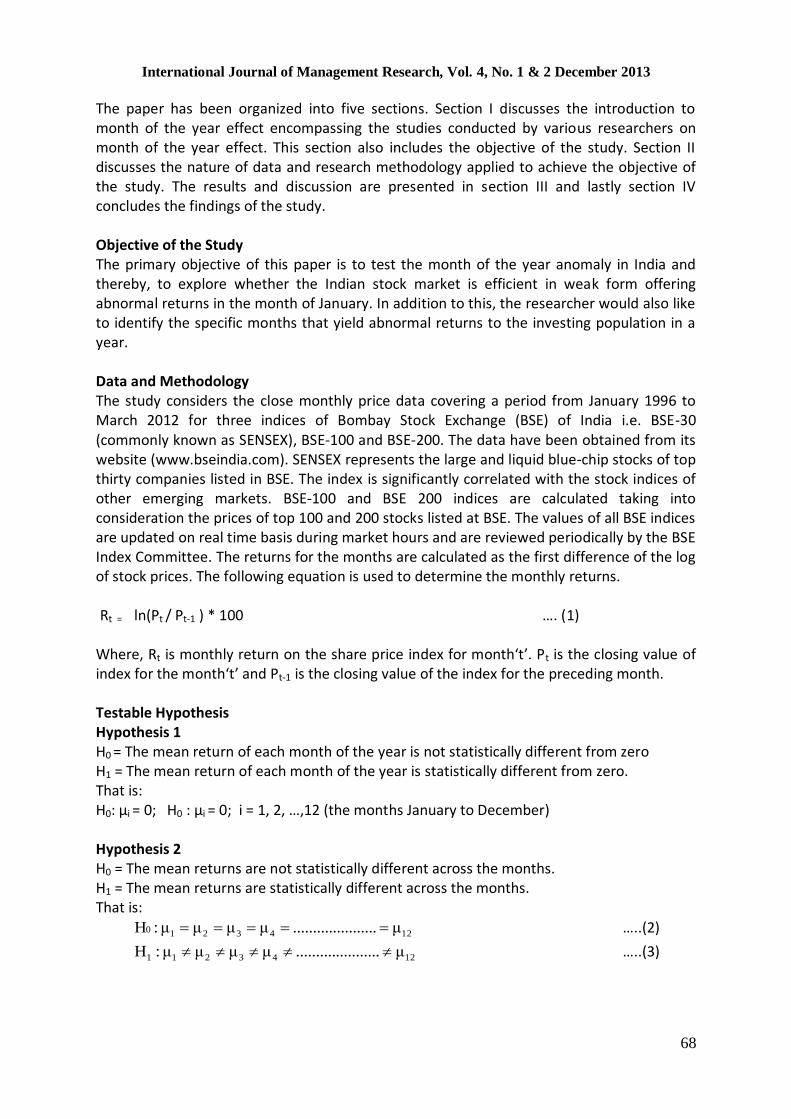
International Journal of Management Research, Vol. 4, No. 1 & 2 December 2013
68
The paper has been organized into five sections. Section I discusses the introduction to month of the year effect encompassing the studies conducted by various researchers on month of the year effect. This section also includes the objective of the study. Section II discusses the nature of data and research methodology applied to achieve the objective of the study. The results and discussion are presented in section III and lastly section IV concludes the findings of the study. Objective of the Study The primary objective of this paper is to test the month of the year anomaly in India and thereby, to explore whether the Indian stock market is efficient in weak form offering abnormal returns in the month of January. In addition to this, the researcher would also like to identify the specific months that yield abnormal returns to the investing population in a year. Data and Methodology The study considers the close monthly price data covering a period from January 1996 to March 2012 for three indices of Bombay Stock Exchange (BSE) of India i.e. BSE-30 (commonly known as SENSEX), BSE-100 and BSE-200. The data have been obtained from its website (www.bseindia.com). SENSEX represents the large and liquid blue-chip stocks of top thirty companies listed in BSE. The index is significantly correlated with the stock indices of other emerging markets. BSE-100 and BSE 200 indices are calculated taking into consideration the prices of top 100 and 200 stocks listed at BSE. The values of all BSE indices are updated on real time basis during market hours and are reviewed periodically by the BSE Index Committee. The returns for the months are calculated as the first difference of the log of stock prices. The following equation is used to determine the monthly returns. Rt = ln(Pt / Pt-1 ) * 100 …. (1) Where, Rt is monthly return on the share price index for month‘t’. Pt is the closing value of index for the month‘t’ and Pt-1 is the closing value of the index for the preceding month. Testable Hypothesis Hypothesis 1 H0 = The mean return of each month of the year is not statistically different from zero H1 = The mean return of each month of the year is statistically different from zero. That is: H0: μi = 0; H0 : μi = 0; i = 1, 2, …,12 (the months January to December) Hypothesis 2 H0 = The mean returns are not statistically different across the months. H1 = The mean returns are statistically different across the months. That is:
1243210 μ.....................μμμμ:H …..(2)
1243211 μ.....................μμμμ:H …..(3)

International Journal of Management Research, Vol. 4, No. 1 & 2 December 2013
69
To test whether the average monthly returns on all the months of the year are statistically different from zero or not, one-sample t-test is used. Next we tested whether the average monthly returns on every month of the year is statistically equal or not. For testing this hypothesis, we have used single factor ANOVA. Unit root test is conducted to verify the stationary properties of the time series data. The formal test of stationarity i.e. the Augmented Dickey-Fuller (ADF) test has been used for this purpose. Many earlier studies investigating the month of the year effect in mean returns employ the conventional OLS methodology on defined dummy variables. However, use of the standard OLS methodology by regressing returns on twelve daily dummy variables has two drawbacks. First, error in the model may be auto-correlated resulting in misleading inferences. To address this drawback, we can include lagged values of the return variables in the model with the following stochastic equation:
n
1it1titDtMAtAtMtFct εRαDα.......................MaαAαMαFααR …. (4)
Where Rt represents return on a selected index. Ft, Mt, At, Mat ……..and Dt are the dummy variables for February, March, April,…..and December at time t. The dummy variable takes the value of unity for a given month and a value of zero for all other months. Where Ft= 1 if month t is February and 0 otherwise; Mt = 1 if t is a March and 0 otherwise and so on. We omit January’s dummy variable from the equation to avoid dummy variable trap. The lag order n is specified by the final prediction error criterion (FPEC) in such a way that it eliminates autocorrelation in the residual. The second drawback is that error variances may not be constant over time. To overcome this problem we allow variances of errors to be time dependent to include a conditional heteroskedasticity that captures time variation of variance in stock returns. The following GARCH (p,q) model proposed initially by Engle (1982) and further developed by Bollerslev (1986) is used in analyzing the behavior of the time series over time:
p
1i
2it
q
1i
2it
2t hh ii0 …. (5)
Thus, the error terms have a mean of zero and time changing variance. We consider two models to investigate the month of the year effect in both return and volatility equations. The first model consists of the following two equations:
n
1it1titDtMAtAtMtFct εRαDα.......................MaαAαMαFααR …. (6)
21t
21t0
2t hεβh 21 …. (7)
In second model, we include some exogenous variables into the GARCH specification. Following Hsieh (1988), Karolyi (1995) and Kiymaz and Berument (2003), we model the conditional variability of stock returns by incorporating the month of the year effect into the volatility equation. Thus, we allow the constant term of the conditional variance equation to

International Journal of Management Research, Vol. 4, No. 1 & 2 December 2013
70
vary for each month. Therefore, our second model is the M-GARCH (1,1) specification of the following form:
n
1it1titDtMAtAtMtFct εRαDα.......................MaαAαMαFααR …. (8)
2
1t22
1t1tDtMAtAtMtFc
2
t hβεβDβ...........................MaβAβMβFββh …. (9)
The parameters of the two different types of specifications for the return and volatility equations are estimated following the quasi-maximum likelihood (QML) estimation introduced by Bollerslev and Wooldridge (1992). Results and Discussion Table 2 presents the descriptive statistics of close return series of BSE-30, BSE-100 and BSE-200. The table shows that there is a moderate difference in the mean return and standard deviation in the close return series of all the three indices of BSE. On comparing the three indices, BSE-200 index depict the highest average return (1.023), whereas, BSE-30 index presents the minimum average return (0.921). With regard to volatility depicted by standard deviation, BSE-100 can be seen as most volatile (8.463) closely followed by BSE-200 (8.431). The lowest volatility is shown by BSE-30 index. Skewness provides an insight about the asymmetry in the distribution of the series. For a normal distribution, the skewness should be zero. The table shows that the sample period has the negative skewness for return series of all the indices. It indicates that stock return series are asymmetric. Further, the return series have kurtosis >3 which implies leptokurtic distribution i.e. peaked tail relative to normal distribution. The Jarque-Bera test indicates that the returns are not normally distributed. Thus, descriptive statistics of whole sample of the three indices indicate that returns exhibit skewness and kurtosis and therefore, are not normally distributed. Table provides the mean and standard deviation of BSE-30, BSE-100 and BSE-200 for close return series after being stratified according to the months. It is interesting to learn from the table that the return series of all the indices present the analogous results. The table shows that the mean return in December is statistically different from zero in all the indices of BSE. Moreover, most of the months detect positive mean returns except January, March, and October but none of them is statistically significant. The highest return is observed in the month of December and is statistically significant whereas October is the month that has lowest returns but is statistically non-significant. Further, the results of F-test signifies that the null hypothesis that the average monthly return is not statistically different across the months cannot be rejected for the close return series of all the indices of BSE as the results do not favour the existence of month of the year effect during this sample period. Thus, in the preliminary analysis, the Indian stock market does not exhibit January effect as well as month of the year effect. The results with regard to volatility are also reasonably comparable in all the three indices of BSE. The highest volatility in the returns can be seen in the months of May and October in all the three indices. On the other hand the least volatile month is December. The highest volatility in the returns can be seen in the months of May and October in all the three indices. On the other hand the least volatile month is December. The highest volatility in the returns can be seen in the months of May and October in all the three indices. On the other hand the least volatile month is December. However, the extent of volatility differs across

International Journal of Management Research, Vol. 4, No. 1 & 2 December 2013
71
the three indices. On comparing the three indices, the month of May depicts highest volatility in BSE-200 (12.198) closely followed by BSE-100 (11.724) and BSE 30 (10.953).Similarly, the month of December observes lowest volatility in BSE-30 (4.414), followed by BSE-200 and BSE-100. The preliminary results are not conventional with risk-return profile, as the most volatile month provides negative returns to the investors and least volatile month provides the highest returns to the investors of Indian stock market. However, it is superb from investors’ outlook that with a reduced amount of risk they are receiving paramount returns. It is well known that the GARCH is an appropriate model to describe the behaviour of stock returns. The results of ADF unit root test conducted to verify the stationary properties of the time series data indicates that all the three return series are stationary (Table 3).Table 4 and 5, report month of the year effect, in stock market returns and volatility (returns only and returns and volatility respectively). Table 4 displays the first estimates of return equation. The FPEC suggests that the order of return equation is zero for all the series under study. It is learnt from the table that the benchmark month in the model is January, represented as constant. Akin to the results presented in Table 3, January provides negative return coefficients for all the indices during the sample period. The dummy variables of all the months with the exception of March and October for BSE-30 index have positive coefficients. The positive coefficients denote that the return of these months is higher than those observed in the month of January. However, the estimated coefficients of the dummy variables for all the months are statistically non-significant for the return series of BSE-30 signifying the absence of month of the year effect in SENSEX. December and October are the highest and the lowest return months respectively. Resembling the return series of BSE-30 index, BSE-100 and BSE-200 indices also depict December as the month of highest return and October as the month of lowest return. However, contrary to BSE 30, highest return in December in both the indices is statistically significant at 1% level. Moreover, the month of April is also statistically different from zero in both the indices. Thus, we can say that December and April reflects anomalous behaviour in returns for BSE-100 and BSE-200 indices as the coefficients of these two months are significant in the mean equation of GARCH model. There are number of reasons as to why December produces abnormal returns compared to any other month in Indian stock market. December falls in the third quarter of the financial year and this quarter has many festivals for Indians to celebrate and most of the Indian and foreign firms in India pay performance bonus to their employees on Diwali and Christmas. Due to more cash in hand and festive season consumer selling shoots up. It gives momentum to industry production resulting in bullish market. The results are in consonance with the Ignatius (1998) who gave evidence for the December effect in BSE On the other hand, it should be noted that the returns for the month March are among the lowest in the year although not statistically different from zero. The reason may be attributed to the fact that the tax settlement month in India is March. However, April provides statistically significant positive returns to investors in the two broader indices of BSE i.e. BSE 100 and BSE 200. As a result, the tax-loss selling hypothesis can be established

International Journal of Management Research, Vol. 4, No. 1 & 2 December 2013
72
in Indian stock market explaining the existence of statistically significant returns in April. Pandey (2002) also confirmed the presence of April effect in Indian stock market. The Wald test has been used to test the null hypothesis that the month of the year dummy variables are jointly equal to zero. The results specify that the null hypothesis that the month of the year effect is jointly equal to zero is accepted for all the three return series. Hence, the month of the year effect is absent for each indices under study. All over again, the outcome of Wald test is parallel to the result obtained by F-test in Table 3. Table also reports the estimates of GARCH (1,1) coefficients. The estimated coefficient of the constant term for the conditional variance equation is 0β while 1
is the estimated
coefficient of the lagged value of the squared residual term. 2 represents the lagged value
of the conditional variance. Each of these coefficients is statistically significant for all return series except 0β and 1
in case of return series of Sensex. Moreover, the sum of 1 and 2
coefficients is less than one for all the three return indices. We also report the Ljung-Box Q statistics for the standardized squared residuals and Engle’s (1982) ARCH-LM test at 5, 10, 15 and 20 lags. All of the coefficients of Q statistics are statistically non-significant except for return series of Sensex at higher lags of 10, 15 and 20. Therefore, we cannot reject the null hypothesis that residuals are not auto-correlated. Further, there is no significant ARCH effect in any of the sampled indexes barring Sensex at 5 lag. Thus, the findings indicate that the standardized squared residual terms have constant variances and do not exhibit autocorrelation. The conditional variance of return is then allowed to change for each month of the year by modeling the conditional variance of return equation as a modified GARCH. This is done to detect the presence of month of the year effect in volatility. Now we re-examine both the returns and conditional variance equation. We exclude the dummy variable for January as mentioned earlier to avoid dummy variable trap and include eleven months of the year as dummy variables. The results are reported in Table 5. The month of the year effect results, with respect to returns, discloses that none of month is statistically significant in all the three indices of BSE. We do not observe the January effect as well as month of the year effect in mean equation. However the similarity to previous results can be witnessed with respect to the highest and lowest returns coefficients which are observed in the month of December and October. Table 5 also presents the results for conditional variance equation. It is found that the estimated coefficients of the dummy variables for all months are statistically non-significant in the variance equation. Here too the effect of January anomaly is not confirmed on its future volatility by its absence in the variance equation. The results of volatile months are analogous to the results depicted in Table 3. The highest volatility occurs in the month of October and May, whereas December is the least volatile month, however none is statistically significant in all the three indices. However, the Wald test rejects the null hypothesis that there is no month of the year effect in the conditional variance equation in all the three indices. Hence, Wald test confirms that month of the year effect is present in variance equations for all the indices under study.
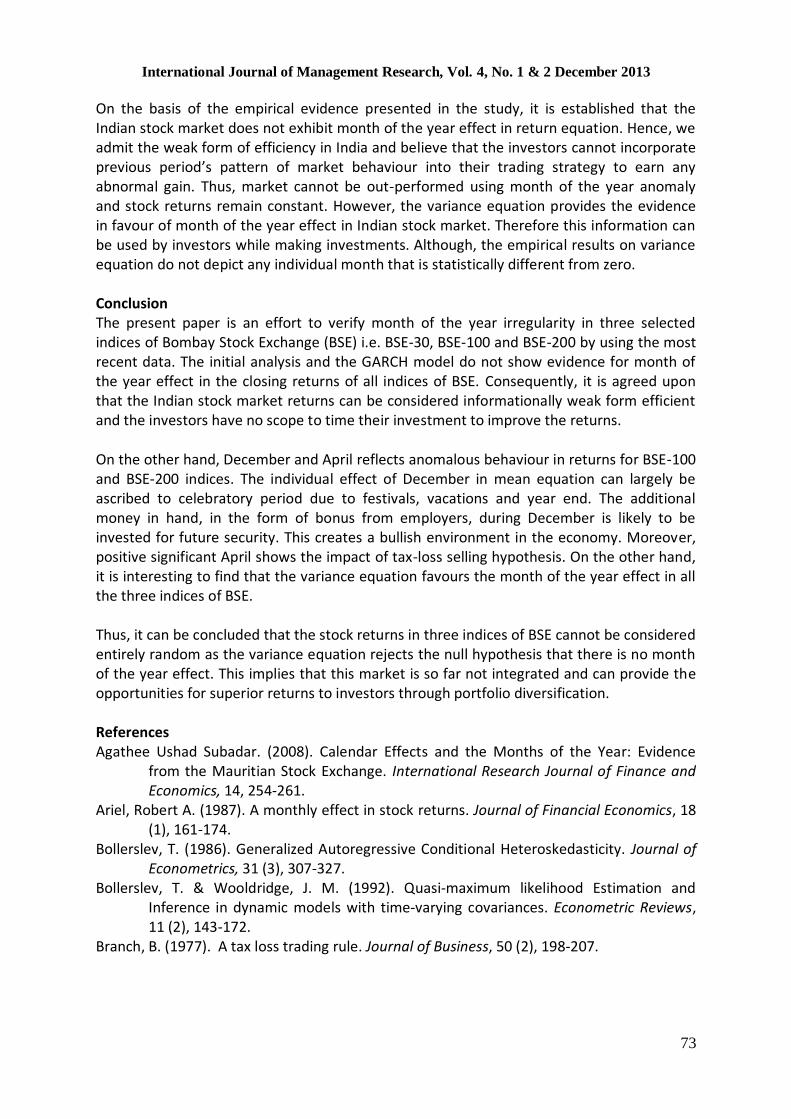
International Journal of Management Research, Vol. 4, No. 1 & 2 December 2013
73
On the basis of the empirical evidence presented in the study, it is established that the Indian stock market does not exhibit month of the year effect in return equation. Hence, we admit the weak form of efficiency in India and believe that the investors cannot incorporate previous period’s pattern of market behaviour into their trading strategy to earn any abnormal gain. Thus, market cannot be out-performed using month of the year anomaly and stock returns remain constant. However, the variance equation provides the evidence in favour of month of the year effect in Indian stock market. Therefore this information can be used by investors while making investments. Although, the empirical results on variance equation do not depict any individual month that is statistically different from zero. Conclusion The present paper is an effort to verify month of the year irregularity in three selected indices of Bombay Stock Exchange (BSE) i.e. BSE-30, BSE-100 and BSE-200 by using the most recent data. The initial analysis and the GARCH model do not show evidence for month of the year effect in the closing returns of all indices of BSE. Consequently, it is agreed upon that the Indian stock market returns can be considered informationally weak form efficient and the investors have no scope to time their investment to improve the returns. On the other hand, December and April reflects anomalous behaviour in returns for BSE-100 and BSE-200 indices. The individual effect of December in mean equation can largely be ascribed to celebratory period due to festivals, vacations and year end. The additional money in hand, in the form of bonus from employers, during December is likely to be invested for future security. This creates a bullish environment in the economy. Moreover, positive significant April shows the impact of tax-loss selling hypothesis. On the other hand, it is interesting to find that the variance equation favours the month of the year effect in all the three indices of BSE. Thus, it can be concluded that the stock returns in three indices of BSE cannot be considered entirely random as the variance equation rejects the null hypothesis that there is no month of the year effect. This implies that this market is so far not integrated and can provide the opportunities for superior returns to investors through portfolio diversification. References Agathee Ushad Subadar. (2008). Calendar Effects and the Months of the Year: Evidence
from the Mauritian Stock Exchange. International Research Journal of Finance and Economics, 14, 254-261.
Ariel, Robert A. (1987). A monthly effect in stock returns. Journal of Financial Economics, 18 (1), 161-174.
Bollerslev, T. (1986). Generalized Autoregressive Conditional Heteroskedasticity. Journal of Econometrics, 31 (3), 307-327.
Bollerslev, T. & Wooldridge, J. M. (1992). Quasi-maximum likelihood Estimation and Inference in dynamic models with time-varying covariances. Econometric Reviews, 11 (2), 143-172.
Branch, B. (1977). A tax loss trading rule. Journal of Business, 50 (2), 198-207.
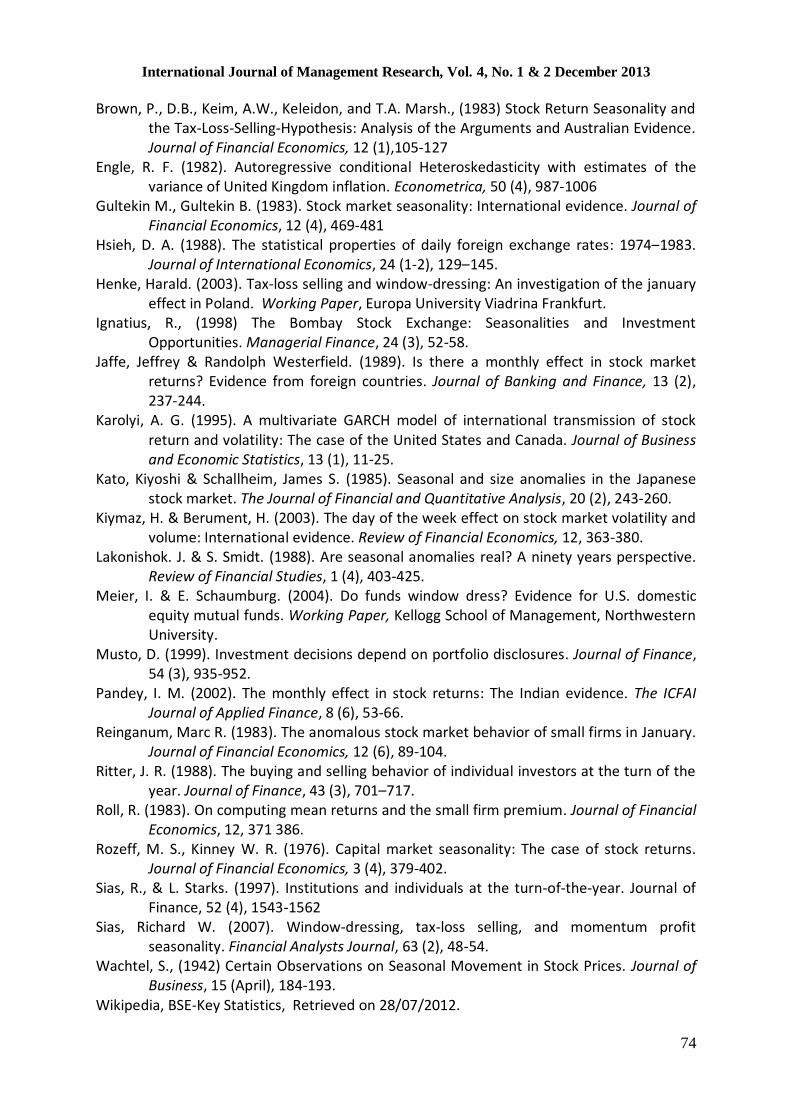
International Journal of Management Research, Vol. 4, No. 1 & 2 December 2013
74
Brown, P., D.B., Keim, A.W., Keleidon, and T.A. Marsh., (1983) Stock Return Seasonality and the Tax-Loss-Selling-Hypothesis: Analysis of the Arguments and Australian Evidence. Journal of Financial Economics, 12 (1),105-127
Engle, R. F. (1982). Autoregressive conditional Heteroskedasticity with estimates of the variance of United Kingdom inflation. Econometrica, 50 (4), 987-1006
Gultekin M., Gultekin B. (1983). Stock market seasonality: International evidence. Journal of Financial Economics, 12 (4), 469-481
Hsieh, D. A. (1988). The statistical properties of daily foreign exchange rates: 1974–1983. Journal of International Economics, 24 (1-2), 129–145.
Henke, Harald. (2003). Tax-loss selling and window-dressing: An investigation of the january effect in Poland. Working Paper, Europa University Viadrina Frankfurt.
Ignatius, R., (1998) The Bombay Stock Exchange: Seasonalities and Investment Opportunities. Managerial Finance, 24 (3), 52-58.
Jaffe, Jeffrey & Randolph Westerfield. (1989). Is there a monthly effect in stock market returns? Evidence from foreign countries. Journal of Banking and Finance, 13 (2), 237-244.
Karolyi, A. G. (1995). A multivariate GARCH model of international transmission of stock return and volatility: The case of the United States and Canada. Journal of Business and Economic Statistics, 13 (1), 11-25.
Kato, Kiyoshi & Schallheim, James S. (1985). Seasonal and size anomalies in the Japanese stock market. The Journal of Financial and Quantitative Analysis, 20 (2), 243-260.
Kiymaz, H. & Berument, H. (2003). The day of the week effect on stock market volatility and volume: International evidence. Review of Financial Economics, 12, 363-380.
Lakonishok. J. & S. Smidt. (1988). Are seasonal anomalies real? A ninety years perspective. Review of Financial Studies, 1 (4), 403-425.
Meier, I. & E. Schaumburg. (2004). Do funds window dress? Evidence for U.S. domestic equity mutual funds. Working Paper, Kellogg School of Management, Northwestern University.
Musto, D. (1999). Investment decisions depend on portfolio disclosures. Journal of Finance, 54 (3), 935-952.
Pandey, I. M. (2002). The monthly effect in stock returns: The Indian evidence. The ICFAI Journal of Applied Finance, 8 (6), 53-66.
Reinganum, Marc R. (1983). The anomalous stock market behavior of small firms in January. Journal of Financial Economics, 12 (6), 89-104.
Ritter, J. R. (1988). The buying and selling behavior of individual investors at the turn of the year. Journal of Finance, 43 (3), 701–717.
Roll, R. (1983). On computing mean returns and the small firm premium. Journal of Financial Economics, 12, 371 386.
Rozeff, M. S., Kinney W. R. (1976). Capital market seasonality: The case of stock returns. Journal of Financial Economics, 3 (4), 379-402.
Sias, R., & L. Starks. (1997). Institutions and individuals at the turn-of-the-year. Journal of Finance, 52 (4), 1543-1562
Sias, Richard W. (2007). Window-dressing, tax-loss selling, and momentum profit seasonality. Financial Analysts Journal, 63 (2), 48-54.
Wachtel, S., (1942) Certain Observations on Seasonal Movement in Stock Prices. Journal of Business, 15 (April), 184-193.
Wikipedia, BSE-Key Statistics, Retrieved on 28/07/2012.
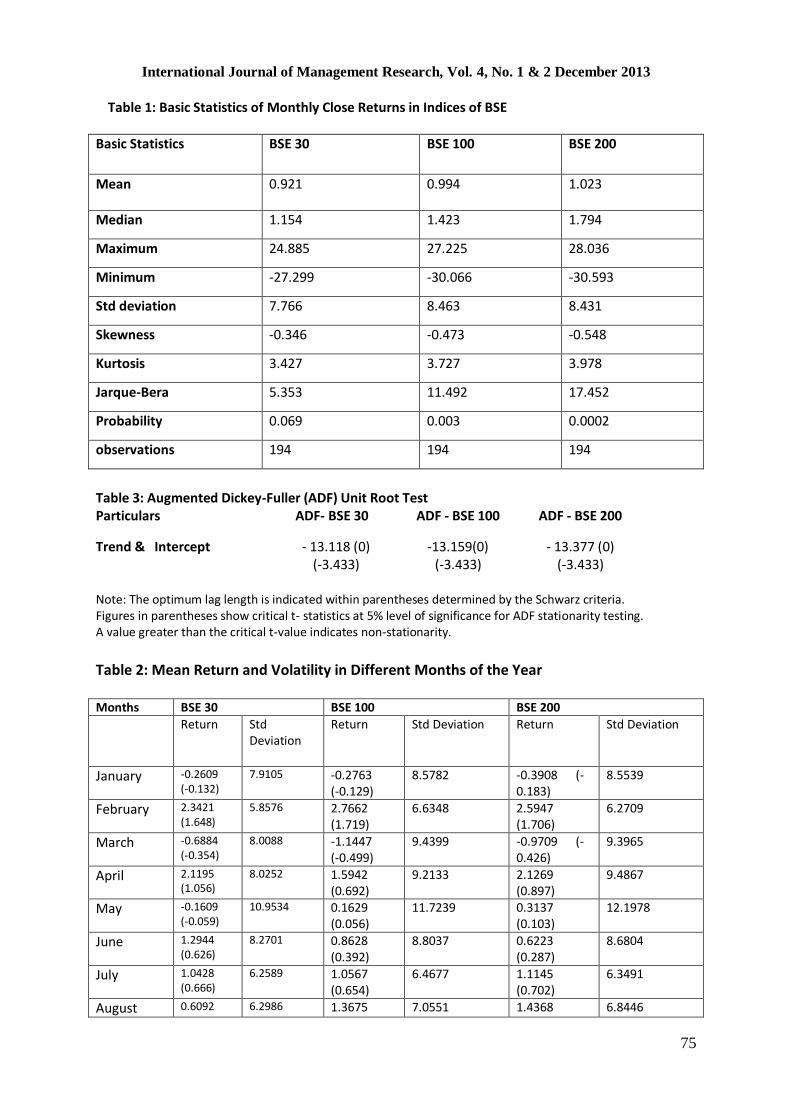
International Journal of Management Research, Vol. 4, No. 1 & 2 December 2013
75
Table 1: Basic Statistics of Monthly Close Returns in Indices of BSE
Basic Statistics BSE 30 BSE 100 BSE 200
Mean 0.921 0.994 1.023
Median 1.154 1.423 1.794
Maximum 24.885 27.225 28.036
Minimum -27.299 -30.066 -30.593
Std deviation 7.766 8.463 8.431
Skewness -0.346 -0.473 -0.548
Kurtosis 3.427 3.727 3.978
Jarque-Bera 5.353 11.492 17.452
Probability 0.069 0.003 0.0002
observations 194 194 194
Table 3: Augmented Dickey-Fuller (ADF) Unit Root Test Particulars ADF- BSE 30 ADF - BSE 100 ADF - BSE 200
Trend & Intercept - 13.118 (0) (-3.433)
-13.159(0) (-3.433)
- 13.377 (0) (-3.433)
Note: The optimum lag length is indicated within parentheses determined by the Schwarz criteria. Figures in parentheses show critical t- statistics at 5% level of significance for ADF stationarity testing. A value greater than the critical t-value indicates non-stationarity.
Table 2: Mean Return and Volatility in Different Months of the Year Months BSE 30 BSE 100 BSE 200
Return Std Deviation
Return Std Deviation Return Std Deviation
January -0.2609 (-0.132)
7.9105 -0.2763 (-0.129)
8.5782 -0.3908 (-0.183)
8.5539
February 2.3421 (1.648)
5.8576 2.7662 (1.719)
6.6348 2.5947 (1.706)
6.2709
March -0.6884 (-0.354)
8.0088 -1.1447 (-0.499)
9.4399 -0.9709 (-0.426)
9.3965
April 2.1195 (1.056)
8.0252 1.5942 (0.692)
9.2133 2.1269 (0.897)
9.4867
May -0.1609 (-0.059)
10.9534 0.1629 (0.056)
11.7239 0.3137 (0.103)
12.1978
June 1.2944 (0.626)
8.2701 0.8628 (0.392)
8.8037 0.6223 (0.287)
8.6804
July 1.0428 (0.666)
6.2589 1.0567 (0.654)
6.4677 1.1145 (0.702)
6.3491
August 0.6092 6.2986 1.3675 7.0551 1.4368 6.8446
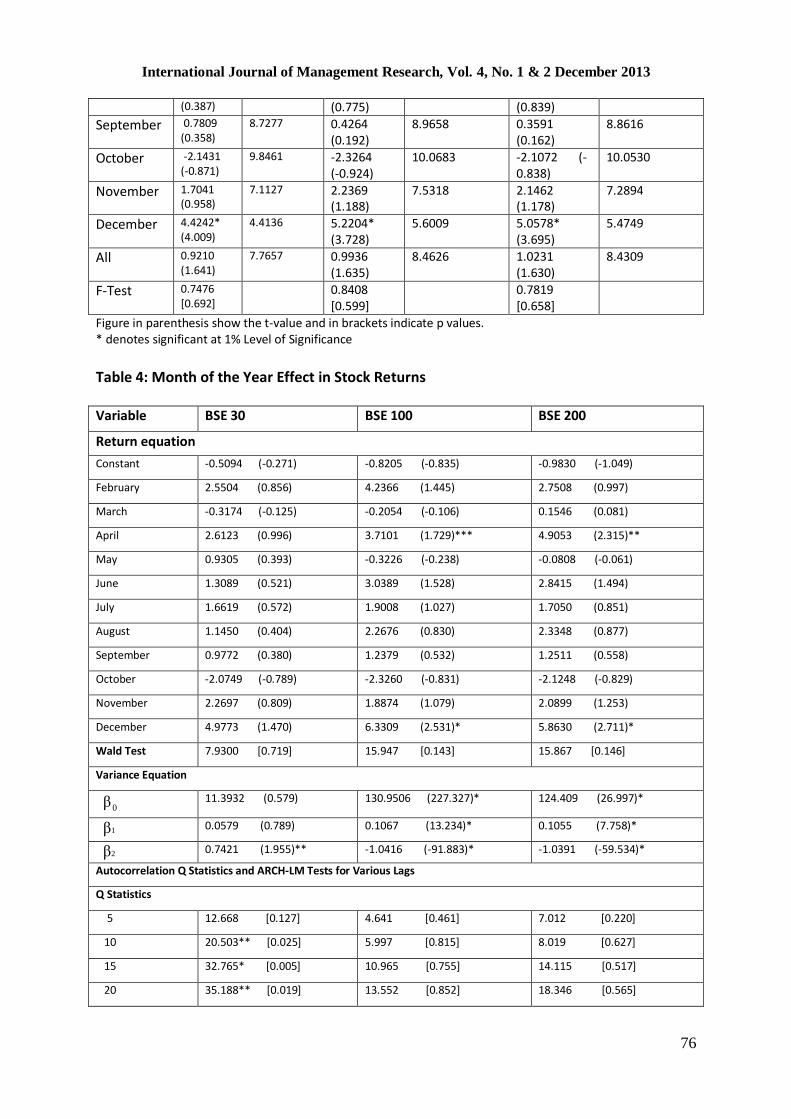
International Journal of Management Research, Vol. 4, No. 1 & 2 December 2013
76
(0.387) (0.775) (0.839)
September 0.7809 (0.358)
8.7277 0.4264 (0.192)
8.9658 0.3591 (0.162)
8.8616
October -2.1431 (-0.871)
9.8461 -2.3264 (-0.924)
10.0683 -2.1072 (-0.838)
10.0530
November 1.7041 (0.958)
7.1127 2.2369 (1.188)
7.5318 2.1462 (1.178)
7.2894
December 4.4242* (4.009)
4.4136 5.2204* (3.728)
5.6009 5.0578* (3.695)
5.4749
All 0.9210 (1.641)
7.7657 0.9936 (1.635)
8.4626 1.0231 (1.630)
8.4309
F-Test 0.7476 [0.692]
0.8408 [0.599]
0.7819 [0.658]
Figure in parenthesis show the t-value and in brackets indicate p values. * denotes significant at 1% Level of Significance
Table 4: Month of the Year Effect in Stock Returns Variable BSE 30 BSE 100 BSE 200
Return equation
Constant -0.5094 (-0.271) -0.8205 (-0.835) -0.9830 (-1.049)
February 2.5504 (0.856) 4.2366 (1.445) 2.7508 (0.997)
March -0.3174 (-0.125) -0.2054 (-0.106) 0.1546 (0.081)
April 2.6123 (0.996) 3.7101 (1.729)*** 4.9053 (2.315)**
May 0.9305 (0.393) -0.3226 (-0.238) -0.0808 (-0.061)
June 1.3089 (0.521) 3.0389 (1.528) 2.8415 (1.494)
July 1.6619 (0.572) 1.9008 (1.027) 1.7050 (0.851)
August 1.1450 (0.404) 2.2676 (0.830) 2.3348 (0.877)
September 0.9772 (0.380) 1.2379 (0.532) 1.2511 (0.558)
October -2.0749 (-0.789) -2.3260 (-0.831) -2.1248 (-0.829)
November 2.2697 (0.809) 1.8874 (1.079) 2.0899 (1.253)
December 4.9773 (1.470) 6.3309 (2.531)* 5.8630 (2.711)*
Wald Test 7.9300 [0.719] 15.947 [0.143] 15.867 [0.146]
Variance Equation
0β 11.3932 (0.579) 130.9506 (227.327)* 124.409 (26.997)*
1β 0.0579 (0.789) 0.1067 (13.234)* 0.1055 (7.758)*
2β 0.7421 (1.955)** -1.0416 (-91.883)* -1.0391 (-59.534)*
Autocorrelation Q Statistics and ARCH-LM Tests for Various Lags
Q Statistics
5 12.668 [0.127] 4.641 [0.461] 7.012 [0.220]
10 20.503** [0.025] 5.997 [0.815] 8.019 [0.627]
15 32.765* [0.005] 10.965 [0.755] 14.115 [0.517]
20 35.188** [0.019] 13.552 [0.852] 18.346 [0.565]
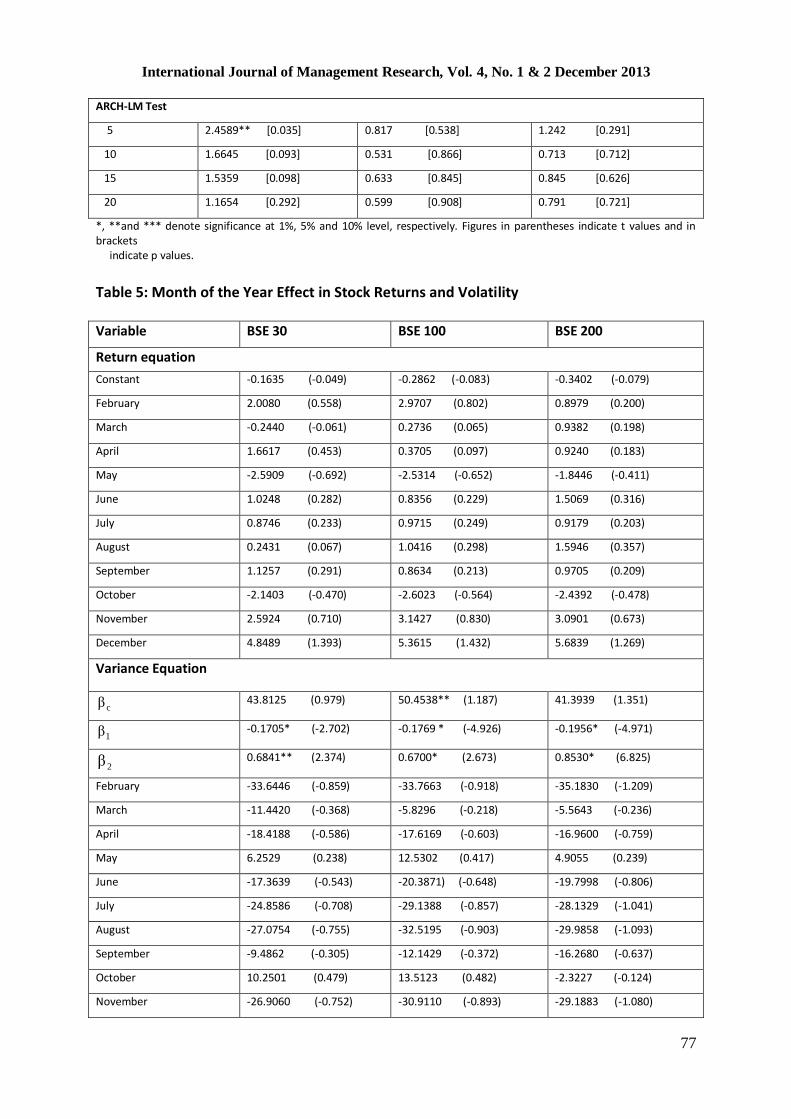
International Journal of Management Research, Vol. 4, No. 1 & 2 December 2013
77
ARCH-LM Test
5 2.4589** [0.035] 0.817 [0.538] 1.242 [0.291]
10 1.6645 [0.093] 0.531 [0.866] 0.713 [0.712]
15 1.5359 [0.098] 0.633 [0.845] 0.845 [0.626]
20 1.1654 [0.292] 0.599 [0.908] 0.791 [0.721]
*, **and *** denote significance at 1%, 5% and 10% level, respectively. Figures in parentheses indicate t values and in brackets indicate p values.
Table 5: Month of the Year Effect in Stock Returns and Volatility Variable BSE 30 BSE 100 BSE 200
Return equation
Constant -0.1635 (-0.049) -0.2862 (-0.083) -0.3402 (-0.079)
February 2.0080 (0.558) 2.9707 (0.802) 0.8979 (0.200)
March -0.2440 (-0.061) 0.2736 (0.065) 0.9382 (0.198)
April 1.6617 (0.453) 0.3705 (0.097) 0.9240 (0.183)
May -2.5909 (-0.692) -2.5314 (-0.652) -1.8446 (-0.411)
June 1.0248 (0.282) 0.8356 (0.229) 1.5069 (0.316)
July 0.8746 (0.233) 0.9715 (0.249) 0.9179 (0.203)
August 0.2431 (0.067) 1.0416 (0.298) 1.5946 (0.357)
September 1.1257 (0.291) 0.8634 (0.213) 0.9705 (0.209)
October -2.1403 (-0.470) -2.6023 (-0.564) -2.4392 (-0.478)
November 2.5924 (0.710) 3.1427 (0.830) 3.0901 (0.673)
December 4.8489 (1.393) 5.3615 (1.432) 5.6839 (1.269)
Variance Equation
cβ
43.8125 (0.979) 50.4538** (1.187) 41.3939 (1.351)
1β -0.1705* (-2.702) -0.1769 * (-4.926) -0.1956* (-4.971)
2β 0.6841** (2.374) 0.6700* (2.673) 0.8530* (6.825)
February -33.6446 (-0.859) -33.7663 (-0.918) -35.1830 (-1.209)
March -11.4420 (-0.368) -5.8296 (-0.218) -5.5643 (-0.236)
April -18.4188 (-0.586) -17.6169 (-0.603)
-16.9600 (-0.759)
May 6.2529 (0.238) 12.5302 (0.417) 4.9055 (0.239)
June -17.3639 (-0.543) -20.3871) (-0.648) -19.7998 (-0.806)
July -24.8586 (-0.708) -29.1388 (-0.857) -28.1329 (-1.041)
August -27.0754 (-0.755) -32.5195 (-0.903) -29.9858 (-1.093)
September -9.4862 (-0.305) -12.1429 (-0.372) -16.2680 (-0.637)
October 10.2501 (0.479) 13.5123 (0.482) -2.3227 (-0.124)
November -26.9060 (-0.752) -30.9110 (-0.893) -29.1883 (-1.080)

International Journal of Management Research, Vol. 4, No. 1 & 2 December 2013
78
December -36.2858 (-0.884) -36.3650 (-0.969) -31.4863 (-1.106)
Wald Test 31.26810** [0.0483] 50.9391* [0.0004] 54.450* [0.0001]
Autocorrelation Q Statistics and ARCH-LM Tests for Various Lags
Q Statistics
5 3.313 [0.652] 3.528 [0.619] 2.592 [0.763]
10 8.862 [0.545] 6.566 [0.766] 4.816 [0.903]
15 15.885 [0.390] 14.974 [0.453] 11.135 [0.743]
20 18.083 [0.582] 18.563 [0.550] 14.641 [0.797]
ARCH-LM Test
5 0.6428 [0.667] 0.683 [0.637] 0.482 [0.789]
10 1.0248 [0.425] 0.724 [0.701] 0.564 [0.842]
15 1.4046 [0.150] 1.329 [0.189] 0.952 [0.508]
20 1.0133 [0.450] 1.009 [0.455] 0.842 [0.659]
*, and ** denote significance at 1%, and 5% level, respectively. Figures in parentheses indicate t values and in brackets indicate p values.
Related Documents


