International Journal of Euro-Mediterranean Studies Table of Contents e territorial attractiveness for foreign investments of Mediterranean cities: the case of city of Tangier Abbes Elhasbi, Mohamed Barkaoui, Othmane Bouksour and Oulaid Kamach e Impact of Public Debt on the Economic Growth for the Gulf Cooperation Council Countries Hanadi Taher Visualizing Emotion and Affect: Visitor Encounters at St. Peter’s Basilica Caitlin Finlayson Interview with Heba Afify, Egyptian journalist Résumés Povzetki Current and Future Events in the Euro-Mediterranean Area 3 27 45 59 63 65 67 69 Volume 9 | 2016 | Number 2

Welcome message from author
This document is posted to help you gain knowledge. Please leave a comment to let me know what you think about it! Share it to your friends and learn new things together.
Transcript

International Journalof Euro-Mediterranean StudiesTable of Contents
The territorial attractiveness for foreign investments of Mediterranean cities: the case of city of Tangier Abbes Elhasbi, Mohamed Barkaoui, Othmane Bouksour and Oulaid Kamach
The Impact of Public Debt on the Economic Growth for the Gulf Cooperation Council CountriesHanadi Taher
Visualizing Emotion and Affect: Visitor Encounters at St. Peter’s Basilica Caitlin Finlayson
Interview with Heba Afify, Egyptian journalist
RésumésPovzetki
Current and Future Events in the Euro-Mediterranean Area
3
27
45
59
636567
69
Volume 9 | 2016 | Number 2


Volume 9 | 2016 | Number 2
| 3 |
The territorial attractiveness for foreign investments of Mediterranean cities: the case of city of Tangier in MoroccoABBES ELHASBILMPGI Laboratory, University Hassan II of Casablanca, Morocco
MOHAMED BARKAOUILMPGI Laboratory, University Hassan II of Casablanca, Morocco
OTHMANE BOUKSOUR,LMPGI Laboratory, University Hassan II of Casablanca, Morocco
OULAID KAMACHLMPGI Laboratory, University Hassan II of Casablanca, Morocco
The objective of this article is to provide the main factors of attractiveness for foreign investors in the manufacturing and logistics sectors of the city of Tangier in Morocco. The concep-tual model was developed from literature review and interviews with a sample of the leaders of foreign small and medium enter-prises (SMEs). The empirical analysis is carried out using data from a survey of executives of these foreign (manufacturing and logistics) companies based in the city of Tangier. The use of the Partial Least Squares (PLS) approach allowed us to test the causal links between the various political, economic, social, technological, legal and environmental (PESTEL) factors. The scientific interest of the model is to provide decision makers of the city of Tangier with the recommendations to improve the development and attractiveness of foreign investments in both logistics and manufacturing sectors.1
Key words: Territorial attractiveness; PESTEL; PLS; manufac-turing and logistics activities
1 The authors express their thanks to Mohamed Amekhchoun who par-ticipated in the data analysis of this study.

Volume 9 | 2016 | Number 2
| 4 |
INTRODUCTION
According 150 executives interviewed for the “BaroMed 2015” (Lacovone and Lhermitte 2015), the Mediterranean region is the more attractive than Europe. It has attracted in 2013 an amount of 85 billion U.S. dollars which has been higher than the foreign investments in China on the same year.
The regions are increasingly seeking to attract FDI in a con-cern to reduce the unemployment rate, to decrease the deficit in the balance of trade by strengthening the exports, transfer-ring technology, contributing to industrial development and strengthening the attractiveness territorial arrangement of the country, etc. The purpose of this Article is to define the main fac-tors of attractiveness of manufacturing enterprises and logistics by a Mediterranean city by taking the case of the city of Tangier. This research is based on an exploratory study conducted with the leaders of the foreign firms.
This article is divided into two parts. The first part concerns the theoretical framework on which authors rely to provide a conceptual model resting on the political, economic, social, tech-nological, legal and environmental (PESTEL) factors model. This is to clearly identify the industrial location factors that deter-mine the manufacturing and logistics attractiveness of the city of Tangier. The second part includes the empirical study allow-ing to achieve the end result. Therefore, we develop an almost exhaustive questionnaire according to the stages of Churchill paradigm (Benraiss 2004). From 120 questionnaires distributed, in fact only 57 are exploitable. The PESTEL model has a qualita-tive structure. To be measurable, we will adopt a research-based approach using the Likert scale and method of structural equa-tions with latent variables according to the partial least squares (PLS) analysis approach via the XL-STAT software.
THEORETICAL AND CONCEPTUAL FRAMEWORK
To determine the factors of territorial attractiveness of foreign manufacturing and logistics companies we use a conceptual framework at the base of PESTEL model and add the factor of proximity (WHY this new factor?).

Volume 9 | 2016 | Number 2
| 5 |
THE CONCEPT OF TERRITORIAL ATTRACTIVENESS
An attractive area is one that has more “capacity to provide, through their resources, more attractive settling conditions than those of competing areas for mobile projects” (Hatem 2004). In fact, the notion of territorial attractiveness becomes more and more a topic of local elected officials and public stake-holders working in the framework of local development agencies to improve the attractiveness of territories to productive and residential activities. In this context, we have seen the creation and development of a number of organizations which evaluate the attractiveness of countries towards companies such as the World Economic Forum, AT Kearney, the United Nations (UN) and the annual Doing Business report of the group of the World Bank that provides an assessment of the business climate by an-alysing the favourable and unfavourable regulations of business activities of the country.
The reports of these organizations have helped to classify the countries in terms of attractiveness compared with other competing countries. Moreover, these reports influence the de-cision-making of business location within and outside the coun-tries. If territories are in need of multinational firms, companies in turn want territories (Hatem 2004).
Companies seek to enjoy various offers worldwide by opti-mizing their organizations and by being established where there are the best comparative advantages.
There are various research works on the theoretical founda-tions of the firms’ investment decisions abroad. Among these works, there is the eclectic theory that was developed by John H. Dunning and which is also called O.L.I. paradigm that is based on three types of benefits to multinationalisation namely: The ownership (O) specific advantages, the locational attractions (L), and the advantage in of internalization (I) (Dunning 2000, 163).
Following the literature review, one finds several models and concepts that address the significant factors of territorial attrac-tiveness for foreign investment.

Volume 9 | 2016 | Number 2
| 6 |
EMPIRICAL WORK
Parallel to the above theoretical works, there are several empiri-cal studies that attempt to measure the territorial attractive-ness based on panel data or opinion survey. In fact, the concepts of attractiveness depend on what the user seeks to apprehend: measure of economic performance, observation of establish-ment decisions or, further upstream of the decision process, their determinants (improve translation - incomprehensible) (Coeuré, Rabaud, and Madiès 2003).
In the works of Fabrice Hatem (2005, 43), there are five cat-egories of attractiveness:• The “macro” approach, by global indicators, which is usu-
ally interested in the attractiveness of a country or a region. This approach, too, has led to the econometric approach and opinion approaches among investors. The most publicized barometers are: Ernst and Young, Business Competitiveness Index (World Economic Forum);
• The «meso» approach which is interested in studying the at-tractiveness factors of a particular area within a particular branch of industry;
• The «micro» approach which is based on the comparative analysis of the benefits of open multiple sites in the same area;
• The approach in terms of image, which studies the effect of the image or reputation of a territory on the decision mak-ing of the leaders at the time of the decision making on the location;
• The «decision making» approach which is based on academic and empirical research to study processes of decision-making.
Table 1 represents a synthesis of the main empirical works relating to the study of selected industrial location factors.

Volume 9 | 2016 | Number 2
| 7 |
Table 1: Summary of the main empirical research
Authors Results Independent factors
(Head and Mayer 2004)
From the study of Japanese mul-tinationals in the EU: the “market potential” factor is more important than other factors (labor or tax costs).
Economic factor
(Sascha et al. 2004)
From the study of German multi-nationals: the main location factor for these companies abroad, is access to “large markets”.
Economic factor
Rathelot and Sillard 2008)(Baldwin and Krugman 2004)
The inequalities in taxation be-tween countries on profits influ-ence the location of firms.
Legal factor
(Cecchini 2002) (Hassane and Zatla 2001)
The legal and regulatory envi-ronment impacts the business location.
Legal factor
(Kalantari 2013) From their exploratory study, they proposed some location factors.
- Social factors- Political factors- Economic factors- Legal factors- Proximity factors
(Elhasbi et al. 2015)
Exploratory research confirms that the geographical proximity of a ter-ritory and the proximity of indus-trial zones influence the decision-making of managers.
Proximity factors
(Yüksel 2012)Economic, Socio-cultural, Technological, Environment and Legal
In his article, the author puts forward PESTEL factors and sub-factors.
PESTEL factors
Source : Authors’ own analysis.

Volume 9 | 2016 | Number 2
| 8 |
PROXIMITY FACTORS
Originally, the space in economic theory is not thick, only gen-erating transportation costs. According to Marshall, territory emerges when the interactions between activities make location decisions become interdependent. The role of space as a genera-tor of economic benefits is then analyzed according to whether geographical proximity may or may not be combined with other forms of proximity between economic agents to facilitate coor-dination (Zimmermann 2008).
Several current empirical situations show that geographical proximity is a component of the strategy of economic actors (Talbot 2009). At the time of our exploratory research (Elhasbi et al. 2015), 26% of interviewed leaders of foreign companies stated that proximity to the poles of competitiveness and to customer demand was seen as a business location factor.
There are several concepts of proximity. According to Rallet and Torre (2004), the concept of proximity is divided into two dimensions: proximity of a spatial type and a non-spatial type proximity which is also divided into institutional proximity and organizational proximity. On the other hand, Jean-Benoît Zimmermann (2008) divides the concept of proximity into three dimensions: an institutional dimension, an organizational dimension and a geographic dimension.
THE PESTEL MODEL
Globalization and the development of new information and communications technology (ICT) have limited the importance of borders and distance between countries thus increasing com-petition among companies internationally. These new conditions are driving companies to integrate the analysis of the business environment among the decision-making tools for choosing a new location. A review of the literature reveals several approach-es and macro environment analysis tools (Lynch 2009).
In our article, we have used the PESTEL analysis model (Political, Economic, Socio-cultural, Technological, Ecological and Legal).
Volume 9 | 2016 | Number 2
| 9 |
PESTEL ANALYSIS
PESTEL analysis is indeed a diagnosis of an organization’s en-vironment in order to use this information to guide strategic decision-making. The assumption is that if the organization is able to control the current environment and evaluate potential changes, it will be better to have the appropriate information so that it is well positioned with respect to its competitors in order to respond to changes (Buchanan and Gibb 1998).
In his article, Yüksel (2012)Economic, Socio-cultural, Technological, Environment and Legal has listed a synthesis of several names (definitions) of the PESTEL analysis such as PEST, STEP, SEPT, and STEPE. The original form of PESTEL was first conceived by Aguilar SPTO (social, political, technical, and economic). Then, it was reformulated “STEP” by Arnold Brown Institute of Life Insurance so as to be used in the strategic as-sessment of trends. The legal factor was introduced to the model in 1980. Today, the PESTEL analysis is used in different fields, particularly in the analysis of business environment and terri-tory (Katko 2006; Richardson 2006; Shilei and Yong 2009). The PESTEL factors are usually measured with sub-factors (Items) and they have different weights and meanings.
In our research, we will use statistical analyses to examine the causal links between different factors of our conceptual model, which was established on the basis of our general hypothesis: Political, Economic, Sociocultural, Technological, Ecological, Legal and Proximity have a significant influence on the territo-rial attractiveness of the city of Tangier.
RESEARCH MODEL AND ASSUMPTIONS
We intend to examine our conceptual model by analysing the causal links between the dependent variables and the depend-ent variable. For each causal relationship, we have formulated a hypothesis.

Volume 9 | 2016 | Number 2
| 10 |
THE AIM OF OUR RESEARCH
The ultimate objective of our research is to propose a con-ceptual model of the factors of attractiveness typical to the Mediterranean cities and in particular to the city of Tangier by examining the causal links between these factors. Our model (Figure 1) is built from syntheses carried out in mainstream ap-proaches presented above, and on the other hand, based on the PESTEL model used by organizations for the macro-analysis by adding the proximity factor (geographical position, proximity to Europe, proximity to Africa). If note explained above, explain here why you add this factor.
Figure 1: Assumptions of a new conceptual model PESTELP
TAF
COF
H
H
HHH
H
H
SCF
ECF
TF
PF
LF
PRF
Table 2: Coding of variables in the model
Variable Code Type de variables
1 Political factor PF explicative 2 Economic factor ECF explicative 3 Socio-cultural
factor SCF explicative
4 Technological factor
TF explicative
5 Eco Factor COF explicative 6 Legal Factor LF explicative 7 Proximity factor PRF explicative 8 Territorial
Attractiveness TAF To-be
explained
Source: Authors’ own analysis.

Volume 9 | 2016 | Number 2
| 11 |
Our model (Figure 1) intends to explain the territorial attrac-tiveness of manufacturing and logistics activities based on eight constructs (Figure 2) which represent the explanatory variables (political factor, economic factor, socio-cultural factor, techno-logical factor, ecological factor, legal factor, proximity factor and the would-be explained variable “territorial attractiveness”).
The overall hypothesis (OH) of our research is “all the ‘PESTELP’ factors influence significantly the territorial attrac-tiveness of the city of Tangier to foreign manufacturing and logistics companies”. To verify the causal links between the PESTELP factors of our model with regard to the variable to-be-explained “territorial attractiveness (TA)”, we will postulate and test the following hypotheses (Table 3).
Table 3: Recap of the study hypotheses
HypothèsesRelationship between Political Factor and Territorial AttractivenessH1 Political Factor has a positive and significant effect on
Territorial AttractivenessRelationship between Economic Factor and Territorial AttractivenessH2 Economic Factor has a positive and significant effect on
Territorial AttractivenessRelationship between Socio-cultural Factor and Territorial AttractivenessH3 Socio-cultural Factor has a positive and significant effect on
Territorial AttractivenessRelationship between Technological Factor and Territorial AttractivenessH4 Technological Factor has a positive and significant effect on
Territorial AttractivenessRelationship between Eco Factor and Territorial AttractivenessH5 Ecological Factor has a positive and significant effect on
Territorial AttractivenessRelationship between Legal Factor and Territorial AttractivenessH6 Legal Factor has a positive and significant effect on Territorial
AttractivenessRelationship between Proximity Factor and Territorial AttractivenessH7 Proximity Factor has a positive and significant effect on
Territorial Attractiveness

Volume 9 | 2016 | Number 2
| 12 |
METHODOLOGICAL FRAMEWORK OF RESEARCH
As part of our research, we have conducted an empirical study “face to face interview” with the leaders of foreign manufac-turing and logistics companies based in the city of Tangier. To measure our assumptions, we have developed a questionnaire using Likert scale. Indeed, the questionnaire is considered as a tool for collecting quantitative data and mechanism of instru-mentation of the assumptions (Giordano and Alain 2012). In the first page of our questionnaire, we have devoted a few lines to the explanation of the aim of the survey before proceeding to the various questions thereof.
SAMPLE SELECTION
Sampling was selected to ensure representation of manufac-turing and logistics companies in the city of Tangier. We con-ducted our survey between August 2014 and April 2015 with 120 leaders of foreign manufacturing and logistics companies that were set up in Tangier between 2007 and 2015. We chose this period because Morocco has launched, since 2007, several national and regional strategies to stimulate foreign invest-ments (emergence programme, logistical strategy, etc). The administration of the questionnaire was very difficult because we have chosen as a target; the managers of foreign compa-nies. The latter rarely find time for an interview. Despite all the obstacles, we were able to complete 80 questionnaires but of which only 57 being usable. This represents a 48% response rate.
DEFINITION OF THE METHOD OF STATISTICAL ANALYSIS
The Structural Equation Modelling (SEM) is a method to de-fine complex interacting systems (Fernandes 2012) and it allows studying the causal connections between multiple la-tent variables. These variables represent a concept but we can only measure them with manifest variables (MV) (Roussel et al. 2002). MES is used for the generalisation of many classic

Volume 9 | 2016 | Number 2
| 13 |
models such as principal components analysis, factor analy-sis, and canonical analysis. We meet these statistical models in several research fields (Jakobowicz 2007) especially in the marketing field to construct satisfaction indicators (Clémence 2004). This type of modelling is thus important to test the hy-potheses of our conceptual model. There are two methods of modeling via (MES) for estimating the existing relationships between the constructs : the LISREL method and the PLS method (Lacroux 2009).
The PLS approach is a regression analysis method of latent variables with their indicators and latent variables among them-selves. It was developed by Herman Wold (M. Tenenhaus 1999) and mainly used for the analysis of small samples (observations) and several variables. It became operational with the develop-ment of PLS 1.8 software (Fernandes 2012).
We have chosen for our exploratory research the PLS ap-proach because it is adapted to the development of theories and prediction, and to predictive causal analyses in complex situa-tions and with weak theoretical information (Zaied and Ramzi 2012). With the PLS approach, the construct is defined as a composite variable (CV) and does not include the measurement error (Tensaout 2016).
𝐕𝐕𝐕𝐕 = 𝐰𝐰𝟏𝟏𝐗𝐗𝟏𝟏 +𝐰𝐰𝟐𝟐𝐗𝐗𝟐𝟐 +𝐰𝐰𝟑𝟑𝐗𝐗𝟑𝟑 +⋯+𝐰𝐰𝐧𝐧𝐗𝐗𝐧𝐧
Knowing that:• (VC) variable to be explained (dependent variable).• x1 à xn represent the n variables which have an influence on
(VC).• The values w1 à wn are the parameters of the model and rep-
resent the relations between variables.
A structural PLS model is described by two sub-models (Addinsoft 2011):1. The measurement model (or external model) connecting the
manifest (observed) variables with the latent variables as-sociated with them.
2. And the structural model (or internal model) connecting the endogenous-called latent variables to other latent variables.
Volume 9 | 2016 | Number 2
| 14 |
Several software’s have been developed to operationalize the PLS approach such as PLSGRAPH, LVPLS, SMARTPLS, and XLSTAT that we have chosen to analyze the data from our survey.
MEASUREMENT AND EVALUATION OF THE MEASUREMENT MODEL
The research model includes seven explanatory latent variables and a latent variable to be explained (Error! Reference source not found.). These variables are measured by manifest variables operationalized by several items. For our reflective model, each manifest variable is associated with a latent variable by a simple linear regression equation (Jakobowicz 2010):
x!!π!" + ξπ! + ε!
Knowing that ξ has an average m and a standard deviation 1.The only assumption required in this case is:
E(x! | ξ) = π!" + ξπ!
Hence the remainder εh has has a mean of 0 and is not corre-lated with the latent variable ξ. The first step to take is the veri-fication of the one-dimensional feature of the blocks (Addinsoft 2011). To verify this, three main tools exist: 1) Principal compo-nents analysis of a block, 2) Cronbach’s Alpha and 3) the Rho of Dillon-Goldstein.
a. Principal components analysis of a block
A block is said to be one-dimensional when the first proper val-ue of the matrix of correlation between the manifest variables of the block is greater than 1 and the second is smaller than 1 or at least much smaller than the first (Addinsoft 2011).
Table 4 shows the results of the verification of dimensional-ity, we notice that all the first proper values are greater than 1 (and higher than the second) which means that the manifest variables actually reflect their latent variables).

Volume 9 | 2016 | Number 2
| 15 |
Table 4 : Proper values of latent variables of the causal model
PF ECF SCF TF COF LF PRF TA1.3340.4620.262
4.4721.2911.0090.6790.5420.3960.201
2.9360.9280.4780.4160.220
1.8050.252
4.2810.6490280
2.6960.5350.320
6.0841.6161.1310.8770.6820.5580.3090.200
7.9922.3211.0860.8820.7780.5120.4470.3620.2560.2140.1670.1330.1030.0780.0730.000
Source: Authors’ own analysis.
The error theory (Roehrich 1993) is based on two criteria: reliability and validity.
b. Reliability measures
The analyst must validate his questionnaire by testing the meas-uring instruments used (Hair et al., 1998).
Reliability is the degree of accuracy of a measuring instru-ment when the same identical result is obtained by repeating the measurement of the same phenomenon several times.
To check the reliability of the measurement instrument, we will use two indicators of Rho of Jöreskog (1971) and Rho of Dillon-Goldstein (Composite reliability) (Dillon and Goldstein 1984) .
To calculate of Dillon and Goldstein the following for-mula is used:
)),(1(()),((
)),(()(
11
22
11
2
11
∑∑
∑
==
=
−+
= p
ii
p
ii
p
ii
txcortxcor
txcorAρ
)(Aρ

Volume 9 | 2016 | Number 2
| 16 |
With, the X matrix, the columns xi represents the P variables associated with the block. The first principal components of the principal components analysis performed on the X matrix are noted down t1, t2 …
From the results of our analysis (Table 5), the indices, Cronbach’s alpha and Rho, that we have calculated for each latent variable are greater than 0.7. Following the recommen-dations of (Nunnally and Bernstein 1994) and initiations of (Fornell and Larcker 1981), these results are satisfactory.
Table 5 : Reliability of measures
The latent variables
Items Cronbach’s Alpha
Rho of D. G. (ACP)
PF 3 0.718 0.844ECF 7 0.843 0.882SCF 5 0.822 0.876TF 2 0.858 0.935
COF 3 0.885 0.932LF 3 0.836 0.904
PRF 8 0.872 0.900TA 16 0.929 0.939
Source : Authors’ own analysis.
c. The convergent validity
According to (Evrard et al. 2009), convergent validity is used to verify the correlation between items of a scale measuring a con-struct, and moreover the correlation between the items and the construct to be measured. The validity is convergent when the average variance extracted (AVE) is greater than 0.5 (Evrard and Pras 2009).

Volume 9 | 2016 | Number 2
| 17 |
To calculate AVE of each latent variable (j), the following for-mula is used:
)(2
2(AVEi
11
1
)(
)
∑∑
∑
==
=
+
=p
ii
p
i
p
i
Vari
i
ξλ
λ
λi: Represents the standardized coefficient of the measure i n: Represents the number of observed variablesξi: Represents the measurement error of i
According to the results of table 6, we have a measurement model of good convergent validity.
Table 6: Quality index of measurement models
Latent variable AVE Rho of D. G PF 0.55 0.773
ECF 0.52 0.881SCF 0.53 0.876TF 0.87 0.932
COF 0.81 0.982LF 0.75 0.899
PRF 0.53 0.900TA 0.51 0.943
Source : Authors’ own analysis.
d. Discriminant validity(divergent)
To verify that there is no correlation between the items of a con-struct with those of another; we will resort to the check of dis-criminant validity. The check is based on comparing the square root of the average variance extracted (AVE) of each latent vari-able with the correlation of different latent variables two by two (Chin et al. 2010, 43). According to
Table 7, the square root of the AVE is higher than the correla-tions between the different dimensions of our model. Therefore,

Volume 9 | 2016 | Number 2
| 18 |
we can assert the discriminant validity of the concept of latent variables of our model.
Table 7 : Discriminant validity
PF ECF SCF TF COF LF PRF TAPF 0.74*ECF 0.237 0.72*SCF 0.401 0.220 0.72*TF 0.379 0.322 0.144 0.93* 0.025COF 0.009 0.001 0.001 0.007 0.90* 0.080LF 0.002 0.318 0.022 0.099 0.019 0.87* 0.174PRF 0.058 0.355 0.066 0.73*TA 0.164 0.557 0.228 0.318 0.054 0163 0.359 0.71*
* The square root of the AVE (Zait and Bertea 2011).Source: Authors’ own analysis.
Based on previous analyses of (Cronbach’s Alpha and Rho of Dillon-Goldstein (Rho of D.G)), the proper value and discri-minant validity, we confirm the validity of our measurement model (external).
e. Validation of the internal structural model with PLS
The validation of the internal structural model with PLS is car-ried out with the following indicators:
Goodness of Fit index (GoF) for the model quality Using the PLS approach, we must determine the quality of
the model by calculating, the adjustment index, Goodness of Fit index (GoF) (Michel Tenenhaus et al. 2005)
GoF= ( √(Mean AVE * Mean R2 ).
According to Latan and Ghozali (Latan and Ghozali 2012), there are three values of quality level of GoF: low quality (GoF 0.10), medium quality (GoF 0.25) and high quality (GoF 0.36). To validate a research model requires that the index is higher

Volume 9 | 2016 | Number 2
| 19 |
than 0.5 (Wetzels et al. 2009). According to our results (Table 8) GoF = 0.63, therefore, our research model is maintained.
Table 8 : Ajustement indices
GoF GoF (Bootstrap)Absolute 0.626 0.644Relative 0.820 0.738External model 0.981 0.958Internal model 0.836 0.770
*The coefficient of determination (R²)Source: Authors’ own analysis.
The determination coefficient R² is used to evaluate the in-ternal model. It is calculated for each endogenous variable and it is used to get an idea on the contribution of each endogenous variable in predicting the exogenous one.
According to Chin (Henseler and Wang 2010), the usual val-ues of R² are 0.67 (substantial), 0.33 (moderate) and 0.19 (low). R² result of our model is: R² = 0.69. From this, we can conclude that R² is substantial and the model is significant.
• Size effect of R² (f2) (weight of latent variables)
To calculate the weight of each endogenous variable we will be interested in size effect (f2). This index is used to measure the impact of a manifest variable in the explanation of an endoge-nous latent variable. The size effect indicates the degree to which a given phenomenon is present in the population. According to Cohen (1988)(Cohen 1988), the usual f2 values are 0.02 (low ef-fect), 0.15 (moderate effect) and 0.35 (high effect).
According to the results presented in Table 9, all the latent variables have a large effect magnitude except f2 associated with links ECF →TA, SCF→TA, TF→TA, PRF→TA that have low ef-fect sizes.
Volume 9 | 2016 | Number 2
| 20 |
The results of our survey clearly show the validity of the measurement model (external) and that of the structural model (internal).
STRUCTURAL EQUATIONS OF THE CONCEPTUAL MODELOur model consists of seven exogenous variables: political
factor (PF); economic factor (ECF), socio-cultural factor (SCF), technological factor (TF), ecological factor (COF), legal factor (LF) and proximity factor (RPF). Since we have only one en-dogenous variable, we can write our model using the following equation:
AT=a1FP + a2 FEC + a3FSC + a4FPR + a5FT + a6FCO + a7FL
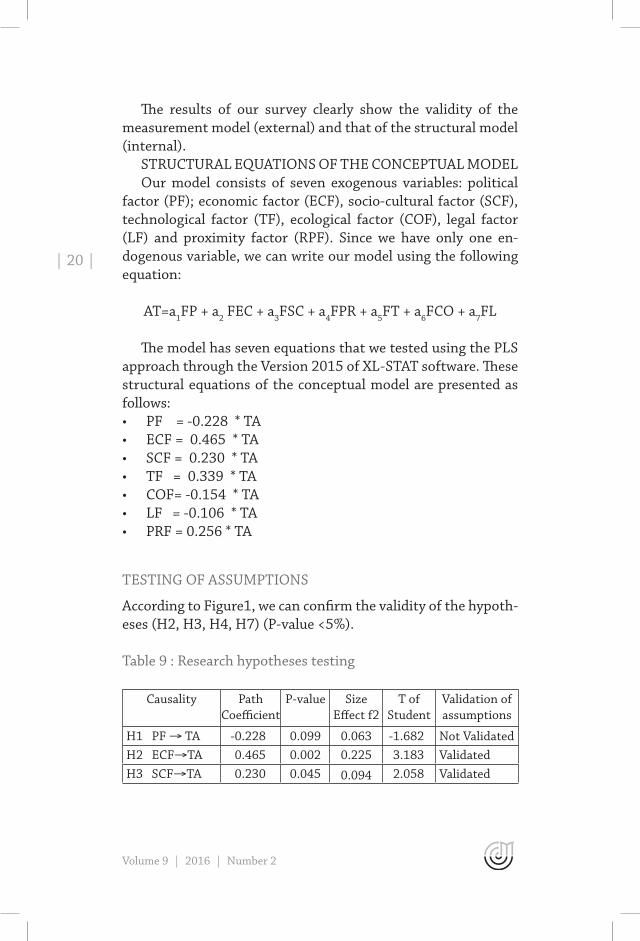
The model has seven equations that we tested using the PLS approach through the Version 2015 of XL-STAT software. These structural equations of the conceptual model are presented as follows:• PF = -0.228 * TA • ECF = 0.465 * TA • SCF = 0.230 * TA• TF = 0.339 * TA• COF= -0.154 * TA• LF = -0.106 * TA • PRF = 0.256 * TA
TESTING OF ASSUMPTIONS
According to Figure1, we can confirm the validity of the hypoth-eses (H2, H3, H4, H7) (P-value <5%).
Table 9 : Research hypotheses testing
Causality Path Coefficient
P-value Size Effect f2
T of Student
Validation of assumptions
H1 PF → TA -0.228 0.099 0.063 -1.682 Not ValidatedH2 ECF→TA 0.465 0.002 0.225 3.183 ValidatedH3 SCF→TA 0.230 0.045 0.094 2.058 Validated
Volume 9 | 2016 | Number 2
| 21 |
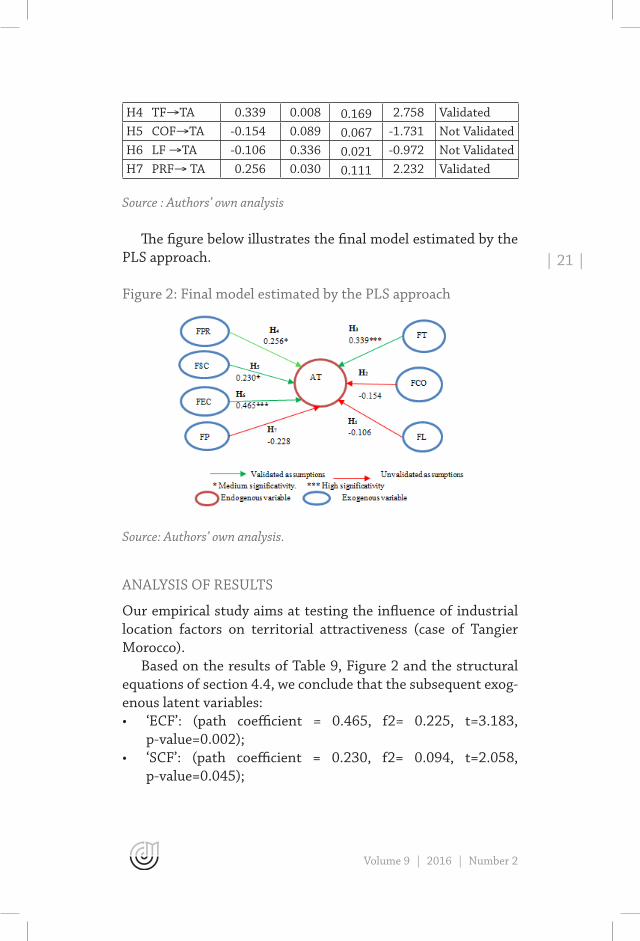
H4 TF→TA 0.339 0.008 0.169 2.758 ValidatedH5 COF→TA -0.154 0.089 0.067 -1.731 Not ValidatedH6 LF →TA -0.106 0.336 0.021 -0.972 Not ValidatedH7 PRF→ TA 0.256 0.030 0.111 2.232 Validated
Source : Authors’ own analysis
The figure below illustrates the final model estimated by the PLS approach.
Figure 2: Final model estimated by the PLS approach
Source: Authors’ own analysis.
ANALYSIS OF RESULTS
Our empirical study aims at testing the influence of industrial location factors on territorial attractiveness (case of Tangier Morocco).
Based on the results of Table 9, Figure 2 and the structural equations of section 4.4, we conclude that the subsequent exog-enous latent variables:• ‘ECF’: (path coefficient = 0.465, f2= 0.225, t=3.183,
p-value=0.002);• ‘SCF’: (path coefficient = 0.230, f2= 0.094, t=2.058,
p-value=0.045);

Volume 9 | 2016 | Number 2
| 22 |
• ‘TF’: (path coefficient = 0.339, f2= 0.169, t=2.758, p-value=0.339);
• ‘PRF’: (path coefficient = 0.256, f2= 0.111, t=2.232, p-value=0.030).
have a positive and statistically significant influence on ‘ter-ritorial attractiveness’. The exogenous latent variables:• ‘PF’: (path coefficient = -0.228, f2= 0.063, t=-1.682,
p-value=0.099);• ‘COF’: (path coefficient = -0.154, f2= 0.067, t=-1.731,
p-value=0.089);• ‘LF’: (path coefficient = -0.106, f2= 0.021, t=-0.972,
p-value=0.336);• ‘PF’ and ‘COF’ and ‘LF’ have a negative and statistically insig-
nificant influence on ‘territorial attractiveness’.
In this study we have used the structural equations and par-ticularly the PLS approach to explore the causal links between the constructs that have been postulated and tested. The link between territorial attractiveness and PESTELP factors consid-ered is represented in the model of Figure 2. Therefore, given the structural diagram, the determination of territorial attrac-tiveness (TA) is in the form of structural model equation:
TA= -0.228*PF + 0.465*ECF + 0.230*SCF + 0.339*TF – 0.154*COF – 0.106*LF + 0.256*PRF
CONCLUSION
This article scrutinizes the factors of territorial attractiveness influencing the location of manufacturing and logistics compa-nies in the city of Tangier. Using a PESTEL strategic analysis tool and an exploratory study (face-to-face interview), we were keen to empirically explain the factors that actually attract manufac-turing and logistics companies to the city of Tangier.
We have adopted a statistical analysis approach to verify the existence of causal connections between the different PESTELP factors and the endogenous variable ‘territorial attractiveness’

Volume 9 | 2016 | Number 2
| 23 |
which were measured by a questionnaire on the scale of Likert. From the results of our research, we can conclude that the prox-imity factor, the socio-cultural factor, the economic factor and the technological factor have a positive influence on the territo-rial attractiveness of manufacturing and logistics activities in the city of Tangier. On the other hand, the legal factor, the en-vironmental factor and the political factor do not have a signifi-cant influence in the decision of choosing the city of Tangier for the location of their businesses.
Our conceptual model shows that public and private actors of the city of Tangier must create an observatory to measure, control and adjust the industrial attractiveness of the city of Tangier by ensuring watchfulness on innovative measures of at-tractiveness developed by other cities in the world. In addition, it should be necessary to stimulate the development of a local industry in partnership with foreign firms in order to ensure the transfer of technology and also increase the integration rate of locally manufactured products. These actions might improve the attractiveness of the city of Tangier and thus potentially con-tribute to the reduction of the unemployment rate.
REFERENCES
Addinsoft. 2011. “XLSTAT – Statistics Package for Excel.” Accessed October 20, 2016. https://www.xlstat.com/fr/solutions/fonctionnalites/approche-pls.
Baldwin, R., and P. Krugman. 2004. “Agglomeration, Integration and Tax Harmo- Nization.” European Economic Review 48 (1): 1–23.
Benraiss, Laila. 2004. “Méthodologie de Construction D’une Échelle de Mesure : Application Du Paradigme de Churchill.” Paper presented on Congrés AGRH, Montréal, November 19–21.
Buchanan, S., and F. Gibb. 1998. “The Information Audit: An Integrated Strategic Approach.” International Journal of Information Management 18 (1): 29–47.
Cecchini, L. 2002. “Les Déterminants Des IDE Dans Les Pays Du Bassin Méditerranéen.” CEFI-CNRS. Accessed October 19, 2016. http://www.memoireonline.com/10/09/2813/ m_Lanalyse-des-determinants-de-linvestissement-direct-au-Cameroun17.html.

Volume 9 | 2016 | Number 2
| 24 |
Chin W.W, V., J. Henseler, and H. Wang. 2010. “How to Write up and Report PLS Analyses, Dans Esposito Vinzi.” Handbook of Partial Least Squares, Concepts, Methods and Applications, Springer, Heidelberg, 655–90.
Clémence, DERQUENNE et. 2004. “Une Méthode Alternative À L’approche PLS: Comparaison et Application Aux Modèles Conceptuels Marketings.“ Statistique Aplliquée 52 (3): 37–72.
Coeuré, Benoît, Isabelle Rabaud, and Thierry Madiès. 2003. “Attractivité de La France – Analyse, Perception et Mesure; Suivi D’un Commentaire de Thierry Madiès.” Economie et Statistique 363 (1): 97–127.
Cohen, J. 1988. Statistical Power Analysis for the Behavioral Sciences. Hillsdale, NJ: Lawrence Erlbaum Associates.
Dillon, W. R, and M. Goldstein. 1987. „Multivariate Analysis: Methods and Applications.“ Biometrical Journal 29 (6): 750–756.
Dunning, J. H. 2000. “The Eclectic Paradigm as an Envelope for Economic and Business Theories of MNE Activity.” International Business Review 9: 163–190.
Elhasbi, A., M. Barkaoui, and O. Bouksour. 2015. “The Territorial Attractiveness, Governance, Infrastructures and Logistics Activities: Case of Tangier City, Morocco.” Asian Journal of Management Research 5 (3): 438–50.
Evrard, Y., B. Prad, and E. Roux. 2009. Market–Fondements et Méthodes Des Recherches En Marketing, 3rd Edition. Paris: Dunod.
Fernandes, V. 2012. “En Quoi L’approche PLS Est-Elle Une Méthode a (Re)-Découvrir Pour Les Chercheurs En Management?” Management 15 (1): 102.
Fornell, C., and D. F. Larcker. 1981. “Evaluating Structural Equation Models with Unobservable Variables and Measurement Error.” Journal of Marketing Research 48: 39–50.
Giordano, V., and J. Alain. 2012. “Specifier L’objet de La Recherche. Méthodologie de La Recherche. Réussir Son Mémoire Ou Sa Thèse En Sciences de Gestion.” Pearson Education 5: 47–86.
Hassane, B., and N. Zatla. 2001. “L’IDE Dans Le Basin Méditerranéen, Ses Déterminants et Son Effet Sur La Croissance.” Report Synthesis. Contract FEM-REF/99/B2-04.
Hatem, F. 2004. Investissement International et Politiques D’attractivité. Paris: Economica.
---. 2005. L’attractivité Du Territoire : De La Théorie À La Pratique. Paris: CNER.
Volume 9 | 2016 | Number 2
| 25 |
Head, K., and T. Mayer. 2004. “Market Potential and the Location of Japanese Investment in the European Union.” Safety And Health 86 (2): 959–72.
Iacovone, D., and M. Lhermitte. 2015. “BaroMed 2015 – The next opportunity.”Accessed October 24, 2016. http://www.ey.com/Publication/vwLUAssets/ey-baromed-2015/$FILE/ey-baromed-2015.pdf.
Jakobowicz, Emmanuel. 2007. “Contributions Aux Modèles D’équations Structurelles À Variables Latentes.“ Accessed October 3, 2016. https://tel.archives-ouvertes.fr/tel-00207990/.
---. 2010. “Applications et Exercices.” Accessed October 19, 2016. https://tel.archives-ouvertes.fr/tel-01207810/.
Jöreskog, K.G. 1971. “Statistical Analysis of Sets of Congeneric Tests.” Psychometrika 36: 109–133.
Kalantari, A. H. 2013. “Facility Location Selection for Global Manufacturing.” MA thesis, University of Wisconsin-Milwaukee.
Katko, T.S. 2006. “Road Safety Fatalities, Management, and Policy in Finland.” Public Works Management and Policy 11 (2): 126–38.
Lacroux, A. 2009. “L’analyse Des Modèles de Relations Structurelles Par La Méthode PLS: Une Approche Émergente Dans La Recherche Quantitative En GRH.” Paper presented on XXème Congres (AGRH), Toulouse, November 17-21.
Latan, H., and I. Ghozali. 2012. Partial Least Squares Konsep, Metode, Dan Aplikasi Menggunakan Program WarpPLS 2.0. Semarang: Badan Penerbit Universitas Diponegoro.
Lynch, R. 2009. Strategic Management. London: Pearson Education Limited.
Rallet, A., and A. Torre. 2004. “Proximité et Localisation.” Économie Rurale 280 (1): 25–41.
Rathelot, R., and P. Sillard. 2008. “The Importance of Local Corporate Taxes in Business Location Decisions: Evidence from French Micro Data.” Economic Journal 118 (527): 499–514.
Richardson, Jr. J. V. 2006. “The Library and Information Economy in Turkmenistan.” IFLA Journal 32 (2): 131–39.
Roussel, P., F. Durrieu, E. Campoy, and A. El Akremi. 2002. Méthodes D’équations Structurelles: Recherches et Applications En Gestion. Paris: Economica.
Sascha, B., K. Ekholm, R. Jackle, and M. A. Muendler. 2005. “Location Choice and Employment Decisions of German Multinationals.” Review of World Economics 141 (4): 693–731.
Shilei, L., and W. Yong. 2009. “Target-Oriented Obstacle Analysis by PESTEL Modeling of Energy Efficiency Retrofit for Existing

Volume 9 | 2016 | Number 2
| 26 |
Residential Buildings in China’s Northern Heating Region.” Energy Policy 37: 2098–2101.
Talbot, D. 2009. “L’approche Par La Proximité: Quelques Hypothèses et Éléments de Définitions.” Paper presented at the 18. Annual meeting of l‘Aims, Grenoble.
Tenenhaus, M. 1999. “L’approche PLS.” Rev. Stat. Appliquée 2: 5–40.Tenenhaus, M., V. E. Vinzi, Y. M. Chatelin, and C. Lauro. 2005. “PLS
Path Modeling.” Computational Statistics and Data Analysis 48 (1): 159–205.
Tensaout, M. 2016. “Les Variables Latentes Formatives Avec LISREL et PLSPM.” Paper presented at SFDS Conference, Montpellier.
Wetzels, M., G. Vanopen, and C. Odekerken-Schroder. 2009. “Using PLS Path Modeling for Assessing Hierarchical Construct Models: Guidelines and Empirical Illustration.” MIS Quarterly 33 (1): 177–95.
Yüksel, I. 2012. “Developing a Multi-Criteria Decision Making Model for PESTEL Analysis.” International Journal of Business and Management 7 (24): 52–66.
Yves E., B. Pras, E. Roux. 2009. Market : Etudes et Recherches En Marketing. Paris: Dunod.
Zaied, Y. B., and S. A. Ramzi. 2012. “Les Déterminants Du Succès Entrepreneurial: Une Étude Empirique de La Région de Sfax En Tunisie.” Accessed October 15, 2016. https://ideas.repec.org/p/tut/cremwp/201235.html.
Zait, A., and P. Bertea. 2011. “Methods for Testing Discriminant Validity.” Management and Marketing 9 (2): 8.
Zimmermann, J. B. 2008. “Le Territoire Dans L’analyse Économique. Proximité Géographique et Proximité Organisée.” Revue Française de Gestion 34 (184): 105–18.
Volume 9 | 2016 | Number 2
| 27 |
The Impact of Public Debt on the Economic Growth for the Gulf Cooperation Council CountriesHANADI TAHER,Beirut Arab University, Lebanon
In this paper, I study the government debt to GDP ratio impact on per-capita GDP growth rate for six Gulf Cooperation Council (GCC) countries, namely, Bahrain, Kuwait, Oman, Qatar, Saudi Arabia, and UAE over a period of about 23 years starting in 1990. Some light has shed on the European Union (EU) rela-tionship with the GCC for better economic growth. The test re-sults are consistent with some studies in literature that proved a negative correlation between public debt and nation’s eco-nomic growth above certain threshold although this threshold is not standard. Public debt for the GCC countries has differ-ent effects on per capita GDP growth varying from country to country due to the variation in a number of different factors. The main finding of this study shows that country government debt and macroeconomic determinants have varied impacts on per capita GDP growth for various countries based mainly on their government debt ratios.
Key words: government debt, public debt, economic growth.
INTRODUCTION
Government debt to GDP ratios increased considerably over the past years in most developed and mainly emergent econo-mies which lead to various impacts on economic growth. In this paper, we study the impact of government debt to GDP ratio on per-capita GDP growth rate for six GCC (Gulf Cooperation Council) countries, namely, Bahrain, Kuwait, Oman, Qatar, Saudi Arabia, and UAE over a period of about 23 years starting in 1990. The Gulf Cooperation Council, as an integrating region in the Middle East, established in 1981 in order to reach an eco-nomic and monetary integration of six GCC countries—Saudi
Volume 9 | 2016 | Number 2
| 28 |
Arabia, Kuwait, the United Arab Emirates, Qatar, Bahrain, and Oman. These regional integrating members share same econom-ic structure as oil exporters beside the similarities in culture. Nowadays, in the globalized world virtual borders are present so that the Middle East European neighborhood is a matter to study economically. The most stable multilateral Middle Eastern organization is the GCC, beside the GCC member states role in securing the global and European financial system because of their sovereign wealth funds. Therefore, it is important to high-light on the relationship between the European Union and GCC partnership.
For these countries, government debt increased inconsist-ently during the last decades. While the government debt to GDP ratio has increased in all tested countries from 1990 to 2014, Kuwait was an exception that showed a sharp increase in 1991 reached 203% of GDP then started to decrease gradually to reach 7% of GDP in 2014. For some countries, such as Saudi Arabia and Kuwait public debt and economic growth showed a negative relationship with higher public debt and lower eco-nomic growth, while for other countries the results were more synchronised where higher government debt to GDP ratio was accompanied by increase in economic growth. Simply we can say, for all tested countries, the case of higher government debt to GDP ratio and lower economic growth are for countries with high government debt to GDP mean. The reasons for the increase in public debt are important issues to be explained in order to check its economic impacts and thus for building up the gov-ernment’s economic and fiscal strategies. Reinhart and Rogoff (2010) argue that peacetime debt is more complicated for future economic growth compared to wartime debt explosions.
One of the important questions related to the economic integration for the GCC countries is their public debt to GDP ratio. An increase in the public debt-to-GDP ratio, ceteris par-ibus, has accompanied with a decline in the economic growth rate. Theoretically, this relationship proved to have a non-linear impact where it turned to negative only after a certain thresh-old. In this paper, this non-linear relationship between govern-ment debt and economic growth has tested between the GCC

Volume 9 | 2016 | Number 2
| 29 |
countries that have different public debt to GDP ratios, taking into consideration other macroeconomic and debt variables. Most GCC policymakers try to reduce their country’s public debt ratios thinking that high government debt would decrease long-run economic growth. However, the government debt ratio negative impact on long-run economic growth is considerably consistent with the neoclassical and endogenous growth models (Diamond 1965; Saint Paul 1992). Although, other beliefs that government debt affects the public expenditures productivity which could have a higher negative effect on economic growth (Teles and Cesar Mussolini 2014). In the same vein, high gov-ernment debt could increase uncertainty of future financial re-pression (Cochrane 2011), and increase sovereign risk (Codogno et al. 2003), and it would lead to lower private investment and higher real interest rates (Tanzi and Chalk 2000; Laubach 2009). However, it is recommended to build up different scenarios or polices related to expansionary fiscal policies by avoiding eco-nomic recessions risks this would have to have a positive effect on both short and long-term economic growth (DeLong and Summers 2012).
In recent empirical study of Reinhart and Rogoff (2010) found that government debt and economic growth generally have a weak relationship for countries with government debt below 90% of GDP while government debt can have adverse consequences on economic growth for countries with debt-to-GDP above 90%. The 90% threshold value of Reinhart and Rogoff (2010) have attempted to provide a formal test by other studies, for exam-ple, Cecchetti et al. (2011b) employ the threshold regression of Hansen (2000) to estimate public debt thresholds. Cecchetti et al. (2011b) tested the effects of public debt on economic growth for 18 OECD countries from 1980 to 2010 using a new dataset on debt levels. Their results showed that government debt affect eco-nomic growth negatively when it is above 85% of GDP. However, Caner et al. (2010) using data for a larger set of countries from 1980 to 2008 based on threshold regression methods find that the critical level of debt where it starts to affect negatively the economic growth is at a threshold of 77% public debt-to-GDP ra-tio. In the same vein, Minea and Parent (2012) found that there

Volume 9 | 2016 | Number 2
| 30 |
is a negative effect of public debt on economic growth when the level of debt to GDP is between 90% and 115% by employing the panel smooth threshold regression model.
The recent financial crisis and economic recession in 2008 has resulted in serious economic problems for many regions and coun-tries, some countries succeed to make a smooth economic reform during the last few years. This crisis affects most of the major macroeconomic variables like the increasing unemployment rate and climbing budget deficits, while most remarkable variable was the public debt that rapidly increased since 2008 worldwide. The Middle East region, more precisely the GCC states, is one of the regions most affected by debt due to their economic structure as oil dependent integrating economies. This crisis had a great effect on most of the GCC overall economies, since their governments worked hardly to peruse a stable public finance sector. Therefore, it is important to study the GCC government debt and other macroeconomic indicators for economic growth.
In studying the impact of public debt on per capita GDP growth rate for the GCC countries in this paper, I start by pro-viding a theoretical and empirical literature review on the im-pact of government debt on economic growth. Then, I introduce the econometric model as a multi-regression relationship for the economic growth and government debt including other control variables after presenting the European Union –GCC partner-ship. Finally, I conclude the article with section data description empirical findings.
LITERATURE REVIEW
The empirical study on the government debt impact on economic growth is taking more attention mainly for the developed econo-mies and much less for emergent economies. The theoretical lit-erature focused on the negative relationship between the public debt to GDP ratio and GDP per capita growth rate (Saint-Paul 1992; Aizenman et al. 2007). Other growth models concluded that there could be a possible positive impact for the public debt on the economic growth during the different stages of debt struc-ture, based on where the debt is financed (Aizenman et al. 2007)

Volume 9 | 2016 | Number 2
| 31 |
or when it reached a certain limit in financing a productive public capital (Aschauer 2000). The empirical studies on the impact of the government debt on economic growth recently are recently focusing on developing countries, while studies over the Middle East region mainly the GCC countries are mainly absent.
Reinhart and Rogoff (2010), using simple correlation for a sample of 20 developed countries from 1790 to 2009, studied the changes of public debt and the long-term real GDP growth rate. They noticed that there is a negative impact on government debt to GDP ratios on the long-term growth for the debt to GDP ratios below a threshold of 90% while above this threshold the median for the economic growth rate decreases by one percent point. In a sample of emerging and advanced economies, Kumar and Woo (2010) showed a linear inverse relationship between initial debt and subsequent growth. For the whole sample of emerging and developed countries, they also find a significant negative effect of public debt on economic growth at high public debt levels above 90 per cent of GDP, which is an evidence of nonlinearity.
The theoretical approaches to the impact of government debt and economic growth directed more toward a negative sign. In a neoclassical setting, growth models showed a negative relation-ship between government debt and economic growth, which raised with public debt, issued to finance consumption or capital goods. Modigliani (1961), based on Meade (1958), stated that the government debt is a huge load for next generations due to the reduction on the flow of income from a private capital. Modigliani considered the gross load of government debt might be, when the debt is financing government expenditure that af-fect the real income of the next generations, mainly productive public capital formation. Several empirical and theoretical con-tributions studied on the impact of external debt on the econom-ic growth and the reasons that rises this impact. In this context, Krugman (1988) mentioned the term of “debt overhang” which reflect the case of a country’s expectation for an external debt repayment ability that falls below the original value of debt. The theoretical model of Cohen’s (1993) confirm the existence of a non-linear foreign borrowing impact on investment and thus on economic growth. Continuously, external debt accumulation

Volume 9 | 2016 | Number 2
| 32 |
can promote investment up to a certain threshold, while beyond this threshold the debt overhang will state showing negative pressure on investors as main capital providers.
The empirical research on the relationship between the public debt and the economic growth has mainly focused on the rela-tionship between external public debt and economic growth in developing countries. Accordingly, several recent studies have shown a non-linear impact of external debt on economic growth, with deviated effects for high public debt ratios mainly after a certain threshold debt to GDP ratio. Pattillo et al. (2002) found a negative impact for external debt on per-capita GDP growth, for public debt levels above 35-40% of GDP as net present value. They used in their test a panel dataset of 93 developing coun-tries from 1969 to 1998. Similarly, Clements et al. (2003), us-ing a panel dataset of 55 low-income countries from 1970 to 1999, investigated the relationship between the external debt and per-capita GDP growth and found that the turning point is above 20-25% of GDP also as net present value of external debt. Smyth and Hsing (1995) and Cohen (1997), as empirical stud-ies also found a non-linear effect of external debt on economic growth. However, Schclarek (2004), using a panel of 59 develop-ing countries from 1970 to 2002 found a linear negative impact of external debt on per-capita growth.
RESEARCH METHODOLOGY
In this research the dataset used was build up using mainly WDI statistics. In total six countries were selected: Bahrain, Kuwait, Qatar, Oman, Saudi Arabia, and UAE. The criteria for country selection were the integration process that gather these coun-tries and off course the availability of data.
Dataset gathered according to countries’ specific factors be-side the availability of data focusing on the debt variables, such as government debt to GDP and private debt. Other macroeco-nomic indicators selected according to the availability of data. These indicators are: trade openness, population growth, for-eign direct investment that could have an important effect on economic growth, inflation rate due to the important influence
Volume 9 | 2016 | Number 2
| 33 |
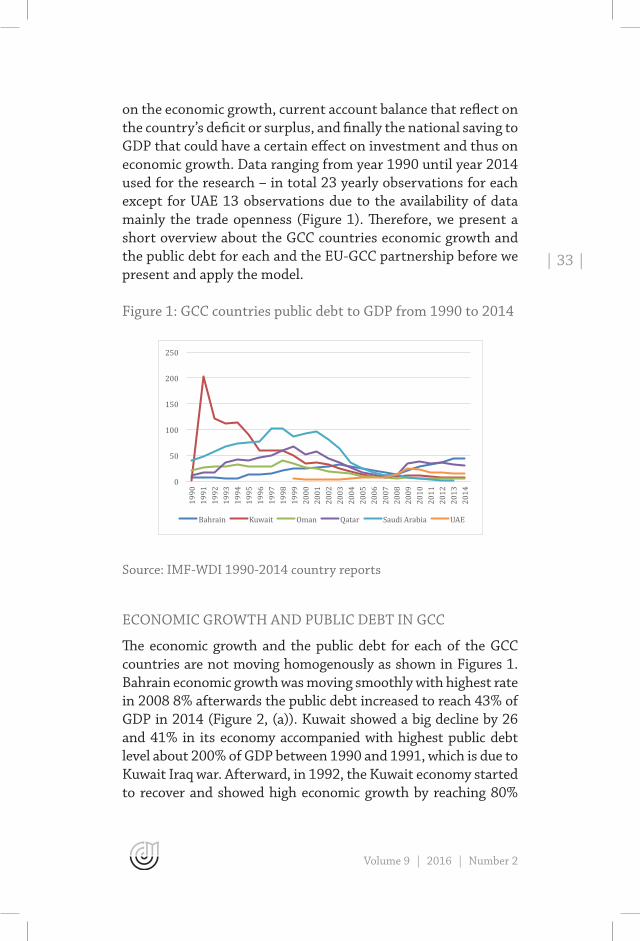
on the economic growth, current account balance that reflect on the country’s deficit or surplus, and finally the national saving to GDP that could have a certain effect on investment and thus on economic growth. Data ranging from year 1990 until year 2014 used for the research – in total 23 yearly observations for each except for UAE 13 observations due to the availability of data mainly the trade openness (Figure 1). Therefore, we present a short overview about the GCC countries economic growth and the public debt for each and the EU-GCC partnership before we present and apply the model.
Figure 1: GCC countries public debt to GDP from 1990 to 2014
0
50
100
150
200
250
1990
1991
1992
1993
1994
1995
1996
1997
1998
1999
2000
2001
2002
2003
2004
2005
2006
2007
2008
2009
2010
2011
2012
2013
2014
Bahrain Kuwait Oman Qatar Saudi Arabia UAE
Source: IMF-WDI 1990-2014 country reports
ECONOMIC GROWTH AND PUBLIC DEBT IN GCC
The economic growth and the public debt for each of the GCC countries are not moving homogenously as shown in Figures 1. Bahrain economic growth was moving smoothly with highest rate in 2008 8% afterwards the public debt increased to reach 43% of GDP in 2014 (Figure 2, (a)). Kuwait showed a big decline by 26 and 41% in its economy accompanied with highest public debt level about 200% of GDP between 1990 and 1991, which is due to Kuwait Iraq war. Afterward, in 1992, the Kuwait economy started to recover and showed high economic growth by reaching 80%

Volume 9 | 2016 | Number 2
| 34 |
while public debt started to decrease and reached 6% of GDP in 2014 (Figure 2, (b)). Oman and Qatar public debt started to de-cline in 200 and their economic growth was moving smoothly for Oman and fluctuating for Qatar (Figure 2, (c), (d)). Saudi Arabia showed highest public debt rate in 1998 and 1999 then this level decreased gradually to reach 1.5% of GDP in 2013. This is the re-sult of higher government revenue from oil production. The con-sidered for United Arab Emirates was from 1999 to 2014 and be-cause of this limitation in data availability no big variation either to the economic growth or for the public debt registered (figure 2, (e)). Therefore, we will test the factors affecting the economic growth for each country focusing mainly on the public debt.
Figure 2: GCC countries economic growth versus public debt to GDP
0 10 20 30 40 50
(a) Bahrain economic growth versus public debt change 1990-‐2014
Bahrain Bahrain
-‐100 -‐50 0 50 100 150 200 250
(b) Kuwait economic growth versus public debt change 1990-‐2014
Kuwait Kuwait

Volume 9 | 2016 | Number 2
| 35 |
-‐10 0 10 20 30 40 50
(c) Oman economic growth versus public debt change 1990-‐2014
Oman Oman
-‐20
0
20
40
60
80
(d) Qatar economic growth versus public debt change 1990-‐2014
Qatar Qatar
-‐20 0
20 40 60 80
100 120
(e) Saudi Arabia economic growth versus public debt change 1990-‐2014
Saudi Arabia Saudi Arabia

Volume 9 | 2016 | Number 2
| 36 |
-‐10 -‐5 0 5
10 15 20 25 30
(f) UAE economic growth versus public debt change 1990-‐2014
UAE UAE
Source: IMF WDI 1990-2014 country reports
EUROPEAN UNION – GCC PARTNERSHIP
In 1995, Barcelona Conference launched the Euro-Mediterra-nean Partnership. However, in 1990, European Union-GCC Cooperation Agreement presented three basic objectives: mainly European Union-GCC institutional framework, bet-ter economic cooperation, and push development in the GCC countries.
Recently, the GCC region has considered as the most sta-ble regional organization based on multilateralism and coop-eration. Facing the latest financial crisis Gulf sovereign wealth funds used to help in rescuing the European financial system. Therefore, a deep study for the European Union-GCC partner-ship most be launched for better economic growth for all par-ties. Accordingly, the European Union need to develop a strong strategy to encourage their bilateral relations with GCC mem-ber states and to support the GCC regional integration process based on their experience (Saleh 1999). Unfortunately, the European Union-GCC partnership is still weak due to different reasons: mainly due to their common interest in energy sector; to low degree of ‘Europeanization’ towards the GCC countries; and to lower degree of institutionalisation.

Volume 9 | 2016 | Number 2
| 37 |
MODEL AND DATA
The dataset used in the study collected mainly from IMF and WDI statistics. The dataset used for testing the impact of the GCC countries government debt on their economic growth com-posed mainly on the debt and non-debt variables. These vari-ables selected based on their reliance and on the availability of yearly data like the public debt, private debt trade openness, na-tional saving, the current account balance, Population growth, foreign direct investment, and finally Inflation rate due to their important influence on the economic growth. Data ranging from year 1990 until year 2014 used in this study in 24 yearly observations where it is limited due to the availability of data.
The research multiple linear regression equation model consists of one dependent and nine independent variables for the time pe-riod t, which equals 24 periods. The model equation is as follows:
gGDPt = α + β1PDBTt + β2NSAVt + β3PDt + β4 LN(GDP/Cap)t + β5PPt + β6FDIt + β7OPNt + β8CABt + β9INFt + εt (2)
Consider the following: α is a constant variable; β is the re-gression coefficients; εt is the error term.
The model dependent variable at the time t is: gGDPt represents the growth rate for the gross domestic product used as a per-centage change for the GDP at current prices in US dollars;
The model independent variables at the time t are: • PDBTt (General government gross debt to GDP) is defined
as the total gross debt at the end of each year• NSAVt (national saving to GDP) is calculated as total na-
tional and dividing it by GDP.• OPNt (openness) has calculated as trade of goods and ser-
vices divided by GDP. • PDt (private debt) is the calculated as the domestic credit to
private sector as percentage of GDP. • PPt (population growth rate) has calculated as the annual
percentage change in nation’s population. • FDIt (foreign direct investment) is the net inflow of foreign
direct investment to GDP ratio

Volume 9 | 2016 | Number 2
| 38 |
• CABt (Current Account Balance to GDP) is the current ac-count balance divided by GDP.
• INFt (inflation average CPI) has calculated as the percentage change in the annual CPI.
• LN(GDP/Cap) (log of GDP per capita) is the natural loga-rithm for annual GDP per capita.
The main hypotheses to be tested in this model is that the government debt to GDP ratio has a significant positive effect in countries with relatively low ratio as it is studied and analyzed in the literature.
EMPIRIRCAL RESULTS
We test the impact of the 6 GCC countries’ government debt to GDP ratio on GDP per capita growth rate in a sample of 6 GCC countries, namely, Bahrain, Kuwait, Oman, Qatar, Saudi Arabia, and UAE. Basic data comes from IMF mainly WDI database cov-ering primarily the period 1990–2014. Adjusted R square and Durbin-Watson test results for GCC countries registered respec-tively at Table 1.
Table 1: Econometric test results
Bahrain Kuwait Oman Qatar Saudi Arabia
UAE
Durbin-Watson 1.859 1.505 2.709 2.123 2.132 1.962R Square .777 .613 .814 .688 .685 .908Adjusted R Square .673 .345 .685 .375 .482 .447Sig. .001 .085 .002 .128 .021 .383F 7.465 2.288 6.305 2.200 3.376 1.972Number of observations 23 23 23 19 24 13
Public debt mean 19.9267 48.2677 19.9007 37.7552 49.6872 12.308
Source: own calculation

Volume 9 | 2016 | Number 2
| 39 |
Table 2: Significance level for each variable for each country
Variable Bahrain Kuwait Oman Qatar Saudi Arabia
UAE
Public debt to GDP .018 .419 .012 .618 .747 .855national saving to GDP .050 .023 .114 .785 .824 .781population .000 .348 .015 .193 .492 .646trade to GDP .003 .519 .366 .052 .356 .650Domestic credit to pri-vate sector (% of GDP) NA .096 .008 .185 .018 .770
Current account balance to GDP .724 .050 .311 .627 .468 .923
inflation average CPI NA .916 .150 .158 .457 .605FDI net inflow .178 .575 .277 .635 .729 .822LNGdpPcap .230 .377 .052 .041 .872 .839
Note: Bahrain For models with dependent variable GDP Per capita growth rate, the following variables are constants or have missing cor-relations: Domestic credit to private sector (% of GDP), inflation aver-age. They deleted from the analysis. Source: own calculation
Table 3: Beta coefficients
Variable Bahrain Kuwait Oman Qatar Saudi Arabia
UAE
Public debt to GDP .783 -.719 1.537 .253 -.254 .393national saving to GDP .893 -6.379 .822 .258 .442 -.799population -.642 -.336 -.417 -.844 .188 2.036trade to GDP .877 -.455 .227 -.825 -.663 -1.971Domestic credit to pri-vate sector (% of GDP) NA -.947 -.750 -.709 -1.143 .343
Current account bal-ance to GDP .105 5.926 .329 -.315 1.086 -.348
inflation average CPI NA -.036 .264 .941 .221 -3.882FDI net inflow -.268 -.178 -.323 -.274 .149 .870LNGdpPcap -.368 .482 1.329 1.555 .136 -.240
Note: Bahrain For models with dependent variable GDP Per capita growth rate, the following variables are constants or have missing cor-relations: Domestic credit to private sector (% of GDP), inflation aver-age. They deleted from the analysis.Source: own calculation

Volume 9 | 2016 | Number 2
| 40 |
Although all countries showed good to acceptable result, Kuwait and Qatar are with adjusted R square 0.345 and 0.375, which is an acceptable result. We notice accordingly that the independent variables used explained by 34.5% and 37.5% of GDP variance. The other countries adjusted R square results are around 0.5 and above. The adjusted R square for Oman and Bahrain equal to 0.685 and 0.673 (see Table 1).
The Durbin-Watson test values are within 1.2 and 2.5 in most cases except for Oman with 2.709, which shows no autocorrela-tion of residuals. In general, we can notice from the test results the model worked well in all tested countries (see Table 1).
The regression results differ from country to country as shown in table 1. Public debt has positively relationship to the economic growth for Bahrain, Oman, Qatar and UAE and the results showed significance just in Bahrain and Oman. The re-sult showed a negative relation between the public debt and economic growth for Saudi Arabia and Kuwait and statistically insignificant. Bahrain, Oman, Qatar and UAE showed a low to medium public debt percentage to GDP while Kuwait and Saudi Arabia with mean 48.2 and 49.6 showed a relatively high public debt level (see table.1). These results reflect the theoretical find-ing for Reinhart and Rogoff (2010) that show a weak relation-ship between government debt and real GDP growth for debt to GDP ratios below 90% threshold. The β coefficient and signifi-cance results for each variable used and for each tested country shown in table 3. Private debt results showed a negative rela-tion to economic growth to most of the tested countries except for UAE, which could be justified due to the small number of observation (13 observation), and the results for Bahrain was not registered to the missing correlation and the results were significantly related just in Oman and Saudi Arabia.
CONCLUSION
The main finding of this paper shows that the different levels of the GCC countries’ government debt have a significant im-pact on their economic growth, positively related for cases of low public debt to GDP and negatively related above certain
Volume 9 | 2016 | Number 2
| 41 |
threshold. In the test cases, the results reflected the theoreti-cal finding for Reinhart and Rogoff (2010) by taking the 90% of GDP as the threshold. The regression test results differ from country to country as shown in table 1. Public debt has posi-tive relationship to the economic growth for Bahrain, Oman, Qatar and UAE and the results shows significance just for the cases of Bahrain and Oman. The result proves that the public debt in case of Saudi Arabia and Kuwait has a negative impact on their economic growth and is statistically insignificant. Bahrain, Oman, Qatar and UAE show a low to medium public debt percentage to GDP while Kuwait and Saudi Arabia with mean 48.2 and 49.6 expose a relatively high public debt level. In this research, trade openness, private debt, and the other tested variables have different effects on GDP, due to countries’ char-acteristics variations. A recommendation stemming out of this research is that the European Union and GCC member states partnership becomes more pro-active and encourages a bilateral relationship that can provide better economic growth for the Euro-Mediterranean region.
REFERENCES
Abbas, A., N. Belhocine, A. El-Ganainy, and M. Horton. 2010. “A Historical Public Debt Database.” Working paper No. 10/245. International Monetary and Funds. Accessed September 6, 2016. https://www.imf.org/external/pubs/cat/longres.aspx?sk=24332.0.
Aizenman, J., K. Kletzer and B. Pinto. 2007. “Economic growth with constrains on tax revenues and public debt: implications for fiscal policy and cross-country differences.” Working paper 12750. The National Bureau of Economic Research. Accessed September 6, 2016. http://www.nber.org/authors/joshua_aizenman.
Aschauer, A. D. 2000. “Do states optimize? Public capital and economic growth.” The Annals of Regional Science 34: 343–363.
Baum, A., C. Checherita, and P. Rother. 2012. “Debt and growth: new evidence for the Euro area.” Working paper No.1450. European Central Bank. Accessed October 10, 2016. http://edz.bib.uni-mannheim.de/daten/edz-ki/ezb/12/w-paper/ecbwp1450.pdf.
Caner, M., T. Grennes, and F. Koehler-Geib. 2010. “Finding the tipping point – when sovereign debt turns bad.” Working Paper

Volume 9 | 2016 | Number 2
| 42 |
No.5391. World Bank Policy Research. Accessed May 10 2016. Doi:10.1596/1813-9450-5391.
Cecchetti, S., M. Mohanty and F. Zampolli. 2011. “The real effects of debt.” Working Paper No 352. Bank of International Settlement. Accessed October 10, 2016. http://www.bis.org/publ/work352.pdf.
Checherita, C., and P. Rother. 2012. “The impact of high and growing government debt on economic growth: an empirical investigation for the Euro area.” European Economic Review 56:1392–1405.
Clements, B., R. Bhattacharya, and T. Nguyen. 2003. “External debt, public investment, and growth in low-income countries.” Working Paper 03/249. International Monetary and Funds. Accessed October 12, 2016. http://www.imf.org/external/pubs/cat/longres.aspx?sk=17074.
Cochrane, J. H. 2011. “Understanding policy in the great recession: some unpleasant fiscal arithmetic.” European economic review 55 (1): 2–30.
Codogno, L., C. Favero and A. Missale. 2003. “Yield spreads on EMU government bonds.” Economic Policy 37: 503–532.
Cohen, D. 1993. “Low Investment and Large LDC Debt in the 1980s.” American Economic Review 83/ 3.
Cohen, D. 1997. “Growth and external debt: a new perspective on the African and Latin American tragedies.” Discussion paper No. 1753. Centre for Economic Policy Research. Accessed October 10, 2016. https://www.ecb.europa.eu/pub/pdf/scpwps/ecbwp1237.pdf.
Cordella, T., L. Ricci, and M. Ruiz-Arranz. 2010. “Debt overhang or debt irrelevance?” Staff papers No.05/223. International Monetary and Funds. Accessed May 10, 2016. http://citeseerx.ist.psu.edu/viewdoc/download?doi=10.1.1.101.3406&rep=rep1&type=pdf.
Diamond, P. 1965. “National debt in a neoclassical growth model.” The American Economic Review 55(1): 1126–1150.
Fosu, A. K. 2010. “The External Debt Burden and Economic Growth in the 1980 s: Evidence from Sub-Saharan Africa.” Canadian Journal of Development Studies 20 (2): 307–18.
Fouad, M., W. Maliszewski, M. Hommes, H. Morsy, M. Petri, and L. Soderling. 2007. “Public Debt and Fiscal Vulnerability in the Middle East.” Working Paper 07/12. International Monetary Fund. Accessed May 10, 2016. http://citeseerx.ist.psu.edu/viewdoc/download?doi=10.1.1.531.9010&rep=rep1&type=pdf.
Hansen, B. 1999. “Threshold effects in non-dynamic panels: estimation, testing and inference.” Economic Review 83 (3):437–49.
Volume 9 | 2016 | Number 2
| 43 |
International Monetary Fund. 2015. World Economic Outlook Database. Washington, DC. Accessed June 5, 2016. https://www.imf.org/external/pubs/ft/weo/2015/02/weodata/index.aspx.
Krugman, P. 1988. “Financing vs. forgiving a debt overhang: Some analytical issues.” Working paper. The National Bureau of Economic Research 29: 253-268. Accessed June 5, 2016. http://www.nber.org/papers/w2486.
Kumar, M., and J. Woo. 2010. “Public debt and growth.” Working paper 10/174. International Monetary Fund. Accessed June 5, 2016. http://www.imf.org/external/pubs/cat/longres.aspx?sk=24080.0.
Laubach, T. 2009. “New evidence on the interest rate effects of budget deficits and debt.” Journal of European Economic Association 7(4): 858–885.
Meade, J. E. 1958. “Is the National Debt a Burden?” Oxford Economic Papers 10/2: 163–183.
Minea, A., and A. Parent. 2012. “Is High Public Debt Always Harmful to Economic Growth? Reinhart and Rogoff and some complex nonlinearities.” CERDI Working Papers, no. 201218. Accessed May 5, 2016. http://publi.cerdi.org/ed/2012/2012.18.pdf.
Modigliani, F. 1961. “Long-Run Implications of Alternative Fiscal Policies and the Burden of the National Debt.” Economic Journal 71(284): 730-755.
Pattillo, C., H. Poirson, and L. Ricci. 2002. “External debt and growth.” Working paper 02/69. International Monetary Fund. Accessed May 5, 2016. https://www.imf.org/external/pubs/ft/wp/2002/wp0269.pdf.
Pescatori, A., D. Sandri, and J. Simon. 2014. “Debt and Growth: Is There a Magic Threshold?” Working papers No.14/34. International Monetary Fund. Accessed May 10, 2016. https://www.imf.org/external/pubs/ft/wp/2014/wp1434.pdf.
Reinhart, C., and K. Rogoff. 2009. “The aftermath of financial crises.” Working paper w14656. The National Bureau of Economic Research. Accessed May 5, 2016. http://www.nber.org/papers/w14656.
Reinhart, C., and K. Rogoff. 2010. “Growth in a time of debt” The American Economic Review. 100(2): 573–578.
Saint Paul, G. 1992. “Fiscal Policy in an endogenous growth model.” The Quarterly Journal of Economics 107: 1243–1257.
Saleh, N. 1999. “The European Union and the Gulf States: A Growing Partnership.” Middle East Policy Council Journal 7(1): 13–20.
Schclarek, A. 2004. “Debt and economic growth in developing industrial countries.” Working paper No.2003/20. Lund University.

Volume 9 | 2016 | Number 2
| 44 |
Smyth, D., and Y. Hsing. 1995. “In search of an optimal debt ratio for economic growth.” Contemporary Economic Policy 13: 51–59.
Teles, V. K., and C. C. Mussolini. 2014. “Public debt and the limits of fiscal policy to increase economic growth.” European Economic Review 66(1): 1–15.
Tanzi, V., and N. Chalk. 2000. “Impact of large public debt on growth in the EU: a discussion of potential channels.” European Economic review 2(4): 23–43.

Volume 9 | 2016 | Number 2
| 45 |
Visualizing Emotion and Affect: Visitor Encounters at St. Peter’s BasilicaCAITLIN FINLAYSON,University of Mary Washington, Department of Geography, USA
St. Peter’s Basilica is the largest church in the world by both area and volume and its impressive structure generates feel-ings of awe and reverence in visitors. How do visitors portray these emotive experiences? What spaces within the church do they highlight, and how does the space affect their encounter? Other studies of affect and emotion have examined a variety of spaces, but research on historical religious sites and the ways in which they are experienced by visitors remains limited. This project seeks to contribute to the emerging dialog of affect and emotion by providing a case study analyzing visitor pho-tographs of St. Peter’s Basilica. These photographs reveal that visitors commonly document beams of light and the structure’s impressive ceiling, suggesting that these elements, more than explicitly religious symbols, are central to the emotional experi-ence of encountering the space.
Key Words: geography, religion, emotion, sacred space
INTRODUCTION
St. Peter’s Basilica located in Vatican City is, by some meas-ures, the largest church in the world. It was built at the height of the Renaissance and each year, attracts an estimated 7 mil-lion visitors (Orcutt 2016). Although this impressive site is considered to be a sacred space and a pilgrimage destination for Roman Catholics, it is also a destination for non-religious tourists. As with many religious sites that have become tour-ist destinations, St. Peter’s Basilica represents an intersection of the spiritual and the secular, a location that is experienced contemporaneously as sacred and profane. In either case, it has continually inspired meaningful emotional encounters
Volume 9 | 2016 | Number 2
| 46 |
among visitors who often document their experience using visual media.
St. Peter’s Basilica is certainly one of the most impressive ex-amples of Roman Catholic architecture during the Renaissance. Counted among its architects, artists, and designers are some “of the greatest artists of the age, among them Bramante, Michelangelo, Raphael, and Bernini” (Scotti 2007, 19). In a broader Mediterranean context, the Mediterranean basin is the world’s largest tourist destination attracting around one-third of all international tourists (UNEP/MAP: State of the Mediterranean Marine and Coastal Environment 2012) and the ways in which people experience and interact with the religious and monumental architecture of this region is a worthy object of study. Studies of emotion and affect have grown in a number of different disciplines (see Pile 2010) but examinations of these phenomena from a visual perspective remain limited. The prolif-eration of smart phone cameras has made the visual documen-tation of tourist explorations relatively easy and subsequently the sheer volume of freely accessible imagery can aid research-ers in understanding the ways in which visitors understand and portray their spatial encounters. In 2011, Flickr announced that it had reached 6 billion uploaded photos (Olivarez-Giles 2011). The billions of openly accessible photographs on this sharing site alone present researchers from a variety of disciplines and from any world region the unprecedented ability to study emo-tion and affect from a visual perspective.
This project aims to push research forward in the area of af-fect and emotion by investigating the ways in which people expe-rience, and visually portray the experience, of visiting religious structures. Specifically, this project analyzes visitor experiences at St. Peter’s Basilica in Vatican City to determine how affect and emotion factor into their accounts. There are two princi-ple research questions that this project explores. First, how do visitors visually portray their experience at St. Peter’s Basilica? Secondly, what spaces within and outside of St. Peter’s Basilica do visitors generally represent in their photography? Although St. Peter’s Basilica was completed in early the 17th century, its monumental architecture is on a scale still unmatched in today’s

Volume 9 | 2016 | Number 2
| 47 |
society. How often do you walk into a single room that is 190 meters (623 feet) long and 45.5 meters (149 feet) high, or stand under a 136 meter high (446 feet) dome (“The Basilica” 2014)? When it was built beginning in the early 16th century, the height and splendor of the ceiling were meant to elicit notions of heav-en (“History” 2014), and photographs taken by visitors reveal that even today, the splendor of St. Peter’s Basilica remains a sight to behold.
While the impressive structure of St. Peter’s Basilica anec-dotally generates feelings of awe and reverence in visitors, but little attention has been given to the tangible ways this space is experienced and portrayed by visitors. What spaces within the church do visitors highlight, and how does the space affect their encounter? Other studies of affect and emotion have examined a variety of modern spaces, from homes to megachurches, and have even investigated virtual spaces, but research on historical religious sites and the ways in which they are experienced by visitors remain limited. This project seeks to contribute to the emerging dialog of affect and emotion by providing a case study as well as a theoretical and methodological foundation upon which future research can proceed.
UNDERSTANDING EMOTION, AFFECT, AND PERSONAL EXPERIENCE
Studies of affect and emotion in a religious context have reemerged as a central object of study in a number of different disciplines, to include anthropology (see Bowen 2015), geogra-phy (see Finlayson 2012), psychology (see Lee et al. 2012), and religious studies (see Samuels 2010). In these encounters, the participant’s emotional and affective experience becomes cen-trally important with the researcher commonly relying on in-depth interviews or quantitative surveying and questionnaires. While these studies give needed insight into personal religious experience, there has been little attention given to utilizing oth-er media to uncover the ways in which people portray their own encounters with spiritual spaces.

Volume 9 | 2016 | Number 2
| 48 |
The ways people interact with and experience spaces can have a significant emotional impact. In exploring the lived experience of Czechoslovakia’s 1989 Velvet Revolution, for example, Trnka (2012, 50) found that for participants “being part of the event of the revolution is /---/ evoked not only in terms of its emo-tional impact /---/ but also by locating the physical self within public spaces that are invested (or in many cases re-invested) with novel political and personal meaning and dramatically en-larged through new connections with the global or European sphere.” Though not explicitly focusing on emotion, Premazzi et al. (2013) found a significant emotional component to the ways in which first- and second-generation Egyptians living in Italy were affected by the events of the Arab Spring relating to both their present location and their conceptions of their ethnic homeland. In an editorial on emotional geographies, Davidson and Milligan (2004, 524) noted: “Our attempts to understand emotion or make sense of space are, thus, somewhat circular in nature. We can, perhaps, usefully speak of an emotio-spatial hermeneutic: emotions are understandable - ‘sensible’ - only in the context of particular places. Likewise, place must be felt [em-phasis in original] to make sense.” This place-based emotional experience can be explored from a variety of different disci-plines and methodological perspectives. Kraftl and Adey (2008, 213), for example, combine architectural analysis and theories of nonrepresentation to undertake a geographic analysis of the experience of being in buildings. They write: “For architects and their buildings to be taken seriously, buildings must be imbued with the power to make a difference to their inhabitants” (ibid.). It is this feeling of being in places that helps explain what drives tourists to explore particular destinations. Why travel to the Mediterranean, for example, instead of simply watching a film about the region? The act of being in spaces has a powerful ca-pacity to affect an emotional response.
Being in spaces is a decidedly personal encounter, and thus individual experience becomes centrally important. Within geography, researchers have continually called for a greater at-tention to the lived religious experience (Holloway 2006; Kong 1990, 2010), and some studies have contributed to this growing

Volume 9 | 2016 | Number 2
| 49 |
body of research (see Pile 2010). Williams (2016), for example, examined emotional experiences of the spiritual landscapes of Pentecostal worship. Holloway (2006, 182) investigated sensu-ous experiences in the space of the séance in the nineteenth century spiritualist movement, finding that “wider cultural-political discursive practices were (re)produced and sometimes challenged in the construction of this space.”
If the location of the affective encounter is meaningful, as researchers have continued to find, then what role can modern technology plan in the documentation of that location? If an emotive and affective spiritual encounter is the product of or is inspired by particular places, researchers could then analyze the ways participants document place. As Rose (2016, 2) notes, visual “images are never transparent windows onto the world. They interpret the world; they display it in very particular ways; they represent it” (ibid.). In this way, photographs can be used to peer through the lens, both literal and metaphorical, through which participants viewed their own experience. Furthermore, there is intentionality behind what we decide to visually docu-ment and these visual documentations of affective encounters could provide researchers with a tangible representation of per-sonal, emotional experience. This research project seeks to build upon existing literature on emotion and place by providing a new avenue of analysis and insight into how participants docu-ment their own experience of encountering spaces.
METHODOLOGY
For this project, a team of researchers including two undergradu-ate students queried Flickr, an online photo sharing website, for photographs of St. Peter’s Basilica. Images of St. Peter’s Basilica were tagged using a number of different spellings, including “Saint Peter’s Basilica,” “St. Peter’s Basilica,” and “St Peter’s.” Although other search strings provided a larger set of images, the complete spelling out of “Saint Peter’s Basilica” provided a large set (over 21,000 results) of images that were primarily of St. Peter’s Basilica in Vatican City rather than a number of other St. Peter’s churches and Cathedrals around the world. The students thus ran a simple

Volume 9 | 2016 | Number 2
| 50 |
search for “Saint Peter’s Basilica,” filtered the images to only in-clude images published under the Creative Commons license (a total of 2,876 photographs), and collected the first 500 results. By filtering only photographs published under the Creative Commons license, we were able to analyze images primarily taken by amateur photographers rather than professionals.
The image URL and caption were imported into Google Sheets to enable collaboration and each image was given a unique iden-tification number. One difficulty students encountered was that Flickr did not always order the photographs the same using the identical search strings on different days. Thus, at times, dupli-cate photographs were collected. To address this problem, once all 500 image URLs and captions were collected, we sorted and analyzed the list to remove any duplicate URLs. We then con-firmed that the images were of indeed of St. Peter’s Basilica in Vatican City and removed any erroneously tagged results. We were then left with 470 unique images of St. Peter’s Basilica.
Each image was hand coded using Google Sheets. The primary investigator and an undergraduate researcher worked to create a list of codes that, following Rose’s (2016) guidelines, clearly connected with the broader cultural context within which the image was situated. Some coding categories were fairly obvious and easy to determine: location (inside or outside), number of people (none, one, two to five, or six or more), camera distance (close up, long, etc.), and camera angle (directly overhead, up, eye level, or down). Other categories were more problematic, however. If a visitor took a picture of the ceiling, for example, was the focus of the image the ceiling itself, a particular decora-tion on the ceiling, or a light fixture? If a painting of an angel was present in the photograph, was that considered primary content and intentionally photographed or was it tangential to the photographer’s intended focus? In order to begin to ad-dress these issues, we created two coding categories: target (re-ferring to the primary architectural focus of the photograph) and primary content (referring to the clearly visible, in-focus symbols or other content that appeared in the central view of the photograph.) We began by analyzing a small sample of the photographs in order to revise and refine our codes, expanding
Volume 9 | 2016 | Number 2
| 51 |
primary content to include content that might not constitute traditional cultural symbols but commonly appeared in photo-graphs and expanding the target category to include people and artwork. The research team then coded the set of 470 images, rectifying any coding discrepancies through discussion.
The primary methodology for this project was content analysis, following the model of Krippendorf (2013), Burgess et al. (2007), and Rose (2016). Through a content analysis of visual imagery, re-searchers can determine key themes in a similar way as one might analyze interviews or texts (Rose 2016). The research team con-ducted an initial coding analysis by hand and then imported the codes into Nvivo 10, a qualitative analysis software package, in order to ensure rigor in our final results. Nvivo 10 offers a number of qualitative analysis techniques including content queries that result in word counts and visual word cloud displays.
It was clear to the research team even after coding a relatively small number of images that there were several key themes in visitor’s images of St. Peter’s Basilica. While we expected a signif-icant number of images to have prominent religious symbolism, far more images had what might be considered nontraditional spiritual elements such as light. Less surprising for a building of its impressive stature, numerous images were aimed upward at the intricately decorated ceiling or the massive marble col-umns. This visual content analysis, while offering unique insight into the ways in which people experience and perceive St. Peter’s Basilica, can more broadly offer researchers a unique perspec-tive into the affective and emotive capacity of our surroundings.
VISUALIZING EXPERIENCES IN ST. PETER’S BASILICA
It is clear that particular spaces can inspire a variety of emo-tions, a capacity for affective experience. How do visitors docu-ment and convey these affective encounters? What do visitor photographs tell us about the ways we interact with and ex-perience religious spaces? Although photographs of St. Peter’s Basilica were wide-ranging in their subjects and particular visual compositions, several key themes emerged after conducting an in-depth content analysis.

Volume 9 | 2016 | Number 2
| 52 |
Of the set of 470 images, slightly more than half (62%) were of the interior of St. Peter’s Basilica. Visitors used a variety of camera distances, with some images a close up of a particular feature (13%), and others taken from a very long distance (14%). Most images, however, could be characterized as taken from a medium (37%) or long (37%) distance. This indicates that peo-ple photographed the Basilica as they experienced it, often gaz-ing at the building or its architectural elements from a distance.
For many visitors, it is clear that when entering the basilica, there is a tendency to look up. Out of the 290 interior photos analyzed, 127 (44%) were pointed upward, often capturing the two meter (6.6 feet) tall gold lettering that circles the dome and reads from the Latin Vulgate: “TV ES PETRVS ET SVPER HANC PETRAM AEDIFICABO ECCLESIAM MEAM. TIBI DABO CLAVES REGNI CAELORVM” (‘You are Peter, and on this rock I will build my church. I will give you the keys of the kingdom of heaven’)” (Binz 2015, 11). In addition to the dome, gold let-tering extends around the top of walls of the Basilica and was prominent in many of the interior photographs (41%).
Figure 1: St. Peter’s Basilica, Seba Sofariu, Flickr, Creative Commons Attribution 2.0 Generic

Volume 9 | 2016 | Number 2
| 53 |
Relatively few photographs (40%) included people and of these, only fourteen photographs (3%) had a person as the main subject of the image. This suggests that visitors were more interested in documenting the architecture or features of the Basilica itself rath-er than documenting themselves being in or outside of the space.
Within the interior of the Basilica, St. Peter’s Baldachin was the most commonly photographed specific structure, featured in 21% of all interior photographs. While visitors often photo-graphed religious symbols such as the cross (22%) or Biblical fig-ures (13%), there seemed to be a broader desire to capture the affective capacity of the space itself rather than document the cultural symbols present. Over two-thirds of the interior pho-tos (37%) were of the Basilica’s impressive ceiling, for example, indicating that while there are other affective symbols and ar-chitectural elements, the height and grandeur of the structure itself was a central element of visitor experiences.
Figure 2: Saint Peter’s Basilica, Matt Chan, Flickr, Creative Commons Attribution-NoDerivs 2.0 Generic
Outside of the Basilica, the most common photograph was of the front, exterior of the church (50%). Other commonly photo-graphed areas were the dome (18%) or St. Peter’s Square (11%). Although the cross was the most photographed symbolic ele-ment among exterior photographs of the Basilica (54%), other nontraditional cultural symbols were also prominent. Clouds were featured in almost half (46%) of exterior images and 21% of exterior images featured light, most commonly documenting

Volume 9 | 2016 | Number 2
| 54 |
the lights of the Basilica at night or views of sunlight behind the Basilica. Again, this signals that visitors likely documented their personal experience of the Basilica, perhaps documenting their initial approach to the building and then the areas that were particularly affective once inside.
Figure 3: Italy-0179 - Last Night Shot for now, Dennis Jarvis, Flickr, Creative Commons Attribution-ShareAlike 2.0 Generic
More broadly, light was a common element among visitor photographs. In fact, over half (60%) of interior photographs featured beams of light, light from windows, or light fixtures. Relatively few photographs featured depictions of Jesus (3% of all photographs) or angels (10% of all photographs). A word cloud created by Nvivo 10 using an analysis of the primary con-tent in the photographs supplements this content analysis and reveals “gold,” “columns,” and “light” were more common in photographs than other, explicitly religious symbolism.
Figure 4: Primary Content Word Cloud Created by Author with Nvivo 10

Volume 9 | 2016 | Number 2
| 55 |
This relatively high number of photographs of light com-pared to more traditional religious elements could be explained by a number of factors. While the Basilica is indeed a Roman Catholic house of worship, it is visited by millions of tourists each year, many of whom are not likely practicing Catholics. The beams of light might thus have a stronger affective capacity for tourists compared to a sculpture like La Pieta, which was only featured in five (2%) of the interior photographs, or images of biblical figures (20% of interior photographs).
Relatively few photographs had descriptive captions; most photographs were captioned with either the picture number (such as “IMG_229”) or with the location (such as “Saint Peter’s Basilica.”) Of the photographs that included more descriptive captions, the most common term used to describe photographs was “light” (12 photographs.) One photograph, for example, was captioned “Divine Light, St. Peter’s Basilica.” For this visi-tor, the beams of light clearly had a spiritual significance and the number of photographs that prominently featured beams of light (17% of the interior photographs) indicates that a number of visitors had a similar experience.
Figure 5: Divine Light, Mzximvs VdB, Flickr, Creative Commons Attribution-ShareAlike 2.0 Generic
Why did visitors commonly photograph beams of light or the basilica’s ceiling? One limitation of visual content analysis, as opposed to in-depth interviews, is that the photographs are sub-ject to the researcher’s interpretation. The content represented in the image is just that, a representation, and what the image

Volume 9 | 2016 | Number 2
| 56 |
is meant to represent or the particular emotions experienced by the participant remain elusive. However, the significant number of photographs that shared the theme of light or the high per-centage of interior photographs of the building’s ceiling speaks to a common experience and indicate the emotive power of the space.
CONCLUSION
Our lived experience is constantly being made and remade by the spaces we occupy and the places we encounter. Whether sitting at our office desk surrounded by mementos, immersing ourselves in a forest on a hike, or exploring a historic building in a new city, these spaces are layered with meanings and each has a unique capacity to affect our emotions. While both emotional and affective investigations are experiencing resurgence in aca-demic research, visual explorations of these phenomena remain limited. Visual representations of being in and around spaces, however, provide tangible evidence of the ways in which people experience the world around them.
As this project has demonstrated, an analysis of visual image-ry can shed light on personal affective and emotive spatial en-counters. While one might expect visitors to St. Peter’s Basilica to be most affected by religious symbolism, it is clear from an analysis of images from Flickr that beams of light and the high ceiling of the structure were far more likely to be photographed indicating that these features had a particularly strong capacity to inspire an emotional response.
REFERENCES
Binz, S. J. 2015. ‘Saint Peter: Flawed, Forgiven, and Faithful.’ Chicago: Loyola Press.
Bowen, J. R. 2015. ‘Religions in Practice: An Approach to the Anthropology of Religion.’ New York: Routledge.
Burgess, M. C., S. P. Stermer, and S. R. Burgess. 2007. ‘Sex, Lies, and Video Games: The Portrayal of Male and Female Characters on Video Game Covers.’ Sex Roles 57(5): 419–433.

Volume 9 | 2016 | Number 2
| 57 |
Davidson, J., and C. Milligan. 2004. ‘Embodying Emotion Sensing Space: Introducing Emotional Geographies.’ Social and Cultural Geography 5(4): 523–532.
Finlayson, C. C. 2012. ‘Spaces of Faith: Incorporating Emotion and Spirituality in Geographic Studies.’ Environment and Planning A 44(7): 1763–1778.
History. 2014. ‘Vatican City Stateo’. Accessed September 15, 2016. http://www.history.com/topics/vatican-city.
Holloway, J. 2006. ‘Enchanted Spaces: The Séance, Affect, and Geographies of Religion.’ Annals of the Association of American Geographers 96(1): 182–187.
Lee, S.A., L.B. Roberts, and J.A. Gibbons. 2013. ‘When Religion Makes Grief Worse: Negative Religious Coping as Associated with Maladaptive Emotional Responding Patterns.’ Mental Health, Religion and Culture 16(3): 291–305.
Kong, L. 1990. ‘Geography and Religion – Trends and Prospects.’ Progress in Human Geography 14(3): 355–371.
Kong, L. 2010. ‘Global Shifts, Theoretical Shifts: Changing Geographies of Religion.’ Progress in Human Geography 34(6): 755–776.
Kraftl, P., and P. Adey. 2008. ‘Architecture/Affect/Inhabitation: Geographies of Being-In Buildings.’ Annals of the Association of American Geographers 98(1): 213–231.
Krippendorff, K. 2004. ‘Content Analysis: An Introduction to its Methodology.’ Thousand Oaks, California: Sage.
Olivarez-Giles, N. 2011. ‘Flickr Reaches 6 Billion Photos Uploaded.’ Los Angeles Times, August 5. Accessed September 3, 2016. http://latimesblogs.latimes.com/technology/2011/08/flickr-reaches-6-billion-photos-uploaded.html.
Orcutt, A. 2016. ‘World’s Most Visited Sacred Sites.’ Travel and Leisure, May 20. Accessed September 1, 2016. http://www.travelandleisure.com/slideshows/worlds-most-visited-sacred-sites.
Pile, S. 2010. ‘Emotions and Affect in Recent Human Geography.’ Transactions of the Institute of British Geographers 35(1): 5–20.
Premazzi, V., E., Ambrosetti, E. Cela, and T. Fokkema. 2013. ‘The Arab Spring and the Return Intention of Egyptians Living in Italy.’ International Journal of Euro-Mediterranean Studies 6(2): 109–131.
Rose, G. 2016. ‘Visual Methodologies: An Introduction to Researching with Visual Materials.’ Thousand Oaks, California: Sage.
Samuels, J. 2016. ‘Attracting the Heart: Social Relations and the Aesthetics of Emotion in Sri Lankan Monastic Culture.’ Honolulu: University of Hawai’i Press.

Volume 9 | 2016 | Number 2
| 58 |
Scotti, R. A. 2007. ‘Basilica: The Splendor and the Scandal: Building St. Peter’s.’ New York: Penguin Group (USA).
The Basilica. 2014. ‘Basilica Tour.’ Accessed September 15, 2016. http://thebasilica.ca/basilica-tour.
Trnka, S. 2012. ‘When the World Went Color: Emotions, Senses and Spaces in Contemporary Accounts of the Czechoslovak Velvet Revolution.’ Emotion, Space and Society 5(1): 45–51.
UNEP/MAP. 2012. ‘State of the Mediterranean Marine and Coastal Environment.’ Accessed September 1, 2016. http://www.grida.no/publications/med/.
Williams, A. 2016. ‘Spiritual Landscapes of Pentecostal Worship, Belief, and Embodiment in a Therapeutic Community: New Critical Perspectives.’ Emotion, Space and Society 19: 45–55.
Volume 9 | 2016 | Number 2
| 59 |
Interview with Heba Afify, Egyptian journalistJERNEJA PENCAEMUNI, Slovenia
Heba Afify was invited as a panellist to the roundtable titled “Youth, the agent of change?” that took place on 14.11.2016 in Ljubljana. The roundtable was co-organised by Euro-Mediterranean University (EMUNI) and the Slovenian Ministry of Foreign Affairs as part of the attempt to discuss, with the voice of young people, common challenges and opportunities of the youth across the Mediterranean. It is hard to think of a person that constitutes a better match for that occasion. Heba is a reflective, critical, broad-minded and pragmatic individual whose contribution stretches beyond that of a panellist in a one-off event. Fortunately, she is a regular contributor to an Egyptian newspaper and she also agreed to this short interview.
1. You marched through various local and international newspapers based in Egypt, but it is really your current affiliation with Mada Masr that stands out as a manifestation of determination and cour-age. Could you map the newspaper [media] landscape in Egypt and situate Mada within it?
The distinction between privately-owned and state-owned me-dia which has been the main categorization in Egyptian media has been fading within the last three years as most mainstream media has conformed on most issues to a unified and largely state-aligned voice, where it became common to find the same main headlines on all newspapers, private and state-owned ali-ke. This is particularly apparent when it comes to coverage of issues such as the state’s announced war on terrorism. There are exceptions to this with websites that attempt to break this conformity and individual journalists who challenge and raise the ceilings of their institutions. Mada falls within the category

Volume 9 | 2016 | Number 2
| 60 |
of media that challenges the current stagnation in media and attempts to continue to do critical and independent journalism that is based in research and inquisition rather than political agendas.
2. What is the role of newspapers, both printed and online, in the larger media scene in Egypt? How relevant is the thesis that newspa-pers are dying out in the Egyptian context?
The newspaper business in Egypt suffers the same recession witnessed in its counterparts elsewhere. Although the official numbers of circulation are kept secret, the Central Agency for Public Mobilization and Statistics (CAPMAS) has announced in recent years drops without revealing numbers. Publishing business insiders have estimated that newspapers circulation dropped to around half a million down from over two million during its peak in 2011. Subsequently, newspapers suffer finan-cially and periodically raise their prices, which further affects circulation. The reasons are similar to those affecting the global newspaper market, as news consumers resort more and more to television talk shows and online resources. This is coupled with a general drop in political engagement that has also affected the numbers. That being said, newspapers still maintain a certain prestige in the Egyptian media scene and are more trusted than other outlets.
3. Mada Masr was established in 2013 by a group of journalists, most of whom were under the age of 30. [How] did that age influence the outlook and ambition of Mada? Do you feel that the drive of Mada is directly related to the attitude and interests of the age group below 30, which represents more than half of the Egypt’s population?
The young nature of Mada has definitely influenced it in the sen-se that it channelled some of the most universal characteristic of youth that transcend political alignments and other differen-ces like the urge to be heard, to make a difference and to inflict change. As Egypt is in the grip of severe political polarization, the youth are as affected by this divisionism as everyone else,

Volume 9 | 2016 | Number 2
| 61 |
that’s why it’s difficult to list a common agenda for them beyond the basics of enhancement of educational system, work oppor-tunities and better economic conditions. Beyond that, the youth are parts of several sub groups within society that range from those who demand more freedoms and decry violations of hu-man rights and those who subscribe to the state’s narrative and believe that all types of opposition have to be subdued as Egypt gets through this difficult juncture.
4. The values of autonomy, independence and freedom of expression lie at the heart of Mada’s identity. But you also openly strive to be a progressive media outlet. As the meaning of “progressive” is heavily dependent on the context at best and diluted at worse, it would be in-teresting to hear what direction for Egypt are you able to distil from the work of reporters and editors. What are the foremost aspects of the social change that Egypt should be pursuing?
As a journalist, the aspects of social change that I am most in-vested in seeing in Egypt have to do with the development of critical thinking and independent opinion. As we see the bulk of public opinion being manipulated by a handful of media perso-nalities whose often widely inaccurate portrayals of events are adopted by a majority with no verification, my hope is for the continued presence of quality journalism to play a role in deve-loping a collective sense of healthy skepticism and autonomy in opinion to disrupt the effects of the propaganda machinery that features so prominently in Egyptian politics.
5. Another key feature of Mada is the fact that it reports in both Arabic and English. The ability to reach an audience beyond the Arab-speaking one is incredibly important. What has been your pri-mary target audience? Do you have a good understanding of your readership?
Our readership is varied between local consumers and readers abroad who are interested in the region and Egypt specifical-ly. Our main readership depends on those looking for nuanced coverage of the area including academics, researchers and other

Volume 9 | 2016 | Number 2
| 62 |
civically engaged individuals, as well as citizens who have lost faith in mainstream media and are looking for alternatives. Taping into the full potential of readership that our dual linguistic advantage allows, which comprises people with widely different educational levels and interests, has been a process that is still ongoing as we continue to discover how to best appeal to this large base.
6. As a journalist, do you work with the notion of the Euro-Mediterranean region? Is an awareness of a Euro-Mediterranean identity present in the regional media?
Our work is very much affected by international and regional events, which inevitably have their echoes in Egypt. As Egypt shares the same issues with its neighbors such as terrorist activi-ty and as its economy and political scene is heavily influences by its relations with world powers, international and regional deve-lopments heavily inform our coverage. The Euro Mediterranean is not a very relevant categorization of the region in our work, except in specific stories like the Juilio Regeni case and migra-tion. When I speak of a region that Egypt belongs to, I mean the Middle East.
7. One of the defining values of Mada is experimentalism – you ap-proach the news and stories using different narratives and visual methods. Can you share with us some of your personal and Mada’s experience (as well as those form other media you follow) in trying out new forms of communication? What, perhaps, is a promising but currently underexplored method? Or, what technique is in decline?
One of the main realizations that we made early on in Mada is that the reader is exhausted of dry stories and responds better to stories with a voice, a human interest angle or a visual storytelling mechanism. In response to this, we have been flexible with the rules of journalistic style, allowing things like writing a feature in the first person, publishing hybrids of opinion articles mixed with reporting and other forms. We have also learnt not to shy away from long form pieces and in depth investigations which, if done well, succeed to draw readers in despite being heavier reads.

Volume 9 | 2016 | Number 2
| 63 |
Résumés
L‘ATTRACTIVITÉ TERRITORIALE POUR LES INVESTISSEMENTS ÉTRANGERS DANS LES VILLES MÉDITERRANÉE : LE CAS DE LA VILLE DE TANGER, MAROCAbbes Elhasbi, Mohamed Barkaoui, Othmane Bouksour, Oulaid Kamach, Mohamed Amekhchoun.
L’objectif de cet article est de fournir les principaux facteurs d’at-tractivité pour les investisseurs étrangers dans les secteurs de la fabrication et de la logistique de la ville de Tanger au Maroc. Le modèle conceptuel était élaboré de la littérature et d›entrevues avec un échantillon de dirigeants de petites et moyennes entre-prises étrangères (PME). L›analyse empirique est réalisée à par-tir des données d›un sondage sur les cadres de ces entreprises étrangères (manufacturières et logistiques) implantées dans la ville de Tanger. L›utilisation de l›approche PLS nous a permis de tester les liens entre les différents facteurs politiques, écono-miques, sociaux, technologiques, juridiques et environnemen-taux (l›analyse PESTEL). L›intérêt scientifique du ce modèle est de fournir aux décideurs de la ville de Tanger les recommanda-tions visant à améliorer le développement et l›attractivité des investissements étrangers dans les secteurs de la logistique et de la fabrication.
Mots clés: attractivité territoriale ; PESTEL; PLS; fabrication et logistiqueIJEMS 9 (2) : 3–26
L’IMPACT DU DEFICIT PUBLIC SUR LA CROISSANCE ÉCONOMIQUE DANS LES ÉTATS MEMBRES DU CONSEIL DE COOPÉRATION DU GOLFE ARABIQUEHanadi Taher
Dans ce dossier, j›analyse quel impact a la relation entre dette publique et le PIB ratio pour le taux de la croissance du PIB dans le six états membres du Conseil de coopération du
Volume 9 | 2016 | Number 2
| 64 |
Golfe Arabique (CCG) : Bahreïn, Koweït, Oman, Qatar, Arabie Saoudite et Émirats Arabes Unis. La période d’analyse couvre 23 ans depuis 1990. Le relations entre l’Union européenne (UE) et CCG a été surligné pour mieux comprendre la crois-sance économique. Les résultats des tests sont cohérents avec certaines études publiées dans la littérature qui ont prouvé une corrélation négative entre la dette publique et la crois-sance économique au-delà d’une valeur bien que ce valeur ne soit pas standard. La dette publique dans les états membre du CCG a des effets différents sur la croissance du PIB par habitant, à cause des facteurs différents. Le résultat principal d›étude montre que le déficit public et les déterminants macro-économiques ont des effets variables sur la croissance du PIB par habitant pour les pays, principalement en fonction de leurs ratios de déficit public.
Mots clés: déficit public, croissance économiqueIJEMS 9 (2) : 27–44
VISUALISER L’ÉMOTION ET L’IMPRESION : RENCONTRES DE VISITEURS À LA BASILIQUE SAINT PIERRECaitlin Finlayson
La plus grande église au monde par la superficie et sa structure impressionnante – la basilique Saint-Pierre provoque dans ses visiteurs des sentiments de crainte et du respect. Mais com-ment les visiteurs dépeignent ces expériences émotives, quels espaces à l›intérieur de l›église mettent-ils en évidence, et com-ment l›espace affecte-t-il leur rencontre ? Autres études sur l›affect et l›émotion ont examiné une variété d›espaces, mais la recherche sur les sites religieux historiques et les façons dont ils sont vécus par les visiteurs reste limitée. Ce projet vise à contribuer au dialogue sur l›affect et l›émotion, qui est base dans l’étude des photographies pris par les visiteurs dans la basilique Saint-Pierre. Ces photographies révèlent que les visi-teurs fréquemment prennent les photos des rayons de lumière ou du plafond impressionnant de la structure. Les photos

Volume 9 | 2016 | Number 2
| 65 |
suggérant que ces éléments, plus que symboles explicitement religieux, sont au centre de l›expérience émotionnelle dans l›église.
Mots clés: géographie, religion, émotion, espace sacréIJEMS 9 (2): 45–58
Povzetki
TERITORIALNA PRIVLAČNOST ZA TUJE NALOŽBE V SREDOZEMSKIH MESTIH: PRIMER MESTA TANGIER V MAROKUAbbes Elhasbi, Mohamed Barkaoui, Othmane Bouksour, Oulaid Kamach, Mohamed Amekhchoun
Cilj tega članka je podati glavne dejavnike privlačnosti za tuje naložbe v proizvodnem in logističnem sektorju v mestu Tangier v Maroku. Konceptualni model je razvit na podlagi pregleda literature in intervjujev na vzorcu vodilnih tujih malih in sred-njih podjetij (SME). Empirična analiza je narejena z uporabo podatkov, pridobljenih na podlagi anketiranja vodij omenjenih tujih podjetij (v proizvodnem in logističnem sektorju) v mestu Tangier. Uporaba t. i. Partial Least Squares (PLS) pristopa nam dovoljuje, da preizkusimo vzročne povezave med različnimi političnimi, gospodarskimi, družbenimi, tehnološkimi, pravn-imi in okoljskimi dejavniki (PESTEL). Znanstveni namen mod-ela je oskrbeti politične odločevalce mesta Tangier s priporočili za izboljšanje razvoja in privlačnosti tujih investicij tako v logističnem kot proizvodnem sektorju.
Ključne besede: teritorialna privlačnost; PESTEL; PLS; proizvodnja in logistične dejavnosti IJEMS 9 (2): 3–26

Volume 9 | 2016 | Number 2
| 66 |
VPLIV JAVNEGA DOLGA NA GOSPODARSKO RAST ZA DRŽAVE SVETA ZA SODELOVANJE ZALIVSKIH DRŽAVHanadi Taher
V tem članku obravnavam vpliv vladnega dolga v razmerju do BDP na rast BDP per capita v šestih državah Sveta za sodelo-vanje zalivskih držav (SSZD), to so Bahrajn, Kuvajt, Oman, Katar, Savdska arabija in Združeni arabski emirati v obdobju 23 let, začenši z letom 1990. Določen del pozornosti je namenjen odnosu Evropske unije z državami SSZD za boljšo gospodarsko rast. Rezultati poskusa so skladni z nekaterimi študijami v lit-eraturi, ki potrjuje negativno korelacijo med javnim dolgom in družbeno gospodarsko rastjo preko deočenih mej, čeprav ta meja ni standard. Za države SSZD ima javni dolg drugačne učinke na rast BDP per capita, odvisno od države do države zaradi variacij v množici različnih dejavnikov. Glavna ugotovitev študije kaže, da imajo državni vladni dolg in makroekonomske determinante različen vpliv na rast BDP per capita za različne države, temelječ predvsem na njihovem razmerju vladnega dolga.
Ključne besede: vladni dolg, javni dolg, gospodarska rastIJEMS 9 (2): 27–44
VIZUALIZACIJA ČUSTEV IN DOŽIVETIJ: IZKUŠNJE OBISKOVALCEV V BAZILIKI SV. PETRACaitlin Finlayson
Bazilika sv. Petra je tako po površini kot po prostornini največja cerkev na svetu, njena impresivna struktura pa pri obiskovalcih vzbuja občutke strahospoštovanja in čaščenja. Kako obiskovalci opisujejo in prikazujejo ta čustvena izkustva? Katere dele cerkve pri tem poudarjajo in kako prostor vpliva na njihovo doživljanje? Druge študije ganjenosti in čustev so preučevale različne pros-tore, še vedno pa je le malo raziskav zgodovinskih verskih krajev in načinov, na katere jih obiskovalci izkušajo. Pričujoči projekt želi s študijo primera, pri katerem preučujemo fotografije obisk-ovalcev bazilike sv. Petra, prispevati k nastajajočemu dialogu

Volume 9 | 2016 | Number 2
| 67 |
ganjenosti in čustev. Fotografije razkrivajo, da obiskovalci po-gosto dokumentirajo snope svetlobe in impresivne stropove, kar kaže, da so ti elementi bolj kot eksplicitno verski simboli, bist-venega pomena pri čustvenem izkustvu srečevanja s prostorom.
Ključne besede: geografija, vera, čustva, posvečen prostorIJEMS 9 (2): 45–58
الإقلیمیة للاستثمارات الأجنبیة لمدن البحر المتوسط: دراسة حالة لمدنیة طنجة في المغربالجاذبیة
خشونی، محمد أمعباس الحصبي، محمد باركوي، عثمان بوكسور، عولید كماش
ر الأجنبي في قطاعي التصنیع للاستثما الجاذبیة الإقلیمیة الأساسیة عوامل توفیر الھدف من ھذا البحث ھو
وإجراء تصمیم التصوري من خلال مراجعة الإنتاج الفكري تطویر الفي مدینة طنجة في المغرب. تم والخدمات اللوجستیة
من بیانات التحلیل التجریبي من خلال استخداممن مدراء الشركات الصغیرة والمتوسطة الأجنبیة. یتم عینةمقبلات مع
لھذه الشركات (في مجال التصنیع والخدمات اللوجستیة) الأجنبیة التي یقع مقرھا في مدینة طنجة في التنفدیناء المدر اتاستفتاء
الروابط المسببة في العدید من العوامل السیاسیة اختبارجازت لنا طریقة المربعات الصغرة الجزئیة استخدامالمغرب.
م الفائدة العلمیة لھذا التصمیالبیئیة (تحلیل البیئیة الخارجیة والمحیطة، بستل). إن والتقنیة والقانونیة و والاجتماعیة والاقتصادیة
الأجنبیة في قطاعي للاستثماراتة الإقلیمیإصلاح التنمیة والجاذبیة توصیات من أجل ھو توفیر لصناع قرار مدینة طنجة
والتصنیع. اللوجستیةالخدمات
التصنیع والأنشطة المربعات الصغرة الجزئیة ،(بستل) والمحیطةتحلیل للبیئة الخارجیة الكلمات الأساسیة: الجاذبیة الإقلیمیة،
اللوجستیة
٢٦-٣ص ):٢(٩المجلة الدولیة للدراسات الأرومتوسطیة العدد رقم بالكامل: النص

Volume 9 | 2016 | Number 2
| 68 |
لدول مجلس تعاون الخلیج الاقتصاديین العام على النمو الد أثر
حامد طاھر
في ھذا البحث الدین المحلي للحكومة لنسبة الناتج المحلى الإجمالي على معدل نمو الناتج المحلي الإجمالي للدول الست أناقشعاما بدأ ٢٣ة والإمارات العربیة المتحدة على مدار وقطر والسعودیلمجلس تعاون الخلیج وتحدیدا، البحرین والكویت وعمان
نتائج . وكانت في البحث ي ومجلس التعاون لدول الخلیجالقاء بعض الضوء على العلاقة بین الاتحاد الأورب. تم ١٩٩٣من عام حد أو ادي للدولة فوقسلبیة بین الدین العام والنمو الاقتصالعلاقة الالتجربة متطابقة مع بعد الدراسات السابقة التي توضح
لھ معیار.مستوى معین مع العلم بأن ھذا الحد لیس للفرد تفاوتت من بلد إلى بلد نتیجة الإجمالي المحلي الناتج نمو الدین العام لدول مجلس تعاون الخلیج أثار مختلفة علىلدى
الكلیة الاقتصادیةمحددات الو للحكومةین المحلي لتراوح بعض العوامل المختلفة. تبدي النتائج الأساسیة لھذا البحث أن لدى الدعلى نسب الدین العام للحكومة بشكل رئیسي. بناءأثار متعددة على نمو الناتج المحلي الإجمالي للفرد في بلاد كثیرة
الاقتصادي، النمو الكلمات الأساسیة: الدین المحلي للحكومة، الدین العام
٤٤-٢٧ص ):٢(٩المجلة الدولیة للدراسات الأرومتوسطیة العدد رقم بالكامل: النص
ملخصاتالبابویة القدیس بطرس بازلیكالعاطفة والإحساس: لقاءات الزوار في تصور یلایسوننكاتلین ف
البابویة الأكبر في العالم من حیث المساحة والحجم ویولد ھیكلھا المثیر للإعجاب الشعور بالرھبة والخشوع. القدیس بطرس بازلیك تعتبر
یة التي یمكن إبرازھا، وكیف تؤثر ھذه التجارب العاطفیة؟ ما ھي المساحات داخل الكنسأن یصفوا ھذه یمكن لھؤلاء الزوار كیف
بعض الدراسات عن العاطفة والإحساس العدید من المساحات ولكن البحث التم إجراءه استعرضت لقد للكنیسة؟على لقاء الزوار المساحات
إلى المشروع البحث أو ھذاداخل ھذه الأماكن والمساحات لایزال محدودا. یسعى التي یشعر بھا الزوار الدنیة والطرقعن الأماكن
خلال تقدیم دراسة حالة تقوم بتحلیل صور الزوار داخل بازلیك القدیس بطرس. والإحساس منالمشاركة في حوار الساعة عن العاطفة
للتجربةلسقف الرائع دلیلا على أن ھذه العناصر جوھریة أن الزوار عادة ینسبوا الفضل إلى أشعة الضوء وتصمیم ا ھذه الصور تظھر
الدینیة.العاطفیة للقاء الأماكن وأكثر صراحة من الرموز
.لكلمات الأساسیة: جغرافیا، دین، عاطفة، أماكن مقدسةا
٥٨-٤٥): ص٢(٩رقم ة الدولیة للدراسات الأرومتوسطیة العدد المجلبالكامل: النص

Volume 9 | 2016 | Number 2
| 69 |
Current and Future Events in the Euro-Mediterranean Area
ELO’17 – Electronic Literature : Affiliations, Communities, TranslationsOrganiser : University Fernando Pessoa Type of event : ConferenceDate : 19–22 July, 2017 Venue : Porto, PortugalWeb page : https://conference.eliterature.org//
International Summer SchoolOrganiser : Middle East Technical UniversityType of event : Summer SchoolDate : Late June–Mid August, 2017 Venue : Ankara, TurkeyWeb page : http://www.ico.metu.edu.tr
Erasmus+ program student/staff mobility for non-EU countries with grantsOrganiser: Middle East Technical UniversityType of Event: Mobility Date: 2017–2018 Venue: Ankara, TurkeyWeb page : http://www.ico.metu.edu.tr
VI. Doctoral International research conferenceOrganiser : Graduate School of Government and European StudiesType of event : International research conferenceDate : 18 May, 2017 Venue : Brdo pri Kranju, SloveniaWeb page : www.fds.si
Alternative Dispute ResolutionOrganiser : Graduate School of Government and European StudiesType of event : Summer schoolDate : 25–29 September, 2017 Venue : Ljubljana, SloveniaWeb page : www.fds.si

Volume 9 | 2016 | Number 2
| 70 |
International research conferenceOrganiser : Graduate School of Government and European StudiesType of event : International research conferenceDate : 17–18 November, 2017 Venue : Ljubljana, SloveniaWeb page : www.fds.si
Management Challeneges in a Network Economy: Creativity and Education - Business Collaboration - Economic Activity - Information TechnologyOrganiser : International School for Social and Business StudiesType of event: International conferenceDate: 17 – 19 May, 2017 Venue: Lubin, PolandWeb page: www.makelearn.mfdps.si
Management and Quality in Education, 1 year, 60 ECTSOrganiser: International School for Social and Business StudiesType of event: Master study programmeDate : 1 October, 2017–30 September, 2018 Venue : Celje, SloveniaWeb page : www.issbs.si
Knowledge Management, 3 years, 180 ECTS Organiser: International School for Social and Business StudiesType of event: Doctoral programme in English (blended learning)Date: / Venue: Celje, Slovenia and online learningWeb page: www.issbs.si
International Journal of Management, Knowledge and Learning and ToKnowPressOrganiser: International School for Social and Business StudiesType of event: Publishing opportunitiesDate: All year Venue: /Web page: www.issbs.si
University Open Day 2017Organiser : University of Presov Type of event : Open dayDate : 15 February, 2017 Venue : Presov, SlovakiaWeb page : www.unipo.sk

Volume 9 | 2016 | Number 2
| 71 |
Unipoday and Academic PresovOrganiser : University of PresovType of event: Cultural and sport event Date : 25 – 28 April, 2017 Venue : Presov, SlovakiaWeb page : www.unipo.sk
Opening ceremony of the academic year 2017/2018 Organiser : University of PresovType of event: Opening ceremonyDate: 19 September, 2017 Venue: Presov, SlovakiaWeb page: www.unipo.sk
20th anniversary of the University of PresovOrganiser : University of PresovType of event: ConferenceDate : November 2017–December 2017 Venue : Presov, SlovakiaWeb page : www.unipo.sk
Modus-Modi-ModalityOrganiser : European University CyprusType of event : International Musicological ConferenceDate : 6–10 September 2017 Venue : Nicosia, CyprusWeb page : www.modality2017conference.com
4th International Motion Festival, Cyprus 2017Organiser : European University CyprusType of event : Film FestivalDate : 11–14 May, 2017 Venue : Nicosia, CyprusWeb page : www.motionfestivalcyprus.com
5th International Bio-Medical Scientific Cyprus CongressOrganiser: European University CyprusType of event: 3 Days International Congress Seminar Date : November, 2017 Venue : Nicosia, CyprusWeb page : www.bsc.euc.ac.cy

Volume 9 | 2016 | Number 2
| 72 |
17th Annual Career Fair 2017Organiser: European University CyprusType of event: Career ExhibitionDate: 29 March, 2017 Venue: Nicosia, Cyprus Web page: http://euc.ac.cy/en/services/career-exhibition
Open Day at the University of Zadar Organiser: University of ZadarType of event: (Conference, Round table, Training, Summer school etc.) – eventDate: December 2017 Venue: Zadar, CroatiaWeb page: /
University Day Organiser: University of ZadarType of event: (Conference, Round table, Training, Summer school etc.) – Protocol eventDate: 25 March, 2017 Venue: Zadar, CroatiaWeb page: /
Divided Societie XX – Memory WarsOrganiser: Interuniversity Centre DubrovnikType of event: CourseDate: 7–14 May, 2017 Venue: Dubrovnik, CroatiaWeb page: http://www.iuc.hr/course-details.php?id=1003
Regional Security and Cooperation in South East EuropeOrganiser: Interuniversity Centre DubrovnikType of event: CourseDate: 19 – 25 June, 2017 Venue: Dubrovnik, CroatiaWeb page: http://www.iuc.hr/course-details.php?id=980
Modalities of Trauma in (Multi)Cultural Contexts: Protagonists, Representations and Recovering – SpeCTReSS Summer Institute on Cultural TraumaOrganiser: Interuniversity Centre DubrovnikType of event: CourseDate: 5–10 June, 2017 Venue: Dubrovnik, CroatiaWeb page: http://www.iuc.hr/course-details.php?id=988

Volume 9 | 2016 | Number 2
| 73 |
MARE NOSTRUM: Negotiating European Values and Ideas in the MediterraneanOrganiser: Interuniversity Centre DubrovnikType of event: CourseDate: 4 – 8 September, 2017 Venue: Dubrovnik, CroatiaWeb page: http://www.iuc.hr/course-details.php?id=991
The social value of confiscated goods: social reuse, shared responsibili-ty, and new welfare opportunitiesOrganiser: CELL UniPegasoType of event: Round tableDate: January 2017 Venue: Naples, Italy Web page: https://www.facebook.com/CELL-UniPegaso-386596061511032/?fref=ts
A Call for the Establishment of New Bioethics UnitsOrganiser: CELL UniPegasoType of event: Participation to12th World Conference of UNESCO Chair in Bioethics Date: 21–23 March, 2017 Venue: Limassol, CyprusWeb page: http://www.isas.co.il/bioethics2017-Limassol/
Sustainable Development Organiser: CELL UniPegasoType of event: ConferenceDate: April, 2017 Venue: Naples, ItalyWeb page: https://www.facebook.com/CELL-UniPegaso-386596061511032/?fref=ts
World Bioethics Day about an article of UNESCO Declaration on Bioethics Organiser: CELL UniPegasoType of event: ConferenceDate: October, 2017 Venue: Naples, ItalyWeb page: https://www.facebook.com/CELL-UniPegaso-386596061511032/?fref=ts

Volume 9 | 2016 | Number 2
| 74 |
Fourth Staff Training By Dr. Winfried Banzer - Goethe University, Frankfurt, GermanyOrganiser: Pharos Univerity in AlexandriaType of event: TrainingDate: February, 2017 Venue: Hilton King‘s Ranch Hotel, Alexandria, EgyptWeb page: http://www.pua.edu.eg/NewsDetails.aspx?NewsID=1461
Third International Conference of Business Innovation & Economic Sustainability ChallengesOrganiser: Pharos Univerity in AlexandriaType of event: ConferenceDate: 12 – 13 April, 2017 Venue: PUA Conference Hall–Pharos University in AlexandriaWeb page: www.pua.edu.eg/business.conf
PUA 2nd Internatioanl ELT symposiumOrganiser: Pharos Univerity in AlexandriaType of event: SymposiumDate: 16 September, 2017 Venue: Alexandria, Egypt Web page: http://www.pua.edu.eg/Page.aspx?Page=Centers-%3EEnglish+Language+Centre-%3E+International+ELT+Symposium+&PID=2058&CID=1284
Graduation Ceremony Organiser: Pharos Univerity in AlexandriaType of event: CeremonyDate: September, 2017 Venue: Alexandria, EgyptWeb page: http://www.pua.edu.eg/NewsDetails.aspx?ACT=INT_ACT&NewsID=2520
Religion, Politics, and Human RightsOrganiser: Human Rights Centre, University of PadovaType of event: International ConferenceDate: 12 May, 2017 Venue: Padova, Italy Web page: http://unipd-centrodirittiumani.it/en
Volume 9 | 2016 | Number 2
| 75 |
Presentation of the Italian Yearbook of Human Rights 2017Organiser: Human Rights Centre, University of PadovaType of event: Book PresentationDate: 10 December, 2017 Venue: Rome, ItalyWeb page: http://www.italianhumanrightsyearbook.eu
Presentation of the Italian Yearbook of Human Rights 2016Organiser: Human Rights Centre, University of PadovaType of event: Book PresentationDate: 15 December, 2016 Venue: Rome, ItalyWeb page: http://www.italianhumanrightsyearbook.eu
Adaptability&Breakthrough:University‘s Reform and Innovation in the New Ecology of Higher EducationOrganiser: »Dimitrie Cantemir« Christian UniversityType of event: Sub-ForumDate: 1–5 June, 2017 Venue: Bucharest, RomaniaWeb page: wwwucdc.ro
Transportation of Sport and Physical Activity through Time; Journey in History Organiser: Alexandria UniversityType of event: Ishpes Congress 2017Date: 3–6 April, 2017 Venue: Alexandria, Egypt Web page: www.alexu.edu.eg
Aspects and Challenges of Agricultural Development in Africa and Arab RegionOrganiser: Alexandria UniversityType of event: International conferenceDate: 22 – 23 February, 2017 Venue: Alexandria, EgyptWeb page: www.alexu.edu.eg
Sustainable Development in Methods of Animal ProductionOrganiser: Alexandria UniversityType of event: ConferenceDate: 20 – 22 November, 2017 Venue: Alexandria, EgyptWeb page: www.alexu.edu.eg

Related Documents