Synthesis, Growth, Spectral, Optical, Thermal and Non-Linear Optical Applications of a Semi-Organic Single Crystal: Potassium Dihydrogen Phosphate- Oxalic Acid S. Jeeva 1 , S. Chithra 1 , K. Arulaabaranam 1 , K. Selvam 1 , G. Mani 1* PG & Research Department of Physics, Arignar Anna Govt. Arts College, Cheyyar - 604 407, Tamil Nadu, India Abstract : A semi organic nonlinear optical material a single crystal of Potassium dihydrogen orthophate - oxalic acid [PDPOA] has been magnificently manufactured and good quality single crystals have been grown by Slow Evaporation Technique at ambient temperature. The grown crystals were characterized by powder X-ray diffraction study shows that the crystalline perfection of grown crystal is good. Single crystal X-ray diffraction studies reveal the lattice parameters of the crystal. The optical absorption [UV-Vis] studies show that the crystal is transparent in the visible region with a lower cut of wavelength of 235 nm and the optical band gap energy E g is determined to be 5.27 eV. The functional group present in the grown crystal has been acknowledged by Fourier Transform infrared spectroscopy [FTIR] and FT-Raman spectroscopy [FT-Raman] analyses. Fluorescence [PL] emission spectrum was noted and lifetime was also studied. The Vickers micro hardness test carried out on the grown crystal and by Vickers hardness number (H v ), work hardening coefficient (n), yield strength ( y ), stiffness constant (C 11) , Knoop hardness (H k ) are evaluated. The dielectric behavior of the as grown crystal was analyzed for various temperatures (313 K, 333 K, 353 K, 373 K) at different frequencies The Kurtz Perry was conformed using Nd:YAG laser with fundamental wavelength of 1064 nm. Key words: Nonlinear optical material; X-ray diffraction; Optical properties; Dielectrics; Life time; Micro hardness. 1. Introduction Since past decade, the interest of researchers has been sustained in upgrading the properties of potassium dihydrogen phosphate (KDP) crystal as it is largely demanded for fabricated the devices for SHG systems, industrial photonics, optical parametric oscillators, electro-optic modulators, telecommunication and large laser facility systems [1]. KDP crystal is most widely used and thoroughly studied nonlinear optical [NLO] crystal. The attempts have been made to modify the properties favorable for NLO applications and growth conditions or by adding different impurities [2-7].Recent studies have shown the significant role of organic additives particularly carboxylic acids in inspiring the qualities of ADP and KDP crystals which hold importance for device fabrication. The impact of increasing molar ratio of DL-malic acid has successively enhanced the optical, electrical, mechanical and SHG response of ADP crystal [8]. The addition of oxalic acid [1 mole] has endorsed the SHG efficiency, mechanical and electrical performance of ADP crystal [9]. International Journal of ChemTech Research CODEN (USA): IJCRGG, ISSN: 0974-4290, ISSN(Online):2455-9555 Vol.11 No.01, pp 377-390, 2018

Welcome message from author
This document is posted to help you gain knowledge. Please leave a comment to let me know what you think about it! Share it to your friends and learn new things together.
Transcript
Synthesis, Growth, Spectral, Optical, Thermal and Non-Linear Optical Applications of a Semi-Organic Single Crystal:
Potassium Dihydrogen Phosphate- Oxalic Acid
S. Jeeva1, S. Chithra1, K. Arulaabaranam1, K. Selvam1, G. Mani1*
PG & Research Department of Physics, Arignar Anna Govt. Arts College, Cheyyar -
604 407, Tamil Nadu, India
Abstract : A semi organic nonlinear optical material a single crystal of Potassium dihydrogen
orthophate - oxalic acid [PDPOA] has been magnificently manufactured and good quality single crystals have been grown by Slow Evaporation Technique at ambient temperature. The
grown crystals were characterized by powder X-ray diffraction study shows that the crystalline
perfection of grown crystal is good. Single crystal X-ray diffraction studies reveal the lattice
parameters of the crystal. The optical absorption [UV-Vis] studies show that the crystal is transparent in the visible region with a lower cut of wavelength of 235 nm and the optical band
gap energy Eg is determined to be 5.27 eV. The functional group present in the grown crystal
has been acknowledged by Fourier Transform infrared spectroscopy [FTIR] and FT-Raman spectroscopy [FT-Raman] analyses. Fluorescence [PL] emission spectrum was noted and
lifetime was also studied. The Vickers micro hardness test carried out on the grown crystal and
by Vickers hardness number (Hv), work hardening coefficient (n), yield strength (y), stiffness constant (C11), Knoop hardness (Hk) are evaluated. The dielectric behavior of the as grown
crystal was analyzed for various temperatures (313 K, 333 K, 353 K, 373 K) at different frequencies The Kurtz Perry was conformed using Nd:YAG laser with fundamental wavelength
of 1064 nm.
Key words: Nonlinear optical material; X-ray diffraction; Optical properties; Dielectrics; Life time; Micro hardness.
1. Introduction
Since past decade, the interest of researchers has been sustained in upgrading the properties of potassium dihydrogen phosphate (KDP) crystal as it is largely demanded for fabricated the devices for SHG
systems, industrial photonics, optical parametric oscillators, electro-optic modulators, telecommunication and
large laser facility systems [1]. KDP crystal is most widely used and thoroughly studied nonlinear optical [NLO] crystal. The attempts have been made to modify the properties favorable for NLO applications and
growth conditions or by adding different impurities [2-7].Recent studies have shown the significant role of
organic additives particularly carboxylic acids in inspiring the qualities of ADP and KDP crystals which hold importance for device fabrication. The impact of increasing molar ratio of DL-malic acid has successively
enhanced the optical, electrical, mechanical and SHG response of ADP crystal [8]. The addition of oxalic acid
[1 mole] has endorsed the SHG efficiency, mechanical and electrical performance of ADP crystal [9].
International Journal of ChemTech Research CODEN (USA): IJCRGG, ISSN: 0974-4290, ISSN(Online):2455-9555
Vol.11 No.01, pp 377-390, 2018
G. Mani et al /International Journal of ChemTech Research, 2018,11(01): 377-390.
378
Previously the KDP crystal doped with oxalic acid in the ratio 3:1 were grown using Gel growth
technique and its, thermal property, presence of functional groups and lattice parameters reported [10], the KDP
crystal doped with oxalic acid in the ratio 1:1 were grown using slow evaporation growth technique and its, SXRD, PXRD, FTIR, UV-Vis, SHG, Dielectrics reported [11], then another report the impact of oxalic acid and
maleic acid on structural, optical, mechanical, thermal, and electrical properties of doped KDP crystal which
plays key role the NLO devices[12]. The crystal structure and some characterization of the title compound have
been reported by Mohd Anis et.al and Manimekalai et.al. [11, 12]
In the present investigation an effort has been made in growing potassium dihydrogen orthophosphate
with Oxalic acid in the ratio 1% mole by slow evaporation growth technique. The established crystals are exposed to various spectral studies like FTIR, FT-RAMAN, Single XRD, UV-Vis, Photoluminescence (PL),
Lifetime, NLO, Dielectrics and micro hardness studied. In this work Photoluminescence (PL) and Lifetime, FT-
Raman characterization of PDPOA are reported first time and obtained results were elaborately discussed.
2. Materials and methods
2.1. Synthesis and crystal growth of PDPOA
The high purity AR Grade Merck make KDP salt was gradually dissolved in double distilled water to
obtain the supersaturated solution of KDP at room temperature. The precisely measured quantity of 1 mole of oxalic acid was separated introduced to the supersaturated solution of OA at room temperature slowly. The
KDP and Oxalic acid solutions added were allowed to stirring for 5hrs for homogenization. Then it was filtering
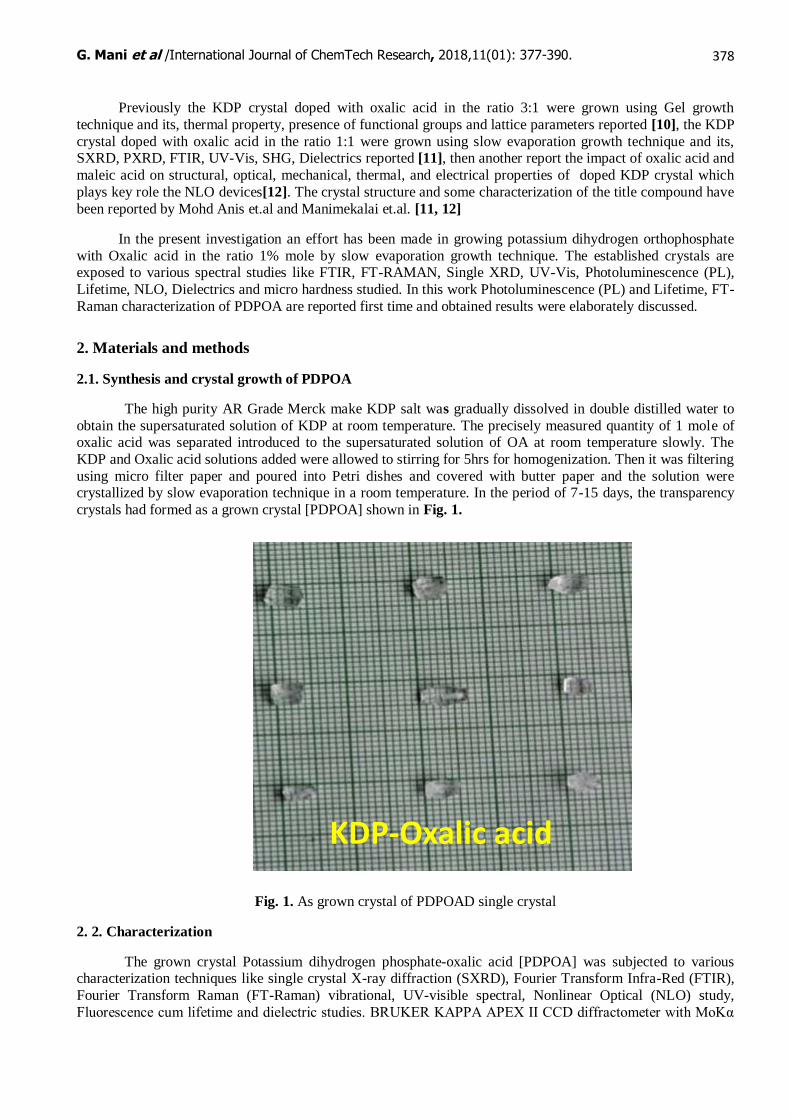
using micro filter paper and poured into Petri dishes and covered with butter paper and the solution were crystallized by slow evaporation technique in a room temperature. In the period of 7-15 days, the transparency
crystals had formed as a grown crystal [PDPOA] shown in Fig. 1.
Fig. 1. As grown crystal of PDPOAD single crystal
2. 2. Characterization
The grown crystal Potassium dihydrogen phosphate-oxalic acid [PDPOA] was subjected to various characterization techniques like single crystal X-ray diffraction (SXRD), Fourier Transform Infra-Red (FTIR),
Fourier Transform Raman (FT-Raman) vibrational, UV-visible spectral, Nonlinear Optical (NLO) study,
Fluorescence cum lifetime and dielectric studies. BRUKER KAPPA APEX II CCD diffractometer with MoKα
KDP-Oxalic acid
G. Mani et al /International Journal of ChemTech Research, 2018,11(01): 377-390.
379
(λ=0.71073Å) radiation was exposed to measure the cell dimensions. FTIR spectrum was recorded using
PERKIN ELMER spectrometer in the range 4000-400cm-1
by KBr pellet technique. Powder FT-Raman
spectrum was recorded on a BRUKER RFS 27 spectrometer in the range 4000-450cm-1
. UV-visible absorption spectrum was recorded in the region 200-700nm using PERKIN ELMER LAMADA 35 spectrophotometer and
with the performance of PERKIN ELMER LS-45 Spectrofluorophotometer using a continuous 450 W xenon
lamp excitation source, fluorescence spectrum was obtained in the range of 240-800 nm. The mechanical
property of the grown PDPOA crystals was characterized by Vicker’s microhardness measurement. The dielectric loss and dielectric constant as a function of frequency for the temperature (313K, 333K, 353K and
373K) were studied. To analyze the nonlinear optical property of PDPOA powder a pulsed Nd:YAG laser was
employed using Kurtz Perry powder method.
3. Result and discussion
3. 1. Single crystal XRD analysis
The crystallographic parameters of grown crystals were experimentally determined by means of Single
X-ray diffraction [SXRD] technique using the BRUKER KAPPA APEX II CCD , diffractometer employing
M0Kα ( = 0.71073 A0) radiation. The grown crystals were confirmed to have Tetragonal crystal system with
space group I-42d and calculated lattice parameters values are depicted in Table. 1. Found to be in the good
agreement with early report.
Table. 1.
Lattice parameters for PDPOAD crystal
Cell parameters Present work [PDPOAD] Reported work [11,12]
Space group I- 42d I- 42d
a (Å) 7.465 7.45
b (Å) 7.465 7.45
c (Å) 6.98 6.97
volume (A3) 390 387
α=β= ( ) 90 90
(˚) 106.74 106.66
Volume (Å3) 778 760.6
3. 2. FTIR and FT-Raman spectral analyses
A PERKIN ELMER Fourier transform infrared spectrometer was employed to determine the infrared
spectrum at room temperature in the range of 4000-400 cm-1
, KBr pellet. The FT-Raman spectra of PDPOA were recorded on a Bruker IFS-88 spectrometer in the range 4000-450 cm
-1 .FTIR spectrum is important
evidence which provides more information about the structure of a compound from vibrational interactions of
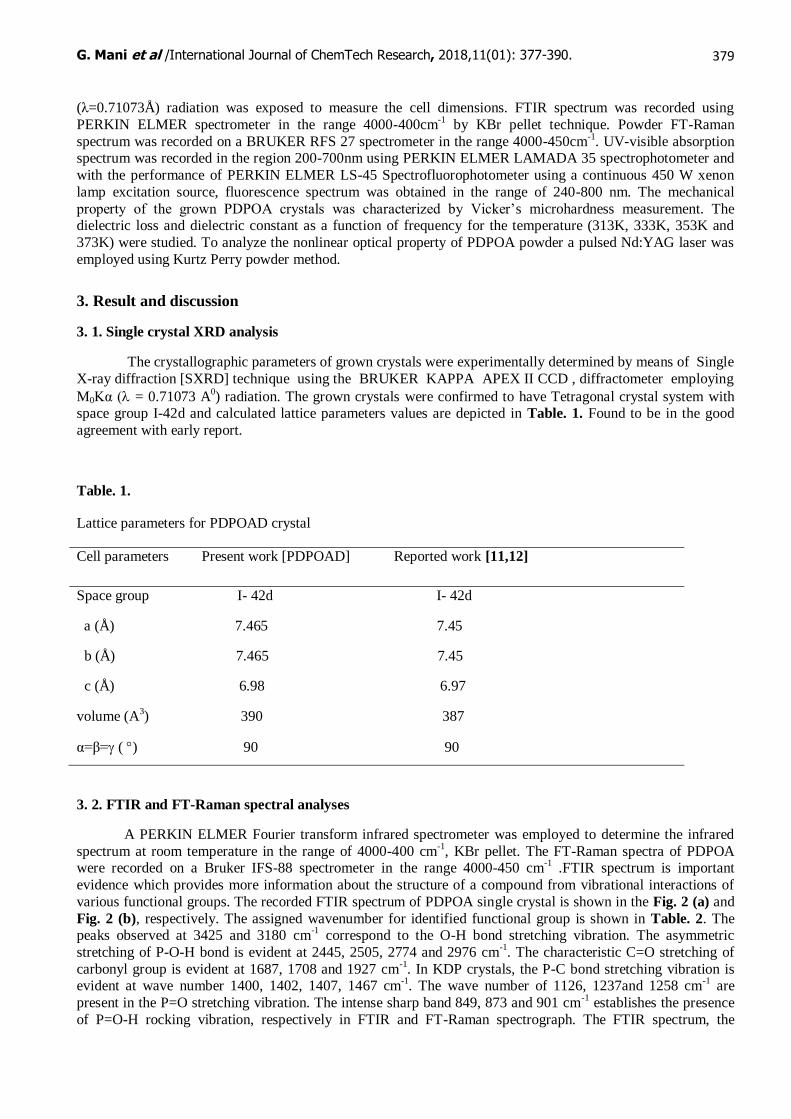
various functional groups. The recorded FTIR spectrum of PDPOA single crystal is shown in the Fig. 2 (a) and
Fig. 2 (b), respectively. The assigned wavenumber for identified functional group is shown in Table. 2. The peaks observed at 3425 and 3180 cm
-1 correspond to the O-H bond stretching vibration. The asymmetric
stretching of P-O-H bond is evident at 2445, 2505, 2774 and 2976 cm-1
. The characteristic C=O stretching of
carbonyl group is evident at 1687, 1708 and 1927 cm-1
. In KDP crystals, the P-C bond stretching vibration is evident at wave number 1400, 1402, 1407, 1467 cm
-1. The wave number of 1126, 1237and 1258 cm
-1 are
present in the P=O stretching vibration. The intense sharp band 849, 873 and 901 cm-1
establishes the presence
of P=O-H rocking vibration, respectively in FTIR and FT-Raman spectrograph. The FTIR spectrum, the
G. Mani et al /International Journal of ChemTech Research, 2018,11(01): 377-390.
380
absorption bands at 566, 716 and 789cm-1
are attributed to HO-P-OH bending vibrations. The wavenumber of
476 cm-1
is C=O stretching vibrations and same absorption bands is observed at 489 cm-1
respectively.
Table. 2.
FT-IR and FT-Raman molecular vibrational assignments of PDPOAD
Wavenumber (cm-1
)
FTIR FT-Raman
Band Assignments/
stretching
3425 3180
2505 2976,2774,2445
1687 1708,1927
1402,1407 1400,1469
1126,1258 1237
901 873,849
716,789 , 566,
478 489
O-H Stretching
P-O-H asymmetric
C=O stretching
P-C stretching
P=O stretching
P=O-H symmetric
HO-P-OH bending
C=O stretching
Fig. 2. (a) FTIR spectrum and (b) FT-Raman spectrum of PDPOAD
3. 3. Optical studies
The UV-visible absorption property of the material was examined using a PERKIN ELMER LAMBDA
35 UV-visible spectrometer in the wavelength range 200-700 nm. The optical absorbance spectrum of PDPOA single crystal is shown in Fig. 3 (a) these properties are used to empathetic the electronic structure of the optical
band gap of the blended crystal. From the absorbance spectrum, it is observed that the grown crystal wholly
transparent in the UV and visible spectral regions with the cut off wavelength around 235 nm there by confirming the leads of the crystal. Complete transparency of the crystal between the regions 400 nm to 700
nm. In the visible absorption region of 325 nm to 385 nm found to be miracle absorption will be appeared.
Advantage of the synthesized to be crystal for optoelectronics and nonlinear optical applications [13-16].
G. Mani et al /International Journal of ChemTech Research, 2018,11(01): 377-390.
381
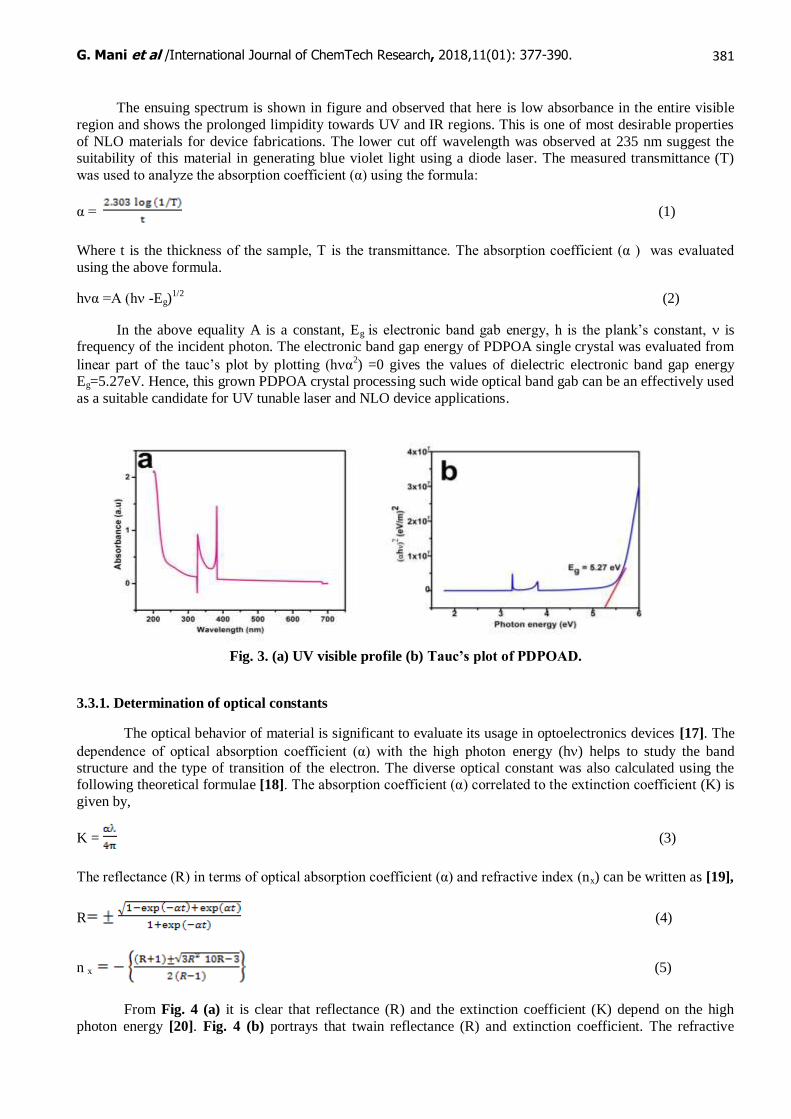
The ensuing spectrum is shown in figure and observed that here is low absorbance in the entire visible
region and shows the prolonged limpidity towards UV and IR regions. This is one of most desirable properties
of NLO materials for device fabrications. The lower cut off wavelength was observed at 235 nm suggest the suitability of this material in generating blue violet light using a diode laser. The measured transmittance (T)
was used to analyze the absorption coefficient (α) using the formula:
α = (1)
Where t is the thickness of the sample, T is the transmittance. The absorption coefficient (α ) was evaluated
using the above formula.
hα =A (h -Eg)1/2
(2)
In the above equality A is a constant, Eg is electronic band gab energy, h is the plank’s constant, is frequency of the incident photon. The electronic band gap energy of PDPOA single crystal was evaluated from
linear part of the tauc’s plot by plotting (hα2) =0 gives the values of dielectric electronic band gap energy
Eg=5.27eV. Hence, this grown PDPOA crystal processing such wide optical band gab can be an effectively used
as a suitable candidate for UV tunable laser and NLO device applications.
Fig. 3. (a) UV visible profile (b) Tauc’s plot of PDPOAD.
3.3.1. Determination of optical constants
The optical behavior of material is significant to evaluate its usage in optoelectronics devices [17]. The
dependence of optical absorption coefficient (α) with the high photon energy (h) helps to study the band structure and the type of transition of the electron. The diverse optical constant was also calculated using the following theoretical formulae [18]. The absorption coefficient (α) correlated to the extinction coefficient (K) is
given by,
K = (3)
The reflectance (R) in terms of optical absorption coefficient (α) and refractive index (nx) can be written as [19],
R (4)
n x (5)
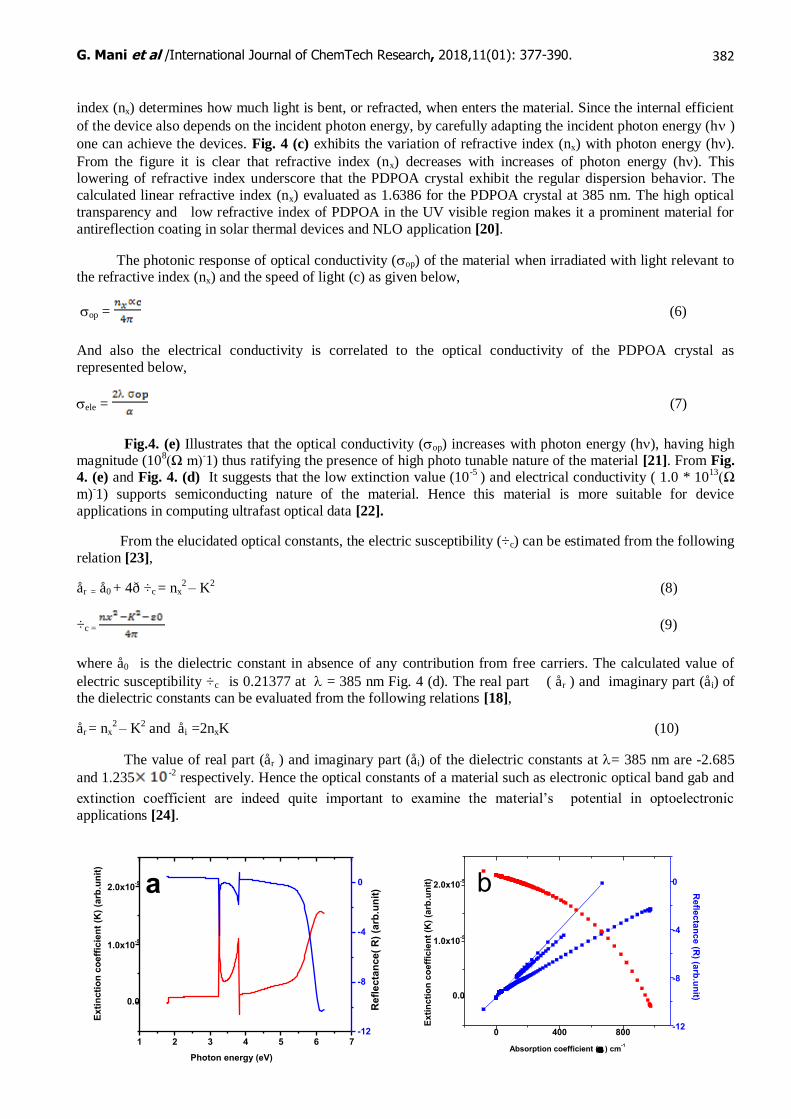
From Fig. 4 (a) it is clear that reflectance (R) and the extinction coefficient (K) depend on the high
photon energy [20]. Fig. 4 (b) portrays that twain reflectance (R) and extinction coefficient. The refractive
G. Mani et al /International Journal of ChemTech Research, 2018,11(01): 377-390.
382
1 2 3 4 5 6 7
0.0
1.0x10⁻⁵
2.0x10⁻⁵
Refl
ec
tan
ce
( R
) (a
rb.u
nit
)
Photon energy (eV)
Exti
ncti
on
co
eff
icie
nt
(K)
(arb
.un
it)
a
-12
-8
-4
0
0 400 800
0.0
1.0x10⁻⁵
2.0x10⁻⁵
Absorption coefficient ( ) cm-1
Ex
tin
cti
on
co
eff
icie
nt
(K)
(arb
.un
it) b
-12
-8
-4
0
Re
flec
tan
ce
(R) (a
rb.u
nit)
index (nx) determines how much light is bent, or refracted, when enters the material. Since the internal efficient
of the device also depends on the incident photon energy, by carefully adapting the incident photon energy (h )
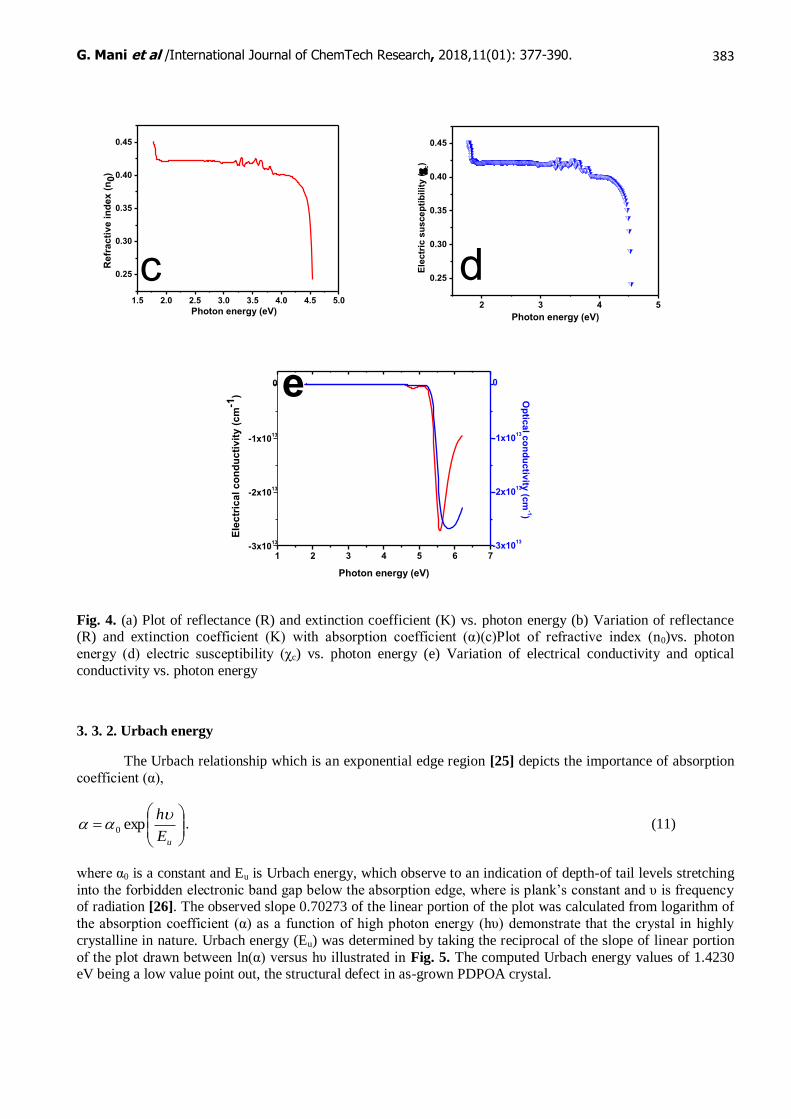
one can achieve the devices. Fig. 4 (c) exhibits the variation of refractive index (nx) with photon energy (h).
From the figure it is clear that refractive index (nx) decreases with increases of photon energy (h). This lowering of refractive index underscore that the PDPOA crystal exhibit the regular dispersion behavior. The
calculated linear refractive index (nx) evaluated as 1.6386 for the PDPOA crystal at 385 nm. The high optical
transparency and low refractive index of PDPOA in the UV visible region makes it a prominent material for
antireflection coating in solar thermal devices and NLO application [20].
The photonic response of optical conductivity (op) of the material when irradiated with light relevant to the refractive index (nx) and the speed of light (c) as given below,
op = (6)
And also the electrical conductivity is correlated to the optical conductivity of the PDPOA crystal as
represented below,
ele = (7)
Fig.4. (e) Illustrates that the optical conductivity (op) increases with photon energy (h), having high magnitude (10
8(Ω m)
-1) thus ratifying the presence of high photo tunable nature of the material [21]. From Fig.
4. (e) and Fig. 4. (d) It suggests that the low extinction value (10-5
) and electrical conductivity ( 1.0 * 1013
(Ω
m)-1) supports semiconducting nature of the material. Hence this material is more suitable for device
applications in computing ultrafast optical data [22].
From the elucidated optical constants, the electric susceptibility (÷c) can be estimated from the following
relation [23],
år = å0 + 4ð ÷c = nx2 – K
2 (8)
÷c = (9)
where å0 is the dielectric constant in absence of any contribution from free carriers. The calculated value of
electric susceptibility ÷c is 0.21377 at = 385 nm Fig. 4 (d). The real part ( år ) and imaginary part (åi) of the dielectric constants can be evaluated from the following relations [18],
år = nx2 – K
2 and åi =2nxK (10)
The value of real part (år ) and imaginary part (åi) of the dielectric constants at = 385 nm are -2.685
and 1.235-2 respectively. Hence the optical constants of a material such as electronic optical band gab and
extinction coefficient are indeed quite important to examine the material’s potential in optoelectronic
applications [24].
G. Mani et al /International Journal of ChemTech Research, 2018,11(01): 377-390.
383
1.5 2.0 2.5 3.0 3.5 4.0 4.5 5.0
0.25
0.30
0.35
0.40
0.45
Re
fra
cti
ve
in
de
x (
n0
)
Photon energy (eV)
c2 3 4 5
0.25
0.30
0.35
0.40
0.45
Ele
ctr
ic s
us
ce
pti
bil
ity
(
c)
Photon energy (eV)
d
1 2 3 4 5 6 7-3x10
13
-2x10¹³
-1x10¹³
0
Photon energy (eV)
Ele
ctr
ica
l c
on
du
cti
vit
y (
cm
-1)
-3x10¹³
-2x10¹³
-1x10¹³
0
Op
tical c
on
du
ctiv
ity (c
m-1)
e
Fig. 4. (a) Plot of reflectance (R) and extinction coefficient (K) vs. photon energy (b) Variation of reflectance (R) and extinction coefficient (K) with absorption coefficient (α)(c)Plot of refractive index (n0)vs. photon
energy (d) electric susceptibility (χc) vs. photon energy (e) Variation of electrical conductivity and optical
conductivity vs. photon energy
3. 3. 2. Urbach energy
The Urbach relationship which is an exponential edge region [25] depicts the importance of absorption
coefficient (α),
uE
h exp0
. (11)
where α0 is a constant and Eu is Urbach energy, which observe to an indication of depth-of tail levels stretching
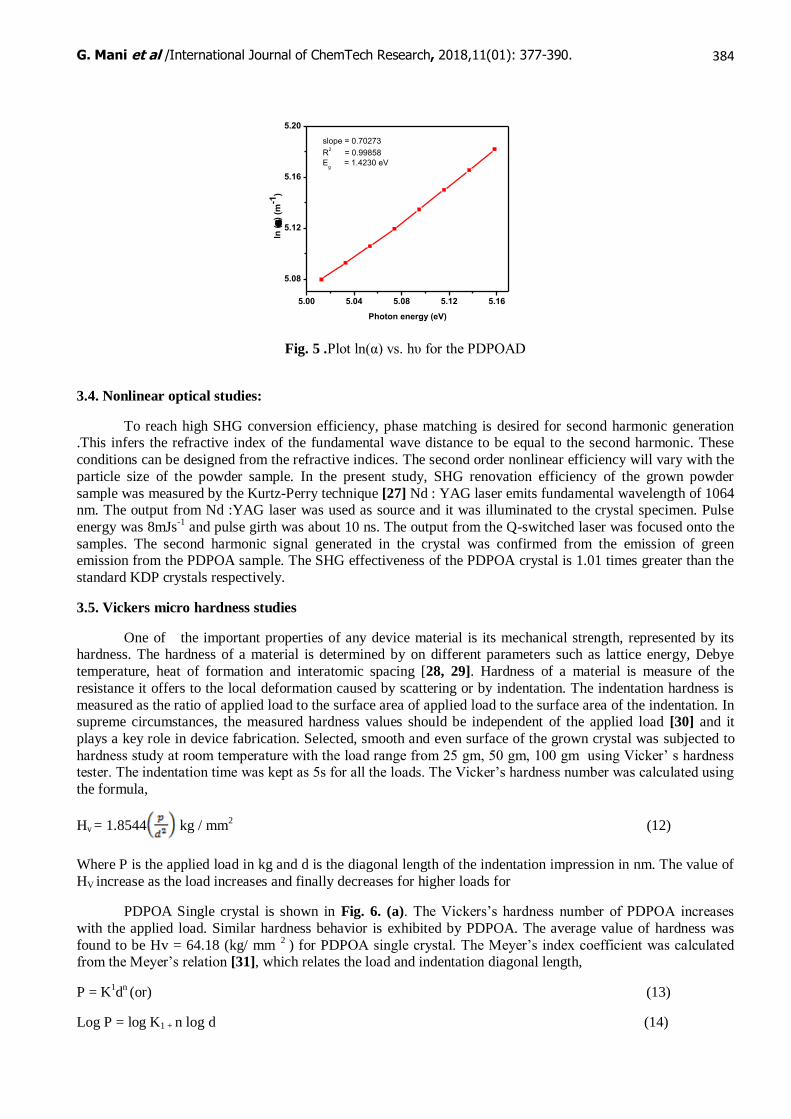
into the forbidden electronic band gap below the absorption edge, where is plank’s constant and υ is frequency of radiation [26]. The observed slope 0.70273 of the linear portion of the plot was calculated from logarithm of
the absorption coefficient (α) as a function of high photon energy (hυ) demonstrate that the crystal in highly
crystalline in nature. Urbach energy (Eu) was determined by taking the reciprocal of the slope of linear portion
of the plot drawn between ln(α) versus hυ illustrated in Fig. 5. The computed Urbach energy values of 1.4230 eV being a low value point out, the structural defect in as-grown PDPOA crystal.
G. Mani et al /International Journal of ChemTech Research, 2018,11(01): 377-390.
384
5.00 5.04 5.08 5.12 5.16
5.08
5.12
5.16
5.20
ln (
) (m
-1)
Photon energy (eV)
slope = 0.70273
R2 = 0.99858
Eg = 1.4230 eV
Fig. 5 .Plot ln(α) vs. hυ for the PDPOAD
3.4. Nonlinear optical studies:
To reach high SHG conversion efficiency, phase matching is desired for second harmonic generation .This infers the refractive index of the fundamental wave distance to be equal to the second harmonic. These
conditions can be designed from the refractive indices. The second order nonlinear efficiency will vary with the
particle size of the powder sample. In the present study, SHG renovation efficiency of the grown powder
sample was measured by the Kurtz-Perry technique [27] Nd : YAG laser emits fundamental wavelength of 1064 nm. The output from Nd :YAG laser was used as source and it was illuminated to the crystal specimen. Pulse
energy was 8mJs-1
and pulse girth was about 10 ns. The output from the Q-switched laser was focused onto the
samples. The second harmonic signal generated in the crystal was confirmed from the emission of green emission from the PDPOA sample. The SHG effectiveness of the PDPOA crystal is 1.01 times greater than the
standard KDP crystals respectively.
3.5. Vickers micro hardness studies
One of the important properties of any device material is its mechanical strength, represented by its hardness. The hardness of a material is determined by on different parameters such as lattice energy, Debye
temperature, heat of formation and interatomic spacing [28, 29]. Hardness of a material is measure of the
resistance it offers to the local deformation caused by scattering or by indentation. The indentation hardness is
measured as the ratio of applied load to the surface area of applied load to the surface area of the indentation. In supreme circumstances, the measured hardness values should be independent of the applied load [30] and it
plays a key role in device fabrication. Selected, smooth and even surface of the grown crystal was subjected to
hardness study at room temperature with the load range from 25 gm, 50 gm, 100 gm using Vicker’ s hardness tester. The indentation time was kept as 5s for all the loads. The Vicker’s hardness number was calculated using
the formula,
Hv = 1.8544 kg / mm2 (12)
Where P is the applied load in kg and d is the diagonal length of the indentation impression in nm. The value of
HV increase as the load increases and finally decreases for higher loads for
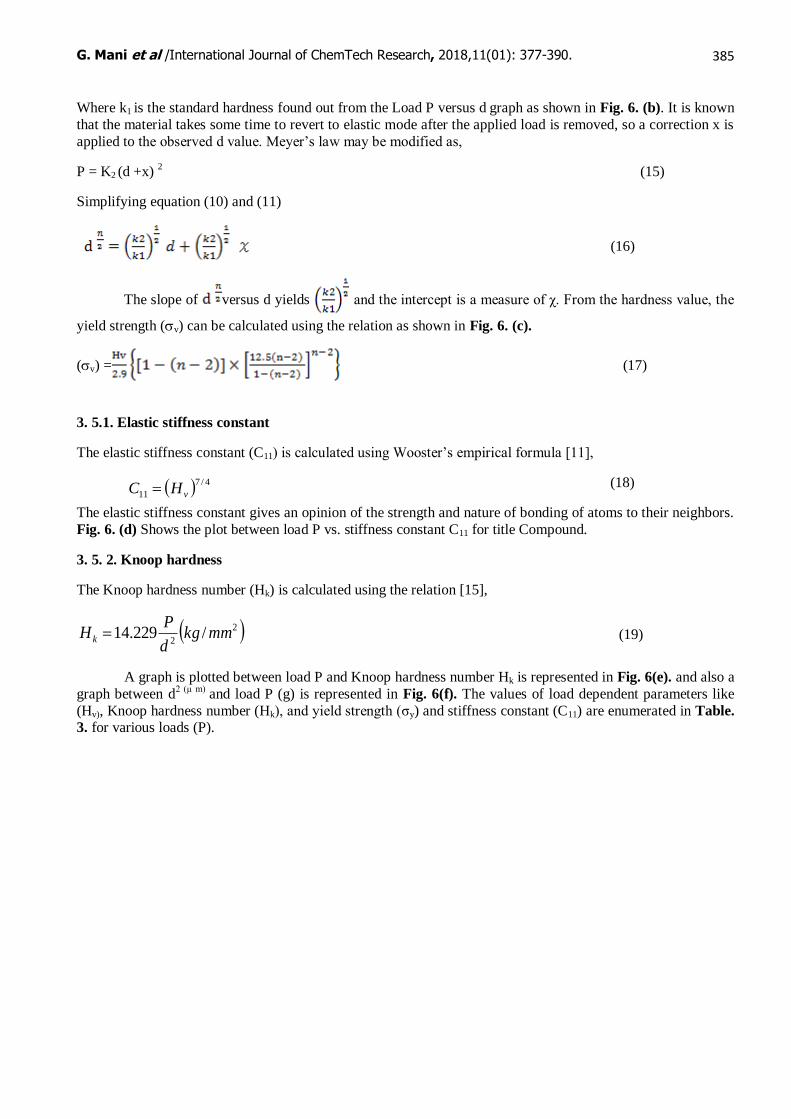
PDPOA Single crystal is shown in Fig. 6. (a). The Vickers’s hardness number of PDPOA increases
with the applied load. Similar hardness behavior is exhibited by PDPOA. The average value of hardness was
found to be Hv = 64.18 (kg/ mm 2
) for PDPOA single crystal. The Meyer’s index coefficient was calculated from the Meyer’s relation [31], which relates the load and indentation diagonal length,
P = K1d
n (or)
(13)
Log P = log K1 + n log d (14)
G. Mani et al /International Journal of ChemTech Research, 2018,11(01): 377-390.
385
4/7
11 vHC
Where k1 is the standard hardness found out from the Load P versus d graph as shown in Fig. 6. (b). It is known
that the material takes some time to revert to elastic mode after the applied load is removed, so a correction x is
applied to the observed d value. Meyer’s law may be modified as,
P = K2 (d +x) 2 (15)
Simplifying equation (10) and (11)
(16)
The slope of versus d yields and the intercept is a measure of χ. From the hardness value, the
yield strength (v) can be calculated using the relation as shown in Fig. 6. (c).
(v) = (17)
3. 5.1. Elastic stiffness constant
The elastic stiffness constant (C11) is calculated using Wooster’s empirical formula [11],
(18)
The elastic stiffness constant gives an opinion of the strength and nature of bonding of atoms to their neighbors.
Fig. 6. (d) Shows the plot between load P vs. stiffness constant C11 for title Compound.
3. 5. 2. Knoop hardness
The Knoop hardness number (Hk) is calculated using the relation [15],
2
2/229.14 mmkg
d
PH k (19)
A graph is plotted between load P and Knoop hardness number Hk is represented in Fig. 6(e). and also a
graph between d2 (μ m)
and load P (g) is represented in Fig. 6(f). The values of load dependent parameters like
(Hv), Knoop hardness number (Hk), and yield strength (ζy) and stiffness constant (C11) are enumerated in Table.
3. for various loads (P).
G. Mani et al /International Journal of ChemTech Research, 2018,11(01): 377-390.
386
Fig. 6. (a) Hardness value (b) Mayer’s plot (c) Yield strength (d) Stiffness constant (e) Knoop hardness and (f)
plot log P vs. d2.
Table. 3.
Calculated mechanical parameters of PDPOAD
Load P (g) Hv (kg mm-2
) Hk (kg mm-2
) ζy (GPa) C11 (GPa)
25 28.50 21.82 21.75 15.94
50 44.60 34.30 34.04 24.95 100 104 43.67 79.38 58.20
3. 6. Fluorescence and life time measurement
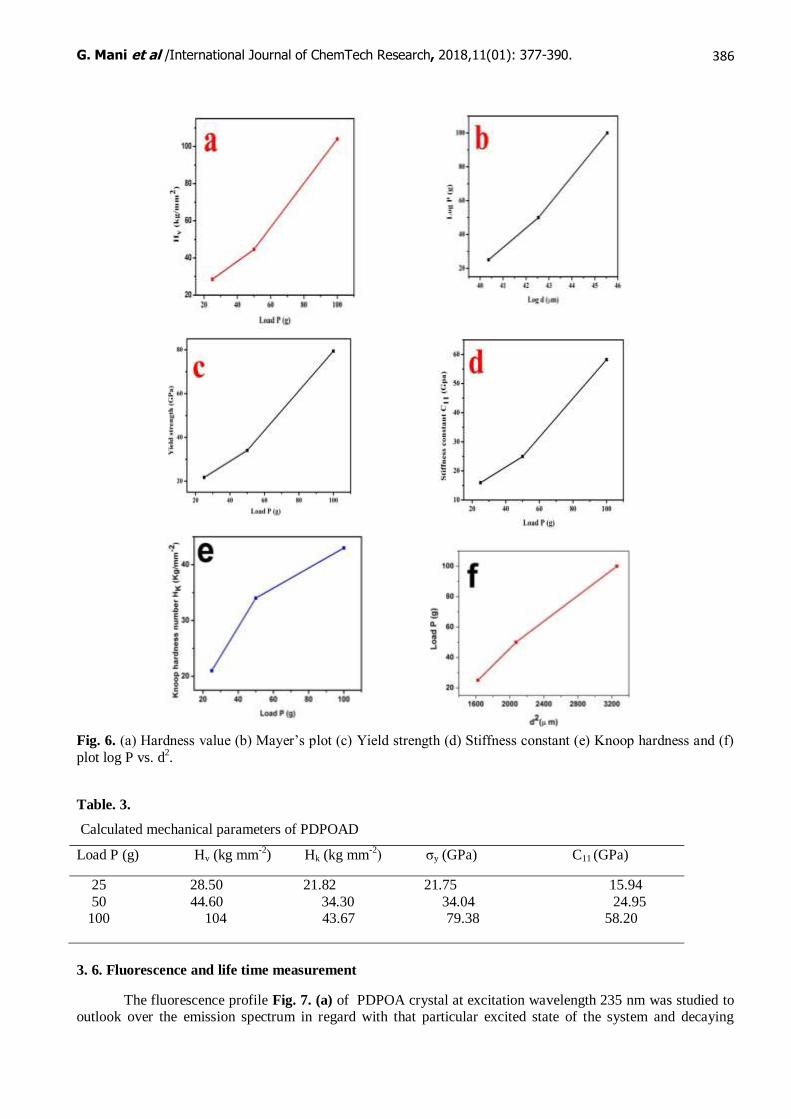
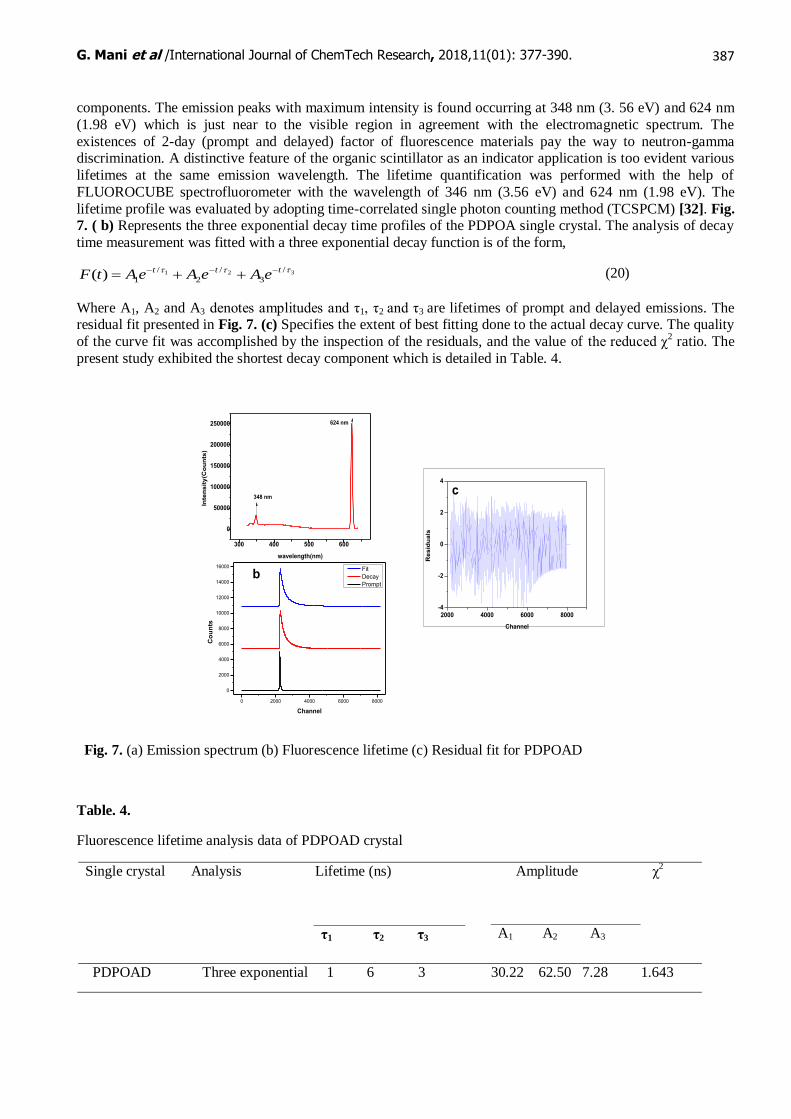
The fluorescence profile Fig. 7. (a) of PDPOA crystal at excitation wavelength 235 nm was studied to outlook over the emission spectrum in regard with that particular excited state of the system and decaying
G. Mani et al /International Journal of ChemTech Research, 2018,11(01): 377-390.
387
components. The emission peaks with maximum intensity is found occurring at 348 nm (3. 56 eV) and 624 nm
(1.98 eV) which is just near to the visible region in agreement with the electromagnetic spectrum. The
existences of 2-day (prompt and delayed) factor of fluorescence materials pay the way to neutron-gamma discrimination. A distinctive feature of the organic scintillator as an indicator application is too evident various
lifetimes at the same emission wavelength. The lifetime quantification was performed with the help of
FLUOROCUBE spectrofluorometer with the wavelength of 346 nm (3.56 eV) and 624 nm (1.98 eV). The
lifetime profile was evaluated by adopting time-correlated single photon counting method (TCSPCM) [32]. Fig.
7. ( b) Represents the three exponential decay time profiles of the PDPOA single crystal. The analysis of decay
time measurement was fitted with a three exponential decay function is of the form,
321 /
3
/
2
/
1)( ttt
eAeAeAtF
(20)
Where A1, A2 and A3 denotes amplitudes and η1, η2 and η3 are lifetimes of prompt and delayed emissions. The residual fit presented in Fig. 7. (c) Specifies the extent of best fitting done to the actual decay curve. The quality
of the curve fit was accomplished by the inspection of the residuals, and the value of the reduced χ2 ratio. The
present study exhibited the shortest decay component which is detailed in Table. 4.
Fig. 7. (a) Emission spectrum (b) Fluorescence lifetime (c) Residual fit for PDPOAD
Table. 4.
Fluorescence lifetime analysis data of PDPOAD crystal
Single crystal Analysis Lifetime (ns) Amplitude χ2
τ1 τ2 τ3 A1 A2 A3
PDPOAD Three exponential 1 6 3 30.22 62.50 7.28 1.643
0 2000 4000 6000 8000
0
2000
4000
6000
8000
10000
12000
14000
16000
Co
un
ts
Channel
Fit
Decay
Prompt
b
2000 4000 6000 8000-4
-2
0
2
4
Re
sid
ua
ls
Channel
c
300 400 500 600
0
50000
100000
150000
200000
250000
Inte
ns
ity
(Co
un
ts)
wavelength(nm)
348 nm
624 nm
G. Mani et al /International Journal of ChemTech Research, 2018,11(01): 377-390.
388
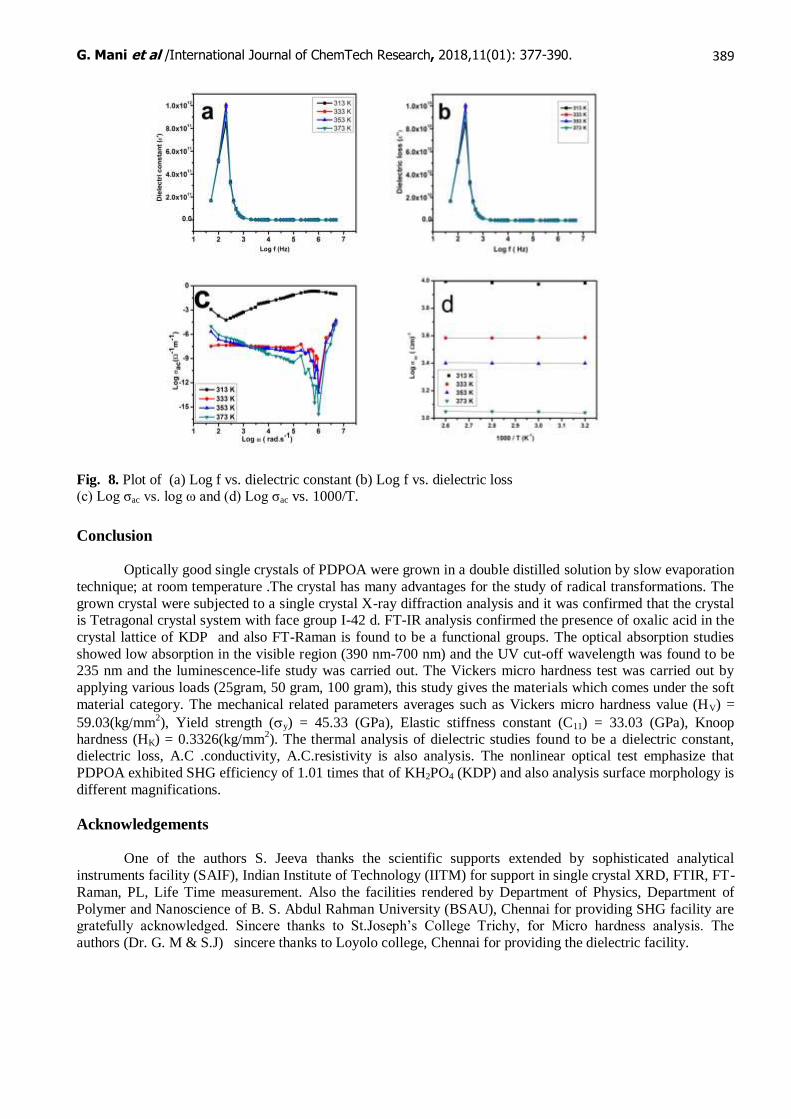
3.7. Dieletric studies
The electrical response, molecular anisotropy, structural changes, polarization mechanism and transport phenomena within crystalline materials were analysed by dielectric measurements [32]. The dielectric constant
and dielectric loss of the grown PDPOA crystal was carried out for various temperatures 313 K, 333K, 353 K
and 373 K in the frequency range 50 Hz to 5MHz using a HIOKI 3532-50 LCR HiTESTER meter. The dielectric constant (ε') and dielectric loss (ε'') of PDPOA was calculated using the following equation:
0
A
Ct (21)
and
ε״ = ε׳ tan δ (22)
respectively, Where C is the capacitance in µF, t is the thickness of the sample in mm, ε0 is the vacuum
dielectric constant (ε0= 8.854 x 10⁻¹²
Fm-1), A- Area of the sample in mm
2 and tan δ is the dissipation factor.
From Figures, it is spotted that increase of frequency there is a decrease of dielectric constant and dielectric
loss. The large values of (ε') at low frequencies is due to the outcome of the contribution of all the four polarizations namely electronic, space charge, orientation and ionic polarization. Also the low value of (ε') at
high frequency region is triggered by inability of the dipoles in consent with the external field [33]. Thus, the
attributed very low value of dielectric constant and dielectric loss at higher frequencies divulge the enhanced optical quality with defect less of the PDPOA crystal, in order to meet the requirements in opto-electronic
applications and photonic applications [32].
3. 7. 1 .A.C conductivity
The a.c conductivity ζac (Ωm)-1
has been calculated from the following formula:
tan'2 0fac (23)
Where f is the applied frequency of ac field (Hz). The variation of log ω with ac conductivity at various temperatures has been plotted and shown in Fig. 8 (c).
3. 7. 2. Activation energy
The activation energy (Ea) is evaluated using the following relation:
Tk
E
B
aexp0 (24)
Where ζac is the conductivity at temperature T, Ea- activation energy, kB is the Boltzmann constant (kB= 1.38 x 10
23 J/K). Fig. 8 (d) Show the variation of log ζac versus 1000/T. This is almost linear in behavior and the slope
of this graph is used to estimate the activation energy (Ea) using the relation,
Ea = -slope x 1000 x kB (25)
The value of the activation energy comes out to be -0.66015, -0.43025, -0.1474 and - 0.1357 eV at
frequencies 200 Hz, 300 Hz, 400 Hz and 500 Hz respectively exhibit that PDPOA possesses less defect owing
to less value of activation vitality. Flawless crystals become more useful materials for device fabrications [34].
G. Mani et al /International Journal of ChemTech Research, 2018,11(01): 377-390.
389
Fig. 8. Plot of (a) Log f vs. dielectric constant (b) Log f vs. dielectric loss (c) Log ζac vs. log ω and (d) Log ζac vs. 1000/T.
Conclusion Optically good single crystals of PDPOA were grown in a double distilled solution by slow evaporation
technique; at room temperature .The crystal has many advantages for the study of radical transformations. The
grown crystal were subjected to a single crystal X-ray diffraction analysis and it was confirmed that the crystal is Tetragonal crystal system with face group I-42 d. FT-IR analysis confirmed the presence of oxalic acid in the
crystal lattice of KDP and also FT-Raman is found to be a functional groups. The optical absorption studies
showed low absorption in the visible region (390 nm-700 nm) and the UV cut-off wavelength was found to be 235 nm and the luminescence-life study was carried out. The Vickers micro hardness test was carried out by
applying various loads (25gram, 50 gram, 100 gram), this study gives the materials which comes under the soft
material category. The mechanical related parameters averages such as Vickers micro hardness value (HV) =
59.03(kg/mm2), Yield strength (y) = 45.33 (GPa), Elastic stiffness constant (C11) = 33.03 (GPa), Knoop
hardness (HK) = 0.3326(kg/mm2). The thermal analysis of dielectric studies found to be a dielectric constant,
dielectric loss, A.C .conductivity, A.C.resistivity is also analysis. The nonlinear optical test emphasize that
PDPOA exhibited SHG efficiency of 1.01 times that of KH2PO4 (KDP) and also analysis surface morphology is
different magnifications.
Acknowledgements One of the authors S. Jeeva thanks the scientific supports extended by sophisticated analytical
instruments facility (SAIF), Indian Institute of Technology (IITM) for support in single crystal XRD, FTIR, FT-
Raman, PL, Life Time measurement. Also the facilities rendered by Department of Physics, Department of
Polymer and Nanoscience of B. S. Abdul Rahman University (BSAU), Chennai for providing SHG facility are gratefully acknowledged. Sincere thanks to St.Joseph’s College Trichy, for Micro hardness analysis. The
authors (Dr. G. M & S.J) sincere thanks to Loyolo college, Chennai for providing the dielectric facility.
G. Mani et al /International Journal of ChemTech Research, 2018,11(01): 377-390.
390
References [1] Anis M, Muley G G, shirsat M D, et al. Single crystal growth, structural, optical, mechanical, dielectric
and thermal studies of formic acid doped potassium dihydrogen phosphate crystal for NLO
applications. Crystal Res Technol.2015; 50:372-378.
[2] Shimomura O, Fast growth and evaluation of potassium dihydrogen phosphate single crystals by electrodialysis with P
H control, J. of Cry. Growth 144 (1994) 253-257.
[3] Yokotani, Hiroshi Koide, Takatomo Sasaki, Tatsuhiko Yamanaka and Chiyoe Yamanaka, Fast growth
of KDP single crystals by electrodialysis method, J. of Cry. Growth 67 (1984) 627-632 [4] Guohui Li, Genbo Su, Xinxin Zhuang, Zhengdong Li, Youping He, Rapid growth of KDP crystal with
new additive, J. of Cry. Growth 269 (2004) 443-447.
[5] Masahiro Nakatsuka, Kana Fujioka, Tadashi Kanabe, Hisanori Fujita, Rapid growth over 50 mm/day of
water-soluble KDP crystal, J. of Cry. Growth 171 (1997) 531-537. [6] Zaitseva N, Carman L, Smolsky I, Torres R, Yan M, The effect of impurities and supersaturation on the
rapid growth of KDP crystals, J. of Cry. Growth 204 (1999) 512-524.
[7] Podder, The study of impurities effect on the growth and nucleation kinetics of potassium dihydrogen phosphate, J. of Cry. Growth 237–239 (2002) 70-75.
[10] Abbas J. Jinia* and Jyotsna R. Pandey Growth and structural analysis of dopped KDP crystals: Gel
technique RJC Vol. 8 | No.2 |167 -171 | April - June | 2015. [11] Manimekalai K, Rajasekaran R, Growth and characterization of Oxalic acid doped Potassium
dihydrogen phosphate crystals, IRJET Vol.4| Issue:7 | 3057 - 3052 | July – 2017 | 2017.
[12] Mohd anis, Muley G.G, Baig M.I, Hussaini S.S, and Shirsat M.D, Doping effect of carboxylic acids on
optical, electrical, mechanical and thermal traits of KDP crystal,Materials Research Innovations- 2016 [13] Deepa Jananakumar, Mani. P, Growth and characterization of nonlinear optical single crystals of L-
Valine oxalate, IJCRGG, vol 5, April/June 2013.
[14] Rahman A, and Podder J. Int. J. Optics, Vol. 86, pp.15, 2010. [15] Krishnakumar .V. and Nagalakshmi R. Spectrochim. Acta, Part A, Vol. 61, pp. 499, 2005.
[16] Venkataramanan. V, Maheswaran. S, Sherwood. J.N, and Bhat H.L, J. Cryst. Growth, Vol.179, pp.
605, 1997. [17] Robert. R, Justin Raj. C, Krishnan. S, Jerome Das. S, phys. J. Appl. Phys. 48(2009) 20403-20409.
[18] Dhanraj. P. V, Sudan. T, Rajesh. N. P, Curr. Appl. Phys. B 405 (2010) 1349-1353.
[19] Surekha. R, Gunaseelan. R, Sagayaraj. P, Ambujam. K, R. Soc. Chem. 16(2014) 7979-7989.
[20] Sangeetha. V, Gayathri. K, Krishnan. P, Sivakumar. N, Kanagathara. N, Anbalagan. G, J. Crys. Growth 389 (2008) 68-77.
[21] Illenikhena, Afr. Phys. Rev. 2 (2008) 68-77.
[22] Mohd Anis, Shaikh. R. N, Shirsat. M. D, Hussaini. S. S, Opt. Laser Tech. 60 ( 2014) 124-129. [23] Arunkumar. A, Ramasamy. P, Opt. Mat 35 (2013) 1151-1156.
[24] Jones. W. J, Orvill –Thomas. W. J, Trans. Faraday Soc. 55 (1959) 203-210.
[25] Urbach. F,The long-wavelength edge of photographic sensitivity and of the electronic absorption of
solids, Phys. Rev. 92 (1953) 1324. [26] Migahed. M. D, Zidan. H. M, Influence of UV- irradiation on the structure and optical properties of
polycarbonate films, Curr. App. Phy. 6 (2006)91.
[27] Kurtz. S. K., Perry. T. T, J. Appl. Phys. 39 (1968) 3798-3813. [28] Vesta. C, Uthrakumar. R, Justin Raj. C, Jonie Varjula. A, Mary Linet. J, Jerome Das. S, Mater. J, Sci.
Technol. 23 (6) (2007) 855-859.
[29] Chacko. E, Mary Linet. J, Navis Priya. S. M, Vesta. C, Milton Boaz. B, Jerome Das. S, J.Master. Sci. Technol. 23 (6) (2007) 855-859.
[30] Subhadra. K. G, Kishan Rao. K, Sirdeshmukh. D. B, Bull. Matter. Sci. 23 (2000) 147-150.
[31] Sangwal. K, Surowska. B, Blaziak. P, J. Mater. Chem. Phys. 80 (2003) 428-437.
[32] Jayaprakash. P, Sangeetha. P, Rathika Thaya Kumari. C, Lydia Caroline. M, Physica B 518(2017)1-12. [33] Peer Mohamed. M, Jayaprakash. P, Nageshwari. M, Rathika Thaya Kumari. C, Sangeetha. P, Sudha. S,
Mani. G, Lydia Caroline. M, J. Mol. Struct.1141 (2017)551-562.
[34] Jayaprakash. P, Peer Mohamed. M, Lydia Caroline. M, J.Mol.Struct.1134 (2016) 67-77.
*****
Related Documents