Welcome message from author
This document is posted to help you gain knowledge. Please leave a comment to let me know what you think about it! Share it to your friends and learn new things together.
Transcript


International Journal of Business Management
&
Research
(A Bi-Annual Journal)
ISSN: 2249-2143
Volume 7, No. 1, Jan-June, 2017
-
An official publication of University School
of Business Management Desh Bhagat
University Amloh Road, Mandi Gobindgarh
Fategarh Sahib-147301 Punjab, INDIA

Year of Publication:2017
© Desh Bhagat University
Disclaimer:
The views & opinions expressed and interpretaions made in the Journal are solely of respective authors and
should not be attributed to Desh Bhagat University. The editor disclaim all for any responsibility injury to
persons or property resulting from any ideas or product or practices referred in papers published in the Journal .
All effects have been made to ensure accuracy, but the editors or DBU not be held responsible for any
remaining inaccuracies or omissions.

International Journal of Business Management & Research
EDITORIAL BOARD
Patron Editor-in-Chief
Dr. Zora Singh Dr. Payal Bassi
Chancellor, Desh Bhagat University Associate Director
University School of Management
Desh Bhagat University
ASSOCIATE EDITORS
Dr. Rajni Saluja Mr. Rajinder Kumar
Associate Professor, Assistant Professor
University School of Management, University School of Management
Desh Bhagat University Desh Bhagat University
ADIVSORY BOARD
Prof. (Dr.) R.K Uppal Prof. (Dr.)Deepak Tandon
Professor, Professor of Finance,
Department of Economics, Lal Bahadhur Institute of Management &
Technology,
DAV College, Malout, Punjab New Delhi
Prof. (Dr.) BishnuPriya Mishra Prof. (Dr.) Pardeep Singh Walia
Professor of Finance, Professor, Department of Commerce,
Uttkal University, Bhubaneswar, Post Graduate Government College for Girls,
Odisha Chandigarh
Prof. (Dr.) Navkiranjit Kaur Dhaliwal
Professor, Department of Commerce,
Punjabi University, Patiala

INTERNATIONAL JOURNAL OF BUSINESS MANAGEMENT & RESEARCH
(ISSN 2249-2143)
Contents
1. Impact of MGNREGA on Financial Inclusion- A Case Study of Majri and
Dhakori Kalan Villages of Punjab
Dr. Payal Bassi & Dr. Rajni Saluja 1
2. Web Based Corporate Reporting in India
Harmanpreet Kaur & Dr. Navkiranjit Kaur Dhaliwal 17
3. Issue and challenges faced by Regulatory Framework with special reference to
Scam- An Analytical study
Nidhi Jain & Vanisha chhabra 27
4. Problems and Challenges of Small And Medium Enterprises
Neha Kapoor & Pankaj Kumar 35
5. Shareholders’ Perception for Corporate Governance in India
Sonia & Dr. Babita 50
6. Transformation of Indian Banking through IT- Enabled Services
Dr. Payal Bassi & Navneet Mittal 57
7. FDI in India – A Sectoral Analysis
Rajni Verma & Dr. Rajni Saluja 63
INTERNATIONAL JOURNAL OF BUSINESS MANAGEMENT & RESEARCH
(ISSN 2249-2143)
Impact of MGNREGA on Financial Inclusion- A Case Study of Majri and Dhakori
Kalan Villages of Punjab
Payal Bassi* & Rajni Saluja**
*HOD & Associate Professor, Department of Business Management & Commerce, Desh Bhagat
University, Mandi Gobindgarh.
**Associate Professor, Department of Business Management & Commerce, Desh Bhagat University,
Mandi Gobindgarh.
Abstract
MGNREGA is widely dispersed flagship programme of Government of India. The issue of financial
inclusion is emerging as the new paradigm of economic growth. The purpose is to study the impact of
MGNREGA on financial inclusion of selected respondents and to assess the prevailing wage level of
MGNREGA workers. The study is based both on primary and secondary data. Field survey is done to
collect information from the respondents. The present study uses a structured questionnaire as a tool
for data collection. The area covered is Majri and Dhakori Kalan village of Punjab located near
Chandigarh. Convenience and Snowball sampling technique was used. 72 respondents were surveyed
in Majri and Dhakori Kalan village. Statistical tools and techniques such as percentages, frequencies,
and averages are calculated and t- test is applied for analyzing the data. MGNREGA is a relevant
programme. It has been observed that wage rate doesn’t matter to the workers as they just want to get
employment. MGNREGA has not been successful in providing stipulated 100 days employment to all
the registered persons in village.
Introduction
Sustainable development and progress of economy depends largely on robust and a strong
financial system as a strong financial system facilitates national objectives of creating a
market-driven, productive and competitive economy. A strong mechanism and diligent
allocation of resources for top to bottom is required to ensure financial inclusion for weaker
sections of society. India is the second largest country in terms of population and manpower.
India is considered as the land where more than one fourth of population is below poverty
line due to fluctuations in employment, shrinking employment opportunities and low wage
rates. It is therefore central government has introduced lot of programs in order to financially
include the weaker sections of society in financial inclusion and ensured right based and
guaranteed wage employment programs.
Financial Inclusion in India
Financial inclusion can be defined as the delivery of financial services at an
affordable cost to various sections of low-income and disadvantaged segments of society. An
all-inclusive financial system is essential because it enhances efficiency and welfare by
providing scope for secure and safe saving practices and by facilitating a wide range of
IJBMR, Vol. 7, No. 1, Jan-June, 2016 Page 1

INTERNATIONAL JOURNAL OF BUSINESS MANAGEMENT & RESEARCH
(ISSN 2249-2143)
efficient financial services. Financial Inclusion implies facilitating access to adequate and
timely financial products and services at an affordable price to vulnerable sections of the
society. It enables them to link with formal lending and preventing them with falling into
debt-trap. The benefits from lower interest improve their income and wealth. At macro level,
financial inclusion broadens the resource base of financial system, removes the rigidities in
financial market and promotes inclusive growth. The issue of financial inclusion is emerging
as the new paradigm of economic growth. It plays a major role in driving away poverty from
the country by delivering banking services to the under privileged and rural sections of
society at affordable prices. Numerous steps have been taken by Indian government to
financially include people of all the sections of society irrespective of there caste, creed and
religion but still there are around more than 40 % of population are financially excluded.
It is since 1994 the concept of financial inclusion got noticed with the establishment of
cooperative bank. The next major step was nationalization of commercial banks in 1969. The
establishment of Regional Rural Banks (RRBs) in 1975 was another milestone in making
banking network accessible to rural population. The issue of financial inclusion was first time
included in the Annual Policy of the Reserve Bank for 2004-05. Kisan Credit Card (KCxC)
for crop loan started in 1998 which has linked more than 100 million farmers with banks and
the current focus is to link remaining small and marginal farmers. Financial literacy and
Credit Counseling Centres (FLCC) have been set up in each district by the lead banks. These
were renamed as Financial Literacy Centres (FLC) in 2012. A multilingual website has been
launched by the Reserve Bank in June, 2007 in 13 languages on all matters concerning
financial education and banking for common persons and students. It is however, that the
concept of financial inclusion became a buzzword with the launching of Jan Dhan Yojana by
Modi’s Government.
Overview MGNREGA
The Mahatma Gandhi National Rural Employment Guarantee Act (MGNREGA), the most
advertised and widely dispersed flagship program of the government of India, was carved out
of a statutory act (known by the same name) notified by the Indian parliament in 2005. The
MGNREGA was notified on September 7, 2005. The Act came into force on 2nd
February,
2006 in the poorest 200 districts, termed the `Phase 1’districts; it was extended to another 130
`Phase 2’ districts in April 2007; and in April 2008 it was implemented in the remaining
`Phase 3’ districts as well. The unique features of the Act include time bound employment
IJBMR, Vol. 7, No. 1, Jan-July, 2017 Page 2
INTERNATIONAL JOURNAL OF BUSINESS MANAGEMENT & RESEARCH
(ISSN 2249-2143)
guarantee, incentive-disincentive structure of the State Governments for providing
employment or payment of unemployment allowance at their own cost and emphasis on
labour intensive works prohibiting the use of contractors and machinery. This is a flagship
programme of the Government that directly touches lives of the poor and promotes inclusive
growth. It is the largest ever public employment programme visualized in human history. It
has unleashed a silent revolution by forcing the government and private employers to provide
minimum wages to the poorest of the poor. The main and immediate objective of the Act is to
enhance livelihood security in rural areas by providing at least 100 days of guaranteed wage
employment in a financial year to every household whose adult members volunteer to do
unskilled manual work. The government has also fixed the minimum wage rate as per the
nature of work in different districts. Today MGNREGA is implemented in 688 districts
across the country and benefitting around 5.17 million households all over country and 0.34
million households in 2015-16.
Objectives of MGNREGA
Employment
Enhancement of Livelihood
Security of Households.
Labour Market and Migration
Environmental Services and
Agricultural Productivity
The MGNREGA, besides, the main features mentioned above also involves participatory
planning and implementation of the scheme through:
(i) Proactive role of Gram Sabha,
(ii) Rigorous & continuous monitoring by way of social audit, and
(iii) Involvement of ordinary people at the grass-roots level.
It addresses:
Chronic poverty
Drought
Deforestation
IJBMR, Vol. 7, No. 1, Jan-July, 2017 Page 3
Sustainable Development
Sustainable Rural Assets creation
Create Livelihood Resource Base
Restore Environment
Gender & Social Empowerment

INTERNATIONAL JOURNAL OF BUSINESS MANAGEMENT & RESEARCH
(ISSN 2249-2143)
Soil erosion etc.
It also aims at:
Generating productive assets,
Protecting the environment,
Empowering rural women, and
Arresting rural-urban migration.
The Act is further marked by certain salient features that purport to facilitate in achieving
the act’s goals and objectives. Notable among them are: (a) all adult members of a rural
household, willing to do unskilled manual work, may apply for registration in writing or
orally to the local Gram Panchayat (b) the Job Card should be issued within 15 days of
application (c) employment will be provided within 15 days of application for work, if it is
not then daily unemployment allowance as per the Act, has to be paid (d) wages are to be
paid according to the Minimum Wages Act 1948 for agricultural labors in the State unless the
Centre notifies a wage rate which will not be less than Rs. 60/ per day. Equal wages will be
provided to both men and women (e) at least one-third beneficiaries shall be women who
have registered and requested work under the scheme (f) permissible works predominantly
include rural connectivity, water and soil conservation, afforestration and land development
works (g) Work should ordinarily be provided within 5 km radius of the village. In case work
is provided beyond 5km extra wages of 10% are payable to meet additional transportation (h)
and living expenses social audit has to be done by the Gram Sabha and (i) all accounts and
records relating to the Scheme should be available for public scrutiny.
2.0 REVIEW OF LITERATURE
Ranaware Kruhna et.al (2015) surveyed the 4,881 users of more than 4100 works created
under the MGNERGA in Maharashtra. It provides evidence that MGNERGA works support
agriculture and benefit a large number of small and marginal farmers. 90 percent of the
respondents considered the works very useful and only 8 percent felt they were useless.
Overall, this study suggests that the widespread perception that the MGNERGA does not
create anything productive appears to be misplaced although there is scope for improving the
choice of works, their design and their execution.
IJBMR, Vol. 7, No. 1, Jan-June, 2017 Page 4

INTERNATIONAL JOURNAL OF BUSINESS MANAGEMENT & RESEARCH
(ISSN 2249-2143)
Organisational Structure of NREGA and Governance Responsibilities of Governments at Various Levels
Source: MRD, GOI (2008), Performance Audit of Implementation of National Rural Employment Guarantee
Act (NREGA).
IJBMR, Vol. 7, No. 1, July-Dec, 2017 Page 5

INTERNATIONAL JOURNAL OF BUSINESS MANAGEMENT & RESEARCH
(ISSN 2249-2143)
Indrakant S. (2015) examined the enhancement of financial inclusion through MGNERGS
in Andhra Pradesh. It analysed the status and performance in financial inclusion of AP at
state and district levels with help of CRISIL Inclusive Index. Financial Index has been
constructed. Field-level data from six villages has been used to examine the impact of policy
change in payment of wages on financial inclusion in different types of villages. The study
concluded that status and performance of AP during 2009-2012 in terms of CRISIL Inclusive
score appears to be satisfactory. There are some indications of widening variations in the
extent of financial inclusion across the districts.
Sangwan S.S (2014) The study has examined the scope of MGNERGA in promoting
financial inclusion. An analysis of reasons for opening bank account reveals that 41 percent
males and 62 percent females opened an account to get wages form MGNERGA. His work
based on field study of two villages from Punjab also reveals that villagers preferred to have
an account in a commercial bank rather than in Regional Rural Bank.
Agriculture Development and Rural Transformation Centre & Institute for Social &
Economic Change (2013) The report has major objective to measure the extent of manpower
employment generated under MGNREGA, their various socio-economic characteristics and
gender variability in implementing MGNERGA since its inception in selected states. The
study is based on both primary and secondary data. The study discussed total employment
generated and their socio-economic characteristics, number of projects completed and total
amount spent. Qualitative aspects and indicators of MGNREGA were also discussed. In the
end suggestions of villagers were given to raise efficacy of MGNERGA. The major
suggestions were increasing working days and wage rate, providing food within the
programme, allowing private land development through MGNREGA for longevity of the
programme and by providing proper information on various aspects of the programme.
Objectives of the Study
To study the impact of MGNREGA on financial inclusion of selected respondents.
To assess the prevailing wage level of MGNREGA workers.
IJBMR, Vol. 7, No. 1, Jan-June, 2017 Page 6
INTERNATIONAL JOURNAL OF BUSINESS MANAGEMENT & RESEARCH
(ISSN 2249-2143)
Research Hypotheses
H01: MGNREGA workers are ready to work even on lesser wages than official minimum
wage rate.
Research Methodology
The present study is descriptive and analytical in nature. The study is based both on primary
and secondary data. Field survey is done to collect information from the respondents. The
present study uses a structured questionnaire as a tool for data collection. The questionnaire
comprised of two sections. The first section enquired about the demographic data of the
respondents. The second section was used to record their awareness and their behavior and
intentions regarding the MGNREGA schemes and to analyze the impact of financial
inclusion on selected respondents. The area covered is Majri and Dhakori Kalan village of
Punjab located near Chandigarh. Convenience and Snowball sampling technique was used.
72 respondents were surveyed in Majri and Dhakori Kalan village. Statistical tools and
techniques such as percentages, frequencies, and averages are calculated and t- test is applied
for analyzing the data.
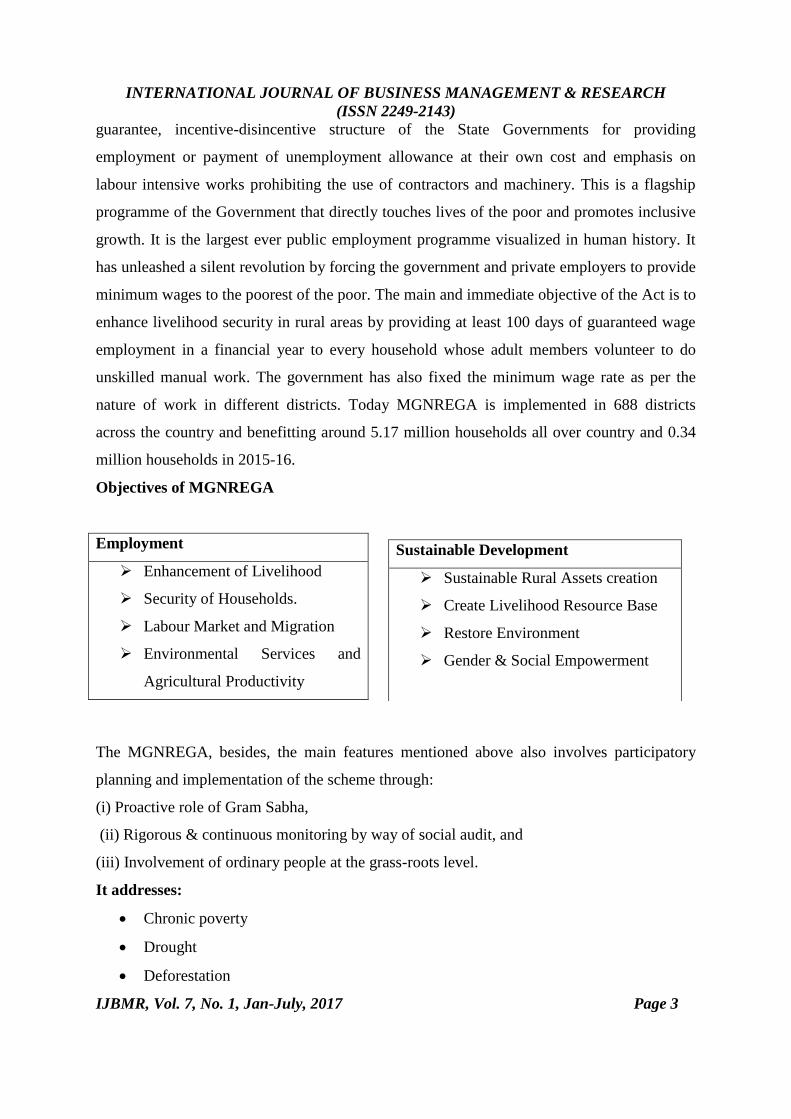
Analysis & Interpretation of Data
Socio-Economic Demographic Profile of Respondents
Table 1: Education-wise Respondent
Education Respondents %
Illiterate 23 32
Literate up to primary 13 18
Middle 8 11
Matriculation 13 18
Higher Secondary 9 12
Graduation 4 6
Post Graduation or above 2 3
Total 72 100.00
Source: Field Survey, 2016
IJBMR, Vol. 7, No. 1, Jan-June, 2017 Page 7

INTERNATIONAL JOURNAL OF BUSINESS MANAGEMENT & RESEARCH
(ISSN 2249-2143)
Table 1 indicates that 32% of the respondents are illiterate followed by 18% as literate up to
primary and 18% as matriculation, followed by 12% who got education up to higher
secondary, 11% did their qualification up to middle, followed by 6% Graduates and only 3 %
of Post graduates.
Table 2 Occupation-wise Respondents
Occupation Respondents
Cultivator 1
Agricultural Labourer 5
Livestock and Allied Activities 2
Mining and quarrying 1
Manufacturing process, servicing and repairs 7
Construction 0
Trade and Commerce 4
Transport, storage and communications 3
Other Services 15
Household Work 25
Student 1
Non Worker 6
Seeking Work 2
Total 72
Source: Field Survey, 2016
It is discovered that out of 72 respondents 25 respondents were busy with household work,
followed by 15 % respondents doing other services like working in banks, running beauty
parlours, etc., followed by 6 % who were free and 5 % working as agricultural labourers and
so on.
IJBMR, Vol. 6, No. 2, July-Dec, 2016 Page 8

INTERNATIONAL JOURNAL OF BUSINESS MANAGEMENT & RESEARCH
(ISSN 2249-2143)
Table 3: Caste-wise Respondents
Caste Respondents %
General 34 46
Scheduled Caste 34 47
OBC 5 7
ST 0 0
Total 72 100.00
Source: Field Survey, 2016
Table 4: Economic Category-wise Respondents
Source: Field Survey, 2016
IJBMR, Vol. 7, No. 1, Jan-June, 2017 Page 9
46% 47%
7% 0%
Respondents
General Scheduled Caste OBC ST
58% 32%
10%
Respondents
APL BPL AAY
Economic Category Respondents
APL 43
BPL 24
AAY 7
Total 100
INTERNATIONAL JOURNAL OF BUSINESS MANAGEMENT & RESEARCH
(ISSN 2249-2143)
Out of 72 respondents 47 % of the respondents belong to SC category, followed by 46 % as
general category respondent followed by 7 % OBC. 55% of the respondents hold APL cards,
where as 32 % have BPL cards and 10 % respondents posses AAY cards.
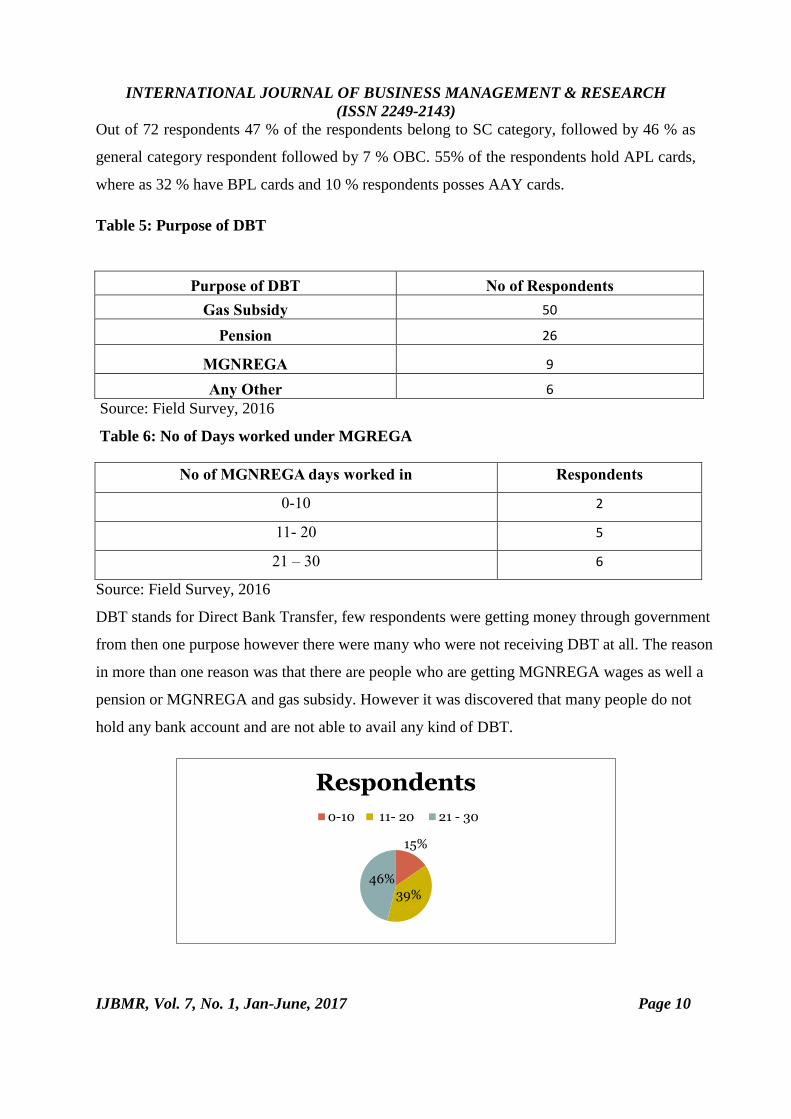
Table 5: Purpose of DBT
Source: Field Survey, 2016
Table 6: No of Days worked under MGREGA
Source: Field Survey, 2016
DBT stands for Direct Bank Transfer, few respondents were getting money through government
from then one purpose however there were many who were not receiving DBT at all. The reason
in more than one reason was that there are people who are getting MGNREGA wages as well a
pension or MGNREGA and gas subsidy. However it was discovered that many people do not
hold any bank account and are not able to avail any kind of DBT.
IJBMR, Vol. 7, No. 1, Jan-June, 2017 Page 10
15%
39% 46%
Respondents
0-10 11- 20 21 - 30
Purpose of DBT No of Respondents Gas Subsidy 50
Pension 26
MGNREGA 9 Any Other 6
No of MGNREGA days worked in Respondents
0-10 2
11- 20 5
21 – 30 6
INTERNATIONAL JOURNAL OF BUSINESS MANAGEMENT & RESEARCH
(ISSN 2249-2143)
During the financial year 2015 -16 only 13 respondents worked under MGNREGA and the
kind of work they were involved in was laying of mud roads on the side of pucca roads.
Table 7: Satisfaction in receiving Wages through Bank
Satisfaction Wages in Bank A/c Response
Satisfied 8
Unsatisfied 5
Source: Field Survey, 2016
Out of the 13 workers of MGNREGA only 8 respondennst were satisfied with the wage
payment system as they actuially received the promised amount where as 5 were unsatisfied
since they did not receive the amount even after 60 days of completing their work. The
reason for this that the dealinghand did not send their details for job cards and other
rgistration formalities.
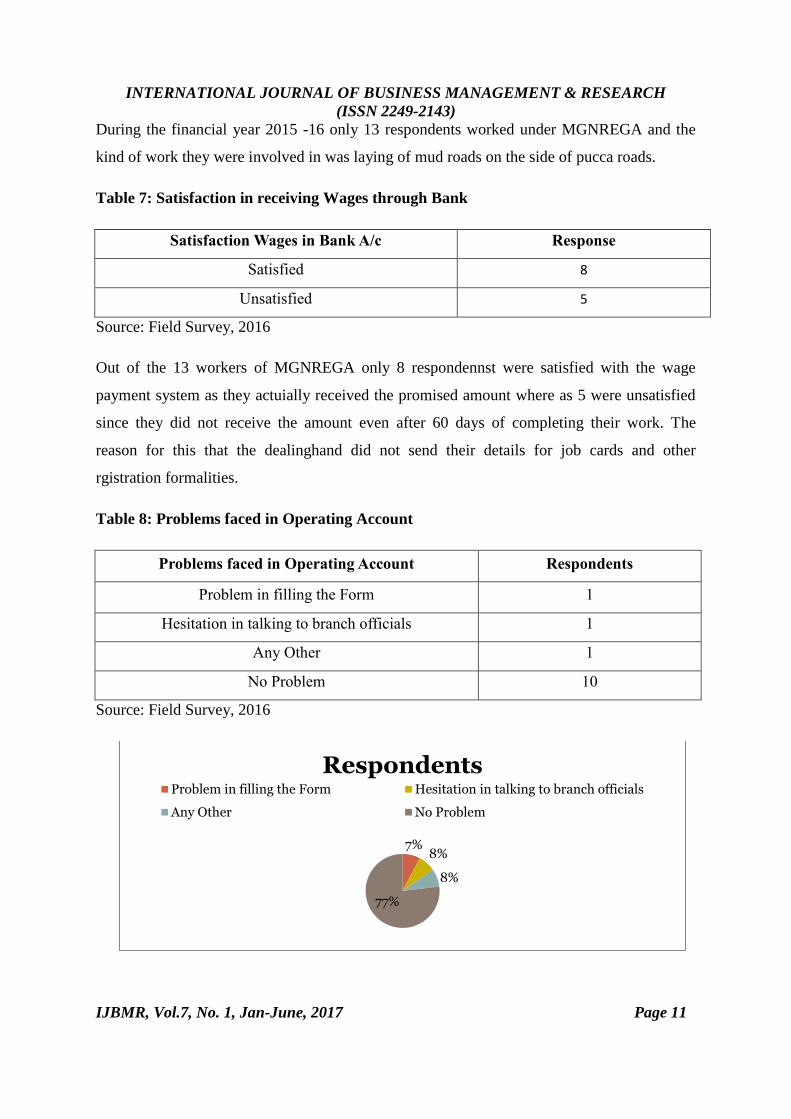
Table 8: Problems faced in Operating Account
Problems faced in Operating Account Respondents
Problem in filling the Form 1
Hesitation in talking to branch officials 1
Any Other 1
No Problem 10
Source: Field Survey, 2016
IJBMR, Vol.7, No. 1, Jan-June, 2017 Page 11
7% 8%
8%
77%
Respondents Problem in filling the Form Hesitation in talking to branch officials
Any Other No Problem

INTERNATIONAL JOURNAL OF BUSINESS MANAGEMENT & RESEARCH
(ISSN 2249-2143)
Since most of the respondents working under MGNREGA were totally illiterate and they did
not know how to write their name faced lot of problem in filling the form and they were
totally dependent on other people for filling the forms. Though few of them were literate up
to primary level they were quiet hesitant in talking to bank officials and never asked for the
money.
Table 9: Whether Authorized to Withdraw money or not
Authorisation Respondents
Yes 9
No 4
Source: Field Survey, 2016
It was discovered in the survey that few of the people working under MGNREGA were not
authorised to operate their Accounts the contractors’ posses their Bank accounts and ATM
cards and operate it on their own. The main reason was that they did not know how to operate
the ATM and there is no other member in their family like they are the only one living.
Table 10 Wage Rate Given under MGNREGA
Source: Field Survey, 2016
Table 11: Preference for MGNREGA
Source: Field Survey, 2016
In Majri village the wage rate offered is Rs 166 where as for the same kind of work the
surrounding villagers are getting Rs 210.
IJBMR, Vol. 7, No. 1, Jan-June, 2017 Page 12
Wage Rate Responses
In Majri Rs 166
Surrounding Villages Rs 210
Preference Respondents
First 56
Last Resort 16

INTERNATIONAL JOURNAL OF BUSINESS MANAGEMENT & RESEARCH
(ISSN 2249-2143)
Out of the total respondents who have worked in MGNREGA for last three years 56
respondents that they still prefer to work under MGNREGA but the concerned person is not
providing them with work while 16 respondents responded that MGNREGA is their last
resort and they do not work under MGNREGA even if they are offered with high wages.
Table 12: t-test for Equality of Means (Wage Rate)
Levene's
Test for
Equality of
Variances t-test for Equality of Means
F Sig. t df
Sig.
(2-
tailed)
Mean
Difference
Std. Error
Difference
95% Confidence
Interval of the
Difference
Lower Upper
wage Equal
variances
assumed 3.37 0.068
-
0.759 142 0.449 -14.3056 18.85407
-
51.5765 22.96537
Equal
variances
not
assumed
-
0.759 137.276 0.449 -14.3056 18.85407
-
51.5875 22.9764
Source: Calculated Values
T test was applied just to see the significance of variance of wages and wage rate t- test was
tested ( i) the variance between the lower wages and upper wages is insignificant. ( ii) It is
found that people are ready to work even at low wages.
Qualitative Aspect of the Study
It is discovered that since most of the people are widowed, living alone or are not
supported by their family and don’t have any other source of income they are ready to
work even at the wage rate lower than that offered by the government.
Attitude of Sarpanch and other officials: In a discussion with village Sarpanch it is
discovered that he is not interested in getting the work of MGNREGA started as in
that case his responsibilities will grow and he will have to keep the record and keep
the track of the work in progress.
IJBMR, Vol. 7, No. 1, Jan-June, 2017 Page 13

INTERNATIONAL JOURNAL OF BUSINESS MANAGEMENT & RESEARCH
(ISSN 2249-2143)
In formal Discussion with people of weaker section of society disclosed the
information that there are number of persons with in these villages who does not
allow actual workers to get the money and they take the benefit of the people who are
not educated they withdraw the money on their behalf and ask those workers to leave
their thumb mark on the register stating that they have received the money. It is also
discovered that the persons who are keeping the records of this work do not tell them
the prevailing wage rate but instead tell them almost half of the wage rate and when
someone asks for the same they tell the money has been spent on the project and on
them during the course of work. It is in this way that the workers are being harassed
and are not being paid as the government promises them.
Financial Illiteracy is also one of the challenges in the area of financial inclusion.
Lack of basic education prevents the people to have an access from financial services
Another challenge in the area of financial inclusion is that access to formal financial
services requires various documents of proof regarding persons' identity, income,
birth certificates, etc. But poor people generally lack these documents and thus are
devoid of these services.
Following observations were made in villages regarding MGNREGA
• Lack of Initiative on the Part of Sarpanch and concerned officials
• Failure on the Part of District Administration to get the village plan Implemented.
• Non Involvement Of line Department in Implementation of works
• Lack of Technical support.
Conclusion
The concept of financial inclusion has gained substantial importance in the Indian context.
Financial Inclusion can be defined as the wide range of financial products and services to
which everybody can have an access which allows them to efficiently manage their finances,
regardless of their level of income or social status. MGNREGA is a relevant programme. It
has been observed that wage rate doesn’t matter to the workers as they just want to get
employment. MGNREGA has not been successful in providing stipulated 100 days
employment to all the registered persons in village.
IJBMR, Vol. 7, No. 1, Jan-June, 2017 Page 14
INTERNATIONAL JOURNAL OF BUSINESS MANAGEMENT & RESEARCH
(ISSN 2249-2143)
Policy Implications
The Panchayats should take the responsibility of facilitating the villagers to open a
bank account, especially with focus on poorer sections who do not know its
significance.
It should also undertake task of generating awareness and publicity about the financial
inclusion and ensure that all the households of a village open a bank account and use
the same for financial transactions such as payment of wages under MGNREGA,
pensions and scholarships.
There is a need for the banks and Panchayats to work in convergence and ensure
collective action in helping the below poverty line population and others in such a
way that the selection of beneficiaries under government schemes and programmes
would get timely support.
MNREGA work should not suffer due to lack of timely funds.
References
Indrakant, S (2015). Bank Linkage through MGNREGS. In Sher Singh Sangwan
& Gagandeep, Proceedings of National Seminar on Panchayati Raj as an
Instrument of Rural Development with support from Financial Institutions,
November 27-28, 2014, CRRID, pp. 43-60.
Sangwan, S.S (2014). Bank Preferences for Financial Inclusion in Rural Punjab.
Economic and Political Weekly, 49 (30).
Sangwan, S.S (2013). State-wise Comparison of Financial Inclusion in India.
Working Paper I, SBI Chair Programme, CRRID.
Agriculture Development and Rural Transformation Centre (2013). Agro-
Economic Research, Impact of MGNREGA on Wage Rate, Food Security and
Rural Urban Migration: A Consolidated Report. Institute for Social and Economic
Change, Banglore, pp. 51-61
www.nrega.nic.in
https://www.rbi.org.in/scripts/BS_SpeechesView.aspx?Id=862
http://sacw.net/article3811.html
IJBMR, Vol. 7, No. 1, Jan-June, 2017 Page 15
INTERNATIONAL JOURNAL OF BUSINESS MANAGEMENT & RESEARCH
(ISSN 2249-2143)
https://www.academia.edu/4018810/Financial_Inclusion_in_India_A_road_map_t
owards_future_growth
http://nrega.nic.in/netnrega/WriteReaddata/circulars/Report_to_the_people_Englis
h2013.pdf
CAG of India (2013). Performance Audit of Mahatma Gandhi National Rural
Employment Scheme. Government of India. Accessed at:
http://saiindia.gov.in/english/home/our_products/audit_report/Government_Wise/
union_audit/recent_reports/union_performance/2013/Civil/Report_6/chap_1.pdf
IJBMR, Vol. 7, No. 1, Jan-June, 2017 Page 16
INTERNATIONAL JOURNAL OF BUSINESS MANAGEMENT & RESEARCH
(ISSN 2249-2143)
Web Based Corporate Reporting in India
Harmanpreet Kaur* & Navkiranjit Kaur Dhaliwal**
*Assistant Professor, Department of Commerce, Desh Bhagat University, Mandi
Gobindgarh
** Professor, Department of Commerce, Punjabi University, Patiala
Abstract
The present research paper examines the extent of web based reporting practices in Indian corporate
sector. The sample for the study consists of 28 companies listed on Bombay Stock Exchange-100
index. The websites of the sample companies are browsed for the collection of data. The study shows
that all companies have maintained active websites. The average disclosure score of all companies is
60.5 per cent. Voluntary disclosure index has been prepared to measure the item-wise disclosure of
the companies.
Keywords: Corporate Reporting, Voluntary Disclosure Index
Introduction
Corporate reporting is the presentation of business information to the interested parties. It
helps the investors in deciding best portfolio investment as they can easily assess the risk and
growth potentials of the company. The informational need of the users induces the companies
to disclose more and more business related information to the users. The disclosure of
financial information provides true picture of the company to the users. The development of
World Wide Web brings revolutionary change in the world. The technology has changed the
way of conveying information and also the expectations of the investors for the need of
information. All companies over the world have started disclosing financial and non financial
information on internet due to low cost of disseminating information and wide reach. As a
medium of communication of corporate information, internet has no equal alternative. As per
RTI ACT, 2005, every public organization must disclose minimum amount of business
information for the stakeholders on their websites. Though, there is no standardized content
and format yet available to disclose corporate information on internet. The disclosure on web
is voluntary on the part of business corporations.
Review of Literature Singh and Singh (2015) examined the extent of financial disclosure practices by public and
private sector companies and investigated the presence of difference between these sectors.
IJBMR, Vol. 7, No. 1, Jan-June, 2017 Page 17

INTERNATIONAL JOURNAL OF BUSINESS MANAGEMENT & RESEARCH
(ISSN 2249-2143)
It was observed that the private sector companies were more concerned about disclosing
financial information on the websites.
Sharma (2013) investigated the status of web based corporate reporting of commercial banks
of Nepal. It was observed that companies were not utilizing the technological benefits of
internet.
Malhotra and Makkar (2012) examined the extent of web based disclosure practices of 100
Indian companies. It was observed that 70 per cent of the companies disclosed general
attributes such as contact us, about us, needs, events and history. Also, 81 per cent of the
companies disclosed some kind of financial information such as annual reports, balance sheet
and profit and loss account. As compared to other sectors banking companies presented
financial and non- financial information at higher levels on the websites.
Verma D (2010) in her research paper examined the disclosure practices on internet by 200
Indian companies. The results highlighted that the average internet disclosure was almost 60
per cent. There was high degree of variation in the disclosure of private sector companies as
compared to public sector companies. The result supported that the industry standard and the
level of competition in particular sector determined reporting practices of the companies on
web.
Dutta and Bose (2007) researched the utilization of the internet for communicating corporate
information by 268 listed companies of Bangladesh. The companies were not having their
own websites. Even the companies with websites were not utilizing the potentials of the
internet reporting. Wide variation was found in the Internet Financial Reporting.
Khan (2005) made an attempt to determine the level of disclosure and transparency in the
financial reporting of 177 companies on web for a period from January to March 2005. 31 per
cent of the sample companies were not having websites. The item-wise disclosure shows that
all companies presented balance sheet. Items such as income statement, cash flow statement,
and director’s biographies were presented by most of the sample companies. Analyst
coverage was the least disclosed item. This showed the variation the level of financial
disclosure on the internet due to difference in regulatory requirements.
Ashbaugh, Johnstone and Warifield (1992) in their research paper examined the use of
internet by 290 firms for disclosing financial information for a period from November 1997
IJBMR, Vol. 7, No. 1, Jan-June, 2017 Page 18
INTERNATIONAL JOURNAL OF BUSINESS MANAGEMENT & RESEARCH
(ISSN 2249-2143)
to January 1998. It was observed that 87 per cent of the companies had websites. 70 per cent
of the companies with websites were engaged in financial reporting on internet. The variation
was found in the content of firms’ financial disclosure on internet. The firms engaged in
internet reporting were particularly large in size and profitable.
Objectives of the Study
The objectives of the study were:
1. To check the presence of websites of sample companies.
2. To examine the extent of disclosure practices on internet in Indian corporate sector.
3. To provide suggestions to improve web based disclosure practices in India.
Research Methodology
The study covers 28 companies (based on market capitalization rate) listed on Bombay Stock
Exchange-100 index as on 1st October, 2015.
For the purpose of study, data has been collected from the websites of the companies for the
period from 1 December 2015 to 29 February 2016. To measure the extent of voluntary
disclosure practices on web, a voluntary disclosure index constituting 52 items has been
prepared. The selection of items for the construction of voluntary index is based on review of
literature of corporate reporting practice on web. For the purpose of analysis, the items have
been classified into six categories such as-
1. Financial Information
2. General Information
3. Marketing Information
4. Corporate Social Responsibility Information
5. Corporate Governance Information
6. Technological Advantages & User Support Information
For scoring of items in the index, both weighted scoring method (in respect of 3 items) and
unweighted scoring method have been used. If a company disclosures an item, then score one
is given and if an item is not disclosed, zero score is given. The item-wise disclosure score
has been calculated by dividing the number of companies disclosing a particular item by the
total number of sample companies.
IJBMR, Vol. 7, No. 1, Jan-June, 2017 Page 19

INTERNATIONAL JOURNAL OF BUSINESS MANAGEMENT & RESEARCH
(ISSN 2249-2143)
Disclosure Score = 𝑵𝒖𝒎𝒃𝒆𝒓𝒐𝒇𝒄𝒐𝒎𝒑𝒂𝒏𝒊𝒆𝒔𝒅𝒊𝒔𝒄𝒍𝒐𝒔𝒊𝒏𝒈𝒑𝒂𝒓𝒕𝒊𝒄𝒖𝒍𝒂𝒓𝒊𝒕𝒆𝒎
𝑻𝒐𝒕𝒂𝒍𝑵𝒖𝒎𝒃𝒆𝒓𝒐𝒇𝒔𝒂𝒎𝒑𝒍𝒆𝒄𝒐𝒎𝒑𝒂𝒏𝒊𝒆𝒔
Table 1: Scoring of Voluntary Disclosure Index
Items Distribution criteria Score
Annual Reports 0 year
1-5 years
5-10 years
More than 10 years
0
1
2
3
Languages of
Websites(English/Hindi/Both)
If any one
If both
1
2
Format of Annual
Report(html/PDF)
If anyone format is available
If both formats are available
1
2
Table 2: Maximum Possible Score of Voluntary Disclosure Index
Categories of VDI Max. possible score
Financial Information 17
General Information 10
Corporate Governance Information 8
Technological Aspects Information 13
Marketing Information 5
Corporate Social Responsibility Information 3
Total Score 56
Results & Discussions
Financial Information
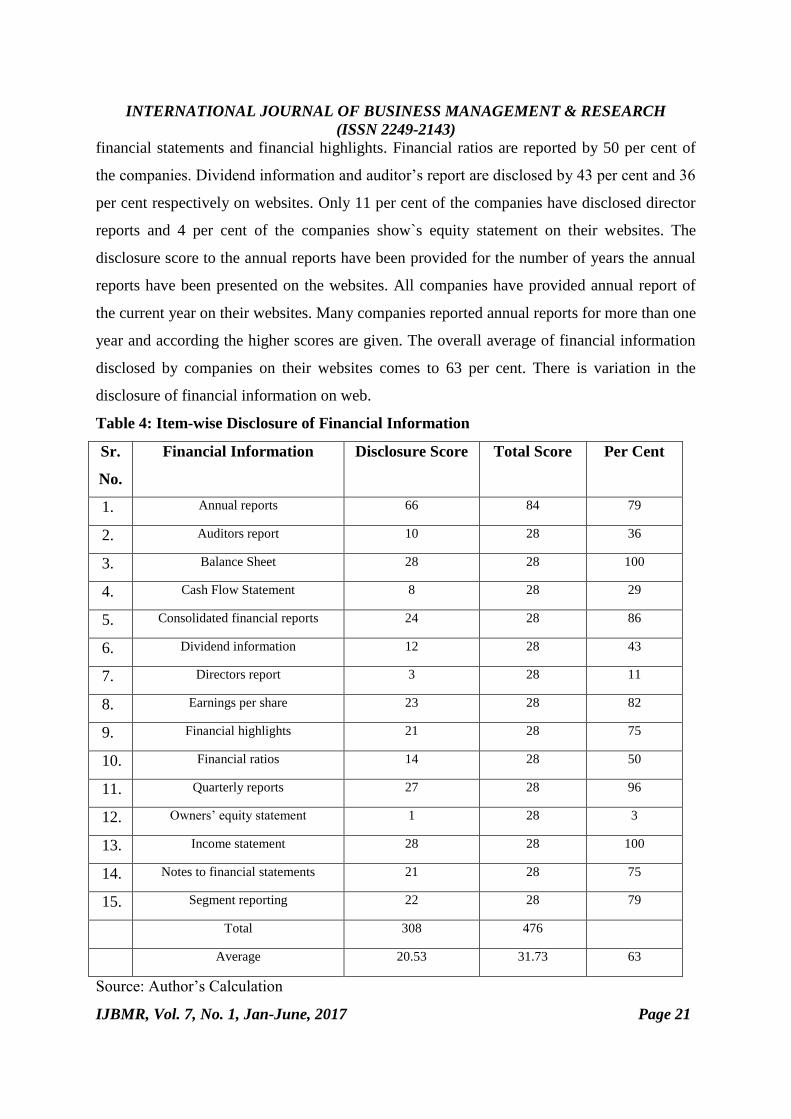
Table 4 shows the item-wise financial disclosure of sample companies. The table shows that
100 per cent of the companies presented balance sheet and profit and loss account for the
current year. 96 per cent of the companies presented reports on quarterly basis. Consolidated
financial reports 86 per cent, earning per share 82 per cent and segment reporting 79 percent
are available on website of companies. 75 per cent of the companies disclosed notes to
IJBMR, Vol. 7, No. 1, Jan-June, 2017 Page 20
INTERNATIONAL JOURNAL OF BUSINESS MANAGEMENT & RESEARCH
(ISSN 2249-2143)
financial statements and financial highlights. Financial ratios are reported by 50 per cent of
the companies. Dividend information and auditor’s report are disclosed by 43 per cent and 36
per cent respectively on websites. Only 11 per cent of the companies have disclosed director
reports and 4 per cent of the companies show`s equity statement on their websites. The
disclosure score to the annual reports have been provided for the number of years the annual
reports have been presented on the websites. All companies have provided annual report of
the current year on their websites. Many companies reported annual reports for more than one
year and according the higher scores are given. The overall average of financial information
disclosed by companies on their websites comes to 63 per cent. There is variation in the
disclosure of financial information on web.
Table 4: Item-wise Disclosure of Financial Information
Sr.
No.
Financial Information Disclosure Score Total Score Per Cent
1. Annual reports 66 84 79
2. Auditors report 10 28 36
3. Balance Sheet 28 28 100
4. Cash Flow Statement 8 28 29
5. Consolidated financial reports 24 28 86
6. Dividend information 12 28 43
7. Directors report 3 28 11
8. Earnings per share 23 28 82
9. Financial highlights 21 28 75
10. Financial ratios 14 28 50
11. Quarterly reports 27 28 96
12. Owners’ equity statement 1 28 3
13. Income statement 28 28 100
14. Notes to financial statements 21 28 75
15. Segment reporting 22 28 79
Total 308 476
Average 20.53 31.73 63
Source: Author’s Calculation
IJBMR, Vol. 7, No. 1, Jan-June, 2017 Page 21

INTERNATIONAL JOURNAL OF BUSINESS MANAGEMENT & RESEARCH
(ISSN 2249-2143)
are available on website of companies. 75 per cent of the companies disclosed notes toneral
Information
The table shows that all sample companies provide news and career information on their
websites. About us and Contact us information is available on 96 per cent of websites. 86 per
cent of the companies disclosed their history on websites. The site map is also provided by 86
per cent of the companies for the users to have a full glance of website at a single click. 57
per cent of the websites are provided with FAQ to provide additional information to the
investors. Disclaimer is provided by only 43 per cent of the companies. 36 per cent of the
corporate websites provide links to other sites to give additional information to the users from
their web pages and 25 per cent of the websites provide the users with help option. The
overall average of disclosure of general information is 73 per cent.
Table 5: Item-wise Disclosure of General Information
Sr.no. General Information Disclosure Score Total Score Per Cent
1 About us 27 28 96
2 News 28 28 100
3 History 24 28 86
4 Links 10 28 36
5 Help 7 28 25
6 Career 28 28 100
7 FAQ 16 28 57
8 Disclaimer 12 28 43
9 Contact us 27 28 96
10 Site map 24 28 86
Total 203 280
Average 20.3 28 73
Source: Author’s Calculation
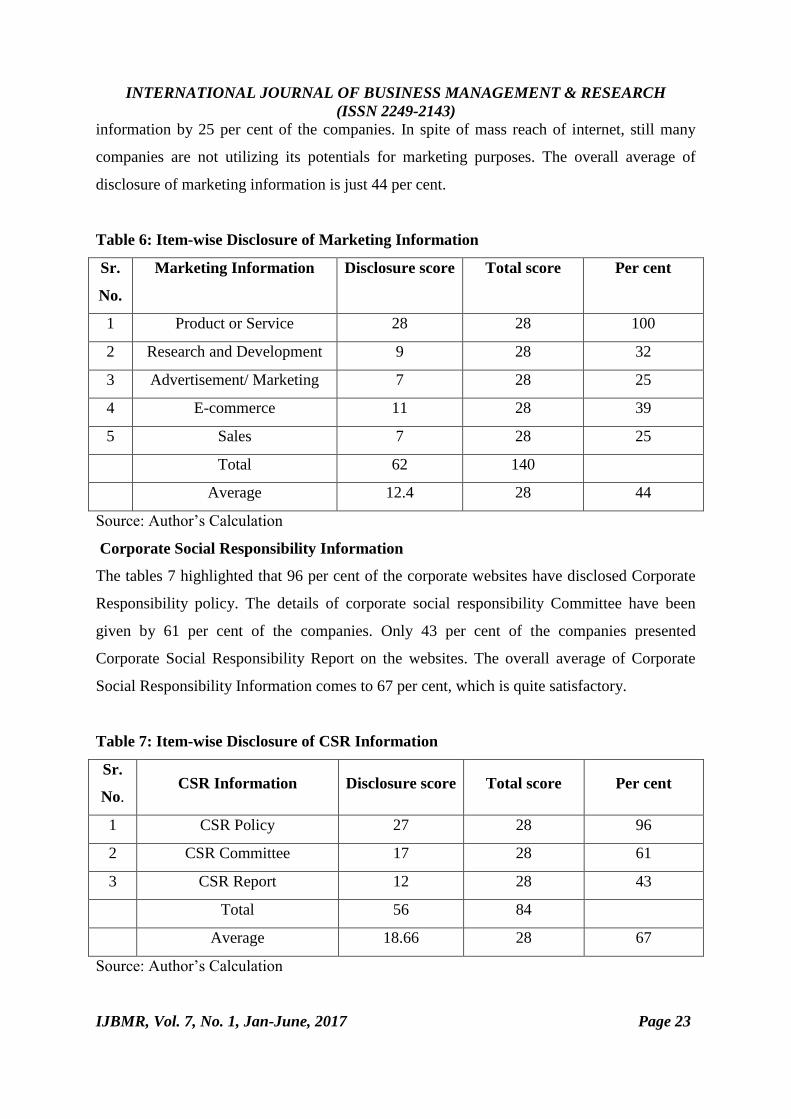
Marketing Information
The table 6 shows that all companies are using websites for communicating information
related to their products or services offered to the customers. E-commerce is being used at
infancy stage. Only 39 per cent of the companies are using websites for E-commerce
purposes. 32 per cent of the companies have revealed research and development information
on their websites. Stakeholders are provided with Sales and Advertisement/ Marketing
IJBMR, Vol. 7, No. 1, Jan-June, 2017 Page 22
INTERNATIONAL JOURNAL OF BUSINESS MANAGEMENT & RESEARCH
(ISSN 2249-2143)
information by 25 per cent of the companies. In spite of mass reach of internet, still many
companies are not utilizing its potentials for marketing purposes. The overall average of
disclosure of marketing information is just 44 per cent.
Table 6: Item-wise Disclosure of Marketing Information
Sr.
No.
Marketing Information Disclosure score Total score Per cent
1 Product or Service 28 28 100
2 Research and Development 9 28 32
3 Advertisement/ Marketing 7 28 25
4 E-commerce 11 28 39
5 Sales 7 28 25
Total 62 140
Average 12.4 28 44
Source: Author’s Calculation
Corporate Social Responsibility Information
The tables 7 highlighted that 96 per cent of the corporate websites have disclosed Corporate
Responsibility policy. The details of corporate social responsibility Committee have been
given by 61 per cent of the companies. Only 43 per cent of the companies presented
Corporate Social Responsibility Report on the websites. The overall average of Corporate
Social Responsibility Information comes to 67 per cent, which is quite satisfactory.
Table 7: Item-wise Disclosure of CSR Information
Sr.
No. CSR Information Disclosure score Total score Per cent
1 CSR Policy 27 28 96
2 CSR Committee 17 28 61
3 CSR Report 12 28 43
Total 56 84
Average 18.66 28 67
Source: Author’s Calculation
IJBMR, Vol. 7, No. 1, Jan-June, 2017 Page 23
INTERNATIONAL JOURNAL OF BUSINESS MANAGEMENT & RESEARCH
(ISSN 2249-2143)
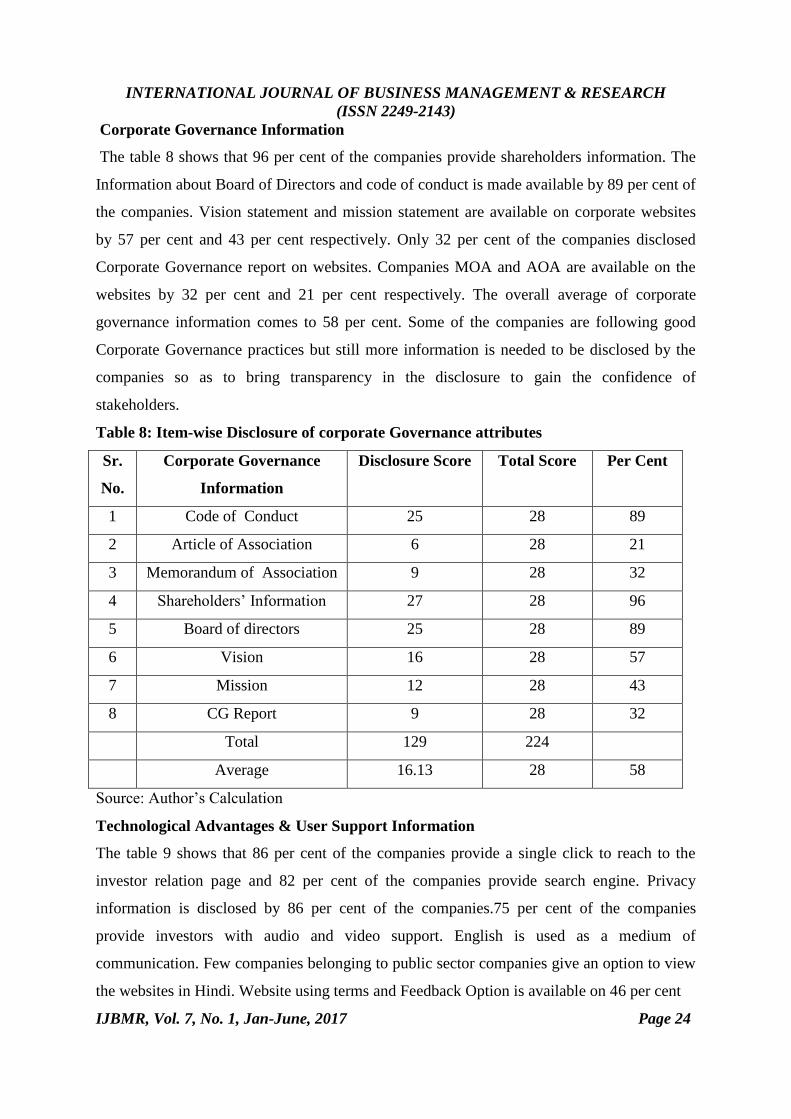
Corporate Governance Information
The table 8 shows that 96 per cent of the companies provide shareholders information. The
Information about Board of Directors and code of conduct is made available by 89 per cent of
the companies. Vision statement and mission statement are available on corporate websites
by 57 per cent and 43 per cent respectively. Only 32 per cent of the companies disclosed
Corporate Governance report on websites. Companies MOA and AOA are available on the
websites by 32 per cent and 21 per cent respectively. The overall average of corporate
governance information comes to 58 per cent. Some of the companies are following good
Corporate Governance practices but still more information is needed to be disclosed by the
companies so as to bring transparency in the disclosure to gain the confidence of
stakeholders.
Table 8: Item-wise Disclosure of corporate Governance attributes
Sr.
No.
Corporate Governance
Information
Disclosure Score Total Score Per Cent
1 Code of Conduct 25 28 89
2 Article of Association 6 28 21
3 Memorandum of Association 9 28 32
4 Shareholders’ Information 27 28 96
5 Board of directors 25 28 89
6 Vision 16 28 57
7 Mission 12 28 43
8 CG Report 9 28 32
Total 129 224
Average 16.13 28 58
Source: Author’s Calculation
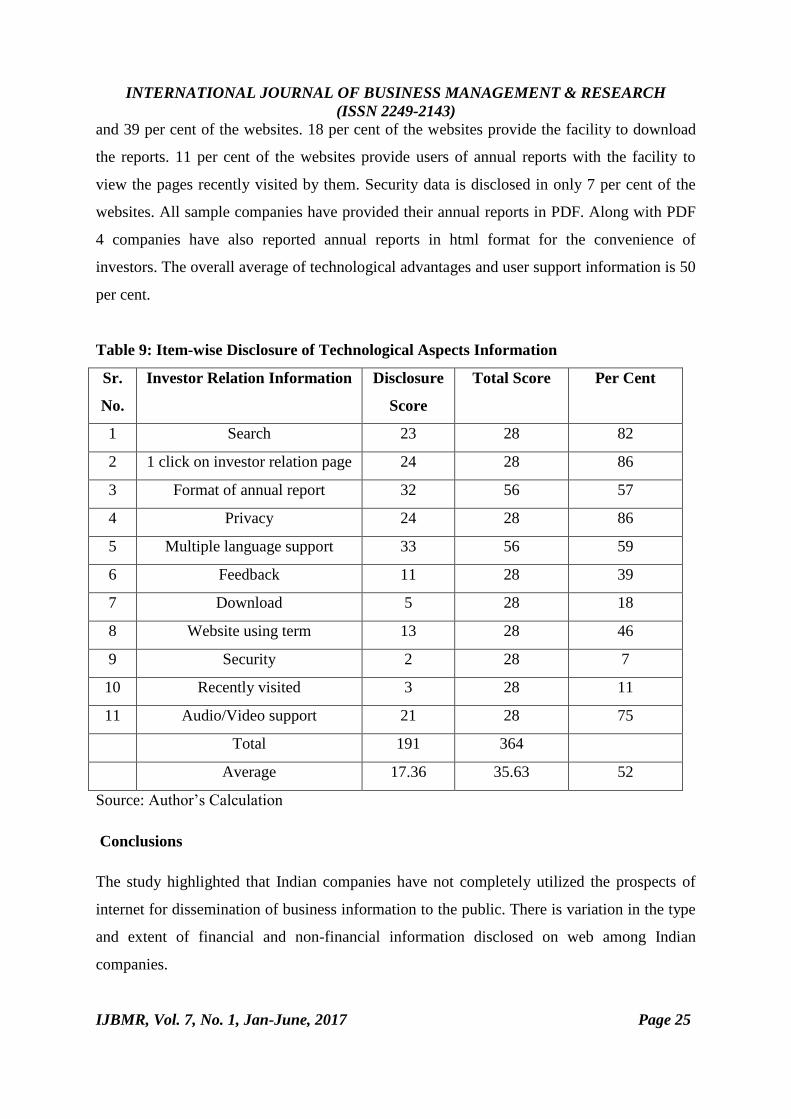
Technological Advantages & User Support Information
The table 9 shows that 86 per cent of the companies provide a single click to reach to the
investor relation page and 82 per cent of the companies provide search engine. Privacy
information is disclosed by 86 per cent of the companies.75 per cent of the companies
provide investors with audio and video support. English is used as a medium of
communication. Few companies belonging to public sector companies give an option to view
the websites in Hindi. Website using terms and Feedback Option is available on 46 per cent
IJBMR, Vol. 7, No. 1, Jan-June, 2017 Page 24
INTERNATIONAL JOURNAL OF BUSINESS MANAGEMENT & RESEARCH
(ISSN 2249-2143)
and 39 per cent of the websites. 18 per cent of the websites provide the facility to download
the reports. 11 per cent of the websites provide users of annual reports with the facility to
view the pages recently visited by them. Security data is disclosed in only 7 per cent of the
websites. All sample companies have provided their annual reports in PDF. Along with PDF
4 companies have also reported annual reports in html format for the convenience of
investors. The overall average of technological advantages and user support information is 50
per cent.
Table 9: Item-wise Disclosure of Technological Aspects Information
Sr.
No.
Investor Relation Information Disclosure
Score
Total Score Per Cent
1 Search 23 28 82
2 1 click on investor relation page 24 28 86
3 Format of annual report 32 56 57
4 Privacy 24 28 86
5 Multiple language support 33 56 59
6 Feedback 11 28 39
7 Download 5 28 18
8 Website using term 13 28 46
9 Security 2 28 7
10 Recently visited 3 28 11
11 Audio/Video support 21 28 75
Total 191 364
Average 17.36 35.63 52
Source: Author’s Calculation
Conclusions
The study highlighted that Indian companies have not completely utilized the prospects of
internet for dissemination of business information to the public. There is variation in the type
and extent of financial and non-financial information disclosed on web among Indian
companies.
IJBMR, Vol. 7, No. 1, Jan-June, 2017 Page 25

INTERNATIONAL JOURNAL OF BUSINESS MANAGEMENT & RESEARCH
(ISSN 2249-2143)
The information such as balance sheet, profit and loss account, news, product and services
and career related information is disclosed by all companies.
SUGGESTIONS
1. The corporate reporting on website should be standardized.
2. There is need for convergence of Indian accounting standards with International
accounting standards so as to provide real benefits of web reporting to the users.
3. The auditor’s report should be attached along with the disclosure of financial
information to make it more reliable.
4. The companies should provide important information at the home page level. This
will provide ease to the user in accessing the financial information on the websites.
5. The companies should provided information on their websites in both English and the
national language (Hindi). As it may be difficult for the local users to understand the
information provided in English language.
6. The companies are recommended that efforts should be made to make websites
technologically sound. Also, there is need to make websites more interactive and user
friendly.
References
Ashbaugh et. al (1999). Corporate reporting on the Internet. Accounting Horizons, 13(3):241-
257.
Bhardwaj and Kumar (2011). Web Based Corporate Reporting Practice in India. Vision
Catalyst - An International Journal for Management, IT & Communication, 1(1).
Kumar and Jain (2012). Corporate Financial Reporting on Internet- A Study of BSE Sensex
Companies. Pacific Business Review International, 4(3).
Malhotra and Makkar (2012). A Study of Corporate Web Reporting Practices in India. IUP
Journal of Corporate Governance, 11(1):7-19.
Sharma (2013). Web Based Disclosures and Their Determinants: Evidence from Listed
Commercial Banks in Nepal. Accounting and Finance Research, 2 (3).
Verma (2010). Web-Based Business Reporting Indian Corporate Sector. Journal of
Knowledge Management Practices, 11(1).
IJBMR, Vol. 7, No. 1, Jan-June, 2017 Page 26

INTERNATIONAL JOURNAL OF BUSINESS MANAGEMENT & RESEARCH
(ISSN 2249-2143)
Issue and challenges faced by regulatory framework with special reference to scam-
An Analytical study
Nidhi Jain & Vanishka Chabbra
Abstract
The emergence of new technologies in the era of globalization and liberalization entirely
changed the nature of business transactions. By the evolution of business life cycles business
transactions became very complex and managing risk became a challenging task for the
organizations. Concerns about corporate governance in India were, however, largely
triggered by Harshad Mehta stock market scam of 1992 followed by incidents of companies
allotting preferential shares to their promoters at deeply discounted prices and also the
recent scam of sat -yam. The aim of "Good Corporate Governance" is to ensure commitment
of the board in managing the company in a transparent manner for maximizing long-term
value of the company for its shareholders. The paper intends to present the various
corporate scam occurred in India and also highlight the regulatory framework for regulating
the corporate governance in India and failure of regulatory Framework in governing the
corporate which leads to occurrence of scam and also the recommendations for better
corporate governance practices in India.
Key words: Corporate Governance, Governance, Mechanism, Scam, Regulating, India.
Introduction
“In the happiness of the subject lies the benefit of the king, and in what is beneficial to
the subjects is his own benefit”.India’s Journey of Corporate Governance’’ -
Kautilya’s Arthashstra
It is a process set up for the firms based on certain systems and principles by which a
company is governed. The guidelines provided ensure that the company is directed and
controlled in a way so as to achieve the goals and objectives to add value to the company and
also benefit the stakeholders in the long term. . It is about commitment to values, about
ethical business conduct and about making a distinction between personal and corporate
funds in the Management of the Company.
Corporate Scam is one of the Most Bad Things Happen in Corporate World. It Totally
Destabilizes the Corporate Sector and Makes a Untruthful environment for investors in the
corporate world. In India, there are lots of big corporate scams happened in the Past.The high
profile corporate governance failure scams like the stock market scam, Ketan Parikh scam,
Satyam scam, which was severely criticized by the shareholders, called for a need to make
corporate governance in India transparent as it greatly affects the development of the country.
Nearly Over 250 Scam have Occurred in India Since 1947 and Approximately
Rs.910,603,234,300,000 Which is Equal to 20.23 Trillion US Dollar has been lost.
IJBMR, Vol. 7, No. 1, Jan-June, 2017 Page 27
INTERNATIONAL JOURNAL OF BUSINESS MANAGEMENT & RESEARCH
(ISSN 2249-2143)
Indian Scam History Started from the 1940’s When in 1948 – Jeep scandal case and in 1947
– INA treasure chest disappearance Scam Happened. To achieve the objectives of ensuring
fair corporate governance, the Government of India has put in place a statutory framework
and various committees have been formed globally to improve the effectiveness of corporate
governance.
Objectives of the study
1. To highlight the various corporate scams occurred in India.
2. To highlight the regulatory framework for regulating the corporate governance in India
3. To highlight the Failure of Regulatory framework in governing the corporate this leads to
occurrences of scam.
4. To give Recommendations for better corporate governance practices in India.
Corporate Scams Occurred in India
1. Harshad Mehta Scam(1992).
It is one of the most technical and done with very cleverness Scam in the year 1992.This
scam takes all the advantage of loopholes in the Indian share market. Harshad Mehta was an
intelligent Broker and he knew the exact loopholes with the Indian economy and the banking
system. In terms of Value, This Scam is About a sum of Rs 4000 crore. The Immediate
impact of Harshad Mehta scam was sharp fall in share prices and indices. Due to Harshad
Mehta scam market loss 0.1 million crore loss in terms of market capitalization. Then
Government liberalization policy comes under various criticisms. SEBI Postponed
sanctioning of Private sector Mutual Fund. The Euro-Issues Planned by various companies
were delayed due to Harshad Mehta scam.
2. C. R Bhansali Scam(1992-1996)
Chain Roop Bhansali Shortly known as C.R Bhansali scam occurred in 1995.The C.R
Bhansali scam was of Rs.1200 Crore, Which is the huge amount of the time of 1995.C.R
Bhansali Collecting all money through his mutual fund company and transferring all amount
to Non-Existing Company. Bhansali had floated 133 companies to pull in funds and suck
them out.
3. Cobbler Scam (1995).
Borrowing Loan From Banks in the Names of Fictitious/Non-Existence Cooperative Society
of Shoe Makers. The Cobbler Scam is one of the biggest million dollars scams in Indian
History, is nicknamed The Great Cobbler Scam. This Great Cobbler Scam was that various
businessman & politicians had siphoned around $600 million US dollars from a scheme that
was running by the Government of India meant to benefit the poor cobblers of Mumbai.
IJBMR, Vol. 7, No. 1, Jan-June, 2017 Page 28
INTERNATIONAL JOURNAL OF BUSINESS MANAGEMENT & RESEARCH
(ISSN 2249-2143)
The money of the scheme was meant to provide low-interest loans and tax grants to the
Mumbai’s poorest – cobblers who work 16-hours a day for less than $2. Not single money
reached these cobblers.
4. Ketan Parekh Scam(1999-2001)
Ketan Parekh is also Described as Pied Piper of Dalal Street. Ketan Parekh was Trainee of
Harshad Mehta. Currently, Ketan Parekh debarred from trading in Indian share market till
2017. His financing method was very simple. he bought a share when they traded at a low
price and when the price was high enough he pledges to share with the bank as collateral for
Funds and he also borrowed from various companies like HCFL. The amount involved in the
scam was Rs.1500 crore. Impact:-One of the biggest falls in Bombay stock exchange-700
points, short selling was banned for 6 months, options and future index derivatives were
introduced.
5. Sanjay Agrawal Scam(2001)
Sanjay Aggarwal was CEO Of Home Trade Company. He Launched Home Trade in the year
2000. He Spends nearly Rs.240 million on advertising and advertisements were done by big
stars like Shahrukh khan,Sachin Tendulkar’s and Hrithik Roshan. After Gaining Trust and
Popularity he Swindled rs. 600 crore from more than 25 cooperative banks. The government
securities (gilt) scam of 2001 was exposed when the Reserve Bank of India checked the
accounts of some cooperative banks following unusual activities in the gilt market. Co-
operative banks and brokers acted in collusion in a bid to make easy money at the cost of the
hard earned savings of millions of Indians.
6. Dinesh Dalmia Scam(2001)
Scam Industry-Information Technology, amount Involved in Scam-595 crores.
Trading in Share Which is not listed in Stock Exchanges. Dinesh Dalmia was a promoter and
managing director of DSQ Software limited. Dinesh Dalmia was involved of criminal breach
of trust, cheating, and fraud is claimed to have induced National Securities Depository
Limited (NSDL) to dematerialize and credit 130 lakh equity shares of the software company
as fully paid shares.The shares were transferred allegedly by Mr. Dalmia to his front
companies and entities without payment of sale considerations.
7. Satyam Scam (2009)
It is regarded as “Debacle of Indian Financial System”. This scam was clear cut example of
how an investor can lose is money by simply misstating the Balance Sheet of the company.
Protagonist – B Ramalinga Raju & others, Amount – Rs. 8000 Cr. Satyam was one of the
biggest accounting scandals where protagonist Ramalinga Raju Accepts that he Cooked up
Accounts of Satyam Computers and inflated Satyam computers bank balances and
Accounting Entries. He and his family members have also been accused of money laundering
through hundreds of companies.
IJBMR, Vol. 7, No. 1, Jan-June, 2017 Page 29
INTERNATIONAL JOURNAL OF BUSINESS MANAGEMENT & RESEARCH
(ISSN 2249-2143)
8. Speak Asia Scam (2011)
Protagonists: Harinder Kaur, Manoj Kumar Sharma, Tarak Bajpai & others, Amount – Rs.
2000 + Cr. An online business survey firm that collected thousands of crores of rupees from
over 24 lakh investors, asking them to fill surveys and guaranteeing to quadruple their
income in one year, speak Asia was accused of running a Ponzi scheme. Some accounts
frozen and its business shutdown.
9. Saradha Chit Fund Scam(2013)
Protagonist – Sudipta Sen Amount – Rs.4000 crore. It’s about fake collective investment
scheme and it is one of the biggest Ponzi schemes. Shraddha scam also enjoys big political
patronage. The chit fund ultimately collapsed leading to defaults after a crackdown by SEBI
and the Reserve Bank of India. The default, apart from leaving small depositors high and dry,
also led to 10 media terminals owned by Saradha being forced to wind up, leaving 1000
journalists jobless.
10. PACL Scheme Scam.(2015)
Lures near 55 million investors by the technique of raising money against bogus and
allotment letters. Money Involved-Near Rs.47000 crore. The matter involves the alleged
collection of about 450 billion rupees ($6.8 billion) from roughly 55 million investors across
the country.
Regulatory framework on corporate governance
1. The Companies Act, 2013 inter alia contains provisions relating to board constitution,
board meetings, board processes, independent directors, general meetings, audit committees,
related party transactions, disclosure requirements in financial statements, etc.
2. Securities and Exchange Board of India (SEBI) Guidelines: SEBI is a regulatory
authority having jurisdiction over listed companies and which issues regulations, rules and
guidelines to companies to ensure protection of investors.
3. Accounting Standards issued by the Institute of Chartered Accountants of India
(ICAI): ICAI is an autonomous body, which issues accounting standards providing
guidelines for disclosures of financial information. Section 129 of the New Companies Act
inter alia provides that the financial statements shall give a true and fair view of the state of
affairs of the company or companies, comply with the accounting standards notified under s
133 of the New Companies Act. It is further provided that items contained in such financial
statements shall be in accordance with the accounting standards.
4. Secretarial Standards issued by the Institute of Company Secretaries of India (ICSI):
ICSI is an autonomous body, which issues secretarial standards in terms of the provisions of
the New Companies Act. So far, the ICSI has issued Secretarial Standard on "Meetings of the
Board of Directors" (SS-1) and Secretarial Standards on "General Meetings" (SS-2). These
IJBMR, Vol. 7, No. 1, Jan-June, 2017 Page 30
INTERNATIONAL JOURNAL OF BUSINESS MANAGEMENT & RESEARCH
(ISSN 2249-2143)
Secretarial Standards have come into force w.e.f. July 1, 2015. Section 118(10) of the New
Companies Act provide that every company (other than one person company) shall observe
Secretarial Standards specified as such by the ICSI with respect to general and board
meetings.
5. The Companies Act, 2013: The Government of India has recently notified Companies
Act, 2013 ("New Companies Act"), which replaces the erstwhile Companies Act, 1956. The
New Act has greater emphasis on corporate governance through the board and board
processes. The New Act covers corporate governance through its following provisions:
Introduce significant changes to the composition of the boards of directors.
Every company is required to appoint 1 (one) resident director on its board.
Nominee directors shall no longer be treated as independent directors.
Listed companies and specified classes of public companies are required to appoint
independent directors and women directors on their boards.
The first time codifies the duties of directors.
The Listed companies and certain other public companies shall be required to appoint
at least 1 (one) woman director on its board.
SEBI has amended the Listing Agreement with effect from October 1, 2014 to align it
with New Companies Act. Clause 49 of the Listing Agreement can be said to be a
bold initiative towards strengthening corporate governance amongst the listed
companies. This Clause intends to put a check over the activities of companies in
order to save the interest of the shareholders. Broadly, clause 49 provides for the
following: Board of Directors, Audit Committee, Disclosure Requirements CEO/
CFO Certification, Report and Compliance.
Failures of regulatory framework in governing the corporate which leads to occurrence
of scam
1. No Proper Structure
It is true that the ‘corporate governance’ has no unique structure or design and is largely
considered ambiguous. There is still lack of awareness about its various issues, like, quality
and frequency of financial and managerial disclosure, compliance with the code of best
practice, roles and responsibilities of Board of Directories, shareholders rights, etc. There
have been many instances of failure and scams in the corporate sector, like collusion between
companies and their accounting firms, presence of weak or ineffective internal audits, lack of
required skills by managers, lack of proper disclosures, non-compliance with standards, etc.
As a result, both management and auditors have come under greater scrutiny.
2. No Government Support
Recent corporate scandals have led to public pressure to reform business practices and
increase regulation. The public outcry over the recent scandals has made it clear that the
status quo is no longer acceptable: the public is demanding accountability and responsibility
in corporate behavior. The recent scandals themselves demonstrate that lax regulatory
institutions, standards, and enforcement can have huge implications for the economy and for
the public.
IJBMR, Vol. 7 No. 1, Jan-June, 2017 Page 31
INTERNATIONAL JOURNAL OF BUSINESS MANAGEMENT & RESEARCH
(ISSN 2249-2143)
3. Insider Trading
Corporate insiders like officers, directors and employees by the virtue of their position have
access to confidential information about the corporation and may misappropriate that
information to reap profits. In most countries, trading by corporate insiders such as officers,
key employees, directors, and large shareholders may be legal, if this trading is done in a way
that does not take advantage of non-public information.
Section 17 Securities Exchange Act, 1933 contained prohibitions to deal with the fraud in the
sale of the securities in the most stringent manner possible. The Act addressed insider trading
directly through Section 16(b) and indirectly through Section 10(b). Section 16(b) of the
Securities Exchange Act, 1934 prohibits the purchase and sale of the shares within six month
Period involving the directors, officers, stock holders owning more than 10% of the shares of
the company. The rationale behind the incorporation of this provision is that it is only the
substantial shareholders and the persons concerned with the decision and management of the
company who can have access to the price sensitive information and therefore there should be
bar upon them to transact in securities.
4. Other Weaknesses
Family-owned business- Family-owned companies are characterized as organizations
in which the shareholders belong to the same family and participate substantially in the
management, direction, and operation of the company. A family business refers to a
company where the voting majority is in the hands of the controlling family; including
the founder(s) who intend to pass the business on to their descendants.
Many Indian businesses are old family establishments and while controlling
shareholders may welcome cash infusions by outside investors, but they may hesitate
to relinquish control. It becomes difficult for outsiders to track the business realities of
individual companies. Family control also brings governance problems – not least of
which are a lack of checks and balances over executive decision making and behavior,
and a lack of transparent reporting to the outside world.
Compliance with disclosure norms and even the failure of auditor’s reports to conform
to the law attract nominal fines with hardly any punitive action. The Institute of
Chartered Accountants in India has not been known to take action against erring
auditors.
While the Companies Act provides clear instructions for maintaining and updating
share registers, in reality minority shareholders have often suffered from irregularities
in share transfers and registrations – deliberate or unintentional.
Sometimes non-voting preferential shares are used by promoters to channel funds and
deprive minority shareholders of their dues.
Minority shareholders have sometimes been defrauded by the management
undertaking clandestine side deals with the acquirers in the relatively scarce events of
corporate takeovers and mergers.
Misleading financial statements- There are many ways to present factually accurate
information on a financial statement in a manner that is misleading to investors
IJBMR, Vol. 7, No. 1, Jan-June, 2017 Page 32
INTERNATIONAL JOURNAL OF BUSINESS MANAGEMENT & RESEARCH
(ISSN 2249-2143)
The Harshad Mehta stock market scam of 1992 concerns about corporate governance
stemming from the corporate scandals as well as opening up to the forces of
competition and globalization gave rise to several investigations into the ways to fix
the corporate governance situation in India.
One of the big problems with Indian corporate governance is that too many listed
companies and directors follow the letter of the law, rather than the spirit.
‘Good people are very few’ partly because there is a legal limit on the amount
companies can pay non-executives. They are not allowed to receive a salary and can
only be paid for attendance at board meetings that gives the non-executives little
incentive to fulfill their obligations properly.
Directors’ remuneration needs a rethink, as does the process of appointing directors.
Currently, non-executives are generally selected by the board, with little input from
shareholders – they should become more active.
Recommendations (Improving Standards)
Preventing insider trading by devising an internal procedure for adequate and timely
disclosures and specific rules for the conduct of insiders and the power to punish
offenders. SEBI should show seriousness about checking insider trading and there
should be a separate code by itself.
Organisation for Economic Co-operation and Development (OECD) lays down certain
principles for reforming corporate governance. They are-The right of shareholders-
These include a set of rights including secure ownership of their shares, the right to full
disclosure of information, voting rights, participation in decisions.
The Equitable Treatment of Shareholders- Here the OECD is concerned with
protecting minority shareholders rights by setting up systems that keep insiders,
including managers and directors, from taking advantage of their positions.
The Role of Stakeholders in Corporate Governance- the OECD recognizes that there
are other stakeholders in companies in addition to shareholders whose rights needs to
be protected on being associated with the company.
New method for the appointment of Independent Director is required.
Independent directors- selection criteria must be transparent; also process of
appointment of BOD must be reconsidered.
It is important to focus on not just Quantity or profits but on the sustainability of
business models.
Need for having supervising the functions of management and make them accountable
and transparent to shareholders.
To revise clause 49 of SEBI listing Agreement.
Codes of conduct and whistle blower policies must be framed in such a way as to be
possible to put in to practice.
IJBMR, Vol. 7, No. 1, Jan-June, 2017 Page 33
INTERNATIONAL JOURNAL OF BUSINESS MANAGEMENT & RESEARCH
(ISSN 2249-2143)
Conclusions
At present, corporate governance reforms in India are at a crossroads. One must, however,
understand that no matter how strong a regulatory system is, it cannot always prevent frauds.
Despite the enormous increase of disclosures and stringent risk management systems scams
do take place. Moreover, strong measures often lead to expensive regulations and defiance.
There are limits to legislations as a lot depends on the integrity and ethical values of various
corporate players such as directors, promoters, executives and shareholders. The key lies in
management decisions and its commitment to establish and follow rigorous governance
systems while corporate governance codes have been drafted with a deep understanding of
the governance standards around the world, there is still a need to focus on developing more
appropriate solutions that would evolve from within and therefore address the India specific
challenges more efficiently.
References
Vaish Associates Advocates (2016). India: Corporate Governance Framework In
India: http://www.mondaq.com [online] January 8, 2016 available from
http://www.mondaq.com/india/x/456460/Shareholders/Corporate+Governance+Fram
ework+In+India [Accessed: January 8, 2016]
Sourav Pathak 10 Biggest Corporate Scam of India http://googleweblight.com
[Online] Available from
http://googleweblight.com/i?u=http://www.thecsclubindia.com/10-biggest-corporate-
scam-of-india/&grqid=BlLkPi-U&hl=en-ln .
Nikhil Inamdar (2013) India's top 5 corporate scams stuck in judicial quagmire
http://www.business-standard.com [Online] October 30, 2013 Available from
http://www.business-standard.com/article/companies/india-s-top-5-corporate-scams-
stuck-in-judicial-quagmire-113103000230_1.html [Accessed: Oct 30, 2013]
www.investopedia.com/terms/c/corporategovernance.asp
S. Chaitanya Shashank, Nilika Kumar (2015) Weaknesses of Corporate Governance
in India http://www.lawctopus.com com [Online] January 12, 2015 Available
from http://www.lawctopus.com/academike/corporate-governance-in-india/[
Accessed : january12, 2015]
RUJITHA T R (2012), ‘CHALLENGES TO CORPORATE GOVERNANCE:
ISSUES AND CONCERNS’’. International Journal of Marketing, Financial Services
& Management Research review, Vol.1, december2012, pp 96-101.
Eravandi (2009) Corporate Governance in India http://eravandi.blogspot.in com
[Online] October 26, 2009 Available from
http://eravandi.blogspot.in/2009/10/corporate-governance-2.html [ Accessed: October
IJBMR, Vol. 7, No. 1, Jan-June, 2017 Page 34
INTERNATIONAL JOURNAL OF BUSINESS MANAGEMENT & RESEARCH
(ISSN 2249-2143)
Problems and Challenges of Small and Medium Enterprises in India
Neha Kapoor & Pankaj Kumar
Assistant Professor, Desh Bhagat University, Mandi Gobindgarh
Abstract
Small and medium enterprises or SME’S accounts for considerable share of industrial
enterprises, employment and production in India. Small business has low capital investment
and therefore the risk of the entrepreneur is limited and he can afford to be venturesome.
Moreover small businesses have a small gestation period so returns are also quick. The
flexibility inherent in this sector allows the entrepreneur to work aggressively if a project
seems promising or change course in case things do not work out. In his manner the small
business functions as a nursery for developing entrepreneurial talent.
Keywords: Small and Medium Enterprises, Challenges, India
Introduction
Entrepreneurship has acquired a special significance in the context of economic growth and
industrial development in the rapidly changing socioeconomic and socio-cultural climates
both in developed and developing countries. Most of the students of MBA aspire to become
entrepreneur rather than an employee in any organisation. One of the way of achieving this is
to analyse the environment critically and the study the problems faced by the entrepreneurs.
With this purpose in mind, a study on the problems and challenges faced by the small scale
entrepreneurs is analysed. Problems of these entrepreneurs of these are analysed from various
angles-production, marketing, finance, labour and infrastructural. While the challenges are
effectively tackled by the entrepreneurs, the result in terms of profits, need to be more
rewarding.
Small and medium enterprises or SME’S accounts for considerable share of industrial
enterprises, employment and production in India. It is essential to sustain this sector because
it generate employment in a depressed manner across country-in cities, towns as well as
villages; it prevents concentration of economic power and it contributes to economic
development through a wide variety of production activities by utilizing the dispersed
resources,which might otherwise remain unutilized.Therefore,SMEs occupy a place of
strategic importance in the INDIAN economy.
IJBMR, Vol. 7, No. 1, Jan-June, 2017 Page 35

INTERNATIONAL JOURNAL OF BUSINESS MANAGEMENT & RESEARCH
(ISSN 2249-2143)
However the economic environment in SMEs operate-domestic as well as international-has
undergone a radical transformation since 1991.As a result, SMEs have been exposed to
intensive competition like never before. Therefore, it is imperative for SMEs to strengthen
their competiveness for survival and growth. Among others, technology is one factor that
contributes decisively to building competitiveness in industries as well as nations.
Technology progress has been the key driving force in industrialized countries,accounting for
a lion’s share of productivity growth. Technological advancement has enabled newly
industrializing econmies such as Japanese, Korean,Chinese,American and European.The
economic environment in which Indian SMEs are functioning today,global changes do affect
them as much as local developments. Attaching due signifance to technology development is
absolutely to their competitiveness.
To understand the need and significance of technology development in INDIAN SMEs in a
proper prespective,it is essential to analyse their performance and problems in the light of
policy changes that have taken place in the country and elsewhere.
An Overview of Economic Growth and Industrialization
To begin with, it is necessary to examine the major policy changes-local and global-that have
implications for SMEs and would have an impact on SMEs performance in the 1990s.After
doing so, strategies need to be suggested to address their crucial problems to build
competitiveness for the better performance. The economic environment in India has
undergone a major transformation since 1990-91 when a balance of payments crisis was used
by the Government of India as an opportunity to launch wide ranging economic reforms in
the industrial and trade policy regime. Indian industry has been increasingly subjected to
competition from imports as well as domestic deregulation, and the private sector has been
given larger scope for contributing to the growth process.
What is important is to know how significant were SMEs in the Indian industrial scenario
prior to 1991 in terms of number of enterprises, fixed capital investment,employment,
production and gross value added. Equally important to find out whether their relative status
has undergone any change or not. A state like Punjab has been in the forefront of the Green
Revolution that helped liberate the nation from the perpetual threat of hunger and famine.
The extensively developed farm sector provides a wealth of opportunity for industries that
IJBMR, Vol. 7, No. 1, Jan-June, 2017 Page 36
INTERNATIONAL JOURNAL OF BUSINESS MANAGEMENT & RESEARCH
(ISSN 2249-2143)
use agricultural produce. Broadly, there is need to harness science and technology, and design
policy to conserve both water and land and improve on their productive potential for
agriculture as well as industry. Conserving water is one of the most fundamental challenges
facing the economy of Punjab. The answer lies not only in science and technology but also in
the industrial strategy adopted by the state. To build successful agricultural diversification, it
is necessary to define an industrial strategy which can exploit agricultural linkages and also
encourage the process of agricultural diversification.
Role of the State Government
The state governments have acquired a very important role in the new
environment in attracting private investment through creating competitive conditions for
investment in their states. This includes facilitating infrastructure development and skill
development as well as enhancing the case of doing business by ensuring good governance,
administrative efficiency and maintaining law and order. In particular, since the state
governments have the primary responsibility for education and health, and these services are
at the base of human resource development, the state governments can attract private
investment by being proactive in developing skills and creating the knowledge base which
can sustain high economic growth and generate productive employment for skilled labor.
Punjab has not done well in the new economic environment. This report makes
recommendations for an industrial strategy for Punjab which enables the state to make up for
lost time and realise its economic potential.
State of finances
Before presenting an overview of economic growth in Punjab, this section
presents an overview of the state of government finances. Punjab has had large and persistent
fiscal deficits and revenue deficits right from the early 1980s. In fact, Punjab's fiscal and
revenue deficits have been consistently much higher than the average of all states . Even
during the recent period between 2001-02 and 2005-06 when there has been some
improvement, the deficits remained high and were consistently above the average for all
states.
There was a major deterioration in the fiscal balance of Punjab in 2006-07 when fiscal deficit
reached 3.6 per cent of GSDP and the revenue deficit 1.4 per cent. The revised estimates for
IJBMR, Vol. 7, No. 1, Jan-June, 2017 Page 37

INTERNATIONAL JOURNAL OF BUSINESS MANAGEMENT & RESEARCH
(ISSN 2249-2143)
2007-08 show some improvement. However, with revenue deficit at 0.9 per cent of GSDP
and fiscal deficit at 3.2 per cent of GSDP in 2007-08, and projected at 0.7 per cent and 2.9
per cent, respectively in 2008-09, Punjab will still not meet the targets of the Fiscal
Responsibility and Budget Management Act which stipulates that by 2008-09, each state
should phase out the revenue deficit and compress its fiscal deficit to 3 per cent of GSDP.
Punjab's own effort at tax mobilisation has been among the weakest of the major states. In
1994, Punjab’s own tax revenue to GSDP ratio was 7.6 per cent, while that of Haryana was
7.2 per cent. In 2006-07, Haryana reached 9 per cent, while Punjab was still at 7.6 per cent.
There have been some regressive decisions in Punjab in recent years, e.g., substantial
lowering / removal of property taxes. Punjab was also one of the last states to remove Octroi,
although octroi is still levied on electricity. Since Octroi was replaced by LADT (Local Area
Development Tax), the information centres at the boarder continue to act as “extortion
points”, significantly impending the movement of goods.
Office of the Development Commissioner
M/O Micro & Small Enterprises Cluster Development Programme
(Statistics & Data Bank Division)
Table 1: Performance Of Micro & Small Enterprises
Year
Number of Enterprises (Lakh
Nos.) Empl.
(Lakh
Person)
Production
(Rs. Crs.) Growth
Share
In
Registered Unregistered Total at Current
prices
Rate
(%)
GDP
(%)
2002-2003 15.91 93.58 109.49 263.49 314850 8.68 5.92
2003-2004 16.97 96.98 113.95 275.30 364547 9.64 5.79
2004-2005 17.53 101.06 118.59 287.55 429796 10.88 5.84
2005-2006 18.71 104.71 123.42 299.85 497842 12.32 5.83
2006-2007 20.98 107.46 128.44 312.52 587196 12.65 5.94
2007-2008
(Projected) 24.68 108.99 133.67 322.28 695126 13.00 NA
IJBMR, Vol. 7, No. 1, Jan-June, 2017 Page 38

INTERNATIONAL JOURNAL OF BUSINESS MANAGEMENT & RESEARCH
(ISSN 2249-2143)
Table 2: Exports From Small Scale Sector
Item
Year
2000-
2001
2001-
2002
2002-
2003 2003-2004 2004-2005 2005-2006
Total
Exports
(Rs. Crore)
202510 207769 252137 291582 375339.52 456417.88
Exports
from SSI
Sector (Rs.
Crore)
69797 71244 86013 97644 124416.56 150242.03
Share of
SSI sector
in total
exports (%)
34.47 34.29 34.03 33.49 33.15 32.92
Growth rate
in Exports
(%)
28.78 2.07 20.73 13.52 27.42 20.76
Table 3: Details of Existing Micro & Small Enterprises and Artisan Units in the
District
Code Types of Industry Units (No.) Employment
(No.)
Investment
(Rs. Lakh)
Production
(Rs. Lakh)
15 Mfg. of Food
Products
Beverages
199 1296 1766.79 29175.00
17 Mfg. of Textiles 24 63 55.20 446.00
18 Mfg. of Wearing
Apparels
9 31 5.09 16.65
19 Leather & Leather
Products
85 165 18.25 68.00
20 Mfg. of Wood
Products
34 185 243.30 1768.00
21 Mfg. of Paper &
Paper Products
5 39 22.00 195.00
22 Printing /
Publishing
12 19 33.55 29.00
24 Chemicals &
Chemical Products
27 309 1037.62 4065.00
25 Rubber & Plastic
Products
12 57 94.75 566.00
26 Other Non-
Metallic Products
27 778 860.57 2941.00
27 Basic Metals 429 10430 19815.51 197492.00
28 Fabricated Metal
Products
97 659 940.19 4815.00
29 Machinery &
Equipments
315 1618 1008.48 9531.00
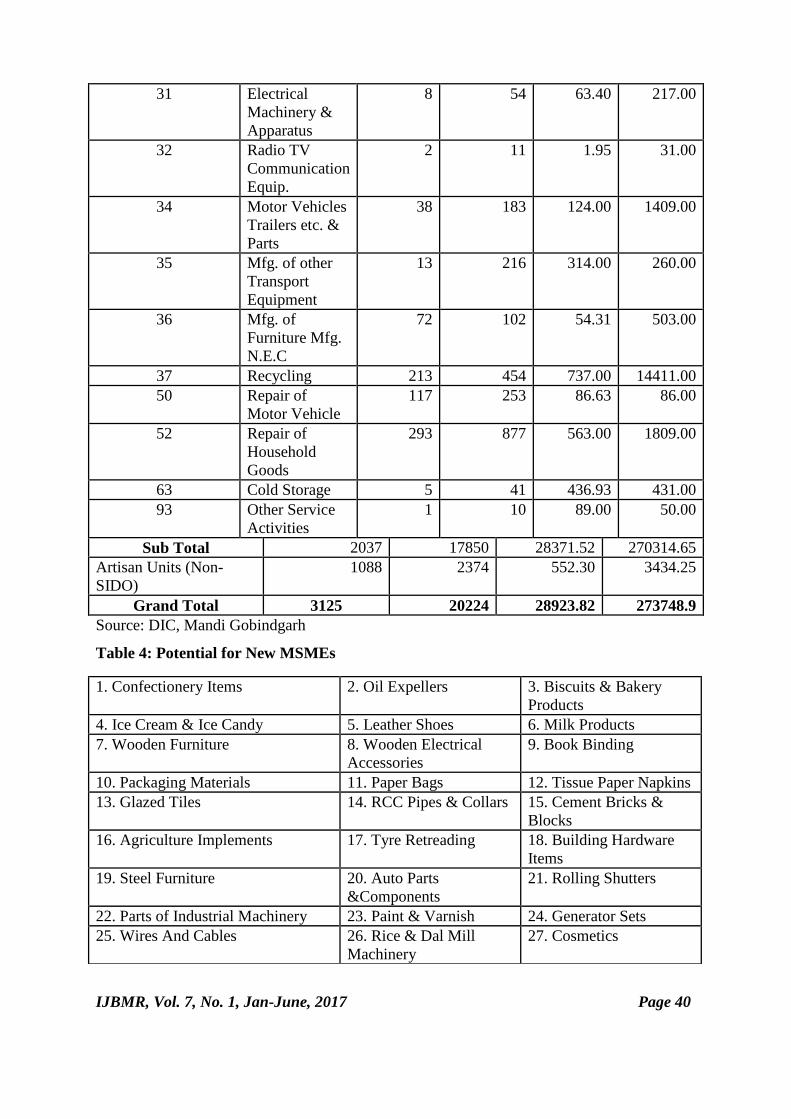
31 Electrical
Machinery &
Apparatus
8 54 63.40 217.00
32 Radio TV
Communication
Equip.
2 11 1.95 31.00
34 Motor Vehicles
Trailers etc. &
Parts
38 183 124.00 1409.00
35 Mfg. of other
Transport
Equipment
13 216 314.00 260.00
36 Mfg. of
Furniture Mfg.
N.E.C
72 102 54.31 503.00
37 Recycling 213 454 737.00 14411.00
50 Repair of
Motor Vehicle
117 253 86.63 86.00
52 Repair of
Household
Goods
293 877 563.00 1809.00
63 Cold Storage 5 41 436.93 431.00
93 Other Service
Activities
1 10 89.00 50.00
Sub Total 2037 17850 28371.52 270314.65
Artisan Units (Non-
SIDO)
1088 2374 552.30 3434.25
Grand Total 3125 20224 28923.82 273748.9
Source: DIC, Mandi Gobindgarh
Table 4: Potential for New MSMEs
IJBMR, Vol. 7, No. 1, Jan-June, 2017 Page 40
1. Confectionery Items 2. Oil Expellers 3. Biscuits & Bakery
Products
4. Ice Cream & Ice Candy 5. Leather Shoes 6. Milk Products
7. Wooden Furniture 8. Wooden Electrical
Accessories
9. Book Binding
10. Packaging Materials 11. Paper Bags 12. Tissue Paper Napkins
13. Glazed Tiles 14. RCC Pipes & Collars 15. Cement Bricks &
Blocks
16. Agriculture Implements 17. Tyre Retreading 18. Building Hardware
Items
19. Steel Furniture 20. Auto Parts
&Components
21. Rolling Shutters
22. Parts of Industrial Machinery 23. Paint & Varnish 24. Generator Sets
25. Wires And Cables 26. Rice & Dal Mill
Machinery
27. Cosmetics

Details of Existing Micro & Small Enterprises and Artisan Units in the District
LUDHIANA:
Code Types of
Industry
Units
(No.)
Employment
(No.)
Investment
(Rs. Lakh)
Production
(Rs. Lakh)
15 Mfg. of Food
Products
Beverages
918 8226 8214 59653
17 Mfg. of
Textiles
6750 93065 44668 483257
18 Mfg. of
Wearing
Apparels
1133 13126 7779 286543
19 Leather &
Leather
Products
2460 11036 1753 8318
20 Mfg. of Wood
Products
467 3470 1566 5849
21 Mfg. of Paper
& Paper
Products
412 3587 2754 16475
22 Printing /
Publishing
324 1700 805 2302
23 Coke &
Refined
Petroleum
Prod.
12 97 186 789
24 Chemicals &
Chemical
Products
606 4124 3465 19484
25 Rubber &
Plastic Products
744 5361 4126 18436
26 Other Non-
Metallic
Products
226 2490 941 8839
27 Basic Metals 1156 16210 13978 304658
28 Fabricated
Metal Products
3547 25106 11392 93689
29 Machinery &
Equipments
3200 28852 14775.10 181521
30 Analog Data
Processing
Machinery
6 85 33 1271
31 Electrical
Machinery &
Apparatus
179 1744 1261 6961
32 Radio TV
Communication
Equip.
314 2222 725 14515
33 Medical 28 403 117 791
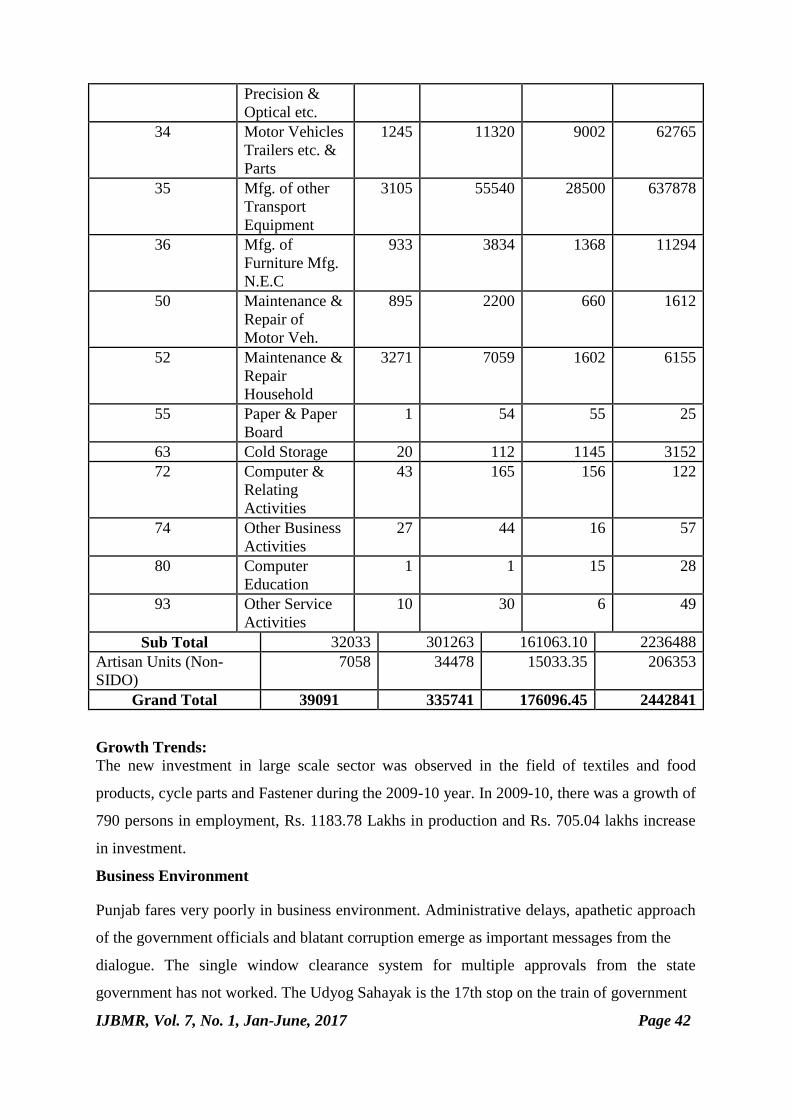
Precision &
Optical etc.
34 Motor Vehicles
Trailers etc. &
Parts
1245 11320 9002 62765
35 Mfg. of other
Transport
Equipment
3105 55540 28500 637878
36 Mfg. of
Furniture Mfg.
N.E.C
933 3834 1368 11294
50 Maintenance &
Repair of
Motor Veh.
895 2200 660 1612
52 Maintenance &
Repair
Household
3271 7059 1602 6155
55 Paper & Paper
Board
1 54 55 25
63 Cold Storage 20 112 1145 3152
72 Computer &
Relating
Activities
43 165 156 122
74 Other Business
Activities
27 44 16 57
80 Computer
Education
1 1 15 28
93 Other Service
Activities
10 30 6 49
Sub Total 32033 301263 161063.10 2236488
Artisan Units (Non-
SIDO)
7058 34478 15033.35 206353
Grand Total 39091 335741 176096.45 2442841
Growth Trends:
The new investment in large scale sector was observed in the field of textiles and food
products, cycle parts and Fastener during the 2009-10 year. In 2009-10, there was a growth of
790 persons in employment, Rs. 1183.78 Lakhs in production and Rs. 705.04 lakhs increase
in investment.
Business Environment
Punjab fares very poorly in business environment. Administrative delays, apathetic approach
of the government officials and blatant corruption emerge as important messages from the
dialogue. The single window clearance system for multiple approvals from the state
government has not worked. The Udyog Sahayak is the 17th stop on the train of government
IJBMR, Vol. 7, No. 1, Jan-June, 2017 Page 42
approvals rather than the one and only one as it is supposed to be. Our understanding is that
the rules under the Industrial Facilitation Act of 2005 have been notified but the question is
whether these are being enforced. Officers causing delays beyond specified time frames for
approvals should be penalised. What is needed is a system of deemed approvals after a
certain specified lapse of time. As regards clearances for pollution control and environment
protection from the Government of India, again, an agreement should be sought for
proceeding with deemed approval if the parameters are clearly in line with the responsibility
and a certain amount of time has elapsed.
The Proposed Industrial Strategy
The industrial strategy proposed in this report attempts to promote synergy between
agriculture and industry as well as between the large and the small scale industrial sub-
sectors. It combines the rejuvenation of traditional industries such as cotton textiles
(including hosiery and knitwear), food processing, dairy, leather, hand tools, etc., with the
promotion of non-traditional industries, e.g., Bio-technology, IT and IT-related industries,
logistics and cold chains, and healthcare. A promising area for Punjab is the tertiary
healthcare industry which can be linked with spiritual tourism in and around Amritsar. This
can be built on the strength of the pharmaceutical industry in the state and the good health
infrastructure that has been developed over the years.
The strategy recommends five new engines of growth, i.e.,
(i) special focus on logistics, cold chains and supply and distribution chains to
encourage high value added agriculture and food processing for urban centers,
specially as the retail sector is being modernized
(ii) Special Economic Zones for IT, biotechnology, pharmaceuticals, textiles, and
agro-processing
(iii) A knowledge city in close proximity to Mohali,
(iv) The promotion of a PCPIR in Bathinda ,
An Industrial Zone along the dedicated rail freight corridor and also ensuring that Punjab is
linked to the corridor in the first phase of the extension of the Western corridor. Good
infrastructure, peaceful industrial relations, flexible labor market conditions and an efficient
administrative machinery can be used to attract large investments in a competitive
environment vis-à-vis other states. The World Bank’s earlier assessment of 2003 was
confirmed by the industry representatives, i.e., that the investment climate in Punjab clearly
IJBMR, Vol. 7, No. 1, Jan-June, 2017 Page 43

lags behind other states. It is necessary that the industries which are already in Punjab must
“feel good” about the business environment in the state. Only then can the efforts on the part
of the government to attract new investments would look credible. To address the enormous
challenges of modernising the small scale units in a number of industries in Punjab, the
strategy strongly endorses using a cluster approach with public-private partnership (PPP),
which is being used effectively and successfully in many states with active support from the
Government of India.
Making Land Available for Industrial Development
Punjab needs a clear and transparent policy of facilitating land acquisition for industrial
development. In the absence of such a policy, Punjab will miss out on the opportunities
which are being exploited by many states in providing a major push to their industrial drive.
Punjab is a state of fertile land. There is apparently a lot of demand for land for urban usage –
housing, commercial and supporting infrastructure – where the ability to pay is often in
excess of what would be viable for industrial use. This is particularly true along the industrial
belt, i.e., the rapidly urbanising axis running from Chandigarh through Ludhiana to Jalandhar
and Amritsar. Land prices have shot up so much as to seriously dent the prospective
competitiveness of any industrial project in Punjab.
There are always options of investing in other states where land prices are much lower. It is
obviously not possible to provide land to industry at a cost that is lower than the price at
which the farmer is willing to sell. However, in levying additional development and other
charges, care should be taken that the cost does not become so high that the viability of the
industry is compromised. From the previous land allotments, a large number of plots have not
been developed into industrial units, and the reason may well lie in the fact that the original
applicant was interested only in the speculative gain that could be made due to the increase in
land prices.
Recommendation
To modernise and rejuvenate the small scale units in light engineering, leather, hand tools,
sports goods, hosiery, etc., the strategy recommends the development of modern clusters
and/or attracting a large scale plant in automotives which can facilitate the technological
upgradation of the component suppliers through vendor development. The following
recommendations address these challenges:
(i) To develop Industrial Clusters under Public Private Partnership (PPP), the
government of Punjab must set up industry-specific Task Forces in collaboration with
IJBMR, Vol. 7, No. 1, Jan-June, 2017 Page 44

(ii) industry associations such as PHDCC, CII and FICCI to study the best practices by
other states of India or other countries, and come up with concrete proposals on
cluster development without losing much time.
(iii)To review why Punjab has failed to benefit from Central Schemes such as Food
Parks, Textile Technology Parks, Cluster Development, Special Economic Zones,
etc., the government of Punjab must set up a High-Powered Administrative Review
Committee with Chief Secretary as Chairman and principal Secretaries of the major
economic departments as members.
(iv) A Secretary level officer should be put in place in the Chief Minister’s office to track
the opportunities offered by these schemes and get the administrative machinery in
the state to respond to exploit these opportunities. The government of Punjab should
proactively attract a large plant for automotive manufacture because of its potential
for positive downstream effects on the numerous small scale auto-component
manufacturers.
IJBMR, Vol. 7, No. 1, Jan-June, 2017 Page 45

IJBMR, Vol. 7, No. 1, Jan-June, 2017 Page 46
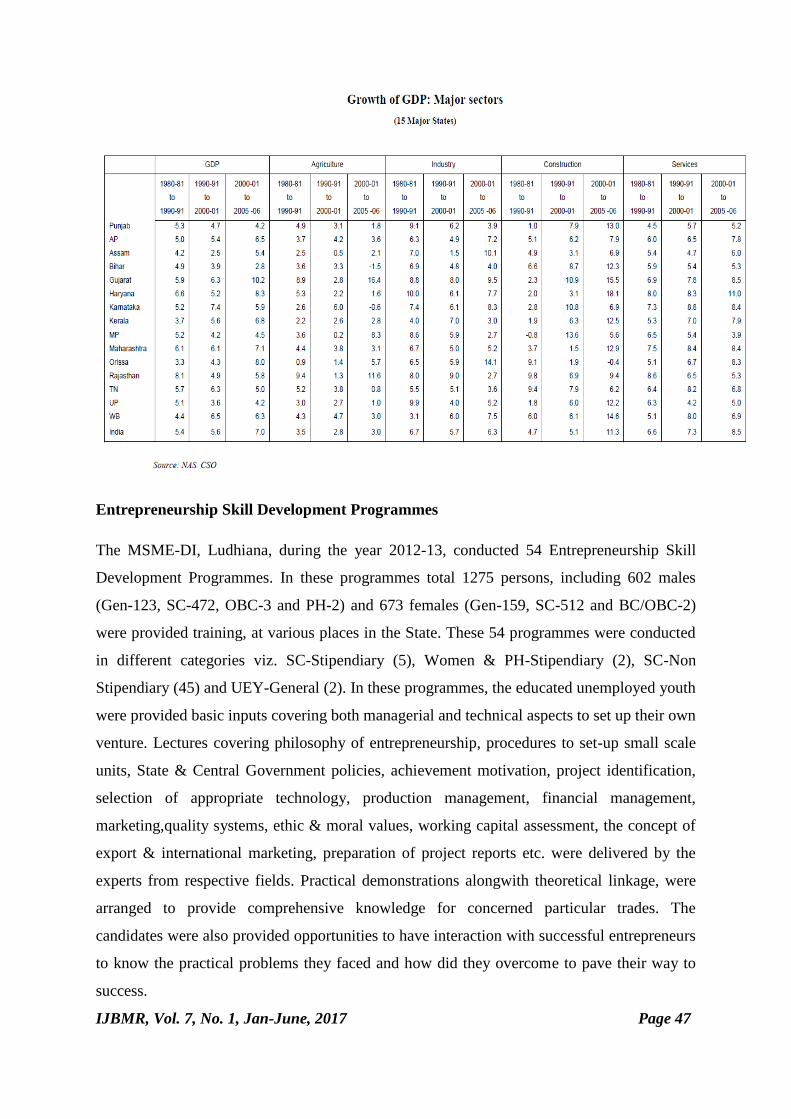
Entrepreneurship Skill Development Programmes
The MSME-DI, Ludhiana, during the year 2012-13, conducted 54 Entrepreneurship Skill
Development Programmes. In these programmes total 1275 persons, including 602 males
(Gen-123, SC-472, OBC-3 and PH-2) and 673 females (Gen-159, SC-512 and BC/OBC-2)
were provided training, at various places in the State. These 54 programmes were conducted
in different categories viz. SC-Stipendiary (5), Women & PH-Stipendiary (2), SC-Non
Stipendiary (45) and UEY-General (2). In these programmes, the educated unemployed youth
were provided basic inputs covering both managerial and technical aspects to set up their own
venture. Lectures covering philosophy of entrepreneurship, procedures to set-up small scale
units, State & Central Government policies, achievement motivation, project identification,
selection of appropriate technology, production management, financial management,
marketing,quality systems, ethic & moral values, working capital assessment, the concept of
export & international marketing, preparation of project reports etc. were delivered by the
experts from respective fields. Practical demonstrations alongwith theoretical linkage, were
arranged to provide comprehensive knowledge for concerned particular trades. The
candidates were also provided opportunities to have interaction with successful entrepreneurs
to know the practical problems they faced and how did they overcome to pave their way to
success.
IJBMR, Vol. 7, No. 1, Jan-June, 2017 Page 47
Consultancy Services
This is one of the important activities being carried-out by the Institute.
Consultancy services include not only providing guidance to set-up new units but also to the
existing MSME units pertaining to techno-managerial-cum-marketing assistance. Prospective
entrepreneurs are guided in identifying the viable products/projects, selection of appropriate
technology, manufacturing processes and techniques, selection of machinery & equipment,
raw materials, standardization and specifications and quality control techniques. Information
is also provided about various facilities being provided by other Organisations like DIC, PFC,
NSIC etc. While providing consultancy services to existing units, developments taking place
in various fields like technology, manufacturing processes, market trends, environmental
protection, energy conservation etc. were taken care of. These factors lead to improve the
quality of their products vis-a-vis to improve their overall productivity.
Conclusion
The small-scale sector has emerged as an engine of growth in most of the developing and
newly industrialized countries of the world. In India the SSI has played a catalytic role in
socio-economic transformation of the country. This sector has exhibited tremendous capacity
for employment generation, greater resource use efficiency, and technical innovation,
promoting inter-sectoral linkages, raising exports and reducing regional imbalances.
Small business has low capital investment and therefore the risk of the entrepreneur is limited
and he can afford to be venturesome. Moreover small businesses have a small gestation
period so returns are also quick. The flexibility inherent in this sector allows the entrepreneur
to work aggressively if a project seems promising or change course in case things do not
work out. In his manner the small business functions as a nursery for developing
entrepreneurial talent.
References
1. Charantimath Poornima, 2006. Entrepreneur Development Small Business Enterprise.
Darling Kindersley (India) Pvt.Ltd, New Delhi.
2. Gupta C.B, Khanka S.S. 2003. Entrepreneurship and Small Business Management.
Sultan Chand & Sons, New Delhi, 4th Edition.
3. Hatten S Timothy, 1997. Small Business Entrepreneurship and Beyond. Prentice Hall,
New Jersey.
IJBMR, Vol. 7, No. 1, Jan-June, 2017 Page 48

4. Laghu Udyog Samachar, 50 Years of SIDO, Commemorative Issue on Golden Jubilee
of Small Industries Development Organisation [1954-2004], A Publication of
Development Commissioner [SSI], Ministry of SSI, Government of India.
IJBMR, Vol. 7, No. 1, Jan-June, 2017 Page 49

Shareholders’ Perception towards Corporate Governance in India
Sonia * & Babita**
*Assistant Professor, Department of Business Administration, Ch. Devilal University, Sirsa
**Senior Financial Analyst, Televisory India Pvt. Ltd., Gurugram, Haryana
Abstract
Good corporate governance is a key component in enhancing the economic competence of a
firm and it additionally serves to ensure that companies consider the interests of a broader
range of communities, as well as society within which they operate. [N. R Narayana Murthy
Committee, 2003]. This paper intends to study Shareholders’ Expectations on Corporate
Governance. The data used for this purpose is primary and was collected from a sample of
495 respondents through a well-structured questionnaire. The main statistical techniques
used for subjecting the primary data include frequency distribution, mean, SD, t test, f test
and Factor Analysis. Major findings of the study revealed that the sampled respondents
consider five factors, namely, ‘shareholders rights’, ‘timeliness and adequacy of disclosure’,
‘trustworthiness of financial intermediaries’, ‘fairness and independence of the legal system’
and ‘treatment of foreign investors as equal to local investors’, quite satisfactory across all
independent variables.
Keywords: Corporate Governance, Shareholder’s Perception, India
Introduction
Cadbury Committee (1992) defined corporate governance as “the system by which
companies are directed and controlled…”. It deals with laws, procedures, practices and
inherent rules that determine a company’s ability to take management decisions with regard
to its stakeholders, specifically, the shareholders, creditors and employees. [Confederation of
Indian Industry Code]. It involves an understanding of connections between an organization's
management, board, shareholders and alternate partners. Also, it gives a structure through
which the objectives of the organization are formed; the way of accomplishing those targets
is determined and performance monitoring is facilitated. [The OECD Principles of Corporate
Governance, 2004].
Review of Literature For several years, researchers in the field of corporate governance studied its various aspects.
Country level investor protection and firm level corporate governance practices are
interrelated and highly important to investment decisions as institutional investors who are
actively monitoring their portfolio holdings are prepared and willing to engage in shareholder
activism and their investment decisions appear to be related to their preferences [McCahery
et al., 2009]. A statistically significant relation between corporate disclosures and foreign
share ownership is reported by Bokpin and his co-authors. They documented that foreign
investors consider corporate governance and disclosure practices of firms too in making their
investment decisions, and avoid investing in countries with a governance regime with poor
IJBMR, Vol. 7, No. 1, Jan-June, 2017 Page 50
disclosure practices; thus, international capital mobility is affected by good governance and
disclosure practices [Bokpin et al., 2009]. Policy makers should also continue to reform
corporate governance to improve transparency and accountability to adopt international
standards and to attract foreign capital [Demirbas and Yukhanaev, 2011].
Although, Raithatha and Bapat argued that corporate governance state in India might not be
an important factor for FFIs to decide on buying stakes in the company and the falsehood that
usually small/medium market capitalization based companies do not have a very strong and
sound corporate governance was proved false. The company attributes like size, profitability,
market capitalization, leverage ratio, foreign ownership, etc. are not significantly related to
Corporate Governance score [Raithatha and Bapat, 2012]. Affected by disclosure practices
of various governance information and quality of financial reports, the groups of institutional
and individual investors exhibit different levels of confidence [Lee and Shailer, 2005].
Research methodology
The present piece of work is an exploratory study. For this study, sampling elements
comprised of five hundred shareholders. The total numbers of questionnaires administered to
shareholders are around seven hundred, but around five hundred twenty are received back as
filled up. Of which, twenty five could not be included in the final sample due to the
inadequacy of the information provided by the respondents. Finally, the responses of 495
respondents were included in the study. Five point measurement scales have been developed
with a view to gaining insights, on the governance issues. Both primary and secondary data is
used in present study. Primary data were solicited with the help of a structured questionnaire
administered to the sampled shareholders manually and electronically. Prior to finalizing the
questionnaire, a pilot survey had been carried out and it involved fifty respondents. The
primary data collected through sample survey are subjected to statistical analysis with the
help of SPSS 13.0 software. The main statistical techniques used for subjecting the primary
data include frequency distribution, mean, SD and Factor Analysis.
Objective of the study
The present study aims to reveal the factors of corporate governance considered by
shareholders while taking investment decisions in India.
Reliability of the construct: Reliability of test refers to the degree to which a test is
consistent and stable in measuring what it is intended to measure. The most widely used
IJBMR, Vol. 7, No. 1, Jan-June, 2017 Page 51
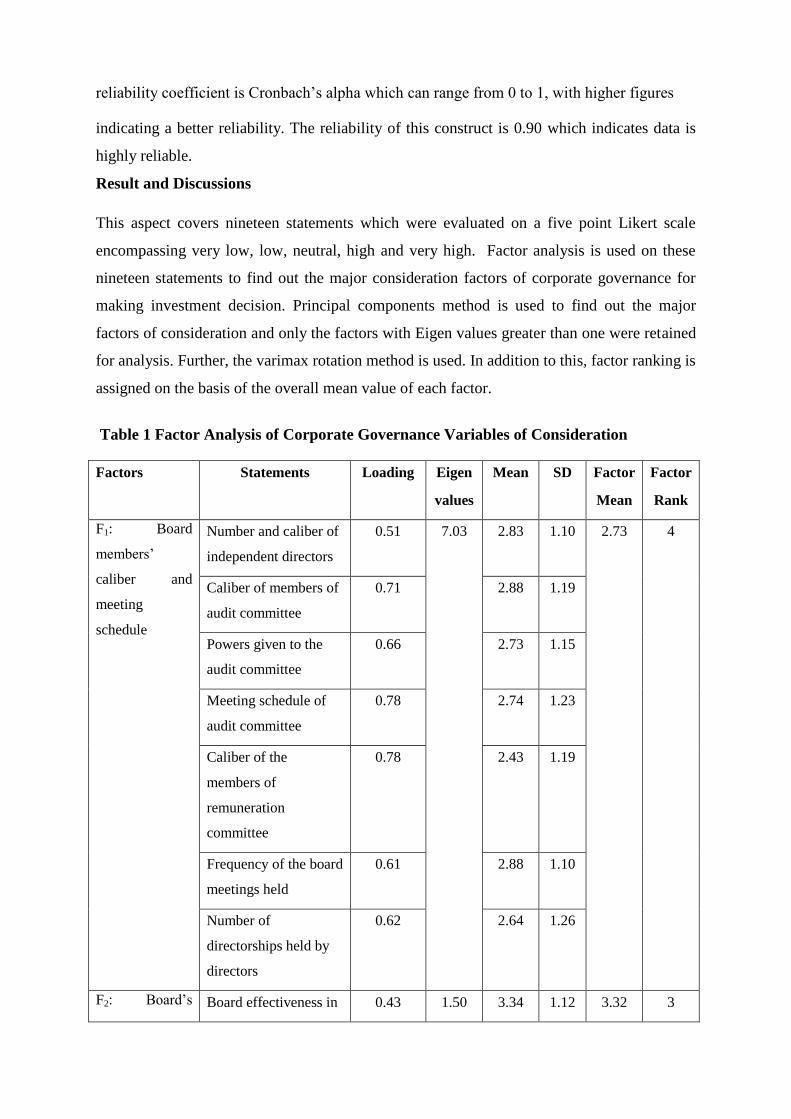
reliability coefficient is Cronbach’s alpha which can range from 0 to 1, with higher figures
indicating a better reliability. The reliability of this construct is 0.90 which indicates data is
highly reliable.
Result and Discussions
This aspect covers nineteen statements which were evaluated on a five point Likert scale
encompassing very low, low, neutral, high and very high. Factor analysis is used on these
nineteen statements to find out the major consideration factors of corporate governance for
making investment decision. Principal components method is used to find out the major
factors of consideration and only the factors with Eigen values greater than one were retained
for analysis. Further, the varimax rotation method is used. In addition to this, factor ranking is
assigned on the basis of the overall mean value of each factor.
Table 1 Factor Analysis of Corporate Governance Variables of Consideration
Factors Statements Loading Eigen
values
Mean SD Factor
Mean
Factor
Rank
i. F1: Board
members’
caliber and
meeting
schedule
Number and caliber of
independent directors
0.51 7.03 2.83 1.10 2.73 4
Caliber of members of
audit committee
0.71 2.88 1.19
Powers given to the
audit committee
0.66 2.73 1.15
Meeting schedule of
audit committee
0.78 2.74 1.23
Caliber of the
members of
remuneration
committee
0.78 2.43 1.19
Frequency of the board
meetings held
0.61 2.88 1.10
Number of
directorships held by
directors
0.62 2.64 1.26
ii. F2: Board’s Board effectiveness in 0.43 1.50 3.34 1.12 3.32 3

effectiveness
and governance
compliance
status
discharging their
duties and
responsibilities
Content and quality of
directors’ reports
0.64 3.33 1.02
Effectiveness of
shareholders/investors
grievance committee
0.74 3.17 1.19
Disclosure range in
corporate governance
report
0.70 3.28 1.15
Compliance status of
company to SEBI rules
on corporate
governance
0.71 3.58 1.14
Board composition 0.40 3.22 0.94
iii. F3:
Shareholders’
privileges and
communication
means
Management profile 0.59 1.24 3.68 1.02 3.35 2
Rights given to the
shareholders
0.56 3.31 1.02
Shareholders’
protection rules
0.67 3.39 1.15
Means of
communication
0.67 3.01 1.07
iv. F4: Ownership
structure and
shareholders’
activism
Ownership structure 0.74 1.04 3.97 0.93 3.39 1
Shareholders’ activism
level in AGMs
0.45 2.81 1.11
Table 1 reveals the results of factor analysis and produces four major factors given as
follows:
i. Board members’ caliber and meeting schedule (F1)
ii. Board’s effectiveness and governance compliance status (F2)
iii. Shareholders’ privileges and communication means (F3)
iv. Ownership structure and shareholders’ activism (F4)
IJBMR, Vol. 7, No. 1, Jan-June, 2017 Page 53
F1: Board members’ caliber and meeting schedule:
Here, the first factor F1 includes seven major issues, viz. the number and caliber of
independent directors on board of company, caliber of the members of audit committee of
company, powers given to the audit committee by the board of the company, meeting
schedule of the audit committee on board of company, the caliber of the members of
remuneration committee of company, the frequency of the board meetings held in a company
and a number of directorships held by directors of the company.
The loading values of these factors worked out at 0.51, 0.71, 0.66, 0.78, 0.78, 0.61 and 0.62
respectively. The values of factor loadings present the correlation between the factor and
variable. It implies that the factor F1 “Board members’ caliber and meeting schedule” and all
seven variables are highly correlated. Keeping in view, the nature of these variables, the
name for factor F1 is considered as “Board members’ caliber and meeting schedule”.
F2: Board’s effectiveness and governance compliance status
The second factor F2, Board’s effectiveness and governance compliance status, is a
combination of six variables such as ‘effectiveness of company’s board in discharging their
duties and responsibilities’, ‘content and quality of directors report of company’,
‘effectiveness of shareholders/investors grievance committee’, ‘disclosure range in the
corporate governance report of company’, ‘compliance status of company with SEBI rules on
corporate governance’ and ‘composition of board of the company’. The loading values of
these variables are 0.43, 0.64, 0.74, 0.70, 0.71 and 0.40 respectively. This implies a high level
of correlation between the second factor and its variables due to the high value of loading
variables.
F3: Shareholders’ privileges and communication means
The third factor F3 “Shareholders’ privileges and communication means” comprises four
aspects, ‘management profile of the company’, ‘rights given to the shareholders of the
company’, ‘shareholders’ protection rules of the company’ and ‘means of communication
used by the company to communicate its shareholders’. The loading values for these
variables are 0.59, 0.56, 0.67 and 0.67 respectively. The higher loading values of variables
present the high level of correlation between the factor and the variables. It implies that the
third factor and its variables are highly correlated with each other.
F4: Ownership structure and shareholders’ activism:
IJBMR, Vol. 7, No. 1, Jan-June, 2017 Page 54
The fourth factor F4 (Ownership structure and shareholders’ activism) has only two sub
factors ‘ownership structure of the company’ and ‘shareholder activism level in annual
general meeting of company’. The loading values of these two sub factors are 0.74 and 0.45
respectively. These values are good enough and present a high correlation between the factor
and its variables.
Table 1 further discloses the value of loading, mean and SDs of variables, value of mean of
factors and ranking of factors on the basis of afore-discussed mean values. It is noticed that
factor F4 (Ownership structure and shareholders’ activism) having the highest mean value
(3.39), falls in the first rank. The factors F3 (Shareholders’ privileges and communication
means) and F2 (Board’s effectiveness and governance compliance status) obtained second
and third rank with mean values of 3.35 and 3.32 respectively. The last rank goes to the factor
F1 (Board members’ caliber and meeting schedule) with mean 2.73. The aforesaid rankings
assigned to the factors are based on the concept that as the mean value of factors decreases,
the corresponding values of their rank increases.
Conclusions and Suggestions
Shareholders are the main party who gets affected by failure of a corporate governance
system. In a country like India, minority shareholders mainly invest for speculative purpose,
but during the survey it was found that people who are aware of corporate governance
mechanisms consider this aspect while investing their money in any company. The ownership
structure and shareholders’ activism is found the most considered variable by respondent
shareholders. In addition, it was found that companies should also focus on its
communication means because these are also considered important by respondents more than
compliance status. Board members’ calibre which seems important factor was not considered
so much by minority shareholders.
References
Bokpin, G.A. and Isshaq, Z. (2009). Corporate Governance, Disclosure and Foreign
Share Ownership on the Ghana Stock Exchange. Managerial Audit Journal, 24(7):.
688-708
CadburyCommittee Report, 1992, http://www.ecgi.org/codes/documents/cadbury.pdf,
retrieved on 27 July 2010.
IJBMR, Vol. 7, No. 1, Jan-June, 2017 Page 55

Demirbas, D. and Yukhanaev, A. (2011). Independence of Board of directors,
Employee Relation and Harmonisation of Corporate Governance, Employee
Relations, 33(4): 444-471.
Lee, J. and Shailer, G. (2005). Australian Corporate Governance Regulations and
Investors’ Confidence. www.afaanz.org/web2005/papers/leej-FIN.pdf , retrieved on
17 August 2010.
McCahery, J.A., Sautner, Z. and Starks, L.T. Behind the Scenes: The Corporate
Governance Preferences of Institutional Investors, 2009,
www.fma.org/Singapore/Papers/MSS_Paper.pdf , retrieved on 16 August 2010.
N.R. Narayan Murthy Committee Report on Corporate Governance, February 8,
2003, www.nfcgindia.org/library/narayanamurthy2003.pdf, retrieved on 12 August,
2010.
OECD Principles of Corporate Governance, 2004, http://www.oecd.org/corporate/ca/
corporategovernanceprinciples/31557724.pdf, retrieved on 12 August 2010.
Raithatha, M. and Bapat, V. (2012). Corporate Governance Compliance Practices of
Indian Companies. Research Journal of Finance and Accounting,3 (8): 19-26.
.
IJBMR, Vol. 7, No. 1, Jan-June, 2017 Page 56

Transformation of Indian Banking through IT- Enabled Services *Payal Bassi & **Navneet Mittal
*HOD & Associate Professor, University School of Management, Desh Bhagat University,
Mandi Gobindgarh.
**Research Scholar, Department of Management, Desh Bhagat University, Mandi
Gobindgarh.
Abstract
Information Technology has become fuel for rapid change. Banking sector in India has been
a major beneficiary of the inroad made by IT. The banks appear to be on fast track for IT
based products and services. Many new processes, products and services offered by banks
and other financial intermediaries are now IT centered. Another major development
witnessed in recent years is the growth in multiple delivery channels to customers such as
internet-based banking, mobile banking and anywhere banking. The major objective of the
study is to focus on the role of information technology in managing bank transformation.
The study also highlights the benefits of IT enabled services for customers and banks. It also
focus on the major challenges faced by Indian banking industry in the use of information
technology such as security, legal issues, building –up of skilled personnel and educating
people about technological banking products. The study concluded that no doubt customers
are benefitted by transformation but India is required to address the important issues to get
the full benefits of information technology implementation.
Keywords: Information Technology, Indian Banking Industry, Customer
Introduction
Technological innovations have made sea changes in Indian Banking Industry and it has
flourished to the level that it can compete with global players. Banking sector in India has
been a major beneficiary of the inroad made by IT. Current stage is of IT advancement
because technology continues to make a dramatic and profound impact in service industry
and radically shapes how services are delivered (Bitner et al., 2000). Many new processes,
products and services offered by banks and other financial intermediaries are now IT
centered. Most of the initiatives regarding technology are aimed at providing better and more
efficient customer services by offering multiple options to the customers. A common impact
of IT enabled banking services has been upon the third ‘P’ of the marketing mix- the ‘Place’.
These services enable a bank customer to avail banking services from hundreds and
thousands of places across the country and some of these across globe. Another major
development witnessed in recent years is the growth in multiple delivery channels to
customers such as internet-based banking, mobile banking and anywhere banking. Indian
banking industry today is in the midst of an IT revolution. A combination of regulatory and
competitive forces has led to increasing importance of total banking automation in the Indian
banking Industry. Banks has moved from ‘brick & mortar’ banking to ‘click & order’
banking. Indian banking Industry is flying on the innovative and new wings of technology in
search of new customers over new territories. Information technology developments in the
banking sector have sped up communication and transactions for clients (Booz et al., 1997).
The new technology has radically altered the traditional ways of doing banking business.
IJBMR, Vol. 7, No. 1, Jan-June, 2017 Page 57
In fact in banking industry, IT is finding its use in five key areas:
Convenience in product delivery access
Managing productivity access
Product design
Adapting to market and customer needs
Access to customer market
Objectives of the Study
• The paper aims to explore some important and popular IT enabled services of banking
institutions, its benefits and issue at present.
• The major objective of the study is to focus on the role of information technology in
managing bank transformation.
Database of the Study
The present study is based on the secondary data collected from published data of
Reserve Bank of India. Various journals, magazines, websites and studies on this subject
have also been referred in this study.
Technological Evolution of IT in Indian banking industry
The early 1980s were instrumental in the introduction of mechanization and
computerization in Indian banks. This was the period when banks as well as the RBI went
very slow on mechanization, carefully avoiding the use of computers to avoid resistance
from employee unions. However, during this critical period banks led to the slow and
steady move towards large scale technology adoption.
Important events in evolution of IT
The introduction of MICR based cheque processing – a first for the region, during the
years 1986-88.
Arrival of card-based payments- Debit/ Credit card in late 1980s and 90s.
Introduction of Electronic Clearing Services (ECS) in late 1990s.
In 1994 RBI constituted a committee for technical up gradation of bank Based on the
recommendations of the committee the Institute for Development and Research in
Banking Technology (IDRBT) was established in 1996.
In 1999 the collaborative efforts of IDRBT and RBI developed a satellite based wide
area network known as Indian Financial Network (INFINET).The network is
restrictive to be used by banks and financial institutions only.
Introduction of Electronic Fund Transfer (EFT) in early 2000s.
Introduction of RTGS in March 2004.
IJBMR, Vol. 7, No. 1, Jan-June, 2017 Page 58
Introduction of National Electronic Fund Transfer (NEFT) as a replacement to
Electronic Fund Transfer/Special Electronic Fund Transfer in 2005/2006.
Cheque Truncation System (CTS) or Image-based Clearing System (ICS), in India, is
a project undertaken by the Reserve Bank of India (RBI) in 2008, for faster clearing
of cheques.
Bank Transformation & E-Delivery Channels
Bank branches alone are no longer enough to offer services to meet the need of today’s high
demanding and challenging customers. In e-banking system, banks are expanding their
customer base with the help of multiple e-delivery channels like ATMs, Credit/Debit/Smart
Cards, Internet Banking, Mobile Banking, Tele-banking, EFTs etc. The virtual financial
services can be largely categorized as follows:
A. Automated Teller Machines
• Cash withdrawals
• Details of most recent balance of account
• Mini statement
• Statement ordering facility
• Deposit facility
• Payments to third parties
B. Remote Banking Services
• Balance enquiry Statement ordering
• Funds transfer (payment) to third parties
• Funds transfer between customer’s different accounts
• Order traveller’s cheques and other financial instruments.
C. Smart Cards
(i) Stored value cards
(ii) As a replacement for all types of magnetic stripes cards like ATM Cards, Debit Cards,
Charge Cards etc.
• One smart card to carry out all these functions
• One smart card can contain the functionality of several different types of cards issued
by different banks while running different types of networks
IJBMR, Vol. 7, No. 1, Jan-June, 2017 Page 59
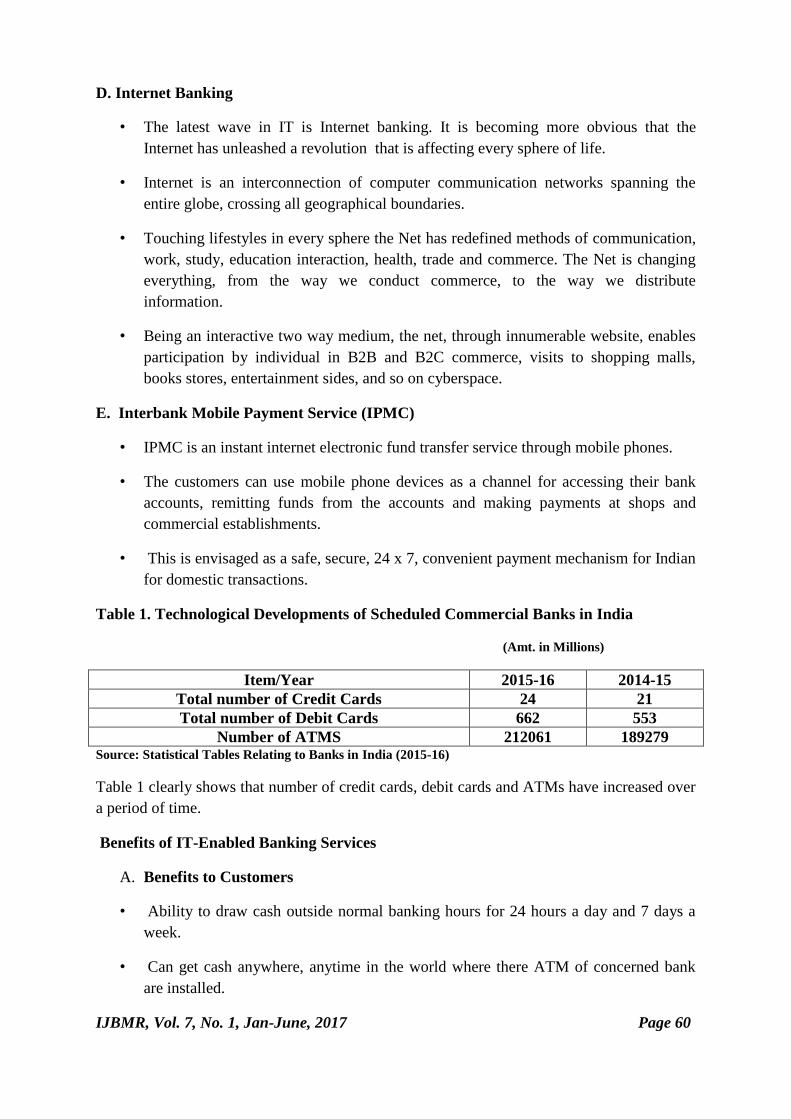
D. Internet Banking
• The latest wave in IT is Internet banking. It is becoming more obvious that the
Internet has unleashed a revolution that is affecting every sphere of life.
• Internet is an interconnection of computer communication networks spanning the
entire globe, crossing all geographical boundaries.
• Touching lifestyles in every sphere the Net has redefined methods of communication,
work, study, education interaction, health, trade and commerce. The Net is changing
everything, from the way we conduct commerce, to the way we distribute
information.
• Being an interactive two way medium, the net, through innumerable website, enables
participation by individual in B2B and B2C commerce, visits to shopping malls,
books stores, entertainment sides, and so on cyberspace.
E. Interbank Mobile Payment Service (IPMC)
• IPMC is an instant internet electronic fund transfer service through mobile phones.
• The customers can use mobile phone devices as a channel for accessing their bank
accounts, remitting funds from the accounts and making payments at shops and
commercial establishments.
• This is envisaged as a safe, secure, 24 x 7, convenient payment mechanism for Indian
for domestic transactions.
Table 1. Technological Developments of Scheduled Commercial Banks in India
(Amt. in Millions)
Item/Year 2015-16 2014-15
Total number of Credit Cards 24 21
Total number of Debit Cards 662 553
Number of ATMS 212061 189279 Source: Statistical Tables Relating to Banks in India (2015-16)
Table 1 clearly shows that number of credit cards, debit cards and ATMs have increased over
a period of time.
Benefits of IT-Enabled Banking Services
A. Benefits to Customers
• Ability to draw cash outside normal banking hours for 24 hours a day and 7 days a
week.
• Can get cash anywhere, anytime in the world where there ATM of concerned bank
are installed.
IJBMR, Vol. 7, No. 1, Jan-June, 2017 Page 60

• Enable the cardholder to avail soft credit and making him more mobile without the
risk of carrying cash/cheques for shopping.
• Accurately transfer the funds, no chance of any fraud and theft as funds are directly
transferred from one account to another account, no need of any cash.
• Electronic Clearing Services are cost effective and time saving because no need to
make the payments personally by standing in long queues.
• Electronic Data Interchange reduces frauds in transferring their important trading
documents.
• Customers perform number of non-cash transactions from the convenience of their
own office or home in fact from anywhere they have access to phone.
• Mobile banking makes banking location independent. This technology serve to check
details, issue new cheque book, payment of bills, instruction to stop payment, other
value added services etc.
• Internet banking provides quality customer services with personal attention.
• RTGS is settlement done in real time, hence no delay in transaction. It helps in easy
and safe management and transfer of funds.
B. Benefits to Banks
• Through ATM service, banks are more likely to retain existing customers and attract
non-bank customers.
• Banks earn interest on credit offered to the customers.
• EFT reduces paper work and reduces over burden of appointing a special person to go
to transfer funds from one place to another.
• Banks are benefitted from ECS in terms of commission on these transactions from
parties, company and customer.
• Electronic Data Interchange helps to generate deposits from foreign exchange through
exporters and importers.
• Through internet banking, banks gain competitive advantages by providing more
competitive services.
Major Issues with IT in Banking Services
Security, legal issues, building –up of skilled personnel and educating people about
technological banking products are some of the major issues or problems in the use of
information Technology. These are discussed as follows:
IJBMR, Vol. 7, No. 1, Jan-June, 2017 Page 61
Security: Internet Banking could result in the siphoning off money by perpetrators of
computer crime. Therefore, banks need to put place of computer security-related
hardware and software and software such as firewalls, encryption programs and virus
protection software.
Legal Issues: Legal issues arising out of siphoning off cash electronically by
computer criminals will pose a major challenge to Indian banks. IT Act provides the
security and legal framework for e- commerce transactions.
Building–up of skilled personnel: There is need to building up a pool of software
application developers and database administrators who can handle e- business
application under proper supervision.
Educating customers for IT enabled services: The technological transformation has
also created a fear-factor among customers due to security, unawareness and
unfamiliar with the use of technology, especially in country like India.
Conclusions
The transformation in banking services is providing various advantages to customers with
anytime, anywhere access to their accounts as well as power to operate their accounts. IT-
enabled banking services has not only increased the cost effectiveness but also helped in
making small value transactions. It also enhanced choices, created new markets and improved
productivity and efficiency. Without information technology and communication we cannot
think about the success of banking industry, it has enlarged the role of banking sector in
Indian Economy. Although the change is good but still banks in India are required to address
the important issues to get the full benefits of information technology implementation. Banks
need to focus on swift and continued infusion of technology.
References
Bitner, M.J., Ostrom, A.L. and Meuter M.L. (2002). Implementing Successful Self- Service
Technologies. Academy of Management Exceutive, 16(4), 96-109. Available on www.
EBSCOhostdatabase.com
Booz, Allen and Hamiltom (1997). Internet Banking: A Global Study of Potential. Booz,
Allen & Hamiliton Inc., New York, NY. Available on www. EBSCOhostdatabase.com
Purkayastha, Sudip Kar (2010). Technology Driven Channels- Need to be More Customer
Centric. The Indian Banker, V(5), 30-37.
Rani, Ibha (2015). A Study of Impact of Information Technology in Indian Banking Industry.
Abhinav National Monthly Referred Journal of Research in Commerce and Management,
4(6), 23-30. Available on www.abhinavjournal.com
RBI, Statistical Tables Relating to Banks in India, 2015-16, Reserve Bank of India, Mumbai.
Uppal, R.K. & Uppal, Agrim (2017). Banking Services and Information Technology- Bank
Employees Experience in India. Crescent Publishing Corporation, New Delhi
Uppal, R.K. (2009). Transformation in Banks Through E-Banking Services. Sarup Book
Publishers Pvt. Ltd., New Delhi.
IJBMR, Vol. 7, No. 1, Jan-June, 2017 Page 62
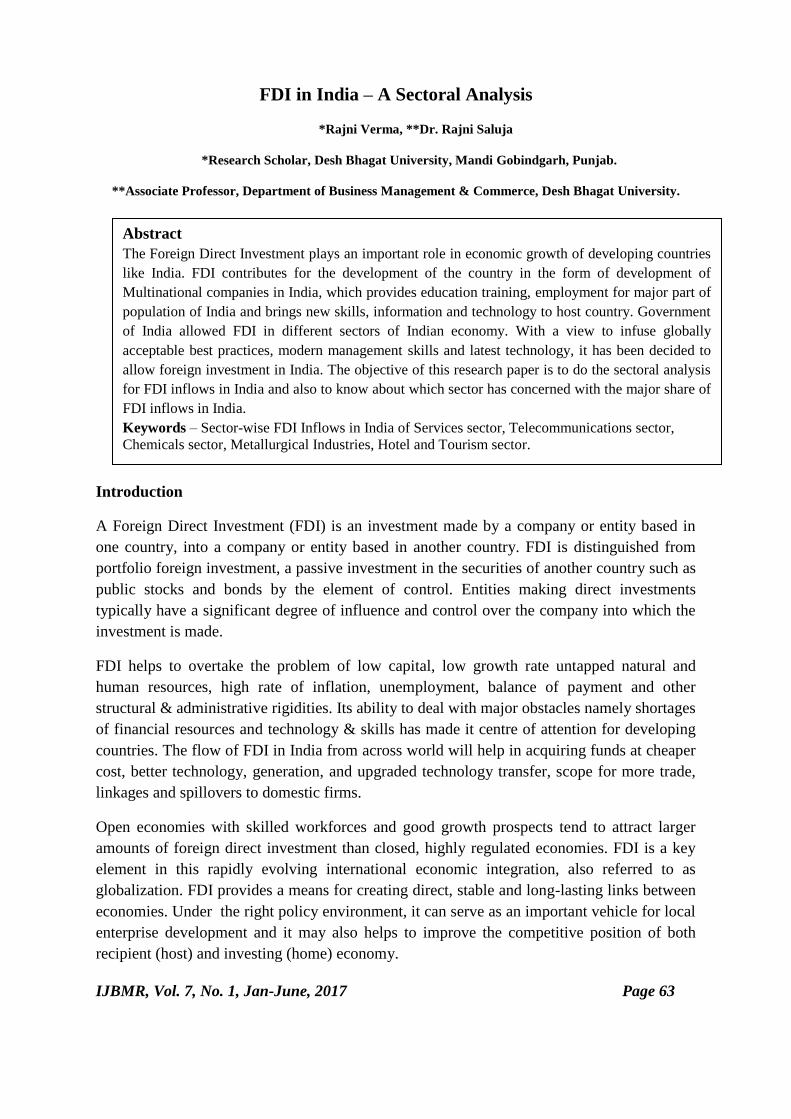
FDI in India – A Sectoral Analysis
*Rajni Verma, **Dr. Rajni Saluja
*Research Scholar, Desh Bhagat University, Mandi Gobindgarh, Punjab.
**Associate Professor, Department of Business Management & Commerce, Desh Bhagat University.
Introduction
A Foreign Direct Investment (FDI) is an investment made by a company or entity based in
one country, into a company or entity based in another country. FDI is distinguished from
portfolio foreign investment, a passive investment in the securities of another country such as
public stocks and bonds by the element of control. Entities making direct investments
typically have a significant degree of influence and control over the company into which the
investment is made.
FDI helps to overtake the problem of low capital, low growth rate untapped natural and
human resources, high rate of inflation, unemployment, balance of payment and other
structural & administrative rigidities. Its ability to deal with major obstacles namely shortages
of financial resources and technology & skills has made it centre of attention for developing
countries. The flow of FDI in India from across world will help in acquiring funds at cheaper
cost, better technology, generation, and upgraded technology transfer, scope for more trade,
linkages and spillovers to domestic firms.
Open economies with skilled workforces and good growth prospects tend to attract larger
amounts of foreign direct investment than closed, highly regulated economies. FDI is a key
element in this rapidly evolving international economic integration, also referred to as
globalization. FDI provides a means for creating direct, stable and long-lasting links between
economies. Under the right policy environment, it can serve as an important vehicle for local
enterprise development and it may also helps to improve the competitive position of both
recipient (host) and investing (home) economy.
IJBMR, Vol. 7, No. 1, Jan-June, 2017 Page 63
Abstract
The Foreign Direct Investment plays an important role in economic growth of developing countries
like India. FDI contributes for the development of the country in the form of development of
Multinational companies in India, which provides education training, employment for major part of
population of India and brings new skills, information and technology to host country. Government
of India allowed FDI in different sectors of Indian economy. With a view to infuse globally
acceptable best practices, modern management skills and latest technology, it has been decided to
allow foreign investment in India. The objective of this research paper is to do the sectoral analysis
for FDI inflows in India and also to know about which sector has concerned with the major share of
FDI inflows in India.
Keywords – Sector-wise FDI Inflows in India of Services sector, Telecommunications sector,
Chemicals sector, Metallurgical Industries, Hotel and Tourism sector.
Keywords – FDI Inflows in India, Route-wise FDI Equity Inflows, Major sources of FDI in India,
Distribution of FDI within India.
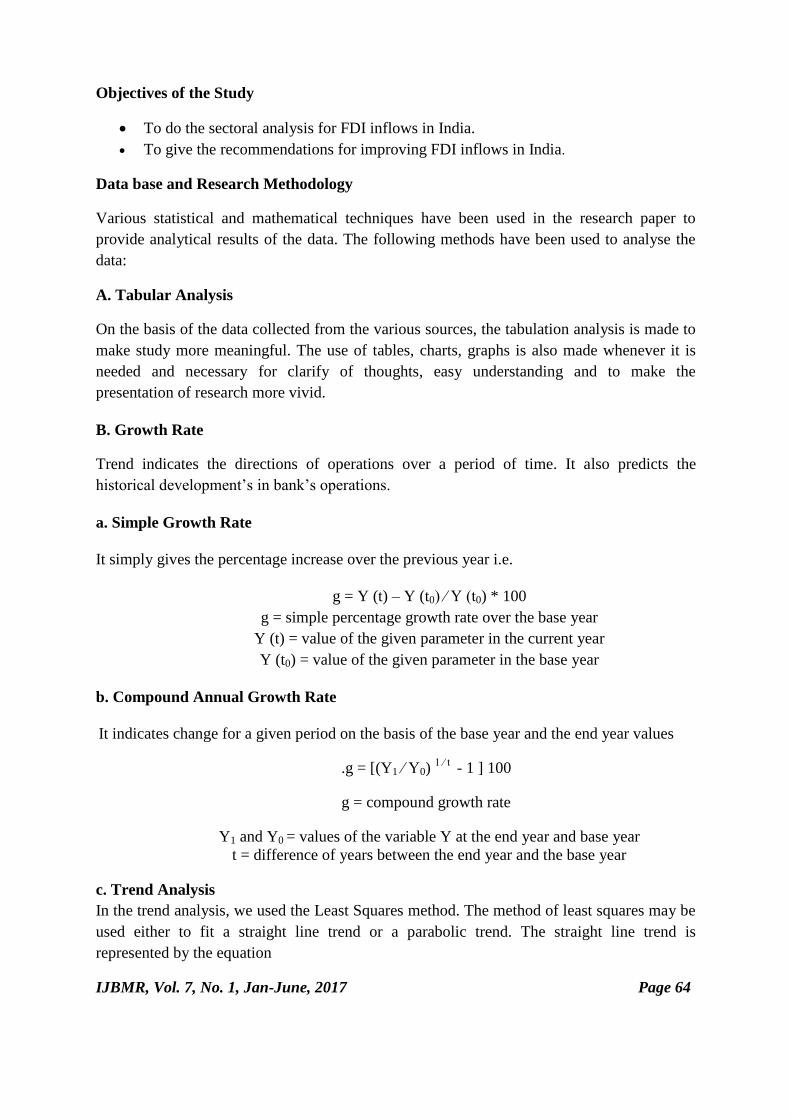
Objectives of the Study
To do the sectoral analysis for FDI inflows in India.
To give the recommendations for improving FDI inflows in India.
Data base and Research Methodology
Various statistical and mathematical techniques have been used in the research paper to
provide analytical results of the data. The following methods have been used to analyse the
data:
A. Tabular Analysis
On the basis of the data collected from the various sources, the tabulation analysis is made to
make study more meaningful. The use of tables, charts, graphs is also made whenever it is
needed and necessary for clarify of thoughts, easy understanding and to make the
presentation of research more vivid.
B. Growth Rate
Trend indicates the directions of operations over a period of time. It also predicts the
historical development’s in bank’s operations.
a. Simple Growth Rate
It simply gives the percentage increase over the previous year i.e.
g = Y (t) – Y (t0) ∕ Y (t0) * 100
g = simple percentage growth rate over the base year
Y (t) = value of the given parameter in the current year
Y (t0) = value of the given parameter in the base year
b. Compound Annual Growth Rate
It indicates change for a given period on the basis of the base year and the end year values
.g = [(Y1 ∕ Y0) 1 ∕ t
- 1 ] 100
g = compound growth rate
Y1 and Y0 = values of the variable Y at the end year and base year
t = difference of years between the end year and the base year
c. Trend Analysis
In the trend analysis, we used the Least Squares method. The method of least squares may be
used either to fit a straight line trend or a parabolic trend. The straight line trend is
represented by the equation
IJBMR, Vol. 7, No. 1, Jan-June, 2017 Page 64

Yc = a + b X
Yc = trend values
a = computed trend figure of the y variable when x = 0,
b = slope of the trend line (or amount of change in y for a given
X = independent variable (which is time in the case).
The constant ‘a’ is equal to the mean of Y values and the constant ‘b’ gives the rate of
change.
Analysis and Interpretation
Sector-wise FDI Inflows in India: In the analysis of sector-wise FDI inflows in India, we analyze the five
sectors during the period 1991-15.
Table-1 shows sector-wise FDI inflows in India during the period 2014-15.
Table-1
Sector-wise FDI Inflows in India as the period 2014-2015
(Rs. Crore)
Sr. No. Name of Sector FDI Inflow in 2014-15
1. Services Sector 27369
2. Telecommunications Sector 17372
3. Chemicals Sector 4658
4. Metallurgical Sector 2897
5. Hotel & Tourism Sector 4740
Source: Computed from the various issues of RBI Bulletin, Ministry of Commerce.
The services sector has highest inflow of FDI (Rs. 27369 crore) in 2014-15 and Metallurgical
sector has lowest FDI inflows (Rs. 2897 crore) during 2014-15.
Sector-wise FDI Inflows in India
1. Services Sector
Services Sector put the economy on a proper glide path. It is among the main drivers of
sustained economic growth and development. India received cumulative FDI inflows of Rs.
1277232 crore during 1991-2015. Out of this, Services sector received an inflow of Rs.
216323 crore, which is 16.94 % of total FDI inflows through FIPB/SIA route, RBI’s
automatic route and acquisition of existing share route during January 1991 to March 2015.
IJBMR, Vol. 7, No. 1, Jan-June, 2017 Page 65

Chart-1
Source: Computed from the various issues of RBI Bulletin, Ministry of Commerce.
(Chart-1) shows that FDI inflows declined in 1991 to 2004 in services sector and has steady
inflow up to 2006, but there is an exponential rise in FDI inflows 2006 to 2009. FDI inflows
then shot up in 2010 & 2011 but rose in 2012 & 2013. In 2014, FDI inflows decline but in
2015 rose to an appreciable level.
Services sector ranks 1st in the list of sectors in terms of cumulative FDI approved from
January 1991 to March 2015. The leading Indian companies which received FDI inflows in
this sector are: Cairn (I) Ltd., DSP Merrill Lynch Ltd., AAA Global Ventures Pvt. Ltd.,
Kappa Industries Ltd., Citi Financial Consumer Finance (I) Ltd., Blue Dart Express Ltd.,
Vyasa Bank Ltd., CRISIL Ltd., Associates India Holding Co. Pvt. Ltd., Housing
Development Finance Corp. Ltd.
2. Telecommunications Sector
Telecommunications Sector comprises Telecommunications, Radio Paging, Cellular Mobile /
Basic Telephone Services, etc. India received cumulative FDI inflows of Rs. 1277232 crore
during 1991-2015. Out of this, Telecommunications sector received an inflow of Rs. 88979
crore, which is 6.97 % of total FDI inflows through FIPB/SIA route, RBI’s automatic route
and acquisition of existing share route during January 1991 to March 2015.
(Chart-2) shows that FDI inflows in telecommunications sector declined in 1991 to 2004, rise
from 2005 and again decline from 2006 but there is an exponential rise in FDI inflows from
2007 onwards and decline from 2010, rise from 2011. FDI inflows then shot up from 2012
and then rose to an appreciable level from 2013 onwards.
IJBMR, Vol. 7, No. 1, Jan-June, 2017 Page 66
0
5000
10000
15000
20000
25000
30000
Rs.
cro
res
Trends in Services Sector
Trend Line Actual Values

Chart-2
Source: Computed from the various issues of RBI Bulletin, Ministry of Commerce.
Telecommunication sector ranks 2nd
in the list of sectors in terms of cumulative FDI
approved from January 1991 to March 2015. The leading Indian companies which received
FDI inflows in this sector are: Bhaik Infotel Pvt. Ltd., Aircel Ltd., Bharti Tele Ventures Ltd.,
Bharti Telecom Ltd., Flextronics Software Systems Ltd., Hathway Cable & Data Com. Pvt.
Ltd, Unitech Developers & Projects Ltd., Hutchison Essar South Ltd., etc.
3. Chemicals Sector
Chemicals sector ranks 3rd
in the list of sectors in terms of cumulative FDI approved from
January 1991 to March 2015. India received cumulative FDI inflows of Rs. 1277432 crore
during 1991-2015. Out of this, Chemicals sector received an inflow of Rs. 55342 crore,
which is 4.33 % of total FDI inflows through FIPB / SIA route, RBI’s automatic route and
acquisition of existing share route during January 1991 to March 2015.
(Chart-3) shows FDI inflows has declined in chemicals sector in 1991 to 2004 and rise in
2005, decline from 2006 & 2007, rise from 2008 and then shot up in 2009 but rise in FDI
inflows from 2010 & 2011. FDI inflows then decline from 2012 but rise in FDI inflows from
2013. As a result, we can say that there is upward and downward FDI inflows during 2005 to
2009 and 2012 to 2015.
IJBMR, Vol. 7, No. 1, Jan-June, 2017 Page 67
0
2000
4000
6000
8000
10000
12000
14000
16000
18000
20000R
s. c
rore
s
Trends in Telecommunications Sector
Trend Line Actual Values
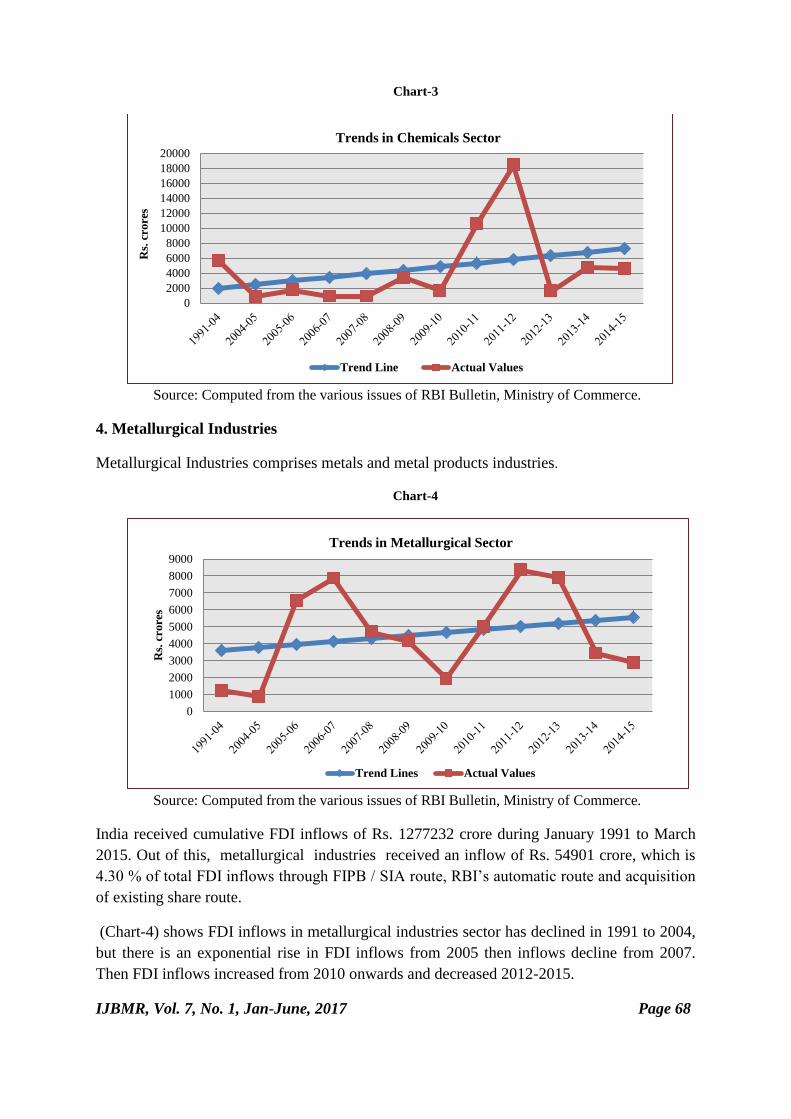
Chart-3
Source: Computed from the various issues of RBI Bulletin, Ministry of Commerce.
4. Metallurgical Industries
Metallurgical Industries comprises metals and metal products industries.
Chart-4
Source: Computed from the various issues of RBI Bulletin, Ministry of Commerce.
India received cumulative FDI inflows of Rs. 1277232 crore during January 1991 to March
2015. Out of this, metallurgical industries received an inflow of Rs. 54901 crore, which is
4.30 % of total FDI inflows through FIPB / SIA route, RBI’s automatic route and acquisition
of existing share route.
(Chart-4) shows FDI inflows in metallurgical industries sector has declined in 1991 to 2004,
but there is an exponential rise in FDI inflows from 2005 then inflows decline from 2007.
Then FDI inflows increased from 2010 onwards and decreased 2012-2015.
IJBMR, Vol. 7, No. 1, Jan-June, 2017 Page 68
0
2000
4000
6000
8000
10000
12000
14000
16000
18000
20000R
s. c
rore
s
Trends in Chemicals Sector
Trend Line Actual Values
0
1000
2000
3000
4000
5000
6000
7000
8000
9000
Rs.
cro
res
Trends in Metallurgical Sector
Trend Lines Actual Values
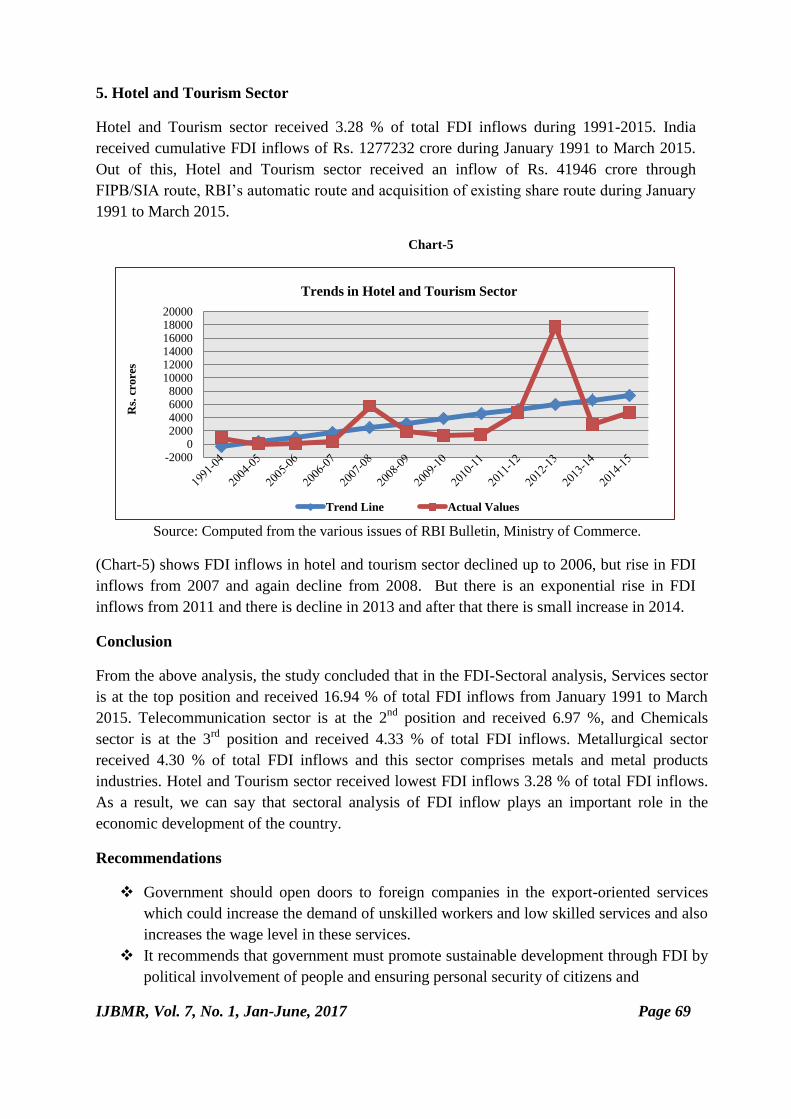
5. Hotel and Tourism Sector
Hotel and Tourism sector received 3.28 % of total FDI inflows during 1991-2015. India
received cumulative FDI inflows of Rs. 1277232 crore during January 1991 to March 2015.
Out of this, Hotel and Tourism sector received an inflow of Rs. 41946 crore through
FIPB/SIA route, RBI’s automatic route and acquisition of existing share route during January
1991 to March 2015.
Chart-5
Source: Computed from the various issues of RBI Bulletin, Ministry of Commerce.
(Chart-5) shows FDI inflows in hotel and tourism sector declined up to 2006, but rise in FDI
inflows from 2007 and again decline from 2008. But there is an exponential rise in FDI
inflows from 2011 and there is decline in 2013 and after that there is small increase in 2014.
Conclusion
From the above analysis, the study concluded that in the FDI-Sectoral analysis, Services sector
is at the top position and received 16.94 % of total FDI inflows from January 1991 to March
2015. Telecommunication sector is at the 2nd
position and received 6.97 %, and Chemicals
sector is at the 3rd
position and received 4.33 % of total FDI inflows. Metallurgical sector
received 4.30 % of total FDI inflows and this sector comprises metals and metal products
industries. Hotel and Tourism sector received lowest FDI inflows 3.28 % of total FDI inflows.
As a result, we can say that sectoral analysis of FDI inflow plays an important role in the
economic development of the country.
Recommendations
Government should open doors to foreign companies in the export-oriented services
which could increase the demand of unskilled workers and low skilled services and also
increases the wage level in these services.
It recommends that government must promote sustainable development through FDI by
political involvement of people and ensuring personal security of citizens and
IJBMR, Vol. 7, No. 1, Jan-June, 2017 Page 69
-20000
2000400060008000
100001200014000160001800020000
Rs.
cro
res
Trends in Hotel and Tourism Sector
Trend Line Actual Values

government should focus on FDI to boost domestic competitiveness, enhance skills, for
social and economic gains.
References
Factsheet on FDI various issues by Reserve Bank of India, Mumbai.
Hooda Sapna (2011), “A Study of FDI and Indian Economy’’, PhD Thesis, National
Institute of Technology (deemed university), Kurukshetra, Haryana.
Sagar Renuka and Lalitha (2013), “Sectoral Trends and Patterns of FDI in India’’,
International Journal of Marketing, Financial Services & Management Research,
Volume 2, Issue 7, ISSN 2277-3622.
www.indiabudget.nic.in.
IJBMR, Vol. 7, No. 1, Jan-June, 2017 Page 70


Related Documents