1 International Health Policy Program - Thailand International Health Policy Program -Thailand Tracking progress in universal Tracking progress in universal health access: health access: Monitoring effectiveness of Monitoring effectiveness of universal coverage in universal coverage in Thailand Thailand Supon Limwattananon, Supon Limwattananon, MPHM, PhD MPHM, PhD Viroj Tangcharoensathien, Viroj Tangcharoensathien, MD, PhD MD, PhD Prince Mahidol Award Conference, Prince Mahidol Award Conference, Bangkok Bangkok Parallel Session 2.3 Parallel Session 2.3 29 January 2010 29 January 2010

Welcome message from author
This document is posted to help you gain knowledge. Please leave a comment to let me know what you think about it! Share it to your friends and learn new things together.
Transcript

1
Inte
rna
tio
na
l H
ea
lth
Po
lic
y P
rog
ram
-T
ha
ila
nd
Inte
rnati
onal H
ealt
h P
olic
y P
rogra
m -
Thaila
nd
Tracking progress in universal health Tracking progress in universal health
access:access:
Monitoring effectiveness of Monitoring effectiveness of
universal coverage in Thailanduniversal coverage in Thailand
Supon Limwattananon, Supon Limwattananon, MPHM, PhDMPHM, PhD
Viroj Tangcharoensathien, Viroj Tangcharoensathien, MD, PhDMD, PhD
Prince Mahidol Award Conference, Prince Mahidol Award Conference, BangkokBangkok
Parallel Session 2.3 Parallel Session 2.3
29 January 201029 January 2010

2
Inte
rna
tio
na
l H
ea
lth
Po
lic
y P
rog
ram
-T
ha
ila
nd
Inte
rnati
onal H
ealt
h P
olic
y P
rogra
m -
Thaila
nd
Objectives
1. To describe the four-decade trend of key health
indicators
2. To demonstrate relationship between health resource
inputs, service outputs and health and financial
outcomes
3. To assess existing data sources for tracking the UC
progress

** * * * *
* ** * * *
* * * * * * * * *
* ** * * *
** * * * *
**** **
* ** * * *
** * * * *
* ** * **
* * * * * ** * * * * *
* * * * * ** * * * **
**** * *
*** * * *
**** * *
** * * *
* * * * **
*** * * *
* * * * * *
** * * **
* * * * **
** * * * *
**** * *
** * ** *
* * * * * *
* * *** *** * * * * *
* * ** * *
* ** * * ** * * * * *
***** *
**
** **
** * *
**** * *
** * * **
* ** * * *
** ** * *
*** * * *
**
***
*
* *** **
**
**
** * * ** * *
* ** * **
** ** * *
** * * * *
*
* *** **
* *
* * * ***
* * * * * *
* * * * * *
*** * **
**** **
**** * *
** * * * *
** * ** *
* * * * * *
* * * ** **** * * *
*** * * *
* *** * **** ** **** * * *
* ** * **
** * ** * * *
** * * * *
* * * * * *
* ** ** *
*** * * *
* * **** * * * *
*** * * *
** * * **
* * ** **
** ** * *
** *** *
** * * **
**
**
**
* * * ** *
*** * **
***
***
* ** * * *
* *** * *
**
** * *
** * * * *
** ** * *
** ** **
**** * **** * **
**** * *
* * * *
**** *** * * * * ** * * * * *
*** * * *
**
* * * * * *
** * * **
*** *
**** **
**
* ** * **
** ** * *
* * *
*** * **
***** *
* ** * * *
* * * * **
T00T01 T02T03T04T05
** * * * *
* * * * * *
**
**
**
** * ***
* *
** * * * *
**** * *
* * ** * *
* * * * * * ***
**** * *
** ** ****** * *
* ** * * *
** * * * *
* ** * * *
*** * *
*** * * *
** * * * *
* * ****
0
20
40
60
80
100
120
140
160
180
200
220
240
260
U5
MR
per
1,0
00
live
bir
ths
5 10 20 50 100 200 400Total health expenditure per capita (USD, logarithm)
Top ten MDG4 performersTop ten MDG4 performers
Source: Analysis of World Health Statistics
Thailand 2000-05
Source: Rohde et al. (Lancet 2008)
Good Health at Low Cost !Good Health at Low Cost !
Where is Thailand standing at?Where is Thailand standing at?
* GNI < USD5,000 per capita; Births > 100,000/year
U5MR vs. THE per capitaLow- and middle-income countries
Rank
0
5,000
10,000
15,000
20,000
25,000
30,000
35,000
40,000
45,000
50,000
Co
nsu
mp
tion
exp
en
ditu
re p
er
cap
ita (
Ba
ht)
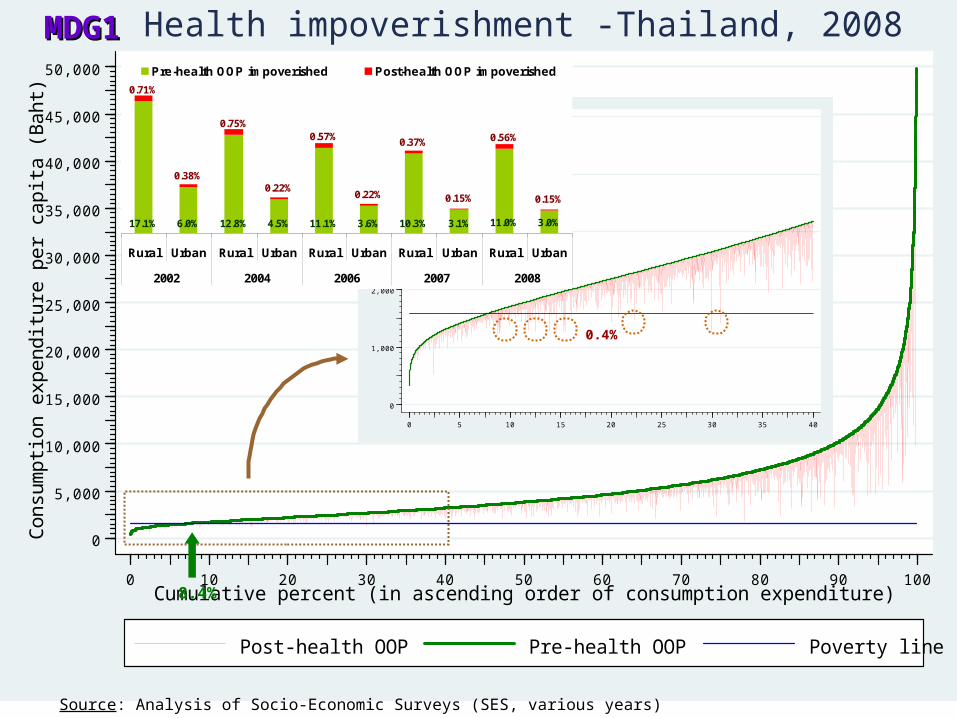
0 10 20 30 40 50 60 70 80 90 100Cumulative percent (in ascending order of consumption expenditure)
Post-health OOP Pre-health OOP Poverty line
Health impoverishment -Thailand, 2008
0
1,000
2,000
3,000
4,000
5,000
0 5 10 15 20 25 30 35 40
11.0% 3.0%
0.71%
0.38%
0.75%
0.22%
0.57%
0.22%
0.37%
0.15%
0.56%
0.15%
17.1% 6.0% 12.8% 4.5% 11.1% 3.6% 10.3% 3.1%
Rural Urban Rural Urban Rural Urban Rural Urban Rural Urban
2002 2004 2006 2007 2008
Pre-health OOP impoverished Post-health OOP impoverished
Source: Analysis of Socio-Economic Surveys (SES, various years)
8.4%
0.4%
MDG1MDG1

0
1
2
3
4
5
6
1995 2000 2005
Total health expenditure per GDP (%)
0
1
2
3
4
5
6
2000 2002 2004 2006
Poorest quintile Richest quintile
Catastrophic health expenditure (%)
0
10
20
30
40
50
60
70
80
1995 2000 2005
Government Household OOP
Health expenditure share (%)
0
1
2
3
4
5
6
7
8
1992 1994 1996 1998 2000 2002 2004 2006
Poorest decile Richest decile
OOP health expenditure per income (%)
UC scheme 2001
UC scheme 2001
UC scheme 2001
* Health expenditure > 10% of total expenditure per household
*
Source: National Health Accounts (NHA) and analysis of Socio-Economic Surveys (SES, various years)
Asian economic crisis
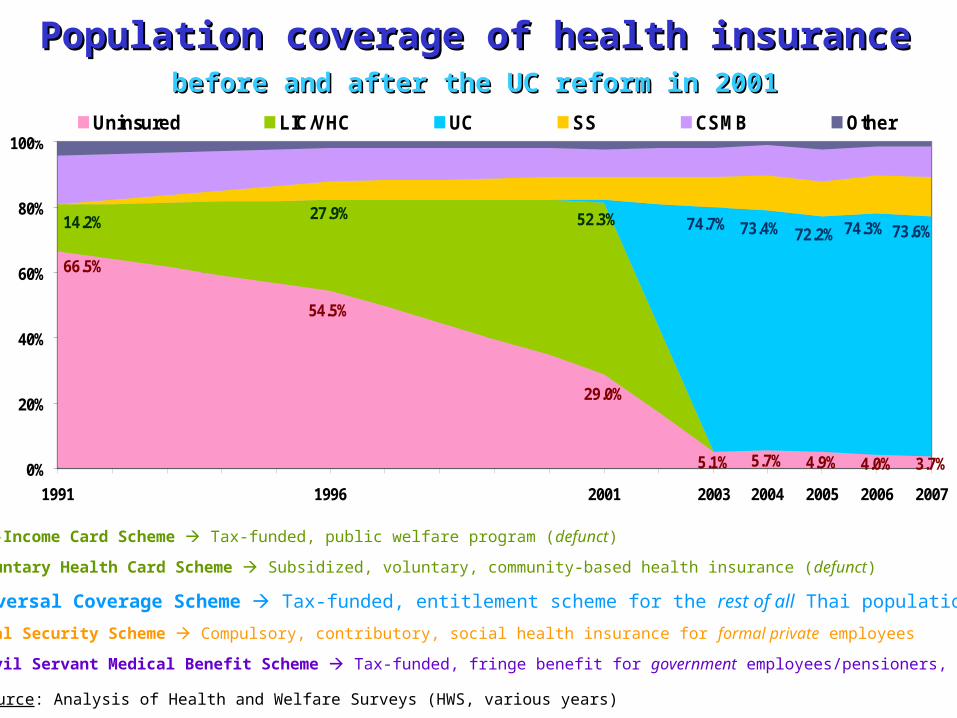
Population coverage of health insurancePopulation coverage of health insurancebefore and after the UC reform in 2001before and after the UC reform in 2001
Source: Analysis of Health and Welfare Surveys (HWS, various years)
5.1% 5.7% 4.9% 4.0% 3.7%
66.5%
29.0%
54.5%
14.2% 27.9% 52.3% 74.7% 73.4% 72.2% 74.3% 73.6%
0%
20%
40%
60%
80%
100%
1991 1996 2001 2003 2004 2005 2006 2007
Uninsured LIC/VHC UC SS CSMB Other
LIC: Low-Income Card Scheme Tax-funded, public welfare program (defunct)
VHC: Voluntary Health Card Scheme Subsidized, voluntary, community-based health insurance (defunct)
UC: Universal Coverage Scheme Tax-funded, entitlement scheme for the rest of all Thai population
SS: Social Security Scheme Compulsory, contributory, social health insurance for formal private employees
CSMB: Civil Servant Medical Benefit Scheme Tax-funded, fringe benefit for government employees/pensioners, dependants

2000
19701st-3rd NHP (1962-76)
100% provincial hospitals
1. Infrastructure development1. Infrastructure development
The path of health care coverageThe path of health care coverage
LIC1975
1990
CSMB1980
CHF1983
SS1991
4th -5th NHP (1977-86)
Expansion of district hospitals
and health centers
UC2001
VHC1994
1980
MOPH established 1942
15 provincial hospitals 300+ health centers
2. Innovative financing2. Innovative financing
Source: Adapted from Srithamrongsawat
Prospective payment system (PPS)- Capitation for SS (OP-IP)
- Diagnostic-related groups (DRG) for LIC/VHC (IP)
PPS expansion- Capitation for UC (OP)
- DRG for UC (IP)
- DRG for CSMB (IP)
- Direct billing for CSMB (OP)
LIC+1996
SS+1994
SS+2002

0
100
200
300
400
500
600
700
800
900
1,000
1,100
1,200
1,300
1,400
1965 1970 1975 1980 1985 1990 1995 2000 2005
All District Other public Private
Hospitals
0
10,000
20,000
30,000
40,000
50,000
60,000
70,000
80,000
90,000
100,000
110,000
120,000
1965 1970 1975 1980 1985 1990 1995 2000 2005
Doctors Nurses
Doctors and nurses
400
500
600
700
800
900
1,000
1,100
1,200
1,300
1,400
1965 1970 1975 1980 1985 1990 1995 2000 2005
Population per bed
1,000
2,000
3,000
4,000
5,000
6,000
7,000
8,000
9,000
10,000
1965 1970 1975 1980 1985 1990 1995 2000 2005
Doctor Nurse
Population per doctor and nurse
National Health Plans
1-th 2-th 3-th 4-th 5-th 6-th 7-th 8-th 9-th 10-th
District hospitals
MD mandated rural service
Technical nurses
Asian economic crisis
Source: Analysis of Health Resource Surveys (HRS, various years)
Four decades of health infrastructure Four decades of health infrastructure developmentdevelopment

-4.2/year
-3.3/year
-2.2/year
-1.3/year
-1.0/year-0.8/year
0
10
20
30
40
50
60
70
80
90
100
1970 1977 1982 1991 1997 2001 2007
Under-five mortality per 1,000 live births
• District hospitals 1977 • Village health volunteers 1977• National EPI 1978
Social Security Act 1991
Universal Coverage scheme 2001
Asian economic crisis 1997
Technical nurses 1982
Low-Income Card scheme 1975
Community health funds 1983
Voluntary Health Card scheme 1994
Civil Servant Medical Benefit scheme 1980
National Health Plans:
3-th 4-th 5-th 6-th 7-th 8-th 9-th 10-th
MD mandatory rural service 1972
Source: Analysis of IHME data
Child mortality trends and health systems developmentChild mortality trends and health systems development

197019711972
19731974
19751976
19771978
19791980
19811982
19831984
1985198619871988198919901991199219931994199519961997199819992000200120022003200420052006200710
20
30
40
50
60
70
80
90
U5M
R p
er 1
,000
live
birt
hs
3,000 4,000 5,000 6,000 7,000 8,000 9,000Population per doctor
19701971
19721973
19741975
19761977
19781979
19801981
19821983
19841985198619871988198919901991199219931994199519961997199819992000200120022003200420052006200710
20
30
40
50
60
70
80
90
U5M
R p
er 1
,000
live
birt
hs
500 1,000 1,500 2,000 2,500 3,000 3,500 4,000 4,500Population per nurse
19701971
19721973
19741975
19761977
19781979
19801981
1982198319841985
198619871988198919901991199219931994199519961997199819992000200120022003200420052006200710
20
30
40
50
60
70
80
90
U5M
R p
er 1
,000
live
birt
hs
400 500 600 700 800 900Population per bed
ThailandChild mortality and population-health resource ratios
U5MRt = – 16.75
+ 2.9 * 103-Population per doctort
+ 12.2 * 103-Population per nurset
+ 38.1 * 103-Population per bedt
– 0.1 * 103-USD GNI per capitat
AR(1) time-series analysisAR(1) time-series analysis

-0.4
-0.3
-0.2
-0.1
0.0
0.1
0.2
0.3
0.4
0.5
0.6
2001 2003 2005 2007
Health ctr. District hosp. Province hosp. Private hosp.
Ambulatory visit (Concentration Index)
-0.4
-0.3
-0.2
-0.1
0.0
0.1
0.2
0.3
0.4
0.5
0.6
2001 2003 2005 2007
District hosp. Province hosp. Private hosp.
Hospitalization (Concentration Index)
0.3
0.4
0.5
0.6
0.7
0.8
0.9
1.0
2000 2002 2004 2006
OOP payment Direct tax Indirect tax
Financing source (Concentration Index)
-0.2
-0.1
0.0
0.1
0.2
0.3
0.4
0.5
2000 2002 2004 2006
OOP payment Direct tax Indirect tax
Financing source (Kakwani Index)
Concentration in health utilization and financing -Thailand
Source: Analysis of HWS (on health utilization) and SES (on health financing)
Pro-rich
Pro-poor
Progressivefinancing
utilization

0.0
0.2
0.4
0.6
0.8
1.0
Cu
mula
tive p
rop
ort
ion o
f ca
se
s
0.0 0.2 0.4 0.6 0.8 1.0Cumulative proportion by wealth index rank
Weight for age
0.0
0.2
0.4
0.6
0.8
1.0
Cu
mula
tive p
rop
ort
ion o
f ca
se
s
0.0 0.2 0.4 0.6 0.8 1.0Cumulative proportion by wealth index rank
Height for age
Inequality in child malnutrition -Thailand
CI – 0.372CI – 0.372
Source:
Analysis of MICS2006
CI – 0.260CI – 0.260
Factors contributing tochild malnutrition
Concentration index
(negative) Weight for age
(negative) Height for age
Elasticity
Contribution 54.7%
Elasticity
Contribution 51.8%
1. Child’s age 0.006 1.386 0.8% 0.521 0.3%
2. Child’s squared age 0.010 -0.665 -0.7% -0.195 -0.2%
3. Male child -0.004 -0.047 -0.05% 0.057 0.08%
4. (log) Income per capita 0.026 -4.779 33.7% -3.001 30.3%
5. Mother’s college education 0.604 -0.047 7.7% -0.033 7.7%
6. Number of children in household
-0.024 0.432 2.7% 0.346 3.1%
7. Living in urban area 0.264 -0.154 10.9% -0.105 10.7%
InequityInequitydecompositiondecomposition
negative negative
Underweight = 9.3% Stunting = 11.9%
13
Inte
rna
tio
na
l H
ea
lth
Po
lic
y P
rog
ram
-T
ha
ila
nd
Inte
rnati
onal H
ealt
h P
olic
y P
rogra
m -
Thaila
nd
0
1,000
2,000
3,000
4,000
5,000
6,000
7,000
8,000
9,000
10,000
11,000
1995 2000 2005
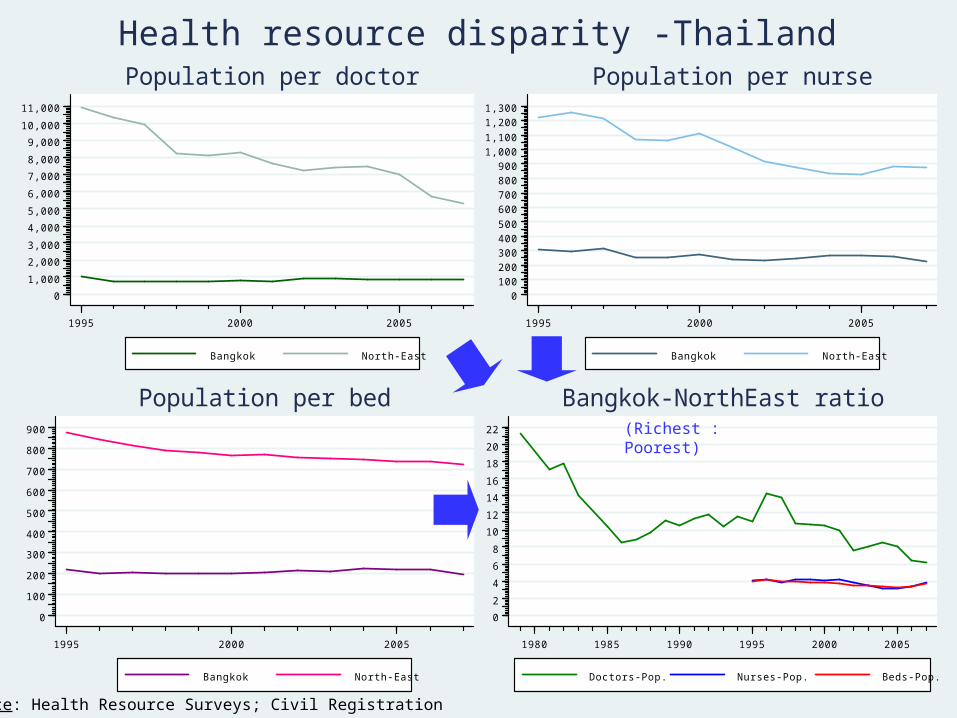
Bangkok North-East
Population per doctor
0
100
200
300
400
500
600
700
800
900
1,000
1,100
1,200
1,300
1995 2000 2005
Bangkok North-East
Population per nurse
0
100
200
300
400
500
600
700
800
900
1995 2000 2005
Bangkok North-East
Population per bed
0
2
4
6
8
10
12
14
16
18
20
22
1980 1985 1990 1995 2000 2005
Doctors-Pop. Nurses-Pop. Beds-Pop.
Bangkok-NorthEast ratio
Health resource disparity -Thailand
Source: Health Resource Surveys; Civil Registration
(Richest : Poorest)
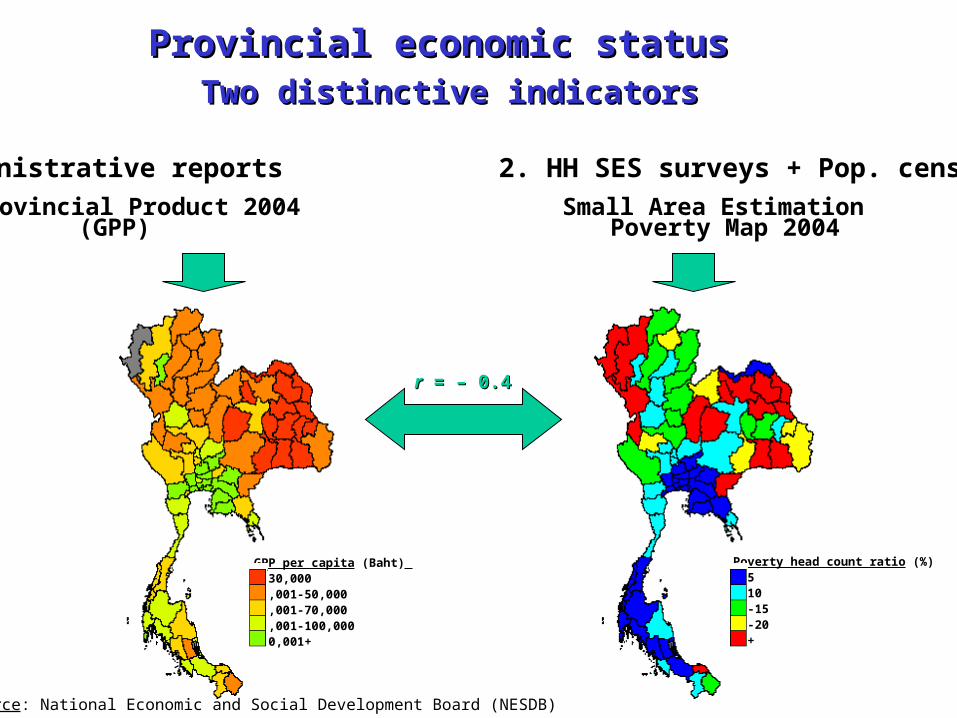
Provincial economic status Provincial economic status Two distinctive indicatorsTwo distinctive indicators
GPP per capita (Baht) 1-30,00030,001-50,00050,001-70,00070,001-100,000100,001+
Poverty head count ratio (%)0-56-1011-1516-2021+
Source: National Economic and Social Development Board (NESDB)
1. Administrative reports 2. HH SES surveys + Pop. census
Gross Provincial Product 2004 Small Area Estimation (GPP) Poverty Map 2004
rr = – 0.4 = – 0.4

13
141516
1718
19
20 21
22
23
24
25
26
27
30
31
32
33
34
35
36
37
39 40
41
42
43
44
45
46
47
4849
50
51
5253
54
55
56
57
60
61
62
63
64
65
66
67
70
71
72
73
7475
76
77
80
81
8384
85
86
90
91
92
93
94
95
96
10
15
20
25U
5MR
per
1,0
00 li
ve b
irths
10000 100000 200000 300000 400000 500000 600000 700000GPP (Baht) per capita
U5MR vs. Gross Provincial Product U5MR vs. Gross Provincial Product 20042004
R2 = 0.064
72 Provinces (Greater Bangkok excluded)Three deep southprovinces

13
14 1516
1718
19
2021
22
23
24
25
26
27
30
31
32
33
34
35
36
37
3940
41
42
43
44
45
46
47
4849
50
51
5253
54
55
56
57
58
60
61
62
63
64
65
66
67
70
71
72
73
7475
76
77
80
81
8384
85
86
90
91
92
93
94
95
96
10
15
20
25U
5MR
per
1,0
00 li
ve b
irths
0 5 10 15 20 25 30 35 40Poverty head count ratio (%)
U5MR vs. Provincial poverty rate U5MR vs. Provincial poverty rate 2004200472 Provinces (Greater Bangkok excluded)
R2 = 0.036
Three deep south provinces

13
141516
1718
192021
22
23
24
25
26
27
30
31
32
33
34
35
36
37
39 40
41
42
43
44
45
46
47
4849
5051
5253
54
55
56
57
58
60
61
62
63
6465
66
67
70
71
72
73
7475
76
7780
81
8384
85
86
9091
92
93
9495
96
10
15
20
25
U5M
R p
er 1
,000
live
birt
hs
5 15 25 35 45 55 65 75Physicians per 100,000 pop.
13
14 1516
1718
192021
22
23
24
25
26
27
30
31
32
33
34
35
36
37
39 40
41
42
43
44
45
46
47
4849
5051
5253
54
55
56
57
58
60
61
62
63
6465
66
67
70
71
72
73
74 75
76
7780
81
8384
85
86
9091
92
93
9495
96
10
15
20
25
U5M
R p
er 1
,000
live
birt
hs
50 100 150 200 250 300Nurses per 100,000 pop.
13
14 1516
1718
192021
22
23
24
25
26
27
30
31
32
33
34
35
36
37
39 40
41
42
43
44
45
46
47
4849
5051
5253
54
55
56
57
58
60
61
62
63
6465
66
67
70
71
72
73
7475
76
7780
81
8384
85
86
9091
92
93
9495
96
10
15
20
25
U5M
R p
er 1
,000
live
birt
hs
50 100 150 200 250 300 350 400Hospital beds per 100,000 pop.
U5MR vs. Health facilities/workers-Population Ratio, 2004
R2 = 0.089 R2 = 0.104
R2 = 0.136
Provincial variations

Health Health
statusstatus
Financing & Financing &
risk protectionrisk protection
Health Health
utilizationutilization
Health Health
resourceresource
1. Population & household surveys
- DHS 1987
- MICS 2006
- NHES 1991, 1996, 2003, 2008
Socio-Economic Survey (SES) 1957-1986 (q 5 y)
1988-2006 (q 2 y)
2007+ (q 1 y)
Health and Welfare Survey (HWS) 1974-1978 (q 1 y)
1981-2001 (q 5 y)
2003-2007 (q 1 y)
2009+ (q 2 y)
2. Administrative & facility-based datasets
Vital RegistryVR 1957+
National Health AccountsNHA 1994-2008
Health insurance electronic IP data2002+
Health Resource SurveyHRS 1962+
Data available for trackingData available for tracking

19
Inte
rna
tio
na
l H
ea
lth
Po
lic
y P
rog
ram
-T
ha
ila
nd
Inte
rnati
onal H
ealt
h P
olic
y P
rogra
m -
Thaila
nd
SummarySummary
• Four-decade investment in public health infrastructure in rural areas results in – High and equitable level of population health outcomes
• Functioning health service is a prerequisite of
extension of health insurance• Targeting scheme public welfare • CBHI for informal sector
Universal coverage extending to the uninsured• SHI and CSMB for formal sector
results in very low catastrophic and poverty impacts
• Comprehensive national datasets plus analytical
capacities facilitate tracking the progress
20
Inte
rna
tio
na
l H
ea
lth
Po
lic
y P
rog
ram
-T
ha
ila
nd
Inte
rnati
onal H
ealt
h P
olic
y P
rogra
m -
Thaila
ndConclusionsConclusions
• Tracking a progress in the universal health
access need to exploit wide variations in health
outcomes, service outputs, and resource inputs
– This requires regular information from (demand-side)
household surveys and (supply-side) facility-based
administrative reports at the national and sub-national
levels
– Analysis of long time-series, multiple cross-sectional,
and panel data would help increase validity in claiming
health systems improvement as a result of health care
reforms
Related Documents