176 International handbook on the economics of integration, volume III 1990s, the US joined in with the H1-B programme, although it already had in place a special category of permanent immigrant visas reserved for highly skilled or excep- tionally talented individuals. In the late 1990s, Western European countries started to compete as well in attracting skilled immigrants. The competition initially took the form of offering privileged access to visas. It is now moving to a higher level with tax advantages and other benefits offered to skilled workers. Tax exemptions on the first 25 per cent of income in Sweden, 30 per cent in the Netherlands and 40 per cent in Korea are examples of fiscal incentives designed to attract highly skilled foreign workers. Offers of tax exemptions on relocation, educational and housing allowances are becoming increasingly common. A new EU programme to issue ‘blue cards’ to skilled immigrants was approved by the European Parliament in November 2008 and is scheduled to be incorporated into the respective national legislation of each participating member state by 19 June 2011. A blue-card holder must have at least a Bachelor’s degree or five years of professional expe- rience and a job offer in an EU member state that pays at least 1.5 times the average wage in that country (1.2 times in labour-short occupations). Blue cards may be validated for up to four years, with holders having the right to be joined by their families within six months. After 18 months in the EU country that first admitted them, blue-card holders will have the right to live and work in any other EU country. British and Irish govern- ments are not taking part in the programme as they have their own schemes to attract highly skilled foreigners. 15 There are also new initiatives targeting foreign students. In a growing number of OECD countries, they are now given special treatment, including the right to remain after graduation for 3, 6, 12 and up to 36 months to look for work (see Lampert and Ochel, 2005, p. 70). In some cases they have an advantage over other foreign workers in that there is no need to certify that they are not replacing a native worker. There is also direct recruitment of skilled workers from the developing countries, as in the case of health-care professionals. Immigration policies concerning skilled labour are usually designed to meet two basic objectives: 1. Increase the stock of expertise available in the country’s labour market by attract- ing migrants with high levels of human capital. This serves to facilitate growth of relatively clean, high-productivity, high value-added activities at the cutting edge of technology, where positive externalities (and especially increasing returns to scale, both internal and external to the firm) are perceived to be significant. In addition, highly skilled migrants are unlikely to become dependent on the welfare system or to represent a fiscal burden for the host country. Because of their level of education, training, income and language skills, they are easier to integrate into the social, cul- tural, political, and not just the economic mainstream of the host-country society. Their children are also likely to attain high levels of education and training and become an asset for the economy. For all these reasons, host countries find high- skilled migrants much more attractive than low-skilled workers as candidates for permanent immigrant status. 2. The other objective of policies aimed at attracting skilled immigrants is to meet short- ages in certain occupations: this includes education and health-care professionals, Copyright © 2011. Edward Elgar. All rights reserved. May not be reproduced in any form without permission from the publisher, except fair uses permitted under U.S. or applicable copyright law. EBSCO Publishing : eBook Collection (EBSCOhost) - printed on 6/9/2015 1:35 PM via UNIVERSIDAD RAFAEL LANDIVAR AN: 387706 ; Jovanovic, Miroslav N..; International Handbook on the Economics of Integration Account: s4245486

Welcome message from author
This document is posted to help you gain knowledge. Please leave a comment to let me know what you think about it! Share it to your friends and learn new things together.
Transcript

176 International handbook on the economics of integration, volume III
1990s, the US joined in with the H1- B programme, although it already had in place
a special category of permanent immigrant visas reserved for highly skilled or excep-
tionally talented individuals. In the late 1990s, Western European countries started
to compete as well in attracting skilled immigrants. The competition initially took the
form of off ering privileged access to visas. It is now moving to a higher level with tax
advantages and other benefi ts off ered to skilled workers. Tax exemptions on the fi rst 25
per cent of income in Sweden, 30 per cent in the Netherlands and 40 per cent in Korea
are examples of fi scal incentives designed to attract highly skilled foreign workers. Off ers
of tax exemptions on relocation, educational and housing allowances are becoming
increasingly common.
A new EU programme to issue ‘blue cards’ to skilled immigrants was approved by
the European Parliament in November 2008 and is scheduled to be incorporated into
the respective national legislation of each participating member state by 19 June 2011. A
blue- card holder must have at least a Bachelor’s degree or fi ve years of professional expe-
rience and a job off er in an EU member state that pays at least 1.5 times the average wage
in that country (1.2 times in labour- short occupations). Blue cards may be validated for
up to four years, with holders having the right to be joined by their families within six
months. After 18 months in the EU country that fi rst admitted them, blue- card holders
will have the right to live and work in any other EU country. British and Irish govern-
ments are not taking part in the programme as they have their own schemes to attract
highly skilled foreigners.15
There are also new initiatives targeting foreign students. In a growing number of
OECD countries, they are now given special treatment, including the right to remain
after graduation for 3, 6, 12 and up to 36 months to look for work (see Lampert and
Ochel, 2005, p. 70). In some cases they have an advantage over other foreign workers
in that there is no need to certify that they are not replacing a native worker. There is
also direct recruitment of skilled workers from the developing countries, as in the case of
health- care professionals.
Immigration policies concerning skilled labour are usually designed to meet two basic
objectives:
1. Increase the stock of expertise available in the country’s labour market by attract-
ing migrants with high levels of human capital. This serves to facilitate growth of
relatively clean, high- productivity, high value- added activities at the cutting edge of
technology, where positive externalities (and especially increasing returns to scale,
both internal and external to the fi rm) are perceived to be signifi cant. In addition,
highly skilled migrants are unlikely to become dependent on the welfare system or
to represent a fi scal burden for the host country. Because of their level of education,
training, income and language skills, they are easier to integrate into the social, cul-
tural, political, and not just the economic mainstream of the host- country society.
Their children are also likely to attain high levels of education and training and
become an asset for the economy. For all these reasons, host countries fi nd high-
skilled migrants much more attractive than low- skilled workers as candidates for
permanent immigrant status.
2. The other objective of policies aimed at attracting skilled immigrants is to meet short-
ages in certain occupations: this includes education and health- care professionals,
jovav3.indb 176jovav3.indb 176 16/12/10 16:52:0116/12/10 16:52:01
Copyright © 2011. Edward Elgar. All rights reserved. May not be reproduced in any form without permission from the publisher, except fair uses permitted under U.S. or
applicable copyright law.
EBSCO Publishing : eBook Collection (EBSCOhost) - printed on 6/9/2015 1:35 PM via UNIVERSIDAD RAFAELLANDIVARAN: 387706 ; Jovanovic, Miroslav N..; International Handbook on the Economics of IntegrationAccount: s4245486

Reforming the system of international migration 177
ICT specialists, managers and other highly skilled workers that may be in short
supply. In most cases, the recruitment programmes have been employer led, with the
government merely acting as a facilitator by keeping bureaucratic hurdles low.
In the meantime, developing countries incur large costs in trying to train doctors and
nurses and other skilled workers in order to make available essential services, such as
health care, to their population. The cost of training highly skilled workers represents
a relatively large burden for the very poor developing countries. While higher- income
countries spend 20–50 per cent of per capita GDP on subsidising each university student,
the per student subsidy in Sub- Saharan Africa is a multiple of per capita GDP (see
Lucas, 2005). The cost to the public sector of training a doctor in South Africa is 23 times
larger than the per capita GDP of that country. Public subsidies for training a nurse are
10 times the per capita GDP (OECD, 2002). For the poorer African economies, the rela-
tive cost is still higher. Yet many of the graduates leave their country to work abroad,
with the most signifi cant fl ows of skilled immigrants pointing in the direction of North
America.
This so- called ‘brain drain’ is a particularly serious concern for the developing coun-
tries when it involves health- care professionals. However, the problem goes far beyond
the fi scal implications of public funding for higher education. It is the most capable
doctors and nurses that emigrate, as they have the greatest prospects of enjoying a large
increase in real income by seeking employment abroad. Their departure deprives com-
munities not only of leaders, role models and taxpayers, but also of health workers who
are desperately needed by the health systems already strapped for resources.
One possible solution might be to seek greater international cooperation for orderly
international transfer of skilled workers. When the workers have commitments to the
institutions that trained them, they should not be eligible for a transfer to another institu-
tion prior to meeting such commitments. These may include working for the institution
for a number of years or compensating it for the loss. A scheme similar to that govern-
ing the transfer of professional athletes from one club to another could be an attractive
solution to the problem. In an orderly, market- based transfer system, the transfer fee
would account for two key elements: (a) the cost of training incurred by the institution
that developed the skills of the worker seeking to be transferred and (b) the value of those
skills from the perspective of both institutions involved in the transfer.
Transfer fees in such a system would provide a strong incentive for institutions in the
developing countries to strengthen their training programmes and uncover more eff ec-
tively the existing, untapped, human- resource potential of the developing countries. By
addressing in this manner the severe credit- market imperfections that currently prevent
millions of young people from acquiring an education and realising their potential, a
competitive, market- based transfer system for highly skilled workers would go a long
way to increase the supply of skilled workers and potentially benefi t both the host and
the source countries.
Objections of the advanced countries to any kind of a compensation scheme for the
transfer of health- care professionals is based on the assumption that a part of the trans-
fer fee (or of some form of a Bhagwati tax) would be at the expense of the host countries.
And even if the fee or tax is shifted on to the migrants, it is seen as potentially having
a negative eff ect on the ability of host countries to attract foreign workers. In a simple
jovav3.indb 177jovav3.indb 177 16/12/10 16:52:0116/12/10 16:52:01
Copyright © 2011. Edward Elgar. All rights reserved. May not be reproduced in any form without permission from the publisher, except fair uses permitted under U.S. or
applicable copyright law.
EBSCO Publishing : eBook Collection (EBSCOhost) - printed on 6/9/2015 1:35 PM via UNIVERSIDAD RAFAELLANDIVARAN: 387706 ; Jovanovic, Miroslav N..; International Handbook on the Economics of IntegrationAccount: s4245486

178 International handbook on the economics of integration, volume III
North–South framework of analysis, with capital market imperfections in the South,
which prevent liquidity- constrained individuals from acquiring advanced training and
skills, it can be shown that neither of these presumptions is well founded. From the
perspective of the host country, the optimal transfer fee may in fact be positive. Such a
fee provides an incentive for the health institutions in the source countries to train more
health workers and off ers a mechanism for surmounting the distortion in the developing
countries’ credit markets. In the end, there is an increase in the supply of newly trained
health workers fl owing from the training institutions in the South. If appropriate poli-
cies are in place, some of the workers will migrate to the North, while others will stay
to increase employment of health- care workers in the South. With a transfer fee that is
optimal for the host country, both economies can end up with a larger supply of health
workers at a lower wage. This represents an improvement in welfare in comparison with
an unregulated migration regime.
6 DISSATISFACTION WITH IMMIGRATION
In spite of the large benefi ts enjoyed by the host countries, there is growing dissatisfac-
tion with immigration among their residents. While only 7 per cent of UN member states
considered immigration to be too high in 1976, the fi gure rose to 35 per cent by 1993 and
to 40 per cent by the beginning of the twenty- fi rst century (Ghosh, 2005). Only if immi-
gration policies ensure that those admitted are an asset for the host country, will there be
more public satisfaction with immigration. Public satisfaction, in turn, is very important
if the country is to enjoy the full benefi ts of hosting foreign workers. The point is that dis-
satisfaction with immigration goes hand in hand with discrimination against immigrants.
When it occurs, it is a problem not only for the migrants, but also for the host country
as a whole. Of particular concern is discrimination in the labour market. It has a nega-
tive impact on the rate of return on human capital of immigrants, discouraging them
and their children from investing in human capital formation. This reduces the pace of
assimilation and contributes to further polarisation, tensions and potential confl ict. It
also lowers productivity of the immigrant population and increases their dependence on
the welfare system. Discrimination against immigrants in other dimensions is similarly
damaging to the assimilation process. Active policies to prevent discrimination and
educate natives about the benefi ts of immigration are urgently needed in most of the host
countries. They should also be part of a comprehensive immigration reform package.
7 CONCLUSION
The existing system of international migration is overly restrictive. It is restrictive in the
sense that larger migration fl ows, if properly managed, have the potential to increase very
signifi cantly the effi ciency of labour allocation in the world economy and raise the levels
of welfare in both the host and source countries. It is also overly restrictive in the sense
that the existing barriers to migration of low- skilled workers from the developing to the
advanced countries generate an enormous waste of resources, both from the perspective
of the migrants trying to get across the border and of the authorities of the host countries
jovav3.indb 178jovav3.indb 178 16/12/10 16:52:0116/12/10 16:52:01
Copyright © 2011. Edward Elgar. All rights reserved. May not be reproduced in any form without permission from the publisher, except fair uses permitted under U.S. or
applicable copyright law.
EBSCO Publishing : eBook Collection (EBSCOhost) - printed on 6/9/2015 1:35 PM via UNIVERSIDAD RAFAELLANDIVARAN: 387706 ; Jovanovic, Miroslav N..; International Handbook on the Economics of IntegrationAccount: s4245486

Reforming the system of international migration 179
trying to keep them out. The system is desperately in need of reforms that would reduce
the waste and improve the effi ciency in the allocation of labour across countries.
An important step in this direction would be to strengthen cooperation between the
host and source countries in an eff ort to develop large- scale guest- worker programmes
designed to facilitate the needed immigration fl ows in an orderly, fl exible and docu-
mented manner. Guest- worker programmes, structured along the lines suggested above,
support the host- country goal of having access to a controllable as well as reversible
infl ow of documented foreign workers who are unlikely to impose a fi scal burden. This
access, in itself, is an essential fi rst step in addressing the problem of illegal immigra-
tion. Designing incentive and enforcement schemes that would eff ectively control illegal
immigration in the presence of a guest- worker programme should be high on the agenda
for future research.
Guest- worker programmes described above are also designed to maximise the ben-
efi ts of international migration enjoyed by the source countries for any given stock
of migrants abroad. By doing so, they promote growth, development and creation of
employment opportunities in these economies to help reduce migration pressures and
illegal immigration in the long run. Refi ning policies and incentive structures to maxim-
ise the benefi ts of temporary migration from the perspective of the source countries is
another important topic for future research.
Concerning international migration of skilled workers, particularly health- care profes-
sionals from the very poor developing countries, where market failures interfere with effi -
cient human capital accumulation, there is a need to develop an orderly transfer system.
Such a system should be designed to compensate the developing- country training institu-
tions for the loss of their graduates while at the same time encouraging them to expand
their training programmes for the purpose of exporting skilled workers. Further research
should devote more attention to this problem and the design of an economically sensible
and politically feasible scheme for international transfer of health- care professionals.
At a more general level, the advanced countries should strive to increase the degree to
which their immigration policies are transparent, enforceable and have clearly defi ned
and well- understood objectives. This will help build confi dence of citizens in national
immigration policies and help them understand the costs and benefi ts of hosting foreign
workers. Immigration policies must also guarantee fair treatment of immigrants. In the
absence of fair treatment, the host countries will not be able to benefi t fully from the
potential that their immigrants can and would like to off er.
SUMMARY
Among the striking features of the world economy today is the persistence of large inter-
national wage diff erentials for labour of similar skill and quality, in spite of the ongoing
globalisation. With such huge diff erences in productivity, the potential gains from lib-
eralising international trade in labour services are also very large. They are estimated
to be much larger than the potential gains from further liberalisation of trade in goods
or from the removal of the remaining restrictions on international capital movements.
This chapter off ers suggestions for reforming immigration policies of the advanced
economies so as to enable both the host and source countries to realise greater benefi ts
jovav3.indb 179jovav3.indb 179 16/12/10 16:52:0116/12/10 16:52:01
Copyright © 2011. Edward Elgar. All rights reserved. May not be reproduced in any form without permission from the publisher, except fair uses permitted under U.S. or
applicable copyright law.
EBSCO Publishing : eBook Collection (EBSCOhost) - printed on 6/9/2015 1:35 PM via UNIVERSIDAD RAFAELLANDIVARAN: 387706 ; Jovanovic, Miroslav N..; International Handbook on the Economics of IntegrationAccount: s4245486
180 International handbook on the economics of integration, volume III
from international labour mobility. With respect to migration of low- skilled labour,
the focus is on the long- term advantages of a guest- worker system designed to facilitate
the needed immigration fl ows, reduce the scope for illegal immigration, and address the
long- term goal of reducing migration pressures by promoting development and expan-
sion of employment opportunities in the source countries. With respect to skilled labour,
the emphasis is on the need for an orderly, effi cient, market- based transfer system for
international mobility of highly trained professionals.
Keywords
Immigration policy, guest- worker programmes, skilled immigrants.
JEL Classification
F22, F15.
NOTES
1. Some of the discussion below draws extensively on Djajić (2010). 2. See Freeman and Oostendorp (2000) for evidence on variations in wages across occupations and
countries. When nominal wages are adjusted by their purchasing power, this lowers diff erences across countries by a half or more (Ashenfelter and Jurajda, 2001). A recent study by Clemens et al. (2008) provides estimates of international wage diff erentials adjusted for compensating diff erentials and worker productivity.
3. Card (1990) examines the impact on wages in the Miami area as a result of the 7 per cent increase in the local labour force following the arrival of 125,000 Cuban immigrants from Mariel to Florida in 1980. He found no evidence of a decline in wages or increase in unemployment of blacks, non- Hispanic whites, or any other group. Only the wages of Cubans declined relative to those of other workers due to the reduc-tion in the average level of skills of that group following the arrival of the relatively less- skilled Mariel immigrants. A recent survey by Hanson (2008) discusses the evidence on the impact of immigration on wages of host- country workers and the problems of measuring such eff ects at the national level. See also Djajić (1997) for a theoretical, general- equilibrium analysis of the impact of illegal immigration on wages of skilled and unskilled natives.
4. In a recent paper, Cohn and Razin (2008) provide evidence that generous benefi t programmes are likely to attract immigrants with relatively lower skills if the host country’s immigration regime is unrestricted (for example, the case of internal migration within the European Union). By contrast, highly skilled migrants are deterred from host countries with generous welfare programmes to the extent that such programmes are associated with a correspondingly heavy tax burden. In the same vein, Sinn (2004) has referred to the welfare state as a two- pole magnet for potential immigrants: one pole repelling high- income immigrants, who would be net contributors to the tax- transfer system and another pole attracting the poor who would be net benefi ciaries.
5. A country’s absorption capacity is a rather complex dynamic concept, infl uenced by economic, social and political factors that determine the extent to which the population of the host country is willing and able to receive immigrants. In the present context, a country’s absorptive capacity should be seen as being positively related to the severity of the supply shortage in its labour market and by the social, cultural and religious affi nity of the natives with the immigrant population. It is negatively related to the degree of perceived rivalry between natives and immigrants for the available opportunities in the labour market, and in sharing public goods and political power in the host country.
6. One must be careful when trying to identify a shortage of labour in a particular sector. Employers always have an incentive to ask the authorities for the admission of immigrants with the specifi c skills required by their enterprises. Such demands should not necessarily be interpreted to refl ect a shortage. A more objective way of identifying a shortage in a particular skill category is by looking at the evolution of the market wage in that occupation relative to the average.
jovav3.indb 180jovav3.indb 180 16/12/10 16:52:0116/12/10 16:52:01
Copyright © 2011. Edward Elgar. All rights reserved. May not be reproduced in any form without permission from the publisher, except fair uses permitted under U.S. or
applicable copyright law.
EBSCO Publishing : eBook Collection (EBSCOhost) - printed on 6/9/2015 1:35 PM via UNIVERSIDAD RAFAELLANDIVARAN: 387706 ; Jovanovic, Miroslav N..; International Handbook on the Economics of IntegrationAccount: s4245486

Reforming the system of international migration 181
7. See, for example, Djajić (1986), Lucas (2005), Rivera- Batiz (1986) and Quibria (1997). On the basis of data from Mexico, Taylor (1992) estimates that a one dollar increase in remittances generates 1.85 dollars of activity in the local economy.
8. On the basis of a dataset on poverty, international migration and remittances for 74 low- and middle- income developing countries, Adams and Page (2003) fi nd that remittances have a statistically signifi cant impact on the incidence of poverty (while controlling for per capita income and its distribution). A 10 per cent increase in the share of remittances in a country’s GDP is associated with a 1.6 per cent decline in the share of the population living in poverty, as defi ned to be living on less than $1 per day. The impact on the severity of poverty is slightly larger.
9. See Amuedo- Dorantes (2006) and Ratha (2006) for recent surveys.10. See, for example, Piore (1979), Rivera- Batiz (1986), Lucas (1987), Durand et al. (1996), Massey and
Parrado (1998), Ilahi (1999), McCormick and Wahba (2001) and Renis (2006). The literature identifi es two signifi cant eff ects of international migration on microenterprises in the sending countries. As shown by Ilahi (1999), Dustmann and Kirkchamp (2002) and Mesnard and Ravaillon (2006), it relieves credit constraints and facilitates entry of returning migrants into self- employment. In addition, it also seems to have a positive eff ect on the amount of capital invested in a small enterprise (see Woodruff and Zenteno, 2007).
11. Djajić and Michael (2008) consider a two- country model of guest- worker migration, where the host country aims to meet shortages in its labour market by inviting temporary migrants, while also being con-cerned that foreign workers may choose to stay permanently as illegal aliens. The source country shares this interest in circularity as it would like to see temporary migrants repatriate their savings from abroad. It has policies available that can encourage return. It is found that these policies are used more effi ciently in a cooperative equilibrium than they are when each country sets migration policies to maximise its own welfare. Host countries can therefore achieve their immigration policy objectives more effi ciently through cooperation with the source countries, although side- payments may be necessary to induce such cooperation.
12. According to Douglass Massey, as quoted in the Arizona Daily Star (McCombs, 2007), some 20–25 per cent of the illegal crossings from Mexico into the US involved women. Katherine Donato estimates that as many as 35–45 per cent are women, as noted in the International Herald Tribune (Alvarez and Broder, 2006).
13. See Martin and Miller (2000). Hanson (2006) off ers an illuminating discussion of border and internal enforcement measures in the USA. See also Hanson (2007).
14. See Djajić (2009) for an analysis of the implications of high migration costs for capital accumulation in the source country and the dynamics of immigration fl ows.
15. See Constant and Zimmermann (this volume, ch. 7) for a discussion on EU policies with respect to migra-tion of skilled workers.
REFERENCES
Adams, R.H. and J. Page (2003), ‘International migration, remittances and poverty in developing countries’, World Bank Policy Research Working Paper 3179, Washington, DC, December.
Alvarez, L. and J. Broder (2006), ‘Women on rise as illegal Mexican migrants: risky crossing judged “worth it”’, International Herald Tribune, 10 January.
Amuedo- Dorantes, C. (2006), ‘Remittances and their microeconomic impact: evidence from Latin America’, in J.F. Hollifi eld, P.M. Orrenius and T. Osang (eds), Migration, Trade and Development, Dallas, TX: Federal Reserve Bank of Dallas, pp. 187–97.
Ashenfelter, O. and S. Jurajda (2001), ‘Cross- country comparisons of wage rates: the Big Mack Index’, unpub-lished manuscript, Princeton University, Princeton, NJ, October.
Card, D. (1990), ‘The impact of the Mariel boatlift on the Miami labor market’, Industrial and Labor Relations Review, 40: 382–93.
Clemens, M.A., C.E. Montenegro and L. Pritchett (2008), ‘The place premium: wage diff erences for identical workers across the US border’, Policy Research Working Paper 4671, World Bank, Washington, DC.
Cohn, A. and A. Razin (2008), ‘The skill composition of immigrants and the generosity of the welfare state: free vs. policy- controlled migration’, NBER Working Paper 14459, National Bureau of Economic Research, Cambridge, MA.
Constant, A.F. and K.F. Zimmermann (2011), ‘Migration, ethnicity and economic integration’, in M.N. Jovanovic (ed.), International Handbook on the Economics of Integration, Volume III, Cheltenham, UK: Edward Elgar Publishing, pp. 145–68.
jovav3.indb 181jovav3.indb 181 16/12/10 16:52:0116/12/10 16:52:01
Copyright © 2011. Edward Elgar. All rights reserved. May not be reproduced in any form without permission from the publisher, except fair uses permitted under U.S. or
applicable copyright law.
EBSCO Publishing : eBook Collection (EBSCOhost) - printed on 6/9/2015 1:35 PM via UNIVERSIDAD RAFAELLANDIVARAN: 387706 ; Jovanovic, Miroslav N..; International Handbook on the Economics of IntegrationAccount: s4245486

182 International handbook on the economics of integration, volume III
Djajić, S. (1986), ‘International migration, remittances and welfare in a dependent economy’, Journal of Development Economics, 21: 229–34.
Djajić, S. (1997), ‘Illegal immigration and resource allocation’, International Economic Review, 38: 91–117.Djajić, S. (1999), ‘Dynamics of immigration control’, Journal of Population Economics, 12: 45–61.Djajić, S. (2009), ‘Barriers to immigration and the dynamics of emigration’, unpublished manuscript, Graduate
Institute, Geneva.Djajić, S. (2010), ‘Immigration reforms for the 21st century: the case of unskilled labor’, in I. Angelescu,
S. Gherghina and P. Flather (eds), Facets of Migration in Contemporary Europe, Stuttgart: Verlag, pp. 51–61.
Djajić, S. and M.S. Michael (2008), ‘Temporary migration policies and welfare of the host and source coun-tries: a game- theoretic approach’, unpublished manuscript, Graduate Institute, Geneva.
Durand, J., W. Kandel, E.A. Parrado and D.S. Massey (1996), ‘International migration and development in Mexican communities’, Demography, 33: 249–64.
Dustmann, C. and O. Kirkchamp (2002), ‘The optimal migration duration and activity choice after re- migration’, Journal of Development Economics, 67: 351–72.
Freeman, R.B. and R.H. Oostendorp (2000), ‘Wages around the world: pay across occupations and countries’, NBER Working Paper 8058, National Bureau of Economic Research, Cambridge, MA, December.
Ghosh, B. (2005), ‘Managing migration: whither the missing regime?’, UNESCO, Paris.Hanson, G.H. (2006), ‘Illegal immigration from Mexico to the United States’, Journal of Economic Literature,
44: 869–924.Hanson, G.H. (2007), ‘The economic logic of illegal immigration’, CSR no. 26, Council on Foreign Relations,
New York.Hanson, G.H. (2008), ‘The economic consequences of international migration of labor’, NBER Working
Paper 14490, National Bureau of Economic Research, Cambridge, MA, November.Ilahi, N. (1999), ‘Return migration and occupational change’, Review of Development Economics, 3: 170–86.Lampert, M. and W. Ochel (2005), ‘Foreign student access to labor markets upon graduation’, CISifo Dice
Report no. 3/2005, CISifo Institute, Munich.Lucas, R.E.B. (1987), ‘Emigration to South Africa’s mines’, American Economic Review, 77: 313–30.Lucas, R.E.B. (2005), International Migration and Economic Development: Lessons from Low- Income Countries,
Cheltenham, UK and Northampton, MA, USA: Edward Elgar.Lueth, E. and M. Ruiz- Arranz (2006), ‘A gravity model of workers’ remittances,’ IMF Working Paper,
WP/06/290, International Monetary Fund, Washington, DC.Martin, P. (2003), ‘Managing labor migration: temporary worker programs for the 21st Century’, International
Labour Organization (ILO), Geneva.Martin, P. and M. Miller (2000), ‘Employer sanctions: French, German and US experiences’, International
Labour Organization (ILO), Geneva.Massey, D.S. and E.A. Parrado (1998), ‘International migration and business formation in Mexico’, Social
Sciences Quarterly, 79: 1–20.McCombs, B. (2007), ‘Tucson region: July is deadliest month for illegal- entrant women’, Arizona Daily Star,
8 March.McCormick B. and J. Wahba (2001), ‘Overseas work experience, savings and entrepreneurship amongst return
migrants to LDCs’, Scottish Journal of Political Economy, 48: 164–78.Mesnard, A. and M. Ravallion (2006), ‘The wealth eff ect on new business startups in a developing economy’,
Economica, 73: 367–92.Organisation for Economic Cooperation and Development (OECD), 2002, International Migration of
Physicians and Nurses: Causes, Consequences and Health- Policy Implications, Paris: OECD.Piore, M. (1979), Birds of Passage, Migrant Labor and Industrial Societies, Cambridge: Cambridge University
Press.Quibria, M.G. (1997), ‘International migration, remittances and income distribution in the source country: a
synthesis’, Bulletin of Economic Research, 49: 29–46.Ratha, D. (2006), ‘Leveraging remittances for development’, in J.F. Hollifi eld, P.M. Orrenius and T. Osang
(eds), Migration, Trade and Development, Dallas, TX: Federal Reserve Bank of Dallas, pp. 173–85.Renis, G. (2006), ‘Migration, trade, capital, and development: substitutes, complements, and policies’, in
J.F. Hollifi eld, P.M. Orrenius and T. Osang (eds), Migration, Trade and Development, Dallas, TX: Federal Reserve Bank of Dallas, pp. 285–94.
Rivera- Batiz, F. (1986), ‘International migration, remittances and economic welfare in the source country’, Journal of Economic Studies, 13: 3–19.
Rodrik, D. (2002), ‘Feasible globalization’, unpublished manuscript, Kennedy School of Government, Harvard University.
Sheldon, G. (2001), ‘Foreign labor employment in Switzerland: less is not more’, Swiss Political Science Review, 7: 104–12.
jovav3.indb 182jovav3.indb 182 16/12/10 16:52:0116/12/10 16:52:01
Copyright © 2011. Edward Elgar. All rights reserved. May not be reproduced in any form without permission from the publisher, except fair uses permitted under U.S. or
applicable copyright law.
EBSCO Publishing : eBook Collection (EBSCOhost) - printed on 6/9/2015 1:35 PM via UNIVERSIDAD RAFAELLANDIVARAN: 387706 ; Jovanovic, Miroslav N..; International Handbook on the Economics of IntegrationAccount: s4245486
Reforming the system of international migration 183
Sinn, H.- W. (2004), ‘EU enlargement, migration and the new constitution’, CESifo Working Paper 1367, CESifo Institute, Munich.
Taylor, E.J. (1992), ‘Remittances and inequality reconsidered: direct, indirect and intertemporal eff ects’, Journal of Policy Modeling, 14: 187–208.
Walmsley, T. and L.A. Winters (2005), ‘Relaxing the restrictions on the temporary movement of natural persons: a simulation analysis’, Journal of Economic Integration, 20: 688–726.
Woodruff , C. and R. Zenteno (2001), ‘Remittances and microenterprises in Mexico’, unpublished manuscript, University of California at San Diego, CA.
Woodruff , C. and R. Zenteno (2007), ‘Migration networks and microenterprises in Mexico’, Journal of Development Economics, 82: 509–28.
jovav3.indb 183jovav3.indb 183 16/12/10 16:52:0116/12/10 16:52:01
Copyright © 2011. Edward Elgar. All rights reserved. May not be reproduced in any form without permission from the publisher, except fair uses permitted under U.S. or
applicable copyright law.
EBSCO Publishing : eBook Collection (EBSCOhost) - printed on 6/9/2015 1:35 PM via UNIVERSIDAD RAFAELLANDIVARAN: 387706 ; Jovanovic, Miroslav N..; International Handbook on the Economics of IntegrationAccount: s4245486

jovav3.indb 184jovav3.indb 184 16/12/10 16:52:0116/12/10 16:52:01
Copyright © 2011. Edward Elgar. All rights reserved. May not be reproduced in any form without permission from the publisher, except fair uses permitted under U.S. or
applicable copyright law.
EBSCO Publishing : eBook Collection (EBSCOhost) - printed on 6/9/2015 1:35 PM via UNIVERSIDAD RAFAELLANDIVARAN: 387706 ; Jovanovic, Miroslav N..; International Handbook on the Economics of IntegrationAccount: s4245486
PART II
AGRICULTURE AND ENVIRONMENT
jovav3.indb 185jovav3.indb 185 16/12/10 16:52:0116/12/10 16:52:01
Copyright © 2011. Edward Elgar. All rights reserved. May not be reproduced in any form without permission from the publisher, except fair uses permitted under U.S. or
applicable copyright law.
EBSCO Publishing : eBook Collection (EBSCOhost) - printed on 6/9/2015 1:35 PM via UNIVERSIDAD RAFAELLANDIVARAN: 387706 ; Jovanovic, Miroslav N..; International Handbook on the Economics of IntegrationAccount: s4245486

jovav3.indb 186jovav3.indb 186 16/12/10 16:52:0116/12/10 16:52:01
Copyright © 2011. Edward Elgar. All rights reserved. May not be reproduced in any form without permission from the publisher, except fair uses permitted under U.S. or
applicable copyright law.
EBSCO Publishing : eBook Collection (EBSCOhost) - printed on 6/9/2015 1:35 PM via UNIVERSIDAD RAFAELLANDIVARAN: 387706 ; Jovanovic, Miroslav N..; International Handbook on the Economics of IntegrationAccount: s4245486

187
9 European integration and agricultural protection: an introductionPiet van den Noort
1 INTRODUCTION
European integration started after the Second World War and took shape after the
Treaty of Rome in 1957. This was the start of the European Economic Community
(EEC), which we can now see as a great experiment.
This chapter is structured as follows. Section 2 addresses the question of why there
should be agricultural protection in the EEC. Section 3 explains the system that evolved.
Section 4 discusses outcomes and problems. Section 5 examines possible solutions and
prospects, and fi nally, Section 6 concludes.
2 WHY AGRICULTURAL PROTECTION IN THE EEC?
The Common Agricultural Policy (CAP) was started as a price policy, giving farmers a
price guarantee and protection from outside suppliers. Why was that? It is a fact that all
capitalist countries have agricultural protection in one form or another and for various
reasons. One of the best reasons is the free market’s inability to achieve stability and
to gain income parity for farmers, but there were also other reasons. Switzerland and
Sweden have protected their agriculture so that in times of war, a situation in which they
prefer to remain neutral, their agriculture and food supply provide reasons for agricul-
tural protection; as can the landscape and the environment (including conservation of
topsoil) as, for example, in Norway and Austria. Some countries, such as France and
Germany, have a long tradition of agricultural protection (Tracy, 1982), but most other
countries have had such policies only since the Great Depression of the 1930s.
It could be said that just as each individual country had protection for its agriculture,
so the EEC had such a policy for itself. This seems to be a logical explanation, but it
does not explain everything. Why is there no common policy in other fi elds where each
country traditionally had its own far- reaching policy measures? Why was agriculture
a lone forerunner in the fi eld of common policies? Given the ideal of unity underlying
the EEC, we might have expected common social, fi scal and monetary policies and also
common policies in the fi elds of research, energy, environment or transport. Other cases
of economic integration (Benelux: Belgium, the Netherlands, Luxembourg; EFTA:
European Free Trade Association; LAFTA: Latin American Free Trade Association)
had no common agricultural policies (Wells, 1973).
So there must be an additional factor. It is useful to remember that economic integra-
tion was a third attempt to reach political integration in Europe; that is, to agree on a
policy for achieving a stable, democratic order in Europe, with reconciliation between
jovav3.indb 187jovav3.indb 187 16/12/10 16:52:0116/12/10 16:52:01
Copyright © 2011. Edward Elgar. All rights reserved. May not be reproduced in any form without permission from the publisher, except fair uses permitted under U.S. or
applicable copyright law.
EBSCO Publishing : eBook Collection (EBSCOhost) - printed on 6/9/2015 1:35 PM via UNIVERSIDAD RAFAELLANDIVARAN: 387706 ; Jovanovic, Miroslav N..; International Handbook on the Economics of IntegrationAccount: s4245486

188 International handbook on the economics of integration, volume III
France and Germany, no wars or revolutions, and a desire for peace and security. The
earlier attempts at unifi cation were the Marshall Plan, and the European Coal and Steel
Community. The third attempt should have been the European Defence Community
(EDC) but this treaty was not ratifi ed by the French National Assembly in 1954.
Integrating the economies in Europe, however, was also a means for achieving greater
stability and peace. Germany was all in favour of this policy, not least because it has
much to gain from a large industrial market. Unlike Germany, France believed that its
comparative economic strength was in agricultural production. Post- war France could
therefore only agree to join the integration policies provided that it could expand its
markets for agricultural products in Europe, in exchange, as it were, for German indus-
trial expansion. The participation of France was essential: its government was prepared
to play it hard (it had already refused to ratify the EDC Treaty) so the other countries
involved thought it wise to humour France. This ‘grain deal’ would give France access
to the European agricultural markets, Germany could expand its industrial markets,
and political integration could proceed. Of course, the deal had its ‘conditions’. The US
as a traditional grain supplier agreed to retreat a little for the greater good of European
political integration, but was unwilling to relinquish a considerable part of the European
market. Consumers and taxpayers implicitly agreed to use more French grain provided
that the policy did not become too expensive, that is, prices did not become too high.
Farmers in Germany, on the other hand, were willing to cooperate, provided that their
losses were made good. It is therefore not surprising to fi nd these provisos in the form of
‘goals’ in the Treaty of Rome; in principle the deal was simple, but its implementation
was achieved only by much hard work on the part of the politicians.
It is clear that France wanted to expand its agricultural production throughout the
Euro- market and therefore demanded a market policy for agricultural goods and not an
income- defi ciency payment system or social measures for farmers. To have a market is
meaningless without price guarantees, so the second aim of the common policy proposed
for the EEC was a price policy. The aim was for the price of French wheat to at least meet
the level of production costs in France, as otherwise a common market would not be an
interesting proposition for the French. The EEC member states were to give preference
to French wheat: this was done by creating an artifi cial price diff erence with the world
market by means of imposing a levy on imported grain (‘Community preference’).
It was diffi cult to arrive at a common acceptable price level and therefore at a common
tariff or levy on grain. The French national price level was not acceptable to the Germans
and the German level was not acceptable to the other member states or to traditional
overseas suppliers. So the conclusion was that the common price level should be some-
where in between and should be determined during a transitional period of some 12
years!
Within the EEC, France directed its political attention to securing a watertight guar-
antee of the grain deal by attempting to secure detailed regulations for agricultural
markets. Outside the EEC, trade policy was paramount for France: for example, during
the Kennedy Round, when the EEC (and also the individual member states) negotiated
the issue of tariff s, mainly on industrial goods. France, however, was not prepared to
accept an attractive deal in this area unless there was also an agreement about tariff s on
agricultural products (and therefore, also about the common price in the EEC).
The stand taken by France was extremely eff ective and the EEC countries also agreed
jovav3.indb 188jovav3.indb 188 16/12/10 16:52:0116/12/10 16:52:01
Copyright © 2011. Edward Elgar. All rights reserved. May not be reproduced in any form without permission from the publisher, except fair uses permitted under U.S. or
applicable copyright law.
EBSCO Publishing : eBook Collection (EBSCOhost) - printed on 6/9/2015 1:35 PM via UNIVERSIDAD RAFAELLANDIVARAN: 387706 ; Jovanovic, Miroslav N..; International Handbook on the Economics of IntegrationAccount: s4245486

European integration and agricultural protection: an introduction 189
on a common price for wheat (106 European units of account (EUA) per ton). This,
combined with the detailed market regulations, gave an almost complete common agri-
cultural price policy (see Table 9.1). It was set up as a system of protection with in fact
unlimited guarantees. The most important fl aw was that no agreement had been reached
over the price of wheat in years to come. Politicians played on this weak spot during
prolonged negotiations. Little wonder that France was in favour of an automatic pro-
cedure, a so- called ‘objective method’, for fi xing future prices. Although such a method
was adopted, in fact it never became truly automatic!
Thus the common agricultural price policy was necessary to obtain French coopera-
tion, without which European integration could not proceed.
3 THE SYSTEM
The common price for wheat was called the ‘target price’ (See Table 9.1). This price was
not the target for every place in the Community, but only for the largest consumption
area in the EEC, that is the city of Duisburg in West Germany. The target price for other
areas was derived from this by deducting the transport costs involved in getting the wheat
from those areas to Duisburg. The derived target price in Rotterdam, gateway to Europe
and largest grain port in Europe, is called the ‘threshold price’. This price is frequently
much higher than the world market price (CIF price) in Rotterdam. It was decided that
this diff erence would be bridged by a levy on imported grain. If the world market price
in Rotterdam (or any other place of entry) changed, the levy should be changed too, thus
the levies are variable. In order to keep grain merchants and users of grain competitive,
this levy is refunded if the grain, either as such or in a processed form, is exported again.
The grain component of products such as eggs, poultry, bacon and so on is also charged
with a levy, so these products can only enter the EEC at minimum or ‘sluice- gate’ prices,
based on production costs which are related to the prices of domestically produced feed
and feed/product conversion rates. There are some periods of the year when there is not
much international trade in (or import of) grain. Then the levies will not work, and the
target price is not reached. To prevent this situation from occurring, an additional policy
was implemented in the form of compulsory intervention by the central authorities. The
farmers could sell any quantity of grain to these authorities for a guaranteed price, which
was originally about 7 per cent below the target price. This guaranteed price is called the
‘intervention price’. Intervention of course leads to storage of grain in the Community.
At fi rst the necessary payments were made with the national treasuries. But France
thought it would be safer for the realisation of the grain deal if the payments of levies for
restitutions and intervention were made at the European level. Hence the creation of the
European Agricultural Guarantee Fund.
The receipts for this fund in the form of levies were originally high enough to guaran-
tee the payments for refunds or intervention, but over the years this has changed com-
pletely – there were shortfalls in the fund, which were supplemented by payments from
the EEC budget. Each member state had to contribute to this budget through a certain
percentage of value- added tax (VAT). This percentage increased by 1.6 per cent nearly
every year. It also became an issue to change the basis of the contribution: instead of
VAT some prefer national income to be the benchmark.
jovav3.indb 189jovav3.indb 189 16/12/10 16:52:0116/12/10 16:52:01
Copyright © 2011. Edward Elgar. All rights reserved. May not be reproduced in any form without permission from the publisher, except fair uses permitted under U.S. or
applicable copyright law.
EBSCO Publishing : eBook Collection (EBSCOhost) - printed on 6/9/2015 1:35 PM via UNIVERSIDAD RAFAELLANDIVARAN: 387706 ; Jovanovic, Miroslav N..; International Handbook on the Economics of IntegrationAccount: s4245486

190
Table
9.1
T
he
EE
C m
ark
et r
egula
tion s
chem
e, 1
970
Co
mm
od
itie
sA
rran
gem
ents
Targ
et
pri
ce
Th
resh
old
pri
ce
Slu
ice-
gate
pri
ce
Fre
e at
fro
nti
er
pri
ce
Imp
ort
levy
Su
pp
le-
men
tary
levy
Imp
ort
du
ty
Pro
vis
ion
for
mark
et
inte
r-
ven
tio
n
Pro
vis
ion
for
exp
ort
refu
nd
s
Qu
ota
Qu
ali
ty
stan
dard
s
Pro
du
cers
org
an
i-
zati
on
Init
ial
date
Date
for1
0
un
ifi c
ati
on
Gra
in
an
d g
rain
pro
du
cts
❑❑
❑❑
❑❑
1- 8
- 62
1- 7
- 67
Ric
e an
d r
ice
p
rod
uct
s
❑1
❑❑
❑❑
1❑
1- 9
- 64
1- 9
- 67
Pig
s an
d
p
igm
eat
❑❑
❑❑
❑1- 8
- 62
1- 7
- 67
Po
ult
ry a
nd
eg
gs
❑❑
❑❑
1- 8
- 62
1- 7
- 67
Mil
k a
nd
d
air
y
pro
du
cts
❑2
❑❑
❑❑
9❑
29- 7
- 68
Bee
f an
d v
eal
❑3
❑❑
❑❑
❑❑
429- 7
- 68
Su
gar
an
d
su
garb
eet
❑❑
❑❑
❑❑
❑5
1- 7
- 67
1- 7
- 68
Oil
seed
❑❑
❑1- 7
- 67
1- 7
- 67
Oli
ve
oil
❑❑
❑❑
❑❑
1- 1
1- 6
61- 1
1- 6
6
Fru
it a
nd
veg
etab
les
❑6
❑❑
❑❑
❑❑
7❑
❑1- 8
- 62
1- 7
- 68
Win
e❑
❑8
❑1- 8
- 62
1- 1
1- 6
9
Note
s:
1.
In F
ran
ce a
nd
Ita
ly.
2.
On
ly i
n t
he
case
of
mil
k.
3.
Gu
ide
pri
ce.
4.
Lev
y- f
ree
imp
ort
qu
ota
s fo
r fr
oze
n b
eef.
5.
Pro
du
ctio
n q
uo
tas.
6.
Ref
eren
ce p
rice
. 7.
Imp
ort
qu
ota
s ap
pli
cab
le o
nly
th
rou
gh
a s
afe
gu
ard
cla
use
pro
ced
ure
. 8.
Imp
ort
qu
ota
s. 9
. A
pp
lica
ble
fo
r b
utt
er a
nd
sk
imm
ed m
ilk
po
wd
er.
10.
Sin
ce t
he
date
s m
enti
on
ed t
he
EE
C i
s u
nifi
ed
. T
his
mea
ns
that
for
the
inn
er E
EC
- tra
de
ther
e are
no
lo
nger
an
y i
mp
ort
lev
ies
an
d f
urt
her
mo
re,
for
trad
e w
ith
th
ird
co
un
trie
s th
ere
are
un
ifo
rm i
mp
ort
lev
ies
an
d e
xp
ort
ref
un
ds.
Sourc
e:
Du
tch
Min
istr
y o
f F
oo
d a
nd
Agri
cult
ure
, T
he
Hagu
e.
jovav3.indb 190jovav3.indb 190 16/12/10 16:52:0116/12/10 16:52:01
Copyright © 2011. Edward Elgar. All rights reserved. May not be reproduced in any form without permission from the publisher, except fair uses permitted under U.S. or
applicable copyright law.
EBSCO Publishing : eBook Collection (EBSCOhost) - printed on 6/9/2015 1:35 PM via UNIVERSIDAD RAFAELLANDIVARAN: 387706 ; Jovanovic, Miroslav N..; International Handbook on the Economics of IntegrationAccount: s4245486

European integration and agricultural protection: an introduction 191
The EEC developed a similar system for milk and sugar. The sugar arrangement,
however, was the fi rst to be modifi ed and there was no longer an unlimited guarantee;
for a limited amount of sugar (‘A’ quota) the full intervention price was paid, and there
was also a ‘B’ quota which received a lower guaranteed price. Together, these were called
‘maximum’ quotas. Any sugar produced above the maximum was referred to as ‘C’
sugar and received no price protection at all.
For beef and veal there was also a price protection scheme, which in principle operates
on the same basis but the terminology is diff erent: ‘target price’ became ‘guide price’.
Another variation is that the intervention price is not the price at which the intervention
buying takes place; this takes place at a buying- in price. There are other variations but
on the whole the basic ideas are the same. Only for oilseeds and olives is there a diff erent
system, because of GATT (General Agreement on Tariff s and Trade) regulations. This
means that imports can take place at world market levels. Protection occurs in a diff erent
form. Exporters of European oil seeds receive a supplement or restitution equal to the
size of the desired price support. This supplement is also paid to manufacturers of proc-
essed oil seeds grown in Europe, which means that they are in a position to pay farmers
the required price.
Even this rough sketch of the system makes it sound cumbersome and complicated.
Indeed it is, and it became even more so because of additional rules for the solution of
monetary problems and the problems that arose in relation to the so- called ‘substitutes’,
not forgetting the surpluses.
The fi rst complication to this already extended system arose as a result of the devalu-
ation of the French franc in 1969 and the revaluation of the German mark (DM) which
followed shortly after. The devaluation should have meant a change in the exchange rate
against the EUA and this in turn should have meant an increase in the price of agricul-
tural products for the French consumer and a higher income for French farmers. The
French government did not think this advisable. However, the maintenance of the old
rate of exchange against the EUA was not possible just like that. The intervention price
in EUA and in francs remained the same, but on exporting to Germany the picture was
diff erent. By off ering the French wheat to the intervention boards in Germany, the old
price in EUA and in DM could be obtained, and the marks could then be exchanged at
any bank for more francs than before. Exports would thus be worthwhile.
Supplies could become dangerously low in France and the German intervention
boards would be fl ooded with French produce. The market would be destabilised. To
prevent this, a border levy equal to the size of gains from the change in the exchange rate
was instituted between France and the other member states. Member states exporting
to France were given a subsidy equal to that border levy. Payments at the border were
called ‘monetary compensatory amounts’ (MCAs), and it was intended that they should
be only temporary.
The revaluation of the DM caused similar problems. Adjusting the rates of exchange
against the EUA implied fewer marks per EUA, meaning that German farmers would
receive a lower income. Such a reduction was not seen as desirable by the German gov-
ernment. The same price as before in EUA was paid on goods exported to Germany,
and the same number of marks, but this could easily be exchanged for other curren-
cies and exchange rate variation gains could be made. In order to prevent diffi culties
arising in the market, imports were slowed down by reintroducing a border levy equal
jovav3.indb 191jovav3.indb 191 16/12/10 16:52:0116/12/10 16:52:01
Copyright © 2011. Edward Elgar. All rights reserved. May not be reproduced in any form without permission from the publisher, except fair uses permitted under U.S. or
applicable copyright law.
EBSCO Publishing : eBook Collection (EBSCOhost) - printed on 6/9/2015 1:35 PM via UNIVERSIDAD RAFAELLANDIVARAN: 387706 ; Jovanovic, Miroslav N..; International Handbook on the Economics of IntegrationAccount: s4245486

192 International handbook on the economics of integration, volume III
to the exchange rate gains. Exports from Germany received a subsidy of the same
magnitude.
Thus, both positive and negative MCAs were introduced. Since exchange rate vari-
ations continued and became more frequent, these MCAs remained in force, and were
readjusted every week in periods of high currency unrest (that is, there was a fl oating
currency). With the establishment of the European Monetary System (EMS), the EUA
was replaced by the ECU (European currency unit), which is a weighted average of the
exchange rates of all the currencies of the member states. Every exchange rate change
works through to the ECU and this aff ects the price of agricultural products.
The level of the MCAs had to be continually readjusted. Prices in national currencies
showed a diff erent trend in each of the member states, and uniformity of market prices
had thus been lost.
The overall result of the agricultural policies and development in European farming
was an increase in production at somewhat high and guaranteed price levels. This
resulted in surpluses which created all kinds of problems: high budgetary expenses
but not the desired level of income for farmers. In order to fulfi l the clause calling for
‘reasonable incomes, reasonable prices and increases in productivity’, an attempt was
made to bring about a complete modernisation and restructuralisation of agriculture
(Mansholt Plan, 1970). To achieve this, agricultural employment had to be reduced
by about 50 per cent, farm area by about 7 per cent, and some capital be transferred
to other production areas. The remaining agricultural resources were to be organised
into large modern units. On such farms, farmers would obtain a reasonable income at
the existing price levels, without this having an undesirable eff ect on total supply or the
consumer being forced to pay excessive prices. Furthermore, international trade would
not be negatively aff ected. With this in mind, the Mansholt Plan was born; however,
because of enormous political opposition, no eff ective large- scale structural measures
were actually undertaken.
Guidelines on measures for pensioning off and re- educating farmers, and for interest
subsidies on some forms of modernisation investment (all to be conducted on a national
level) was all that emerged. To fi nance these measures a ‘Guidance Section’ of the
European Fund was set up.
It became clear that hill farmers could never receive a reasonable income via the guar-
anteed price system without overriding the stated aim regarding prices to consumers, and
without imposing unnecessarily high farm incomes in other areas. But it was not always
socially desirable to leave these people without additional governmental support. It was
felt that neither the social environment nor the rural beauty (through erosion) of the hilly
areas should be allowed to be destroyed. Thus, the so- called ‘hill- farm regulation’ came
into being.
Clearly the Community responsibility for the fi nancing of the policy has become
an increasingly important element in the discussion regarding market regulation. The
need emerged to limit the applicability of price guarantees somewhat, by such diverse
measures as premiums on non- delivery of milk and on cattle slaughter, and consumer
subsidies for butter, milk powder and school milk. Furthermore, in the case of milk and
grain, lower intervention prices should apply for quantities over and above a certain
production ceiling. This reduction of the marginal price was called the ‘co- responsibility
levy’ (Bureau of Agricultural Economics, 1985).
jovav3.indb 192jovav3.indb 192 16/12/10 16:52:0116/12/10 16:52:01
Copyright © 2011. Edward Elgar. All rights reserved. May not be reproduced in any form without permission from the publisher, except fair uses permitted under U.S. or
applicable copyright law.
EBSCO Publishing : eBook Collection (EBSCOhost) - printed on 6/9/2015 1:35 PM via UNIVERSIDAD RAFAELLANDIVARAN: 387706 ; Jovanovic, Miroslav N..; International Handbook on the Economics of IntegrationAccount: s4245486
European integration and agricultural protection: an introduction 193
When this proved to be insuffi cient, a cap on production was devised, whereby the
intervention price would only be paid for a certain quota (set at about the 1983 produc-
tion level), and any farmer producing more than this amount would be penalised with a
super- levy of about 75 per cent of the intervention price. The rules for this quota system
are too complicated to deal with here.
There were also problems concerning the so- called ‘substitutes’. The grain substitutes
are best known although there are now also substitutes for sugar, milk, beef and so
on. One well- known grain substitute was tapioca. At the time this was an insignifi cant
product on world markets; it was more expensive than grains, but as a result of the levies
imported grains became dearer than tapioca. It was therefore an attractive proposition
to feed processors to use tapioca rather than grains. Pig production thus became cheaper,
with the result that there was an expansion in this fi eld. This consequently reduced the
demand for grains, for which there was a large intervention storage or even a surplus.
So, it was then decided to restrict the use and import of tapioca. This was rather embar-
rassing because the exporters are developing countries (for example, Thailand). It was
decided that Thailand should not export more than a certain quantity; to prohibit the
export completely was impossible for obvious political reasons.
Since Article 39 of the Treaty of Rome seems to place so much importance on the
improvement of agricultural productivity, one should perhaps expect a policy to promote
agricultural technology or to improve the structure of agriculture.
Indeed, there have been some measures for the improvement of land allocation and of
markets and marketing channels, but these guidance measures are of limited importance
both technically and fi nancially. In 1984, for example, while 27,249 million ECU were
allocated from the European Fund, only 675 million ECU were in the Guidance Section,
whereas the Guarantee Section received 18,333 million ECU. Policies regarding the
technical development of agriculture were left to national authorities. The system was
therefore fundamentally a market and price policy with an unlimited guarantee. This has
been changed, fi rst for sugar and later for milk, and there are also proposals to limit the
intervention and/or production of grains. The main issue of the CAP in the last part of
the 1980s was therefore the limiting of the guarantee for agricultural prices in one way or
another. The unifi cation in 1992 required further adaptations. It was questionable, for
example, whether the MCAs could be maintained. The global policies (vis- à- vis the US
and the developing countries, the UNCTAD and GATT) for grains, beef, sugar and so
on would also require some changes in the CAP. So the system is in a state of constant
repair and change.
The main features of the CAP, therefore, are the changes in the price level decided
upon by the Council of Ministers (see Table 9.2).
4 OUTCOMES AND PROBLEMS
The EEC had a common market policy and a common price level for many agricultural
products, but if we look at the price level in national prices (applying exchange rates) we
can see that the levels and their trends diff er greatly between member countries. The dif-
ferences are as great as before the Treaty of Rome, and they exist because of the system
of special levies and subsidies between the member states – the MCAs. However, the
jovav3.indb 193jovav3.indb 193 16/12/10 16:52:0116/12/10 16:52:01
Copyright © 2011. Edward Elgar. All rights reserved. May not be reproduced in any form without permission from the publisher, except fair uses permitted under U.S. or
applicable copyright law.
EBSCO Publishing : eBook Collection (EBSCOhost) - printed on 6/9/2015 1:35 PM via UNIVERSIDAD RAFAELLANDIVARAN: 387706 ; Jovanovic, Miroslav N..; International Handbook on the Economics of IntegrationAccount: s4245486

194 International handbook on the economics of integration, volume III
various price levels have always been above world market price levels and were particu-
larly attractive for France. France could, therefore, profi t from the grain deal: it could
increase its share of the European market (see Table 9.3) in exchange for German indus-
trial expansion. The French did indeed obtain a larger agricultural market, although they
were faced with some competition from the Dutch who had a high agricultural produc-
tivity and an excellent geographical position. Because of German political pressure the
price level was high, which also prevented the French from having an even larger market
share. The high prices led to a high eff ective rate of protection for the main agricultural
products such as wheat, meat, cheese and butter.
It is said that the CAP had only one instrument – the common price level – whereas
the Treaty of Rome lays down many targets. Formally, the CAP would therefore be an
illogical construction; it would only be logical to have a separate instrument for each
target or political end. But should we look at the CAP in this way? The real and main
target of the CAP was to obtain French cooperation in European policy. Market and
price policies have realised this goal, although not without some confl ict of interest. The
so- called goals of the CAP, for example as formulated in Article 39 of the Treaty, can
better be seen as limiting conditions, indicating other interests to be considered in realis-
ing the agricultural policy.
Table 9.2 Average change in agricultural prices (in percent), decided upon by the
Council of Ministers in various years
EC6 % EC9 % EC10 %
1968–69 –1.3 1973–74 6.1 1982–83 10.3
1969–70 0 1974–75 15.5 1983–84 4.3
1970–71 0.5 1975–76 8.6 1984–85 –0.4
1971–72 4.0 1976–77 9.1 1985–86 0.1
1972–73 4.7 1977–78 4.9 1986–87 –0.3
1978–79 2.4
1979–80 1.2
1980–81 4.9
1981–82 9.3
Source: Gilbert (1987).
Table 9.3 The expansion of the French agricultural market share
1960 1967 1980
Grains (tons m) 23 32 48
(%) (33) (36) (40)
Sugar (tons m) 19 12 26
(%) (33) (20) (32)
Milk (tons m) 23 27 32
(%) (26) (28) (28)
Source: Gilbert (1987).
jovav3.indb 194jovav3.indb 194 16/12/10 16:52:0116/12/10 16:52:01
Copyright © 2011. Edward Elgar. All rights reserved. May not be reproduced in any form without permission from the publisher, except fair uses permitted under U.S. or
applicable copyright law.
EBSCO Publishing : eBook Collection (EBSCOhost) - printed on 6/9/2015 1:35 PM via UNIVERSIDAD RAFAELLANDIVARAN: 387706 ; Jovanovic, Miroslav N..; International Handbook on the Economics of IntegrationAccount: s4245486

European integration and agricultural protection: an introduction 195
For example, consumers were apprehensive about excessive price levels for agricul-
tural products. Is it true that the CAP has consumer interests at heart and that prices
are not too high? The fact is that prices at the farm gate have risen less than retail prices.
Without the CAP the purchasing power of consumers would have been higher. They
have been paying about 2.3 per cent of national income as income transfer to farmers
(see Table 9.4), but without the CAP there would have been a similar (national) transfer
to income. Therefore we should only look at the additional aspects, but these are dif-
fi cult to estimate. For example, consumers also had some interest in supply and self-
suffi ciency. The achievement of the latter is remarkable. For almost all products the
degree of self- suffi ciency has increased considerably since the inception of the EEC, often
to fi gures exceeding 100 per cent! As a consequence, ample supplies have been available
for consumers, but at a cost for them as taxpayers – they have also paid out large sums.
This has taken place in a period in which all countries have been experiencing serious
problems with government fi nances. So, when EC expenditures reached the limits of
the ‘own resources’ (in 1982/83) there was a problem but also a political opportunity to
change the CAP.
Foreign consumers have benefi ted from the CAP because food has become cheap;
this may have improved welfare in some countries although foreign exporters have suf-
fered: they complain of dumping. For developing countries the repercussions are mixed:
industrialisation policies benefi t, but those countries that give priority to agricultural
Table 9.4 Estimates of EC transfers and costs as a result of the CAP as a percentage of
GDP and on a per person basis*
Period Cost to
consumers
Cost to
taxpayers
Total cost to
consumers and
taxpayers
Cost to the
economy
(deadweight losses)
As a percentage of GDP (%)
EC9
1974–78 0.6 1.1 1.7 0.16
peak 1.8 1.0 2.8 0.48
EC10
1983 1.2 1.0 2.2 0.32
Average 1973–83 1.3 1.0 2.3 0.30
Per person (in 1982 values, ECU)
EC9
1974–78 48 84 132 12
Peak 163 85 248 43
EC10
1983 112 90 202 29
Average 1973–83 112 86 198 27
Note: * After allowance for the estimated eff ect of EC support policies on world market prices for major agricultural products.
Source: Bureau of Agricultural Economics (1985).
jovav3.indb 195jovav3.indb 195 16/12/10 16:52:0116/12/10 16:52:01
Copyright © 2011. Edward Elgar. All rights reserved. May not be reproduced in any form without permission from the publisher, except fair uses permitted under U.S. or
applicable copyright law.
EBSCO Publishing : eBook Collection (EBSCOhost) - printed on 6/9/2015 1:35 PM via UNIVERSIDAD RAFAELLANDIVARAN: 387706 ; Jovanovic, Miroslav N..; International Handbook on the Economics of IntegrationAccount: s4245486
196 International handbook on the economics of integration, volume III
development have suff ered. The external (net) welfare eff ect of the EC agricultural price
policy is diffi cult to assess and is still a much debated issue (de Hoogh, 1987).
Some politicians and economists feared the high real costs of protection: too many
resources in agriculture, a defi cient structure and low productivity. According to Article
39, this should be prevented and in this the agricultural policies have been successful.
Since the Treaty of Rome was signed, there has been an enormous outfl ow of agricul-
tural labour (about 4 per cent per year), an increase in farm size and a rise in technical
productivity (by between 3 and 5 per cent per year, a rate that was as good as any that
can be found in industry).
It is true, however, that as a consequence of price protection, labour (which could have
been better employed in other parts of the economy) was retained in agriculture – at the
expense of the GDP of the EC. So there are real costs involved with the CAP, but these
are not more than 0.5 per cent of GDP (see Table 9.4). In the period of growth between
1965 and 1975 this was not a large burden, particularly when it is recalled that without the
CAP, there would also have been national price policies, which would have had their real
costs. The additional real costs of the CAP are therefore around 0.2 per cent of GDP.
According to Scitovsky (1958, p. 67), the real benefi t of free trade between member
states was perhaps 0.1 to 0.5 per cent of GDP. In comparison, the cost of agricultural
protection was high.
This was acceptable only because the political and ‘dynamic’ benefi ts were consider-
able. It is not surprising that protests against the CAP became more vociferous in the
1980s when economic growth, the dynamic benefi ts of integration and even the political
benefi ts seemed too small.
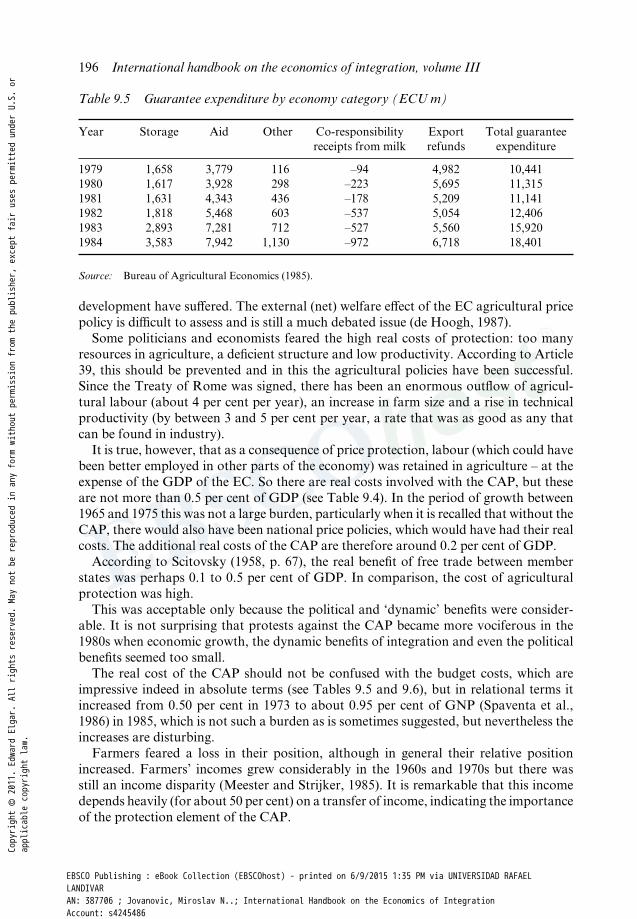
The real cost of the CAP should not be confused with the budget costs, which are
impressive indeed in absolute terms (see Tables 9.5 and 9.6), but in relational terms it
increased from 0.50 per cent in 1973 to about 0.95 per cent of GNP (Spaventa et al.,
1986) in 1985, which is not such a burden as is sometimes suggested, but nevertheless the
increases are disturbing.
Farmers feared a loss in their position, although in general their relative position
increased. Farmers’ incomes grew considerably in the 1960s and 1970s but there was
still an income disparity (Meester and Strijker, 1985). It is remarkable that this income
depends heavily (for about 50 per cent) on a transfer of income, indicating the importance
of the protection element of the CAP.
Table 9.5 Guarantee expenditure by economy category (ECU m)
Year Storage Aid Other Co- responsibility
receipts from milk
Export
refunds
Total guarantee
expenditure
1979 1,658 3,779 116 –94 4,982 10,441
1980 1,617 3,928 298 –223 5,695 11,315
1981 1,631 4,343 436 –178 5,209 11,141
1982 1,818 5,468 603 –537 5,054 12,406
1983 2,893 7,281 712 –527 5,560 15,920
1984 3,583 7,942 1,130 –972 6,718 18,401
Source: Bureau of Agricultural Economics (1985).
jovav3.indb 196jovav3.indb 196 16/12/10 16:52:0116/12/10 16:52:01
Copyright © 2011. Edward Elgar. All rights reserved. May not be reproduced in any form without permission from the publisher, except fair uses permitted under U.S. or
applicable copyright law.
EBSCO Publishing : eBook Collection (EBSCOhost) - printed on 6/9/2015 1:35 PM via UNIVERSIDAD RAFAELLANDIVARAN: 387706 ; Jovanovic, Miroslav N..; International Handbook on the Economics of IntegrationAccount: s4245486

European integration and agricultural protection: an introduction 197
So there have been some real problems: real costs, income transfers, budgetary costs,
income disparity, and disturbance of international trade and development policies.
Nevertheless, the EC acquired six new members: Greece, the UK, Eire, Denmark, Spain
and Portugal. The recent entry of more new members will lead to additional problems
in all these areas.
5 SOLUTIONS AND PROSPECTS
In retrospect, we can say that the European policy to achieve peace, stability and democ-
racy in Europe has been a priority. The policies of economic integration can be seen as
a means of achieving this goal. The agricultural policy is part of this policy and is also a
concrete example of the complicated and costly means of achieving that goal. The main
element is protection of farm income.
The situation is now very diff erent from that in the 1950s. We are no longer con-
cerned with reconstruction and reconciliation, and East–West relations have changed
considerably.
There is no longer any fear of food shortages. Now the emphasis is more on daily,
technical problems than on dealing with high ideals. Nevertheless, there are grave social
and economic problems and it is surprising that there are not more common actions
against unemployment, environmental destruction and energy problems, or for scientifi c
research and development strategies. The entry into the EEC of Spain, Portugal and
countries in Eastern Europe recalled the idealistic desire to strengthen democracy in
Europe. But again, even these important policies are overshadowed by a large number of
more or less technical problems concerning vegetables, grain, wine, money and all kinds
of foreign relations in the Mediterranean, and in developing countries, to say nothing of
energy problems.
I believe that France and the northern areas of the EU are now in a similar position
Table 9.6 Community revenue and expenditure (ECU m)
Item 1974 1976 1978 1980 1982 1984
Revenue
Customs duties 2,737 4,064 4,391 5,906 6,815 7,884
Agricultural levies 330 1,164 2,279 2,002 2,228 3,172
Value- added tax 7,259 12,000 14,377
Other 1,669 2,765 5,507 899 197 1,816
Total 5,036 7,993 12,177 16,066 21,241 27,249
Expenditure
Agriculture
Guarantee Section 3,278 5,365 9,279 11,306 12,406 18,333
Guidance Section 128 218 324 601 548 675
Total 4,516 7,238 11,973 16,290 20,012 27,249
Agriculture’s share (%) 75 77 80 73 65 70
Source: Bureau of Agricultural Economics (1985).
jovav3.indb 197jovav3.indb 197 16/12/10 16:52:0116/12/10 16:52:01
Copyright © 2011. Edward Elgar. All rights reserved. May not be reproduced in any form without permission from the publisher, except fair uses permitted under U.S. or
applicable copyright law.
EBSCO Publishing : eBook Collection (EBSCOhost) - printed on 6/9/2015 1:35 PM via UNIVERSIDAD RAFAELLANDIVARAN: 387706 ; Jovanovic, Miroslav N..; International Handbook on the Economics of IntegrationAccount: s4245486

198 International handbook on the economics of integration, volume III
as Germany was in 1957. The new countries have special agricultural interests, just as
the founding EU members now have industrial interests. It is interesting indeed to ‘swap
markets’. It is even questionable whether France did in fact have such a large economic
interest in grain exports as was said at the time (Harvey, 1982). But nowadays even
France is an industrial nation and should allow Eastern European countries an opportu-
nity to develop, in exchange for participation in a large industrial market. The CAP has
the historical role of improving and accelerating economic and political integration and
should not become a hindrance to these policies.
Many proposals for new policies have been put forward and some have been incorpo-
rated into the CAP. I believe it is unwise to continue changing policies each season. There
are still many alternatives open to the CAP. Let us consider some major examples.
One of the oldest alternatives is a structural policy. Price levels could be lower if there
were a modern well- structured agriculture. Thus in the late 1960s Commissioner Sicco
Mansholt proposed a plan to achieve this in agriculture. The idea was to accelerate the
outmigration of rural labour and the modernisation of agriculture. This plan ran into
much opposition because of its fl aws. For example, it had a low rate of return, needed
a large budget, did not consider the unfavourable social consequences of migration and
disregarded the vested interests of the agricultural lobby. Today we could also use a better
organised agriculture, but a new Mansholt Plan would not be a wise policy: an additional
outfl ow of labour from agriculture would be unprofi table because of unemployment, and
the modernisation of agriculture could also lead to more production and more surpluses,
which is also unprofi table. Additional structural measures are therefore not the solution,
although some doubts about this have been raised because of the recent shortage of grain.
An eff ective measure is to decrease price levels or levels of protection. The high price
levels compared to world market prices were the real cause of surpluses. Many would
gain from lower prices, but farming and some agribusiness would not. The income posi-
tion of farmers is an important aspect of agricultural policies in Europe and this policy
line is therefore not generally acceptable in real politics, for example, when applied to
cereals in 1985 it created much political tension in the Community. Comparable pro-
posals that have been considered have involved increases in import prices, especially of
feedstuff s, which have always led to an intensive political debate with no results. It is
diffi cult to predict whether recent high price levels for cereals on the world market will
be upheld in the future.
To have the advantages of low prices but also to maintain income protection and
the social position of farmers, Professor J.F. van Riemsdijk proposed a direct income
payment system in which the loss of income resulting from the lower prices would be
compensated for by direct income payments to farmers. These payments would only be
made for a limited period, at most 20 years, and only to farmers up to 65 years of age.
This would give a stimulus to improve farming, because after that transitional period low
prices would rule the agricultural economy and to survive, farmers would need large and
modern farms. This plan was also debated but rejected, because it also had a low rate
of return, needed a large budget and would have led to massive migration, with all its
attendant social and political repercussions. Today, all these problems would still follow
such a policy to an even greater degree, because an additional outmigration is not at all
profi table and any increase in the budget for agriculture would meet with considerable
political opposition.
jovav3.indb 198jovav3.indb 198 16/12/10 16:52:0116/12/10 16:52:01
Copyright © 2011. Edward Elgar. All rights reserved. May not be reproduced in any form without permission from the publisher, except fair uses permitted under U.S. or
applicable copyright law.
EBSCO Publishing : eBook Collection (EBSCOhost) - printed on 6/9/2015 1:35 PM via UNIVERSIDAD RAFAELLANDIVARAN: 387706 ; Jovanovic, Miroslav N..; International Handbook on the Economics of IntegrationAccount: s4245486

European integration and agricultural protection: an introduction 199
Another method is to restrict production by imposing production quotas per country
and per farmer. There is a wide range of possibilities in this fi eld. The super- levy system
now in use in the dairy sector is perhaps the best- known example, but it is a purely techni-
cal measure. It restricts production and therefore decreases the budget costs of the CAP
but without the basic systematic improvements that the above- mentioned alternative
policies promised to give. The restrictive measures that have been taken for sugar and
milk have changed the CAP system from an unlimited guarantee to a limited one. This
is already a considerable change when we realise how strongly the farmers are organised
compared with all other interest groups involved.
Other interesting proposals involve taking marginal land out of agricultural produc-
tion and using it for timber production or for recreation. The diffi culty with this policy
idea is to fi nd this marginal land. For example, in the Netherlands, there are consider-
able areas of this type of land available, but it is claimed that timber production is not
profi table and therefore not an attractive alternative to milk production. But in various
other regions it could indeed be a splendid idea to increase alternative production. The
problem with labour- intensive products like timber is that new means have to be found
to protect employment now found in the CAP.
This would require an additional social policy. It is interesting to note that such
policies of new uses of agricultural land have a positive eff ect on the environment.
Each of these measures has its variations. So in theory, there are many alternative
proposals for solving the CAP problems. Among economists there is a strong tendency
to try to fi nd the optimal instrument in that series of solutions by estimating the total net
eff ect on the welfare of the Community that each instrument would have, and selecting
the highest- scoring measure. The diffi culty with this procedure, based on Tinbergen’s
theory of economic policy (Tinbergen, 1952), is, that there is no social welfare function
or no such function can be specifi ed and estimated. So it is no use looking for an instru-
ment or measure that will lead to the maximum value of this function (van den Noort,
1983). This method can only be applied to individual or partial preferences but will not
refl ect the social preferences of a nation or the Community as a whole. The real selec-
tion can therefore be done only by other, that is, political, means. This conclusion is too
often overlooked by economists. The Council of Ministers (a result of President Charles
de Gaulle’s policy towards the EEC in 1965), was a kind of coalition government of the
EEC: 10 ministers working towards common decisions. The bartering of votes between
them is an obvious way of reaching agreement. To reach unanimity will require greater
strength and more exchanges or trade- off s than simple majority rule would require.
Because in practice this Council deals only with agricultural aff airs and not all types of
other aff airs (as a national cabinet must do), the political bargaining leads to even more
measures in the agricultural environmental fi eld, each time making agricultural policy
more expensive (see Table 9.7).
So if we could fi nd more common policies (for example, for energy, environment,
unemployment, research) and if we could apply majority rule, we could fi nd easier and
cheaper political solutions for agriculture too, but not with an ever- increasing number
of member states.
The CAP was quite introverted in character, because it was largely the representatives
of farmers and the ministers of agriculture who were involved in the decision- making
process in Brussels. The only opportunity for others to infl uence the process was if the
jovav3.indb 199jovav3.indb 199 16/12/10 16:52:0116/12/10 16:52:01
Copyright © 2011. Edward Elgar. All rights reserved. May not be reproduced in any form without permission from the publisher, except fair uses permitted under U.S. or
applicable copyright law.
EBSCO Publishing : eBook Collection (EBSCOhost) - printed on 6/9/2015 1:35 PM via UNIVERSIDAD RAFAELLANDIVARAN: 387706 ; Jovanovic, Miroslav N..; International Handbook on the Economics of IntegrationAccount: s4245486

200 International handbook on the economics of integration, volume III
‘own means’ of the Community fell short. This led to new proposals for fi nancing the
Community or to reform the CAP, but they failed to bring about any real improvements
(Pelkmans, 1985).
An enlarged EEC could not continue with its agricultural policies in the same way
as it did before the entry of Spain and Portugal. Continuing to increase price levels was
leading to grave problems. Furthermore, small farmers, with only small means of pro-
duction (of which there are many, especially in Southern Europe) can never be assured
of a reasonable income by price policies alone. High prices also lead to large income
diff erences within agriculture, and have a tendency to lead to high rents and land prices.
Experience with former proposals shows that it will be neither simple nor easy to
realise changes in economic and social measures for agriculture.
All this became less and less important in the 1990s because of unexpected develop-
ments in Eastern Europe, which demonstrated that a detailed knowledge of the internal
structure is not suffi cient to understand integration policies in reality.
6 A WALL CAME DOWN
This experiment with economic integration in Western Europe started around 1949 and
after 40 years of development something amazing happened: the notorious Berlin Wall
came down, leading to the end of communist rule in Eastern Europe. In a rather short
period, the USSR was dissolved and a large number of new nation- states appeared. One
of the old sources of inspiration for European integration disappeared in the course of
the process: fear of communism and of the mighty USSR. The Warsaw Pact and the
Council for Mutual Economic Assistance (COMECON or CMEA) also lost infl uence as
stimulators of integration in the West.
Various new problems arose, for example, how to deal with Eastern Germany and
later with the new independent states in the eastern part of Europe. Here we can see now
that the old idea of reconciliation began to play an important role again, as did measures
to increase stability and democracy.
There were also new problems, for example, with the legal and political structure of the
Community (the so- called ‘constitutional’ problem) with new member states and with oil
and ethanol produced from agricultural products, problems with the exchange rates, and
with the rate of economic growth (including the new fear of recession and even of a real
Table 9.7 EC budget and agricultural expenditure, mid- period, 1980s (ECU m)
Year Total EC budget Total for agriculture Guarantee Structure
1982 20,705 13,055 12,405 605
1983 24,807 16,539 15,811 728
1984 27,208 19,022 18,346 676
1985 28,100 20,463 19,744 719
1986 35,174 22,938 22,153 785
1987 36,247 23,999 23,003 995
Source: EC Commission, Brussels.
jovav3.indb 200jovav3.indb 200 16/12/10 16:52:0216/12/10 16:52:02
Copyright © 2011. Edward Elgar. All rights reserved. May not be reproduced in any form without permission from the publisher, except fair uses permitted under U.S. or
applicable copyright law.
EBSCO Publishing : eBook Collection (EBSCOhost) - printed on 6/9/2015 1:35 PM via UNIVERSIDAD RAFAELLANDIVARAN: 387706 ; Jovanovic, Miroslav N..; International Handbook on the Economics of IntegrationAccount: s4245486

European integration and agricultural protection: an introduction 201
depression). There were also new environmental problems with, as a consequence, some
climate policies being introduced. There was a strong tendency towards globalisation,
which has given all European policies an unexpected global twist, including agricultural
policies because they are important for world markets and have an enormous impact
on developing countries, for example, the unexpected rise in the price of wheat, rice and
dairy produce in recent years. There were new economic theories, for example indicat-
ing that there was no longer any end to economic growth, which after a couple of years
appeared to be a misconception. There were serious diplomatic problems, even leading
to wars in the Balkans and later in the Middle East. And in the year 2009 we had to face
an unexpected recession. We speak often of fi nancial, economic, energy, food and water
crises – which have profound eff ects for all of us, but most certainly also for the CAP.
What will be the consequences of all these problems for that unique experiment –
European integration – and how will this, in its turn, infl uence the common agricultural
policies of Western Europe? Of course, all this is too ambitious a subject to be dealt with
in these few pages. There are certainly some limits to agricultural policies in an extended
Community, but there are also prospects, as Jovanović (2005) demonstrated.
The experience with agriculture in the process of economic integration is important
for the understanding of integration policies in other parts of the world, as demonstrated
by Angarita and Coff ey (1981) for Latin America. I shall confi ne my contribution to the
great experiment itself, which took place after the Second World War. The prospects
for integration and agriculture involve possibilities and also opinions (the past and also
the future). They involve extrapolations of tendencies and also special theories of what
might happen as, for example, the studies of the so- called Club of Rome about limits to
economic growth. Speculation about what might happen often goes under the guise of
science, but we have to understand, as Northrop (1960, p. 235) pointed out, that such
so- called strict scientifi c predictions are impossible in the economic realm.
SUMMARY
The political background of the present European Union is the European Economic
Community. At the basis of this community lay the so- called reconciliation between
France and Western Germany. Reconciliation is still fundamental, as we can see in the
policies to include former communist states, or nations that recently made war in the
Balkans.
At the core of this important policy of the 1950s was the ‘great grain deal’, which
secured the agricultural interests of France – fi rst of all grain production – in cooperation
with the more industrial- oriented West German Republic.
It was the fi rst Commissioner for Agriculture, Dutchman Sicco Mansholt, who turned
this deal into a Common Agricultural Policy and, therefore, transformed the plan of
integration into a political reality, which still exists today.
It is interesting to see that this important aspect was of course not available in other
areas, in Europe or Latin America, where there were tendencies towards economic inte-
gration. In these cases agriculture could not be used as a motor to power the process – in
fact agriculture appeared to function as a brake or even as an obstacle for the coopera-
tion or integration process, and was frequently simply left out of any deal.
jovav3.indb 201jovav3.indb 201 16/12/10 16:52:0216/12/10 16:52:02
Copyright © 2011. Edward Elgar. All rights reserved. May not be reproduced in any form without permission from the publisher, except fair uses permitted under U.S. or
applicable copyright law.
EBSCO Publishing : eBook Collection (EBSCOhost) - printed on 6/9/2015 1:35 PM via UNIVERSIDAD RAFAELLANDIVARAN: 387706 ; Jovanovic, Miroslav N..; International Handbook on the Economics of IntegrationAccount: s4245486
202 International handbook on the economics of integration, volume III
Conditions change all the time, making policy changes both needed and desirable.
Nevertheless, this is very diffi cult to realise with so many member states and their vested
interests. A close study reveals a series of reform plans, which were heavily debated and
occasionally implemented in real policy changes. The various measures and changes are
well known to students of integration, but they do not explain why agriculture was so
important in the early stages of the formation of the European Union. We have to realise
that agriculture was not simply a business of using land, or economic integration, but
involved the creation of a single market.
Keywords
Grain deal, Common Agricultural Policy, France, protection, cereals, surpluses, agricul-
tural prices, reconciliation.
JEL Classification
Q10, Q17, Q18.
REFERENCES
Angarita, C. and Peter Coff ey (1981), Europe and the Andean Countries: A Comparison of Economic Policies and Institutions, Pinter, London.
Bureau of Agricultural Economics (1985), ‘Agricultural Policies in the European Community, their Origins, Nature and Eff ects on Production and Trade’, Policy Monograph No. 2, Bureau of Agricultural Economics, Canberra.
de Hoogh, J. (1987), ‘Agricultural policies and the Third World’, Tijdschrift voor Sociaalwetenschappelijk onderzoek van de Landbouw, 2, 68–81.
Gilbert, A. (1987), ‘Twintig jaar Europese Landbouw, Groen Europa’, Landbouwbulletin, 217, Brussels.Harvey, D.R. (1982), ‘National Interests and the CAP’, Food Policy, 7 (3) August, 174–90.Jovanović, M. (2005), The Economics of European Integration: Limits and Prospects, Edward Elgar,
Cheltenham, UK and Northampton, MA, USA.Meester, G. and D. Strijker (1985), Het Europese landbouwbeleid. Voorbij de scheidslijn van zelfvoorziening (The
European Agricultural Policy beyond the Boundary of Self- support), Netherlands Scientifi c Council for Government Policy, State Publishing Company, The Hague. (In Dutch).
Northrop, F.S.C. (1960), The Logic of Sciences and the Humanities, Meridian, New York.Pelkmans, J. (ed.) (1985), Can the CAP be reformed?, IEAP, Maastricht.Scitovsky, Tibor (1958), Economic Theory and Western European Integration, Unwin, London.Spaventa, L., L. Koopmans, L. Salmon, P. Smith and S. Spahn (1986), ‘The future of Community Finance’,
CEPS Papers no. 30, Centre for European Policy Studies, Brussels.Tinbergen, J. (1952), On the Theory of Economic Policy, North- Holland, Amsterdam.Tracy, M. (1982), Agriculture in Western Europe, Challenge and Response, Granada, London.van den Noort, P.C. (1983), ‘The problem of optimum policy choice in European agriculture’, Netherlands
Journal of Agricultural Science, 31, 93–7.Wells, S.J. (1973), International Economics, Allen & Unwin, London.
jovav3.indb 202jovav3.indb 202 16/12/10 16:52:0216/12/10 16:52:02
Copyright © 2011. Edward Elgar. All rights reserved. May not be reproduced in any form without permission from the publisher, except fair uses permitted under U.S. or
applicable copyright law.
EBSCO Publishing : eBook Collection (EBSCOhost) - printed on 6/9/2015 1:35 PM via UNIVERSIDAD RAFAELLANDIVARAN: 387706 ; Jovanovic, Miroslav N..; International Handbook on the Economics of IntegrationAccount: s4245486
203
10 The reforms of the Common Agricultural PolicyHuib Silvis and Roel Jongeneel
1 INTRODUCTION
The formation of the European Union (EU) is an example of economic integration sui
generis. Within the EU integration experiment, the integration with respect to agriculture
played a key role. It was one of the major conditions that had to be addressed in order
to get the whole experiment running.1 The Common Agricultural Policy (CAP) was and
still is a set of instruments to achieve, develop and further deepen this integration. At the
same time the policies can be specifi ed in such a way that they function as a stumbling
block to integration. As becomes clear after reviewing the evolution of the CAP, integra-
tion is an ongoing process, requiring multiple reforms. In this process, structural changes
in the economy and political–economy factors play a co- determining role and aff ect the
focus of the integration (Petit, 1989; Blandford, 1996). Initially, the emphasis of the CAP
was on internal market integration and protecting EU agriculture from world markets.
Later on, when for several products the EU switched to becoming a net exporter and
became more reliant on world markets for surplus disposal, issues of external integra-
tion (world trade relations and policies) became more prominent. At the same time, new
issues of integration emerged, such as environment, biodiversity, sustainable land use,
animal welfare and so on (Garzon, 2006). The (previous) enlargements of the EU15 with
10 new member states in 2004 and another two in 2007 are still a driving force.
This chapter is structured as follows. In Section 2 a brief overview of the agricultural
policy evolution is sketched, with the details left for explanation later. Since the budget
expenditure is considered to have been a primary driver in the CAP policy reform
process, Section 3 discusses the issue of fi nancial discipline. Section 4 describes a number
of key cases in the reform of the common market organisations. Section 5 discusses the
single farm payment scheme and cross- compliance. Section 6 brings in the EU’s rural
development policy evolution, which has become a second pillar of the CAP alongside
the traditional market and price support policy (fi rst pillar). Section 7 provides a fi nal
discussion, interpreting the past and future evolution of the CAP in an integration
perspective.
2 A SHORT HISTORY OF CAP REFORMS
When the EU started in the late 1950s, it was still a defi cit region with respect to a lot of
agricultural products. If imports from third countries are necessary to meet the demand,
the system of the market organisations for basic products can operate smoothly, at least
from a budget perspective. This was the case for grain and beef in the initial phase of the
Community, and for dairy products after the enlargement with Denmark, Ireland and
the United Kingdom in 1973. In this situation the common external tariff insulates the
jovav3.indb 203jovav3.indb 203 16/12/10 16:52:0216/12/10 16:52:02
Copyright © 2011. Edward Elgar. All rights reserved. May not be reproduced in any form without permission from the publisher, except fair uses permitted under U.S. or
applicable copyright law.
EBSCO Publishing : eBook Collection (EBSCOhost) - printed on 6/9/2015 1:35 PM via UNIVERSIDAD RAFAELLANDIVARAN: 387706 ; Jovanovic, Miroslav N..; International Handbook on the Economics of IntegrationAccount: s4245486
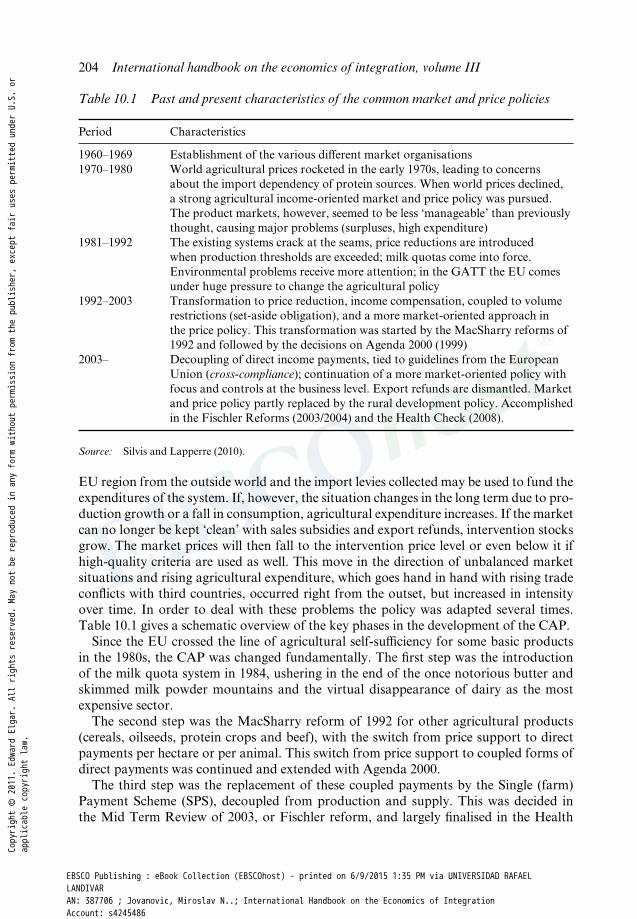
204 International handbook on the economics of integration, volume III
EU region from the outside world and the import levies collected may be used to fund the
expenditures of the system. If, however, the situation changes in the long term due to pro-
duction growth or a fall in consumption, agricultural expenditure increases. If the market
can no longer be kept ‘clean’ with sales subsidies and export refunds, intervention stocks
grow. The market prices will then fall to the intervention price level or even below it if
high- quality criteria are used as well. This move in the direction of unbalanced market
situations and rising agricultural expenditure, which goes hand in hand with rising trade
confl icts with third countries, occurred right from the outset, but increased in intensity
over time. In order to deal with these problems the policy was adapted several times.
Table 10.1 gives a schematic overview of the key phases in the development of the CAP.
Since the EU crossed the line of agricultural self- suffi ciency for some basic products
in the 1980s, the CAP was changed fundamentally. The fi rst step was the introduction
of the milk quota system in 1984, ushering in the end of the once notorious butter and
skimmed milk powder mountains and the virtual disappearance of dairy as the most
expensive sector.
The second step was the MacSharry reform of 1992 for other agricultural products
(cereals, oilseeds, protein crops and beef), with the switch from price support to direct
payments per hectare or per animal. This switch from price support to coupled forms of
direct payments was continued and extended with Agenda 2000.
The third step was the replacement of these coupled payments by the Single (farm)
Payment Scheme (SPS), decoupled from production and supply. This was decided in
the Mid Term Review of 2003, or Fischler reform, and largely fi nalised in the Health
Table 10.1 Past and present characteristics of the common market and price policies
Period Characteristics
1960–1969 Establishment of the various diff erent market organisations
1970–1980 World agricultural prices rocketed in the early 1970s, leading to concerns
about the import dependency of protein sources. When world prices declined,
a strong agricultural income- oriented market and price policy was pursued.
The product markets, however, seemed to be less ‘manageable’ than previously
thought, causing major problems (surpluses, high expenditure)
1981–1992 The existing systems crack at the seams, price reductions are introduced
when production thresholds are exceeded; milk quotas come into force.
Environmental problems receive more attention; in the GATT the EU comes
under huge pressure to change the agricultural policy
1992–2003 Transformation to price reduction, income compensation, coupled to volume
restrictions (set- aside obligation), and a more market- oriented approach in
the price policy. This transformation was started by the MacSharry reforms of
1992 and followed by the decisions on Agenda 2000 (1999)
2003– Decoupling of direct income payments, tied to guidelines from the European
Union (cross- compliance); continuation of a more market- oriented policy with
focus and controls at the business level. Export refunds are dismantled. Market
and price policy partly replaced by the rural development policy. Accomplished
in the Fischler Reforms (2003/2004) and the Health Check (2008).
Source: Silvis and Lapperre (2010).
jovav3.indb 204jovav3.indb 204 16/12/10 16:52:0216/12/10 16:52:02
Copyright © 2011. Edward Elgar. All rights reserved. May not be reproduced in any form without permission from the publisher, except fair uses permitted under U.S. or
applicable copyright law.
EBSCO Publishing : eBook Collection (EBSCOhost) - printed on 6/9/2015 1:35 PM via UNIVERSIDAD RAFAELLANDIVARAN: 387706 ; Jovanovic, Miroslav N..; International Handbook on the Economics of IntegrationAccount: s4245486

The reforms of the Common Agricultural Policy 205
Check decisions of 2008. The Fischler reform ‘decoupled’ direct aid to farmers, but
some member states chose to maintain some ‘coupled’ aid – that is, production- linked
payments. With the Health Check decisions these remaining coupled payments will now
be decoupled and moved into the single farm payment. The only exceptions are for the
suckler cow, goat and sheep premia, where member states may maintain current levels
of coupled support.
Whereas the EU started as a customs union, with member states agreeing to charge
the same external tariff s, over time it involved into a monetary union, although at this
stage not all member states have joined. With respect to agriculture the use of a common
currency, the euro, brought to an end the system of monetary compensatory amounts
(MCAs), a system of shadow exchange rates, introduced in the CAP to ‘preserve’ the
unity of the market (see Box 10.1).
The legislative texts of the CAP Health Check were adopted in early 2009. The steps
towards a more market- oriented CAP came as EU markets were under pressure – dairy
in particular – of low world market prices. The Health Check was not intended to be a
major reform – more a completion of various issues deferred in the Fischler reform, and
a number of points aimed at making the CAP more defendable, ahead of the next reform
for European farm policy after 2013. Among the driving forces for this new reform
are the new fi nancial framework, the outcome of the Doha Round and the discussion
between old and new member states about the distribution of agricultural support.
3 FINANCIAL DISCIPLINE
The dramatically rising expenditure of the CAP in the 1970s and 1980s was a particular
source of concern for many years. The reining in of this policy with the introduction of
an absolute spending ceiling from 1988 onwards, was largely aimed at forcing urgently
needed reforms (Bos, 2010).
Agricultural expenditures (in current prices) have increased from about €10 billion
in 1980 to more than €50 billion (including rural development) in 2007. Until recently
agriculture expenditure represented the largest part of total EU expenditure. Partly this
development has to be perceived in a context where agriculture was one of the main
areas where policy integration was pursued, whereas in several other areas a common
approach did not take off – or if it did, progress was slow. In 1970 85 per cent of the EU
budget was spent on the CAP. In the 1970s and 1980s this share fl uctuated between 60
and 70 per cent due to the development of other common policies. The introduction of
policy reforms saw the beginning of a structural fall in this share to 56 per cent in 1992
and 48 per cent in 2002. At the end of the current Financial Perspectives 2007–13, the
share of agriculture spending (including rural development policy) is set to come out
under the 40 per cent mark.
From 1982 to 1986 CAP expenditure rose on average by more than 15 per cent a year.
The budget estimates were systematically exceeded. The underlying cause was the pro-
ductivity increase of European agriculture combined with a high level of protection and
an active price policy which turned the EU from a net importer into a net exporter of key
agricultural products. Because an eff ective limit on agricultural spending was lacking,
agriculture ministers were not forced to reform the CAP during this period.
jovav3.indb 205jovav3.indb 205 16/12/10 16:52:0216/12/10 16:52:02
Copyright © 2011. Edward Elgar. All rights reserved. May not be reproduced in any form without permission from the publisher, except fair uses permitted under U.S. or
applicable copyright law.
EBSCO Publishing : eBook Collection (EBSCOhost) - printed on 6/9/2015 1:35 PM via UNIVERSIDAD RAFAELLANDIVARAN: 387706 ; Jovanovic, Miroslav N..; International Handbook on the Economics of IntegrationAccount: s4245486

206 International handbook on the economics of integration, volume III
The impasse was broken by the Fontainebleau European Council (1984) which
induced the introduction of milk quotas to contain supply, before agreeing to further
expansion of fi nancial resources for the EU budget. Agriculture ministers were subse-
quently forced in 1988 to accept budget stabilisers in the CAP, after which the European
Council approved the fi rst Financial Perspectives (Delors I package). In order to disci-
pline agriculture expenditure, a guideline was enforced by the 1988 Council decision on
budgetary discipline. The guideline stipulated that agriculture expenditure (excluding
structural policy) should not exceed 74 per cent of the annual growth of the GNP of the
BOX 10.1 GREEN CURRENCIES, MONETARY COMPENSATORY AMOUNTS AND MARKET INTEGRATION
In the standard system of the CAP’s common market organisations one price prevails throughout the market (full market integration). Before the introduc-tion of the euro, agricultural prices and payments were calculated by the so- called green ECU. This was the equivalent of the ECU as defi ned in the EMS, plus 20.75 per cent. The percentage increase was the result of a re- alignment between the green ECU and the ECU- EMS which took place on 1 February 1995.This complex system had longstanding origins, going back as far as the devaluation of the French franc with respect to the Deutschmark in 1969.
To avoid politically unacceptable consequences for farm incomes, infl ation rates and unity of agricultural prices, the Community at that time instituted a system of import and export payments in intra- Community trade in agricultural products. These payments were negative (levies) or positive (restitutions) according to whether products passed from a weak currency country to a strong currency country or vice versa. This was the system of monetary compensatory amounts (MCAs).
The MCAs had the effect of breaking the unity of the common market in agri-culture, leading to distortions. The Community decided to dismantle it, introduc-ing the switchover mechanism* with Regulation 855/84. This brought about an increase in prices in national currencies for farmers throughout the Community in order to keep prices stable in one or two of them where there had been a revaluation of currencies. The system also contributed to increasing Community expenditure because of the increases in all prices, subsidies and aid paid for from the FEOGA (Fonds Europeen d’Orientation et de Garantie Agricole: see EAGGF in Figure 10.2) Guarantee Section (Ritson and Swinbank, 1997).
After 30 years there was a return to the ‘normal’ situation existing prior to 1969. Since 1 January 1999, all agricultural payments are made at the parities of the national currencies with the euro and no longer with the green ECU.
Note: * Switchover was an agro- monetary mechanism by which, in three phases, MCAs were transformed and later eliminated.
jovav3.indb 206jovav3.indb 206 16/12/10 16:52:0216/12/10 16:52:02
Copyright © 2011. Edward Elgar. All rights reserved. May not be reproduced in any form without permission from the publisher, except fair uses permitted under U.S. or
applicable copyright law.
EBSCO Publishing : eBook Collection (EBSCOhost) - printed on 6/9/2015 1:35 PM via UNIVERSIDAD RAFAELLANDIVARAN: 387706 ; Jovanovic, Miroslav N..; International Handbook on the Economics of IntegrationAccount: s4245486

The reforms of the Common Agricultural Policy 207
EU on an annual basis. This entails a gradual reduction in the size of agricultural spend-
ing in relation to EU GNP.
In the 1988–92 period, agricultural spending remained fi rmly within the guideline.
This was due to both the high level of expenditure in 1988 and favourable economic
conditions. Part of the budgetary margin under the guideline was used for fi nancing
agriculture expenditure in former East Germany after reunifi cation.
In 1992 the MacSharry reforms opened the way to more market- oriented agricultural
policies. Price support for arable products was partly replaced by direct income compen-
sation. Two aspects of this are of signifi cance for the EU budget. First, direct income
support is predictable and thus in budgetary terms more manageable than product-
related price support which is strongly dependent on volatile market conditions. Second,
the MacSharry reforms implied a shift of burden from consumers to the EU budget and
ultimately the taxpayer. Therefore it has improved overall economic effi ciency but not
resulted in signifi cant budget savings. However, the guideline provided suffi cient space to
cover the post- reform CAP expenditure.
The Berlin European Council (1999) decided to tighten budgetary discipline by
setting the annual ceilings for agriculture expenditure in the Financial Framework
2000–06 lower than stipulated by the guideline. The agriculture expenditure heading
was also split into two categories. Category 1a concerns market- related expenditure
and direct income support as well as veterinary expenditure. Category 1b concerns rural
development.
The fi nancial framework 2000–06 was established on the premise that the EU would
be enlarged by six new member states and that these states would get no direct income
support in the context of the CAP. These premises appeared to be politically infeasible.
In the end there were 10 new member states and a gradual phasing- in of income support
in these countries was inevitable. Meanwhile the European Council decided in October
2002 to restrict the nominal increase in agriculture expenditure for market measures and
direct payments (thus excluding rural development policy) up to and including 2013 to a
maximum of 1 per cent per year. Assuming 2 per cent infl ation this represents a real fall
in the ceiling of agricultural expenditure of 1 per cent per year. The gradual phasing- in
of the direct income support to farmers in the new member states must be fi tted under
this ceiling.
EU agricultural spending continued to rise in the 1970s and 1980s, but has become
more manageable in recent years. The change from price support to payments, in partic-
ular for cereals and beef, which began in the 1990s, caused spending to rise dramatically
(Figures 10.1 and 10.2). The drastic increase in ‘Other’ payments after 2005, refl ects the
transition to the SPS, which will be explained below. The category not only includes the
decoupled payments but also the partially decoupled SPS payments.
4 EVOLUTION OF THE MARKET ORGANISATIONS
It is neither possible nor useful here to describe all the features and changes of the
common market organisations for all products. Details on the latest changes are pro-
vided in the CAP Monitor (Agra Europe, 2009). To illustrate the general CAP evolution,
this section sketches the policies for a selected number of products: cereals, oilseeds and
jovav3.indb 207jovav3.indb 207 16/12/10 16:52:0216/12/10 16:52:02
Copyright © 2011. Edward Elgar. All rights reserved. May not be reproduced in any form without permission from the publisher, except fair uses permitted under U.S. or
applicable copyright law.
EBSCO Publishing : eBook Collection (EBSCOhost) - printed on 6/9/2015 1:35 PM via UNIVERSIDAD RAFAELLANDIVARAN: 387706 ; Jovanovic, Miroslav N..; International Handbook on the Economics of IntegrationAccount: s4245486

208 International handbook on the economics of integration, volume III
protein crops; sugar; dairy; and beef. Finally, special attention is given to the single
Common Market Organisation (CMO), the new legal framework for the agricultural
market and price activities of the EU.
Cereal, Oilseeds and Protein Crops
The market organisation for cereals was threatened by the growing use of competing
products in compound animal feed such as tapioca, cereal residues, maize gluten feed
and fruit pulp. This was called ‘the problem of the cereal substitutes’ (Harris et al., 1983).
With the increase in imports of cereal substitutes came an annual fall in cereal consump-
tion of 1.5–2 per cent. Around 1980 there was an agreement with Thailand to stabilise
the imports of tapioca. The other substitutes, such as maize gluten and fruit pulp, came
mainly from the USA and Latin America. In the 1980s a so- called ‘guarantee threshold’
was introduced for cereals, when the EU was more than self- suffi cient in this area. If
cereal production exceeded this threshold, a discount of 3 per cent was applied during
the next price- fi xing round. Later in the 1980s, a co- responsibility levy was imposed
on cereals, which was partly dependent on the extent to which the threshold guarantee
was exceeded. Similar guarantee threshold formulae (stabilisers) were drawn up for the
oilseeds and protein- rich cattle feed raw ingredients. The stabilising decisions of 1988
also comprised voluntary regulations for setting aside grain acreage for one or fi ve years.
But none of the various measures seemed to work: cereal production in the Community
continued to rise.
The decrease in use and the increase in production were an important argument for
the MacSharry reform of 1992. The reform package was agreed bilaterally with the
USA and paved the way for the agriculture agreement in the Uruguay Round. The
reform package was partly concerned with restoring the market balance for agricultural
products, strengthening the EU’s international competitive position, a more- even distri-
bution of agricultural support, improvements in the relationship with the environment
(extensifi cation) and safeguarding employment in the countryside. The fi nal agreed
0
5,000
10,000
15,000
20,000
25,000
30,000
35,000
40,000
45,000
1985 1990 1995 2000 2005 2007
Direct payments
Export restitutions
Intervention
Source: European Commission (2008a).
Figure 10.1 Composition of EU expenditure (€ m) for price and income support,
1985–2007
jovav3.indb 208jovav3.indb 208 16/12/10 16:52:0216/12/10 16:52:02
Copyright © 2011. Edward Elgar. All rights reserved. May not be reproduced in any form without permission from the publisher, except fair uses permitted under U.S. or
applicable copyright law.
EBSCO Publishing : eBook Collection (EBSCOhost) - printed on 6/9/2015 1:35 PM via UNIVERSIDAD RAFAELLANDIVARAN: 387706 ; Jovanovic, Miroslav N..; International Handbook on the Economics of IntegrationAccount: s4245486

The reforms of the Common Agricultural Policy 209
reform contained a fundamental change to the EU agricultural policy: a transition from
price support, which is by defi nition tied to product, to lower prices with direct income
support in the form of area payments. The reform decisions for cereals boiled down to a
reduction in EU prices by about 30 per cent over a three- year period.
For larger growers of cereals, rapeseed, specifi c protein crops and corn silage the pay-
ments were conditional on setting aside at least 15 per cent of the acreage of these prod-
ucts for non- food crops. Due to the reduction in grain stocks the set- aside percentage
was decreased little by little. Figure 10.2 shows that this reform in the 1990s resulted in a
dramatic increase (about 80 per cent) in the budget for arable products, with almost the
entire arable budget going to area payments.
The set- aside rule also applied to oilseeds and for peas and beans grown for cattle
fodder. The support system for these products was challenged by the US in the General
Agreement on Tariff s and Trade (GATT). After the 1992 reform, area payments were
paid out for these products. The oilseed agreement reached in June 1993 with the US and
ratifi ed by GATT provides for a maximum acreage of about 5 million ha for these crops
in the EU.
For the above- mentioned arable products the reform in the context of Agenda 2000
(Berlin 1999) was a lot less radical than that of 1992. However, the cereal prices were
reduced again, this time by 15 per cent. While the price reduction of the MacSharry
reform was fully compensated, the compensatory payments in Agenda 2000 was limited
to about 50 per cent of the gross price reduction.
At the time of the next reform, the Mid Term Review of 2003, now better known as
the Fischler reform, with the introduction of the SPS it was decided to make the com-
plete decoupling of support the rule. However, member states did get the opportunity to
have 25 per cent of the payments per hectare coupled to production. The intervention
19851980 1990 1995 2000 2005 20070
5,000
10,000
15,000
20,000
25,000
30,000
35,000
40,000
45,000
OtherBeef and vealCerealsDairy
Note: EAGGF: European Agricultural Guidance and Guarantee Fund, since 2005 split into EAGF and EAFRD.EAGF: European Agricultural Guarantee Fund (created 2005); fi nances direct payments to farmers, and measures to regulate agricultural markets such as export funds.EAFRD: European Agricultural Fund for Rural Development (created 2005); fi nances the rural development programmes of member states.
Source: European Commission (2008a).
Figure 10.2 Evolution of the ex- EAGGF Guarantee Section (excluding rural
development) and EAGF expenditure (€ m) for selected sectors, 1980–2007
jovav3.indb 209jovav3.indb 209 16/12/10 16:52:0216/12/10 16:52:02
Copyright © 2011. Edward Elgar. All rights reserved. May not be reproduced in any form without permission from the publisher, except fair uses permitted under U.S. or
applicable copyright law.
EBSCO Publishing : eBook Collection (EBSCOhost) - printed on 6/9/2015 1:35 PM via UNIVERSIDAD RAFAELLANDIVARAN: 387706 ; Jovanovic, Miroslav N..; International Handbook on the Economics of IntegrationAccount: s4245486

210 International handbook on the economics of integration, volume III
arrangements for cereals remained unchanged, with the exception of the intervention for
rye, which disappeared.
As a result of market pressures it was decided in 2007 to lower the set- aside percent-
age to 0 per cent, and in the Health Check, set- aside was abolished. Import tariff s for
cereals were also suspended, and in fact remained at zero until the summer of 2008. As
a consequence, in a few years the cereal sector had gone from being a surplus sector to a
sector for which the EU had unilaterally reduced all import protection to zero: a unique
development, arising from radical internal reforms and a dramatic rise in grain prices
on the world market. This was also caused by the rapid economic growth in Asia and
the accompanying increase in demand for animal proteins. In addition, the demand for
biofuels has risen sharply, in the face of high oil prices and strong backing from various
diff erent governments.
Sugar
From the outset of the sugar market organisation in the 1960s, the EU restricted the
price guarantees to a certain volume of production. Each producer is entitled to the
full guaranteed price only for a basic ‘A- quota’, subject to a 2 per cent levy for fi nanc-
ing the system. For an additional ‘B- quota’ a levy is applied, which can be up to 39.5
per cent. Sugar produced above these quotas, so- called ‘C sugar’, had in principle to
be sold without support on the world market and so yielded no more than the world
market price. This was usually no more than 30–50 per cent of the price in the EU. Beet
producers in some member states received a pooled price.
The sugar market organisation provided rigorous import protection. In the context of
the Lomé agreement, the EU had made a preferential import agreement for sugar with
the so- called ACP countries: countries in Africa, the Caribbean and the Pacifi c. This
import arrangement consisted of a duty- free import quota (1.3 million tonnes), for which
these countries then received the high EU sugar price. The sugar policy was subject to
increasing criticism from other countries and the World Trade Organization (WTO),
which judged in 2004 that aspects of the sugar market organisation were contrary to
current WTO rules. In the context of the Everything but Arms (EBA) initiative, the EU
had also agreed to let the least- developed countries (LDCs) sell sugar on the EU market
without import tariff from 2009. If no adjustments were made, there would be a real risk
of disruption to the EU sugar market.
So it was decided in 2006 to introduce radical reforms. This meant a 36 per cent
reduction in the offi cial sugar price. The calculated loss of income suff ered by beet
growers was partially compensated (by 64 per cent) with a payment decoupled from
production. The intervention was limited to 600,000 tons per year. The second pillar
of the reform agreement was a restructuring fund that gave sugar producers the chance
to off er their production rights for buy- back. By 2010, the buy- back regulation should
lead to a shrinking of European sugar production by a third compared to 2006. The
consequence of this is that the EU will go from being a major net exporter of sugar to a
key net importer within a short time, in particular of sugar from the poorest developing
countries. One consequence of the reform is that the sugar- exporting Lomé countries
lose part of the price premium on their preferential sales into the EU. With the disap-
pearance of export refunds and the dismantling of the intervention mechanism into a
jovav3.indb 210jovav3.indb 210 16/12/10 16:52:0216/12/10 16:52:02
Copyright © 2011. Edward Elgar. All rights reserved. May not be reproduced in any form without permission from the publisher, except fair uses permitted under U.S. or
applicable copyright law.
EBSCO Publishing : eBook Collection (EBSCOhost) - printed on 6/9/2015 1:35 PM via UNIVERSIDAD RAFAELLANDIVARAN: 387706 ; Jovanovic, Miroslav N..; International Handbook on the Economics of IntegrationAccount: s4245486

The reforms of the Common Agricultural Policy 211
safety net since 2006, the sugar policy has been reformed to look much like that for the
other arable products.
Dairy
As mentioned in Section 3, the dairy market posed problems practically from the outset
of the market organisation, because production was rising too fast. To combat this,
various measures have been taken over the years, such as sales subsidies, conversion and
slaughter premiums, price reductions and (co- responsibility) duties. These measures had
precious little eff ect, so the milk quota was introduced in 1984.
This was offi cially intended to be a ‘temporary’ measure, but was extended several
times and now runs to 2015. In the fi rst instance, the total EU milk quota was equal to
the milk supplies in 1981 plus 1 per cent. Later a substantial reduction appeared to be
necessary. Only at the end of the 1990s was the quota expanded a little again. Expenditure
for the dairy policy fell steadily from the mid- 1980s. There was a particularly dramatic
fall in the expenditure on storage and domestic sales – the budgetary counterpart to the
famous butter mountain.
The quotas are allocated to individual businesses. Exceeding these quotas results
in a high levy. The super- levy was initially set at 115 per cent of the target price. The
quotas are tradable within many member states, but not between member states.
Various member states still see the quotas as an important measure for preserving milk
production in economically fragile agricultural areas.
On the one hand the quota system facilitates a gentle reorganisation because the
quotas can be sold, but on the other, they are also seen as a defi nite obstacle to the neces-
sary restructuring of the sector. And yet 50 per cent of the EU15 milk producers have
stopped in the last decade and their production has been taken over by other parties.
Since developments in the WTO mean that export support is being gradually phased
out and that import tariff s will be reduced, it was decided in June 2003 to lower the inter-
vention prices for skimmed milk powder and butter by 15 and 25 per cent, respectively.
This would also cause the milk price to fall. Approximately 60 per cent compensation
was paid out for this. In the fi rst few years the compensatory payment – in total about
€5 billion – was linked to the quota, but it has since been included in the ‘single farm
payment’.
Price supportive measures such as export refunds, domestic sales measures (baker’s
butter, milk powder for feed) and intervention were dismantled in 2007 due to the afore-
mentioned support- price reductions and the high prices for dairy products on the world
market. By mid- 2007 there were no intervention stocks for dairy products. In future,
intervention will be limited to relatively small maximum amounts in a specifi c period
(March–August).
Now that the price support in the dairy sector for a large part has been replaced by
decoupled direct income support, the discussion on ending milk quotas has reappeared
on the agenda. During the negotiations on the Health Check proposals there was a clear
majority of member states in favour of discarding quotas by the anticipated fi nal date
of 1 April 2015. A ‘soft landing’ is addressed by increasing quotas by 1 per cent every
year between 2009/10 and 2013/14, in addition to a 2 per cent quota increase in 2008/09
(Bouamra et al., 2008).
jovav3.indb 211jovav3.indb 211 16/12/10 16:52:0216/12/10 16:52:02
Copyright © 2011. Edward Elgar. All rights reserved. May not be reproduced in any form without permission from the publisher, except fair uses permitted under U.S. or
applicable copyright law.
EBSCO Publishing : eBook Collection (EBSCOhost) - printed on 6/9/2015 1:35 PM via UNIVERSIDAD RAFAELLANDIVARAN: 387706 ; Jovanovic, Miroslav N..; International Handbook on the Economics of IntegrationAccount: s4245486

212 International handbook on the economics of integration, volume III
Beef
The common beef policy encountered surprisingly few problems until the 1980s, because
the EU was a net importer. The situation changed with the introduction of milk quotas
which caused cattle farmers to switch to beef production. The increase in the supply of
beef resulted in huge intervention stocks and export quantities to third countries, and
thus to rising EU spending. When the market problems arose, changes in the interven-
tion policy were initiated at fi rst, mainly with respect to quality requirements, purchasing
periods and price levels.
In the context of the 1992 reforms more far- reaching reforms were pushed through,
similar to those for cereals. The intervention prices were lowered by 15 per cent in three
years, a ceiling was put in place for the intervention purchases (running to 350,000 tons
in 1997) and the premiums for steers and suckler cows were raised. For this last there
were maximums per business (90 steers and for suckler cows the number in 1990, 1991
or 1992) and per hectare (cattle density), the last running to 2 livestock units (lsu) in
1996. This was intended to extensify beef production and provide more opportunities
for cattle farmers in areas ‘disadvantaged by nature’, for example, mountainous regions.
The reform of the beef policy has led, as with grain, to an increase in the required budget.
Expenditure on interventions and refunds has fallen off dramatically, but spending on
direct premiums has risen sharply since 2000. In 2006 this amount fell again because
most of the premiums had been included in the single farm payment.
The Single CMO2
Until 2007, the EU was operating 21 separate CMOs, each governed by its own basic
regulation. The European Commission has been seeking to reform the CAP by moving
away from the traditional approach of legislating specifi c support measures for specifi c
production sectors. As explained in the next section, the introduction of the SPS is a clear
example of this ambition.
Another signifi cant development was the plan to make the functioning of the EU more
simple and less bureaucratic. The CAP, with its multitude of legislation covering a wide
range of production sectors, was a clear target for rationalisation. Most of the regula-
tions followed the same structure and had numerous provisions in common. This was the
case for some general provisions, for rules relating to the internal market and especially
for rules on trade with third countries.
The Commission therefore amalgamated the provisions of the sector regulations into
a single legal framework, replacing the sector approaches by horizontal ones, where pos-
sible and appropriate. A new single CMO was created, governed by a single regulation,
which controls the main elements of market support across the board. The Regulation
1234/2007 (Council of the EU, 2007) was agreed by EU agriculture ministers on 12 June
2007, came into force on 1 January 2008 and was fully active as from 1 January 2009.
The single CMO covers the following sectors: cereals; rice; sugar; dried fodder; seeds;
hops; olive oil and table olives; fl ax and hemp; bananas; live plants and fl owers; raw
tobacco; beef and veal; milk and dairy products; pigmeat; sheep and goatmeat; eggs;
poultrymeat; fruit and vegetables; and wine.
The single CMO sets out the rules on intervention mechanisms (private storage aid,
jovav3.indb 212jovav3.indb 212 16/12/10 16:52:0216/12/10 16:52:02
Copyright © 2011. Edward Elgar. All rights reserved. May not be reproduced in any form without permission from the publisher, except fair uses permitted under U.S. or
applicable copyright law.
EBSCO Publishing : eBook Collection (EBSCOhost) - printed on 6/9/2015 1:35 PM via UNIVERSIDAD RAFAELLANDIVARAN: 387706 ; Jovanovic, Miroslav N..; International Handbook on the Economics of IntegrationAccount: s4245486
The reforms of the Common Agricultural Policy 213
public storage, special measures, production quotas) specifi c aid schemes and trade
with third countries (imports and exports). Moreover, it contains rules on state aid and
competition. In principle, products covered by the CAP are subject to the basic aid and
competition provisions set out in the EU Treaty, except where a derogation is provided
under the regulation. The scope for such derogation is not small, as it covers ‘agree-
ments, decisions and practices’ necessary for the attainment of the objectives of the CAP.
In particular, normal competition law does not apply to the operations of producer
organisations operating within the scope of the CAP.
In the day- to- day management of the agricultural markets for products covered by
the CMO, the European Commission is assisted by the Management Committee for the
Common Organisation of Agricultural Markets. This committee is attended by member
state experts on a specifi c commodity, depending on which issues are on the agenda for
discussion.
The creation of a single CMO can be seen as a technical exercise designed to simplify
the CAP. This view has been stressed by the Commission. The single CMO is in line with
the trend of moving away from precise support for specifi c sectors towards direct income
support. However, it would be misleading to suggest that all sectors are now treated in
the same way: the CMO retains special clauses for the diff erent sectors.
5 SINGLE PAYMENT SCHEME AND CROSS- COMPLIANCE
The political origin of the direct income support, started by the MacSharry reform
of 1992, is to provide farmers fi nancial compensation for lowering the price support.
Although the MacSharry reform off ered 100 per cent compensation of revenue loss, in
later reforms the announced price declines were only partially compensated (with com-
pensation rates about 60–70 per cent). In practice, however, it turned out that the actual
compensation in some cases could still be more than 100 per cent, for example, because
the real decline in EU market prices was less than the reductions in intervention prices
and export subsidies or because of induced cost reductions.
Initially, the direct income payments were generally not fully decoupled from produc-
tion. For this reason, the payments were criticised as still being trade distortive. Also
the combination with compulsory set- aside aimed at curbing production did not change
this. In the WTO, the payments were classifi ed in the so- called ‘blue box’, a box compris-
ing policies which should be dismantled over time. With the Luxembourg Agreement
(outcome of the 2003 Mid Term Review of the CAP), however, an important next step
in the ongoing reform process was set: the direct payments were to a large extent to
be decoupled from production. In 2006, 82 per cent of the EU direct payments were
already decoupled and this share will further increase over time. ‘Decoupled’ means that
payments are no longer tied to the production of specifi c products, but receipt of the
so- called ‘single farm payments’ still requires that entitlements are matched to eligible
hectares (which must be maintained in a proper condition). Farmers are now in princi-
ple free to choose the optimal allocation of their type of production given market price
signals. Initial limitations (for example, vegetable crops, fruit, potatoes) were reduced
when land with fruits and vegetables also became eligible for payment entitlements (for
example, the Fruits and Vegetables reform; Regulation 1182/2007). With the 2003 CAP
jovav3.indb 213jovav3.indb 213 16/12/10 16:52:0216/12/10 16:52:02
Copyright © 2011. Edward Elgar. All rights reserved. May not be reproduced in any form without permission from the publisher, except fair uses permitted under U.S. or
applicable copyright law.
EBSCO Publishing : eBook Collection (EBSCOhost) - printed on 6/9/2015 1:35 PM via UNIVERSIDAD RAFAELLANDIVARAN: 387706 ; Jovanovic, Miroslav N..; International Handbook on the Economics of IntegrationAccount: s4245486

214 International handbook on the economics of integration, volume III
reform, the EU income support, which was until then considered to be trade distorting,
claimed a ‘green- box’ status in the WTO. As such it should no longer count as distorting
output and trade, being exempted from support reduction commitments.
The SPS is now the main income support instrument of the CAP (Jongeneel and
Brand, 2010). As such, further insight into the degree of support derived from the direct
payments and its distribution over farms is useful for evaluating this policy. In 2006
average direct payment per farm in EU25 amounted €10,110 (of which €8,780 came from
the EU and €1,330 came from national funds, including the complementary national
direct payments) (derived from European Commission, 2008b: 5). On average for the
EU15 the share of national direct payments in total direct payments received by farmers
was about 5 per cent, with Finland as an exception. Because the distribution of direct
payments is rather skewed the median value (half of the farmers receive less than the
median value and half of farmers receive more) might be more informative than average
numbers. According to the FADN 2006 farm bookkeeping data, the median EU direct
payment per farm was €2,160 per farm. The median direct payment per hectare was
€160/ha. (ibid.: 1). As compared to 2004, the median payments per farm and per hectare
increased by 20 per cent. Two factors explaining the increase are the added milk direct
payments (milk premium) and the SAPS (Single Area Payment Scheme) level increase in
the new member states, that is, those joining in 2004 and 2007. The level of the median
direct payments per farm is closely linked to the structure of the farms. This is in particu-
lar the case in the new member states applying the SAPS (linked to area). In the EU15
the level of direct payments by farm is also closely linked to the products they were and
usually still are producing (payments refl ect historical references). As such the median
direct payment per farm in EU15 varied from 0 for specialised horticulture and wine-
producing farms to €12,490 for specialised dairy farms (ibid.: 1).
From 2003, member states were allowed to retain by sector 10 per cent of their national
budget ceilings for direct payments for use for environmental measures or improving the
quality and marketing of products in that sector (Article 69). In the Health Check it has
been decided that this possibility will become more fl exible (Article 68). The money will
no longer have to be used in the same sector; it may be used to help farmers producing
milk, beef, goat and sheepmeat and rice in disadvantaged regions or vulnerable types of
farming; it may also be used to support risk management measures such as insurance
schemes for natural disasters and mutual funds for animal diseases.
Cross- compliance
With the growing commitment in the European Community in the late 1980s to inte-
grating environmental considerations into the CAP, the so- called ‘cross- compliance’
instrument had already become part of the debate on agricultural policy reforms. With
the 1992 MacSharry reforms of the CAP, which increased reliance on the direct payment
instruments, the potential relevance of cross- compliance increased. The greater transpar-
ency of these payments prompted a debate on the ‘value added’ or contribution that EU
agriculture should give to society. This intensifi ed the debate about the tangible social
and environmental services farmers should provide in reciprocity to these payments.
Although elements of environmental cross- compliance were introduced into the CAP by
the MacSharry reform, its impact initially remained rather limited. Member states were
jovav3.indb 214jovav3.indb 214 16/12/10 16:52:0216/12/10 16:52:02
Copyright © 2011. Edward Elgar. All rights reserved. May not be reproduced in any form without permission from the publisher, except fair uses permitted under U.S. or
applicable copyright law.
EBSCO Publishing : eBook Collection (EBSCOhost) - printed on 6/9/2015 1:35 PM via UNIVERSIDAD RAFAELLANDIVARAN: 387706 ; Jovanovic, Miroslav N..; International Handbook on the Economics of IntegrationAccount: s4245486

The reforms of the Common Agricultural Policy 215
obliged to apply so- called ‘appropriate environmental conditions’ to the management of
compulsory set- aside in arable cropping. Moreover, they were allowed (but not obliged)
to introduce environmental conditions on the direct payments off ered as headage pay-
ments for beef cattle and sheep. Only a limited number of member states (notably the
UK) implemented such schemes.
The Agenda 2000 reform of the CAP extended the switch from price support to
direct payments. Also cross- compliance became a more prominent part of the agricul-
tural policy package. Regulation 1259/1999 (Article 3) required member states to take
measures to ensure that agricultural activities within the scope of the ‘common rules
regulation’ were compatible with environmental requirements. It allowed member states
several options for such measures. These options included: support in return for agri-
environmental commitments, the introduction of general mandatory environmental
requirements, and the introduction of specifi c environmental requirements constituting
a condition for direct payments (cross- compliance). Member states were able to decide
on a sanctioning system punishing violations. Punishment should be appropriate and
proportionate and could include withdrawal or even cancellation of direct payments.
Only a limited number of member states (among them Denmark, France, Greece, the
Netherlands and the UK) set down conditions for direct payments.
With the 2003 policy reform, cross- compliance became a compulsory measure.
Together with decoupling of support and the renewed rural development pillar (Second
Pillar of CAP) that were then introduced, it intrinsically sought to promote and con-
tribute to sustainable agriculture. This is achieved through the respect by the farmer of
the rules relating to the relevant aspects of cross- compliance. A second objective is to
make the CAP more compatible with the expectations of society at large. There is now
a growing body of opinion that agricultural payments should no longer be granted to
farmers who fail to comply with basic rules in certain important areas of public policy.
As such, its scope was extended from its original environmental focus to one dealing with
a much wider range of public concerns, each of which was already covered by EU legisla-
tion. Added concerns were animal welfare, food safety and maintaining agricultural land
in a good agricultural and environmental condition.
Cross- compliance can be considered to be an additional enforcement mechanism,
alongside the legal sanctioning systems that are at the discretion of the member states.
It creates a link between the full payment of support, and compliance with certain rules
relating to agricultural land use and to the process of agricultural production. This link
is expressed in concrete terms in the possibility, if the rules are not respected, of full or
partial reductions of certain EU agricultural payments. These reductions depend on the
severity, the extent, the permanence, the repetition and the intentionality of the non-
compliance (European Commission, 2007).
Cross- compliance involves three elements of standards: the statutory management
requirements (SMRs), the good agricultural and environmental conditions (GAECs)
and the obligation to preserve the area of permanent pasture at the reference level
in 2003. With the Health Check decisions (November 2008) the original Regulation
1782/2003 (Council of the EU, 2003) establishing cross- compliance was replaced by a
new Regulation 73/2009. In return for direct payments under the SPS, this regulation
(which applied in all pre- 2000 member states, and, as at 2009, Slovenia and Malta)
requires farmers to observe certain standards in the following areas:
jovav3.indb 215jovav3.indb 215 16/12/10 16:52:0216/12/10 16:52:02
Copyright © 2011. Edward Elgar. All rights reserved. May not be reproduced in any form without permission from the publisher, except fair uses permitted under U.S. or
applicable copyright law.
EBSCO Publishing : eBook Collection (EBSCOhost) - printed on 6/9/2015 1:35 PM via UNIVERSIDAD RAFAELLANDIVARAN: 387706 ; Jovanovic, Miroslav N..; International Handbook on the Economics of IntegrationAccount: s4245486

216 International handbook on the economics of integration, volume III
environment; ●
public, animal and plant health; ●
animal welfare; and ●
GAECs. ●
More precisely, farmers must comply with 19 SMRs defi ned in Annex III of the regu-
lation, and a number of standards ensuring the good agricultural and environmental
condition of agricultural land. Although they are part of the cross- compliance package,
the SMRs are all pre- existing EU directives and regulations for the EU15. The Nitrate
Directive, to mention one example, originates from 1991. With regard to these SMRs,
cross- compliance acts only, or at most, as an additional fi nancial incentive, besides the
existing national systems for enforcement of EU legislation as transposed into national
legislation and in national enforcement and sanctioning policies.
The GAEC framework and the obligation to preserve the national ratio of perma-
nent pasture at the level present in 2003 are, at least in principle, new requirements. The
GAEC framework focuses on four ‘issues’ (soil erosion, soil organic matter, soil struc-
ture, minimum level of maintenance) and a total of 11 corresponding standards. With
the Health Check the original (obligatory) standards were subdivided into those which
are compulsory and those which are optional (member states that already implemented
these should stick to them). Moreover, a new compulsory GAEC standard requires
member states to introduce a standard for buff er strips next to watercourses. Another
new requirement is compliance with water use authorisation standards. The retention of
landscape elements was revised referring more specifi cally to features to be maintained.
As a result of the Health Check reform the majority of member states will need to intro-
duce additional GAEC standards for buff er strips and landscape features.
The permanent pasture requirement was included in the cross- compliance package to
avoid not only the abandonment of land and associated environmental degradation, but
also a potential massive conversion of permanent pasture into arable land. Abandonment
of land was feared as a potential side- eff ect of the introduced decoupling, which delinked
support from production activities. A ban on (massive) conversion of permanent pasture
into arable land should also limit possible market responses of the arable markets. As
such the GAEC requirements can be seen as a precautionary policy to prevent potential
problems which might occur in the future. In contrast with the SMRs, the GAEC stand-
ards and the permanent pasture clause are part of cross- compliance, which implies that
the behavioural changes (and associated costs and benefi ts) induced by these standards
can be attributed to the direct impacts of cross- compliance.
6 POLICIES FOR RURAL DEVELOPMENT
To understand the objectives and instruments of the EU rural development policy, it
is useful to start with its origins (Thomson et al., 2010). These origins lie in eff orts to
promote economic growth and integration in rural areas via ‘structural’ means. Aside
from agricultural market and price policy, and the accompanying common trade policy,
it was the intention of policy makers such as Sicco Mansholt right from the beginning
to also develop a common agricultural structure policy. This policy should focus on the
jovav3.indb 216jovav3.indb 216 16/12/10 16:52:0216/12/10 16:52:02
Copyright © 2011. Edward Elgar. All rights reserved. May not be reproduced in any form without permission from the publisher, except fair uses permitted under U.S. or
applicable copyright law.
EBSCO Publishing : eBook Collection (EBSCOhost) - printed on 6/9/2015 1:35 PM via UNIVERSIDAD RAFAELLANDIVARAN: 387706 ; Jovanovic, Miroslav N..; International Handbook on the Economics of IntegrationAccount: s4245486

The reforms of the Common Agricultural Policy 217
supply side of agriculture: the production factors (land, labour and capital) and the farm
structure. However, this common policy never really got off the ground. In addition to
the less binding articles of the EEC Treaty, agriculture ministers were reluctant to hand
over power on this policy to Brussels, a reticence which remains to this day.
Within the CAP, the Agricultural Fund had from the start a structural (‘Guidance’)
component, as a consequence of extensive discussion on this point during the 1958 Stresa
Conference . However, compared to the establishment of CMOs for the main farm prod-
ucts under the Guarantee Section of the Fund during the 1960s, progress on agricultural
structural policy was confi ned mainly to examination and coordination of national
measures, such as state aids for farm reorganisation and modernisation. Although the
Guidance Section was intended to cover one- third of total FEOGA expenditure (with
‘matched’ national funding to be added), this proportion seldom exceeded 10 per cent.
By the end of the 1960s, the establishment of CAP market support, along with rapid
technological progress in farming and slow agricultural restructuring, was leading to
severe problems of overproduction. In response, the Mansholt Plan of 1968 proposed
a radical shift towards fewer, larger farming units. The plan was violently contested in
farming circles, and eventually abandoned. Instead, a set of structural directives (nos
72/159–161) was adopted in 1972, dealing with, respectively: modernisation of ‘main
occupation farms’ via various forms of aid; farmer retirement, releasing farmland to
other farmers or for aff orestation; and ‘socioeconomic’ advice and training both for
those leaving farming and for those remaining.
In 1975, the fi rst ‘less favoured areas’ (LFA) Directive (no. 75/258) was adopted – a
signifi cant break from the principle of a ‘common market’ within which economic com-
parative advantage should be pursued without geographical distinction. Farm producers
in the LFAs – which eventually spread to over half the total area of the EU – received
annual payments, typically per hectare, in order to ‘compensate’ for natural handicaps
and other diffi cult territorial conditions. Almost all the content of the 1972 and 1975
directives have been continued in some form or other into the present era.
Later, a wider regional approach provided special support to European regions
‘lagging behind’ in economic development. Several studies had shown that European
integration was leading – possibly due to market imperfections – to agglomeration (clus-
tering) of economic activity in certain city regions, and hence to divergence rather than
convergence of GDP levels between all EU regions. To counter this eff ect, it was con-
sidered desirable to keep resources (labour, capital) in their original locations, and not
simply helped to transfer to more prosperous regions. By the 1980s, with the Community
of Ten again in severe oversupply of farm products, and manufacturing no longer
absorbing surplus farm labour, structural problems in rural areas were again in evidence.
A number of directives were adapted to take account of this situation, for instance by
limiting the possibility of giving aid if this would increase production. Environmental
concerns were also incorporated for the fi rst time . In 1986, the further enlargement of
the Community to include Spain and Portugal, and the adoption of the Single European
Act – which formally recognised regional policy as a major tool in promoting socio-
economic ‘cohesion’ – heralded a more serious attempt at addressing regional and rural
problems within the Twelve.
Following a small set of experimental ‘integrated development programmes’ (IDPs) in
the late 1970s, a series of more substantial integrated Mediterranean programmes (IMPs)
jovav3.indb 217jovav3.indb 217 16/12/10 16:52:0216/12/10 16:52:02
Copyright © 2011. Edward Elgar. All rights reserved. May not be reproduced in any form without permission from the publisher, except fair uses permitted under U.S. or
applicable copyright law.
EBSCO Publishing : eBook Collection (EBSCOhost) - printed on 6/9/2015 1:35 PM via UNIVERSIDAD RAFAELLANDIVARAN: 387706 ; Jovanovic, Miroslav N..; International Handbook on the Economics of IntegrationAccount: s4245486
218 International handbook on the economics of integration, volume III
were initiated in France, Greece and Italy. These involved a number of innovations: for
example, member states, not the Commission, were responsible for their design; their
scope included manufacturing and services (for example, tourism) as well as agriculture;
funding came from all three funds (agricultural, regional and social); and multi- annual
‘programming’ (and budgeting) was instituted.
The MacSharry reforms of the CAP agreed in 1992 included not only major steps
towards lowering agricultural price support, but in the fi eld of rural policy included
‘accompanying measures’ in the form of an early retirement scheme, an agri- environment
scheme and a scheme for aff orestation of farmland. These were designed both to reduce
production capacity and to improve the structure of farming. The problems of ‘agricul-
tural adjustment’ thus continued to be recognised, but were now more strongly linked to
the growing interest in environmentally friendly land management by farmers: member
states were now obliged to off er a relevant scheme to their farmers. This happened
against the background of diminishing market support due to the 1993 Uruguay Round
agreement, although, with the exception of a 20 per cent ‘incentive’, agri- environmental
schemes were to compensate farmers only for additional costs and income forgone,
as provided for under the WTO green- box rules. However, many of these fi rst agri-
environmental schemes were not well targeted, and a clear link to perceived environ-
mental benefi t could not always be established. A more critical approach towards
agri- environment schemes was adopted by the Commission in the next and subsequent
programming periods.
A next step, in November 1996, was the Cork Conference attended by Franz Fischler
as Commissioner for Agriculture and Rural Development (emphasis added), and result-
ing in ‘The Cork Declaration: A Living Countryside’. Alongside a ‘multisectoral’ or
‘territorial’ approach, and ‘subsidiarity’ in policy decision making, the term ‘sustain-
ability’ worked its way into the standard terminology in recognition of growing environ-
mental concerns at EU and global levels. A further term growing in importance was the
‘multifunctionality’ of agriculture, refl ecting the mixture of private goods and services
(food and fi bre products, and farm tourism) and ‘public (or non- commodity) goods’
(landscape, wildlife and so on) provided by much of European farming. The ‘European
Model of Agriculture’ was endorsed by the Council of Ministers as a framework to be
supported (for example, against pressures from international trade negotiations) in the
general interest of EU citizens and their environment.
However, the practical importance of the Cork Declaration was not immediate: many
ministers of agriculture were still not keen to shift the main focus of the CAP away from
support for farmers and towards wider rural support. In any case, decisions had to await
the major Agenda 2000 negotiations leading up to the third programming period of
2000–06 for the EU as a whole. For the CAP, this meant the defi nition of the two CAP
pillars, with all rural development measures reorganised within a separate component of
the overall policy, that is, Pillar 2. Alongside multiannual programming, monitoring and
evaluation of rural policy measures also became more important. The new integrated
regulation (no. 1257/1999) included measures (previously co- fi nanced under Objective
5b) geared at non- agricultural development of regions, so that its scope now covered all
rural regions in the EU.
The Agenda 2000 decisions entailed no signifi cant increase in the EU budget for struc-
tural funds. The Regional Fund’s objectives were limited to two: Objective 1 much as
jovav3.indb 218jovav3.indb 218 16/12/10 16:52:0216/12/10 16:52:02
Copyright © 2011. Edward Elgar. All rights reserved. May not be reproduced in any form without permission from the publisher, except fair uses permitted under U.S. or
applicable copyright law.
EBSCO Publishing : eBook Collection (EBSCOhost) - printed on 6/9/2015 1:35 PM via UNIVERSIDAD RAFAELLANDIVARAN: 387706 ; Jovanovic, Miroslav N..; International Handbook on the Economics of IntegrationAccount: s4245486

The reforms of the Common Agricultural Policy 219
before but including ‘Objective 6’ regions in the 1996 entrant countries of Sweden and
Norway; and a new Objective 2 which now included Objective 5b areas. ‘Community
Initiative’ programmes were cut to four: INTERREG, URBAN, LEADER and
EQUAL.
A special feature of the Agenda 2000 decisions was the preparation for EU entry by
the new member states, scheduled for 2004. In the fi eld of rural policy, the SAPARD
(Special Accession Programme for Agriculture and Rural Development) initiative was
set up (alongside the parallel ISPA and PHARE instruments for structural and environ-
mental infrastructure) to assist the implementation of the acquis communautaire in the
countries of Central Europe, primarily by building administrative capacity for support-
ing the enhancement of effi ciency and competitiveness in farming and the food industry
(about half of the available funding), and the improvement of rural infrastructure (about
a third). It was thus recognised that the new member states not only faced a major struc-
tural problem in the farm- food sector, but that its public administration needed help in
putting together viable proposals for EU funding to create employment and sustainable
economic development in rural areas. A more concrete incentive lying behind SAPARD
was anxiety in the Commission that the new member states would not be able to prepare
and administer the new programmes, and thus that the allocated funds would not be
absorbed.
A further step in the development of the EU rural policy was the Mid Term Review (of
the CAP) decision taken in 2003 to convert most direct payments to farmers into ‘single’
payments as from 2005 or 2006. Within a strict ‘fi nancial discipline’, a small proportion
of Pillar 1 funds were compulsorily ‘modulated’ to Pillar 2, with complex rules over the
allocation and use (including co- funding by member states) of such funds.
Finally, Regulation 1698/2005 set up the current structure for rural development
policy within the CAP, with three ‘strategic priorities’ or ‘Axes’, that is:
Improving the competitiveness of agriculture and forestry by supporting restruc- ●
turing, development and innovation (Axis 1).
Improving the environment and the countryside by supporting land management ●
(Axis 2).
Improving the quality of life in rural areas and encouraging diversifi cation of ●
economic activity (Axis 3).
In addition, a fourth ‘horizontal’ Axis 4 enhances the use of the LEADER approach,
which can be delivered across any one or combination of the three main axes. Although
the implementation of the axes is mainly a national competence, the European
Commission exerts some control via the requirement – among others – to spend at least
10 per cent of the Community fi nancial contribution on Axes 1 and 3, at least 25 per cent
on Axis 2 and at least 5 per cent on Axis 4.
Some of these developments parallel those in other countries, as represented by the
OECD’s pursuit of a ‘New Rural Paradigm’,3 with its emphasis on: local amenities (envi-
ronmental or cultural) or local products (traditional or labelled) as a means of generating
new competitive advantages; a shift from a sectoral to a territorial policy approach; and
new forms of governance, for example, decentralisation, partnerships, and multisectoral
coordination.
jovav3.indb 219jovav3.indb 219 16/12/10 16:52:0216/12/10 16:52:02
Copyright © 2011. Edward Elgar. All rights reserved. May not be reproduced in any form without permission from the publisher, except fair uses permitted under U.S. or
applicable copyright law.
EBSCO Publishing : eBook Collection (EBSCOhost) - printed on 6/9/2015 1:35 PM via UNIVERSIDAD RAFAELLANDIVARAN: 387706 ; Jovanovic, Miroslav N..; International Handbook on the Economics of IntegrationAccount: s4245486
220 International handbook on the economics of integration, volume III
In designing and implementing Rural Development Programmes (RDPs) for
2007–13 under Regulation 1698/2005, the main aspects of the EU’s Lisbon and
Gothenburg Agendas (on competitiveness and sustainability respectively) were refl ected
in ‘Community Strategic Guidelines’ (COM(2005) 0299), while the strategic aspects of
EU rural development policy were strengthened through the requirement to prepare
a National Strategy Plan prior to the initiation of the ‘programming’ phase. Initially
these eff orts to impose EU- level guidance on national rural development policies were
contested, both conceptually (is this an appropriate area for strong EU coordination?)
and in practice (will the above documents prove eff ective during the implementation of
national and regional programmes?). However, according to Commission sources, these
documents have proved useful tools in translating EU priorities into practical measures
in national and regional RDPs. Nevertheless, some member states have doubted their
added value. In any case, as detailed below, the actual use of CAP rural development
money by a number of EU member states largely maintains a traditional land- based
approach.
At time of writing (autumn 2008), EU rural development policy is well into the fourth
programming period 2007–13 with some exceptions due to delays in approvals – with
an EU27 ‘indicative expenditure’ budget of about €90 billion. The approval process was
not always an easy one, especially for countries where regional authorities were required
for the fi rst time to prepare stand- alone programmes which still had to respect the pri-
orities set out in the National Strategy Plan and in so- called national frameworks. Some
issues required special attention such as, for example: the defi nition and controllability
of agri- environment measures; monitoring and evaluation (see the quantitative targets
in the following paragraphs); and demarcation with other funding instruments and with
the First Pillar of the CAP to avoid the risk of double fi nancing. Axis 1 in the approved
RDPs as a whole accounts for about a third of the planned spend of Community funds,
Axis 2 for somewhat under half, Axis 3 for about an eighth, and Axis 4 for just over
6 per cent.4
Axis 1 proportions among member states vary from nearly 50 per cent (Belgium) to
10 per cent (Ireland), with new member states scattered fairly evenly. According to the
quantitative targets set, the objective of improving human capital is to be pursued by
providing training and advice to millions of farmers, and by supporting some 176,000
young farmers to set up for the fi rst time, while 86,000 older ones will retire early.
Physical investment and innovation will take place on several hundred thousand farms
and forest holdings, including 111,000 semi- subsistence farms in the new member states.
The main planned expenditures within Axis 1 are: ‘modernisation of agricultural hold-
ings’ (€9.6 billion of EU funds); ‘adding value to agricultural and forestry products’ (€5.5
billion); and ‘improvement and development of infrastructure’ (€4.9 billion).
Axis 2 proportions vary more diff erentially, at over 60 per cent for six old member
states, but under 33 per cent for fi ve new member states; this is in line with previous fi nd-
ings on the spatial impact of the CAP.5 Three million holdings, covering some 34 million
hectares, will receive agri- environmental payments totalling €20.3 billion from the EU,
and a further 3 million holdings on 50 million hectares will receive €12.6 billion in less
favoured area (LFA) payments.
Axis 3 measures are favoured relatively by new member states (which enjoy higher EU
co- fi nancing rates) with proportions of EU funding between 17 and 34 per cent, while
jovav3.indb 220jovav3.indb 220 16/12/10 16:52:0216/12/10 16:52:02
Copyright © 2011. Edward Elgar. All rights reserved. May not be reproduced in any form without permission from the publisher, except fair uses permitted under U.S. or
applicable copyright law.
EBSCO Publishing : eBook Collection (EBSCOhost) - printed on 6/9/2015 1:35 PM via UNIVERSIDAD RAFAELLANDIVARAN: 387706 ; Jovanovic, Miroslav N..; International Handbook on the Economics of IntegrationAccount: s4245486
The reforms of the Common Agricultural Policy 221
most member states allocate less than 14 per cent to this axis. The main expenditures are
on village renewal and basic services (€5.7 billion), business creation and development
(€2.2 billion), and diversifi cation to non- agricultural activities (€1.4 billion). In all, some
370,000 new jobs are expected from diversifi cation, micro enterprises and tourism, and
some 36 million people should benefi t from improved basic services.
Some old member states propose Axis 4 expenditure proportions over 10 per cent, and
nine new member states have shares of 5 per cent or less; most of the rest are around 6 per
cent. About two- thirds of these expenditures are focused on Axis 3, with smaller propor-
tions on Axis 1 and the management of local action groups (LAGs).
7 CONCLUSIONS
Progressive integration has been one of the most characteristic elements of economic
development worldwide and the EU is a prime and unique example. Reviewing the evo-
lution of the CAP choosing an integration perspective suggests that aspects of internal
and external integration should be distinguished. From the late 1960s to the beginning of
the 1980s, the CAP changes had a piecemeal character. Important elements in this phase
were making further progress with market and policy integration. A number of decisions
(those related to the MCAs) can be seen as an answer of a sectoral policy which tries to
preserve the unity of market and prices but has to cope with a lack of policy integration.
This holds in particular with respect to the divergent monetary policies pursued by EU
member states, which required several realignments between exchange rates.
During this period, the EU changed from a net importer with respect to basic agri-
cultural products into a net exporter. As a net exporter it became a big player in several
markets. As such the EU was forced more and more to take into account the distortive
eff ects it created at world markets. Not only the increasing tensions with other competing
prime exporters (USA) played a role, also the budget implications of market imbalances
increased the political pressure from within the EU to reform its policy. An example of
the response is the introduction of the milk quota regime in 1984.
In the 1990s, the structural change in the EU’s trade position (from net importer to
net exporter) as well as the dominance of the trade issue at the EU’s policy agenda were
important drivers. In other words: rather than internal integration, the external integra-
tion of the EU with respect to world markets gained importance. This not only aff ected
the EU’s trade policies and the trade policy part of the CAP, but it simultaneously
aff ected the more internal sides of this policy (income support to farmers). The ‘solution’
found was the switch from price support to income support by means of direct payments.
Whereas initially these payments were still coupled to output, later on it was decided to
decouple them.
Alongside the external integration, there is still an element of internal integration that
deserves further attention. This is the broadening of the CAP from a producer support
policy exclusively linked to food and fi bre production to a policy which accounts for
other societal concerns, in particular those with respect to the environment. Relevant in
this respect is the conditionality (created by introduction of obligatory cross- compliance)
of the SFPs to compliance with a wide range of statutory management regulations (for
example, Nitrate Directive, Birds and Habitat Directives, food safety and animal welfare
jovav3.indb 221jovav3.indb 221 16/12/10 16:52:0216/12/10 16:52:02
Copyright © 2011. Edward Elgar. All rights reserved. May not be reproduced in any form without permission from the publisher, except fair uses permitted under U.S. or
applicable copyright law.
EBSCO Publishing : eBook Collection (EBSCOhost) - printed on 6/9/2015 1:35 PM via UNIVERSIDAD RAFAELLANDIVARAN: 387706 ; Jovanovic, Miroslav N..; International Handbook on the Economics of IntegrationAccount: s4245486
222 International handbook on the economics of integration, volume III
regulations and so on) and good agricultural and environmental practices (aimed at
avoiding erosion and land abandonment). Also the second pillar of the CAP has been
directed more at these issues.
At present, the internal integration has been roughly completed, including the EU
enlargement with the Central and East European member states. Also the most impor-
tant steps necessary to integrate the EU’s agriculture with the world economy have been
accomplished. What are the challenges for the future? The price upheaval of the 2007–08
period (food crisis), apart from its incidental elements, signalled that agricultural
markets as well as other resource markets might enter a new era, where the develop-
ment spurt of Brazil, Russia, India and China (BRIC) will change the relative scarcities.
At the same time the subsequent fi nancial economic crisis is not only likely to create a
signifi cant slowdown of the world economy, but also might switch the pendulum from
a neo- liberal policy perspective (Washington Consensus) to a more protective one. As a
reaction, more eff orts might result to infl uence the world’s economic integration process
(globalisation) in a direction to better account for sustainability and fairness. This really
becomes speculative, but the potential implications for agriculture and its policy envi-
ronment might be signifi cant (for example, biofuel policy).
The future of the CAP will also be shaped by the new Financial Perspective (2014–20).
It is interesting to note (Bos, 2010) that the Interinstitutional Agreement on the present
fi nancial framework (2007–13) contains a closing paragraph arguing for the introduc-
tion of new co- fi nancing mechanisms (European Parliament et al., 2006). Co- fi nancing
has been generally accepted in the EU structural policy. Mixed fi nancing by the EU and
the member states is also used in the second pillar of the CAP. In the current system of
co- fi nancing of this rural development policy, the EU contribution to the total public
expenditure is no more than 50 or 55 per cent (respectively, 75 to 80 per cent for the so-
called convergence regions with a GDP per capita below 75 per cent of the EU average).
The rest has to be fi nanced nationally or locally. Co- fi nancing contributes to making
member states more cost- conscious, leading to a prudent implementation of the funds
and hence a greater effi ciency. As yet, the fi rst pillar of the CAP is fully fi nanced from the
EU budget. With the broader introduction of direct payments decoupled from produc-
tion, the arguments for decentralisation of income support to farmers gather strength.
The personal income distribution is part of the realm of the member states. In line
with the subsidiarity principle, it may therefore be expected that at least part of these
payments will be fi nanced from the national budgets.
SUMMARY
The development of the Common Agricultural Policy (CAP) off ers an interesting
example of international economic integration. The Treaty of Rome, by which six coun-
tries set up the European Economic Community (EEC), formed the starting point. The
treaty stated the direction for agriculture: free trade within the common market. To
establish this result, the formulation and implementation of the CAP was a necessary
condition. After the 1960s, the original CAP was reformed in several steps. This chapter
describes and explains the main policy changes.
The changes were shaped by the following factors:
jovav3.indb 222jovav3.indb 222 16/12/10 16:52:0216/12/10 16:52:02
Copyright © 2011. Edward Elgar. All rights reserved. May not be reproduced in any form without permission from the publisher, except fair uses permitted under U.S. or
applicable copyright law.
EBSCO Publishing : eBook Collection (EBSCOhost) - printed on 6/9/2015 1:35 PM via UNIVERSIDAD RAFAELLANDIVARAN: 387706 ; Jovanovic, Miroslav N..; International Handbook on the Economics of IntegrationAccount: s4245486

The reforms of the Common Agricultural Policy 223
the classic objectives of agricultural policies, as formulated in the Treaty; ●
the expansion of agricultural production beyond consumption; ●
the lack of stable exchange rates; ●
the enlargements of the European Union; ●
the budgetary limits; ●
the constraints of the GATT/WTO, which refer to market access, export support ●
and domestic support;
the need and ambition to address environmental concerns; and ●
the hidden objectives of sectors and member states to maintain the level of ●
support.
In 2008 the Health Check of the CAP was on the European agenda. The decisions are
likely to be followed by new reform proposals for the CAP after 2013.
Keywords
European Union, agricultural and trade policies, environmental policies.
JEL classification
F14, F15, Q17, Q18.
NOTES
1. See also van den Noort (this volume, ch. 9).2. This section is based on chapter 5 of Agra Europe’s CAP Monitor (2009).3. See OECD (2006).4. These fi gures, and those in the following paragraphs, refer only to Community funding, and exclude
national public and private funding. RDP co- funding shares vary widely, from around 80 per cent in some new member states, to under 10 per cent in some old member states.
5. See Shucksmith et al. (2005).
REFERENCES
Agra Europe (2009), CAP Monitor, Agra Informa Ltd, Tunbridge, UK.Blandford, D. (1996), ‘The political economy of post- Uruguay Round agricultural policies in the United States
and the European Union: discussion’, American Journal of Agricultural Economics, 78: 1324–26.Bos, M., (2010), ‘EU budget’, Chapter 3 in A.J. Oskam, G. Meester and H.J. Silvis (eds), EU Policy for
Agriculture, Food and Rural Areas, Wageningen: Wageningen Academic Publishers, pp. 73–87.Bouamra- Mechemache, Z., R. Jongeneel and V. Réquillart (2008), ‘Impact of a gradual increase in milk quotas
on the EU dairy sector’, European Review of Agricultural Economics, 35(4), 461–91.Council of the EU (2003), Council Regulation (EC) No. 1782/2003 of 29 September 2003 establishing common
rules for direct support schemes under the common agricultural policy and establishing certain support schemes for farmers.
Council of the EU (2007), Council Regulation (EC) No. 1234/2007 of 22 October 2007 establishing a common organisation of agricultural markets and on specifi c provisions for certain agricultural products (Single CMO Regulation), Offi cial Journal of the European Union, 16 November.
European Commission (2007), Rapport van de Commissie aan de Raad – ‘De uitvoering van cross- compliance’, COM(2007) 147 defi nitief, 29 March, European Commission, Brussels.
jovav3.indb 223jovav3.indb 223 16/12/10 16:52:0216/12/10 16:52:02
Copyright © 2011. Edward Elgar. All rights reserved. May not be reproduced in any form without permission from the publisher, except fair uses permitted under U.S. or
applicable copyright law.
EBSCO Publishing : eBook Collection (EBSCOhost) - printed on 6/9/2015 1:35 PM via UNIVERSIDAD RAFAELLANDIVARAN: 387706 ; Jovanovic, Miroslav N..; International Handbook on the Economics of IntegrationAccount: s4245486

224 International handbook on the economics of integration, volume III
European Commission (2008a), First Financial Report from the Commission to the European Parliament and the Council on the European Agricultural Guarantee Fund, 2007 fi nancial year, Brussels.
European Commission (2008b), Direct payments distribution in the EU- 25 after implementation of the 2003 CAP reform based on FADN data. DG- Agri (Economic analysis, perspectives and evaluations), Brussels, 07 November, SH D(2008).
European Parliament, Council and Commission (2006), Interinstitutional agreement between the European Parliament, the Council and the Commission on budgetary discipline and sound fi nancial management (2006/C 139/01).
Garzon, I. (2006), Reforming the Common Agricultural Policy; History of a Paradigm Change, Basingstoke: Palgrave, Macmillan.
Harris, S., A. Swinbank and G. Wilkinson (1983), The Food and Farm Policies of the European Community, Chichester: John Wiley & Sons.
Jongeneel, R. and J.M. Brand (2010), ‘Direct income support and cross- compliance’, Chapter 9 in A.J. Oskam, G. Meester and H.J. Silvis (eds), EU Policy for Agriculture, Food and Rural Areas, Wageningen: Wageningen Academic Publishers, pp. 191–205.
Organisation for Economic Cooperation and Development (OECD) (2006), The New Rural Paradigm: Policies and Governance, Paris: OECD.
Petit, M. (1989), Pressures on Europe’s Common Agricultural Policy, International Food Policy Research Institute (IFPRI), Washington, DC and École Nationale Supérieure des Sciences Agronomiques Appliquées, Dijon.
Ritson, C. and A. Swinbank (1997), ‘Europe’s green money’, in C. Ritson and D. Harvey (eds), The Common Agricultural Policy, Wallingford: CAB International.
Shucksmith, M., K. Thomson and D. Roberts (2005), The CAP and the Regions: the Territorial Impact of the Common Agricultural Policy, Wallingford: CAB International.
Silvis, H.J. and R.P. Lapperre (2010), ‘Market, price and quota policy: half a century of CAP experience’, Chapter 8 in A.J. Oskam, G. Meester and H.J. Silvis (eds), EU Policy for Agriculture, Food and Rural Areas, Wageningen: Wageningen Academic Publishers, pp. 165–82.
Thomson, K.J., P. Berkhout and A. Constantinou (2010), ‘Balancing between structural and rural policy’, Chapter 22 in A.J. Oskam, G. Meester and H.J. Silvis (eds), EU Policy for Agriculture, Food and Rural Areas, Wageningen: Wageningen Academic Publishers, pp. 377–92.
jovav3.indb 224jovav3.indb 224 16/12/10 16:52:0216/12/10 16:52:02
Copyright © 2011. Edward Elgar. All rights reserved. May not be reproduced in any form without permission from the publisher, except fair uses permitted under U.S. or
applicable copyright law.
EBSCO Publishing : eBook Collection (EBSCOhost) - printed on 6/9/2015 1:35 PM via UNIVERSIDAD RAFAELLANDIVARAN: 387706 ; Jovanovic, Miroslav N..; International Handbook on the Economics of IntegrationAccount: s4245486

225
11 Agricultural policy as a barrier to global economic integrationKym Anderson and Ernesto Valenzuela*
1 INTRODUCTION
While the benefi ts from specialisation in production and international exchange have
been recognised for millennia, most governments restrict international trade to some
extent, especially in agricultural goods. Sometimes it would be via export taxes, to
raise government revenue or to lower the price of food for domestic consumers. More
commonly it takes the form of import duties or bans. While food security concerns
are sometimes mentioned as a reason for intervention in both sets of countries, for
advanced economies the most likely reason for farm trade restrictions in the past
century or more has been to protect domestic producers from import competition as
they come under competitive pressure to shed labour in the course of economic devel-
opment. In the process those protective measures hurt not only domestic consumers
and exporters of other products but also foreign producers and traders of farm prod-
ucts, and they reduce national and global economic welfare. For many decades agri-
cultural protection and subsidies in high- income (and some middle- income) countries
have been depressing international prices of farm products, which lowers the earnings
of farmers and associated rural businesses in developing countries. That worsened
between the 1950s and the early 1980s (Anderson and Hayami, 1986), thereby adding
to global inequality and poverty because three- quarters of the world’s poorest people
depend directly or indirectly on agriculture for their main income (World Bank,
2008).
In addition to this external policy infl uence on rural poverty, the governments of many
developing countries have directly taxed their farmers over the past half- century. A
well- known example is the taxing of exports of plantation crops in post- colonial Africa
(Bates, 1981). At the same time, many developing countries chose also to pursue an
import- substituting industrialisation strategy, predominantly by restricting imports of
manufactures, and to overvalue their currency. Together those measures indirectly taxed
producers of other tradable products in developing economies, by far the most numerous
of them being farmers (Krueger et al., 1988, 1991).
Thus the global integration of markets for farm products has been reduced by poli-
cies of both high- income and developing countries. This disarray in world agriculture,
as D. Gale Johnson (1991) described it in the title of his seminal book, means there has
been overproduction of farm products in high- income countries and underproduction
in more- needy developing countries. It also means that there has been less international
trade in farm products than would be the case under free trade, thereby thinning markets
for these weather- dependent products and thus making them more volatile. Using a sto-
chastic model of world food markets, Tyers and Anderson (1992, Table 6.14) found that
jovav3.indb 225jovav3.indb 225 16/12/10 16:52:0216/12/10 16:52:02
Copyright © 2011. Edward Elgar. All rights reserved. May not be reproduced in any form without permission from the publisher, except fair uses permitted under U.S. or
applicable copyright law.
EBSCO Publishing : eBook Collection (EBSCOhost) - printed on 6/9/2015 1:35 PM via UNIVERSIDAD RAFAELLANDIVARAN: 387706 ; Jovanovic, Miroslav N..; International Handbook on the Economics of IntegrationAccount: s4245486
226 International handbook on the economics of integration, volume III
instability of international food prices in the early 1980s was three times greater than it
would have been under free trade in those products.
During the past quarter- century, however, numerous countries have begun to reform
their agricultural price and trade policies. To get a sense of how much that has increased
the integration of global markets for farm products, the present chapter draws on the
results of the recent World Bank multicountry study of distortions to agricultural price
incentives over the past fi ve decades. That study includes 75 countries that together
account for 92 per cent of the world’s population and agricultural GDP and 95 per cent
of total GDP. The sample countries also account for more than 85 per cent of farm
production and employment in each of Africa, Asia, Latin America and the transition
economies of Europe and Central Asia, and their spectrum of per capita incomes ranges
from among the poorest (Zimbabwe and Ethiopia) to among the richest (Norway).
Specifi cally, this chapter summarises estimates of the nominal rates of assistance and
consumer tax equivalents (NRAs and CTEs) for more than 70 diff erent farm products,
with an average of almost a dozen per country.1 Not all countries had data for the entire
1955–2007 period, but the average number of years covered is 41 per country. Having
such a comprehensive coverage of countries, products and years off ers the prospect of
obtaining a reliable picture of long- term trends in price- distorting policies (as well as
annual fl uctuations around those trends, not reported here) for country groups, regions
and the world as a whole (as well as for individual countries and commodities, also not
reported here because of space limitations).
This chapter is structured as follows. Section 2 begins with the methodology used to
generate annual indicators of the extent of government interventions in markets, details
of which are provided in Anderson et al. (2008a). In Section 3, the NRA and CTE esti-
mates are summarised across regions and over the decades since the 1950s. A summary is
also provided of an additional set of indicators of agricultural price distortions that are
based on the trade restrictiveness index fi rst developed by Anderson and Neary (2005)
and modifi ed for the Bank’s research project by Lloyd et al. (2010). In Section 4, we
discuss a new set of results from a global economy- wide model that provided quantifi ca-
tion of the impacts on global agricultural trade of the reforms since the early 1980s and
of the policies still in place as of 2004. The chapter concludes with Section 5, by drawing
on the lessons learned to speculate on the prospects for further increasing the global
integration of agricultural markets.
2 METHODOLOGY FOR MEASURING THE EXTENT OF POLICY- INDUCED PRICE DISTORTIONS
Government- imposed distortions can create a gap between domestic prices and what
they would be under free markets. The NRA for each farm product is computed as the
percentage by which government policies have raised gross returns to farmers above
what they would be without the government’s intervention (or lowered them, if NRA <
0). A weighted average NRA for all covered products is derived using the value of pro-
duction at undistorted prices as weights (unlike the producer and consumer support esti-
mates (PSEs and CSEs) computed by OECD (2008), which are expressed as a percentage
of the distorted price). To that NRA for covered products is added a ‘guesstimate’ of the
jovav3.indb 226jovav3.indb 226 16/12/10 16:52:0216/12/10 16:52:02
Copyright © 2011. Edward Elgar. All rights reserved. May not be reproduced in any form without permission from the publisher, except fair uses permitted under U.S. or
applicable copyright law.
EBSCO Publishing : eBook Collection (EBSCOhost) - printed on 6/9/2015 1:35 PM via UNIVERSIDAD RAFAELLANDIVARAN: 387706 ; Jovanovic, Miroslav N..; International Handbook on the Economics of IntegrationAccount: s4245486

Agricultural policy as a barrier to global economic integration 227
NRA for non- covered products (on average around 30 per cent of the total value of farm
production) and an estimate of the NRA from non- product- specifi c forms of assistance
or taxation. Since the 1980s some high- income governments have also provided so-
called ‘decoupled’ assistance to farmers but, because that support in principle does not
distort resource allocation, its NRA has been computed separately and is not included
for direct comparison with the NRAs for other sectors or for developing countries. Each
farm industry is classifi ed either as import competing, or a producer of exportables, or
as producing a non- tradable (with its status sometimes changing over the years), so as
to generate for each year the weighted average NRAs for the two diff erent groups of
covered tradable farm products.
Also computed is a production- weighted average NRA for non- agricultural tradables,
for comparison with that for agricultural tradables via the calculation of a percentage
relative rate of assistance (RRA), defi ned as:
RRA = 100*[(100 + NRAagt)/(100 + NRAnonagt) 2 1],
where NRAagt and NRAnonagt are the percentage NRAs for the tradables parts of the
agricultural (including non- covered) and non- agricultural sectors, respectively.2 Since
the NRA cannot be less than –100 per cent if producers are to earn anything, nor can
the RRA (since the weighted average NRAnonagt is non- negative in all our country case
studies). And if both of those sectors are equally assisted, the RRA is zero. This measure
is useful in that if it is below (above) zero, it provides an internationally comparable
indication of the extent to which a country’s sectoral policy regime has an anti- (pro- )
agricultural bias.
Also considered is the extent to which consumers are taxed or subsidised. To do so,
a CTE is calculated by comparing the price that consumers pay for their food and the
international price of each food product at the border. Diff erences between the NRA
and the CTE arise from distortions in the domestic economy that are caused by transfer
policies and taxes/subsidies that cause the prices paid by consumers (adjusted to the
farm- gate level) to diff er from those received by producers. In the absence of any other
information, the CTE for each tradable farm product is assumed to be the same as the
NRA from border distortions.
The cost of government policy distortions to incentives in terms of resource misalloca-
tion tend to be greater the greater the degree of substitution in production. In the case
of agriculture which involves the use of farmland that is sector specifi c but transferable
among farm activities, the greater the variation of NRAs across industries within the
sector then the higher will be the welfare cost of those market interventions. A simple
indicator of dispersion is the standard deviation of the covered industries’ NRAs.
However, it would be helpful to have a single indicator to capture the overall welfare
eff ect of each country’s regime of agricultural price distortions in place at any time
(taking account of both the mean and variance of the product NRAs and CTEs), and
to trace its path over time and make cross- country comparisons. From the viewpoint of
global integration, an index of the international trade volume eff ect of national govern-
ment interventions would also be helpful. To that end, the family of indexes fi rst devel-
oped by Anderson and Neary (2005), under the catch- all name of ‘trade restrictiveness
indexes’, is drawn upon.
jovav3.indb 227jovav3.indb 227 16/12/10 16:52:0216/12/10 16:52:02
Copyright © 2011. Edward Elgar. All rights reserved. May not be reproduced in any form without permission from the publisher, except fair uses permitted under U.S. or
applicable copyright law.
EBSCO Publishing : eBook Collection (EBSCOhost) - printed on 6/9/2015 1:35 PM via UNIVERSIDAD RAFAELLANDIVARAN: 387706 ; Jovanovic, Miroslav N..; International Handbook on the Economics of IntegrationAccount: s4245486
228 International handbook on the economics of integration, volume III
To generate partial equilibrium indicators of the impact of distortions imposed by
each country’s border and domestic agricultural policies on its economic welfare and its
agricultural trade volume, Lloyd et al. (2009) defi ne a Welfare Reduction Index (WRI)
and a Trade Reduction Index (TRI) and estimate them for the same focus countries,
taking into account that for some covered products the NRA and CTE diff er (because
there are domestic measures in place in addition to or instead of trade measures). As
their names suggest, these two new indexes, respectively, each provide a single indicator
of the direct welfare- or trade- reducing eff ects of distortions to consumer and producer
prices of covered farm products from all agricultural and food price and trade policy
measures in place (while ignoring non- covered farm products and indirect general equi-
librium eff ects of sectoral and trade policy measures directed at non- agricultural sectors).
Specifi cally, the WRI (or TRI) is that ad valorem trade tax rate which, if applied uni-
formly to all farm commodities in a country that year would generate the same reduction
in economic welfare (or trade) as the actual cross- commodity structure of agricultural
NRAs and CTEs for that country, other things equal.
The WRI measure refl ects the partial equilibrium welfare cost of agricultural price-
distorting policies better than the NRA because it recognises that the welfare cost of a
government- imposed price distortion is related to the square of the price wedge. It thus
captures the disproportionately higher welfare costs of peak levels of assistance or taxa-
tion, and is larger than the mean NRA/CTE and is positive regardless of whether the
government’s agricultural policy is favouring or hurting farmers. In this way the WRI
and TRI go somewhat closer to what a computable general equilibrium (CGE) model
can provide in the way of estimates of the trade and welfare (and other) eff ects of the
price distortions captured by the product NRA and CTE estimates, while having the
advantage over a CGE model of providing an annual time series and not requiring a
formal model.
3 EMPIRICAL ESTIMATES: MUTED GLOBAL INTEGRATION TO THE 1980s, BUT THEN SOME REFORMS
The study launched by the World Bank in 2006 involved 75 countries (including 20
high- income countries) that together account for more than 90 per cent of the world’s
population and agricultural GDP. The global summary of these new results is provided
in Figure 11.1. It reveals that the nominal rate of assistance to farmers in high- income
countries rose steadily from the mid- 1950s until the end of the 1980s, apart from a small
dip when international food prices spiked around 1973–74. After peaking at more than
50 per cent in the mid- 1980s, that average NRA for high- income countries has fallen a
little, depending on the extent to which one believes that some new farm programmes
are ‘decoupled’ in the sense of no longer infl uencing production decisions. For develop-
ing countries, too, the average NRA for agriculture has been rising, but from a level of
around −25 per cent during the period from the mid- 1950s to the early 1980s to nearly 10
per cent in the fi rst half of the present decade.
The average NRA for developing countries conceals the fact that the exporting and
import- competing subsectors of agriculture have very diff erent NRAs. Figure 11.2
reveals that while the average NRA for exporters has been negative throughout (going
jovav3.indb 228jovav3.indb 228 16/12/10 16:52:0216/12/10 16:52:02
Copyright © 2011. Edward Elgar. All rights reserved. May not be reproduced in any form without permission from the publisher, except fair uses permitted under U.S. or
applicable copyright law.
EBSCO Publishing : eBook Collection (EBSCOhost) - printed on 6/9/2015 1:35 PM via UNIVERSIDAD RAFAELLANDIVARAN: 387706 ; Jovanovic, Miroslav N..; International Handbook on the Economics of IntegrationAccount: s4245486

Agricultural policy as a barrier to global economic integration 229
from −20 per cent to −30 per cent before coming back up to almost zero in 2000–04),
the NRA for import- competing farmers in developing countries has fl uctuated between
20 and 30 per cent (and even reached 40 per cent in the years of low prices in the mid-
1980s). Having increased in the 1960s and 1970s, the anti- trade bias within agriculture
(the taxing of both exports and imports of farm products) for developing countries has
diminished since the mid- 1980s, but the NRA gap between the import- competing and
export subsectors still averages around 20 percentage points.
Figure 11.2 also reveals that the NRA for import- competing farmers in developing
countries has increased at virtually the same pace as that in high- income countries. This
suggests that growth in agricultural protection is something that begins at relatively low
levels of per capita income rather than being a phenomenon exclusive to high- income
countries.
The improvement in farmers’ incentives in developing countries is understated by
the above NRA estimates, because those countries have also reduced their assistance to
producers of non- agricultural tradable goods, most notably manufactures. The decline
in the weighted average NRA for the latter, depicted in Figure 11.3, was clearly much
greater than the increase in the average NRA for tradable agricultural sectors for the
period to the mid- 1980s, consistent with the fi nding two decades ago of Krueger et al.
(1988, 1991). For the period since the mid- 1980s, changes in the NRAs of both sectors
have contributed almost equally to the improvement in incentives to farmers. The RRA,
defi ned in the previous section, provides a useful indicator of relative price change: the
RRA for developing countries as a group went from −46 per cent in the second half of
–30
–20
–10
0
10
20
30
40
50
60
70%
1955
–59
1960
–64
1965
–69
1970
–74
1975
–79
1980
–84
1985
–89
1990
–94
1995
–99
2000
–04
HIC & ECA HIC & ECA, incl. decoupled payments Developing countries
Note: a Denoted by the World Bank as ECA, for (Central and Eastern) Europe and Central Asia.
Source: Anderson (2009, Ch. 1), based on estimates in Anderson and Valenzuela (2008).
Figure 11.1 Nominal rates of assistance to agriculture in high- income countries (HIC)
and European transition economiesa and in developing countries, 1955 to
2004 (per cent, weighted averages, with ‘decoupled’ payments included in
the dashed HIC line)
jovav3.indb 229jovav3.indb 229 16/12/10 16:52:0216/12/10 16:52:02
Copyright © 2011. Edward Elgar. All rights reserved. May not be reproduced in any form without permission from the publisher, except fair uses permitted under U.S. or
applicable copyright law.
EBSCO Publishing : eBook Collection (EBSCOhost) - printed on 6/9/2015 1:35 PM via UNIVERSIDAD RAFAELLANDIVARAN: 387706 ; Jovanovic, Miroslav N..; International Handbook on the Economics of IntegrationAccount: s4245486
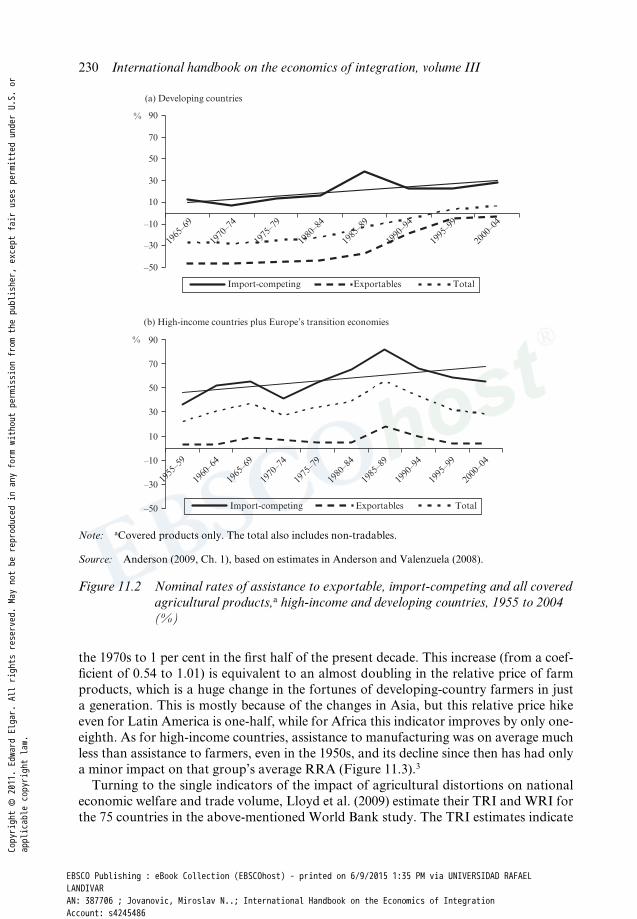
230 International handbook on the economics of integration, volume III
the 1970s to 1 per cent in the fi rst half of the present decade. This increase (from a coef-
fi cient of 0.54 to 1.01) is equivalent to an almost doubling in the relative price of farm
products, which is a huge change in the fortunes of developing- country farmers in just
a generation. This is mostly because of the changes in Asia, but this relative price hike
even for Latin America is one- half, while for Africa this indicator improves by only one-
eighth. As for high- income countries, assistance to manufacturing was on average much
less than assistance to farmers, even in the 1950s, and its decline since then has had only
a minor impact on that group’s average RRA (Figure 11.3).3
Turning to the single indicators of the impact of agricultural distortions on national
economic welfare and trade volume, Lloyd et al. (2009) estimate their TRI and WRI for
the 75 countries in the above- mentioned World Bank study. The TRI estimates indicate
1965
–69
1970
–74
1975
–79
1980
–84
1985
–89
1990
–94
1995
–99
2000
–04
(a) Developing countries
–50
–30
–10
10
30
50
70
90
Import-competing Exportables Total
1955
–59
1960
–64
1965
–69
1970
–74
1975
–79
1980
–84
1985
–89
1990
–94
1995
–99
2000
–04
(b) High-income countries plus Europe’s transition economies
%
%
–50
–30
–10
10
30
50
70
90
Import-competing Exportables Total
Note: aCovered products only. The total also includes non- tradables.
Source: Anderson (2009, Ch. 1), based on estimates in Anderson and Valenzuela (2008).
Figure 11.2 Nominal rates of assistance to exportable, import- competing and all covered
agricultural products,a high- income and developing countries, 1955 to 2004
(%)
jovav3.indb 230jovav3.indb 230 16/12/10 16:52:0216/12/10 16:52:02
Copyright © 2011. Edward Elgar. All rights reserved. May not be reproduced in any form without permission from the publisher, except fair uses permitted under U.S. or
applicable copyright law.
EBSCO Publishing : eBook Collection (EBSCOhost) - printed on 6/9/2015 1:35 PM via UNIVERSIDAD RAFAELLANDIVARAN: 387706 ; Jovanovic, Miroslav N..; International Handbook on the Economics of IntegrationAccount: s4245486

Agricultural policy as a barrier to global economic integration 231
that the trade- reducing impact of agricultural policies for developing countries as a
group was roughly constant until the early 1990s and thereafter it declined, while for
high- income countries the decline in TRI began a few years later (Figure 11.4(a)). The
TRI for developing countries is driven by the exportables subsector which was being
taxed until recently and the import- competing subsector which was and is increasingly
being protected (albeit less than in high- income countries – see Figure 11.2 above). For
high- income countries, policies have supported both exporting and import- competing
agricultural products and, even though they strongly favour the latter, the assistance
%
1955
–59
1960
–64
1965
–69
1970
–74
1975
–79
1980
–84
1985
–89
1990
–94
1995
–99
2000
–04
(b) High-income countries
–60
–40
–20
0
20
40
60
80
100
NRA agriculture NRA non-agricultureRRA
1965
–69
1970
–74
1975
–79
1980
–84
1985
–89
1990
–94
1995
–99
2000
–04
(a) Developing countries
–60
–40
–20
0
20
40
60
80%
RRA NRA non-ag tradables NRA ag tradables
Note: a The RRA is defi ned as 100*[(100 + NRAagt)/(100 + NRAnonagt) − 1], where NRAagt and NRAnonagt are the percentage NRAs for the tradables parts of the agricultural and non- agricultural sectors, respectively.
Source: Anderson (2009, Ch. 1), based on estimates in Anderson and Valenzuela (2008).
Figure 11.3 Nominal rates of assistance to agricultural and non- agricultural sectors and
relative rate of assistance,a developing and high- income countries, 1955 to
2004 (per cent, production- weighted averages across countries)
jovav3.indb 231jovav3.indb 231 16/12/10 16:52:0216/12/10 16:52:02
Copyright © 2011. Edward Elgar. All rights reserved. May not be reproduced in any form without permission from the publisher, except fair uses permitted under U.S. or
applicable copyright law.
EBSCO Publishing : eBook Collection (EBSCOhost) - printed on 6/9/2015 1:35 PM via UNIVERSIDAD RAFAELLANDIVARAN: 387706 ; Jovanovic, Miroslav N..; International Handbook on the Economics of IntegrationAccount: s4245486

232 International handbook on the economics of integration, volume III
to exporters has off set somewhat the anti- trade bias from the protection of import-
competing producers.
The WRI estimates for agricultural policies, shown in Figure 11.4(b), indicate a steady
rise from the 1960s to the 1980s, but some decline in the 1990s. This refl ects the fact that
NRAs for high- income and developing countries diverged (in opposite directions) away
from zero in the fi rst half of the period under study and then converged towards zero in
the most recent quarter- century. That meant that, while their weighted average NRA
traces out a fairly fl at trend, the WRI traces out a hill- shaped path and thus provides
a less misleading indicator of the trend in resource misallocation in world agricultural
markets.
2005
–07
1960
–64
1965
–69
1970
–74
1975
–79
1980
–84
1985
–89
1990
–94
1995
–99
2000
–04
2005
–07
1960
–64
1965
–69
1970
–74
1975
–79
1980
–84
1985
–89
1990
–94
1995
–99
2000
–04
(a) Trade reduction index
–20
0
20
40
60
(b) Welfare reduction index
–20
0
20
40
60
%
%
Developing countries Europe’s transition econs High-income countries
Developing countries Europe’s transition econs High-income countries
Source: Lloyd et al. (2009), based on NRAs and CTEs in Anderson and Valenzuela (2008).
Figure 11.4 Trade reduction and welfare reduction indexes for tradable farm products,
by region, 1960 to 2007 (%)
jovav3.indb 232jovav3.indb 232 16/12/10 16:52:0216/12/10 16:52:02
Copyright © 2011. Edward Elgar. All rights reserved. May not be reproduced in any form without permission from the publisher, except fair uses permitted under U.S. or
applicable copyright law.
EBSCO Publishing : eBook Collection (EBSCOhost) - printed on 6/9/2015 1:35 PM via UNIVERSIDAD RAFAELLANDIVARAN: 387706 ; Jovanovic, Miroslav N..; International Handbook on the Economics of IntegrationAccount: s4245486

Agricultural policy as a barrier to global economic integration 233
4 EFFECTS OF PAST REFORMS AND OF REMAINING POLICIES: RESULTS OF ECONOMY- WIDE MODELLING
It is clear from the above that there has been a great deal of reform over the past quarter
of a century of policy distortions to agricultural incentives throughout the world: the
anti- agricultural and anti- trade biases of the policies of many developing countries have
been reduced, and the farm export subsidies of high- income countries have been cut.
As well, there has been some re- instrumentation towards less ineffi cient and less trade-
distorting forms of agricultural support, particularly in Western Europe (see the dashed
line in Figure 11.1). However, protection from agricultural import competition has con-
tinued to show an upward trend in both rich and poor countries, notwithstanding the
Uruguay Round Agreement on Agriculture that aimed to bind and reduce farm tariff s.
What have been the net economic eff ects of agricultural price and trade policy changes
around the world since the early 1980s? And how do those eff ects on global markets,
farm incomes and economic welfare compare with the eff ects of policy distortions that
were still in place as of 2004? Valenzuela et al. (2009) used a global economy- wide model
known as ‘Linkage’ (van der Mensbrugghe, 2005) to provide a combined retrospective
and prospective analysis that sought to assess how far the world had come, and how far it
still has to go, in rectifying the disarray in world agriculture. Those authors quantify the
impacts of both past reforms and current policies by comparing the eff ects of the recent
World Bank project’s distortion estimates for the 1980–84 period with those of 2004.4
Several key fi ndings from that economy- wide modelling study are worth summaris-
ing here. First, the policy reforms from the early 1980s to the mid- 2000s improved
global economic welfare by US$233 billion per year, and removing the distortions that
remained in 2004 would add another US$168 billion per year (in 2004 US dollars). This
suggests that in terms of global welfare the world moved three- fi fths of the way towards
global free trade in goods over that quarter- century.
Second, developing economies benefi ted proportionately more than high- income
economies (1.0 per cent compared with 0.7 per cent of national income) from those past
policy reforms, and would gain nearly twice as much as high- income countries if all
countries were to complete that reform process (an average increase of 0.9 per cent com-
pared with 0.5 per cent for high- income countries from freeing the distortions in place in
2004). Of those prospective welfare gains from global goods trade liberalisation, 70 per
cent would come from agriculture and food policy reform. This is a striking result given
that the shares of agriculture and food in global GDP and global trade are only 3 and 6
per cent, respectively. The contribution of farm and food policy reform to the prospec-
tive welfare gain for developing countries alone is slightly greater, at 72 per cent.
Third, the share of global farm production exported (excluding intra- European Union
(EU) trade) in 2004 has been slightly smaller as a result of those reforms since 1980–84,
because of less farm export subsidies. The 8 per cent share for agriculture in 2004 con-
trasts with the 31 per cent share for other primary products and the 25 per cent for all
other goods – a ‘thinness’ that is an important contributor to the volatility of interna-
tional prices for weather- dependent farm products. If the policies distorting goods trade
in 2004 were removed, the share of global production of farm products that is exported
would rise from 8 to 13 per cent, thereby reducing instability of prices and expanding the
quantities of those products traded.
jovav3.indb 233jovav3.indb 233 16/12/10 16:52:0216/12/10 16:52:02
Copyright © 2011. Edward Elgar. All rights reserved. May not be reproduced in any form without permission from the publisher, except fair uses permitted under U.S. or
applicable copyright law.
EBSCO Publishing : eBook Collection (EBSCOhost) - printed on 6/9/2015 1:35 PM via UNIVERSIDAD RAFAELLANDIVARAN: 387706 ; Jovanovic, Miroslav N..; International Handbook on the Economics of IntegrationAccount: s4245486

234 International handbook on the economics of integration, volume III
Fourth, the developing countries’ share of the world’s primary agricultural exports
rose from 43 to 55 per cent, and its share of global farm output from 58 to 62 per cent,
because of the reforms since the early 1980s, with rises in output of nearly all agricultural
industries except rice and sugar. Removing the remaining goods market distortions as
of 2004 would boost the developing countries’ shares of global agricultural exports and
output even further, to 64 and 65 per cent, respectively.
Fifth, the average real price for agricultural and food products in international markets
would have been 13 per cent lower had policies not changed over the past quarter-
century. Evidently the impact of the fall in RRA in high- income countries (including the
cuts in farm export subsidies) in raising international food prices more than off set the
opposite impact of the RRA rise (including the cuts in agricultural export taxes) in devel-
oping countries over that period. By contrast, removing the remaining distortions as of
2004 is projected to raise the international price of agricultural and food products by less
than 1 per cent on average. This is in contrast to earlier modelling results based on the
Global Trade Analysis Project (GTAP) protection database. (For example Anderson et
al. (2006) estimated that they would rise by 3.1 per cent or, for primary agriculture alone,
by 5.5 per cent.) The smaller impact seen in these new results is because export taxes in
developing countries, based on the above NRA estimates for 2004, are included in the
new database (most notably for Argentina) and their removal would off set considerably
the international price- raising eff ect of eliminating import protection and farm subsidies
elsewhere.
Sixth, for developing countries as a group, net farm income (value added in agricul-
ture) is estimated to be 4.9 per cent higher than it would have been without the reforms
of the past quarter- century, which is more than 10 times the proportional reform gain
in non- agricultural value added. If the price and trade policies remaining in 2004 were
removed, net farm incomes in developing countries would rise a further 5.6 per cent,
compared with just 1.9 per cent for non- agricultural value added. In addition, unskilled
workers in developing countries – the majority of whom work on farms – would see
their returns rise more than returns on other productive factors from that liberalisation.
Together, these fi ndings suggest that both inequality and poverty could be alleviated
by such reform, given that three- quarters of the world’s poor are farmers in developing
countries (Chen and Ravallion, 2008).
5 PROSPECTS FOR FURTHER AGRICULTURAL REFORM
The reasons why some countries have reformed their price- distorting agricultural and
trade policies more than others in recent decades are varied. Some have reformed unilat-
erally, apparently having become convinced that it is in their own national interest to do
so. China is the most dramatic and signifi cant example of the past three decades among
developing countries, and Australia and New Zealand among the high- income countries
(Anderson et al., 2007; Huang et al., 2009). Other developing countries may have done
so partly to secure bigger and better loans from international fi nancial institutions and
then, having taken that fi rst step, they continued the process, even if somewhat intermit-
tently. India is one example, but there are numerous other examples in Africa and Latin
America. Few have gone backwards in terms of increasing their anti- agricultural bias,
jovav3.indb 234jovav3.indb 234 16/12/10 16:52:0216/12/10 16:52:02
Copyright © 2011. Edward Elgar. All rights reserved. May not be reproduced in any form without permission from the publisher, except fair uses permitted under U.S. or
applicable copyright law.
EBSCO Publishing : eBook Collection (EBSCOhost) - printed on 6/9/2015 1:35 PM via UNIVERSIDAD RAFAELLANDIVARAN: 387706 ; Jovanovic, Miroslav N..; International Handbook on the Economics of IntegrationAccount: s4245486

Agricultural policy as a barrier to global economic integration 235
but Zimbabwe and perhaps Argentina qualify during the present decade – and numer-
ous others joined them in 2008, at least temporarily, in response to the sudden upward
spike in international food prices. And some have reduced their agricultural subsidies
and import barriers at least partly in response to the GATT’s (General Agreement on
Tariff s and Trade) multilateral Uruguay Round Agreement on Agriculture, the EU
being the most important example (helped by its desire for otherwise costly preferential
trade agreements, including its expansions eastwards in 2004 and 2007 and its preferen-
tial trading arrangements with former colonies and other least- developed countries). The
United States, by contrast, has slipped back into higher support after showing signs of
reform in the latter 1990s (Orden et al., 2010).
The EU reforms suggest that growth in agricultural protection can be slowed and even
reversed if accompanied by re- instrumentation away from price supports to decoupled
measures or more direct forms of farm income support (Josling, 2009). The starker
examples of Australia and New Zealand show that one- off buyouts can bring faster
and even complete reform.5 But in the developing countries where levels of agricultural
protection are generally below those in high- income countries, there are fewer signs of a
slowdown of the upward trend in agricultural protection from import competition over
the past half- century.
Indeed, there are numerous signs that the governments of developing countries want
to keep open their options to raise agricultural NRAs in the future, particularly via
import restrictions. One indicator is the high tariff bindings to which developing coun-
tries committed themselves following the Uruguay Round: as of 2001, actual applied
tariff s on agricultural products averaged less than half the corresponding bound tariff s
for developing countries of 48 per cent, and less than one- sixth in the case of least-
developed countries (Anderson and Martin, 2006, Table 1.2).
Another indicator of reluctance about agricultural trade reform is the demand by
many developing countries to be allowed to maintain their rates of agricultural protec-
tion for reasons of food security, livelihood security and rural development. This view
has succeeded in bringing ‘special products’ and a ‘special safeguard mechanism’ into
the multilateral trading system’s agricultural negotiations, even though such policies,
which would raise domestic food prices in developing countries, may worsen poverty and
reduce the food security of the poor (Ivanic and Martin, 2008), and would exacerbate
instability in international markets for farm products.
Those developing economies that continue to free up domestic markets and prac-
tise good macroeconomic governance will keep growing. Typically the growth will be
more rapid in manufacturing and service activities than in agriculture, especially in the
more densely populated countries where agricultural comparative advantage is likely to
decline. Whether such economies become more dependent on imports of farm products
depends, however, on what happens to their relative RRA. The fi rst wave of Asian indus-
trialisers (Japan, and then Korea and Taiwan), like some Western European countries
before them, chose to slow the growth of dependence on food imports by raising their
NRA for agriculture even as they were bringing down their NRA for non- farm trada-
bles, such that their RRA became increasingly further above the neutral zero level. A
key question is: will later industrialisers copy advanced economies, given the past close
association of RRAs with rising per capita income and falling agricultural comparative
advantage? Figures 11.2 and 11.3 suggest that developing countries’ RRA trends of the
jovav3.indb 235jovav3.indb 235 16/12/10 16:52:0216/12/10 16:52:02
Copyright © 2011. Edward Elgar. All rights reserved. May not be reproduced in any form without permission from the publisher, except fair uses permitted under U.S. or
applicable copyright law.
EBSCO Publishing : eBook Collection (EBSCOhost) - printed on 6/9/2015 1:35 PM via UNIVERSIDAD RAFAELLANDIVARAN: 387706 ; Jovanovic, Miroslav N..; International Handbook on the Economics of IntegrationAccount: s4245486

236 International handbook on the economics of integration, volume III
past three decades have been on the same upward trajectory as the high- income countries
prior to the 1990s. So unless new forces aff ect their polities, the governments of later
industrialising economies may well follow suit.
One new force is disciplines on farm subsidies and protection policies of WTO members
since the Uruguay Round. Earlier industrialisers were not bound under GATT to limit
their agricultural protection. Had there been strict disciplines on farm trade measures
at the time Japan and Korea joined GATT in 1955 and 1967, respectively, their NRAs
may have been halted at less than 20 per cent (Anderson, 2009, Figure 1.12). At the time
of China’s accession to the WTO in December 2001, its NRA was less than 5 per cent
according to Huang et al. (2009), or 7.3 per cent for import- competing agriculture alone.
Its average bound import tariff commitment was about twice that (16 per cent in 2005),
but what matters most is China’s out- of- quota bindings on the items whose imports are
restricted by tariff rate quotas. These tariff bindings, as of 2005, were 65 per cent for
grains, 50 per cent for sugar and 40 per cent for cotton (Anderson et al., 2009). Clearly
the legal commitments even China made on acceding to the WTO are a long way from
current levels of support for its farmers, and so are unlikely to constrain the government
very much in the next decade or so. The legal constraints on developing countries that
joined the WTO earlier are even less restrictive. For India, Pakistan and Bangladesh, for
example, their estimated NRAs for agricultural importables in 2000–04 are 34, 4 and 6
per cent, respectively, whereas the average bound tariff s on their agricultural imports are
114, 96 and 189 per cent, respectively (WTO, ITC and UNCTAD, 2007). Also, like other
developing countries, they have high bindings on product- specifi c domestic supports of
10 per cent and another 10 per cent for non- product specifi c assistance, a total of 20 more
percentage points of NRA (17 per cent in China’s case) that legally could come from
domestic support measures – compared with 10 per cent currently in India and less than
3 per cent in the rest of South Asia.
Given this need to tighten the constraints on agricultural protection and assistance
policies, it is especially unfortunate that the WTO’s Doha Development Agenda is strug-
gling to deliver a new agreement, and makes it more likely that developing countries will
follow the same agricultural protection path this century as that taken last century by
high- income countries.
There are some relatively new forces at work that have recently raised, and will con-
tinue to raise, international prices of farm products above what they would otherwise be,
and thus reduce the NRAs of countries that maintain constant domestic prices. One is
the emergence of demand for biofuels, which is driven largely by subsidies and mandates
in the United States and EU (whose NRA equivalents have yet to be calculated for those
countries). Another is the growth of demand for protein- rich foods (for example, live-
stock products) in rapidly emerging economies such as China. Global climate change is
also expected to raise the mean (and variance) of international prices of farm products,
thereby raising the denominator of the domestic- to- border price ratio.
By contrast, the emergence of the new biotechnologies that provide genetically modi-
fi ed (GM) foods, feedstuff s, fi bres and biofuels are helping to lower international food
prices – although not in those countries that are banning the production and importa-
tion of GM farm products. Such bans purportedly are for local food safety and envi-
ronmental reasons, although countries that have adopted and export GM crops suspect
that these new protective measures also have a traditional economic protective motive.
jovav3.indb 236jovav3.indb 236 16/12/10 16:52:0316/12/10 16:52:03
Copyright © 2011. Edward Elgar. All rights reserved. May not be reproduced in any form without permission from the publisher, except fair uses permitted under U.S. or
applicable copyright law.
EBSCO Publishing : eBook Collection (EBSCOhost) - printed on 6/9/2015 1:35 PM via UNIVERSIDAD RAFAELLANDIVARAN: 387706 ; Jovanovic, Miroslav N..; International Handbook on the Economics of IntegrationAccount: s4245486

Agricultural policy as a barrier to global economic integration 237
Regardless of the rationale for those bans, the new biotechnologies on the one hand are
providing lower- cost (and potentially higher- quality and less- pollutive) farm products in
those developing countries that share the view of current adopters that this is a benign
technology.6 On the other hand, until there is general acceptance of GM technology glo-
bally, this issue is going to be a force that fragments the world into two parts: the group
of countries that accept the technology and enjoy lower- priced farm products, and the
residual set of countries where consumers will have to continue paying higher prices for
their food.
SUMMARY
For decades, trade between countries in agricultural products has been distorted by
policies of richer countries favouring their farmers with import barriers and subsidies.
Agricultural trade has often also been limited by an anti- agricultural, pro- urban bias in
many developing- country policies. Both sets of policies have reduced national and global
economic welfare. They also have added to inequality and poverty in developing coun-
tries, because three- quarters of the world’s billion poorest people depend on farming for
their livelihood. Over the past two decades numerous developing- country governments
have reduced their sectoral and trade policy distortions, while some high- income coun-
tries have also begun reforming their farm protectionist policies. Drawing on results from
a new multicountry World Bank research project, this chapter summarises estimates of
the extent of those distortions to prices of farm products over the past fi ve decades, and
of their eff ect in reducing the integration of the world’s agricultural markets.
Keywords
Distorted incentives, agricultural and trade policy reforms, international economic
integration.
JEL Classification
F13, F14, Q17, Q18.
NOTES
* This chapter draws on results from the World Bank research project on Distortions to Agricultural Incentives (www.worldbank.org/agdistortions). The authors are grateful for the eff orts of nearly 100 authors who provided the country case studies for the Agricultural Distortions project; for computational assistance from a team of assistants that brought together the global Agricultural Distortions database; and for funding from various World Bank Trust Funds and the Australian Research Council. Views expressed are the authors’ alone and not necessarily those of the World Bank or its Executive Directors.
1. In aggregate the coverage represents just under two- thirds of global farm production valued at undistorted prices over the period covered. Of the world’s 30 most valuable agricultural products, the NRAs cover 77 per cent of global output, ranging from two- thirds for livestock, three- quarters for oilseeds and tropical crops, and fi ve- sixths for grains and tubers. Those products represent an even higher share (85 per cent) of global agricultural exports.
jovav3.indb 237jovav3.indb 237 16/12/10 16:52:0316/12/10 16:52:03
Copyright © 2011. Edward Elgar. All rights reserved. May not be reproduced in any form without permission from the publisher, except fair uses permitted under U.S. or
applicable copyright law.
EBSCO Publishing : eBook Collection (EBSCOhost) - printed on 6/9/2015 1:35 PM via UNIVERSIDAD RAFAELLANDIVARAN: 387706 ; Jovanovic, Miroslav N..; International Handbook on the Economics of IntegrationAccount: s4245486

238 International handbook on the economics of integration, volume III
2. Farmers are aff ected not just by prices of their own products but also by the incentives non- agricultural producers face. That is, it is relative prices and hence relative rates of government assistance that aff ect producer incentives. More than 70 years ago, Lerner (1936) provided his symmetry theorem which proved that in a two- sector economy, an import tax has the same eff ect as an export tax. This carries over to a model that also includes a third sector producing only non- tradables.
3. Australia and New Zealand were clear exceptions, where manufacturing protection had been very high and its decline occurred several decades later than in other high- income countries, so their RRAs have risen much like the average for developing countries (Anderson et al., 2007).
4. While international food prices in mid- 2008 were well above those of 2004, the slump in these prices over the second half of 2008 suggests that prices in 2009 may not be so diff erent from those of 2004, and in any case the Doha Round negotiations have been using such a historical period against which to draw up reform proposals.
5. Anderson et al. (2007). For a detailed analysis of the buyout option versus the slower and less complete cashout option (moving to direct payments), as well as the uncompensated gradual squeeze- out or sudden cutout options, see Orden and Diaz- Bonilla (2006).
6. On the potential global economic welfare eff ects of GM technologies and associated trade policies for GM farm products, and their distributional consequences, see, for example, Anderson and Jackson (2005) and Anderson et al. (2008b).
REFERENCES
Anderson, J.E. and Neary, J.P. (2005), Measuring the Restrictiveness of International Trade Policy, Cambridge, MA: MIT Press.
Anderson, K. (ed.) (2009), Distortions to Agricultural Incentives: A Global Perspective, 1955–2007, London: Palgrave Macmillan and Washington, DC: World Bank.
Anderson, K. and Hayami, Y. (1986), The Political Economy of Agricultural Protection: East Asia in International Perspective, London: Allen & Unwin.
Anderson, K. and Jackson, L.A. (2005), ‘Some implications of GM food technology policies for Sub- Saharan Africa’, Journal of African Economies, 14(3), September: 385–410.
Anderson, K., Kurzweil, M., Martin, W., Sandri, D. and Valenzuela, E. (2008a), ‘Measuring distortions to agricultural incentives, revisited’, World Trade Review, 7: 675–704.
Anderson, K., Lloyd, P.J. and MacLaren, D. (2007), ‘Distortions to agricultural incentives in Australia since World War II’, The Economic Record, 83: 461–82.
Anderson, K. and Martin W. (eds) (2006), Agricultural Trade Reform and the Doha Development Agenda, London: Palgrave Macmillan and Washington, DC: World Bank.
Anderson, K., Martin, W. and Valenzuela, E. (2009), ‘Long run implications of WTO accession for agriculture in China’, in Sheldon, I. (ed.), China’s Agricultural Trade: Issues and Prospects. St Paul, MN: International Agricultural Trade Research Consortium.
Anderson, K., Martin, W. and van der Mensbrugghe, D. (2006), ‘Distortions to world trade: impacts on agricultural markets and farm incomes’, Review of Agricultural Economics, 28: 168–94.
Anderson, K. and Valenzuela, E. (2008), ‘Global Estimates of Distortions to Agricultural Incentives, 1955–2007’, Core database available at www.worldbank.org/agdistortions.
Anderson, K., Valenzuela, E. and Jackson, L.A. (2008b), ‘Recent and prospective adoption of genetically modifi ed cotton: a global CGE analysis of economic impacts’, Economic Development and Cultural Change, 56(2), January: 265–96.
Bates, R.H. (1981), Markets and States in Tropical Africa: The Political Basis of Agricultural Policies, Berkeley, CA: University of California Press.
Chen, S. and Ravallion, M. (2008), ‘The developing world is poorer than we thought, but no less successful in the fi ght against poverty’, Policy Research Working Paper 4703, World Bank, Washington, DC.
Huang, J., Rozelle, S., Martin, W. and Liu, Y. (2009), ‘China’, Ch. 3 in Anderson, K. and Martin, W. (eds), Distortions to Agricultural Incentives in Asia, Washington, DC: World Bank.
Ivanic, M. and Martin, W. (2008), ‘Implications of higher global food prices for poverty in low- income coun-tries’, Agricultural Economics, 39: 405–16.
Johnson, D.G. (1991), World Agriculture in Disarray, (rev. edn), London: St Martin’s Press.Josling, T. (2009), ‘Western Europe’, Ch. 3 in Anderson (ed.), pp. 115–76.Krueger, A.O., Schiff , M. and Valdés, A. (1988), ‘Measuring the impact of sector- specifi c and economy- wide
policies on agricultural incentives in LDCs’, World Bank Economic Review, 2: 255–72.Krueger, A.O., Schiff , M. and Valdés, A. (1991), The Political Economy of Agricultural Pricing Policy, Volume
jovav3.indb 238jovav3.indb 238 16/12/10 16:52:0316/12/10 16:52:03
Copyright © 2011. Edward Elgar. All rights reserved. May not be reproduced in any form without permission from the publisher, except fair uses permitted under U.S. or
applicable copyright law.
EBSCO Publishing : eBook Collection (EBSCOhost) - printed on 6/9/2015 1:35 PM via UNIVERSIDAD RAFAELLANDIVARAN: 387706 ; Jovanovic, Miroslav N..; International Handbook on the Economics of IntegrationAccount: s4245486
Agricultural policy as a barrier to global economic integration 239
1: Latin America, Volume 2: Asia, and Volume 3: Africa and the Mediterranean, Baltimore, MD: Johns Hopkins University Press for the World Bank.
Lerner, A. (1936), ‘The symmetry between import and export taxes’, Economica, 3(11), August: 306–13.Lloyd, P., Croser, J. and Anderson, K. (2010), ‘Global distortions to agricultural markets: new indicators of
trade and welfare impacts, 1960 to 2007’, Review of Development Economics, 14(2): 141–60, May.Orden, D., Blandford, D. and Josling, T. (2010), ‘Determinants of farm policies in the United States, 1996–
2008’, Ch. 7 in Anderson, K. (ed.), The Political Economy of Agricultural Price Distortions, Cambridge and New York: Cambridge University Press.
Orden, D. and Diaz- Bonilla, E. (2006), ‘Holograms and ghosts: new and old ideas for reforming agricultural policies’, Ch. 11 in Anderson and Martin (eds).
Organisation for Economic Cooperation and Development (OECD) (2008), Producer and Consumer Support Estimates, available www.oecd.org (accessed 1 December 2008).
Tyers, R. and Anderson, K. (1992), Disarray in World Food Markets: A Quantitative Assessment, Cambridge and New York: Cambridge University Press.
Valenzuela, E., van der Mensbrugghe, D. and Anderson, K. (2009), ‘General equilibrium eff ects of price distor-tions on global markets, farm incomes and welfare’, Ch. 13 in Anderson (ed.).
van der Mensbrugghe, D. (2005), ‘Linkage Technical Reference Document: Version 6.0’, unpublished, World Bank, Washington, DC, available at: www.worldbank.org/prospects/linkagemodel (accessed 1 December 2008).
World Bank (2008), World Development Report 2008: Agriculture for Development, Washington, DC: World Bank.
WTO, ITC and UNCTAD (2007), Tariff Profi les 2006, Geneva: World Trade Organization.
jovav3.indb 239jovav3.indb 239 16/12/10 16:52:0316/12/10 16:52:03
Copyright © 2011. Edward Elgar. All rights reserved. May not be reproduced in any form without permission from the publisher, except fair uses permitted under U.S. or
applicable copyright law.
EBSCO Publishing : eBook Collection (EBSCOhost) - printed on 6/9/2015 1:35 PM via UNIVERSIDAD RAFAELLANDIVARAN: 387706 ; Jovanovic, Miroslav N..; International Handbook on the Economics of IntegrationAccount: s4245486

240
12 The diff erential impact of economic integration on environmental policyJale Tosun and Christoph Knill
1 INTRODUCTION
In the last three decades, a growing number of both industrialised and industrialising
countries have decided to open their economies and conduct liberal trade policies. The
launching of multilateral trade regimes, such as the General Agreement on Tariff s and
Trade (GATT) and the World Trade Organization (WTO), further intensifi ed the eco-
nomic interactions between countries. Complementary to multilateral regimes, regional
integration, such as the North American Free Trade Agreement (NAFTA), has prolifer-
ated, and has even led to the creation of a political union as the case of the European
Union (EU) shows.
While the acceleration of international trade was initially regarded against the back-
ground of industrial development and income growth, gradually concerns emerged about
negative impacts on the environment. The focus of this discussion has been on whether
countries engage in an environmental ‘race to the bottom’ by deliberately setting envi-
ronmental protection standards at low levels to attract international capital (Ferrantino,
1997, p. 48). This scenario has been associated with a loss in the level of environmental
quality and consequently with an increase in social costs. Policy makers in industrialising
countries, by contrast, have expressed fears that the links between trade policy and envi-
ronmental policy are used by industrialised countries to erect barriers to trade (Copeland
and Gulati, 2006, p. 178). These concerns are currently, for instance, present in the public
debate surrounding the creation of the Free Trade Area of the Americas (see Deere and
Esty, 2002) and a frequent object of dispute settlement in the WTO context as they are
perceived as non- tariff barriers to global economic integration (see Charnovitz, 2007;
Anderson and Valenzuela, this volume, ch. 11).1
As a result, the interaction between trade policy and environmental policy has triggered
a scientifi c debate, in which both the commercial impact of environmental policies (see,
for example, van Beers and van der Bergh, 1999) and the environmental impact of trade
policies (see, for example, Prakash and Potoski, 2006) have been considered. Despite
the large size of the literature, the evidence on the impact of economic integration on
environmental policy choices often produces contradictory fi ndings making cumulative
research diffi cult (Bernstein and Cashore, 2000, p. 68). This chapter reviews some of the
theoretical concepts and empirical evidence on the trade– environment interface with the
goal of shedding light on the shortcomings and providing solutions.
How does economic integration aff ect the design of national environmental policy
arrangements? To answer this question, we propose a conceptual clarifi cation of eco-
nomic integration and the underlying causal mechanisms that bring about environmen-
tal policy change. Researchers interested in addressing this issue fi rst need to clarify their
jovav3.indb 240jovav3.indb 240 16/12/10 16:52:0316/12/10 16:52:03
Copyright © 2011. Edward Elgar. All rights reserved. May not be reproduced in any form without permission from the publisher, except fair uses permitted under U.S. or
applicable copyright law.
EBSCO Publishing : eBook Collection (EBSCOhost) - printed on 6/9/2015 1:35 PM via UNIVERSIDAD RAFAELLANDIVARAN: 387706 ; Jovanovic, Miroslav N..; International Handbook on the Economics of IntegrationAccount: s4245486

The diff erential impact of economic integration on environmental policy 241
understanding of economic integration, which leads to the question, how they measure
this variable. This is a necessary step since there are several conceptions of international
economic integration, which at the most general level imply that economic activities make
boundaries between nation- states less discontinuous.2 For the sake of conceptual clarity,
here we stick to a narrow defi nition of economic integration, which comprises only three
aspects. The fi rst and most rampant defi nition of economic integration refers to rising
international trade and investment fl ows. The second concept of economic integration
takes up the specifi c trade patterns among countries and focuses on increased trade and
investment fl ows with a particular group of countries. Third, economic integration can
be understood as the creation of institutions facilitating cross- border economic fl ows,
such as GATT/WTO. Depending on the concept selected, the environmental policy
implications of economic integration are likely to change due to diff erent causal mecha-
nisms, which are intended to open the ‘black box’ between the dependent variable and
the explanatory variable. Against this background, we introduce regulatory competition,
economic conditionality and international harmonisation as helpful concepts for dis-
entangling the environmental impact of economic integration. Regulatory competition
explicitly models the policy implications of rising competition for trade and investment,
whereas economic conditionality pays attention to the regulatory consequences of trade
with industrialised, high- regulating countries for industrialising, mostly low- regulating
countries. Finally, the mechanism of international harmonisation highlights how
economic institutions shape the member states’ environmental policies.
The central conclusion that can be drawn from our discussion is that the conceptual
clarifi cation and identifi cation of the appropriate causal mechanisms help to overcome
the confusion present in the research literature. In this vein, we can gain a better under-
standing of how international economic forces aff ect domestic environmental policy
making. Our analytical approach thus enables a diff erential modelling of the environ-
mental policy impact of economic integration and supports a more rigorous hypothesis
testing.
This chapter is structured as follows. In Section 2, we give an overview of the most
relevant economic and political science literature on the environmental policy impact of
trade policies. This presentation of the state of the art helps to locate the contribution of
this chapter in the appropriate context. In Section 3, we discuss diff erent modes of eco-
nomic integration and link those with the concepts of regulatory competition, economic
conditionality and international harmonisation. Finally, in Section 4, we summarise our
argument and point to open questions setting the stage for future research.
2 RESEARCH ON TRADE AND THE ENVIRONMENT
The interaction between trade and the environment has been the subject of much schol-
arly debate, in which both economists and political scientists are involved. Generally,
the economists’ research eff orts focus on how increased international trade and capital
mobility aff ect environmental quality. Political scientists, on the other hand, scrutinise
the implications of economic integration for the stringency of environmental policy
arrangements.
According to the economic literature, economic integration aff ects environmental
jovav3.indb 241jovav3.indb 241 16/12/10 16:52:0316/12/10 16:52:03
Copyright © 2011. Edward Elgar. All rights reserved. May not be reproduced in any form without permission from the publisher, except fair uses permitted under U.S. or
applicable copyright law.
EBSCO Publishing : eBook Collection (EBSCOhost) - printed on 6/9/2015 1:35 PM via UNIVERSIDAD RAFAELLANDIVARAN: 387706 ; Jovanovic, Miroslav N..; International Handbook on the Economics of IntegrationAccount: s4245486

242 International handbook on the economics of integration, volume III
quality through several diff erent channels, that is, through product eff ects, scale eff ects
and structure eff ects (Stevens, 1993, pp. 443–5). Product eff ects refer to the transnational
exchange of products and services that have ecological impacts. Through trade, both
environmentally friendly and harmful products can enter a certain country. Scale eff ects
focus on the possible expansion of economic activity and growth, which on the one hand
can burden the environment. On the other hand, however, economic growth entails an
increase in wages and may therefore generate a stronger demand for advanced environ-
mental standards. Structure eff ects relate to production patterns in a particular country
and the use of natural resources due to intensifi ed trade. All of these three categories
can yield both positive and negative impacts on environmental quality. Further, the
interaction of these eff ects can again lead to diff erent results. For example, higher levels
of pollution stemming from an increased scale of production and structure changes can
be off set by positive product eff ects, implying that free trade has a positive impact on the
environment (see Antweiler et al. 2001).
Against this background, the ‘pollution haven hypothesis’ and the ‘environmental
Kuznets curve’ have dominated much of the economic research literature.3 The pollu-
tion haven hypothesis states that trade liberalisation may induce pollution- intensive
industries to migrate to countries with less- stringent environmental regulations. Here
it is important to note that this approach directly refers to regulatory diff erences across
jurisdictions. Countries with weaker environmental protection standards would have
a comparative advantage in pollution- intensive goods and could therefore be inclined
to eff orts to attract foreign capital in these areas. In addition to the pollution haven
hypothesis, Copeland and Taylor (2004) recognise a weaker ‘pollution haven eff ect’,
which would exist if more stringent environmental regulations lead to a capital outfl ow
of the aff ected industries.
With regard to the empirical testing of the pollution haven hypothesis, there is little
evidence that polluting industries shift to other locations in order to avoid the costs of
environmental regulations (see, for example, Birdsall and Wheeler, 1993; Levinson, 1997;
Mani and Wheeler, 1998; Wheeler, 2001; Dasgupta et al., 2002; Gallagher, 2004). The
costs of complying with stringent environmental protection standards seem to be rela-
tively small compared to other factors of production (Ferrantino, 1997, p. 50).4 But there
is indeed emerging evidence that changes in environmental policy aff ect plant location
and production decisions at the margin (Copeland and Gulati, 2006, p. 203). Spatareanu
(2007), for instance, reveals that fi rms in industries with higher abatement costs seem to
invest more abroad, which lends support to the pollution haven eff ect. Nevertheless, the
increasing international liability arising from environmental damages and requests to
undertake remedial actions should turn this option into an ever less attractive option for
multinational companies.
The environmental Kuznets curve refers to the scale eff ects of trade. It stipulates that
the initial increase in pollution associated with economic growth will give way to declin-
ing levels of pollution per capita as countries economically develop and demand higher
environmental quality (Grossman and Krueger, 1995). The inverted U- shaped relation-
ship between economic growth and environmental quality is exhibited by Figure 12.1.
Much of the environmental Kuznets curve literature has focused on testing this basic
hypothesis and estimating the ‘turning point’ level of development at which the per capita
pollution–growth relationship changes sign (see, for example, Seldon and Song, 1995;
jovav3.indb 242jovav3.indb 242 16/12/10 16:52:0316/12/10 16:52:03
Copyright © 2011. Edward Elgar. All rights reserved. May not be reproduced in any form without permission from the publisher, except fair uses permitted under U.S. or
applicable copyright law.
EBSCO Publishing : eBook Collection (EBSCOhost) - printed on 6/9/2015 1:35 PM via UNIVERSIDAD RAFAELLANDIVARAN: 387706 ; Jovanovic, Miroslav N..; International Handbook on the Economics of IntegrationAccount: s4245486
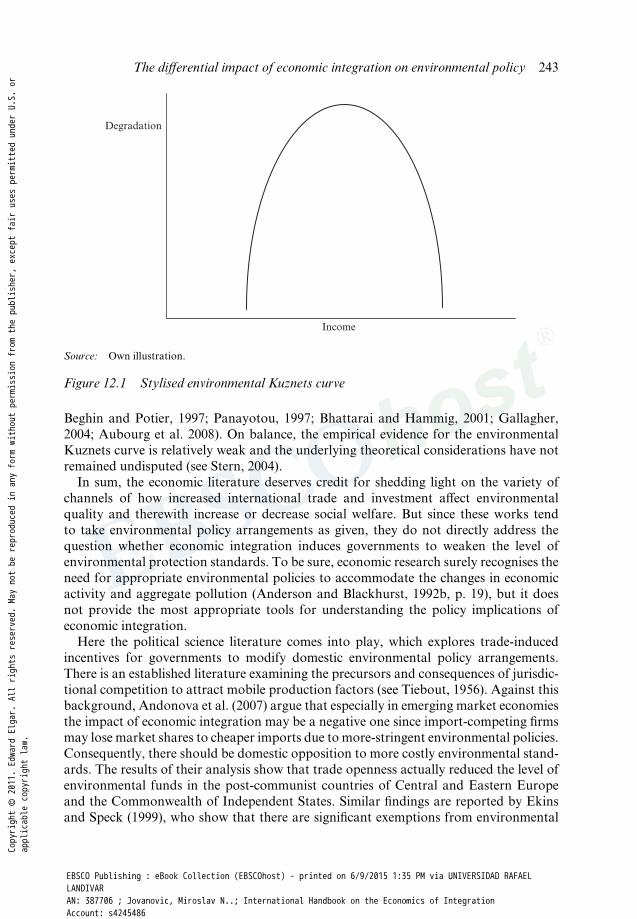
The diff erential impact of economic integration on environmental policy 243
Beghin and Potier, 1997; Panayotou, 1997; Bhattarai and Hammig, 2001; Gallagher,
2004; Aubourg et al. 2008). On balance, the empirical evidence for the environmental
Kuznets curve is relatively weak and the underlying theoretical considerations have not
remained undisputed (see Stern, 2004).
In sum, the economic literature deserves credit for shedding light on the variety of
channels of how increased international trade and investment aff ect environmental
quality and therewith increase or decrease social welfare. But since these works tend
to take environmental policy arrangements as given, they do not directly address the
question whether economic integration induces governments to weaken the level of
environmental protection standards. To be sure, economic research surely recognises the
need for appropriate environmental policies to accommodate the changes in economic
activity and aggregate pollution (Anderson and Blackhurst, 1992b, p. 19), but it does
not provide the most appropriate tools for understanding the policy implications of
economic integration.
Here the political science literature comes into play, which explores trade- induced
incentives for governments to modify domestic environmental policy arrangements.
There is an established literature examining the precursors and consequences of jurisdic-
tional competition to attract mobile production factors (see Tiebout, 1956). Against this
background, Andonova et al. (2007) argue that especially in emerging market economies
the impact of economic integration may be a negative one since import- competing fi rms
may lose market shares to cheaper imports due to more- stringent environmental policies.
Consequently, there should be domestic opposition to more costly environmental stand-
ards. The results of their analysis show that trade openness actually reduced the level of
environmental funds in the post- communist countries of Central and Eastern Europe
and the Commonwealth of Independent States. Similar fi ndings are reported by Ekins
and Speck (1999), who show that there are signifi cant exemptions from environmental
Degradation
Income
Source: Own illustration.
Figure 12.1 Stylised environmental Kuznets curve
jovav3.indb 243jovav3.indb 243 16/12/10 16:52:0316/12/10 16:52:03
Copyright © 2011. Edward Elgar. All rights reserved. May not be reproduced in any form without permission from the publisher, except fair uses permitted under U.S. or
applicable copyright law.
EBSCO Publishing : eBook Collection (EBSCOhost) - printed on 6/9/2015 1:35 PM via UNIVERSIDAD RAFAELLANDIVARAN: 387706 ; Jovanovic, Miroslav N..; International Handbook on the Economics of IntegrationAccount: s4245486

244 International handbook on the economics of integration, volume III
taxes in Europe in order to allay concerns about the adverse eff ect of these taxes on
competitiveness. Moreover, Konisky (2007) uses data from the State Environmental
Managers Survey to show that state regulators in the United States (US) have familiar-
ity with the regulatory practices of other states. Accordingly, they sometimes lead their
agencies to ease their regulatory eff ort, which indicates that competitiveness concerns
indeed aff ect the environmental regulatory behaviour of some US states.
This literature, however, does not allow for easy conclusions. In fact, there is also
strong evidence refuting the hypothesis that international trade undermines environ-
mental protection standards (see, for examples, Hoberg, 1991; Vogel, 1995, 1997, 2000;
Desai, 1998; Drezner, 2001, 2007; Holzinger et al. 2008a, 2008b). Garcia- Johnson (2000),
for instance, argues that the operation of chemical multinational cooperations stimu-
lated the adoption of more advanced environmental practices in Mexico and Brazil.
Why is it so diffi cult to assess whether economic integration is either positively or
negatively correlated with tighter protection standards? We argue that besides diff ering
notions of ‘environmental policy’, the main impediment to a more thorough under-
standing of the impact of economic integration stems from diff erent conceptualisations
of the focal explanatory variable. Some authors (Ekins and Speck, 1999; Andonova et
al., 2007) conceive of economic integration only in terms of increased competition for
international trade and investment. Other contributions (Charnovitz, 1993; Knill et al.,
2008b) focus on regulatory harmonisation within the context of institutional economic
integration, which confronts national policy makers with other pressures than mere
competitiveness considerations. Finally, a third group of empirical works analyses the
eff ects of environmental provisions included in free trade agreements (Weintraub, 2004).
Of course, this plurality in the conceptualisations of economic integration is necessary
and corresponds to its complex character, but it is often overlooked that they also neces-
sitate completely diff erent theoretical underpinnings to produce sound explanations.
Consequently, the empirical fi ndings are limited in their comparability.
Overall, the political scientists’ eff orts to explore the link between economic integra-
tion and environmental policy have produced a heterogeneous body of research, which
provides many instructive insights but does not allow for generalisations. It therefore
remains diffi cult to state which particular aspect of economic integration motivates
national regulators to weaken environmental policies and which prevents them from
doing so. To remedy this situation, we propose to disaggregate the causal mechanisms
underlying the diff erent forms of economic integration and to formulate more clear- cut
expectations about the direction and strength of trade- induced environmental policy
change.
3 THE DIFFERENTIAL IMPACT OF ECONOMIC INTEGRATION
The objective of this section is to elucidate how economic integration aff ects the strin-
gency of national environmental policy arrangements. To this end, we review and struc-
ture the promising theoretical literature that has emerged recently. We argue that by
making their research interests more explicit, scholars of public policy analysis can gain a
better understanding of the trade–environment nexus. This entails that researchers must
jovav3.indb 244jovav3.indb 244 16/12/10 16:52:0316/12/10 16:52:03
Copyright © 2011. Edward Elgar. All rights reserved. May not be reproduced in any form without permission from the publisher, except fair uses permitted under U.S. or
applicable copyright law.
EBSCO Publishing : eBook Collection (EBSCOhost) - printed on 6/9/2015 1:35 PM via UNIVERSIDAD RAFAELLANDIVARAN: 387706 ; Jovanovic, Miroslav N..; International Handbook on the Economics of IntegrationAccount: s4245486

The diff erential impact of economic integration on environmental policy 245
state how they conceive of the variable economic integration, that is, whether they focus
on the outcome of economic integration as increased international trade and investment
or rather on the institutions facilitating or impeding cross- border economic fl ows, such
as GATT/WTO. The diff erent notions of economic integration entail the necessity to use
diff erent theoretical underpinnings. A primary interest in competition for international
trade and investment would suggest the use of the theory of regulatory competition,
whereas economic conditionality is an appropriate concept when the focus is on the
direction of trade. Moreover, international harmonisation helps to understand the impli-
cations of economic integration through the creation of common institutions. These
concepts originate from the literature on cross- national policy convergence (Holzinger
and Knill, 2005, 2008). Their analytical use, however, reaches well beyond this particular
area and allows us to explain environmental policy change in more general terms.
Regulatory Competition
Regulatory competition is associated with the importance of attracting foreign capital
and improving the competitive position of the domestic economy. This concept refers
to the defi nition of economic integration as increased cross- border activities. It hypoth-
esises that the international mobility of goods, workers and capital puts pressure on
the nation- states to redesign domestic market regulations in order to avoid regulatory
burdens restricting the competitiveness of domestic industries (Goodman and Pauly,
1993). The pressure arises from (potential) threats of economic actors to shift their activi-
ties elsewhere. In this sense, the theory of regulatory competition somewhat parallels the
logic of the pollution haven hypothesis. Politicians behaving as rational actors seek to
attract investments, for instance, in order to create or preserve working places. Thus,
regulatory competition clearly predicts a race to the bottom in policies, implying that
industrialised, high- regulating countries lower their standards for approaching those of
industrialising, low- regulating countries (Simmons and Elkins, 2004). Equally, indus-
trialising countries might be reluctant to tighten their protection standards in order to
preserve their comparative advantage, implying a ‘stuck at the bottom’ scenario (Porter,
1999; Knill et al., 2008b).
Theoretical work, however, suggests that there are a number of conditions that may
drive the stringency of domestic environmental policy in both directions (Vogel, 1995,
1997, 2000; Scharpf, 1997; Drezner, 2001, 2007; Holzinger, 2002, 2003). In this context,
particular emphasis is placed on the distinction of diff erent types of environmental
regulations, namely product and process standards.
Product standards defi ne regulatory requirements for the quality and specifi c char-
acteristics of traded goods such as passenger car emissions. Two conditions can avoid
downward dynamics of national product standards. First, competition between products
might be based not only on their price, but also on their quality. If quality aspects domi-
nate, stricter standards will constitute a competitive advantage, hence implying a race
to the top (Scharpf, 1997, p. 523). Second, downward pressures can be avoided if trade
rules allow individual countries to erect exceptional trade barriers for products which
do not comply with national environmental standards. Such measures are, for instance,
possible within the trade regimes of the WTO and the EU. In empirical terms, Damania
et al. (2003) show that increased trade is indeed associated with a reduction of the
jovav3.indb 245jovav3.indb 245 16/12/10 16:52:0316/12/10 16:52:03
Copyright © 2011. Edward Elgar. All rights reserved. May not be reproduced in any form without permission from the publisher, except fair uses permitted under U.S. or
applicable copyright law.
EBSCO Publishing : eBook Collection (EBSCOhost) - printed on 6/9/2015 1:35 PM via UNIVERSIDAD RAFAELLANDIVARAN: 387706 ; Jovanovic, Miroslav N..; International Handbook on the Economics of IntegrationAccount: s4245486

246 International handbook on the economics of integration, volume III
gasoline lead content – that is, a product standard – and consequently with an increase
in environmental protection.
Process standards, by contrast, refer to the conditions under which certain goods are
produced. Typical examples of process standards are sulphur dioxide or nitrogen oxide
emission standards for large combustion plants. Strict standards demand fi lters, which
raise production costs. Then the domestic steel industry, for example, suff ers from a
competitive disadvantage against the steel producers abroad, if the latter need not apply
the same strict standards. In order to avoid such a disadvantage, governments may want
to decrease their standards to the level of other countries. The expectations for the direc-
tion of changes in process standards are therefore less optimistic than for product stand-
ards (see Holzinger, 2002, 2003). However, there is also empirical evidence showing that
the level of process standards may also increase over time (see Holzinger et al., 2008b;
Knill et al., 2008a). In a similar vein, Sorsa (1994) fi nds that more- demanding legislation
has not lowered the international competitiveness of industrialised countries, but rather
created a comparative advantage in environmentally sensitive industries.
Nevertheless, there is empirical evidence that some political jurisdictions have not
strengthened or have even weakened the enforcement of environmental regulations in
order to increase the competitiveness of domestic producers (Vogel, 2000, p. 266). In this
context, Konisky (2007) argues that governments may have the motivation to attempt
to attract economic investment through their enforcement of pollution control regula-
tion. Using a panel dataset of state- level enforcement of US federal air and water pol-
lution control regulation, he shows that a state’s choice about its level of environmental
enforcement is a function of similar choices in states with which they compete for eco-
nomic investment. This fi nding provides evidence that race to the bottom- type dynamics
aff ect the environmental enforcement behaviour of some US states. Similar dynamics
are observed for the relationship between environmental rule setting and actual enforce-
ment and compliance eff orts in Hungary and Mexico (see Gallagher, 2004; Knill et al.,
2008b).
To sum up, the theory of regulatory competition is helpful for understanding how
competitiveness concerns may induce policy makers to lower or to preserve low envi-
ronmental protection standards. Yet, most empirical work rather points to a positive
relationship between increased trade and foreign direct investment (FDI) and the strin-
gency of environmental policy. Does this show that the theory of regulatory competition
is wrong? In fact, it does not since regulatory competition merely describes the incentives
for governments in view of strong competitiveness pressures. This implies that only the
volume of trade and investment is taken into account. The positive impact of economic
integration on environmental policies can, however, be much better understood if one
not only focuses on the volume but also on the direction of economic activities.
Economic Conditionality
An important modifi cation to the theory of regulatory competition has been proposed by
Vogel (1995, 1997, 2000), who argues that the erection of trade barriers might not only
avoid a race to the bottom, but even induce an upward dynamic between national regula-
tions. He observed this development for the regulation of car emission standards in the
US. When California raised its emission standards, most US states followed quickly for
jovav3.indb 246jovav3.indb 246 16/12/10 16:52:0316/12/10 16:52:03
Copyright © 2011. Edward Elgar. All rights reserved. May not be reproduced in any form without permission from the publisher, except fair uses permitted under U.S. or
applicable copyright law.
EBSCO Publishing : eBook Collection (EBSCOhost) - printed on 6/9/2015 1:35 PM via UNIVERSIDAD RAFAELLANDIVARAN: 387706 ; Jovanovic, Miroslav N..; International Handbook on the Economics of IntegrationAccount: s4245486
The diff erential impact of economic integration on environmental policy 247
two reasons. First, California was permitted to apply its standards to foreign car produc-
ers. Second, since licensing procedures for cars are very expensive, car producers wanted
to avoid multiple arrangements and hence demanded harmonised requirements through-
out the US. Based on this observation, the upward ratcheting of regulatory standards is
known as the ‘California eff ect’.
Briefl y, the California eff ect stipulates that economic integration can trigger an upward
adjustment of regulatory policies in (originally) low- regulating countries. This is most
likely if low- regulating countries aim at integrating their economies with high- regulating
countries that possess more advanced regulatory systems. Given their weak economic
position and the – compared to high- regulating countries – much higher relative welfare
gains associated with economic integration, low- regulating countries are generally more
dependent on intensifi ed trade relations than their more wealthy counterparts. This
holds particularly true if the latter already have well- established free trade regimes with
one another, such as in the case of the EU.
In this vein, the California eff ect touches upon the growing interference and infl uence
of the state government in economic aff airs since a somewhat paradoxical consequence
of economic liberalisation is the increase of public intervention in the economy and
the proliferation of rules (Gilardi, 2008, p. 1). As a result, the enhanced activities of
regulatory policy making not only emerge at the national but also at the global level
(Vogel, 1995, p. 2). In turn, this facilitates governments of high- regulating countries to
gain domestic political support for free trade agreements with low- regulation countries
(Hufbauer and Goodrich, 2004, p. 46).
Following this logic, market incentives can also trigger a strengthening of process
standards of industrialising countries, if three conditions are met: fi rst, the practices
have to be targeted by domestic political or economic pressure groups in a ‘green’, that
is, high- regulating, country; second, the producing country should seek to enter a free
trade agreement with a green country, or be already a member of it; third, the production
process should be covered by an eff ectively enforced international environmental agree-
ment (see also Hoberg, 2001). While the California eff ect is generally treated as a refi ne-
ment of the theory of regulatory competition, we argue that it refers to another causal
mechanism, namely economic conditionality.
Economic conditionality thus occurs, when a country needs to adopt certain envi-
ronmental policies in order to become a member of a free trade agreement or to gain
access to the market of green jurisdictions (Dolowitz and Marsh, 2000, p. 9; Holzinger
and Knill, 2005, p. 781). Depending on the degree of power asymmetries between the
countries seeking market access, high- regulating countries might also be able to render
further economic integration with low- regulating countries dependent on the adoption
of respective process regulations. To protect the competitive position of their economies,
they can factually impose the adoption of stricter regulatory standards in low- regulating
countries in exchange for intensifi ed trade relationships (Abrego et al., 2001, p. 414).
In other words, there is an exchange of economic resources for the adoption of stricter
environmental policies. Thus, economic conditionality constitutes incentives for low-
regulating countries to adjust their regulatory arrangements upwards. This particular
mechanism also implies that a country is forced to adopt a certain model without much
leeway for modifying it. As a consequence, it can generally be expected to lead to a high
degree of similarity of the policies present in the submitting and the imposing country.
jovav3.indb 247jovav3.indb 247 16/12/10 16:52:0316/12/10 16:52:03
Copyright © 2011. Edward Elgar. All rights reserved. May not be reproduced in any form without permission from the publisher, except fair uses permitted under U.S. or
applicable copyright law.
EBSCO Publishing : eBook Collection (EBSCOhost) - printed on 6/9/2015 1:35 PM via UNIVERSIDAD RAFAELLANDIVARAN: 387706 ; Jovanovic, Miroslav N..; International Handbook on the Economics of IntegrationAccount: s4245486
248 International handbook on the economics of integration, volume III
Various empirical examples underline the validity of this argument. Borregaard et al.
(1999, p. 34) argue that the strengthening of Chilean environmental regulations inter alia
resulted from repeated pressure from the US government and its decision to decrease
imports of copper products because of low protection standards. Garcia- Johnson
(2000) fi nds that Brazil and Mexico adopted US environmental practices. However,
the Brazilian approximation to US legislation was notably smaller due to the country’s
large domestic market and its increasing trade relations with the countries of the South
Cone. The relevance of specifi c trade patterns is also underlined by the fact that many
governments of the Commonwealth of Independent States have expressed their willing-
ness to adapt their environmental legislation to European standards. According to the
European Commission (2003, p. 9), ‘this interest is driven by the general economic and
political orientation towards the EU, which is their most important foreign trading and
investment partner’. Also, as a result of the involvement with the international market,
the Czech Republic, Poland and Bulgaria all decided to adopt EU chemical safety legis-
lation (Andonova, 2004, p. 80). Along the same lines, Prakash and Potoski (2006) show
that trade creates incentives for fi rms in developing countries to introduce the relatively
costly ISO 14001 management system, if trade occurs with countries whose fi rms have
adopted a progressive environmental programme.
In sum, the concept of economic conditionality explains why increased economic inte-
gration with industrialised countries may induce governments of industrialising coun-
tries to introduce stricter environmental protection standards. Modelling asymmetries
in terms of political and economic power, it also allows us to explain why industrialised
countries do not lower their protection standards. The EU and the US hence benefi t from
the large size of their internal economic markets, which turns them into regulatory ‘price-
makers’ (Drezner, 2007, p. 34). In this sense, low- regulating countries are not confronted
with competitiveness pressures but rather with the threat of losing permanent access to
attractive markets. In other words, the pressures stemming from increased competition
for trade and investment translate into a pressure arising from economic conditionality.
International Harmonisation
There are still stronger forms of economic integration, which off er their members even
more eff ective ways for avoiding an environmental race to the bottom. Membership
in an international economic institution may prevent competitiveness pressures from
emerging through the mechanism of international harmonisation. Harmonisation refers
to a specifi c outcome of international cooperation, in which the countries involved are
required to comply with uniform legal obligations defi ned by free trade agreements, their
side agreements, or international or supranational law. International harmonisation is
generally traced to the existence of interdependencies or externalities which push govern-
ments to resolve common problems through cooperation within international institu-
tions, hence sacrifi cing some independence for the good of the community (Drezner,
2001, p. 60; Hoberg, 2001, p. 127).
Once established, these arrangements constrain and shape the domestic policy choices,
even as they are constantly challenged and reformed by their member states (Martin
and Simmons, 1998). The idea is to neutralise comparative advantages stemming from
regulatory diff erences by creating a ‘level playing fi eld’. However, as member states
jovav3.indb 248jovav3.indb 248 16/12/10 16:52:0316/12/10 16:52:03
Copyright © 2011. Edward Elgar. All rights reserved. May not be reproduced in any form without permission from the publisher, except fair uses permitted under U.S. or
applicable copyright law.
EBSCO Publishing : eBook Collection (EBSCOhost) - printed on 6/9/2015 1:35 PM via UNIVERSIDAD RAFAELLANDIVARAN: 387706 ; Jovanovic, Miroslav N..; International Handbook on the Economics of IntegrationAccount: s4245486

The diff erential impact of economic integration on environmental policy 249
voluntarily engage in institutional integration and actively infl uence corresponding deci-
sions and arrangements, the impact of international harmonisation on national policies
constitutes no hierarchical process; it can rather be interpreted as ‘negotiated transfer’
(Dolowitz and Marsh, 2000, p. 15).
With regard to environmental policy, several factors favour that international har-
monisation implies an overall increase in the strictness of regulatory levels, that is, a
compromise that is closer to the strictest rather than weakest regulatory level found in
the member states of the international institution in question.
First, it has been argued by several authors (Vogel, 1995, 1997, 2000; Scharpf, 1997;
Holzinger, 2002, 2003) that in certain constellations those countries preferring stricter
levels of environmental regulation are more infl uential in international negotiations,
implying that international harmonisation takes place at the top rather than the bottom
level. This argument has been developed in particular for the case of product standards.
In this case, all member states (regardless of their preference for strict or weak stand-
ards) share a common interest in international harmonisation in order to avoid market
segmentation as a result of diff erent national product requirements (Holzinger, 2002, p.
69). While all countries share a common interest in harmonisation, those states with a
preference for strict standards are in a stronger position to put through their preferences
in international negotiations. The trade regimes of the EU (Article 30 TEU) and the
WTO – for reasons of health and safety protection – allow high- regulating countries to
ban the import of products that are not in line with the strict domestic standards. As all
countries share an interest in international harmonisation, high- regulating countries are
therefore in certain cases able to unilaterally impose their strict standards as the inter-
national rule (see Drezner, 2007). Based on this argument, we should expect that – at
least for product standards – international harmonisation implies an upward shift of the
regulatory mean.
Second, especially for harmonisation at the EU level, additional structural features
of the policy- making process might favour an upward shift for other policy types
(production standards and non- trade- related policies), for which the above- mentioned
interest constellation favouring harmonisation at the top does not apply. The fact that
we also observe European harmonisation at the top rather than at the bottom of exist-
ing member state regulations in these areas has been explained by particular dynamics
emerging from a regulatory contest in infl uencing EU policies between the member states
(Héritier et al., 1996).
These dynamics emerge from the interest of national governments to minimise institu-
tional costs of adjusting domestic regulatory arrangements to EU policy requirements.
In particular, high- regulating countries with a rather comprehensively and consistently
developed regulatory framework of environmental policies and instruments might face
considerable problems of adjustment, if European policies refl ect regulatory approaches
and instruments that depart from domestic arrangements. As a result, these countries
have a strong incentive to promote their own concepts at the European level. In so
doing, the most promising way is to rely on the strategy of the ‘fi rst move’, that is,
to try to shape European policy developments already during the stages of problem
defi nition and agenda setting. This requires that member states have to win the support
of the EU Commission, which has the formal monopoly to initiate policies at the EU
level. The Commission, in turn, is generally interested in strengthening and extending
jovav3.indb 249jovav3.indb 249 16/12/10 16:52:0316/12/10 16:52:03
Copyright © 2011. Edward Elgar. All rights reserved. May not be reproduced in any form without permission from the publisher, except fair uses permitted under U.S. or
applicable copyright law.
EBSCO Publishing : eBook Collection (EBSCOhost) - printed on 6/9/2015 1:35 PM via UNIVERSIDAD RAFAELLANDIVARAN: 387706 ; Jovanovic, Miroslav N..; International Handbook on the Economics of IntegrationAccount: s4245486

250 International handbook on the economics of integration, volume III
supranational policy competencies. As a consequence, only those domestic initiatives
that fi t with these objectives of the Commission have a chance to succeed. This spe-
cifi c interaction of national and supranational interests favours the development of
innovative and ambitious policies at the EU level, hence driving EU harmonisation
more towards the top rather than the bottom of domestic regulation levels (Knill and
Lieff erink, 2007).
Third, even if we assume that the fi nal agreement only lies in the middle between high-
regulating and low- regulating countries, there is still a high probability that the mean
of national regulatory levels becomes stricter. This can be traced to the fact that the by
far largest part of environmental standards follows the principle of minimum rather
than total harmonisation. In the case of minimum harmonisation, it is still possible for
countries with a preference for higher regulatory levels to enact standards beyond the
minimum level specifi ed in international agreements.5 In contrast to total harmonisation,
deviations to the top are therefore still possible, while countries with lower standards are
obliged to raise their standards at least to the international minimum level. Given the
dominance of minimum harmonisation, we thus predict that international environmen-
tal policy harmonisation is likely to result in shifting the regulatory mean upward. This
expectation rests on the assumption that not all high- regulating countries will lower their
standards towards the minimum level.
With regard to the empirical fi ndings, the impact of international harmonisation has
particularly been analysed for the EU. In this context, the comparative analysis of 40
environmental policy items in 24 countries carried out by Holzinger et al. (2008a, 2008b)
reveals that EU membership is positively correlated with changes in policy stringency.
In addition to the studies on the EU, the NAFTA has also been evaluated against this
theoretical background. In this regard, Hoberg (1991, 2001) shows that the harmonisa-
tion of pesticide standards in the context of the Canada–US Free Trade Agreement and
the NAFTA triggered a tightening of the protection level.
The compliance costs to international harmonisation, however, should not be under-
estimated. In this regard, Andonova (2004) shows that the implementation eff ectiveness
of European air pollution legislation varied across the Czech Republic, Bulgaria and
Poland. Her analysis reveals that the good performance of the Czech Republic can
largely be explained by the well- developed administrative infrastructure but also by
the fact that the Czech government off ered the aff ected industries generous compensa-
tions. To give another example, the European Directives 88/609/EC and 2001/80/EC on
emissions from large combustion plants, for instance, refer to a policy which involved
substantive compliance costs for the new member states. As a result, 10 of the 12 new
member states were granted temporal exemptions from implementing the directives,
until 2017 in the most extreme case, that is, Poland. A World Bank study revealed
that Ukraine’s approximation with the EU directives on urban wastewater treatment
and large combustion plants would create costs of $2–20 million along with $25–50
million costs of staff capacity improvements and $50–100 million for a monitoring
system upgrade (European Commission, 2003, p. 17). Nevertheless, Knill and Tosun
(2009) highlight that international harmonisation is the most eff ective way of achieving
a tightening of regulatory standards vis- à- vis other mechanisms, such as, for example,
economic conditionality.
jovav3.indb 250jovav3.indb 250 16/12/10 16:52:0316/12/10 16:52:03
Copyright © 2011. Edward Elgar. All rights reserved. May not be reproduced in any form without permission from the publisher, except fair uses permitted under U.S. or
applicable copyright law.
EBSCO Publishing : eBook Collection (EBSCOhost) - printed on 6/9/2015 1:35 PM via UNIVERSIDAD RAFAELLANDIVARAN: 387706 ; Jovanovic, Miroslav N..; International Handbook on the Economics of IntegrationAccount: s4245486

The diff erential impact of economic integration on environmental policy 251
Summing up
A diff erent understanding of economic integration can lead to diff erent fi ndings about
its environmental policy impacts. This conclusion is not too surprising in view of the
complexity of the variable. Therefore, empirical studies should clearly state the conse-
quences of their measurement of economic integration for the theoretical underpinnings.
In Table 12.1, we summarise how diff erent economic integration indicators and causal
mechanisms are linked to each other.
The expectations for the direction of environmental policy responses in the presence of
economic integration change in accordance with the diff erent theoretical concepts con-
sidered. As a result, a race to the bottom or a stuck at the bottom scenario is most likely
if competitiveness pressures are the only policy- shaping force. Economic conditional-
ity, that is, trade with high- regulating countries, and international harmonisation, by
contrast, are expected to lead to a race to the top. Thus, once the underlying theoretical
considerations are clear, the empirical picture on the economic integration and environ-
mental policy interface starts to become less ambivalent and enables a better understand-
ing of the empirical phenomena.
4 CONCLUSION
The linkage between economic integration and environmental policy has indeed become
an important topic in the last few years. This is refl ected by the impressive size of the
body of scholarly literature and ongoing public debates. In this chapter, we scrutinised
how increased economic integration aff ects the stringency of environmental policy
arrangements. We started with an overview of the economic and political science research
literature. This exercise revealed that economic theories are only of limited appropriate-
ness for deriving hypotheses about the direction of the impact of economic integration
on environmental policy arrangements since they take environmental policies as given.
Instead, these approaches explore the interaction between international trade and envi-
ronmental quality on a sophisticated methodological basis. We found that in view of
our research question, the political science literature provides more adequate analytical
Table 12.1 Overview of causal mechanisms underlying economic integration
Variable Measurement Causal mechanism Expectation
Trade
intensity
Ratio of trade fl ows or FDI to
GDP
Regulatory
competition
Race to the bottom/
stuck at the bottom
Direction of
trade
Ratio of trade with a particular
country or group of countries
with attractive markets, e.g. the
US, to GDP
Economic
conditionality
Race to the top
Institutional
integration
Membership in free trade
agreements, e.g. NAFTA, or
common markets, e.g. EU
International
harmonisation
Race to the top
jovav3.indb 251jovav3.indb 251 16/12/10 16:52:0316/12/10 16:52:03
Copyright © 2011. Edward Elgar. All rights reserved. May not be reproduced in any form without permission from the publisher, except fair uses permitted under U.S. or
applicable copyright law.
EBSCO Publishing : eBook Collection (EBSCOhost) - printed on 6/9/2015 1:35 PM via UNIVERSIDAD RAFAELLANDIVARAN: 387706 ; Jovanovic, Miroslav N..; International Handbook on the Economics of IntegrationAccount: s4245486

252 International handbook on the economics of integration, volume III
tools. Nevertheless, this body of literature often remains implicit about the measurement
of economic integration and the underlying theoretical underpinnings. Such a lacking
conceptual precision produces contradictory fi ndings that hamper a fuller understanding
of the economic integration and environment policy interface.
To improve the state of theorising, we introduced the concepts of regulatory competi-
tion, economic conditionality and international harmonisation, to which several studies
implicitly make reference – sometimes by merely using a diff erent terminology or slightly
diff erent defi nitions. In the way we use these concepts, regulatory competition refers to
economic integration through enhanced trade and FDI infl ows by asking whether national
governments compete over the optimal design of domestic regulations in order to attract
foreign capital and to improve the competitive position of their economy. Economic
conditionality is predominantly likely to aff ect the stringency of environmental protec-
tion standards in industrialising countries, whose main trading partners have demanding
environmental protection standards, or which seek to enter a free trade agreement with
industrialised countries. Generally, the NAFTA serves as a suitable example for elucidat-
ing the environmental policy implications of economic conditionality. International har-
monisation is likely to occur if countries (with diff erent regulatory levels) decide to join or
form a supranational or an international organisation, in which national governments are
legally required to adopt policies and programmes as part of their obligations. Which of
these concepts applies depends on the defi nition of economic integration and to a certain
extent also for which country the environmental impacts are evaluated.
While these concepts still do not produce unambiguous theoretical expectations, they
can easily be adapted to the corresponding analytical context. As a result, they provide
an ideal basis for diff erential hypotheses on the environmental impact of international
trade. Our fi ndings, together with the fact that diff erent causal factors are often operat-
ing in parallel, indicate that an environmental dumping is indeed an unlikely scenario.
Most importantly, we argue that not competitiveness pressures per se but rather addi-
tional forces neutralising them are responsible for environmental improvements. In this
regard, it should also be kept in mind that freer markets were accompanied by more
public interventions in the economy, which in turn has positive implications for the level
of environmental protection. Nevertheless, our fi ndings do not automatically imply that
we should be overoptimistic about environmental problem solving at the national or
international level. For industrialising countries, in particular, the costs of complying
with stricter environmental protection standards are high. Therefore, it is important to
emphasise that there is a strategic dimension to environmental policy making, which is
characterised by ‘symbolic’ environmental standards set by governments of industrialis-
ing countries.
Overall, however, we should also be aware that particular forms of economic integra-
tion and environmental policy are more mutually supportive than often thought. This
overall fi nding matches with research on other policy areas that are also associated with
race to the bottom scenarios, such as labour standards (see, for example, Mosley and
Uno, 2007).
Despite lively research on economic integration and environmental policy, there are
still several questions which could be addressed by future research – especially in terms of
empirical testing. First, the analysis of the implementation of environmental policy could
be improved. The focus of this treatise has clearly been on the explanatory variable.
jovav3.indb 252jovav3.indb 252 16/12/10 16:52:0316/12/10 16:52:03
Copyright © 2011. Edward Elgar. All rights reserved. May not be reproduced in any form without permission from the publisher, except fair uses permitted under U.S. or
applicable copyright law.
EBSCO Publishing : eBook Collection (EBSCOhost) - printed on 6/9/2015 1:35 PM via UNIVERSIDAD RAFAELLANDIVARAN: 387706 ; Jovanovic, Miroslav N..; International Handbook on the Economics of IntegrationAccount: s4245486

The diff erential impact of economic integration on environmental policy 253
However, there is still much that can be done to develop more- reliable measures of the
dependent variable. Several studies tend to use outcome data as a proxy for environ-
mental policy. Since we do not know how much environmental outcomes correlate with
environmental outputs, this approach may be imprecise and therefore unsatisfactory.
Other studies concentrate on one or a few environmental policies, for example, the limit
values for the lead content of gasoline. While this approach surely represents a more
direct measurement of government activity, it does not allow for drawing conclusions
with regard to the entire or substantive areas of the policy fi eld. Thus, it would be worth-
while to scrutinise changes in entire environmental policy areas against the background
of economic integration to be able to compare whether there are diff erences across dif-
ferent areas. 6
A second interesting research exercise would be to assess whether economic condition-
ality indeed entails a direct transfer of environmental protection standards from industr-
ialised countries to the industrialising ones. There is some empirical work (for example,
Knill et al., 2008b) hinting that conditionality triggers policy transfer, but whether this
behaviour represents an empirical regularity has not been analysed yet. Furthermore, it
would be worthwhile to systematically assess the degree of similarity between the ‘origi-
nal’ and the ‘emulated’ legislation. Carefully designed comparative research could shed
light on this research question.
Finally, with regard to economic conditionality and international harmonisation it
could be worthwhile to shed light on the characteristics of the policy adoption process.
Do industrialising countries merely adopt relatively ‘costless’ environmental policies?
Such behaviour could be rational as it grants industrialising countries a better basis for
negotiating free trade arrangements due to their ‘revealed’ commitment to environmen-
tal policy issues.
SUMMARY
The interaction between international trade and environmental policy has become an
important issue in the last few years. Despite the vast body of literature on the linkage
between trade and environment, there are hardly any studies which attempt to conceptu-
alise actual policy responses of governments to economic integration. To fi ll this gap, we
suggest a theory- based disaggregation of the compound variable economic integration
for deriving more precise expectations on its diff erential impact on environmental policy
arrangements. Drawing on fi ndings of our current research, such as in the fi eld of cross-
national policy convergence, this chapter seeks to develop a better understanding of the
eff ects of economic integration on environmental policy.
Keywords
International economic integration, government policy, environment and trade.
JEL Classification
F15, Q48, Q56.
jovav3.indb 253jovav3.indb 253 16/12/10 16:52:0316/12/10 16:52:03
Copyright © 2011. Edward Elgar. All rights reserved. May not be reproduced in any form without permission from the publisher, except fair uses permitted under U.S. or
applicable copyright law.
EBSCO Publishing : eBook Collection (EBSCOhost) - printed on 6/9/2015 1:35 PM via UNIVERSIDAD RAFAELLANDIVARAN: 387706 ; Jovanovic, Miroslav N..; International Handbook on the Economics of IntegrationAccount: s4245486
254 International handbook on the economics of integration, volume III
NOTES
1. In a similar vein, agricultural policies are often perceived as non- tariff barriers (see Anderson and Valenzuela, this volume, ch. 11; van den Noort, this volume, ch. 9).
2. For an overview of the diff erent concepts of economic integration, see, for examples, Prakash and Hart (2000); Jovanović (2006, pp. 15–21).
3. Of course, the pollution haven hypothesis and the environmental Kuznets curve are not the only topics addressed by economic research. As a comprehensive review would reach well beyond the scope of this chapter, we point to detailed reviews by Anderson and Blackhurst (1992a), Huang and Labys (2002) and Copeland and Taylor (2004).
4. For a more general discussion of plant location decisions, see, for example, Ando (this volume, ch. 5).5. In the EU, for instance, this possibility is regulated in Article 95 TEU.6. The research project CONSENSUS (‘Confronting Social and Environmental Sustainability with Economic
Pressure: Balancing Trade- off s by Policy Dismantling or Expansion?’) funded by the EU’s Seventh Framework Programme is currently trying to address this precise question. Briefl y, it seeks to document and explain changes in diff erent environmental and social policy subfi elds. For further information, see: www.fp7- consensus.eu.
REFERENCES
Abrego, L., C. Perroni, J. Whalley and R.M. Wigle (2001), ‘Trade and environment: bargaining outcomes from linked negotiations’, Review of International Economics, 9 (3), 414–28.
Anderson, Kym and Richard Blackhurst (eds) (1992a), The Greening of World Trade Issues, London and New York: Harvester Wheatsheaf.
Anderson, Kym and Richard Blackhurst (1992b), ‘Trade, the environment and public policy’, in Anderson and Blackhurst (eds), pp. 3–22.
Andonova, Liliana B. (2004), Transnational Politics of the Environment: The European Union and Environmental Policy in Central and Eastern Europe, Cambridge, MA and London: MIT Press.
Andonova, L.B., E.D. Mansfi eld and H.V. Milner (2007), ‘International trade and environmental policy in the postcommunist world’, Comparative Political Studies, 40 (7), 782–807.
Antweiler, W., B.R. Copeland and M.S. Taylor (2001), ‘Is free trade good for the environment?’, American Economic Review, 91 (4), 877–908.
Aubourg, R.W., D.H. Good and K. Krutilla (2008), ‘Debt, democratization, and development in Latin America: how policy can aff ect global warming’, Journal of Policy Analysis and Management, 27 (1), 7–19.
Beghin, J. and M. Potier (1997), ‘Eff ects of trade liberalization on the environment in the manufacturing sector’, The World Economy, 20 (4), 435–56.
Bernstein, S. and B. Cashore (2000), ‘Globalization, four paths of internationalization and domestic policy change: the case of ecoForestry in British Columbia, Canada’, Canadian Journal of Political Science, 33 (1), 67–99.
Bhattarai, M. and M.D. Hammig (2001), ‘Institutions and the environmental Kuznets curve for deforestation: a cross- country analysis for Latin America, Africa, and Asia’, World Development, 29 (6), 995–1010.
Birdsall, N. and D. Wheeler (1993), ‘Trade policy and industrial pollution in Latin America: where are the pollution havens?’, Journal of Environment and Development, 2 (1), 137–49.
Borregaard, Nicola, Giulio Volpi, Hernán Blanco, Françoise Wautiez and Andrea Matte- Baker (1999), Environmental Impacts of Trade Liberalization and Policies for the Sustainable Management of Natural Resources: A Case Study on Chile’s Mining Sector, Geneva: United Nations Environmental Programme.
Charnovitz, S. (1993), ‘Environmentalism confronts GATT rules’, Journal of World Trade, 27 (2), 37–52.Charnovitz, S. (2007), ‘The WTO’s environmental progress’, Journal of International Economic Law, 10 (3),
685–706.Copeland, Brian and Sumeet Gulati (2006), ‘Trade and the environment in developing countries’, in Ramon
E. Lopez and Michael Toman (eds), Economic Development and Environmental Sustainability: New Policy Options, Oxford and New York: Oxford University Press, pp. 178–216.
Copeland, B.R. and S.M. Taylor (2004), ‘Trade, growth, and the environment’, Journal of Economic Literature, 42 (1), 7–71.
Damania, R., P.G. Fredriksson and J.A. List (2003), ‘Trade liberalization, corruption, and environmental policy formation: theory and evidence’, Journal of Environmental Economics and Management, 46 (3), 490–512.
jovav3.indb 254jovav3.indb 254 16/12/10 16:52:0316/12/10 16:52:03
Copyright © 2011. Edward Elgar. All rights reserved. May not be reproduced in any form without permission from the publisher, except fair uses permitted under U.S. or
applicable copyright law.
EBSCO Publishing : eBook Collection (EBSCOhost) - printed on 6/9/2015 1:35 PM via UNIVERSIDAD RAFAELLANDIVARAN: 387706 ; Jovanovic, Miroslav N..; International Handbook on the Economics of IntegrationAccount: s4245486

The diff erential impact of economic integration on environmental policy 255
Dasgupta, S., B. Laplante, H. Wang and D. Wheeler (2002), ‘Confronting the environmental Kuznets curve’, Journal of Economic Perspectives, 16 (1), 147–68.
Deere, Carolyn L. and Daniel C. Esty (eds) (2002), Greening the Americas. NAFTA’s Lessons for Hemispheric Trade, Cambridge, MA and London: MIT Press.
Desai, Uday (ed.) (1998), Ecological Policy and Politics in Developing Countries: Economic Growth, Democracy, and Environment, Albany, NY: State University of New York Press.
Dolowitz, D.P. and D. Marsh (2000), ‘Learning from abroad: the role of policy transfer in contemporary policy making’, Governance, 13 (1), 5–24.
Drezner, D.W. (2001), ‘Globalization and policy convergence’, International Studies Review, 3 (1), 53–78.Drezner, Daniel W. (2007), All Politics is Global: Explaining International Regulatory Regimes, Princeton, NJ
and Oxford: Princeton University Press.Ekins, P. and S. Speck (1999), ‘Competitiveness and exemptions from environmental taxes in Europe’,
Environmental and Resource Economics, 13 (4), 369–96.European Commission (2003), Convergence with EU Environmental Legislation in Eastern Europe, Caucasus
and Central Asia: A Guide, Luxembourg: Offi ce for Offi cial Publications of the European Communities.Ferrantino, M.J. (1997), ‘International trade, environmental quality and public policy’, The World Economy,
20 (1), 43–72.Gallagher, Kevin P. (2004), Free Trade and the Environment: Mexico, NAFTA, and Beyond, Stanford, CA:
Stanford University Press.Garcia- Johnson, Ronie (2000), Exporting Environmentalism: U.S. Multinational Chemical Corporations in
Brazil and Mexico, Cambridge, MA and London: MIT Press.Gilardi, Fabrizio (2008), Delegation in the Regulatory State Independent Regulatory Agencies in Western
Europe, Cheltenham, UK and Northampton, MA, USA: Edward Elgar.Goodman, J. and L. Pauly (1993), ‘The obsolescence of capital control’, World Politics, 46 (1), 50–82.Grossman, G.M. and A.B. Krueger (1995), ‘Economic growth and the environment’, Quarterly Journal of
Economics, 110 (2), 353–77.Héritier, Adrienne, Christoph Knill and Susanne Mingers (1996), Ringing the Changes in Europe. Regulatory
Competition and the Transformation of the State, Berlin: De Gruyter.Hoberg, G. (1991), ‘Sleeping with an elephant: the American infl uence on Canadian environmental regulation’,
Journal of Public Policy, 11 (1), 107–32.Hoberg, G. (2001), ‘Globalization and policy convergence: symposium overview’, Journal of Comparative
Policy Analysis: Research and Practice, 3 (2), 127–32.Holzinger, Katharina (2002), ‘The provision of transnational common goods: regulatory competition for envi-
ronmental standards’, in Adrienne Héritier (ed.), Common Goods: Reinventing European and International Governance, Lanham, MD: Rowman & Littlefi eld, pp. 59–82.
Holzinger, K. (2003), ‘Common goods, matrix games, and institutional solutions’, European Journal of International Relations, 9 (2), 173–212.
Holzinger, K. and C. Knill (2005), ‘Cross- national policy convergence: causes, concepts and empirical fi nd-ings’, Journal of European Public Policy, 12 (5), 775–96.
Holzinger, Katharina and Christoph Knill (2008), ‘Theoretical framework: causal factors and convergence expectations’, in Holzinger et al. (eds), pp. 30–63.
Holzinger, Katharina, Christoph Knill and Bas Arts (eds) (2008a), Environmental Policy Convergence in Europe? The Impact of International Institutions and Trade, Cambridge: Cambridge University Press.
Holzinger, K., C. Knill and T. Sommerer (2008b), ‘Environmental policy convergence: the impact of international harmonization, transnational communication and regulatory competition’, International Organization, 62 (4), 553–87.
Huang, H. and W.C. Labys (2002), ‘Environment and trade: a review of issues and methods’, International Journal of Global Environmental Issues, 2 (172), 100–160.
Hufbauer, G. and B. Goodrich (2004), ‘Lessons from NAFTA’, in Jeff rey J. Schott (ed.), Free Trade Agreements: US Strategies and Priorities, Washington, DC: Institute for International Economics, pp. 37–50.
Jovanović, Miroslav N. (2006), The Economics of International Integration, Cheltenham, UK and Northampton, MA, USA: Edward Elgar.
Knill, Christoph and Duncan Lieff erink (2007), Environmental Politics in the European Union, Manchester: Manchester University Press.
Knill, Christoph, Thomas Sommerer and Katharina Holzinger (2008a), ‘Degree and direction of environmen-tal policy convergence: analysis of aggregate data’, in Holzinger et al. (eds), pp. 98–143.
Knill, C. and J. Tosun (2009), ‘Harmonization, competition, or communication: how does the EU shape environmental policy adoptions of within and beyond its borders?’, Journal of European Public Policy, 16 (6), 873–94.
Knill, C., J. Tosun and S. Heichel (2008b), ‘Balancing competitiveness and conditionality: environmental policy- making in low- regulating countries’, Journal of European Public Policy, 15 (7), 1019–40.
jovav3.indb 255jovav3.indb 255 16/12/10 16:52:0316/12/10 16:52:03
Copyright © 2011. Edward Elgar. All rights reserved. May not be reproduced in any form without permission from the publisher, except fair uses permitted under U.S. or
applicable copyright law.
EBSCO Publishing : eBook Collection (EBSCOhost) - printed on 6/9/2015 1:35 PM via UNIVERSIDAD RAFAELLANDIVARAN: 387706 ; Jovanovic, Miroslav N..; International Handbook on the Economics of IntegrationAccount: s4245486

256 International handbook on the economics of integration, volume III
Konisky, D.M. (2007), ‘Regulatory competition and environmental enforcement: is there a race to the bottom?’, American Journal of Political Science, 51 (4), 853–72.
Levinson, Arik (1997), ‘Environmental regulations and industry location: international and domestic evi-dence’, in Jagdish Bhagwati and Robert E. Hudec (eds), Fair Trade and Harmonization: Prerequisites for Free Trade?, Cambridge, MA and London: MIT Press, pp. 429–58.
Mani, M. and D. Wheeler (1998), ‘In search of pollution havens? Dirty industry in the world economy, 1960–1995’, Journal of Environment and Development, 7 (3), 215–47.
Martin, L.L. and B.A. Simmons (1998), ‘Theories and empirical studies of international institutions’, International Organization, 52 (4), 729–57.
Mosley, L. and S. Uno (2007), ‘Racing to the bottom or climbing to the top? Economic globalization and col-lective labor rights’, Comparative Political Studies, 40 (8), 923–48.
Panayotou, T. (1997), ‘Demistifying the environmental Kuznets curve’, Environment and Development Economics, 2 (4), 451–63.
Porter, G. (1999), ‘Trade competition and pollution standards: “race to the bottom” or “stuck at the bottom”’, Journal of Environment and Development, 8 (2), 133–51.
Prakash, A. and J.A. Hart (2000), ‘Indicators of economic integration’, Global Governance, 6 (1), 95–114.Prakash, A. and M. Potoski (2006), ‘Racing to the bottom? Globalization, environmental governance, and ISO
14001’, American Journal of Political Science, 50 (2), 347–61.Scharpf, F.W. (1997), ‘Introduction. The problem- solving capacity of multi- level governance’, Journal of
European Public Policy, 4 (4), 520–38.Selden, T.M. and D. Song (1995), ‘Neoclassical growth, the J curve for abatement, and the inverted U curve
for pollution’, Journal of Environmental Economics and Management, 29 (2), 162–8.Simmons, B.A. and Z. Elkins (2004), ‘The globalization of liberalization: policy diff usion in the international
political economy’, American Political Science Review, 98 (1), 171–89.Sorsa, Piritta (1994), ‘Competitiveness and environmental standards: some exploratory results’, World Bank
Policy Research Working Paper Series 1249, Washington, DC.Spatareanu, M. (2007), ‘Searching for the pollution havens – the impact of environmental regulations on
foreign direct investment’, Journal of Environment and Development, 16 (2), 161–82.Stern, D.I. (2004), ‘The rise and fall of the environmental Kuznets curve’, World Development, 32 (8),
1419–39.Stevens, C. (1993), ‘The environmental eff ects of trade’, The World Economy, 6 (4), 439–541.Tiebout, C. (1956), ‘A pure theory of local expenditures’, Journal of Political Economy, 64 (5), 416–26.van Beers, C. and J.C.J.M. van der Bergh (1999), ‘An empirical multi- country analysis of the impact of envi-
ronmental regulations on foreign trade fl ows’, Kyklos, 50 (1), 29–46.Vogel, David (1995), Trading Up: Consumer and Environmental Regulation in the Global Economy, Cambridge,
MA and London: Harvard University Press.Vogel, D. (1997), ‘Trading up and governing across: transnational governance and environmental protection’,
Journal of European Public Policy, 4 (1), 556–71.Vogel, D. (2000), ‘Environmental regulation and economic integration’, Journal of International Economic
Law, 3 (2), 265–79.Weintraub, Sidney (2004), ‘Lessons from the Chile and Singapore free trade agreements’, in Jeff rey J. Schott
(ed.), Free Trade Agreements: US Strategies and Priorities, Washington, DC: Institute for International Economics, pp. 79–92.
Wheeler, D. (2001), ‘Racing to the bottom? Foreign investment and air pollution in developing countries’, Journal of Environment and Development, 10 (3), 225–45.
jovav3.indb 256jovav3.indb 256 16/12/10 16:52:0316/12/10 16:52:03
Copyright © 2011. Edward Elgar. All rights reserved. May not be reproduced in any form without permission from the publisher, except fair uses permitted under U.S. or
applicable copyright law.
EBSCO Publishing : eBook Collection (EBSCOhost) - printed on 6/9/2015 1:35 PM via UNIVERSIDAD RAFAELLANDIVARAN: 387706 ; Jovanovic, Miroslav N..; International Handbook on the Economics of IntegrationAccount: s4245486

PART III
QUANTIFICATION OF EFFECTS OF INTEGRATION
jovav3.indb 257jovav3.indb 257 16/12/10 16:52:0316/12/10 16:52:03
Copyright © 2011. Edward Elgar. All rights reserved. May not be reproduced in any form without permission from the publisher, except fair uses permitted under U.S. or
applicable copyright law.
EBSCO Publishing : eBook Collection (EBSCOhost) - printed on 6/9/2015 1:35 PM via UNIVERSIDAD RAFAELLANDIVARAN: 387706 ; Jovanovic, Miroslav N..; International Handbook on the Economics of IntegrationAccount: s4245486

jovav3.indb 258jovav3.indb 258 16/12/10 16:52:0316/12/10 16:52:03
Copyright © 2011. Edward Elgar. All rights reserved. May not be reproduced in any form without permission from the publisher, except fair uses permitted under U.S. or
applicable copyright law.
EBSCO Publishing : eBook Collection (EBSCOhost) - printed on 6/9/2015 1:35 PM via UNIVERSIDAD RAFAELLANDIVARAN: 387706 ; Jovanovic, Miroslav N..; International Handbook on the Economics of IntegrationAccount: s4245486
259
13 Estimating the eff ects of integrationNigel Grimwade, David G. Mayes and Jiao Wang
1 INTRODUCTION
In the early phases of post- war regional integration there were many estimates of the
economic impact in both prospect and retrospect. On the whole they came up with rather
small numbers, less than 1 per cent of GDP (Lipsey, 1960; Mayes, 1978; Winters, 1987).
This seems in contradiction to the political enthusiasm for those changes. More recently
the European Commission (Cecchini et al., 1988; Emerson et al., 1988) came up with
considerably more signifi cant numbers for the possible impact of the completion of the
European single market (5–7 per cent of GDP). However, these estimates subsequently
proved controversial and it is noticeable that the Commission was much more reticent
about publishing estimates of the likely gain from Economic and Monetary Union
(EMU) or subsequent enlargements.
There are many problems in estimating the eff ects of regional integration on the eco-
nomic welfare and main variables of interest for the countries involved and the world as
a whole. Regional integration has a variety of eff ects, some of which improve welfare,
others which reduce it. The eff ects depend on the period of time considered.
While the early stages of integration were mainly concerned with tariff liberalisation,
they now go much further, tackling non- tariff barriers and services as well as goods.
Some arrangements also incorporate measures for promoting intra- regional investment
and even labour mobility. A few have also included measures for stabilising intra-
regional exchange rates or the adoption of a common currency. In most cases, there
are complex procedures for achieving gradual liberalisation over diff erent time periods.
The measurement of the impact of integration must, therefore, go further than simply
looking at the impact of the integration process on trade fl ows.
The major obstacle that researchers face is establishing a counterfactual so that the
impact of economic integration can be isolated from other factors at work at the same
time. This necessitates making some judgement about what the value of diff erent vari-
ables would have been had integration not taken place. This is necessarily hypothetical
and these other factors can never be fully eliminated. Thus estimates of the impact of
integration have to be treated with caution and diff erent studies of the same eff ect can
come up with widely diff ering estimates.
In this chapter, we examine some of the main methods used to measure the impact
of regional integration and take a look at the results obtained. We compare and
contrast the diff erent approaches, identifying in each case their major strengths and
weaknesses.
This chapter is structured as follows. Section 2 begins with an overview of the major
economic eff ects that are worthy of investigation. Section 3 discusses the empirical
methodology. The following sections examine residual models (Section 4), the intensity
of trade approach (Section 5), gravity models (Section 6), other stochastic economic
jovav3.indb 259jovav3.indb 259 16/12/10 16:52:0316/12/10 16:52:03
Copyright © 2011. Edward Elgar. All rights reserved. May not be reproduced in any form without permission from the publisher, except fair uses permitted under U.S. or
applicable copyright law.
EBSCO Publishing : eBook Collection (EBSCOhost) - printed on 6/9/2015 1:35 PM via UNIVERSIDAD RAFAELLANDIVARAN: 387706 ; Jovanovic, Miroslav N..; International Handbook on the Economics of IntegrationAccount: s4245486

260 International handbook on the economics of integration, volume III
approaches (Section 7) and computable general equilibrium models (Section 8). Section
9 concludes.
2 THE EFFECTS OF ECONOMIC INTEGRATION
Analysis of the eff ects of integration has developed in line with the increasingly close
regional integration, particularly in the European Union (EU). Although regional inte-
gration had proceeded far further in the United States and indeed in the former Soviet
Union and the Council for Mutual Economic Assistance (CMEA), this did not generate
a matching interest in the underlying economic theory. The initial concern was simply
with reducing trade barriers.
Trade Effects
The major concern of the orthodox theory of free trade areas (FTAs) and customs
unions (CUs) was with the impact of integration on trade. In his pioneering work on this
subject, Jacob Viner distinguished between two eff ects of integration on trade (Viner,
1950).1 On the one hand, the removal of tariff s on imports coming from other member
states results in trade creation – defi ned as the displacement of high- cost domestic pro-
duction of a particular product in one member state by lower- cost imports from another
member state. Viner argued that trade creation is welfare improving, because it results in
a better allocation of global resources and, as such, represents a step in the direction of
free trade. On the other hand, the fact that tariff reductions are applied only to imports
from other member states (that is, they are discriminatory) results in trade diversion –
defi ned as the displacement of lower- cost imports of a product from a non- member state
by higher- cost imports from a member state – and hence in a less optimal allocation
of global resources. It is welfare reducing and, therefore, a step towards protection-
ism. Hence, the removal of tariff s and other barriers may not be welfare improving in
aggregate and may well harm excluded countries. This led to the concern in the General
Agreement on Tariff s and Trade (GATT) that only those agreements that are generally
welfare improving should be permitted (internal tariff s have to be abolished, not simply
reduced, for example).
However, the formation of an FTA or a CU may result in external trade creation, for
example, if faster economic growth inside the area or union due to integration leads to
the member states importing more from the rest of the world. Regional integration is the
archetypal context of the theory of the second best. Welfare would generally be maxim-
ised by the removal of all barriers and distortions. Removing only some of them does not
necessarily move aff airs in the direction of this fi rst best, and further off setting measures
may be required to ensure this.
There are of course other ways in which trade may develop as barriers fall, as Vinerian
analysis makes strong assumptions about the nature of competition and implicitly about
production functions. Increased trade typically allows the exploitation of economies of
scale and scope. However, it may also result in increased concentration and the ability
to exact oligopoly rents, thus failing to exploit the full welfare gains without matching
antitrust rules.
jovav3.indb 260jovav3.indb 260 16/12/10 16:52:0316/12/10 16:52:03
Copyright © 2011. Edward Elgar. All rights reserved. May not be reproduced in any form without permission from the publisher, except fair uses permitted under U.S. or
applicable copyright law.
EBSCO Publishing : eBook Collection (EBSCOhost) - printed on 6/9/2015 1:35 PM via UNIVERSIDAD RAFAELLANDIVARAN: 387706 ; Jovanovic, Miroslav N..; International Handbook on the Economics of IntegrationAccount: s4245486

Estimating the eff ects of integration 261
The Vinerian analysis also makes no reference to the time path of change and purely
relates to comparative statics. Outcomes will vary according to the rate at which fi rms
can respond and develop a position of market strength. Thus modern analysis has to be
much more complex.
Income Effects
Typically, the trade eff ects in themselves are of limited magnitude since their welfare is
a typical ‘Harberger triangle’ and not the full extent of the trade change, which may be
large even for small price diff erentials. Thus for example, using a simple partial equi-
librium model, the welfare gain from trade creation is given by multiplying half the
reduction in tariff s by the increase in imports.2 The loss of economic welfare from trade
diversion is given by the diff erence between the world price of the product and the price
of the product inside the area or union. This, in turn, must be multiplied by the volume
of trade diverted. However, as trade diversion increases the exports of another member
state, account must be taken of the welfare gain from such diversion for the exporting
country. This can be measured by taking the volume of additional exports multiplied by
half the increase in price, following the adoption of the common external tariff .3 Each
country benefi ts from the net impact of the various welfare gains and losses on its con-
sumers and producers.
These are the static welfare gains from integration, which are quantitatively less
important than the long- run, dynamic eff ects that integration gives rise to. These eff ects
accrue mostly in markets that are characterised by imperfect competition – with dif-
ferentiated not homogeneous goods and increasing rather than constant or decreasing
returns to scale. In such markets, integration tends to result in intra- rather than inter-
industry trade. Whereas inter- industry trade involves countries exchanging the products
of diff erent industries, intra- industry trade involves countries exchanging products
belonging to the same industry (for example, diff erent models of motor cars). The gains
from intra- industry trade are diff erent from those of inter- industry trade. Whereas inter-
industry trade benefi ts countries through lower prices and improved resource allocation,
the gains from intra- industry trade come more in the form of a greater variety of goods
for consumers to choose from. Lower prices may also result, but as a consequence of
increased competition and a fall in average costs of production as fi rms enlarge the scale
of their production. The dynamic eff ects of integration on real incomes are clearly much
more diffi cult to measure than the more conventional static eff ects. However, it is clearly
important to do so.
Balance of Payments Effects
Economic integration will also have an eff ect on the balance of payments of individual
countries, which may be of great importance. This could be favourable (if exports
increase by more than imports) or unfavourable (if imports expand more than exports).
It is especially likely that, where one country lags behind another one in economic devel-
opment, the balance of payments eff ect will be unfavourable. Equally, where one country
is making bigger tariff reductions than the others, the trade balance eff ect will be nega-
tive. An adverse balance of payments eff ect, however, need not be a matter for concern
jovav3.indb 261jovav3.indb 261 16/12/10 16:52:0316/12/10 16:52:03
Copyright © 2011. Edward Elgar. All rights reserved. May not be reproduced in any form without permission from the publisher, except fair uses permitted under U.S. or
applicable copyright law.
EBSCO Publishing : eBook Collection (EBSCOhost) - printed on 6/9/2015 1:35 PM via UNIVERSIDAD RAFAELLANDIVARAN: 387706 ; Jovanovic, Miroslav N..; International Handbook on the Economics of IntegrationAccount: s4245486

262 International handbook on the economics of integration, volume III
as long as the country in question is prepared to let the real exchange rate fall. Where
the exchange rate is fl oating, the nominal rate may well fall anyhow if the balance of
payments deteriorates, although this may not be the case if large infl ows of capital from
abroad create greater demand for the currency on foreign exchange markets.
By aff ecting the country’s terms of trade, devaluation will lead to a resource loss for
the country. It will, therefore, reduce any welfare gain from integration. If the size of the
eff ect is too large, it may even result in the welfare eff ect being negative. However, the
balance of payments eff ect becomes more serious where the exchange rate cannot be
lowered. This will be the case if the country operates a fi xed exchange rate against the cur-
rencies of the other member states or where integration has resulted in all member states
adopting a common currency. In this case, adjustment will take place through a lowering
of domestic output and incomes. A fall in the real exchange rate will be achieved through
a lowering of the domestic price level rather than any change in the nominal exchange
rate. In this case, depending on the fl exibility of domestic costs and prices, the country
will experience a resource loss measured by the resulting loss of output and employment
in the short run. The measurement of these eff ects will necessitate a study of the eff ects
of integration on macroeconomic aggregates such as output, employment and prices in
individual countries.
Growth Effects
In addition to the eff ects on real income, economic integration can be expected to have an
eff ect on the rate of economic growth in individual countries. The relationship between
integration and economic growth is a complex one. However, the fact that integration
will stimulate growth is not in dispute. The only matter in dispute is whether the growth
stimulus will be temporary or permanent. In the neoclassical theory of growth, integra-
tion can bring about only a temporary increase in the growth rate. Once the shock of the
change passes through the economy it returns to the same steady- state growth path.
In new growth theory, however, capital accumulation is treated as an endogenous
variable in the growth process and includes investment in human or knowledge capital
as well as physical capital. While the rate of return on capital invested by the individual
fi rm may fall as the stock of capital increases, the public rate of return from new invest-
ment, which determines the total amount of investment undertaken by fi rms as a whole,
may continue rising. In eff ect, a wedge is created between the private and public rates of
return on investment. One reason for this is that, as fi rms invest in knowledge capital,
they create technological spillovers to other fi rms, which off sets any tendency towards
diminishing returns. There are grounds for expecting integration to play a positive role in
stimulating knowledge capital accumulation. For example, by widening the market for
new products, trade boosts the profi tability of investment in research and development
(R&D). By lowering import barriers, trade increases competition and competition spurs
fi rms to innovate, providing that fi rms are able to hold on to the profi ts that innovation
yields. Baldwin (1989) off ers some estimates of the eff ects of the creation of the European
single market along these lines and discusses problems of estimation in Baldwin (1993).
Capital market integration may also stimulate greater investment in R&D by elimi-
nating imperfections in capital markets and reducing the costs of borrowed funds. This
has led new growth theorists to expect a more permanent stimulus to growth from
jovav3.indb 262jovav3.indb 262 16/12/10 16:52:0316/12/10 16:52:03
Copyright © 2011. Edward Elgar. All rights reserved. May not be reproduced in any form without permission from the publisher, except fair uses permitted under U.S. or
applicable copyright law.
EBSCO Publishing : eBook Collection (EBSCOhost) - printed on 6/9/2015 1:35 PM via UNIVERSIDAD RAFAELLANDIVARAN: 387706 ; Jovanovic, Miroslav N..; International Handbook on the Economics of IntegrationAccount: s4245486

Estimating the eff ects of integration 263
integration. However, the impact can be very diff erent from what is implied by more
traditional theory. Not only that but it may refl ect what has been described as the ‘new
economic geography’ (Fujita et al., 2001; Neary, 2001), where how production agglom-
erates, given a range of demand and supply determinants, refl ects a much more dynamic
and integrated view of the development of trade and production than traditional theory,
in many ways similar to the ideas of Michael Porter (1990) and others who have devel-
oped theories of clustering of activities. Breaking down the barriers between countries
can lead to intensifi cation of existing clusters, but it can also lead to the creation of new
clusters as large changes in relative prices can lead to major movements of capital and
fi rms.
Further Integration
Extending the analysis to include non- tariff barriers to trade and indeed to eliminating
a wide range of barriers while trying to create a ‘single market’ and harmonising on
single standards all have impacts of the same form as tariff changes, although it can be
extremely diffi cult to quantify what the changes are. In such cases it becomes easier to
observe the eff ects than it does to estimate contributions from a specifi c cause. However,
once barriers to inhibit the movement of labour and capital are also removed it becomes
much more diffi cult to assess the impact, and growth can increase simply because the
factors of production available are enhanced through foreign direct investment (FDI),
migration and skill and technology transfer (Mayes and Kilponen, 2007). Openness
to a more advanced country’s technology is likely to increase the rate of catch- up for
the less advantaged, as clearly evidenced by the strong performance of the transition
economies.
Clearly as countries move towards a closer union, they can also reap gains from policy
coordination and of course from transfers towards the less advantaged, which may
focus deliberately on facilitating growth, as in the case of the cohesion funds in the EU.
Perhaps the largest gain from monetary union is that smaller, infl ation- prone countries
gain the benefi ts of lower real interest rates and more stable policy.
3 EMPIRICAL METHODOLOGY
We can distinguish four broad approaches to the empirical analysis of the eff ects of
economic integration. The fi rst and simplest approach is to construct an ‘anti- monde’,
showing what would have happened to trade fl ows in the absence of integration accord-
ing to a set of clear hypotheses and to treat any diff erence between actual and predicted
trade fl ows as being a measure of the integration eff ect. Such an approach is often
referred to as the ‘residual approach’. As we shall see, although such an approach has
the attraction of great simplicity, there are considerable problems in predicting the path
that trade would have taken had integration not happened. Clearly, there is no way of
knowing what would have happened and, therefore, some assumptions have to be made
as to how trade fl ows would have behaved. A common approach in such models is to
assume that the changes would have been the same in the post- integration period as in
the pre- integration one. However, even this is a sweeping assumption, as factors may
jovav3.indb 263jovav3.indb 263 16/12/10 16:52:0316/12/10 16:52:03
Copyright © 2011. Edward Elgar. All rights reserved. May not be reproduced in any form without permission from the publisher, except fair uses permitted under U.S. or
applicable copyright law.
EBSCO Publishing : eBook Collection (EBSCOhost) - printed on 6/9/2015 1:35 PM via UNIVERSIDAD RAFAELLANDIVARAN: 387706 ; Jovanovic, Miroslav N..; International Handbook on the Economics of IntegrationAccount: s4245486

264 International handbook on the economics of integration, volume III
have infl uenced trade in the post- integration period that did not in the pre- integration
period.
The second approach is an extension of the fi rst. It consists of an attempt to formalise
a model of the factors that determine the amount of bilateral trade taking place between
any two countries or the so- called ‘intensity of trade’. It then seeks to compare the actual
level of bilateral trade with the amount of trade that the model predicts to determine
the extent to which trade between any two countries is geographically biased. Clearly,
geographical bias is to be expected where two countries are geographically close to each
other or share a common border, as distance between countries gives rise to transaction
costs. However, other factors may also give rise to such a bias, including membership of
the same regional trading bloc or the use of a common currency. In short, the intensity
of trade approach measures the extent to which any two countries are economically inte-
grated, although without distinguishing between market and institutional integration
eff ects. However, as factors such as distance do not change over time, any increase in
bias over time may be taken as being due to institutional factors, such as the formation
of a regional trading bloc.
The third approach is largely an extension of the second and has come into renewed
prominence over the last decade in the context of currency unions (Frankel and Rose,
2002). It uses focused stochastic econometric models to estimate the impact of integra-
tion on trade. This, too, involves the construction of a model capable of explaining most
of the factors that determine the amount of trade one country does with another or the
change in the level of this trade over time. This will include factors such as membership of
the same regional trading bloc or the use of the same currency. The model is then applied
to bilateral trade over the relevant period of time and the coeffi cients of the diff erent
variables are estimated. The most commonly used model for this kind of exercise is the
gravity model of trade, fi rst proposed by Tinbergen (1962), later developed by Linnemann
(1966) and widely used by others since. This treats trade between two countries as being a
function of two masses, GDP and population, and the distance between them. However,
gravity models have been criticised as lacking any sound theoretical basis. In particular,
it is often argued that gravity models leave out relative prices of goods in the two coun-
tries and changes in the real exchange rate. For this reason, other analytic models are
often used instead, which attach relatively less importance to gravitational factors.
The fourth approach is to use a multicountry, static or dynamic computable general
equilibrium (CGE) model. Such models seek to explain the main equilibrium relation-
ships between the diff erent sectors of the economy of each country and between the dif-
ferent countries themselves. Once a model has been constructed, the task is to calibrate
the model for a particular year. Having done so, the model is simulated for a later year
to see the extent to which diff erent economic variables have been aff ected by the inte-
gration process. The diff erence between the actual level of diff erent variables and the
level predicted by the simulated version of the model measures the impact of economic
integration. Such an approach has much appeal because the model can be designed to
capture all the economic relationships that exist in the economy of each country. It is also
possible to introduce real- world complexities such as imperfect competition and increas-
ing returns to scale into relevant markets within each country.
Moreover, the model will include the feedback eff ects whereby changes in one set of
variables in any one country cause changes in other variables in another. In the dynamic
jovav3.indb 264jovav3.indb 264 16/12/10 16:52:0316/12/10 16:52:03
Copyright © 2011. Edward Elgar. All rights reserved. May not be reproduced in any form without permission from the publisher, except fair uses permitted under U.S. or
applicable copyright law.
EBSCO Publishing : eBook Collection (EBSCOhost) - printed on 6/9/2015 1:35 PM via UNIVERSIDAD RAFAELLANDIVARAN: 387706 ; Jovanovic, Miroslav N..; International Handbook on the Economics of IntegrationAccount: s4245486

Estimating the eff ects of integration 265
version of the model, this makes possible the measurement of long- run eff ects that may
accrue over many years and which are known to be statistically more important than
the purely static eff ects that occur only in the short run. Thus, CGE models are espe-
cially useful for measuring the eff ects of integration on economic growth. However,
CGE models are not without their critics. In particular, some see such models as unduly
abstract and divorced from reality because they describe a purely hypothetical situa-
tion of what will happen at some stage in the future with and without integration. Even
applied to the past they require strong assumptions.
4 RESIDUAL MODELS
The essence of the residual approach is to construct an anti- monde for the period follow-
ing integration and to compare what actually happened after integration with the hypo-
thetical outcome predicted by the anti- monde. This approach was widely used in the early
days of post- war European integration to determine the ex post eff ects of the formation
of the European Economic Community (EEC) and European Free Trade Association
(EFTA). The important question that all such studies faced is the construction of an
appropriate anti- monde.
The simplest approach is to assume that the value of imports coming from partner
countries would have continued to grow at the same rate after integration as before, had
integration not taken place. It is clear, however, that this is far too simplistic. There are no
grounds for supposing that the growth in imports that had taken place in previous years
would have been repeated. The volume of imports in any given year is highly sensitive to
the particular point reached in the business cycle, so that the pre- and post- integration
periods would, at the very least, have to cover the full length of the cycle. However, these
will be diff erent for diff erent countries. Changes in relative prices, including changes
in the exchange rate, can also be expected to aff ect the growth of import volume. Any
fall in the price of domestic goods relative to imports, including any fall brought about
by a decline in the real exchange rate, might be expected to result in a slower growth in
import volume. Structural changes within the country aff ecting both the composition
of demand and output might also impact on the demand for imports, if some sectors or
products have a greater import propensity than others. Finally, reductions in multilater-
ally negotiated tariff s either in the pre- or post- integration period could be expected to
cause imports to grow at diff erent rates in the two periods.
A somewhat better approach is to extrapolate trade shares illustrated in Table 13.1 for
many of the main trading blocs in the period since 1970. However, such a procedure is
subject to much the same objections as the simple extrapolation approach. There is no
reason to assume that these shares would have remained the same, as diff erent factors can
be expected to have aff ected them in the post- rather than in the pre- integration period.
A further problem with this method is that it provides no way in which a distinction can
be made between trade creation and trade diversion. An increase in the intra- area trade
share (and decrease in the extra- area trade share) could be due to either imports from
partner countries displacing high- cost domestic production or imports from partner
countries displacing lower- cost imports from third countries.
A clear pattern is not observable. Although the intra- regional share rose in some regions
jovav3.indb 265jovav3.indb 265 16/12/10 16:52:0316/12/10 16:52:03
Copyright © 2011. Edward Elgar. All rights reserved. May not be reproduced in any form without permission from the publisher, except fair uses permitted under U.S. or
applicable copyright law.
EBSCO Publishing : eBook Collection (EBSCOhost) - printed on 6/9/2015 1:35 PM via UNIVERSIDAD RAFAELLANDIVARAN: 387706 ; Jovanovic, Miroslav N..; International Handbook on the Economics of IntegrationAccount: s4245486

266 International handbook on the economics of integration, volume III
Table 13.1 Intra- regional export shares, 1970–2001
1970 1980 1985 1990 1995 2000 2001 Year
in force
Europe and North America
CEFTA .. .. .. .. 14.6 11.5 12.4 1993
EU 59.5 60.8 59.2 65.9 62.4 62.1 61.2 1957
NAFTA 36.0 33.6 43.9 41.4 46.2 55.7 54.8 1994
Latin America and the Caribbean
CACM 26.0 24.4 14.4 15.4 21.7 13.7 15.0 1961
Andean Group 1.8 3.8 3.2 4.2 12.2 8.8 11.2 1988
CARICOM 4.2 5.3 6.3 8.1 12.1 14.6 13.4 1973
MERCOSUR 9.4 11.6 5.5 8.9 20.3 20.7 20.8 1991
Africa
CEMAC
(UDEAC)
4.8 1.6 1.9 2.3 2.2 1.2 1.3 1999
COMESAa 7.4 5.7 4.4 6.3 6.0 4.8 5.2 1994
ECCAS 9.8 1.4 1.7 1.4 1.5 0.9 1.1 1983c
ECOWAS 2.9 9.6 5.1 8.0 9.0 9.6 9.8 1975c
SADCb 4.2 0.4 1.4 3.1 10.6 11.9 10.9 1992c
UMEOA 6.2 9.9 8.7 12.1 10.3 13.0 13.5 2000
Middle East and Asia
ASEAN/AFTA 22.4 17.4 18.6 19.0 24.6 23.0 22.4 1992
GCC 4.6 3.0 4.9 8.0 6.8 5.0 5.1 1981c
SAARC 3.2 4.8 4.5 3.2 4.4 4.3 4.9 1985c
Notes:a. Prior to 2002, data unavailable for Namibia and Swaziland.b. Prior to 2000, data unavailable for Botswana, Lesotho and Swaziland.c. Year of foundation.
Key:CEFTA= Central European Free Trade Agreement.EU = European Union.NAFTA = North American Free Trade Area.CACM = Central America Common Market.CARICOM = Caribbean Common Market.MERCOSUR = Common Market of South America.CEMAC (UDEAC) = Economic and Monetary Community of Central African States.COMESA = Common Market for Eastern and Southern Africa.ECCAS = Economic Community of Central African States.ECOWAS = Economic Community of West African States.SADC = South African Development Community.UEMOA = Economic and Monetary Union of East Africa.ASEAN (AFTA) = Association of South East Asian Nations (ASEAN Free Trade Area).GCC = Gulf Cooperation Council.SAARC = South Asian Association for Regional Cooperation.
Source: WTO (2003).
jovav3.indb 266jovav3.indb 266 16/12/10 16:52:0316/12/10 16:52:03
Copyright © 2011. Edward Elgar. All rights reserved. May not be reproduced in any form without permission from the publisher, except fair uses permitted under U.S. or
applicable copyright law.
EBSCO Publishing : eBook Collection (EBSCOhost) - printed on 6/9/2015 1:35 PM via UNIVERSIDAD RAFAELLANDIVARAN: 387706 ; Jovanovic, Miroslav N..; International Handbook on the Economics of IntegrationAccount: s4245486

Estimating the eff ects of integration 267
following integration (for example, NAFTA, the Andean Community, CARICOM,
MERCOSUR), it was stable or falling in others. Even when it did increase, this was often
not sustained or even reversed in later years. One of the reasons, of course, is that mem-
bership changed. As we shall see below, the intra- regional trade share measure is highly
sensitive to the number of countries and the size of the trading bloc. Also, the integration
process may have occurred at a more or less intensive rate at diff erent times following the
signing of the original agreement.
Other variables and parameters used for extrapolation include the share of imports to
GNP/GDP or to the share of imports in apparent consumption (domestic production
less exports plus imports). Of these, apparent consumption is the preferred measure. One
possibility is to assume that the share of apparent consumption coming from domestic
sources, partner sources and the rest of the world would have remained constant, had
integration not taken place. Then, any decrease in the share of apparent consumption
coming from domestic sources is evidence for gross trade creation. An increase in the
share of imports coming from partner countries is evidence for net trade creation (gross
trade creation less trade diversion) and any decrease in the share of imports coming from
the rest of the world is evidence for trade diversion. In this way, the diff erent eff ects of
integration on trade can be identifi ed and measured. An early example of a study of the
eff ects of European integration that used such an approach was Truman (1969). Using
such a methodology, he estimated that, by 1968, the formation of the EEC had created
new intra- regional trade in manufactured goods equal to $9.2 billion (or 26 per cent of
trade) as well as new external trade of $1.0 billion (or 7 per cent of trade).
Several studies preferred to make a diff erent assumption, namely, that the share of
imports in apparent consumption would have changed by the same amounts in the
post- integration as in the pre- integration period had integration not taken place. Such
an approach was used by the EFTA Secretariat (1969, 1972) to estimate the trade eff ects
of both the EC and EFTA. They estimated trade creation for EFTA at $2.3 billion and
trade diversion at $1.1 billion, respectively. In a later study, Truman (1975) allowed for
increases in the share of imports in apparent consumption over time. This resulted in an
estimate for trade creation of $2.5 billion (or 7 per cent of trade) and trade diversion of
$0.5 billion (or 4 per cent of trade) for 1968.
A fourth approach used by Balassa (1967, 1974) was to use the income elasticity
of demand for imports. He assumed for the anti- monde that the income elasticity of
demand for imports for the pre- integration period would have been the same for the
post- integration period if integration had not taken place. A rise in the income elasticity
of demand for intra- area imports following integration was, then, defi ned as gross trade
creation. However, as this may have resulted from either imports displacing domestic
production (trade creation proper) or imports from other member states displacing
imports from the rest of the world (trade diversion), only a rise in the income elasticity
of demand for imports from all sources taken together would constitute trade creation
proper. A fall in the income elasticity of demand for extra- area imports would indicate
that trade diversion had taken place. On the other hand, a rise in this ratio would be evi-
dence for external trade creation. His results suggested that trade creation had occurred
in all product groups, except temperate- zone food, beverages and tobacco and other
manufactures, while trade diversion occurred in temperate- zone food, beverages and
tobacco, chemicals and other manufactured goods. However, in several categories (fuels,
jovav3.indb 267jovav3.indb 267 16/12/10 16:52:0316/12/10 16:52:03
Copyright © 2011. Edward Elgar. All rights reserved. May not be reproduced in any form without permission from the publisher, except fair uses permitted under U.S. or
applicable copyright law.
EBSCO Publishing : eBook Collection (EBSCOhost) - printed on 6/9/2015 1:35 PM via UNIVERSIDAD RAFAELLANDIVARAN: 387706 ; Jovanovic, Miroslav N..; International Handbook on the Economics of IntegrationAccount: s4245486

268 International handbook on the economics of integration, volume III
machinery and transport equipment), substantial external trade creation also took place.
Expressed in absolute terms, trade creation was estimated at $11.3 billion (or 21 per cent
of trade) and trade diversion at $0.3 billion (or 1 per cent).
Some studies constructed an anti- monde by using parameters for the same period
taken from some third country or group of countries, in eff ect, using this third country
or group of countries as a ‘normaliser’ or control group. Thus, in measuring the eff ects of
European integration, Kreinin (1972) used the United States as the normalising country,
but made additional adjustments for diff erences in the rate of growth of incomes and
prices. He estimated trade creation in manufactured goods and processed foods at $7.3
billion, compared with trade diversion at $2.4 billion. Using the United Kingdom as the
normalising country, trade creation was estimated to amount to $9.3 billion and trade
diversion at $0.4 billion. There are serious drawbacks to this anti- monde approach,
however sophisticated; Mayes (1971), for example, shows that Japan exhibits a greater
gain during the process of creation of the EEC than any of the member countries by
applying exactly the same methodology over the years in question. Thus if one used
Japan as a normaliser, all the EEC countries would appear to have lost by membership.
5 INTENSITY OF TRADE APPROACH
The second approach to measuring the impact of integration introduces the notion of
trade intensity. This is based on the idea that there is some ‘natural’ amount of trade that
will take place between two trading partners, given their geographical features. Thus, if
trade is greater than this natural amount, it implies that their trade is biased by other
factors. These other factors will include membership of a regional integration scheme
such as a trading bloc, common market or currency union. If the degree of bias tends to
increase over time, this provides a measure of the eff ects of integration.4
The major task is to fi nd a suitable index for measuring trade intensity. The starting
point is to return to the intra- regional trade share index referred to above. As Anderson
and Norheim (1993), Frankel (1997) and others have shown, this index suff ers from
two problems. First, the indicator is biased by the number of countries making up the
region (Anderson and Norheim, 1993). The greater the number of countries, the higher
will be the intra- regional trade share. Second, it is biased upwards by the share of world
trade accounted for by the region. As Anderson and Norheim have demonstrated, the
solution to this problem is to divide the intra- regional trade share by the region’s share
in total trade5 creating an ‘intra- regional trade intensity’ or ‘trade concentration ratio’.
The index will be equal to one if the intensity of bilateral trade between two countries
exactly equals the importance of the region in world trade. This would mean that there
is no geographical bias in the trade between the two countries. If the index exceeds one,
trade is geographically biased. Of course, this may be due to natural factors (such as a
common border, distance or common language) or institutional factors (such as mem-
bership of the same trading bloc, a new regional trading agreement or the adoption of
a common currency). There is no way of knowing which of the two infl uences is the
greater. However, as natural factors do not change over time, any increase in the index
implies that institutional factors have aff ected trade. Table 13.2 illustrates recent trends
in the trade concentration ratio for diff erent trading blocs.
jovav3.indb 268jovav3.indb 268 16/12/10 16:52:0316/12/10 16:52:03
Copyright © 2011. Edward Elgar. All rights reserved. May not be reproduced in any form without permission from the publisher, except fair uses permitted under U.S. or
applicable copyright law.
EBSCO Publishing : eBook Collection (EBSCOhost) - printed on 6/9/2015 1:35 PM via UNIVERSIDAD RAFAELLANDIVARAN: 387706 ; Jovanovic, Miroslav N..; International Handbook on the Economics of IntegrationAccount: s4245486

Estimating the eff ects of integration 269
First, we should note that all of the ratios in the table are greater than one, indicat-
ing regional bias in trade. This is not itself a measure of the eff ect of discriminatory
policy arrangements, as the bias may equally be due to natural factors, such as distance,
common borders, common language or common culture. However, as these natural
factors do not change, an increase in the ratio over time is evidence of an eff ect from
policy changes. Second, the trend in the ratios over time suggests a confusing picture.
In the case of the EU and NAFTA, there is virtually no change in the ratio over the
relevant period. However, for the Latin American countries (Andean Community and
MERCOSUR), there is an upward trend, although for ASEAN, the trend is downwards.
In the case of the African countries, the overall picture is a mixed one, although the trade
data are less reliable.
In recent years, a wide variety of alternative methods of measuring for regional bias in
Table 13.2 Intra- regional export concentration ratios
1970 1980 1985 1990 1995 2000 2001 Year in
force
Europe and North America
CEFTA .. .. .. .. 9.1 6.2 5.5 1993
EU 1.5 1.6 1.6 1.5 1.6 1.7 1.6 1957
NAFTA 1.9 2.2 2.7 2.6 2.8 2.9 2.9 1994
Latin America and the Caribbean
CACM 74.8 103.0 75.4 122.4 151.1 46.9 52.1 1961
Andean
Community
1.1 2.5 2.6 4.5 15.4 8.7 9.6 1988
CARICOM 10.7 10.1 19.2 51.4 86.1 128.3 92.6 1973
MERCOSUR 6.2 8.0 3.1 6.6 14.9 15.2 13.6 1991
Africa
CEMAC
(UDEAC)
34.5 7.0 8.4 12.9 19.4 7.0 7.9 1999
COMESAa 5.5 12.1 8.9 15.6 17.8 11.6 12.9 1994
ECCAS 18.6 4.5 4.2 4.3 7.2 3.1 3.8 1983c
ECOWAS 3.1 28.5 5.3 14.5 22.0 20.0 20.6 1975c
SADCb 2.2 0.2 1.3 3.1 14.0 20.1 16.1 1992c
UEMOA 2.2 42.0 34.9 80.7 89.3 137.3 140.4 2000
Middle East and Asia
ASEAN (AFTA) 11.4 4.9 5.1 4.6 3.9 3.4 3.5 1992
GCC 5.7 0.4 1.5 3.2 3.4 1.9 2.0 1981c
SAARC 3.3 7.5 6.6 4.1 4.9 4.2 4.6 1985c
Notes:a. Prior to 2000, data unavailable for Namibia and Swaziland.b. Prior to 2000, data unavailable for Botswana, Lesotho and Swaziland.c. Year of foundation.
Source: WTO (2003).
jovav3.indb 269jovav3.indb 269 16/12/10 16:52:0316/12/10 16:52:03
Copyright © 2011. Edward Elgar. All rights reserved. May not be reproduced in any form without permission from the publisher, except fair uses permitted under U.S. or
applicable copyright law.
EBSCO Publishing : eBook Collection (EBSCOhost) - printed on 6/9/2015 1:35 PM via UNIVERSIDAD RAFAELLANDIVARAN: 387706 ; Jovanovic, Miroslav N..; International Handbook on the Economics of IntegrationAccount: s4245486
270 International handbook on the economics of integration, volume III
world trade have been proposed.6 Anderson and Norheim (1993) calculate what they call
‘the propensity to trade extra- regionally’. This takes into account the fact that regional
integration in recent decades has often taken place against the background of growing
openness in the trade policies of countries. Unfortunately, the evidence suggests that
results are highly sensitive to the particular measure used. As we have seen, the simple
measures, such as the intra- regional trade share and the trade intensity index, suff er from
serious problems. However, there is as yet no obvious alternative to these measures if we
wish to base our measurement on the concept of relative trade intensity.7 However, the
major problem with the trade intensity approach is that it measures the integration eff ect
simply by observing the diff erence between two fi gures – the actual level of trade between
two partners and the normal level of trade based on each country’s trade with the rest of
the world. This is clearly not satisfactory. We cannot treat the integration eff ect as simply
being the diff erence between two observed values. Instead, what we need is an accurate
estimate of the contribution made by all the diff erent determinants of trade between any
two countries, so that we can isolate the precise impact of actual trade policy changes.
This leads us to the third approach.
6 GRAVITY MODELS
Gravity models build on this notion of the ‘natural’ level of trade between two countries.
However, they do so, fi rst, by identifying the factors that determine trade intensity and,
second, by measuring the relationship between these factors and bilateral trade fl ows
over the relevant period. The original gravity model8 viewed bilateral trade fl ows as
being aff ected by two basic forces – trade potential and trade resistance. Trade potential
is shaped by two factors – the size of each country’s GNP or GDP and the population
of the two countries – and thus by per capita GNP/GDP. These two masses act in the
same way as in the theory of gravity to increase trade between the two partners. Trade
resistance was seen as being a function of distance, which acts negatively to reduce trade
between countries. However, as the gravity model has evolved, a large number of other
variables have been added to increase the explanatory power of the model.
The infl uence of population is not as straightforward as fi rst thought. While the
population of the importing country can be expected to increase trade through demand,
the population of the exporting country is more likely to have a negative eff ect. This is
because the bigger the country, the larger the domestic market and the more inwardly
oriented the country will be. Large countries may also be better able to exploit econo-
mies of scale than small countries, resulting in less trade. Small countries may also have
fewer natural resources and, therefore, be more dependent on trade. Third, some gravity
models include geographical size as a separate, additional variable to capture the specifi c
eff ect of physical area or land mass on the need to import natural resources.
Several variables are used to capture the infl uence of trade resistance. While distance
raises the costs of trade and, therefore, has a negative eff ect on trade, it also plays an
important role by raising the costs of shipping goods from one country to another, by
increasing the time spent by goods in transit and by raising the ‘psychic’ or ‘cultural’ cost
resulting from consumers being less familiar with the goods of a more distant country.
For similar reasons, it is common to include dummy variables for countries that are
jovav3.indb 270jovav3.indb 270 16/12/10 16:52:0416/12/10 16:52:04
Copyright © 2011. Edward Elgar. All rights reserved. May not be reproduced in any form without permission from the publisher, except fair uses permitted under U.S. or
applicable copyright law.
EBSCO Publishing : eBook Collection (EBSCOhost) - printed on 6/9/2015 1:35 PM via UNIVERSIDAD RAFAELLANDIVARAN: 387706 ; Jovanovic, Miroslav N..; International Handbook on the Economics of IntegrationAccount: s4245486
Estimating the eff ects of integration 271
adjacent to one another and for countries that share a common language or cultural affi n-
ity. Third, a dummy variable is added to capture the eff ect of countries being members
of the same regional trading arrangement. Other dummy variables are often included for
factors such as where one country is a landlocked or island economy, where two coun-
tries operate a common currency or where one country is a former colony of another.
Such a model has the attraction of being able to isolate the eff ect of each of the major
variables entering into the determination of trade between two countries and thus to
obtain a more accurate measure of the integration eff ect. However, gravity models have
often been criticised for lacking any robust theoretical basis. In particular, prices are
excluded entirely from the model, it being assumed that markets adjust to equate demand
and supply. However, as Bergstrand (1985) and others have shown, gravity models can
be made consistent with trade theory. Furthermore, the explanatory power of most
applications of the gravity model has been quite high, with an adjusted R- squared as
high as 70 or 80 per cent.
Many of the early studies that made use of a gravity model to measure the impact of
regional integration were used in relation to the formation of the EEC and EFTA. Two
approaches were used. One was to estimate the amount of trade that would be expected
to take place between member states in the absence of economic integration and then
to compare this with the actual level of trade several years after integration. The unex-
plained element of trade or the residual was then treated as being the result of integra-
tion. The alternative was to include a dummy variable for integration for intra- bloc
trade, and thereby measure more directly the impact of integration. Aitken (1973) was
the fi rst to make use of a dummy variable to measure the eff ects of integration in a study
of the impact of the formation of the EEC and EFTA. However, the estimated coeffi cient
measures only gross trade creation, not distinguishing between trade- creation and trade
diversion eff ects. Bayoumi and Eichengreen (1995) and Frankel (1997) provided a solu-
tion to this problem through the inclusion of a second dummy variable to represent trade
between the member and non- member states. If the importing country is a member of the
bloc and the exporting country is not, the dummy variable takes a value of one and vice
versa. A positive relationship between this and the increase in intra- regional imports is
taken to indicate a diversion of trade from non- members to members. The value of the
coeffi cient thus measures the amount of any increase in intra- regional trade that is due
to trade diversion.
Bayoumi and Eichengreen (1995) found that the formation of both the EC and EFTA
had signifi cant eff ects on intra- European trade. In the fi rst period covering the formation
of the EEC and EFTA, trade among the Six grew by an estimated 3.2 per cent per annum
faster, and among the Seven by an estimated 2.3 per cent per annum faster, as a result of
integration. However, in the case of the EEC, this was accompanied by some trade diver-
sion, which was not the case for EFTA. Following both of the fi rst two enlargements of
the EEC, similar eff ects were apparent. After 1972, trade between the United Kingdom,
Eire and Denmark increased signifi cantly faster than predicted by the model, as a result
of both trade creation and trade diversion. Following the accession of Greece in 1981
and Spain and Portugal in 1986, trade between the Nine and the newly acceding coun-
tries grew faster than predicted by the model, which, in the case of Spain and Portugal
was due entirely to trade creation.
Frankel (1997) used a gravity model to estimate the integration eff ects of six trading
jovav3.indb 271jovav3.indb 271 16/12/10 16:52:0416/12/10 16:52:04
Copyright © 2011. Edward Elgar. All rights reserved. May not be reproduced in any form without permission from the publisher, except fair uses permitted under U.S. or
applicable copyright law.
EBSCO Publishing : eBook Collection (EBSCOhost) - printed on 6/9/2015 1:35 PM via UNIVERSIDAD RAFAELLANDIVARAN: 387706 ; Jovanovic, Miroslav N..; International Handbook on the Economics of IntegrationAccount: s4245486
272 International handbook on the economics of integration, volume III
blocs over the period from 1965 to 1994: EC/EU, NAFTA, MERCOSUR, the Andean
Group, ASEAN and ANZCERTA (Australia–New Zealand Closer Economic Relations
Trade Agreement). Bilateral trade fl ows from the United Nations trade matrix covering
some 63 countries were included. An estimated 75 per cent of all bilateral trade fl ows
were explained by the model. All the variables were signifi cant and showed the expected
relationship. For individual trading blocs, however, the results were variable. In all cases,
intra- bloc trade was found to be higher than could be explained by the other factors in
the model. The strongest eff ects were found for the two Asian trading blocs, ASEAN and
ANZCERTA, with intra- bloc trade being fi ve times higher than would have taken place
with other similar, non- member states. Strong eff ects were also found for the two South
American blocs, MERCOSUR and the Andean Community. With regard to Europe,
however, much depended on whether the EU15 or the EC12 was taken as the relevant
bloc. For the EU, there was no statistically signifi cant eff ect until after 1985, which is not
surprising given that the EU did not come into being until the end of the period covered.
By 1990, trade between members of the EU was found to be 35 per cent more than trade
between two similar countries. The EC bloc eff ect was stronger, but not statistically
signifi cant until 1980. Again, however, membership of the EC was not complete until
1986, with the accession of Spain and Portugal. Frankel’s results showed that, by 1992,
bilateral trade between any two EC member states was 65 per cent higher than it would
have been had the EC not existed. Both of the two enlargements in 1973 and 1985 were
found to have contributed about one half of the increase.
Soloaga and Winters (1999) used a gravity model to estimate the impact of regional
trading agreements on bilateral trade fl ows between some 58 countries over the 1980–96
period and covering nine trading agreements. These countries were members of one
of six trading blocs – EU, NAFTA, MERCOSUR, the Andean Group, ASEAN and
CACM. They introduced two additional bloc- related dummy variables to capture
abnormal levels of trade that might be attributable to the formation of the trading blocs.
As usual, one variable captures the eff ect on intra- bloc trade of both countries being
members of the bloc. A second dummy variable takes the value of one if the importing
country is a member of the bloc and zero otherwise. This measures the overall open-
ness of the importing country to imports from other members of the same bloc. A third
dummy variable takes the value of 1 when the exporting country belongs to the trading
bloc of the importing country. The last two variables are designed to capture, to a greater
extent than in previous models, the eff ects of greater openness on the part of the trading
bloc. In this way, the specifi c eff ect of regional integration on the trade of each member
state can be measured. Soloaga and Winters’s results show that, over the period covered,
regional integration had no signifi cant eff ect on intra- bloc trade. For the EU and EFTA,
they found convincing evidence that trade diversion had taken place. On the other
hand, trade liberalisation in Latin America had a positive impact on intra- bloc imports,
although the results were only statistically signifi cant for CACM and MERCOSUR.
Finally, they found evidence for export diversion in the case of the EU and EFTA.
Clarete et al. (2002) adopted the same approach as Soloaga and Winters (2001) in
their study of the eff ects of regional integration on Asian trade. The model was esti-
mated for the period from 1980 to 2000 and covering 11 trade blocs, mostly from the
Asian region. Between 68 and 73 per cent of the variation in trade fl ows was explained
by the variables in the model. Their results showed great variations across trading blocs.
jovav3.indb 272jovav3.indb 272 16/12/10 16:52:0416/12/10 16:52:04
Copyright © 2011. Edward Elgar. All rights reserved. May not be reproduced in any form without permission from the publisher, except fair uses permitted under U.S. or
applicable copyright law.
EBSCO Publishing : eBook Collection (EBSCOhost) - printed on 6/9/2015 1:35 PM via UNIVERSIDAD RAFAELLANDIVARAN: 387706 ; Jovanovic, Miroslav N..; International Handbook on the Economics of IntegrationAccount: s4245486

Estimating the eff ects of integration 273
Clarete et al.’s study identifi ed three groups. The fi rst were trading blocs which enjoyed
increased intra- bloc trade mainly at the expense of exports to and imports from the rest
of the world. These included the Andean Pact, ECO, EFTA, MERCOSUR, SAPTA and
SPARTECA.9 The second enjoyed increased intra- bloc trade without leading to reduced
trade with the rest of the world. These included countries that practised ‘open regional-
ism’ such as APEC, ANZCERTA and the EU. A third group, comprising AFTA and
NAFTA did not change their intra- bloc trade but reduced their trade with the rest of
the world. Overall, their estimates showed that regional trading agreements had con-
tributed to an expansion of trade at both a global and a regional level. However, there
are regional trading agreements that do result in signifi cant net trade diversion, in the
Commonwealth of Independent States (CIS) and the EFTA for example, to say nothing
of colonial arrangements.
7 OTHER STOCHASTIC ECONOMETRIC APPROACHES
As we have seen, gravity models have (wrongly) been criticised for lacking any solid
basis in economic theory. In particular, critics have questioned the exclusion from the
model of key variables, such as relative prices and real exchange rates. An alternative
is, therefore, to construct a model for trade fl ows between country pairs that includes
these variables. At a simple level, the main determinants of total imports in any year are
the level of economic activity (with GNP or GDP or apparent consumption as the most
suitable proxy) and the prices of domestic products relative to the price of imports. The
relationship between GNP/GDP and imports is given by the income elasticity of demand
for imports and between relative prices and imports by the price elasticity of demand for
imports. However, in order to measure the impact of integration on imports, it is neces-
sary to distinguish between total, intra- area and extra- area imports. Intra- and extra-
area imports will be determined by the relationship between the prices of import from
partner countries and the price of imports in non- partner countries. This will depend on
the elasticity of substitution of imports with respect to price changes between partner
and non- partner countries.
The integration eff ect may be assumed to work through changes in relative prices.
However, this assumes that tariff changes are fully passed on to prices, which may not be
the case where goods are diff erentiated and/or markets are less than perfectly competi-
tive. A further diffi culty is that tariff changes may have an eff ect on imports other than
through changes in relative prices. Balassa (1974) and others have drawn attention to
the possible ‘promotional eff ects’ of integration, whereby integration stimulates imports
through increased information fl ows, direct investment by fi rms in sales and distribu-
tion outlets and a reduction of risk and uncertainty. For this reason, some models have
preferred to include a separate variable for tariff changes.
Once the model is agreed, the next task is to estimate the coeffi cients in the equation
for a suitable period of time, and then to use the completed equation to estimate what
trade would have been had integration not taken place. Actual trade fl ows may then be
compared with fl ows predicted by the model, and the residual treated as the integra-
tion eff ect. In this case, the anti- monde is based on actual estimates of how income and
relative prices have aff ected trade fl ows over the integration period. If the purpose is to
jovav3.indb 273jovav3.indb 273 16/12/10 16:52:0416/12/10 16:52:04
Copyright © 2011. Edward Elgar. All rights reserved. May not be reproduced in any form without permission from the publisher, except fair uses permitted under U.S. or
applicable copyright law.
EBSCO Publishing : eBook Collection (EBSCOhost) - printed on 6/9/2015 1:35 PM via UNIVERSIDAD RAFAELLANDIVARAN: 387706 ; Jovanovic, Miroslav N..; International Handbook on the Economics of IntegrationAccount: s4245486

274 International handbook on the economics of integration, volume III
make an ex ante prediction as to how integration will aff ect trade fl ows in the future, the
coeffi cients in the equation may be used to compare the eff ects with and without integra-
tion. For this purpose, integration may be treated as a separate dummy variable, taking
the value of one or zero according to the simulation. Rather than estimating the model
for the EC for a diff erent period during which integration took place, an alternative is
to estimate the equation for a comparable country or group of countries for the same
period. Ideally, the estimation should be done at as disaggregated a level as possible, as
individual countries and products do not behave in the same fashion.
Various studies have been carried out using models of this kind. Resnick and Truman
(1974) used one to measure the impact of European integration on trade in manufac-
tured goods. Coeffi cients were obtained by estimating the equations for EC trade for
the period from 1953 to 1968. The model was then simulated to estimate the impact of
integration by altering the 1968 values of the relative price variables for tariff changes in
the EC and EFTA. Trade creation was estimated at $1.2 billion ($1.4 billion including
EFTA) and trade diversion at $2.7 billion ($3.6 billion including EFTA). Interestingly,
these fi gures were much lower than the estimates obtained by other studies, with trade
diversion actually exceeding trade creation.
Another example of an analytic model is Winters (1984, 1985) who used a model based
on the Almost Ideal Demand System (AIDS) proposed by Deaton and Muellbauer
(1980) to estimate the eff ects on the UK of accession to the EC. For each industry, the
share of the market taken by an individual supplier is denoted by sik
where i denotes the
ith supplier’s share of the kth country’s market for a particular industry. This is given
by:
Sik
= a + Slij ln p
jk +
b ln Y
k / P
k,
where pjk
is the price of the jth country supplier into the kth country market, Yk is total
nominal expenditure by k residents and Pk is a price index covering supplies from all
sources. The attraction of this model is that it accounts for the allocation of consumer
expenditure on manufactures among all suppliers, not just between domestic and foreign
suppliers. The eff ects of tariff reductions on intra- area imports are incorporated into the
model through the use of dummy variables. In this way, the eff ects of non- price factors
can be included, and possible data constraints regarding prices overcome.
CEPR/EU Commission (1997) used a similar approach to estimate the eff ects of the
creation of the Single Market. They used three demand equations for 15 three- digit sensi-
tive goods sectors for four principal countries, namely, Germany, France, Italy and the
UK. The equations estimated the share of nominal, sectoral expenditure accounted for
by domestically produced goods, intra- EU imports and extra- EU imports. A separate
dummy variable was included to capture the eff ect of the creation of the Single Market.
The Single Market was expected to aff ect trade fl ows not only through the direct eff ects
of reductions in trade costs on demand, but also through the indirect eff ects of increased
competition and reductions in price–cost margins. Separate price equations for each of
the sectors covered were used to estimate these indirect, supply- side eff ects. The esti-
mated impact of the Single Market on price–cost margins was then used to simulate the
impact of price reductions on trade fl ows using the estimated demand equations. CEPR/
EU Commission found that the overall impact of the Single Market Programme was to
jovav3.indb 274jovav3.indb 274 16/12/10 16:52:0416/12/10 16:52:04
Copyright © 2011. Edward Elgar. All rights reserved. May not be reproduced in any form without permission from the publisher, except fair uses permitted under U.S. or
applicable copyright law.
EBSCO Publishing : eBook Collection (EBSCOhost) - printed on 6/9/2015 1:35 PM via UNIVERSIDAD RAFAELLANDIVARAN: 387706 ; Jovanovic, Miroslav N..; International Handbook on the Economics of IntegrationAccount: s4245486
Estimating the eff ects of integration 275
cause a decrease in the domestic producers’ share in the 15 sectors covered of 4.2 per cent
and a rise in the share of EU producers of 2.1 per cent and of the rest of the world of 2 per
cent. A similar exercise was carried out for the manufacturing sectors as a whole in order
to be able to examine the eff ects of the Single Market on other manufacturing sectors.
For manufacturing as a whole, the fall in the domestic producers’ share was 2.3 per cent,
with EU producers increasing their share by 0.5 per cent and the rest of the world by 1.8
per cent. In other words, the impact of the Single Market was, overwhelmingly, one of
both internal and external trade creation.
8 COMPUTABLE GENERAL EQUILIBRIUM MODELS
CGE modelling has become steadily more popular in recent years. The models require
strong assumptions and in many cases have been calibrated rather than econometrically
estimated. Until 1995, most models were largely static, so while they could compute a
theoretical end point after the consequences of the change had worked themselves out,
they could not suggest the time path, which is essential if there is a degree of path depend-
ency in the process. Two main kinds of CGE models have been used to study economic
integration.10 The fi rst group is multiregional (for example, GTAP,11 MEGABARE,12
WorldScan13) while the remainder relate to single countries (for example PRCGEM,
ORANI, Monash Model and so on).14
Devarajan (1998) shows that CGE models are powerful tools for policy analysis for
three main reasons: fi rst, they are able to generate a new set of equilibrium prices follow-
ing a shock, which will in turn serve to determine outputs, consumption, employment
and income and so on; second, they are able to capture not just the primary eff ects of a
shock or change in policy but also the full eff ects as well; third, they are able to capture
the changes in economic structure, such as the proportions of agriculture, industry and
services in GNP, the shares of payments to labour and capital in value added, and the
composition of government revenue.
CGE models were fi rst used extensively in integration with the NAFTA negotiations.
Most CGE models incorporate imperfect competition in all markets and imperfect sub-
stitution in all markets and imperfect substitution between foreign and domestic goods,
and between alternative sources of imports (see Armington, 1969, model of trade15).
Among the CGE models, GTAP Model16 is the most popularly used tool to study the
multi- trade fl ows among all sorts of economic integration. The literature reveals that
developing countries make substantially larger gains than developed countries.17 In con-
trast, comparable cuts in agriculture and services benefi t developed countries relatively
more.
NAFTA18 and its Enlargement
CGE models have been used extensively to analyse NAFTA and its enlargement to
Central and South America. Various issues related to this (mostly from the US perspec-
tive) have been fully reviewed by Harris and Cox (1985), Brown and Stern (1989), Brown
(1992), Brown et al. (1992, 2004, 2005), Kehoe and Kehoe (1994), Hilaire and Yang
(2004), Trefl er (2004), USITC (2004) and Georges (2008).
jovav3.indb 275jovav3.indb 275 16/12/10 16:52:0416/12/10 16:52:04
Copyright © 2011. Edward Elgar. All rights reserved. May not be reproduced in any form without permission from the publisher, except fair uses permitted under U.S. or
applicable copyright law.
EBSCO Publishing : eBook Collection (EBSCOhost) - printed on 6/9/2015 1:35 PM via UNIVERSIDAD RAFAELLANDIVARAN: 387706 ; Jovanovic, Miroslav N..; International Handbook on the Economics of IntegrationAccount: s4245486
Related Documents