Welcome message from author
This document is posted to help you gain knowledge. Please leave a comment to let me know what you think about it! Share it to your friends and learn new things together.
Transcript


INTERNATIONAL FISH FARMING HOLDING CO. - PSC - ASMAK -
A PUBLIC JOINT STOCK COMPANY
AND IT'S SUBSIDIARIES
ABU DHABI
UNITED ARAB EMIRATES
CONSOLIDATED STATEMENT OF INCOME FOR THE YEAR
ENDED 31 DECEMBER 2012 EXHIBIT B
______________________________________________________________________________ Note 2012 2011 AED '000' AED '000'
Continuing Operations : Revenue 23 254,645 361,619 Cost of revenue 24 (212,686) (311,276)
Gross profit 41,959 50,343
Other income 25 10,540 18,607 Administrative expenses 26 (64,199) (37,146) Finance cost (24,504) (26,081) Change in fair value of Biological assets (4,323) 3,170 Investments income 27 (5,278) 12,589 Impairment in value of assets 28 (95,530) -- _______________
(Loss)/profit for the year from continuing operation (141,335) 21,482
Discontinuing Operations : Loss for the year from discontinued operations 15 (1,778) (470)
_________________ ______________
(Loss)/profit for the year – Exhibit C & D (143,113) 21,012
====== ===== Attributable To : Equity holders of the parent company (142,351) 19,026 Non-controlling interest (762) 1,986 _________________ ______________
Total (143,113) 21,012 ======= ======
Basic (Loss)/profit per share (AED) 29 ( 1.67) 0.24 ===== ======
THE ACCOMPANYING NOTES CONSTITUTE AN INTEGRAL
PART OF THESE CONSOLIDATED FINANCIAL STATEMENTS
-5-

INTERNATIONAL FISH FARMING HOLDING CO. - PSC - ASMAK -
A PUBLIC JOINT STOCK COMPANY
AND IT'S SUBSIDIARIES
ABU DHABI
UNITED ARAB EMIRATES
CONSOLIDATED STATEMENT OF COMPREHENSIVE INCOME
FOR THE YEAR ENDED 31 DECEMBER 2012 EXHIBIT B
(CONTINUED)
______________________________________________________________________________ 2012 2011 AED '000' AED '000'
(Loss)/profit for the year (143,113) 21,012
Other comprehensive income : Net unrealized gain/(loss) on fair value of available for sale investments 3,739 (915)
Total other comprehensive income/(loss) 3,739 (915)
Net comprehensive (loss)/income for the year – Exhibit C (139,374) 20,097 ====== =====
Attributable to : Equity holders of the parent company (138,612) 18,111 Non-controlling interest (762) 1,986
Total (139,374) 20,097 ======= =====
THE ACCOMPANYING NOTES CONSTITUTE AN INTEGRAL
PART OF THESE CONSOLIDATED FINANCIAL STATEMENTS
-6-

INTERNATIONAL FISH FARMING HOLDING CO. - PSC - ASMAK -
A PUBLIC JOINT STOCK COMPANY
AND IT'S SUBSIDIARIES
ABU DHABI
UNITED ARAB EMIRATES
CONSOLIDATED STATEMENT OF CHANGES IN EQUITY FOR THE YEAR ENDED 31 DECEMBER 2012
EXHIBIT C
________________________________________________________________________________________________________________________________
Attributable to equity holders of the parent company . Available for Non-
Statutory sale investment Retained controlling
Capital reserves revaluation reserve Earnings Total interest Total
AED '000' AED '000' AED '000' AED '000' AED '000' AED '000' AED '000'
Balance at 1 January 2011 300,000 27,112 (20,470) 30,130 336,772 7,555 344,327 ___________ ___________ ___________ ____________ ___________ ___________ ____________
Profit for the year ended 31 December 2011 - Exhibit B -- -- -- 19,026 19,026 1,986 21,012
Other comprehensive loss -- -- (915) -- (915) -- (915) ___________ ___________ ___________ ____________ ___________ ___________ ____________
Total comprehensive income/(loss) - Exhibit B -- -- (915) 19,026 18,111 1,986 20,097
Conversion of subordinated convertible loan notes 210,000 209,193 -- -- 419,193 -- 419,193
Adjustment of non-controlling interest -- -- -- -- -- 200,045 200,045
Transferred to statutory reserve -- 1,903 -- (1,903) -- -- -- ___________ ___________ ___________ ____________ ___________ ___________ ____________
Balance at 31 December 2011 - Exhibit A 510,000 238,208 (21,385) 47,253 774,076 209,586 983,662
___________ ___________ ___________ ____________ ___________ ___________ ____________
Loss for the year ended 31 December 2012 - Exhibit B -- -- -- (142,351) (142,351) (762) (143,113)
Other comprehensive income -- -- 3,739 -- 3,739 -- 3,739 ___________ ___________ ___________ ____________ ___________ ___________ ____________
Total comprehensive income/(loss) - Exhibit B -- -- 3,739 (142,351) (138,612) (762) (139,374) ___________ ___________ ___________ ____________ ___________ ___________ ____________
Management fees -- -- -- (364) (364) -- (364)
Adjustment of non-controlling interest -- -- -- -- -- (1,911) (1,911)
Accumulated losses set-off with premium loan notes -- (95,462) -- 95,462 -- -- -- ___________ ___________ ___________ ____________ ___________ ___________ ____________
Balance at 31 December 2012 - Exhibit A 510,000 142,746 (17,646) -- 635,100 206,913 842,013
====== ====== ====== ======= ====== ====== ======
THE ACCOMPANYING NOTES CONSTITUTE AN INTEGRAL PART OF THESE CONSOLIDATED FINANCIAL STATEMENTS
-7-
INTERNATIONAL FISH FARMING HOLDING CO. - PSC - ASMAK -
A PUBLIC JOINT STOCK COMPANY
AND IT'S SUBSIDIARIES
ABU DHABI
UNITED ARAB EMIRATES
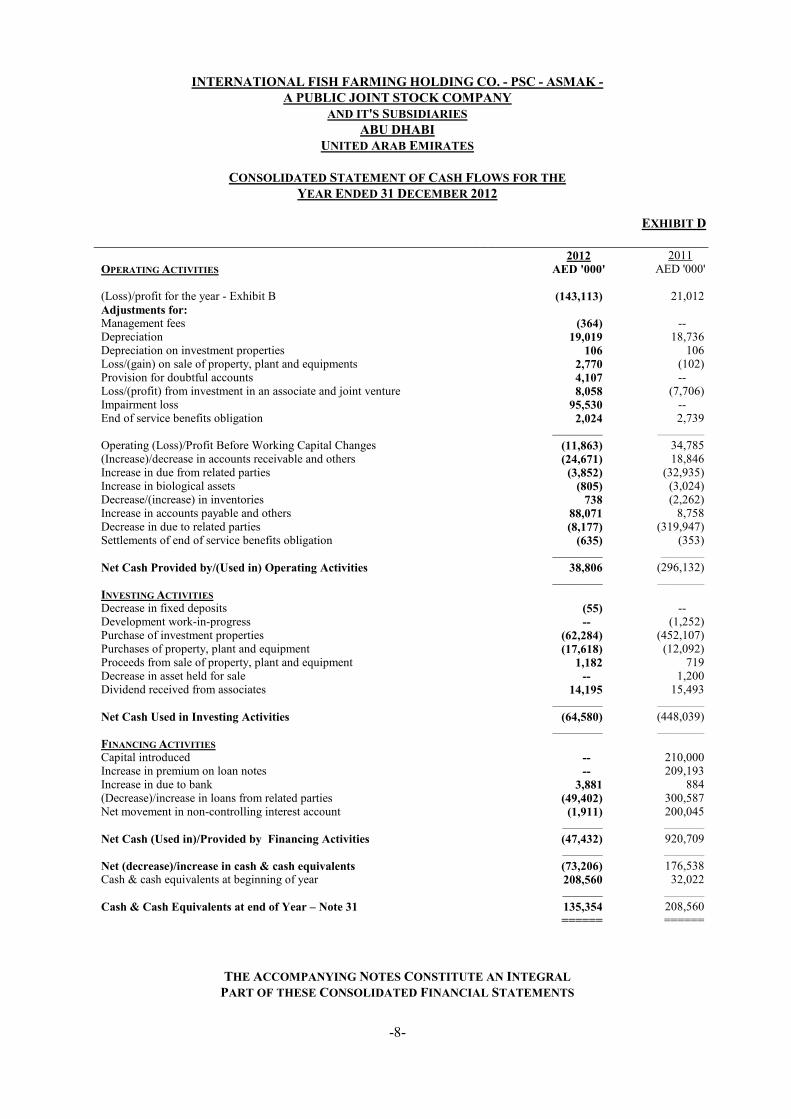
CONSOLIDATED STATEMENT OF CASH FLOWS FOR THE
YEAR ENDED 31 DECEMBER 2012
EXHIBIT D
_____________________________________________________________________________ 2012 2011
OPERATING ACTIVITIES AED '000' AED '000' (Loss)/profit for the year - Exhibit B (143,113) 21,012
Adjustments for: Management fees (364) -- Depreciation 19,019 18,736 Depreciation on investment properties 106 106 Loss/(gain) on sale of property, plant and equipments 2,770 (102) Provision for doubtful accounts 4,107 -- Loss/(profit) from investment in an associate and joint venture 8,058 (7,706) Impairment loss 95,530 -- End of service benefits obligation 2,024 2,739 _______________ ______________
Operating (Loss)/Profit Before Working Capital Changes (11,863) 34,785 (Increase)/decrease in accounts receivable and others (24,671) 18,846 Increase in due from related parties (3,852) (32,935) Increase in biological assets (805) (3,024) Decrease/(increase) in inventories 738 (2,262) Increase in accounts payable and others 88,071 8,758 Decrease in due to related parties (8,177) (319,947) Settlements of end of service benefits obligation (635) (353) _______________ _____________
Net Cash Provided by/(Used in) Operating Activities 38,806 (296,132) _______________ ______________
INVESTING ACTIVITIES Decrease in fixed deposits (55) -- Development work-in-progress -- (1,252) Purchase of investment properties (62,284) (452,107) Purchases of property, plant and equipment (17,618) (12,092) Proceeds from sale of property, plant and equipment 1,182 719 Decrease in asset held for sale -- 1,200 Dividend received from associates 14,195 15,493 _______________ ______________
Net Cash Used in Investing Activities (64,580) (448,039) _______________ ______________
FINANCING ACTIVITIES Capital introduced -- 210,000 Increase in premium on loan notes -- 209,193 Increase in due to bank 3,881 884 (Decrease)/increase in loans from related parties (49,402) 300,587 Net movement in non-controlling interest account (1,911) 200,045 ____________ ____________
Net Cash (Used in)/Provided by Financing Activities (47,432) 920,709 ____________ ____________
Net (decrease)/increase in cash & cash equivalents (73,206) 176,538 Cash & cash equivalents at beginning of year 208,560 32,022 ____________ ____________
Cash & Cash Equivalents at end of Year – Note 31 135,354 208,560
====== ======
THE ACCOMPANYING NOTES CONSTITUTE AN INTEGRAL
PART OF THESE CONSOLIDATED FINANCIAL STATEMENTS
-8-
INTERNATIONAL FISH FARMING HOLDING CO. - PSC - ASMAK -
A PUBLIC JOINT STOCK COMPANY
AND IT'S SUBSIDIARIES
ABU DHABI
UNITED ARAB EMIRATES
NOTES TO CONSOLIDATED FINANCIAL STATEMENTS
___________________________________________________________________________
1. STATUS AND ACTIVITIES International Fish Farming Holding Co. - PSC - ASMAK - Abu Dhabi (hereinafter referred to as
the “Company”) is a Public Joint Stock Company incorporated in Abu Dhabi by an Amiri Decree No.15 issued by His Highness the Ruler of Abu Dhabi on 23 November 1998.
The company is domiciled in Abu Dhabi City and its registered address is P. O. Box 32619,
Emirate of Abu Dhabi, United Arab Emirates.
The main activities of the company and its subsidiaries "The Group" are Establishments management services, investing in aquaculture projects, trading in fish and fish products, exporting, preserving fish products and other sea living resources through cooling and freezing and buying, selling and dividing plots and real estates, management and leasing of real estate and developing real estate. To perform technical, commercial and contracting services specifically marine work constructs, general contracting and other associates businesses.
2. ADOPTION OF NEW AND REVISED STANDARDS In the current year, the group has adopted the new and revised International Financial Reporting
Standards (IFRSs) including the International Accounting Standards (IASs) and their interpretations that are relevant to its operations and effective on the current consolidated financial statements.
The directors anticipate that all of the new International Financial Reporting Standards (IFRS) and Interpretations as applicable will be adopted in the Group’s financial statements for the period commencing 1 January 2013 or as and when it is applicable.
3. SIGNIFICANT ACCOUNTING POLICIES
Statement of compliance
The Group’s consolidated financial statements have been prepared in accordance with International Financial Reporting Standards.
Basis of preparation The group’s consolidated financial statements are prepared on the historical cost basis except for financial instruments which have been measured on the basis of fair value. The following is the summary of significant accounting policies adopted :
Basis of consolidation The consolidated financial statements incorporate the financial statements of the parent company and its subsidiaries. Subsidiaries :
Subsidiaries are all entities over which the group has the power to govern the financial and operating policies generally accompanying a shareholding of more than one half of the voting rights. Subsidiaries are fully consolidated from the date on which control is transferred to the group. They are de-consolidated from the date that control ceases.
-9-
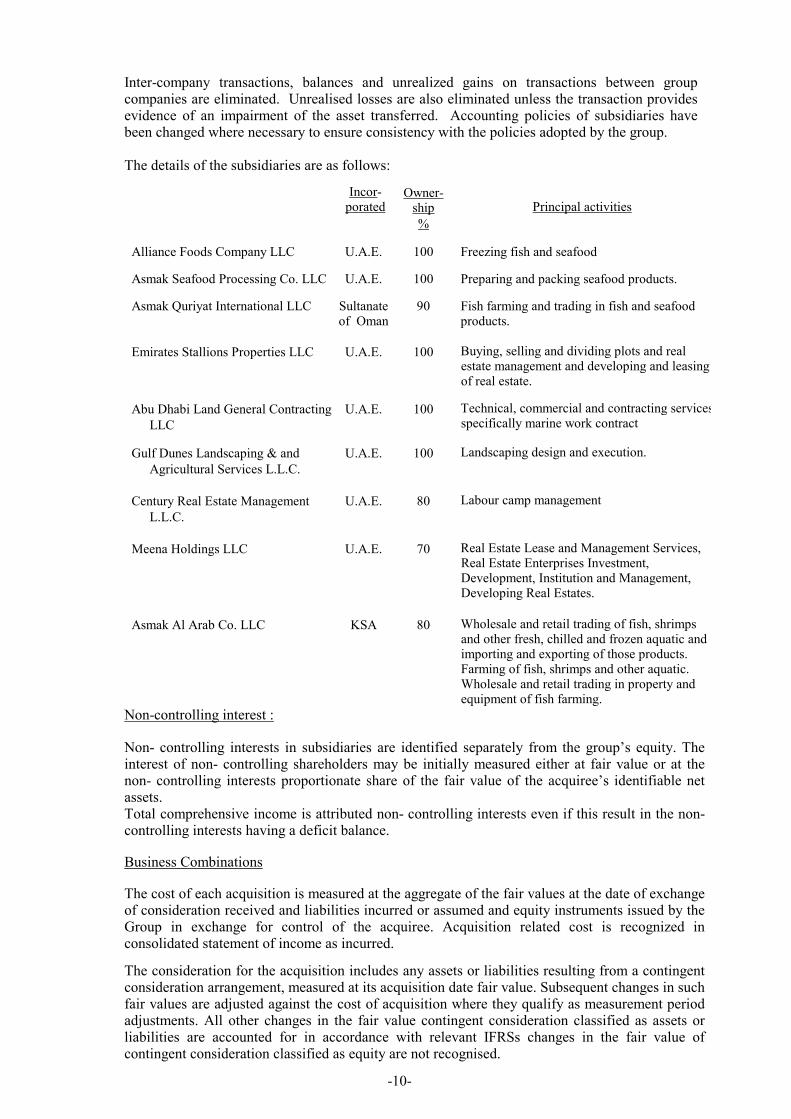
Inter-company transactions, balances and unrealized gains on transactions between group companies are eliminated. Unrealised losses are also eliminated unless the transaction provides evidence of an impairment of the asset transferred. Accounting policies of subsidiaries have been changed where necessary to ensure consistency with the policies adopted by the group. The details of the subsidiaries are as follows:
Incor- porated
Owner- ship
Principal activities
%
Alliance Foods Company LLC U.A.E. 100 Freezing fish and seafood
Asmak Seafood Processing Co. LLC U.A.E. 100 Preparing and packing seafood products.
Asmak Quriyat International LLC
Sultanate of Oman
90 Fish farming and trading in fish and seafood products.
Emirates Stallions Properties LLC U.A.E. 100 Buying, selling and dividing plots and real estate management and developing and leasing of real estate.
Abu Dhabi Land General Contracting
LLC
U.A.E. 100 Technical, commercial and contracting services specifically marine work contract
Gulf Dunes Landscaping & and
Agricultural Services L.L.C.
U.A.E. 100 Landscaping design and execution.
Century Real Estate Management
L.L.C.
U.A.E. 80 Labour camp management
Meena Holdings LLC U.A.E. 70 Real Estate Lease and Management Services, Real Estate Enterprises Investment, Development, Institution and Management, Developing Real Estates.
Asmak Al Arab Co. LLC KSA 80 Wholesale and retail trading of fish, shrimps and other fresh, chilled and frozen aquatic and importing and exporting of those products. Farming of fish, shrimps and other aquatic. Wholesale and retail trading in property and equipment of fish farming.
Non-controlling interest :
Non- controlling interests in subsidiaries are identified separately from the group’s equity. The interest of non- controlling shareholders may be initially measured either at fair value or at the non- controlling interests proportionate share of the fair value of the acquiree’s identifiable net assets. Total comprehensive income is attributed non- controlling interests even if this result in the non-controlling interests having a deficit balance.
Business Combinations
The cost of each acquisition is measured at the aggregate of the fair values at the date of exchange of consideration received and liabilities incurred or assumed and equity instruments issued by the Group in exchange for control of the acquiree. Acquisition related cost is recognized in consolidated statement of income as incurred.
The consideration for the acquisition includes any assets or liabilities resulting from a contingent consideration arrangement, measured at its acquisition date fair value. Subsequent changes in such fair values are adjusted against the cost of acquisition where they qualify as measurement period adjustments. All other changes in the fair value contingent consideration classified as assets or liabilities are accounted for in accordance with relevant IFRSs changes in the fair value of contingent consideration classified as equity are not recognised.
-10-
Investment in Associates An associate is an entity over which the group has significant influence and that is neither a subsidiary nor an interest in a joint venture. Significant influence is the power to participate in the financial and operating policy decisions of the investee but is not control or joint control evidenced by the power to govern the financial and operating policies of that investee. The company's investment in its associate is accounted for under the equity method of accounting. Under the equity method, investments in associates are carried in the consolidated statement of financial position at cost as adjusted for post-acquisition changes in the group's share of the net assets of the associates, less any impairment in the value of the investment. The consolidated statement of income reflects the groups share of its associates results of group's operations. Losses of an associate in excess of the parent company’s interest in that associate are recognized, if the company has incurred legal or constructive obligations or made payments on behalf of the associate. Any excess of the cost of acquisition over the company’s share of the net fair value of the identifiable assets, liabilities and contingent liabilities of the associate recognized at the date of acquisition as goodwill. The goodwill is included in the carrying amount of the investment and is assessed, annually, for impairment. Accounting policies of associate have been changed where necessary to ensure consistency with policies adopted by the group. Intra-company profit and loss transactions are eliminated to the extent of the group’s interest in the relevant associate.
Investment in Joint venture The group’s interests in jointly controlled entities are accounted for by equity method of accounting and are initially recognized at cost. The group’s share of its joint venture’s post-acquisition profits or losses is recognized in the consolidated statement of income, and its share of post-acquisition movements in reserves is recognized in reserves. The cumulative post-acquisition movements are adjusted against the carrying amount of investment. When the group’s share of losses in a joint venture equals or exceeds its interest in the joint venture, including any other unsecured receivables, the group does not recognize further losses, unless it has incurred obligations or made payments on behalf of the joint venture.
Unrealised gains on transactions between the group and its joint venture are eliminated to the extent of the group’s interest in the joint venture. Unrealised losses are also eliminated unless the transaction provides evidence of an impairment of the asset transferred. Accounting policies of joint ventures have been changed where necessary to ensure consistency with the policies adopted by the group.
Goodwill Goodwill arising on the acquisition of a subsidiary or a jointly controlled entity represents the excess of the cost of acquisition over the group’s interest in the net fair value of the identifiable assets, liabilities and contingent liabilities of the subsidiary or jointly controlled entity recognized at the date of acquisition. Goodwill is initially recognized as an asset at cost and is subsequently measured at cost less any accumulated impairment losses. Goodwill is tested for impairment annually, or more frequently when there is an indication of impairment. If the recoverable amount of the goodwill is less than the carrying amount, the impairment loss is recognized in the consolidated statement of income. Any impairment loss recognized for goodwill is not reversed in a subsequent periods.
On disposal of a subsidiary or a jointly controlled entity, the attribute amount of goodwill is included in the determination of the profit or loss on disposal.
-11-
Property, plant and equipment The property, plant and equipment are carried, in the statement of financial position, at their cost less any accumulated depreciation and any accumulated impairment. Depreciation is calculated on a straight line basis over the estimated useful lives (years) are as follows :
Years
Nets 5 Moorings 12 Cages 12 Buildings & leasehold improvements 5 – 15 Plant & equipment 3 – 5 Furniture, fixtures & equipment 3 – 5 Motor vehicles 4 – 5 Marine vessels 10 – 25
No depreciation is charged on capital work-in-progress. The depreciation charge for each period is recognized in the consolidated statement of income.
The estimated useful lives, residual values and depreciation method are reviewed and adjusted if appropriate at each consolidated statement of financial position date.
The carrying amounts are reviewed at each consolidated statement of financial position date to assess whether they are recorded in excess of their recoverable amounts. Where carrying values exceed recoverable amounts, assets are written down to their recoverable amounts
Any gain or loss arising on derecognition of any item of property, plant and equipment is determined as the difference between the net disposal proceeds and the carrying amount of the assets and is recognized in the consolidated statement of comprehensive income.
Investment properties
Investment properties represent interests in land and buildings which are held by the group to earn rentals or for capital appreciation or both. Such properties are measured at cost and depreciated over their useful life or term of the lease period whichever is earlier.
Investment properties are derecognized upon disposal or when permanently withdrawn from use and no future economic benefits are expected from its disposal. The gain or loss arising from the retirement or disposal of investment property, calculated as the difference between the net disposal proceeds and the carrying amount of the investment property, is recognized in the consolidated statement of income in the period of the retirement or disposal.
Development work-in-progress Development work-in-progress consists of property being developed principally for sale and is stated at the lower of cost or net realizable value. Cost comprises all direct costs attributable to the design and construction of the property including direct staff costs. Net realizable value is the estimated selling price in the ordinary course of the business less estimated costs to complete and applicable variable selling expenses.
Non-current assets held for sale Non-current assets are classified as held for sale if their carrying amount will be recovered principally through a sale transaction rather than through continuing use. This condition is regarded as met only when the sale is highly probable and the asset is available for immediate sale in its present condition. Management is committed to the sale, which should be expected to qualify for recognition as a completed sale within one year from the date of classification.
Non-current assets classified as held for sale are measured at the lower of the carrying amount and fair value less costs to sell.
-12-
Financial assets
Financial assets comprising of, among other things, investments in debt and equity instruments, are recognized and derecognized on the trade date when the group becomes party to the contractual provisions of the instruments. The financial assets are initially recognized at fair value plus transaction costs, directly attributable to the acquisition or issue of those assets, except for the financial assets classified as at fair value through profit or loss, which are initially measured at fair value.
The classification of financial assets depends on the nature and purpose of the financial assets and is determined at the time of initial recognition.
Financial assets at Fair value through Profit and Loss (FVTPL) Financial assets are classified as fair value through profit and loss (FVTPL) when they are held for trading, which means they have been acquired principally for the purpose of selling in the near future. Initially the financial assets in these criteria are recorded at fair value through profits and losses (FVTPL). Gains or losses resultant form changes in the fair value arising on subsequent measurement are recognized in the consolidated statement of income. The net gain or loss recognized in the consolidated statement of income incorporates any dividend or interest earned on the financial asset.
Available for sale (AFS) Available for sale (AFS) financial assets may include equity instruments that are not held principally for the purpose of selling in the near future or debt instruments with fixed or determinable payments and fixed maturity dates that the group has no positive intent and ability to hold to maturity. AFS financial assets are stated at fair value. Gains and losses arising from changes in fair value are recognized directly in equity in cumulative change in fair value with the exception of impairment losses and foreign exchange gains and losses on monetary assets, which are recognized directly in the consolidated statement of comprehensive income. The cumulative gain or loss previously recognized in cumulative change in fair value is included in the consolidated statement of comprehensive income upon the disposal of investment. Dividends on AFS equity instruments are recognized in profit or loss when the group’s right to receive payments is established.
Impairment of financial assets
Financial assets, other than those at FVTPL, are assessed for indications of impairment at each statement of financial position date. For financial assets carried at amortized cost, the amount of the impairment is the difference between the asset’s carrying amount and the present value of estimated future cash flows, discounted at the original effective interest rate. The carrying amount of the financial asset is reduced by the impairment loss directly for all financial assets. With the exception of AFS equity instruments, if, in a subsequent period, the amount of the impairment loss decreases due to an event occurring after the impairment was recognized, the previously recognized impairment loss is reversed through profit or loss to the extent that the carrying amount of the investment at the date the impairment is reversed does not exceed what the amortized cost would have been had the impairment not been recognized. In respect of AFS equity securities, any increase in fair value subsequent to an impairment loss is recognized directly in equity.
Impairment of non-financial assets
Assets that are subject to depreciation or amortization are reviewed for impairment whenever events or changes in circumstances indicate that the carrying amount may not be recoverable.
-13-
An impairment loss is recognized for the amount by which the asset’s carrying amount exceeds its recoverable amount. The recoverable amount is the higher of an asset’s fair value less costs to sell and value in use. For the purposes of assessing impairment, assets are grouped at the lowest levels for which there are separately identifiable cash flows (cash-generating units). Non-financial assets that suffered impairment are reviewed for possible reversal of the impairment at each reporting date.
Derecognition of Financial assets
The group derecognizes a financial asset only when the contractual rights of the cash flows from the assets expire, or it transfers the financial asset and substantially all the risks and rewards of ownership of the asset to another entity.
Cash and cash equivalents Cash comprises cash in hand and demand deposits where cash equivalents are short term, highly liquid investments that are readily convertible to known amounts of cash and which are subject to an insignificant risk of changes in value.
Accounts receivable
Accounts receivables are stated at original invoices amount less a provision for any uncollectible amounts. An estimate for doubtful accounts is made when collection of full amount is no longer probable. Bad accounts are written off when there is no possibility of recovery.
Biological assets
Biological assets are bifurcated as matured fish and immature fish. Matured fish are stated at fair value less estimated point of sales costs with resulting gain or loss recognized in the consolidated statement of comprehensive income. The immature fish are valued at the lower of cost or net realizable value. The fair value of matured fish is arrived at by averaging the sales price for last fifteen days prior to the year end less cost of selling. Cost of immature fish comprise cost of juvenile, fish feed and medicines and other allocated direct overheads. Biological assets also include nursery plants and stated at fair value less estimated point of sale cost with resulting gain or loss recognized in the statement of comprehensive income. The fair value of nursery plants is determined based on the market price of plants of similar size and nature.
Inventories Inventories are stated at lower of cost or net realizable value, cost is determined using the First-in, First-out (FIFO) basis. Cost includes purchase cost, freight, insurance and other related expenses incurred in bringing the goods to their present condition and location. Net realizable value is based on the normal selling price, less cost expected to be incurred on disposal. Provision is made where necessary for obsolete, slow-moving and damaged items.
End of service benefits obligation
The group provides for employees’ end of service benefits obligation in accordance with the laws applicable in the countries where the group and its subsidiaries are operating its activities.
Accounts payable and accruals
Accounts payable and accruals are recognized for amounts to be paid in the future for goods or services received, whether billed by supplier or not.
-14-
Provisions
Provisions are present obligations (legal or constructive) resulted from past events and recognized when the settlement of the obligations is probable and the amount of those obligations can be estimated reliably. The amount recognized as a provision is the best estimate of the expenditure required to settle the present obligation at the statement of financial position date. Provisions are reviewed and adjusted at each statement of financial position date. If outflows, to settle the provisions, are no longer probable, reversal of the provision is recorded as income. Provisions are only used for the purpose for which they were originally recognized.
Financial liabilities
Debt and equity instruments are classified as either financial liabilities or as equity depending on the substance of the contractual arrangement.
Equity instruments are contracts that evidence residual interest in the assets of an entity after deducting all of its liabilities. Equity instruments are recorded at the proceeds received net of direct issue costs.
Other financial liabilities, including borrowings, are initially measured at fair value, net of transaction costs. Other financial liabilities are subsequently measured at amortized cost using the effective interest method, with interest expense recognized on an effective yield basis.
The effective interest method is a method of calculating the amortized cost of a financial liability and of allocating interest expense over the relevant period. The effective interest rate is the rate that exactly discounts estimated future cash payments through the expected life of the financial liability, or, where appropriate, a shorter period.
Derecognition of financial liabilities
The group derecognizes financial liabilities when, and only when, the group’s obligations are discharged, cancelled or they expire.
Borrowing Costs
Borrowing costs include interest on bank overdrafts and borrowings, amortization of discounts or premiums on borrowings, amortization of ancillary costs incurred in the arrangement of borrowings, and finance charges on finance leases.
Revenue recognition Revenue is measured at the fair value of the consideration received or receivable. Revenue is reduced for estimated customer returns and rebates.
Contract revenue and related costs
Contract revenue is recognized under the percentage of completion method. When the outcome of the contract can be reliably estimated, profit is recognized by reference to the proportion that accumulated costs up to the year-end bear to the estimated total costs of the contract. When the contract is at an early stage and its outcome cannot be reliably estimated, revenue is recognized to the extent of costs incurred up to the year-end, which are considered recoverable. Revenue arising from contract variations and claims is not accounted for unless it is probable that the customer will approve the variation/claim and that the amount of revenue arising from the variation/claim can be measured reliably. In determining the costs incurred up to the year-end, any costs relating to future activity on a contract are excluded and shown as contract work in progress. Losses on contracts are assessed on an individual contract basis and a provision is made for the full amount of the anticipated losses, including any losses relating to future work on a contract, in the period in which the loss is first foreseen.
-15-

The aggregate of the costs incurred and the profit/loss recognized on each contract is compared against the progress billings up to the year-end. Where the sum of the costs incurred and recognized profit or recognized loss exceeds the progress billings, the balance is shown under trade and other receivables as due from customers on contracts. Where the progress billings exceed the sum of costs incurred and recognized profit or recognized loss, the balance is shown under trade payables as due to customers on contracts.
Revenue from services Revenue from services provided is recognized in the accounting period in which the services are rendered.
Lease
Leases are classified as finance leases whenever the terms of the lease transfer substantially all the risks and rewards of ownership to the lessee. All other leases are classified as operating leases. Classification is made at the inception of the lease. Operating lease payments are recognized as an expense on a straight-line basis over the lease term, except where another systematic basis is more representative of the time pattern in which economic benefits from the leased asset are consumed. Contingent rentals arising under operating leases are recognized as an expense in the period in which they are incurred.
Taxation
When applicable, provision is made for current and deferred taxes arising from operating results of subsidiaries that are operating in taxable jurisdictions.
Foreign currencies The individual financial statements of each group company are presented in the currency of the primary economic environment in which the company operates (its functional currency). The consolidated financial statements are presented in Arab Emirates Dirhams (AED) which is the functional currency of the parent company. Transactions in foreign currencies are recorded at the rate ruling at the date of the transaction. Monetary assets and liabilities denominated in foreign currencies are retranslated at the rate of exchange ruling at the statement of financial position date. Non-monetary items that are measured in terms of historical cost in a foreign currency are translated using the exchange rate at the date of the transaction. Non-monetary items that are measured at fair value in foreign currency are translated using the exchange rates at the date when the fair value was determined. Exchange differences arising on translating monetary items in profit or loss are recognized in the consolidated statement of comprehensive income.
Dividend distribution
Dividend distribution to the group’s shareholders is recognized as a liability in group’s financial statements in the period in which the dividends are approved by the group’s shareholders.
Contingent liabilities Contingent liabilities are possible obligations depending on whether some uncertain future events occur, or they are present obligations but payments are not probable or the amounts cannot be measured reliably. Contingent liabilities are not recognized in the consolidated financial statements.
Critical accounting judgments and key sources of estimation uncertainty The estimates and underlying assumptions are reviewed on an ongoing basis. Revisions to accounting estimates are recognized in the year in which the estimate is revised if the revision affects only that period or in the period of the revision and future periods if the revision affects both current and future periods.
-16-
Segments Information
� Business segment The Group’s policy of differentiation between the work segments which are considered as primary segments by taking into consideration the nature of services and product from these segments, production machinery used, organization and administrative hierarchy, and the internal system relating to the internal financial reports about it.
� Geographic segment The Group’s policy of differentiation between the geographical segments which are considered as secondary segments taking into consideration the economic consequences, the related risk for each geographical segment and the ruling regulations of commercial exchange and geographical segments, have been presented according to client locations. Financial information of segments has been presented in net amount after eliminating the internal balances and transactions.
-17-
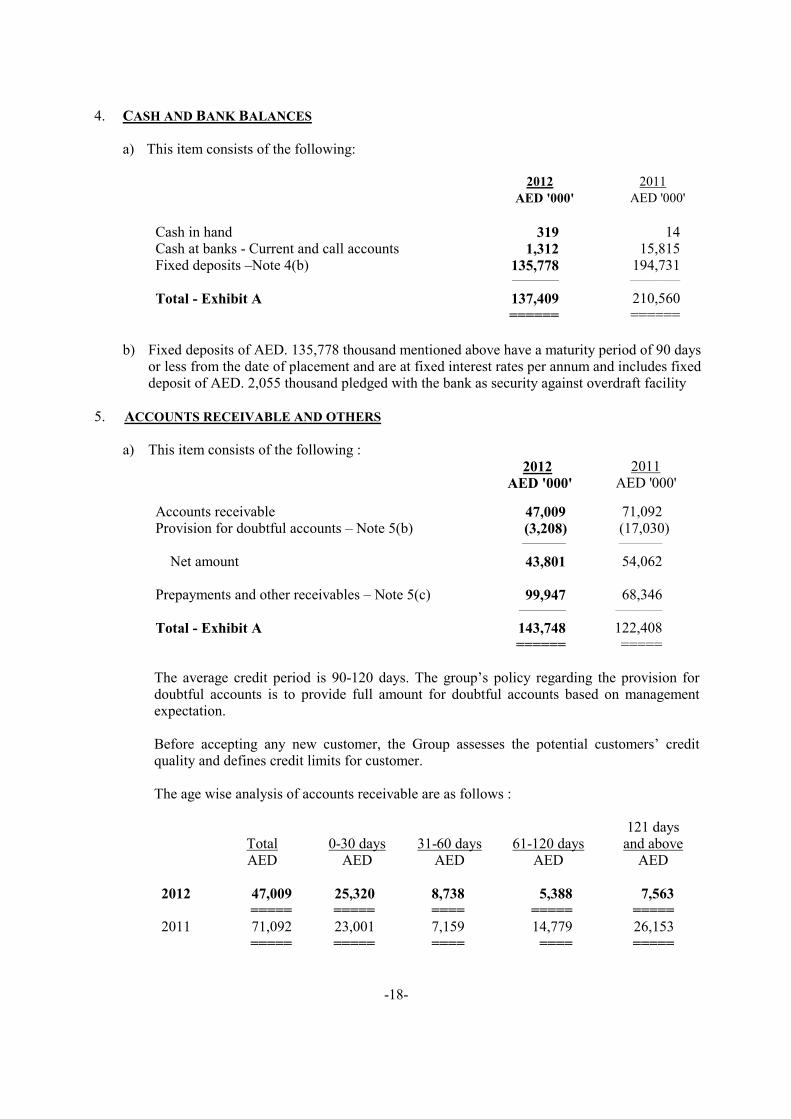
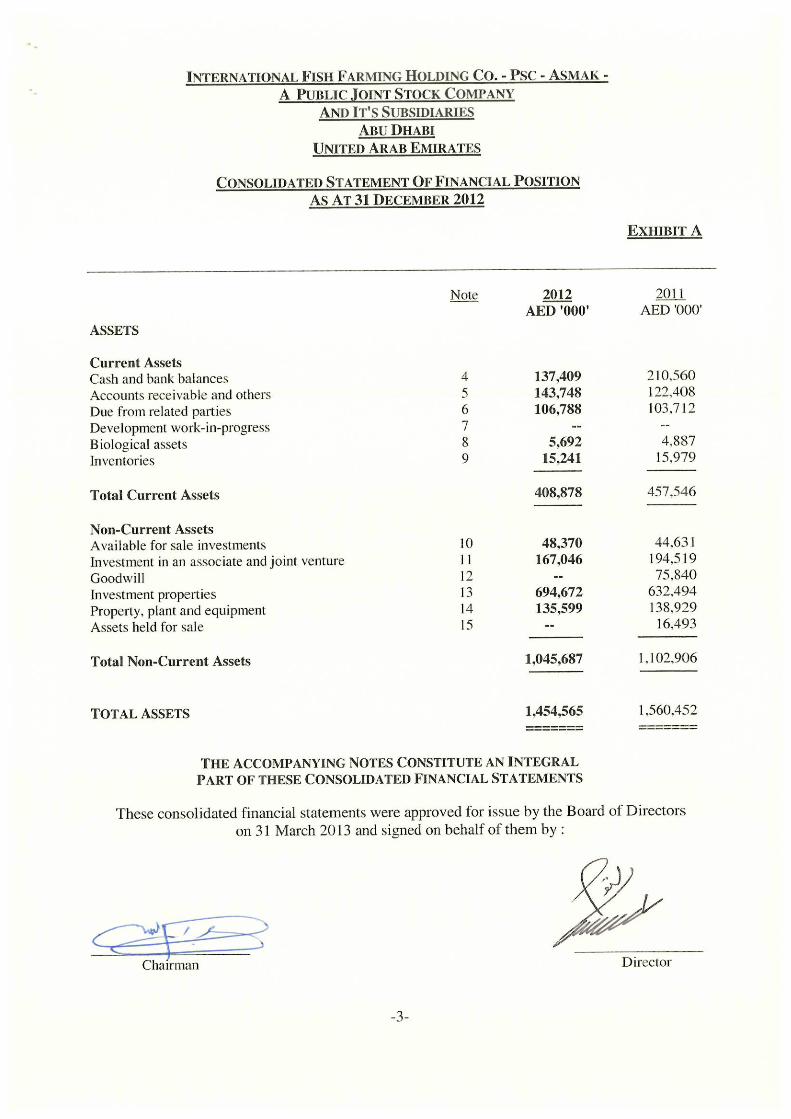
4. CASH AND BANK BALANCES
a) This item consists of the following:
2012 2011
AED '000' AED '000'
Cash in hand 319 14 Cash at banks - Current and call accounts 1,312 15,815 Fixed deposits –Note 4(b) 135,778 194,731
______________ _______________
Total - Exhibit A 137,409 210,560 ====== ======
b) Fixed deposits of AED. 135,778 thousand mentioned above have a maturity period of 90 days
or less from the date of placement and are at fixed interest rates per annum and includes fixed deposit of AED. 2,055 thousand pledged with the bank as security against overdraft facility
5. ACCOUNTS RECEIVABLE AND OTHERS
a) This item consists of the following :
2012 2011 AED '000' AED '000'
Accounts receivable 47,009 71,092 Provision for doubtful accounts – Note 5(b) (3,208) (17,030)
_____________ _____________
Net amount 43,801 54,062 Prepayments and other receivables – Note 5(c) 99,947 68,346
______________ ______________
Total - Exhibit A 143,748 122,408 ====== ===== The average credit period is 90-120 days. The group’s policy regarding the provision for doubtful accounts is to provide full amount for doubtful accounts based on management expectation. Before accepting any new customer, the Group assesses the potential customers’ credit quality and defines credit limits for customer. The age wise analysis of accounts receivable are as follows :
121 days Total 0-30 days 31-60 days 61-120 days and above AED AED AED AED AED
2012 47,009 25,320 8,738 5,388 7,563
===== ===== ==== ===== ===== 2011 71,092 23,001 7,159 14,779 26,153 ===== ===== ==== ==== =====
-18-
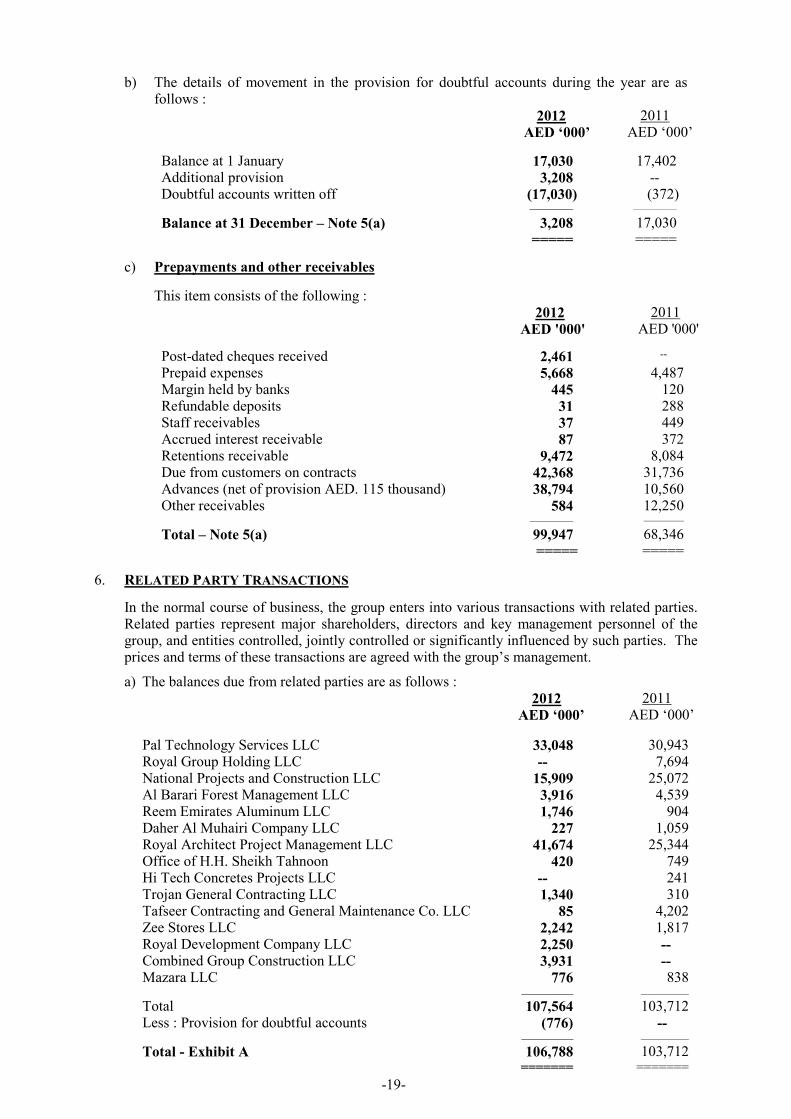
b) The details of movement in the provision for doubtful accounts during the year are as follows : 2012 2011 AED ‘000’ AED ‘000’
Balance at 1 January 17,030 17,402 Additional provision 3,208 -- Doubtful accounts written off (17,030) (372) _____________ _____________
Balance at 31 December – Note 5(a) 3,208 17,030 ===== =====
c) Prepayments and other receivables
This item consists of the following : 2012 2011 AED '000' AED '000'
Post-dated cheques received 2,461 --
Prepaid expenses 5,668 4,487 Margin held by banks 445 120 Refundable deposits 31 288 Staff receivables 37 449 Accrued interest receivable 87 372 Retentions receivable 9,472 8,084 Due from customers on contracts 42,368 31,736 Advances (net of provision AED. 115 thousand) 38,794 10,560 Other receivables 584 12,250 _____________ ____________
Total – Note 5(a) 99,947 68,346 ===== =====
6. RELATED PARTY TRANSACTIONS
In the normal course of business, the group enters into various transactions with related parties. Related parties represent major shareholders, directors and key management personnel of the group, and entities controlled, jointly controlled or significantly influenced by such parties. The prices and terms of these transactions are agreed with the group’s management.
a) The balances due from related parties are as follows : 2012 2011 AED ‘000’ AED ‘000’
Pal Technology Services LLC 33,048 30,943 Royal Group Holding LLC -- 7,694 National Projects and Construction LLC 15,909 25,072 Al Barari Forest Management LLC 3,916 4,539 Reem Emirates Aluminum LLC 1,746 904 Daher Al Muhairi Company LLC 227 1,059 Royal Architect Project Management LLC 41,674 25,344 Office of H.H. Sheikh Tahnoon 420 749 Hi Tech Concretes Projects LLC -- 241 Trojan General Contracting LLC 1,340 310 Tafseer Contracting and General Maintenance Co. LLC 85 4,202 Zee Stores LLC 2,242 1,817 Royal Development Company LLC 2,250 -- Combined Group Construction LLC 3,931 -- Mazara LLC 776 838 _____________ ____________
Total 107,564 103,712 Less : Provision for doubtful accounts (776) -- _____________ ____________
Total - Exhibit A 106,788 103,712 ======= =======
-19-

b) The balances due to related parties are as follows : 2012 2011 AED ‘000’ AED ‘000’
Royal Group Holdings LLC 2,038 -- Tripods Contracting and General Maintenance LLC 1,984 1,984 Seven Emirates LLC 1,500 1,500 Reem Building Materials LLC 120 759 Vision Furniture and Decoration Factory LLC 114 209 Hi-Tech Concrete Projects LLC 4,052 -- Royal Technology Solutions LLC 97 -- Phoenix Timber Factory LLC 134 108 Al Jaraf Travel and Logistic LLC 447 261 Reem Ready Mix Co. LLC 910 39 Infinity TV 158 158 Awal Fishing Co. WLL 978 444 Al Tamouh Investment LLC 66,646 81,757 Others 21 157 ___________ ___________
Total - Exhibit A 79,199 87,376 ====== ======
c) i) The details of loans from related parties are as follows : 2012 2011 AED ‘000’ AED ‘000’
Royal Group - Corporate Office - Note 6(c)(ii) 9,213 8,615 H.H. Sheikh Tahnoon Bin Zayed Al Nahyan-Note 6(c)(iii) 250,000 300,000 ____________ _____________
Total 259,213 308,615 ======= =======
Current Portion - Exhibit A 59,213 108,615
Non-current portion - Exhibit A 200,000 200,000 _____________ _____________
Total 259,213 308,615 ======= =======
ii) The loan granted from Royal Group of AED. 9,213 thousand (2011 : AED. 8,615 thousand) mentioned above is at an agreed interest rate and is repayable in a single installment on 30 June 2013.
iii) The loan of AED. 300,000 thousand granted from H.H. Sheikh Tahnoon Bin Zayed Al Nahyan carries interest at a rate of 8.5% per annum for first 6 months, thereafter reset every 6 months. The loan is repayable within six years by repaying AED. 50,000 thousand each year and secured by a registered first degree mortgage over 4 plots of land mentioned in Note 13(c)(iii).
d) The group entered into the following significant transactions and amounts with related
parties during the year : 2012 2011 AED ‘000’ AED ‘000’
Sales of fish and products 6,107 5,566 Loans -- 300,000 Purchase of fish and products 2,480 1,260 Issue of convertible loan notes -- 420,000 Interest on loans 21,911 24,013 Repayment of loan 50,000 --
-20-
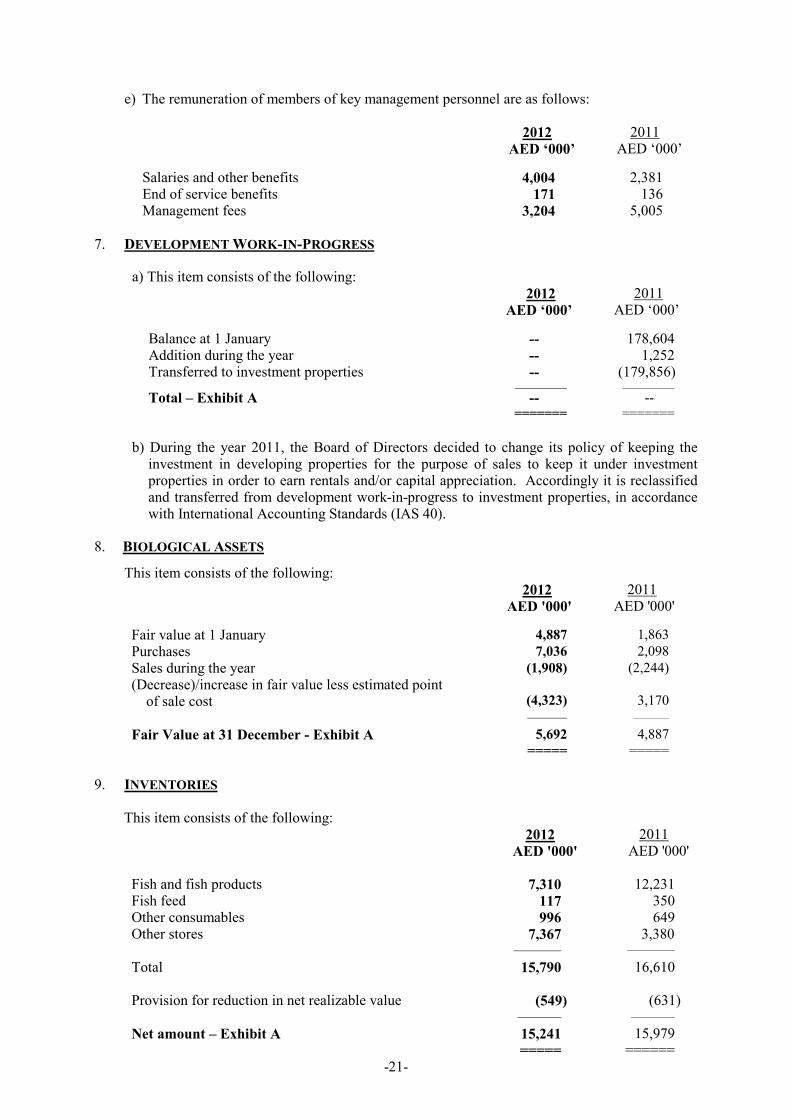
e) The remuneration of members of key management personnel are as follows:
2012 2011 AED ‘000’ AED ‘000’
Salaries and other benefits 4,004 2,381 End of service benefits 171 136 Management fees 3,204 5,005
7. DEVELOPMENT WORK-IN-PROGRESS
a) This item consists of the following: 2012 2011 AED ‘000’ AED ‘000’
Balance at 1 January -- 178,604 Addition during the year -- 1,252 Transferred to investment properties -- (179,856) _____________ _____________
Total – Exhibit A -- -- ======= =======
b) During the year 2011, the Board of Directors decided to change its policy of keeping the
investment in developing properties for the purpose of sales to keep it under investment properties in order to earn rentals and/or capital appreciation. Accordingly it is reclassified and transferred from development work-in-progress to investment properties, in accordance with International Accounting Standards (IAS 40).
8. BIOLOGICAL ASSETS
This item consists of the following: 2012 2011 AED '000' AED '000'
Fair value at 1 January 4,887 1,863
Purchases 7,036 2,098
Sales during the year (1,908) (2,244)
(Decrease)/increase in fair value less estimated point of sale cost
(4,323)
3,170
__________ _________
Fair Value at 31 December - Exhibit A 5,692 4,887
===== =====
9. INVENTORIES
This item consists of the following: 2012 2011 AED '000' AED '000'
Fish and fish products 7,310 12,231 Fish feed 117 350 Other consumables 996 649 Other stores 7,367 3,380
____________ ____________
Total 15,790 16,610 Provision for reduction in net realizable value (549) (631)
___________ ___________
Net amount – Exhibit A 15,241 15,979 ===== ======
-21-

10. AVAILABLE FOR SALE INVESTMENTS
This item consists of the following: 2012 2011 AED '000' AED '000'
Fair value at 1 January 44,631 45,546
Change in fair value 3,739 (915)
___________ ___________
Fair Value at 31 December - Exhibit A 48,370 44,631
===== =====
Bifurcation of available for sale investments on the basis of geographical area is as follows:
2012 2011 AED '000' AED '000'
Local 48,194 44,496 Regional 176 135
__________ __________
Total 48,370 44,631
===== =====
Available for sale investments include investment of AED. 508 thousand registered in the name of related parties and held on trust for the benefit of the group.
Available for sale investments amounting AED. 48,370 thousand mentioned above include available for sale investment of AED. 31,245 thousand in unlisted equity securities which are measured at fair value by independent valuer.
11. INVESTMENTS IN AN ASSOCIATE AND JOINT VENTURE
This item consists of the following : 2012 2011 AED ‘000’ AED ‘000’
Balance at 1 January 194,519 202,306 Share of the group from (loss)/profit after acquisitions (8,058) 7,706 Dividend received during the year (14,195) (15,493) Impairment of investment in associates (5,220) --
_____________ ____________
Balance at 31 December – Exhibit A 167,046 194,519 ======= =======
The group’s share of the results of its associates and joint ventures are as follows :
Profit % of Assets Liabilities Revenues /(loss) Interest held
AED ‘000’ AED ‘000’ AED ‘000’ AED ‘000’ %
At 31 December 2012 :
Associates
Abu Dhabi Mountain Gate
Property Investment L.L.C. 36,273 8,321 31,344 9,669 40
Tafseer Contracting and General
Maintenance company LLC 373,615 443,227 397,262 (85,682) 20
Awal Fishing Co. WLL 3,010 416 2,720 (528) 50
Joint Ventures
Progressive Real Estate Development LLC 41,972 12,750 24,228 9,353 60
Lazio Real Estate Investment LLC 5,094 208 2,110 (277) 60
-22-

At 31 December 2011 :
Associates
Abu Dhabi Mountain Gate Property Investment L.L.C. 44,564 13,881 23,085 5,534 40
Tafseer Contracting and General
Maintenance company LLC 453,634 433,575 340,595 (20,836) 20
Awal Fishing Co. WLL 3,746 625 3,636 282 50
Joint Ventures
Progressive Real Estate Development LLC 51,672 16,302 31,156 12,230 60
Lazio Real Estate Investment LLC 6,959 218 5,566 3,634 60
12. GOODWILL
a) The details of this item are as follows : 2012 2011 AED ‘000’ AED ‘000’ Goodwill on Acquisition of :
Abu Dhabi Land General Contracting LLC- Abu Dhabi 17,202 17,202 Gulf Dunes Landscape and Agricultural Services LLC - Abu Dhabi 58,638 58,638 Impairment of goodwill (75,840) --
___________ ___________
Fair value as at 31 December - Exhibit A -- 75,840 ===== =====
b) The Board of Directors have subjected the goodwill for an impairment test and have concluded that the goodwill to be impaired completely.
13. INVESTMENT PROPERTIES
a) This item consists of the following: 2012 2011 AED ‘000’ AED ‘000’
Real Estate - Note 13(b) 425 531 Investment properties under development - Note 13(c) 694,247 631,963 _____________ _____________
Total - Exhibit A 694,672 632,494 ====== ======
b) Real Estate : 2012 2011 AED '000' AED '000' Cost :
Balance as at 1 January 850 850 _______ _______
Balance as at 31 December 850 850
______ _______
Accumulated Depreciation :
Balance at 1 January 319 213
Charged for the year 106 106 _______ _______
Balance as at 31 December 425 319
_______ _______
Net amount - Note 13 (a) 425 531
=== ====
As at 31 December 2012, this item represent a building in Reem Island on land leased from Tamouh Investments LLC. The property is being depreciated over the life of the lease. The fair value of this real estate could not be determined as the market was not readily available.
-23-
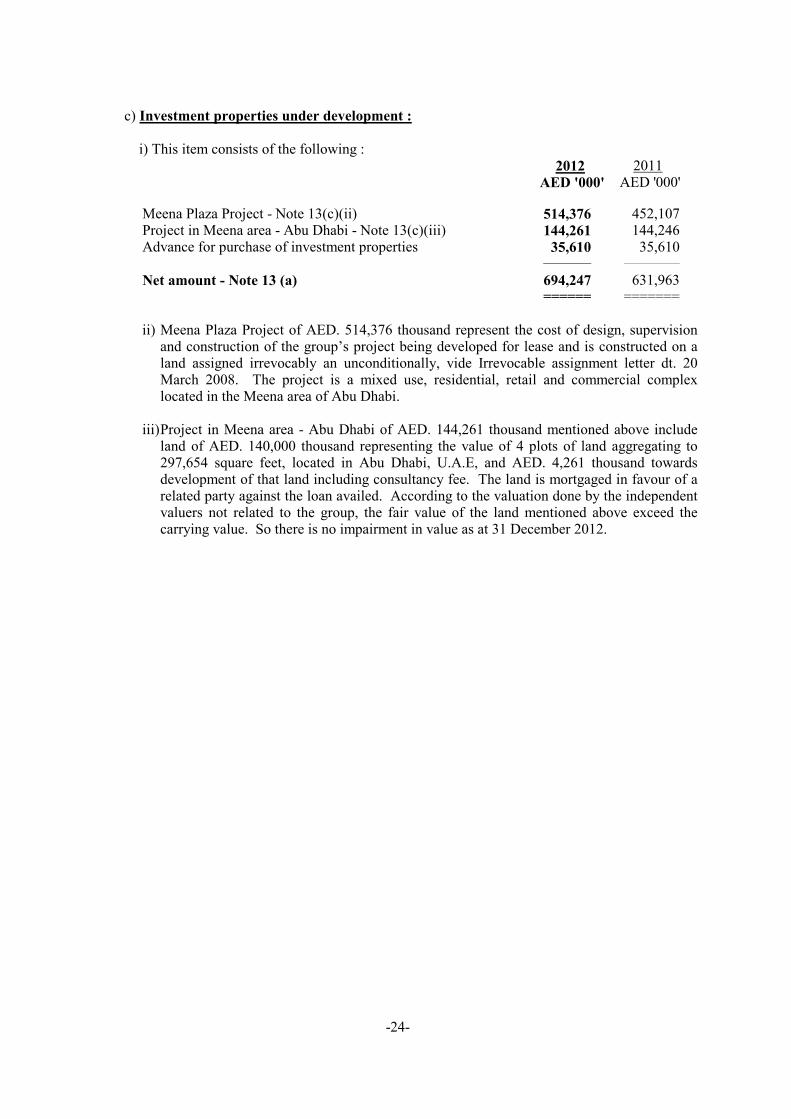
c) Investment properties under development :
i) This item consists of the following : 2012 2011 AED '000' AED '000'
Meena Plaza Project - Note 13(c)(ii) 514,376 452,107 Project in Meena area - Abu Dhabi - Note 13(c)(iii) 144,261 144,246 Advance for purchase of investment properties 35,610 35,610
____________ ______________
Net amount - Note 13 (a) 694,247 631,963
====== =======
ii) Meena Plaza Project of AED. 514,376 thousand represent the cost of design, supervision
and construction of the group’s project being developed for lease and is constructed on a land assigned irrevocably an unconditionally, vide Irrevocable assignment letter dt. 20 March 2008. The project is a mixed use, residential, retail and commercial complex located in the Meena area of Abu Dhabi.
iii) Project in Meena area - Abu Dhabi of AED. 144,261 thousand mentioned above include
land of AED. 140,000 thousand representing the value of 4 plots of land aggregating to 297,654 square feet, located in Abu Dhabi, U.A.E, and AED. 4,261 thousand towards development of that land including consultancy fee. The land is mortgaged in favour of a related party against the loan availed. According to the valuation done by the independent valuers not related to the group, the fair value of the land mentioned above exceed the carrying value. So there is no impairment in value as at 31 December 2012.
-24-
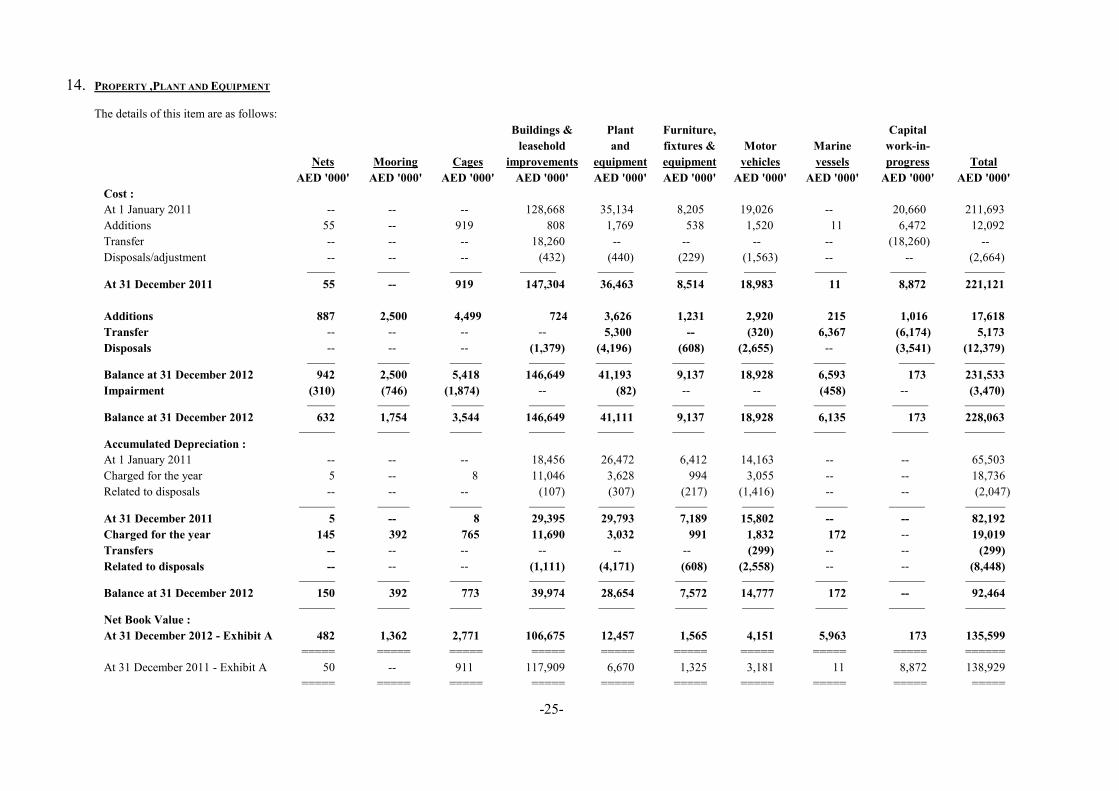
14. PROPERTY ,PLANT AND EQUIPMENT
The details of this item are as follows:
Buildings & Plant Furniture, Capital
leasehold and fixtures & Motor Marine work-in-
Nets Mooring Cages improvements equipment equipment vehicles vessels progress Total
AED '000' AED '000' AED '000' AED '000' AED '000' AED '000' AED '000' AED '000' AED '000' AED '000'
Cost :
At 1 January 2011 -- -- -- 128,668 35,134 8,205 19,026 -- 20,660 211,693
Additions 55 -- 919 808 1,769 538 1,520 11 6,472 12,092
Transfer -- -- -- 18,260 -- -- -- -- (18,260) --
Disposals/adjustment -- -- -- (432) (440) (229) (1,563) -- -- (2,664) _______ ________ ________ _________ _________ ________ ________ ________ _________ __________ At 31 December 2011 55 -- 919 147,304 36,463 8,514 18,983 11 8,872 221,121
Additions 887 2,500 4,499 724 3,626 1,231 2,920 215 1,016 17,618
Transfer -- -- -- -- 5,300 -- (320) 6,367 (6,174) 5,173
Disposals -- -- -- (1,379) (4,196) (608) (2,655) -- (3,541) (12,379) _______ ________ ________ _________ _________ ________ ________ ________ _________ __________ Balance at 31 December 2012 942 2,500 5,418 146,649 41,193 9,137 18,928 6,593 173 231,533
Impairment (310) (746) (1,874) -- (82) -- -- (458) -- (3,470) _______ ________ ________ _________ _________ ________ ________ ________ _________ __________ Balance at 31 December 2012 632 1,754 3,544 146,649 41,111 9,137 18,928 6,135 173 228,063 _________ ________ ________ _________ _________ ________ ________ ________ _________ __________ Accumulated Depreciation :
At 1 January 2011 -- -- -- 18,456 26,472 6,412 14,163 -- -- 65,503
Charged for the year 5 -- 8 11,046 3,628 994 3,055 -- -- 18,736
Related to disposals -- -- -- (107) (307) (217) (1,416) -- -- (2,047) _________ ________ ________ _________ _________ ________ ________ ________ _________ __________ At 31 December 2011 5 -- 8 29,395 29,793 7,189 15,802 -- -- 82,192
Charged for the year 145 392 765 11,690 3,032 991 1,832 172 -- 19,019
Transfers -- -- -- -- -- -- (299) -- -- (299)
Related to disposals -- -- -- (1,111) (4,171) (608) (2,558) -- -- (8,448) _________ ________ ________ _________ _________ ________ ________ ________ _________ __________ Balance at 31 December 2012 150 392 773 39,974 28,654 7,572 14,777 172 -- 92,464 _________ ________ ________ _________ _________ ________ ________ ________ _________ __________ Net Book Value :
At 31 December 2012 - Exhibit A 482 1,362 2,771 106,675 12,457 1,565 4,151 5,963 173 135,599
===== ===== ===== ===== ===== ===== ===== ===== ===== ======
At 31 December 2011 - Exhibit A 50 -- 911 117,909 6,670 1,325 3,181 11 8,872 138,929
===== ===== ===== ===== ===== ===== ===== ===== ===== =====
-25-
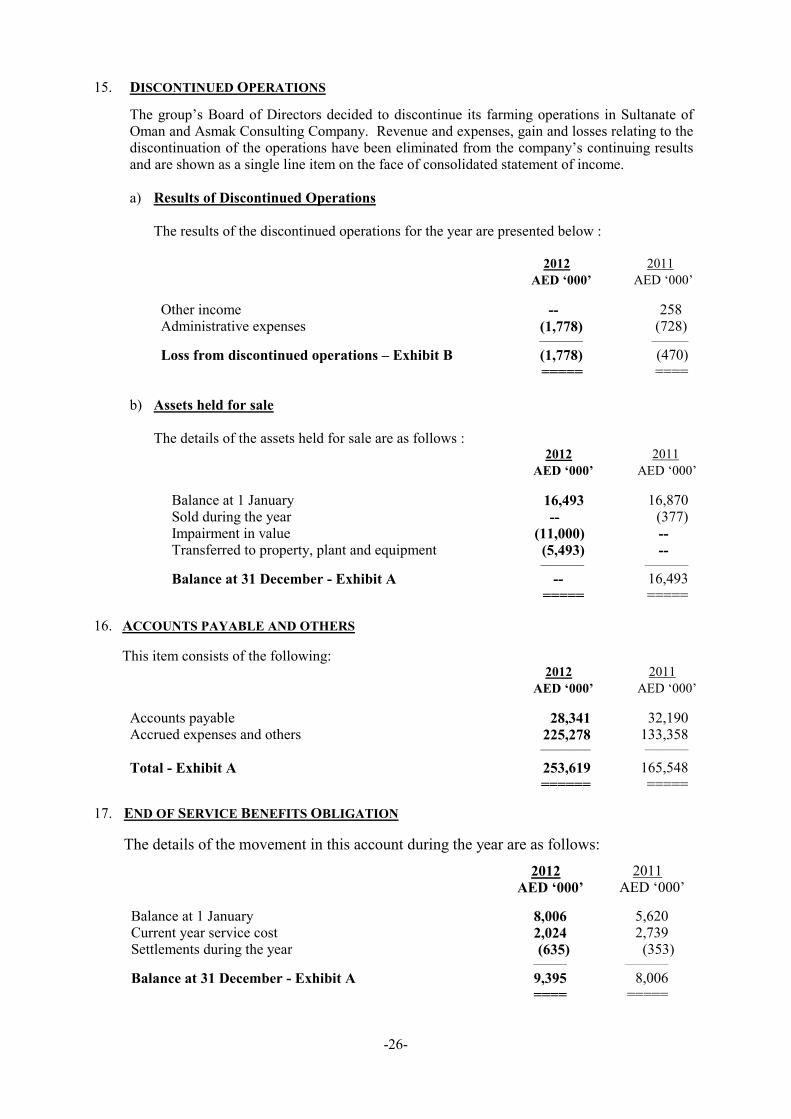
15. DISCONTINUED OPERATIONS
The group’s Board of Directors decided to discontinue its farming operations in Sultanate of Oman and Asmak Consulting Company. Revenue and expenses, gain and losses relating to the discontinuation of the operations have been eliminated from the company’s continuing results and are shown as a single line item on the face of consolidated statement of income.
a) Results of Discontinued Operations
The results of the discontinued operations for the year are presented below :
2012 2011
AED ‘000’ AED ‘000’
Other income -- 258 Administrative expenses (1,778) (728) _____________ ___________
Loss from discontinued operations – Exhibit B (1,778) (470) ===== ====
b) Assets held for sale
The details of the assets held for sale are as follows : 2012 2011
AED ‘000’ AED ‘000’
Balance at 1 January 16,493 16,870 Sold during the year -- (377) Impairment in value (11,000) -- Transferred to property, plant and equipment (5,493) -- _____________ _____________
Balance at 31 December - Exhibit A -- 16,493
===== =====
16. ACCOUNTS PAYABLE AND OTHERS
This item consists of the following: 2012 2011
AED ‘000’ AED ‘000’
Accounts payable 28,341 32,190 Accrued expenses and others 225,278 133,358
_______________ _____________
Total - Exhibit A 253,619 165,548 ====== =====
17. END OF SERVICE BENEFITS OBLIGATION
The details of the movement in this account during the year are as follows:
2012 2011 AED ‘000’ AED ‘000’
Balance at 1 January 8,006 5,620 Current year service cost 2,024 2,739 Settlements during the year (635) (353) __________ _____________
Balance at 31 December - Exhibit A 9,395 8,006 ==== =====
-26-
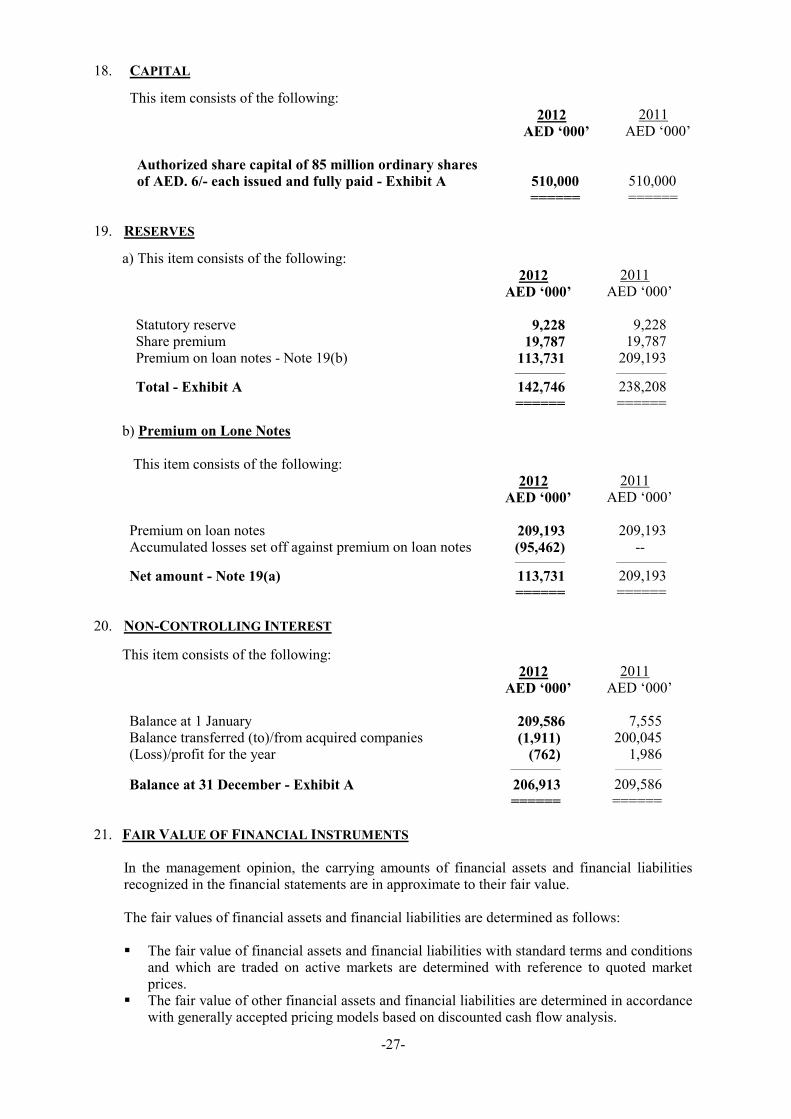
18. CAPITAL
This item consists of the following: 2012 2011 AED ‘000’ AED ‘000’
Authorized share capital of 85 million ordinary shares
of AED. 6/- each issued and fully paid - Exhibit A 510,000 510,000
====== ======
19. RESERVES
a) This item consists of the following: 2012 2011 AED ‘000’ AED ‘000’
Statutory reserve 9,228 9,228 Share premium 19,787 19,787 Premium on loan notes - Note 19(b) 113,731 209,193 _______________ _______________
Total - Exhibit A 142,746 238,208 ====== ======
b) Premium on Lone Notes
This item consists of the following: 2012 2011 AED ‘000’ AED ‘000’
Premium on loan notes 209,193 209,193 Accumulated losses set off against premium on loan notes (95,462) -- _______________ _______________
Net amount - Note 19(a) 113,731 209,193 ====== ======
20. NON-CONTROLLING INTEREST
This item consists of the following: 2012 2011 AED ‘000’ AED ‘000’
Balance at 1 January 209,586 7,555 Balance transferred (to)/from acquired companies (1,911) 200,045 (Loss)/profit for the year (762) 1,986 _______________ ______________
Balance at 31 December - Exhibit A 206,913 209,586 ====== ======
21. FAIR VALUE OF FINANCIAL INSTRUMENTS
In the management opinion, the carrying amounts of financial assets and financial liabilities recognized in the financial statements are in approximate to their fair value. The fair values of financial assets and financial liabilities are determined as follows:
� The fair value of financial assets and financial liabilities with standard terms and conditions
and which are traded on active markets are determined with reference to quoted market prices.
� The fair value of other financial assets and financial liabilities are determined in accordance with generally accepted pricing models based on discounted cash flow analysis.
-27-
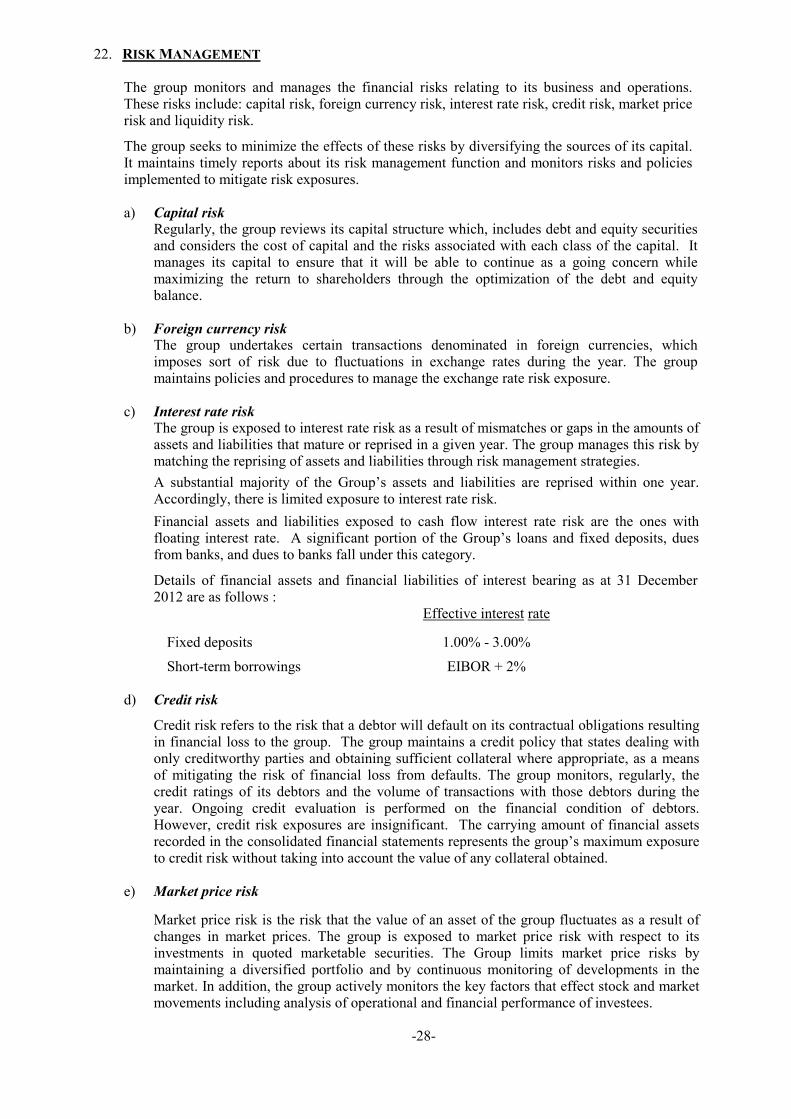
22. RISK MANAGEMENT
The group monitors and manages the financial risks relating to its business and operations. These risks include: capital risk, foreign currency risk, interest rate risk, credit risk, market price risk and liquidity risk.
The group seeks to minimize the effects of these risks by diversifying the sources of its capital. It maintains timely reports about its risk management function and monitors risks and policies implemented to mitigate risk exposures.
a) Capital risk Regularly, the group reviews its capital structure which, includes debt and equity securities and considers the cost of capital and the risks associated with each class of the capital. It manages its capital to ensure that it will be able to continue as a going concern while maximizing the return to shareholders through the optimization of the debt and equity balance.
b) Foreign currency risk The group undertakes certain transactions denominated in foreign currencies, which imposes sort of risk due to fluctuations in exchange rates during the year. The group maintains policies and procedures to manage the exchange rate risk exposure.
c) Interest rate risk The group is exposed to interest rate risk as a result of mismatches or gaps in the amounts of assets and liabilities that mature or reprised in a given year. The group manages this risk by matching the reprising of assets and liabilities through risk management strategies.
A substantial majority of the Group’s assets and liabilities are reprised within one year. Accordingly, there is limited exposure to interest rate risk.
Financial assets and liabilities exposed to cash flow interest rate risk are the ones with floating interest rate. A significant portion of the Group’s loans and fixed deposits, dues from banks, and dues to banks fall under this category.
Details of financial assets and financial liabilities of interest bearing as at 31 December 2012 are as follows :
Effective interest rate
Fixed deposits 1.00% - 3.00%
Short-term borrowings EIBOR + 2%
d) Credit risk
Credit risk refers to the risk that a debtor will default on its contractual obligations resulting in financial loss to the group. The group maintains a credit policy that states dealing with only creditworthy parties and obtaining sufficient collateral where appropriate, as a means of mitigating the risk of financial loss from defaults. The group monitors, regularly, the credit ratings of its debtors and the volume of transactions with those debtors during the year. Ongoing credit evaluation is performed on the financial condition of debtors. However, credit risk exposures are insignificant. The carrying amount of financial assets recorded in the consolidated financial statements represents the group’s maximum exposure to credit risk without taking into account the value of any collateral obtained.
e) Market price risk
Market price risk is the risk that the value of an asset of the group fluctuates as a result of changes in market prices. The group is exposed to market price risk with respect to its investments in quoted marketable securities. The Group limits market price risks by maintaining a diversified portfolio and by continuous monitoring of developments in the market. In addition, the group actively monitors the key factors that effect stock and market movements including analysis of operational and financial performance of investees.
-28-
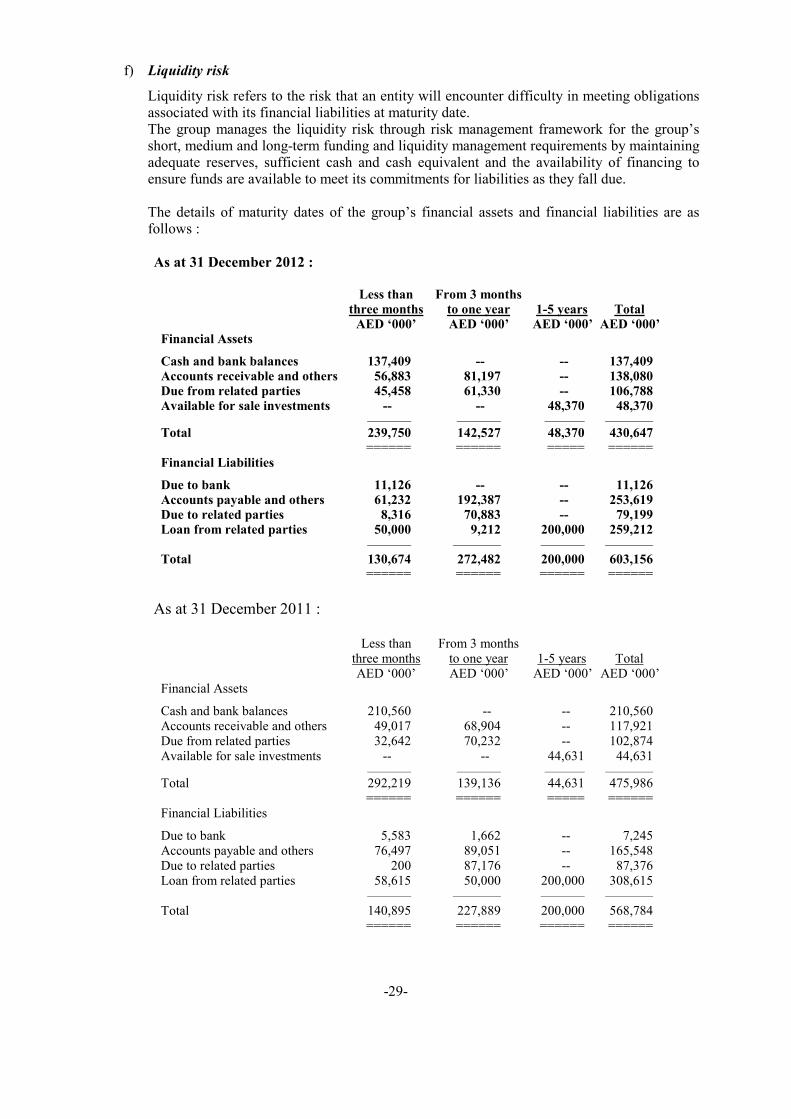
f) Liquidity risk
Liquidity risk refers to the risk that an entity will encounter difficulty in meeting obligations associated with its financial liabilities at maturity date. The group manages the liquidity risk through risk management framework for the group’s short, medium and long-term funding and liquidity management requirements by maintaining adequate reserves, sufficient cash and cash equivalent and the availability of financing to ensure funds are available to meet its commitments for liabilities as they fall due. The details of maturity dates of the group’s financial assets and financial liabilities are as follows :
As at 31 December 2012 :
Less than From 3 months
three months to one year 1-5 years Total
AED ‘000’ AED ‘000’ AED ‘000’ AED ‘000’
Financial Assets
Cash and bank balances 137,409 -- -- 137,409
Accounts receivable and others 56,883 81,197 -- 138,080
Due from related parties 45,458 61,330 -- 106,788
Available for sale investments -- -- 48,370 48,370 ___________ ___________ __________ ____________
Total 239,750 142,527 48,370 430,647
====== ====== ===== ======
Financial Liabilities
Due to bank 11,126 -- -- 11,126
Accounts payable and others 61,232 192,387 -- 253,619
Due to related parties 8,316 70,883 -- 79,199
Loan from related parties 50,000 9,212 200,000 259,212
___________ ____________ ___________ ____________
Total 130,674 272,482 200,000 603,156
====== ====== ====== ======
As at 31 December 2011 :
Less than From 3 months three months to one year 1-5 years Total AED ‘000’ AED ‘000’ AED ‘000’ AED ‘000’ Financial Assets
Cash and bank balances 210,560 -- -- 210,560 Accounts receivable and others 49,017 68,904 -- 117,921 Due from related parties 32,642 70,232 -- 102,874 Available for sale investments -- -- 44,631 44,631 ___________ ___________ __________ ____________
Total 292,219 139,136 44,631 475,986 ====== ====== ===== ====== Financial Liabilities
Due to bank 5,583 1,662 -- 7,245 Accounts payable and others 76,497 89,051 -- 165,548 Due to related parties 200 87,176 -- 87,376 Loan from related parties 58,615 50,000 200,000 308,615 ___________ ____________ ___________ ____________
Total 140,895 227,889 200,000 568,784 ====== ====== ====== ======
-29-
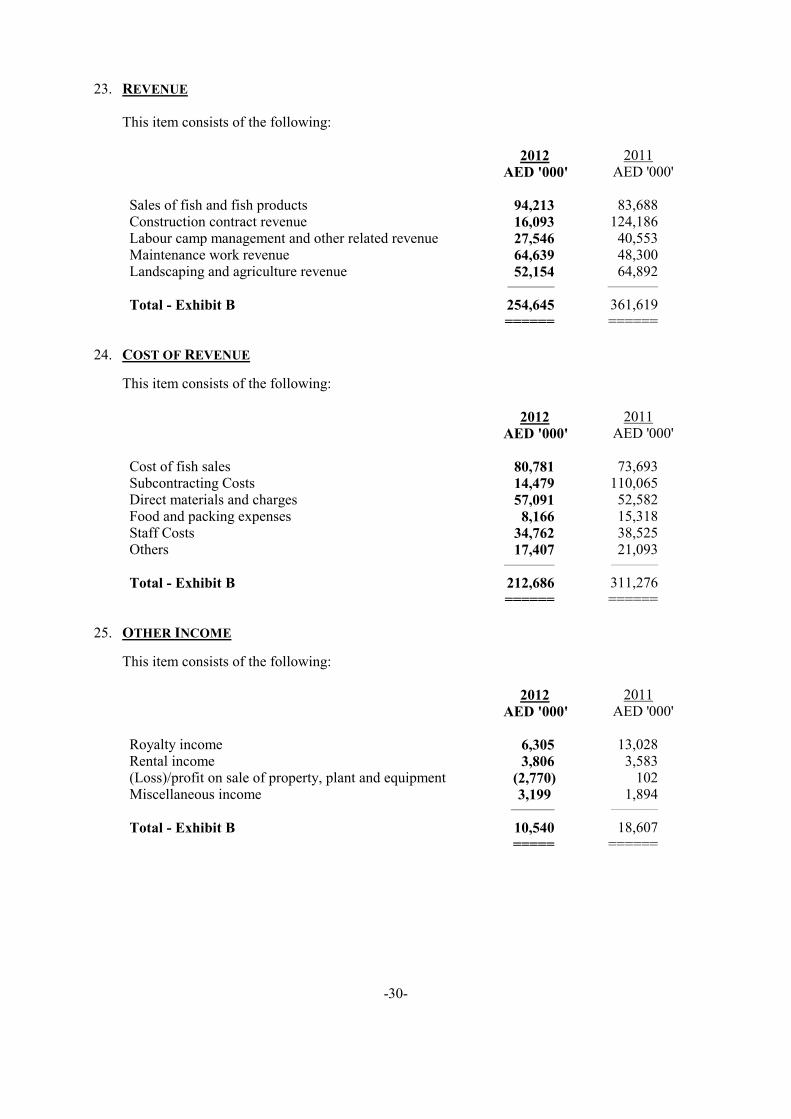
23. REVENUE
This item consists of the following: 2012 2011 AED '000' AED '000'
Sales of fish and fish products 94,213 83,688 Construction contract revenue 16,093 124,186 Labour camp management and other related revenue 27,546 40,553 Maintenance work revenue 64,639 48,300 Landscaping and agriculture revenue 52,154 64,892
______________ _______________
Total - Exhibit B 254,645 361,619 ====== ======
24. COST OF REVENUE
This item consists of the following: 2012 2011 AED '000' AED '000'
Cost of fish sales 80,781 73,693 Subcontracting Costs 14,479 110,065 Direct materials and charges 57,091 52,582 Food and packing expenses 8,166 15,318 Staff Costs 34,762 38,525 Others 17,407 21,093
_______________ ______________
Total - Exhibit B 212,686 311,276 ====== ======
25. OTHER INCOME
This item consists of the following: 2012 2011 AED '000' AED '000'
Royalty income 6,305 13,028 Rental income 3,806 3,583 (Loss)/profit on sale of property, plant and equipment (2,770) 102 Miscellaneous income 3,199 1,894
_____________ ______________
Total - Exhibit B 10,540 18,607 ===== ======
-30-

26. ADMINISTRATIVE EXPENSES
This item consists of the following: 2012 2011 AED '000' AED '000'
Salaries and wages 24,069 15,999 Depreciation 4,475 2,866 Freight and direct sales expenses 998 927 Rent, utilities and communication 3,498 1,641 Travelling expenses 188 106 Insurance expenses 603 484 Sales promotion & marketing 1,062 211 Inventory disposals 3,971 94 Govt. fees, professional & legal expenses 2,490 2,600 Repairs and maintenance 649 473 AGM & Share listing expenses 104 120 Management fees 3,204 5,005 Capital work-in-progress written off 1,481 -- Bad & doubtful accounts 4,107 -- Other expenses 13,300 6,620
____________ ____________
Total - Exhibit B 64,199 37,146 ===== =====
27. INVESTMENTS INCOME
This item consists of the following: 2012 2011 AED '000' AED '000'
Interest and dividends income 2,780 4,883 Share of (loss)/profit from investment in an associate (8,058) 7,706 _____________ _____________
Net Amount – Exhibit B (5,278) 12,589 ===== =====
28. IMPAIRMENT
This item consists of the following: 2012 2011 AED '000' AED '000'
Impairment of goodwill 75,840 -- Impairment of property, plant and equipment 3,470 -- Impairment of investment in associate 5,220 -- Impairment of assets held for sale 11,000 -- _____________ _____________
Total – Exhibit B 95,530 -- ===== =====
-31-
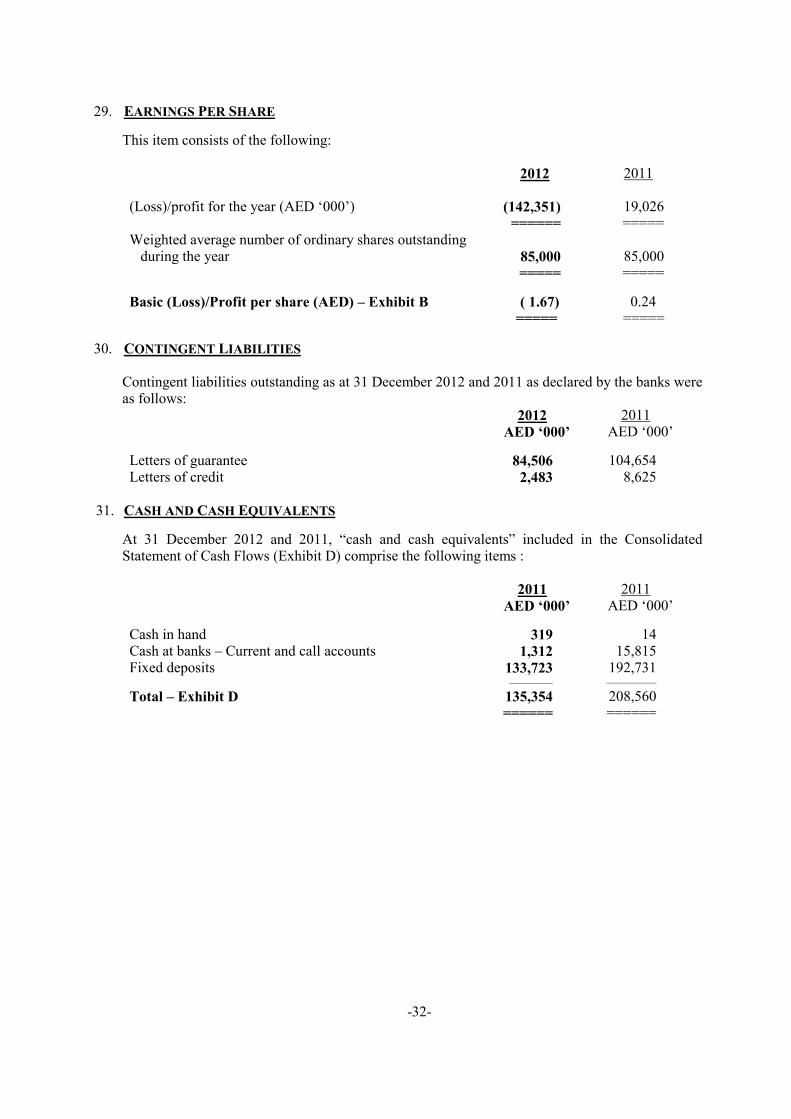
29. EARNINGS PER SHARE
This item consists of the following: 2012 2011
(Loss)/profit for the year (AED ‘000’) (142,351) 19,026 ====== ===== Weighted average number of ordinary shares outstanding during the year 85,000 85,000 ===== =====
Basic (Loss)/Profit per share (AED) – Exhibit B ( 1.67) 0.24 ===== =====
30. CONTINGENT LIABILITIES
Contingent liabilities outstanding as at 31 December 2012 and 2011 as declared by the banks were as follows: 2012 2011 AED ‘000’ AED ‘000’
Letters of guarantee 84,506 104,654 Letters of credit 2,483 8,625
31. CASH AND CASH EQUIVALENTS
At 31 December 2012 and 2011, “cash and cash equivalents” included in the Consolidated Statement of Cash Flows (Exhibit D) comprise the following items : 2011 2011 AED ‘000’ AED ‘000’
Cash in hand 319 14 Cash at banks – Current and call accounts 1,312 15,815 Fixed deposits 133,723 192,731 _____________ _______________
Total – Exhibit D 135,354 208,560 ====== ======
-32-
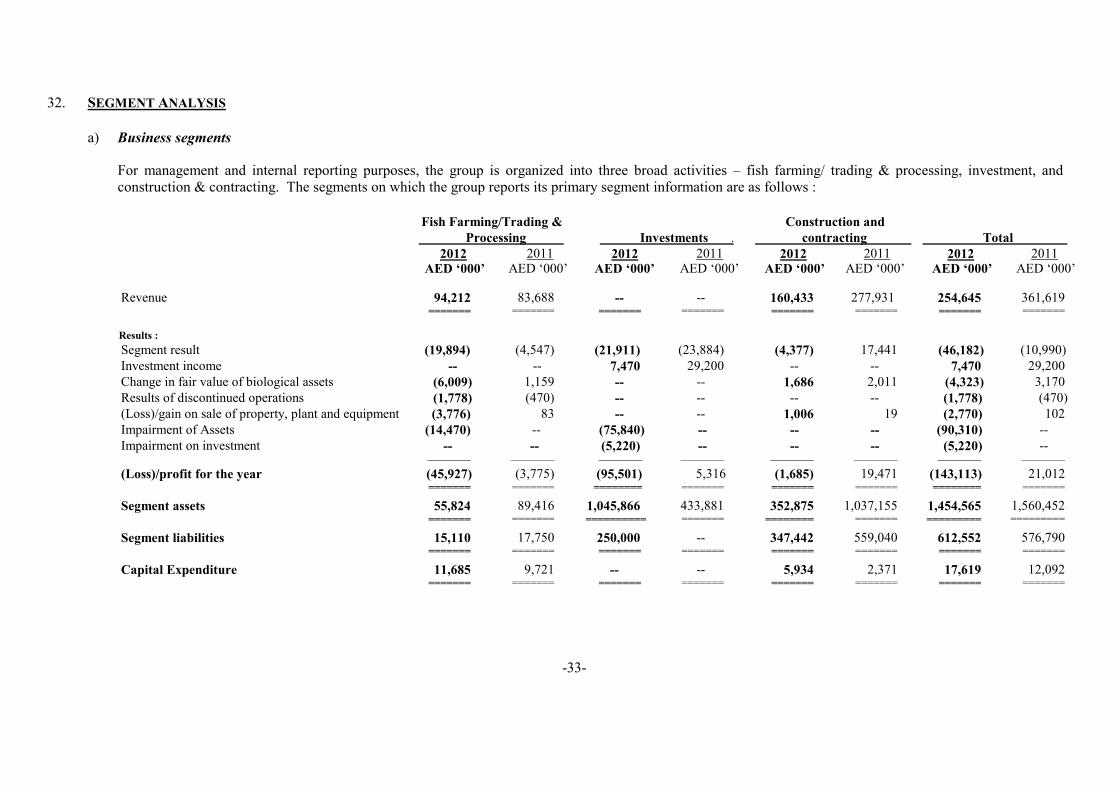
32. SEGMENT ANALYSIS
a) Business segments
For management and internal reporting purposes, the group is organized into three broad activities – fish farming/ trading & processing, investment, and construction & contracting. The segments on which the group reports its primary segment information are as follows :
Fish Farming/Trading &
Processing .
Investments .
Construction and
contracting .
Total .
2012 2011 2012 2011 2012 2011 2012 2011
AED ‘000’ AED ‘000’ AED ‘000’ AED ‘000’ AED ‘000’ AED ‘000’ AED ‘000’ AED ‘000’
Revenue 94,212 83,688 -- -- 160,433 277,931 254,645 361,619 ======= ======= ======= ======= ======= ======= ======= =======
Results :
Segment result (19,894) (4,547) (21,911) (23,884) (4,377) 17,441 (46,182) (10,990)
Investment income -- -- 7,470 29,200 -- -- 7,470 29,200
Change in fair value of biological assets (6,009) 1,159 -- -- 1,686 2,011 (4,323) 3,170
Results of discontinued operations (1,778) (470) -- -- -- -- (1,778) (470)
(Loss)/gain on sale of property, plant and equipment (3,776) 83 -- -- 1,006 19 (2,770) 102
Impairment of Assets (14,470) -- (75,840) -- -- -- (90,310) --
Impairment on investment -- -- (5,220) -- -- -- (5,220) -- _____________ _____________ _____________ _____________ _____________ _____________ _____________ _____________
(Loss)/profit for the year (45,927) (3,775) (95,501) 5,316 (1,685) 19,471 (143,113) 21,012
======= ======= ======== ======= ======= ======= ======== =======
Segment assets 55,824 89,416 1,045,866 433,881 352,875 1,037,155 1,454,565 1,560,452
======= ======= ========== ======= ======== ======= ========= =========
Segment liabilities 15,110 17,750 250,000 -- 347,442 559,040 612,552 576,790
======= ======= ======= ======= ======= ======= ======= =======
Capital Expenditure 11,685 9,721 -- -- 5,934 2,371 17,619 12,092
======= ======= ======= ======= ======= ======= ======= =======
-33-
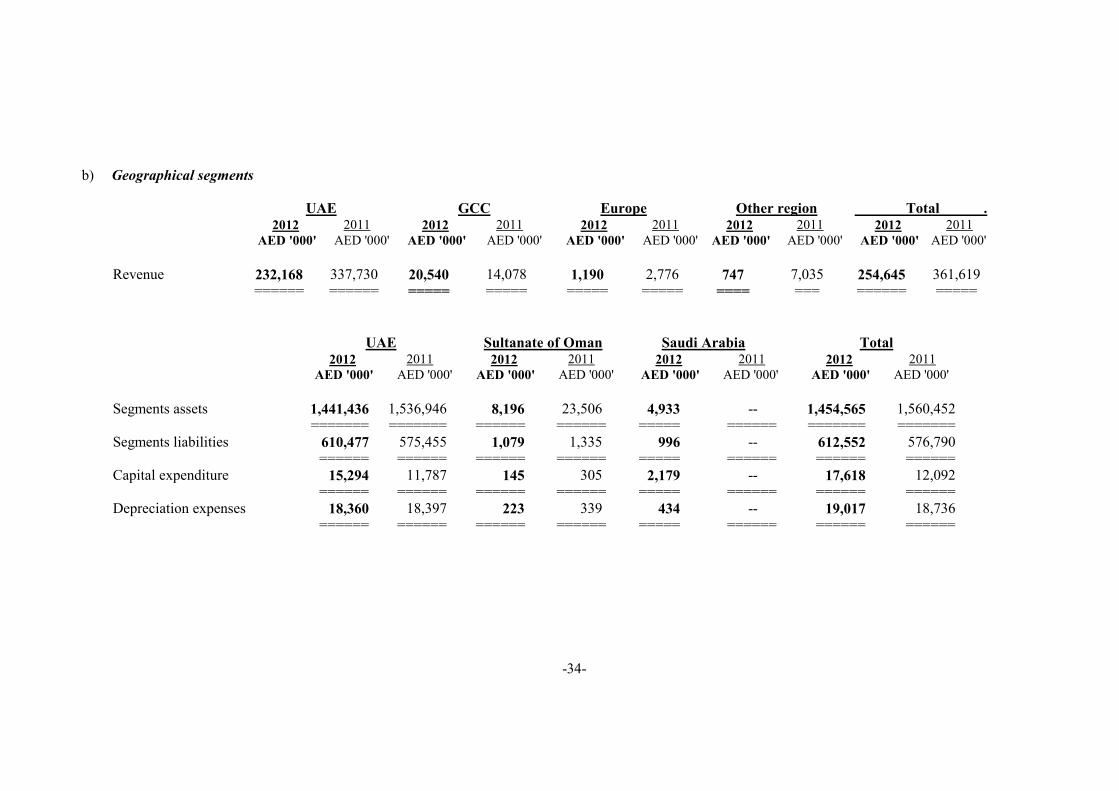
b) Geographical segments
UAE GCC Europe Other region Total .
2012 2011 2012 2011 2012 2011 2012 2011 2012 2011
AED '000' AED '000' AED '000' AED '000' AED '000' AED '000' AED '000' AED '000' AED '000' AED '000'
Revenue 232,168 337,730 20,540 14,078 1,190 2,776 747 7,035 254,645 361,619 ====== ====== ===== ===== ===== ===== ==== === ====== =====
UAE Sultanate of Oman Saudi Arabia Total 2012 2011 2012 2011 2012 2011 2012 2011
AED '000' AED '000' AED '000' AED '000' AED '000' AED '000' AED '000' AED '000'
Segments assets 1,441,436 1,536,946 8,196 23,506 4,933 -- 1,454,565 1,560,452 ======= ======= ====== ====== ===== ====== ======= ======= Segments liabilities 610,477 575,455 1,079 1,335 996 -- 612,552 576,790 ====== ====== ====== ====== ===== ====== ====== ====== Capital expenditure 15,294 11,787 145 305 2,179 -- 17,618 12,092 ====== ====== ====== ====== ===== ====== ====== ====== Depreciation expenses 18,360 18,397 223 339 434 -- 19,017 18,736 ====== ====== ====== ====== ===== ====== ====== ======
-34-

33. GENERAL
a) Certain prior year figures have been reclassified to conform to current year presentation. b) The figures in the consolidated financial statements are rounded to the nearest thousand of
Arab Emirates Dirham (AED).
-35-
Related Documents