i INTERNATIONAL FINANCIAL REPORTING STANDARD, TRADE AND FOREIGN DIRECT INVESTMENT IN SUB-SAHARA AFRICAN COUNTRIES By EFOBI Uchenna Rapuluchukwu (Matric Number: CU021010062) APRIL, 2017

Welcome message from author
This document is posted to help you gain knowledge. Please leave a comment to let me know what you think about it! Share it to your friends and learn new things together.
Transcript
i
INTERNATIONAL FINANCIAL REPORTING STANDARD, TRADE AND FOREIGN DIRECT INVESTMENT IN SUB-SAHARA AFRICAN
COUNTRIES
By
EFOBI Uchenna Rapuluchukwu (Matric Number: CU021010062)
APRIL, 2017
ii
INTERNATIONAL FINANCIAL REPORTING STANDARD, TRADE AND FOREIGN DIRECT INVESTMENT IN SUB-SAHARA AFRICAN
COUNTRIES
By
EFOBI Uchenna Rapuluchukwu (Matric Number: CU021010062)
B.Sc. (Hons.) Accounting (Covenant University) M.Sc. (Accounting) (Covenant University)
A THESIS SUBMITTED TO THE SCHOOL OF POSTGRADUATE STUDIES
OF COVENANT UNIVERSITY, OTA, OGUN STATE, NIGERIA IN PARTIAL FULFILMENT OF THE REQUIREMENTS FOR THE AWARD
OF DOCTOR OF PHILOSOPHY (Ph.D) DEGREE IN ACCOUNTING, IN THE DEPARTMENT OF ACCOUNTING, COLLEGE OF BUSINESS AND SOCIAL
SCIENCES, COVENANT UNIVERSITY, OTA.
APRIL, 2017

iii
ACCEPTANCE This is to attest that this thesis is accepted in partial fulfillment of the requirements for
the award of the degree of Doctor of Philosophy in Accounting in the Department of
Accounting, College of Business and Social Sciences, Covenant University, Ota.
Philip John Ainwokhai ……………………….. Secretary, School of Postgraduate Studies Signature & Date Professor Samuel Wara ……………………….. Dean, School of Postgraduate Studies Signature & Date

iv
DECLARATION
I, EFOBI, Uchenna Rapuluchukwu, (CU021010062), declare that this research was
carried out by me under the supervision of Professor Iyoha F.O. of the Department of
Accounting, Covenant University and Dr. Uwuigbe U. of the Department of Account-
ing, Covenant University, Ota. I attest that the thesis has not been presented either
wholly or partly for the award of any degree elsewhere. All sources of data and scholarly
information used in this thesis are duly acknowledged.
EFOBI, Uchenna Rapuluchukwu …………………….. Signature & Date

v
CERTIFICATION We certify that the thesis titled “International Financial Reporting Standard, Trade and
Foreign Direct Investment in Sub-Saharan African Countries” is an original work car-
ried out by EFOBI Uchenna Rapuluchukwu (CU021010062), in the Department of
Accounting, College of Business and Social Sciences, Covenant University, Ota, Ogun
State, Nigeria, under the supervision of Prof. Iyoha F.O. and Dr. Uwuigbe walomwa, U.
We have examined and found the work acceptable for the award of a degree of Doctor
of Philosophy in Accounting.
Professor Francis Iyoha …………………….. Supervisor Signature & Date Dr. Uwalomwa Uwuigbe …………………….. Co-Supervisor Signature & Date Dr. Olubukola Uwuigbe …………………….. Head of Department Signature & Date Professor Rufus Akintoye …………………….. External Examiner Signature & Date Professor Samuel Wara …………………….. Dean, School of Postgraduate studies Signature & Date

vi
DEDICATION
This research is dedicated to the Almighty God, who has given me the wisdom and the
inner strength to complete this project.

vii
ACKNOWLEDGEMENTS
To the Almighty God be all the glory! I thank Him, for making a way at the end of the
tunnel. Through it all I have learnt is to trust and depend completely on Him.
I wish to express my deep sense of gratitude and thanks to the Chancellor and Chairman
of the Board of Regents, Covenant University, Dr. D.O., Oyedepo for the academic and
spiritual platform created. I sincerely thank the Vice-Chancellor, Professor A.A.A.
Atayero and all the management team for running with the vision.
I am deeply grateful to my supervisor Prof. F., Iyoha and my Co-Supervisor Professor
Dr. U., Uwuigbe for their relentless effort in seeing the completion of this theses. I am
indeed grateful to them and want to use this opportunity to say that the seed that they
have sown will blossom around the world in Jesus Name, Amen.
I sincerely appreciate the Department of Accounting, Covenant University and the mem-
bers of faculty and staff beginning with the Head, Dr. O., Uwuigbe, Dr. U., Uwuigbe,
Dr. Fakile, Dr. Mukoro, Dr. Adetula, Dr. Adeyemo, Dr. Mrs Uwuigbe, Dr. Ben Caleb,
Dr. Ojeka, Dr. Obigbemi, Dr. Faboyede, Mrs. Ezenwoke, Miss. Okougbo, Mrs. Oluseyi,
Mrs. Owolabi, Mr Ajayi, Mr Olusanmi, Mr Ogbu, Mrs Azuh and Mr Peter.
I sincerely appreciate all my lecturers, both at Post-graduate and Under-graduate classes.
I want to specially thank Prof. Okoye (UNIBEN), Prof. Asaolu (UNI Ife), Dr Owolabi
(Lagos Business School), Dr Mrs Adedayo (UNILAG), Professor Oloyede J.A., Prof.
Enyi (BABCOCK), Dr. Umoren (UNIUYO), Dr. J., Enahoro, Dr. F., Adegbie, Profes-
sor. Iyoha (Covenant University), Dr. D., Mukoro for their relentless effort and love that
was shown to me during my postgraduate classes. I am also indebted to my PG panel of
examiners and assessors, including Prof. Dan Gberevbie, Dr. Okodua, Prof. Obembe,
Prof. Alege.
The same depth of appreciation goes again to Professor Francis Iyoha. Sir, you are in-
deed a father and have taught me beyond the class room. You have taught me some basic

viii
life principles that hitherto I have neglected and you have been to me like a father with
an ear to hear. I am indeed grateful to you. I am particularly grateful to Dr. Evans Osa-
buohien of the Department of Economics Covenant University.
My appreciation goes to my parents Mr and Mrs Okwuoma Efobi. You have been a
support to me and I cannot forget that your prayers have been answered through the
completion of this project. I am happy today that you are alive to see your dreams being
fulfilled and I cannot seize to remember the Joy in your faces when you supported me
in joining the academia. I am grateful to you.
My final appreciation goes to my students in Accounting 400 level 2014/2015 set. You
all have been wonderful and your passion has kept me seeking for the completion of this
project.
Uchenna Efobi, 2017

ix
TABLE OF CONTENTS
CONTENT PAGE
Cover Page i
Title Page ii
Acceptance iii
Declaration iv
Certification v
Dedication vi
Acknowledgements vii
Table of Contents ix
List of Figures xiv
List of Tables xvi
Abstract xviii
CHAPTER ONE – INTRODUCTION
1.1 Background to the Study 1
1.2 Statement of Research Problem 4
x
1.3 Objective of the Study 6
1.4 Research Questions 6
1.5 Research Hypotheses 7
1.6 Significance of the Study 7
1.7 Scope of the Study 9
1.8 Operational Definition of Terms 11
CHAPTER TWO – LITERATURE REVIEW
2.1 Introduction 13
2.1.1 Conceptual Definitions of Financial Reporting 13
2.1.2 Issues in Financial Reporting 16
2.1.3 The Changing Role of an Accountant 18
2.1.4 Drivers of the Changing Role of an Accountant 19
2.1.5 Developments in Accounting and Corporate Reporting 25
2.1.6 Stewardship and Corporate Governance 32
2.1.7 Financial Reporting 33
2.1.8 International Financial Reporting 34
xi
2.1.9 International Accounting: Historical Perspective 36
2.1.10 Concept of IFRS Adoption 42
2.1.11 Why will a Country Adopt IFRS? 51
2.1.12 Concept of Foreign Investment 60
2.1.13 Concept of Trade 73
2.2. Theoretical Underpinning 78
2.2.1 Some Theories Related to Financial Reporting, FDI and Trade 78
2.2.2 Network Economic Theory (NET) of IFRS Adoption 91
2.2.3 Review of Empirical Literature and Identification of Gaps 95
CHAPTER THREE – METHODOLOGY
3.1 Introduction 98
3.2. Research Design 98
3.2 Population of Study 99
3.3 Sampling Size and Sampling Technique 100
3.4 Data Gathering Method 101
3.5 Estimation Technique 110
xii
CHAPTER FOUR – RESULTS AND DISCUSSION
4.1 Introduction 116
4.2 Stylized Facts: Foreign Investment and Trade 116
4.3 Descriptive Overview of Foreign Investment and Trade in
Selected Sample 126
4.4 Comparing the Trend Prior and After IFRS Adoption of Countries 130
4.5 Summary Statistics of Variables included in the Empirical Model 133
4.6 Test of Association between Variables of Interest 136
4.7 Regression Analysis 142
CHAPTER FIVE– CONCLUSIONS AND RECOMMENDATIONS
5.1 Introduction 173
5.2 Summary 173
5.3 Findings 174
5.4 Conclusions 174
5.5 Recommendations 177
5.6 Contributions to Knowledge 178

xiii
5.7 Limitations of the Study 179
5.8 Suggestions for Further Study 180
xiv
LIST OF FIGURES
FIGURE PAGE
Figure 1 Network Economic Theory of IFRS Adoption 93
Figure 2 The Linkage between IFRS Adoption, Trade and FDI 105
Figure 3 FDI Net Inflows to Africa (1970-2013) 117
Figure 4 FDI Flow to/from Africa 118
Figure 5 Africa’s Top Five (5) Recipients of FDI Inflows 120
Figure 6A Sectorial Distribution of Announced Value of FDI Greenfield
Projects in Africa by Source (cumulative 2009 – 2013 per cent) 121
Figure 6B Announced value of FDI Greenfield projects in Manufacturing
and services in RECs, cumulative 2009 – 2013 121
Figure 7 Portfolio Investment vs FDI in Africa (1975-2013) 122
Figure 8 Portfolio Investment vs FDI across Regions of the
World (1975-2013) 123
Figure 9 Africa’s Trade as a % of GDP (1975-2013) 124
Figure 10 Africa vs World’s Trade as a % of GDP (1975-2013) 124
xv
Figure 11 Decomposed Export for Africa (1975-2011) 125
Figure 12 Trade Volume across IFRS Adoption Status of Sampled Countries127
Figure 13 FDI Flow across IFRS Adoption Status of Sampled Countries 128
Figure 14 FPI Flow across IFRS Adoption Status of Sampled Countries 129
Figure 15 Association between FDI Flow and IFRS Adoption (Using IFRS
Adoption Count Variable 137
Figure 16: Association between FPI Flow and IFRS Adoption (Using IFRS
Adoption Count Variable 138
Figure 17 Association between Trade Flow and IFRS Adoption (Using
IFRS Adoption Count Variable 138

xvi
LIST OF TABLES
TABLE PAGE
Table 1 Population of the Study 99
Table 2 List of Countries and Year of Legal Adoption of IFRS 101
Table 3 Sources of Secondary Data 110
Table 4: Decomposed Export across Regions of the World (1961-2011) 126
Table 5: Mean Statistics of Main Explained Variables of IFRS adopting
Countries “Prior to” and “After” the Adoption of IFRS 131
Table 6 Summary Statistics of Variable 134
Table 7 Pairwise Correlation Analysis 141
Table 8a Regression Analysis (Explained Variable-Trade Flow; Using IFRS
as Count Variable) 148
Table 8b Regression Analysis (Explained Variable-Trade Flow; Using IFRS
as a dummy Variable) 149
Table 9 Regression Analysis (Explained Variable-Foreign Direct
Investment; Using IFRS as a Count Variable) 153
xvii
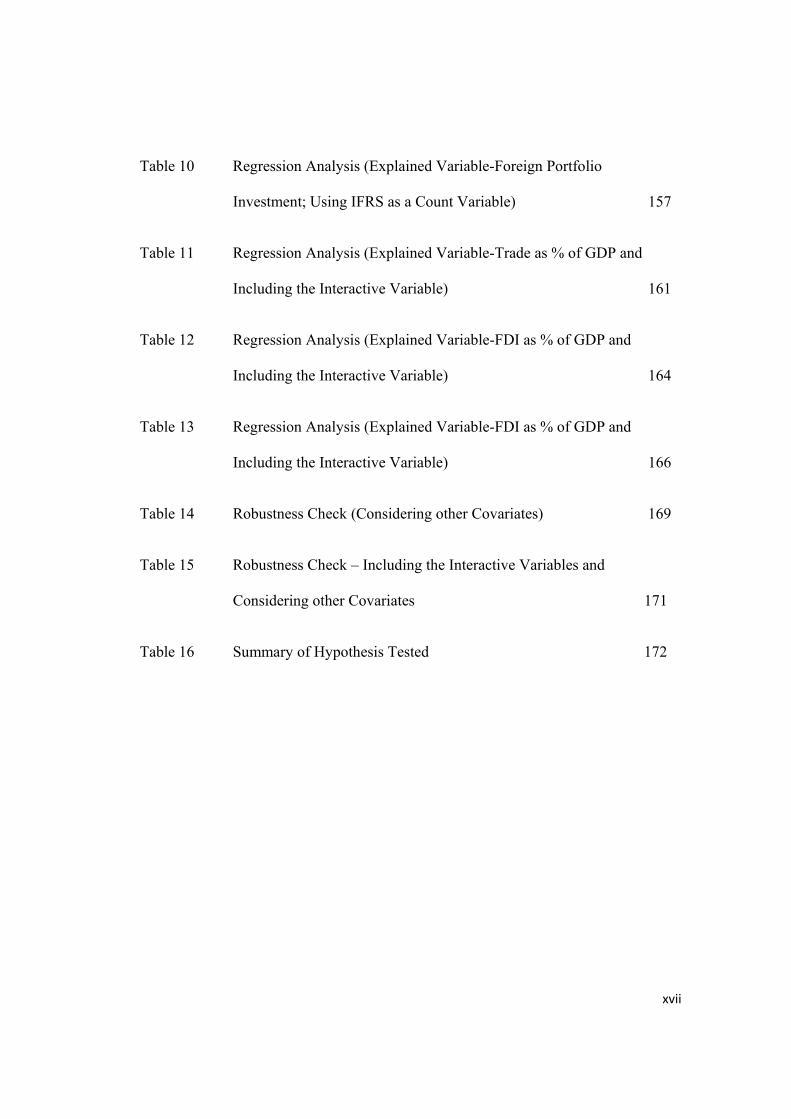
Table 10 Regression Analysis (Explained Variable-Foreign Portfolio
Investment; Using IFRS as a Count Variable) 157
Table 11 Regression Analysis (Explained Variable-Trade as % of GDP and
Including the Interactive Variable) 161
Table 12 Regression Analysis (Explained Variable-FDI as % of GDP and
Including the Interactive Variable) 164
Table 13 Regression Analysis (Explained Variable-FDI as % of GDP and
Including the Interactive Variable) 166
Table 14 Robustness Check (Considering other Covariates) 169
Table 15 Robustness Check – Including the Interactive Variables and
Considering other Covariates 171
Table 16 Summary of Hypothesis Tested 172

xviii
ABSTRACT
Since the promulgation of IFRS as a result of the metamorphosis of the International Accounting Standard Board from the International Accounting Standard Committee in 2001, improved global capital flow and trade were identified as some of the outcomes from using IFRS for global financial reporting practice. Due to the fact that IFRS in-cludes more realistic measure of accounting numbers and promotes better disclosure of accounting transactions, it is adjudged as a better form of financial reporting practice. Thus it reduces information asymmetry between preparers and users of financial infor-mation and promotes better disclosure and lowers cost of monitoring of subsidiaries and information barriers to cross border investments and trade. The rising global campaign for developing countries, including those in Africa, to adopt IFRS, still requires further examination as to its impact. More so, Africa is confronted by poor institutional frame-work and accounting infrastructure, and based on this, the consequent effect of IFRS adoption on trade and investment require empirical clarification. In essence, three im-portant questions were asked: (i) to what extent has IFRS adoption enhanced trade flow of selected African countries? (ii) How has IFRS adoption impacted on the volume of FDI inflow to selected African countries? (iii) to what extent has the development of the accounting infrastructure in the selected African countries’ affected the influence of the adoption of IFRS on trade and FDI inflow. In answering the research questions, a panel data, consisting of 48 African countries were gathered and for the period 2002 – 2014. The econometric model were sourced from different database including the World Bank’s World Development Indicator, the United Nations Conference on Trade and De-velopment Statistics and the Price Water House Coopers data on the extent of IFRS adoption around the world. The data were estimated using three approaches: the Ordi-nary Least Square regression, the Random Effect approach and the system GMM. The three estimation methods are deemed important considering their merits and weak-nesses; thus, a multiplicity of methods will help for sensitivity checks. The key results from the study include that African countries will benefit more from IFRS by improving their institutional framework and more so through the development of accounting infra-structure. Keywords: Accounting Information; Accounting Standards; Foreign Direct Invest-ment; Financial Reporting; Institutions: Trade

xix

1
CHAPTER ONE
INTRODUCTION
1.1 BACKGROUND TO THE STUDY
There is a new direction to foreign trade and foreign capital flow which is given promi-
nence due to globalization. This is based on the fact that African countries are beginning
to attract foreign investment and are becoming more competitive in the international
market (Asiedu and Lien, 2011). The gains derivable by countries from globalization
include improved trade and attraction of foreign capital to sustain domestic investment,
which can result to improved economic growth and productivity, increase in balance of
payments position and employment, crowd-in of domestic investment and technology
spill-over (Agosin and Mayer, 2000).
Trade includes the exchange of goods and services between countries. The trend for
African countries, using the component of trade, reveals that African countries have re-
lied more on the trade of goods-agricultural products and natural resources (World Bank,
2012). The volume of trade in services for African countries is still dismal as the level
of industrial development and technology utilization is low. Dwelling on this, extant
consensus has it that African countries over reliance on trading of agricultural and nat-
ural resource goods is as a result of the fact that most of the economies are undiversified
(Douglas, 2013). This implies that African countries depend on a ‘restricted’ trading
basket and there is the need to expand on the categories of products that are traded.
African countries have also depended on Foreign Direct Investment (FDI) for the im-
provement of her growth and development (Asiedu, 2006). This includes net inflows of
foreign investment into other economies other than theirs, with the aim of acquiring a
lasting management interest that may be 10 percent or more of voting right in another
enterprise (World Bank, 2012). It includes the addition of equity capital, reinvestment
of earnings, other long-term capital, and short-term capital as identified in the balance
2
of payments of the country. Consensus has it that the focus of FDI inflow into African
countries is natural resource and market driven. The consequences of this form of FDI
are that they crowd out domestic investment and under-develop the market base of the
country (Agosin and Mayer, 2000). Despite this, African countries still depend on FDI
inflow as they have been attributed to contribute to the productive capacity of the coun-
try, improve employment and local capacity utilization, among others (Pigato, 2001).
The trend of Africa’s trade and Foreign Direct Investment (FDI), in the past decade, has
improved as a result of globalization. The statistics from World Bank (2012) reveal that
between 1980 and 1990, Africa’s trade contributed beyond 50 percent of the total output
of her economy, while FDI inflow grew from 0.09 percent to 0.43 percent. Likewise,
trade volume of African countries between 1990 and 2000 further increased from 63.71
to 75.89 percent in 2008 and then reduced to 64.75 percent in 2010. FDI contribution
(between 1990 and 2000) was 1.97 and then 3.67 percent in 2008 and 2.29 percent in
2010 (World Bank, 2012).
The need for improved trade flow and FDI inflow around the world has brought about a
demand for uniform financial reporting language. This is with regards to the compara-
bility and uniformity of financial reports across different countries. Ashcroft, Chevis
and Smith (2008) noted that the need for uniformity in financial reports was caused by
the increase in the global integration caused by trade and financial asset flow between
countries. Portes and Reys (2005) also earlier noted that global integration of financial
reporting is much more important than the diversifications opportunities in foreign mar-
ket. This is because financial reporting uniformity is demanded by many international
organizations and regional economic communities.
In 2003, the International Accounting Standard Board (IASB) released the IFRS as an
international standard which is expected to foster uniform financial reporting across
countries. Since 2005, over a 100 countries around the world have adopted the standard.
Focusing on Africa, about 34% of countries in Africa have either required all listed

3
companies on their stock exchange to utilize the IFRS for financial reporting or have
shown interest in adopting the standard in a later date (Deloitte, 2012).
The adoption of IFRS will enhance financial reporting comparability and lower infor-
mation asymmetry, thereby improving international capital mobility (Portes and Rey,
2005). This is supported by the fact that better information symmetry, will improve for-
eign investment and international trade in goods. Besides, some studies such as
Marquez-Ramos (2012) have observed that a country’s decision to adopt IFRS will
boost trade competitiveness and FDI inflow. However, the relative impact of the adop-
tion of IFRS on trade and FDI in Africa has not been given considerable attention. The
current literature in Africa that relates to this issue and featured in scientific database
have focused on the level of compliance by companies after the adoption of IFRS (Ya-
haya, and Khadijat, 2011); the general implication of the adoption of IFRS in Nigeria
(Iyoha and Faboyede, 2011; Madawaki, 2012); financial statement effect of IFRS adop-
tion by African countries (Okpala, 2012); perception based analysis of mandatory adop-
tion of IFRS in Nigeria (Adeyemo, 2013); the adoption of IFRS in relation to curriculum
development (Onuoha, 2013); the effect of the adoption of IFRS on the stock market
performance of African countries (Okoye and Ezejiofor, 2014).
In this study, emphasis was given to the effect of the adoption of IFRS on trade and FDI
by focusing on some selected African countries for which data were available. Apart
from investigating this relationship, the role of the development of indigenous account-
ing infrastructure was also examined as it is suspected that the effect of IFRS adoption
is conditional on the level of development of the indigenous accounting infrastructure
of the country. Put differently, the effect of the adoption of IFRS by African countries
cannot be examined in isolation. This is because it is plausible for IFRS to have minimal
impact on the trade and FDI inflow of countries, depending on the strength of the indig-
enous professional accounting body. Accounting infrastructural development connote
the presence of professional accounting bodies and professionals to complement the
adoption of IFRS in informing trade and FDI flow.
4
When countries’ adopt IFRS, for instance, the switch from national GAAP to IFRS will
signal a favourable business environment for FDI, especially with monitoring their sub-
sidiaries in the country. However, sustaining the FDI inflow will require a well-devel-
oped accounting system and available professionals to be hired for the preparation of
financial reports. This is following the argument of Oxley, Le and Gibson (2008) who
emphasized that the people in a society are critical for sustainable development. In this
context, development connotes all factors that can improve the well-being of the society
such as trade and FDI. This calls for human capital development, in terms of education
and professionalism. This will also be empirically considered in this study.
1.2 STATEMENT OF RESEARCH PROBLEM
Over the last decade, some African countries are waking up to the need for the adoption
of IFRS. There are a number of reasons put forward to justify their decisions. On one
stance, some have argued that the decisions to adopt IFRS are as a result of colonial
imperialism (Nnadi, 2011). Amiram (2009) argued that the need to improve foreign cap-
ital inflow, trade competitiveness by the reduction of cost of access to information and
asymmetry of information are possible reasons for the adoption of IFRS. This is apart
from other reasons put forward for IFRS adoption such as network effect and net polit-
ical value (see Ramanna and Sletten, 2009; Iyoha and Faboyede, 2011).
Given the reasons for IFRS adoption and the possible implication, debate on the rela-
tionship between trade, FDI and IFRS adoption is inconclusive. Some studies have noted
that IFRS adoption improves the trade and foreign capital flow of the adopting countries
(Ramos, 2008; Gordon, Loab and Zhu, 2012). While some other stance emphasize that
it is not necessarily IFRS that improves trade, but countries that trade more and depend
on FDI are more likely to adopt IFRS (Ramanna and Sletten, 2009; Ramanna and Slet-
ten, 2010). This debate is not even considered when zeroing in to IFRS adoption litera-
tures that have focused on the African context. At best, the conclusion in Afrocentric
IFRS adoption literature have climaxed on considering the level of compliance by com-
panies after the adoption of IFRS (Yahaya, and Khadijat, 2011); the implication of the
5
adoption of IFRS in Nigeria (Iyoha and Faboyede, 2011; Madawaki, 2012); financial
statement effect of IFRS adoption (Okpala, 2012); perception based analysis of manda-
tory adoption of IFRS in Nigeria (Adeyemo, 2013); the adoption of IFRS in relation to
curriculum development (Onuoha, 2013); the effect of the adoption of IFRS on the stock
market performance of African countries (Okoye and Ezejiofor, 2014).
Noting the inconclusiveness of the literature on the linkage between IFRS adoption, FDI
and trade, and the incongruity of this debate in the African context, this study took this
up by further investigating into the relevance of IFRS adoption on the volume of trade
and FDI attractiveness of the adopting African country. The approach of this study is
unique considering that the conclusions reached by non-African literature, on the FDI-
Trade implication of IFRS adoption, made use of panel data that comprise of both de-
veloped and developing countries. The pitfall in this mixed sample is that, the combina-
tion of data of countries from different regions will result to an inefficient conclusion as
a result of heterogeneity in the structures of the economic system (i.e. political, social
and economic structures), thereby implying that conclusions reached in those studies
may not be generally applicable. This has possibly accounted for the inconclusive debate
on the impact of IFRS adoption on countries trade and FDI.
This study also observes that some of the non-African studies (e.g. Gordon, Loeb and
Zhu, 2012) have considered a linear relationship between IFRS adoption, trade and FDI.
This implies that they have considered the adoption of IFRS as having a direct impact
on trade and FDI without being conditioned on any other intervening variable. However,
in this study, the role of some intervening variables was suggested based on the intuition
that IFRS adoption will only have an impact on trade and FDI when certain structures
are in place to facilitate this process. A country’s decision to adopt IFRS will signal to
the international community that the business environment in the country is conducive
for investment. This is especially for FDIs that will require the adoption of IFRS for
easy control and supervision of their subsidiaries in host countries. However, for sus-
6
taining the FDI inflow and trade, institutional, professional and human capital infra-
structure will be needed. For instance, a country that adopts IFRS and has stringent busi-
ness regulations will not be able to attract FDI. Likewise, a country that adopts IFRS but
have poor professional accounting bodies and low human capital (such as education)
will not have the capacity to sustain the inflow of FDI. This was not considered in extant
studies and in this study, there was an examination of the interaction term between the
prevailing indigenous professional accounting infrastructure and IFRS adoption out-
comes.
1.3 OBJECTIVES OF THE STUDY
The main objective of the study is to empirically determine the impact of IFRS adoption
on Trade and FDI in Africa. The specific objectives of this study are to:
I. Examine the extent of relationship between the adoption of IFRS and trade in-
flow in selected African countries.
II. Determine the extent of relationship between IFRS adoption and the volume of
FDI inflow to selected African countries.
III. Examine the extent to which the level of the accounting infrastructure within the
selected African countries affects the IFRS, trade and FDI nexus.
1.4 RESEARCH QUESTIONS
The following research questions will be considered in this study:
I. To what extent has IFRS adoption affected trade flow of selected African coun-
tries?
II. How has IFRS adoption impacted on the volume of FDI inflow to selected Afri-
can countries?
III. To what extent has the development of the accounting infrastructure in the se-
lected African countries’ affected the IFRS, trade and FDI nexus.
7
1.5 RESEARCH HYPOTHESES
The research hypotheses developed for the study are stated in null form (H0) since the
alternative hypothesis (H1) can be inferred from H0. Three main hypotheses tested in-
clude:
Hypothesis One
H0: The adoption of IFRS has not significantly improved trade flow in selected African
countries.
Hypothesis Two
H0: The adoption of IFRS has not significantly affected the volume of FDI inflow to
selected African countries.
Hypothesis Three
H0: The level of development of accounting infrastructure of the selected African coun-
tries does not significantly enhance the impact of IFRS adoption on trade and FDI.
1.6 SIGNIFICANCE OF THE STUDY
This study will be significant to the following group of individuals.
Policy Makers:
The significance of this study is tied to policy makers in Africa is based on the relevance
of FDI to African countries especially in relation to augmenting the fund for develop-
ment projects. Asiedu (2006), in support of this, noted that an increase in FDI flow to
African countries will help in providing development fund for the achievement of the
Millennium Development Goal (MDG) of poverty reduction by half in 2015. More so,
the author highlights that in order for African countries to achieve the MDG, the region
needs to fill an annual resource gap of 64 billion USD, which is only about 12 per cent
8
of GDP. The consideration for the improvement of FDI flow to African countries sur-
passes the requirement for development finance but the attendant benefits that come
with FDI presence in a host country (see Abdulai, 2007). More so, based on the fact that
African countries have low income and domestic savings and may not have ready access
to foreign capital market, then the raising of development finance is further constrained
and the need for improved FDI flow cannot be over-emphasised. Therefore, policy rel-
evant investigation of this form will be required for policy actions on the role of IFRS
for attracting FDI
Accounting Profession:
The analysis of this study will also be relevant to the accounting profession in general
and the accounting professional bodies in African countries. This is because we con-
trolled for the development of accounting professional bodies in the country and how it
affects the relationship between IFRS adoption, trade and FDI. The result from the in-
clusion of this variable in the analysis of this study will be provide insight into the com-
plementary effect (or otherwise) of the development of the accounting profession on the
nexus (IFRS, FDI and trade). At least, from the result, it will be clear as to how the
accounting profession affect this relationship.
Researchers:
Since an important gap, informing the statement of research problem, was observed, the
result of this study will be relevant for future researchers that intend to delve into the
issue of IFRS adoption impact on macro-economic outcome. For Africa, this is very
relevant as not much study has considered the macroeconomic effect of accounting num-
bers, thereby making the outcome of this study to be of significance for the advancement
of knowledge. Also, this study makes immense contribution to the literature by consid-
ering the role of institutions, human capital and the development of accounting profes-
sional bodies in enhancing the relationship between IFRS adoption, trade and FDI.
9
The Accounting Department of my Host Institution:
This study will also be relevant to the accounting department of my host institution
(Covenant University) especially because of the methodology adopted for this study. In
this study, the panel data analysis framework was used in the estimations of the relation-
ship between IFRS adoption, FDI and trade and this approach will be beneficial for fu-
ture postgraduate students in the department.
1.7 SCOPE OF THE STUDY
This research contains five chapters, distributed as introduction, literature review, and
research methodology, discussion of results, and conclusion and recommendation. Next
to this introductory chapter is the literature review, which discusses the existent litera-
ture in this area of focus. The theoretical framework is also included in the second chap-
ter. The theories discussed spans from the Agency Theory, Stakeholder Theory, New
Institutional Accounting Theory, New Trade Theory and Network Economic Theory of
IFRS adoption. The essence of this broad discussion is to have a wide view of possible
theory that explains the relationship that is being modelled in this study and to identify
their possible criticisms. After this discussions, there was a more succinct examination
of the theory that was used in this study.
The third chapter focuses on the applicable research methodology. The main issue in
this section is the data and method of analysis. The data involves countries for which
data is available and they are 48 in number. They include Algeria, Angola, Benin, Bot-
swana, Burkina Faso, Burundi, Cameroon, Central African Republic, Chad, Comoros,
Congo, DRC, Cote D’Ivoire, Djibouti, Egypt, Equatorial Guinea, Eritrea, Ethiopia, Ga-
bon, Gambia, Ghana, Guinea-Bissau, Kenya, Lesotho, Liberia, Libya, Madagascar, Ma-
lawi, Mali, Mauritania, Mauritius, Morocco, Mozambique, Namibia, Niger, Nigeria,
Rwanda, Senegal, Sierra Leone, South Africa, Sudan, Swaziland, Tanzania, Togo, Tu-
10
nisia, Uganda, Zambia, Zimbabwe. From these countries, Botswana, Egypt, Ghana, Le-
sotho, Kenya, Malawi, Mauritius, Morocco, Mozambique, Namibia, Nigeria, South Af-
rica, Sierra Leone, Swaziland, Tanzania, Uganda, Zambia and Zimbabwe.
The period for this study was 2002 to 2012. 2002. The period was chosen in order to
effectively capture the transition of countries from the GAAP to IFRS because 2002 was
the earliest year after the replacement of IASB with IFRS in 2001. The year 2012 was
chosen as the climax year because most of the data required for this study did not have
indices for years after 2012. The period of analysis is critical for the comparison of FDI
and trade prior to and after the adoption of IFRS.
The data analysis involved the use of descriptive statistics and econometric data estima-
tion techniques. The econometric technique includes the application of the Ordinary
Least Square (OLS) regression technique, the Generalised Feasible Least Square Tech-
nique, and the Systems Generalized Methods of Moments (SGMM) for dynamic panel
data estimations. The justifications for these estimation techniques are presented in the
subsequent chapter that contains the research methodology in Chapter three (3).
The fourth section includes the presentation of data and the discussions of results. The
fifth section concludes with policy recommendations.
The data for this study was sourced from databases that provide relevant statistics for
modelling the relationships envisaged in this study. Some databases that was consulted
include: Deloitte website on the extent of IFRS adoption around the world. The data on
the extent of countries’ legal adoption of IFRS was sourced principally from this data-
base available at www.iasplus.com. However, to complement this database and in some
cases where some countries were not included in the Deloitte database, the IFRS website
(www.ifrs.org), and World Bank Group Report on Standards and Codes
(www.worldbank.org/ifa/rosc), provides an alternative database for the IFRS adoption
variable. Data for the other explanatory variables are sourced from the World Bank-
11
World Development Indicator 2012, World Governance Indicator 2012, and United Na-
tions Conference on Trade and Development online database. The data for the account-
ing infrastructure was gotten from the websites of the various accounting associations
in the respective countries.
1.8 OPERATIONAL DEFINITION OF TERMS
The following are the operational definition of terms that were commonly used in this
study.
Accounting Infrastructure: This includes those structures that are put in place to pro-
mote the professional accounting practice in a country. It includes structures like the
professional accounting association that provides a framework for the practice of ac-
counting.
Accounting Practice: This is the act of playing the role of a professional in the dis-
charge of the duty of preparing and interpreting financial information for informed de-
cisions by users that will rely on such information.
Accounting Standards: These are those guidelines, framework and principles that
guide the computation and reporting of accounting transactions.
Annual Report: this includes the financial statement of a company. These reports are
released annually, depending on the financial year of the company. It shows both the
quantitative and qualitative information about the company and can be relied on for
economic decision because they have been duly certified by a professional.
Financial Statement: Financial report include those reports that have been certified by
a professional accountant as true and fair, and includes quantitative and qualitative in-
formation that shows the financial position of the company as well as the efficiency of
the management at the end of a given period.

12
Generally Accepted Accounting Principles: this includes those accounting standards
that are prepared by a statutory organisation with the aim of guiding the preparation of
annual report of companies that are located within the jurisdiction of the standard.
Globalisation: This is the interrelatedness and connectivity that exist between countries,
firms and individuals that has fostered both economic and non-economic relationships.
Investment: This involves monetary input into a particular venture with the aim of ex-
pecting a gain at a later period.
Parent Company: This is a company that owns a sizeable amount of holdings in an-
other company that is located in another country. This imply that such a company –
called the parent – has the right to make decisions and influence the actions of the other
country for which they have a holding.
Subsidiary Company: this is a company that another company owes a substantial
amount of its holdings.
Trade: This is the exchange of goods and services between countries, firms or individ-
uals who are separated by distance.

13
CHAPTER TWO
LITERATURE REVIEW
2.1 INTRODUCTION
In this chapter the conceptual and theoretical issues relating to financial reporting and
the requisite standards that informs the extent of financial disclosure are discussed.
These discussion is aimed at nuancing the relevant issues that spurs the empirical inves-
tigation in this work.
2.1.1 CONCEPTUAL DEFINITIONS OF FINANCIAL REPORTING
Financial reporting are sets of documents that are prepared by a financial information
provider – be it a professional or otherwise – with the aim of disclosing financial trans-
actions in an orderly manner, so that users can engage them in making informed deci-
sions (International Accounting Standard Board-IASB, 2010). These information are
prepared over a series of period (be it daily, weekly, monthly, quarterly or yearly) and
are explicit enough to contain summary of accounting data, background notes, and other
relevant information that will be useful for making informed decision.
The IFRS framework views financial reporting as general purpose financial reports
(GPFRs) and the act of presenting same to the users of the report for decision making
(Financial Reporting Council, 2013). The components of this report include the balance
sheet (statement of financial position), the profit or loss account (income statement),
changes in equity, cash flows, and the notes to the account. These aspect of the financial
report are called the quantitative section. The qualitative section of the financial report
includes the chairman’s statement, the director’s and auditor’s report, among others.
Broadly speaking, financial reporting is the periodic process for the provision of infor-
mation that reflects the financial position and performance of a reporting entity (Gee,
2001): most times, these are publicly listed firms with stakeholders that are interested in
the company’s financials.

14
To understand financial statement, it is necessary to also consider the financial reporting
cycle and the sources through which financial statements emanates. The cycle runs from
source document, books of original entry, the ledger, trial balance, final accounts, which
will then be assured by an external auditor. The end product of the cycle if the prepara-
tion of the financial statement, which begins from the daily recording of day to day
financial transactions that involves the record keeping in source documents (Woods and
Omuya, 1982). The source documents are not accounts but those records those orderly
highlights the series of recurrent financial transaction in an organization and it contains
the dates, purpose, tracking details and amount of the transaction. It includes documents
like the cash receipt, cheque registers, invoices, credit and debit note, tellers and slips.
These list are in exhaustive, but the fundamental understanding is that any document
that shows clearly the arising financial transaction in an organization can be termed as
source document.
The Source document has its diverse uses. Apart from the fact that it acts as an objective
evidence of a business transaction, it serves as part of the audit trail that proves the
authenticity of a claimed transaction. It also helps the accountant in minimizing errors
and improving the efficiency of the financial report, especially when the source docu-
ment is orderly documented.
The items in the source documents are recorded in the books of original entry (Woods
and Omuya, 1982). The books of original entry, also called the books of prime entry or
day book are accounting journals that summarizes and aggregates business transactions
from the source documents. In this book, the detailed records of items from the source
documents are grouped into an orderly manner to inform easy summing of items that
are of similar nature. These journals include: sales journal/day book (records only credit
sales); purchases journal/day book (records only credit purchases); return inward jour-
nal/day book (records items that are returned by customers); return outward journal/day
book (records items that are returned to suppliers); cash journal- records cash transac-
tions (Woods and Omuya, 1982).

15
The books of original entry are tremendously valuable for investigating individual ac-
counting transactions, and just like the source documents, they are commonly accessed
by auditors for the verification of the origination of selected business transactions and
to ensure that these transactions were properly recorded (Omolehinwa, 2000). It is im-
portant to note that these concepts apply to manual record keeping and may not be re-
ferred to in a computerized accounting system, where business transactions are recorded
in a central database.
From the books of original entries, accounting data may not clearly make for easy un-
derstanding of the implications of such transactions. Therefore, these data are transferred
to a form of account called the ledgers. The ledger is an account that records all the
business transactions to show the double entry processes and to reach a monetary sum-
mation of such transactions (Woods and Omuya, 1982; Omolehinwa, 2000). This is the
principal book of account because all other accounting entries has its foundation from
the prepared ledgers. From the ledger, the trial balance is generated: this is just a sum-
mary of all the prepared ledger in a particular accounting period. It is not an account but
a list of all the closing balances that are extracted from the ledger. As a rule of thumb,
the trial balance must balance; implying that the debit side must be equal to the credit
side of the trial balance. Thereafter, other accounts like the income statement, the state-
ment of financial position and other final accounts are prepared from the trial balance.
The final account may not be valid for informed decision until it is been assured by the
external auditors. The external auditors are independent professionals, contracted by the
reporting entity to carefully and technically pass an opinion as to the fairness of the
financial information, after a careful review of the foundational document and other as
sundries as deem fit, and are willing to bear the risk of any contingencies that may arise
from their opinion (Bell et al, 1997; Elliot, 1998; Umoren, 2012). It is after this process
that a financial statement can be termed as reliable for economic decision.
16
2.1.2 ISSUES IN FINANCIAL REPORTING
The final accounts can either be prepared for internal or external users (see Higson,
2003). The internal users include those economic agents, who require the financial in-
formation and are within the organization or setting that the financial information is
originating from. These users require the financial information to aid their planning,
strategizing, decisions and informed judgment with regards to making economic deci-
sions that involves any form of economic value (see Botosan, 1997; Canadian Institute
of Chartered Accountants-CICA, 1999). They can be members of the strategic, tactical
or operational ranks of the organization. The external users of financial information in-
clude those economic agents, who are located outside the organization or setting that the
financial information are originating from. These parties require the financial infor-
mation to also make economic decisions but they are independent of the processes of
preparing the financial information. The list of these parties are in-exhaustive but they
include the auditors, investors, government officials and competitors.
The dynamism of the business environment is reconditioning the way and manner
through which these financial information are presented, in such a form that it makes for
easy understanding and assimilation of the end user – be it internal or external (see Elliot,
1998). These dynamism involves the development of accounting figures in such a form
that it provides assurance to those users outside the reporting entity and does not mislead
those within the entity, as well (Higson, 2003). This supports the view of oversight func-
tion and appropriate accountability that the management of an enterprise is supposed to
provide for efficient utilisation of resources in their custody (Miles, 2012). Of course,
assurance cannot be effective without the critical role played by an external auditor, in
collaboration with the internal audit of the reporting entity. This makes for effective
corporate governance, in the sense that effective reporting and accounting involves ex-
ternal scrutiny from auditors (Company Law Review Steering Committee, 2001).
This imply that financial reporting cannot be discussed in isolation of the forces that
must be put in place to ensure required assurance. These forces include the intermingled

17
negotiations and discussions between the reporting entity and the external auditors, who
are made to give assurance to the financial statement before it can be relied upon for
informed decision. For the financial statement, the final figures are derived as a result
of consistent negotiations between the management and the external auditors that are
expected to examine the reasonableness of the management's justifications for their rep-
resentations (Higson, 2003). This includes the fact that emphasis will be placed on the
level of business risks exposed to the reliance of such financial statement. In some cases,
the auditors may be held liable for assuring the representations made by the management
and as a result of this, there are economic consequences to be borne by the auditor. Due
to this, the auditors consistently negotiate the items to be included in the annual report
and go as far as verifying the authenticity or reliability of such items.
Higson (2003) also noted that financial reporting and auditing are not just technical sub-
jects, but encompasses the application of judgements and assumptions. This explains
why some companies collapse after the external auditor has given assurance on the reli-
ability of their annual reports. Put differently, the assurance of the annual report of firms
does not necessarily mean that the firm cannot collapse and this is likely to happen in
cases where the external auditor has not effectively negotiated the items to be included
in the annual report. They may likely depend on their judgement or their trust in the
management’s capacity to produce a fair representation. In essence, auditing goes be-
yond vouching for the contents of the accounting records, but on focusing on the im-
portance of understanding and exploring the interdependences between financial report-
ing and the factual occurrences in the firm.
It is this barrage of negotiations that there are rising fundamental issues in financial
reporting in the global context. For instance, users who are outside the political domain
of the reporting entity, might find it difficult to establish the assurance of the financial
report, knowing that the opinion that is passed are informed by negotiations between the
‘independent professionals’ and the reporting entity. More so, the regulatory framework
of the political terrain of the reporting entity can likely inform the manner and procedure
18
that structures the information that is being disclosed in the financial statement. This
explains the divergence in the financial reporting format across firms that are located in
different countries of the world. Likewise, the role of accounting has been classically
redefined from recording, classifying, summarizing and interpreting financial infor-
mation to a service activity that provides quantitative and qualitative information that is
primarily financial in nature about an economic entity and it is intended in making eco-
nomic decisions and resolved choices among alternative course of action (Accounting
Principles Board, 1970).
Noting these developments and the continuous upgrading of the role of an accountant in
a firm, there is the need to understand the developments in accounting and the major
drivers of these developments.
2.1.3 THE CHANGING ROLE OF AN ACCOUNTANT
Traditionally, accountants are seen as professionals, whose main responsibility is re-
cording, classifying, summarizing and interpreting financial information to aid decision
making of users. This definition is tied to the classical definition of the Accounting Prin-
ciples Board that relates accounting to an art of recording, classifying and summarizing
monetary transactions in such a significant form, which are in part and at-least of a fi-
nancial character and interpreting the results thereof. However, in the definition put for-
ward by the US Accounting Principles Board, as earlier stated, accounting role and re-
sponsibilities has transcended beyond quantitative to qualitative. In essence, the issue of
recording financial information and then interpreting it is a subset of the broader respon-
sibility of an accountant.
In contemporary times, the accountant is supposed to use his numeric background in
undergoing qualitative task that is supposed to yield economic benefits to the organiza-
tion. Accountants now get involved in other fields like human resource, petroleum, en-
vironment and institutional framework, to mention but a few. For instance, Iyoha and

19
Faboyede (2011) clearly distils the perspective of an accountant in relation to prevailing
institutional settings that affects their responsibilities.
It is not surprising that accountants are becoming broader in their scope of operation and
significance. This may not be disassociated from the fact that the responsibility of an
accountant is influenced by many other exogenous factors that are outside the regular
quantitative framework. For instance, the projected profit of an accountant will likely be
incorrect if the accountant does not consider the contingent regulatory instability that
may affect the projected sales volume from which the profit was earlier estimated (As-
sociation of Chartered Certified Accountants, 2012). The implication of this is that, tac-
itly, the organization and the society where the accountant is based, expect more from
the accountant beyond the regular balancing of the book and creation of report. They
expect the accountant to foresee any contingencies that will likely affect the performance
of the organization; they expect the accountant to be versatile in information and be able
to point out possible upcoming that will likely have an adverse effect on the performance
of the firm.
The main question that stems from this changing role of the accountant is: what are the
drivers of this change?
2.1.4 DRIVERS OF THE CHANGING ROLE OF AN ACCOUNTANT
These drivers will be discussed in context. The first of the driver is:
Globalization
Globalization has reduced the distant between countries into a model of interconnected-
ness (Cheong and Wu, 2013; Bandyopadhyay, Sandler and Younas, 2014; Bergh and
Nilsson, 2014); in essence, making the world a global village. The implication of this is
that for an accountant to be relevant – in terms of playing the role of financial reporting
and advice – there must be an adequate know how of the play out of business models in
particular region or countries. This includes the fact that the accountant must understand
20
the different strategic challenges and opportunities faced in the application of the differ-
ent business models confronted by the accountant (Association of Chartered Certified
Accountants, 2012). Perhaps, there should be a global awareness by the accountant that
their duty is beyond serving indigenous client or firm, but they are serving global client
with more intricate and complex needs/demands.
Noting these increased complexities and demands from an accountant, countries are
awake to the improvement of regulations that will guide and monitor the approach of
accountants in financial reporting. In the late twentieth century, it was recorded that
there was increasing proliferation and politicization of the standards-setting process,
with attendant economic consequences (Zeff, 1978; Zeff, 2002). One of the main con-
sequence is the dis-uniformity of accounting standards, which makes global “understand
ability” of financial information difficult. The economic consequences of this is that
users of accounting information, who are hitherto unaware of the reporting guideline in
the reporting country, will incur an overhead cost of translation of the financial infor-
mation. Sometimes, these translations are not without its own demerits of misinfor-
mation.
Regulations
This includes those rules and regulations, policies, guidelines and decrees that controls,
monitors and enforces economic transactions in such a form that the cost of such trans-
actions are immensely reduced (North, 1990;1991; La Porta et al, 1997; 1998; 1999;
2008; Wysocki, 2011). As businesses expand and their stakeholders increase, especially
spanning across borders, the businesses are confronted with the pressure of aligning with
different regulations that confront them. This is not leaving out the rising local regula-
tions that seeks at preserving the environment and fiscal sustenance of the host country
(North, 1990). For instance, due to environmental pollution and the rising effect of in-
dustrial pollution on the environment where the firm operates, countries are now begin-
ning to tax firms on the amount of carbon emission that their operation generates. More

21
so, other forms of pollutant are taxed in order for corporate entities to strategically or-
ganize their operation in such a form that the environment is preserved.
In an exposition, the ACCA (2012) reports on accountants and financial professionals
in business reports the following about the challenges faced by the accountant in today’s
business order. They noted that accountants are to invest more in personal resources by
dealing with regulatory matters that arises as a result of their engagement with policies
(and policy makers) to ensure that regulatory requirements provide benefits to their busi-
nesses. The Chief Financial Officers (CFO) are expected to play a critical role in the
prevention of overly onerous and burdensome regulation, for them to be relevant in the
changing business world. They play other roles such as lobbying on behalf of the busi-
ness, and even put in place business processes and protocols to negate the adverse con-
sequences of contemporaneous regulations.
It is clear that corporate entities that must have a competitive and efficient financial
information department must be such that invest in acquiring and retaining professional
personnel that are abreast with regulatory matters and engage policy makers in ensuring
that new regulatory requirements are able to provide benefits to the business. This is no
wonder why in most corporate entity of contemporary times, there is the presence of a
legal department, who works hands-in-glove with the accounting department. At least,
the accounting department is able to provide the cost implication of compliance, or oth-
erwise, with the rising number of legality that confronts the business entity.
Advances in Technology
The changing role in the extent of technological infrastructure has affected different so-
cietal strata (Boateng, 2012; Alberto, Margarita and Fernando, 2013). The accountant
role is also becoming more complex due to the fact that the accountant is confronted
with advancement in technology and software that enhances their role and the speed of
financial reporting. This is as a result of the increasing demand for timely financial re-
port that howbeit is informed by the urgency for timely investment decision by the users.

22
CICA (1999) observed that accounting information user have increased their demand
for timely and comprehensive information, in order to use it comes from decision doing,
or may want to do, business with the reporting entity: due to this increasing demand for
information and the urgency involve, the need to utilise platforms for quicker and easier
access to database of the financial information has enhanced the need for advanced tech-
nology to speedup this process.
In corroboration, the Panel on Audit Effectiveness (2000) noted that technology-driven
information systems are capable of accessing, unifying and disseminating information
in `real time'. This implies that investors can have access to quick information and con-
sequently expand their demands for both financial and non-financial information. Some
of these information includes the traditional historical financial data, as well as those
qualitative information that shows the culture, branding, mission statement and other
relevant information that may not be attached an economic term.
In essence, the financial reporting process has transcended beyond the mechanical book
keeping procedure to the use of technology infrastructures, which enhances the speed
and accuracy of the process. Of course, the business environment demands the saving
of time for processes. This is because of the urgency of making decision and the cost of
slowing down the decision process. As it seems, if accounting process does not incor-
porate the saving of time into their process, it may not be able to meet the demands and
the need of the users of financial information – especially the internal users. ACCA
(2012) noted that technological developments will serve to help gather, organize, stand-
ardize and make data timely to the users of financial information. This development has
a driving effect on the business intelligence and will be useful for identifying new mar-
ket and profit opportunities by running simulations through customers’ insight and pref-
erences that can indulge the company into new business opportunities.
The financial information providers is now involved in dealing with complex database.
The growth of corporate organizations and even the proliferation of ‘tentacles’ of cor-

23
porate operations and branches, makes the accountant role to demand an advanced tech-
nology to keep abreast with these data. With advanced technology, they are able to use
better tools with predictive capacity and in a short time, they are able to generate ade-
quate information that can enhance strategic decisions.
Development of the Knowledge Economy
The advancement of the Solow growth model of the inclusion of the total factor produc-
tivity as an enhancer of the traditional factors of production of labour and capital, has
brought new insights into the growth of economies. Principally, Oluwatobi et al (2014)
observed that countries thrive better than others based on the relative input of innovation
in their production process. This is termed ‘knowledge economy’, where countries thrive
relative to the quality of the knowledge that drive the economy. Asongu (2013) has ex-
tensively discussed this in his study on the knowledge economy, intellectual property
right and intuitional development in the African state.
The drive towards knowledge economy has implications for financial reporting. The
main agitation is the ability of financial statement to capture the intangible assets
‘knowledge’ that drives the knowledge economy. As a matter of fact, this constitute the
major asset of the company because it enhances the usefulness and effectiveness of other
forms of asset. As gleaned from The Enterprise Development (2014), since the last two
centuries, neo-classical economics has recognized labour and capital as the only two
factors of production. This is now changing as information and knowledge are beginning
to gain prominence as the major factors of production. This is in the sense that these
factors of production are replacing capital and energy as the primary wealth-creating
assets. In addition, the advancement of modern technology have transformed wealth-
creating enterprises from the use of physically-based instruments to "knowledge-based"
technology, which now makes knowledge to be the key factor of production (Asongu,
2013; Oluwatobi et al, 2014).
24
The implication of this advancement of technology and the prominence of knowledge
as one of the key factors of production is that there is an increased mobility of infor-
mation that makes the global work force, knowledge and expertise to be transportable
at the instance of time around the world. Corporate firms even face increased challenges
based on the fact that any advantage gained by one company can be eliminated by com-
petitive improvements overnight (Lindsey, 2001). This means that corporate firms can
only enjoy comparative advantage by improving on its process of innovation, while
combining market and technology know-how with the creative talents of knowledge
workers.
The effect of this trend on the financial statement is enormous. Principally, apart from
the inability to capture these intangibles, research has revealed that the financial state-
ment of most firms that thrive on innovation is underestimated. Lindsey (2001) reported
the research by a (then) leading auditing firm, who stated that out of 10,000 public com-
panies, under 30 percent of their market capitalization was represented by the book value
that was reported by their professional accountant. They went on to state that more than
70 percent of their value was not sufficiently captured by the public measurement and
reporting system. This occurrences is a sporadic shift from the period when the book
values of firms provided about 95 percent of market value (Higson, 2003).
Rising Business Risk
The business environment is now becoming more risky (Busse and Hefeker, 2005;
Hayakawa, Kimura and Lee, 2011). The cost of misinformation has increased (Wysocki,
2011) and the rising rate of litigation and law suits even makes the job of an accountant
to be more sensitive than before. The accountant need to be aware of this and this will
affect the quality of discretion that is applied by the accountant, in terms of scrutiny of
the effectiveness of risk management and the necessary process involved. The implica-
tion of increased risk imply that the users of financial information will be demanding
for higher assurance over the financial viability of the business strategy that applies the
financial information (ACCA, 2012).

25
From another perspective, the ACCA (2012) observed that the consequential relation-
ship that exist between poor corporate behaviour and risk should be embedded in the
fact that the accountant is seen as the internal safeguard to a better corporate ethos. The
CFO should guard the organization’s assets and should recognize that poor discharge of
this duty can lead to value erosion and ultimately the capital providers will withdraw
their capital. This leaves the company with only one option – folding up. This was the
case of many ‘big’ firms like Arthur Andersen and Enron, who collapsed after a mis-
statement by the financial reporting officer.
2.1.5 DEVELOPMENT IN ACCOUNTING AND CORPORATE REPORTING
This sub-section gives an historical perspective to the contemporary accounting situa-
tion. In essence, the sub-section helps a proper conceptualization of why accounting is
what it is. Accounting development has followed the trend of the industrial development
process as well as the societal commercial and social changes (Higson, 2003). As a mat-
ter of fact, there has been a debate in the extant literature as to the school of taught to fit
the development of accounting into. They (Tinker, 1985; Yamey, 1964; Winjum, 1971)
include: those that believe that accounting is socially constructed and those that believe
that accounting development was primarily involved in the construction of modern so-
ciety. Higson (2003) took a stand that accounting is socially constructed and noted the
following:
1) The original concept of `stewardship', which is the basis for financial reporting, pre-
dates the production of accounts.
2) Management accounting presents the earliest uses of accounting data and was entirely
used for internal control purposes. Therefore, it is prudent to believe that stewardship
and management accounting were – in some way – linked.
3) The development of double-entry bookkeeping is another example of internal control
mechanism role of accounting.

26
These connotes that the development of modern accounting is borne out of the develop-
ment of the society and accounting and stewardship are inseparable. This cannot be de-
nied owing to the earlier argument that recent developments in the modern society has
affected the role of accounting.
To understand the development of accounting and corporate reporting, there is the need
to understand some underlining definitions of the concept of some of the issues that will
be subsequently unfolded. Some of these concepts include stewardship, accountability,
transparency and true and fairness.
2.1.5.1 The Concept of Stewardship
The concept of stewardship connotes attending to the resources of another party. Alt-
hough, the early forms of accounting includes these concept (concept of attending to the
resources of others), the nature of these early forms of accounting has been more akin
to management accounting than financial accounting (Higson, 2003). The reason for this
medieval approach is that accounting records of those times were targeted at internal
control mechanisms and its main objective was to monitor and account for the resources
of the owner(s) of the business organization. However, this may not be plausible in re-
cent times, when the size of the businesses has increased and there is a growing demand
for more information about the business than just the demand for information regarding
the resources of the firm.
The definition of stewardship, in accounting, follows different directions and they in-
clude: Stewardship include the duties and obligations of a person who manages some-
thing on behalf of other persons. This connotes that a steward’s main responsibility is
the management of the resources that is handed over to them by another party. In this
case, the party requires the professionalism of another individual to effectively manage
the resources.
This definition is lacking some vital points. In most definitions, the authors are not able
to distinguish between the different forms of resources that is being managed and does
27
not clearly state the role of accounting in this stewardship responsibility. Another defi-
nition is considered by Whitehead (1998), who defined the concept using an analogy as
described: the concept of stewardship is seen in the analogy that the owner of a business
entity are not personally involved in its operations. In some cases, it may even be for-
bidden by law for the owners to play an active role in the operations of the business.
This implies that the owners will have to seek for the inputs of other persons to actually
be fully involved in the running of the business and they are supposed to keep relevant
accounts. These individuals are called the stewards, who are individuals that stand in
lieu for the owners of the business and accountable to them for the conduct of the busi-
ness's affairs. In preparing the accounts of any business the accountant must prepare
their financial statement in such a way that they comply with national laws as well as
with the requirements of the owners of the business: whoever they may be (Whitehead,
1998: 13).
This definition is an improvement on the earlier version by Derek (1985) in the sense
that it included the role of an accountant in the stewardship definition. In this definition,
Whitehead (1998) noted that, apart from the accountant performing the role of taking
care of the resources of the principal, the accountant is also involved in preparing the
accounts in such a way that they comply with national laws and the directive of the
owners of the business. The necessity for this is predicative to the fact that the owners
of the business are also interested in understanding the dimensions of their businesses
such as the cost, profit, investments and other aspects of their businesses. With these
information, the owners of the business are able to make a better informed decision than
they would have if they are not privy to such information.
Considering the accounting regulator’s definition, the July 2005 meeting of the Interna-
tional Accounting Standards Board and the Financial Accounting Standards Board as a
tool used to distinguish or separate the performance of a reporting entity’s management
and the performance of the entity itself. The boards noted that the definition of steward-

28
ship as the custodian or safe-keeper of the resources of another party, is a narrow defi-
nition of the term stewardship. Making reference to a broader definition of stewardship,
it can be defined as how the manager/owners has used the resources that is put into a
business.
Stewardship includes the custody and safekeeping of the resources of an enterprise and
also the efficient and profitable use, which includes the protection of the resources
against unfavourable economic factors like the inflation, deflation, technological and
social changes. Therefore the boards concluded that stewardship can be taught of as the
state of being appointed to manage something and being responsible for that action.
Management encompasses being in custody of the resource but providing information
about the quality of the resources and playing other responsibilities that is of interest to
the boards of the organisation (International Accounting Standards Board, 2010).
The role of stewardship is seen in an imperfect market (Young, 1998). By market im-
perfection, we imply the unpredictability of the value of the firm and accountants’ role
– in terms of stewardship – is seen when the assets and decisions are entrusted to the
managers and these managers have absolute information advantage (with respect to
whether they are making appropriate use of the assets to which they were entrusted) over
the owners of the business. In this case, the role of accounting is magnified to enhance
the information quality and accessibility to the owners of the firm. Of course, the main
reason for this is that investors usually delegate decision making process to the managers
and will usually demand form information about the actions that are taken for the pur-
pose of controlling them (Gjesdal, 1981). In the same vein, Rosenfield (1974: 126) states
that the main objective of the financial statements is to present reports that shows the
control and use of resources by the stewards to whom they are accountable to.
Having understood the meaning of the concept stewardship, we go further to examine
some other issues like who is a steward and the responsibilities of a steward.
29
Who is a Steward?
A steward is one, who is appointed to manage the holdings or resources of another indi-
vidual called the agent (Miles, 2012). Some of these resources include financial and non-
financial resources and they cut across the overall overseeing of the wellbeing and ef-
fective management of the resources of the individuals (Jensen and Meckling, 1976;
Fama and Jensen, 1983; Jensen, 1983; Eisenhardt, 1989).
A steward in a business entity takes on a number of responsibility depending on the
different organizational forms, such as corporations, partnerships, trusts, and proprietor-
ships. Generally, the stewards are managers in these organisation (Jensen and Meckling,
1976). For example, the members of an elected board of directors of a publicly traded
company are stewards and are appointed by the present shareholders of the company in
order to manage the affairs of their business entity. Omelinhwa (2000) expounded that
in the situation where a business owner (sole proprietor) who owns a small family busi-
ness hires an individual to manage the affairs of the business, the individual hired is also
called a steward. Such an individual is a steward whose services is required to manage
a part of the owner’s business affairs. In partnership business as well, the partners also
appoint individuals to run the affairs of the business to function for the affairs of the
partnership.
A steward or stewards are responsible for the performance of a number of actions. Some
of them include the initiation of proceedings for the sale or lease of corporate assets that
are outside the regular course of business, new price determination and the general over-
seeing of the negotiations of major contracts. Their responsibilities include the appoint-
ment, overseeing, supervision and the removal of corporate officers and other employ-
ees; likewise, the determination of their compensation is included in the responsibility
roster of a steward. They also perform the role of financial decisions that include the
declaration and payment of dividends to shareholders, among others.
30
2.1.5.2 The Concept of Accountability
The term accountability have been used in different disciplines and context and refers
to varying but similar concept. For instance, in institutional economics perspective, the
term accountability connotes the ability of an elected public officer to be responsible
enough to explain and justify his actions to the public that elected the individual, know-
ing that some form of resources has been handed over to be managed by such individual.
Posner (2006) noted that in the governance structure, effective accountability include
transparency on how the resources are been managed. Lederman, Loayza and Soares
(2005) further stressed this.
On the other-hand, accountability connotes a different but similar definition in the man-
agement sciences. It includes the ability to manage resources and report the outcome of
the management processes to the owner of the resources. Similarly, accountability in-
cludes those individuals’ or organisations’ obligation to account for activities, accept
responsibility for them, and then transparently disclose the results. It also includes the
responsibility for money or other entrusted property.
Considering another fundamental exposition of the concept of accountability, the true-
blood committee that was set up in 1971 and 1972 to advice the American Institute of
Certified Public Accountant (AICPA, 1973) noted that the basic objective of a financial
statement is to provide those sets of information that are useful for making economic
decisions. In the same vein accountability encompasses stewardship. This connotes that
a financial statements should provide information that assists users of the information to
assess whether the management of the enterprise is using the firm’s resources effectively
for the achievement of the primary enterprise goal of maximizing economic returns.
In essence, accountability denotes a stewardship responsibility of ensuring that proper
care is put in place in the management of the resources of principal and reporting same
in such a way that the principal has an absolute knowledge about the developments in
the aforementioned resources.

31
2.1.5.3 The Concept of True and Fairness
The concept of true and fairness in financial reporting entails that the financial statement
of an organization are free from any form of material misstatements (substantial items
that can cause economic loss) and it faithfully represents the financial performance and
position of the reporting entity (Omolehinwa, 2000). The concept ‘true’ suggest that the
financial statement of the reporting entity are factually, accurately and truthfully correct
and it is prepared in accordance with applicable financial reporting guidelines/frame-
works and it does not contain any information that are either misstated or false and can
be misleading. While on the other hand, the concept of ‘fairness’ connotes that the fi-
nancial statements faithfully presents the information about the operations of the report-
ing entity without any form of bias and they reflect the economic substance of transac-
tions and not just the legal form (see Arnold et al, 2010; Omolehinwa, 2000).
True and fair view is a fundamental bedrock principles of preparing financial infor-
mation and reporting same to the users for informed decisions. The concept can be
linked directly to four basic concepts in accounting and that pertains to presenting fi-
nancial information to the users. These basic concepts are the going concern, accruals
(matching), consistency, and prudence (Arnold et al, 2010).
The concept of true and fairness in financial reporting is paramount to the legal perspec-
tive of stewardship and accountability. For instance, the section 393 of the United King-
dom’s Companies Act in 2006 requires that the directors of an existing entity must not
approve an accounting report unless it is certified by a professional as it is giving a true
and fair representation of the financial position of the entity (Financial Reporting Coun-
cil, 2013). Likewise, the Nigerian company act also mandated that all financial statement
of publicly traded entities are required to hire the services of a professional in passing a
comment about the truthfulness and fairness of the financial statement of such entity.
This statement is paramount in providing a reliable source of information for financial
statement users to depend on in making their investment decisions. This implies that any
form of economic loss that arises from their dependent on the financial statement will

32
be entirely borne by the professional who passed such comment on the financial state-
ment.
Importantly, the concept of true and fairness originated in the United Kingdom for many
decades and its principal strength is that the financial statements are expected to reflect
the economic realities of a business and its financial transactions (Financial Reporting
Council, 2013). The concept of true and fair draws heavily from the principle of sub-
stance over form, which connotes that the financial information of a company must not
omit any substantial information, despite the legal form of such information (Arnold et
al, 2010). In the case that the financial statement omits a substantial information as a
result of the legal form, the entity is still liable for misleading users of financial infor-
mation.
2.1.6 STEWARDSHIP AND CORPORATE GOVERNANCE
The concept of stewardship will not be complete without taking into cognisance the
recent development of this concept in modern industrial trail. In contemporary industrial
hub, the concept of stewardship has metamorphosed into corporate governance (Higson,
2003). The concept of corporate governance was made prominent in recent times as a
result of some corporate failures and this concerns about the working of the corporate
system by criticisms of the lack of effective board accountability for such matters as
directors' pay (Cadbury Report, 1992).
The Cadbury committee defines corporate governance as the systems by which compa-
nies are directed and controlled (See Cadbury Report, 1992). In essence, it includes those
frameworks that are put in place to ensure that the resources of the organisation are
efficiently utilised and controlled and even monitored in such a form that the owners of
the resources do not suffer losses on their resources. The committee also noted that the
corporate boards of directors are responsible for the governance of their companies. In
essence, the shareholder's role in the governance of the firm is to appoint suitable direc-
tors and the auditors who should be responsible for satisfying themselves with the fact

33
that they have efficiently installed an appropriate governance structure in place. In en-
suring this, the board is responsible for the setting of the company's strategic aims,
providing the leadership to put them into effect, supervising the management of the
business and ensuring that they report same to shareholders on their stewardship. After
this process is fulfilled, the board also ensures that they appoint external auditors who
are supposed to provide the shareholders with an external and objective check on the
financial statement that is prepared by directors of the firm.
The board should pay particular attention to their duty in order to present a balanced and
understandable assessment of their company's position. The term balance imply that any
form of setback that may jeopardise the success or efficiency of the annual report should
be handled and dealt with such that the report presents a readily understood emphasises
on the relevance of words over figures (Cadbury Report,1992). Tricker (1984) beauti-
fully noted that management is to do with running a business, whereas governance is
about ensuring that it is run properly. The author viewed the corporate governance pro-
cess in four major principal activity. They include: formulating strategic direction for
the future of the company; efficient involvement in crucial executive decisions; efficient
monitoring and oversight function of the management performance; and ensuring ac-
countability.
Higson (2003: 49) noted that the concept of corporate governance was earlier pointed
out by Adam Smith, way back in 1776. The author noted that the directors of companies,
also being the managers of other people's money, may likely not be too involved in the
efficient management of the resources with such intensity with which the partners in a
private copartnery frequently watch over their own affairs. Like every other stewards,
these individuals may likely be apt to pay attention to small matters as against the inten-
tion of the principals. The author also noted that in the light of the self-interest of man-
agers of firms’ resources, the boards of directors (managers) should aim at ensuring the
integrity and consistency of their reports and also ensure the integrity and consistency

34
of their reports. Therefore, is important to consider corporate financial reporting within
the overall context of corporate governance.
2.1.7 FINANCIAL REPORTING
Financial reporting is the act of presenting the financial performance and other as sundry
information to users of the financial information. This act is aimed at ensuring that the
users of these financial information receives adequate information that will enable such
user to take meaningful decisions that pertains to their interest in a reporting entity. The
financial reporting process is highly regulated by some statutory regulatory authorities
such as the Accounting Standards Board, Securities and Exchange Commission and the
Stock Exchange.
The typical financial report should aim at answering the following questions: what is the
profit making trajectory/potential of the business and in terms of how much profit is
being made? How does the assets of the business of the enterprise stack up against the
liabilities? What is the source of finance for the business and how is the business making
use of the available capital to earn further revenue? How solvent is the business in terms
of cash flow? How is the business managing its current success, in-terms of utilisation
of the profit? What is the going concern of the business and can the business be self-
sustaining?
In Nigeria, the Nigerian Accounting Standards Board, now called the Financial Report-
ing Council (FRC), is the body that is responsible for the issuance and monitoring of the
compliance of entities with such released standards. Other regulatory authorizes in Ni-
geria include: the Central Bank of Nigeria (CBN), the Nigerian Insurance Commission
(NAICOM) and the Securities and Exchange Commission (SEC). However, most ac-
counting standard in countries are beginning to comply, adopt or conform to the inter-
national financial reporting guideline.
35
2.1.8 INTERNATIONAL FINANCIAL REPORTING
The introduction of common financial reporting standard around the world can be traced
to globalization and internationalization of business operation. This has led to the de-
mand by parent companies to ensure efficient and effective monitoring of the activities
of their subsidiaries around the world. This has brought about international stewardship
demand by accountant and by extension international accounting.
The concept of international accounting can be viewed from three different perspectives:
the supranational accounting, which involves the standard set by international organiza-
tion to govern the reporting framework for related parties. Such organizations include
the United Nations, the World Bank among others. The second perspective is that inter-
national accounting relates to the framework of reporting adopted by companies and
business in relation to their network of subsidiaries and foreign investments around the
world. The third perspective is that international accounting relates with those standards
and guidelines for reporting, auditing and taxation that is diverse and peculiar with dif-
ferent countries around the world. International accounting can be traced to specific fac-
tors caused by globalization such as the growth of customer base of multinational com-
panies, hedging of foreign exchange risk, among others.
Most multinational companies have customer base around the world. This is as a result
of the growth of the business operations thereby causing international expansion and
customer demand around the world. The growth in the customer base will require bills
to be drawn up in foreign currencies and the process of reporting these in the financial
statement will require adequate foreign currency translation. This will require interna-
tional accounting/foreign currency translation mechanism to properly account for the
transaction. Similarly, exchange fluctuation exposes the company to certain risk and the
company will require adequate technique to hedge against these risks. The company
may also require establishing plants in foreign countries in order to meet the demands
of their customers and reduce the cost of transporting the goods from the factories to

36
their customers. This will result to foreign taxation because the plants that is been estab-
lished in the foreign country will be subjected to the tax regulations suffice in the coun-
try. The parent company will want to adequately monitor the affairs of the foreign sub-
sidiaries by engaging the services of auditors (international audit) to evaluate the finan-
cial statements of the subsidiaries and ensure the information disclosed by them are of
a true and fair view of their activities per time. These among others bring about the need
for international accounting.
This chapter is divided into six sections. The first section will describe the historical
perspective to international accounting around the world. The second section will focus
on the evidence of accounting diversity around the world. Stylized facts on reasons for
accounting diversity around the world with focus on legal system, taxation, and provid-
ers of financing, inflation and political and economic will be discussed in section three,
four, five six and seven.
2.1.9 INTERNATIONAL ACCOUNTING: HISTORICAL PERSPECTIVE1
The concept of international accounting can be traced back to the development suffice
from the 1904 St. Louis world congress accountants. However, the concept of interna-
tional accounting especially with regards to international uniformity around the world
was first introduced. Prior to this, different countries have developed their accounting
system based on the relationship between the agents and the stewards, the legal system
within the country, inflation, and tax system, culture and history of the country among
others. These systems were encapsulated in the Generally Acceptable Accounting Prin-
ciples (GAAP), which different countries impose on companies doing business within
their borders. These GAAP are aimed at generating comparable and reliable accounting
information to aid investors, creditors and others make informed decisions.
However, due to globalization and the internationalization of business activities around
the world, the need for comparable financial reporting by different countries of the world
1 This historical perspective was gathered and summarised from the IASB website

37
suffices. The concept of convergence of financial reporting standard around the world
was first initiated in the late 1950s in response to economic integration and related in-
creases in cross-border capital flows caused by post World War II. Although the need
for international financial reporting was highlighted, which later translated to the actual
initiation of forming the Accountants International Study Group (AISG), which was the
forerunner to International Accounting Standard Committee.
Chronologically, the development of the international accounting has witnessed several
milestones, which has translated to the convergence plan of countries in recent years.
Some of the milestones witnessed during the years with particular dates and events are
highlighted below (Note: this exposition was drawn from the IASB website on chronol-
ogy of development of accounting standard):
In the 1950s and early 1960s, the desire for international accounting standards and some
early steps by the accounting communities was prompted by economic integrations of
different countries as well as the increase in cross border capital flows such as the for-
eign direct investment, portfolio investment among others. The economic integration
after the World War II affected the growth in international trade as well as world eco-
nomic returns (GDP). For instance, world trade in goods and services has risen to nearly
double that of world real GDP. Explicitly, the volume of world trade in goods and ser-
vices increased from about one-tenth of world GDP in 1950 to about one-third of world
GDP in 2000. The rise in the global prosperity stirred up the demand for international
accounting as companies began to require accounting procedure to handle issues relating
to foreign exchange translation of foreign sales, comparable accounting system to mon-
itor the activities of foreign investments among others.
In the period 1962 and 1964, three events occurred, which include the 8th international
congress of accountants convened by the American Institute of Certified Public Ac-
countants (AICPA) and the reactivation of the AICPA committee on issues relating to
international relation. The international congress convened by the AICPA was aimed at
discussing issues that relates to the accountants role in the growing world economy. The

38
outcome of the meeting includes the need to develop reporting, auditing standards
amongst others that can be understandable internationally. After the congress, the
AICPA set up a committee whose objective was to establish programs aimed at promot-
ing international cooperation among accountants. The cooperation was to facilitate dis-
cussions that would lead to agreement on common standards. The outcome from the
committee was a completed review of an accounting standard that would be used inter-
nationally. This standard was published by the association in 1964 titled “Professional
Accounting in 25 Countries”.
In 1966, the accounting association in America, United Kingdom and Canada converged
to form a group called Accounting International Study Group (AISG) with the aim of
studying the differences in their respective standards. The group was in existence for 10
years and 20 different divergence was observed in relation to different accounting issues.
This culminated into the publication of the first book in international accounting. The
book by Mueller was the first text discussing issues with regards to international ac-
counting.
The AISG was later transformed to the International Accounting Standard Committee
(IASC) in 1970s. The discussion towards the establishment of the IASC as the first in-
ternational accounting standard setting body was carried on with the aim of setting
standards that should be adhered to for international financial reporting purposes that
will soothe the interest of users. Such financial reporting must also be internationally
accepted. To achieve this, body collaborated with other national accounting bodies es-
pecially with issues relating to divergence between the standards and the various na-
tional GAAPs. The IASC was established in 1973 by the AICPA and other accounting
bodies in eight other countries. In 1979, the IASC collaborated with the UK and Canada
accounting standard board to form a joint task force to ensure formal collaborations
when developing standards. This resulted into the issue of about 25 standards on differ-
ent accounting issues in 1987. In the same year, the IASC undertook a comparability
and improvement project on the standards to reduce the number of allowable alternative

39
treatments. This is because the standards allowed for alternative treatment for same
transactions because they were to substitute GAAPs of different countries.
In 1988, the IASB became a member of the IASC consultative group and a non-voting
observer in IASB meetings. Prior to this period, the relationship between the IASC and
IASB was informal and they were only consulted when the need be. In the same period,
the support for common accounting standard around the world was pushed forward by
the FASB. The aim of this drive was to ensure a common accounting standard that would
surpass national standard and aid for international financial reporting. This drive was
propagated by the then chairman of FASB Dennis Beresford and in 1990; IASB became
more voracious by collaborating with other standard setting bodies around the world.
This voracity co-opted many other bodies like the US congress and the Security and
Exchange Commission to support the goal.
By 1991, the first strategic plan towards a common accounting standard was issued by
the IASB. The strategic plan includes five specific efforts such as: considering the ex-
isting requirements of international standards; engage in joint projects with other stand-
ard setting bodies; participate actively in the IASC’s processes/meetings; foster interna-
tional relationships among standard setting bodies around the world; expand interna-
tional communications, especially with regards to financial reporting. The first strategic
plan paid off with the release of segment reporting from the joint project between the
FASB and the accounting standard setting board of Canada in 1993. Similar collabora-
tion was observed in the relationship between the FASB and the accounting standard
setting body of Canada, United Kingdom, Australia and New Zealand to form the G4+1.
The aim of the collaboration was to pursue carryout research and propose solutions to
common accounting issues. A major outcome from this was the project undertook by
FASB in collaboration with IASC to improve the standard on earning per share.
As part of the community service, IASB undertook a project to compare the US GAAP
and the IASC standards in 1995. This resulted into the publication of the book The IASC-
U.S. Comparison Project: A Report on the Similarities and Differences between IASC
40
Standards and U.S. GAAP in 1996. Also, in 1995, the International Organization of Se-
curity Commissions (IOSCO) agreed to endorse the IASC standards based on the con-
dition that IASC core standards would be acceptable for recommendation for cross bor-
der capital and listings purposes.
In 1996, the need arose to seek for an international standard that would enhance cross
border listings and inflow of foreign investors into the United States capital market.
Concisely, the American Securities Market reiterated the need to attract cross border
security offerings in the US stock market. The SEC was mandated to enhance this pro-
cess and report was expected within a year. The SEC considered the IASC standard for
this purpose, but required that the standard satisfy three main criteria: very comprehen-
sive, high quality and can be interpreted and applicable to users.
The Asian crisis in 1998 further prompted the need for an international financial report-
ing standard by a joint decision from the World Bank, International Monetary Fund and
the various finance ministers of the G7. This was because there was an urgent need for
rapid adoption of high quality financial reporting practice.
In 1999, the FASB Publishes its Vision for the Future of International Accounting Stand-
ard Setting. At this date, the FASB published International Accounting Standard Set-
ting: A Vision for the Future, which described the vision of the ideal international finan-
cial reporting system. The report noted that the system would be characterized by a sin-
gle set of high-quality accounting standards characterized by a single standard setter that
will be absolutely independent. As at 2000, the Pace of Convergence Accelerated. At
this date, the FASB and IASB agree to Work Collaboratively. At the same period, the
SEC Issued a Concept Release on International Accounting Standards. The concept re-
lease was aimed at developing a broad input on a framework of the convergence of
accounting standards. They also sought input on the conditions that must be in place for
the SEC to accept the financial statements of foreign private issuers prepared using
IASC standards.
41
In 2001, the IASC was reconstituted Into the International Accounting Standard Board.
The IASB was in response to calls for the improvement in the governance, funding, and
independence of the IASC. There is similarity between the governance, oversight, and
standard-setting processes of the IASB and that of the FASB. As an independent stand-
ard-setting Board that is appointed and overseen by a group of Trustees of the IASC
Foundation, the IASB was established. Since then, the IASB has made progress. For
instance, in 2002 the European Union decided to use the IASB standard (IFRS) by re-
quiring all listed companies to prepare their consolidated financial statements using the
standard, starting from 2005. This become the first major capital market to require IFRS.
After this, the EU subsequently decided to “carve-out” a portion of the international
standard for financial instruments, which became an European version of IFRS.
In 2002, the FASB and IASB Agree to Collaborate, which was tagged the ‘Norwalk
Agreement’. In September 2002, the FASB and the IASB had a joint agreement to work
together to improve and converge U.S. GAAP and IFRS. The agreement was tagged the
“The Norwalk Agreement,” which was issued after the joint meeting. The Norwalk
Agreement set out the shared goal of developing compatible, high-quality accounting
standards that could be used for both domestic and cross-border financial reporting. In
2003, the SEC re validates the position of the FASB as the U.S. private sector standard
setter, based on the pursuant of the Sarbanes-Oxley Act of 2002; the FASB was to ensure
the convergence of high-quality standards with international practices, which should be
appropriate in the public interest and for the protection of investors.
In 2005 the SEC Proposed a Roadmap to the Elimination of the Reconciliation Require-
ment. The proposed Roadmap identified several milestones that would support elimi-
nating the reconciliation for foreign private issuers filling financial statement under
IFRSs and reconciling reported net income and equity to US, , if achieved. By 2006, the
FASB and IASB Issued a Memorandum of Understanding that described the progress
they hoped to achieve toward convergence by 2008. While in 2007, four major events

42
occurred. Firstly, the SEC proposed and subsequently eliminated the Reconciliation Re-
quirement. In the same year, the SEC Issued a concept release on possible optional use
of IFRS by U.S. Issuers. Thirdly, the FASB responds to the SEC’s Concept Release on
Possible Optional Use of IFRS by U.S. Issuers. The response reaffirmed the FASB’s
support for a single set of high-quality common standards developed by an independent
and international standard setter. Fourthly, the FASB and IASB issued a converged
standards on business combinations.
In 2008, the FASB and IASB updated their Memorandum of Understanding. The MoU
is an update to the 2006 MoU to report the progress made since 2006 and to establish
their convergence goals through 2011. In 2008, the SEC issues a proposed roadmap to
adoption of IFRS in the U.S. and a proposed rule on optional early use of IFRS. Under
the proposed Roadmap, the Commission would decide by 2011 whether adoption of
IFRS would be in the public interest and would benefit investors. The response to the
comment letter was released in the same year. By 2010, the SEC Issued a Statement in
support of convergence and global accounting standards. In the same year, FASB reports
periodically on the status of their project to improve and converge with the U.S. GAAP
and IFRS. In 2011, a progress report on IASB-FASB convergence work was released.
In April, the FASB and IASB reported on their progress toward completion of the con-
vergence work program. The Boards were giving priority to three remaining projects on
their Memorandum of Understanding (financial instruments, revenue recognition, and
leasing) as well as their joint project on insurance.
2.1.10 CONCEPT OF IFRS ADOPTION
The International Financial Reporting Standard (IFRS) is a globally-accepted standard
that aids in the preparation of financial reporting as well as in the interpretation of ac-
counting numbers that are included in the said financial report. It is a guideline that aids
the preparers of financial report to present a financial statement that is of higher quality,
transparent and comparable with globally prepared financial report (Asiemo, 2013).
Stemming from this, the drive towards the usage of a globally acceptable financial report
43
in a global context is embedded on the fact that accounting numbers ought to be com-
parable and easily utilised irrespective of the location of the individual that requires
them. Therefore, an accounting number that is prepared by a professional in Africa can
easily be understood by professionals in other African countries and around the world
in general.
Financial reporting are designed to be used by profit oriented entities (Asiemo, 2013),
who are operating with the perspective of having a global audience that have a stake in
their annual report or who utilises their annual report for decision purposes. Firms have
gone beyond private entities because of the complexity of the business environment and
the dynamic requirement of their annual report for investment purposes. The need for
the transition of firms from private enterprises to a public one can also be linked to the
fact that most firms require more capital to run their operations. Being this as it may,
they gather capital from varying sources to foster their operations. This suggest that
these firms will require proper accountability and reporting practice to be able to gain
the trust of their stakeholders. More so, some of these stakeholders are not nationals of
the country of resident of the firm and based on that, there will be the need to utilise an
accounting framework that is universally and generally applicable at varying contexts.
Gordon, Loeb and Zhu (2012) clearly emphasises the need for the adoption of IFRS as
it will aid the global flow of capital. Asiemo (2013) also noted that having a single set
of high-quality globally accepted accounting standards is important especially in in-
creasing the global capital markets. This can be achieved by the functionality of IFRS
in bridging the information gap between the providers of capital and the users. The cum-
bersomeness involved in the interpretation and understanding of accounting statements
prepared using the national gaps will be reduced with the advent of IFRS. This is because
the singleness of accounting standards that are utilised in the preparation of the annual
report will reduce the cost of translating the financial report as well as the cost of inter-
preting it. In this case, the overhead cost of operating a capital investment venture in a
host country will be expunged with the adoption of IFRS.

44
In having a grasp understanding of IFRS, it will be important to devote some time in the
study of the conceptual framework that encumbers the underlining concepts of IFRS. If
these concepts are understood, it will be easy to follow through in understanding the
general framework that guide the interpretation and understanding of IFRS. Taking this
further, the Conceptual Framework sets out the varying concepts that trigger the prepa-
ration and presentation of financial statements. In essence, it is a practical tool that as-
sists the IASB when developing and revising IFRSs.
2.1.10.1 The Evolving Concepts in the IFRS Framework
The first revolving concept that will be discussed is the concept of assets and liabilities.
The traditional definition of Assets and Liabilities is such that they focus attention on
economic phenomena that exist in the real world, which include resources and obliga-
tions that are relevant to users of financial statements. These items (assets and Liabili-
ties) cannot be classified as such if they are not seen or felt, and in the usual auditing
process, external auditors requires a verification of assets and liabilities before they are
included in the annual report of the firm. This is coined as audit evidence in Izedonmi
(2000). In this case, it includes those physical evidences that verifies the information
provided by the audit client in the annual report.
The IASB made some clarifications to the traditional definition of assets and liabilities.
They noted that an asset (or a liability) should be such that it represents the underlining
resources in a business, rather than it being the ultimate inflow (or outflow) with yielding
economic benefits. They also highlight that an asset (or liability) should be such that it
is able to generate economic benefits from its inflow or outflow. Hinging on this, the
IASB proposes that an asset should be any item that represents a present economic re-
source that are controlled by the firm as a result of their past events. In the same vein, a
liability should be such that it represents a present obligation of the entity to transfer an
economic resource as a result of past events. Building on this, an economic resource
therefore is a right, or other source of value, that has the capacity to produce economic
benefit (see IASB, 2010).

45
IASB also noted that the definitions of assets and liabilities should be such as does not
retain the notion that an inflow or outflow is expected before such an item is qualified
to be called an asset or liability. In essence, an asset must be such as is able to produce
economic benefits, while a liability should be such as is able to result into the transfer
of economic resources from the firm to other parties. Since it is an obligation, then it is
required to be paid back to such persons that the company is obligated to pay.
In the view of the IASB, an obligation can be viewed as an event that has arisen from
previous events, depending on the amount of the liability, which will be determined by
reference to benefits received or other form of activities that are conducted by the entity
before the end of the reporting period. The IASB views an obligation from three differ-
ent perspectives: the first is that it is a present obligation that must have arisen from past
events and must be strictly unconditional on other events. This imply that the entity does
not have a present obligation if it could, at least in theory, avoid the transfer through its
future actions. Therefore, the entity must pay and not be able to transfer the payment.
The second view is that the obligation must have arisen from past events and be practi-
cally unconditional. The term ‘practical un-conditionality’ implies that the obligation is
practically not dependent on whether the entity does not have ability to avoid the transfer
through its future actions. The third view is that the present obligation must have arisen
from past events but may be unconditional on the entity’s future actions.
The next to be discussed is that of income and expenses. In the IFRS conceptual frame-
work, the definition of income and expense transcends the traditional definition of these
two concepts. Traditionally, income is seen as a form of inflow of economic resources
into the particular business entity. On the other hand, expenses are seen as a form of
financial outflow that involves financial resources leaving the business entity (see Wood
and Omuya, 1982). In relation to IFRS conceptual framework, income involves those
increases in economic benefits during the accounting period in the form of inflows or
enhancements of assets or those decreases of liabilities that result in increases in equity
of the business entity. This is other than those relating to the contributions from equity
46
participants. Expenses on the other hand include those decreases in economic benefits
during the accounting period in the form of outflows or depletions of assets or incur-
rences of liabilities and obligations that result in the decrease of the equity of the busi-
ness entity.
The income and expenses of the firm, provides users of financial information with those
set of information that relates to some of the changes in an entity’s resources and obli-
gations. This is linked to the fact that the return on the equity of the business is tied to
some of these information. For instance, to understand the return on the equity of the
firm, there is the need to produce the volume of the economic resources attributable to
such firm. This information also helps users to understand, in return, the extent of the
future net cash inflows of the reporting entity. They can use this information to predict
about the future occurrences in the firm, in relation to its capacity to earn. It can also
help users of financial information to understand how efficiently and effectively the
management of the entity has effectively discharged their responsibilities in the man-
agement of the resources entrusted to them.
The IASB also clearly distinguishes gains from revenue and losses from expenses. In
their definition, revenues arises from the course of the ordinary activities of the business
entity. Gains represents all those other items that meet the definition of income and may
likely or may not arise in the ordinary activities of the business entity. On the other hand,
expenses arises in the course of the ordinary activities of the business entity, while losses
may or may not arise in the ordinary course of the operations of the business entity.
2.1.10.2 IFRS Application around the World: The European Union Experience
Particular attention is given to the European Union and how they have fared with the
adoption of IFRS. The reason being that this regional organisation were among the first
to adopt the IFRS by making it mandatory that all member states begin the usage of
IFRS for their publicly listed entity latest by first January, 2005. An in-depth observation
47
was given to the survey conducted by IASB in 2015 on the state of IFRS adoption in
European Union (EU) and the following fall out was observed:
The EU has made its public commitment for the support of moving towards a single set
of high quality global accounting standards, which in its form is the IFRS. The public
commitment was made in 2002, which was exactly a year after the formation of the
IASB from the IASC and the subsequent release of the first IFRS standard in 2003. The
EU adopted the IFRS for usage in preparing the consolidated financial statements of
listed companies, whose securities are traded in member countries stock market. The
adoption was supposed to be effective in 2005.
The IFRS adoption in EU member countries allowed for the freedom of the member
states to have an option of permitting IFRS for small security exchanges that are not –
in any form- deemed regulated markets; for separate financial statements for all or some
of the companies whose securities are traded on a regulated market; for the consolidated
financial statements of all or some companies whose securities are not traded on a reg-
ulated market; used for the financial statements of all or some companies whose securi-
ties trade on a regulated market.
The EU countries require IFRS for some foreign companies whose securities are pub-
licly traded in the stock market of any member country. They require that these compa-
nies use the IFRS in the preparation of their consolidated financial statements unless the
European commission deems their accounting standards to be equivalent to IFRS. In
such a case, such company can use their local standard in the preparation of their finan-
cial statements. This provision is applicable to all listed foreign companies whose secu-
rities trade in a publicly listed companies.
The external auditors report are also expected to state clearly that the financial statement
of the firm are prepared in accordance with stipulated guidelines as such as it is IFRS as
adopted by the EU. This is expected since the IFRS is seen as the acceptable legal frame-
48
work for the preparation of financial statement in this region. More so, the IFRS is trans-
lated into the different languages of members of the EU. This is a pointer to the fact that
the commission is interested in the usability of IFRS by member countries and goes
ahead to reduce any form of encumbrance that might usurp the ultimate goal of unifying
the accounting standards.
The European Union has twenty four (24) official languages including Bulgarian, Cro-
atian, Danish, Dutch, English, Estonian, Finnish, French, German, Greek, Hungarian,
Irish, Italian, Latvian, Lithuanian, Maltese, Polish, Portuguese, Romanian, Slovak, Slo-
vene, Spanish and Swedish. This implies that IFRS must be translated into these lan-
guages before they are applicable to the respective member countries (European Union,
2014).
The European Union has not adopted IFRS for Small and Medium Enterprises. The rea-
son being that the IFRS for SMEs was seen as being incompatible with the European
Union accounting directive. As a result of this, the IFRS for SMEs was not endorsed by
the European Union commission.
2.1.10.3 The African Experience
In the African region, there has not been any tangible step taken by the African Union
to support the need for a continental adoption of the standard. Individual countries are
making such moves as they perceive the benefit emanating from the adoption of the
standard. Bruce (2011) has this to say about Africa’s adoption of the IFRS standard: the
recent change in the global economic landscape of the BRICs countries (i.e. Brazil, Rus-
sia, India and China), which is tandem to the rising economy of Africa and their focus
on the rapid expansion of their economy, hinges on the fact that the improvement of
financial reporting within these countries and region (as a whole) is an important part of
strengthening of the story of economic growth. This suggest that for a sustainable form
of development to be in existence, countries rapid growth and the need for expansion
must be tied to the development of their financial reporting infrastructure.

49
There is also the need for the deepening of Africa’s capital market for sustainable
growth. To achieve this, there is a range of events that must be brought to light. Chief
of them is the need to transcend from the local accounting standards to the adoption of
International Financial Reporting Standards-IFRSs (Rooyen, 2011). This is in order to
create an investor friendly business environment that will be suitable to ensure the re-
turns on investment.
There are some challenges in the adoption of IFRS in Africa (Rahman, 2011). Some of
these challenges include the fact that Africa is a vast continent and have their strengths
and weaknesses in the implementation of a common form of financial reporting standard
with the west. Her institutional strength is not as developed to contain the investor pro-
tection attribute that underlie IFRSs extent of disclosure. More so, the diverse colonial
root makes it difficult for some countries with a strong colonial tie find it difficult to
break away for the implementation of IFRS. For instance, countries of the Francophone
African origin tend to retain their culture of sticking with the French domestic account-
ing rules. This cannot be separated from the fact that most investment and trade in these
countries are preoccupied by French investors and partners.
There are difficulty in the application of a uniform accounting standard, especially for
African countries to effectively adopt the IFRS guidelines and framework. This is be-
cause the legal standard for the preparation of annual reports must be matched with the
capacity to apply the requirements of the standard. For example, the author notes that
the number of qualified accountant in the Francophone part of the region. Therefore, the
author suggest that it will take longer time for them to get the requisite technical capa-
bilities required for the successful adoption of IFRS. Hence, some authors note that with
a simplified IFRS, countries in this region will not easily comply with the stipulations
of IFRS in the next ten (10) years. Some countries in Africa are developing their capacity
through an intensive training of professionals in the form of workshops and seminars.

50
Some of these countries include Kenya, Uganda and Zambia, who are all moving to-
wards a critical mass of professional and capable professionals to perform their duties
and responsibilities.
This is the central issue with the adoption of IFRS in Africa – the unavailability of ca-
pable professionals to follow through with the guidelines and principles of IFRS. As
typical of the African region, there is enthusiasm regarding the adoption of IFRS as
African countries are expecting deluge of FDI inflow from this policy action. However,
building up of the critical mass of the means to successfully implement IFRSs is still
lacking in diverse ramifications. Countries in the West African Economic and Monetary
Union (WAEMU-comprising of Benin, Burkina Faso, Guinea Bissau, Ivory Coast, Mali,
Niger, Senegal and Togo), for example, are on the road map to the implementation of
IFRS for SMEs and has the legal ability to enforce same. However, the necessary ca-
pacity to drive this accomplishment is lacking.
The Eastern Central and Southern African Federation of Accountants (ECSAFA) pre-
sents a different report. The region comprises of Angola, Botswana, the Democratic Re-
public of Congo, Ethiopia, Kenya, Lesotho, Malawi, Mauritius, Namibia, Rwanda,
South Africa, Sudan, Swaziland, Tanzania, Uganda, Zambia and Zimbabwe. As such,
the countries in this region have all agreed to adopt IFRSs and the IFRS for SMEs. They
believe that the adoption of IFRSs was the right thing to do and adapting IFRSs was not
the thing to do. South Africa, being the power house for the development of accounting
infrastructure in Africa and as a result of this, its national standards have been converg-
ing with IFRSs and has led driven the need for the implementation of IFRSs in their
financial reporting infrastructure.
The issue with the African countries decision to adopt IFRS goes beyond the adoption
of the standard, but on their ability to implement such standard. However, apart from
the reasons given above, there are other bottle-necks that hinders the ability of African
countries to derive measurable benefits from their adoption of IFRS. Some of these bot-
tle-necks are:

51
First, considering the pecuniary benefit from the adoption of IFRS – that is the improved
comparability and uniformity of financial statements among companies that will bring
about a decrease in the equity cost of capital and improved transparency, it is evident
that these benefits may likely not be reached in then African context. This is based on
the argument that IFRS was designed for the capital markets that are already developed
or matured. This is based on the fact that financial statements prepared by the preparers
are supposed to aid in investment valuation, especially in the buying and selling of se-
curities. In this case pushing IFRS for usage in countries without stock market or for
which there are no tangible quoted stocks makes the benefit of IFRS to these countries
to be questionable. More so, some of these African countries have a totally different
financial reporting needs than developed and industrialised countries do.
Another interesting point to note is that some of the highly industrialised countries have
converged their national GAAP with the IFRS. Thus, suggesting that the weak adopt
IFRS while the strong converge their national GAAP with some parts of IFRS. In this
case, the strong countries converge their national GAAP with some provisions of IFRS
in order to have a more robust accounting standard for usage by quoted companies. In
developing countries like those in Africa, have adopted the standard hook-line-and
sinker. Most developing countries have adopted IFRS without modifications.
2.1.11 WHY WILL A COUNTRY ADOPT IFRS?
This study is focused on the International Financial Reporting Standard-IFRS adoption
or otherwise decisions of African countries to adopt the IFRS. This is based on earlier
submission that dearth of knowledge on country specific factors that can have influence
the decision to either adopt or otherwise IFRS. In Africa, unlike Europe (European Un-
ion), there is no unified mandate subscribed by member countries to adopt the standard.
This is evidenced in the solitary decisions based on diverse dates of subscription of Af-
rican countries to implement the financial standards.
52
These solitary decisions are influenced by some factors inherent in the country. For in-
stance, countries are likely to adopt the IFRS if the expected growth and level of foreign
capital inflow and international trade are high. This is because these countries will per-
ceive IFRS as beneficial to sustaining their economic growth. This study will examine
this stance in relation to countries in Africa by finding out if perceived value from having
a shared body of accounting standards is able to explain the decision to adopt IFRS by
African countries.
In line with this, Ramanna and Sletten (2009) notes that institutions and the quality of
local governance institutions of countries can explain the decision to adopt IFRS. This
is based on the fact that countries with higher quality institutions will demand better
transparency as well as quality accountability. Scoot (2001) also noted that the major
factors accountable for the decision to adopt IFRS by a given country are the isomor-
phism emanating from the societal institutions; however, this stance is not ravelled in
Africa. This is based on the fact that the institutional development in Africa is poor
compared to other regions of the world and this may affect their decisions to adopt stand-
ards that will enhance transparency and accountability. This is because African countries
may not have the relevant institutional infrastructure to facilitate the adoption of IFRS.
Hence, the study is poised to find out the extent which quality of indigenous governance
institution of African countries is able to explain the decision to adopt IFRS.
IFRS has been adduced to be Pan European (Ramanna and Sletten, 2009). This implies
that the standard is set to soothe demand by European financial reporting users. This is
no doubt why the European Union general assembly subscribed to the compulsory uti-
lization of the standard by all quoted companies in member state from 2005 (see the
2002 European Union report). Therefore it is possible that countries acculturation with
Europe will influence the countries decision to adopt the financial reporting standard.
Therefore, this study also intends to find out if African countries acculturation with Eu-
rope has an impact on their decision to adopt IFRS.

53
More so, the network effect of countries relationships is also envisaged as an influencing
factor to adopt IFRS. Network effect is a phenomenon where countries decision to adopt
IFRS is influenced by actions of other countries in the same regional blocs/or countries
they have close ties with. For instance, if the major source of FDI is a country that has
adopted IFRS, there is a high tendency that pressure will be mounted on the recipient
country to adopt IFRS. Similarly, in a regional bloc where many influential countries in
the region has adopted IFRS, there is a high tendency for other countries to follow
soothe. Although there is no empirical evidence validating this especially with regards
to African countries, thus this study also intends to find out if IFRS decision is influ-
enced by network benefit attributable to country’s relationships with other countries that
has adopted IFRS.
The influence of the country in international politics can affect their decision to adopt
IFRS. For instance, a country that is influential in international politics may likely adopt
IFRS. This is because they may want to align with global demands compared to less
influential countries on issues in international politics. By extension, this may not be the
outcome in all cases. For instance, America is yet to adopt the IFRS irrespective that
they are influential in international politics. However, African countries have been more
of adopters of international views on relevant issues. Therefore, the study wants to also
find out the extent of effect a country’s influence in international politics will have on
their decision to adopt IFRS.
The quality of education also matters in the formation process of standards in a country.
This is because it is expected that country with an enhanced education and literacy level
will find it easier to adopt IFRS since users and preparers of financial information will
be able to understand the standard. This supports the normative isomorphism that coun-
tries will tend to adopt IFRS depending on the capacity and quality of their educational
system (Scoot, 2001). The quality of education can also include the extent of profes-
sional accounting education penetration in a given country. However extant studies have

54
not investigated this, therefore this study also intends to understand the extent educa-
tional quality will have on the countries decision to adopt IFRS.
The study also intends to find out the relationship existing between countries natural
resource endowment and their decision to adopt IFRS. This is pertinent given the fact
that countries with more natural resource may be an attraction for foreign investment,
thereby putting pressure on them to adopt IFRS. Most foreign direct investment (FDI)
in Africa is resource driven and tends towards the exploitation of the primary sector. As
a result of this, there is a tendency that the parent companies of these FDI may want
efficient monitoring of the activities of their subsidiaries in Africa leading to undue pres-
sure on the government of the countries to adopt IFRS. Hence, this study intends to
observe whether the extent of a countries natural resource endowment have an impact
on their decision to adopt IFRS.
2.1.11.1 Value from having a Shared Body of Accounting Standards
There are several values that can be derived from having a shared body of accounting
standards. IASB (2010) observed that the adoption of IFRS can help to reduce the cost
of capital. This was elaborated by Jensen and Meckling (1976) and Fama and Jensen
(1983), who documented that the monitoring cost of debt by creditors can be reduced
through better disclosure and this cost saving can be transferred to the company by the
reduction in the cost of capital. Put differently, when a country adopts the IFRS, there is
the tendency to reduce the cost of translation of financial statement. At this point, pro-
viders of finance spend less in understanding monitoring the financial statement of the
borrowing company.
Some other studies have found that foreign direct investment (FDI) inflow can be a ma-
jor benefit from having a shared body of accounting standards (e.g. Ramanna and Slet-
ten, 2009). FDI has to do with the transfer of capital, managerial and technical assets of
a firm from one country (home country) to another (host country). These transfers are
induced by the need to reduce operational cost (cost of labour and materials), better
55
access to capital, to avoid trade restrictions and better access to cheap available factors
of production. Despite the benefit of FDI in host countries, not many countries attract
FDI’s. The reason attributable to this is diverse. However, the cost of monitoring sub-
sidiaries can be a major disincentive for not establishing subsidiaries in some countries.
In support of this, Beneish et al. (2012) stated that IFRS adoption has an influence on
the extent of foreign equity and debt inflows. The relationship between a country’s adop-
tion of IFRS and the extent of FDI inflow can be viewed from the fact that companies
will want to establish subsidiaries in countries where the monitoring cost is low. This is
because the parent company wants to minimize cost and maximize profit and by so do-
ing, will demand for lower cost of translation and monitoring the financial performance
of their subsidiaries. Gordon et al (2012) examined this issue in the light of transparency
as fostered by IFRS adoption. They observed that IFRS adoption can enhance financial
report transparency, which can lead to the attraction of multinational corporations to the
country.
Some other benefits attributed to the adoption of IFRS is trade benefit. Trade includes
the exchange of goods and services between different countries of the world. IFRS has
been noted to enhance this exchange in the form of attracting companies to set up plants
that can enhance the production process and by extension, foster trade. Ramanna and
Sletten (2010), studying the network effect from the adoption of IFRS observed that
greater dependence on foreign trade increases benefits from reduced transaction cost as
a result of IFRS adoption. As a result of these benefits from IFRS adoption, countries
that are dependent on trade or FDI will have more reasons to adopt IFRS than less de-
pendent countries. This promotes the argument that a country will likely adopt IFRS
when the perceived benefit from the adoption decision is high.
2.1.11.2 Quality of Indigenous Governance Institutions
Institutions are rules and frameworks that are put together by a set body, intended to
regulate human behaviour within a society. The majority of scholars define institutions

56
as the rule of the game (e.g. La Porta et al, 1999; Williamson, 2000; Acemoglu et al,
2001). This includes the humanly devised constraints that shape interactions in an eco-
nomic system (North, 1990). In consequence, institutions structure the incentives in hu-
man exchange, whether political, social or economic. North (1990) further expounded
the definition of institutions by noting that any formal rule is partially backed, supple-
mented or contradicted by implicit rules, which can take the form of taboo, customs and
traditions. This implies that in a society, the quality of institutions can be viewed from
two perspectives: the formal institutions and the informal institutions.
The formal institutions include those written down rules and regulations which are sup-
posed to be abided by in the relationship between economic agents. These include the
constitutions, policies and other forms of regulations. The informal institution include
those non-written down guidelines, in the form of traditions, customs, beliefs and norms
that regulate behaviours of a particular group of persons. These kind of institutions are
usually not formalized but are upheld by the behavioural pattern of the persons that are
banded by the institutions. For the focus of this study, we will focus on the formal insti-
tutions.
The quality of indigenous institutions can influence a countries decision to adopt IFRS.
For instance, a country with poor institutional framework in terms of poor regulatory
quality, poor rule of law and poor judicial system, may not have the necessary capacity
to foster the adoption of IFRS. Ramanna and Sletten (2009) pointed out that accounting
standards evolve in the context of domestic, cultural, legal and other institutional fea-
tures. This includes issues such as the auditing framework of a country. Ball (2006)
observed that the cost of accounting harmonization may be gruesome if it is not accom-
panied by changes to related capital market institutions.
The relevance of institutional quality cannot be neglected because accounting standard
is a subset of the quality of institutions prevalent in the country. Ramanna and Sletten
(2009) noted that local accounting standards are part of a complex system of governance
institutions. Therefore, the development of the indigenous institutions will lead to the
57
development of accounting standards in the country. In this case, the compatibility of
institutions with world practice matters. For instance, a country with autocratic system
of governance may not promote the implementation of IFRS standard, other things been
equal. This is because the implementation of IFRS will require a system of government
that protects property rights; enhance the role of the press and reduction of corruption.
2.1.11.3 Countries’ Acculturation with Europe
Acculturation with Europe relates to the country’s affinity with European culture. This
includes a country’s closeness to the values and tenets of Europe. In this case, the lan-
guage affinity, religious affinity and international relations cannot be over emphasized.
Dong (2014) noted that the perception of IFRS as a European institution will likely af-
fect the acceptance of the standard in a given country. This is especially when the coun-
try is not acculturate with Europe. Ramanna and Sletten (2009) noted that countries that
are more acculturated with Europe will find it more politically feasible to accept IFRS.
This is unlike countries where European institutions are non-native and the adoption of
IFRS in such case will be viewed as abrogating authority to a European standard-setter.
When examining the extent of European acculturation of a country, it is note-worthy to
put into consideration the colonial relationship of a country. This is because a country
that is a colony of a European country will hold allegiance to their colonial master. This
implies that their economic values and institutional framework will be patterned after
their colonial masters. Ramanna and Sletten (2009) further observed that colonial rela-
tionships with Europe can bring about strong cultural ties regardless of the religion of
the country. They made an annotation that the cultural ties are likely to become stronger
with the passage of time. This is because as the time goes by, the former colonies view
begins to have a favourable view of their former colonial masters.
58
2.1.11.4 Relationship with other Countries that have Adopted IFRS
The relationship of a country with other countries that have adopted IFRS is crucial in
the adoption of the standard. Many studies have considered this relationship as the net-
work effect. Countries do not make national policies in isolation. This implies that be-
fore a country adopts IFRS, there must have been a reason as a result of their relationship
with other countries. This connotes that the impact of IFRS on the country that has ear-
lier adopted the standard will act as a motivation for other countries to adopt the stand-
ard.
Studies have observed that IFRS, as a globally recognized body of standards, can lower
the transaction costs for foreign users of financial statements (Ramanna and Sletten,
2010). That is, users of financial statement outside the country will spend lower cost in
understanding and interpreting the financial report prepared using IFRS. By this, a coun-
try will rather adopt IFRS in order to sustain the relationship with other countries that
have adopted the standard. Put differently, as more jurisdictions with economic ties to a
given country adopt IFRS, the perceived benefits to that country from lowering transac-
tions costs to foreign users, and thus from adopting IFRS, can increase (Ramanna and
Sletten, 2009).
The African experience may not be entirely different. For instance, the adoption decision
of Nigeria may be traceable to the decision to adopt IFRS by other countries in Africa
such as Ghana and South Africa.
2.1.11.5 Strength of the Adopting Country in International Politics
Considering the strength of the country in international politics is vital in explaining the
decision to adopt IFRS in Africa. Due to the protection of the countries status in the
international sphere, the country will want to align itself with international occurrence,
therefore the need to adopt IFRS.

59
On the contrary, Ramanna and Sletten (2009) noted that a country that is more powerful
in the international sphere will less likely adopt IFRS. This is based on the fact that more
powerful countries will be less likely to surrender their standard for international stand-
ard. They have influence over their decision and they can stand with their decision irre-
spective of pressure from the international community. The United States FASB is a
testimony in this regard. Despite the benefit from the adoption of IFRS, the US has not
adopted the standard, owing to the peculiarity of the US GAAP.
The discourse on the influence of the strength on the country in international politics is
still under contentions. There are basically two sides to the discourse considering that
more powerful countries may intend to adopt the standard in order to sustain their image.
On the contrary, these countries may not intend to adopt the standard in order to sustain
their local standard.
2.1.11.6 Quality of Education and IFRS Adoption
In the comprehension and adoption of national policies, the role of the education of the
populace cannot be neglected. The literacy level of the citizens of a country will affect
the extent of their comprehension of national policies and guidelines. Focusing on the
issue of IFRS adoption, the standard may be too complex if the educational capacity of
the people is low. Scoot (2001) noted that the major factors accountable for the decision
to adopt IFRS by a given country are isomorphism emanating from the convergence of
the desires, structure and actions from the three levels of institutions. These isomorphism
include the level of education of the country.
It can also be argued that a lack of adequate education of accounting information users
can lead to increase in accounting illiteracy. This can affect the extent of adoption as
they become cultural barrier for the adoption of IFRSs in the country. Apart from acting
as barriers to the adoption of IFRS, the extent of education can also influence the length
of time it takes for the citizens to get accustomed to the newly adopted IFRS standard.
This is because users of the financial information may take a while to get accustomed to

60
the newly adopted standard if they are not well educated to comprehend the tenets of the
standard.
Madawaki (2012) observed that the practical challenges facing the transition from local
standards to IFRS in Nigeria can be traceable to the level of education and training of
the users and preparers of financial statement in Nigeria. This implies that the level of
education cannot be neglected in the adoption process of IFRS. Furthermore, the prac-
tical implementation of IFRS will require the relevant technical capacity among the pre-
parers and users of financial statements. This includes the auditors and other regulatory
authorities such as the security and exchange commission.
2.1.11.7 Natural Resources and IFRS Adoption
There remains a rising contention that the demand for IFRS can be traceable to pressure
from the international community for countries to adopt the standard in order to enhance
the reporting of subsidiaries in other countries. In Africa, multinational corporations are
mostly involved in the extractive industries, where they deal with the mining and pro-
cessing of raw materials. By this, the tendency for pressure to adopt IFRS increases in
order to enable a better understanding and interpretation of financial statement prepared
using the local standards.
Dirk (2006) argued that literature on FDI inflow has emphasized that the risk of FDI
destroying local capabilities and extracting natural resources without adequately com-
pensating poor countries persist. A vivid example is the case of Nigeria, where the bulk
of multinational inflows have focused on the oil extractive industry. This will have a
long run effect on national policies and framework of reporting.
The inflow of multinationals having an impact on reporting framework of a country is
not farfetched. This is as a result of the fact that Parent Company will want to induce
the host country about the need to change their reporting framework in such a way to
soothe their monitoring capacity. This is most rampant in FDI dependence countries

61
such as most African countries. This can also be explained in line with the coercive
Isomorphism as illustrated in Scoot (2001).
2.1.12 CONCEPT OF FOREIGN INVESTMENT
Foreign direct investment, commonly known as FDI, include those types of investment
that are made to acquire a lasting or long-term interest in an enterprise that operates
outside of the economy of the investor. This form of investment is termed a direct in-
vestment because in involved investors (which could either be a foreign individual, com-
pany or group of individuals) that are seeking to control, manage, or have a significant
influence over the foreign enterprise. On a simpler sense, foreign direct investment can
be seen as a firm having controls or a strong influence over another firm that is located
abroad (Piana, 2005). Such controls can come in the form of owning an equity control
of more than 10 percent, where the firm that owns this percentage is termed the parent
while the other firm is regarded as the affiliate. Foreign Direct Investment is also those
financial investment that gives rise to a sustaining investor’s significant degree of influ-
ence over the management of the affiliate. These investments can be out rightly pur-
chased of an existing firm – by merger and acquisition – and can involve the founding
of a new legal entity which involves building a factory in the foreign country i.e. green-
field real investment.
This form of investment is such that involves investment from one country to another:
this form of investment is normally by companies rather than governments officials or
affiliates and it involves the establishment of an operation or the acquisition of tangible
assets that includes stakes in other businesses. This form of purchase or establishment
is such that is directed towards the acquisition and control of the operation of an asset in
a foreign country and that is income-generating.
Sometimes, FDI is confused with portfolio investment. Both of the investment are for-
eign capital flow; however, there is a marked difference between the both of them. Port-

62
folio investment is the purchase of one country’s securities by nationals of another coun-
try, with the aim of establishing a lasting control. By control, it implies a 10 percent
threshold of voting power. Considering FDI, it involves investment in an asset and not
security (World Bank, 2012). Such asset must be of a tangible form and it is not just a
transfer of ownership but it usually involves the transfer of complementary factors to
capital (including human capital like management, technology and organizational
skills).
Foreign direct investment plays an important role in the growth of global businesses
(Graham and Spaulding, 2005). The reason being that foreign direct investment can pro-
vide a firm with new market opportunities and market channels that helps in the facili-
tation of cheaper production facilities, access to new technology, products, skills and
financing. For a developing country, the inflow foreign direct investment can provide
new technologies in the form of capital and technological transfer, improvement in the
processes or products of an organisation and as such, can provide a strong platform for
enhanced economic growth and development.
Classically, foreign direct investment is defined as a company that makes a physical
investment in another country and such physical investment plays the role of the subsid-
iary of the original/parent company. These investments can either be direct or indirect,
depending on the form in which these investments are made. For instance, an investment
in physical assets like building, machinery and equipment is regarded as a direct form
of investment. On the other hand, when the investment is focused on portfolio form of
investment or investment in equity, this form of investment is considered an indirect
investment.
Foreign direct investment include those forms of investment that involves the acquisi-
tion of a lasting management interest in a company or enterprise abroad. As such, the
foreign investor can either directly invest in the firm by the construction of a facility, or
they may invest in a joint venture or strategic alliance position with a local firm with
63
their attendant input of technology, licensing of intellectual property (see Graham and
Spaulding, 2005).
Graham and Spaulding (2005) also noted that there has been some profound changes in
the size, scope and methods of foreign direct investment. New information technology
systems, decline in global communication costs have made management of foreign in-
vestments far easier than in the past because of the ease of accessing information and
the reduction in the encumbrances to global information flow.
2.1.12.1 Forms of FDI
FDI flows into a country in three forms. They include: horizontal, vertical and conglom-
erate.
Horizontal Flow: this is a situation where the FDI flows into a country and carries out
the same activities in the foreign country as it is doing in the home country. For instance,
most car manufacturing country are involved in horizontal flow, where the car manu-
facturer sets up factories abroad and then assembles cars abroad such as it does in their
home country. A vivid example is the apple corporation, who sets up factories abroad
(in Asian countries) and does the same manufacturing as it does in the home country
(America).
Vertical Flow: this kind of flow occur when the FDI flows into a country but at different
stages of activities are the flows that are carried out abroad. The vertical flow of FDI
can be categorized into two (2) distinct groups. The first is the forward vertical FDI,
which occurs when the FDI takes the firm nearer to the market. Most Chinese companies
get involved in this form of FDI, where they set up plants in countries where they have
the market share with the intention of taking the firm closer to the market. On the other
hand, a backward vertical FDI is such a firm, where there are flows into foreign countries
but with the intention of accessing raw materials (see Asiedu, 2006; Asiedu and Lien,

64
2011). A vivid example is a car manufacturing firm, who sets up its subsidiaries in coun-
ties where they can easily access rubbers that can aid them in the manufacturing of tyre
for their cars.
Conglomerate Flow: Conglomerate entry occurs where an unrelated business is added
abroad. This is the most unusual form of FDI as it involves attempting to overcome two
barriers simultaneously - entering a foreign country and a new industry. The authors
also noted that this situation leads to the analytical solution that internationalization and
diversification are often alternative strategies, not complements. However, due to the
evolving and dynamic international business land-scape, the forms of foreign direct in-
vestment have changed to incorporate recent advances in their operations. The forms of
FDI are considered as follows:
Licencing and Technology Transfer: Licensing and technology transfer have been an
essential instrument in the promotion of collaboration between businesses. The devel-
opment and growth of research and development (R&D) as well as technology improve-
ment have enhanced the need for the strengthening of the licensing processes in order to
protect intellectual property of individuals. As a result of this, there has been an increase
in industry clusters that are in the area of technological improvement as well as intellec-
tual property cluster. There are also growth in licensing agreements that allow compa-
nies to take advantage of new and existing technologies, while they limit their overall
risk to royalty payments until the completion of the technology development processes
and thus the technology being ready to put new products into the manufacturing pipeline
(see Graham and .Spaulding, 2005).
Reciprocal Distribution Agreements: Graham and Spaulding (2005) also pointed out
that this form of foreign direct investment is more in tune with trade related activities. It
is a strategic alliance that involves the coming together of two enterprises, usually within
the same or affiliated industries, who agree to act as the national distributor for each
other’s product. For instance, using the hypothetical example, we can clearly see how
this alliance works. A Nigerian based supermarket enters into a legal agreement with a
65
South African supermarket, where both companies gain direct access to each other’s
distribution network, without having any recourse to pay distributor support payments
and other related expenses that are associated within the distribution network. The im-
plication of this is that neither of the company has the capacity to hurt the other’s market
for its products or even out rightly refuse the sale of the others product in their own mall.
Where such an agreement is inexistent, the Nigerian supermarket may have out rightly
invested in South Africa to sell its product and vice versa for the South African super-
market’s product. More so, the agreement reduces the overhead cost that can be associ-
ated with the sales office coordination, the coordination of the distributor network, man-
aging the warehouse in the host country abroad and other administrative expenses and
tasks that may likely occur.
Joint Venture and Hybrid Strategic Alliances: Traditionally, joint venture is bilat-
eral and involves two parties/individuals who are within the same industry and are part-
nering for some strategic advantages, with the aim of making profit. Firms engage in
this form of partnership with the ultimate aim of accessing proprietary technology that
might be relevant for bringing about a competitive edge in the favour of the venture
(Graham and .Spaulding, 2005). The author also highlights that another reason why joint
venture partnership involves two persons is as a result of the difficulty in integrating
different corporate cultures. In essence, when there are two domestic companies from
the same country, it would still be very difficult of integration but in the case of two
companies from different cultures, it is almost impossible at times. In the case of a joint
venture partnership that involves more than two parties, such a joint venture is termed
syndicates and are most often formed for the accomplishment of a specific projects that
might involve a wide variety of expertise and (economic and non-economic) resources
for successful completion. Syndicates – most times – are easier to manage because the
project itself sets certain limits on each party and does not require close cooperation for
completion (Graham and .Spaulding, 2005).
66
2.1.12.2 How Does FDI Gain Foreign Presence?
Apart from these three forms of FDI flow, FDI can take the form of Greenfield entry or
merger and acquisition (takeover situation). The Greenfield entry occurs in a situation
where a foreign investor gets into a country in order to assemble all the elements of a
product from the scratch. It also includes the flow of FDI into a country with the aim of
acquisition of new assets (Calderon, Serven and Loayza, 2004). This form of FDI seems
to affect growth through its investment in physical asset, while merger and acquisition
affects the productivity in a country.
The merger and acquisition form of foreign investment include those investments that
are solely motivated by the need for efficiency gains and strategic planning to reduce
competition in a market where the firms are not atomistic and affects the behaviour of
other firms (Stepanok, 2013). The firms that are categorized in the merger and acquisi-
tion categories are solely focused on efficiency gains through the transfer of knowledge
and are driven by the need to reduce their short-run variable cost by establishing their
firms in a particular location.
The decision by a multinational to go into another country springs up with the need to
expand the operation of the business. This include three options: to export the final prod-
ucts into the foreign market, acquire a foreign firm in the foreign market and the last
option is to build a plant in the foreign market (Stepanok, 2013). In this research, the
last two options are the kinds of FDI presence being studied.
For a business to expand its operation abroad, an important dilemmas that the business
is being faced with is the need to create its presence in the foreign market either through
the green-field investment or through mergers and acquisition (as earlier discussed).
Businesses most times will likely be more inclined to opt for the acquisition of an al-
ready existing foreign firm, especially when the foreign markets seems tough to pene-
trate. The benefit of this kind of establishment of foreign presence is that the foreign

67
firm faces mild challenges in harnessing human resources, indigenous experience, es-
tablishing a market niche or even securing licenses to operate. Also, the lag of creat-
ing/establishing a corporate identity is reduced because the indigenous firm that is being
taken over have already created such goodwill for itself.
An investor who does not want to acquire an already existing business, but wants to
build the business from the scratch will choose to do so depending on investment climate
in the foreign country. Some countries may set-up tedious regulations and policies that
makes it difficult for an FDI to establish its presence in the foreign market. Also, a for-
eign investor can decide to set-up its foreign presence in countries where there are no
suitable target indigenous firms for the foreign investor to acquire.
There are other circumstances where the foreign country’s policy favours foreign busi-
nesses to establish a start-up firm in the country. For instance, some countries grants tax
holidays to foreigners who decides to establish their firms in such country. Some African
countries like Ethiopia has used this strategy to attract foreign investors.
2.1.12.3 Main Drivers of Foreign Direct Investment
The main issue to be discussed in this section is explaining the reasons for the locations
of FDI. A popular theoretical paradigm that explains the reasons for the locations of
foreign investment is defined in the “eclectic paradigm” attributed to Dunning (1980;
1988). The eclectic paradigm groups the factors that explains FDI locations into micro
and macro level determinants. The framework suggest that firms invest in countries
other than theirs in order to derive three main advantages. The first is the ownership
advantage, location advantage is the second, while the third is the internationalization
advantage.
Ownership Specific Advantage
The ownership-specific advantage allows a firm the advantage to compete with other
firms in the market it serves irrespective of the disadvantages of being in the foreign
68
market because of its accessibility to and exploit the export opportunities in the natural
resources and resource based products that are available in such a market. These ad-
vantages are tied to the firm’s ability to coordinate their complementary activities such
as manufacturing and distribution and their ability to exploit the differences between
both countries (Anyanwu, 2012).The ownership specific advantage refers to those in-
tangible asset that are, at least, for a while, the exclusive possession of the company who
invest in such a location and may be transferred within themselves at a low cost and this
leads either to higher incomes or reduced costs (see Vintila, 2010).
It is not far-fetched to consider the underlining reasons explaining why a multinational
will locate its firm in a foreign country depending on the advantage it can derive from
such a location. Some of these advantages are seen in the property competences of the
firm, which are specific to its operation. The firm is expected to have a monopoly over
its own specific advantages and using such an advantage abroad will only lead to having
a higher marginal profitability or lower marginal cost than other competitors. (Dunning,
1980, 1988). To buttress this, three specific ownership advantages exist. They are: the
monopoly, technology and economics of scale advantage.
The monopoly advantage involves those forms of economic advantage that accrues to
the multinational as a result of privileged access to markets through their ownership of
natural and limited resources in the form of patents, trademarks, among others. The
technology advantage involves technology knowledge that is broadly defined by forms
of innovation that accrue from the ownership of such technology. While the economies
of scale advantage stems from the economies of learning, economies of scale and scope
and greater access to financial capital that comes from the size of the firm (Vintila,
2010).
Location Advantage
Location advantage occurs when the location of the firm is more advantageous for the
parent company to use the foreign investment than sell them or rent them to foreign
69
firms. Location advantages of countries are one of the principal factors that attract for-
eign investments into them (Asiedu, 2006; Asiedu and Lien, 2011). Some specific loca-
tion advantages are those advantages that consist of quantitative and qualitative factors
of production like the cost of transport, telecommunications, and market size among
others. Other location advantages include the political advantages that are common and
specific to the regulations and government policy that influences the return on invest-
ment. The final location advantages includes those socio-cultural factors that are specific
to a particular location that affects the inflow of foreign investment. It includes items
that relates to the extent of cultural diversity of the country among other factors like
religion, ethnic fractionalisation among others.
Internationalisation Advantage
The internationalisation factor that informs FDI location is conditioned on the profita-
bility of the company when considering internationalisation. This comes as a result of
exploiting economic power that stems from the sale of goods and services that can be
traceable from the agreements entered into by the firm with other international clients.
As this benefits increases, the more the firm will be willing to engage in foreign produc-
tion than base their firms’ location in their home country. In essence, some of these
agreements are in the form of franchise and licenses that is tied to the international col-
laborations of the firm with other parties.
The internalization advantages also arise as a clear answer to the issues of market failure.
The underlining assumption in the internationalisation advantage is seen in the under-
standing that buyers and sellers have asymmetric information, which creates uncertainty
around the quality of the transactions and the determination of the appropriate price to
be paid. The internalization advantage perceives that the firm considers its ownership
advantages as best exploited internally within the firm rather than being sold directly
through spot markets or offered to other firms through some contractual arrangement
such as licensing, the establishment of a joint venture or management contracting (Dun-
70
ning, 1980). Internationalisation advantage also involves the firm exploiting the imper-
fections in the external markets such as the reduction of uncertainty and cost if transac-
tions so that knowledge can be generated more efficiently (Anyanwu, 2014).
In recent literature (e.g. Fedderke and Romm, 2006; Anyanwu, 2012) there has been a
classification of the drivers of FDI location and this can be classified policy and non-
policy factors. The policy factors includes those factors that are informed by the gov-
ernment policy in the FDI host country that has attracted such FDI to that particular
location. Some of these policy factors include openness of the economy, product market
regulations and labour market arrangements, corporate tax rates, FDI restrictions and
any other factors that inhibit the free flow of capital (Asiedu, 2006; Asiedu and Lien,
2011; Anyanwu, 2012). On the other hand, the non-policy factors include those that
affects market size of the host country, distance and infrastructure, factor endowment,
among others (Mateev, 2009).
Anyanwu (2012) further classifies the factors that explains the location of FDI based on
the following categories: foreign aid; infrastructure development; institutional and po-
litical factors that informs investment climate; attraction of natural resources; human
resources development, productivity and cost; basic macro-economic and other factors.
The most controversial of these factors is the foreign aid. The reason being that foreign
aid is form of development assistance that is given to the host country government by a
multilateral or bilateral organisation for development projects. In relation to FDI, some
form of foreign aid substitutes FDI, while others act as complimentary.
2.1.12.4 Foreign Direct Investment and Portfolio Investment
Foreign direct investment consist of direct investment by large multinational (or trans-
national) firms or corporations into a foreign country, with their headquarters located in
the parent’s country. Most times, the headquarters of these multinational firms are lo-
cated in developed countries and their interest are distributed across different countries
of the world. This is unlike portfolio investment, which also involves huge capital that

71
is disabused by a foreign investor in the form of stocks, bonds and notes as a form of
security in a foreign market.
With the rise of foreign investment across the world, the main drivers of this are multi-
national corporations. A multinational corporation is defined as a corporation or an en-
terprise that conducts and controls productive activities in more than one country of the
world. These corporations are usually operate in an oligopoly form of market, which
restricts new market entries and the already existing market operators are so powerful
that they can influence the price in the ordinary market.
Foreign investors involves much more than the simple transfer of capital or the estab-
lishment of local factories in developing countries. It includes the transfer of technology
by multinational firms, change of taste of the local markets, managerial philosophies
and improved business practices which includes cooperative arrangements, marketing
restrictions, advertising and the phenomenon of transfer pricing.
2.1.12.5 Benefits of Foreign Direct Investment.
The benefits of foreign direct investment vary across countries. For a typical small and
medium sized company, the inflow of foreign direct investment presents an opportunity
for the small businesses to become more actively involved in the global sphere of busi-
nesses. However, to properly understand these benefits, the discussion was distributed
into varying sub-sections. These sub-sections are:
Resource Transfer
The first advantage of foreign direct investment is that it enhances the transfer of re-
sources from the foreign investor to the host community. Foreign direct investment
makes positive contribution to a host country economy by supplying capital, technology
and other form of management resources that spills over to the host country and may
not be readily available to boost the economic growth of the host country. More so,

72
foreign investors also have access to huge forms of capital that can be utilised to estab-
lish their investments abroad (Anyanwu, 2012). Being this the case, many of these in-
vestors are by virtue large in size (economically and non-economically) and as a result
of this, these funds are available to be redistributed in their host countries by their col-
laboration with indigenous businesses. Other forms of resource transfer include technol-
ogy and management transfer. Most of these foreign investors also have technological
advantage based on the fact that they have access to cutting edge technology and man-
agement structure, which they can transfer to indigenous firms as a result of their pres-
ence in the host country.
Razin and Lougani (2001) notes that foreign investment allows the transfer of technol-
ogy especially those that are in the form of new varieties of capital inputs that cannot
readily be achieved through financial investment or trade in goods and services. Apart
from this, beneficiaries of FDI flow can also benefit from the presence of FDI by the
trainings that officer for those who they have employed and these trainings can be spelt
over to other firms whom the individual will be working for later in the future.
Employment Effect
Another benefit from the presence of foreign investment in the host country is that they
bring about employment effect. This imply that the presence of foreign investment cre-
ates employment opportunities for the host country citizens. Some of these employment
opportunities that are created by the presence of foreign investment would hitherto not
have been created assuming these investors were not present in the host country. The
employment benefit from the presence of foreign investment can be classified into direct
and indirect employment effect. The direct employment effect occurs when a foreign
investment in the host country employs the citizens of the host country to work a paid
employment in its establishment. The Indirect effects arise when jobs are created in local
supply chains that are created by the presence of the foreign investment. As a result,
when jobs are created because of the demand for factor input – in terms of raw materials

73
– that are required by the investor and which are to be supplied by the indigenes. In the
process, they create employment opportunities.
Effect on Competition and Economic Growth
The presence of foreign investors in a host country brings about the creation of economic
competition (see Kurtishi-Kastrati, 2013) that makes the market to function efficiently
in such a form that suppliers and buyers have an open market function in which value
will be encouraged and prices will be efficiently determined. The presence of foreign
investment increases the consumer choice. This increase in consumer choice is based on
the fact that the market is opened up to the participation of many suppliers of goods in
which only those goods that are of better economic value will prevail in the market.
More so, price will be regulated in the market thereby driving at consumers’ welfare.
Increased competition in the host country will also stimulate the flow of capital invest-
ment by firms in plant installation, the purchase of equipment, and expenditure on re-
search and development as the need to gain a competitive edge will be the driving force
of firms. The long-term results of this includes increased growth in the productivity of
firms, innovations in the development of products and processes that will be attained
through the improvement in the innovative capacity of these firms, and therefore leading
to greater economic growth.
2.1.13 CONCEPT OF TRADE
Trade (be it international or local) is the exchange of goods and services for an economic
benefit. The theoretical and empirical literature on trade indicate four different channels
to show the various aspects of “trade” and its effect on the broader economic outcome:
trade integration that is measured by the volume of exports or imports; trade openness
measured by value of exports plus imports over gross domestic product (GDP); trade
liberalization measured by the observed changes in the trade policy regime such as the
changes in the level of industrial or agricultural tariffs; and the value of outsourcing or
total flows of FDI (Jansen, Peters and Salazar-Xirinachs, 2011; Anyanwu, 2014).
74
In the trade literature, there is a concept of free trade and protectionism. The debate over
these two strands have continued to be recurring in both academic and policy platforms.
Those that advocate for free trade considers a minimization of the restrictions to inter-
national trade in the favour of openness and painless access to the global market. On the
other hand, protectionists perspectives advocates for a national interest and economic
welfare that will be implemented through regulating imports and market entry of other
countries.
Trade is generally seen as an essential instrument to the growth of a country. Likewise,
trade affects economic development from both the demand and supply sides. This asser-
tion stems from the empirical and theoretical studies of a number of academic scholars.
Some of the popular scholars include Dollar et al (2001), Sachs and Warner (1995).
Grossman and Helpman (1995) also revealed that the process of international trade has
an influence on entrepreneurs, which has a direct impact on the social structure of a
country’s economic system. These findings, amongst others, emphasize the relevance of
trade liberalization in enhancing economic growth and development (Winters, 2004).
Krugman (1983) further suggest that the positive effects of economic development, es-
pecially with regards to employment generation, poverty reduction, income re-distribu-
tion and economic can be linked to the growth of global trade.
The main issue in international trade is the occurrence of trade inhibiting measures that
are policy instruments tagged protectionist actions. This action defeats the tenets of in-
ternational trade and hinders the free flow capacity of international trade. By the occur-
rence of these inhibitors, the gains from trade such as economic growth (see Grossman
and Helpman, 1991), are hindered by the occurrence of protectionist actions.
Protectionism is as an attempt by the government of a particular country to impose or
enact certain restrictions on the exchange of goods and services between itself and other
countries of the world. The underlining philosophy that governs the framework of pro-
tectionism postulates that the regulation of international trade is vital in ensuring that
markets function properly, and this emanates from the fact that market inefficiencies can

75
impede the benefits of international trade. This therefore implies that there is the need
to provide avenues of mitigating these inefficiencies. The implication of market ineffi-
ciencies and the consequent loss of trust in free trade is the persistent occurrence of
protectionist actions. Some of the instruments used for protectionism include: export
subsidies (financing indigenous export), quotas, embargoes (trade restrictions), ex-
change controls, import licensing, voluntary export restraint arrangements, and intellec-
tual property laws such as patents and copyrights (Osabuohien et al, 2014; Evenett,
2011).
There are some justifications proposed for the employment of protectionist measures by
countries and they include infant industry argument, import dumping, externalities, mar-
ket failures, import controls, and non-economic reasons. The argument for Infant indus-
try is one of the most widely adopted theories that supports protectionist actions. The
underlining framework in this argument is that in certain situations, when foreign com-
panies are allowed to freely operate in some industries without due regulations, the com-
petition will be stringent and may crowd out indigenous infant industries. These infant
industries have the potential to develop and gain comparative advantage and the occur-
rence of these crowding out effect would limit their ability to flourish beyond their for-
eign counterparts.
Some of the shortcomings of protectionist action is that it creates productive inefficien-
cies, in the sense that domestic firms that enjoy protection from competition may likely
become lackadaisical in the reduction of productive costs. It also provides little protec-
tion for employment. This is because in the long-run, tariffs and other barriers to trade
(which protectionists argue help to protect low-skilled workers of industries facing grim
international competition), are found to be ineffective, inefficient and possessing high-
level opportunity costs (Osabuohien et al, 2014). Another fundamental argument against
protectionism is that it creates negative multiplier effects by the occurrence of trade dis-
putes which adversely affects the trade volumes and leads to negative outcomes for

76
countries. This may also trigger high taxes and high prices of goods by imposing a dou-
ble burden on tax payers and consumers.
2.1.13.1 Why Do Countries Engage in International Trade
Principally, every economic activity is motivated by the need to maximise benefit and
minimise cost. Likewise in international trade, countries indulge in the exchange of
goods for an economic value in order to maximise their gains from trade and minimise
their cost. This implies that all trade is motivated by expectations of gains, either in-
creased income or reduced costs (Byrns and Stone, 1992). Put differently, the global
value of income and output is always maximised when the opportunity costs of produc-
tion of everything everywhere are maximised. More so, the distance between countries
has also made international trade to of immense benefit to consumers, as consumers are
able to maximise their utility by purchasing goods without having to relocate nor travel
to the countries where the goods are produced. In the same vein, factor input suppliers
like labour are able to be productively engaged in a venture and get paid without having
to travel out of their country of resident. Therefore, an efficient global trading system is
expected to improve the welfare and standard of living of people everywhere.
For a clearer understanding of the benefits from trading, we analyse this issue based on
some conceptual frameworks. These frameworks include:
Absolute Advantage
The concept of absolute advantage was propounded by Adam Smith, who says that as a
result of the differences that exist in the abilities of individuals and nations to produce a
particular good with the same amount of factor endowment. The concept of absolute
advantage is seen when country A produces more of a commodity than another country
B with the same resource endowment. The excess will then be traded between the coun-
tries. Adam Smith proposes that each country should specialise in the production of
those materials for which they have an absolute advantage in and then exchange in trade
with those products for which they do not have absolute advantage in.
77
Comparative Advantage
This was propounded by David Richardo as an improvement of the Adam Smith’s ab-
solute advantage concept. This concept takes into account gains that may be available
through trade. This classical theory of trade shows that with international trade, coun-
tries can benefit immensely from trading with other countries even though they may not
have an absolute advantage in the production of a particular product. This theory suggest
that mutual gain in trade is always possible between countries even though the pre-trade
relative costs and prices differ between themselves. In comparative advantage theory,
the main focus is the terms of trade of each country.
Specialisation Gains from Trade
Countries that engage in international trade gain from trade because their access to ex-
port markets makes what they produce to be more valuable. Free trade enables countries
to specialize in the production of those commodities in which they have a comparative
advantage. More so, with specialization, countries are able to take advantage of efficien-
cies that are generated from economies of scale and increased output. More so, it cannot
be denied how international trade helps to increase the size of a firm’s market, especially
in the global market, and this will inevitably result in the lowering of average costs and
increased productivity that will ultimately result in the increment in the volume of pro-
duction.
Uniqueness Gains
There are some goods and resources that are uniquely available in some locations of the
world, which are not distributed in other locations of the world. For instance, natural
resources like diamond, tin, petroleum, bauxite and gold are not found in all countries
of the world but in some unique locations. In the same vein, technologies may also differ
across countries and this brings about a unique advantage for some countries compared
to other countries. Byrns and Stone (1992) notes that the uniqueness advantage is seen
in the trading for goods that are not available from local sources. These include the

78
uniqueness advantages that comes from the trade in certain minerals and agricultural
produce.
Gains from Scale Economy
This involves the increase in the size of the market that results from international trade.
In essence, moving beyond domestic market to international trade will provide an in-
trinsic incentive for the firm to increase their productivity beyond the domestic consum-
ers. As the production increases, the average cost of production will definitely reduce
because of the volume of production.
Technology Diffusion
Another gain from international trade is technology diffusion. Trade increases the spread
of technology that would not have spread if the country did not engage in international
trade (McAfee and Bryniolfsson, 2009). Trade has increased the speed at which tech-
nology is transferred from developed and industrialised economy to developing coun-
tries.
International Political Relations
Countries also engage in international trade in order to foster their relationship with
other countries around the world. Due to the development of this trade relationships, the
likelihood of hostility will be reduced between these trading countries. Political gains
from trade arise as a result of the rising interdependency that trade fosters between coun-
tries and as such, facilitates international political stability (Byrns and Stone, 1992).
2.2. THEORETICAL UNDERPINNING
In this sub-section, we discuss, broadly, various theories that relates to financial report-
ing and then we concentrated on the theory that underpins this study.

79
2.2.1 SOME THEORIES RELATED TO FINANCIAL REPORTING, FDI AND
TRADE
The theories that are of particular interest to this study include: agency theory, stake-
holder theory, new institutional accounting theory and the isomorphism concept.
Agency Theory
The first to be considered is the classical agency theory that suggest that a typical firm
is viewed as a complex structure that involves the relationships transcending among
economic agents as a result of binding contracts between the agents; in essence the
agents are those resource holders and those managing the resources. The agency rela-
tionship arises whenever one or more of these individuals that own the resources (prin-
cipals) hire other agents (or individuals) to perform some service, which involves the
delegation of decision-making authority over the resources.
The agency theory is borne out of the need to understand the risk sharing problem that
arises as a result of cooperating parties having different attitudes towards the risk (Ei-
senhardt, 1989). The uniqueness of the agency theory is that it included the agency prob-
lem as a fundamental tool in understanding the risk sharing problem that arise from
economic cooperation. In essence, due to the arising divergence of goals and visions
between the parties in the economic cooperation, the agency problem will likely arise
(Jensen and Meckling, 1976). The agency problem therefore arises when one party (the
principal) delegates work to another (the agent), who performs that work and by the
reason of the contract, some misaligning intention arises and to understand this, the
agency theory was formulated.
Fundamentally, the agency theory was initiated to solve two problems that arise as a
result of the contractual relationship between the two parties: the first is the agency
problem that arises as a result of the conflicting desires or goals of the principal and
agent and the difficulty encumbered by the principal in verifying the actual actions of
the agents. The latter is paramount because the principal intends to have absolute
80
knowledge about the agents since they are the owners of the resources and the agents
were appointed to act on their behalf in managing the resources for profit (Jensen and
Meckling, 1976; Eisenhardt, 1989). The second problem is the risk sharing that arises
when the principal and agent have different attitudes toward risk, which informs their
actions (Eisenhardt, 1989). For instance, because of the high risk of losing the resources
provided, the principal may not take some actions that may jeopardize the going-concern
of the resources. However, the agent may be willing to take such actions because of their
low stake in the resources.
The main unit of analysis of the agency theory is the contractual agreement that govern
the relationship between the principal and the agent and based on this, the agency theory
was propounded to understand and ascertain the most efficient contractual agreement
that should govern the parties. This is given the assumptions that people are self-interest
driven, bounded by rationality and are risk averse; organizations are challenged with
conflict among members and information is a costly commodity, which can likely be
asymmetric in nature (Eisenhardt, 1989).
The main underlining assumption of the agency theory is the supposition that human
beings are driven by self-interest. This imply that a company’s manager (agent) may
likely have personal goals that competes efficiently with the principal’s goal of maxim-
izing their wealth. This suggest that in an imperfect market, the agents will seek to max-
imize their own goals (utility) at the expense of that of the principal. As a result, the
agents have the capacity to operate in their own self-interest rather than in the best in-
terests of the firm as a result of asymmetric information – that is the agents have a better
information about the firm than the principal.
Some of the evidences that portrays the self-interest agenda of the agent include their
consumption of some corporate resources, using such corporate resources for personal
benefit and profit, avoidance of optimal risk positions and initiate risk-averse behaviours
that bypasses profitable opportunities that the firm's shareholders would have preferred.
As a result of these myriads of occurrences, the agency cost arises where the principals
81
bear some cost to encourage the managers to maximize the principal’s wealth rather than
behave in their own self-interests manner (Jensen and Meckling, 1976). These costs in-
clude expenditures to monitor the agent’s activities (e.g. cost on hiring professional au-
ditors), expenditures to structure the organization in a manner that will curtail objection-
able managerial behaviour (e.g. cost of appointing outside directors as part of the board
members), and the last is the opportunity costs that arises when the principal-imposed
restrictions on the agents limit their ability to take actions that can advance the wealth
of the principal.
The agency theory has been criticized because its assumptions are overly simplistic and
do not reflect the contemporary business environment. More so, empirical research has
failed to support its basic assumptions (Miles, 2012) because it has a low predictive
capacity. For instance, among the solutions put forward by the agency theory to reduce
the incidences of agents pursuing their self-interest include: expand the number and in-
fluence of independent (non-executive) board directors on corporate boards so that they
can act as an eye of the principal and check the excesses of executive board members;
ensure that the roles of the Chairman of the board is separated from the Chief Executive
Officer (CEO) in order to reduce the power vested on the CEO; create markets for cor-
porate controls and hostile takeovers so that acquirers can dismiss wasteful managers;
ensure that managers have stake in the company – by paying them with stock options –
so that they can effectively pursue the interest of the shareholders.
Despite the submissions of this theory, recounting empirical evidence exist that does not
validate some of the assumptions of the theory. For instance, some studies have observed
that the separation of the power of the Chairman of the board and that of the CEO, as
well as the board composition of independent directors does not affect the performance
of the firm in any way (Dalton et al, 1998). More so, in realistic point of view, corpora-
tions like Enron that applied the agency theory by providing a stock option for her board
of directors and whose board compose of over 80 percent of independent board mem-
bers, still collapsed following series of self-interest agenda of the agents.

82
Some other critics highlighted that the agency theory did not address any clear organi-
sational problems as it only highlights that there is a divergence of interest between the
principal and the agents. More so, the solution of using the option of owning stock to
control the behaviours of agents is excessively narrow and more so, using the organisa-
tional stock price to measure the wealth of the principal does not garner the complexity
of the contemporary business environment (Hirsch and Friedman, 1986).
Stakeholder Theory
The second theory is the stakeholder theory, which is an advancement of the traditional
view of organizations that they are primarily in existence for the purpose of improving
the wealth of the providers of resource (those who own shares in the company) that
initially puts them in existence. In view of this, the main objective of the company is
strictly making profit to maximise the wealth of the shareholders and this is at the ex-
pense of other types of interest that may be in existence (Miles, 2012). The stakeholder
theory markedly advances this traditional view of the objective of the firm (Freeman,
1984). This theory was made popular following the works of Freeman (1984) in his book
on strategic management: a stakeholder’s approach.
In Freeman’s (1984) book, the author noted that corporations will cease to be merely a
legal device through which the transactions of private business of individuals may be
carried on. The author also notes that a typical corporation has become both a method
of property tenure and a means of organising economic life. It is important to clearly
define who a stakeholder is.
A stakeholder is an individual or a group of individuals, entities and related parties,
whose existence can affect or are being affected by the actions of the firm. They include
all other entities or parties other than and inclusive of the shareholders. For any party to
be classified as a stakeholder of the firm, the interest of such party must be directly
83
linked to the firm’s operation or corporate objectives (Walsh, 2005). They can be cate-
gorised into three broad groups: internal stakeholders, external stakeholders and distal
(Sirgy, 2002).
The internal stakeholders include those parties who are within the firm and whose ex-
istence affect or affected by the operations of the firm and they include employees, ex-
ecutive staff and the board of directors of the firm. The external stakeholders include
those parties who are existing outside the firm but whose existence are affecting or are
being affected by the operations of the firm and they include: shareholders, suppliers,
creditors and the environment of the firm. The distal stakeholders include the competi-
tors, consumer, advocacy groups and government agencies (Miles, 2012).
The main intuition underlining the stakeholder theory is that the firm’s existence is fo-
cused primarily objective should be focused on meeting the broader interests of the
stakeholders rather than maximising the shareholders wealth. This implies that instead
of the firm to focus their entire attention on maximising financial performance, they
should also focus on enhancing their social performance. This include their ability to
understand, respect, and meet the needs of all of those who have a stake in the actions
and outcomes of the organization; this will enhance the competitive advantage of the
organisation (Plaza-Ubeda, de Burgos-Jimenez, and Carmona-Moreno, 2010; Miles,
2012).
Donaldson and Preston (1995) laid down some precedence on the underlining thesis
explaining the stakeholder’s theories. Among them are: the stakeholder theory is unar-
guably descriptive. The theory presents a model that describes the basis for the existence
of a corporation. It describes the corporation as a constellation of cooperative and com-
petitive interests that possesses intrinsic values. The second is that the stakeholder theory
is instrumental and it establishes a framework that examines the connections, if any, that
exist between the practice of stakeholder management and the achievement of various
corporate performance goals. The principal focus of interest here has been the proposi-
tion that corporations practicing stake-holder management will, other things being
84
equal, be relatively successful in conventional performance terms such as their profita-
bility, stability and growth.
The third underlining thesis is that fundamentally, the basis for the stakeholders’ theory
is normative and it involves the acceptance of the ideas stakeholders are persons or
groups of persons with legitimate interests in procedural and (or) substantive aspects of
corporate activity. This implies that the stakeholders of corporations are identified by
their interests in the corporation, irrespective of whether the corporation has any corre-
sponding functional interest in them. More so, the interests of all stakeholders of the
firm are of intrinsic value and by this, each group of stakeholders deserve to be consid-
ered in the corporate stake of the firm.
The fourth thesis is that the stakeholder is managerial in the broad sense of its existence.
It does not simply describe existing situations or predict cause and effect relationships
but it also recommends attitudes, structures, and practices that constitutes stakeholder
management. By stakeholder management, it implies that key attributes and simultane-
ous attention should be given to the legitimate interests of all appropriate stakeholders
of the firms, which includes both in the establishment of organizational structures and
general policies that affects the stakeholders. The theory does not necessarily presume
that the managers of the organizations are the only rightful locus of corporate control
and governance.
The concept of stakeholder is brought to bear with the existence of the activities of the
firm affecting their environment. By this, we imply the corporate social responsibility
of the firm, which includes the responsibility of the firm towards the broader audience,
apart from those within the firm. Corporate social responsibility (CSR) has become an
increasingly prominent issue for companies and the corporate boards of directors of
firms are becoming more involved in assessing and shaping company policies and prac-
tices on a wide range of social and environmental topics.
85
To match up the demands for firms to begin to pay attention to the broader stakeholders
of the firm and those whom the activities of the firm are affecting, there is the need to
beef up the governance structure of the firm and ensure that a proper structure, composed
of the behaviour of corporate boards are properly checked to ensure that they align with
the overall goal of enhancing corporate ‘stakeholdership’.
The stakeholder implies that there is a drastic shift in the traditional role of the board of
directors as individuals that are set-up and that exist in ensuring that they defend the
interest of the shareholders. Although, it cannot be denied that the board of directors
exist based on the responsibility of setting the values and standards that structures the
operations of the organisation through instruments like strategies, incentives and internal
control systems. Therefore, for a board to effectively function and impact the industry,
they must be such that needs to commit to corporate social responsibility and address
the needs of the diverse stakeholders. Therefore, the firm is viewed as a locus of respon-
sibility that relates to a wider array of stakeholders interest and therefore maximises the
sum of the various stakeholders’ surpluses.
The major criticism of the stakeholder theory is that it stems from the difficulty of de-
fining the concepts of who really constitutes a genuine stakeholder. There is an expan-
sive list that shows the stakeholders of a company and this ranges from most bizarre to
include terrorists, dogs and trees and this makes it even more complex on the categories
of individuals to be included as the stakeholders of a company. In essence, there are
many shareholders that forms the categorization of the stakeholders and this makes it
even more worrisome on who to be regarded as the stakeholder of the firm.
A major shortcoming of the theory is that if the directors intend to serve all the stake-
holders in the company, they may not be able to serve the interest of the stakeholders
whose impact is supposed to be genuinely serviced by the company. For instance, it is
obvious that not all stakeholders’ matters as much as the other and the management team
concentrating on satisfying all the stakeholder may be a displeasure to some whose in-
terest matters as much. Another criticism of the theory is that relating to the range and

86
diversity of stakeholders, the stakeholder theory is being accused of being ‘superfluous’
by which they mean that the intent of the theory is better achieved by relying on the
hand of management to deliver social benefit where it is required.
The New Institutional Accounting Theory
The New Institutional Accounting theory is a spring forth from the popular and contem-
porary New Institutional Economics (NIE) School of taught that directly relates to the
La Porta et al (1999) theories of institutional development. The NIE theory is a new
development in economic thoughts that posits that economic activities that involves eco-
nomic agents within a society is mostly informed by the social and legal relationships
that exist among them (Osabuohien, 2011). These relationships can be termed as frame-
works, which govern the behaviour of economic agents. This is in the sense that indi-
viduals are naturally drawn to being opportunist and in order to avoid any form of losses
in their relationship with other individuals, then there is a need for these frameworks.
The La Porta et al (1999) theory of institutional development centres on the factors that
leads to the formation and persistence of the development of institutional frameworks in
the society. La Porta et al classified these institutional developments into economic,
political and cultural institutional theories. The economic development paradigm im-
plies that institutions are mostly formed by economic actors by considering the social
benefits of such creation in relation to the perceived transaction costs that are associated
with such creations. The political formation paradigm informs that institutions are cre-
ated by those in political powers in such a way that the institutions protects their interest
of remaining in power to extract economic rents. Lastly, the cultural institutional theory
paradigm hinges on the redistribution of societal resources much more than economic
efficiency (Osabuohien, 2011).
The NIA was championed by the influential work of Wysocki (2011), where the author
highlighted the main theses of this theory as a syntheses of elements to suggest the
frameworks for analysing the determinants and outcomes of both accounting institutions
87
and non-accounting institutions based on the following structures: (A) institutional
structures (B) levels of institutional analysis (micro and macro) (C) exogeneity and en-
dogeneity of institutions (D) interdependencies and complementarities of the frame-
works of institutions (E) efficiency and inefficiency of the institution.
The concept of institutions was propagated in this theory. The main definition of insti-
tutions is that it includes the mechanisms and frameworks that facilitate efficient ex-
change and interactions between economic agents in an economic system (Williamson,
2000; North 1990). In North (1990) definition, the fragment of the comprehensive defi-
nition of the concept of institution includes those humanly devised constraints that
shapes human interactions and provides the rule of the game in the society where the
actions of the players are clearly defined by the governing rules. In this definition, insti-
tutions are classified as rules and these rules are put in place to regulate the actions of
individuals that operate in a system where these rules are applicable. It is important to
note that these rules (both legal, political and social rules) are established on the basis
for the production (both efficient and inefficient) exchange and distribution in the econ-
omy (Wysocki, 2011).
Institutions can be broadly classified into the formal and informal frameworks that guide
the economic and social interactions of players in the society. The informal institutions
include those rules and regulations that are not clearly and out-rightly documented for
reference, but are implicitly and tacitly recognized as a guiding framework for human
behaviour. It also consist of informal measures such as sanctions, taboos, customs, and
traditions as well as formal rules such as constitutions, laws, and property rights (North,
1991). On the other hand, formal institutions include those humanly formulated structure
that are codified and crafted to create peaceful economic interactions and reduce uncer-
tainty in exchange of values (Williamson, 2000).
Accounting frameworks are kinds of institution (Wysocki, 2011). This is due to the fact
that the underlining reduction of transaction cost by the presence of institutional frame-
work is a veritable platform for understanding the role of accounting frameworks. This
88
is because there is the need for clear information symmetry between the parties involved
in an economic transaction: such clarity include the verification of properties of what is
being exchanged and enforcing the terms of the exchange. In relating this to accounting,
accounting framework is an institutional mechanism that helps to lower transaction
costs, reduce information costs and asymmetry, lowers coordination costs and improve
the enforcement of property rights (Wysocki, 2011). North (1990) even noted that the
enforceability of accounting and auditing methods for use in debt collection and the
enforcement of contract is an essential feature in the facilitation of economic develop-
ments.
To broadly explain the accounting frameworks that can be classified as an institutional
framework, it is important to state that these frameworks transcends accounting rules
and frameworks such as IFRS. It include other frameworks like the corporate govern-
ance mechanism, the legal framework and the existence and enforcement of laws gov-
erning investor protection and disclosure standards (Wysocki, 2011).
The main criticism of this research is the challenge of identifying and documenting
which institutions are important for the influence of accounting frameworks on the
broader macroeconomic context. Wysocki (2011) noted that while many theories exist
for the possible role of institutions in influencing economic outcomes, it is ultimately an
empirical issue to confirm the real world effects of institutions on economic activity.
This is because different institutional choices can lead to clear differential economic
outcomes. More so, research efforts needs to be careful in applying these different insti-
tutions to accounting frameworks. It is evident that when due care is not applied in the
application of these institutions, there will be difficulty in identifying the actual institu-
tional framework that will result to a particular economic outcome from the adoption of
accounting frameworks.
Also, the method applicable in the examination of institution has been scrutinized. One
of the prominent method is the usage of good instrumental variable for institution. This
approach is called the quasi-experiments. One of the major limitations of this method is
89
that there are competing channels through which institutions affect economic outcomes
and it will not be easy to identify appropriate instrument to account for this. There are
likely to be complementarities between a country’s institutions: this implies that multi-
ple institutional elements endogenously arise to fit and work with each other (Wysocki,
2011). Therefore, it is difficult to attribute observed differences in accounting frame-
works and economic outcomes across countries to certain institutional frameworks.
A third criticism of this approach is that the proxy for institutions are problematic. Most
country-level studies rely on proxy indicators of the business environment like the
strength of the legal system operational in the country (La Porta et al. 1997, 1998), reg-
ulatory framework and the governance structure that is prevalent in the country (Kauf-
mann et al. 2005). However, Wysocki (2011) noted that some of these measures of in-
stitutions exhibit little or no variation over time.
New Trade Theory
The fourth theory is the New Trade Theory (NTT), which is an improvement of the
classical trade theories that comprise of the Mercantilist theory, the Absolute Advantage
theory, the Comparative Advantage theory and the Herscker-Ohlin theory of trade the-
ory of factor endowment. The New Trade theory advanced on the classical theories by
relaxing three main assumptions that was not considered in the classical trade theories.
These assumptions are:
1. Product differentiation
2. Increasing returns to scale
3. Imperfect competition.
The concept of product differentiation was propagated by the NTT and it appreciates the
diversities that exist between firms in the same sector. This diversity results to product
differentiation, which was not emphasized in the classical trade theory. The classical
trade theories emphasis was on homogenous products or two products that forms the
basis for trade.
90
The emphasis on product differentiation was championed by the work of Krugman (ᦁ;
1981), among others. The authors stress that the changes in the distribution of income
among industrialized countries. Their theory predicts a model that explains the mecha-
nism for accounting for the observed expansion of trade relative to the income of coun-
tries. Therefore, as the distribution of national income becomes more equal across coun-
tries, then trade volumes should also be on the increase. This increase in the national
income brings about a demand for differentiated products in the national economy.
Therefore, if the demand for differentiated products will be superior to the homogeneous
products; this brings about the need for intra-industry trade; and, in the situation where
industrialized countries are net exporters of the differentiated products, then intra-indus-
try trade among industrialized countries would increase relative to trade with less devel-
oped countries.
As firms produce different products due to the rising demand that corroborates with the
rising income level, the situation arises when countries begin to specialize to increase
the production of the similar but differentiated products. As the economy opens up to
international trade the demand faced by each firm increases to meet the rising world
demand for that product. Quantities produced are therefore larger and the concept of
economies of scale come to be. The concept connotes that the average cost declines as
the size of the firm that produces the specialized products increases. As a result, prices
are of the products are reduced as trade generates an additional gain from economies of
scale.
The gains from trade, in terms of economies of scale, is associated with the idea that an
extra unit of quantity produced will reduce the average cost of producing the product in
the long-run. The reason for this reduction is the concept of specialization that occurs
when firms operating on a larger scale can match inputs more closely to tasks or the
advancement that comes with technological reasons. This decline in average costs leads
to lower prices of the products.
91
The monopolistic competition arises from the gains linked to trade. As the economics
of scale of countries increases, firms begin to gain market power. This creates an oli-
gopolistic form of market structure, where the few big firms are involved in the produc-
tion of differentiated products. By this, the firms can begin to inform the prices and the
forces of demand and supply are no more responsible for determining the prices of the
products. This creates an imperfect market structure. This is market force where the
prices of a product are fixed by oligopolistic suppliers and not the forces of demand and
supply.
A major contributor to the NTT is Paul Krugman whose works (e.g. Krugman, 1981;
Krugman, 1983) revolve around the central issue of economies of scale and specialisa-
tion. The economies of scale of a firm are mostly internal to the firm, where the firm’s
average cost reduces with the volume of production. The consideration of the internal
economies of scale is premixed on the high fixed cost that a firm engages in in order to
begin its production. In the long-run, this fixed cost of production is higher than the
foreseen profit the firm can generate. However, to reduce this burden, more outputs will
be required to spread the fixed cost. In such a situation, Krugman emphasises that the
market cannot be perfectly competitive (which is against the classical trade theories’
assumption of a perfectly competitive market). Krugman developed a theoretical model
to explain this based on the monopolistic competition model. Since this model is a shift
from the classical trade theories, then the term New Trade Theory was coined to aggre-
gate further empirical works that sprang up from the assumption of imperfect competi-
tive market, scale economy, among others.
2.2.2 THEORY APPLICABLE TO THIS STUDY ‘NETWORK ECONOMIC
THEORY (NET) OF IFRS ADOPTION’
Empirical studies on the macroeconomic consequences of IFRS adoption have faced the
challenges of identifying a suitable theoretical framework to underpin their studies. For
instance, Gordon, Loeb and Zhu (2012), who studied the impact of IFRS adoption on
92
foreign capital flow around the world, concluded that among their main limitation is that
they could not underpin their studies to any theoretical background.
Due to this challenge, we followed the approach of Ramanna and Sletten (2009) by un-
derpinning our study on the economic theory of network. The economic theory of net-
work is a popular theory in technology literature that explains the process and speed of
technological and innovation diffusion in a particular locality (see Ramanna and Sletten,
2010). Ramanna and Sletten (2009) noted that the theory predicts that in addition to
network benefits (synchronization value), a product with network effects can be adopted
due to its autarky value. Ramanna and Sletten (2010) elaborated on the network eco-
nomic theory by explaining that there are three autarky values that new adopters look
out for. They include the demand for the new product, the features of the new product
and the number of the users of the new product.
In the context of this study, the theory explains that the adoption of IFRS can be appeal-
ing to a country if other countries have adopted the standard (Ramanna and Sletten,
2009). This theory predicts that IFRS will be adopted by countries due to its direct ben-
efits. These direct benefits include the net economic benefit, which are those economic
outcomes of countries as a result of their decision to adopt IFRS. It can be in the form
of foreign capital flow and trade, which is facilitated by the reduction of information
asymmetry and transaction and coordination cost attributed to IFRS adoption.
Consensus have been reached on the usefulness of the standard in the uniformity of
financial reporting framework and the consequent reduction in cost of access to financial
information around the world (Beneish et al, 2012; Marquez-Ramos, 2009). These de-
velopments will result to pecuniary benefits (in terms of cheaper global capital market
participation) for foreign investors, particularly as capital flows and trade become more
globalized. Therefore it is cheaper for capital market participants to become familiar
with one set of global standards than with several local standards (Ramanna and Sletten,
2009).
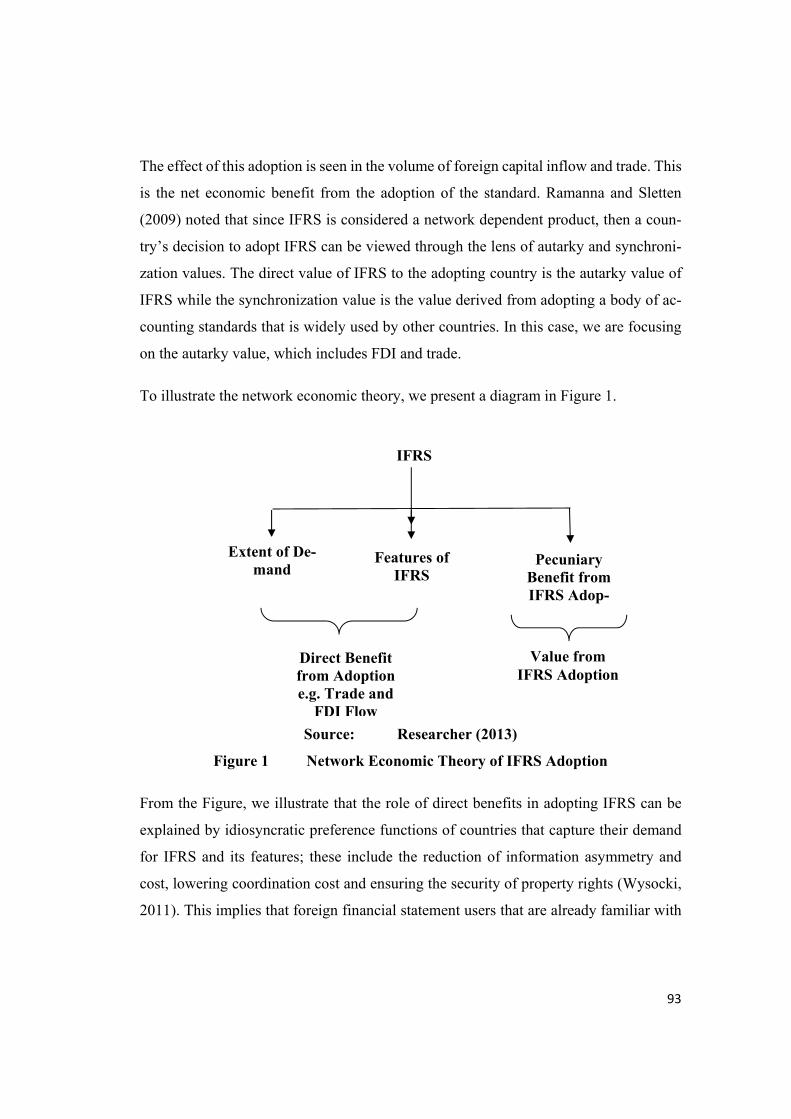
93
The effect of this adoption is seen in the volume of foreign capital inflow and trade. This
is the net economic benefit from the adoption of the standard. Ramanna and Sletten
(2009) noted that since IFRS is considered a network dependent product, then a coun-
try’s decision to adopt IFRS can be viewed through the lens of autarky and synchroni-
zation values. The direct value of IFRS to the adopting country is the autarky value of
IFRS while the synchronization value is the value derived from adopting a body of ac-
counting standards that is widely used by other countries. In this case, we are focusing
on the autarky value, which includes FDI and trade.
To illustrate the network economic theory, we present a diagram in Figure 1.
Source: Researcher (2013)
Figure 1 Network Economic Theory of IFRS Adoption
From the Figure, we illustrate that the role of direct benefits in adopting IFRS can be
explained by idiosyncratic preference functions of countries that capture their demand
for IFRS and its features; these include the reduction of information asymmetry and
cost, lowering coordination cost and ensuring the security of property rights (Wysocki,
2011). This implies that foreign financial statement users that are already familiar with
IFRS
Extent of De-mand
Features of IFRS
Pecuniary Benefit from IFRS Adop-
Direct Benefit from Adoption e.g. Trade and
FDI Flow
Value from IFRS Adoption

94
IFRS standard, as a result of the global relevance of the standard, will incur lower bar-
riers in analysing the financial statement of other adopting country. This in turn can
result in accrued benefits to reporting entities.
The theory expects that IFRS adoption will improve the volume of foreign capital inflow
and trade of those countries, due to the lowering of information costs to capital markets
and reduction of information asymmetry that can be traceable to the adoption of the
standard. These are the values from the adoption of the standard. The absent of interna-
tional accounting standards such as IFRS will reduce the costs of becoming familiar
with domestic accounting practices and this will likely improve the attractiveness of the
investment destination country.
This theory is applicable to our work because it relates the role of IFRS adoption in
improving the net economic outcomes of the adopting countries. In this case, we intend
to expand on the role of IFRS adoption in enhancing the trade and FDI outcome of the
adopting countries through the uniformity of financial reporting standard that will en-
hance foreign capital flow around the world.
Some studies have applied this theory to explain the relationship between IFRS and the
pecuniary benefits of trade and FDI. They include Ramanna and Sletten (2008) who
identified that the degree of IFRS harmonization in a country is an increasing function
of the perceived value of its IFRS network, particularly when network benefits are de-
fined to include the trade and FDI benefits. Their studies consistently argued that the
network effect matters less to countries with larger GDPs and countries where foreign
trade accounts for a smaller fraction of GDP. These suggest that professed advantage of
IFRS harmonization decisions are weaker for countries with more international bargain-
ing power.
Ramanna and Sletten (2010) examined the network effects in countries’ adoption of
IFRS. Their study developed and tested the hypothesis that perceived network benefits
from the adoption of IFRS by countries can possibly explain the country’s decision to

95
shift away from local accounting standards. That is, as more jurisdictions with economic
ties to a given country adopt IFRS, perceived benefits from lowering transactions costs
to foreign financial-statement users will outweigh the institutional differences that make
IFRS adoption costly. Their result supports the fact that perceived network benefits in-
creases the degree of IFRS harmonization among countries, which is dependent on the
fact that larger countries and countries that are less dependent on foreign trade have a
differentially lower response to these perceived benefits.
The Network Economic Theory relates to our study in some ways. First of all, the theory
argues that there are pecuniary benefits derivable from the a globalised uniform account-
ing standard (IFRS) and such benefits include trade and FDI, which are caused by the
reduction of information cost and asymmetry and by improving property right protection
as well as reduction of coordination cost and transaction cost (Ramanna and Sletten,
2009; Ramanna and Sletten, 2010; Wysocki, 2011; Gordon, Loeb and Zhu, 2012). This
implies that there are expected trade and FDI benefit from the adoption of the standard.
In this light, we expect a positive relationship between IFRS adoption, trade and FDI.
Secondly, the theory explains why a country adopts IFRS; this is as a result of the trade
and FDI benefits from the adoption. Considering that the numbers of African countries
that are adopting IFRS are rising, we are interested in seeing if the adoption is transmit-
ting to the Trade and FDI volumes of the countries. We perceive that this theory best
explains the mechanism and other related studies, such as Ramanna and Sletten (2009
and 2010) have adopted similar theory.
2.2.3 REVIEW OF EMPIRICAL LITERATURE AND IDENTIFICATION OF
GAPS
As earlier stated, given the reasons for IFRS adoption and the possible implication, de-
bate on the relationship between trade, FDI and IFRS adoption is inconclusive. For in-
stance, there are some studies that have noted that IFRS adoption improves the trade and
foreign capital flow of the adopting countries (Ramos, 2008; Gordon, Loab and Zhu,
96
2012). And on the other hand, some other studies clearly emphasize that it is not neces-
sarily IFRS that improves trade, but countries that trade more and depend on FDI are
more likely to adopt IFRS (Ramanna and Sletten, 2009; Ramanna and Sletten, 2010).
This debate is not even considered when zeroing in on IFRS adoption literatures that
have focused on the African context. The African context is important considering that
IFRS is a recent phenomenon in defining the accounting structure of countries within
this region. More so, there are immense studies that have emphasised the inadequacy of
African countries to apply and understand the sophistication of the new standards. At
best, the conclusion in Afrocentric IFRS adoption literature have climaxed on consider-
ing the level of compliance by companies after the adoption of IFRS (Yahaya, and Kha-
dijat, 2011); the implication of the adoption of IFRS in Nigeria (Iyoha and Faboyede,
2011; Madawaki, 2012); financial statement effect of IFRS adoption (Okpala, 2012);
perception based analysis of mandatory adoption of IFRS in Nigeria (Adeyemo, 2013);
the adoption of IFRS in relation to curriculum development (Onuoha, 2013); the effect
of the adoption of IFRS on the stock market performance of African countries (Okoye
and Ezejiofor, 2014).
Noting the inconclusiveness of the literature on the linkage between IFRS adoption, FDI
and trade, and the incongruity of this debate in the African context, this study identifies
this important gap and goes further investigating into the relevance of IFRS adoption on
the volume of trade and FDI attractiveness of the adopting African country. The ap-
proach of this study is unique considering that the conclusions reached by non-African
literature, on the FDI-Trade implication of IFRS adoption, made use of panel data that
comprise of both developed and developing countries. The pitfall in this mixed sample
is that, the combination of data of countries from different regions will result to an inef-
ficient conclusion as a result of heterogeneity in the structures of the economic system
(i.e. political, social and economic structures), thereby implying that conclusions
reached in those studies may not be generally applicable. This has possibly accounted
for the inconclusive debate on the impact of IFRS adoption on countries trade and FDI.
97
This study also observes that some of the non-African studies (e.g. Gordon, Loeb and
Zhu, 2012) have considered a linear relationship between IFRS adoption, trade and FDI.
This implies that they have considered the adoption of IFRS as having a direct impact
on trade and FDI without being conditioned on any other intervening variable. However,
in this study, the role of some intervening variables was suggested based on the intuition
that IFRS adoption will only have an impact on trade and FDI when certain structures
are in place to facilitate this process. A country’s decision to adopt IFRS will signal to
the international community that the business environment in the country is conducive
for investment. This is especially for FDIs that will require the adoption of IFRS for
easy control and supervision of their subsidiaries in host countries. However, for sus-
taining the FDI inflow and trade, institutional, professional and human capital infra-
structure will be needed. For instance, a country that adopts IFRS and has stringent busi-
ness regulations will not be able to attract FDI. Likewise, a country that adopts IFRS but
have poor professional accounting bodies and low human capital (such as education)
will not have the capacity to sustain the inflow of FDI. This was not considered in extant
studies and in this study, there was an examination of the interaction term between the
prevailing indigenous professional accounting infrastructure and IFRS adoption out-
comes.

98
CHAPTER THREE
METHODOLOGY
3.1 INTRODUCTION
This chapter presents the research design, population of the study, sampling technique,
sampling size, data gathering method, the sources of data, instrument of data collection,
data analysis method and the instruments of data analysis.
3.2. RESEARCH DESIGN
This study is an ex-post study. It uses quantitative research technique and quantitative
data in reaching its inference. It is a quantitative research because empirical analysis was
employed in answering our research questions. Forty eight (48) countries was selected
as the sample. The selection of the countries is based on the availability of relevant data
that shows the legal date of adopting IFRS and other relevant data that was included in
the empirical model. The period of study is 2002- 2014. Some of the data for African
countries are very scanty and accesses to these data are difficult. Some other studies
have encountered similar challenges and they resorted to including only those countries
with data as part of their sample (Asiedu, 2006).
The data for this study are sourced principally from some established databases, which
includes the Price Water House Coppers web report on the state of IFRS adoption around
the world. This website provides information on the actual date the countries made a
declaration of their acceptance of IFRS to be used by listed companies as reporting
standard. Furthermore, other data are sourced from the World Bank World Development
Indicators 2012, which reports the macroeconomic variables that are sourced for as co-
variates in the Trade/FDI equation. The choice of this data source is because the kind of
objective poised out to be achieved in this study is such that these databases provides
the relevant data to be suitable to achieve the underlining objectives.

99
After the data are gathered, some empirical techniques (to be discussed subsequently)
were engaged such as descriptive and econometric statistics to empirically establish the
relationship between the variables. The econometric analysis will involve the use of the
Generalized Methods of Moments technique, among others, to control for possible en-
dogeneity that usually arises in econometric models
3.2 POPULATION OF STUDY
The population for the non-survey research is all the countries in Africa. Currently, there
are fifty seven (57) countries in Africa as identified by the United Nations Conference
on Trade and Development. These countries are presented in Table 1 based on their
divisions into the five sub-regions (Central, East, North, South and West Africa).
Table 1: Population of the Study Central Africa East Africa North Africa South Africa West Africa Angola British Indian Ocean Territory Algeria Botswana Benin Cameroon Burundi Egypt Lesotho Burkina Faso Central African Republic Comoros Morocco Namibia Cape Verde Chad Djibouti Libyan Arab South Africa Côte d'Ivoire Congo Eritrea Sudan Swaziland Gambia DR Congo Ethiopia Tunisia Ghana Equatorial Guinea Kenya Guinea Gabon Madagascar Guinea-Bissau Sao Tome and Principe Malawi Liberia Mauritius Mali
Mayotte Mauritania Mozambique Niger Rwanda Nigeria
Somalia Sénégal Seychelles Sierra Leone Uganda Togo
United Republic of Tanzania Zambia Zimbabwe
Source: Classification was based on UNCTAD (2016).
The population of the study includes the countries that have adopted IFRS and those that
have not adopted the standard. The combination of the two groups was necessary be-
cause the broad research objective is to establish the impact of IFRS adoption on the
trade and FDI inflow of African countries. Therefore, econometric estimations will be
100
conducted on the second group and the result will be used to validate our findings from
the results of our econometric estimations using the first group.
3.3 SAMPLING TECHNIQUE AND SAMPLING SIZE
This is discussed in two sections. The first is the sample size, followed by the sampling
technique.
The countries included in the sample are Algeria, Angola, Benin, Botswana, Burkina
Faso, Burundi, Cameroon, Central African Republic, Chad, Comoros, Congo, DRC,
Cote D’Ivoire, Djibouti, Egypt, Equatorial Guinea, Eritrea, Ethiopia, Gabon, Gambia,
Ghana, Guinea-Bissau, Kenya, Lesotho, Liberia, Libya, Madagascar, Malawi, Mali,
Mauritania, Mauritius, Morocco, Mozambique, Namibia, Niger, Nigeria, Rwanda, Sen-
egal, Sierra Leone, South Africa, Sudan, Swaziland, Tanzania, Togo, Tunisia, Uganda,
Zambia, Zimbabwe. From these countries, Botswana, Egypt, Ghana, Lesotho, Kenya,
Malawi, Mauritius, Morocco, Mozambique, Namibia, Nigeria, South Africa, Sierra Le-
one, Swaziland, Tanzania, Uganda, Zambia and Zimbabwe. This sample represents
about 84 percent of the total countries in the African region. This implies that the sample
size is sufficient to draw inference and make generalisations about the African region.
It is worth observing the years that IFRS was adopted by some of the sample. Table 2
presents these statistics and from the table, many of the countries were adopting IFRS
some years after the declaration of IFRS by the IASB in 2001. The earliest adopting
country was morocco and Burundi, who legally adopted the standard in 2004. Many of
the other countries began adopting from 2005 onward, which was only a year after the
compulsory adoption by listed European countries. Some of the countries such as Eritrea
and Nigeria adopted the standard in 2010, following the public declaration by the coun-
try for their decision to adopt the standard. Some other countries who adopted the stand-
ard beyond 2010, that would have been included in this sample was dropped because
data would not be gotten for the other variables beyond this period, if chosen.
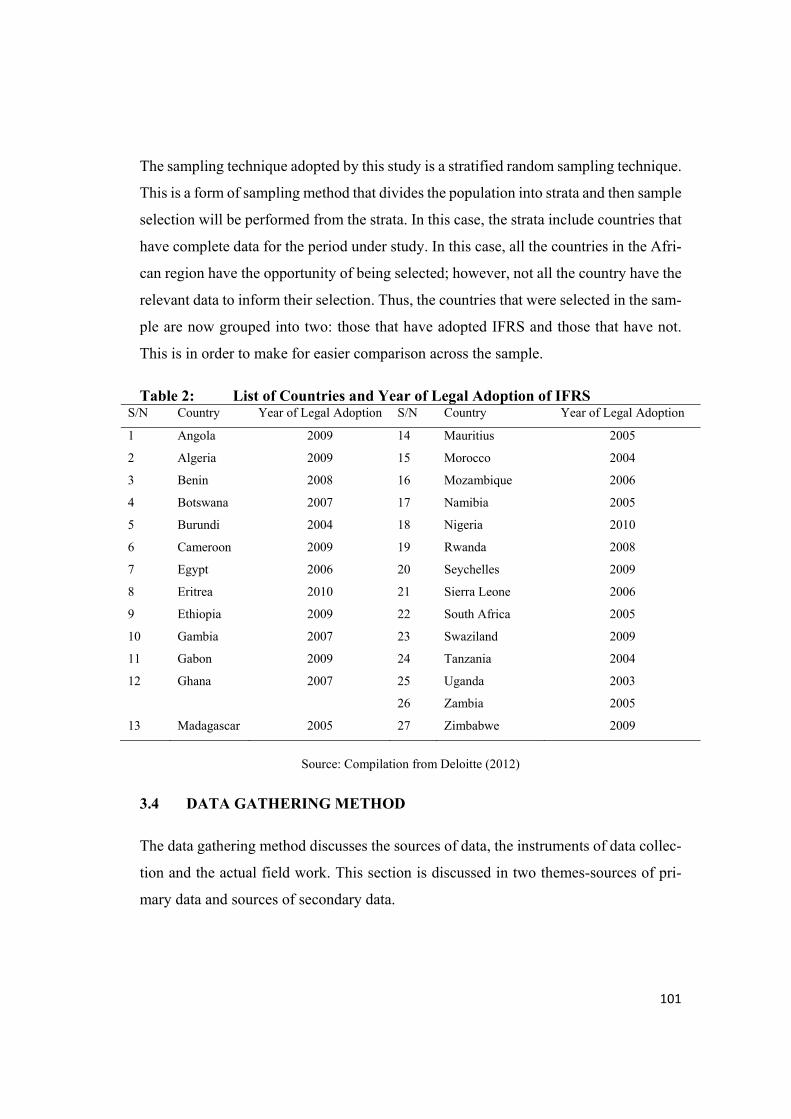
101
The sampling technique adopted by this study is a stratified random sampling technique.
This is a form of sampling method that divides the population into strata and then sample
selection will be performed from the strata. In this case, the strata include countries that
have complete data for the period under study. In this case, all the countries in the Afri-
can region have the opportunity of being selected; however, not all the country have the
relevant data to inform their selection. Thus, the countries that were selected in the sam-
ple are now grouped into two: those that have adopted IFRS and those that have not.
This is in order to make for easier comparison across the sample.
Table 2: List of Countries and Year of Legal Adoption of IFRS S/N Country Year of Legal Adoption S/N Country Year of Legal Adoption
1 Angola 2009 14 Mauritius 2005
2 Algeria 2009 15 Morocco 2004
3 Benin 2008 16 Mozambique 2006
4 Botswana 2007 17 Namibia 2005
5 Burundi 2004 18 Nigeria 2010
6 Cameroon 2009 19 Rwanda 2008
7 Egypt 2006 20 Seychelles 2009
8 Eritrea 2010 21 Sierra Leone 2006
9 Ethiopia 2009 22 South Africa 2005
10 Gambia 2007 23 Swaziland 2009
11 Gabon 2009 24 Tanzania 2004
12 Ghana 2007 25 Uganda 2003
26 Zambia 2005
13 Madagascar 2005 27 Zimbabwe 2009
Source: Compilation from Deloitte (2012)
3.4 DATA GATHERING METHOD
The data gathering method discusses the sources of data, the instruments of data collec-
tion and the actual field work. This section is discussed in two themes-sources of pri-
mary data and sources of secondary data.
102
3.4.1 Sources of Secondary Data
This study makes use of secondary data. The data is sourced from the PriceWaterHouse-
Coppers web report on the extent of IFRS adoption around the world. From this web
report, this study gathers the dates of adoption of IFRS, which is then used to compute
the periods of adoption of IFRS. The main dependent variables (Trade and FDI) is
sourced from the World Bank-World Development Indicators.
This study controls for other covariates, which can affect the extent of trade and FDI
inflow into a country. The inclusion of these covariates is aimed at avoiding errors of
variable omission. The covariates of interest are depicted in the analytical framework as
described in figure 2.
The analytical framework was developed from an extensive literature review on the de-
terminants of trade and FDI. Six covariates were identified and they include the human
capital, cost of trade, institutions (government effectiveness, rule of law, control of cor-
ruption and regulatory quality), market size, infrastructures and natural resources. Data
will also be gathered for these covariates from the World Bank dataset.
The first covariate is the indigenous institutions, which cannot be overemphasized. This
is based on the fact that institutions include principles and standards regulating the in-
teractions of economic agents. Likewise, it enhances transparency and the extent to
which information flow can be symmetric between different economic agents. The qual-
ity of institutions will determine the extent to which trade and FDI can be facilitated by
IFRS adoption. Studies, such as Fosu (2011), have argued that the terms of trade of many
African countries are dwindling as a result of poor institutional framework. This is de-
spite their adoption of IFRS. Asiedu (2006) also reverberated the fact that institutions
matter especially in attracting FDI into a country. Anecdote evidence suggests that FDI
will flow into a country that has well established institutional framework in order to
protect their investment. This implies that a country with poor investment climate in the

103
form of war and political instability, poor contract enforcement, will attract less FDI and
will perform poorly in trade irrespective of their willingness to adopt IFRS.
The second covariate is the level of human capital development in the country. This has
been identified in literature as a major influence of trade and FDI. Asiedu (2006) and
Asiedu and Lien (2011) have consistently re-echoed this by noting that the volume of
Africa’s trade and FDI inflow will be determined by the development of her human
capital. Logically, trade requires production and FDI require developed labour force:
therefore, for a country to effectively make progress in trade and FDI inflow, it will be
expected that they focus on the development of their human capital despite their desire
to adopt IFRS.
Other covariates as illustrated in the Figure include the cost of trade, which has also been
identified as a major determinant of a country’s performance in international trade. This
was emphasized in extant literature as it is noted that the transportation cost of trading
has a great impact on the volume of trade. The author noted that the prominent explana-
tion for the rise in international trade is as a result of decline in the international trans-
portation cost.
Market size includes the income of the country in one form and population of the country
in another form. The market size will attract FDI and will facilitate international trade
because countries will want to have a trade partner whose demand for their products will
be high as a result of the potential market. Likewise, FDI will be attracted to flow into
countries with large market size so that their manufactured products can easily be sold
and their profit recouped. Asiedu (2006) included this variable in her model of estimat-
ing the relationship between FDI, natural resources, market size, government policy,
institutions and political instability. She also established that natural resources are at-
tractors of FDI into a country. This has severally being reverberated in the literature:
FDI inflow into Africa are resource seeking (see Asiedu, 2006). This implies that the
extent to which FDI flows into African countries will be determined by the availability
of resources.
104
Finally, infrastructure is a major determinant of trade and FDI. This is because infra-
structural development is both a trade facilitator and FDI attractor. For example, coun-
tries with poor road and electricity will increase the cost of trade because of the cost of
transportation and the cost of powering storage facilities will be higher. Likewise, FDI
will not be able to efficiently function when there are poor infrastructures because they
require infrastructure such as power to function. Asiedu (2006) earlier used dataset for
African countries to identify infrastructure as a major factor to yield Africa access to the
global economy, in terms of trade.
From the analytical framework, we identified that IFRS adoption will not just affect
trade and FDI in isolation, without the combined influence of accounting infrastructure.
This is because the extent of accounting infrastructure in the country is capable of ex-
plaining the sustainability of the influence of IFRS adoption on trade and FDI. As we
earlier noted, when a country adopts IFRS, the availability of accounting infrastructure
that would aid the use and implementation of the standard in the country, will determine
the extent to which sustainable capital inflow will be achieved. Based on this, we iden-
tified three main accounting infrastructures- the indigenous accounting institution, the
development of the professional accountancy body and the human capital in the country.
The development of the professional accounting bodies will aid the sustainability and
the provision of qualified manpower that can be hired in the industry, to aid the prepa-
ration of financial report based on IFRS. We note that, despite the adoption of IFRS, if
professional accounting bodies are not producing able personnel to be hired, the out-
come from FDI and trade will be dismal. This is very important considering that FDI
require professionals to prepare the financial reports of their subsidiaries to aid ease of
monitoring.
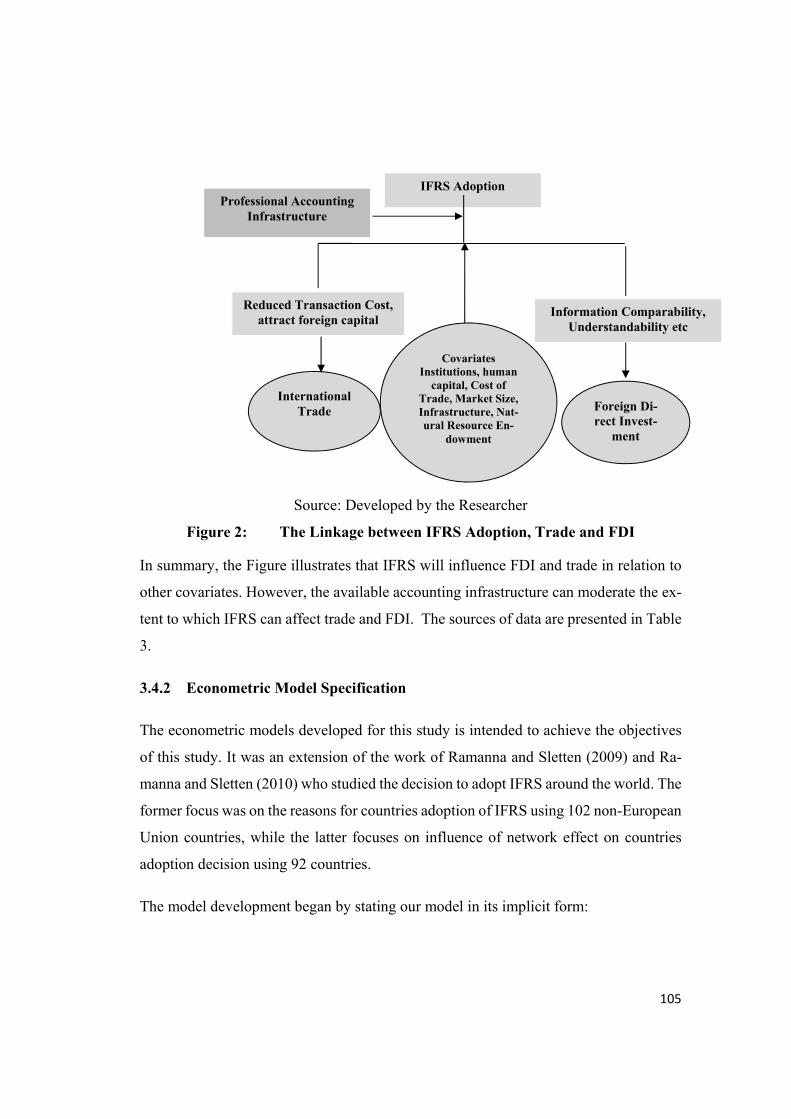
105
Source: Developed by the Researcher
Figure 2: The Linkage between IFRS Adoption, Trade and FDI
In summary, the Figure illustrates that IFRS will influence FDI and trade in relation to
other covariates. However, the available accounting infrastructure can moderate the ex-
tent to which IFRS can affect trade and FDI. The sources of data are presented in Table
3.
3.4.2 Econometric Model Specification
The econometric models developed for this study is intended to achieve the objectives
of this study. It was an extension of the work of Ramanna and Sletten (2009) and Ra-
manna and Sletten (2010) who studied the decision to adopt IFRS around the world. The
former focus was on the reasons for countries adoption of IFRS using 102 non-European
Union countries, while the latter focuses on influence of network effect on countries
adoption decision using 92 countries.
The model development began by stating our model in its implicit form:
International Trade Foreign Di-
rect Invest-ment
IFRS Adoption
Reduced Transaction Cost, attract foreign capital
Information Comparability, Understandability etc
Professional Accounting Infrastructure
Covariates Institutions, human
capital, Cost of Trade, Market Size, Infrastructure, Nat-ural Resource En-
dowment

106
Yit = β0i + β1Xit + β2Cit + µit (3.1)
Where Yis our dependent variable, X is the explanatory variable and C are the sets of
covariates/control variables as described in our analytical framework. Taking this fur-
ther, we describe the explicit form of our model as:
Ykit = β0i + β1IFRSit + β2HCapit + β3Costit+ β4Instit+ β5Mktn
it+ β6Infrait+ β7Natit+
β8Prof_Acctit+ β9Prof_Acct*IFRSit+ µit (3.2)
Yk is the measure of trade and foreign investment. The subscript ‘k’ include the
measures and they are: FDI- foreign capital inflow. The net Foreign Direct In-
vestment inflow-FDI as a percentage of the Gross Domestic Product-GDP was
used to capture FDI; Foreign Portfolio Investment-FPI, which is measured as
the portfolio equity net inflows as a ratio of the GDP of the respective countries;
the third variable-Trade, is measured as the ratio of total export to GDP of the
country.
IFRSit implies the date of legal adoption of the IFRS standard by a country. The date of
legal adoption of IFRS is measured as the number of years a country has been
an adopter of IFRS-partial or full adoption (Yradpt). The apriori expectation is
such that we expect a positive relationship between IFRS adoption, trade and
foreign direct investment.
HCap is the extent of human capital in the country i at time t. It is measured as Adult
Literacy and Tertiary Gross Enrolment Rate. These measures take into account
the literacy of the adult citizens in a country and they consider the level of de-
velopment of the productive population of the country. We expect that human
capital in the country should have a positive impact on foreign direct investment
and trade. For instance, when human capital values increase, it is expected that
the trade and foreign direct investment will naturally increase in the respective
countries.
107
Cost Cost is the cost of trade proxied as the exchange rate. This is very relevant for
measuring the cost of trade because the exchange rate of a country is a tangible
pointer to the cost of exporting or importing a product into a country. The apriori
expectation here is that the cost of trade is expected to have a negative impact on
trade. For instance, when trade cost increases, for instance, the cost of importing
goods or exporting same, trade will definitely be hurt.
Inst indigenous governance and institutions with in the country; the study concen-
trates on formal institutions which include: political institutions. Political insti-
tution of country i in time t identified from extant literature (such as kauffman et
al, 2005) was used to indicate the quality of political institution in the country.
These measures are political stability (Pol_Stab); Control of Corruption
(Pol_Cop); Government Effectiveness (Pol_Gov) and Regulatory Quality
(Pol_Qua). These indicators are standardized on a scale of -2.5 (poor) to +2.5
(better). However, for better estimation and interpretation of result, + 3.5 was
added to the original values, thus rescaling them from 1 to 6. This is similar to
the original values as the higher the value, the better the quality of political in-
stitution within the country. Similar technique was applied by Osabuohien
(2011). The apriori expectation is that as the quality of institutions improves, the
foreign direct investment and trade will also be improved. This is because insti-
tutions create lasting economic and political structures that enhances investment
and business operations within a country. This relationship is expected to be pos-
itive.
Mktn This is an indicator for the market size of the country, with superscript n connot-
ing two measures. They include the economic size of the country and population
size. The economic size of the country was measured using the GDP per capita
of the country while the population size was captured using the total population
of the country in millions. We expect a positive relationship between market
108
size, trade and foreign direct investment. This is because with larger market
sizes, more trade and foreign investments are expected within the country.
Infra This is the value for infrastructure in the country. We captured this variable using
the total electricity production per kilowatt in the country. This measure was
deemed suitable owing to the fact that power is a major facilitator of production
for trade and FDI attraction. It is expected that infrastructural development will
improve foreign direct investment inflow and trade flow to respective countries.
Nat This is the indicator for natural resources in the country. To measure this varia-
ble, precaution has to be observed so as to avoid a myopic view. This study takes
into consideration the fact that foreign investment into a country will be attracted
where there is the presence of natural resources as well as human capital to be
engaged in the exploitation of these resources. Many proxies have been used in
extant literature to capture this variable such as natural resource as the share of
one or more of primary products, export including agricultural raw materials,
food, fuel, ores and metal to GDP. However, these measures are not measures of
resource abundance, but rather measures of dependence on natural resources.
However, this study measures the natural resource endowment in a country using
the measure of natural resource export per worker. This measure is relevant to
this study because there is no direct count on natural resources of countries and
the assumption that countries especially African countries’ natural resource ex-
traction is exported2 and not consumed locally, further buttress the argument.
Therefore, since African countries thrive more on primary product from agricul-
ture and other form of economic value derivable from land, we deem this meas-
ure very appropriate. A positive relationship is expected here. Natural resource
enhances the trade flow and foreign investment flows to countries.
2This is evident based on the fact that African countries do not process their natural resource and they therefore export it.

109
Prof_Acct: this is the measure for the development of professional accounting body.
This was captured using three variables. They include the length of years that
the professional accounting body has been in existence. We began to count from
the day the professional accounting body was established. We also include the
number of accounting bodies in the country. This measure will sufficiently illus-
trate the depth of the accounting profession in the country. This implies that a
country with more professional accounting bodies will have more professional
depth than countries with fewer professional accounting bodies. The third vari-
able in this category is a dummy variable to capture countries with accounting
standard setting bodies as 1 and those without these bodies as 0. The apriori ex-
pectation for this variable is not clear. We either expect a positive or negative
relationship. However, the econometric estimation is expected to clearly direct
the signs of the result.
itis identifier for country i and time t while β0i is the constant term, that measures the
variation In the dependent variable as a result of the interactions between the explanatory
variables. µit is the error term which is expected to capture the combined effect of omit-
ted variables in the model.
The last variables in the model (Prof_Acct*IFRS) is the interactive variables, which is
expected to aid us in understanding the extent to which accounting infrastructural de-
velopment can enhance the effect of IFRS adoption on trade and FDI. Based on apriori,
if the variable is +, then it implies that the particular accounting infrastructure can en-
hance the effect of IFRS adoption on trade and FDI and – otherwise.

110
Table 3: Sources of Secondary Data S/N Variables Source
Dependent Variable
1 FDI World Development Indicators-WDI (2012)
2 FPI World Development Indicators-WDI (2012)
3 Trade World Development Indicators (2012)
4 IFRS Adoption
Deloitte database on the rate of IFRS (IASplus.com) and
PWC document on IFRS adoption
5 Adult Literacy World Development Indicators (2010)
6 Tertiary Gross Enrolment Rate Human Development Report (2010)
7 Tariff Rate World Integrated Trade Solutions
8 Political Institutions World Governance Indicators (2012)
9 GDP Per Capita World Development Indicators (2012)
10 Population World Development Indicators (2012)
11 Total Electricity Production World Development Indicators (2012)
12 Natural Resource Export Per Worker World Development Indicators (2012)
14 Accounting Infrastructure
Various websites of professional accounting bodies in the
sampled countries
3.5 Estimation Technique
To begin the estimation, this study takes into consideration clarity of analysis so as to
avoid ambiguity and misinterpretation of results. Therefore, we will begin by estimating
the correlation analysis in order to establish the association existing between the varia-
bles in their bivariate form. From the correlation analysis, we will also be able to under-
stand if multicollinearity exists between any of the explanatory variables. This will de-
termine whether we are to include all of the variables in the same model. In the case of
multicollinearity, a stepwise regression will be performed in order to avoid spurious
estimates.
Three estimation techniques was applied in order to ensure a robust estimates. The or-
dinary least square regression estimation technique was applied as the baseline estima-
tor; while the generalised least square technique is the second test and this one controls
for either the fixed country effect or the random effect depending on the choice from the
111
Hausman test; and then corroborated with the inclusion of the third estimation tech-
nique-Generalized Method of Moments estimation technique.
Pooled Ordinary Least Square (POLS Technique)
The POLS regression estimations concerns itself with the study of the effect of one or
more variables (called the explanatory variables) on another variable(s) - the explained
variable, with a view to estimating the predictive coefficient of the explanatory varia-
bles. The regression analysis does not necessarily imply causation. In other words, a
statistical relationship, despite strong and suggestive, does not explain the causation of
the variable.
The regression analysis thrives on seven fundamental assumptions. Gujarati and Porter
(2009) argued that these assumptions must be fulfilled for the regression analysis to
produce its best linear unbiased estimates (BLUE). These assumptions include:
The first assumption is that the parameters of the regression model is linear in nature.
By linearity, it implies that the model follow a linear stochastic trend; in actual sense,
there is a straight line relationship between the variables. Secondly, the explanatory var-
iables have fixed values that are independent of the error terms. Thirdly, there is a zero
mean value of the disturbances to the regression model. In other words, there is no spec-
ification bias, where the regression model contains variables that are not supposed to be
included in the model or are wrongly included in the model. This therefore causes a
wrong specification and the extent of disturbances increases as well. Fourthly, the model
assumes homoscedasticity or constant variance of the error term. This implies that the
error term remains the same irrespective of the explanatory variable that is included in
the model. Fifthly, the regression analysis assumes no autocorrelation between the dis-
turbances/error terms. The sixth and seventh assumption is that the number of observa-
tion is expected to be greater than the number of parameters to be estimated and the
values of the variables that are included in the model must not be constant.
112
Having known these assumptions, the OLS regression presents a reliable starting point
to examine the relationship between the variables. In essence, since this analysis presents
the explanatory power of the variables in the model, then it can easily be seen as to the
strength of association that comes with the model.
Generalised Least Square
The estimation process began by considering the baseline regression that controls for
the fixed country effect. This technique estimates the Ordinary Least Square-OLS re-
gression with country-fixed effects and heteroscedasticity-corrected standard errors.
This technique is immeasurably relevant since it controls for the country’s unobserved
heterogeneities that are likely to occur due to time-invariant country characteristics (Gu-
jarati and Porter, 2009). Some of these characteristics include the level of institutional
set-ups in the sampled countries; the country’s accounting heritage; and the legal system
etc.
For instance, consider a country in the sample, with an Anglo-Saxon financial reporting
heritage, and another with the Continental European framework, despite the adoption
of IFRS, these factors are likely going to inform the procedure through which the finan-
cial reporting standards affects investment in such country. Since these heterogeneities
are likely to inform the relationship between the adoption of IFRS and foreign invest-
ment, then it is essential to apply a technique that adequately controls for this in its
estimation process. A preliminary Hausman test was conducted to validate our choice
for the country-fixed effect technique.
Therefore, the fixed effect model is presented as:
Ykit = β0i + β1IFRSit + β2HCapit + β3Costit + β4Instit + β5Mktn
it + β6Infrait + β7Natit +
β8Prof_Acctit + β9Prof_Acct*IFRSit + Ci + Tt + µit (3.3)
Where the identifiers ‘Ci‘ and ‘Tt‘ represents the country’s and time fixed effects, µitis
the error term, α is a constant and β and are parameters.

113
The second form of the generalised least square is the random effect estimation
technique. This technique considers the unique time constant attributes that are the
results of random variation and do not correlate with the individual regressors.This
model is adequate, if inferences are to be drawn about the whole population, not only
the examined sample. However, to choose between the fixed effect and the random
effect, the Hausman test will be conducted and the probability value of the test statistics
will determine which of the approach best soothes the analysis of this study.
The Generalized Method of Moments
After this, we will estimate the Generalized Method of Moments. The rationale for this,
especially focusing on the GMM technique, is because most economic relationships
such as the focus of this study may be orthogonal in nature. This implies that their values
may not be entirely determined in the model and can be influenced by other variables
represented in the error term. Thus, the problem of autocorrelation can arise. A failure
to account for this relationship can lead to dynamic misspecification and endogeneity
problems. For example, the contemporaneous explanatory variable in the various mod-
els of the study may not be absolutely endogenous as some factors outside the models
can influence them, which may be correlated with the error term of the models. Arrelano
and Bond (1991) developed a GMM in first difference equation so as to correct the
endogenous variables by the lagged dependent variable. For example, consider the fol-
lowing equation:
Yit = β1Yit-1 + β2Xit + λit= ᾢi + νit (3.11)
Where Yit is the dependent variable and Yit-1 is the lag dependent variable and Xit is the
exogenous variable that possibly includes the lagged value and λitis the error term for
the country effect ᾢi. The GMM difference transforms this equation by the first differ-
ence:
Yit - Yit-1 = β1 [Yit-1 - Yit-2] + β2 [Xit - Yit-1] + [λit - λit-1] (3.12)
114
The first difference was performed to eliminate the time invariant unobserved country
specific effect ᾢi,. This makes the GMM technique efficient for this kind of estimation.
The GMM has several advantages amongst which is that it is more efficient and con-
sistent since it uses more moment restrictions and if any of the explanatory variables are
endogenous, appropriate instruments are found for using predetermined and exogenous
variable within the system (Leyaro and Morrissey, 2010). These internal instruments
help in solving the problem of endogenous explanatory variables.
However, the internal instrument may not be good instruments of current differences if
the series is close to a random walk (when the time series are persistence) and the num-
ber of time series observation is small and in the case of this study, T = 7. To avoid this
problem Arellano and Bond (1991) propose the system GMM that is derived from the
estimation of a system of two equations (the differenced equation and the levels equa-
tion). The suitably lagged levels of Yit and Xit are used as the instrumental variables in
the differenced equation. However, ΔYit and ΔXit are used as the instrumental variable
in the level equation provided those explanatory variables are strictly exogenous.
To establish the validity of the instruments, the standard Sargan tests of over-identifying
restrictions and for system GMM the standard Hansen test is used. Furthermore, the AR
(1) and the AR (2) values is also estimated to test the null hypothesis of no autocorrela-
tion of first order and second order (Arellano and Bond, 1991). The former under the
null hypothesis is asymptotically distributed as a chi-square with degrees of freedom
equal to the number of instruments less than the number of parameters. Hence, if the
model is correctly specified, then the variables in the instrument set are expected to be
uncorrelated with the idiosyncratic component of the error term in the model (Leyaro
and Morrissey, 2010). Leyaro and Morrissey also noted that the AR(2) test is asymptot-
ically distributed as a standard normal under the null of no second order serial correla-
tion as it aims at providing a check on the specification of the model as well as the
legitimacy of the variables used as instruments. This is a very important check compared
to the AR(1). This implies that in a system GMM, there could be the presence of the first

115
order autocorrelation, but the system is not permitted to exhibit a second order autocor-
relation.
To validate these, the probability value of the Sargan test, AR(2) and AR(1) are used.
The assumption is such that the probability value of the Sargan test and the AR(2) is
greater than 0.05 while that of AR(1) is less than 0.05. Once these criteria are attained,
then the validity of the instrument used in the system GMM is established as well as
there is no problem of over identifying of the instrument in the system.
3.5.1 Argument for the Use of SGMM Technique as the Main Tool for Testing our Hypothesis
The main arguments for the use of the SGMM technique include the following: the
SGMM approach addresses the issues of endogeneity with an application of methods of
moments that exploits all the orthogonality conditions between the lagged dependent
variables and the error term. Also, issues of endogeneity are efficiently addressed by
using internal instruments and the System GMM technique (Gujarati and Porter, 2009).
This technique includes reasonable stationarity restrictions on its initial condition pro-
cess; includes additional moment conditions unlike other dynamic estimation tools like
the Difference GMM - DGMM; and it is robust to heteroscedasticity and distributional
assumptions (Bandyopadhyay et. al., 2014, Oluwatobi et al, 2014).
The only problem with this technique is the validity of the internal instruments included
in the estimation process. In essence, the assurance that the internal instruments are not
over-identified. To validate this, the test for autocorrelation [AR (1) and AR (2)] and
Sargan test for instrument over-identification will be applied. The rule of thumb in the
application of this test is that it is expected that the probability value of the AR (1) test
should be ≤ 0.05 and that of the AR (2) be ≥ 0.05. Likewise, the probability value for
the Sargan test should be such that the test is ≥ 0.05. Once these rules are satisfied, then
it is evident that the internal instruments applied are reliable and not over-identified.
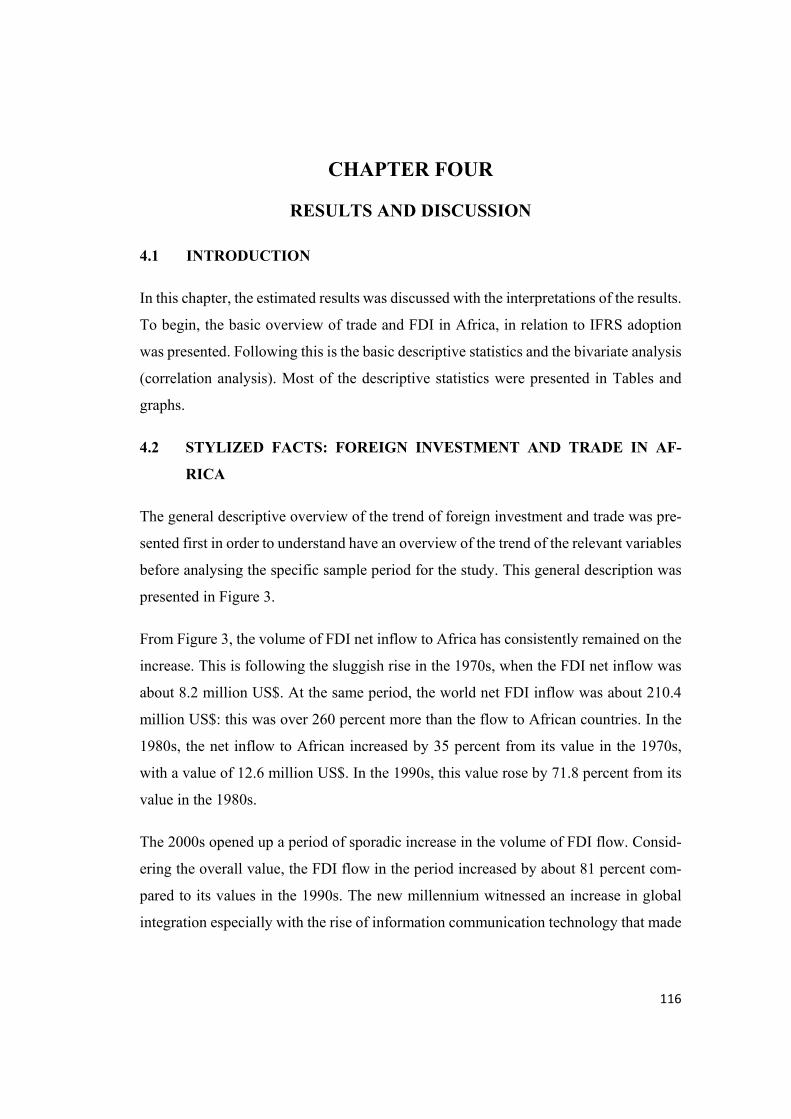
116
CHAPTER FOUR
RESULTS AND DISCUSSION
4.1 INTRODUCTION
In this chapter, the estimated results was discussed with the interpretations of the results.
To begin, the basic overview of trade and FDI in Africa, in relation to IFRS adoption
was presented. Following this is the basic descriptive statistics and the bivariate analysis
(correlation analysis). Most of the descriptive statistics were presented in Tables and
graphs.
4.2 STYLIZED FACTS: FOREIGN INVESTMENT AND TRADE IN AF-
RICA
The general descriptive overview of the trend of foreign investment and trade was pre-
sented first in order to understand have an overview of the trend of the relevant variables
before analysing the specific sample period for the study. This general description was
presented in Figure 3.
From Figure 3, the volume of FDI net inflow to Africa has consistently remained on the
increase. This is following the sluggish rise in the 1970s, when the FDI net inflow was
about 8.2 million US$. At the same period, the world net FDI inflow was about 210.4
million US$: this was over 260 percent more than the flow to African countries. In the
1980s, the net inflow to African increased by 35 percent from its value in the 1970s,
with a value of 12.6 million US$. In the 1990s, this value rose by 71.8 percent from its
value in the 1980s.
The 2000s opened up a period of sporadic increase in the volume of FDI flow. Consid-
ering the overall value, the FDI flow in the period increased by about 81 percent com-
pared to its values in the 1990s. The new millennium witnessed an increase in global
integration especially with the rise of information communication technology that made
117
global capital flow easier compared to the earlier periods. For instance, the introduction
of the wireless transfers and integration of the financial systems among countries, the
transfer of global capital was made easier and this cannot be separated from the ava-
lanche increase in the global capital flow.
In this period (2000s), the global capital flow witnessed a major shock tagged the global
financial crisis. This crisis affected global capital as countries began to repatriate their
investment in order to aid national business cycle shock. The global capital flow from
the period 2000-2007 was about 125 million US$ and during the crisis (2007-2010), the
global capital flow reduced to about 109 million US$. This drop was about 15 percent
from its value prior to the global financial crisis.
Source: World Development Indicators (2014)
Figure 3 FDI Net Inflows to Africa (1970-2013)
Figure 4 presents the FDI flow to/from Africa. Focusing on the FDI inflows into African
compared to the outflow from Africa, it is observed that there is a marked increase in
the inflow compared to the outflow. This increase is about six-fold over the past decade.
The flows increased from about 6.3 billion US$ in 2000 to 35 billion US$ in 2012. While
this increase is still just 2.5 percent of the total global flow of FDI, it reveals that an
0
5E+09
1E+10
1.5E+10
2E+10
2.5E+10
3E+10
3.5E+10
4E+10
4.5E+10
5E+10
0
5E+11
1E+12
1.5E+12
2E+12
2.5E+12
3E+12
World Africa

118
unprecedented size of investment capital in most African countries is still much larger
than remittances or official aid to the continent.
As displayed in Figures 3 and 4, the period of financial crisis witnessed a reduction in
the inflow to Africa. However, compared to the rest of the world, the inflows to Africa
have been less volatile than the worldwide inflows. In the pre-crisis, the inflow of FDI
to the world was about 60% and similarly, the African FDI flow was also about 64 per-
cent. However, during the crisis, the FDI flow reduced by about 89 percent for the world
and for Africa, it reduced by about 15 percent. This confirms the less volatile situation
of the FDI flow to African countries.
Source: World Development Indicators (2014)
Figure 4: FDI Flow to/from Africa
The FDI inflows to Africa has risen mainly driven by international and regional market-
seeking investments as well as infrastructure investment. More so, due to the expecta-
tions for sustained economic and population growth in Africa, the region is attracting
more of market-seeking FDI into her consumer-oriented industries.
Figure 5 presents the statistics from the World Investment Report on the volume of FDI
flow to Africa by top FDI recipient countries. The FDI flow to the Northern African
region declined by 7 percent (amounting to 15.5 billion US$) in 2013 from the value in
2012. This decline is most likely traceable to the global insecurity crisis attributable to
119
the Arab nations. For instance, the FDI flows to Egypt dropped by 19 per cent in 2013,
from its value in 2012.
In the Western African region, the flow of FDI also declined by 14 per cent; the figure
reveals the situation of Nigeria whose decline in FDI inflow can also be associated with
the rising media propaganda of the rising rate of terrorism in the country. Most investors
will likely be unwilling to invest their fund in countries with unsafe investment climate
(Asiedu and Lien, 2011). In the Eastern African region, FDI flow surged by 15 per cent,
and the reason for this increase was attributed to the fact that investment in this region
was driven by rising flows of foreign investment to Kenya and Ethiopia who are devel-
oping a favourable business hub in industrial production and transport services. Like-
wise, Ethiopia’s industrial strategy is able to attract Asian capital investors into the coun-
try and this has improved the development of the manufacturing base in such country.
In Southern Africa, the situation is not different in the sense that FDI flows to countries
in this region has almost doubled to 13 billion US$ and this is mainly due to record-high
flows into South Africa and Mozambique (they are currently among the top attractors
of FDI). In both countries, the quality of infrastructural provision has increased and this
was the main attraction of most FDI into these countries.
In the African region, there is a rising rate of Intra-African investments flow. The main
drivers of these flows are the South Africa, Kenyan and Nigerian investors who are
having to set up their plants in other African countries. For instance, the South African
telecommunication investors in the MTN service providers have increased the flow of
investment into other African countries by setting up their stations in these countries.
More so, Dangote, a Nigerian investor is setting up factories in other African countries
like Ethiopia. Between 2009 and 2013, the share of announced cross-border Greenfield-
investment projects that originates from within Africa rose to 18 per cent of the total,
from less than 10 per cent in 2003-2008.

120
Source: World Investment Report (2014)
Figure 5: Africa’s Top Five (5) Recipients of FDI Inflows (billions of dollars)
In the African sub-region, intra-African projects are concentrated mostly in the manu-
facturing and service sector (See Figure 6A). When talking about intra-regional invest-
ment, it also includes the contribution and building-up of the regional value chains of
production: which implies improving the processing and value of products from this
region. The growth of intra-group FDI is not representative across the sub-regions in
Africa. It is only in two regional economic cooperation (REC) initiatives does intra-
group FDI make up a significant part of intra-African investments and these two RECs
are the East African Community (EAC), with about half, and the South African Devel-
opment Community (SADC) with more than 90 per cent (see Figure 6B). Of course,
these developments is traceable to investors flow from Nigeria like the banking sector
in Nigeria that is currently spreading faster in Africa.
0 1 2 3 4 5 6 7 8 9
South Africa
Mozambique
Nigeria
Egypt
Morocco
2013 2012
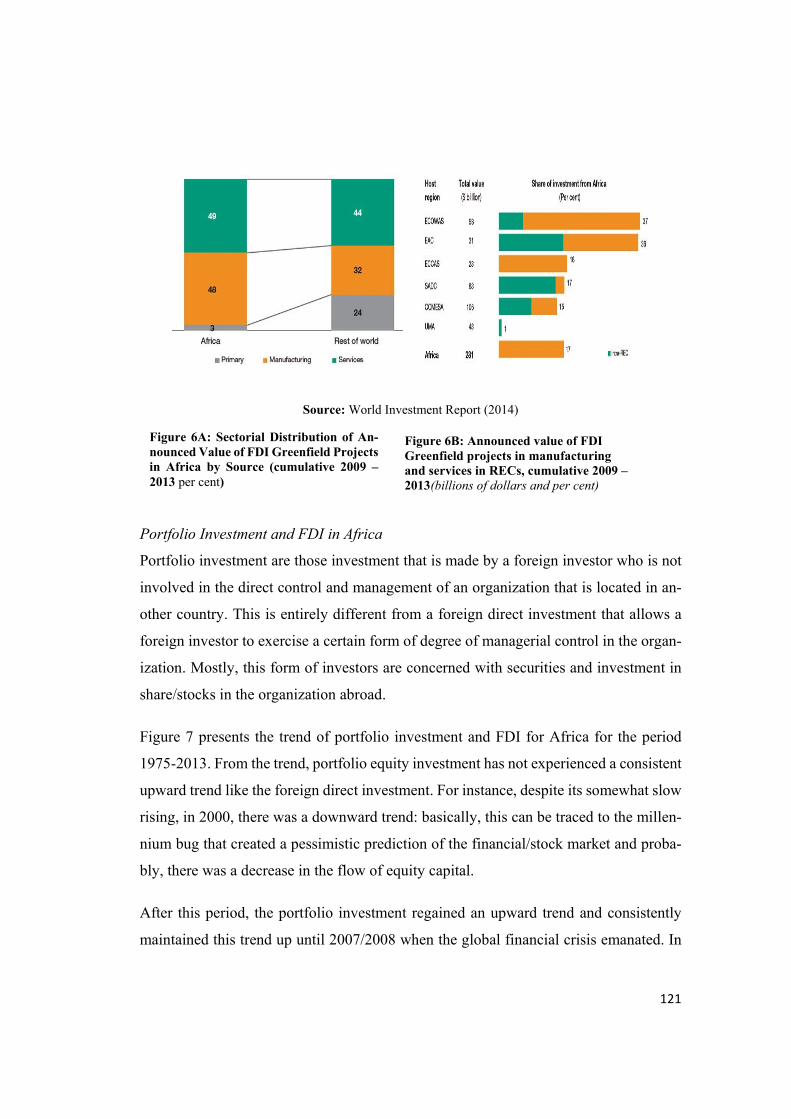
121
Source: World Investment Report (2014)
Portfolio Investment and FDI in Africa
Portfolio investment are those investment that is made by a foreign investor who is not
involved in the direct control and management of an organization that is located in an-
other country. This is entirely different from a foreign direct investment that allows a
foreign investor to exercise a certain form of degree of managerial control in the organ-
ization. Mostly, this form of investors are concerned with securities and investment in
share/stocks in the organization abroad.
Figure 7 presents the trend of portfolio investment and FDI for Africa for the period
1975-2013. From the trend, portfolio equity investment has not experienced a consistent
upward trend like the foreign direct investment. For instance, despite its somewhat slow
rising, in 2000, there was a downward trend: basically, this can be traced to the millen-
nium bug that created a pessimistic prediction of the financial/stock market and proba-
bly, there was a decrease in the flow of equity capital.
After this period, the portfolio investment regained an upward trend and consistently
maintained this trend up until 2007/2008 when the global financial crisis emanated. In
Figure 6A: Sectorial Distribution of An-nounced Value of FDI Greenfield Projects in Africa by Source (cumulative 2009 – 2013 per cent)
Figure 6B: Announced value of FDI Greenfield projects in manufacturing and services in RECs, cumulative 2009 – 2013(billions of dollars and per cent)

122
this period, there was an abrupt reduction in the volume of portfolio investment to Af-
rica. After 2009, the volume picked up but was increasingly volatile; creating a down-
ward trend from 2010 onward. This is unlike the foreign direct investment, which main-
tained a consistent and an increasing trend despite the global financial crisis that was
supposed to affect the trend of the global investment.
Source: World Development Indicators (2014)
Figure 7: Portfolio Investment vs FDI in Africa (1975-2013)
Irrespective of the trend exhibited by African countries with regards to foreign direct
investment and portfolio equity investment, African countries have not being able to
attract much of foreign investment (in terms of direct and equity investment) when com-
pared to countries from other regions of the world. Figure 8 presents this stylized facts
and compared to the other regions of the world, African countries were at the lower
echelon of the league of regions.
Across the regions of the world, the Europe and Central Asia (ECA) and the East Asia
Pacific (EAP) countries are the leading regions, in terms of attracting foreign direct in-
vestment and equity investment. Countries in the ECA were attracting foreign direct
investment and equity investment that were about 24 and 20 times more than the volume
of these investments that flow into African countries. Similarly, the EAP countries at-
tracted these forms of investments that were about 13 and 17 times more than the volume
that flow into African countries. With regards to the other regions of the world, the for-
eign direct investment and equity investment for countries in the Latin America and
‐1E+10
0
1E+10
2E+10
3E+10
4E+10
5E+10
Portfolio equity investment Foreign direct investment

123
Caribbean (LAC) region was about five and two times more than that of African coun-
tries, respectively. While for the Middle East and North Africa (MENA) and South
Asian (SA) countries, the statistics reveal that they were about two (for MENA) and one
time more in the volume of foreign investment inflow than that of Africa and about one
time more for the foreign portfolio investment inflow than that of Africa, respectively.
Note: MENA-Middle East and North Africa; LAC-Latin America and the Caribbean; ECA-Europe and
Central Asia; EAP-East Asia and the Pacific Source: World Development Indicators (2014)
Figure 8: Portfolio Investment vs FDI across Regions of the World (1975-2013)
This trend reveals that African countries have performed relatively low in attracting for-
eign investment flow compared to the other regions of the world. In relation to trade, the
trend of Africa’s trade has consistently remained on the increase but at a steady rate (see
Figure 9). In 1975, Africa’s trade to GDP was only 55 percent and the trade value re-
mained at that percentage axis all through until 2000s, when the trade percentage to GDP
rose to 65 percent. After this period, the value of trade to GDP peaked at 75 percent in
2008 after which it began to drop to 66 percent in 2013. This trend was higher than the
trade to GDP percentage of the world: the trend for the world was some folds lower than
that of Africa. In essence, this does not imply that Africa’s trade volume was more com-
pared to the world average, but the value displayed in the figure only represents the trade
value that were scaled by the GDP of the countries. In principle, the value portrays the
percentage of the GDP of the country that is composed of trade.
0
5E+10
1E+11
1.5E+11
2E+11
2.5E+11
3E+11
Africa South Asia MENA LAC ECA EAP
Foreign direct investment Portfolio equity investment
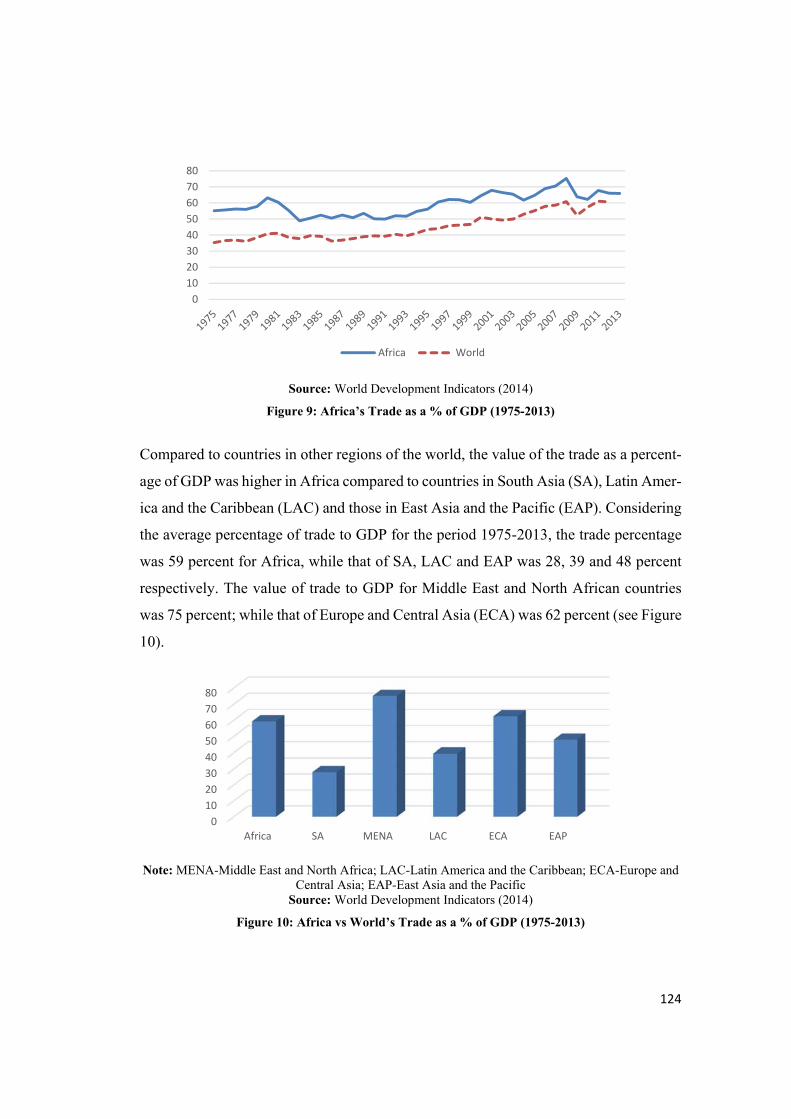
124
Source: World Development Indicators (2014)
Figure 9: Africa’s Trade as a % of GDP (1975-2013)
Compared to countries in other regions of the world, the value of the trade as a percent-
age of GDP was higher in Africa compared to countries in South Asia (SA), Latin Amer-
ica and the Caribbean (LAC) and those in East Asia and the Pacific (EAP). Considering
the average percentage of trade to GDP for the period 1975-2013, the trade percentage
was 59 percent for Africa, while that of SA, LAC and EAP was 28, 39 and 48 percent
respectively. The value of trade to GDP for Middle East and North African countries
was 75 percent; while that of Europe and Central Asia (ECA) was 62 percent (see Figure
10).
Note: MENA-Middle East and North Africa; LAC-Latin America and the Caribbean; ECA-Europe and
Central Asia; EAP-East Asia and the Pacific Source: World Development Indicators (2014)
Figure 10: Africa vs World’s Trade as a % of GDP (1975-2013)
0
10
20
30
40
50
60
70
80
Africa World
0
10
20
30
40
50
60
70
80
Africa SA MENA LAC ECA EAP
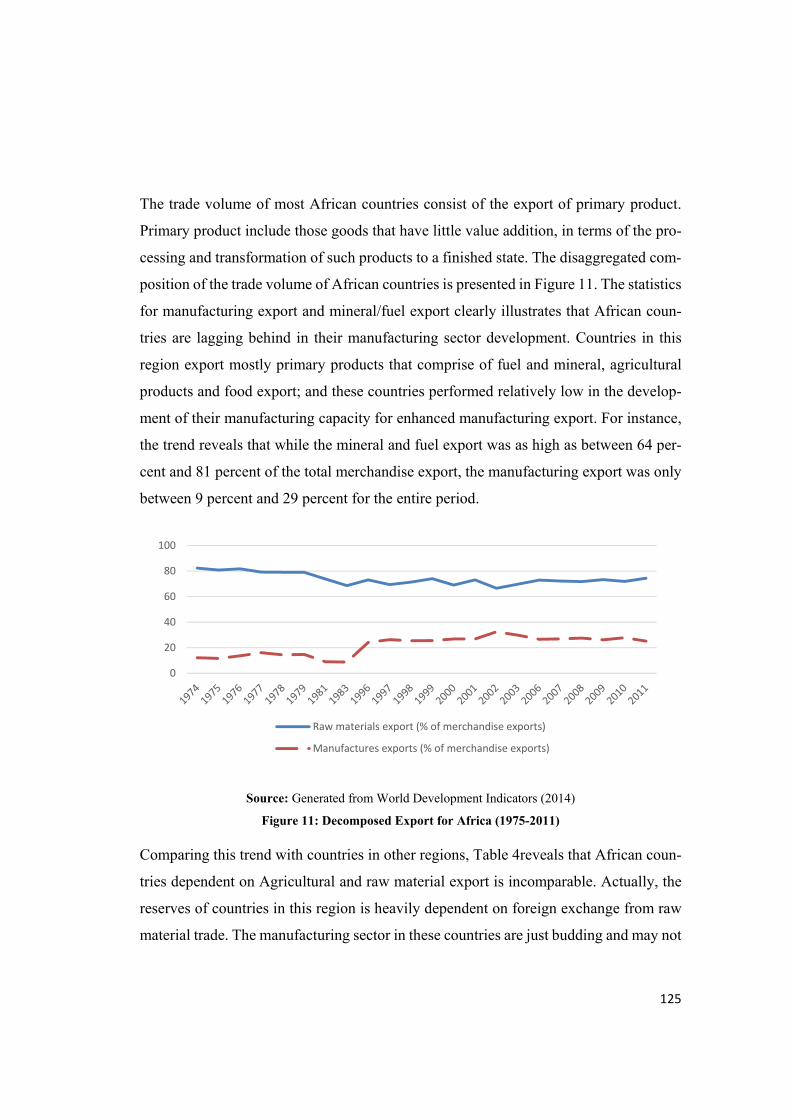
125
The trade volume of most African countries consist of the export of primary product.
Primary product include those goods that have little value addition, in terms of the pro-
cessing and transformation of such products to a finished state. The disaggregated com-
position of the trade volume of African countries is presented in Figure 11. The statistics
for manufacturing export and mineral/fuel export clearly illustrates that African coun-
tries are lagging behind in their manufacturing sector development. Countries in this
region export mostly primary products that comprise of fuel and mineral, agricultural
products and food export; and these countries performed relatively low in the develop-
ment of their manufacturing capacity for enhanced manufacturing export. For instance,
the trend reveals that while the mineral and fuel export was as high as between 64 per-
cent and 81 percent of the total merchandise export, the manufacturing export was only
between 9 percent and 29 percent for the entire period.
Source: Generated from World Development Indicators (2014)
Figure 11: Decomposed Export for Africa (1975-2011)
Comparing this trend with countries in other regions, Table 4reveals that African coun-
tries dependent on Agricultural and raw material export is incomparable. Actually, the
reserves of countries in this region is heavily dependent on foreign exchange from raw
material trade. The manufacturing sector in these countries are just budding and may not
0
20
40
60
80
100
Raw materials export (% of merchandise exports)
Manufactures exports (% of merchandise exports)

126
be as competitive in the global market. In the East Asia and Pacific community, the
manufacturing sector accounted for over 50 percent of the entire merchandise export for
the period 1961-2011. The primary product export accounts for only a marginal propor-
tion of the merchandise export. This trend is also common for countries in the Europe
and Central Asian community where products from the manufacturing sector remains
the main export basket of countries in this region. Also, focusing on the world export
performance, averagely, their bulk of export is in the manufacturing sector and not the
primary/agricultural production for export. The world is driving towards value addition
but sadly, African countries are seriously lagging behind in this regime.
Table 4: Decomposed Export across Regions of the World (1961-2011)
Africa East Asia and Pacific Europe and Central Asia World
Primary Product
Manufactures Product
Primary Product
Manufactures Product
Primary Product
Manufactures exports
Primary Product
Manufactures Product
1961-70 --- --- 41.06 58.16 28.74 70.40 40.21 58.83 1971-80 80.33 13.79 35.66 63.36 24.70 73.65 36.62 61.96 1981-90 71.18 8.90 26.48 68.53 23.68 74.62 31.44 65.91 1991-00 71.35 25.69 15.25 83.40 20.05 76.91 24.00 73.53 2001-10 71.41 28.03 14.46 83.51 21.45 73.55 25.10 71.11 2011 74.35 25.16 19.57 78.00 25.45 71.06 25.45 71.06
Note: Values are presented in percentages of merchandise export. Source: World Development Indicators (2014)
4.3 Descriptive Overview of Foreign Investment and Trade in Selected Sample
In this section, descriptive analysis was performed for the specific sample and the time
period for the study was also observed. In this section, we present the specific descrip-
tion of the variables of interest as it pertains to our sample data. Consideration was given
to the trend analysis of the volume of trade, FDI and FPI across the sampled countries
that have adopted IFRS and those that have not. The main aim and objective of this
exercise is to underscore, based on a pictorial means, the distinction that exist between
the trade, FDI and FPIs of those countries that have adopted IFRS and those that have
not.
Beginning with Figure 12, the graphical representation of the distinction between the
trade volumes of the sampled countries across their IFRS adoption status was presented.
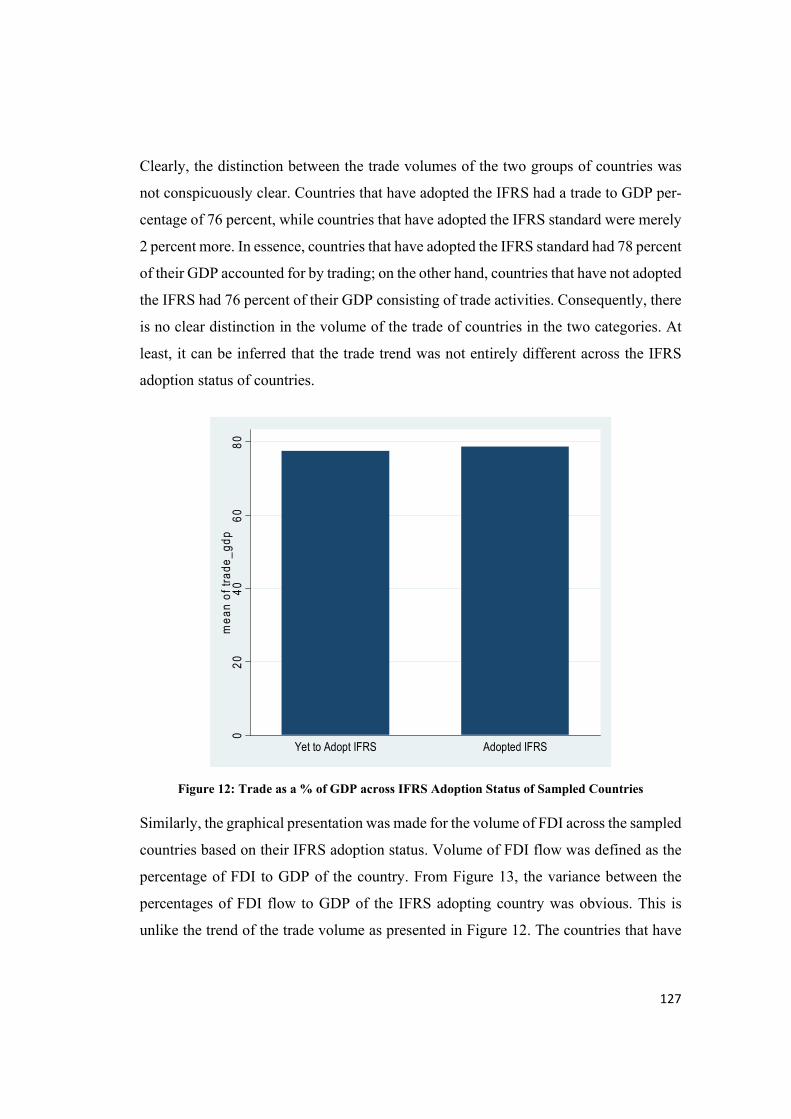
127
Clearly, the distinction between the trade volumes of the two groups of countries was
not conspicuously clear. Countries that have adopted the IFRS had a trade to GDP per-
centage of 76 percent, while countries that have adopted the IFRS standard were merely
2 percent more. In essence, countries that have adopted the IFRS standard had 78 percent
of their GDP accounted for by trading; on the other hand, countries that have not adopted
the IFRS had 76 percent of their GDP consisting of trade activities. Consequently, there
is no clear distinction in the volume of the trade of countries in the two categories. At
least, it can be inferred that the trade trend was not entirely different across the IFRS
adoption status of countries.
Figure 12: Trade as a % of GDP across IFRS Adoption Status of Sampled Countries
Similarly, the graphical presentation was made for the volume of FDI across the sampled
countries based on their IFRS adoption status. Volume of FDI flow was defined as the
percentage of FDI to GDP of the country. From Figure 13, the variance between the
percentages of FDI flow to GDP of the IFRS adopting country was obvious. This is
unlike the trend of the trade volume as presented in Figure 12. The countries that have
02
04
06
08
0m
ean
of t
rade
_gd
p
Yet to Adopt IFRS Adopted IFRS
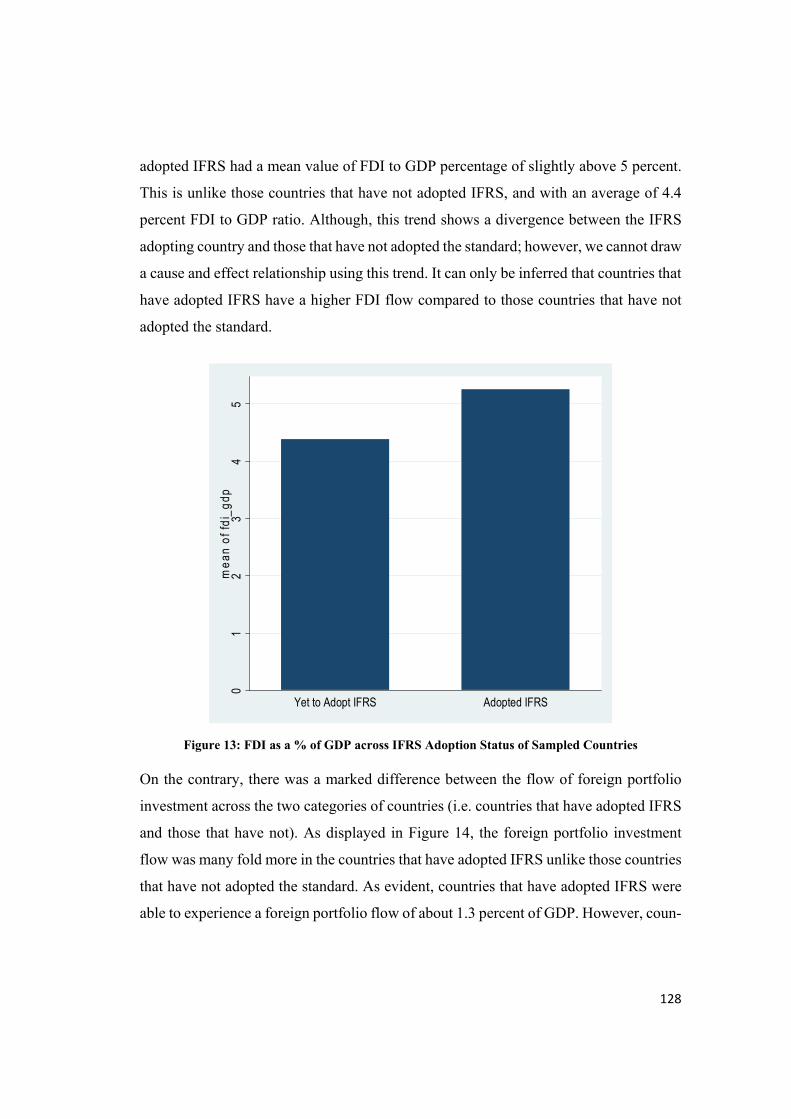
128
adopted IFRS had a mean value of FDI to GDP percentage of slightly above 5 percent.
This is unlike those countries that have not adopted IFRS, and with an average of 4.4
percent FDI to GDP ratio. Although, this trend shows a divergence between the IFRS
adopting country and those that have not adopted the standard; however, we cannot draw
a cause and effect relationship using this trend. It can only be inferred that countries that
have adopted IFRS have a higher FDI flow compared to those countries that have not
adopted the standard.
Figure 13: FDI as a % of GDP across IFRS Adoption Status of Sampled Countries
On the contrary, there was a marked difference between the flow of foreign portfolio
investment across the two categories of countries (i.e. countries that have adopted IFRS
and those that have not). As displayed in Figure 14, the foreign portfolio investment
flow was many fold more in the countries that have adopted IFRS unlike those countries
that have not adopted the standard. As evident, countries that have adopted IFRS were
able to experience a foreign portfolio flow of about 1.3 percent of GDP. However, coun-
01
23
45
me
an o
f fd
i_g
dp
Yet to Adopt IFRS Adopted IFRS

129
tries that have not adopted IFRS were able to attract a minute 0.01 percent foreign port-
folio flow, when compared to the GDP of such country. This marginal trend of foreign
portfolio investment can likely be caused by the poor capital development of most Af-
rican countries, which are not able to attract so much portfolio investors. This is why
some studies advocated for the adoption of IFRS as a possible policy switch that can
enhance the flow of foreign portfolio investors into African countries. More so, since
portfolio investors are mostly equity investment inclined, and the relevance of infor-
mation symmetry cannot be neglected, then the adoption of IFRS will be a veritable tool
to increase the flow of these forms of investors.
Figure 14: FPI as a % of GDP across IFRS Adoption Status of Sampled Countries
As a summary of this subsection, we conclude that the trend of the trade volume between
countries that have adopted IFRS and those that have not, was not as obvious. However,
when moving on to the FDI flow to countries, the difference between the volumes of
FDI flow to the two categories of countries was somewhat more obvious than the trend
for trade volume: when considering the foreign portfolio investment flow, the trend be-
came more visible. Countries that have adopted IFRS were able to attract more foreign
portfolio investors; although, the average volume of flow was just 1.3 percent.
0.0
02
.00
4.0
06
.00
8.0
1m
ean
of f
pi_
gdp
Yet to Adopt IFRS Adopted IFRS
130
4.4 Comparing the Trend Prior and After IFRS Adoption of Countries
The aim of this statistics is to compare the trade, Foreign Direct Investment (FDI) and
Foreign Portfolio Investment (FPI) flow of the IFRS adopting countries prior to and after
the adoption of the IFRS standard. The main aim of this statistics is to observe if the
IFRS adopting country has been able to improve the inflow of these three indicators
after the adoption of the IFRS standard. The statistics to corroborate this was presented
in Table 5, where the column “prior to” and “after” imply the averages of the indicators
prior and after the adoption of the IFRS. Caution was taken to ensure that the countries
that were included in this Table represents the countries that have adopted IFRS since
2001.
From the sample, on the average, only about 35 percent of the countries did not experi-
ence an improvement in their trade volume after the adoption of the IFRS. Other coun-
tries had an improvement on the volume of their trade after they decided to adopt the
IFRS. Some of the countries that did not experience an improvement in the volume of
their trade flow include Angola, Benin Republic, Cameroon, Chad, Gabon, Ghana,
Mozambique, Nigeria, Sudan, Swaziland and Zambia.
To further investigate the peculiarity of these countries, it cannot be denied that some of
the countries are highly trading on primary products and the competitiveness of these
forms of trade in the global economy is slim. The adoption of IFRS is expected to attract
foreign capital into the economy, which is supposed to enhance the industrial intensity
of such a country. However, the trading of primary product may not benefit immensely
from the adoption of the IFRS standard since industrialisation involves value addition.
More so, since some of these countries’ economy are highly funded by the trading of
these primary products, the incentive to refocus on value addition is not a major priority
of the political leadership of these countries.
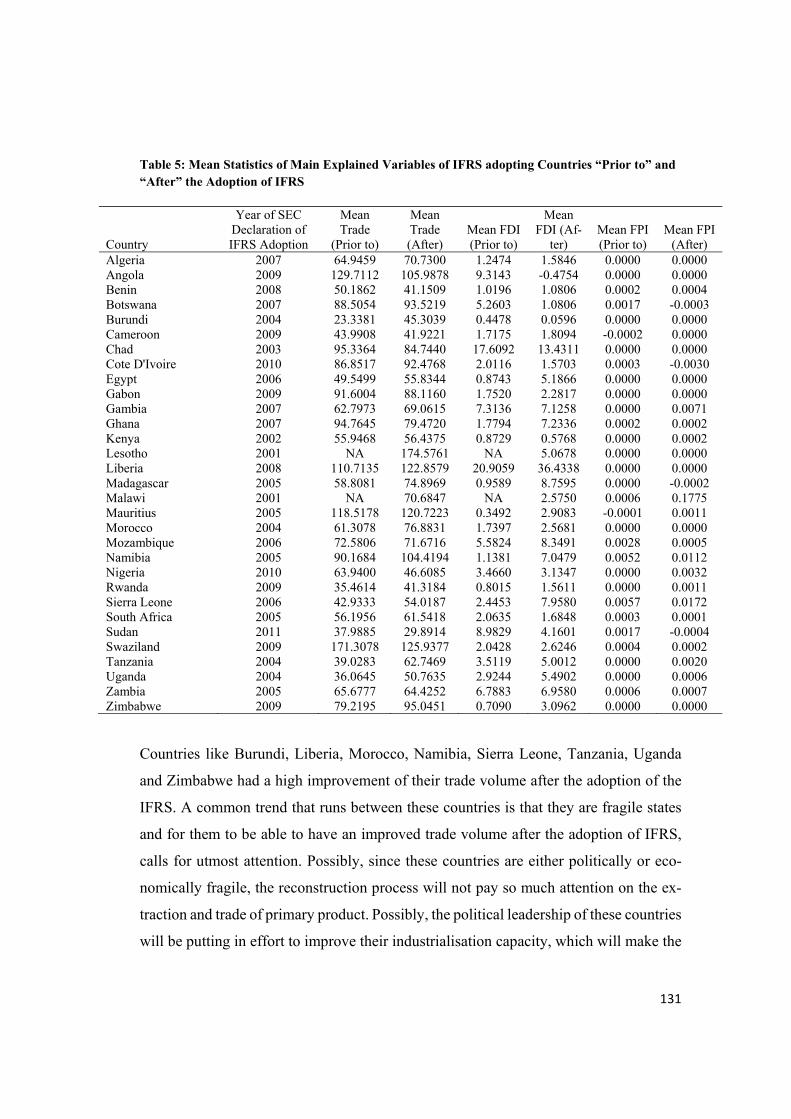
131
Table 5: Mean Statistics of Main Explained Variables of IFRS adopting Countries “Prior to” and “After” the Adoption of IFRS
Country
Year of SEC Declaration of IFRS Adoption
Mean Trade
(Prior to)
Mean Trade (After)
Mean FDI (Prior to)
Mean FDI (Af-
ter) Mean FPI (Prior to)
Mean FPI (After)
Algeria 2007 64.9459 70.7300 1.2474 1.5846 0.0000 0.0000 Angola 2009 129.7112 105.9878 9.3143 -0.4754 0.0000 0.0000 Benin 2008 50.1862 41.1509 1.0196 1.0806 0.0002 0.0004 Botswana 2007 88.5054 93.5219 5.2603 1.0806 0.0017 -0.0003 Burundi 2004 23.3381 45.3039 0.4478 0.0596 0.0000 0.0000 Cameroon 2009 43.9908 41.9221 1.7175 1.8094 -0.0002 0.0000 Chad 2003 95.3364 84.7440 17.6092 13.4311 0.0000 0.0000 Cote D'Ivoire 2010 86.8517 92.4768 2.0116 1.5703 0.0003 -0.0030 Egypt 2006 49.5499 55.8344 0.8743 5.1866 0.0000 0.0000 Gabon 2009 91.6004 88.1160 1.7520 2.2817 0.0000 0.0000Gambia 2007 62.7973 69.0615 7.3136 7.1258 0.0000 0.0071 Ghana 2007 94.7645 79.4720 1.7794 7.2336 0.0002 0.0002 Kenya 2002 55.9468 56.4375 0.8729 0.5768 0.0000 0.0002 Lesotho 2001 NA 174.5761 NA 5.0678 0.0000 0.0000 Liberia 2008 110.7135 122.8579 20.9059 36.4338 0.0000 0.0000 Madagascar 2005 58.8081 74.8969 0.9589 8.7595 0.0000 -0.0002 Malawi 2001 NA 70.6847 NA 2.5750 0.0006 0.1775 Mauritius 2005 118.5178 120.7223 0.3492 2.9083 -0.0001 0.0011 Morocco 2004 61.3078 76.8831 1.7397 2.5681 0.0000 0.0000 Mozambique 2006 72.5806 71.6716 5.5824 8.3491 0.0028 0.0005 Namibia 2005 90.1684 104.4194 1.1381 7.0479 0.0052 0.0112 Nigeria 2010 63.9400 46.6085 3.4660 3.1347 0.0000 0.0032 Rwanda 2009 35.4614 41.3184 0.8015 1.5611 0.0000 0.0011 Sierra Leone 2006 42.9333 54.0187 2.4453 7.9580 0.0057 0.0172 South Africa 2005 56.1956 61.5418 2.0635 1.6848 0.0003 0.0001 Sudan 2011 37.9885 29.8914 8.9829 4.1601 0.0017 -0.0004 Swaziland 2009 171.3078 125.9377 2.0428 2.6246 0.0004 0.0002 Tanzania 2004 39.0283 62.7469 3.5119 5.0012 0.0000 0.0020 Uganda 2004 36.0645 50.7635 2.9244 5.4902 0.0000 0.0006 Zambia 2005 65.6777 64.4252 6.7883 6.9580 0.0006 0.0007 Zimbabwe 2009 79.2195 95.0451 0.7090 3.0962 0.0000 0.0000
Countries like Burundi, Liberia, Morocco, Namibia, Sierra Leone, Tanzania, Uganda
and Zimbabwe had a high improvement of their trade volume after the adoption of the
IFRS. A common trend that runs between these countries is that they are fragile states
and for them to be able to have an improved trade volume after the adoption of IFRS,
calls for utmost attention. Possibly, since these countries are either politically or eco-
nomically fragile, the reconstruction process will not pay so much attention on the ex-
traction and trade of primary product. Possibly, the political leadership of these countries
will be putting in effort to improve their industrialisation capacity, which will make the
132
adoption of IFRS a considerable strategy to achieve such objective. In essence, the at-
tractiveness of foreign investors into these countries will be as a result of the external
economies of scale that is created by the government to enhance the social and economic
conduciveness of their country to foreign investors. Hence, the adoption of IFRS will be
a complementary tool in achieving such feats.
The average of foreign investment flow was considered “prior to” and “after” the adop-
tion of IFRS by the sampled countries. The statistics were presented in the 5th and 6th
columns in Table 5 respectively. From the Table, only 32 percent did not experience an
improvement in the flow of FDI after the adoption of IFRS. These countries include
Angola, Botswana, Burundi, Chad, Cote D’Ivoire, Gambia, Kenya, Nigeria, South Af-
rica and Sudan. This trend is contrary to our expectations as consensus in extant litera-
ture suggest that the adoption if IFRS is supposed to enhance the volume of FDI flow to
the country (e.g. Wysocki, 2011; Gordon, Loeb and Zhu, 2012). However, since this is
only a descriptive statistics of the comparison of the averages of each of these countries
between the two periods, we are not able to draw inference as to the cause and effect of
the adoption of IFRS on trade and foreign investment.
Countries that had an improved flow of foreign investment after the adoption of IFRS
include Algeria, Benin, Cameroon, Egypt, Gabon, Ghana, Liberia, Madagascar, Mauri-
tius, Morocco, Mozambique, Namibia, Rwanda, Sierra Leone, Swaziland, Tanzania,
Uganda, Zambia, and Zimbabwe. The number of countries that have experienced an
improvement in the flow of foreign investment was more than those that did not. In
essence, some form of association is likely to exist between the adoption of IFRS and
foreign investment. This will only be verified in our empirical analysis, where statistical
and econometric tool will be used to test this trend.
Moving unto the foreign portfolio investment trend prior to and after the adoption of
IFRS, and presented in the 7th and 8th column of Table 5, it is observed that only 22.58
percent of the countries did not experience and improvement in the flow of foreign port-
133
folio investment. The countries within this category are Botswana, Cote D’Ivoire, Mad-
agascar, Mozambique, South Africa, Sudan and Swaziland. More countries experienced
an improvement in the flow of these forms of investors. Although, the volume of these
forms of investors is minute and this cannot be separated from the extent of development
of the capital market within the African region. Since these forms of foreign investors
are those that deal on equity shares/investment, then the strength of the capital market
within these countries are paramount to the behaviour of this form of investors.
4.5 Summary Statistics of Variables included in the Empirical Model
The summary statistics of the variables that were included in the model was presented
in Table 6. The summary statistics presented include the mean, standard deviation, min-
imum and maximum values of the variables. Focusing on the main explained variables
(i.e. foreign direct investment-FDI; foreign portfolio investment-FPI; and trade volume),
on the average, the foreign investment flow into the entire sampled countries was less
than 5 percent of the entire GDP of the countries. Some countries performed way above
this average, with an FDI to GDP percentage of 91 percent and some other countries had
a negative net FDI flow of -5.131. This imply that in the period of study, such a country
witnessed more outflow of FDI compared to the inflow.
Considering foreign portfolio investment of the sampled countries as presented in Table
6, it is observed that the mean of the foreign portfolio investment was about 0.5 percent
of the GDP of the sampled countries. Some countries had a negative foreign portfolio
investment flow of about 2.5 percent; implying that the foreign portfolio outflow was
more than the inflow into the country. The maximum value of the foreign direct invest-
ment flow was only 8.05 percent for Sierra Leone, implying that the country was able
to attract a foreign portfolio investment flow that is 8.05 percent of the GDP of that
country.

134
Table 6: Summary Statistics of Variable S/N Variables Mean Std. Dev Minimum Maximum 1 FDI 4.693 7.944 -5.131 91.007 2 FPI 0.005 0.050 -0.025 0.805 3 Trade 78.004 39.838 20.964 351.106 4 IFRS Adoption (Dummy Variable) 0.361 0.481 0.000 1.000 5 IFRS Adoption (Count Variable) 1.580 2.644 0.000 12.000 6 Adult Literacy 60.568 20.959 14.376 94.514 8 Official Exchange Rate 410.288 607.768 0.055 4349.162 9 Political Stability 2.969 0.848 0.799 4.689 10 Control of Corruption 2.881 0.540 1.820 4.755 11 Government Effectiveness 2.767 0.587 1.715 4.266 12 Regulatory Quality 2.826 0.603 1.238 4.347 13 GDP Per Capita 1844.355 2936.704 108.015 23463.760 14 Population 19200000 26200000 534592 169000000 15 Total Electricity Production 767.065 1100.179 26.305 4872.476 16 Natural Resource Export 0.000 0.000 0.000 0.000 17 Presence of Accounting Association 0.833 0.373 0.000 1.000 18 Membership of IFAC 0.458 0.499 0.000 1.000
Evidently, the sampled countries’ GDP is driven by trade. This is in the sense that 78
percent of their entire GDP is being accounted for by trade in goods. Some countries
had over a hundred percent of their entire GDP consisting of trade. Countries like Equa-
torial Guinea was able to have a trade to GDP percentage of 351.106 percent, while the
trade to GDP percentage of Burundi was only 20.96 percent. The variance between the
countries in this region is high: therefore, using the GDP as denominator equalises the
country based on their economic size. The implication of this is that, despite the variance
across countries within this region, it is still possible to use the countries as a good ana-
lytical sample. The incidence of outliers will be reduced since the values of trade has
been denominated by the GDP of the country.
We further considered the descriptive statistics of the IFRS variables. Two main indica-
tors were used and they are the dummy variable representing IFRS and the count varia-
ble, which measures the number of years since the country has earlier adopted IFRS.
The mean value of the IFRS dummy shows that about 36 percent of the countries within
the sample has adopted the IFRS. The standard deviation is 0.481; at least the mean
value of the IFRS adoption variable of the sampled countries were not too distant from
the mean. This gives some degree of confidence on the possibility of clustering that will
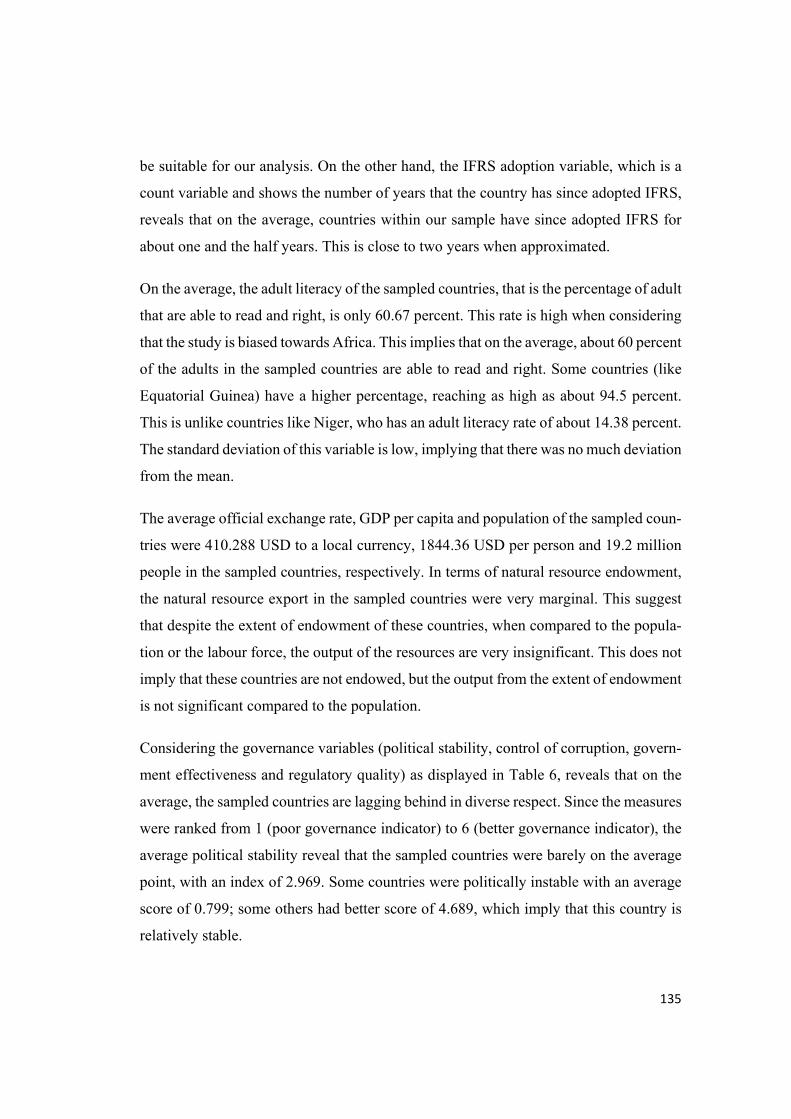
135
be suitable for our analysis. On the other hand, the IFRS adoption variable, which is a
count variable and shows the number of years that the country has since adopted IFRS,
reveals that on the average, countries within our sample have since adopted IFRS for
about one and the half years. This is close to two years when approximated.
On the average, the adult literacy of the sampled countries, that is the percentage of adult
that are able to read and right, is only 60.67 percent. This rate is high when considering
that the study is biased towards Africa. This implies that on the average, about 60 percent
of the adults in the sampled countries are able to read and right. Some countries (like
Equatorial Guinea) have a higher percentage, reaching as high as about 94.5 percent.
This is unlike countries like Niger, who has an adult literacy rate of about 14.38 percent.
The standard deviation of this variable is low, implying that there was no much deviation
from the mean.
The average official exchange rate, GDP per capita and population of the sampled coun-
tries were 410.288 USD to a local currency, 1844.36 USD per person and 19.2 million
people in the sampled countries, respectively. In terms of natural resource endowment,
the natural resource export in the sampled countries were very marginal. This suggest
that despite the extent of endowment of these countries, when compared to the popula-
tion or the labour force, the output of the resources are very insignificant. This does not
imply that these countries are not endowed, but the output from the extent of endowment
is not significant compared to the population.
Considering the governance variables (political stability, control of corruption, govern-
ment effectiveness and regulatory quality) as displayed in Table 6, reveals that on the
average, the sampled countries are lagging behind in diverse respect. Since the measures
were ranked from 1 (poor governance indicator) to 6 (better governance indicator), the
average political stability reveal that the sampled countries were barely on the average
point, with an index of 2.969. Some countries were politically instable with an average
score of 0.799; some others had better score of 4.689, which imply that this country is
relatively stable.
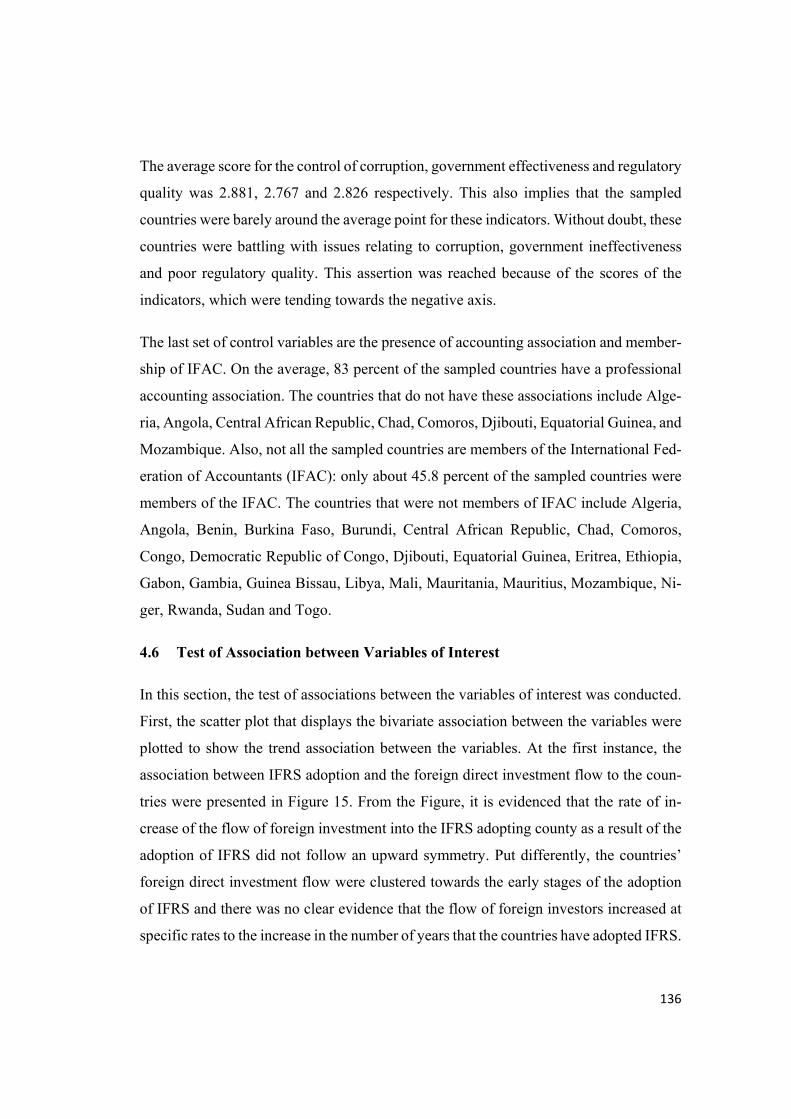
136
The average score for the control of corruption, government effectiveness and regulatory
quality was 2.881, 2.767 and 2.826 respectively. This also implies that the sampled
countries were barely around the average point for these indicators. Without doubt, these
countries were battling with issues relating to corruption, government ineffectiveness
and poor regulatory quality. This assertion was reached because of the scores of the
indicators, which were tending towards the negative axis.
The last set of control variables are the presence of accounting association and member-
ship of IFAC. On the average, 83 percent of the sampled countries have a professional
accounting association. The countries that do not have these associations include Alge-
ria, Angola, Central African Republic, Chad, Comoros, Djibouti, Equatorial Guinea, and
Mozambique. Also, not all the sampled countries are members of the International Fed-
eration of Accountants (IFAC): only about 45.8 percent of the sampled countries were
members of the IFAC. The countries that were not members of IFAC include Algeria,
Angola, Benin, Burkina Faso, Burundi, Central African Republic, Chad, Comoros,
Congo, Democratic Republic of Congo, Djibouti, Equatorial Guinea, Eritrea, Ethiopia,
Gabon, Gambia, Guinea Bissau, Libya, Mali, Mauritania, Mauritius, Mozambique, Ni-
ger, Rwanda, Sudan and Togo.
4.6 Test of Association between Variables of Interest
In this section, the test of associations between the variables of interest was conducted.
First, the scatter plot that displays the bivariate association between the variables were
plotted to show the trend association between the variables. At the first instance, the
association between IFRS adoption and the foreign direct investment flow to the coun-
tries were presented in Figure 15. From the Figure, it is evidenced that the rate of in-
crease of the flow of foreign investment into the IFRS adopting county as a result of the
adoption of IFRS did not follow an upward symmetry. Put differently, the countries’
foreign direct investment flow were clustered towards the early stages of the adoption
of IFRS and there was no clear evidence that the flow of foreign investors increased at
specific rates to the increase in the number of years that the countries have adopted IFRS.

137
Only some few countries were able to attract FDI at latter stages of the period of adop-
tion of IFRS: even at that, the rate of FDI flow into these countries was still at marginal.
Figure 15: Association between FDI Flow and IFRS Adoption (Using IFRS Adoption Count Variable
Further consideration was given to the association between IFRS adoption and foreign
portfolio investment flow in order to ascertain the extent to which a country’s adoption
of IFRS is able to relate with the flow of these forms of investors. Figure 16 presents
this association and similar occurrence with the pattern in Figure 15 was observed. From
the Figure, the number of countries that attracts portfolio investors were more at the
early years of IFRS adoption; unlike the latter years in the x axis of the graph, where the
number of countries were not as much as the earlier period. Consequently, it can be
inferred that the countries attractiveness to foreign portfolio investors was not clearly
symmetric in its association with IFRS adoption.
Algeria
Angola
BeninBotswanaBurkina FasoBurundiCameroonCentral African Republic
Chad
Comoros
CongoDRCCote D'IvoireDjiboutiEqypt
Equatorial Guinea
EritreaEthiopiaGabonGhanaGuinea BissauKenya
LesothoLiberiaLibyaMadagascarMalawiMaliMauritania
MauritiusMorocco
Mozambique
NamibiaNigerNigeriaRwandaSenegalSierra Leone
South AfricaSudanSwazilandTanzaniaTogoTunisiaUgandaZambiaZimbabweAlgeria
Angola
BeninBotswanaBurkina FasoBurundiCameroonCentral African Republic
Chad
ComorosCongoDRCCote D'IvoireDjiboutiEqypt
Equatorial Guinea
EritreaEthiopia
GabonGhanaGuinea BissauKenya
LesothoLiberiaLibyaMadagascarMalawi
MaliMauritaniaMauritiusMorocco
Mozambique
NamibiaNigerNigeriaRwandaSenegalSierra LeoneSouth AfricaSudanSwazilandTanzaniaTogoTunisiaUgandaZambia
ZimbabweAlgeria
Angola
Benin
Botswana
Burkina FasoBurundi
Cameroon
Central African Republic
Chad
Comoros
Congo
DRCCote D'IvoireDjiboutiEqypt
Equatorial Guinea
EritreaEthiopiaGabonGhanaGuinea BissauKenya
LesothoLiberiaLibyaMadagascar
MalawiMaliMauritania
MauritiusMoroccoMozambique
NamibiaNigerNigeriaRwandaSenegalSierra LeoneSouth Africa
Sudan
Swaziland
TanzaniaTogoTunisiaUgandaZambia
ZimbabweAlgeria
Angola
Benin
Botswana
Burkina FasoBurundiCameroonCentral African Republic
Chad
Comoros
CongoDRC
Cote D'IvoireDjiboutiEqypt
Equatorial Guinea
EritreaEthiopiaGabonGambiaGhanaGuinea Bissau Kenya
Lesotho
Liberia
LibyaMadagascarMalawi
Mali
Mauritania
MauritiusMoroccoMozambiqueNamibiaNigerNigeriaRwandaSenegalSierra LeoneSouth Africa
SudanSwazilandTanzaniaTogoTunisiaUgandaZambia
ZimbabweAlgeria
Angola
Benin
Botswana
Burkina FasoBurundiCameroonCentral African Republic
Chad
ComorosCongo
DRCCote D'IvoireDjiboutiEqyptEquatorial Guinea
Eritrea
EthiopiaGabon
Gambia
GhanaGuinea Bissau KenyaLesotho
Liberia
Libya MadagascarMalawiMali
Mauritania
MauritiusMoroccoMozambique
NamibiaNigerNigeriaRwandaSenegalSierra Leone
South Africa
Sudan
Swaziland
TanzaniaTogoTunisia UgandaZambiaZimbabweAlgeria
AngolaBeninBotswanaBurkina Faso BurundiCameroonCentral African Republic
ChadComoros
Congo
DRCCote D'IvoireDjiboutiEqypt
Equatorial Guinea
EritreaEthiopiaGabonGambia
GhanaGuinea Bissau KenyaLesotho
Liberia
LibyaMadagascar
MalawiMaliMauritania
MauritiusMoroccoMozambique
Namibia
NigerNigeriaRwandaSenegalSierra Leone
South Africa
Sudan
Swaziland TanzaniaTogo
TunisiaUgandaZambia
ZimbabweAlgeriaAngolaBeninBotswana
Burkina Faso BurundiCameroonCentral African Republic
ChadComoros
Congo
DRCCote D'Ivoire
DjiboutiEqypt
Equatorial Guinea
EritreaEthiopiaGabon
Gambia
GhanaGuinea BissauKenya
Lesotho
Liberia
Libya
Madagascar
MalawiMaliMauritania MauritiusMoroccoMozambique
Namibia
NigerNigeriaRwandaSenegal Sierra LeoneSouth Africa
Sudan
SwazilandTanzaniaTogoTunisiaUganda
Zambia
Zimbabwe AlgeriaAngola
Benin BotswanaBurkina Faso BurundiCameroonCentral African Republic
ChadComoros
Congo
DRC
Cote D'Ivoire
Djibouti
EqyptEquatorial Guinea
EritreaEthiopiaGabon
GambiaGhana
Guinea Bissau KenyaLesotho
Liberia
Libya
Madagascar
MalawiMali
MauritaniaMauritiusMorocco
MozambiqueNamibia
NigerNigeriaRwandaSenegal Sierra LeoneSouth Africa
Sudan
SwazilandTanzania
TogoTunisia UgandaZambia
Zimbabwe AlgeriaAngolaBeninBotswana
Burkina Faso BurundiCameroon
Central African RepublicChadComoros
Congo
DRC
Cote D'Ivoire
Djibouti
Eqypt
Equatorial Guinea
EritreaEthiopiaGabon
GambiaGhana
Guinea Bissau Kenya
Lesotho
Liberia
Libya
Madagascar
MalawiMaliMauritaniaMauritiusMorocco
MozambiqueNamibia
Niger
NigeriaRwandaSenegal Sierra Leone
South Africa
Sudan
SwazilandTanzania
TogoTunisiaUgandaZambia
Zimbabwe AlgeriaAngolaBenin BotswanaBurkina Faso Burundi
CameroonCentral African Republic
Chad
Comoros
Congo
DRCCote D'Ivoire
Djibouti
Eqypt
Equatorial Guinea
EritreaEthiopia GabonGambiaGhana
Guinea Bissau Kenya
Lesotho
Liberia
Libya
Madagascar
MalawiMaliMauritania Mauritius
Morocco
MozambiqueNamibia
Niger
NigeriaRwandaSenegal
Sierra Leone
South Africa
Sudan
SwazilandTanzania
TogoTunisia Uganda
Zambia
Zimbabwe Algeria
AngolaBenin BotswanaBurkina Faso Burundi
CameroonCentral African Republic
Chad
Comoros
CongoDRC
Cote D'IvoireDjibouti Eqypt
Equatorial Guinea
EritreaEthiopiaGabon Gambia
Ghana
Guinea Bissau KenyaLesotho
Liberia
Madagascar
MalawiMaliMauritania MauritiusMorocco
Mozambique
Namibia
Niger
NigeriaRwandaSenegal
Sierra Leone
South AfricaSudan Swaziland
TanzaniaTogoTunisia
UgandaZambiaZimbabweAlgeria
AngolaBenin Botswana
Burkina Faso BurundiCameroonCentral African Republic
Chad
Comoros
Congo
DRC
Cote D'IvoireDjibouti
EqyptEquatorial GuineaEritreaEthiopia Gabon Gambia
Ghana
Guinea Bissau KenyaLesotho
Liberia
Sudan SwazilandTanzaniaTogoTunisia
UgandaZambiaZimbabwe
020
40
60
80
100
FDI_
GDP
0 5 10 15IFRS_Adopt
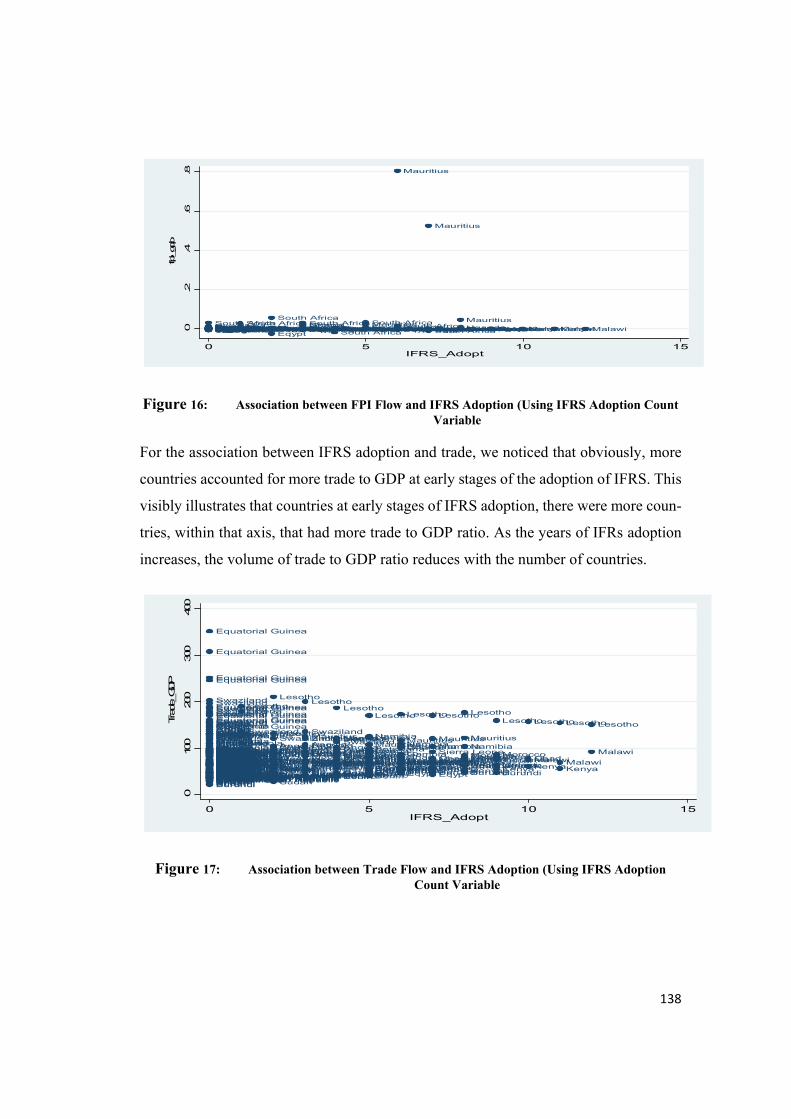
138
Figure 16: Association between FPI Flow and IFRS Adoption (Using IFRS Adoption Count Variable
For the association between IFRS adoption and trade, we noticed that obviously, more
countries accounted for more trade to GDP at early stages of the adoption of IFRS. This
visibly illustrates that countries at early stages of IFRS adoption, there were more coun-
tries, within that axis, that had more trade to GDP ratio. As the years of IFRs adoption
increases, the volume of trade to GDP ratio reduces with the number of countries.
Figure 17: Association between Trade Flow and IFRS Adoption (Using IFRS Adoption Count Variable
BeninBotswanaBurkina FasoBurundiCameroonDRCCote D'IvoireDjiboutiEqyptGhanaGuinea BissauKenyaLesothoLibyaMadagascarMaliMauritiusMoroccoMozambiqueNamibiaNigerRwandaSenegalSierra LeoneSouth AfricaSudanSwazilandTanzaniaTogoTunisiaUgandaZambiaAngolaBeninBotswanaBurkina FasoBurundiCameroonDRCCote D'IvoireDjiboutiEqyptGhanaGuinea BissauKenyaLesothoLibyaMadagascarMaliMauritiusMoroccoMozambiqueNamibiaNigerRwandaSenegalSierra LeoneSouth AfricaSudanSwazilandTanzaniaTogoTunisiaUgandaZambiaAngolaBeninBotswanaBurkina FasoBurundiCameroonCote D'IvoireDjiboutiEqyptEthiopiaGhanaGuinea BissauKenyaLesothoLibya MalawiMaliMauritiusMoroccoMozambiqueNamibiaNigerRwandaSenegalSierra LeoneSouth AfricaSudanSwazilandTanzaniaTogoTunisiaUgandaZambiaAngolaBeninBotswanaBurkina FasoBurundiCameroonCote D'IvoireDjiboutiEqyptEthiopiaGhanaGuinea Bissau KenyaLesothoLiberiaLibya MalawiMaliMauritiusMoroccoMozambiqueNamibiaNigerRwandaSenegalSierra LeoneSouth AfricaSudanSwazilandTanzaniaTogoTunisiaUgandaZambiaAlgeriaAngolaBeninBotswanaBurkina FasoBurundiCameroonCote D'IvoireDjiboutiEqyptEthiopia KenyaLesothoLiberiaLibya MalawiMali MauritiusMoroccoMozambiqueNamibiaNigerNigeriaSenegal
South AfricaSudanSwaziland TanzaniaTogoTunisiaZambiaAlgeriaAngolaBeninBotswanaBurkina Faso BurundiCameroonCote D'IvoireDjiboutiEqyptEthiopia KenyaLiberiaLibya MalawiMali MauritiusMoroccoMozambiqueNamibiaNigerNigeriaSenegal
South Africa
SudanSwaziland TanzaniaTogoTunisia UgandaZambiaAlgeriaAngolaBenin BotswanaBurkina Faso BurundiCameroonCote D'IvoireDjiboutiEqypt
EthiopiaGambiaGuinea Bissau KenyaLiberiaLibya MalawiMali MauritiusMoroccoMozambiqueNamibiaNigerNigeriaSenegalSouth Africa
SudanSwaziland TanzaniaTogoTunisia UgandaZambiaAlgeriaAngolaBenin BotswanaBurkina Faso BurundiCameroonCote D'IvoireDjibouti EqyptEthiopia Gambia KenyaLiberiaLibya MalawiMali MauritiusMoroccoMozambiqueNamibiaNigerNigeriaSenegal South AfricaSudanSwaziland TanzaniaTogoTunisia UgandaZambiaAlgeriaAngolaBenin BotswanaBurkina Faso BurundiCameroonCote D'IvoireDjibouti EqyptEthiopia Gambia
GhanaGuinea Bissau KenyaLiberiaLibya MalawiMali
MauritiusMoroccoMozambiqueNamibiaNigerNigeriaSenegal Sierra Leone
South AfricaSudanSwaziland TanzaniaTogoTunisia UgandaZambiaAlgeriaAngolaBenin BotswanaBurkina Faso BurundiCameroonCote D'IvoireDjibouti EqyptEthiopia GambiaGhanaGuinea Bissau KenyaLiberiaLibya MalawiMali
Mauritius
MoroccoMozambiqueNamibiaNiger NigeriaRwandaSenegal Sierra LeoneSouth AfricaSudan Swaziland TanzaniaTogoTunisia UgandaZambiaAlgeriaAngolaBenin BotswanaCameroonDjibouti EqyptGhanaGuinea Bissau KenyaLibya MalawiMali
Mauritius
MoroccoMozambiqueNamibiaNiger NigeriaRwandaSenegal Sierra LeoneSouth AfricaSudan TanzaniaTunisia UgandaZambiaBenin BotswanaCameroon Eqypt KenyaMalawi
Mauritius
MoroccoNamibiaNigerNigeria
Rwanda Sierra LeoneSouth AfricaSudan TanzaniaTunisia UgandaZambia0.2
.4.6
.8
fpi_gdp
0 5 10 15IFRS_Adopt
Algeria
Angola
Benin
Botswana
Burkina FasoBurundi
CameroonCentral African Republic
ChadComoros
Congo
DRC
Cote D'IvoireDjibouti
Eqypt
Equatorial Guinea
Eritrea
Ethiopia
Gabon
Gambia
Ghana
Kenya
Lesotho
LiberiaLibyaMadagascarMalawiMaliMauritania
Mauritius
MoroccoMozambique
Namibia
Niger
Nigeria
Rwanda
Senegal
Sierra Leone
South Africa
Sudan
Swaziland
Tanzania
TogoTunisia
Uganda
ZambiaZimbabweAlgeria
Angola
Benin
Botswana
Burkina FasoBurundiCameroonCentral African Republic
Chad
Comoros
Congo
DRC
Cote D'IvoireDjibouti
Eqypt
Equatorial Guinea
Eritrea
Ethiopia
Gabon
Gambia
Ghana
Kenya
Lesotho
LiberiaLibya
MadagascarMalawi
MaliMauritania
Mauritius
MoroccoMozambiqueNamibia
Niger
Nigeria
Rwanda
Senegal
Sierra Leone
South Africa
Sudan
Swaziland
Tanzania
TogoTunisia
Uganda
ZambiaZimbabweAlgeria
Angola
Benin
Botswana
Burkina FasoBurundiCameroonCentral African Republic
Chad
Comoros
Congo
DRC
Cote D'IvoireDjibouti
Eqypt
Equatorial Guinea
Eritrea
Ethiopia
GabonGambia
Ghana
Kenya
Lesotho
Liberia
Libya
MadagascarMalawiMaliMauritania
Mauritius
MoroccoMozambique
Namibia
Niger
Nigeria
Rwanda
SenegalSierra LeoneSouth Africa
Sudan
Swaziland
Tanzania
Togo
Tunisia
Uganda
ZambiaZimbabweAlgeria
Angola
Benin
Botswana
Burkina FasoBurundiCameroonCentral African Republic
Chad
Comoros
Congo
DRC
Cote D'IvoireDjibouti
Eqypt
Equatorial Guinea
EritreaEthiopia
Gabon
Gambia
Ghana
Kenya
Lesotho
LiberiaLibyaMadagascar
MalawiMali
MauritaniaMauritius
MoroccoMozambiqueNamibia
NigerNigeriaRwanda
Senegal
Sierra LeoneSouth AfricaSudan
Swaziland
Tanzania
TogoTunisia
Uganda
ZambiaZimbabweAlgeria
Angola
Benin
Botswana
Burkina FasoBurundiCameroonCentral African Republic
Chad
Comoros
Congo
DRC
Cote D'IvoireDjibouti
Eqypt
Equatorial Guinea
EritreaEthiopia
Gabon
Gambia
Ghana
Kenya
Lesotho
LiberiaLibya
Madagascar MalawiMali
MauritaniaMauritius
MoroccoMozambiqueNamibia
NigerNigeriaRwanda
Senegal
Sierra LeoneSouth AfricaSudan
Swaziland
Tanzania
TogoTunisia
Uganda
ZambiaZimbabweAlgeria
Angola
Benin
Botswana
Burkina FasoBurundi
CameroonCentral African Republic
Chad
Comoros
Congo
DRC
Cote D'IvoireDjibouti
Eqypt
Equatorial Guinea
EritreaEthiopia
Gabon
GambiaGhanaKenya
LesothoLiberia
Libya
Madagascar MalawiMali
Mauritania
Mauritius
MoroccoMozambiqueNamibia
NigerNigeria
Rwanda
Senegal
Sierra Leone
South AfricaSudan
Swaziland
Tanzania
TogoTunisia
UgandaZambia
ZimbabweAlgeria
Angola
Benin
Botswana
Burkina Faso BurundiCameroonCentral African Republic
Chad
Comoros
Congo
DRCCote D'Ivoire
Djibouti
Eqypt
Equatorial Guinea
EritreaEthiopia
Gabon
GambiaGhana
Kenya
LesothoLiberia
LibyaMadagascar
MalawiMali
Mauritania
Mauritius
MoroccoMozambique
Namibia
NigerNigeria
Rwanda
Senegal
Sierra Leone
South Africa
Sudan
Swaziland
Tanzania
TogoTunisia
UgandaZambia
Zimbabwe Algeria
Angola
Benin
Botswana
Burkina FasoBurundiCameroon
Central African Republic
ChadComoros
Congo
DRCCote D'IvoireEqypt
Equatorial Guinea
EritreaEthiopia
Gabon
GambiaGhana
Kenya
LesothoLiberia
LibyaMadagascar MalawiMali
Mauritania
Mauritius
Morocco
Mozambique
Namibia
NigerNigeria
Rwanda
Senegal
Sierra Leone
South Africa
Sudan
Swaziland
Tanzania
Togo
Tunisia
UgandaZambia
Zimbabwe
Algeria
Angola
Benin
Botswana
Burkina FasoBurundi
CameroonCentral African Republic
ChadComoros
Congo
DRC
Cote D'Ivoire
Eqypt
Equatorial Guinea
EritreaEthiopia
Gabon
GambiaGhana
Kenya
Lesotho
LiberiaMadagascar
MalawiMali
MauritaniaMauritius
MoroccoMozambique
Namibia
NigerNigeria
Rwanda
Senegal
Sierra LeoneSouth Africa
Sudan
Swaziland
Tanzania
TogoTunisia
UgandaZambiaZimbabwe Algeria
Angola
Benin
Botswana
Burkina Faso BurundiCameroonCentral African Republic
ChadComoros
Congo
DRC Cote D'Ivoire
Eqypt
Equatorial Guinea
EritreaEthiopia
GabonGambiaGhana
Kenya
Lesotho
Liberia
Madagascar MalawiMali
Mauritania Mauritius
MoroccoMozambique
Namibia
Niger
NigeriaRwanda
SenegalSierra LeoneSouth Africa
Sudan
Swaziland
Tanzania
TogoTunisia
UgandaZambia
Zimbabwe
Algeria
Angola
Benin
Botswana
Burkina Faso BurundiCameroonCentral African Republic
ChadComoros
Congo
DRC Cote D'Ivoire
Eqypt
Equatorial Guinea
EritreaEthiopia
GabonGambiaGhana
Kenya
Lesotho
Liberia
Madagascar MalawiMali
Mauritania Mauritius
MoroccoMozambique
Namibia
NigerNigeria
Rwanda
Senegal Sierra LeoneSouth Africa
Sudan
Swaziland
TanzaniaTogoTunisia
UgandaZambia
Zimbabwe
Algeria
Angola
Benin
Botswana
Burkina FasoBurundiCameroon
Central African Republic
ChadComoros
Congo
DRC
Cote D'Ivoire
Eqypt
Equatorial Guinea
Ethiopia
Gabon GambiaGhana
Kenya
Lesotho
Liberia
MadagascarMalawi
Mali
Mauritania
Mauritius
MoroccoMozambique
Namibia
Niger
NigeriaRwanda
Senegal
Sierra Leone
South Africa
Sudan
Swaziland
Tanzania
Tunisia
UgandaZambia
Zimbabwe
0100
200
300
400
Trade_
GDP
0 5 10 15IFRS_Adopt
139
The trends in Figures 15-17 suggest that there was no strong association between the
adoption of IFRS, trade, foreign direct investment and foreign portfolio investment.
Since the relationship being tested is in its bivariate form, it will not be appropriate to
draw inferences pertaining to the direction and significance of the causal effect of the
adoption of IFRS. This will be further tested in the advanced analysis, where the varia-
bles will be plugged into an econometric model and then tested using the appropriate
statistical techniques.
Test for Multicollinearity
The correlation analysis was presented in Table 7, where the variables included in the
model were tested for bivariate associations. In this type of analysis, the main interest is
to observe the direction in which the variables move with one another. From this analy-
sis, two main distinct end is expected: to test the presence of multicollinearity among
the variables and to predict the possible effect of the variables on one another, using the
direction and coefficient of association.
The presence of multicollinearity involves the existence of a perfect or exact linear re-
lationship among some or all explanatory variables of a regression model (Gujarati, and
Porter, 2009). As an example, for the k-variable regression involving explanatory vari-
ables X1, X2,…,Xn, and X1=1, an exact linear relationship between the explanatory vari-
ables will exist when:
⋯ 0
From the Table, there were no obvious case of multicollinearity except for few occur-
rences: that is the relationship between adult literacy (A_Lit), GDP per capita (GDP_PC)
and total electricity production (Elect). From the Table, the extent of association be-
tween the variables was as high as 0.59 (for adult literacy and GDP per capita) and 0.67
(for adult literacy and electricity production). Likewise, the relationship between the
measures of governance/institutions (i.e. Pol_Stab- Political Stability; Corr- Control of

140
Corruption; G_Effect- Government Effectiveness; Reg_Qua- Regulatory Quality) also
shows a high correlation.
To deal with the problems of multicollinearity, in the regression analysis, there are two
options that can be applied: first, since these variables are the explanatory variables, one
of the multicollinearity variables can be dropped for the other; implying that one can be
used in the analysis while the other variable is dropped off the model. The second ap-
proach is to plug in the variables one at a time in the regression model. This imply that
one of the variables is used at a time in the regression model in order to prevent the
occurrence of including the variables together in the regression model.
In this study, the first approach will be applied for the first set of multicollinearity vari-
ables due to the fact that these variables are not of utmost importance in defining the
behaviour of our model. This is unlike the second group of multicollinearity variables,
which includes the governance structure. Because these variables are of utmost im-
portance in defining the institutional framework in the country, the step-wise approach
in the regression analysis is applied. The reason being that all the multicollinearity var-
iables are important in understanding the main relationship that exist between IFRS
adoption, trade and FDI. In essence, when analysing the data, the variables will be in-
cluded one at a time in order to ensure that the variables were all utilised in the analysis.
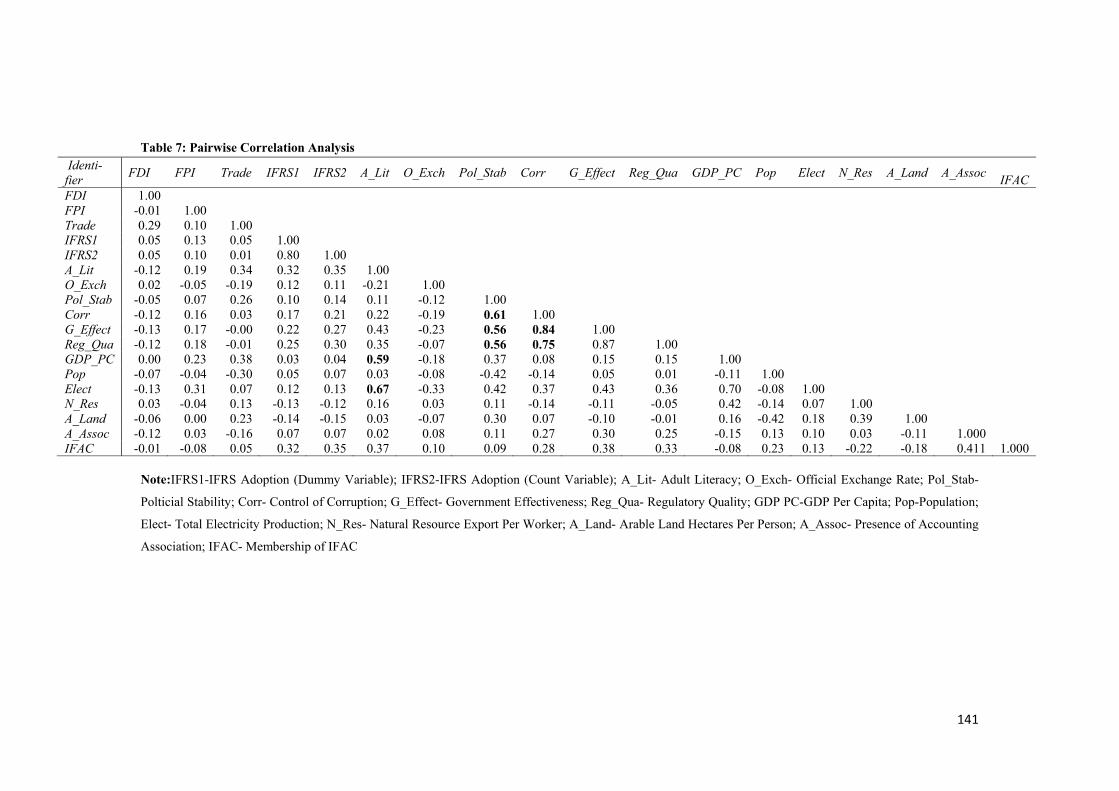
141
Table 7: Pairwise Correlation Analysis Identi-fier
FDI FPI Trade IFRS1 IFRS2 A_Lit O_Exch Pol_Stab Corr G_Effect Reg_Qua GDP_PC Pop Elect N_Res A_Land A_Assoc IFAC
FDI 1.00 FPI -0.01 1.00 Trade 0.29 0.10 1.00 IFRS1 0.05 0.13 0.05 1.00 IFRS2 0.05 0.10 0.01 0.80 1.00 A_Lit -0.12 0.19 0.34 0.32 0.35 1.00 O_Exch 0.02 -0.05 -0.19 0.12 0.11 -0.21 1.00 Pol_Stab -0.05 0.07 0.26 0.10 0.14 0.11 -0.12 1.00 Corr -0.12 0.16 0.03 0.17 0.21 0.22 -0.19 0.61 1.00 G_Effect -0.13 0.17 -0.00 0.22 0.27 0.43 -0.23 0.56 0.84 1.00 Reg_Qua -0.12 0.18 -0.01 0.25 0.30 0.35 -0.07 0.56 0.75 0.87 1.00 GDP_PC 0.00 0.23 0.38 0.03 0.04 0.59 -0.18 0.37 0.08 0.15 0.15 1.00 Pop -0.07 -0.04 -0.30 0.05 0.07 0.03 -0.08 -0.42 -0.14 0.05 0.01 -0.11 1.00 Elect -0.13 0.31 0.07 0.12 0.13 0.67 -0.33 0.42 0.37 0.43 0.36 0.70 -0.08 1.00 N_Res 0.03 -0.04 0.13 -0.13 -0.12 0.16 0.03 0.11 -0.14 -0.11 -0.05 0.42 -0.14 0.07 1.00 A_Land -0.06 0.00 0.23 -0.14 -0.15 0.03 -0.07 0.30 0.07 -0.10 -0.01 0.16 -0.42 0.18 0.39 1.00 A_Assoc -0.12 0.03 -0.16 0.07 0.07 0.02 0.08 0.11 0.27 0.30 0.25 -0.15 0.13 0.10 0.03 -0.11 1.000 IFAC -0.01 -0.08 0.05 0.32 0.35 0.37 0.10 0.09 0.28 0.38 0.33 -0.08 0.23 0.13 -0.22 -0.18 0.411 1.000
Note:IFRS1-IFRS Adoption (Dummy Variable); IFRS2-IFRS Adoption (Count Variable); A_Lit- Adult Literacy; O_Exch- Official Exchange Rate; Pol_Stab-
Polticial Stability; Corr- Control of Corruption; G_Effect- Government Effectiveness; Reg_Qua- Regulatory Quality; GDP PC-GDP Per Capita; Pop-Population;
Elect- Total Electricity Production; N_Res- Natural Resource Export Per Worker; A_Land- Arable Land Hectares Per Person; A_Assoc- Presence of Accounting
Association; IFAC- Membership of IFAC
142
4.7 Regression Analysis
In this section, the regression analysis was performed to test the hypothesis that were pro-
posed in this study. It is important to reiterate that the three distinct estimation techniques
were applied in the regression analysis. They are the ordinary least square regression that
considers the fixed effect structure of the sample, to check the baseline underlining rela-
tionships between the variables; the feasible generalised least square, which was applied to
control for possible heteroscedasticity and the SGMM technique, which controls for pos-
sible reverse causality and endogeneity issues.
More so, the regression analysis will be performed in piecemeal. This implies that since
the explained variables are three, the separate analysis will be performed considering the
uniqueness of their individuality. This is essential for the consideration of the behaviours
of the individual variables and how they relate with the variables of interest. The regression
result was analysed in such a way that the three explained variables (trade, FDI and FPI)
were considered separately in different regressions. After this estimations, then the inter-
active variable will be included to explain the indirect effect of the adoption of IFRS on
the three explained variables, considering the level of accounting development in the adopt-
ing country.
Regression Analysis: Trade Flow as Explained Variable
The first set of regression analysis that was considered is the regression analysis for the
model when considering trade as a percentage of GDP as the main explained variable. The
three estimation techniques (i.e. the ordinary least square regression-OLS, the random ef-
fect-RE and the systems GMM) were involved in this analysis for robustness and sensitiv-
ity purposes. The result from the estimations were presented in Table 8a, with different
columns signifying the different estimation techniques.
The Table was presented in a step-wise form. The reason being that the multicollinearity
variables that pertain to the governance/institutional variables (political stability, control
of corruption, government effectiveness and regulatory quality) were highly correlated.
Therefore, in order to prevent any form of ‘spuriousity’ in the estimations, there is the need
to avoid the inclusion of the entire variables in a single model. Therefore, this explains the
143
reasons for the inclusion of the variables one at a time. More so, the variables exchange
rate, population, and the measure of natural resources were all presented in their logarith-
mic form. By presenting them in their logarithmic form, we are interested in the elasticity
of the variables, measured in changes and not interested in their signs.
To begin the analysis, it is important to consider the preliminary examinations of the good-
ness of fit of the overall model and the strength of the explanatory power of the independent
variables. The R2 was first examined and from the Table 8a, the combined explanatory
strength of the variables imply that the entire variables can explain, at most, about 65 per-
cent of the changes caused in the trade flow to African countries. This explanatory strength
is statistically significant, considering that the F Statistics of the estimations were signifi-
cant at the 1 percent level of significance (see all the columns apart from those that pertains
to the SGMM).
The last preliminary analysis, is to consider the post-estimation outcomes of the regres-
sions, to enable a judgement as to the validity of the predictive capacity of the models. This
was performed by considering the Breusch Pagan test for the OLS results that were pre-
sented in columns 1, 4, 7 and 10 in Table 8a. This test examines whether the residuals of
the regression model are homogenous in nature. As an underlining assumption, for the OLS
model to be fit for prediction, the variance of the residuals arenot expected to be constant.
The test reveals that the variance of the residuals from the OLS does not follow a constant
form. This is because the probability statistics rejects the null hypothesis that the variance
of the residuals is constant. The second test is the Hausman Test that considers the choice
between the fixed effect and random effect model. The probability of the Hausman test
shows that the random effect model is most preferable. Lastly, the probability value of
theAR(2)confirms the p-value of the Arellano-Bond test for second-order serial correlation
in differences [AR (2)] and this value settles the fact that there were no serial correlation in
the residuals. The implication of this is that the results are useful for inferences as the in-
ternal instruments were not proliferated.
As a baseline, the covariates were examined to underscore their predictive ability to explain
the trade volume of the sampled countries. In all the columns, representing the different
estimation techniques, adult literacy, the exchange rate, population and the presence of

144
natural resource were the main explainer of the volume of trade flow in the sampled coun-
tries. The variables (adult literacy, exchange rate and population) were negatively explain-
ing the behaviour of trade flow. This imply that an increase in the rate of adult literacy will
reduce the volume of trade flow. Since this variable is not in its log-linear form, then the
implication of this result is that countries with more adult population will tend to be ad-
versely affected, in terms of trade. The magnitude of effect range from 21 percent to about
35 percent and significant at varying levels. A possible explanation for this is that most of
the sampled countries3trade in primary product, which demands minimal literacy, there-
fore, in situation where the adults, who are supposed to be employed in the primary sectors
are becoming literate, then there will be a form of labour migration from the primary sector
to other sectors. The effect of this is that the output from the primary sector will be reduced
by the number of migrant, which will then affect the overall trade volume of such country.
Perhaps, this explains why the variable was consistently negative in all the columns (except
for the last column).
The signs and significant values of the exchange rate follow theoretical explanations that
an exchange rate appreciation reduces trade while a devaluation increases trade. This trend
is peculiar to African countries, who are mostly import oriented. The implication being that
when the foreign exchange value of the local currency to US dollar increases, the value of
trade reduces and vice versa, the value of trade increases.
The variable – population also shows a negative relationship with the value of trade to
GDP. At least, it can be said from Table 8a that when the number of the population in-
creases in the country, the trade volume reduces by volumes above 0.10. This seems to
support the notion that the population growth adversely reduces the trade volume of the
country. The behaviour of the variable – natural resources suggest that countries with more
natural resource tend to behave better with regards to trade volume.
Considering the level of accounting development in the country, measured using the period
of existence of the professional accounting body in the country and the country being a
member of the International Federation of Accountants (IFAC), there are interesting results
3Most of the sampled countries trade in agricultural products and mineral components like crude oil, gold, diamond, coal etc.

145
to be considered. The signs and level of significance were varying across the columns and
dependent on the model being considered. From the columns 1-8 in Table 8a, the variables
representing accounting infrastructure in the country were not significant. However, when
considering the columns 9-11, the variable – IFAC membership – became significant. This
suggest that being a member of IFAC may take the positive and significant signs in relating
with the trade variable, but depended on the model and estimation technique being consid-
ered. The model where the variable was significant was such that controlled for the extent
of regulatory quality within the country. As earlier suggested, this is the only institutional
measure that clearly reflects the importance of accounting related phenomenon on the
macro-economic outcome of the country. This is not surprising since accounting infrastruc-
ture and regulation is a form of regulatory strategy that confines countries to behave in a
particular manner. This therefore implies that this variable must be an important institu-
tional infrastructure to be considered when discussing the relationship between an account-
ing concept and the macro-economy of a country.
The sign and significant values of the main variable of interest – IFRS adoption, shows a
positive effect, which is significant at the varying levels of significance. At least, it can be
confirmed from the Table that an increase in the number of years that a country has adopted
IFRS, will result to an improvement in the trade volume. The main explanation that under-
lines this relationship is that a country with an improved financial reporting infrastructure
will invariably result to sectorial/industrial development that will enhance trade flow with
other countries.
Since African countries trade more of primary product, there is the need to situate this
relationship when considering the production of primary products like unprocessed agri-
cultural output and other forms of minerals. In understanding this relationship, it is im-
portant to state that the adoption of IFRS enhances public accountability of companies
(both small, medium and large), irrespective of the sector that the company is located in.
Following the definition that public accountability is a state, where an entity meets the
following conditions: firstly, the entity has a high degree of outside interest from non-man-
agement investors or other kinds of stakeholders. These forms of stakeholders primarily
depends on external financial reporting as their means of obtaining financial information
146
about the entity; secondly, the entity, because of its nature of operation, has an essential
public service responsibility. Therefore, since the adoption of IFRS is expected to enhance
the extent of public responsibility of the firm, then the firm will likely have a higher access
to capital and the resultant effect is an increase in the output of the firm. This will have a
ripple effect on the trade volume of such a country.
Interestingly, the signs and level of significance of the IFRS variable was consistent across
the three estimation techniques. This suggest a robust behaviour and despite the peculiarity
of each of the techniques, the variable was still consistent. We expected that addressing the
reverse causality and endogeneity issues that sometimes reoccurs with panel data analysis
will have an effect on the relationship. However, the result from the Table 8a negates this
expectation. In the sense of it, the IFRS variable was only consistent in the last column for
SGMM, when the variable “regulatory quality” was included in the model. The implica-
tion of this is that when controlling for endogeneity and reverse causality in the panel re-
gression model, there is the need to consider the adoption of IFRS in line with the regula-
tory quality of the country. This institutional measure has the capacity to reveal the signif-
icant effect of IFRS on trade, while other institutional measures were not able to do so. At
least, the other variables were able to reveal the signs of the adoption of IFRS on trade, but
they were not able to inform the extent of significance of this relationship. Therefore, the
variable – regulatory quality is a policy variable that must be considered when dealing with
advanced analysis in an IFRS trade model.
As a further check, the IFRS variable was included in the model as a dummy variable. The
whole essence is to check if the signs of the relationship will remain consistent as it is in
Table 8a. The result of this check was displayed in Table 4.5b, where similar estimations
were performed as it is in Table 8a. From the Table, similar sign was observed for the IFRS
variable (see columns 1-12, in Table 8a). From the Table, IFRS, measured as a dummy
variable, still maintained a positive relationship with the explained variable – trade to GDP
ratio. This variable was not significant in any of the columns. Possibly, the dummy com-
ponent of this variable clearly distorts the trend relationship that is likely to be in existence
in the model.
147
It can be concluded that for African countries, the IFRS variable will display an efficient
relationship with trade volume when considering the trend component of the variable.
However, when taking the variable as a dummy, it is no longer capable of showing the
exact relationship that exist within the model. This is especially when considering the sig-
nificance of the relationship. The other variables in the model still showed consistent be-
haviour as they were in Table 8a. Therefore, since the use of IFRS dummy was not trans-
lating to an improved significant values of the IFRS variable and does not reflect the trend
relationships that are likely to occur amongst the variables, it is no longer useful for further
analysis. More importantly, the inclusion or exclusion does not distort the behaviour of the
other variables, making it redundant and hence not useful in other analysis.
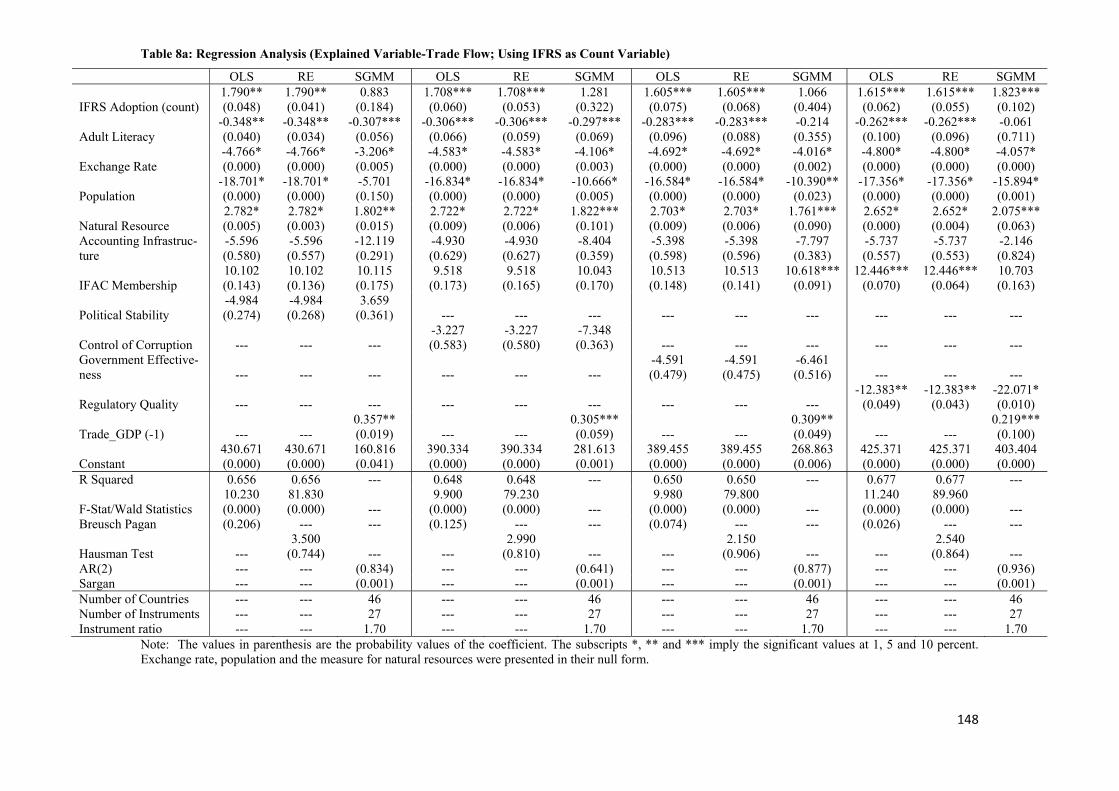
148
Table 8a: Regression Analysis (Explained Variable-Trade Flow; Using IFRS as Count Variable)
OLS RE SGMM OLS RE SGMM OLS RE SGMM OLS RE SGMM
IFRS Adoption (count) 1.790** (0.048)
1.790** (0.041)
0.883 (0.184)
1.708*** (0.060)
1.708*** (0.053)
1.281 (0.322)
1.605*** (0.075)
1.605*** (0.068)
1.066 (0.404)
1.615*** (0.062)
1.615*** (0.055)
1.823*** (0.102)
Adult Literacy -0.348** (0.040)
-0.348** (0.034)
-0.307*** (0.056)
-0.306*** (0.066)
-0.306*** (0.059)
-0.297*** (0.069)
-0.283*** (0.096)
-0.283*** (0.088)
-0.214 (0.355)
-0.262*** (0.100)
-0.262*** (0.096)
-0.061 (0.711)
Exchange Rate -4.766* (0.000)
-4.766* (0.000)
-3.206* (0.005)
-4.583* (0.000)
-4.583* (0.000)
-4.106* (0.003)
-4.692* (0.000)
-4.692* (0.000)
-4.016* (0.002)
-4.800* (0.000)
-4.800* (0.000)
-4.057* (0.000)
Population -18.701* (0.000)
-18.701* (0.000)
-5.701 (0.150)
-16.834* (0.000)
-16.834* (0.000)
-10.666* (0.005)
-16.584* (0.000)
-16.584* (0.000)
-10.390** (0.023)
-17.356* (0.000)
-17.356* (0.000)
-15.894* (0.001)
Natural Resource 2.782* (0.005)
2.782* (0.003)
1.802** (0.015)
2.722* (0.009)
2.722* (0.006)
1.822*** (0.101)
2.703* (0.009)
2.703* (0.006)
1.761*** (0.090)
2.652* (0.000)
2.652* (0.004)
2.075*** (0.063)
Accounting Infrastruc-ture
-5.596 (0.580)
-5.596 (0.557)
-12.119 (0.291)
-4.930 (0.629)
-4.930 (0.627)
-8.404 (0.359)
-5.398 (0.598)
-5.398 (0.596)
-7.797 (0.383)
-5.737 (0.557)
-5.737 (0.553)
-2.146 (0.824)
IFAC Membership 10.102 (0.143)
10.102 (0.136)
10.115 (0.175)
9.518 (0.173)
9.518 (0.165)
10.043 (0.170)
10.513 (0.148)
10.513 (0.141)
10.618*** (0.091)
12.446*** (0.070)
12.446*** (0.064)
10.703 (0.163)
Political Stability -4.984 (0.274)
-4.984 (0.268)
3.659 (0.361) --- --- --- --- --- --- --- --- ---
Control of Corruption --- --- --- -3.227 (0.583)
-3.227 (0.580)
-7.348 (0.363) --- --- --- --- --- ---
Government Effective-ness --- --- --- --- --- ---
-4.591 (0.479)
-4.591 (0.475)
-6.461 (0.516) --- --- ---
Regulatory Quality --- --- --- --- --- --- --- --- --- -12.383**
(0.049) -12.383**
(0.043) -22.071* (0.010)
Trade_GDP (-1) --- --- 0.357** (0.019) --- ---
0.305*** (0.059) --- ---
0.309** (0.049) --- ---
0.219*** (0.100)
Constant 430.671 (0.000)
430.671 (0.000)
160.816 (0.041)
390.334 (0.000)
390.334 (0.000)
281.613 (0.001)
389.455 (0.000)
389.455 (0.000)
268.863 (0.006)
425.371 (0.000)
425.371 (0.000)
403.404 (0.000)
R Squared 0.656 0.656 --- 0.648 0.648 --- 0.650 0.650 --- 0.677 0.677 ---
F-Stat/Wald Statistics 10.230 (0.000)
81.830 (0.000) ---
9.900 (0.000)
79.230 (0.000) ---
9.980 (0.000)
79.800 (0.000) ---
11.240 (0.000)
89.960 (0.000) ---
Breusch Pagan (0.206) --- --- (0.125) --- --- (0.074) --- --- (0.026) --- ---
Hausman Test --- 3.500
(0.744) --- --- 2.990
(0.810) --- --- 2.150
(0.906) --- --- 2.540
(0.864) --- AR(2) --- --- (0.834) --- --- (0.641) --- --- (0.877) --- --- (0.936) Sargan --- --- (0.001) --- --- (0.001) --- --- (0.001) --- --- (0.001) Number of Countries --- --- 46 --- --- 46 --- --- 46 --- --- 46 Number of Instruments --- --- 27 --- --- 27 --- --- 27 --- --- 27 Instrument ratio --- --- 1.70 --- --- 1.70 --- --- 1.70 --- --- 1.70
Note: The values in parenthesis are the probability values of the coefficient. The subscripts *, ** and *** imply the significant values at 1, 5 and 10 percent. Exchange rate, population and the measure for natural resources were presented in their null form.
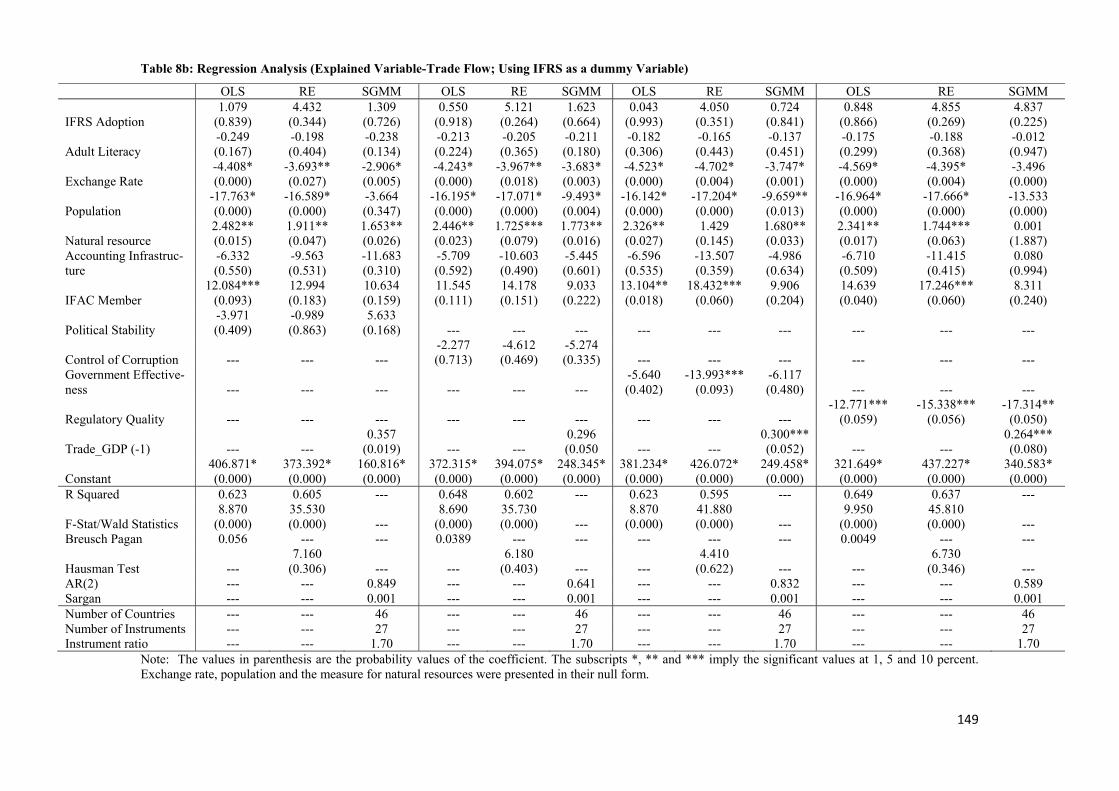
149
Table 8b: Regression Analysis (Explained Variable-Trade Flow; Using IFRS as a dummy Variable)
OLS RE SGMM OLS RE SGMM OLS RE SGMM OLS RE SGMM
IFRS Adoption 1.079
(0.839) 4.432
(0.344) 1.309
(0.726) 0.550
(0.918) 5.121
(0.264) 1.623
(0.664) 0.043
(0.993) 4.050
(0.351) 0.724
(0.841) 0.848
(0.866) 4.855
(0.269) 4.837
(0.225)
Adult Literacy -0.249 (0.167)
-0.198 (0.404)
-0.238 (0.134)
-0.213 (0.224)
-0.205 (0.365)
-0.211 (0.180)
-0.182 (0.306)
-0.165 (0.443)
-0.137 (0.451)
-0.175 (0.299)
-0.188 (0.368)
-0.012 (0.947)
Exchange Rate -4.408* (0.000)
-3.693** (0.027)
-2.906* (0.005)
-4.243* (0.000)
-3.967** (0.018)
-3.683* (0.003)
-4.523* (0.000)
-4.702* (0.004)
-3.747* (0.001)
-4.569* (0.000)
-4.395* (0.004)
-3.496 (0.000)
Population -17.763* (0.000)
-16.589* (0.000)
-3.664 (0.347)
-16.195* (0.000)
-17.071* (0.000)
-9.493* (0.004)
-16.142* (0.000)
-17.204* (0.000)
-9.659** (0.013)
-16.964* (0.000)
-17.666* (0.000)
-13.533 (0.000)
Natural resource 2.482** (0.015)
1.911** (0.047)
1.653** (0.026)
2.446** (0.023)
1.725*** (0.079)
1.773** (0.016)
2.326** (0.027)
1.429 (0.145)
1.680** (0.033)
2.341** (0.017)
1.744*** (0.063)
0.001 (1.887)
Accounting Infrastruc-ture
-6.332 (0.550)
-9.563 (0.531)
-11.683 (0.310)
-5.709 (0.592)
-10.603 (0.490)
-5.445 (0.601)
-6.596 (0.535)
-13.507 (0.359)
-4.986 (0.634)
-6.710 (0.509)
-11.415 (0.415)
0.080 (0.994)
IFAC Member 12.084***
(0.093) 12.994 (0.183)
10.634 (0.159)
11.545 (0.111)
14.178 (0.151)
9.033 (0.222)
13.104** (0.018)
18.432*** (0.060)
9.906 (0.204)
14.639 (0.040)
17.246*** (0.060)
8.311 (0.240)
Political Stability -3.971 (0.409)
-0.989 (0.863)
5.633 (0.168) --- --- --- --- --- --- --- --- ---
Control of Corruption --- --- --- -2.277 (0.713)
-4.612 (0.469)
-5.274 (0.335) --- --- --- --- --- ---
Government Effective-ness --- --- --- --- --- ---
-5.640 (0.402)
-13.993*** (0.093)
-6.117 (0.480) --- --- ---
Regulatory Quality --- --- --- --- --- --- --- --- --- -12.771***
(0.059) -15.338***
(0.056) -17.314**
(0.050)
Trade_GDP (-1) --- --- 0.357
(0.019) --- --- 0.296 (0.050 --- ---
0.300*** (0.052) --- ---
0.264*** (0.080)
Constant 406.871* (0.000)
373.392* (0.000)
160.816* (0.000)
372.315* (0.000)
394.075* (0.000)
248.345* (0.000)
381.234* (0.000)
426.072* (0.000)
249.458* (0.000)
321.649* (0.000)
437.227* (0.000)
340.583* (0.000)
R Squared 0.623 0.605 --- 0.648 0.602 --- 0.623 0.595 --- 0.649 0.637 ---
F-Stat/Wald Statistics 8.870
(0.000) 35.530 (0.000) ---
8.690 (0.000)
35.730 (0.000) ---
8.870 (0.000)
41.880 (0.000) ---
9.950 (0.000)
45.810 (0.000) ---
Breusch Pagan 0.056 --- --- 0.0389 --- --- --- --- --- 0.0049 --- ---
Hausman Test --- 7.160
(0.306) --- --- 6.180
(0.403) --- --- 4.410
(0.622) --- --- 6.730
(0.346) --- AR(2) --- --- 0.849 --- --- 0.641 --- --- 0.832 --- --- 0.589 Sargan --- --- 0.001 --- --- 0.001 --- --- 0.001 --- --- 0.001 Number of Countries --- --- 46 --- --- 46 --- --- 46 --- --- 46 Number of Instruments --- --- 27 --- --- 27 --- --- 27 --- --- 27 Instrument ratio --- --- 1.70 --- --- 1.70 --- --- 1.70 --- --- 1.70
Note: The values in parenthesis are the probability values of the coefficient. The subscripts *, ** and *** imply the significant values at 1, 5 and 10 percent. Exchange rate, population and the measure for natural resources were presented in their null form.
150
Regression Analysis: Foreign Direct Investment as Explained Variable
Considering the explained variable – foreign direct investment (FDI) – Table 9 presents
the relationship that exist between this variable – FDI – the main explanatory variable
(IFRS), the covariates. The three estimation techniques were also applied in testing this
relationship and these techniques were all presented in different columns in the Table, de-
pending on the combinations of the institutional variable.
As a preliminary check, considerations was given to the post estimation checks for the
different analysis. This is to enable us properly consider the suitability and reliability of
the results. As earlier done, for the OLS regression, the R2 and the test for homogeneity of
the residuals was checked. The R2 of the entire model reveals that the entire model (inclu-
sive of the main explanatory variable and the covariates), were able to explain above 20
percent of the behaviour of the FDI variable. This explanatory power is low, but consider-
ing a variable like FDI that is very volatile and affected by many other factors, an above
20 percent explanatory power is substantial and can be relied upon for policy consideration.
The test for homogeneity of the residuals of the regression model shows that the residuals
follow a homogenous pattern. At least, the null hypothesis of a constant variance of the
residuals is rejected at the varying levels of significance.
Columns 2, 5, 6, 8, 11 and 12 of Table 9, respectively displays the Hausman, the AR (2)
and Sargan test for instrument proliferation for the SGMM technique. From the Table, the
Hausman test reveals that the Random Effect (RE) estimation technique is preferable to the
Fixed Effect (FE) test. The statistics of the Hausman test shows that the null hypothesis of
difference in coefficients not being systemic should be rejected: this imply that the RE
should be selected over the FE test. Of course, its advantages is tied to the fact that it is
able to analyse the unique, time constant attributes that are the results of random variation
and do not correlate with the individual regressors.This model is adequate, if we want to
draw inferences about the whole population, not only the examined sample. The AR (2)
test reveals that there is no problem of autocorrelation among the internal instruments used
in the SGMM estimation technique. This suggest that the result from the SGMM test can
be relied upon.
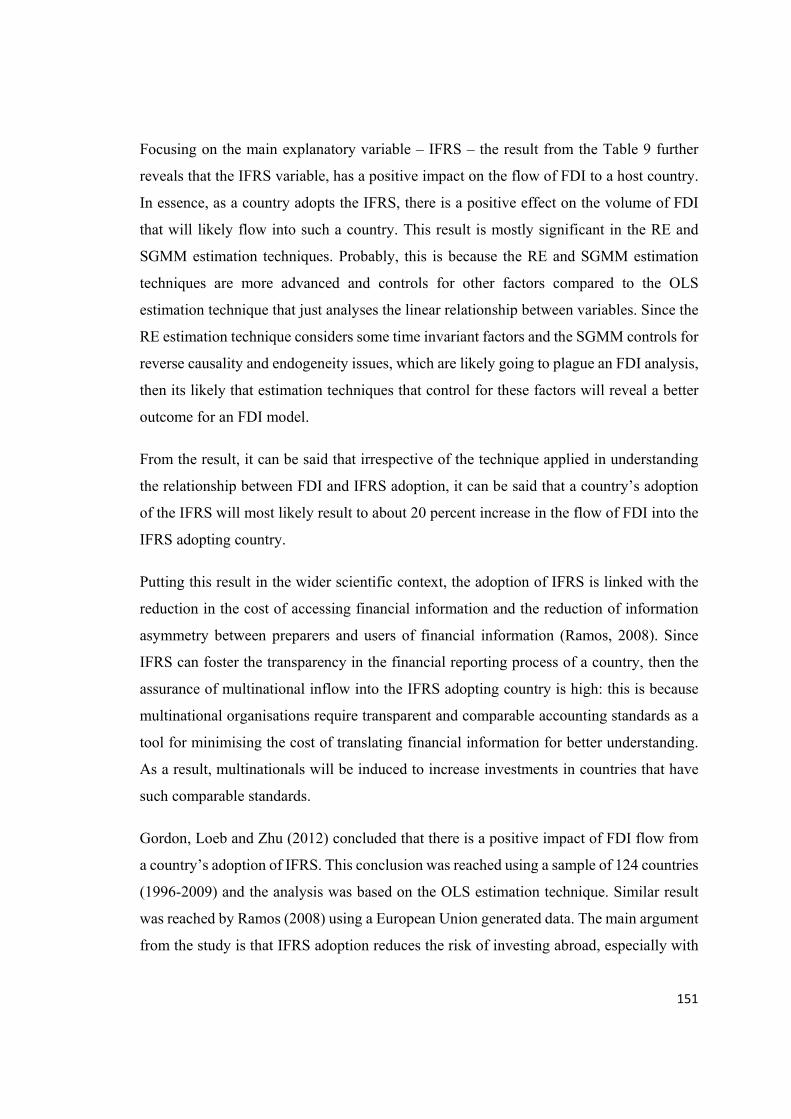
151
Focusing on the main explanatory variable – IFRS – the result from the Table 9 further
reveals that the IFRS variable, has a positive impact on the flow of FDI to a host country.
In essence, as a country adopts the IFRS, there is a positive effect on the volume of FDI
that will likely flow into such a country. This result is mostly significant in the RE and
SGMM estimation techniques. Probably, this is because the RE and SGMM estimation
techniques are more advanced and controls for other factors compared to the OLS
estimation technique that just analyses the linear relationship between variables. Since the
RE estimation technique considers some time invariant factors and the SGMM controls for
reverse causality and endogeneity issues, which are likely going to plague an FDI analysis,
then its likely that estimation techniques that control for these factors will reveal a better
outcome for an FDI model.
From the result, it can be said that irrespective of the technique applied in understanding
the relationship between FDI and IFRS adoption, it can be said that a country’s adoption
of the IFRS will most likely result to about 20 percent increase in the flow of FDI into the
IFRS adopting country.
Putting this result in the wider scientific context, the adoption of IFRS is linked with the
reduction in the cost of accessing financial information and the reduction of information
asymmetry between preparers and users of financial information (Ramos, 2008). Since
IFRS can foster the transparency in the financial reporting process of a country, then the
assurance of multinational inflow into the IFRS adopting country is high: this is because
multinational organisations require transparent and comparable accounting standards as a
tool for minimising the cost of translating financial information for better understanding.
As a result, multinationals will be induced to increase investments in countries that have
such comparable standards.
Gordon, Loeb and Zhu (2012) concluded that there is a positive impact of FDI flow from
a country’s adoption of IFRS. This conclusion was reached using a sample of 124 countries
(1996-2009) and the analysis was based on the OLS estimation technique. Similar result
was reached by Ramos (2008) using a European Union generated data. The main argument
from the study is that IFRS adoption reduces the risk of investing abroad, especially with

152
regards to transparency and control of subsidiaries. Chen, Ding and Xu (2014) found sim-
ilar result for countries in the Organization for Economic Cooperation and Development
(OECD).
The lagged value of the FDI variables was first considered before discussing the other ex-
planatory variables. From the Table 9, the variable maintained a positive sign in all the
columns it appeared in. Its significance was verified only in column 9. Since it maintained
a consistent positive sign in the entire models, it can be said that the FDI flow to African
countries follow an agglomeration pattern. This imply that the value of FDI flow in a cur-
rent year will most likely inform the value of future FDI flow into such a country. Mijiyawa
(2011) carefully expounded on this effect in his study of the drivers of foreign investment
into Africa and concluded that the current volume of foreign investment is most likely
going to be an attractive tool for other foreign investors. The positive sign from the Table
consistently verified this fact, but the significance level proved murky: in some columns,
the variable was insignificant, while in another column, it became significant at 1 percent.
Just as it was in Table 8, most of the other covariates in Table 9, like the adult literacy,
official exchange rate and the population of the country, still maintained a consistent sign
and the significance levels was not so different from the earlier presented. Attention is
drawn to the variable – exchange rate – which was not able to maintain a significant effect
on FDI as it was in the first model that had trade to GDP ratio as its explained variable.
This in itself is not a major issue because trade volume will most likely be affected by the
exchange rate policy of the country compared to FDI: meaning that the insignificant effect
of this variable on FDI may not really be an issue unlike if it were insignificant in the trade
flow model in Table 8.
The signs and significant values of the accounting infrastructure variables and measures of
institutional development in Table 9 maintained similar sign and significant value as in
Table 8. The effect of these variables will be further explored in subsequent discussions
and their intervening roles in the IFRS adoption, trade and FDI nexus will be expounded.
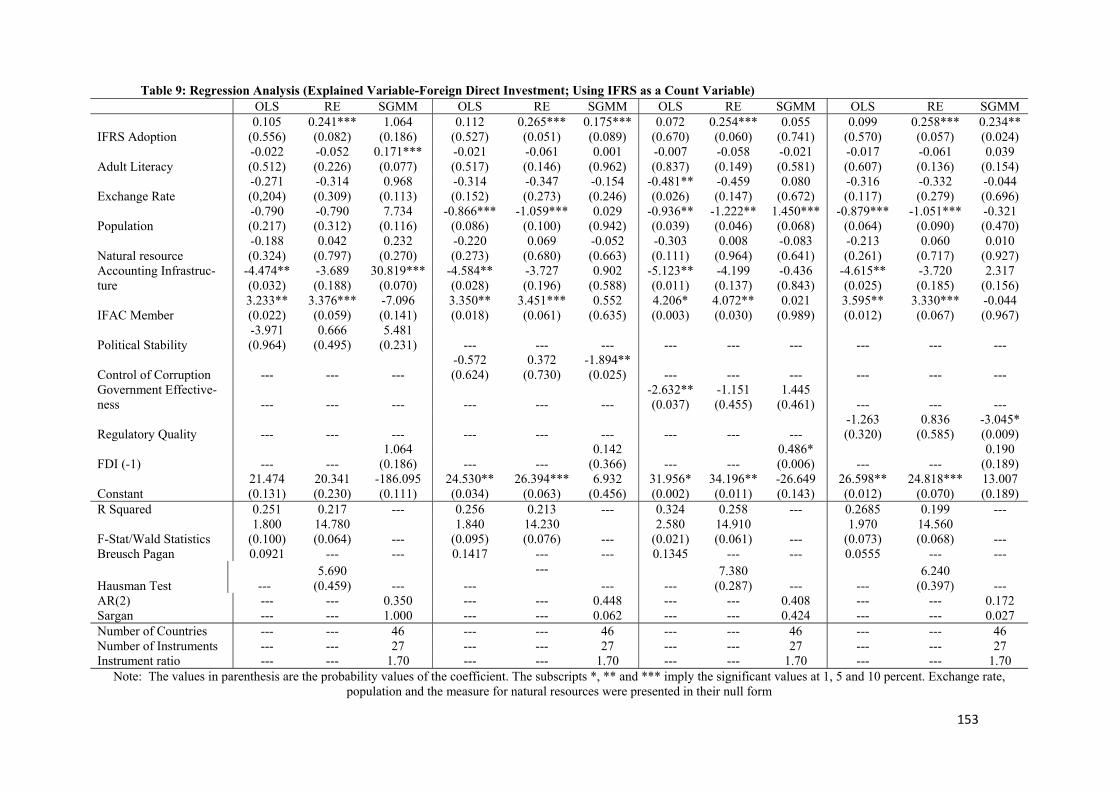
153
Table 9: Regression Analysis (Explained Variable-Foreign Direct Investment; Using IFRS as a Count Variable)
OLS RE SGMM OLS RE SGMM OLS RE SGMM OLS RE SGMM
IFRS Adoption 0.105
(0.556) 0.241*** (0.082)
1.064 (0.186)
0.112 (0.527)
0.265*** (0.051)
0.175*** (0.089)
0.072 (0.670)
0.254*** (0.060)
0.055 (0.741)
0.099 (0.570)
0.258*** (0.057)
0.234** (0.024)
Adult Literacy-0.022 (0.512)
-0.052 (0.226)
0.171*** (0.077)
-0.021 (0.517)
-0.061 (0.146)
0.001 (0.962)
-0.007 (0.837)
-0.058 (0.149)
-0.021 (0.581)
-0.017 (0.607)
-0.061 (0.136)
0.039 (0.154)
Exchange Rate -0.271 (0,204)
-0.314 (0.309)
0.968 (0.113)
-0.314 (0.152)
-0.347 (0.273)
-0.154 (0.246)
-0.481** (0.026)
-0.459 (0.147)
0.080 (0.672)
-0.316 (0.117)
-0.332 (0.279)
-0.044 (0.696)
Population -0.790 (0.217)
-0.790 (0.312)
7.734 (0.116)
-0.866*** (0.086)
-1.059*** (0.100)
0.029 (0.942)
-0.936** (0.039)
-1.222** (0.046)
1.450*** (0.068)
-0.879*** (0.064)
-1.051*** (0.090)
-0.321 (0.470)
Natural resource -0.188 (0.324)
0.042 (0.797)
0.232 (0.270)
-0.220 (0.273)
0.069 (0.680)
-0.052 (0.663)
-0.303 (0.111)
0.008 (0.964)
-0.083 (0.641)
-0.213 (0.261)
0.060 (0.717)
0.010 (0.927)
Accounting Infrastruc-ture
-4.474** (0.032)
-3.689 (0.188)
30.819*** (0.070)
-4.584** (0.028)
-3.727 (0.196)
0.902 (0.588)
-5.123** (0.011)
-4.199 (0.137)
-0.436 (0.843)
-4.615** (0.025)
-3.720 (0.185)
2.317 (0.156)
IFAC Member 3.233** (0.022)
3.376*** (0.059)
-7.096 (0.141)
3.350** (0.018)
3.451*** (0.061)
0.552 (0.635)
4.206* (0.003)
4.072** (0.030)
0.021 (0.989)
3.595** (0.012)
3.330*** (0.067)
-0.044 (0.967)
Political Stability -3.971 (0.964)
0.666 (0.495)
5.481 (0.231) --- --- --- --- --- --- --- --- ---
Control of Corruption --- --- --- -0.572 (0.624)
0.372 (0.730)
-1.894** (0.025) --- --- --- --- --- ---
Government Effective-ness --- --- --- --- --- ---
-2.632** (0.037)
-1.151 (0.455)
1.445 (0.461) --- --- ---
Regulatory Quality --- --- --- --- --- --- --- --- --- -1.263 (0.320)
0.836 (0.585)
-3.045* (0.009)
FDI (-1) --- --- 1.064
(0.186) --- --- 0.142
(0.366) --- --- 0.486* (0.006) --- ---
0.190 (0.189)
Constant 21.474 (0.131)
20.341 (0.230)
-186.095 (0.111)
24.530** (0.034)
26.394*** (0.063)
6.932 (0.456)
31.956* (0.002)
34.196** (0.011)
-26.649 (0.143)
26.598** (0.012)
24.818*** (0.070)
13.007 (0.189)
R Squared 0.251 0.217 --- 0.256 0.213 --- 0.324 0.258 --- 0.2685 0.199 ---
F-Stat/Wald Statistics 1.800
(0.100) 14.780 (0.064) ---
1.840 (0.095)
14.230 (0.076) ---
2.580 (0.021)
14.910 (0.061) ---
1.970 (0.073)
14.560 (0.068) ---
Breusch Pagan 0.0921 --- --- 0.1417 --- --- 0.1345 --- --- 0.0555 --- ---
Hausman Test --- 5.690
(0.459) --- --- ---
--- --- 7.380
(0.287) --- --- 6.240
(0.397) --- AR(2) --- --- 0.350 --- --- 0.448 --- --- 0.408 --- --- 0.172 Sargan --- --- 1.000 --- --- 0.062 --- --- 0.424 --- --- 0.027 Number of Countries --- --- 46 --- --- 46 --- --- 46 --- --- 46 Number of Instruments --- --- 27 --- --- 27 --- --- 27 --- --- 27 Instrument ratio --- --- 1.70 --- --- 1.70 --- --- 1.70 --- --- 1.70
Note: The values in parenthesis are the probability values of the coefficient. The subscripts *, ** and *** imply the significant values at 1, 5 and 10 percent. Exchange rate, population and the measure for natural resources were presented in their null form
154
Regression Analysis: Portfolio Investment as Explained Variable
In the nest analysis, the robust relationship between IFRS adoption and portfolio invest-
ment was examined, taking note of the other covariates. As usual, the OLS, random effect
and SGMM estimation techniques were applied in testing this relationship and the estima-
tion results were presented in Table 10.
Following the paradigm, the preliminary analysis of the regression results were presented
in the lower section of the Table and the result were as follows: the OLS regression analy-
sis, presented in columns 1, 4, 6 and 9, reveals that the entire model were able to explain
above 50 percent of the variation of the foreign portfolio investment. This fraction is high
and imply that the model is capable of explaining the behaviour of the foreign portfolio
investment, at least to a large extent. The OLS result presented in the Table was unable to
fulfil the homoscedasticity rule of regression analysis. In essence, the Breusch Pagan test
reveals that the result did not fulfil the criterion of homoscedasticity. Since this is not the
main analysis of interest, then we are not paying much attention to this inadequacy of the
model.
The Random Effect (RE) model reveals that the entire model was able to explain above 50
percent of the behaviour of the foreign portfolio investment. This magnitude of explanatory
strength is also sufficient to predict the foreign portfolio flow into our sampled countries.
The Hausman test also suggest that the RE test is better and more efficient in predicting
the relationships that exist between the variables.
The main estimation technique is the SGMM test, which controls for reverse causality and
endogeneity problems, suggest an interesting outlook for modelling the relationship. First,
the AR (2) test reveals that the model is of good fit and the internal instruments were not
serially correlated. Also, the instrument ration reveals that the internal instruments used in
the analysis were not proliferated.
From the Table, the IFRS adoption variable consistently had a negative effect on the vol-
ume of foreign portfolio investment in all the columns. The significant values were not
easily verified as in some columns, the IFRS variable was insignificant while in the other

155
columns, the variable was significant. Since the significant values were not easily verifia-
ble, we focused our attention on the consistency of the signs. Albeit, the signs can reveal,
to some extent, the behaviour of the IFRS variable, irrespective of the extent to which the
variable is able to affect foreign portfolio investment.
The IFRS variable was negative in all the columns of Table 10. This suggest that as coun-
tries in Africa adopt IFRS, there tend to be a negative effect on the volume of portfolio
investors that flow into the country. This result is contrary to the findings of Beneish et al
(2012), who emphasised that the effect of IFRS adoption on the debt and equity market of
EU countries is positive: implying that IFRS adoption has positively influenced foreign
debt movement and has a marginal positive impact on equity investment. Since their result
suggest marginal influence of IFRS adoption on equity investors and the result from this
study suggest a negative effect, it can be argued that IFRS adoption does not necessarily
promote equity investors in countries.
This argument is premixed on the fact that most portfolio investors depend on the risk
involved in investment and not necessarily the financial information translation in making
their investment decision. Also, most of these investors may not necessarily be involved in
the monitoring of the financial statement of companies they invest in, but will most likely
be studying the trend of the stock market before making investment decisions. The stock
market is based on speculations that comes from the information flow that spans beyond
the micro entity called the firm. For instance, the recent global financial crisis witnessed
stock market crash of some countries (which simply means that the portfolio investors were
gradually selling up their stock for liquidity) and the values of shares were dropping sym-
metrically. The ubiquitous occurrence of this trend was not as a result of the firm’s financial
statement translation, but as a result of some other shocks that emanated from the macro
economy at large.
This argument does not imply that the IFRS may not have a significant effect on the port-
folio investors, but that the effect may not necessarily be as strong and positive as it has on
trade and foreign investors. Atleast, the behaviour of the variable in the Table 10 further
156
exaggerates this facts. The behaviour of the other covariates in relation to portfolio invest-
ment was also presented in the Table.
The variables that have consistently behaved in similar fashion across the Tables (Tables
8a and b, and 9) include adult literacy, exchange rate and population. In the earlier men-
tioned Tables, these variables had a negative impact on the respective explained variables
(i.e. Trade and Foreign Direct Investment) presented in Tables 8a and b, and 9. In Table
10, the variables behaved differently with regards to their influence on foreign portfolio
investment. At least, the positive signs, displayed by the variables suggest that an increase
in the extent of adult literacy, exchange rate and population will inform an increase in the
volume of foreign portfolio investment.
The significant value of the adult literacy, especially in the columns with OLS and RE
estimations, reveal that when neglecting the consideration of endogeneity and reverse cau-
sality, the impact of the variable was positive in informing foreign portfolio investment. In
essence, the more literate the adult population in the country, the more the foreign portfolio
investors flow into the country. Perhaps, this behaviour can be traced to the demand of
portfolio investors for professionals and literate population to be able to work with them
for investment and advisory purposes. Therefore, the more these category of the population
in a country, the belter the portfolio investor’s requirement for highly educated adult work-
force will be sorted out. This finding is not applicable when computing estimation tech-
niques that considers reverse causality and issues regarding to endogeneity.
The variable-population, was also displaying a positive impact on foreign portfolio invest-
ment. The exchange rate was not consistent in its impact on foreign portfolio investment.
The impact of accounting infrastructure on foreign portfolio investment was positive and
significant in most of the columns. As earlier discussed for adult literacy, the accounting
infrastructure (a measure of the strength of the professional association) is able to provide
professional personnel. On the contrary, the IFAC variable (which measures the country’s
IFAC membership) was negatively informing foreign portfolio investment. All the
measures of institution had a positive impact on the volume of foreign portfolio investment.

157
Table 10: Regression Analysis (Explained Variable-Foreign Portfolio Investment; Using IFRS as a Count Variable) OLS RE SGMM OLS RE SGMM OLS RE SGMM OLS RE SGMM
IFRS Adoption -0.003 (0.468)
-0.001***(0.060)
-0.001 (0.134)
-0.002 (0.963)
-0.005***(0.098)
-0.001* (0.008)
0.007 (0.842)
-0.004 (0.185)
-0.001*(0.021)
-0.006 (0.876)
-0.004 (0.142)
-0.001*(0.001)
Adult Literacy 0.002* (0.000)
0.002* (0.010)
-0.004 (0.839)
0.002**(0.016)
0.002** (0.038)
0.002 (0.171)
0.001** (0.048)
0.001* (0.008)
-0.001 (0.132)
0.002**(0.017)
0.002* (0.033)
-0.002 (0.148)
Exchange Rate 0.009
(0.825) 0.111
(0.309) -0.001 (0.813)
0.008 (0.862)
0.001 (0.981)
0.001*** (0.060)
0.002 (0.673)
0.002 (0.726)
0.001* (0.000)
-0.002 (0.674)
-0.001 (0.809)
0.002 (0.637)
Population 0.007* (0.000)
0.006* (0.000)
0.009* (0.000)
0.004* (0.000)
0.003** (0.023)
0.009* (0.000)
0.004* (0.002)
0.003** (0.018)
0.012* (0.000)
0.004* (0.000)
0.003** (0.014)
0.011* (0.000)
Natural resource -0.001 (0.733)
-0.002 (0.647)
-0.004 (0.408)
0.002 (0.663)
0.006 (0.976)
0.001 (0.114)
0.001 (0.797)
0.001 (0.688)
0.001* (0.001)
-0.008 (0.827)
-0.004 (0.913)
0.002 (0.587)
Accounting Infrastructure 0.009** (0.038)
0.008*** (0.089) ---
0.007 (0.128)
0.006 (0.238) ---
0.007***(0.100)
0.007 (0.146) ---
0.006 (0.124)
0.006 (0.198) ---
IFAC Member -0.006**(0.034)
-0.005***(0.091)
0.008 (0.344)
-0.005*(0.003)
-0.004 (0.275)
-0.007*** (0.071)
-0.007** (0.016)
-0.006***(0.070)
-0.011*(0.005)
-0.008*(0.010)
-0.006***(0.076)
-0.003 (0.534)
Political Stability 0.007* (0.000)
0.006* (0.001)
0.009* (0.002) --- --- --- --- --- --- --- --- ---
Control of Corruption --- --- --- 0.008* (0.000)
0.005** (0.015)
0.015* (0.000) --- --- --- --- --- ---
Government Effectiveness --- --- --- --- --- --- 0.009* (0.001)
0.009* (0.001)
0.024* (0.000) --- --- ---
Regulatory Quality --- --- --- --- --- --- --- --- --- 0.011* (0.000)
0.008 (0.005)
0.034 (0.000)
FPI (-1) --- --- 0.105
(0.763) --- --- 0.068
(0.755) --- --- 0.067
(0.688) --- --- 0.002
(0.993)
Constant -0.152* (0.000)
-0.129* (0.000)
-186.095(0.111)
-0.099*(0.000)
-0.077* (0.006)
-0.204* (0.000)
-0.096* (0.000)
-0.084* (0.001)
-0.271*(0.000)
-0.104*(0.000)
-0.085 (0.002)
-0.278 (0.000)
R Squared 0.531 0.509 --- 0.464 0.419 --- 0.500 0.4645 --- 0.53 0.5011 ---
F-Stat/Wald Statistics 5.240
(0.000) 21.690 (0.006) ---
4.010 (0.002)
14.070 (0.080) ---
4.620 (0.000)
19.850 (0.011) ---
5.210 (0.000)
17.410 (0.021) ---
Breusch Pagan 0.000 --- --- 0.000 --- --- 0.000 --- --- 0.000 ---
Hausman Test --- 10.290 (0.113) --- ---
6.410 (0.379) --- ---
9.190 (0.197) --- ---
15.180 (0.189) ---
AR(2) --- --- 0.518 --- --- 0.533 --- --- 0.463 --- --- 0.342 Number of Countries --- --- 46 --- --- 46 --- --- 46 --- --- 46 Number of Instruments --- --- 28 --- --- 28 --- --- 28 --- --- 28 Instrument ratio --- --- 1.64 --- --- 1.64 --- --- 1.64 --- --- 1.64
Note: The values in parenthesis are the probability values of the coefficient. The subscripts *, ** and *** imply the significant values at 1, 5 and 10 percent. Exchange rate, population and the measure for natural resources were presented in their null form

158
Considering the Interaction between IFRS adoption and Accounting Infrastructure
The interaction variable was considered, where the variable IFRS adoption was multiplied
with the measures of accounting infrastructure (particularly how long the accounting body
in the country has been in existence and being an IFAC member). The main aim of this
exercise is to find out the indirect effect caused by accounting infrastructure in defining the
relationship between IFRS adoption and the explained variables. Put differently, the effect
of accounting infrastructure in explaining the relationship between IFRS adoption and
trade, FDI and FPI, was examined. In essence, if there is a positive relationship, it is as-
sumed that IFRS will be beneficial to trade, FDI and FPI when the accounting infrastructure
within the country is properly developed. A negative relationship will imply that account-
ing infrastructure has a substitutive effect on IFRS adoption in explaining trade, FDI and
FPI.
The first analysis under this subsection is the consideration of the effect of the interaction
variable on our first explained variable “trade as a percentage of GDP”. The coefficient of
this variable is presented in Table 11as “Accounting Infrastructure × IFRS Adoption”. This
multiplicative term stems from multiplying the number of years the professional account-
ing body in a country has been in existence with the IFRS adoption variable. It is only the
indirect effect that was considered in this analysis. Since in the other Tables, the direct
effect has already been considered and it is established that IFRS adoption has a positive
effect on trade and FDI. The indirect effect only considers the intervening role of account-
ing infrastructure in the effect of IFRS adoption on the explained variables.
Some of the variables like IFRS adoption, accounting association and IFAC membership
were excluded from the analysis, marked by the sign “---“. The reason being that, as earlier
discussed, these variables will show the direct effect of the variables on the explained var-
iable “trade as a percentage of GDP”. Since the indirect effect is being examined, then
including them in the models estimated will bring about high collinearity between the var-
iables and the interactive terms. The danger in this is that the real indirect effect of the
interactive variable on the explained variable will not be visible due to interferences from
159
the other explanatory variables (IFRS adoption, accounting association and IFAC mem-
bership). Similar approach will be applied for the other models that contains FDI and FPI
as the explained variable.
From the Table, the interactive variable signifying the indirect effect of accounting infra-
structure on the relationship between IFRS adoption and trade, reveals that a country that
has adopted IFRS will benefit from trade outcomes, when the accounting infrastructure in
the country is developed. The positive effect of this variable (Accounting Infrastructure ×
IFRS Adoption) across the columns and the different estimation approaches, suggest that
consistently, a country that adopts IFRS should also endeavour to develop its accounting
infrastructure in order to benefit from the adoption of IFRS.
In essence, accounting infrastructure can play a complimenting role to IFRS adoption in
forming trade flow into the adopting country. When countries adopt IFRS, then there
should be striving towards the development of their accounting infrastructure: this include
the increase in the number of professional accountants of the recognised professional as-
sociation within the country. The positive sign connote that when a country adopts the
IFRS, an increase in the number of professional accountants in the country (synonymous
with an increase in the number of years of existence of the accounting body), then the
outcome effect on trade will definitely be on the positive.
Comparing the row that presents the coefficients of the IFRS adoption variable in Table 8a
and the row that presents the coefficients of the interactive term (Accounting Infrastructure
× IFRS Adoption) in Table 11, some interesting findings can be observed. From the Table
8a, the IFRS adoption variable had a significant impact of between 1.605 and 1.823 across
the columns: when considering the interactive variable, when accounting infrastructure is
brought to fore, the coefficient of the influence of IFRS adoption on trade increased dras-
tically across the columns. For instance, in the first two columns of the both Tables, the
influence of IFRS adoption on trade increased from 1.790 to 2.126 and 2.220 when con-
sidering the development of accounting infrastructure. Simply put, a country will benefit
much more from trade when adopting IFRS as well as experiences a development of the
domestic accounting infrastructure.

160
Wysocki (2011) presents a simple analogy that elaborates on the complimentary relation-
ship that exist between accounting infrastructure and IFRS adoption in informing trade
flow between countries. The author noted that the transaction cost existing between eco-
nomic agents can be drastically reduced: this is because trade between and within firms
and other contracting parties will be costly if it is difficult to efficiently verify the properties
of what is being exchanged (such as the goods, capital and labour) and as well, the diffi-
culty will extend if there are problems in enforcing the terms of exchange. This becomes
even imperative noting that accounting standards and guidelines are mechanisms that , if
in place, can help lower transaction cost, reduce information asymmetry and cost of ac-
cessing such information, lower cost of coordinating the information and even improve the
enforceability of property rights.
Furthermore, viewing accounting from an institutional perspective highlights its emer-
gence from an endogenously arranged instrument within an economic system, such that its
form, efficiency and the quality of the existent system is influenced by man-made factors
that enhance the supply of and demand for financial information, among others (Wysocki,
2011). This can be viewed from the existence of a professional accounting body within the
country that can enhance the rate of supply of professionals that can bring about quality
financial reporting system. This explains the reason for the sporadic increase in the rate of
influence of the adoption of IFRS on trade, when considering the intervening role of ac-
counting infrastructure.

161
Table 11: Regression Analysis (Explained Variable-Trade as % of GDP and Including the Interactive Variable)
OLS RE SGMM OLS RE SGMM OLS RE SGMM OLS RE SGMM IFRS Adoption --- --- --- --- --- --- --- --- --- --- --- ---
Adult Literacy -0.262* (0.000)
-0.199 (0.295)
-0.146 (0.198)
-0.241 (0.117)
-0.189 (0.306)
-0.138 (0.218)
-0.235 (0.150)
-0.146 (0.442)
-0.117 (0.458)
-0.185 (0.232)
-0.147 (0.416)
0.060 (0.656)
exchange rate -4.990* (0.000)
-4.742* (0.001)
-3.148* (0.000)
-4.820* (0.000)
-4.970* (0.000)
-3.914* (0.000)
-4.781* (0.000)
-5.297* (0.000)
-3.491* (0.000)
-5.106* (0.000)
-5.388* (0.000)
-3.860* (0.000)
Population -17.096* (0.000)
-15.743* (0.000)
-7.123** (0.043)
-15.848* (0.000)
-15.815* (0.000)
-10.764* (0.0000
-15.634* (0.000)
-15.434* (0.000)
-9.223* (0.006)
-16.125* (0.000)
-15.974* (0.000)
-14.886* (0.000)
Natural resource 3.056* (0.001)
2.263* (0.009)
2.153* (0.002)
3.031* (0.002)
2.115** (0.018)
2.070* (0.003)
3.070* (0.002)
2.030** (0.024)
2.113* (0.005)
2.955* (0.001)
2.108** (0.013)
2.128* (0.001)
Accounting Infrastructure --- --- --- --- --- --- --- --- --- --- --- --- IFAC Membership --- --- --- --- --- --- --- --- --- --- --- --- Accounting Infrastruc-ture×IFRS Adoption
2.126* (0.019)
2.220* (0.004)
0.891 (0.171)
2.089** (0.022)
2.263* (0.003)
1.215*** (0.054)
2.054** (0.023)
2.148* (0.005)
1.053*** (0.090)
2.087** (0.018)
2.271* (0.002)
1.749* (0.007)
Political Stability -3.294 (0.456)
-0.993 (0.842)
2.059 (0.556) --- --- --- --- --- --- --- --- ---
Control of Corruption --- --- --- -1.690 (0.767)
-3.352 (0.551)
-6.642 (0.191) --- --- --- --- --- ---
Government Effectiveness --- --- --- --- --- --- -1.203 (0.843)
-6.654 (0.363)
-1.925 (0.799) --- --- ---
Regulatory Quality --- --- --- --- --- --- --- --- --- -9.032 (0.132)
-11.544*** (0.100)
-18.720* (0.010)
Trade as % of GDP (-1) --- --- 0.319** (0.025) --- ---
0.279** (0.043) --- ---
0.299** (0.033) --- ---
0.227*** (0.098)
Constant 395.031* (0.000)
360.160* (0.000)
178.417** (0.017)
367.096* (0.000)
368.865* (0.000)
272.083* (0.000)
361.545* (0.000)
371.525* (0.000)
227.389* (0.003)
392.748* (0.000)
396.322* (0.000)
372.856* (0.000)
R_Squared 0.641 0.6304 --- 0.637 0.628 --- 0.6371 0.6218 --- 0.6546 0.6445 ---
F-Stat/Wald Statistics 13.410 (0.000)
49.910 (0.000) ---
13.190 (0.000)
49.960 (0.000) ---
13.160 (0.000)
51.630 (0.000) ---
14.210 (0.000)
56.160 (0.000) ---
Breusch Pagan 0.258 --- --- --- --- --- 0.231 --- --- 0.097 --- ---
Hausman Test --- 3.120
(0.794) --- --- 3.130
(0.793) --- --- 2.690
(0.847) --- --- 2.620
(0.854) --- AR(2) --- --- 0.756 --- --- 0.426 --- --- 0.730 --- --- 0.950 Number of Countries --- --- 46 --- --- 46 --- --- 46 --- --- 46 Number of Instruments --- --- 33 --- --- 33 --- --- 33 --- --- 33 Instrument Ratio --- --- 1.394 --- --- 1.394 --- --- 1.394 --- --- 1.394 Note: The values in parenthesis are the probability values of the coefficient. The subscripts *, ** and *** imply the significant values at 1, 5 and 10 percent. Exchange rate, popula-
tion and the measure for natural resources were presented in their null form
162
Following status quo, the preliminary analysis to check the substance of the estimations was ex-
amined. These preliminary analysis include the test of heteroscedasticity, the Hausman test and
the AR (2) and instrument ration, to ensure that the regression estimates are not spurious and can
be relied upon for inference sake. The probability value of the F-statistics and the Wald test was
also examined. Speaking of the probability value of the Wald statistics for the OLS and RE test,
the results from Table 12shows that the OLS and RE tests will likely be misleading because the
statistics were not significant in any of the columns. Consistently, it can be said that the estimates
in the Table does not efficiently describe the relationship between the variables based on the fact
that the F-Statistics and the Wald statistics were not significant in all the columns.
As a fallout, the SGMM technique will be relied on for understanding the behaviour of the inter-
active variable in the model presented in Table 12. The AR (2) preliminary test for the SGMM
estimation technique reveals that the internal instrument generated to efficiently estimate the
SGMM technique was not proliferated and the results from this analysis can be relied upon. For
instance, the rule of thumb is that the probability value of the AR(2) test should be above 0.05
significant level and the instrument ratio should be above “1.000” (Roodman, 2007). Therefore,
since all the indices satisfy the criterions for establishing the efficiency of the results from the
SGMM estimations, then the analysis in this section will only be considering the estimates that
was presented in Table 12.
From the Table, the interaction variable (i.e. multiplicative between IFRS adoption and accounting
infrastructure) reveals that there exist a positive relationship between the adoption of IFRS and
foreign direct investment flow, when considering the extent of the development of the accounting
infrastructure in the given country. The SGMM results in all the columns of Table 12, shows that
the indirect influence of accounting infrastructure on the relationship between IFRS adoption and
the flow of foreign direct investment into the adopting country, ranges from 29 percent to 31.4
percent. Putting this in context, the implication of this result is that a country will have between
29 to 31 percent expectation of an improved flow of foreign direct investment after adopting the
IFRS, only if the level of accounting infrastructure is developed within the country.

163
The development of the accounting infrastructure within a country’s economic system is a form of
institutional setting to enforce and drive property right protection and ensure development of reg-
ulations that protect security of capital and investment (Wysocki, 2011), then accounting infra-
structure is an important sub-set of the information environment of a country. Noting this, some
findings that examines international differences in the cost of equity capital across countries, con-
cludes that countries having more expansive disclosure requirement, better security regulations
and stricter enforcement mechanisms are generally prone to lower cost of capital. The tendency
of this attracting an increased presence of foreign investment is enormous because foreign inves-
tors are driven by maximising their profit and minimising their cost. Perhaps, when countries adopt
IFRS and their accounting infrastructure is developed, the cost of information access and coordi-
nation reduces due to available regulations to guide the preparation (IFRS) and as well, available
institutional setting (in the light of existence of professional accounting bodies) to regulate and
provide the resources for the preparation of the financial statement.
Some other studies for which inference was drawn in understanding the intervening role of ac-
counting infrastructure in the relationship between the adoption of IFRS and FDI include Chen et
al (2014), who find that both country-level investor protection and higher disclosure and systems
that enhance corporate governance ratings contribute to a lower cost of equity capital for firms in
the Asian economic system. Focusing on emerging countries, Chen et al (2014) also noted that
strengthening country’s corporate governance, among others, is a veritable strategy for reducing
the cost of equity capital than does only the expansion of disclosure by firms. In essence, the
adoption of the IFRS may not be sufficient in enhancing corporate governance that can attract
foreign capital: this implies that there should be a co-existence of accounting infrastructure that
can play a supportive role to the adoption of IFRS in furthering the inflow of foreign investment
into the IFRS adopting country.
The other explanatory variables follow consistent signs across the different columns in Table
12.Theirlevels of significance was not verifiable across the columns. In essence, some of the var-
iables were significant in some columns and in other columns, these significant values were no
longer in existence.
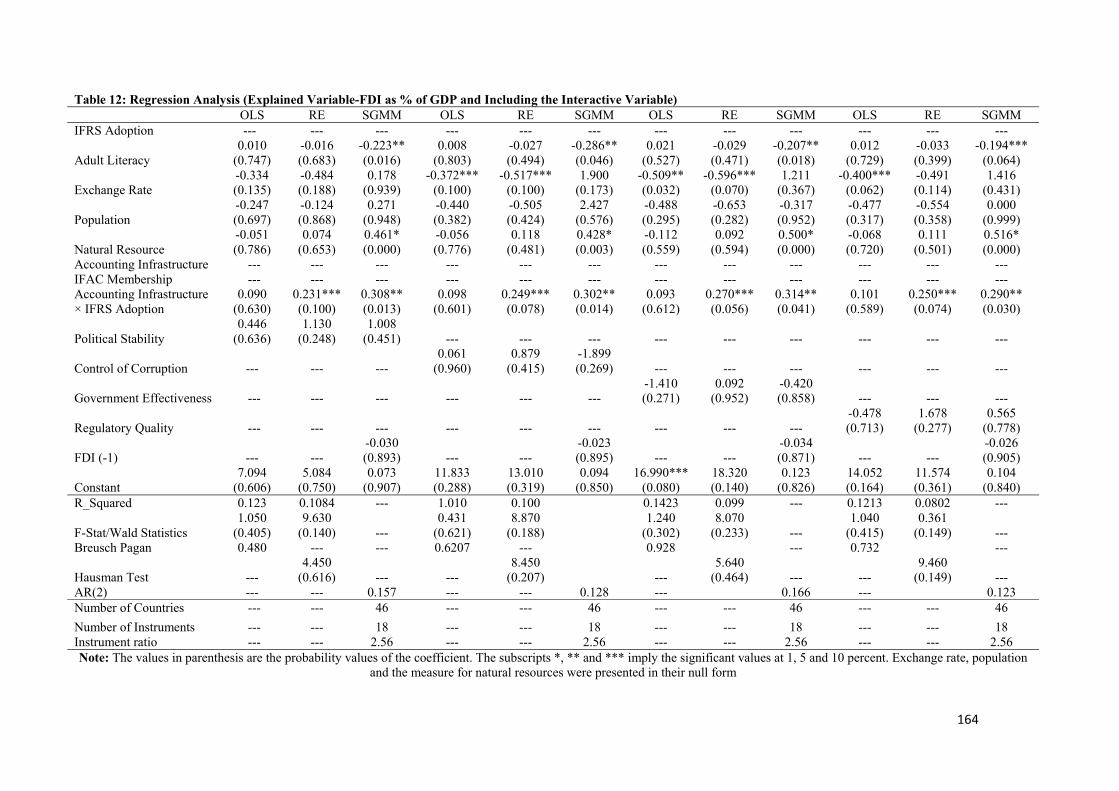
164
Table 12: Regression Analysis (Explained Variable-FDI as % of GDP and Including the Interactive Variable) OLS RE SGMM OLS RE SGMM OLS RE SGMM OLS RE SGMM IFRS Adoption --- --- --- --- --- --- --- --- --- --- --- ---
Adult Literacy 0.010
(0.747) -0.016 (0.683)
-0.223** (0.016)
0.008 (0.803)
-0.027 (0.494)
-0.286** (0.046)
0.021 (0.527)
-0.029 (0.471)
-0.207** (0.018)
0.012 (0.729)
-0.033 (0.399)
-0.194*** (0.064)
Exchange Rate -0.334 (0.135)
-0.484 (0.188)
0.178 (0.939)
-0.372*** (0.100)
-0.517*** (0.100)
1.900 (0.173)
-0.509** (0.032)
-0.596*** (0.070)
1.211 (0.367)
-0.400*** (0.062)
-0.491 (0.114)
1.416 (0.431)
Population -0.247 (0.697)
-0.124 (0.868)
0.271 (0.948)
-0.440 (0.382)
-0.505 (0.424)
2.427 (0.576)
-0.488 (0.295)
-0.653 (0.282)
-0.317 (0.952)
-0.477 (0.317)
-0.554 (0.358)
0.000 (0.999)
Natural Resource -0.051 (0.786)
0.074 (0.653)
0.461* (0.000)
-0.056 (0.776)
0.118 (0.481)
0.428* (0.003)
-0.112 (0.559)
0.092 (0.594)
0.500* (0.000)
-0.068 (0.720)
0.111 (0.501)
0.516* (0.000)
Accounting Infrastructure --- --- --- --- --- --- --- --- --- --- --- --- IFAC Membership --- --- --- --- --- --- --- --- --- --- --- --- Accounting Infrastructure × IFRS Adoption
0.090 (0.630)
0.231*** (0.100)
0.308** (0.013)
0.098 (0.601)
0.249*** (0.078)
0.302** (0.014)
0.093 (0.612)
0.270*** (0.056)
0.314** (0.041)
0.101 (0.589)
0.250*** (0.074)
0.290** (0.030)
Political Stability0.446
(0.636) 1.130
(0.248)1.008
(0.451) --- --- --- --- --- --- --- --- ---
Control of Corruption --- --- --- 0.061
(0.960) 0.879
(0.415) -1.899 (0.269) --- --- --- --- --- ---
Government Effectiveness --- --- --- --- --- --- -1.410 (0.271)
0.092 (0.952)
-0.420 (0.858) --- --- ---
Regulatory Quality --- --- --- --- --- --- --- --- --- -0.478 (0.713)
1.678 (0.277)
0.565 (0.778)
FDI (-1) --- --- -0.030 (0.893) --- ---
-0.023 (0.895) --- ---
-0.034 (0.871) --- ---
-0.026 (0.905)
Constant 7.094
(0.606) 5.084
(0.750) 0.073
(0.907) 11.833 (0.288)
13.010 (0.319)
0.094 (0.850)
16.990*** (0.080)
18.320 (0.140)
0.123 (0.826)
14.052 (0.164)
11.574 (0.361)
0.104 (0.840)
R_Squared 0.123 0.1084 --- 1.010 0.100 0.1423 0.099 --- 0.1213 0.0802 ---
F-Stat/Wald Statistics 1.050
(0.405) 9.630
(0.140) --- 0.431
(0.621) 8.870
(0.188) 1.240
(0.302) 8.070
(0.233) --- 1.040
(0.415) 0.361
(0.149) --- Breusch Pagan 0.480 --- --- 0.6207 --- 0.928 --- 0.732 ---
Hausman Test --- 4.450
(0.616) --- --- 8.450
(0.207) --- 5.640
(0.464) --- --- 9.460
(0.149) --- AR(2) --- --- 0.157 --- --- 0.128 --- 0.166 --- 0.123 Number of Countries --- --- 46 --- --- 46 --- --- 46 --- --- 46
Number of Instruments --- --- 18 --- --- 18 --- --- 18 --- --- 18 Instrument ratio --- --- 2.56 --- --- 2.56 --- --- 2.56 --- --- 2.56 Note: The values in parenthesis are the probability values of the coefficient. The subscripts *, ** and *** imply the significant values at 1, 5 and 10 percent. Exchange rate, population
and the measure for natural resources were presented in their null form

165
Table 13 presents the regressions analysis when considering foreign portfolio investment
as the main explained variable. The preliminary analysis suggest that the OLS suffers from
the problem of heteroscedasticity, which imply that the estimates from the OLS result may
not be reliable. The probability value of the Breusch Pagan test clearly shows this fact as
the null hypothesis of constant variance is rejected at 1 percent level of significance. This
leaves us with the option of depending on the RE and SGMM for the result interpretations.
Focusing on the interactive variable of interest – that is the multiplicative between the IFRS
adoption variable and the indicator of accounting infrastructure – the RE technique was not
sufficient in explaining the behaviour of this variable. From the Table 4.10, the random
effect estimation technique only reveals one column where the variable was significant.
However, in all the column where this variable was significant, it displayed a consistent
negative sign and thus suggest that when a country adopts IFRS, the impact on foreign
portfolio investment will be negative if the accounting infrastructure in the country is de-
veloped. Put differently, IFRS adoption and accounting infrastructure are substitutive in
affecting the flow of foreign portfolio investment into the adopting country. This result was
valid for the SGMM estimation technique’s column in the Table 4.7. The AR (2) test and
the instrument ratio validates the efficiency of the results that were presented in the SGMM
estimations.
This result is not too surprising as in the earlier Tables when foreign portfolio investment
was presented as the main explained variable (see Table4.7), the IFRS adoption variable
presents a negative impact on the level of foreign portfolio investment flow to the country.
Probably, this impact could not be covered up with the level of the development of ac-
counting infrastructure. Thus suggesting that irrespective of the development of the ac-
counting profession within the IFRS adopting country, the impact of the adoption of IFRS
still remains negative for the foreign portfolio investment.
Focusing on the other explanatory variables, they follow similar sign and somewhat sig-
nificant values as displayed in the previous Tables. The inclusion of the interaction variable
was not sufficient in changing the behaviours of the other variables, atleast to a large extent.
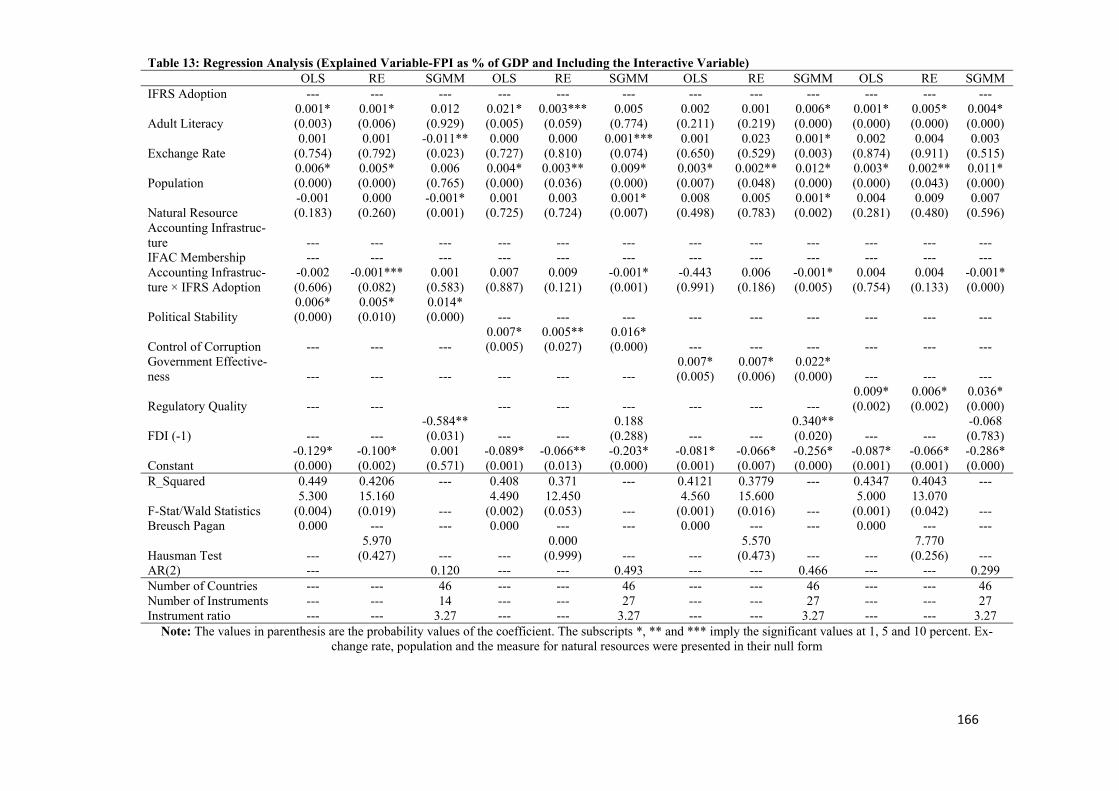
166
Table 13: Regression Analysis (Explained Variable-FPI as % of GDP and Including the Interactive Variable) OLS RE SGMM OLS RE SGMM OLS RE SGMM OLS RE SGMM IFRS Adoption --- --- --- --- --- --- --- --- --- --- --- ---
Adult Literacy 0.001* (0.003)
0.001* (0.006)
0.012 (0.929)
0.021* (0.005)
0.003*** (0.059)
0.005 (0.774)
0.002 (0.211)
0.001 (0.219)
0.006* (0.000)
0.001* (0.000)
0.005* (0.000)
0.004* (0.000)
Exchange Rate 0.001
(0.754) 0.001
(0.792) -0.011** (0.023)
0.000 (0.727)
0.000 (0.810)
0.001*** (0.074)
0.001 (0.650)
0.023 (0.529)
0.001* (0.003)
0.002 (0.874)
0.004 (0.911)
0.003 (0.515)
Population 0.006* (0.000)
0.005* (0.000)
0.006 (0.765)
0.004* (0.000)
0.003** (0.036)
0.009* (0.000)
0.003* (0.007)
0.002** (0.048)
0.012* (0.000)
0.003* (0.000)
0.002** (0.043)
0.011* (0.000)
Natural Resource -0.001 (0.183)
0.000 (0.260)
-0.001* (0.001)
0.001 (0.725)
0.003 (0.724)
0.001* (0.007)
0.008 (0.498)
0.005 (0.783)
0.001* (0.002)
0.004 (0.281)
0.009 (0.480)
0.007 (0.596)
Accounting Infrastruc-ture --- --- --- --- --- --- --- --- --- --- --- --- IFAC Membership --- --- --- --- --- --- --- --- --- --- --- --- Accounting Infrastruc-ture × IFRS Adoption
-0.002 (0.606)
-0.001*** (0.082)
0.001 (0.583)
0.007 (0.887)
0.009 (0.121)
-0.001* (0.001)
-0.443 (0.991)
0.006 (0.186)
-0.001* (0.005)
0.004 (0.754)
0.004 (0.133)
-0.001* (0.000)
Political Stability 0.006* (0.000)
0.005* (0.010)
0.014* (0.000) --- --- --- --- --- --- --- --- ---
Control of Corruption --- --- --- 0.007* (0.005)
0.005** (0.027)
0.016* (0.000) --- --- --- --- --- ---
Government Effective-ness --- --- --- --- --- ---
0.007* (0.005)
0.007* (0.006)
0.022* (0.000) --- --- ---
Regulatory Quality --- --- --- --- --- --- --- --- 0.009* (0.002)
0.006* (0.002)
0.036* (0.000)
FDI (-1) --- --- -0.584** (0.031) --- ---
0.188 (0.288) --- ---
0.340** (0.020) --- ---
-0.068 (0.783)
Constant -0.129* (0.000)
-0.100* (0.002)
0.001 (0.571)
-0.089* (0.001)
-0.066** (0.013)
-0.203* (0.000)
-0.081* (0.001)
-0.066* (0.007)
-0.256* (0.000)
-0.087* (0.001)
-0.066* (0.001)
-0.286* (0.000)
R_Squared 0.449 0.4206 --- 0.408 0.371 --- 0.4121 0.3779 --- 0.4347 0.4043 ---
F-Stat/Wald Statistics 5.300
(0.004)15.160 (0.019) ---
4.490 (0.002)
12.450 (0.053) ---
4.560 (0.001)
15.600 (0.016) ---
5.000 (0.001)
13.070 (0.042) ---
Breusch Pagan 0.000 --- --- 0.000 --- --- 0.000 --- --- 0.000 --- ---
Hausman Test --- 5.970
(0.427) --- --- 0.000
(0.999) --- --- 5.570
(0.473) --- --- 7.770
(0.256) --- AR(2) --- 0.120 --- --- 0.493 --- --- 0.466 --- --- 0.299 Number of Countries --- --- 46 --- --- 46 --- --- 46 --- --- 46 Number of Instruments --- --- 14 --- --- 27 --- --- 27 --- --- 27 Instrument ratio --- --- 3.27 --- --- 3.27 --- --- 3.27 --- --- 3.27
Note: The values in parenthesis are the probability values of the coefficient. The subscripts *, ** and *** imply the significant values at 1, 5 and 10 percent. Ex-change rate, population and the measure for natural resources were presented in their null form
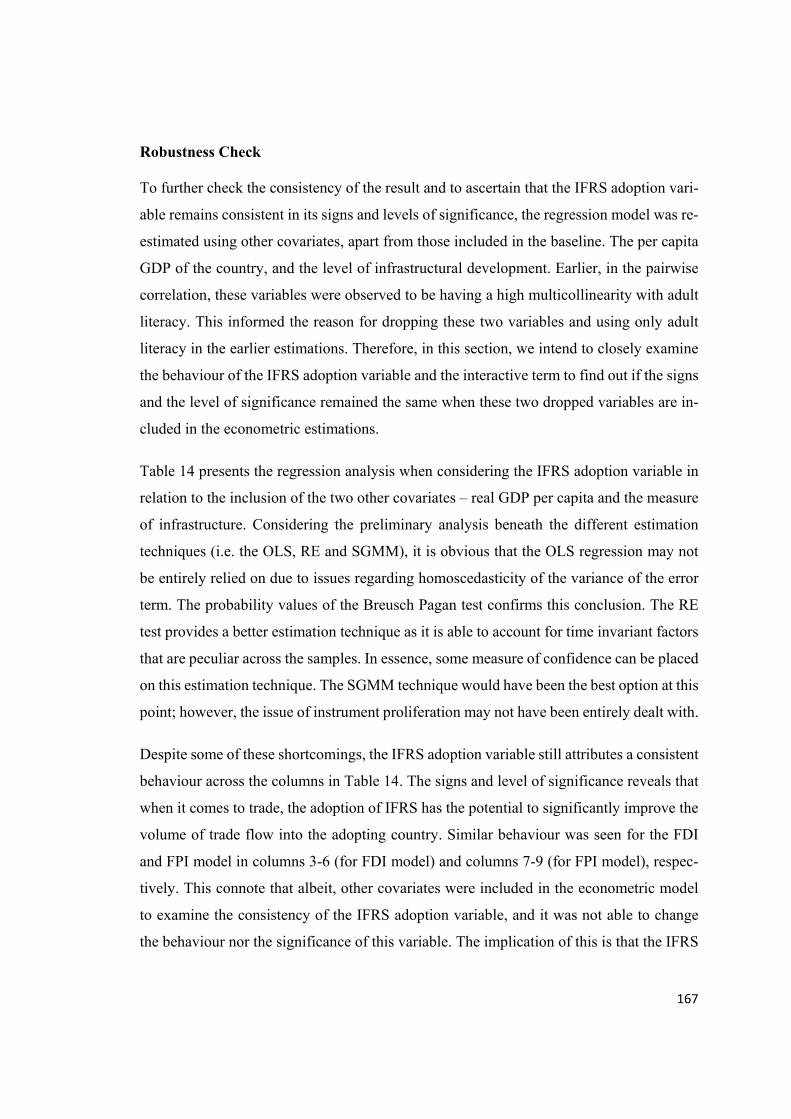
167
Robustness Check
To further check the consistency of the result and to ascertain that the IFRS adoption vari-
able remains consistent in its signs and levels of significance, the regression model was re-
estimated using other covariates, apart from those included in the baseline. The per capita
GDP of the country, and the level of infrastructural development. Earlier, in the pairwise
correlation, these variables were observed to be having a high multicollinearity with adult
literacy. This informed the reason for dropping these two variables and using only adult
literacy in the earlier estimations. Therefore, in this section, we intend to closely examine
the behaviour of the IFRS adoption variable and the interactive term to find out if the signs
and the level of significance remained the same when these two dropped variables are in-
cluded in the econometric estimations.
Table 14 presents the regression analysis when considering the IFRS adoption variable in
relation to the inclusion of the two other covariates – real GDP per capita and the measure
of infrastructure. Considering the preliminary analysis beneath the different estimation
techniques (i.e. the OLS, RE and SGMM), it is obvious that the OLS regression may not
be entirely relied on due to issues regarding homoscedasticity of the variance of the error
term. The probability values of the Breusch Pagan test confirms this conclusion. The RE
test provides a better estimation technique as it is able to account for time invariant factors
that are peculiar across the samples. In essence, some measure of confidence can be placed
on this estimation technique. The SGMM technique would have been the best option at this
point; however, the issue of instrument proliferation may not have been entirely dealt with.
Despite some of these shortcomings, the IFRS adoption variable still attributes a consistent
behaviour across the columns in Table 14. The signs and level of significance reveals that
when it comes to trade, the adoption of IFRS has the potential to significantly improve the
volume of trade flow into the adopting country. Similar behaviour was seen for the FDI
and FPI model in columns 3-6 (for FDI model) and columns 7-9 (for FPI model), respec-
tively. This connote that albeit, other covariates were included in the econometric model
to examine the consistency of the IFRS adoption variable, and it was not able to change
the behaviour nor the significance of this variable. The implication of this is that the IFRS

168
adoption variable maintains a positive and significant effect on trade, FDI and FPI, irre-
spective of the inclusion or exclusion of some of the covariates.
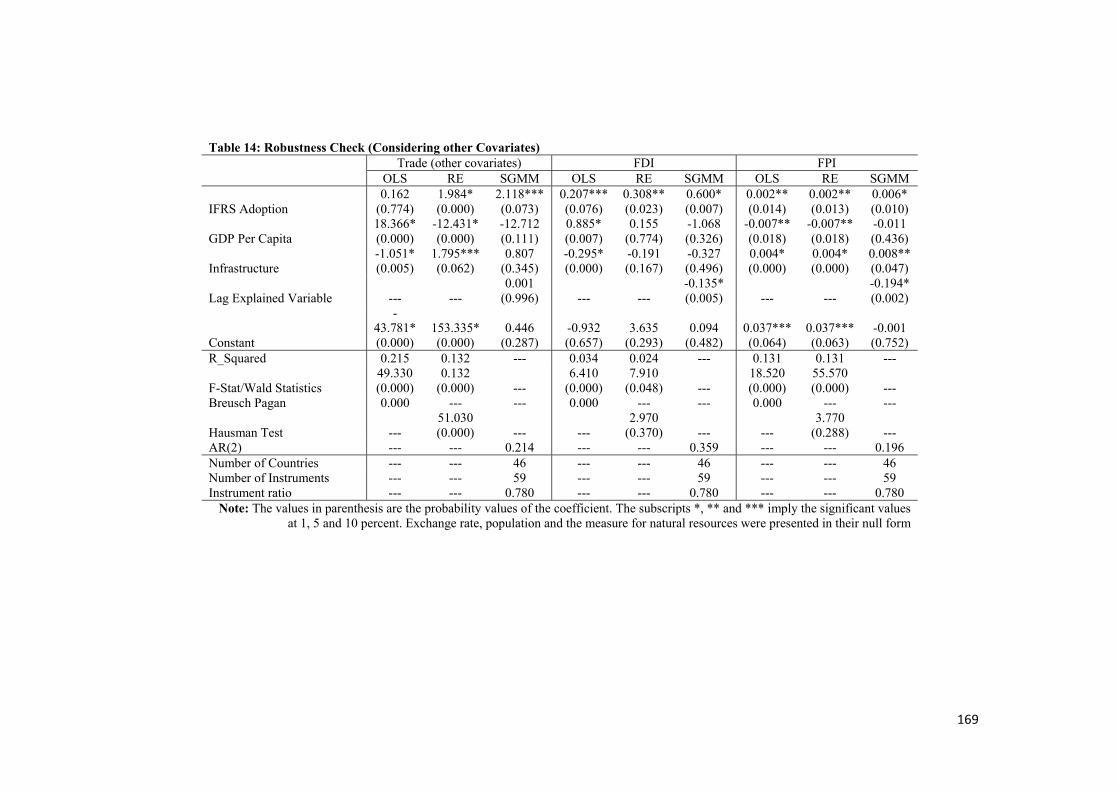
169
Table 14: Robustness Check (Considering other Covariates)Trade (other covariates) FDI FPI
OLS RE SGMM OLS RE SGMM OLS RE SGMM
IFRS Adoption 0.162
(0.774)1.984* (0.000)
2.118*** (0.073)
0.207*** (0.076)
0.308** (0.023)
0.600* (0.007)
0.002** (0.014)
0.002** (0.013)
0.006* (0.010)
GDP Per Capita 18.366* (0.000)
-12.431* (0.000)
-12.712 (0.111)
0.885* (0.007)
0.155 (0.774)
-1.068 (0.326)
-0.007** (0.018)
-0.007** (0.018)
-0.011 (0.436)
Infrastructure -1.051* (0.005)
1.795*** (0.062)
0.807 (0.345)
-0.295* (0.000)
-0.191 (0.167)
-0.327 (0.496)
0.004* (0.000)
0.004* (0.000)
0.008** (0.047)
Lag Explained Variable --- --- 0.001
(0.996) --- --- -0.135* (0.005) --- ---
-0.194* (0.002)
Constant
-43.781* (0.000)
153.335* (0.000)
0.446 (0.287)
-0.932 (0.657)
3.635 (0.293)
0.094 (0.482)
0.037*** (0.064)
0.037*** (0.063)
-0.001 (0.752)
R_Squared 0.215 0.132 --- 0.034 0.024 --- 0.131 0.131 ---
F-Stat/Wald Statistics 49.330 (0.000)
0.132 (0.000) ---
6.410 (0.000)
7.910 (0.048) ---
18.520 (0.000)
55.570 (0.000) ---
Breusch Pagan 0.000 --- --- 0.000 --- --- 0.000 --- ---
Hausman Test --- 51.030 (0.000) --- ---
2.970 (0.370) --- ---
3.770 (0.288) ---
AR(2) --- --- 0.214 --- --- 0.359 --- --- 0.196 Number of Countries --- --- 46 --- --- 46 --- --- 46 Number of Instruments --- --- 59 --- --- 59 --- --- 59 Instrument ratio --- --- 0.780 --- --- 0.780 --- --- 0.780
Note: The values in parenthesis are the probability values of the coefficient. The subscripts *, ** and *** imply the significant values at 1, 5 and 10 percent. Exchange rate, population and the measure for natural resources were presented in their null form

170
The interactive variable was further considered in the regression models, where only the
interactive variable (i.e. multiplicative between the IFRS adoption variable and accounting
infrastructure) was included in a single model with the two covariates that were slated to
be included in the regression analysis for robust checks. The results from this estimations
were presented in Table 15.
As earlier noted, a positive behaviour of this variable will suggest that IFRS adoption has
a complimentary effect on the adoption of IFRS in influencing trade, FDI and FPI. This
suggest that a country will benefit from the adoption of IFRS – in terms of trade, FDI and
FPI – if the accounting infrastructure within the country is developed. This was tested as a
robust check, considering the other interactive variables (per capita GDP and measures of
infrastructure): and as expected, the preliminary checks were also carried out to underscore
the efficiency of the estimation techniques. The OLS technique suffers from the problem
of homoscedasticity, which defeats the reliance on the results of this technique. This leaves
us with the random effect and SGMM estimation techniques.
Just like the estimates in the previous section, the SGMM may likely be suffering from
instrument proliferation and this may be troublesome in the data analysis process. Being
this the case, the most important outcome from the Table is that the interactive variable
(the multiplicative of IFRS adoption and accounting infrastructure), revealed a consistent
sign and significant values across the columns. The importance of this behaviour is that the
interactive variable still showed no different behaviour from its outlook in the previous
Tables such as Tables 11-13. In these Tables, the interactive variable was positive and it
significantly affected the other three explained variables.
This also suggest that despite the inclusion of other covariates in the model, the effect of
the interactive variable on trade, foreign direct investment and foreign portfolio investment
still remains the same. The significant values did not vary and it can be concluded that this
variable maintained a consistent assertion that countries that have adopted IFRS will be
able to efficiently improve their trade, FDI and FPI when their accounting infrastructure is
also developed.
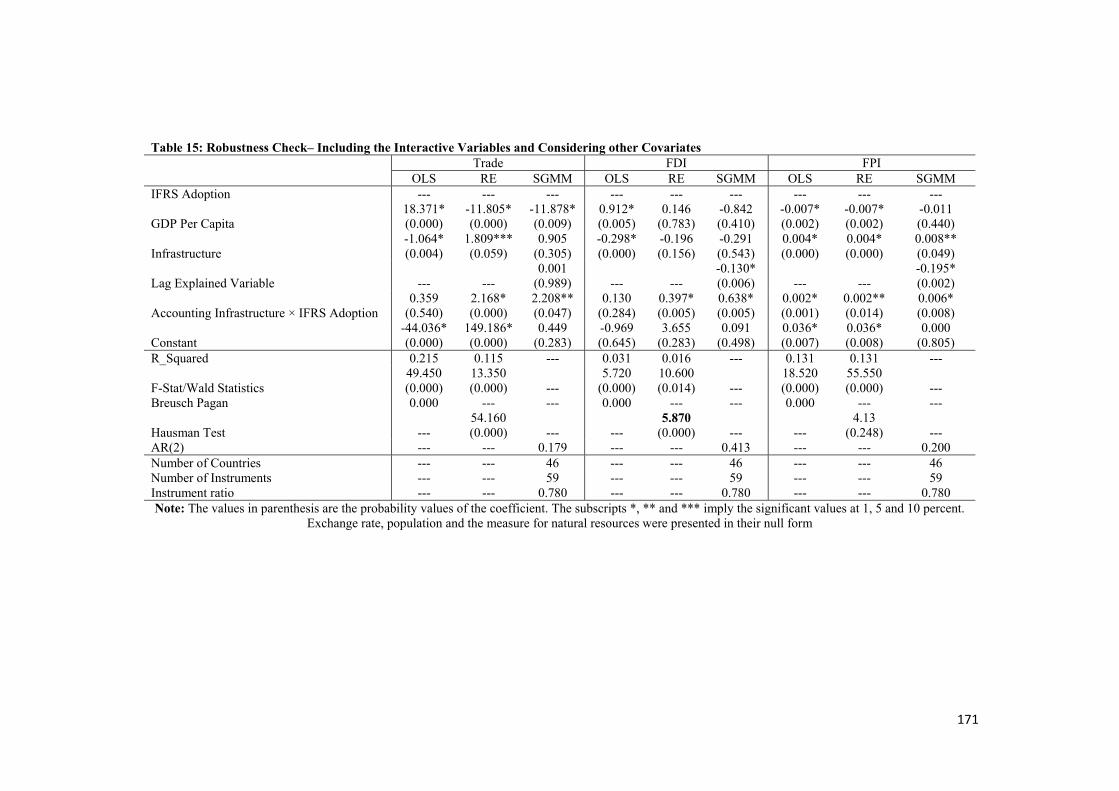
171
Table 15: Robustness Check– Including the Interactive Variables and Considering other Covariates
Trade FDI FPI
OLS RE SGMM OLS RE SGMM OLS RE SGMM IFRS Adoption --- --- --- --- --- --- --- --- ---
GDP Per Capita 18.371* (0.000)
-11.805* (0.000)
-11.878* (0.009)
0.912* (0.005)
0.146 (0.783)
-0.842 (0.410)
-0.007* (0.002)
-0.007* (0.002)
-0.011 (0.440)
Infrastructure -1.064* (0.004)
1.809*** (0.059)
0.905 (0.305)
-0.298* (0.000)
-0.196 (0.156)
-0.291 (0.543)
0.004* (0.000)
0.004* (0.000)
0.008** (0.049)
Lag Explained Variable --- --- 0.001
(0.989) --- --- -0.130* (0.006) --- ---
-0.195* (0.002)
Accounting Infrastructure × IFRS Adoption 0.359
(0.540) 2.168* (0.000)
2.208** (0.047)
0.130 (0.284)
0.397* (0.005)
0.638* (0.005)
0.002* (0.001)
0.002** (0.014)
0.006* (0.008)
Constant -44.036* (0.000)
149.186* (0.000)
0.449 (0.283)
-0.969 (0.645)
3.655 (0.283)
0.091 (0.498)
0.036* (0.007)
0.036* (0.008)
0.000 (0.805)
R_Squared 0.215 0.115 --- 0.031 0.016 --- 0.131 0.131 ---
F-Stat/Wald Statistics 49.450 (0.000)
13.350 (0.000) ---
5.720 (0.000)
10.600 (0.014) ---
18.520 (0.000)
55.550 (0.000) ---
Breusch Pagan 0.000 --- --- 0.000 --- --- 0.000 --- ---
Hausman Test --- 54.160 (0.000) --- ---
5.870 (0.000) --- ---
4.13 (0.248) ---
AR(2) --- --- 0.179 --- --- 0.413 --- --- 0.200 Number of Countries --- --- 46 --- --- 46 --- --- 46 Number of Instruments --- --- 59 --- --- 59 --- --- 59 Instrument ratio --- --- 0.780 --- --- 0.780 --- --- 0.780 Note: The values in parenthesis are the probability values of the coefficient. The subscripts *, ** and *** imply the significant values at 1, 5 and 10 percent.
Exchange rate, population and the measure for natural resources were presented in their null form

172
To summarise the hypothesis that was put forward to be tested in this study, a summary
was presented in Table 16, where the hypothesis and the decisions - based on the analyses
- were presented. From the Table. The first testable hypothesis is that the adoption of IFRS
has not significantly improved the volume of trade flow to the IFRS adopting country in
Africa. Therefore, following the behaviour of this variable in the preceding Tables, the sign
of the IFRS adoption variable suggest that, convincingly, a country that adopts IFRS will
most likely improve their trade volume. This therefore imply that the null hypothesis will
be rejected at varying levels of significance.
The second hypothesis depicts that the adoption of IFRS has not significantly affected the
volume of FDI inflow into the IFRS adopting African. This hypothesis was not sustained
as the coefficient and the significant values of the IFRS variable, in the previous Tables
(Table 9), suggest that a country that has adopted IFRS will more likely be able to attract
foreign direct investment into the country. This imply that the null hypothesis that the
adoption of IFRS has not significantly affected the volume of FDI inflow to African coun-
tries will be rejected at varying levels of significance.
The third hypothesis is such that there is no significant effect of the adoption of IFRS on
the volume of portfolio investment to African countries. This hypothesis is accepted as the
IFRS adoption variable showed that there was a negative effect of the adoption of IFRS on
the volume of foreign portfolio investment (see Table 10). the hypothesis pertaining to the
interactive variables that the level of professional accounting infrastructure in African
countries does not significantly enhance the impact of IFRS adoption on trade, FDI and
FPI, was rejected at the varying levels of significance.
Table 16: Summary of Hypothesis Tested
Hypothesis Description Decision
H01 The adoption of IFRS has not significantly improved the trade inflow of African countries. Reject
H02 The adoption of IFRS has not significantly affected the volume of FDI in-flow to African countries. Reject
H03 There is no significant effect of the adoption of IFRS on the volume of port-folio investment to African countries. Accept
H04
The level of development of professional accounting infrastructure in Afri-can countries does not significantly enhance the impact of IFRS adoption on trade and FDI. Reject
173
CHAPTER FIVE
CONCLUSION AND RECOMMENDATIONS
5.1 INTRODUCTION
This chapter presents a summary of the entire work, a brief discussion of the theoretical
and empirical findings of the research as well as concludes the work by presenting some
recommendations for policy action. The limitations and suggestions for future research was
also included in this section.
5.2 SUMMARY
This research was set out to examine the extent to which the adoption of IFRS has enhanced
trade inflow of selected African countries, determine how the adoption of IFRS has en-
hanced the volume of FDI inflow to selected African countries and examine the extent to
which the level of the accounting infrastructure of the selected African countries can en-
hance the influence of IFRS adoption on trade and FDI. Based on these objectives, litera-
ture that covers issues surrounding IFRS adoption, foreign investment and trade was ex-
amined and the main theoretical framework that underpins this study was the network the-
ory of IFRS adoption. This theoretical underpinning was chosen as a result of its depth in
explaining the reasons why countries, especially in developing region, adopt the IFRS. As
a result, most of the countries adopted the standard owing to the fact that perceived benefit
of adopting the standard and the cost of not adopting it are major influence of their deci-
sions. The network arise as a result of trickle down perceptions and notions that inform
their decisions to adopt the standard. The research method was mainly a quantitative form
of research that controls for the dynamic component of the form of data that was included
in the study. Both graphical and statistical approach was used in presenting the data. The
hypothesis were interpreted based on the coefficient and statistical significance of the var-
iables of interest.

174
5.3 FINDINGS
The findings discussed in this section are in accordance with the research objectives that
have been stated in Chapter one. They include:
I. The adoption of IFRS was found to have a positive impact on the trade flow of our
sampled African countries. However, we found that the extent to which IFRS adop-
tion matters on trade is minimal, especially in relation to the size of the coefficient.
II. The study also found out that IFRS adoption has a stringer impact on the volume
of foreign investment inflow, unlike trade flow. The impact was positive and sig-
nificant in most of the estimated model. The size of the coefficient is higher than
that of trade flow.
III. The accounting infrastructure was found to have a higher impact on foreign invest-
ment flow through IFRS adoption. This unlike its impact on trade. This implies that
countries that adopt IFRS and with an improved accounting infrastructure will have
a high impact on foreign investment flow, unlike trade flow.
5.4 CONCLUSIONS
From the analysis, it is eminent that IFRS adoption has a positive and significant effect on
trade flow in selected African countries. At least, it is evident that an increase in the number
of years that a country has adopted IFRS will result into an improvement in the trade vol-
ume. This can be explained as a country with an improved financial reporting infrastructure
will invariably result to sectorial/industrial development that will enhance trade flow with
other countries. The adoption of IFRS by African countries enhances public accountability
of companies (both small, medium and large), irrespective of the sector that the company
is located in. This finding supports literature on the stance that public accountability is a
state, where an entity meets the conditions of having a high degree of outside interest from
non-management investors or other kinds of stakeholders. Therefore, since the adoption of
IFRS is expected to enhance the extent of public responsibility of the firm, then it is likely
to have a higher effect on the chance of companies in the IFRS adopting country to have
access to capital and the resultant effect is an increase in their output.
175
The result also reveals that the IFRS variable, has a positive and significant impact on the
flow of FDI to the host African country. In essence, as a country adopts the IFRS, there is
a positive effect on the volume of FDI that will likely flow into such a country. The adop-
tion of IFRS is linked with the reduction in the cost of accessing financial information and
the reduction of information asymmetry between preparers and users of financial infor-
mation (Ramos, 2008). The assurance of multinational inflow into the IFRS adopting coun-
try is high because multinational organisations require transparent and comparable ac-
counting standards as a tool for minimising the cost of translating financial information for
better understanding. As a result, multinationals will be induced to increase investments in
countries that have such comparable standards.
Considering another aspect of foreign investment – portfolio investment – the IFRS adop-
tion variable consistently had a negative effect on the volume of foreign portfolio invest-
ment in all the columns. The significant values were verified except for some columns.
This suggest that as countries in Africa adopt IFRS, there tend to be a negative effect on
the volume of portfolio investors that flow into the country. It can therefore be argued that
IFRS adoption does not necessarily promote equity investors in selected African countries.
This argument is premixed on the fact that most portfolio investors depend on the risk
involved in investment and not necessarily the financial information translation in making
their investment decision. Also, most of these investors may not necessarily be involved in
the monitoring of the financial statement of companies they invest in, but will most likely
be studying the trend of the stock market before making investment decisions. It is also
expedient to state that the stock market is based on speculations that comes from the infor-
mation flow that spans beyond the micro entity called the firm. For instance, the recent
global financial crisis witnessed stock market crash of some countries (which simply means
that the portfolio investors were gradually selling up their stock for liquidity) and the values
of shares were dropping symmetrically. The ubiquitous occurrence of this trend was not as
a result of the firm’s financial statement translation, but as a result of some other shocks
that emanated from the macro economy at large.
Considering the interactive term, of our first explained variable “trade as a percentage of
GDP” and “IFRS Adoption” variable suggest that a country that has adopted IFRS will

176
benefit from trade outcomes, when the accounting infrastructure in the country is devel-
oped. This suggest that consistently, a country that adopts IFRS should also endeavour to
develop its accounting infrastructure in order to benefit from the adoption of IFRS. In es-
sence, accounting infrastructure can play a complimenting role to IFRS adoption in form-
ing trade flow into the adopting country. When countries adopt IFRS, then there should be
striving towards the development of their accounting infrastructure such as the increase in
the number of professional accountants of the recognised professional association within
the country. The positive sign connote that when a country adopts the IFRS, an increase in
the number of professional accountants in the country (synonymous with an increase in the
number of years of existence of the accounting body), then the outcome effect on trade will
definitely be on the positive.
The interaction variable (i.e. multiplicative between IFRS adoption and accounting infra-
structure) reveals that there exist a positive relationship between the adoption of IFRS and
foreign direct investment flow, when considering the extent of the development of the ac-
counting infrastructure in the given country. The main explanation here is that foreign in-
vestors are driven by the reduction of the cost of information access and coordination re-
duces due to available regulations to guide the preparation (IFRS) of financial reports.
The underlining explanations for the reasons responsible for the complementary effect of
accounting infrastructure on IFRS adoption in informing the extent of trade inflow and
foreign investment flow is based on: the development of the accounting infrastructure
within a country’s economic system is a form of institutional setting to enforce and drive
property right protection and ensure development of regulations that protect security of
capital and investment (Wysocki, 2011), then accounting infrastructure is an important sub-
set of the information environment of a country.
These results are robust to alternative estimations. First of all, the regression models were
re-estimated using other covariates, apart from those included in the baseline estimation.
For instance, the per capita GDP of the country, and the level of infrastructural develop-
ment were included. Despite these inclusions, the IFRS adoption variable still remained
consistently positive in informing trade and foreign direct investment (FDI). This connote

177
that IFRS is consistently positive and significant in informing trade and FDI in African
countries despite the inclusion of other covariates like GDP per capita and infrastructural
development.
As a further robustness check, the interactive variables were considered in the regression
models where GDP Per capita and infrastructural development indicator were included. In
this model, despite the inclusion of other covariates, the effect of the interactive variable
on trade, foreign direct investment and foreign portfolio investment still remains the same.
The significant values did not vary and it suggest that this variable maintained a consistent
assertion that countries that have adopted IFRS will be able to efficiently improve their
trade, FDI and FPI when their accounting infrastructure is also developed.
5.5 RECOMMENDATIONS
From the analysis of this study, the following recommendations were reached:
1) It is important for African countries to begin to take seriously the transition from their
national accounting standard and guidelines to the use of IFRS. This is because IFRS
adoption improves the information environment of relevant adopting countries.
2) This transition should be embedded on strong development of the relevant accounting
infrastructure. This is based on the fact that accounting infrastructure plays a comple-
mentary role to the idealisation foreign investors rely on the strength of the information
environment that is fostered by the adoption of IFRS. However, the development of
accounting infrastructure is hinged on the fact that professionals that can help in the
realisation of the development of information environment, through IFRS adoption, can
only be realised when the accounting professional associations are developed.
3) There is the need for African countries to give serious consideration to the development
of their institutional framework for them to maximise the benefit from the adoption of
IFRS. The reason being that the adoption of IFRS is not a “magic one” to stimulate the
inflow of FDI into African countries. Although out result shows a positive effect, how-
178
ever, the institutional development like the control of corruption, government effective-
ness and the improvement of regulatory quality will prepare a sustainable foundation
for the inflow of FDI as a result of IFRS adoption.
4) There is the need for professional accounting bodies to focus on the development of
professional accountants to play a complementary role for the adoption of IFRS in at-
tracting foreign investment and promoting trade in the selected African countries. More
importantly, these development come as a result of time and other forms of resources
put in to ensure the development of the professional accounting association in the coun-
try. From the data, this was found to be significant as an increase in the number of years
of existence matters for the attraction of FDI and enhancement of trade flow.
5) Some authors have argued that the transition towards the adoption of IFRS may not be
a suitable move for African countries because of the strength of their institutional envi-
ronment and some even argue that African countries may not have adequate investors’
protection framework. This therefore makes them unsuitable for the use of IFRS. In this
study, we found that with the development of institutional infrastructures in African
countries, then the transition towards IFRS adoption may be beneficial and most appro-
priate for African countries. More so, since the world is tending towards IFRS adoption,
then the issue should not be whether African countries should or should not adopt IFRS,
but for these countries to begin to develop complementary infrastructures to facilitate
the inflow of FDI. Some of these infrastructures include accounting infrastructure and
institutional framework.
5.6 CONTRIBUTION TO KNOWLEDGE
This study has been able to make theoretical and practical contributions to the field of ac-
counting of African countries. This study has contributed to the body of literature in the
area of International Accounting in the African context. To be explicit, the following are
some of the specific areas where this study makes its contributions.
This study has contributed to the body of literature in the area of international accounting
using the African context. This was based on observing the dynamic relationships between
179
the adoption of IFRS and its resultant effect on trade and foreign investment. The issue of
accounting infrastructure was also considered, which is budding in accounting research in
Africa.
This study has empirically revealed the importance of accounting institutions in African
countries by considering the role of professional development in the IFRS, trade and FDI
nexus. The findings from this analysis encourages the development of professional ac-
counting institutions in realising the trade and FDI benefit from the adoption of IFRS.
This study expands the understanding of how trade and foreign direct investment into Af-
rican countries are affected by accounting standards. This is an important dimension that
has not been explored. The study also dissects foreign direct investment into portfolio and
foreign investment, which expands the concept of foreign investment and explains how
accounting standards affects these dimensions differently.
The emphasis on institutional development was also an important contribution as we were
able to emphasise that for African countries to benefit from their transition towards IFRS
adoption, there is the need for them to develop their institutional infrastructure including
the control of corruption and those frameworks that ensures protection of investors’ right
and property.
5.7 LIMITATIONS OF THE STUDY
The generalisation of this study is limited to the period of study from 2003-2012. This
study is also limited to the sampled African countries.
Another limitation of this study is that this study considered only a sample of African coun-
tries. The data were not readily available for all African countries. Based on this, our gen-
eralisation is limited to the behaviour of our main variables conditioned on the sampled
countries.
The measure of accounting infrastructure for this study was specifically focused on the
development of accounting professional body in the country by considering the number of

180
years such an association has been in existence. We did not consider other forms of ac-
counting infrastructure like the number of professional accountant that is present in the
sampled countries.
This study did not divide the trade value into manufacturing trade, agricultural trade or
probably industrial/sectorial volume of trade. The reason being that of unavailability of
data that will allow an in-depth examination of this kind of analysis.
The extent of institutional development that was considered in this study was only limited
to those measures reported in the World Governance Indicators. There are other measures
of data on institutions that could have been applied such as the one reported by the Inter-
national Country Risk Guide (ICRG), Corruption Perception Index and those that directly
measures investors control. However, due to time constraint and the extent of access
opened to users, this form of data were not readily available for this research.
5.8 SUGGESTIONS FOR FURTHER STUDY
From the limitations that were highlighted above, the following are the submissions of this
study on areas that could be considered to further enhance the knowledge in the area of
international accounting and its consequences in African countries. Some other specific
areas include:
1. There is the need to consider other periods with regards to extending the sampled period
beyond 2012. This will bring about a more recent findings in the area of this study.
2. The measure of accounting infrastructure can be expanded from just focusing on the
development of accounting professional body in the country to the number of profes-
sional accountant that is present in the sampled countries. This may be difficult because
of the availability of data. However, if this difficulty can be solved, then it will make an
important filling of knowledge gap in this budding area of enquiry.

181
3. The extent of institutional development can be expanded to consider data in relation to
the International Country Risk Guide (ICRG), Corruption Perception Index and those
that directly measures investors’ control.

182
REFERENCES
Abdulai, D.N., (2007). Attracting Foreign Direct Investment for Growth and Development in sub-Saharan Africa: Policy Options and Strategic Alternatives. African Devel-opment XXXII (2): 1-27.
Accounting Principles Board-APB (1970), APB Statement No. 4: Basic Concepts and Prin-ciples Underlying Financial Statements of Business Enterprises. New York: American Institute of Certified Public Accountant-AICPA.
Acemoglu, D., Johnson, S., and Robinson, J. (2001). The colonial origin of comparative development: An empirical investigation. American Economic Review, 91 (5),
Adeyemo, K., (2013). A Perception Based Analysis of the Mandatory Adoption of Inter-national Financial Reporting Standards (IFRS) in Nigeria, Journal of Emerging trends in Economics and Management Sciences (JETEM), 4(2): 203-210.
Agosin, M., and Mayer, R., (2000). Foreign Investment in Developing Countries: Does it Crowd in Domestic Investment? UNCTAD Discussion Paper, No. 146. Geneva: UNCTAD
Alberto B., Margarita B., and Fernando, L., (2013). Perceived performance effects of ICT in manufacturing SMEs, Industrial Management and Data Systems, 113(1): 117 – 135
American Institute of Accountants, Committee on Terminology (1953) Accounting Termi-nology Bulletin No. 1. New York: American Institute of Accountants.
American Institute of Certified Public Accountants (AICPA) (1973) (True-blood Report) Objectives of Financial Statements, Report of the Accounting Objectives Study Group. New York: AICPA.
Amiram, D. (2009), Financial Information Globalization and Foreign Investment Deci-sions, Retrieved from http://ssrn.com/abstract=1446522.
Anyanwu, J. C. (2014). Does Intra-African Trade Reduce Youth Unemployment In Africa? Working Paper Series N° 201, African Development Bank, Tunis, Tunisia.
Anyanwu, J.C., (2012), Why Does Foreign Direct Investment Go Where It Goes? New Evidence from African Countries, Annals of Economics and Finance, 13(2): 425-462.
Arnold, D. G., Audi, R., and Zwolinski, M. (2010).Recent Work in Ethical Theory and its Implications for Business Ethics. Business Ethics Quarterly, 20, 559–581.
Arrelano, M. and Bond, S. 1991. ‘Some Tests of Specification for Panel Data: Monte Carlo Evidence and an Application for Employment Equations’. Review of Economic Studies, 58 (2): 277-297.
183
Ashcroft, P., Chevis, G., and Smith, L.M., (2008). Faculty Perspectives on International Accounting Topics. Advances in International Accounting, 21: 21-45.
Asiedu, E. (2006). Foreign Direct Investment in Africa: The Role of Natural Resources, Market Size, Government Policy, Institutions and Political Stability. The World Economy, 29 (1), 63-77.
Asiedu, E., and Lien, D., (2011). Democracy, foreign direct investment and natural re-sources, Journal of International Economics, 84; 99-111
Asiemo, P., (2013). Managing the Challenges of IFRS Transition: An Operator’s Perspec-tive. Paper Presented in the ICAN Conference. Retrieved from http://www.icanig.org/documents/CHALLENGES-OF-IFRS-ADOPTION-ICAN.pdf
Asongu, S. (2013).Harmonizing IPRs on software piracy: Empirics of trajectories in Af-rica. Journal of Business Ethics, 118(1): 45-60.
Association of Chartered Certified Accountants (2012).The Changing Role of the Chief Financial Officer. London: ACCA.
Ball, R., (2006). International Financial Reporting Standards (IFRS): Pros and Cons for Investors. Accounting and Business Research, 36, 5-27.
Bandyopadhyay, S., Sandler, T., and Younas, J., (2014). Foreign Direct Investment, Aid and Terrorism, Oxford Economic Papers, 66(1), 25-50.
Bell, T.B., Marrs, F.O., Solomon, I. and Thomas, H. (1997) Auditing Organizations through a Strategic-Systems Lens: The KPMG Business Measurement Process. USA: KPMG Peat Marwick LLP.
Beneish, M.D., Press, E., Vargus, M.E., (2012), Insider Trading and Earnings Management in Distressed Firms, Contemporary Accounting Research, 29 (1): 191-220
Bergh, A. and Nilsson, T., (2014). Is Globalization Decreasing Absolute Poverty? World Development, 62, 42-61
Boateng, M.S., (2012). The Role of Information and Communication Technologies in Ghana’s Rural Development. Library Philosophy and Practice (e-journal): Paper 871. Retrieved from http://digitalcommons.unl.edu/cgi/viewcontent.cgi?arti-cle=2065&context=libphilprac
Botosan, C. (1997), Disclosure Level and the Cost of Equity Capital, The Accounting Re-view, 72 (3): 323-49.
Bruce, R., (2011), African Plans for the Adoption of IFRS. Being a column in Africa Em-braces IFRS, Retrieved from http://www.ifrs.org/news/features/Pages/africa-em-braces-ifrss.aspx
184
Busse, M., and Hefeker, C., (2005), Political Risk, Institutions and Foreign Direct Invest-ment, Hamburg Institute of International Economics (HWWA), Discussion Paper 315.
Byrns, R.T., and Stone, G.W., (1992), Economics, HarperCollinsPublishers: New York.
Cadbury Report (1992), Report of the Committee on the Financial Aspects of Corporate Governance. London: Gee and Co.
Calderon, C., Loayza, N., and Serven, L., (2004), Greenfield Foreign Direct Investment and Mergers and Acquisitions: Feedbacks and Macroeconomic Effects, World Bank Policy Research Working Paper 3192. Retrieved http://docu-ments.worldbank.org/cu-rated/en/628261468781753575/110510322_20041117173021/addi-tional/325780wps3192.pdf
Canadian Institute of Chartered Accountants (CICA) (1999), Continuous Auditing. To-ronto: CICA.
Chen, C.J., Ding, Y., and Xu, B., (2014). Convergence of Accounting Standards and For-eign Direct Investment. The International Journal of Accounting, 49 (1): 53-86
Cheong, T.S., and Wu, Y., (2013), Inequality and Crime Rates in China, The University of Western Australia Business School Discussion Paper 13: 11, Retrieved from http://www.business.uwa.edu.au/__data/assets/pdf_file/0005/2275763/13-11-Inequality-and-Crime-Rates-in-China.pdf
Company Law Review Steering Committee (2001), Modern Company Law for a Compet-itive Economy: Final Report. London: DTI.
Dalton, D., Daily, C., Ellstrand, A. and Johnson, J. (1998) Meta-analytic Review of Board Composition, Leadership Structure and Financial Performance. Strategic Man-agement Journal, 19: 269-290.
Deloitte (2012). IFRSs in your Pocket. International Accounting Standards Board: United Kingdom
Dirk, W.V., (2006), Foreign Direct Investment and Development: An Historical Perspec-tive, Overseas Development Institute Background Paper. Retrieved from https://www.odi.org/sites/odi.org.uk/files/odi-assets/publications-opinion-files/850.pdf
Dollar, D., Fisman, R., and Gatti, R., (2001), Are Women Really the “Fairer “Sex? Cor-ruption and Women in Government, Journal of Economic Behaviour and Or-ganisation, 46, 423-429.
185
Donaldson, T., and Preston, L. (1995), The Stakeholder Theory of the Corporation: Con-cepts, evidence and Implications, Academy of Management Review, 20 (1): 65-91.
Dong, M., (2014), Discussion of “Convergence of Accounting Standards and Foreign Di-rect Investment”, The International Journal of Accounting, 49: 87-96.
Douglas, K., (2013).Diversifying Trade Could Help Africa Industrialise, Says UN., Re-trieved from www.howwemadeitinafrica.com/diversifying-trade-could-help-af-rica-industrialise-says-un/28030/
Dunning, J. H. (1980), Toward an Eclectic Theory of International Production: Some Em-pirical Tests, Journal of International Business Studies, 11(8).
Dunning, J. H. (1988), The Eclectic Paradigm of International Production: A Restatement and some Possible Extensions, Journal of International Business Studies, 19 (Spring).
Eisenhardt, K.M., (1989), Agency Theory: An Assessment and Review, Academy of Man-agement Review, 14(1): 57-74.
Elliott, R.K. (1998), Assurance Services and the Audit Heritage, Auditing: A Journal of Practice and Theory, 17 (Supplement): 1-7.
Evenett, S. (2011), Trade Tensions Mount: The 10th GTA Report, London: Centre for Eco-nomic Policy Research.
Fama, E. F., and Jensen, M. C. (1983).Separation of Ownership and Control. Journal of Law and Economics, 26, 301–325.
Fedderke, J. W., and Romm A.T., (2006).Growth Impact and Determinants of Foreign Di-rect Investment into South Africa, 1956-2003.Economic Modelling, 23: 738-760.
Financial Reporting Council (2013).What Do We Mean by the Term ‘Financial Reporting’, Especially in Relation to Integrated Reporting? Financial Reporting Council: Australia. Retrieved from http://www.frc.gov.au/files/2013/09/defining_fin_re-porting.pdf
Fosu, A.K., (2011), Terms of trade and growth of resource economies; A tale of two coun-tries, UNU-WIDER Working Paper, No.2011/28
Freeman, R. E. (1984), Strategic Management: A Stakeholder Approach. Boston: Pitman
Gee, P., (2001), Spicer and Pegler’s Book Keeping and Accounts, Butterworths Tolley: United Kingdom.
186
Gjesdal, F., (1981).Accounting for Stewardship. Journal of Accounting Research, 19(1): 208-231.
Gordon, L. A., Loeb, M. P., and Zhu, W., (2012).The impact of IFRS adoption on Foreign Direct Investment, Journal of Account. Public Policy, 31, 374-398.
Graham, J.P., and Spaulding, R.B., (2005). Understanding Foreign Direct Investment, Re-trieved from http://www.going-global.com/articles/understanding_foreign_di-rect_investment.htm
Grossman, G.M. and Helpman, E., (1995). Trade Wars and Trade Talks, Journal of Polit-ical Economy, 103, 675-708.
Gujarati, N.D., and Porter, D.C., (2009), Basic Econometrics, Singapore: McGraw Hill International
Hayakawa, K., Kimura, F., and Lee, H., (2011). How Does Country Risk Matter for For-eign Direct Investment? IDE Discussion Paper No. 281
Higson, A., (2003). Corporate Financial Reporting: Theory and Practice. London: Sage Publication.
Hirsch, P., and Friedman, R. (1986), Collaboration or paradigm shift? Economic vs. be-havioural thinking about policy? In Pearce, J., and Robinson, R., (Eds.), Best papers proceedings, Chicago: Academy of Management, 31-35.
International Accounting Standard Board-IASB (2010). Conceptual Framework for Finan-cial Reporting 2010. Retrieved from http://www.iasplus.com/en/stand-ards/other/framework
Iyoha, F.O and Faboyede, S.O. (2011).Adopting International Financial Reporting Stand-ards (IFRS): A Focus on Nigeria. International Journal of Research in Com-merce and Management. 2(1), 35-40.
Izedonmi, F.O.I., (2000), Introduction to Auditing, Abbik Press: Benin
Jansen, M., Peters, R., and Salarzar-Xirinachs, J.M., (2011), Trade and Employment: From Myths to Facts, Geneva: International Labour Office.
Jensen, M. C. (1983). Organization Theory and Methodology. Accounting Review, 58, 319–339.
Jensen, M. C., and Meckling, W. H. (1976). Theory of the Firm: Managerial Behaviour, Agency Costs, and Ownership Structure. Journal of Financial Economics, 3, 305-360.

187
Kaufmann, D. Kraay, A. and Mastruzzi, M. (2005), The Worldwide Governance Indica-tors: A Summary of Methodology, Data and Analytical Issues, World Bank Pol-icy Research Working Paper, No. 543, World Bank.
Krugman, P., (1981), Intra-industry Specialization and the Gains from Trade, Journal of Political Economy, 89: 959-973.
Krugman, P., (1983). New Theories of Trade among Industrial Countries, American Eco-nomic Review, 73(2), 343-47.
Kurtishi-Kastrati, S., (2013), The Effects of Foreign Direct Investments for Host Country’s Economy, European Journal of Interdisciplinary Studies, 5 (1): 26-39
La Porta, R., Florencio, L.S., Andrei, S., and Robert, W.V. (1997). Legal Determinants of External Finance. Journal of. Finance, 52(11): 31-50.
La Porta, R., Florencio, L.S., Andrei, S., and Robert, W.V. (1998). Law and Finance. Jour-nal of Political Economy.106: 13-55.
La Porta, R., Florencio, L.S., Andrei, S., and Robert, W.V. (1999). The Quality of Govern-ment. Journal of Law, Economic and Organization.15: 22–79.
La Porta, R., Lopez, F., and Shleifer, A. (2008). The Economic Consequences of Legal Origins, Journal of Economic Literature, 4(2): 285 - 332.
Lederman, D., Loayza, N.V., and Soares, R.R., (2005), Accountability and Corruption: Political Institutions Mater, World Bank Policy Research Working Paper, 17(1): 1-35
Leyaro, V. and Morrissey, O., 2010, ‘Trade and Growth: Is Sub-Saharan Africa Differ-ent?’, CREDIT Research Paper, No.10/04.
Lindsey, R. (2001), New Economy, New Accounting, New Assurance, Accountancy, 1:16-17.
Madawaki, A. (2012). Adopting International Financial Reporting Standards in Develop-ing Countries: The Case of Nigeria. International Journal of Business and Man-agement. 7 (3).
Marquez-Ramos, L., (2009).European Accounting Harmonization: Consequences of IFRS Adoption on Trade in Goods and Foreign Direct Investments. 32nd Annual Con-gress of the European Accounting Association.
Mateev, M., (2009), Determinants of Foreign Direct Investment in Central and South East-ern Europe: New Empirical Tests. Oxford Journal 8(1): 133-149.
McAfee, A., and Brynjolfsson, E., (2008), Investing in the IT that makes a Competitive Difference. Harvard Business Review. Retrieved from

188
https://hbr.org/2008/07/investing-in-the-it-that-makes-a-competitive-difference (20/02/2015).
Mijiyawa, A, G., (2010), What Drives Foreign Direct Investments in Africa? An Empirical Investigation with Panel Data, Retrieved from http://www.afdb.org/filead-min/uploads/afdb/Documents/Knowledge/What%20Drives%20Foreign%20Di-rect%20Investments%20in%20Africa%20An%20Empirical%20Investiga-tion%20with%20Panel%20Data.pdf (Accessed 8th of May, 2014)
Miles, J., (2012). Management and Organizational Theory. San Francisco: Jossey-Bass
Nnadi, M., (2011).International Financial Reporting Standards (IFRS) Adoption in Africa: the Influence of Anglo Neo-Colonialism.
North, D., (1991). Institutions. The Journal of Economic Perspectives. 5(1): 97-112
North, D.C., (1990).Institutions and Institutional Change and Economic Performance. Cambridge: Cambridge University Press.
Okoye, P.V.C., and Ezejiofor, R., (2014), The Effect of Adoption of IFRS on the Stock Performance: Implications on Investor’s Expectations, Research Journal of Fi-nance and Accounting, 5(4): 8-12
Okpala, K.E., (2012). Adoption of IFRS and Financial Statements Effects: The Perceived Implications on FDI and Nigeria Economy, Australian Journal of Business and Management Research, 2(5): 76-83. Retrieved from http://www.ajbmr.com/ar-ticlepdf/aus-25-14i5n2a10.pdf
Oluwatobi, S., Efobi, U., Olunriola, I., and Alege, P., (2014). Innovation in Africa: Why Institutions Matter. South African Journal of Economics, 83(3): 390-410
Omolehinwa, E., (2000). Foundation of Accounting. Pumark Nigeria Limited: Lagos, Ni-geria.
Onuoha, I. (2013). Accounting Student Gets Sensitized on IFRS Adoption in Nigeria. Busi-ness Day, Retrieved from http://businessdayonline.com/NG/index.php/compo-nent/content/article/366-business shool/42398-accounting-students-get-sensi-tised-on-ifrs-adoption-in-nigeria
Osabuohien, E., (2011). Analysis of International Trade Performance in Selected Sub-Sa-haran African Countries: Impact of Institutional Framework. Unpublished PhD Thesis, Covenant University.
Osabuohien, E.S., Efobi, U.R., and Beecroft, I., (2014). “Free Trade, protectionism and Balance of Trade: New Empirical Insights”, in Evenett, S., (Ed.), Beggar-Thy-Neighbour: Crisis-Era Protectionism and Developing Countries, London: Cen-tre for Economic Policy Research.
189
Panel on Audit Effectiveness (2000) Report and Recommendations. Stanford, CT: Public Oversight Board.
Piana, V., (2005), Foreign Direct Investment, Retrieved from http://www.econom-icswebinstitute.org/glossary/fdi.htm
Pigato, M. A., (2001). The Foreign Direct Investment in Africa, Africa Region Working Paper Series No. 15
Plaza-Ubeda, J. A., de Burgos-Jimenez, J., and Carmona-Moreno, E. (2010).Measuring stakeholder integration: Knowledge, interaction and adaptation behaviour dimen-sions. Journal of Business Ethics, 93, 419-442.
Portes, R., and Rey, H., (2005). The Determinants of Cross-Border Equity Flows, Journal of International Economics, 65, 269-296.
Posner, P., (2006), Accountability Institutions and the Policy Process: The United States Experience. OECD Journal on Budgeting. 5(3): 71-96.
Rahman, Z., (2011), Africa’s Adoption of IFRS, Being a Column in Africa Embraces IFRS, Retrieved from http://www.ifrs.org/news/features/Pages/africa-embraces-ifrss.aspx
Ramanna, K., and Sletten, E. (2009). Why do Countries Adopt International Financial Re-porting Standards? Harvard Business School Working Paper 09-102
Ramanna, K., and Sletten, E. (2010). Why do Countries Adopt International Financial Re-porting Standards? Harvard Business School Working Paper 09-102
Ramos, L. M. (2008), The Effect of IFRS Adoption on Trade and Foreign Direct Invest-ments, International Trade and Finance Association, Working Paper No. 19.
Razin, A., and Loungani, P., (2001), How Beneficial is Foreign Direct Investment for De-veloping Countries, Finance and Development, 38(2). Retrieved from http://www.imf.org/external/pubs/ft/fandd/2001/06/loungani.htm
Roodman, D., (2007), A Short Note on the Theme of too many Instruments. Centre for Global Development Working Paper 125.
Rooyen, V., (2011), Deepening of Africa’s Capital Market, Being a Column in Africa Em-braces IFRS, Retrieved from http://www.ifrs.org/news/features/Pages/africa-embraces-ifrss.aspx
Rosenfield, P. (1974). Stewardship. In Objectives of Financial Statements, Selected Papers. New York: AICPA, 1974.
Sachs, J. D. and A. Warner (1995). Economic Reform and the Process of Global Integra-tion. Brookings Papers on Economic Activity 19(1): 1-118.
190
Scott, W. R., (2001), Institutions and Organisations, London: Sage Publications.
Sirgy, M.J., (2002), Measuring corporate performance by building on the stakeholders model of business ethics, Journal of Business Ethics, 35(3): 143-162
Stepanok, I., (2013), Cross-Border Mergers and Greenfield Foreign Direct Investment, Kiel Working Papers, No. 1805. Retrieved from https://www.ifw-members.ifw-kiel.de/publications/cross-border-mergers-and-greenfield-foreign-direct-invest-ment-1/KWP%201805.pdf
The Enterprise Development (2014), Knowledge Economy, Retrieved from http://www.en-terweb.org/know.htm
Tinker, T. (1985), Paper Prophets: A Social Critique of Accounting. London: Holt, Rine-hart and Winston.
Tricker, R.I. (1984), Corporate Governance: Practices, Procedures and Powers in British Companies and Their Boards of Directors. Aldershot: Gower.Konrad.
Umoren, A., (2012), Fraud and Forensic Auditor. Department of Accounting, Covenant University Lecture Note (Unpublished)
UNCTAD (2016), UNCTAD Handbook of Statistics – 2016, UNCTAD: Geneva
Vintila, D., (2010), Foreign Direct Investment Theories: An Overview of the Main FDI Theories, European Journal of Interdisciplinary Studies, 2(2): 104-111.
Walsh, J. P. (2005). Taking Stock of Stakeholder Management. Academy of Management Review, 30, 426-438.
Whitehead, G., (1998), Book Keeping Made Simple. United Kingdom: Butterworth-Heine-mann
Williamson, O.E., (2000), The new institutional economics: taking stock, looking ahead, Journal of Economic Literature, 38 (3), 595-613.
Winjum, J.O. (1971), Accounting and the Rise of Capitalism: an Accountant's View, Jour-nal of Accounting Research, 9: 333-50.
Winters, L.A. (2004) Trade Liberalisation and Economic Performance: an Overview, Eco-nomic Journal, 114 (493) 4-21.
Woods, F., and Omuya, J.O., (1982). Business Accounting 1, Longman Group Limited: Essex United Kingdom.
World Bank (2012).World Development Indicators. Available online at http://data.worldbank.org/data-catalog/world-development-indicators
191
World Development Indicators (2014), The World Bank: World Development Indicators. Available online at http://data.worldbank.org/data-catalog/world-development-in-dicators
World Investment Report (2014), UNCTAD – World Investment Report, Geneva: UNCTAD
Wysocki, P. (2011). New Institutional Accounting and IFRS, Accounting and Business Research, 41(3), 309-328.
Yahaya, and Khadijat, A. (2011).Compliance with Statement of Accounting Standards by Nigerian Quoted Banks. European, Journal of Economics, Finance and Adminis-trative Sciences.34, 104-112.
Yamey, B.S. (1964), Accounting and the Rise of Capitalism: Further Notes on a Theme by Sombart, Journal of Accounting Research, 2: 117-36.
Young, R.A., (1998), The Stewardship Role of Accounting, Retrieved from http://fisher.osu.edu/~young.53/Stewardship.pdf
Zeff, S.A. (1978). The Rise of Economic Consequences, The Journal of Accountancy, 13: 56-63.
Zeff, S.A. (2002). Political' Lobbying on Proposed Standards: a Challenge to the IASB, Accounting Horizons, 16 (1): 43-54.
Related Documents