ISSN 0976 – 1411 Available online at www.internationaleJournals.com International eJournals International eJournal of Mathematics and Engineering200 (2012)1904-1931 Thrust Vector Control Studies using Jet Vanes 1. Pothuraju Sudheer Babu 2. S. Srinivas Prasad 1,2. Department of Aerospace Engineering, MLR Institute of Technology, Hyderabad-43, Andhra Pradesh, India ABSTRACT: Thrust vector control (TVC) methods were developed as an alternative to aerodynamic control surfaces for missiles, which suffered from poor pitch- over characteristics in launching stage. TVC system, can allow the missile to turn quickly and stably in any direction by deflecting the nozzle exhaust gas irrespective of the missile speed. A jet vane is one of such devices, used for thrust vectoring. An effort has been made to evolve a methodology that can be used to develop a jet vane, that is lighter in weight and / or smaller in size for a given control force. Computations have been performed to analyze the jet vane at high temperatures at different angles of attack. The aerodynamic performance of a jet vane has also been determined at Mach number 2 in a supersonic wind tunnel at ambient conditions. In another experimental set up the jet vane erosion has been determined by placing a mild steel jet vane in the stream of exhaust gases at different angles of attack. KERWORDS: Thurst Vector Control (TVC), Nozzle exhaust, Jet Vane, Angles of Attack. ________________________________________________________________________________________________ INTRODUCTION: Correction in the flight path of flying vehicles such as guided missiles, satellite launch vehicles, and space probes is of paramount importance in case of deviation from the desired path. This correction in the flight path is generally automatic and continuous. This can be achieved by employing a Thrust Vector Control System, which comprises of guidance system and control system. The guidance system can be classified into different types as command guidance, beam rider guidance, inertial guidance, stellar navigation guidance, and radio navigation guidance. Control guidance can also be classified into aerodynamic control, thrust deflection control, thrust vector control and vernier rocket control. A fundamental issue regarding the performance of any military aircraft is maneuverability, the capability to produce an alteration in its trajectory, attitude, velocity or acceleration. A maneuver is the response of the aircraft to a control input by the pilot, and is traditionally accomplished using aerodynamic control surfaces. These include ailerons, rudders, elevators and canards. Control surfaces are located in specific parts of the aircraft, such as wings and tail. When deflected, these surfaces modify the exterior shape of the vehicle, thus creating an imbalance in the aerodynamic forces acting on it, causing the desired, pitch, yaw or roll. The traditional aerodynamic control systems are therefore limited by aerodynamic constraints, because at all conditions in which aerodynamic forces are small, control is compromised or even lost. Such conditions are, high angles of attack and low speed flight. An aerodynamic force for a given surface is proportional to the square of the velocity; therefore, only above a certain threshold of velocity, will a deflection of a control surface be effective, in bringing about a differential in an aerodynamic force, large enough to create a rotation of the aircraft. Regarding angle of attack, aerodynamic forces increase with it only up to a maximum value, beyond which the flow separates, giving rise to aerodynamic stall. At this point, the aerodynamic force falls rapidly with the consequent loss of efficiency of the control surfaces.

Welcome message from author
This document is posted to help you gain knowledge. Please leave a comment to let me know what you think about it! Share it to your friends and learn new things together.
Transcript

ISSN 0976 – 1411 Available online at www.internationaleJournals.com
International eJournals
International eJournal of Mathematics and Engineering200 (2012)1904-1931
Thrust Vector Control Studies using Jet Vanes 1. Pothuraju Sudheer Babu 2. S. Srinivas Prasad
1,2. Department of Aerospace Engineering, MLR Institute of Technology, Hyderabad-43, Andhra Pradesh, India
ABSTRACT: Thrust vector control (TVC) methods were developed as an alternative to aerodynamic
control surfaces for missiles, which suffered from poor pitch- over characteristics in launching stage. TVC
system, can allow the missile to turn quickly and stably in any direction by deflecting the nozzle exhaust gas
irrespective of the missile speed. A jet vane is one of such devices, used for thrust vectoring. An effort has
been made to evolve a methodology that can be used to develop a jet vane, that is lighter in weight and / or
smaller in size for a given control force. Computations have been performed to analyze the jet vane at high
temperatures at different angles of attack.
The aerodynamic performance of a jet vane has also been determined at Mach number 2 in a
supersonic wind tunnel at ambient conditions. In another experimental set up the jet vane erosion has been
determined by placing a mild steel jet vane in the stream of exhaust gases at different angles of attack. KERWORDS: Thurst Vector Control (TVC), Nozzle exhaust, Jet Vane, Angles of Attack.
________________________________________________________________________________________________
INTRODUCTION: Correction in the flight path of flying vehicles such as guided missiles, satellite launch
vehicles, and space probes is of paramount importance in case of deviation from the desired path. This
correction in the flight path is generally automatic and continuous. This can be achieved by employing a
Thrust Vector Control System, which comprises of guidance system and control system.
The guidance system can be classified into different types as command guidance, beam rider
guidance, inertial guidance, stellar navigation guidance, and radio navigation guidance. Control guidance
can also be classified into aerodynamic control, thrust deflection control, thrust vector control and vernier
rocket control.
A fundamental issue regarding the performance of any military aircraft is maneuverability, the
capability to produce an alteration in its trajectory, attitude, velocity or acceleration. A maneuver is the
response of the aircraft to a control input by the pilot, and is traditionally accomplished using aerodynamic
control surfaces. These include ailerons, rudders, elevators and canards. Control surfaces are located in
specific parts of the aircraft, such as wings and tail. When deflected, these surfaces modify the exterior
shape of the vehicle, thus creating an imbalance in the aerodynamic forces acting on it, causing the desired,
pitch, yaw or roll.
The traditional aerodynamic control systems are therefore limited by aerodynamic constraints,
because at all conditions in which aerodynamic forces are small, control is compromised or even lost. Such
conditions are, high angles of attack and low speed flight. An aerodynamic force for a given surface is
proportional to the square of the velocity; therefore, only above a certain threshold of velocity, will a
deflection of a control surface be effective, in bringing about a differential in an aerodynamic force, large
enough to create a rotation of the aircraft. Regarding angle of attack, aerodynamic forces increase with it
only up to a maximum value, beyond which the flow separates, giving rise to aerodynamic stall. At this
point, the aerodynamic force falls rapidly with the consequent loss of efficiency of the control surfaces.

International ejournal of Mathematics and Engineering 200(2012) 1904-1931-
Pothuraju Sudheer Babu and S. Srinivas Prasad
1905
The development of another source of control became necessary, especially for high Performance
aircraft, whose survivability in combat depends mostly on their ability to maneuver. Attention was drawn to
the other forces acting on the vehicle besides the aerodynamic ones: weight and thrust. Though neglected for
maneuvering purposes in almost all aircraft, the thrust force can also be used to achieve maneuverability.
Usually the direction of thrust is fixed, and only the magnitude changes, according to the regime at which
the engine is operating.
A gas turbine engine is equipment that presents many opportunities to implement flow control. The
exhaust nozzle is only one of the parts of an engine whose performance can be altered by using such
techniques. Thrust vectoring is the name given to the technique in which the direction of the thrust force is
modified, and it was around the 1970's that the industry's interest was drawn to it.
For high performance aircraft, TVC helps to improve the flying qualities, thus extending the flight
envelope to regions of speed/angle of attack that could not be reached by the use of aerodynamic control
alone. TVC can also reduce the distance necessary for takeoff and landing, or even make vertical takeoff and
landing possible, a great advantage from the operational standpoint (Rauth and Herrmann, 2003).
As an additional control force is provided, TVC could even allow the reduction/elimination of
certain aerodynamic control surfaces. For instance, reduction or elimination of the horizontal and vertical
tail would reduce dramatically the aircraft's radar cross signature. The TVC system can allow the missile to
turn quickly and stably in any direction by deflecting the direction of the nozzle exhaust gas.
TVC is effective only while the propulsion system is operating and creating an exhaust jet. For the
flight period, when a rocket propulsion system is not firing and therefore its TVC is inoperative, a separate
mechanism needs to be provided to the flying vehicle for achieving control over its attitude or flight path.
Aerodynamic fins (fixed and movable) continue to be very effective for controlling vehicle flight within the
earth‟s atmosphere, and almost all weather rockets, antiaircraft missiles, and air-to-surface missiles use
them. Even though aerodynamic control surfaces provide some additional drag, their effectiveness in terms
of vehicle weight, turning moment and actual power consumption is difficult to surpass with any other flight
control method.
Vehicle flight control can also achieved by a separate attitude control propulsion system. Here six or
more small liquid propellant thrusters (with a separate feed system and a separate control) provide small
moments to the vehicle in flight during, before, or after the operation of the main rocket propulsion system.
During powered flight a number of requirements are presented by the specific missiles in relation to
the TVC. This may include i. to willfully change a flight path or trajectory (e.g., changing the direction of
flight path of a target-seeking missile); ii. to rotate the vehicle or change its attitude during powered flight;
iii. to correct for deviation from the intended trajectory or the attitude during powered flight; or iv. to correct
for thrust misalignment of a fixed nozzle in the main propulsion system during its operation, When the main
thrust vector misses the missiles centre of gravity.
Many different TVC mechanisms have been used successfully. Mechanical deflection of the nozzle
or of the thrust chamber, by a gimbal or a hinge, and movable nozzle using flexible bearing or rotary balls
with gas seal are some of the prevalent mechanisms.
Insertion of heat resistant movable bodies in to the exhaust jet: these experience aerodynamic forces
and cause a deflection of part of the nozzle exhaust gas flow: Jet vanes, Jet tabs, and Jetavator. Injection of
fluid in to the side of the diverging nozzle section, causing an asymmetrical distortion of supersonic exhaust
flow: Liquid-side injection and Hot-gas-side injection
The general shape of the vane is similar to that of supersonic wings. They both, for example, have a
double wedge with some aspect ratio. Therefore, theoretical analysis, experiment, and numerical research of
supersonic wing can help us to understand the characteristics of the single vane.

International ejournal of Mathematics and Engineering 200(2012) 1904-1931-
Pothuraju Sudheer Babu and S. Srinivas Prasad
1906
The number of vanes is usually four, and they arranged in „+‟ - formation or „X‟- formation. In
geometrical point of view, X formation is just a + formation rotated 45 deg. But if the alignment of vanes are
related with in aerodynamic surface or the position of umbilical cable of the missile body, the vane system
with + arrangement move two vanes to provide pitch or yaw force, where as X arrangement vane system
moves four vanes. The + formation is preferred as it produces a wider linear range of side forces to the
deflection angle because only two vanes facing the same direction are deflected to provide the required
control force. However, if the required side force cannot be sufficiently achieved with + formation, the X
formation can be an alternative because all four vanes are deflected.
Fig.1.1: Moments Applied to a Missile Fig.1.2: MissileWith and Without
Jet Vane Deflection
LITERATURE REVIEW:2. 1 INTRODUCTION: Thrust vector control (TVC) systems have been
widely used for the purpose of controlling the path and attitude of missiles and aircrafts, particularly at low
flight speeds when the aerodynamic surfaces can generate only weak forces. By reorienting the direction of
thrust vector, these systems provide lateral forces necessary to quickly alter the flight path of the air vehicle.
Different types of thrust vector control systems have been developed. The current study was based on jet
vane systems by a rocket with hybrid propellant. A number of important investigations in this field have
been carried out by scientists and engineers.
2. 2 DESIGN EFFORT AND ANLYSIS OF JET VANE TVC
A jet vane is a type of device used for thrust vectoring of missiles and is located in the aft region of
missile rocket nozzles. A combined analytical and experimental effort on design of jet vane TVC has been
carried out by Rahaim et al1. The solid rocket motors that use this TVC device can have an aluminum
content of up to 18 wt pct. Because of this, solid aluminum particles are present in the rocket motor gas
stream. In order for the jet vane to function properly, it must be designed to survive the thermal and erosive
environment of this gas stream. A jet vane design optimization using flow, thermal, and materials
technology was performed in order to improve the jet vane. The intent is to evolve a methodology that can
be used to develop a jet vane that is lighter in weight and/or smaller in size than the current configuration. A
reliable and easy-to-use design procedure was sought to optimize the jet vane configuration.
Theoretical and experimental aerodynamic correlation of jet vane control effectiveness has been
carried out by Giragosian2. The problem of predicting the aerodynamic (or Gas dynamics) performance of a
set of four, mutually orthogonal jet vane controls, immersed in the hot gas flow of a racket motor nozzle is
treated theoretically and validated by a static motor-ground test. 'Three axes (pitch, yaw and roll) control
system (in the form of a jet vane package appended to the rocket motor nozzle) is provided to enhance
missile control, maneuver capability and trajectory control during vertical launch and slew. The jet vane

International ejournal of Mathematics and Engineering 200(2012) 1904-1931-
Pothuraju Sudheer Babu and S. Srinivas Prasad
1907
control effectiveness is estimated using supersonic aerodynamic theory, with consideration for real gas
composition, interference and conical nozzle flow.
Jet vanes normally placed in the supersonic exhaust of the converging diverging nozzle. Such a
system consists of four orthogonal vanes mounted at the exit of nozzle. These jet vanes are always adopted
in the vehicle of high maneuverability and large side force, to realize the control in pitching, rolling and
yawing directions by redirecting the propulsive forces. This can be obtained by deflecting the jet vanes.
When these vanes are deflected at a certain angle, pressure distribution is changed on the surfaces of
windward and leeward sides as a result a control force is generated. The validation of CFD code, PAK-3D
discussed by Hussain et al5 using a low thrust convergent-divergent nozzle. These results are compared with
experimental and numerical results. Comparisons of flow solvers are also discussed.
A joint study with Defence Research and Development Canada – Valcartier, Honeywell Limited,
and University Laval has been carried out on a thrust vector control system with four jet vanes by Rainville
et al6. This system has been installed on a solid propellant rocket motor. This was divided in to three parts,
the experimental measurements on an actual rocket motor, wind tunnel measurements on a scale-model
vane, and Computational Fluid Dynamics (CFD) modeling on the entire rocket motor with a jet vane thrust
vector control nozzle. However, there were some problems with the measurements that can be partially
explained by the small number of measurements and some fairly complex phenomena at the leading edges
of the vanes.
2. 3 THRUST-VECTOR CHARACTERISTICS OF JET VANES
Thrust-vector characteristics of jet vanes arranged in an X formation within a TVC shroud are very
unique and much more complicated than those of the jet vanes acting without the shroud because of both the
flow interference between the vanes and the shroud and the X formation of the vanes. The fluid dynamic
interferences, such as the impingement of shock waves induced by jet vanes on the shroud wall, and the
aerodynamic performance of jet vanes arranged in an X formation have been investigated by Sung and
Hwang8, to characterize thrust vector control of jet vanes operating within the TVC shroud.
A successful solution was devised using a jet vane control system for missile maneuvering during
the boost phase of the shipboard vertical launch has been designed by Facciano et al9. By the location aft of
the rocket motor nozzle, the vanes are inserted into the propellant stream for the purpose of generating
maneuvering forces. After rocket motor burn out, the jet vane assembly detaches from the missile and falls
away to not degrade the rocket motor specific impulse during flight to target. The four vanes are mounted at
right angles to each other with each having its own mounting support and gear train assembly. Each vane is
connected through a detachable coupling to the steering control system of the missile, such that actuation of
the steering control simultaneously actuates the jet vane.
An apparatus for vectoring the thrust of a motor that produces thrust along a longitudinal axis by
expelling combustion gases through nozzle has been presented by Kinsey et al15
. It may include a plurality
of linearly positionable non-rotatable thrust deflectors. The thrust deflectors may be disposed at around a
perimeter of the nozzle. Each thrust deflector may be independently extended to simultaneously generate
both a force transverse to the longitudinal axis and a torque about the longitudinal axis.
2. 4 AERODYNAMIC CHARACTERISTICS OF JET VANES
A method to predict lift force produced by the jet vanes of a particular thrust vector control system
has been developed by Harrison et al17
. Jet vanes erosion effects on the efficiency of thrust vector control
system used in missile applications are evaluated. The vanes were made in to two materials: copper
infiltrated tungsten (CIT) and heat-treated 4340 steel. A six degree- of- freedom (6-DOF) transducer was
used to measure the forces and moments of a jet-vaned rocket motor and, from these measurements, the lift
force produced by the jet vanes can be deduced.

International ejournal of Mathematics and Engineering 200(2012) 1904-1931-
Pothuraju Sudheer Babu and S. Srinivas Prasad
1908
Wind tunnel tests were performed on thrust vector control system to find out the Pressure and force
measurements have been carried out by Hamel et al18
. Two velocities regimes chosen for the tests were
Mach 3 and 3. 5. The jet vane of interest is scaled by 3. 7 : 1 as compared to actual TVC four vane systems.
It was mounted on square missile body to facilitate its installation in the wind tunnel and to make it easier
for the grid generation of the CFD model at different angles-of-attack (AOA). The vane angle of attack for
the tests was varied from - 20 to + 20 in 5o increments.
Investigations into a multiaxis thrust-vectoring system have been conducted by Bowers et al24
on
an F - 18 configuration. These investigations include ground-based scale-model tests, ground-based full-
scale testing, and flight testing. This thrust-vectoring system has been tested on the NASA F - 18 High
Alpha Research Vehicle (HARV). The system provides thrust vectoring in pitch and yaw axes. Ground-
based subscale test data have been gathered as background to the flight phase of the program. Tests
investigated aerodynamic interaction and vane control effectiveness. The ground-based full-scale data were
gathered from static engine runs with image analysis to determine relative thrust-vectoring effectiveness
Parameter identification input techniques have been developed. Individual vanes were not directly controlled
because of a mixer-predictor function built into the flight control laws. Combined effects of the vanes have
been measured in flight and compared to combined effects of the vanes as predicted by the cold-jet test data.
RESEARCH METHODOLOGY:
3. 1 THEORETICAL ANALYSIS
3. 1. 1 INTRODUCTION
TVC systems are currently widely used for the purpose of controlling the path and attitude of
missiles, aircrafts particularly at low flight speeds when the aerodynamic surfaces can generate only weak
forces. An effort has been made to study the TVC studies using jet vanes.
In the present work, the prediction of the aerodynamic performance of a set of four mutually
orthogonal jet vanes, immersed in the hot gas flow of a rocket motor nozzle has been treated theoretically
and validated by static motor test. Three axes (pitch, yaw, and roll) control system (in the form of jet vane
package appended to the rocket motor nozzle) has also been provided. The jet vane control effectiveness has
been estimated using supersonic aerodynamic theory, with consideration for real gas composition,
interference and conical nozzle flow. The correlation of the prediction technique for the jet vane lift, drag,
and centre-of-pressure with static motor test firing has also been shown.
3. 1. 2 GAS DYNAMIC ANALYSIS
The gas properties in the jet flow with in a rocket motor nozzle have been determined analytically
assuming that the length of the jet vane has been simply added to the length of the conical nozzle. The
resulting variation of the nozzle flow gas dynamics pressure and Mach number as a function of distance
behind the nozzle exit has been calculated using gas dynamic theory and nozzle flow relations. Particles in
the flow, varying gas composition with pressure and specific heat ratio are real effects that have a significant
influence on the jet vane control characteristics, however this has not been considered.
The gas behavior that complicates the prediction of vane control performance is that the flow takes in
a conical form. When the vane is deflected, this effect also results in a variation of angle of attack along the
vane. The following two assumptions have been made in order to simplify calculation of the vane forces:
i. The flow within the nozzle is essentially parallel.
ii. The resultant force acting on the vane is perpendicular to the vane chord.
3. 1. 3 LINEAR THEORY
The jet vane cross section is a double wedge shape of unequal lengths which can be taken as equal to
thin aerofoil. Experience has shown that the leading edge and the trailing edge of supersonic aerofoils
International ejournal of Mathematics and Engineering 200(2012) 1904-1931-
Pothuraju Sudheer Babu and S. Srinivas Prasad
1909
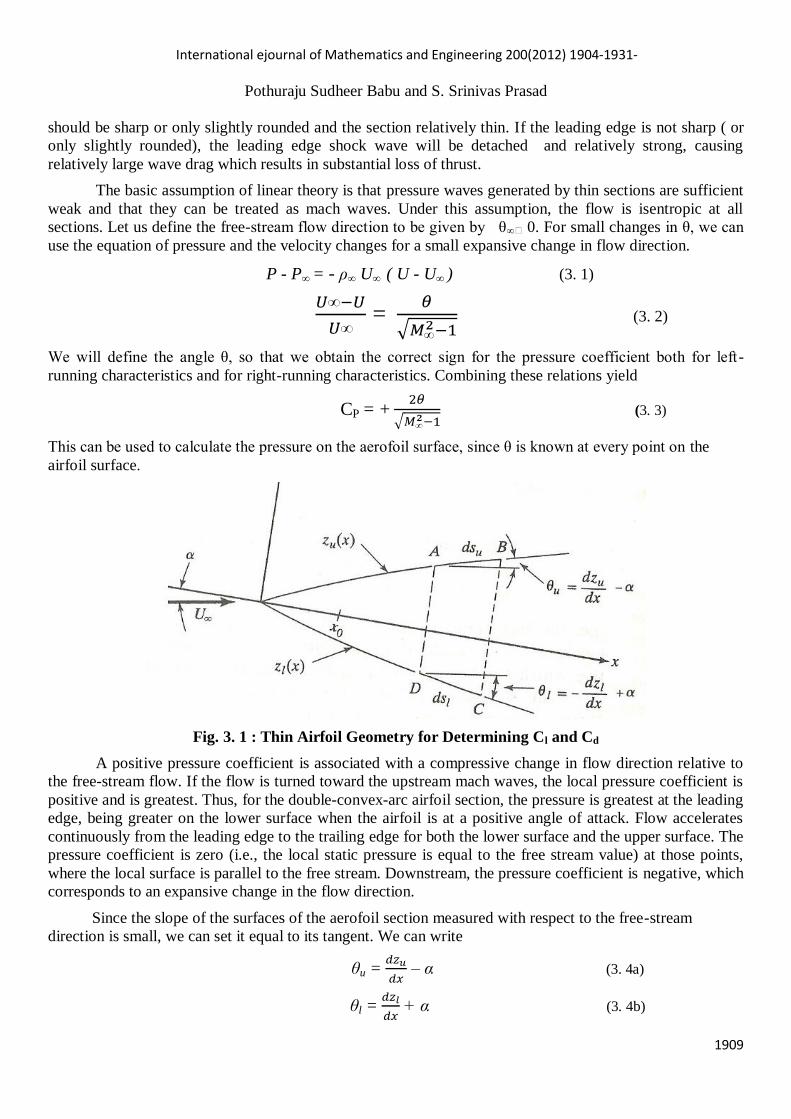
should be sharp or only slightly rounded and the section relatively thin. If the leading edge is not sharp ( or
only slightly rounded), the leading edge shock wave will be detached and relatively strong, causing
relatively large wave drag which results in substantial loss of thrust.
The basic assumption of linear theory is that pressure waves generated by thin sections are sufficient
weak and that they can be treated as mach waves. Under this assumption, the flow is isentropic at all
sections. Let us define the free-stream flow direction to be given by θ∞ ˭0. For small changes in θ, we can
use the equation of pressure and the velocity changes for a small expansive change in flow direction.
P - P∞ = - ρ∞ U∞ ( U - U∞ ) (3. 1)
= (3. 2)
We will define the angle θ, so that we obtain the correct sign for the pressure coefficient both for left-
running characteristics and for right-running characteristics. Combining these relations yield
CP = + (3. 3)
This can be used to calculate the pressure on the aerofoil surface, since θ is known at every point on the
airfoil surface.
Fig. 3. 1 : Thin Airfoil Geometry for Determining Cl and Cd
A positive pressure coefficient is associated with a compressive change in flow direction relative to
the free-stream flow. If the flow is turned toward the upstream mach waves, the local pressure coefficient is
positive and is greatest. Thus, for the double-convex-arc airfoil section, the pressure is greatest at the leading
edge, being greater on the lower surface when the airfoil is at a positive angle of attack. Flow accelerates
continuously from the leading edge to the trailing edge for both the lower surface and the upper surface. The
pressure coefficient is zero (i.e., the local static pressure is equal to the free stream value) at those points,
where the local surface is parallel to the free stream. Downstream, the pressure coefficient is negative, which
corresponds to an expansive change in the flow direction.
Since the slope of the surfaces of the aerofoil section measured with respect to the free-stream
direction is small, we can set it equal to its tangent. We can write
θu = – α (3. 4a)
θl = + α (3. 4b)

International ejournal of Mathematics and Engineering 200(2012) 1904-1931-
Pothuraju Sudheer Babu and S. Srinivas Prasad
1910
3. 2 COMPUTATIONAL WORK
3. 2. 1 INTRODUCTION Numerical investigation has been carried out to have an overall understanding
of the flow phenomena occurring around the jet vane in supersonic speeds. All the computations
have been carried out using commercially available software FLUENT at the central computational facility,
Birla Institute of Technology, Mesra. The details of geometry, modeling, mesh generation for 2- D and
3- D flows and solution methodology adopted for different cases have been presented in this chapter.
3. 2. 2 CFD ANALYSIS
Pre-processing, Solver and Post-processing are the three components for effectively using any
computational work. Pre- processing involves the process of creating geometry, generating mesh and setting
of zones. The created mesh is exported to the solver for solving proper governing equations at each discrete
point of the mesh. Post- processing is the means of obtaining a solution in a desired manner. For the present
study, GAMBIT has been used for the pre-processing, while solver and post- processing has been done
using FLUENT.
3. 2. 3 GEOMETRY DETAILS
A C - D nozzle with the following geometrical details has been selected for validation of the flow
phenomenon and for the jet vane analysis.
Table. : 3. 1 Geometrical Details of Nozzle used for Present Computation
Length , L 98.42 mm
Throat Diameter, Dthroat 14.74 mm
Inlet Diameter, Dinlet 116 mm
Exit Diameter, Dexit 39 mm
Half angle of Convergence, ϕ
45 deg
Half angle of Divergence, θ 15 deg
3. 2. 4 GRID GENERATION
Meshing is the process of dividing the physical domain into discrete points or volumes or elements,
to solve the flow over a body. Grids can be structured or unstructured or hybrid. 2- D and 3-D grids can be
made, depending on the nature of the flow and geometry. A 2- D structured grid is obtained by splitting the
domain into multiple faces, then specifying the interval count or interval spacing on the edges, such that a
one to one mapping is assured. The face is then meshed using map or sub map schemes. Unstructured 2- D
grids are generated using pave and tri primitive schemes. For a 3- D problem the domain is split into
multiple blocks, each block is filled with possible combinations of hex (hexahedral), hex/ wedge and tet
(tetrahedral) hybrid cells, depending on the block geometry. Grading scheme facilitates the clustering and
coarsening of grid points depending on the requirements.
3. 2. 5 BOUNDARY CONDITIONS
For the jet vane without nozzle, inlet face of the domain has been specified as pressure inlet
boundary while outlet, top, bottom and side faces have been specified as pressure outlet boundary. Body
surfaces, in effect the upper and lower surfaces of the vane, have been specified as wall boundary
conditions.

International ejournal of Mathematics and Engineering 200(2012) 1904-1931-
Pothuraju Sudheer Babu and S. Srinivas Prasad
1911
In the case of jet vane with nozzle, free stream condition has been applied at the inlet, while the
condition of extrapolation has been imposed at the exit of the nozzle. For the nozzle wall, no - slip condition
has been imposed for the viscous model. Also, the wall has been assumed to be adiabatic in all the cases. For
2- D axisymmetric case, centre line has been taken as the axes of symmetry; similarly, for the 3- D half body
case half body plane was taken as symmetry plane condition, while for the full 3- D averaging has been done
about the nozzle‟s centre line.
3. 2.6 FLOW CONDITIONS
Flow conditions for the analysis of jet vanes with nozzle are as follows:
Chamber pressure, Pc = 3.44 Mpa (500 psi)
Back pressure, Pb = 101352.85 pa (14.7 psi)
Chamber temperature, Tc = 2200 K
Flow conditions of only the jet vane performance are as follows:
Total gauge pressure = 308145 pa
Initial gauge pressure = 39382.75 pa
Temperature = 300 K
3. 2.7 POST PROCESSING
For post – processing, the simulation results is stored using auto save command, while the simulation
set up is stored in the case file and the results obtained after simulation in data file. In this way, the data file
has the information of all the properties of all the cells in the domain. The data plots, vector plots and the
surface data plots etc. of pressure, velocity and density etc. can be checked during the solution process and
at convergence. These plots can be saved as image files and the data from surface plots can be written on to
a file. Points, rakes and planes have been created in the flow domain to analyze the properties at the desired
locations. FLUENT offers a very good range of post processing options which can be used to analyze the
computational data, as also to compare computational results with experimental results.
.
Fig. 3.2: Surface Grid on Jet Vane Fig. 3.3: C – D Nozzle Structured Grid in 2–D

International ejournal of Mathematics and Engineering 200(2012) 1904-1931-
Pothuraju Sudheer Babu and S. Srinivas Prasad
1912
Fig. 3.4: Grids showing Domain over the Jet Vane and Boundary Conditions Adopted in the Present
Computation
3. 3 EXPERIMENTAL METHODOLOGY
3. 3. 1 INTRODUCTION In the first instance, aerodynamic performance of the jet vane has been
evaluated to find out whether the shape of the vane would be workable or not. Experiments have been
carried out to investigate the flow field existing around double wedge shaped jet vane at supersonic speed. A
Supersonic Wind Tunnel has been used to carry out the dry run experiments with a single vane at ach
number 2 at different angles of attack. A head- end- Injection hybrid test motor has been fabricated and used
to carry out the experiments with one vane placed in the nozzle exit section at different angle of attack.
3. 3. 2 SUPERSONIC WIND TUNNEL
All the experiments have been carried out using intermittent blow down Supersonic Wind Tunnel,
available in the Department. It has a test section size of 50mm x 100 mm. The Mach number in the test
section can be varied from 1.8 to 3. 2 by using different nozzle blocks. For the present study, nozzle block
resulting in Mach number 2 has been used. Compressed air from the compressor passes through a dryer and
stored in a reservoir with 30 m3 capacity stored at a maximum pressure of 150 psig. Compressed air is
supplied to the tunnel through a settling chamber using an electronic solenoid valve, which expands through
a C - D nozzle block to the test section. The run time of the tunnel is typically 15 sec.
3. 3. 3 GEOMETRICAL DETAILS OF JET VANE
Jet vane has been designed using commercially available modeling software CATIA V5 R19. The
selected jet vane has a double wedge shape of unequal lengths with trailing section is slightly longer than
the leading section. The leading edge and the trailing edges are slightly rounded so as to prevent detachment
of the leading edge shock wave. Also, this would make it relatively strong and would reduce large wave
drag. The angle at the leading edge has been kept as 16. 26 deg, and the angle at the trailing edge as 8. 67
deg. The total chord length of the vane has been kept 33. 19 mm and the span of the vane as 21 mm. The
vane, which looks like truncated shape when viewed from the top, has been intentional so as to reduce the
boundary layer separation, where the angle towards leading edge comes out as 80. 80 deg, and the angle
towards the trailing edge as 78. 31 deg.
Pressure inlet
Pressure outlet
Symmetry

International ejournal of Mathematics and Engineering 200(2012) 1904-1931-
Pothuraju Sudheer Babu and S. Srinivas Prasad
1913
It is pertinent that certain ratios are maintained, regardless of the size of the jet vane in order to
provide maximal roll control and minimal drag. The ratio of the span to the chord for the jet vane is 0. 65.
The ratio of the thickness to the chord is 0. 15, and the ratio of the thickness to the lead is 0. 35.
3. 3. 4 FABRICATION OF MODEL
The model has been fabricated with mild steel in two symmetric half sections, to make
pressure taps. These two- half sections were fabricated on wire- cut electrical discharge machining in
Vamshi Industries, Balanagar, Hyderabad. Base plate has been made of a aluminum to facilitate mounting
the model in supersonic wind tunnel.
3. 3. 5 STATIC PRESSURE MEASUREMENT
Static pressure measurements have been carried out identifying a total of eight pressure tap locations
in the region of interest. 1. 2 mm diameter holes have been made on both upper and lower surface at 3 mm,
6 mm, 11 mm, and 16 mm distance respectively from the leading edge, which served as pressure taps.
Stainless steel tubes have been passed through these holes and one side of the tubes were flushed with the
vane surface, the other end of the stainless tubes have been connected to polythene tubes, which in turn has
been connected to the mercury manometer a electronic pressure scanner tubings.
3. 3. 6 STATIC PRESSURE MODEL MOUNTING
Suitable grooves have been made on the base plate to take out pressure tubing outside the tunnel. The
free end of the polythene tubes were connected to the tubings of the electronic pressure scanner.
3. 3. 7 PRESSURE DATA ACQUISITION
Pressures have been measured using Scanivalve-make electronic pressure scanner (Z0C 22b/ 32Px).
This has 32 individual sensors having a range of 2. 5 to 50 psig. Logic controls and the signal acquisition
from the scanner are programmed through LabVIEW. National Instruments- make Data Acquisition System
using AD card DAQ (PCI- M10- 16E- 1) and a PC have been used to acquire the signals. Calibration of the
sensors of the scanner has been done with the help of a mercury manometer.
3. 3. 8 TEST HYBRID ROCKET MOTOR
The Test Hybrid Rocket Motor thrust chamber comprises of the following components:
Combustion chamber assembly
Injector assembly
Nozzle assembly.
3. 3. 8. 1 Combustion Chamber Assembly:
A single-walled combustion chamber with no coolant passage has been fabricated with mild steel.
The combustion chamber has an inner diameter of 116 mm and a total length of 400 mm. At either ends of
the chamber, flanges of 200 mm outer diameter, 114 mm of inner diameter and thickness of 12 mm have
been separately fabricated welded. Six holes of 9mm diameter have been made on both the flanges with 163.
5 mm p.c.d.
3. 3. 8. 2 Injector Assembly
The injector assembly consists of an Oxidizer Chamber and Injector Plate. A cup- shaped chamber
with 60 mm outer diameter and 45 mm length has been fabricated and welded a flange of 200 mm outer
diameter, 40 mm inner diameter and 12 mm. Six holes of 9mm diameter have been made on 163.5 mm
p.c.d. On the other an adapter of 25. 4 mm outer diameter, 20 mm inner diameter and 20 mm length has been
welded to match the oxygen supply connection.

International ejournal of Mathematics and Engineering 200(2012) 1904-1931-
Pothuraju Sudheer Babu and S. Srinivas Prasad
1914
A 200 mm outer diameter, 12 mm thick stainless steel plate with six holes of 9 mm diameter on
163.5 mm p.c.d has been used to serve as injector. Nine circular orifices of 1 mm diameter have been drilled
in the central region of the injector, in such a way that the central one is axial in direction and the remaining
eight of them are 450
apart on 28 mm p.c.d. This is done in order to get shower head injection of the
oxidizer through the port of the fuel grain.
3. 3. 8. 3 Nozzle Assembly
The nozzle assembly comprises of a nozzle and a nozzle retainer plate. Mild steel is not suitable for
fabricating the nozzle, since the system is oxidizer rich and may produce corrosive in nature. The nozzle has
been manufactured of graphite insert supported in a aluminum block. Such nozzles have been found to
withstand several firings without any erosion. A straight cone convergent- divergent nozzle has been chosen
for this hybrid system. The inlet diameter is 116 mm and the exit diameter of nozzle is of 39 mm, which the
throat diameter is 14 mm and with a constant diameter for 2 mm length. The nozzle is converged at an angle
of 450 towards the throat and is diverged at 15
0 angle towards its exit.
A nozzle retainer plate has been used to secure the nozzle at the end of the combustion chamber.
12mm thick mild steel ring with 200 mm outer diameter and 130 mm inner diameter has been used. Six
holes of 9mm diameter have been made on 163.5 mm p.c.d. on both the flanges.
3. 3. 12 FUEL GRAIN
A conventional hybrid fuel comprising of 45% Poly Vinyl Chloride (PVC), 45% of Di-Butyl
Phthalate (DBP) and 10% of Ammonium Perchlorate (AP) was processed in the usual manner and cast to
get PVC plastisol grain of 114 mm outer diameter30 mm and inner diameter.
3. 3. 12. 1 Mixing of propellant ingredients
International ejournal of Mathematics and Engineering 200(2012) 1904-1931-
Pothuraju Sudheer Babu and S. Srinivas Prasad
1915
The required quantity of PVC, DBP, and AP was taken in the tray. Six- sigma Blade mixture was
used for the processing. At first, DBP was poured in a chamber in the mixture then PVC was added to the
mixture slowly in three installments for every 25 minutes. Ammonium Perchlorate was then added and
mixed for 40 minutes to get the homogeneity of the dough. The entire amount is left it for a short length of
time.
The propellant dough as obtained earlier was once again mixed for another five minutes and poured
in the mould fitted with mandrel and placed in the vacuum casting unit with vacuum and vibrating facility.
The unit was operated for vacuum and vibration and then left for three hours to ensure complete removal of
the trapped air. The mould was removed from vacuum casting unit and kept at room temperature for two
days. Subsequently, it was kept at 500 for 24 hours and at 55
0 for another 24 hours, and then at 60
0for 48
hours. The moulds were allowed to cool down to room temperature and the fuel grains were taken out from
the mould. Similar procedure was taken for processing of all type of fuel grains used in the present
investigation. These fuel grains were cleaned, inspected for cracks and voids, were cut to the required size
and casted in the combustion chamber. A typical photograph of the fuel grains have been presented in Fig.
3.8.
3. 3. 13 IGNITER
A shellac- based igniter was used to initiate the combustion. The igniter composition of an bead,
surrounded by small quantities of beads contained in a polythene bag, and placed in the port of the fuel grain
near injection end.
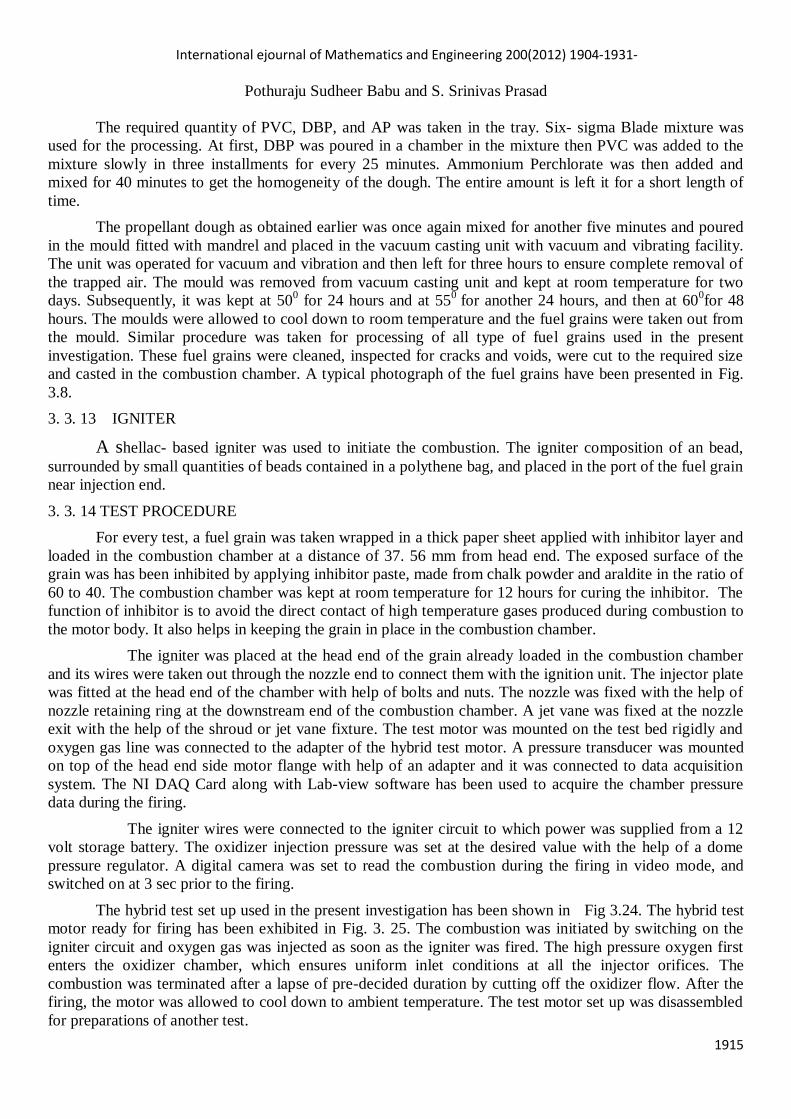
3. 3. 14 TEST PROCEDURE
For every test, a fuel grain was taken wrapped in a thick paper sheet applied with inhibitor layer and
loaded in the combustion chamber at a distance of 37. 56 mm from head end. The exposed surface of the
grain was has been inhibited by applying inhibitor paste, made from chalk powder and araldite in the ratio of
60 to 40. The combustion chamber was kept at room temperature for 12 hours for curing the inhibitor. The
function of inhibitor is to avoid the direct contact of high temperature gases produced during combustion to
the motor body. It also helps in keeping the grain in place in the combustion chamber.
The igniter was placed at the head end of the grain already loaded in the combustion chamber
and its wires were taken out through the nozzle end to connect them with the ignition unit. The injector plate
was fitted at the head end of the chamber with help of bolts and nuts. The nozzle was fixed with the help of
nozzle retaining ring at the downstream end of the combustion chamber. A jet vane was fixed at the nozzle
exit with the help of the shroud or jet vane fixture. The test motor was mounted on the test bed rigidly and
oxygen gas line was connected to the adapter of the hybrid test motor. A pressure transducer was mounted
on top of the head end side motor flange with help of an adapter and it was connected to data acquisition
system. The NI DAQ Card along with Lab-view software has been used to acquire the chamber pressure
data during the firing.
The igniter wires were connected to the igniter circuit to which power was supplied from a 12
volt storage battery. The oxidizer injection pressure was set at the desired value with the help of a dome
pressure regulator. A digital camera was set to read the combustion during the firing in video mode, and
switched on at 3 sec prior to the firing.
The hybrid test set up used in the present investigation has been shown in Fig 3.24. The hybrid test
motor ready for firing has been exhibited in Fig. 3. 25. The combustion was initiated by switching on the
igniter circuit and oxygen gas was injected as soon as the igniter was fired. The high pressure oxygen first
enters the oxidizer chamber, which ensures uniform inlet conditions at all the injector orifices. The
combustion was terminated after a lapse of pre-decided duration by cutting off the oxidizer flow. After the
firing, the motor was allowed to cool down to ambient temperature. The test motor set up was disassembled
for preparations of another test.

International ejournal of Mathematics and Engineering 200(2012) 1904-1931-
Pothuraju Sudheer Babu and S. Srinivas Prasad
1916
Jet vanes were removed from the shroud without removal of grain from the combustion chamber.
Same grain was used for the next firing. Total two grains were used, and two tests on each grain were
performed. The tests were carried out at four different angles of attack, namely 0 deg, 5 deg, 10 deg, and 15
deg to determine the extent of erosion during various angles of attack. The pressure – time plot was obtained
from the pressure data stored by the Lab-view. The characteristics of flame was also be visualized from the
video recordings during each test firing
.
Fig. 3.5: Dimensions of Base Plate
Fig. 3.6: Pressure Measurement Model. Fig. 3.7: Jet Vanes used for Test Firings

International ejournal of Mathematics and Engineering 200(2012) 1904-1931-
Pothuraju Sudheer Babu and S. Srinivas Prasad
1917
Fig. 3.8: Fuel Grains used for Test Firings Fig. 3.9: Schematic Diagram of Experimental Set-Up
RESULTS AND DISCUSSIONS:4. 1 INTRODUCTION
Thrust vector control (TVC) was developed as an alternate to aerodynamic control surfaces, which
suffered from poor alpha pitch - over characteristics in launching stages. TVC works very effectively at any
speed. Various methods of TVC have been developed and are in a wide practice. Jet vane is a convenient
method to get the desired TVC by placing a set of four jet vanes at exit section of a nozzle.
In the present investigation, an effort has been made to understand the thrust vectoring performance
of the jet vanes theoretically as well as experimentally.
4. 2 COMPUTATIONAL
In the present study, 2- D and 3- D computations have been carried out for the performance of jet
vane in dry run and for the entire set of jet vanes with combustion chamber and nozzle, as described in the
earlier Chapter.
2- D computations have been made to simulate the real conditions, and it has been presented in Fig. 4. 1.

International ejournal of Mathematics and Engineering 200(2012) 1904-1931-
Pothuraju Sudheer Babu and S. Srinivas Prasad
1918
Fig. 4.1: Velocity Contour of 2- D Nozzle with Combustion Chamber
In the next step, 3- D computations have been carried out on the jet vanes only at Mach number 2 to
evaluate the aerodynamic performance of the jet vanes at different angles of attack, which has been taken as
α = 0, 2, 5, and 7. 5 deg. Coefficient of pressure (Cp) has been evaluated at different angles of attack for
better understanding of the performance of the jet vane.
Fig. 4.2: Density Contours of Jet Vane at α = 0 deg
Compression waves have clearly been observed at the leading edge in the figure, and the density has
been found to be a value of approximately around 1.79. Expansion waves have been observed at the
maximum thickness of the jet vane. Density variations on both the upper and lower surfaces of the jet vane
have been found to be in the same order, and this is due to zero angle of attack. At the trailing edge of the jet
vane, again compression waves has been observed, which is due to steep angle of jet vane design.
Density contours at α = 2 deg, has similarly been found out and has been presented in Fig. 4.3.
Fig. 4.3: Density Contours of Jet Vane at α = 2 deg

International ejournal of Mathematics and Engineering 200(2012) 1904-1931-
Pothuraju Sudheer Babu and S. Srinivas Prasad
1919
Thick Compression waves have clearly been observed on the lower surface of the jet vane at the
leading edge. This is due to the angle of attack. At the maximum thickness of jet vane, strong expansion
waves have been observed and the value of density has been found to be approximately 0. 56 on both the
surfaces. Again weak compression waves have been observed on both the surfaces of jet vane at the trailing
edge.
In the next step, an attempt has been made to find out the temperature and velocity contours, with
entire set of jet vanes placed in the exit section of the nozzle at the rear end of the combustion chamber at
different angles of attack, namely at α = 0 and 5 deg. Realistic static hybrid test rocket motor conditions
have been assumed in this section.
Temperature contours of Jet Vane at α = 0 deg, has been presented in the Fig. 4.4.
Fig. 4.4: Temperature Contour of Jet Vane at α = 0 deg
It has been observed that, value of a temperature at the leading of the jet vane is approximately
around 1570 K. At the maximum thickness of a jet vane the value of temperature on both upper and lower
surfaces has been increased to approximately 1630 K. This is due to the wedge angle of the jet vane design.
Again at the trailing edge of the jet vane, a slight drop of temperature value has been observed with a value
of 1600 K.
Velocity contours of the Jet Vane at α = 0 deg, has been presented in the Fig. 4.5
.
Fig. 4.5: Velocity Contour of Jet Vane at α = 0 deg.
Oblique shock wave has been observed at the leading edge of the jet vane due to the supersonic
velocity at the nozzle exit. At maximum thickness of the jet vane, expansion waves have been observed due

International ejournal of Mathematics and Engineering 200(2012) 1904-1931-
Pothuraju Sudheer Babu and S. Srinivas Prasad
1920
to the wedge shape of the jet vane, this effect of expansion waves reduces the Cp gradually. Velocity at the
trailing edge drops to a Mach number1. 8. due to steep angle of jet vane.
Coefficient of normal and axial forces of jet vane has been presented in the Fig. 4.6.
Fig. 4.6: CN and CA of Jet Vane at Different Angles of Attack.
4. 3 THEORETICAL
An effort has also been made to determine the gas flow condition at the nozzle exit of a combination
having PVC – plastisol hybrid fuel burning in the stream of gaseous oxygen.
A composition of hybrid fuel that has been actually employed during the test motor set up has been
taken to determine the same as theoretically. The composition carrying of 45 % of PVC, 45 % of DBP, and
10 % of AP for hybrid fuel has been taken, and it has been assumed that the combustion is complete. Such
that all H2 converts to H2O and all C converts to CO2. A representative equation may be given by
C2H3Cl + 2NH4ClO4 + C16H22O4 + 19.5 O2 18CO2 + N2 + 15H2O + HCl
Exit temperature has been calculated from the classical equation,
Q = Cp ∆T. (4. 1)
were, Q = heat of formation and Cp = specific heat from the each molecule in the products, and it has been
determined by the classical methods and it comes to Q = ∆Hf = - 8803.3 KJ/mol, and Cp = = 0.56
KJ/Kg.k. Tc has been found out to be Tc = 2187.9 K.
In the similar way, exhaust velocity has been calculated from the classical equation,
Ve = (4. 2)
Unknown variables has been determined by the classical method and it comes to k = 1. 6, R = 345.7, Pc
= 500 psi, and Tc = 2187.9 K. from this, exhaust velocity has been found to be Ve = 1989.27 m/sec.
In the next step, lift forces have been evaluated from the linear theory at different angles of attack, by
considering the vane erosion rate. From the empical relation, Asteel = Ainit [1.045-0.115t], the area of the jet
vane has been calculated theoretically with respect to the time. Changes of jet vane area with respect to time
have been presented in the Fig. 4.7.
0
0.2
0.4
0.6
0.8
1
1.2
1.4
1.6
1.8
0 2 4 6 8
CN
an
d C
A
α
CN
CA
International ejournal of Mathematics and Engineering 200(2012) 1904-1931-
Pothuraju Sudheer Babu and S. Srinivas Prasad
1921
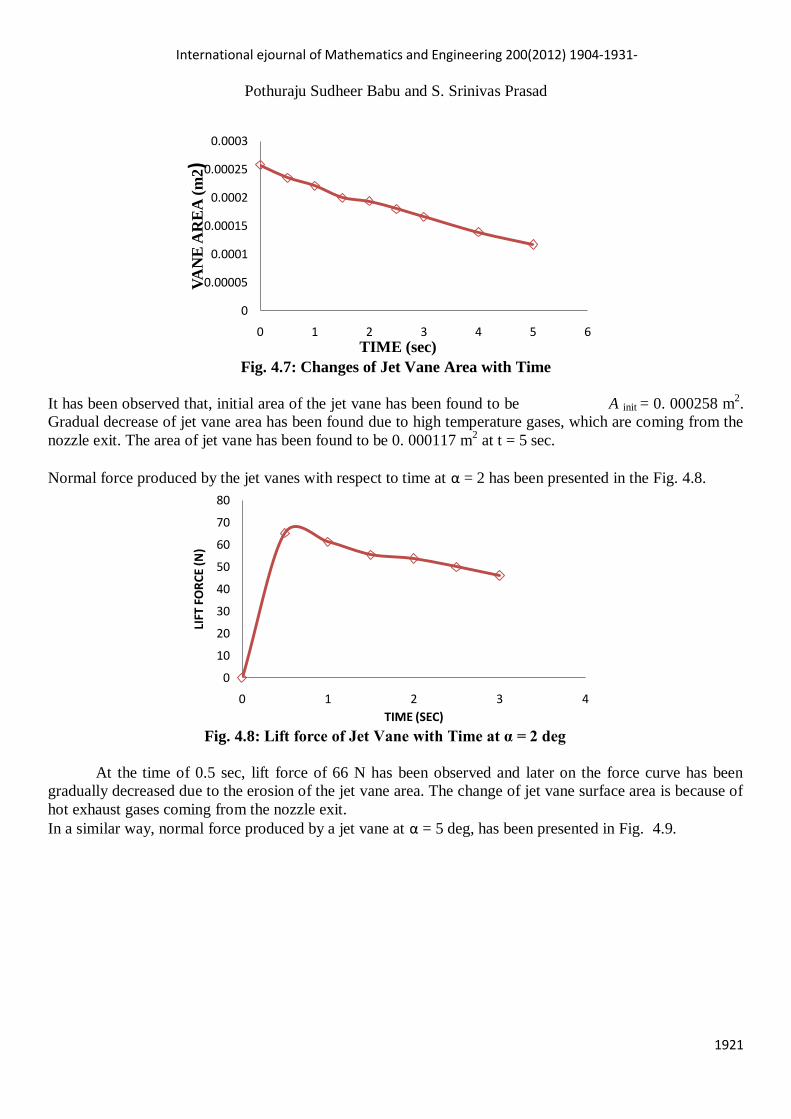
Fig. 4.7: Changes of Jet Vane Area with Time
It has been observed that, initial area of the jet vane has been found to be A init = 0. 000258 m2.
Gradual decrease of jet vane area has been found due to high temperature gases, which are coming from the
nozzle exit. The area of jet vane has been found to be 0. 000117 m2 at t = 5 sec.
Normal force produced by the jet vanes with respect to time at α = 2 has been presented in the Fig. 4.8.
Fig. 4.8: Lift force of Jet Vane with Time at α = 2 deg
At the time of 0.5 sec, lift force of 66 N has been observed and later on the force curve has been
gradually decreased due to the erosion of the jet vane area. The change of jet vane surface area is because of
hot exhaust gases coming from the nozzle exit.
In a similar way, normal force produced by a jet vane at α = 5 deg, has been presented in Fig. 4.9.
0
0.00005
0.0001
0.00015
0.0002
0.00025
0.0003
0 1 2 3 4 5 6
VA
NE
AR
EA
(m
2)
TIME (sec)
0
10
20
30
40
50
60
70
80
0 1 2 3 4
LIFT
FO
RC
E (N
)
TIME (SEC)

International ejournal of Mathematics and Engineering 200(2012) 1904-1931-
Pothuraju Sudheer Babu and S. Srinivas Prasad
1922
Fig. 4.9: Lift force of Jet Vane with Time at α = 5 deg
A force of 170 N has been observed at t = 0.5 sec due to angle deflection of jet vane. A similar curve
has been observed for all the angles, of course the force at each and every second has been changed. At t = 1
and 3.5 secs force has been observed as 155 N and 120 N due to the erosion of the jet vane area.
At the time of 0.5 sec lift force of 340 N has been observed and later on the curve trend has been
gradually decreased due to the erosion of the jet vane area. The change of jet vane surface area is because of
hot exhaust gases coming from the nozzle exit. 250 N of force has been observed at the time of sec.
Consistency of the jet vane has been found to be reduced by increase the duration of burn time
In a similar way, normal force produced by a jet vane at α = 15 deg, has been presented in Fig. 4.10.
Fig. 4.10: Lift force of Jet Vane with Time at α = 15 deg
At the angle of attack α = 15 deg, force of 490 N has been observed at t = 0.5 sec due to deflection of
the jet vane, and later on the force curve has been gradually decreased due to effect of erosion of the jet vane
surface area. This erosion is due to the hot combustion gases coming from the nozzle exit. Erosion of the
surface area results in loss of lift force by the jet vane. In this way, force of 380 N has been observed at t = 3
sec. consistency of the jet vane has been found to be reduced by increase the duration of burn time.
4. 3 EXPERIMENTAL Experiments have been carried out in the supersonic wind tunnel at Mach number 2, to evaluate the
aerodynamic performance of a jet vane and to find out whether the shape of the vane would be workable or
not. Coefficient of pressure distribution has been evaluated at different angles of attack. In the next step,
another set of experiments have been performed by placing a jet vane in the stream of hot gases of the above
0
20
40
60
80
100
120
140
160
180
200
0 1 2 3 4
LIFT
FO
RC
E (
N)
TIME (sec)
0
100
200
300
400
500
600
0 1 2 3 4
LIFT
FO
RC
E (N
)
TIME SEC

International ejournal of Mathematics and Engineering 200(2012) 1904-1931-
Pothuraju Sudheer Babu and S. Srinivas Prasad
1923
mentioned hybrid test motor to evaluate the extent of erosion on the jet vanes surface at different angles of
attack.
4. 4. 1 AERODYNAMIC PERFORMANCE
Cp distribution on both the surfaces of the jet vane at α = 0 deg has been presented in the Fig. 4.11.
Fig. 4.11: Experimental Cp of Jet Vane at α = 0 deg
It has been observed that, maximum Cp takes place at the leading edge, with a value of 0.55. The
high value is obvious due to the compression waves. The value falls sharply to approximately 0. 45 The
effect of compression is not very intense at these locations. From here onwards, a sudden drop of pressure
has been noticed, and this is due to the expansion waves (at maximum thickness of jet vane). From here
onwards it remains approximately constant at the trailing edge due to appearance of a weak compression
wave. Again the curve rises to the maximum value of Cp with a value of 0.55 due to strong compression
waves at the leading edge of the jet vane.
Cp distribution of jet vane on both surfaces at α = 5 deg, has been similarly found out and has been
presented in the Fig. 4.12.
Fig. 4.12: Experimental Cp of Jet Vane at α = 5 deg
The value of Cp at the leading edge on the upper surface has been found out to be 0. 35. This is due
to the compression waves From here onwards, due to expansion waves, a sudden drop of pressure has been
noticed (at maximum thickness of jet vane) with a value of - 0. 1. Again it remains approximately constant
-0.2
-0.1
0
0.1
0.2
0.3
0.4
0.5
0.6
-1 -0.5 0 0.5 1
Cp
x / l
upper lower
-0.2
-0.1
0
0.1
0.2
0.3
0.4
0.5
0.6
0.7
0.8
-0.8 -0.6 -0.4 -0.2 0 0.2 0.4 0.6 0.8
Cp
x / l
lower upper

International ejournal of Mathematics and Engineering 200(2012) 1904-1931-
Pothuraju Sudheer Babu and S. Srinivas Prasad
1924
due to the weak compression waves in the trailing edge at the locations from 3 to 5 in the figure. Later on,
again a slight increment of Cp has been observed to a value of – 0. 002. Maximum Cp with a value of 0.7
on the lower surface has been observed due to the strong compression waves at the leading edge of the jet
vane.
Normal force coefficient has been calculated from the experimental Cp distribution of jet vanes and
has been presented in the figure 4.13.
Fig. 4.13: Calculated CN From the Experimental Cp at different Angles of attacks.
4. 4. 2 STATIC MOTOR GROUND TEST
In this section, PVC-AP-DBP hybrid fuel grains have been subjected to combustion in a stream of
gaseous oxygen oxidizer using a hybrid test rocket motor. Jet vanes have been tested at different angles of
attack, α = 0, 5, 10, and 15 deg. All the test firings have been carried out for 3 to 5 seconds. Actual firing
time was estimated from the pressure-time history of each test firing. After each firing, the jet vane has been
carefully taken out from the shroud, for visual inspection and for carrying out the post firing erosion
measurements on the jet vane. All the measurements of the jet vane has been measured by a micro meter.
Erosion of the jet vane along the span and chord wise at α = 0 deg, has been presented in the Fig.
4.14 and Fig. 4.15.
Fig. 4.14: Span Wise Erosion of Jet Vane at α = 0 deg
00.20.40.60.8
11.21.41.61.8
0 2 4 6 8
CN
α
0
2
4
6
8
10
12
14
0 0.1 0.2 0.3 0.4 0.5 0.6 0.7 0.8 0.9
Sp
an
(m
m)
x/l
AV1
EV1

International ejournal of Mathematics and Engineering 200(2012) 1904-1931-
Pothuraju Sudheer Babu and S. Srinivas Prasad
1925
It has been observed that the portion of the jet vane has been consumed at the leading edge with a
value of 7 mm. At the location of x / l = 0. 25, thickness of the jet vane has been observed to be a value of 8.
2 mm. Later on, at the maximum thickness of the jet vane slight erosion has been observed. From here
onwards, no more erosion has been found. Overall erosion of the jet vane may effects the design of the jet
vane which results in loss of lift.
Fig. 4.15: Chord Wise Erosion of Jet Vane at α = 0 deg
It has been observed that only the leading edge of the jet vane has been slightly eroded due to the
hot combustion gases coming from the nozzle. Erosion on both the upper and lower surfaces of the jet van
have been found out to be remain unchanged due to zero angle of attack. This slight erosion may be effects
the lift force produced by the jet vanes.
Erosion of jet vane along the span and chord wise at α = 5 deg, has been found out similarly and
has been presented in the Fig.4.16 and Fig. 4.17
.
Fig. 4.16: Span wise Erosion of Jet Vane at α = 5 deg
In the same way at the angle of attack α = 5, it has been observed that the portion of the jet vane
has been consumed at the leading edge with a value of 7. 3 mm. At the location of x / l = 0. 25, thickness of
the jet vane has been observed to be a value of 8. 8 mm. Later on, at the maximum thickness of the jet vane
slight erosion has been observed. From here onwards, no more erosion has been found.
0
0.5
1
1.5
2
2.5
0 0.2 0.4 0.6 0.8 1
Ch
ord
x / l
AV 1
EV 1
0
2
4
6
8
10
12
14
0 0.2 0.4 0.6 0.8 1
spa
n (m
m)
x/l
AV2
EV2
International ejournal of Mathematics and Engineering 200(2012) 1904-1931-
Pothuraju Sudheer Babu and S. Srinivas Prasad
1926
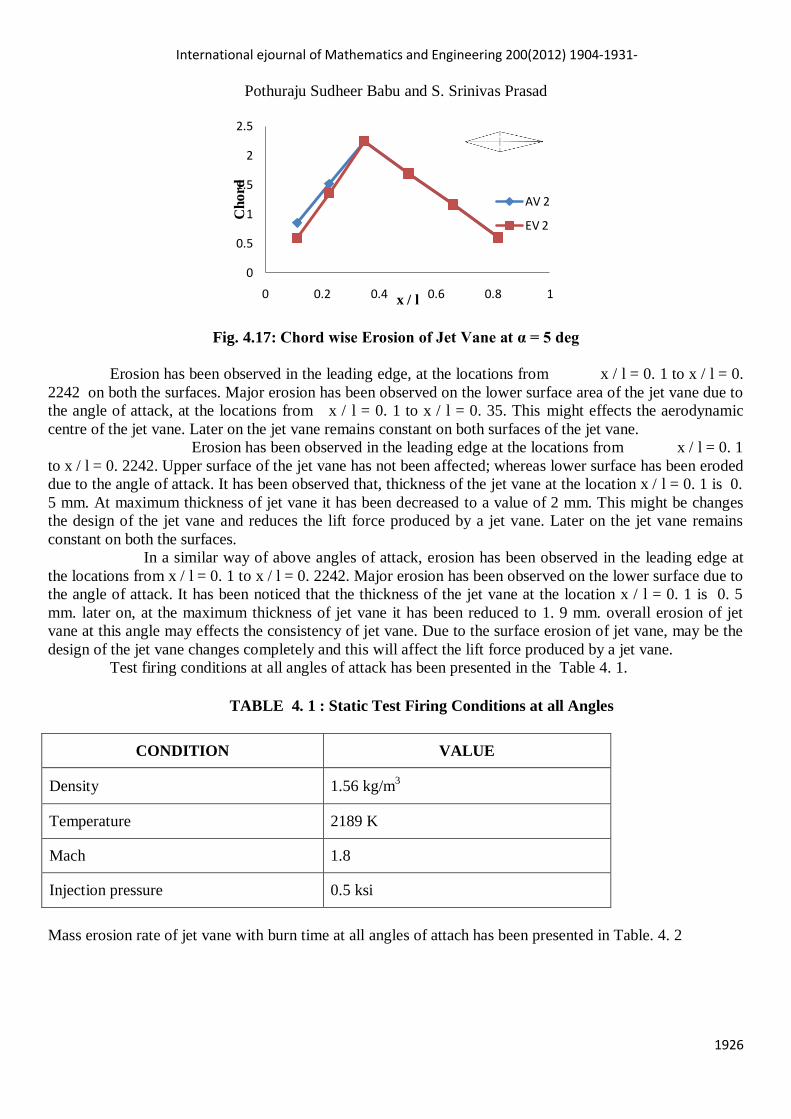
Fig. 4.17: Chord wise Erosion of Jet Vane at α = 5 deg
Erosion has been observed in the leading edge, at the locations from x / l = 0. 1 to x / l = 0.
2242 on both the surfaces. Major erosion has been observed on the lower surface area of the jet vane due to
the angle of attack, at the locations from x / l = 0. 1 to x / l = 0. 35. This might effects the aerodynamic
centre of the jet vane. Later on the jet vane remains constant on both surfaces of the jet vane.
Erosion has been observed in the leading edge at the locations from x / l = 0. 1
to x / l = 0. 2242. Upper surface of the jet vane has not been affected; whereas lower surface has been eroded
due to the angle of attack. It has been observed that, thickness of the jet vane at the location x / l = 0. 1 is 0.
5 mm. At maximum thickness of jet vane it has been decreased to a value of 2 mm. This might be changes
the design of the jet vane and reduces the lift force produced by a jet vane. Later on the jet vane remains
constant on both the surfaces.
In a similar way of above angles of attack, erosion has been observed in the leading edge at
the locations from x / l = 0. 1 to x / l = 0. 2242. Major erosion has been observed on the lower surface due to
the angle of attack. It has been noticed that the thickness of the jet vane at the location x / l = 0. 1 is 0. 5
mm. later on, at the maximum thickness of jet vane it has been reduced to 1. 9 mm. overall erosion of jet
vane at this angle may effects the consistency of jet vane. Due to the surface erosion of jet vane, may be the
design of the jet vane changes completely and this will affect the lift force produced by a jet vane.
Test firing conditions at all angles of attack has been presented in the Table 4. 1.
TABLE 4. 1 : Static Test Firing Conditions at all Angles
CONDITION VALUE
Density 1.56 kg/m3
Temperature 2189 K
Mach 1.8
Injection pressure 0.5 ksi
Mass erosion rate of jet vane with burn time at all angles of attach has been presented in Table. 4. 2
0
0.5
1
1.5
2
2.5
0 0.2 0.4 0.6 0.8 1
Ch
ord
x / l
AV 2
EV 2

International ejournal of Mathematics and Engineering 200(2012) 1904-1931-
Pothuraju Sudheer Babu and S. Srinivas Prasad
1927
Table 4. 2 : Mass Erosion Rate at all Angles of Attack
α (deg) Burn Time (sec) Mass Erosion Rate
(gm / sec)
0 5.7 0.0977
5 3.21 0.08411
10 3.96 0.127
15 3.66 0.079
4. 5 COMPARISON OF EXPRIMENTS AND COMPUTATIONS
The computed model configuration is maintained same as that of experiments, so following
comparisons has been carried out. It is has been observed that the trend followed by the curves in both
experiments and computations are almost same, but magnitude of values makes the slight difference. For the
accuracy of results more clustering of cells must be made such finer grids can be generated near the surface.
Comparison of CN graph has been presented in Fig. 4.32. Comparison of pressure distribution at different
angles has been presented in Fig.4.18, and Fig. 4.19.
Fig. 4.18: Comparision of CN at Different Angles of Attack.
0
0.2
0.4
0.6
0.8
1
1.2
1.4
1.6
1.8
0 2 4 6 8 10 12
CN
α
Compu.
Experi.
Theore.

International ejournal of Mathematics and Engineering 200(2012) 1904-1931-
Pothuraju Sudheer Babu and S. Srinivas Prasad
1928
Fig. 4.19: Comparison of Cp on Both Surfaces at α = 0 deg
It shows the good agreement between the computed and experimental Cp on the both the surface of
the jet vane at 7. 5 deg angle of attack. In the similar way from the above angle, upper surface of the jet vane
has been found to be differing. A slight difference has been found at the downstream on lower surface. It
may be, because of grid generation on the jet vane surface and the boundary conditions adopted in the
computations at the nozzle exit.
CONCLUSION:
In the present investigation, computations have been performed to evaluate the aerodynamic
performance of the Jet Vane TVC. Theoretical studies have been made to evaluate the jet vane erosion area
as also to predict the lift forces produced by the jet vanes by considering the vane erosion rate empirically.
Supersonic wind tunnel experiments have been carried out to determine the coefficient of normal force and
distribution of coefficient of pressure at Mach number 2 on both the upper and lower surfaces of a jet vane at
different angles of attack. In another experimental set up, static test motor firings have been conducted to
determine the actual jet vane erosion by placing a mild steel jet vane at different angles of attack.
The following conclusions have been made from the results obtained during experiments and
computations.
1. The value of Cp has been found to be maximum at the leading edge on both the surfaces of jet vane,
followed by a gradual decrease. Cp has been found to be very low at the trailing edge.
2. With the increase of the angle of attack the value of Cp has been found to increase more on the lower
surface of the jet vane as compared to the upper surface.
3. Strong compression waves at the leading edge have been observed in all the cases. Expansion waves
have also been found at the maximum thickness of the jet vane. At the trailing edge of the jet vane
however, weak compression wave has been found.
4. Density variations around the jet vane have been found to be constant at zero angle of attack.
5. The value of the density at the lower surface has been found to be higher than that at the upper
surface at an angle of attack. Also, the trend has been found to increase with the increase in the angle
of attack.
6. The area of the jet vane, and thereby the lift force produced by a jet vane has been found to decrease
with the increase in the duration of burning time.
7. Coefficient of lift of the jet vane has been found to increase with the increase in the angle of attack
-0.2
-0.1
0
0.1
0.2
0.3
0.4
0.5
0.6
-0.8 -0.6 -0.4 -0.2 0 0.2 0.4 0.6 0.8
Cp
x / l
Exp-U
Comp-U
Exp-L
Comp-L
upperlower

International ejournal of Mathematics and Engineering 200(2012) 1904-1931-
Pothuraju Sudheer Babu and S. Srinivas Prasad
1929
8. A portion of the leading edge has been found to have completely been consumed in all the cases. The
dimension of the consumed portion has been found to increase with the increase in the angle of
attack.
FUTURE SCOPE OF WORK
An effort has been made to investigate the thrust vector control system using jet vanes. Computations
have been carried out to evaluate the air flow condition around a jet vane. The aerodynamic performance of
jet vane at different angles of in the supersonic wind tunnel at Mach number 2 has also been studied. An
effort has also been made to evaluate the erosion effects of a mild steel jet vane in static test hybrid rocket
motor at different angles of attack.
It would be worth to carry out further studies to obtain more understanding. Some of them are listed
below.
1. It would be worth to evaluate aerodynamic performance of jet vane at higher angles of attack, the
missile makes during maneuvering.
2. Erosion rate studies by varying the jet vane material would be worth investigating, as it would give
better understanding of available control forces.
3. Experimental measurement of the lift forces by a jet vane in static test firings would give good
understanding vis- a- vis exposure duration.
4. Investigation of variation of coefficient of lift and distribution of coefficient of pressure at higher
angles of attack to simulate such maneuvering would be worth to investigate.
5. Similarly, the investigation at higher Mach numbers in supersonic regime would prove very worthy.
PLATE – 1
Jet Vane at α = 0 deg Jet Vane at α = 5 deg
(PVC + AP + DBP) (PVC + AP + DBP)
Jet Vane at α = 10 deg Jet Vane at α = 15 deg
(PVC + AP + DBP) (PVC + AP + DBP)
PLATE - 2
International ejournal of Mathematics and Engineering 200(2012) 1904-1931-
Pothuraju Sudheer Babu and S. Srinivas Prasad
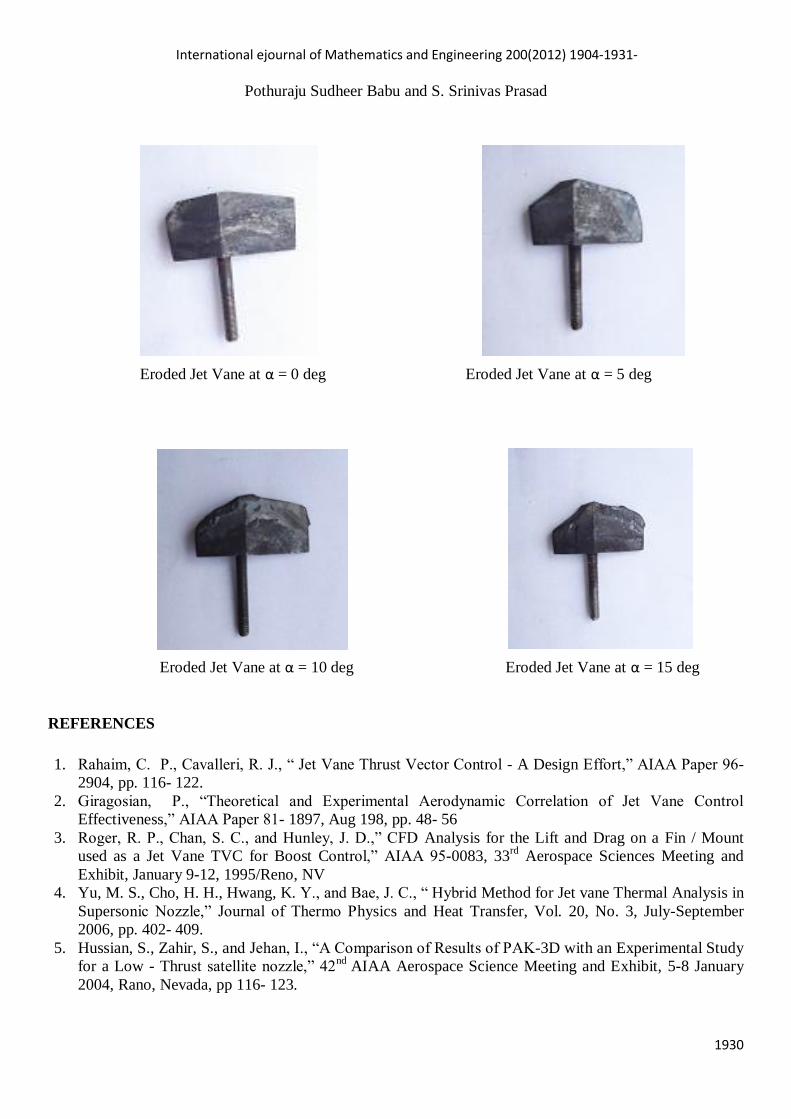
1930
Eroded Jet Vane at α = 0 deg Eroded Jet Vane at α = 5 deg
Eroded Jet Vane at α = 10 deg Eroded Jet Vane at α = 15 deg
REFERENCES
1. Rahaim, C. P., Cavalleri, R. J., “ Jet Vane Thrust Vector Control - A Design Effort,” AIAA Paper 96-
2904, pp. 116- 122.
2. Giragosian, P., “Theoretical and Experimental Aerodynamic Correlation of Jet Vane Control
Effectiveness,” AIAA Paper 81- 1897, Aug 198, pp. 48- 56
3. Roger, R. P., Chan, S. C., and Hunley, J. D.,” CFD Analysis for the Lift and Drag on a Fin / Mount
used as a Jet Vane TVC for Boost Control,” AIAA 95-0083, 33rd
Aerospace Sciences Meeting and
Exhibit, January 9-12, 1995/Reno, NV
4. Yu, M. S., Cho, H. H., Hwang, K. Y., and Bae, J. C., “ Hybrid Method for Jet vane Thermal Analysis in
Supersonic Nozzle,” Journal of Thermo Physics and Heat Transfer, Vol. 20, No. 3, July-September
2006, pp. 402- 409.
5. Hussian, S., Zahir, S., and Jehan, I., “A Comparison of Results of PAK-3D with an Experimental Study
for a Low - Thrust satellite nozzle,” 42nd
AIAA Aerospace Science Meeting and Exhibit, 5-8 January
2004, Rano, Nevada, pp 116- 123.

International ejournal of Mathematics and Engineering 200(2012) 1904-1931-
Pothuraju Sudheer Babu and S. Srinivas Prasad
1931
6. Rainvillie, P. A., deChamplain, A., and Kretchmer,D., “Unsteady CFD Calculation for Validation of a
Multi-Vane Thrust Vector Control System,” 40th
AIAA/ASME/SAE/ASEE Joint Propulsion Conference
and Exhibit
7. Murty, M. S. R., Rao, M., Chakraborty, D., “Numerical Solution of Nozzle Flow Field with Jet Vane
Thrust Vector Control,” Proc. IMechE Vol. 224 Part G: J. Aerospace Engineering, 2009, pp. 416- 424.
8. Sung, H. G., and Hwang, Y. S., “ Thrust- Vector Characteristics of Jet Vanes Arranged in X- Formation
within a Shroud,” Journal of Propulsion and Power, Vol. 20, No. 3, May- June 2004, pp. 123- 13.
9. Facciano, A. B., and Seybold, K. G., “ Evolved Sea Sparrow Missile Jet Vane Control System
Prototype Hardware Development,” Journal of Spacecrafts and Rockets, Vol. 39, No. 4, 2002, pp. 176-
183.
10. William, M., Andrew, B., Steiphen, D., “ Missile Jet Vane Control System and Method,” U.S. Patent,
No:5806791, Sep.15,1998.
11. Faupell, L. C., Wassom, S. R., and Klinger, J. , “ Vectorable Nozzle Having Jet Vanes,” U.S. Patent
Trademark Office, Patent 5, 511, 745, Filed 30 Apr 1996
12. Jacobson, M.D.,” Droppable Jet Vane Thrust Vector Control,” U.S Patent No.5082202, Jan.21st , 1992.
13. Goddard, R. H., “ Mechanism for Directing Flight,” U. S Patent No.1879187, Sep.27, 1932.
14. Robert, F. J., and Pensergraft, O. C., “Static Thrust-Vectoring Performance of Non Axisymmetric
Convergent-Divergent Nozzles with Post-Exit Yaw Vanes,” M.S. Thesis by George Washington Univ.,
Aug. 1988, , pp 126- 134.
Related Documents