Index Market View 1 Company Update 2 Around the Economy 3 Knowledge Corner 3 Mutual Fund 4 Commodity Corner 5 Forex Corner 6 Report Card 7 Short Term Call Status 8 Special Contributors Sagar Soni Dhaval Ghodasara For suggestions, feedback and queries [email protected] Outcome of Karnataka assembly elections eyed 14 MAY 2018 The government will announce consumer price inflation (CPI) and wholesale price inflation (WPI) for April 2018 on Monday, 14 May 2018. CPI and WPI stood at 4.28% and 2.47%, respectively, in March 2018. On the political front, the Karnataka Assembly elections single-phase polling will be held on Saturday, 12 May 2018. Results will be announced on Tuesday, 15 May 2018. Karnataka is one of only three states to be ruled by the Congress. Bharatiya Janata Party has been targeting the south Indian state aggressively. There are 224 seats in Karnataka. The ongoing term for the Karnataka assembly expires on 28 May 2018. On the macro front, the government will announce industrial production data for March 2018 after market hours on Friday, 11 May 2018. India's indus- trial output grew 7.1% in February 2018 from a year earlier, easing from a down- wardly revised 7.4% expansion in the previous month. Japan GDP preliminary growth rate for Q1 will be declared on Wednesday, 16 May 2018. The Japanese economy advanced 0.4% quarter-on-quarter in De- cember quarter 2017, much stronger than the preliminary estimate of a 0.1% ex- pansion and after a 0.6% growth in the prior quarter. US retail sales for April 2018 will be unveiled on Tuesday, 15 May 2018. US re- tail trade rose by 0.6% month-over-month in March 2018, recovering from a 0.1% drop in February 2018. Weaker opening and correction first to 10751-10690 can be used for buying with a stop loss of 10600. Expect higher range of 10867-10927 to be tested. Overall as a result of a rise and close above 10785, Nifty can be expected to test 11171 in near term as long as 10600 is not violated. Kamal Jhaveri MD- Jhaveri Securities - 1 - Vol.: 371 14 MAY ,2018

Welcome message from author
This document is posted to help you gain knowledge. Please leave a comment to let me know what you think about it! Share it to your friends and learn new things together.
Transcript
Index
Market View 1 Company Update 2 Around the Economy 3 Knowledge Corner 3 Mutual Fund 4 Commodity Corner 5 Forex Corner 6 Report Card 7 Short Term Call Status 8 Special Contributors Sagar Soni Dhaval Ghodasara For suggestions, feedback and queries [email protected]
Outcome of Karnataka assembly elections eyed
14 MAY 2018
The government will announce consumer price inflation (CPI) and wholesale price inflation (WPI) for April 2018 on Monday, 14 May 2018. CPI and WPI stood at 4.28% and 2.47%, respectively, in March 2018. On the political front, the Karnataka Assembly elections single-phase polling will be held on Saturday, 12 May 2018. Results will be announced on Tuesday, 15 May 2018. Karnataka is one of only three states to be ruled by the Congress. Bharatiya Janata Party has been targeting the south Indian state aggressively. There are 224 seats in Karnataka. The ongoing term for the Karnataka assembly expires on 28 May 2018. On the macro front, the government will announce industrial production data for March 2018 after market hours on Friday, 11 May 2018. India's indus-trial output grew 7.1% in February 2018 from a year earlier, easing from a down-wardly revised 7.4% expansion in the previous month. Japan GDP preliminary growth rate for Q1 will be declared on Wednesday, 16 May 2018. The Japanese economy advanced 0.4% quarter-on-quarter in De-cember quarter 2017, much stronger than the preliminary estimate of a 0.1% ex-pansion and after a 0.6% growth in the prior quarter. US retail sales for April 2018 will be unveiled on Tuesday, 15 May 2018. US re-tail trade rose by 0.6% month-over-month in March 2018, recovering from a 0.1% drop in February 2018. Weaker opening and correction first to 10751-10690 can be used for buying with a stop loss of 10600. Expect higher range of 10867-10927 to be tested. Overall as a result of a rise and close above 10785, Nifty can be expected to test 11171 in near term as long as 10600 is not violated.
Ka ma l Jhaver i
MD- Jha ver i Secur i t ies
- 1 -
Vol.: 371 14 MAY ,2018

- 2-
Company Basics
BSE Code 540767
NSE Symbol RNAM
EQUITY (` in Cr.) 51.42
MKT.CAP (` in Cr.) 15710
Financial Basics
FV (`) 10.00
EPS (`) (TTM) 7.76
P/E (x) (TTM) 34.00
P/BV (x) (TTM) 35.82
Share Holding Pattern
Holder's Name % Holding Promoter 85.75 Public 14.25
Company Overview :
Reliance Nippon Life Asset Management Ltd (RNAM) is the second largest profitable and the third largest in AUM with a market share of 11.4%. It is promoted by the ADAG group and Nippon Life of Japan. It provide various ser-
vices such as Mutual fund, Portfolio Management (PMS), alternative funds and offshore funds.
Investment Rationale for Reliance Nippon Asset management:
It is one of the largest AMC and second most profitable with a market share of 11.4%.
Strong growth in AUM led by macro factors like rise in financial savings, growing demand from mutual fund,
foot-print in to the smaller towns.
RNAM has been having strong return ratios in excess of 20% for the last three years. With revenue growth of
7.8%, 9.6%, 13.1% and 14.4% for the last four years the company is strongly placed.
The growing trend of mutual fund and its acceptance by public as an investment tool also further pro-
vide the room for the growth of the mutual fund.
The industry is expected to grow at a 25% CAGR which provides the further growth opportunities. Mu-
tual funds are in a sweet spot.
The Indian MF AUM is only the 18.3% of bank deposit which is very low in comparison to other devel-
oped countries, provide significant scope for the growth of mutual fund industry in the coming years.
Outlook and valuation : We recommend BUY on the stock and value RNAM at 9x F Y 1 9 E EPS with a ta r get pr i ce of Rs. 3 2 0 & P/E of 3 6 .
Company Update : RELIANCE NIPPON LIFE ASSET MANAGEMENT LTD
Vol.: 371 14 MAY ,2018

- 3-
Weekly Market Recap : Domestic stocks logged strong gains in the week boosted by upbeat global cues. Steady buying in index pivotals
pushed the Sensex above the psychologically important 35,000 level. The Sensex and the Nifty, both, settled at
their highest closing level in more than 14 weeks. However, small and mid-cap stocks underperformed the Sen-
sex.
Market ended with strong gains on Friday, 11 May 2018, tracking positive leads from Asian markets and overnight
gains on the Wall Street. The barometer index, the S&P BSE Sensex, rose 289.52 points or 0.82% to settle at
35,535.79. The Nifty 50 index rose 89.95 points or 0.84% to settle at 10,806.50. Global risk appetite got a boost
from soft US inflation, helping alleviate worries of faster rate hikes by the Federal Reserve.
Market Eye Week ahead :
The government will announce consumer price inflation (CPI) and wholesale price inflation (WPI) for April 2018 on Monday, 14 May 2018. CPI and WPI stood at 4.28% and 2.47%, respectively, in March 2018. . On the global front, China industrial production data for April 2018 will be unveiled on Tuesday, 15 May 2018. China's industrial production rose by 6% year-on-year in March 2018, after a 7.2% gain in the previous period. Japan GDP preliminary growth rate for Q1 will be declared on Wednesday, 16 May 2018. The Japanese economy advanced 0.4% quarter-on-quarter in December quarter 2017, much stronger than the preliminary estimate of a 0.1% expansion and after a 0.6% growth in the prior quarter. Key Events / Factors to Watch
1. Mon : Results : Blue star ltd, lal pathlabs ltd , Hindustan Unilever ltd, South Indian bank ltd,
2. Tue : Results: Lupin ltd , PNB, Syndicate bank, Karnataka Bank , Britannia industries ltd .
3. Wed : Results: AIA engineering ltd, Axis Bank , ITC , Muthoot finance ltd, Tata steel ltd.
4. Thu: Results: Bajaj finance ltd, Bajaj Finserv ltd, Escorts ltd , Voltas ltd.
5 . Fri : Results: Amara Raja Betteries ltd , Ashok Leyland ltd, Bajaj Auto ltd, Tata Chemicals ltd .
RSI
The Relative Strength Index (RSI), developed by J. Welles Wilder, is a momentum oscillator that measures the speed and change of price movements. The RSI oscillates between zero and 100. Traditionally the RSI is considered overbought when above 70 and oversold when below 30.
Why it is important? Traditionally the RSIis considered overbought when above 70 and oversold when below 30. The RSI is often used in conjunction with trend lines, as trend line support or resistance often coincides with support or resistance levels in the RSI reading.
Around The World
Vol.: 371 14 MAY 2018
Knowledge Corner :

Mutual Fund Corner
- 4-
Source : - www.valueresearchonline.com
Fund Name
Scheme Name Axis Focused 25 fund
AMC Axis mutual fund
Type Open Ended & Equity– Multicap
Category Open-ended
Launch Date 28th march 2018
Fund Manager Mr Jinesh Gopani (CIO axis mutual fund )
Net Assets
( In crore ) 3154cr
Top 10 Sector Break-Ups
Sector Weights Fund (%)
Financial 39.52
Construction 6.03
Automobile 16.09
Healthcare 3.05
IT 8.27
Services 6.46
Con.Durable 3.05
Textiles 3.07
Chemicals 8.93
Composition (%)
Equity 94.47
Debt 5.69
Cash -0.16
Risk Analysis
Volatility Measures
Standard Deviation 15.19
Sharpe Ratio 0.87
Beta 1.03
R-Squared 0.90
Alpha 3.60
History 2015 2016 2017 2018
NAV (Rs) 17.56 18.36 26.65 27.21
Total Return (%) 3.91 4.56 45.15 2.10
Rank (Fund/Category) 60/173 83/143 19/118 3/132
52 Week High (Rs) 18.82 20.44 26.65 -
52 Week Low (Rs) 16.56 15.05 18.32 -
Net Assets (Rs.Cr) 331.47 764.78 2278.71 2959.08
Expense Ratio (%) 3.12 3.07 2.74 -
Fund Style
Investment Style Growth Blend Value
Large
Medium
Small
Capita
lizatio
n
Vol.: 371 14 MAY ,2018
Fund Performance v/s Nifty 50
—– Fund —– Nifty 500 (Rebased to 10,000)

Commodity Corner
- 5-
FUNDAMENTAL: Bullion prices ended with gains on weekly basis as support seen as the dollar weakened and investors grew a bit less confident about prospects that the Federal Reserve would raise interest rates three more times in 2018. St. Louis Federal Reserve Bank President James Bullard said aggressive rate increases would risk nipping off U.S. business investment. Bond market investors remain confident the Fed will hike rates in June, but less sure of prospects for rate hikes in September and December.
RECOMMENDATION . BUY GOLD JUN 2018 @ 31300 SL 31000 TGT 31650-31800 ,BUY SILVER JUL 2018 @ 40100 SL
39700 TGT 40600-41200
FUNDAMENTAL : Aluminium ended the week in negative territory as the market corrected after a recent price surge on U.S. sanc-tions against the world’s largest producer and its major shareholder. Glencore and United Company Rusal have asked the London Metal Exchange to temporarily lift its suspension on Rusal’s aluminium after an extension of the deadline for companies to wind down contracts with the Russian firm under U.S. sanctions said. Russian alu-minium giant Rusal warned of expected harm to its business from U.S. sanctions, sending its share price lower despite the company reporting a 20 percent jump in first-quarter core profit. On-warrant stocks in aluminium - those not earmarked for delivery - fell by3,250 tonnes to 860,700 tonnes. RECOMMENDATION : SELL COPPER JUN 2018 @ 470.00 SL 476.00 TGT 462.00-454.00.,SELL ZINC MAY 2018 @ 211.00 SL
215.00 TGT 207.00-204.00.,BUY NICKEL MAY 2018 @ 920.00 SL 900.00 TGT 960.00-985.00. ,BUY ALUMINIUM MAY 2018 @
152.00 SL 149.00 TGT 156.00-160.00. BUY LEAD MAY 2018 @ 157.00 SL 154.00 TGT 160.00-164.00.
FUNDAMENTAL :
Hedge funds and money managers slashed their bullish wagers on U.S. crude in the latest week to the lowest level in nearly five months, data showed, in the lead-up to U.S. President Donald Trump's decision to pull out of the Iran nuclear pact. The speculator group cut its combined futures and options position in New York and London by 8,831 contracts to 435,230 in the week to May 8, the U.S. Commodity Futures Trading Commission (CFTC) said. That was the lowest level since the week to Dec. 19. Net long positioning in ICE Brent crude futures and op-tions fell by 22,009 contracts to 569,448 contracts, the lowest level since March 20.
RECOMMENDATION : BUY CRUDEOIL MAY 2018 @ 4650 SL 4550 TGT 4780-4880 ,BUY NAT GAS MAY 2018 @ 186.00 SL
182.00 TGT 192.00-195.00.
BULLION
BASE METALS
ENERGY
Vol.: 371 14 MAY,2018
- 7-
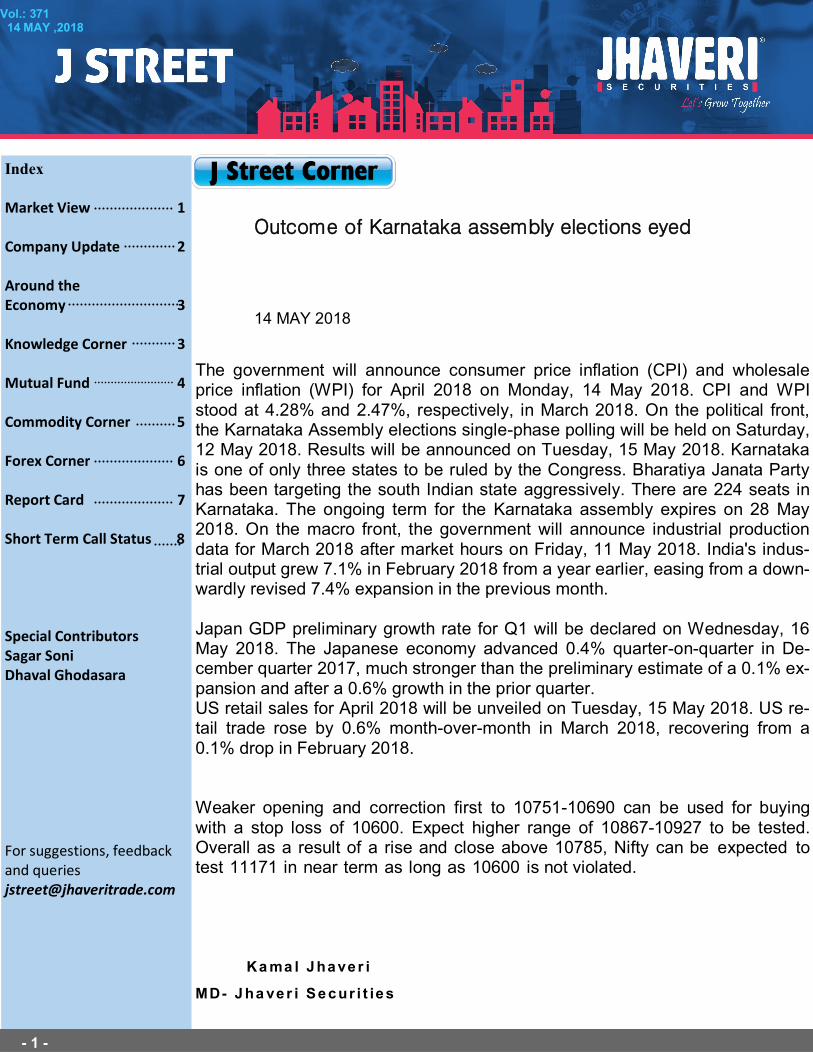
J Street Recommendations Report Card
Top Fundamental Stocks
Stocks Rec. Date CMP on Rec. CMP Target
Absolute Return @
CMP Status
Reliance Nippon asset 5/2/2018 270 247 320 0% Accumulate
KEC International 11/9/2017 310 411 384 35% Accumulate
Maruti Suzuki 30/06/2017 7220 8715 10200 22% Buy
DHFL Ltd 27/06/2017 430 624 660 23% Buy
Manappuram Finance 30/05/2017 87 119 130 3% Accumulate
Godrej Properties 12/5/2017 508 812 740 51% Buy
TVS Motor 24/04/2017 485 619 790 39% Buy
DCB Bank 17/04/2017 175 188 230 -7% Buy
REC Ltd 27/03/2017 175 115 220 -20% Accumulate
Petronet 20/02/2017 200 214 290 17% Buy
Escorts 6/2/2017 410 941 790 113% Buy
Edelweiss Financial 16/11/2016 117 298 300 132% Buy
IOC Ltd 27/02/2017 188 168 245 1% Accumulate
Marico 20/02/2016 255 310 370 20% Buy
Mother Sumi 3/4/2017 300 336 460 3% Buy
Lic Hsg Finc 27/03/2017 608 500 700 -16% Buy
Asian Paints 10/3/2017 1030 1298 1260 7% Buy
NBCC India 20/03/2017 175 98 270 9% Buy
M&M 12/1/2015 619 850 1550 18% Buy
“Go for a business that any idiot can run-because sooner or later, any idiot probably is going to run it.”
Vol.: 371 14 MAY ,2018
Nifty last week opened at 10653.15 and remained above it previous weeks low of 10601.60.The low registered last week was
10635.65 and moved up to cross its previous week high of 10784.The high registered last week was 10812.05 and closed the week at
10806.50.Nifty finally closed the week at 10806.5 thereby showed a net rise of 1.77% on week to week basis. Weaker opening and
correction first to 10751-10690 can be used for buying with a stop loss of 10600.Expect higher range of 10867-10927 to be tested.
Overall as a result of a rise and close above 10785, Nifty can be expected to test 11171 in near term as long as 10600 is not violated.

- 7-
Forex Corner
Vol.: 371 14 MAY ,2018
The dollar has been boosted by rising U.S. yields and the prospect of a faster pace of rate hikes by the Federal Reserve this year. Expecta-tions of higher interest rates make the dollar more attractive to in- vestors seeking yield.
The bank cut growth forecasts, saying it now expects the UK econ-omy to expand just 1.4% this year, down from 1.8% expected three months ago. The growth outlook for 2019 and 2020 was also down- graded, from 1.8% to 1.7%.
China's producer inflation picked up for the first time in seven months
in April, bolstered by surging commodities prices and suggesting its
industrial demand remains resilient even as trade tensions ratchet up
with the United States.
Market Recap :
Market Eye Week ahead :
The USDINR opened on positive territory and traded range bound on Thursday session. On the daily chart, pair has
been forming high top & higher bottom formation; which suggest bullish rally will continue further for near term. More-
over, a momentum indicator RSI (14) has sustained at overbought zone and still showing good strength with positive
crossover. On the above technical studies & parameter, we expect bullish move in the prices towards 67.90 level.
USD/INR
Level S2 S1 CP R1 R2
USD/INR 67.00 67.33 67.48 67.57 67.96
EUR/INR
Level S2 S1 CP R1 R2
EUR/INR 79.64 80.02 80.12 80.26 80.60
GBP/INR
Level S2 S1 CP R1 R2
GBP/INR 90.72 91.31 91.46 91.68 92.20
JPY/INR
Level S2 S1 CP R1 R2
JPY/INR 61.12 61.45 61.60 61.69 62.08

- 7-
J Street Short Term Call Status
Vol.: 371 14 MAY ,2018
Sr.
No. DATE STOCK
BUY/SELL
RANGE RANGE TRIGGER
PRICE TGT SL STATUS
% RETURN
1 26-Mar-18 OIL BUY 344 353 348.50 371.00 331 SL -3.6
2 27-Mar-18 INDIGO BUY 1264 1288 1276.00 1351.00 1228 TA 4.4
3 28-Mar-18 SRTRANSFIN BUY 1430 1455 1442.50 1536.00 1387 TA 4.5
4 3-Apr-18 VOLTAS BUY 616 624 620.00 664.00 598 TA 3.8
5 4-Apr-18 RELAXO BUY 658 667 662.50 687.00 651 TA 4.4
6 5-Apr-18 ESCORTS BUY 872 878 875.00 898.00 866 TA 4.4
7 6-Apr-18 UJJIVAN BUY 378 381 379.50 396.00 368 TA 4.6
8 9-Apr-18 MINDTREE BUY 822 836 829.00 871.00 804 TA 4.6
9 10-Apr-18 BHARATFIN BUY 1145 1162 1153.50 1216.00 1118 EXIT .
10 11-Apr-18 IRB BUY 254 260 257.00 276.00 246 TA 4.4
11 12-Apr-18 DCBBANK BUY 174 179 176.50 188.00 168 TA 4.6
12 13-Apr-18 HAVELLS BUY 544 552 548.00 583.00 526 EXIT .
13 16-Apr-18 PIDILITIND BUY 1010 1028 1019.00 1072.00 978 TA 4.4
14 17-Apr-18 DHFL BUY 561 580 570.50 623.00 536 TA 4.6
15 18-Apr-18 PETRONET BUY 240 245 242.50 261.00 232 SL -3.8
16 19-Apr-18 VGAURD 241 246 259 252.50 269.00 230 SL -3.6
17 20-Apr-18 ARVIND BUY 428 433 430.50 464.00 408 SL -3.6
18 23-Apr-18 COALINDIA BUY 287 295 291.00 312.00 278 SL -3.6
19 24-Apr-18 AUROPHRMA BUY 628 644 636.00 686.00 603 SL -3.4
20 25-Apr-18 MOTHERSUMI BUY 351 359 355.00 376.00 338 SL -3.6
21 26-Apr-18 M&M BUY 848 860 854.00 916.00 821 EXIT .
22 30-Apr-18 PVR BUY 1420 1440 1430.00 1492.00 1364 TA 4.2
23 2-May-18 UBL BUY 1172 1208 1190.00 1265.00 1131 OPEN .

- 7-
J Street Short Term Call Status
Vol.: 371 14 MAY ,2018
Sr. No. DATE STOCK BUY/SELL
RANGE RANGE TRIGGER
PRICE TGT SL STATUS
% RETURN
24 3-May-18 ASIANPAINT BUY 1206 1230 1218.00 1282.00 1168 TA 4.4
25 4-May-18 CONCOR BUY 1348 1364 1356.00 1431.00 1312 OPEN .
26 7-May-18 ICICIPRULI BUY 431 442 436.50 462.00 416 TA 3.8
27 8-May-18 GAIL BUY 338 346 342.00 372.00 320 OPEN .
28 9-May-18 CROMPTON BUY 248 250 249.00 265.00 235 OPEN .
29 10-May-18 FSL BUY 70 72 71.00 78.00 64 OPEN .
30 11-May-18 MAHLOG BUY 560 572 566.00 612.00 536 OPEN .
STATUS CALLS RATIO
TA+PB 14 66.67
SL+EXIT 07 33.33
TOTAL 21 100.00
One call on daily basis is given keeping view of short term trading on closing basis. Time frame and expected % of return is also mentioned with the suggested call. This call are purely given on technical trading system generated by the Technical Research Desk. Generally Expected Return on investment is 5-6 % with time horizon of 6-7 days. Profit Booking update is considered if on an average expected return exceed 3.50-4.00 % against the
Expected return of 5-6% Risk- Reward ratio percentage wise depends on the volatility of stock Normally it stands ( 3 : 9)

Vol.: 371 14 MAY ,2018
Related Documents


![Edelweiss [1]](https://static.cupdf.com/doc/110x72/577d29e11a28ab4e1ea8224e/edelweiss-1.jpg)