Internal Reforming and Mass Transport Properties of a Reaction Sintered Ni-YSZ and a Novel Porous Metal Support for SOFC Applications. Michael G. McNeeley ______________________________________________________

Welcome message from author
This document is posted to help you gain knowledge. Please leave a comment to let me know what you think about it! Share it to your friends and learn new things together.
Transcript

Internal Reforming and Mass Transport Properties of a
Reaction Sintered Ni-YSZ and a Novel Porous Metal
Support for SOFC Applications.
Michael G. McNeeley
______________________________________________________

Internal Reforming and Mass Transport Properties of a
Reaction Sintered Ni-YSZ and a Novel Porous Metal
Support for SOFC Applications.
Michael G. McNeeley
A 30 ECTS credit units Master´s thesis
Advisor:
Dr. Neal Sullivan
Assistant Professor: Colorado School of Mines, Department of Engineering
Director: Colorado Fuel Cell Center
A Master´s thesis done at
RES | The School for Renewable Energy Science
in affiliation with
University of Iceland &
University of Akureyri
Akureyri, February 2011

Internal Reforming and Mass Transport Properties of a Reaction Sintered Ni-YSZ and a
Novel Porous Metal Support for SOFC Applications.
A 30 ECTS credit units Master´s thesis
© Michael G. McNeeley, 2011
RES | The School for Renewable Energy Science
Solborg at Nordurslod
IS600 Akureyri, Iceland
Telephone + 354 464 0100
www.res.is
Printed in (date)
at Stell Printing in Akureyri, Iceland

i
ABSTRACT
High temperature solid oxide fuel cells have the capability of reforming conventional
hydrocarbon fuels into hydrogen directly within the fuel cell anode itself. These systems
can achieve efficiencies much greater than current electricity generation techniques using
the combustion of fuel. The design of a high performing internal reforming SOFC system
is extremely challenging because the anode must function as both fuel reformer and
electrochemical anode. The risk of carbon formation in the anode structure itself is a
serious concern because the reforming environment is coupled to both reforming activity
and the electrochemical activity of the anode. Anode materials must be carefully
engineered to perform in this environment.
SOFC systems are currently limited by their dependence on ceramic cell components. The
use of these components prevents rapid thermal cycling of the SOFC systems giving them
poor rapid start up and load following capabilities. To help alleviate these issues, SOFCs
using a metal support are being developed. Internal reforming metal supported SOFC
systems are extremely well suited for both mobile auxiliary power units and stationary
backup power systems, due to their enhanced thermal cycling capabilities.
Utilizing the unique Separated Anode Experiment at the Colorado School of Mines the
internal reforming and mass transport characteristics of a conventional ceramic anode and
a porous metal support are evaluated independent of electrochemical operation. This
experiment provides analysis of the anode morphology and how it affects species transport
through the structure. These results provide insight to the future design efforts for both
ceramic and metal supported SOFC system.

ii
PREFACE
This thesis is made on the topic of mass transport and internal reforming kinetics of SOFC
anodes and supports. It is prepared by the author to satisfy the graduation requirements for
a M.Sc. degree in Renewable Energy Science from RES| The School for Renewable
Energy Science. RES is a joint graduate program between the University of Iceland in
Reykjavik Iceland and the University of Akureyri in Akureyri Iceland. All work detailed
in this report was conducted between October 2010 and February 2011, while in residence
at the Colorado Fuel Cell Center at the Colorado School of Mines in Golden Colorado.
The advisor for this project was Dr. Neal Sullivan asst. professor of Engineering at the
Colorado School of Mines and director of the Colorado Fuel Cell Center. This thesis was
defended before a University of Iceland and University of Akureyri approved defense
committee on February 10, 2011 at Nýsköpunarmiðstöð Íslands (Icelandic Center of
Innovation) in Reykjavik. Members of the thesis defence committee were; Dr. Þorsteinn
Ingi Sigfusson, professor of Physics at the University of Iceland, director general of the
Icelandic Center of Innovation, coordinator of Hydrogen Systems and Fuel Cells
concentration at RES| The School for Renewable Energy Science; Dr. David Dvorak,
professor of Mechanical Engineering Technology at University of Maine, coordinator of
Hydrogen Systems and Fuel Cells concentration at RES| The School for Renewable
Energy Science; Dr. Neal Sullivan asst. professor of Engineering at the Colorado School of
Mines and director of the Colorado Fuel Cell Center; and Dr. Guðmundur Gunnarsson of
the Icelandic Center of Innovation, as examiner.
This work was prepared solely by the author and constitutes an original scientific work;
however, like all scientific work, this thesis is possible only because of the previous work
of others. All efforts were made to reference and cite all works that contributed directly to
the writing of this thesis.

iii
ACKNOWLEDGEMENTS
There are several entities that I would like to thank for assisting me with this thesis and
over the course of my studies. I would like to thank the RES administration and staff for
their assistance throughout this year in Iceland and the universities of Iceland and Akureyri
for providing academic and facility support for the RES program. This research was
conducted at the Colorado Fuel Cell Center at the Colorado School of Mines. I am
thankful and appreciative for the facilities and support provided by the CFCC and CSM.
Finally I would like to thank Plansee SE for supplying the ITM samples used in this work.
I received assistance from several individuals while conducting my research. I would like
to thank; Shaun Babiniec for his ceramics expertise and sample preparation; Nicolaus
Faino, Gary Zito, and John Chandler for assistance with the SEM work; Professor Robert
Kee for his modeling background and illustrations used extensively in this report;
Guðmundur Gunnarsson for his participation on my defense committee as examiner, The
Hydrogen Systems and Fuel Cells concentration coordinators Þorsteinn Sigfusson and
David Dvorak for their guidance, suggestions and logistical support; and Amber Waite and
Mike Lindemann for their editing assistance and useful feedback.
Two people, above all others, worked with me to insure the high academic quality of this
work, my advisor Dr. Neal Sullivan and PhD. candidate Amy Richards, both at the CFCC.
Dr. Sullivan was instrumental in securing the samples used, securing financial support, and
academic support for this work. He is a talented and dedicated educator who values his
students and wants to see them all succeed. Amy Richards has worked on the SAE
apparatus and computational model used in this work for over two years as a graduate
student at CSM. Her years of effort have made the SAE a highly repeatable and effective
experiment. In many ways Amy acted as a second advisor for this project and without her
and her expertise, this thesis would not have been possible.
Finally, I would like to dedicate this work to my parents, Mike and Alda McNeeley, and
my wonderful girlfriend, Amber Waite. Their undying and unconditional support has been
the pillar that I have leaned on throughout this experience.

v
TABLE OF CONTENTS
Preface .............................................................................................................................. ii
Acknowledgements .......................................................................................................... iii
List of abbreviations ......................................................................................................... xi
List of symbols .............................................................................................................. xiii
1 Introduction ................................................................................................................... 1
1.1 Types of fuel cell .................................................................................................... 2
1.2 The role of catalysts ................................................................................................ 2
1.3 Fuel requirements ................................................................................................... 3
1.4 Fuel reforming ........................................................................................................ 4
1.4.1 Steam reforming ............................................................................................4
1.4.2 Partial oxidation reforming ............................................................................5
1.4.3 Water gas shift...............................................................................................6
1.4.4 Autothermal reforming ..................................................................................6
1.4.5 CO2 dry reforming .........................................................................................7
1.4.6 Carbon formation ..........................................................................................7
1.5 Fuel reforming systems ........................................................................................... 8
1.5.1 External reforming systems ...........................................................................8
1.5.2 Internal reforming systems ............................................................................9
1.6 The SOFC .............................................................................................................. 9
1.6.1 SOFC operation ........................................................................................... 10
1.7 Objective .............................................................................................................. 13
1.8 Approach .............................................................................................................. 14
2 Background ................................................................................................................. 15
2.1 Current SOFC materials........................................................................................ 15
2.1.1 SOFC cell construction ................................................................................ 15
2.1.2 SOFC anode functionality ........................................................................... 17
2.1.3 Zirconia based anodes ................................................................................. 18
2.1.4 Perovskite based anodes .............................................................................. 19
2.1.5 Ceria based anodes ...................................................................................... 19
2.1.6 Internal reforming considerations ................................................................ 19
2.1.7 Inert barrier layers ....................................................................................... 21
2.1.8 Reforming specific catalyst layers ............................................................... 21
vi
2.2 Metal supported cells ............................................................................................ 22
2.2.1 Nickel based metal supports ........................................................................ 23
2.2.2 Iron based metal supports ............................................................................ 24
2.3 Operation temperature .......................................................................................... 29
2.4 Ceramic cell components for metal supported cells ............................................... 29
2.4.1 Zirconia electrolytes and anodes .................................................................. 30
2.4.2 Ceria based electrolytes and anodes ............................................................. 30
2.4.3 LSGM electrolytes ...................................................................................... 31
2.5 Processing issues associated with metal supported cells ........................................ 32
3 Experimental Method .................................................................................................. 33
3.1 Sample fabrication ................................................................................................ 33
3.1.1 CoorsTek reaction-sintered Ni-YSZ Anode ................................................. 33
3.1.2 Plansee porous ITM support ........................................................................ 34
3.2 Sample characterization ........................................................................................ 34
3.2.1 Scanning electron microscopy of anode and support .................................... 35
3.2.2 Porosimetry measurements .......................................................................... 35
3.3 The separated anode experiment ........................................................................... 35
3.3.1 SAE design .................................................................................................. 37
3.3.2 Start up and maintenance procedure............................................................. 39
3.3.3 CO2 transport experiments ........................................................................... 40
3.3.4 Methane dry reforming tests ........................................................................ 41
3.3.5 Experimental repeatability ........................................................................... 41
3.3.6 Discussion on the use of dry reforming ........................................................ 42
4 Computational model .................................................................................................. 43
4.1 Flow in channels ................................................................................................... 43
4.2 Transport and chemistry within porous anode ....................................................... 44
4.3 Computational algorithm ...................................................................................... 48
5 Experimental results .................................................................................................... 49
5.1 Visual observations pre and post run ..................................................................... 49
5.2 Porosimetry results ............................................................................................... 50
5.2.1 Liquid picnometry results ............................................................................ 50
5.2.2 Mercury porosimetry results ........................................................................ 51
5.3 SEM analysis ........................................................................................................ 53
5.3.1 Pre Run Plansee ITM support compared to post run ITM support ................ 56
5.4 Separated anode experiment results ...................................................................... 59

vii
5.4.1 SAE CO2 transport results ........................................................................... 59
5.4.2 CO2 transport model results ......................................................................... 62
5.4.3 CH4 dry reforming results ............................................................................ 68
5.4.4 CH4 dry reforming model results ................................................................. 71
6 Conclusions ................................................................................................................. 74
7 Works Cited .................................................................................................................. 1

viii
LIST OF FIGURES
Figure 1- Diagram of internal reforming SOFC processes ................................................... 11
Figure 2- Schematic of the various SOFC cell architectures ................................................ 16
Figure 3- Oxide growth behavior of Plansee ITM compared to ingot based Fe22Cr
substrate. .......................................................................................................... 28
Figure 4- Cutaway illustration of the Separated Anode Experiment setup ............................ 37
Figure 5- Exploded view of SAE manifold assembly and anode sealing process ................. 38
Figure 6- Frame work for the CFCC computational model .................................................. 43
Figure 7- Images of CoorsTek Ni-YSZ anode ..................................................................... 49
Figure 8- Images of Plansee ITM support ............................................................................ 49
Figure 9- Cross-sectional images of the samples after running in the SAE ........................... 50
Figure 10- Mercury intrusion data for CoorsTek NiYSZ ..................................................... 52
Figure 11-Mercury intrusion data from ITM sample. ........................................................... 53
Figure 12- Cross-sectional images of the of the Ni-YSZ and ITM sample ........................... 54
Figure 13- Surface images of the of the Ni-YSZ and ITM samples ...................................... 55
Figure 14- Cross-sectional images of Plansee ITM pre and post run in the SAE. ................. 57
Figure 15- Surface images of Plansee ITM pre and post run in the SAE. ............................. 58
Figure 16- CO2 transport, fuel side CO2 mole fraction for Ni-YSZ and ITM samples .......... 59
Figure 17- CO2 transport, CO Mole fraction in SAE exhaust streams of Ni-YSZ
and ITM sample ................................................................................................. 60
Figure 18- CO2 transport, H2 mole fraction in SAE exhaust streams of Ni-YSZ and
ITM sample ....................................................................................................... 60
Figure 19- CO2 Transport, Corrected “Total Carbon” transport ........................................... 62
Figure 20- CO2 transport CoorsTek fuel-side exhaust composition ...................................... 63
Figure 21- CO2 transport CoorsTek electrolyte-side exhaust composition ........................... 64
Figure 22- CO2 transport Plansee ITM fuel-side exhaust composition.. ............................... 64
Figure 23 - CO2 transport Plansee ITM electrolyte-side exhaust composition ...................... 65
Figure 24 - Illustration of the interactions between flow driving forces as represented
by the Dusty Gas Model .................................................................................... 67
Figure 25 - CH4 dry reforming – Reforming product exhaust gas concentrations ................. 69

ix
Figure 26 - CH4 dry reforming – Reforming reactant exhaust gas concentrations ................ 70
Figure 27- Comparison between fuel side exhaust gas CO2 concentration of the CO2
transport and CH4 reforming tests for the ITM sample ....................................... 71
Figure 28- Ni-YSZ CH4 reforming results ........................................................................... 72
Figure 29- ITM CH4 reforming results ................................................................................ 72

x
LIST OF TABLES
Table 1- Summary of proposed SOFC support metals ........................................................... 26
Table 2- Surface reaction mechanism for CH4 on Ni ............................................................. 47
Table 3- Porosimetry results .................................................................................................. 51
Table 4- Morphological properties of samples used in AFL model fitting .............................. 63

xi
LIST OF ABBREVIATIONS
AFC.......................................................................................................Alkaline fuel cell
AFL...............................................................................................Anode functional layer
ASR..............................................................................................Area specific resistance
AT................................................................................................Auto thermal reforming
CAA...................................................................................................Catalytic active area
CFCC.......................................................................................Colorado Fuel Cell Center
CGO............................................................................................Gadolinium-doped ceria
CPOX......................................................................Catalytic partial oxidation reforming
CSM.........................................................................................Colorado School of Mines
CTE...............................................................................Coefficient of thermal expansion
DBL................................................................................................Diffusion barrier layer
DGM......................................................................................................Dusty Gas Model
DIR............................................................................................Direct internal reforming
DMFC........................................................................................Direct methanol fuel cell
DR...............................................................................................................Dry reforming
EDX......................................................................Energy-dispersive X-ray spectroscopy
EIS...................................................................Electrochemical impedance spectroscopy
FC........................................................................................................................Fuel cell
GC.......................................................................................................Gas chromatograph
HC.................................................................................................................Hydrocarbon
HTFC......................................................................................High temperature fuel cell
IIR............................................................................................Indirect internal reforming
IT-SOFC....................................................Intermediate temperature solid oxide fuel cell
LSCM........................................................................................La0.5Sr0.25Cr0.97Ma0.03O3
LSM...........................................................................................................La0.5Sr0.5MnO3
LSSM..................................................................................................... La0.8Sr0.2Mn0.8O3
LSVC.............................................................................................La0.5Sr0.25Cr0.97V0.03O3
LTFC........................................................................................Low temperature fuel cell
MCFC......................................................................................Molten carbonate fuel cell
MFC..................................................................................................Mass flow controller

xii
Ni-YSZ.................................................................Nickel-doped yttria stabilized zirconia
ODS...................................................................................Oxide dispersive strengthened
PAFC..........................................................................................Phosphoric acid fuel cell
PC.........................................................................................................Personal computer
PEMFC....................................................................Proton exchange membrane fuel cell
PM.......................................................................................................Powder metallurgy
POX........................................................................................Partial oxidation reforming
RWGS.............................................................................Reverse water gas shift reaction
SAE......................................................................................Separated anode experiment
S/C...................................................................................................Steam to carbon ratio
ScSZ........................................................................................Scandia stabilized zirconia
SDC..................................................................................................Samaria-doped ceria
SOFC.................................................................................................Solid oxide fuel cell
SR............................................................................................................Steam reforming
TC..................................................................................................................Total carbon
TPB................................................................................................Triple phase boundary
WGS............................................................................................Water gas shift reaction
XRD.......................................................................................................X-Ray diffraction
YSZ............................................................................................Yttria stabilized zirconia

xiii
LIST OF SYMBOLS
j0…………………………………………..…………………...Exchange current density
n.………………………………………Number of electrons exchanged during reaction
F………………………………………………………….…………..Faraday’s constant
f1……………………………………………………………………..Reactant decay rate
R………………………………….…...…………………...……..Universal gas constant
T……………...…………………….…………………….…………………Temperature
*
Rc ……………...………………….……………………………..Reactant concentration
1G
‡………..……...…………………………….…………Activation barrier for reaction
xn ……………………..…………………...………………Moles of subscripted species
E0...........................................................................................Standard electrode potential
iv
xa ……………………...………………..…….Chemical activity of subscripted species
%
openv ………………………..……………..……….Volume percentage of open porosity
xm ……………………………..…….………………….……mass of subscripted object
.
m‡
...........................................................................Mass flow out of x direction channel
.
km................................................................Mass flow into x direction channel element
c
kj .................................................Mass flux of the subscripted species in the z direction
cA.....................................cross sectional area element at the manifold and SAE sample
Yk...................................................................................subscripted species mass fraction
As....................................................................................................................specific area
.
ks................................................................Molar production rate of subscripted species
Wk.......................................................................Molecular weight of subscripted species
Jk...................................................................................Molar flux of subscripted species
[Xk]................................................................Molar concentration of subscripted species
p..............................................................................................................Pressure gradient
Bg...................................................................................................................Permeability
μ.............................................................................................................Mixture viscosity

xiv
ρ...............................................................................................pressure within the sample
P...........................................................................................................................Pressure
W
............................................................................................Average molecular weight

1
1 INTRODUCTION
A fuel cell (FC) is an electrochemical device that directly converts chemical fuel into electricity.
Conventional electricity generation techniques typically combust fuel to produce mechanical
work which is then converted into electricity. These processes use thermodynamic cycles of a
working fluid and are therefore limited by the Carnot efficiency. Fuel cells on the other hand,
directly convert the chemical energy in the fuel stream into electricity. Since the fuel is directly
converted to electricity via electrochemical reactions there is no thermodynamic cycle. As such,
the fuel cell is not limited by the Carnot efficiency and is therefore capable of running at higher
efficiencies than conventional fuel-based electricity generation technologies.
There are multiple types of fuel cells; however, all fuel cells operate on the same general
electrochemical processes. High energy electron bonds in reactant fuels and oxidizers are
converted into lower energy bonds in the resulting products of the chemical reaction. The
balance of energy from the electrochemical reaction is then released in the form of heat, phase
state of the products, and electricity. The chemical reaction of fuel and oxidizer is conducted
through the transfer of electrons from the fuel (oxidation) to the oxidizer (reduction). By
intercepting the electrons during the transfer and forcing them through an external circuit,
energy in the form of electricity can be directly extracted from the chemical reaction.
In order to capture the electrons from the chemical reaction, the fuel and oxidizer must be
physically separated by a membrane placed between two electrodes, an anode and a cathode.
The membrane allows the transmission of reactant ions while inhibiting the transmission of
electrons. The electrodes host the electrochemical reactions and act as electron collectors and
conductors. The electrode where the electrochemical fuel is oxidized is the anode. The
electrode where the oxidizer is reduced is the cathode. The membrane separating the anode and
the cathode is referred to as the electrolyte. The electrolyte has the unique properties of
conducting ions (either positive or negative, depending on the fuel cell type) but having zero
electronic conductivity. The electrolyte’s resistance to electron flow results in a build-up of
electrons in the anode and positive ion build-up in the cathode, which leads to an electrical
potential. This electrical potential can then force electrons through an external circuit similar to
a battery.

2
1.1 Types of fuel cell
While there are numerous differences amongst the various forms of fuel cells, all major types of
fuel cells can be classified into two general classes by operating temperature, high temperature
fuel cells (HTFC), and low temperature fuel cells (LTFC). In general, low temperature FCs
operate in the temperature range of 60C to 250C while high temperature fuel cells operate from
400C – 1200C. The low temperature classification includes; Proton Exchange Membrane
(PEMFC), Phosphoric Acid (PAFC), Direct Methanol (DMFC) and Alkaline (AFC) fuel cell
types while the high temperature classification includes Molten Carbonate (MCFC) and Solid
Oxide (SOFC) fuel cell types. Generally LTFCs have the advantage of quick response to
transient electrical demand while suffering from increased fuel incompatibility and/ or catalyst
poisoning issues. HTFCs on the other hand benefit from increased fuel flexibility and poison
tolerance but have a generally poor response time to transient electrical load dynamics.
1.2 The role of catalysts
The rate of the electrochemical reaction within the fuel cell can be characterized by the
exchange current density as seen in equation 1.1 below(R. O'Hayre, 2008).
1
* /( )
0 1
G RT
Rj nF c f e‡
(1.1)
Where n is the number of electrons transferred in the reaction, F is the Faraday constant , *
Rc is
the reactant concentration, f1 is the decay rate of the reactant, 1G
‡
is the activation barrier for
the reaction, R is the universal gas constant, and T is the temperature.
It can be seen from equation 1.1 that by decreasing the activation barrier ( 1G
‡
) of the reaction
the exchange current density will increase, and therefore the rate of the reaction will increase.
Catalysts are introduced into both the fuel cell anode and cathode to lower the activation barrier
to the hydrogen oxidation and oxygen reduction reactions. The highest performing catalysts for
this purpose are the transition metals surrounding the platinum group, with platinum (Pt) itself
showing the best performance. For this reason, Pt tends to be the main catalyst of choice for
LTFCs. By examining equation 1.1 it can be seen that increasing the operating temperature of

3
the fuel cell will also lead to an increase in the reaction rate. Due to the increased reaction
kinetics within the high temperature fuel cells they can utilize less active catalysts like nickel
(Ni). This is a distinct advantage because Ni is much cheaper than Pt.
The chemical reaction within the fuel cell can only take place where reactant ions and electrons
can combine. This can only occur in a region where the catalyst, fuel bearing gas, and reactant
ion conducting electrolyte meet. This region is known as the triple phase boundary (TPB). In
equation 1.1 the exchange current within the fuel cell is expressed as a current density. As such,
the overall exchange current in the fuel cell is highly dependent on the total surface area
accessible to the reaction. In order to maximize fuel cell performance the catalyst loading and
the TPB surface area at the electrode-electrolyte interface should be maximized.
1.3 Fuel requirements
All major types of fuel cells are either directly or indirectly dependent on hydrogen as a fuel and
oxygen as an oxidizer. Hydrogen is either sent to the fuel cell directly or via a “hydrogen
carrier” that receives further processing in the fuel cell system to extract the hydrogen.
Examples of common hydrogen carriers are hydrocarbon fuels like methane or alcohols such as
methanol.
The presence of catalysts in the fuel cell electrodes make them intolerant to various
contaminants that are common in the conventional hydrogen carriers. Chemical contaminates
in the fuel supply of a fuel cell leads to deactivation of the catalysts present in the anode
through chemical “poisoning” which increases the activation losses in the FC and decreases
system efficiency. Catalyst deactivation can eventually lead to cell death. In LTFCs Pt is often
used as a catalyst for the hydrogen oxidation reaction in the anode. Pt is susceptible to
poisoning from sulfur (S) compounds and carbon monoxide (CO). S and CO form a strong
chemical bond with Pt. Once the Pt atom has formed a chemical bond it is rendered inert and
no longer functions as an oxidation catalyst for hydrogen. The poisoning of the catalyst present
in the anode results in a reduction of its catalytic activity, because the total number of available
reaction sites at the TPB has been reduced.
HTFCs such as SOFCs typically use Ni as the catalyst for the hydrogen oxidation reaction. Ni
based catalysts in SOFCs are tolerant of CO contaminates in the fuel stream because CO does
not form a strong chemical bond with Ni at the operation temperatures typical of these systems.
For HTFCs, CO can actually act as a fuel by reacting with product water in the FC anode to

4
form additional H2 fuel via the water gas shift reaction or by being chemically oxidized to CO2
directly, which is discussed in section 1.4 of this paper. Nickel based catalysts; however,
remain intolerant to S compounds because Ni and S form a strong bond similar to Pt. While
the HTFC’s Ni based catalysts are deactivated by S compounds, they can tolerate S
concentrations as high as 1ppm while Pt based LTFCs can only tolerate up to approximately
0.1ppm (Song, 2002).
1.4 Fuel reforming
As discussed in section 1.3, essentially all fuel types require H2 fuel, either directly or
indirectly. Hydrogen, unfortunately, is not the most convenient fuel. While H2 is the most
abundant element in the universe, it does not occur in its elemental form naturally on Earth
(Jefferson Lab, 2010). Therefore all pure hydrogen that would be used for fuel in fuel cell
systems must first be generated by processing available hydrogen containing compounds, most
commonly water (H2O) and various hydrocarbons. The generation of H2 from a hydrocarbon
(HC) feed stock is commonly referred to as a reforming process. There are four main types of
reforming processes that are relevant to fuel cell systems; steam reforming, partial oxidation
reforming, auto thermal reforming, and dry reforming.
1.4.1 Steam reforming
Hydrocarbon steam reforming (SR) is currently the most common form of H2 production on the
planet (United States Department of Energy, 2008). In the SR reaction a stream of gaseous HC
fuel is reacted with gaseous water (steam) to form CO and H2 gases. Refer to equation 1.2 for
the SR reaction for methane gas (CH4) (Song, 2002). The general SR reaction for any HC feed
stock is shown in equation 1.3(Song, 2002).
4 2 23CH H O CO H (1.2)
2 2
1( ( ) )
2m nC H mH O mCO m n H (1.3)

5
Steam reforming is a highly endothermic reaction and therefore requires a large amount of
thermal energy for the reaction to occur. Normal temperature range for SR is from 700-1000
C. In order to maximize H2 production more steam than is required by the stoichiometry is
supplied to the reaction. The increase in the concentration of H2O forces the chemical
equilibrium to favour the products via Le Chatelier’s Principle (R. O'Hayre, 2008). The steam-
to-carbon ratio (S/C) is commonly used to describe the relative concentration of water to fuel.
The S/C is shown in equation 1.4 below where 2H On is the number of moles of steam present and
cn is the number of moles of atomic carbon present at the reaction site.
2H O
c
nS
C n (1.4)
Catalysts are employed to aid the SR reaction by decreasing the activation barrier of the
reaction. Various transition metals are commonly used as catalysts for the steam reforming
reaction. The catalyst used can vary greatly based on the HC feedstock and operating
conditions within the reactor. However, both Pt and Ni are commonly used as reforming
catalysts (K. Tomishige, 2004). As discussed earlier, these two catalysts are also commonly
used as catalysts for the H2 oxidation reaction in fuel cell anodes.
1.4.2 Partial oxidation reforming
While the steam reforming reaction has high H2 yield, its high energy requirement makes it
somewhat impractical for either small scale or low temperature systems. Hydrogen generation
from HC feed stock is also possible though partial oxidation reforming (POX). POX occurs
when HC feedstock is reacted with a sub-stoichiometric amount of O2. The term “partial
oxidation” comes from the fact that the products of the reaction are only partially oxidized. The
POX reaction is an exothermic reaction and thus does not require energy from the environment
to react, making this type of reforming attractive to small scale and/or low temperature systems.
Like the SR reaction the POX reaction is often performed in the presence of catalysts, in this
case the reaction is referred to as Catalytic Partial Oxidation (CPOX). The chemical equation
for the partial oxidation of CH4 can be seen below in equation 1.5 (Song, 2002). Equation 1.6 is
the general equation for partial oxidation of any HC feed stock (Song, 2002).

6
4 2 22CH O CO H (1.5)
2 2
1 1( ) ( )2 2
m nC H mO mCO nH (1.6)
1.4.3 Water gas shift
The water gas shift (WGS) reaction is an exothermic reaction of CO and gaseous H2O to form
H2 and CO2. For fuel cell systems the WGS reaction is rarely employed as a standalone
reforming reaction it is generally employed as a secondary reaction to the SR or CPOX
reactions. By using the product CO from the SR or CPOX reaction and excess steam in the
system the WGS reaction can increase H2 yield of a reforming process by approximately 5%(R.
O'Hayre, 2008). The WGS reaction is shown in equation 1.7 below(Song, 2002).
2 2 2CO H O CO H (1.7)
1.4.4 Autothermal reforming
Autothermal reforming combines the endothermic SR reaction with the exothermic CPOX
reaction into a single reforming process. The two reactions are often combined with the
addition of a WGS reaction in a thermo-neutral manner; such that the energy requirements of
the SR reaction are met by the energy produced in the CPOX reaction. It is important to note
the thermo-neutral aspect of this process pertains purely to the reaction energies themselves and
not the energy required to heat the reactants to the reaction temperature, which can be a
significant thermal load. The CH4 specific autothermal reaction is shown in equation 1.8 (Song,
2002). While the general reaction for any HC feed stock is shown in equation 1.9 (Song, 2002).
4 2 2 2
1 1 5
2 2 2CH O H O CO H (1.8)
2 2 2
1 1 1 1( ) ( ) (( ) ( ) )2 4 2 2
m nC H mH O mO mCO m n H (1.9)

7
1.4.5 CO2 dry reforming
Dry reforming (DR) is the process of reforming a HC feedstock by reacting it with CO2 gas at a
high temperature as described by the chemical equation below (equation 1.10) (E. Ruckenstein,
1995).
4 2 22 2CH CO CO H (1.10)
DR is rarely employed as a standalone reforming method when H2 production is the goal of the
process because the energy requirements of the DR reaction are higher than the energy required
for the SR reaction and H2 yield from the DR reaction is lower than that of the SR reaction.
The DR reaction is, however, employed when reformate gas is to be used as synthesis gas (H2 +
CO) for Fischer-Tropsch syntheses or similar processes. This is because the DR reaction has a
higher selectivity to CO and the lower H2/CO ratio of the reaction is more conducive for the
subsequent reactions necessary for synthetic fuel production (E. Ruckenstein, 1995). The DR
reaction is also more prone to carbon formation than SR, which is discussed in the next section.
1.4.6 Carbon formation
When reforming a HC feedstock into H2 care must be taken to avoid the formation of elemental
carbon during the process. Carbon formation is often referred to as coking. Elemental carbon
is a solid at high temperatures and its formation in the reaction chamber can lead to deactivation
of the reforming catalyst and reduction of the gas diffusion in the chamber which significantly
retards the reforming reaction and decreases H2 yield. For CH4 reforming coking can occur via
three main reactions; methane decomposition (equation 1.11), The Boudouard reaction
(equation 1.12), and a form of the reverse water gas shift reaction (equation 1.13) (E.
Ruckenstein, 1995) ,(H. Sumi, 2010).

8
4 22CH C H (1.11)
22CO C CO (1.12)
2 2H CO C H O (1.13)
Many factors are involved in carbon formation during a reforming process; such as, operating
temperature, material composition and morphology of the reactant chamber, feedstock
composition, reforming catalyst used, and reforming reactant stoichiometry. Hei, Chen etal.
and Rostup-Nielsen and Hansen have published separate papers documenting the reforming
characteristics of transition metal catalysts both suggesting that the choice of catalyst plays a
key role in the carbon formation during the reforming reaction (J.R. Rostrup-Nielsen,
1993),(M.J. Hei, 1998) . In general higher hydrocarbon fuels have higher propensities for
coking as well (J.R. Rostrup-Nielsen, 1993). Carbon formation during the reforming process
can also be minimized by running steam to carbon or CO2 to carbon ratios greater than one in
the case of the SR or DR reactions respectfully. Unfortunately running additional reforming
reactants decreases overall system efficiency (H. Sumi, 2010).
1.5 Fuel reforming systems
To avoid practicality issues associated with hydrogen fuel, manufactures of fuel cell systems
often design onboard fuel reforming systems that allow the fuel cell to operate on more widely
available fuels like methane or propane. Inclusion of these reforming systems greatly increases
the fuel flexibility of the fuel cell system, which in turn eases integration issues into existing
systems; for example, the use of fuel cells as auxiliary power units in transportation where the
fuel cell system can operate on the same fuel as the propulsion system.
1.5.1 External reforming systems
External reforming fuel cell systems are fuel cell systems that are dependent on an external
reforming subsystem for their supply of hydrogen fuel. External fuel reforming subsystems can
either be located in close proximity to the fuel cell system itself or linked to the fuel cell via
pipelines. Low temperature PEM or Alkaline fuel cells typically use CPOX or AT external fuel
reforming subsystems because the operating temperatures of those systems pose poor thermal
integration potential for highly endothermic reforming reactions like steam reforming. For high

9
temperature systems like SOFCs external reforming systems are typically in close thermal
contact with the fuel cell stack. The use of the high quality heat from the stack can support the
highly endothermic, but high yielding, steam reforming reaction. Use of the waste heat from
the stack for the reforming of HC fuel greatly increases overall system efficiency.
1.5.2 Internal reforming systems
Fuel cell systems that are capable of reforming HC fuel into H2 within the fuel cell stack itself
are referred to as internal reforming fuel cell systems. The reforming reaction can occur in the
anode structure itself or prior to reaching the actual anode by reforming within the gas
distribution channel of the stack interconnect plates. Fuel cell systems where HC reforming is
performed prior to the reaching the anode are referred to as indirect internal reforming systems
(IIR). Systems where the HC fuel is reformed within the anode itself are referred as direct
internal reforming systems (DIR). High temperature fuel cells are currently the only fuel cell
systems that have internal reforming capabilities because their high operating temperatures can
support highly endothermic reforming reactions like steam reforming. In addition high
temperature fuel cells are more tolerant of fuel contaminates typically present in the HC
feedstock (CO) so there is less of a need to purify the reformate (assuming the fuel is low in
sulfur content).
1.6 The SOFC
There are multiple types of fuel cells and while they all operate on the same general principles,
each type of fuel cell has its own mode of operation and operating temperature. One of the
most promising fuel cell types is the solid oxide fuel cell (SOFC). The general operating
temperature range for a SOFC system is from 400C-1000C. The SOFC category can be divided
into two subgroups by operating temperature. Intermediate temperature solid oxide fuel cells
(IT-SOFC) operate in a temperature range of 400-800C and high temperature SOFCS operate
from 800-1000C. The high operating temperature of SOFC systems pose unique material
challenges. The extreme SOFC environment rapidly degrades common materials. Ceramics are
commonly used in place of metals as most metal alloys cannot withstand the high heat and
degrade quickly. Commonly used sealants will not work at such high temperatures so ceramic
based pastes or glass seals are often used; however, they are brittle and do not tolerate
expansion and contraction associated with thermal cycling of the system. The high operating
temperature of the SOFC leads to advantages as well. It allows for high electrochemical

10
efficiency while using cheaper, less active catalysts like Ni. The high operating temperature
also provides increased fuel flexibility through increased contaminate tolerance and the ability
to support internal reforming of HC fuels. The high temperature also provides excellent
prospects for combined heat and power applications.
1.6.1 SOFC operation
SOFCs, like the other major types of fuel cells, operate based on the simple hydrogen
combustion reaction below equation (1.14).
2 2 22H O H O (1.14)
However in the case of a fuel cell the hydrogen and oxygen are separated by an electrolyte. It is
useful to consider the above complete combustion reaction as the sum of two half-reactions, the
oxidation (loss of electrons) of hydrogen (equation 1.15) and the reduction (gain of electrons) of
oxygen (equation 1.16). The oxidation of the hydrogen fuel occurs in the anode and the
reduction of the oxygen occurs in the cathode.
2
2 2 2H O H O e (1.15)
2
2
12
2O e O (1.16)

11
Figure 1- Diagram of internal reforming SOFC processes. Inset shows triple phase boundary at
the anode electrolyte interface. Diagram taken from (E. Hecht, 2005)
Figure 1 shows a diagram of SOFC operation. On the cathode side, oxygen diffuses from the
channel through the cathode structure. The O-O bond of the O2 molecule, in a surface reaction
with the catalyst present, is weakened and the molecule is absorbed onto the surface of the
cathode (chemisorption). Once the O atoms are absorbed onto the cathode surface they are
electrochemically reduced into O2-
ions by reacting with electrons arriving from an external
load. Equation 1.17 provides a better description of the oxygen reduction reaction.
.2
2( 2 ) 4 2catalyst ext load
O O e O (1.17)
Once reduced, the oxygen ions are conducted through the ion conducting electrolyte where they
react with the hydrogen fuel to form water and electrons at the anode electrolyte barrier
(equation 1.15).
The electrons are sent from the anode to the cathode through an external load where the
electrical energy is harvested. In order for the hydrogen fuel to react with the O2-
ions the

12
hydrogen molecule must be dissociated by the catalyst and absorbed onto the surface of the
anode, similar to the oxygen dissociation in the cathode. The dissociated hydrogen atoms are
now lightly bonded to the catalyst surface where they react with the arriving O2-
ions. When the
hydrogen atoms and O2-
ion react, H2O is formed and leaves the surface of the anode in a
gaseous phase. The electrons from the O2-
ion remain bound to the electrode surface and are
conducted away to the external load. Below equation 1.18 more aptly describes the reaction
occurring at the anode electrolyte interface.
.2
2 2( 2 ) 2electrolyte ext loadcatalyst
H H O H O e (1.18)
The steam that is produced at the TPB diffuses back through the anode and is available to
support internal SR reaction (equation 1.2)
4 2 23CH H O CO H (1.2)
The CO produced during the SR reaction can then react with the water present in the anode to
form additional H2 and CO2 via the WGS reaction (equation 1.7). Or it can be directly oxidized
in to CO2 at the TPB (equation 1.20)
2 2 2CO H O CO H (1.7)
2
2 2CO O CO e (1.20)
It is then possible for the CO2 produced to participate in dry reforming (DR) of the methane
(equation 1.10).
4 2 22 2CH CO CO H (1.10)

13
DR is also likely to take place if the HC fuel is rich in CO2, for example in the case of bio gas
use.
The electrochemical reactions within a fuel cell are complicated and joint optimization of the
reforming and electrochemical reactions is a difficult, multifaceted problem, not only due to the
electrochemistry, but due to mass transport and reforming kinetics within the fuel cell as well.
Control of the concentration levels of the reforming reactants CO2 and H2O present in the anode
environment is critical to avoid carbon deposition and fuel starvation issues. Both of these
reactants are dependent on both the native fuel composition and operational current density of
the fuel cell itself. Since the operational current density of a fuel cell system tends to fluctuate
based on usage profile, concentration levels of these reactants tends to fluctuate as well. If there
are insufficient amounts of the reforming reactants present, carbon formation in the anode is
much more likely occur. However if there is too much steam present in the anode of the fuel
cell, the fuel concentration is diluted, which lowers system efficiency. Optimized anode design
is critical to balance these issues.
1.7 Objective
Optimization of the anodic function within a fuel cell is critical for system efficiency,
reliability, and cost. The processes that occur in an SOFC anode are complicated, multifaceted,
and coupled to each other. Hydrogen oxidation reactions, ionic and electronic conduction, fuel
reforming, and mass transport of fuel and exhaust all occur in the fuel cell anode
simultaneously, and are all coupled to one another. As a result, it is incredibly difficult to
predict, and therefore difficult to optimize the performance of an anode. Typically, anode
performance is measured indirectly by using electrochemical tests like polarization
measurements or electrochemical impedance spectroscopy (EIS) (R. O'Hayre, 2008). These
tests measure activity in the entire active cell structure and as a result specific aspects of anodic
performance must be inferred from the electrochemical results.
Critical anodic processes like internal reforming and gas transport can be easily masked in
electrochemical based tests. The objective of this work is to decouple these critical anodic
processes and provide an alternative method for anodic performance assessment and
optimization. Through the use of a unique experiment developed by the Colorado Fuel Cell
Center (CFCC) it is possible to analyze and measure the critical anodic processes of mass
transport and internal reforming performance without the need for electrochemical activity

14
within the fuel cell. This experiment will be used to demonstrate how easy it is to compare
two drastically different anode structures and help predict their transport and reforming
performance in SOFC operating conditions.
1.8 Approach
The CFCC has developed the Separated Anode Experiment to decouple the mass transport and
internal reforming reaction kinetics from the electrochemical reactions within a fuel cell. By
allowing the experimenter to directly measure these critical aspects of anode operation, the SAE
is able to provide unique insight into the anode performance with no need for electrochemical
operation of the fuel cell. SAE based results have been previously published by Hecht et al.,
Storjohann et al. ,and Richards et al. (E. Hecht, 2005), (D. Storjohann, 2009),(A. Richards,
2010).
In addition to the SAE, morphological characterization experiments are conducted to identify
physical characteristics of the two vastly different SOFC anode materials. The analysis of the
physical morphology and composition of those samples is then directly correlated to the gas
phase transport and reforming kinetics results from the SAE. This provides a straight forward
evaluation of each sample’s capability to perform the critical anode tasks of fuel reforming and
subsequent transportation of that fuel to the reaction site. This evaluation is done independently
of the anode’s electrochemical operation, greatly simplifying the analysis and subsequent
optimization of those characteristics.

15
2 BACKGROUND
SOFCs have been studied for multiple decades and are only now starting to reach marketability.
SOFCs have been, and continue to be, limited by the available materials to support their
operation. Common materials simply cannot survive long in the high temperature environment
of the SOFC. Highly engineered and expensive materials like specialty ceramics and exotic
alloys are commonly used to mitigate the effects of the operating environment, however even
the best SOFC’s still have limited operating lifetimes. High costs, short lifetimes associated
with poor materials, as well as high temperature durability continue to be the most significant
issues facing the SOFC technology and marketability.
2.1 Current SOFC materials
Current SOFCs are largely dependent on ceramic materials for critical components such as the
cell support. Reliance on ceramics severely limits SOFC operation. Ceramics have poor
thermal conductivity and are prone to fracture if heated or cooled too rapidly. The poor thermal
characteristics of the SOFC coupled with its high operating temperature severely limits the
electrical load following and rapid start up and shutdown capabilities of the device. The
abilities to start up rapidly and adjust to dynamic electrical loads are important characteristics
for electricity generation devices, especially in smaller systems such as transportation APUs
and backup generators.
2.1.1 SOFC cell construction
SOFC cells have four main components; anode, cathode, electrolyte, and support. There are
four main types of cell configurations that are currently used in SOFC design; electrolyte
supported cells, cathode supported cells, anode supported cells, and metal supported cells. A
diagram of the different constructions can be seen in Figure 2. The naming convention is
straight forward. For example, in a cathode supported cell the cathode layer acts as both
cathode and as the main mechanical support of the cell. Likewise for anode supported and
electrolyte supported cells; the anode and the electrolyte, in addition to performing their
electrochemical functions, act as mechanical support for the cell. Electrolyte supported cells are

16
generally the oldest architecture for SOFC construction. In order to minimize ohmic losses the
electrolyte supported cells normally operate at temperatures of 1000C or greater. Electrode
supported cells (anode or cathode supported) do not require a thick electrolyte layer for
mechanical support. Consequently the electrolyte layer on those architectures can be
substantially thinner. Thinner layers are more conductive and ohmic losses are decreased. The
increase in conductivity of the electrolyte in electrode support cells allows them to be operated
at lower temperatures (approximately 800 C). Popularity of the electrolyte supported cell has
declined as the electrode supported architectures have become more popular (in particular
anode supported); however, electrolyte supported cells are still used, a prime example being the
SOFC cell used in the “Bloom Energy Server”, from Bloom Energy.
Figure 2- Schematic of the various SOFC cell architectures. Left to right; electrolyte supported
cell, cathode supported cell, anode supported cell, and metal supported cell.
The newest type of cell construction for SOFC applications is the metal supported cell. In a
metal supported cell a porous or laser drilled metal substrate is used to provide mechanical
support for the cell. The simplest form of metal supported cells consist of the metal substrate
with a conventional ceramic cell adhered to the surface of the metal. The use of a metal support
for the SOFC has the ability to greatly increase the thermal cycling and startup capabilities of a
SOFC. The metal substrate must be porous to allow fuel transport to the fuel cell that is adhered
on the other surface. Typically the metal support is chemically inert and simply acts as a
support for the cell. However, Yan et al. and Ishihara et al. have experimented with Ni based
alloys to act as both support and anode (J.W. Jan, 2005),(T. Ishihara, 2008),(T. Ishihara, 2006).
In this case the cell could be considered both anode and metal supported. Metal supports and
metal supported cells are discussed in more detail in section 2.2.

17
Currently the most common SOFC style used is the anode supported cell. Anode supported
cells are generally used more often than cathode supported cells for a few reasons:
The polarization (activation) losses at the anode are less than at the cathode.
The mobility of H2 is higher than that of O2. H2 diffusion is less effected by the thicker
electrode structure than O2 would be.
O2 reduction kinetics tend to be slower than H2 oxidation kinetics.
A thicker porous anode structure increases the catalytic affective area (CAA) of the
anode exposing more Ni catalyst for both electrochemical oxidation of H2 and the
reforming of HC fuels.
The most commonly used cathode perovskites like La0.5Sr0.5MnO3 (LSM) have a poor
coefficient of thermal expansion (CTE) match to the most commonly used electrolyte
material, YSZ. A poor CTE match can lead to mechanical stresses in the cell and result
in cracking. Increasing the thickness of the cathode to provide mechanical support for
the cell aggravates this issue.
2.1.2 SOFC anode functionality
Brandon and Brett list three main purposes that anode structures serve during SOFC operation:
Transport of electrons to the current collector from the reaction site through an
electronically conducting phase
Acceptance of these electrons from a species absorbed on the electrode surface from the
gas phase, to form ionic species.
Transport of ions from the electrolyte through an ionically conducting phase (N.P
Brandon, 2006).
In other words, the anode must be porous to allow the diffusion of fuel into and waste products
out of the cell. The anode must be catalytically active to promote absorption of H2 onto its
surface. Finally the anode must be electronically and ionically conductive at the temperature of
operation. In addition, if direct internal reforming will be used in the system, the anode must be
catalytically active to promote the reforming of the HC fuel.
As discussed previously, the electrochemical reactions in the SOFC can only occur in a region
where the O2-
ions, the H2 gas, and electronically connected catalysts meet. This area is known
as the triple phase boundary (TPB). Typically TPB is restricted to the anode-electrolyte
interface because the relevant reactant species are bound to their respective surfaces. However,
if the anode were a conductor of ions in addition to being a conductor of electrons, the reactant

18
ions would be free to transition from the electrolyte into the anode structure. This effectively
makes the entire anode part of the TPB, drastically increasing the TPB surface area.
Conductors of both ions and electrons are known as mixed conductors and are extremely
attractive for SOFC anode applications.
2.1.3 Zirconia based anodes
Zirconia based anodes are currently the most commonly used SOFC anodes. The zirconia
(ZrO2) is typically stabilized with a transition metal oxide, most commonly yttria (Y2O3),
leading to the name yttria stabilized zirconia (YSZ). While yttria is the most commonly used
stabilizing compound, scandia (Sc2O3) can be used as well, which results in scandia stabilized
zirconia (ScSZ). At SOFC operating temperature YSZ is chemically inert and a pure O2-
ion
conductor, making it ideal for use as an SOFC electrolyte. In order to be used as an anode the
YSZ material must be made catalytically active, electronically conductive, and permeable to gas
transport. This is typically done by adding Ni to the ceramic. Ni is usually added in the form of
NiO, which is then subsequently chemically reduced to Ni during start-up. The reduction of
NiO adds the needed porosity for the anode to meet its mass transport requirements (typically
30% or greater (W.Z. Zhu, 2003)) while the remaining Ni adds the catalytic activity and
electron conductivity. The YSZ ceramic structure provides mechanical stability for the layer
and supports the Ni, helping to prevent Ni coarsening. The CTE of the zirconia based anodes
can be adjusted by altering the particle size and ratios of the powders used, which allows the Ni-
YSZ to be custom formulated to be compatible with numerous different supports or electrolytes.
Ni-YSZ anodes have significantly improved sulfur contaminate tolerance when compared to
low temperature catalysts like Pt; however, sulfur poisoning remains an issue and the deposition
of sulphides can increase with reduced operation temperature (Y. Matsuzaki, 2000). Also,
while the yttria or scandia support of the zirconia structure significantly reduces Ni coarsening,
coarsening remains an issue with redox cycling of the cell, making long-term operation a
concern.
Ni–YSZ anodes are commonly used in DIR applications because Ni is an excellent
electrochemical catalyst and an acceptable reforming catalyst. While Ni is an effective
reforming catalyst it is known to promote carbon coking if insufficient water is present for the
SR reaction. Internal reforming concerns are discussed in greater detail in section 2.1.6.

19
2.1.4 Perovskite based anodes
Due to the limitations with the Ni-YSZ anodes, multiple other anode materials have been
developed and tested. One of the leading alternatives to Ni-YSZ is the perovskite based anode.
The key advantage of perovskite based anodes is that they promote HC reforming catalytic
activity with low propensity for carbon formation. While reforming activity of most
perovskites is modest compared to Ni-YSZ they can easily be modified though the addition of
other reforming catalyst like Ru, which greatly improves their reforming capabilities. As
perovskite anodes are Ni free they do not have Ni coarsening or sulfur poisoning issues.
Perovskites are poor O2-
ion conductors at low partial pressures of O2 so they are frequently
doped with elements such as La, Sr or Y to enhance their ion conductivity. Common
perovskites used for SOFC anode applications are La0.8Sr0.2Cr0.97V0.03O3 (LSVC),
La0.75Sr0.25Cr0.5Ma0.5O3 (LSCM), and La0.8Sr0.2Mn0.8O3 (LSSM), amongst many many others.
2.1.5 Ceria based anodes
Development of CeO2 based anodes began because doped ceria is an excellent reforming
catalyst for methane. Ceria is also attractive as it is a mixed electron and ion conductor in
reducing environments without the need for doping. Unfortunately ceria becomes structurally
unstable at high temperature due to lattice expansion caused by the chemical reduction of Ce+4
to Ce+3
. The structural instability of ceria can lead to cracking or even complete delamination of
the anode layer. Ceria is often heavily doped with +3 cations like gadolinium (Gd3+
), samarium
(Sm3+
), or yttrium (Y3+
) which replace a large amount of the Ce4+
cations in the structure, this
adds significant stability to the structure at high operating temperatures.
The reforming performance of ceria can be improved by the addition of noble metal catalysts
such as Pt, Rh, Pd, or Ru. It has also been shown that the addition of Ni to ceria can promote
carbon-free reforming, likely due to the mixed conducting nature of the ceria layer, which
allows for direct oxidation of methane on its surface with no need of an intermediate steps.
However, the actual mechanism is debated.
2.1.6 Internal reforming considerations
In direct internal reforming systems the HC fuel is reformed into the necessary hydrogen fuel
within the anode structure itself. With direct internal reforming the anode now supports two
coupled but entirely different chemical reactions. A major issue with direct internal reforming
systems is the fact that reforming reactions (SR, DR, WGS) have entirely different reaction
20
kinetics when compared to the electrochemical oxidation of hydrogen. Reforming rates of HC
fuels tend to be much faster than the electrochemical oxidation rate within the anode. The rates
of the reactions could be changed by altering the catalyst loading for each reaction; however,
both the reforming and oxidation processes are typically catalyzed by the same catalyst making
it impossible to customize the catalyst loading for each reaction. Fundamentally, the rate of the
electrochemical reactions within a fuel cell is determined by the flow of electrons through its
external circuit. Therefore the external electrical load on the fuel cell determines the rate at
which the hydrogen fuel is consumed and product water is formed. The reforming reactions on
the other hand have no external moderation control. The rate at which the reforming reactions
take place is determined by the operating temperature, catalytic loading, and concentration
levels of the reactants. As discussed in section 1.4.6, the amount of H2O present during the
reforming reaction is critical to the coking stability of the process. However, the amount of H2O
present in the anode structure is largely determined by the electrical load on the fuel cell.
Unfortunately, simply humidifying the fuel and running with excessive amounts of water
present to prevent coking in the anode would result in a lower reversible cell voltage via the
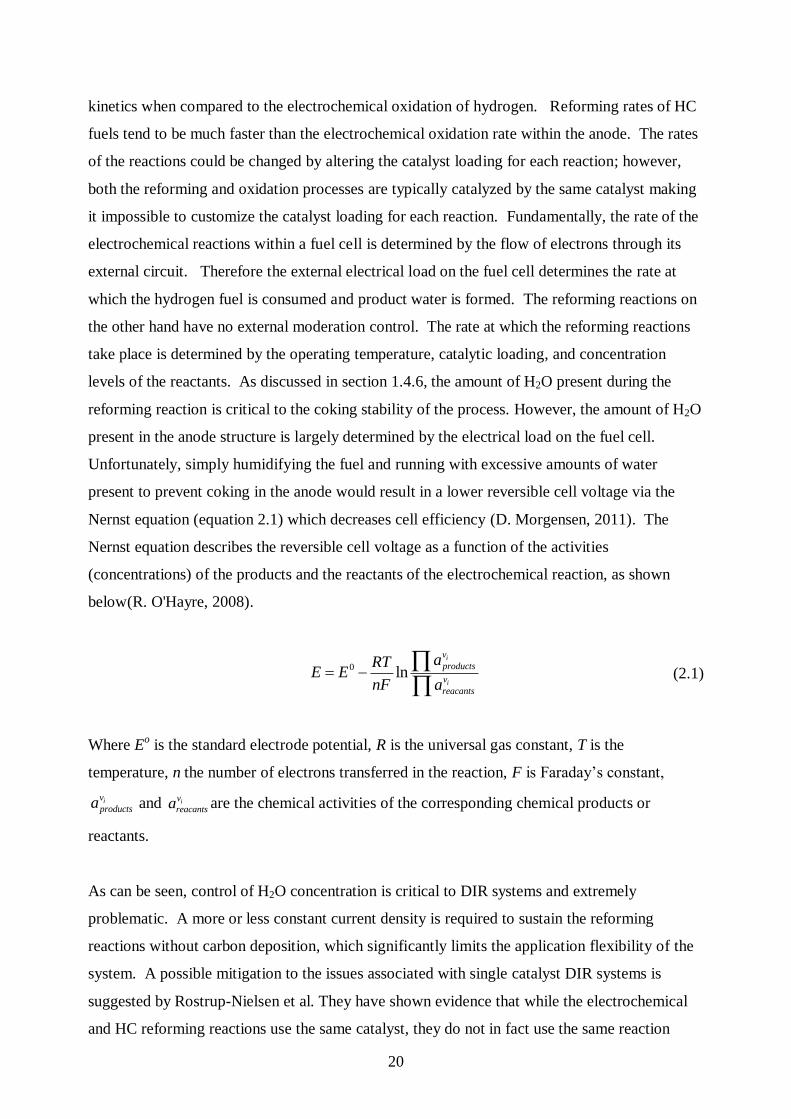
Nernst equation (equation 2.1) which decreases cell efficiency (D. Morgensen, 2011). The
Nernst equation describes the reversible cell voltage as a function of the activities
(concentrations) of the products and the reactants of the electrochemical reaction, as shown
below(R. O'Hayre, 2008).
0 ln
i
i
v
products
v
reacants
aRTE E
nF a
(2.1)
Where Eo is the standard electrode potential, R is the universal gas constant, T is the
temperature, n the number of electrons transferred in the reaction, F is Faraday’s constant,
iv
productsa and iv
reacantsa are the chemical activities of the corresponding chemical products or
reactants.
As can be seen, control of H2O concentration is critical to DIR systems and extremely
problematic. A more or less constant current density is required to sustain the reforming
reactions without carbon deposition, which significantly limits the application flexibility of the
system. A possible mitigation to the issues associated with single catalyst DIR systems is
suggested by Rostrup-Nielsen et al. They have shown evidence that while the electrochemical
and HC reforming reactions use the same catalyst, they do not in fact use the same reaction

21
sites. Rostrup-Nielsen et al. go on to say that selectively blocking specific reforming structures
while leaving the electrochemical sites active may be a way to regulate the reforming reaction
while maintaining electrochemical performance (J.R. Rostrup-Nielsen, 2006).
2.1.7 Inert barrier layers
Some researchers have proposed the use of inert barrier layers between the HC fuel and the
active anode layer. The barrier layer retards the penetration of the HC fuel into the anode and
helps moderate the reforming rate of the fuel. Lin et al. have shown that the current density a
DIR cell requires for coke free operation can be substantially reduced with the addition of a thin
inert barrier layer. The addition of this film significantly widened the low current density
operating window. Lin et al. also noted a decrease in the high current density operating window
due to concentration losses due to the barrier layer restricting fuel flow into the cell. It was also
apparent the barrier layer cell had a lower reversible voltage, likely due to high concentrations
of H2O present in the anode. The barrier layer cell appeared to have increased ohmic
polarization loses as well. This was likely due to poor electronic conductivity of the barrier
layer (Y. Lin, 2006).
In Pillai et al. it was shown that the addition of CO2 and/or air to the methane stream coupled
with the use of an inert barrier layer increased coking stability. The addition of the barrier layer
is also attributed to increase margin to anode cracking by slowing the endothermic reforming
reaction, which can lead to cell cracking due to thermal stresses induced by localized cooling
(M. Pillai, 2010).
While inert barrier layer addition may gain margin to coking at lower current densities, the
addition of these layers will ultimately result in increased concentration losses at high current
densities due to the decreased mass transport characteristics of the structure. Increased ohmic
losses are also likely, due to additional electrical resistance between the anode and the current
collector. Lower reversible potential due to H2O trapping within the anode structure is also
likely, especially at higher current densities.
2.1.8 Reforming specific catalyst layers
Another proposed idea to control the reforming reaction is to use a separate catalyst layer
specifically for the reforming of the HC fuel. Similar to a barrier layer, the reforming specific
catalyst layer is applied to the surface of the anode in between the anode and the fuel channel.
Addition of the second catalyst allows for custom catalyst loading tailored to the reaction kinetics
of the reforming reactions and allows for a different catalyst species to be used for reforming and

22
for the electrochemical reactions. The use of catalysts like Ru or Ir is especially attractive as they
are known to be highly effective HC fuel reformers while not promoting carbon formation. The
use of additional reforming specific catalyst layers is generally considered a form of indirect
internal reforming (IIR).
Zhan and Barnett used a thin Ru-CeO2 layer to demonstrate internal reforming of iso-octane with
encouraging results (Z. Zhan, 2005). Klein et al. have demonstrated stable internal reforming of
CH4 using an Ir-CeO2 catalyst layer applied to the surface of a standard Ni-YSZ anode.
Unfortunately their cell suffered a premature death due to delamination, but the reforming results
are encouraging (J.-M. Klein, 2009). Cheekatamarla et al. at NanoDynamics Energy, Inc. have
used a proprietary catalyst applied to the surface of a Ni-YSZ anode to reform various
hydrocarbon fuels (P.K. Cheekatamarla, 2008). Unfortunately NanoDynamics Energy filed for
bankruptcy in 2009 so their development in this area has stopped(unknown, 2011).
There are disadvantages to using a separate catalyst layer as well. Zhan and Barnett noted
increased concentration losses in the cell with the reforming catalyst layer due to mass transport
reduction, similar to the behaviour noted with the inert barrier layer(Z. Zhan, 2005). Zhan and
Barnett also note that the CeO2 layer used is electronically insulating, which causes issues with
current collection(Z. Zhan, 2005). Klein et al. placed Pt wires between the electrolyte layer and
the anode to act as current collector for their cell to mitigate this issue(J.-M. Klein, 2008).
2.2 Metal supported cells
Metal supported SOFCs have many potential advantages over conventional ceramic supported
SOFCs including; increased durability, greatly improved thermal cycling capability, increased
redox tolerance, cheaper manufacturing, and improved stack level sealing options. Improved
rapid thermal cycling, in particular, is a significant advantage; rapid response is often necessary in
most small to medium sized systems. All these advantages have the potential to lead to decreased
balance of plant complexity, longer system lifetime, and overall reduced system costs.
Metal supports for SOFCs have, to date, been of two general types, preformed metal sheets
perforated by laser drilling to provide adequate mass transport or porous metal formed through
powder metallurgy methods such as tape casting, pressing, or free-powder sintering. Both
methods of support manufacture have advantages and disadvantages. Preformed sheets are
generally flexible with the ability to be bent or twisted while porous metals are generally more
brittle and tend to break or crack when bent. Porous metals tend to be thicker than preformed
23
supports as thicker sheets are needed for mechanical support. Due to the nature of laser drilling
manufacturing, laser drilled supports have essentially zero tortuosity while porous samples will
have significantly higher tortuosity. The lack of tortuosity of a laser drilled sample promotes
higher mass transport for given porosity level in the laser drilled supports (N. Oishi, 2010). This
implies that laser drilled supports will generally require lower porosity to support the needed mass
transport within an operational cell. Preformed sheets have regular dense surfaces which promote
easier coverage for anode and electrolyte depositions which has the potential to lead to thinner
films and higher conductivity. Laser drilled samples will also have less exposed surface area,
allowing for greater resistance to oxidation and potentially longer lifetimes at higher temperatures
for reasons that will be discussed in section 2.2.2. Greater surface area may, however, be
desirable if the support is also acting as anode due to increased reaction sites at the TPB. Porous
metals have potential advantages in internal reforming applications where the intrinsic tortuosity
of the support may help prevent excessive water loss, promoting a more complete and coking free
SR reaction. Laser drilling also has a significant disadvantage due to its high cost for mass
production.
The manufacture of a metal-supported SOFC starts with the choice of support material. Multiple
metals have been used to support SOFCs including; Ni, NiFe, NiCrAlY, Hastelloy-X, 300 series
austenitic stainless steel, 400 series ferritic stainless steel, Crofer, and ITM . In order to ensure
long cell life, especially in high-cycle applications, the coefficient of thermal expansion (CTE) of
the metal support should be matched to the anode and electrolyte layers. In addition the metal
supports should have a high resistance to oxidation in the SOFC operating environment and be
relatively low-cost. A summary table of proposed metal supports can be seen in Table 1. The
metals currently used as SOFC supports can be classified into two general categories, nickel (Ni)
based metals and iron (Fe) based metals.
2.2.1 Nickel based metal supports
Multiple groups have manufactured functional cells using a plain porous Ni substrate. Hwang et
al. manufactured Ni-YSZ/LSGM/LSCF cells on a porous Ni substrate (C. Hwang, 2008). Cho et
al. used porous Ni to support a conventional Ni-YSZ/YSZ cell (H.J. Cho, 2009). Metal supports
are not always inert bystanders to the electrochemical reactions taking place in the fuel. Ni
supports, in particular, can perform both as anode and support. In Mineshige et al, Ni supported
small, tubular cells were built where the porous Ni support acted both as anode and support (A.
Mineshige, 2006).

24
Pure Ni supports have significant limitations making them unlikely to be adopted as a long-term
metal support solution for SOFCs. Referring to Table 1 it can be seen that the coefficient of
thermal expansion (CTE) of Ni is significantly higher than that of commonly used electrolytes
like YSZ, CGO and LSGM, which have CTE values of 10-12 ppm/K. In addition to the CTE
mismatch, Ni metal is susceptible to carbon coking in an internal reforming environment and is
highly susceptible to sulfur damage as discussed previously. Ni is also a high-cost metal.
In order to overcome some of the challenges faced by pure Ni supports, Ni-Fe alloys have been
used to support SOFCs. Referring to Table 1, the addition of Fe to the Ni changes the CTE to be a
better match with the commonly used electrolytes. The addition of Fe also decreases the cost of
the support. Ishihara et al. have constructed numerous IT-SOFC cells using a NiFe alloy acting as
both support and anode. They note that the addition of Fe to the Ni substrate lowers the anodic
over potential with a minimum seen at 10%wt Fe (T. Ishihara, 2008)(T. Ishihara, 2006) . Further
investigation into the NiFe mixture has been conducted by Zhu et al. They suggest a 1:1 weight
ratio has the best possible CTE match to the commonly used ceramic electrolytes(J. H. Zhu,
2007). While the addition of Fe to Ni lowers the cost and improves the CTE issues, susceptibility
to sulfur and coking remain.
Porous Hastelloy-X plates from the Mott Corporation have been used by the Institute for Fuel Cell
Innovation in Vancouver BC as a support for SOFC cells with a Ni-SDC anode and SDC
electrolyte(R. Hui, 2009)(Z. Wang, 2008). Hastelloy-X is a commonly used alloy for high
temperature applications in industry and has excellent oxidation resistance characteristics.
Hastelloy-X is a complex alloy consisting of approximately 47% Ni, 22% Cr, 18% Fe, 9% Mo,
1.5% Co, 0.6% W with trace amounts of C, Mn, Si and B. Referring to Table 1, it can be seen that
Hastelloy-X has a poor CTE match to commonly used electrolytes. It is also significantly more
expensive than both pure Ni and 1:1 Ni Fe. For these reasons, Hastelloy-X does not seem to be a
viable support for mass adoption.
2.2.2 Iron based metal supports
Numerous studies have been conducted on Fe based metals for use as support for SOFC. Both
300 series austenitic stainless steels and 400 series ferritic stainless steels are attractive options for
mass-produced supports because they are inexpensive, and the technology associated with their
production and forming is well understood. Molin et al. performed an evaluation of 316L porous
stainless steel. They showed significant rates of oxidation, even while in a H2 rich reducing
environment. Molin et al. also noted that austenitic steels such as 316L form non-conductive Fe-

25
Cr oxides at temperatures typical for SOFC operation (S. Molin, 2009) . Formations of non-
conductive oxides increase the electrical resistance of the support making it impractical for use as
a current collector in an SOFC. Referring to Table 1 there is also a significant CTE mismatch
with austenitic steel and common electrolytes. For these reasons Molin et al. concluded that 300
series stainless steels are a poor choice for SOFC supports (S. Molin, 2009).
Due to the limitations of the other supports, ferritic stainless steels are generally accepted as the
alloy of choice for metal-support SOFCs (Tucker, 2010). Ferritic stainless steels (400 series
stainless steels) have many advantages over other supports. 400 series alloys are cheap and their
manufacturing process is straightforward and well understood by industry. Referring to Table 1,
it can be seen that 400 series SS also has an excellent CTE match to the commonly used
electrolytes. Ferritic SS have excellent oxidation resistance and are regularly used for high
temperature applications like automotive exhausts and refinery applications. They typically
contain between 10.5wt% and 26wt% Cr. The high Cr content in the metal is critical as the
formation of a chromia scale is necessary to protect against further oxidation of the substrate.
Chromia scale is also conductive, which maintains the electrical conductivity of the support and
allows it to operate as a good current collector (S. Molin, 2010).
Molin et al. performed an evaluation of porous 430L Stainless steel as a potential SOFC support.
They noted higher than expected oxidation rates in the porous sample when compared to dense
430L oxidation rates (S. Molin, 2008). They also noted that the formation of both Fe2O3 and
Cr2O3 scale was present in the porous sample when compared to the dense sample, in which only
Cr2O3 scale was present. They concluded that despite the 16-18wt% Cr in the 430L sample, the
amount of Cr present was insufficient to form a continuous chromia scale due to the increased
surface area exposure of a porous sample. The lack of a continuous chromia scale in the sample
lead to the formation of a non-conductive Fe2O3, which increased the sample’s ASR.

26
Table 1- Summary of proposed SOFC support metals
Alloy Structure CTE Oxidation
Resistance
Alloying Elements % Source
ppm/K Cr Ni Fe Other
Ni based
Ni Austenitic 16.5 Very Poor - 100 - (Tucker, 2010)
Ni-Fe (1:1) Austenitic 13.7 Very Poor - 50 50 (Tucker, 2010)
Ni 625 Austenitic 9-10 Good 19.4 Balance 1.9 Si=0.37,Mo=11.2,
Mn=0.16 (A. Bautista, 2008)
Ni20Cr Austenitic 17.3 Fair 19.05 Balance 0.1 Si=0.72,O=0.04
N=0.04,Mn=0.21 (A. Bautista, 2008)
PI600 Austenitic 13.3 Very Good 15.56 Balance 9.11 Si=0.84,Mn=0.05 (S. Molin, 2010)
Hayes 230 Austenitic 14.8-15.7 Good 22 Balance < 3.0 W=14.0,Co = 5.0
Mo=2,Mn=0.5
(S. Molin, 2008),(Haynes
International, 2007)
Hastelloy-X Austenitic 15.5-16 Very Good 22 Balance 18
Co =1.5,W=0.6,
C= 0.10,
B<0.008,Si<1.0
(Tucker, 2010),(Haynes
International, 1997)
Fe Based
300 SS Austenitic 18-20 Poor >10.5 Var Balance Var (Tucker, 2010)
317L SS Austenitic 19 Poor 18.27 11.87 Balance Si=0.85,Mo=3.04,
Mn=0.12- (S. Molin, 2010)
400 SS Ferritic 10-12 Good >10.5 Var Balance Var (Tucker, 2010)
430L SS Ferritic 11.5 Good 16.0-18.0 - Balance Si<1.0,
Mo<0.5,Mn<1.0-
(S. Molin, 2008),(A. Bautista,
2008),(L. Rose, 2009)
ITM Ferritic 10-12 Excellent 26 - Balance Ti, Y2O3 (T. Franco, 2007)
Fe22CR Ferritic 11.5-12.5 Very Good 22.3 - Balance Si=0.16, Mn=0.48 Ti=0.31,La=0.34
(A. Bautista, 2008),
Crofer22APU Ferritic 11.5-12.5 Very Good 20.0-24.0 - Balance Mn<0.8,C<0.12,
Cu <0.5
(I. Antepara, 2010),(I. Antepara,
2005),(S. Fontana,
2007),(ThyssenKrupp VDM,
2005)
E-brite Ferritic 11.5-12.5 Very Good 26.0-27.5 <0.5 Balance Mo<1.5, <0.4
C<0.01, Cu<0.5
(ATI Allegheny Ludlum, 2007)
,(S. Molin, 2008)

27
Materials used as interconnect materials in SOFCs tend to be strong candidates for cell supports.
Interconnect materials in SOFC stacks join adjacent cells by providing electrical connection between
cells and by providing fuel and exhaust ducting. The environment seen by the interconnect material
is essentially the same environment that is seen by SOFC supports. In addition to the similarities in
the environment, the physical requirements for the interconnect materials and support materials are
similar in that both are desired to have good CTE match to common electrolytes, to be highly
conductive, to have high oxidation resistance, and to be inexpensive. Given the similarities in the
requirements, successful interconnect materials should also be satisfactory candidates for metallic
supports. A recent study by Ikerlan-Energia investigated a leading metallic interconnect material,
Crofer22APU for use as porous metal support of SOFCs. In the study Crofer powder was pressed
and sintered to three different porosity levels. The oxidation rate of each porous sample was
measured using thermogravimetric measurements from 600C to 800C in a humidified hydrogen
environment consistent with conditions present within a SOFC. It was found that all samples
oxidized with the lowest porosity samples showing the lowest rate of oxidation. The increased
resistance to oxidation in the low porosity samples is attributed to the lower surface area present in
the samples. This study concludes that even Crofer, which is a leading metallic interconnect for
SOFC applications is currently incapable of meeting the lifetime demands for a porous metal
support(I. Antepara, 2010).
Plansee SE has developed a porous metal support based on its popular ITM alloy. ITM is an oxide
dispersive strengthen (ODS) ferritic FeCr alloy Fe-26Cr-(Mo, Ti, Y2O3). Dense versions of the ITM
alloy are commonly used as interconnect material for high temperature SOFC stacks such as the
emerging “Energy Server” from Bloom Energy (Plansee SE, 2010). The porous ITM is
manufactured using powder metallurgy (PM) techniques, which gives the support a high porosity to
facilitate the transport of fuel. In the PM manufacturing route used by Plansee SE, the material does
not reach its melting point, and hence no significant evaporation and segregation processes can
occur. This leads to a more homogenous elemental distribution in the alloy and enables the
formation of well-adherent protective oxide scales during the cell operation (T. Franco, 2007). A
recent study by Franco et al. compared the porous ITM support to ingot metallurgy based Fe22Cr
alloy (similar to Crofer ). Thermogravimetric results of this study can be seen in Figure 3.

28
Figure 3- Oxide growth behavior of Plansee ITM compared to ingot based Fe22Cr substrate.
Figure taken from Franco et al. (T. Franco, 2009)
The TGA results show that the ITM alloy had a significantly lower initial weight gain (within the
first 100 hours) and that after 1000 hours the ITM alloy had only experienced approximately 70%
weight gain seen by the Fe22Cr alloy(T. Franco, 2009). It is implied from this result that the ITM
alloy is more resistant to oxidation than the Fe22Cr sample. It is important note, however, that
nearly all of the weight gain experienced by the Fe22Cr alloy was within the first 100 hrs, while the
initial oxidation of the ITM sample only constituted 60% of its total 1000 hour weight gain
suggesting that the ITM sample may actually have a higher rate of oxidation for longer term
operation. By extrapolating the data provided by Franco et al. (Figure 3) and assuming stable long-
term oxidation rates, it can be seen that the weight gain of the ITM sample may in fact surpass that of
the Fe22Cr sample after approximately 2000 hours in the TGA. It is hypothesized by Molin et al.
that a high initial mass gain followed by slow mass gain can be beneficial if one takes into account
the possibility of pre-oxidation of alloy prior to deposition of the ceramic layers(S. Molin, 2010). No
XRD, EDX, or ASR data on the ITM or Fe22Cr alloys is reported by Franco et al. So it is
impossible to determine if the weight gain in either sample was due solely to growth of the protective
and conductive Cr2O3 scale or due to growth of both a Cr2O3 and Fe2O3 which would be detrimental
to the life of the supports.
Molin et al. have noted in various studies of porous metals that oxidation rates in the porous samples
are significantly higher than dense versions of the same alloys (S. Molin, 2008),(S. Molin, 2010),(S.

29
Molin, 2009). These findings are similar to the findings of Antepara et al. and Bautista et al. (I.
Antepara, 2010),(I. Antepara, 2005),(A. Bautista, 2008) . The studies mentioned have included some
of the most advanced alloys for SOFC applications; however, none have shown an alloy to be
capable of long-term operation at 800C. Tucker notes that there is ample evidence that appropriate
coatings, treatments, or alloy modifications can reduce oxidation rate and increase scale adhesion for
dense interconnect materials. Exploring similar options for porous supports should be a focus for
further research (Tucker, 2010).
2.3 Operation temperature
It is generally known that higher operating temperatures lead to higher rates of oxidation of metallic
components in SOFCs. It is also known that lowering the operating temperature lowers the stresses
and strains on components that are caused by CTE mismatch and thermal cycling. As discussed in
section 1.2, lower operating temperatures lead to decreased conductivity of ceramic electrolytes and
decreased catalytic activity for internal reforming and hydrogen oxidation reactions. This leads to
efficiency losses in the system. Many metal supported SOFC researchers and manufactures have
begun to focus on lower temperature metal supported SOFC systems that operate between
approximately 400C – 800C, these systems are often referred to as intermediate temperature solid
oxide fuel cells (IT-SOFC). Lowering the operating temperature of the system allows for use of
more common place alloys as support. Ceres Power Ltd. for example is arguably the leading metal
supported SOFC manufacture in the world. Their systems have a reported operating temperature of
approximately 575C (N.P. Brandon, 2004). Due to their lower operating temperature, Ceres power
is able to use common 400 series Stainless steel foil as their support. In order to achieve this lower
operating temperature Ceres Power has had to pursue alternative electrode and electrolyte materials.
It is also important to note that operating temperatures lower than approximately 625C are generally
considered too cool for stable internal reforming systems, requiring use of an external reforming
system, which increases system complexity (Tucker, 2010). Lower operating temperatures are
currently the only real option for long term reliability of metal supported SOFC systems; however,
there are significant tradeoffs associated with electrical conductivity and catalytic activity.
2.4 Ceramic cell components for metal supported cells
Compatibility of metal support and anode/electrolyte is critical for long term stability and reliability
of the cell. In order to avoid material compatibility issues like CTE mismatch and co sintering

30
issues, typical cell designs use catalyst doped porous anode materials based on the same general bulk
material of the dense electrolyte. Metal support and electrolyte/anode CTE must match within an
acceptable margin to prevent stress related failures. As operating temperature and thermal cycling
requirements decrease, the need for CTE match is also decreased. Also, as system operating
temperature is decreased, electrolyte resistance increases, leading to increased ohmic losses in the
system. The metal support must be capable of long term operation at a temperature necessary for
the electrolyte to conduct ions effectively; while the electrolyte must be able to conduct ions
effectively at a low enough temperature for the metal support to survive long term. Currently the
only commercially viable metal supported SOFCs operate at temperatures that are generally
insufficient to sustain internal reforming and require higher conductive electrolytes and more
electrochemically active anodes than the standard YSZ and Ni-YSZ materials.
2.4.1 Zirconia electrolytes and anodes
Yittria stabilized zirconia (YSZ) is the most common electrolyte used in SOFC systems. It has many
advantages over other electrolyte options. YSZ is a mature, well-established material with a proven
track record of high performance and longevity. It is an inexpensive material that is widely used in
industrial applications lending to long-term price stability and availability (Tucker, 2010). At
operating temperature YSZ is an excellent ion conductor while maintaining essentially zero
electronic conductivity. YSZ is also capable of stable operation at temperatures necessary to support
internal reforming of HC fuels. The key disadvantage of YSZ is its requirement of high system
operation temperature for adequate ion conduction. Operation temperature necessary for ion
conduction can be mitigated somewhat by thinning the electrolyte layer; however, that can lead to
increased electron leakage due to poor film coverage. The lower bound for YSZ based system
operation is not likely to be less than 700C with most current systems operating at 800C which is too
high for sustained reliable operation of any current porous metal support. Ni-YSZ is the most
commonly used anode material with the YSZ electrolyte. The German Aerospace Center (DLR) and
their industry collaborator Plansee SE have pioneered the use of Ni –YSZ/ YSZ based cells
supported by porous ITM alloy manufactured by Plansee, although they are still in the development
stage. (P. Szabo, 2009),(T. Franco, 2007),(T. Franco, 2009) .
2.4.2 Ceria based electrolytes and anodes
Gadolinium-doped ceria (CGO) and samaria-doped ceria (SDC) are popular electrolytes for IT-
SOFC applications with operating temperatures below 600C. Ceria based electrolytes benefit from
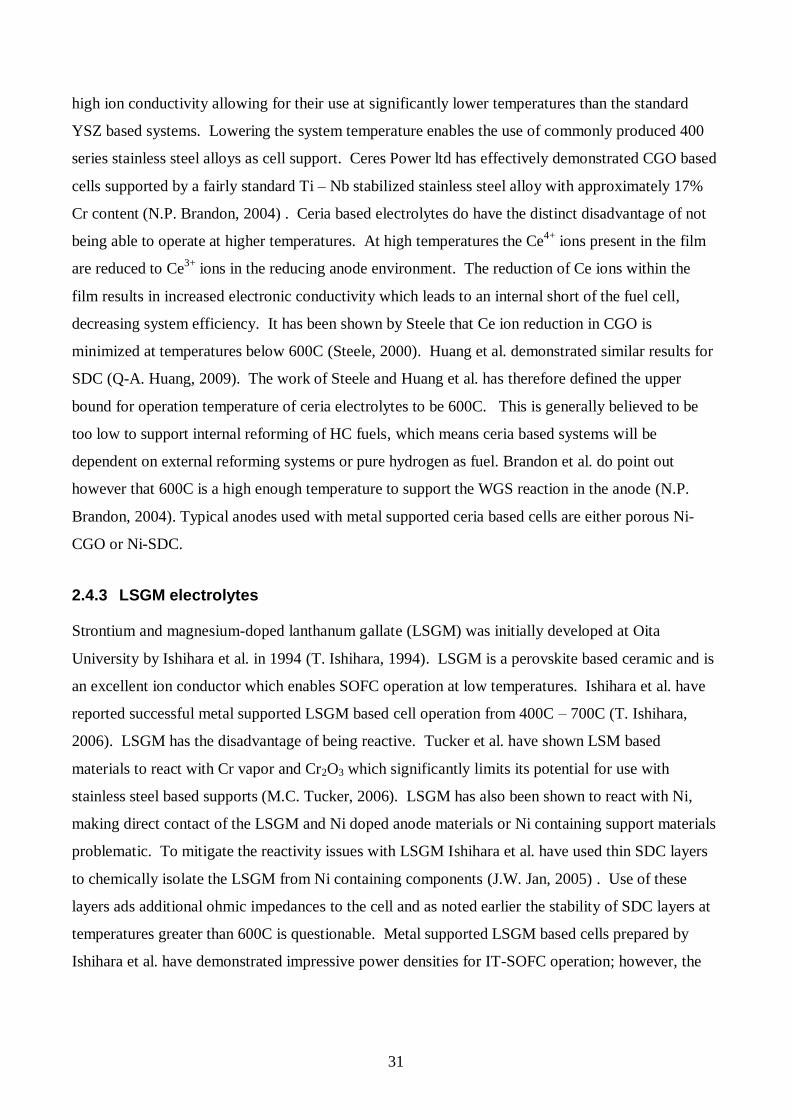
31
high ion conductivity allowing for their use at significantly lower temperatures than the standard
YSZ based systems. Lowering the system temperature enables the use of commonly produced 400
series stainless steel alloys as cell support. Ceres Power ltd has effectively demonstrated CGO based
cells supported by a fairly standard Ti – Nb stabilized stainless steel alloy with approximately 17%
Cr content (N.P. Brandon, 2004) . Ceria based electrolytes do have the distinct disadvantage of not
being able to operate at higher temperatures. At high temperatures the Ce4+
ions present in the film
are reduced to Ce3+
ions in the reducing anode environment. The reduction of Ce ions within the
film results in increased electronic conductivity which leads to an internal short of the fuel cell,
decreasing system efficiency. It has been shown by Steele that Ce ion reduction in CGO is
minimized at temperatures below 600C (Steele, 2000). Huang et al. demonstrated similar results for
SDC (Q-A. Huang, 2009). The work of Steele and Huang et al. has therefore defined the upper
bound for operation temperature of ceria electrolytes to be 600C. This is generally believed to be
too low to support internal reforming of HC fuels, which means ceria based systems will be
dependent on external reforming systems or pure hydrogen as fuel. Brandon et al. do point out
however that 600C is a high enough temperature to support the WGS reaction in the anode (N.P.
Brandon, 2004). Typical anodes used with metal supported ceria based cells are either porous Ni-
CGO or Ni-SDC.
2.4.3 LSGM electrolytes
Strontium and magnesium-doped lanthanum gallate (LSGM) was initially developed at Oita
University by Ishihara et al. in 1994 (T. Ishihara, 1994). LSGM is a perovskite based ceramic and is
an excellent ion conductor which enables SOFC operation at low temperatures. Ishihara et al. have
reported successful metal supported LSGM based cell operation from 400C – 700C (T. Ishihara,
2006). LSGM has the disadvantage of being reactive. Tucker et al. have shown LSM based
materials to react with Cr vapor and Cr2O3 which significantly limits its potential for use with
stainless steel based supports (M.C. Tucker, 2006). LSGM has also been shown to react with Ni,
making direct contact of the LSGM and Ni doped anode materials or Ni containing support materials
problematic. To mitigate the reactivity issues with LSGM Ishihara et al. have used thin SDC layers
to chemically isolate the LSGM from Ni containing components (J.W. Jan, 2005) . Use of these
layers ads additional ohmic impedances to the cell and as noted earlier the stability of SDC layers at
temperatures greater than 600C is questionable. Metal supported LSGM based cells prepared by
Ishihara et al. have demonstrated impressive power densities for IT-SOFC operation; however, the
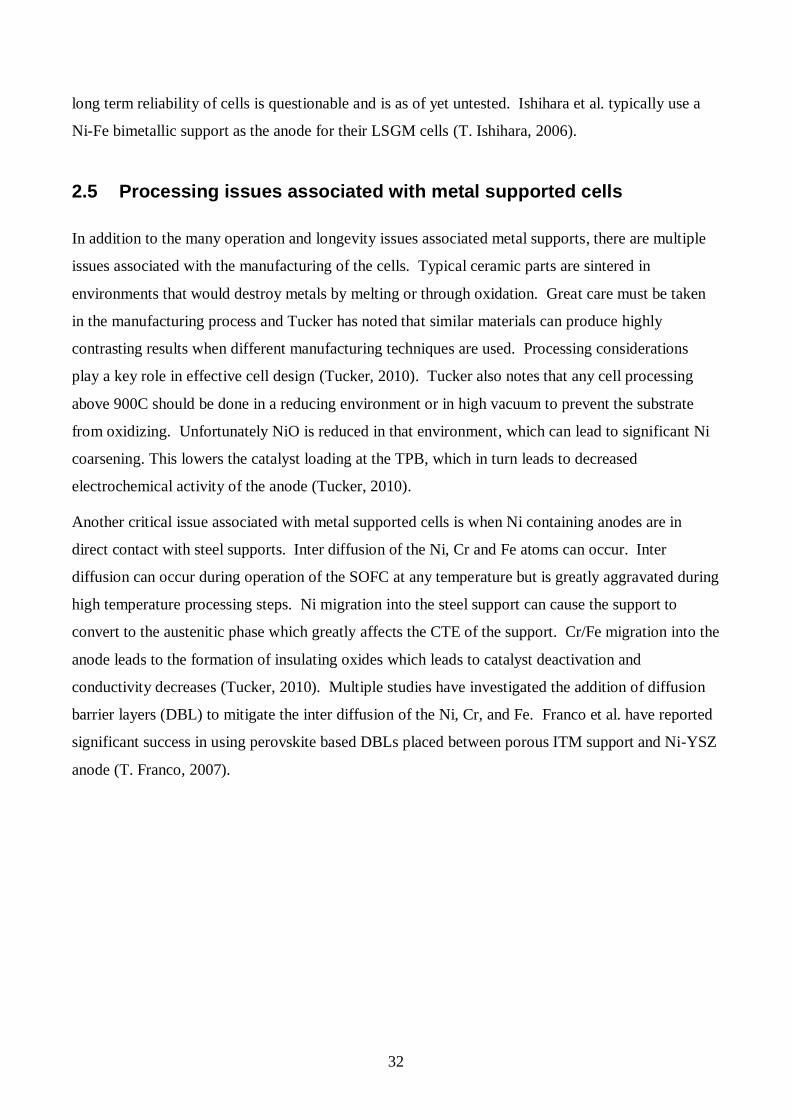
32
long term reliability of cells is questionable and is as of yet untested. Ishihara et al. typically use a
Ni-Fe bimetallic support as the anode for their LSGM cells (T. Ishihara, 2006).
2.5 Processing issues associated with metal supported cells
In addition to the many operation and longevity issues associated metal supports, there are multiple
issues associated with the manufacturing of the cells. Typical ceramic parts are sintered in
environments that would destroy metals by melting or through oxidation. Great care must be taken
in the manufacturing process and Tucker has noted that similar materials can produce highly
contrasting results when different manufacturing techniques are used. Processing considerations
play a key role in effective cell design (Tucker, 2010). Tucker also notes that any cell processing
above 900C should be done in a reducing environment or in high vacuum to prevent the substrate
from oxidizing. Unfortunately NiO is reduced in that environment, which can lead to significant Ni
coarsening. This lowers the catalyst loading at the TPB, which in turn leads to decreased
electrochemical activity of the anode (Tucker, 2010).
Another critical issue associated with metal supported cells is when Ni containing anodes are in
direct contact with steel supports. Inter diffusion of the Ni, Cr and Fe atoms can occur. Inter
diffusion can occur during operation of the SOFC at any temperature but is greatly aggravated during
high temperature processing steps. Ni migration into the steel support can cause the support to
convert to the austenitic phase which greatly affects the CTE of the support. Cr/Fe migration into the
anode leads to the formation of insulating oxides which leads to catalyst deactivation and
conductivity decreases (Tucker, 2010). Multiple studies have investigated the addition of diffusion
barrier layers (DBL) to mitigate the inter diffusion of the Ni, Cr, and Fe. Franco et al. have reported
significant success in using perovskite based DBLs placed between porous ITM support and Ni-YSZ
anode (T. Franco, 2007).

33
3 EXPERIMENTAL METHOD
Understanding the mass transport and internal reforming characteristics of the SOFC anodes is
critical to the long term viability of the technology. While ceramic based cells have been studied
extensively in this area, metal supported cells have not received the same treatment. In this work, a
state of the art Ni-YSZ anode (CoorsTek reaction sintered Ni-YSZ) will be compared to a leading
next generation porous support (Plansee SE ITM) in regards to mass transport and reforming
capabilities. Analysis techniques used are liquid picnometry (Archimedes’ Method) using distilled
water, mercury porosimetry, SEM image analysis, and Separated Anode Experiment (SAE) to
compare gas transport and internal reforming performance of the anodes.
3.1 Sample fabrication
3.1.1 CoorsTek reaction-sintered Ni-YSZ Anode
The standard for comparison used in this study is a Ni-YSZ anode that was developed and patented
by CoorsTek Inc (W.G.Coors, 2007). The preparation of the CoorsTek reaction sintered anode is
detailed in Storjohann et al. (D. Storjohann, 2009). Anode preparation begins with combining and
ball milling 92 mol% monoclinic zirconia powder with 8 mol% yttria powder (Advanced Material
Resources, Toronto, Ontario). The yttria-zirconia powder is dried, screened, and then blended with
65 wt% nickel oxide (OMG, Westlake, OH). The anode powder is then mixed with a binder specific
to the final forming process. In the case of this study, the anode is dry pressed. The slurry is then
spray-dried into a rotary atomizer. The NiO powders used for the reaction sintered process have a
particle size of 10 μm. No pore former is needed for this process as the reduction of NiO into Ni
within the sample during startup will provide adequate porosity. The powders used for Ni-YSZ
anode formation at the Colorado Fuel Cell Center (CFCC) are provided by CoorsTek, Inc.
At the CFCC, 10g of powder is pressed into discs using a uni-axial press (Carver AutoFour30)
loaded to 53.4 kN and held for 10 seconds. The green discs are then placed onto YSZ-Al2O3 porous
setter plates (Selee Ceramics) and sintered in ambient pressure air at 1400C for four hours(D.
Storjohann, 2009). After sintering, the anode measures 4.43cm in diameter and is 1.45 mm thick
(Richards, 2010). The sintered anode disc is then shaped to the desired format using a diamond
cutting wheel and surface grinding plates. For SAE experiments, the anode edge is sealed using
alumina paste (Cotronics 989FS) to prevent gas leakage from the sides of the sample. The CoorsTek

34
sample used in this study was prepared by Amy Richards at The Colorado School of Mines,
Colorado Fuel Cell Center.
3.1.2 Plansee porous ITM support
Plansee SE has developed a porous metal support based on its popular ITM alloy. The ITM is an
oxide dispersive strengthened (ODS) ferritic FeCr alloy, Fe-26Cr-(Mo, Ti, Y2O3). The porous ITM
is manufactured using powder metallurgy (PM) techniques, which gives the support a high porosity
to facilitate the transport of fuel. In the PM manufacturing route used by Plansee, the material does
not reach its melting point, and hence no significant evaporation and segregation processes can
occur. This leads to a more homogenous elemental distribution in the alloy and enables the
formation of well adhered protective oxide scales during the cell operation (T. Franco, 2007). The
porous ITM substrate was delivered to the CFCC in 1mm thick plate form. A standard metal cutting
band saw was used to rough cut the sample and a surface grinding wheel was used for final shaping
of the sample to the desired size. Alumina paste (Cotronics 989FS) was used to seal the edges of the
ITM sample for SAE testing. No AFL was present on the ITM sample analyzed in this study.
3.2 Sample characterization
As detailed in section 2.1.6, internal reforming anodes and supports must have multiple
characteristics in order to perform well in an operational SOFC environment. Two of the most
import characteristics are the mass transport and internal reforming capabilities of those structures.
Multiple properties of the anode/support materials influence their transport and internal reforming
characteristics including porosity, pore size, particle size, reforming catalytic activity, reforming
catalytic surface area, and structure tortuosity. In addition to the SAE, several other characterization
techniques are used to gain a more complete understanding of the sample structures. Scanning
electron microscopy (SEM) is used to understand the surface and cross sectional morphology of the
samples. Porosity measurements using Archimedes method (distilled water) and mercury
porosimetry are used to measure sample porosity (ф), mean particle diameter (dp), and mean pore
size (rp). These characteristics are then used in computational model to estimate sample tortuosity
(τp).
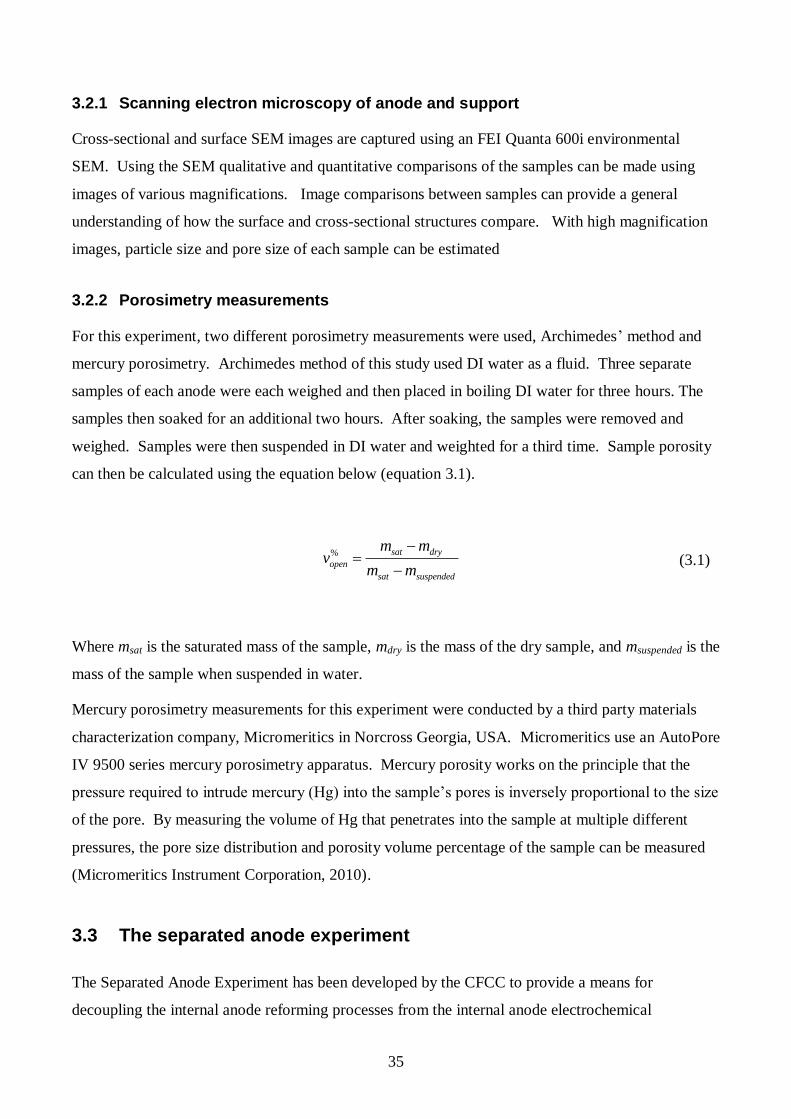
35
3.2.1 Scanning electron microscopy of anode and support
Cross-sectional and surface SEM images are captured using an FEI Quanta 600i environmental
SEM. Using the SEM qualitative and quantitative comparisons of the samples can be made using
images of various magnifications. Image comparisons between samples can provide a general
understanding of how the surface and cross-sectional structures compare. With high magnification
images, particle size and pore size of each sample can be estimated
3.2.2 Porosimetry measurements
For this experiment, two different porosimetry measurements were used, Archimedes’ method and
mercury porosimetry. Archimedes method of this study used DI water as a fluid. Three separate
samples of each anode were each weighed and then placed in boiling DI water for three hours. The
samples then soaked for an additional two hours. After soaking, the samples were removed and
weighed. Samples were then suspended in DI water and weighted for a third time. Sample porosity
can then be calculated using the equation below (equation 3.1).
% sat dry
open
sat suspended
m mv
m m
(3.1)
Where msat is the saturated mass of the sample, mdry is the mass of the dry sample, and msuspended is the
mass of the sample when suspended in water.
Mercury porosimetry measurements for this experiment were conducted by a third party materials
characterization company, Micromeritics in Norcross Georgia, USA. Micromeritics use an AutoPore
IV 9500 series mercury porosimetry apparatus. Mercury porosity works on the principle that the
pressure required to intrude mercury (Hg) into the sample’s pores is inversely proportional to the size
of the pore. By measuring the volume of Hg that penetrates into the sample at multiple different
pressures, the pore size distribution and porosity volume percentage of the sample can be measured
(Micromeritics Instrument Corporation, 2010).
3.3 The separated anode experiment
The Separated Anode Experiment has been developed by the CFCC to provide a means for
decoupling the internal anode reforming processes from the internal anode electrochemical

36
processes. The SAE was originally outlined and developed by Hecht et al. (E. Hecht, 2005),(Hecht,
2005). The SAE has since been used by Daggett, Gupta, and Richards (Daggett, 2008), (G.K. Gupta,
2006),(Gupta, 2007), (Richards, 2010),(A. Richards, 2010), (A. Richards, 2011).
The SAE setup used for this experiment was built by Amy Richards at the CFCC and contains many
modifications and improvements from the setup that was originally reported by Hecht et al.
Chemically inert ceramic manifolds and tubing are now used within the hot zone of the experiment,
greatly decreasing the possibility of contamination. An improved sealing method using glass filter
paper and mica sheets has significantly improved the gas leakage during the experiment. Improved
start-up procedures have been implemented to prevent anode damage during start up. The mass
spectrometer that was originally used has been replaced with a gas chromatograph, greatly improving
the repeatability of the gas composition measurements. The experiment has also been modified so
that the gas pressures in the fuel gas manifold and electrolyte gas manifold can be monitored and
balanced using a water column, better representing the actual anode environment seen within an
operational SOFC.

37
Figure 4- Cutaway illustration of the Separated Anode Experiment setup. Diagram from Hecht et al.
(E. Hecht, 2005).
3.3.1 SAE design
An illustration of the SAE setup is shown in Figure 4. The anode sample is placed between the two
ceramic gas manifolds. 0.6 mm thick mica paper seals (McMaster-Carr) are placed between two
borosilicate glass filter paper seals (Fisher Scientific). A mica/glass seal is placed on each side of the
sample between the sample and ceramic manifold as seen in Figure 5. This sealing method is based
on the method used by Chou et al. (Y.-S. Chou, 2002).

38
Figure 5- Exploded view of SAE manifold assembly and anode sealing process. Diagram taken
from(Richards, 2010)
The manifold and sample assembly is then placed into a furnace and compressed for sealing. Gas
connections are then coupled to the manifolds using compressive Swagelok fittings. The assembly
is then heated to SOFC operating temperature (800C). As the sample is heated, the glass paper seals
will melt and penetrate into the surfaces of the mica, ceramic manifold, and the sample, creating a
better and tighter seal. The SAE has the ability to operate at various temperatures. However, for the
extent of this study, all experiments are conducted at 800C.
Referring to Figure 4, it can be seen that each manifold has an inlet tube and an exhaust tube. The
top manifold is the fuel manifold. During reforming testing, the fuel manifold is fed with a gas
composition consistent with SOFC fuel mixtures. The bottom manifold is the electrolyte manifold.
During reforming testing, it is fed with a gas composition that would be present at the TPB of the
cell. The presence of the fuel mixture on the fuel side and electrolyte gases on the electrolyte side
allows for the simulation of the internal reforming anode environment with no need for
electrochemical reactions to occur. Thermocouples are placed at the anode surface to monitor
sample temperature. The gas flows are controlled using mass flow controllers (MFC) (Alicat
Scientific) accessed through a custom LabVIEW interface running on a standard desktop PC.

39
The gases present on the fuel side and the gases present on the electrolyte side cross diffuse through
the anode structure in opposite directions. While diffusing through the anode, the gases are free to
react with each other in reforming reactions to produce hydrogen, carbon monoxide, and other
reforming product gases. The excess reactants and products from these reactions then diffuse to
either the fuel or the electrolyte manifold channels and exit through the corresponding exhaust. The
exhaust gas compositions are measured using a gas chromatograph (GC) (Agilent MicroGC 3000).
Prior to reaching the GC, water vapour is condensed out of the exhaust streams using a counter flow
dryer (Perma Pure MD Series). The use of the counter flow dryer prevents the build up of water
within the stainless steel tubing of the experiment.
The exit gas compositions are directly related to the mass transport and internal reforming
characteristics of the anode sample and can therefore be used to predict the performance of the anode
in an operational SOFC. There is no electrolyte or cathode present in the experiment. As such there
is a complete decoupling of the electrochemical processes from the reforming and gas transport
processes present in the anode. The design of the SAE allows the experimenter to directly measure
the anode’s mass transport and internal reforming capabilities without having to consider the
electrochemical interactions.
3.3.2 Start up and maintenance procedure
The CoorsTek anode is placed into the experiment in a dense green state, meaning the NiO used in
the manufacture of the anode has not yet been chemically reduced to Ni. When the NiO is reduced
the porosity of the anode is formed and Ni becomes chemically active and is available to act as a
reforming catalyst. A critical aspect of the start up procedure is this reduction process. By exposing
the anode to a reducing environment during the heating period, NiO is reduced to Ni. Care must be
taken during the reducing process and the heating of the sample. If the sample is heated too quickly
or if it is exposed to too aggressive of a reducing environment in the early stages of the start up
process, excessive stresses on the ceramic structure can occur leading to sample fracture(Richards,
2010). The CoorsTek sample was heated from room temperature to 800C over a period of 800
minutes. During the heating period, forming gas (96.5% N2 + 3.5%H2) is flowed over the sample at
a rate of 50 sccm in each channel. Once the sample has reached 800C the gas composition and flow
is changed to 67% H2 and 33% N2 at a flow rate of 75 sccm in each channel. The sample is held in
this environment for 48 hours to ensure complete reduction of the NiO has occurred. Once the
sample has been reduced the CO2 transport and reforming tests are performed. In between tests, the
sample is stored at 800C while a gas mixture of 67% H2 and 33% N2 is flowed at a rate of 75 sccm in

40
each channel. Once all the tests have been performed, the sample is cooled back to room
temperature over a period of 800 minutes while flowing a gas mixture of 67% H2 and 33% N2 .
The ITM sample is handled in a slightly different manner than the CoorsTek sample. In the case of
the ITM sample, no reduction process is necessary. The ITM sample is also much more durable than
the ceramic CoorsTek anode. However the ITM sample, being metal, is more susceptible to
oxidation, especially at high temperatures. The ITM sample was heated within the experiment from
room temperature to 800C over a period of 800 minutes to be consistent with the CoorsTek handling.
Since fracture is not a concern with the ITM sample but oxidation is a concern, a gas mixture of 67%
FG and 33% H2 is flowed over the sample at a rate of 150 sccm in each channel. A gauge pressure
of approximately 5 inH2O is maintained in each channel. This allows for a highly reducing
environment during the heating of the sample which helps prevent chemical oxidation. The slightly
increased pressure helps to discourage any possible infiltration of O2 from the atmosphere into the
system. Once the sample reaches 800C the transport and reforming tests can be performed. In
between tests the sample is stored at 800C while a gas mixture of 67% H2 and 33% N2 is flowed at a
rate of 150 sccm in each channel at approximately 5 inH2O gauge pressure. Once all tests have been
performed the sample is cooled back to room temperature over a period of 800 minutes while a gas
mixture of 67% H2 and 33% N2 is flowing at a rate of 150 sccm at approximately 5 inH2O gauge
pressure in each channel.
3.3.3 CO2 transport experiments
CO2 transport tests are used to measure the ability of gases to diffuse through a particular anode
material. Three CO2 transport runs were performed on each sample. The CO2 transport tests are
usually alternated with CO2 dry reforming tests in the SAE. By alternating the tests, coking or other
side effects of the previous reforming test that would affect mass transport within the sample will be
seen in the results of the subsequent transport test.
In the transport experiments, a near-inert gas stream of 50% CO2 and 50% forming gas (FG) (3.5%
H2 + 96.5% N2) is fed to the electrolyte side gas manifold while a stream of pure FG is fed to the fuel
side gas manifold. Total fuel flow rates are matched in each channel using MFCs. The gas pressures
in each channel are equalized to each other using a water column. By equalizing the pressure in each
gas channel, the pressure gradient across the sample is zero which better represents the operating
conditions of an operational SOFC. Test runs are performed at four different flow rates (75, 100,
150 and 200 sccm per channel). The amount of CO2 transported through the anode is determined by
gas composition analysis of the fuel side exhaust using gas chromatography. The results of the

41
transport tests are then compared between samples. Samples with higher concentrations of CO2 in
the fuel side exhaust have higher gas transport capabilities.
3.3.4 Methane dry reforming tests
Fuel reforming experiments are performed utilizing a mixture of CH4 and CO2 at a typical SOFC
operating temperature (800C). In the case of these experiments CO2 represents the products of the
electrochemistry reactions that would be present at the TPB during typical SOFC operation. Steam
is not used as a reforming reactant due to poor humidity control and poor repeatability of results as
detailed in Hecht et al.(E. Hecht, 2005). It has been established that the reforming reaction
mechanisms between CO2 reforming and steam reforming are essentially the same. As such, the CO2
reforming performance can be extrapolated to qualitatively predict steam reforming performance of
the sample. The use of CO2 as primary reforming reactant is discussed in more detail in section 3.3.6.
For the dry reforming tests a mixture of 20% CH4, 80% FG is supplied to the fuel-side inlet and a
50% CO2, 50% FG mixture is supplied to the electrolyte-side inlet. The gases then diffuse through
the porous sample and can participate in reforming reactions according to the reforming
characteristics of the sample being tested. Total gas flow into each channel is matched. The gas
pressures in each channel are equalized to each other using a water column. Exhaust stream gas
compositions are measured using gas chromatography. Test runs are performed at four different
input flow rates (75, 100, 150, 200 sccm per channel).
The exiting gas compositions are directly related to the internal reforming performance within the
sample. The higher the concentration of reforming products in the exhaust streams, the higher
internal reforming activity of the sample. Comparisons of the exhaust gas compositions allows for
comparison of the reforming activity of each sample.
3.3.5 Experimental repeatability
CO2 transport tests and CH4 reforming tests are repeated three times for each sample to verify
experimental repeatability. Each CO2 transport test is followed by a CH4 reforming test so that any
decay in mass transport capabilities of the sample due to carbon deposition during the previous
reforming test are seen in the subsequent CO2 transport test. Only one test is performed in a 24 hour
period. To avoid thermal stress on the samples and delays associated with cooling and reheating of
the samples, they are maintained at 800C for the duration of the testing period. When not being
tested, the CoorsTek anode is stored with mixture of 66% FG and 33% H2 with a total flow of
75sccm in each gas channel at ambient pressure to maintain a reducing environment. The Plansee

42
ITM sample is stored with the same gas mixture but flowing at a higher rate of 150 sccm in each
channel held at a pressure of approx 5 inH2O using the water column. The storage parameters for the
ITM sample are adjusted due to oxidation concerns. Each sample is held at operating temperature
for approximately 6 days during the testing period, not including time to initially heat and cool the
sample.
3.3.6 Discussion on the use of dry reforming
While steam is a critical reforming reactant and a product of the electrochemistry of SOFC operation,
the use of steam in the experiment is extremely problematic. Hecht et al. report that the
humidification level of the gas stream is extremely difficult to control, leading to poor repeatability
of the reforming experiments that utilized steam as a reforming reactant (E. Hecht, 2005). A recent
study by Sumi et al. compared the internal reforming capabilities of Ni-YSZ and Ni-ScSZ anodes
both in steam reforming and dry reforming (CO2) environments in this study Ni-ScSZ anode had
higher reforming performance than the Ni-YSZ performance in both steam and dry reforming
tests(H. Sumi, 2010). In a study for steam reforming and dry reforming of CH4 Rostrup-Nielsen and
Hansen note that the replacement of steam by CO2 in the reforming reaction has no drastic impact on
the reforming mechanism(Hansen, 1993). However both Sumi et al. and Rostrup-Nielsen and
Hansen note that reforming activity using CO2 is decreased when compared to steam reforming. This
behaviour was also noted in Hecht et al.(E. Hecht, 2005).
While CO2 reforming appears to be an acceptable proxy for steam reforming it is important to note
that different reforming catalysts respond to dry reforming and steam reforming differently.
Rostrup-Nielsen and Hansen note that the reforming activity ratio of steam reforming and dry
reforming over Ni catalysts appears to be approximately 80%. However each other catalyst they
tested had a different dry reforming to steam reforming activity ratio. It is extremely important to
consider the dry reforming and steam reforming activity ratio when comparing anodes with different
reforming catalysts in the SAE. While direct comparisons of dry reforming performance will always
be possible when comparing the dry reforming results, trying to infer steam reforming activity based
on dry reforming results is problematic. It is clear that the lack of steam reforming capabilities in the
SAE is a significant issue and work is underway to add this capability to experiment.

43
4 COMPUTATIONAL MODEL
A computational model for the simulation of mass transport and chemical reactions occurring within
the anode has been developed at the CFCC. Figure 6 shows a visual representation of the model
framework.
Figure 6- Frame work for the CFCC computational model. Anode and flow channels are divided
into Δx elements along the length of the channel. The Anode is also divided into Δz elements through
its thickness. Diagram taken from (E. Hecht, 2005)
Gas flow within the fuel and electrolyte channels is described by a series of perfectly stirred tank
reactors. Gas flow within the anode is described by the Dusty-Gas Model (DGM). The flow within
the flow channels is treated considering only axial variation in the x-direction. Perfect mixing is
assumed within the flow channels. Plug-flow assumption is used within the anode. Therefore, only
transport due to gradients in the z-direction is considered. Flow induced by axial gradients is
neglected.
4.1 Flow in channels
Each channel is considered a series of perfectly stirred tank reactors, which implies uniform
temperature and composition within the channel (H. Zhu, 2005). The continuity equation for gas
species within the fuel channel can be seen below in equation 4.1.

44
. . ckk k cm m j A ‡ (4.1)
Where .
km‡ and .
km are the mass flow rates in and out of the x-direction channel element respectively,
c
kj is the mass flux of the species k in the z-direction from the channel into the anode resulting from
the chemistry and transport occurring within it, and cA is the cross-sectional area between the fuel
channel and anode control volume. The general continuity equation within the fuel channel is shown
below.
. .
1
Kc
k k c
k
m m j A
‡ (4.2)
K is the total number of species present in the gas mixture and
. .
k km Y m. (4.3)
Where Yk is the species mass fraction.
The continuity equation is used to solve for the density of the gas mixture.
The flow channels are assumed to be chemically inert and the gas phase chemistry within the
channels is assumed to be negligible. With the short residence times of the SAE taken it to account, it
has been shown that neglecting the gas phase chemistry is reasonable under the operating conditions
of the (800 C, 1 Atm pressure) (G.K. Gupta, 2006).
4.2 Transport and chemistry within porous anode
The gas composition within the anode is determined by solving a reactive porous media problem in
the structure of the anode itself. The single species continuity equation in the anode is shown in
equation (4.4),

45
.k
k k s
js W A
z
(4.4)
where kj is the mass flux of species k within the anode, sA is the specific area (i.e., area per unit
volume) of the exposed Ni catalyst, .
ks is the net molar production rate of gas-phase species k by
heterogeneous reforming chemistry, and kW are the species molecular weights (R.J. Kee, 2003). The
general continuity equation (equation 4.5) shown below is then used to find the density (ρ) of the gas
mixture.
.
1 1
K Kk
k k s
k k
js W A
z
(4.5)
Gas species fluxes within the anode are related by the Dusty-Gas Model (DGM) (Malinauskas,
1983),(H. Zhu, 2005) .
The DGM is an implicit relationship between the gas-phase molar fluxes of each species, Jk, the
molar concentrations[ ]kX , concentration gradients, and the pressure gradient p. The DGM is shown
the equation below.
, ,
[ ] [ ] [ ][ ]
[ ]
gl l k l k kke e e
l k T kl k Kn k Kn
BX J X J J XX p
X D D D
(4.6)
gB is the permeability, is the mixture viscosity and [ ]TX is the total molar concentration, as shown
below.
[ ]T
pX
RT (4.7)
The DGM is the combination of ordinary multi-component diffusion (gas-gas collisions), Knudsen
diffusion (gas-wall collisions), and pressure-driven Darcy flow. The ordinary diffusion coefficient
and the Knudsen diffusion coefficient depend on the binary gas-to-gas diffusion coefficients

46
(evaluated from kinetic theory) and the physical porous media properties. These properties include
porosity ϕ, average pore radius rp , and tortuosity τg .
Heterogeneous chemistry within the anode is represented by a reaction mechanism describing CH4-
reforming on Ni-based catalysts. The mechanism used is taken from Hecht et al. and contains 42
irreversible elementary reactions (see Table 2) involving six gas-phase and twelve surface- adsorbed
species (E. Hecht, 2005). Because the mechanism is based on elementary reactions and describes
all combinations of steam reforming, dry reforming, partial oxidation, and autothermal reforming, its
applicability spans a far-broader range than the global reforming reactions often used in SOFC
internal reforming modelling.
Since the pore size within the anode is comparable to the molecular mean-free-path length, the
probability for gas-gas collisions is low. Gas-phase chemistry within the voids of the anode can
therefore be neglected(E. Hecht, 2005).
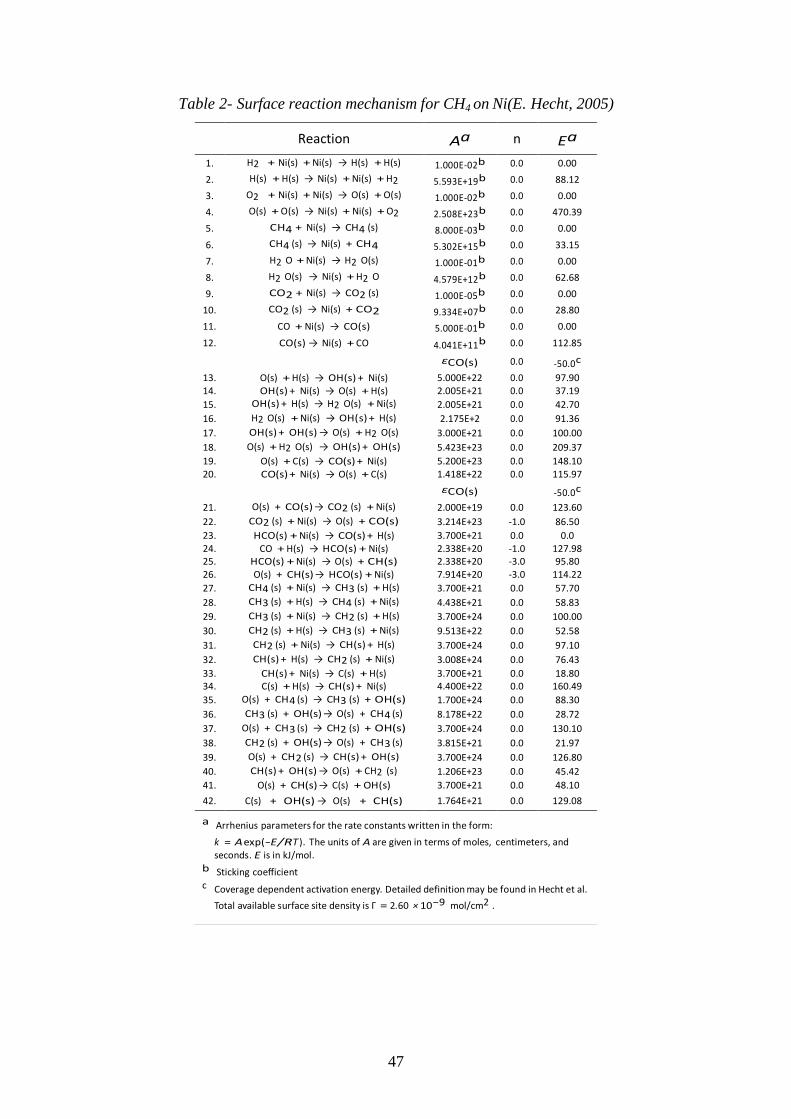
47
Table 2- Surface reaction mechanism for CH4 on Ni(E. Hecht, 2005)
Reaction Aa n Ea
1. H2 + Ni(s) + Ni(s) → H(s) + H(s) 1.000E-02b 0.0 0.00
2. H(s) + H(s) → Ni(s) + Ni(s) + H2 5.593E+19b 0.0 88.12
3. O2 + Ni(s) + Ni(s) → O(s) + O(s) 1.000E-02b 0.0 0.00
4. O(s) + O(s) → Ni(s) + Ni(s) + O2 2.508E+23b 0.0 470.39
5. CH4 + Ni(s) → CH4 (s) 8.000E-03b 0.0 0.00
6. CH4 (s) → Ni(s) + CH4 5.302E+15b 0.0 33.15
7. H2 O + Ni(s) → H2 O(s) 1.000E-01b 0.0 0.00
8. H2 O(s) → Ni(s) + H2 O 4.579E+12b 0.0 62.68
9. CO2 + Ni(s) → CO2 (s) 1.000E-05b 0.0 0.00
10. CO2 (s) → Ni(s) + CO2 9.334E+07b 0.0 28.80
11. CO + Ni(s) → CO(s) 5.000E-01b 0.0 0.00
12. CO(s) → Ni(s) + CO 4.041E+11b 0.0 112.85
εCO(s) 0.0 -50.0c
13. O(s) + H(s) → OH(s) + Ni(s) 5.000E+22 0.0 97.90 14. OH(s) + Ni(s) → O(s) + H(s) 2.005E+21 0.0 37.19 15. OH(s) + H(s) → H2 O(s) + Ni(s) 2.005E+21 0.0 42.70 16. H2 O(s) + Ni(s) → OH(s) + H(s) 2.175E+2 0.0 91.36 17. OH(s) + OH(s) → O(s) + H2 O(s) 3.000E+21 0.0 100.00 18. O(s) + H2 O(s) → OH(s) + OH(s) 5.423E+23 0.0 209.37 19. O(s) + C(s) → CO(s) + Ni(s) 5.200E+23 0.0 148.10 20. CO(s) + Ni(s) → O(s) + C(s) 1.418E+22 0.0 115.97
εCO(s) -50.0c
21. O(s) + CO(s) → CO2 (s) + Ni(s) 2.000E+19 0.0 123.60
22. CO2 (s) + Ni(s) → O(s) + CO(s) 3.214E+23 -1.0 86.50 23. HCO(s) + Ni(s) → CO(s) + H(s) 3.700E+21 0.0 0.0 24. CO + H(s) → HCO(s) + Ni(s) 2.338E+20 -1.0 127.98 25. HCO(s) + Ni(s) → O(s) + CH(s) 2.338E+20 -3.0 95.80 26. O(s) + CH(s) → HCO(s) + Ni(s) 7.914E+20 -3.0 114.22 27. CH4 (s) + Ni(s) → CH3 (s) + H(s) 3.700E+21 0.0 57.70 28. CH3 (s) + H(s) → CH4 (s) + Ni(s) 4.438E+21 0.0 58.83 29. CH3 (s) + Ni(s) → CH2 (s) + H(s) 3.700E+24 0.0 100.00 30. CH2 (s) + H(s) → CH3 (s) + Ni(s) 9.513E+22 0.0 52.58 31. CH2 (s) + Ni(s) → CH(s) + H(s) 3.700E+24 0.0 97.10 32. CH(s) + H(s) → CH2 (s) + Ni(s) 3.008E+24 0.0 76.43 33. CH(s) + Ni(s) → C(s) + H(s) 3.700E+21 0.0 18.80 34. C(s) + H(s) → CH(s) + Ni(s) 4.400E+22 0.0 160.49 35. O(s) + CH4 (s) → CH3 (s) + OH(s) 1.700E+24 0.0 88.30 36. CH3 (s) + OH(s) → O(s) + CH4 (s) 8.178E+22 0.0 28.72 37. O(s) + CH3 (s) → CH2 (s) + OH(s) 3.700E+24 0.0 130.10 38. CH2 (s) + OH(s) → O(s) + CH3 (s) 3.815E+21 0.0 21.97 39. O(s) + CH2 (s) → CH(s) + OH(s) 3.700E+24 0.0 126.80 40. CH(s) + OH(s) → O(s) + CH2 (s) 1.206E+23 0.0 45.42 41. O(s) + CH(s) → C(s) + OH(s) 3.700E+21 0.0 48.10
42. C(s) + OH(s) → O(s) + CH(s) 1.764E+21 0.0 129.08
a Arrhenius parameters for the rate constants written in the form:
k = A exp(−E/RT ). The units of A are given in terms of moles, centimeters, and seconds. E is in kJ/mol.
b Sticking coefficient
c Coverage dependent activation energy. Detailed definition may be found in Hecht et al.
Total available surface site density is Γ = 2.60 × 10⁻⁹ mol/cm2 .
48
4.3 Computational algorithm
The resulting series of nonlinear simultaneous equations is solved computationally. The species
continuity equations for the gas channels are coupled to the anode species continuity equations by
the exchanged mass fluxes c
kj exchanged between the anode and flow channels. Equation 4.6 is a
second-order boundary value problem, with the gas-phase species compositions in the channels taken
as the boundary conditions.
Due to the uniform gas channel assumptions, the compositions at the top and bottom of the anode are
taken to be the compositions within the gas flow channels. There is assumed to be no flow
resistance between the anode surface and the gas channels. The channels are divided into cells of
length ∆x and the anode is divided into cells of length ∆z. The pressure within the anode is
calculated using the ideal gas law below.
PW
RT
(4.8)
Where P is pressure, W
is the average molecular weight, R is the universal gas constant, and T is
temperature. The temperature is assumed to be uniform through the channel and determined by the
temperature of the external furnace. Fuel flow is assumed to be isobaric. These assumptions have
been verified by measurements made during experimentation.
The CFCC computational model was originally developed and reported by Hecht et al. (E. Hecht,
2005). The model as described above has been completely rewritten with modifications to gas phase
uniformity assumptions and the computational algorithm. The model used in this report is written by
Amy Richards at the CFCC. The above description of the model is based extensively on a report
from Amy Richards (Richards, 2010). All model fitting to the experimental SAE results in this
report was performed by Amy Richards.

49
5 EXPERIMENTAL RESULTS
5.1 Visual observations pre and post run
Pre and post run pictures of the CoorsTek and the ITM samples can be seen in Figure 7. Significant
differences in the samples can be seen. Prior to running in the SAE, the CoorsTek is in a non-
reduced state. The NiO is still present in the CoorsTek anode giving it a green color. After the SAE
experiment it can be seen that the NiO has been reduced to Ni as the anode is a uniform grey color.
Figure 7-Images of CoorsTek Ni-YSZ anode. Left: CoorsTek anode prior to being run in the SAE.
Green color is unreduced NiO. Right: CoorsTek anode after running the SAE, gray color indicates
NiO is completely reduced to Ni. The gold ring around the sample is the mica seal from the SAE
experiment, which is now adhered to the surface.
Pictures of the Plansee ITM sample pre and post run can be seen in Figure 8. The ITM sample also
experiences a significant color change. Prior to running in the SAE, the ITM sample is a uniform
grey color. After the SAE experimentation, the ITM sample has turned black. The color change is
assumed due to the growth of an oxidation layer.
Figure 8- Images of Plansee ITM support. Left: Raw ITM prior to final forming. Right: ITM after
running in the SAE, the black color is an oxidation layer on the sample. The gold ring around the
sample is the mica seal from the SAE experiment, which is now adhered to the surface.

50
Cross-sectional images of the post run ITM and CoorsTek sample can be seen in Figure 9. The
Plansee sample shows uniform oxidation through the sample. The CoorsTek sample shows uniform
reduction of the NiO through the cross-sectional direction of the sample. NiO is still present on the
left and right sides of the sample suggesting that the sealing techniques employed in the SAE work
satisfactorily. Note that the CoorsTek sample pictured is from an abbreviated run in the SAE and it
is likely that the NiO remaining in a sample that had run for an entire testing cycle would show
significantly less NiO remaining.
Figure 9-Cross-sectional images of the samples after running in the SAE. Left: The Plansee ITM
sample shows uniform oxidation through the entire crossection. Right: The CoorsTek Ni-YSZ show
uniform reduction of NiO through the thickness of the sample, NiO remains laterally, suggesting
effective edge sealing. Note: the CoorsTek sample pictured was only run in the SAE for a short time,
complete reduction of NiO is expected in samples that have received full term testing.
5.2 Porosimetry results
Two different porosimetry measurement techniques are used in this report, liquid picnometry
(Archimedes’ method) using standard DI water as the fluid and mercury porosimetry. Liquid
picnometry measurements are conducted at the CFCC. Mercury porosimetry measurements are
conducted by a third party, Micromeritics Particle Analysis (Norcross, GA).
5.2.1 Liquid picnometry results
Three samples of the Ni-YSZ anode and three samples of the ITM support were measured using
Archimedes’ method. Referring to Table 3 it can be seen that the ITM and Ni-YSZ anode have
similar porosities when measured using Archimedes method.
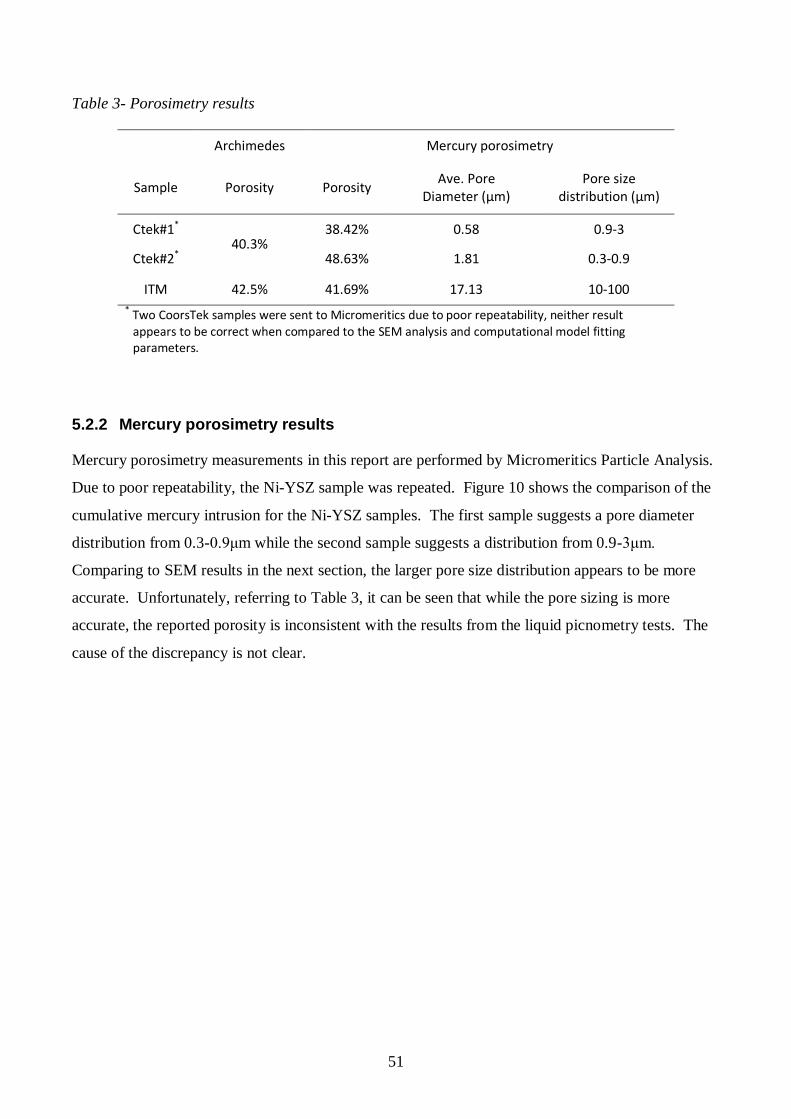
51
Table 3- Porosimetry results
Archimedes Mercury porosimetry
Sample Porosity Porosity Ave. Pore
Diameter (μm) Pore size
distribution (μm)
Ctek#1*
40.3% 38.42% 0.58 0.9-3
Ctek#2* 48.63% 1.81 0.3-0.9
ITM 42.5% 41.69% 17.13 10-100
* Two CoorsTek samples were sent to Micromeritics due to poor repeatability, neither result appears to be correct when compared to the SEM analysis and computational model fitting parameters.
5.2.2 Mercury porosimetry results
Mercury porosimetry measurements in this report are performed by Micromeritics Particle Analysis.
Due to poor repeatability, the Ni-YSZ sample was repeated. Figure 10 shows the comparison of the
cumulative mercury intrusion for the Ni-YSZ samples. The first sample suggests a pore diameter
distribution from 0.3-0.9μm while the second sample suggests a distribution from 0.9-3μm.
Comparing to SEM results in the next section, the larger pore size distribution appears to be more
accurate. Unfortunately, referring to Table 3, it can be seen that while the pore sizing is more
accurate, the reported porosity is inconsistent with the results from the liquid picnometry tests. The
cause of the discrepancy is not clear.

52
Figure 10- Mercury intrusion data for CoorsTek NiYSZ Left: Intrusion data from sample #1 Right:
Intrusion from sample #2. Data provided by Micromeritics (Norcross, GA)
Figure 11 shows the cumulative mercury intrusion of the ITM sample. Intrusion data from the ITM
sample suggests a pore size distribution from 10-100μm and porosity of 41.7% which is consistent
with the liquid picnometry results.

53
Figure 11-Mercury intrusion data from ITM sample. Data provided by Micromeritics (Norcross,
GA)
5.3 SEM analysis
SEM images taken of the cross sections and surfaces of each sample are shown at various
magnifications in Figure 12 and Figure 13 respectfully. As can be seen, the samples are
extremely different in structure and morphology. Open porosity of the anode or support is
critical as it provides the needed pathways for the fuels to enter and the exhausts to exit the fuel
cell. As shown above in the porosity results, each sample has roughly the same volume
porosity but drastically different pore size and particle size. Referring to Figure 12 and Figure
13, the CoorsTek anode is characterized by much finer particle size and pore structure than the
ITM support. The larger pore size of the ITM support promotes increased permeability which
one would expect to increase the transport capabilities of the support when compared to the
CoorsTek anode.

54
Figure 12- Cross-sectional images of the of the Ni-YSZ and ITM sample. Left column: Reduced
CoorsTek Ni-YSZ. Right column: Plansee ITM
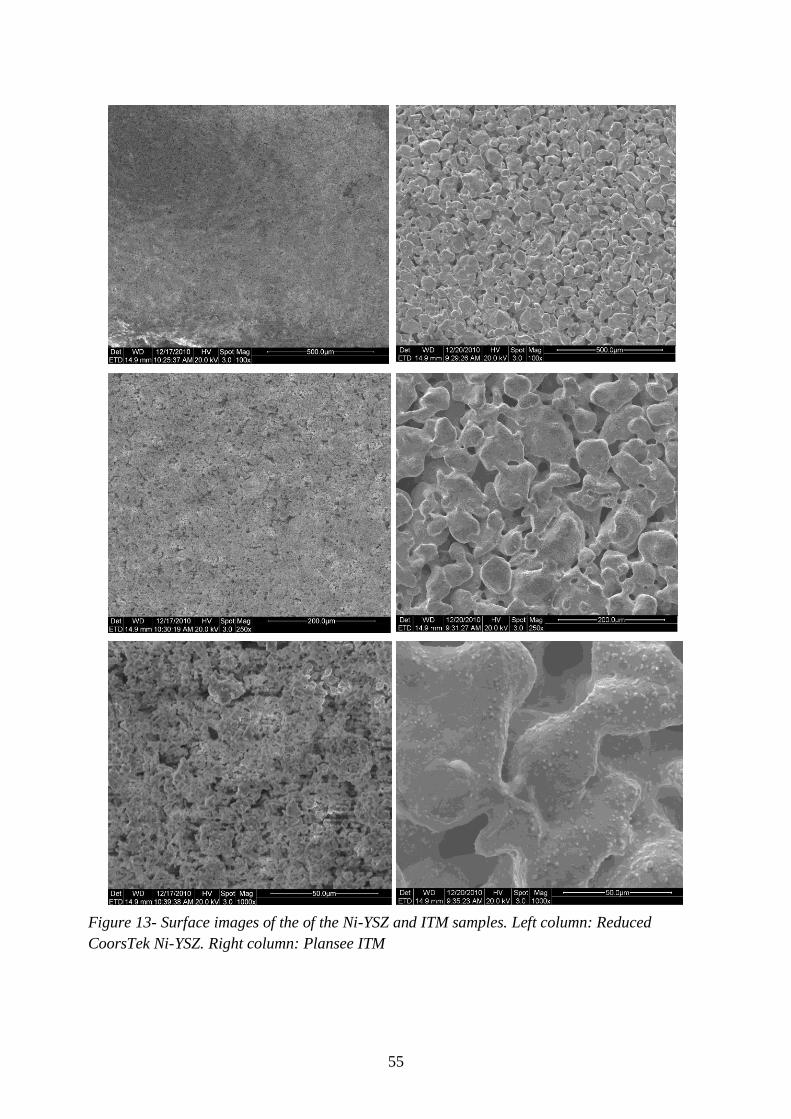
55
Figure 13- Surface images of the of the Ni-YSZ and ITM samples. Left column: Reduced
CoorsTek Ni-YSZ. Right column: Plansee ITM

56
5.3.1 Pre Run Plansee ITM support compared to post run ITM support
As shown above in section 5.1, even after the short testing period associated with the SAE, the
ITM sample shows signs of oxidation. SEM images of the surface and cross section of the ITM
material pre and post run in the SAE can be seen in Figure 14 and Figure 15 respectfully.
While there is no significant change in the cross sectional or surface morphology evidence of a
thin oxidation layer can be seen on the post run images.

57
Figure 14- Cross-sectional images of Plansee ITM pre and post run in the SAE. Right column:
Prerun ITM. Left column: Post run ITM, evidence of a thin oxidation layer can be seen.
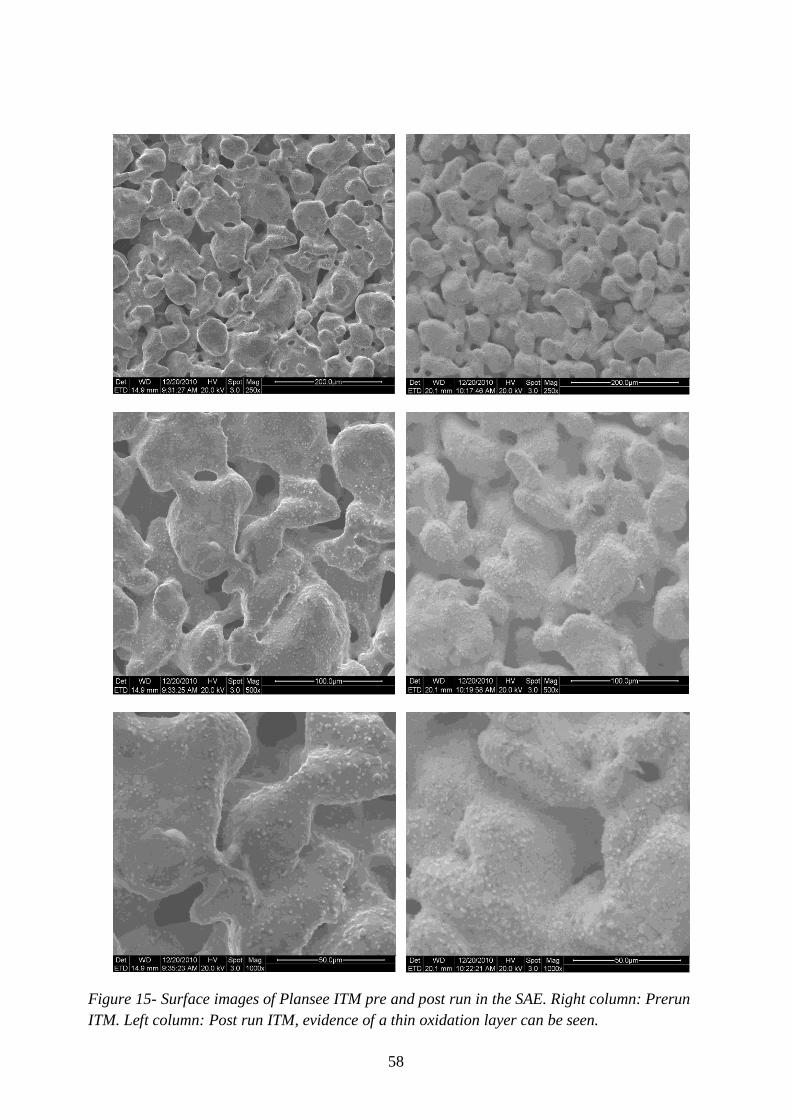
58
Figure 15- Surface images of Plansee ITM pre and post run in the SAE. Right column: Prerun
ITM. Left column: Post run ITM, evidence of a thin oxidation layer can be seen.

59
5.4 Separated anode experiment results
As described in section 3.3.1 the internal reforming and transport properties of the samples are
tested using the SAE. Results for the SAE are separated into two sections, CO2 transport and
CH4 reforming.
5.4.1 SAE CO2 transport results
In the CO2 transport test, the fuel side manifold is supplied with a 100% FG mixture (3.5% H2
+96.5% N2). The electrolyte side gas manifold is supplied with a 50% FG and 50% CO2
mixture. The gases are allowed to diffuse across the sample according to its specific transport
properties. Therefore, the amount of CO2 that diffused to the fuel side of the sample is related
to the transport capabilities of the sample. By comparing the CO2 concentration present in the
fuel side exhaust stream in each sample, a comparison of the mass transport characteristics of
the different samples can be made.
Figure 16 shows the CO2 mole fraction present in the fuel side exhaust of both the ITM and
CoorsTek samples. CO2 concentration in the exhaust stream of the 1mm thick ITM sample is
approximately 17% higher than the 1.4mm thick CoorsTek sample, suggesting slightly
increased mass transport characteristics for the ITM support. However the CoorsTek sample is
40% thicker than the ITM sample.
Figure 16- CO2 transport, fuel side CO2 mole fraction for Ni-YSZ and ITM samples
0.00%
5.00%
10.00%
15.00%
20.00%
25.00%
30.00%
50 100 150 200
Mo
le F
ract
ion
CO
2
Flow rate (sccm)
CO2 Transport Fuel-Side Exhaust
ITM
CTek

60
Examining exhaust gas compositions more closely, it can be seen that a small amount of carbon
monoxide (CO) gas is present in the CoorsTek fuel side and electrolyte side exhaust but not
present in the ITM exhaust (Figure 17). Since CO is not present in the supply gas mixture it
must be a product of a gas phase chemical reaction within the CoorsTek anode itself.
Figure 17- CO2 transport, CO Mole fraction in SAE exhaust streams of Ni-YSZ and ITM sample
Left: Fuel-side exhaust. Right: Electrolyte-side exhaust
The H2 concentration in the fuel side and electrolyte side for both samples is shown in Figure
18. Examining the exiting hydrogen concentrations of the samples, it is clear that the CoorsTek
sample has significantly lower hydrogen content. Since both samples are supplied with the
same gas mixtures it is clear that the hydrogen in the CoorsTek anode as been consumed by a
gas phase chemical reaction
Figure 18- CO2 transport, H2 mole fraction in SAE exhaust streams of Ni-YSZ and ITM sample
Left: Fuel-side exhaust. Right: Electrolyte-side exhaust
0.00%
1.00%
2.00%
3.00%
50 100 150 200
Mo
le F
ract
ion
CO
Flow rate (sccm)
CO2 Transport Fuel-Side Exhaust
ITM
CTek
0.00%
1.00%
2.00%
3.00%
50 100 150 200
Mo
le F
ract
ion
CO
Flow rate (sccm)
CO2 Transport Electrolyte Exhaust
ITM
CTek
0.00%
1.00%
2.00%
3.00%
50 100 150 200
Mo
le F
ract
ion
H2
Flow rate (sccm)
CO2 Transport Fuel Exhaust
ITM
CTek
0.00%
1.00%
2.00%
3.00%
50 100 150 200
Mo
le F
ract
ion
H2
Flow rate (sccm)
CO2 Transport Electrolyte Exhaust
ITM
CTek
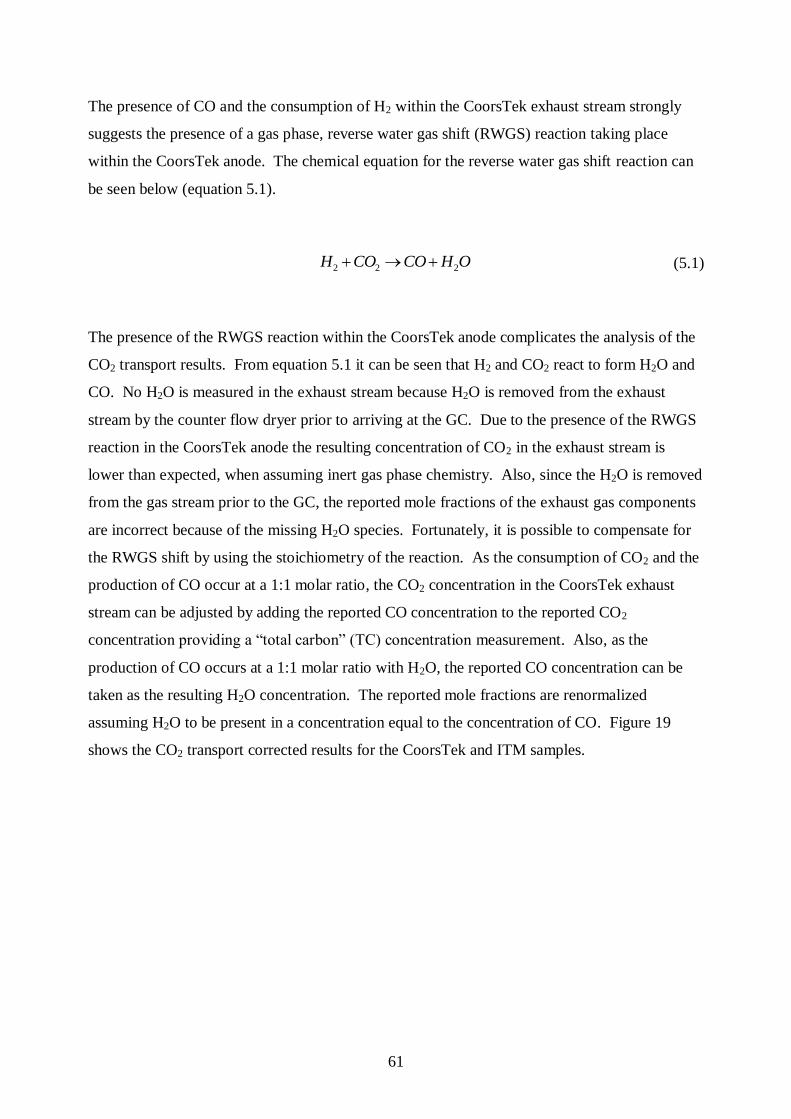
61
The presence of CO and the consumption of H2 within the CoorsTek exhaust stream strongly
suggests the presence of a gas phase, reverse water gas shift (RWGS) reaction taking place
within the CoorsTek anode. The chemical equation for the reverse water gas shift reaction can
be seen below (equation 5.1).
2 2 2H CO CO H O (5.1)
The presence of the RWGS reaction within the CoorsTek anode complicates the analysis of the
CO2 transport results. From equation 5.1 it can be seen that H2 and CO2 react to form H2O and
CO. No H2O is measured in the exhaust stream because H2O is removed from the exhaust
stream by the counter flow dryer prior to arriving at the GC. Due to the presence of the RWGS
reaction in the CoorsTek anode the resulting concentration of CO2 in the exhaust stream is
lower than expected, when assuming inert gas phase chemistry. Also, since the H2O is removed
from the gas stream prior to the GC, the reported mole fractions of the exhaust gas components
are incorrect because of the missing H2O species. Fortunately, it is possible to compensate for
the RWGS shift by using the stoichiometry of the reaction. As the consumption of CO2 and the
production of CO occur at a 1:1 molar ratio, the CO2 concentration in the CoorsTek exhaust
stream can be adjusted by adding the reported CO concentration to the reported CO2
concentration providing a “total carbon” (TC) concentration measurement. Also, as the
production of CO occurs at a 1:1 molar ratio with H2O, the reported CO concentration can be
taken as the resulting H2O concentration. The reported mole fractions are renormalized
assuming H2O to be present in a concentration equal to the concentration of CO. Figure 19
shows the CO2 transport corrected results for the CoorsTek and ITM samples.

62
Figure 19- CO2 Transport, Corrected “Total Carbon” transport for each sample.
As can be seen in Figure 19 the adjusted transport performance of the samples is very
comparable. On average the ITM sample is within 6% of the CoorsTek sample, which is
remarkable considering the differences in the thickness and morphologies of the two samples.
5.4.2 CO2 transport model results
Using the sample porosity and thickness as constants, the CFCC computational model is fit to
the SAE data at a single flow rate by using an iterative approach adjusting sample tortuosity as
a fitting parameter. Once the most appropriate tortuosity is found, the model is used to
calculate the gas compositions at the other flow rates. Computational fitting for the SAE data in
this report was performed by Amy Richards at the CFCC. The fitting parameters used for the
CorrsTek and ITM samples can be seen in Table 4.
0.00%
5.00%
10.00%
15.00%
20.00%
25.00%
30.00%
50 100 150 200
Mo
le F
ract
ion
CO
2 +
CO
Flow rate (sccm)
CO2 Transport Fuel-side Exhaust
ITM
CTek
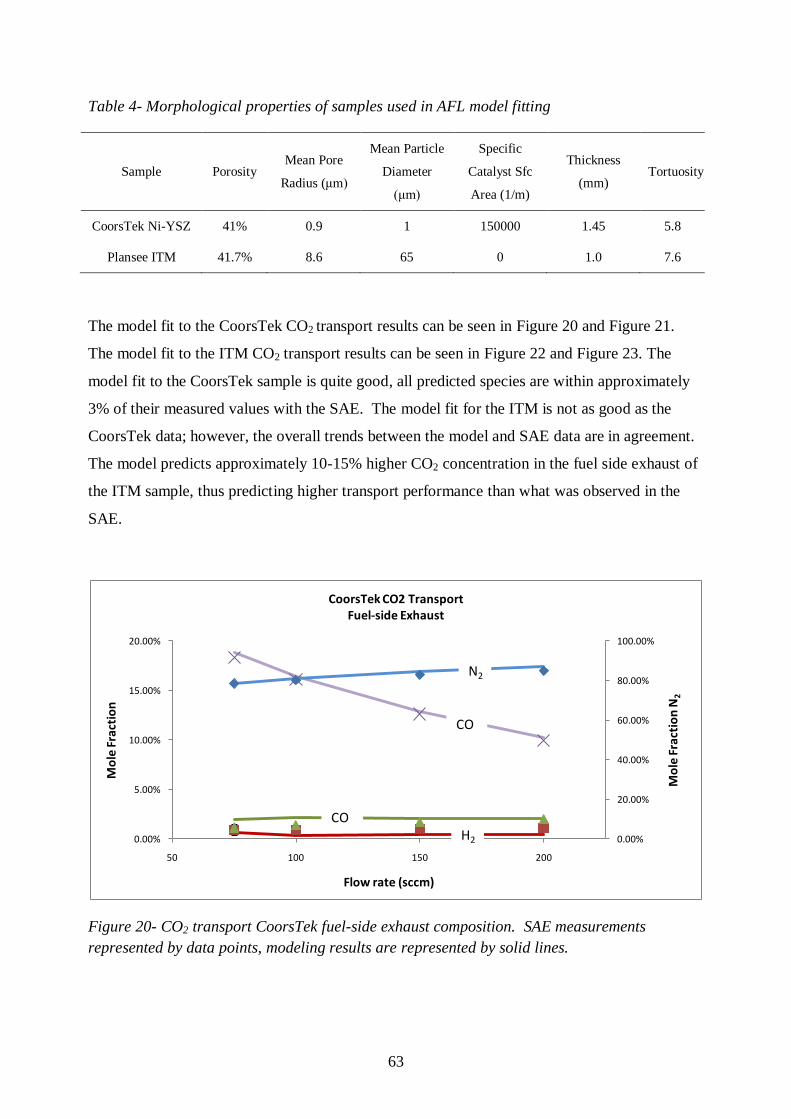
63
Table 4- Morphological properties of samples used in AFL model fitting
Sample Porosity Mean Pore
Radius (μm)
Mean Particle
Diameter
(μm)
Specific
Catalyst Sfc
Area (1/m)
Thickness
(mm) Tortuosity
CoorsTek Ni-YSZ 41% 0.9 1 150000 1.45 5.8
Plansee ITM 41.7% 8.6 65 0 1.0 7.6
The model fit to the CoorsTek CO2 transport results can be seen in Figure 20 and Figure 21.
The model fit to the ITM CO2 transport results can be seen in Figure 22 and Figure 23. The
model fit to the CoorsTek sample is quite good, all predicted species are within approximately
3% of their measured values with the SAE. The model fit for the ITM is not as good as the
CoorsTek data; however, the overall trends between the model and SAE data are in agreement.
The model predicts approximately 10-15% higher CO2 concentration in the fuel side exhaust of
the ITM sample, thus predicting higher transport performance than what was observed in the
SAE.
Figure 20- CO2 transport CoorsTek fuel-side exhaust composition. SAE measurements
represented by data points, modeling results are represented by solid lines.
0.00%
20.00%
40.00%
60.00%
80.00%
100.00%
0.00%
5.00%
10.00%
15.00%
20.00%
50 100 150 200
Mo
le F
ract
ion
N2
Mo
le F
ract
ion
Flow rate (sccm)
CoorsTek CO2 Transport Fuel-side Exhaust
CO
N2
COH2
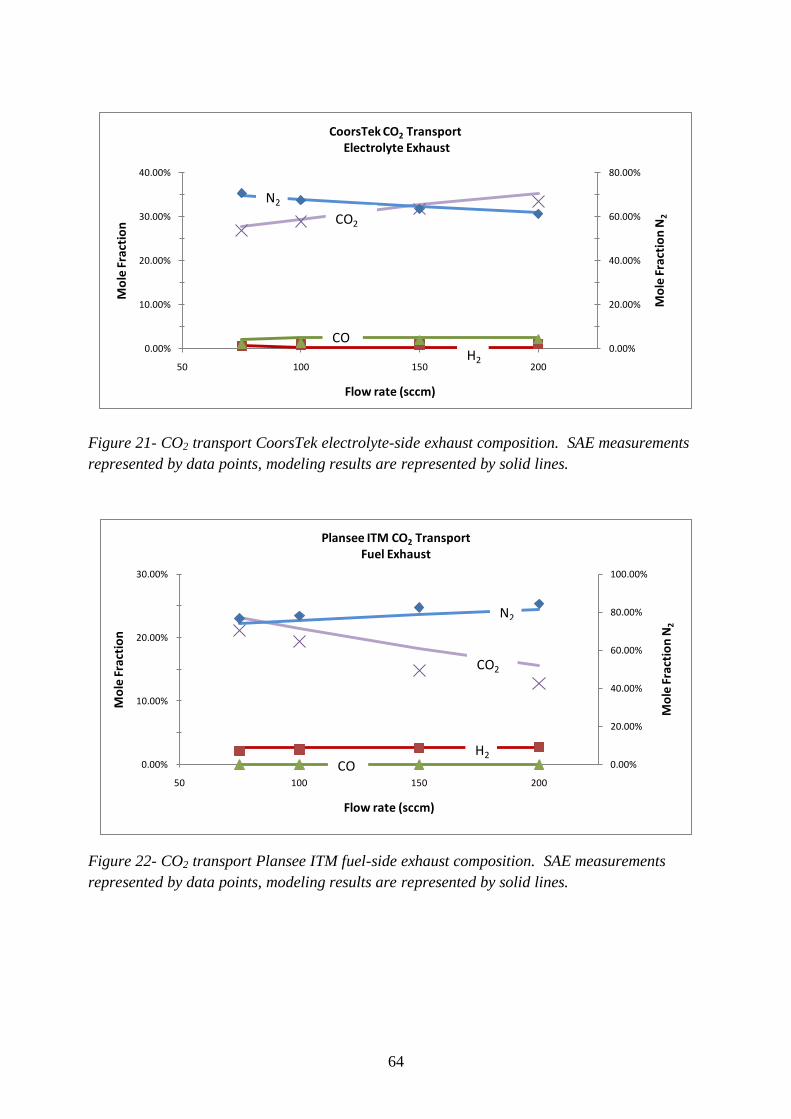
64
Figure 21- CO2 transport CoorsTek electrolyte-side exhaust composition. SAE measurements
represented by data points, modeling results are represented by solid lines.
Figure 22- CO2 transport Plansee ITM fuel-side exhaust composition. SAE measurements
represented by data points, modeling results are represented by solid lines.
0.00%
20.00%
40.00%
60.00%
80.00%
0.00%
10.00%
20.00%
30.00%
40.00%
50 100 150 200
Mo
le F
ract
ion
N2
Mo
le F
ract
ion
Flow rate (sccm)
CoorsTek CO2 TransportElectrolyte Exhaust
CO2
N2
COH2
0.00%
20.00%
40.00%
60.00%
80.00%
100.00%
0.00%
10.00%
20.00%
30.00%
50 100 150 200
Mo
le F
ract
ion
N2
Mo
le F
ract
ion
Flow rate (sccm)
Plansee ITM CO2 Transport Fuel Exhaust
CO2
N2
COH2
65
Figure 23 - CO2 transport Plansee ITM electrolyte-side exhaust composition. SAE
measurements represented by data points, modeling results are represented by solid lines.
There are some possible explanations for the discrepancy between the model and SAE results
for the ITM sample. While the fuel channel is being sampled by the GC, the electrolyte channel
is venting to atmosphere, resulting in a significant pressure gradient across the sample due to
gas flow resistance associated with the GC measurement. The computational model assumes a
zero pressure gradient across the sample. The SAE uses a water column to minimize this
pressure gradient. By venting to atmosphere through the water column a back pressure
equivalent to the height of the water above the inlet to the water column is applied to the
venting gas channel. Pressure meters located on each gas channel are monitored and the water
height in the column is adjusted until the meters read an equivalent pressure, thus eliminating
the pressure gradient across the porous sample. If the gas meters attached to each channel were
poorly calibrated, or if the pressure were poorly balanced, a pressure gradient would still be
present across the sample. Due to a significantly larger pore size, the ITM would be much more
susceptible to these pressure gradients. Comparing the CO2 concentrations in the fuel side
exhaust to the model results, the difference between the two is consistent with a higher pressure
in the fuel channel, thus retarding the CO2 transport to that side. Human error in balancing the
pressure seems unlikely as the difference between the model and measured data is consistent at
all flow rates. The fact that the model is consistently higher than the measured results suggests
a more systematic error, for example, poor meter calibration.
0.00%
20.00%
40.00%
60.00%
80.00%
0.00%
10.00%
20.00%
30.00%
40.00%
50 100 150 200
Mo
le F
ract
ion
N2
Mo
le F
ract
ion
Flow rate (sccm)
Plansee CO2 TransportElectrolyte Exhaust
CO
N2
CO
H2
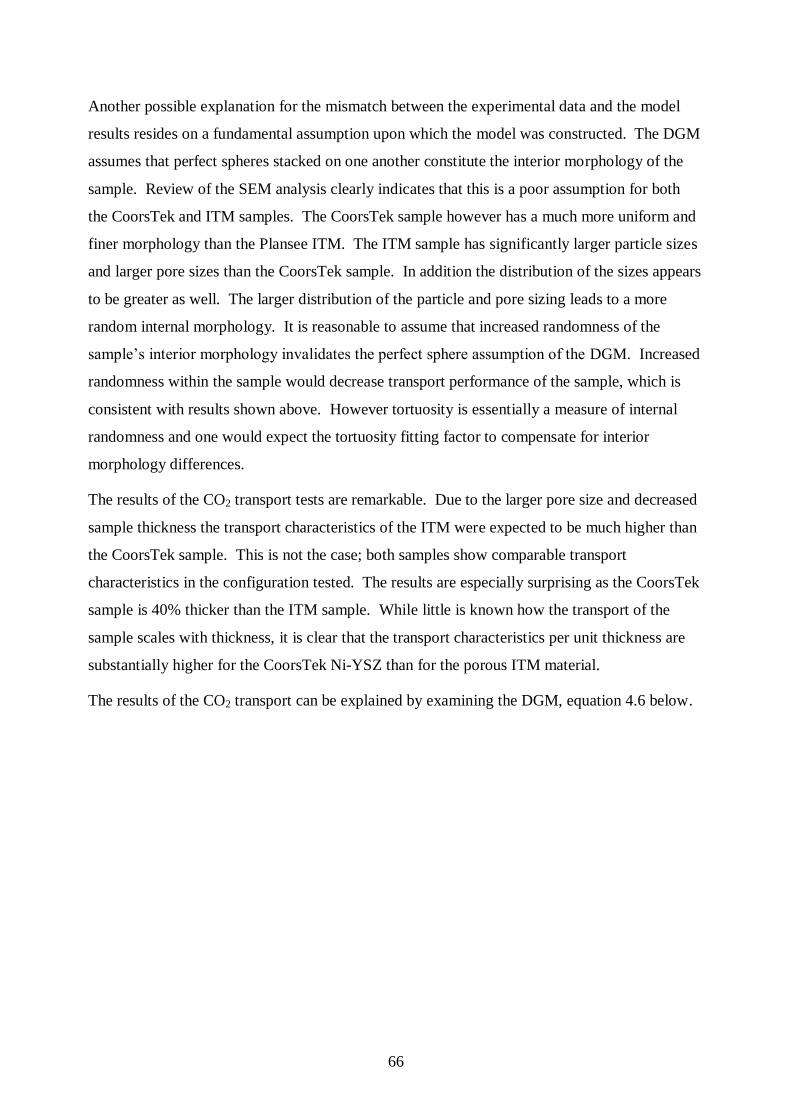
66
Another possible explanation for the mismatch between the experimental data and the model
results resides on a fundamental assumption upon which the model was constructed. The DGM
assumes that perfect spheres stacked on one another constitute the interior morphology of the
sample. Review of the SEM analysis clearly indicates that this is a poor assumption for both
the CoorsTek and ITM samples. The CoorsTek sample however has a much more uniform and
finer morphology than the Plansee ITM. The ITM sample has significantly larger particle sizes
and larger pore sizes than the CoorsTek sample. In addition the distribution of the sizes appears
to be greater as well. The larger distribution of the particle and pore sizing leads to a more
random internal morphology. It is reasonable to assume that increased randomness of the
sample’s interior morphology invalidates the perfect sphere assumption of the DGM. Increased
randomness within the sample would decrease transport performance of the sample, which is
consistent with results shown above. However tortuosity is essentially a measure of internal
randomness and one would expect the tortuosity fitting factor to compensate for interior
morphology differences.
The results of the CO2 transport tests are remarkable. Due to the larger pore size and decreased
sample thickness the transport characteristics of the ITM were expected to be much higher than
the CoorsTek sample. This is not the case; both samples show comparable transport
characteristics in the configuration tested. The results are especially surprising as the CoorsTek
sample is 40% thicker than the ITM sample. While little is known how the transport of the
sample scales with thickness, it is clear that the transport characteristics per unit thickness are
substantially higher for the CoorsTek Ni-YSZ than for the porous ITM material.
The results of the CO2 transport can be explained by examining the DGM, equation 4.6 below.

67
, ,
[ ] [ ] [ ][ ]
[ ]
gl l k l k kke e e
l k T kl k Kn k Kn
BX J X J J XX p
X D D D
(4.6)
It can be seen that the species concentration gradient ( [ ]kX ) is determined by three
independent driving forces; standard multi-component diffusion ([ ] [ ]
[ ]
l l k l
el k T kl
X J X J
X D
), Knudsen
diffusion (,
k
e
k Kn
J
D), and pressure driven Darcy flow (
,
[ ] gk
e
k Kn
BXp
D ). The effect of each of these
driving forces on total mass transport through a given sample can be thought of as a simple
resistor circuit shown in Figure 24
Figure 24 - Illustration of the interactions between flow driving forces as represented by the
Dusty Gas Model. Source: (A. Richards, 2011).
Referring to Figure 24 it can be seen that when a high pressure differential is present across the
sample (when p is large), the Darcy flow mechanism will dominate the mass transport
mechanism. In the SAE the pressure differential is eliminated by balancing the pressure in the
fuel side and electrolyte side manifolds. The lack of a pressure differential eliminates the Darcy
characteristics from consideration in the overall mass transport performance of the sample. The
lack of a Darcy flow component in the transport mechanism of the SAE explains why the ITM
sample and the CoorsTek sample transport characteristics are similar. Even though the ITM

68
sample is thinner, the increased tortuosity and larger particle size of the material impedes the
remaining diffusion transport mechanisms.
5.4.3 CH4 dry reforming results
The CH4 dry reforming test is performed by supplying the fuel side gas manifold with a mixture
of 20% CH4 and 80% FG. The electrolyte side gas manifold is supplied with a gas mixture of
50% CO2 and 50% FG. The dry reforming equation is shown below.
4 2 22 2CH CO CO H (1.10)
By comparing the concentration levels of the reforming products (CO and H2) and reactants
(CH4 and CO2) in the exhaust gases of the fuel and electrolyte sides, a comparison of the
reforming activity of the samples can be made. Figure 25 shows the H2 and CO concentrations
in the fuel and electrolyte exhaust streams of the two samples. Figure 26 shows the reactant
(CH4, CO2) concentrations remaining in the fuel and electrolyte exhaust streams.

69
Figure 25 - CH4 dry reforming – Reforming product exhaust gas concentrations. Top Left: H2
concentration in fuel-side exhaust. Top Right: H2 concentration in electrolyte-side exhaust.
Bottom Left: CO concentration in fuel-side exhaust. Bottom Right: CO concentration in
electrolyte-exhaust
0.00%
2.00%
4.00%
6.00%
8.00%
10.00%
50 100 150 200
Mo
le F
ract
ion
H2
Flow rate (sccm)
CH4 Dry reforming Fuel-Side Exhaust
ITM
Ctek
0.00%
2.00%
4.00%
6.00%
8.00%
10.00%
50 100 150 200
Mo
le F
ract
ion
H2
Flow rate (sccm)
CH4 Dry reforming Electrolyte-Side Exhaust
ITM
Ctek
0.00%2.00%4.00%6.00%8.00%
10.00%12.00%14.00%16.00%18.00%
50 100 150 200
Mo
le F
ract
ion
CO
Flow rate (sccm)
CH4 Dry reforming Fuel-Side Exhaust
ITM
Ctek
0.00%2.00%4.00%6.00%8.00%
10.00%12.00%14.00%16.00%18.00%
50 100 150 200
Mo
le F
ract
ion
CO
Flow rate (sccm)
CH4 Dry reforming Electrolyte-Side Exhaust
ITM
Ctek

70
Figure 26 - CH4 dry reforming – Reforming reactant exhaust gas concentrations. Top Left: CH4
concentration in fuel-side exhaust. Top Right: CH4 concentration in electrolyte-side exhaust.
Bottom Left: CO2 concentration in fuel-side exhaust. Bottom Right: CO2 concentration in
electrolyte-exhaust
As can be seen in Figure 25 and Figure 26, reforming product concentrations are higher and
reforming reactants are lower in the CoorsTek sample. This implies that the CoorsTek sample
is more catalytically active in the reforming reaction. The ITM exhaust stream shows no CO
production at all, suggesting that the ITM support is catalytically inert and no dry reforming
occurs at the temperature of operation (800C). Low reforming performance of the ITM support
was expected, as there is no AFL present to promote the reforming reaction. The fact that the
support is completely inert is surprising. Hei et al., Murata et al. and Horita et al. have all
demonstrated the reforming capabilities of Fe based catalysts, however all have noted low
performance and high susceptibility for coke formation with an Fe based catalyst(M.J. Hei,
1998),(K. Murata, 2004),(T. Horita, 1996).
0.00%
2.00%
4.00%
6.00%
8.00%
10.00%
12.00%
14.00%
16.00%
50 100 150 200
Mo
le F
ract
ion
CH
4
Flow rate (sccm)
CH4 Dry reforming Fuel-Side Exhaust
ITM
Ctek
0.00%
1.00%
2.00%
3.00%
4.00%
5.00%
6.00%
7.00%
8.00%
9.00%
50 100 150 200
Mo
le F
ract
ion
CH
4
Flow rate (sccm)
CH4 Dry reforming Electrolyte-Side Exhaust
ITM
Ctek
0.00%
5.00%
10.00%
15.00%
20.00%
25.00%
50 100 150 200
Mo
le F
ract
ion
CO
2
Flow rate (sccm)
CH4 Dry reforming Fuel-Side Exhaust
ITM
Ctek
0.00%
5.00%
10.00%
15.00%
20.00%
25.00%
30.00%
35.00%
40.00%
50 100 150 200
Mo
le F
ract
ion
CO
2
Flow rate (sccm)
CH4 Dry reforming Electrolyte-Side Exhaust
ITM
Ctek
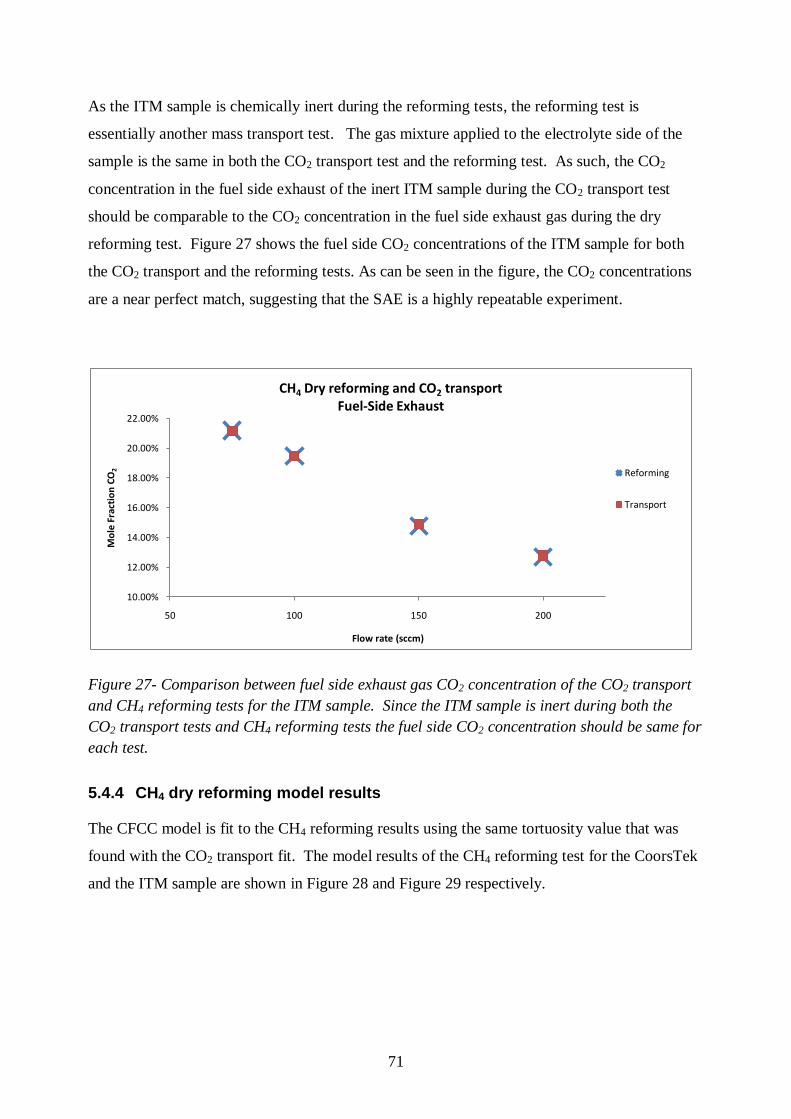
71
As the ITM sample is chemically inert during the reforming tests, the reforming test is
essentially another mass transport test. The gas mixture applied to the electrolyte side of the
sample is the same in both the CO2 transport test and the reforming test. As such, the CO2
concentration in the fuel side exhaust of the inert ITM sample during the CO2 transport test
should be comparable to the CO2 concentration in the fuel side exhaust gas during the dry
reforming test. Figure 27 shows the fuel side CO2 concentrations of the ITM sample for both
the CO2 transport and the reforming tests. As can be seen in the figure, the CO2 concentrations
are a near perfect match, suggesting that the SAE is a highly repeatable experiment.
Figure 27- Comparison between fuel side exhaust gas CO2 concentration of the CO2 transport
and CH4 reforming tests for the ITM sample. Since the ITM sample is inert during both the
CO2 transport tests and CH4 reforming tests the fuel side CO2 concentration should be same for
each test.
5.4.4 CH4 dry reforming model results
The CFCC model is fit to the CH4 reforming results using the same tortuosity value that was
found with the CO2 transport fit. The model results of the CH4 reforming test for the CoorsTek
and the ITM sample are shown in Figure 28 and Figure 29 respectively.
10.00%
12.00%
14.00%
16.00%
18.00%
20.00%
22.00%
50 100 150 200
Mo
le F
ract
ion
CO
2
Flow rate (sccm)
CH4 Dry reforming and CO2 transport Fuel-Side Exhaust
Reforming
Transport
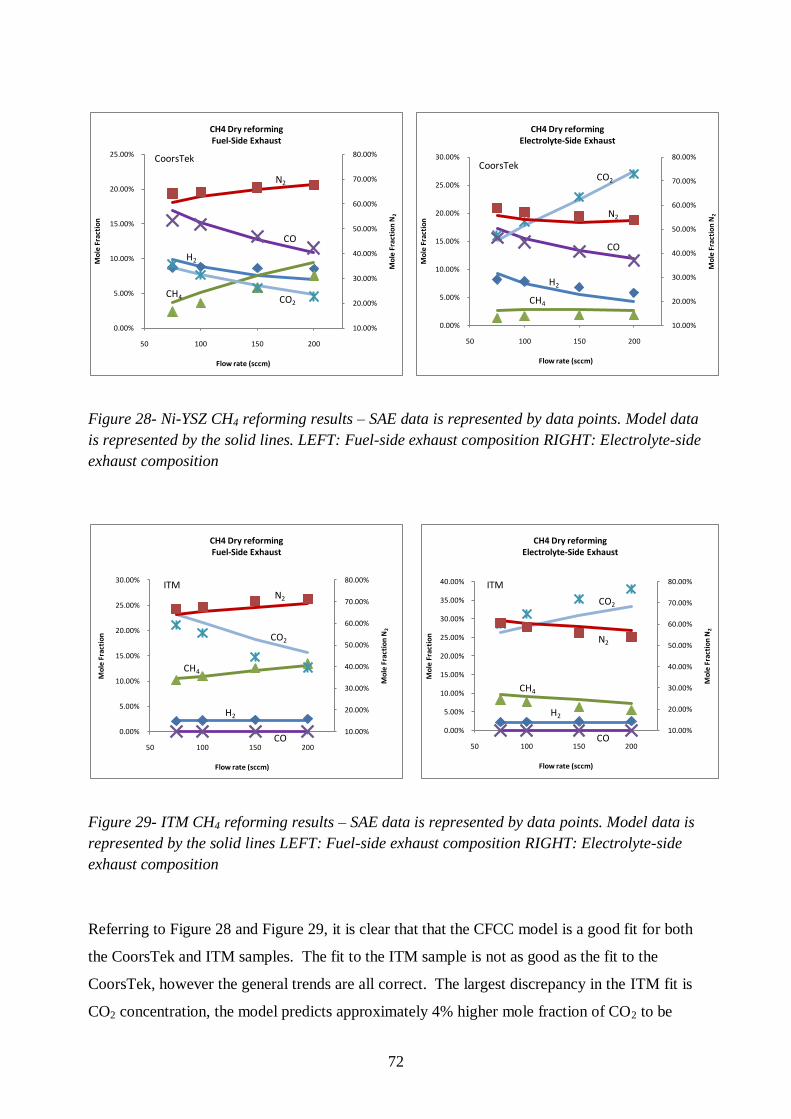
72
Figure 28- Ni-YSZ CH4 reforming results – SAE data is represented by data points. Model data
is represented by the solid lines. LEFT: Fuel-side exhaust composition RIGHT: Electrolyte-side
exhaust composition
Figure 29- ITM CH4 reforming results – SAE data is represented by data points. Model data is
represented by the solid lines LEFT: Fuel-side exhaust composition RIGHT: Electrolyte-side
exhaust composition
Referring to Figure 28 and Figure 29, it is clear that that the CFCC model is a good fit for both
the CoorsTek and ITM samples. The fit to the ITM sample is not as good as the fit to the
CoorsTek, however the general trends are all correct. The largest discrepancy in the ITM fit is
CO2 concentration, the model predicts approximately 4% higher mole fraction of CO2 to be
10.00%
20.00%
30.00%
40.00%
50.00%
60.00%
70.00%
80.00%
0.00%
5.00%
10.00%
15.00%
20.00%
25.00%
50 100 150 200
Mo
le F
ract
ion
N2
Mo
le F
ract
ion
Flow rate (sccm)
CH4 Dry reforming Fuel-Side Exhaust
N2
CO
CH4
H2
CO2
CoorsTek
10.00%
20.00%
30.00%
40.00%
50.00%
60.00%
70.00%
80.00%
0.00%
5.00%
10.00%
15.00%
20.00%
25.00%
30.00%
50 100 150 200
Mo
le F
ract
ion
N2
Mo
le F
ract
ion
Flow rate (sccm)
CH4 Dry reforming Electrolyte-Side Exhaust
N2
CO
CH4
H2
CO2
CoorsTek
10.00%
20.00%
30.00%
40.00%
50.00%
60.00%
70.00%
80.00%
0.00%
5.00%
10.00%
15.00%
20.00%
25.00%
30.00%
50 100 150 200
Mo
le F
ract
ion
N2
Mo
le F
ract
ion
Flow rate (sccm)
CH4 Dry reforming Fuel-Side Exhaust
N2
CO
CH4
H2
CO2
ITM
10.00%
20.00%
30.00%
40.00%
50.00%
60.00%
70.00%
80.00%
0.00%
5.00%
10.00%
15.00%
20.00%
25.00%
30.00%
35.00%
40.00%
50 100 150 200
Mo
le F
ract
ion
N2
Mo
le F
ract
ion
Flow rate (sccm)
CH4 Dry reforming Electrolyte-Side Exhaust
N2
CO
CH4
H2
CO2
ITM

73
present in the fuel side exhaust than actually seen with SAE experiment. This discrepancy is
the same seen with the CO2 transport results.

74
6 CONCLUSIONS
The fuel reforming and transport capabilities of two vastly different SOFC anode/support
materials have been compared and analyzed. Typically, analysis of these characteristics is done
using electrochemical testing procedures, such as polarization measurements and
electrochemical impedance spectroscopy. Anode transport and reforming characteristics can
only be inferred from these tests because those processes are tightly coupled with the
electrochemical reactions in an active fuel cell. Using the unique Separated Anode Experiment
at the CFCC it is possible to decouple these processes and directly measure the transport and
reforming characteristics of the anode structure with no need for electrochemical activity.
Using the SAE, a leading, commercially developed, Ni-YSZ SOFC anode was used as baseline
to compare the mass transport and reforming reaction kinetics present within a leading porous
metal support. The commercially developed CoorsTek reaction sintered Ni-YSZ anode was
used as baseline in this study. The CoorsTek Ni-YSZ anode has been previously evaluated by
Storjohann et al, and constitutes the state-of-the-art in ceramic Ni-YSZ anode design(D.
Storjohann, 2009). A porous metal support developed by Plansee SE specifically for SOFC
support applications (Plansee porous ITM support) serves as the experimental group.
The Ni-YSZ anode shows significant reforming characteristics while the ITM sample showed
no catalytic activity to reforming. It is not surprising that the Ni-YSZ anode showed
substantially higher reforming characteristics than the ITM sample because the ITM sample
lacked a functional layer to catalyze the dry reforming reaction. While the ITM sample’s
reforming capabilities were expected to be substantially less than the Ni-YSZ anode, the ITM
sample was not expected to be completely inert to reforming. Methane reforming over Fe based
catalysts has been documented in multiple studies (T. Horita, 1996),(M.J. Hei, 1998),(K.
Murata, 2004).
SEM analysis of the two samples showed vastly different morphologies. The ITM sample has
significantly larger particle and pore size than the Ni-YSZ anode. With the vast differences in
morphology, the mass transport characteristics of the samples were expected to be vastly
different. Surprisingly, the Ni-YSZ and ITM samples show comparable mass transport
characteristics. This can be explained by the lack of a pressure differential across the sample
while being tested. Large pore sizing promotes increased transport through porous media by
increasing the pressure driven Darcy flow characteristics of the material. Darcy flow is driven
by a pressure differential across the material. In the SAE, pressure differential across the

75
sample is minimized to accurately represent the SOFC operating environment. As the pressure
differential is minimized the Darcy flow characteristics of the sample have little to no effect on
the mass transport in SOFC operating conditions.
Visual and SEM comparisons for the ITM material pre and post testing in the SAE show that
the ITM sample developed an oxide scale while being tested at SOFC operating temperature.
However, it is unclear whether this scale is the desirable continuous Cr2O3 scale or a
combination of Cr2O3 and the detrimental Fe2O3. An oxidation study of porous ITM substrate
has been conducted by Franco et al. with a generally positive result (T. Franco, 2009). Neither
composition of the oxide scale nor ASR measurements were reported, which makes it difficult
to predict the operational lifetime expectancy of the substrate.

A - 1
7 WORKS CITED
A. Bautista, E.A.F.V.C.M.a.R.C., 2008. Oxidation behavior of Highly Porous Metallic Components.
Oxidation of Metals, 70, pp.267-86.
A. Mineshige, K.F.S.O.T.K.M.K.T.Y.K.K.M.I.Z.O., 2006. Porous metal tubular support for solid oxide
fuel cell design. Electrochemcial and Solid State Letters, 9, pp.A427-29.
A. Richards, N.S.R.K.H.Z., 2010. Internal Reforming Chemistry in Novel SOFC Anodes and
Architectures. In Proceedings of the 9th European Solid Oxide Fuel Cell Forum. Lucerne,
Switzerland, 2010.
A. Richards, N.S.R.K.M.M.S.B., 2011. Gas Transport and Internal Reforming Chemistry in SOFC
Anode Supports and Structures. In SOFC XII. Montreal, 2011.
ATI Allegheny Ludlum, 2007. [Online] Available at:
http://www.brownmetals.com/downloads/AlloyEbriteTechSheet.pdf.
Atkinson, A., 1985. Transport processes during the growth of oxide films at elevated temperature.
Reviews of Modern Physics, 57(2), pp.437-70.
C. Hwang, C.-H.T.C.-H.L.C.-H.S., 2008. Plasma sprayed metal supported YSZ/Ni-LSGM-LSCF. Journal
of Power Sources, 180, pp.132-42.
D. Morgensen, J.-D.G.P.V.H.K.D.-J.J.U.N., 2011. Internal steam reforming in solid oxide fuel cells:
status and opertunities of kinetic studies and thier impact on modelling. Journal of Power Sources,
196, pp.25-38.
D. Storjohann, J.D.N.P.S.H.Z.R.J.K.S.M.D.B., 2009. Fabrication and evaluation of solid-oxide fuel
cell anodes employing reaction-sintered yttria-stabilized zirconia. Journal of Power Sources , 193,
pp.706-12.
Daggett, J.M., 2008. Ethanol transport and chemistry in Ni/YSZ anodes for solid oxide fuel cell
applications. Master's thesis. Golden, CO: Colorado School of Mines.
E. Hecht, G.K.G.H.Z.A.M.D.R.J.K.L.M.a.O.D., 2005. Methane reforming kinetics within Ni-YSZ SOFC
anode support. Applied Catalysis A, 295, pp.40-51.
E. Ruckenstein, Y.H.H., 1995. Carbon dioxide reforming of Methane over nickel/ alkaline earth
oxide cataysts. Applied Catalysis A: General, 133, pp.149-61.
G.K. Gupta, E.S.H.H.Z.A.M.D.a.R.J.K., 2006. Gas-Phase Reactions of Methane and Natural-Gas with
Air and Steam in non-catalytic regions of a solid-oxide fuel cell. Journal of Power Sources, 156,
pp.434-47.

A - 2
Gupta, G.K., 2007. Analysis of gas-phase and catalytic kinetics in solid oxide fuel cells. PhD thesis.
Golden, CO: Colorado School of Mines.
H. Sumi, Y.-H.L.H.M.T.M.a.K.E., 2010. Comparison Between Internal Steam and CO2 Reforming of
Methane for Ni-YSZ and Ni-ScSZ SOFC Anodes. Journal of The Electrochemical Society, 157,
pp.1118-25.
H. Zhu, R.J.K.V.M.J.O.D.a.D.G.G., 2005. Modeling elementary heterogeneous chemistry and
electrochemistry in solid-oxide fuel cells. Journal of The Electrochemical Society, 152, pp.A2427-
40.
H. Zhu, D.G.G.R.J.K., 2005. Solid-oxide fuel cells with hydrocarbon fuels. Proceedings of the
Combustion Institute, 30, pp.2379-404.
H.J. Cho, G.M.C., 2009. Frabrication and characterization of Ni-supported solid oxide fuel cell.
Solid State Ionics, 180.
Hansen, J.R.R.-N.a.J.-H.B., 1993. CO2-Reforming of Methane over Transition Metals. Journal of
Catalysis , 144, pp.38-49.
Haynes International, 1997. [Online] Available at: http://www.haynesintl.com/pdf/h3009.pdf.
Haynes International, 2007. [Online] Available at:
http://www.haynesintl.com/230HaynesAlloy.htm.
Hecht, E., 2005. Internal reforming of methane in a nickel-yttria stabilized zirconia solid oxide fuel
cell anode.. Master's thesis. Golden, CO: Colorado School of Mines.
I. Antepara, I.V.L.M.R.N.L.U.C.A.L., 2005. Evaluation of Ferritic steels for use as interconnects and
porous metal supports in IT-SOFCs. Journal of Power Sources, 151, pp.103-07.
I. Antepara, M.R.I.V.N.B.F.C., 2010. Influence of Different Aspects of the SOFC Anode Environment
on the Oxidation Behavior of Porous Samples Made of Crofer. Journal of Fuel Cell Science and
Technology, 7, pp.1-7.
J. H. Zhu, S.J.G.Z.G.L.a.W.D.P., 2007. Evaluation of Binary Fe-Ni Alloys as Intermediate-
Temperature SOFC Interconnect. Journal of the Electrochemical Society, 154, pp.1288-94.
J. Sfeir, P.A.B.P.M.N.X.R.V.J.J.M.J.V.h.K.R.T., 2001. Lanthanum chromite based catalysts for
oxidation of methane directly on SOFC anodes. Journal of Catalysis , 202, pp.229-44.
J.-M. Klein, M.H.P.G.Y.B.a.S.G., 2008. A Solid Oxide Fuel Cell Operating in Gradual Internal
Reforming Conditions under Pure Dry Methane. Electrochemical and Solid-State Letters, 11(8),
pp.B144-47.
J.-M. Klein, M.H.C.R.Y.B.S.G., 2009. Direct methane solid oxide fuel cell working by gradual
internal steam reforming: Analysis of operation. Journal of Power Sources, 193, pp.331-37.
J.R. Rostrup-Nielsen, J.-H.B.H., 1993. CO2-Reforming of Methane over Transisiton Metals. Journal
of Catalysis, 144, pp.38-49.

A - 3
J.R. Rostrup-Nielsen, J.B.H.S.H.N.C.A.-K.J., 2006. Sites for catalysis and electrochemistry in solid
oxide fuel cell (SOFC) anode. Applied Physics A, 85, pp.427-30.
J.W. Jan, H.M.M.E.T.I., 2005. High-power SOFC using LSGM-SDC composite film. Electrochemical
and Solid State Letters, 8(8), pp.A389-91.
Jefferson Lab, 2010. Jefferson Lab Science Education. [Online] Available at:
http://education.jlab.org/itselemental/ele001.html.
K. Murata, L.W.M.S.M.I.I.T.N.M., 2004. Hydrogen Production from Steam Reforming of
Hydrocarbons over Alkaline-Earth-Modified Fe - or Ni-Based Catalysts. Energy & Fuels, 18, pp.122-
26.
K. Tomishige, M.N.K.M.K.K., 2004. Effect of oxygen addition to steam and dry reforming of
methane on bed temperature profile over Pt and Ni catalysts. Fuel Processing Technology, 85,
pp.1103-20.
L. Rose, O.K.C.D.-P.T.R.M., 2009. Characterization of Porous Stainless Steel 430 for Low- and
Intermediate-Temperature Solid Oxide Fuel Cell Substrates. International Journal of Green Energy,
6, pp.638-45.
M. Pillai, Y.L.H.Z.R.J.K.a.S.A.B., 2010. Stability and coking of direct-methane solid oxide fuel cells.
Journal of Power Sources, 195, pp.271-79.
M.C. Tucker, H.K.C.P.J.J.C.D.J.S.J.V., 2006. A fundamental study of chromium deposition on solid
oxide fuel cell cathode materials. Journal of Power Sources, 160, pp.130-38.
M.J. Hei, H.B.C.J.Y.Y.J.L.Y.Z.L.G.W.D.W.L., 1998. CO2 reforming of methane on transition metal
surfaces. Surface Science, 417, pp.82-86.
Malinauskas, E.M.a.A., 1983. Gas Transport in Porous Media: The Dusty Gas Model. New York:
American Elsevier.
Micromeritics Instrument Corporation, 2010. [Online] Available at:
http://www.micromeritics.com/Repository/Files/Mercury_Porosemitry_Theory_poster_.pdf.
N. Oishi, Y.Y., 2010. Evaluation of Metal Supported Ceria Based Solid Oxide Fuel Cell Fabricated by
Wet Powder Spray and Sintering. Journal od the Electrochemical Society, 157(1), pp.B125-29.
N.P Brandon, D.J.B., 2006. Engineering porous materials for fuel cell applications. Philosophical
Transactions of The Royal Society A, 364, pp.147-59.
N.P. Brandon, A.B.D.C.D.C.A.D.K.E.-K.e.a., 2004. Development of Metal Supported Solid Oxide Fuel
Cells for Operation at 500-600 C. Journal of Fuel Cell Science and Technology, 1, pp.61-65.
N.P. Brandon, D.C.D.C.A.D.K.E.-K.D.H.R.L.G.L.N.M.T.M.R.T.A.S.a.M.S., 2004. Development of Metal
Supported Solid Oxide Fuel Cells for Operation at 500-600C. Journal of Materials Engineering and
Performance, 13(3), pp.253-56.

A - 4
P. Szabo, J.A.T.F.M.G.A.R.A.Z.A.A., 2009. Progress in Metal Supported Solid Oxide Fuel Cells and
Stacks for APU. ECS Transactions, 25(2), pp.175-85.
P.K. Cheekatamarla, C.M.F.a.J.C., 2008. Internal reforming of hydrocarbon fuels in tubular solid
oxide fuel cells. International Journal of Hydrogen Energy, 33, pp.1853-58.
Plansee SE, 2010. Plansee corporate website. [Online] Available at:
http://www.plansee.com/news-2393.htm.
Q-A. Huang, B.W.W.Q.R.H., 2009. Impedance diagnosis of metal-supported SOFCs with SDC as
electrolyte. Journal of Power Sources, 191, pp.297-303.
R. Hui, J.O.B.D.-P.W.Q.S.Y.J.-G.L.C.M., 2009. High performance metal-supported solid oxide fuel
cell fabricated by thermal spray. Journal of Power Sources, 191, pp.371-76.
R. O'Hayre, S.W.C.W.C.F.P., 2008. Fuel Cell Fundamentals. 2nd ed. Hoboken, New Jersey, USA:
John Wiley & Sons.
R.J. Kee, M.E.C.a.P.G., 2003. Chemically Reacting Flow: Theory and Practice. Hoboken, NJ: John
Wiley.
Richards, A., 2010. A unique experimental tool for the evaluation of gas transport and internal-
reforming chemistry within solid oxide fuel cell anodes. Master's thesis. Golden, CO: Colorado
School of Mines.
Richards, A., 2010. A Unique Experimental Tool for the Evaluation of Gas Transport and Internal-
Reforming Chemistry within Solid Oxide Fuel Cell Anodes. Master's Thesis. Golden, CO: Colorado
School of Mine.
Richards, A., 2010. Gas Transport and Internal Reforming Chemistry in SOFC Anode supports and
Structures. PhD Thesis proposal. Golden CO: Colorado School of Mines.
S. Fontana, R.A.S.C.P.P.G.C.M.V.R.M.M.S., 2007. Mettallic interconnects for SOFC:
Characterization of corrosion resistance and conductivity evaluation at operating temperature of
differently coated alloys. Journal of Power Sources, 171, pp.652-62.
S. Molin, B.K.M.G.a.P.J., 2008. Evaluation of porous 430L stainless steel for SOFC operation at
intermediate temperatures. Journal of Power Sources, 181, pp.31-37.
S. Molin, M.G.B.K.P.J., 2009. Evaluation of 316L porous stainless steel for SOFC support. Journal of
the European Ceramic Society, 29, pp.757-62.
S. Molin, M.G.a.P.J., 2010. High temperature oxidation of porous alloys for solid oxide fuel cell
applications. Solid State Ionics, 181, pp.1214-20.
Song, C., 2002. Fuel processing for low-temperature and high-temperature fuel cells Challenges,
and oppertunities for sustainable development in the 21st century. Catalysis Today, 77, pp.17-49.
Steele, B.C.H., 2000. Appraisal of CGO electrolytes for IT-SOFC operation at 500C. Solid State
Ionics , 129, pp.95-110.

A - 5
T. Franco, K.S.Z.I.G.S.a.A.V., 2007. Ceramic Diffusion Barrier Layers for Metal Supported SOFCs.
ECS Transactions, 7(1), pp.771-80.
T. Franco, M.B.M.R.G.K.A.V.a.L.S.S., 2009. Recent Development Aspects of Metal Supported Thin-
Film SOFC. ECS Transactions, 25(2), pp.681-88.
T. Horita, N.S.T.K.H.Y.a.M.D., 1996. Oxidation and Steam Reforming of CH4 on Ni and Fe Anodes
under Low Humidity Conditions in Solid Oxide Fuel Cells. Journal of the Electrochemical Society,
143(4), pp.1162-68.
T. Ishihara, H.M.a.Y.T., 1994. Doped LaGaO3 Perovskite Type Oxide as a New Oxide Conductor.
Journal of the American Chemical Society , 116(9), pp.3801-03.
T. Ishihara, J.Y.M.S.H.M., 2006. Ni-Fe bimetallic anode as an active anode for intermediate
temperature SOFC using LaGaO3 based electrolyte film. Electrochimica Acta, 52, pp.1645-50.
T. Ishihara, J.Y.M.E.S.O.H.M., 2008. Ni-Fe Alloy-Supported Intermediate Temerature SOFCs Using
LaGaO3 Electrolyte Film for Quick Startup. Journal of Fuel Cell Science and Technology, 5, pp.1-3.
ThyssenKrupp VDM, 2005. [Online] Available at: http://www.thyssenkrupp-vdm-
fareast.com/media/down_datasheets_heatres_new/crofer22apu_e.pdf.
Tucker, M.C., 2010. Progress in metal-supported solid oxide fuel cells: A review. Journal of Power
Sources, 195, pp.4570-82.
United States Department of Energy, 2008. Hydrogen Production. [Online] Available at:
https://www1.eere.energy.gov/hydrogenandfuelcells/production/natural_gas.html.
unknown, 2011. Bloomberg Businessweek. [Online] Available at:
http://investing.businessweek.com/research/stocks/private/snapshot.asp?privcapId=61567383.
W.G.Coors, R.S., 2007. Preparation of yttria-stabilized zirconia reaction sintered products. Patent
Number: 20070176332. United States of America.
W.Z. Zhu, S.C.D., 2003. A review on the status of anode materials for solid oxide fuel cells.
Materials Science and Engineering A, A362, pp.228-39.
Y. Lin, Z.Z.S.A.B., 2006. Improving the stability of direct-methane solid oxide fuel cell using anode
barrier layers. Journal of Power Sources , 158, pp.1313-16.
Y. Matsuzaki, I.Y., 2000. The poisoning effect of sulfur-containing impurity gas on a SOFC anod:
Part I. Dependence on temperature, time, and impurity concentration. Solid State Ionics, 132,
pp.261-69.
Y.-S. Chou, J.W.S.L.A.C., 2002. Ultra-low leak rate of hybrid compressive mica seals for solid oxide
fuel cells. Journal of Power Sources , 112, pp.130-36.
Z. Wang, J.O.B.S.Y.C.D.-P.W.Q.R.H.R.M.D.G., 2008. Dynamic evaluation of low-temperature metal-
supported solid oxide fuel cell oriented to auxiliary power units. Journal of Power Sources, 176,
pp.90-95.

A - 6
Z. Zhan, S.A.B., 2005. An octane-fueled solid oxide fuel cell. Science, 308, pp.844-47.
Related Documents