1 Introduction It can be said that a priority goal of any transportation system is to grant access to facilities. As a place-specific concept, accessibility relates to the ability to have inter- actions with other locales. Accessibility represents how easily spaced-out economic opportunities can be apprehended through trade from a reference location, using a particular transportation system (Koenig, 1980). Therefore, in order to evaluate the performance of a transportation system, it is necessary to devise measures of efficiency of the system (Levinson, 2003) in moving people to places they wish to go, and in shipping goods to where they are in demand. Until now, most research on accessibility measures has been confined to the urban-metropolitan context based on street networks (Hanson and Schwab, 1987; Helling, 1998; Thill and Kim, 2005), while accessibility via intermodal freight-transportation networks has singularly been left unexplored. The need for an intermodal perspective in accessibility impact analysis of transportation enhancements has been forcefully advocated by Bruinsma and Rietveld (1998) and others. Comprised of an array of modes that are physically distinct from one another, traditional transportation systems depend on effective connections and coordination among them to be competitive and to provide value to shippers. With the steady increase in long-haul trade and the growing pressure to reduce logistics costs, the integration of shipments across modes, or ‘intermodalism’, has become a prominent expression of logistics and supply-chain management in advanced economies (Slack, 2001) öfirst, in overseas trade and, more recently, in domestic trade. (1) The objective of this paper is to gauge the efficiency gained by the US freight- transportation system in embracing intermodalism as an alternative to door-to-door Intermodal freight transportation and regional accessibility in the United States Hyunwoo Lim Department of Geography, State University of New York at Buffalo, 105 Wilkeson Quad, Buffalo, NY 14261, USA; e-mail: [email protected] Jean-Claude Thill Department of Geography and Earth Sciences, University of North Carolina at Charlotte, 9201 University City Boulevard, Charlotte, NC 28223, USA; e-mail: [email protected] Received 1 September 2005; in revised form 28 November 2006; published online 23 May 2008 Environment and Planning A advance online publication Abstract. The authors investigate how the intermodal freight-transportation network affects the ability of regions to position themselves more effectively in the national space economy. The case of domestic containerized freight traffic is examined because it is closely associated with contemporary forms of integration between rail shipping and trucking. With the help of a geographic information system, the potential impact of intermodalism in the United States is analyzed by mapping integral place accessibility measures of five-digit zip-code areas. The performance of the intermodal freight network is evaluated by comparing accessibility measures based on the highway network and on the intermodal network, respectively. Geographically weighted regressions are also performed to identify the variables that contribute to the improvement of accessibility due to intermodalism, while accounting for the spatial nonstationarity of relationships. doi:10.1068/a38336 (1) Truck ^ rail multimodal shipping captured about 2.1% of all domestic trade based on ton-miles in 1997 (US DOT, 1999). This is comparable to its market share in Europe (EC, 2001).

Welcome message from author
This document is posted to help you gain knowledge. Please leave a comment to let me know what you think about it! Share it to your friends and learn new things together.
Transcript
1 IntroductionIt can be said that a priority goal of any transportation system is to grant access tofacilities. As a place-specific concept, accessibility relates to the ability to have inter-actions with other locales. Accessibility represents how easily spaced-out economicopportunities can be apprehended through trade from a reference location, using aparticular transportation system (Koenig, 1980). Therefore, in order to evaluate theperformance of a transportation system, it is necessary to devise measures of efficiencyof the system (Levinson, 2003) in moving people to places they wish to go, and inshipping goods to where they are in demand. Until now, most research on accessibilitymeasures has been confined to the urban-metropolitan context based on street networks(Hanson and Schwab, 1987; Helling, 1998; Thill and Kim, 2005), while accessibility viaintermodal freight-transportation networks has singularly been left unexplored. Theneed for an intermodal perspective in accessibility impact analysis of transportationenhancements has been forcefully advocated by Bruinsma and Rietveld (1998) andothers.
Comprised of an array of modes that are physically distinct from one another,traditional transportation systems depend on effective connections and coordinationamong them to be competitive and to provide value to shippers. With the steadyincrease in long-haul trade and the growing pressure to reduce logistics costs, theintegration of shipments across modes, or `intermodalism', has become a prominentexpression of logistics and supply-chain management in advanced economies (Slack,2001)öfirst, in overseas trade and, more recently, in domestic trade.(1)
The objective of this paper is to gauge the efficiency gained by the US freight-transportation system in embracing intermodalism as an alternative to door-to-door
Intermodal freight transportation and regional accessibilityin the United States
Hyunwoo LimDepartment of Geography, State University of New York at Buffalo, 105 Wilkeson Quad, Buffalo,NY 14261, USA; e-mail: [email protected]
Jean-Claude ThillDepartment of Geography and Earth Sciences, University of North Carolina at Charlotte,9201 University City Boulevard, Charlotte, NC 28223, USA; e-mail: [email protected] 1 September 2005; in revised form 28 November 2006; published online 23 May 2008
Environment and Planning A advance online publication
Abstract. The authors investigate how the intermodal freight-transportation network affects the abilityof regions to position themselves more effectively in the national space economy. The case ofdomestic containerized freight traffic is examined because it is closely associated with contemporaryforms of integration between rail shipping and trucking. With the help of a geographic informationsystem, the potential impact of intermodalism in the United States is analyzed by mapping integralplace accessibility measures of five-digit zip-code areas. The performance of the intermodal freightnetwork is evaluated by comparing accessibility measures based on the highway network and on theintermodal network, respectively. Geographically weighted regressions are also performed to identifythe variables that contribute to the improvement of accessibility due to intermodalism, while accountingfor the spatial nonstationarity of relationships.
doi:10.1068/a38336
(1) Truck ^ rail multimodal shipping captured about 2.1% of all domestic trade based on ton-milesin 1997 (US DOT, 1999). This is comparable to its market share in Europe (EC, 2001).
highway transportation. The case of domestic containerized freight traffic is examinedbecause it is closely associated with contemporary forms of integration between railshipping and trucking. The performance of the rail ^ highway logistical combination isevaluated from an infrastructure policy perspective by comparing maps of gravity-typeaccessibility measures based on the national highway network and on the nationalintermodal (highway plus rail) network, respectively. Therefore, the resulting accessibilitymaps are instrumental in addressing whether intermodalism enhances the efficiency ofdomestic ground freight transportation and whether any perceived gain exhibits an orga-nized spatial pattern across the United States. Ultimately, this research contributes to thedebate on whether contemporary enhancements of the logistics and supply managementsystem have promoted spatial polarization or decentralization in competitive advantagestied to market accessibility, whether they have contributed to maintaining hierarchiesamong functional regions, and whether the tyranny of distance has been harnessed.
The rest of this paper is organized as follows. Section 2 highlights what sets apartnetworks integrating multiple modal component networks and networks formed of asingle mode of transportation from the perspective of accessibility. The regional economicimplications of changes in accessibility are also presented. The intermodal freight networkused as the foundation of the regional accessibility study is described in section 3, andthe methodology is introduced in section 4. Results of the statistical analysis arepresented and discussed in section 5, and conclusions are drawn in section 6.
2 Intermodalism, network accessibility, and economic developmentFor a shipper, the decision to forego door-to-door trucking service for an intermodalsolution is often multifaceted and specific to its own operations and supply-chainconsiderations (Tsamboulas and Kapros, 2000). As a more or less tightly integratedprocess, intermodalism brings interconnectivity to the transportation system at large(Rietveld, 1997) which, in turn, becomes a central element shaping the modal choice ofshippers.With intermodalism, transshipment at the nodes, where one can transfer fromone modal network to another, is unavoidable. This operation can be costly to theshipper, but extensive standardization, institutional coordination, and synchronizationof schedules at transshipment terminals has contributed to lowering the barrier tointermodal service (Beuthe and Kreutzberger, 2001). In short, the intermodal solutionis economically viable only if a reduction of the generalized impedance on modalsegments compensates for the additional transshipment cost.
It has been argued that the logistical integration of distribution networks throughintermodal processes has triggered a transformation in the economic significance of placesand spaces, at scales ranging from the local to the global perspective (Priemus andKonings, 2001; Roson and Soriani, 2000; Slack, 1990). Transformation is not limited topoints of transfer between modal networks (inland load centers), however. Because theintermodal network constitutes the backcloth on which the physical distribution systemoperates, erosion of transshipment impedances can be expected generally to lead to animprovement in accessibility throughout the area served by the networköalthough notnecessarily with the same intensity at all locations. This process mirrors the contraction ofspace and ensuing improvements to the physical transportation infrastructure of a regionor continent (Bruinsma and Rietveld, 1998; Spiekermann and Wegener, 1994). The conceptof accessibility' encapsulates the potential use of infrastructure for shipping commodities,which may contribute to reshaping the space-economy (Rietveld and Bruisma, 1998).
The accessibility impact of transportation infrastructure has become a popularresearch theme in transportation and regional analysis, particularly within the contextof Europe's regional development policy and of the development of trans-Europeannetworks. For instance, rail accessibility has been studied on the scale of the whole of
2 H Lim, J-C Thill

Europe by Gutierrez et al (1996) and Vickerman et al (1999), and highway accessibility byBruinsma and Rietveld (1993) and Gutierrez and Urbano (1996). The accessibility impactof the entire British motorway system was studied by Spence and Linneker (1994); andDodgson (1974) and Linneker and Spence (1991; 1992) aimed at sorting out the impactsimputable to development in a single corridor.
Before ^ after studies of accessibility impact have concluded that the magnitude ofsystem-side accessibility improvements hinges upon the nature, location, and signifi-cance of the infrastructure enhancement. Little consistency has so far emerged on theissue of the spatial equity in accessibility. Some studies have indicated that the resultingaccessibility is more equalized across regions (for instance, Bruinsma and Rietveld,1994; Gutierrez and Urbano, 1996), while others have suggested that differences inaccessibility may widen rather than shrink between geographically central and peri-pheral regions (Spence and Linneker, 1994; Vickerman et al, 1999). Yet others point tothe emergence of opposite trends at different geographic scales. For instance, greaterinequity in the distribution of accessibility is anticipated on a national scale from thecompletion of a new high-speed rail line between Madrid, Barcelona, and the Frenchborder, yet core ^ periphery imbalances could be reduced within the European contextat large (Gutierrez and Urbano, 1996).
Transportation improvements that lead to a reduction in the impedance and cost offreight shipping translate straightforwardly into lower total costs for firms. Whether aregion can take advantage of these conditions to develop its economy depends onmany factors, which remain ardently debated to this day. Improving linkages betweena central and a peripheral region can benefit firms in both regions in terms of reducingshipping costs, however, other circumstances will often decide whether the net result isfor producers in the peripheral region to have easier access to the central market andexpand, or for them to suffer greater exposure to competition from the center and beforced to retrench or disappear (Rietveld and Bruinsma, 1998; Vickerman et al, 1999).Banister and Berechman (2001) and others have argued that, in developed economies,accessibility is one of several conditions which, together, can promote economic devel-opment. Hence, a relative increase in accessibility brought about by capital investmentin transportation, or by the advent of an integrated intermodal transportation system,does not necessarily translate into greater competitiveness over other regions. However,it provides significant impetus that can be leveraged to enhance a region's overallcompetitive advantage in the national space economy.
3 The national intermodal network3.1 Original databaseThe intermodal network database used in this research was obtained from the Centerfor Transportation Analysis (CTA), Oak Ridge National Laboratory. The original CTAintermodal network was designed to simulate the routing of freight shipments reportedin the 1997 United States Commodity Flow Survey (CFS). It is composed of indepen-dently constructed, single-mode networks for highway, rail, and waterborne shipping,which are connected by a set of intermodal terminals and logical links. For thepurpose of specific routing applications, traffic generators can be added and connectedto any modal links of the network. Detailed technical description of this network andof the procedure used to construct it can be found in the work of Peterson (2000),Southworth and Peterson (2000), and Southworth et al (1997). Some of the key featuresof this network are summarized below. It is noteworthy to point out that a similarnetwork was produced about the same time for Europe by the NODUS project(Jourquin and Beuthe, 1996).
Intermodal freight transportation and regional accessibility in the USA 3

Mode-specific subnetworks are connected with one another at appropriate transferlocations (terminals or inland load centers). Access to a terminal gate from a modalsubnetwork is represented in the database by unidirectional modal links. Multipleterminal access links are used when more than two modes or carriers are available atthe terminal, for each major commodity type handled at the terminal, or when theshipping mode is available in the incoming and outgoing directions. These links haveendpoints which serve as modal entry and exit points of the terminal facility. All theprocesses and costs involved in the transfer of shipments within a terminal (for example,loading, unloading, break bulk, storage, drayage) are captured by logical transfer links.
A complex set of factors influence the actual costs of freight shipping, including thecommodity type, time sensitivity, shipment size, as well as carrier and shipper decisions,and contractual details. The enormity of the task of collecting detailed shipping-costinformation is clearly beyond our scope in this paper. Instead, we follow the approachdeveloped by CTA to estimate impedances for each traversable element of the inter-modal network, namely: line-haul links, railroad interline links, terminal access links,and logical terminal links. Impedances are calibrated for a generic commodity so as tobest represent shipment characteristics recorded in the 1997 CFS.
All line-haul links in the CTA network have their own `native' impedances derivedfrom the mileage, the modal attributes, and the urban/rural functional class of thecorresponding links in the real-world shipping network. For each shipping model, the impe-dance value is normalized so that approximately one impedance unit corresponds toshipping one mile on a link under the best possible conditions for this mode.
For example, native impedances are assigned to highway links based on several linkattributes such as distance, functional class (whether urban or rural), speed, presenceof a toll, and the truck route designation. Highway impedances typically range from0.9 times the link mileage for rural interstates, to 5 times the mileage for two-laneurban streets or unpaved rural roads. Rail impedances are primarily determined bythe `main line class'öan evaluation of line importance, by annual traffic volumes(Southworth and Peterson, 2000). For instance, A-main' lines are assigned impedanceequal to the link mileage, whereas the impedance of lower traffic branch lines is 4 timesthe mileage.
The computation of the effective impedance of a link depends on several shipmentcharacteristics, such as value, weight, shipping distance, ease of facility access, andcargo handling. Therefore, it is necessary to factor mode-specific link impedances aswell as the relative cost of shipping by each mode (modal impedance) to ensure thatthe transportation mode with the lowest cost would be used predominantlyöotherthings remaining equal. Validation on 1997 CFS shipment data as a whole points tothe equivalence of one line-haul mile on highways to 3.5 rail miles (Southworth andPeterson, 2000). No statistical estimation of relative modal costs has been conductedspecifically for containerized freight shipping. It appears, however, that when it comesto shipping containerized merchandise, rail and highways are more closely competitivethan they are for general cargo and bulk freight, owing to the speed and flexibilityadvantage of trucking. Relying on the detailed examination of US freight flows,Peterson suggested that the equivalence of 2 rail miles for each line-haul highwaymile reproduces patterns of freight distribution well, on average (personal communica-tion, B E Peterson, Center for Transportation Analysis, Oakridge National Laboratory,Oakridge, TN, 2005). It should be stressed that the relative modal impedance factorsare simply used to force modal route selections in-line with freight survey data, ratherthan estimating relative freight shipping costs (Southworth and Peterson, 2000).
Terminal access links tend to be secondary roads or rail spurs. Therefore, theirimpedance is high in comparison with other traversable links: their calibrated value is
4 H Lim, J-C Thill

5 times their mileage. The shipping modes which a terminal access links connects aretaken into account by averaging modal impedances of the shipping modes it connectsand assigning it to this access link.
The transfer of railcars from one railroad to another is known to be an expensiveoperation for the shipper. An interline transfer impedance of 300 was assigned bydefault to all these instances. Where local cost information was available, it was usedto adjust the default to the local conditions. Impedance on terminal links was set toreflect the high cost of handling freight at the interface of two shipping modes. Fortruck-to-rail terminals, it was calibrated to the range of 300 to 400 (Peterson, 2000).
3.2 Data preparation and customizationThe CTA intermodal network database was originally designed for much broaderobjectives than those intended in this research, so some customization was in order.As stated above, the emphasis here is on containerized freight traffic within the UnitedStates, with the exclusion of general cargo and bulk shipments. Furthermore, in orderto perform the large number of origin ^ destination (OD) routing operations requiredfor accessibility analysis, and to obtain a manageable minimum path cost matrix, theoriginal intermodal network database was selectively simplified according to the principlesoutlined below.
Transportation modes to be included in the intermodal network were limited totruck and rail shipping, with the exclusion of all waterways. This represents a minimalloss of information on intermodalism since waterways carry only a small shareof the domestic containerized freight traffic. After removing duplicate private andfor-hire truck-network links and duplicate carrier-specific rail links, the resulting inter-modal network was composed of two primary subnetworks, namely: the nationalhighway network, and the national rail network.
Intermodal transfer facilities included in the 1997 CTA network database are ofvarious types and have various functional characteristics. Starting from the originaldatabase, all the terminals that do not allow truck ^ rail transfers and are not equippedto handle containers were removed. The resulting network encompassed 401 terminals.
The contiguous United States is comprised of 31906 five-digit zip codes, as of2000. For the purpose of estimating accessibility measures over such a vast territory,possible origins and destinations of shipments are defined at the resolution of thesezip-code areas. To reduce the computational burden, shortest paths and accessibilitymeasures were computed at a lower spatial resolution than the full set of OD pairs.A subset of 6572 zip-code centroids was constituted to serve as freight shipmentorigins, and the entire set of 31906 zip-code centroids was kept as destinations in theaccessibility analysis.
The spatial distribution of five-digit zip-code centroids is not even across thecountry. In fact, it is closely related to the population distribution. Therefore, from astrict geographic perspective, densely populated sections of the country are representedby a number of reference points that is unnecessarily large; hence, some sample ofzip-code centroids was in order. A random point sampling strategy is inadequate forthis purpose because it may result in too many points being missed where zip-codecentroids are sparse. Therefore, a sampling scheme akin to systematic unaligned sampling(Berry and Baker, 1968) was used instead to ensure that similar numbers of points wereselected from any given fixed-size local area. Uniform areal representation was thusachieved. A regularly spaced triangular grid with a mesh of 32 km (20 miles) was laidover the contiguous United States; zip-code centroids closest to, and within 16 km(10 miles) of, the grid points were selected as part of the spatial sample of shipmentorigins. The result was a sample of 6572 zip-code centroids. It should be noted that this
Intermodal freight transportation and regional accessibility in the USA 5

process of point sampling does not affect the substance of our accessibility analysis. Itleads to a geographic resolution consistent with the continental scope of the analysis.
The network database derived from CTA files was connected to origins anddestinations to enable routable traffic. For highway movements, it is straightforward toconnect a zip-code centroid to the long-haul network because highways can be assumedto be ubiquitous and accessible from anywhere. This was accomplished by an access linkconnecting to the nearest highway link in a perpendicular way (crow-fly path).
Native impedance on highway access links was computed as the link mileage times theimpedance rate of 5 per mile. In addition, a 1.2 factor was applied to account forthe circuity of real access links, compared with the crow-fly distance. Modal impedancewas also factored in the computation of final connector impedances.
4 Methodology4.1 Formulation of the accessibility measuresLocation-based measures of integral accessibility represent the economic attractivenessof a location, taking into account the trade and interaction opportunities offeredby other locations and the impedances to reach them on a transportation network(Bruinsma and Rietveld, 1998; Hanson and Schwab, 1987). We formulae a gravity-typepotential accessibility measure as
Ai �Xj2L
Mj f�cij ; b � , (1)
where Ai is the measure of accessibility at location i, L is the set of all potentialdestinations, Mj is the mass of economic opportunities available at potential destina-tion j, and f(cij ; b ) is the impedance function of shipping cost cij with coefficient b.Although it is also a popular measure of accessibility, the cumulative-opportunityapproach (Kwan, 1998; Thill and Kim, 2005) was not considered here. This approachis based on the assumption that interactions occur exclusively at short range, which isnot consistent with known patterns in trade relations between regionsöas revealed bythe CFS, for instance. Conversely, gravity-type measures of potential do not rule outtrade flows between any two regions, although they typically discount them accordingto some measure of spatial impedance.
As shown in equation (1), the metric of place accessibility adopted in this researchcan be considered as a weighted average of the mass of economic opportunitiesavailable in all possible freight shipping destinations in the continental United States.The identification of what should constitute the mass term can be problematic. Usingeither population or gross regional product alone for the mass term may not be enoughto represent the economic power that a place may have to generate containerized freighttraffic. Therefore, as shown in equation (2), we suggest a surrogate measure of economicopportunity that is designed as a combination of a final demand (personal consumptionexpenditure) and intermediate demands (purchases) of manufactured goods at the levelof five-digit zip-code areas:
Mj �PjXi
Pi
X�Xk
EjkXi
Eik
Yk , (2)
where Mj is the measure of economic opportunities in j, Pj is the 2000 population in j,X is the personal consumption expenditure on manufactured goods in 1999, Ejk is thenumber of employees in industrial sector k in j as of 2000, and Yk is the purchasesof industry k from the manufacturing industry in 1999. Final and intermediatemanufacturing purchases are unfortunately not available at a local geographic scale.These purchases were estimated by apportioning final and intermediate national purchases
6 H Lim, J-C Thill
for the entire nation to each zip code in relation to its population and employment inindustrial sector k, respectively. National final demand X, and intermediate demands Yk
are given in table 1.The potential accessibility measures were calculated according to equation (1) for
the 6572 zip-code centroids sampled to represent the contiguous United States. Theimplementation was done in TransCAD 4.5 and ArcGIS. It is well known that theparameterization of accessibility models conditions their empirical validity (Kwan,1998; Thill and Kim, 2005). However, the literature on freight-transportation systemsprovides little guidance in this respect due to the lack of flow-distribution studies usingan intermodal network, like the one used here. Furthermore, there are no publishedfreight traffic flow data at the 5-digit zip-code level that could serve to establish theappropriate specification of these models.(2) We now discuss the approach used toidentify suitable impedance functions and model parameters.
In this research, the exponential function f(cij ) � exp (ÿ bcij ) was used to modelthe deterrent effect of the transportation cost on potential freight flows. The exponentialfunction is particularly useful in handling the `self-potential' problem which happenswhen i � j, cij � 0. Since exp (0) � 1, the case of cij � 0 is trivially handled bythe exponential function and the entirety of trade opportunities are accounted forin the estimation of accessibility scores (O'Kelly and Horner, 2003).
Since the shipping impedance decay parameter cannot be directly estimated statisti-cally, three alternative values were assumed for b, each one being consistent with ahypothetical, though realistic, scenario. This allowed us to conduct sensitivity analysis ofresults to the assumptions made to specify the accessibility model. In the first scenario,shipping costs were assumed to weigh most heavily on freight-flow distribution betweenzip code areas. Specifically, the direct effect of economic opportunities Mj on flowattraction was discounted by 95% for a shipping impedance of 1000. The secondscenario assumed a reduced response of freight flows to shipping impedance: that is,the effect of the economic opportunities was discounted by 90% for an impedance of1000. The third scenario assumed the weakest impedance decay effect on freight flows:the effect of the economic opportunities was discounted by 75% for an impedanceof 1000. The resulting three parameters are 0.0030, 0.0023, and 0.0014, respectively.(3)
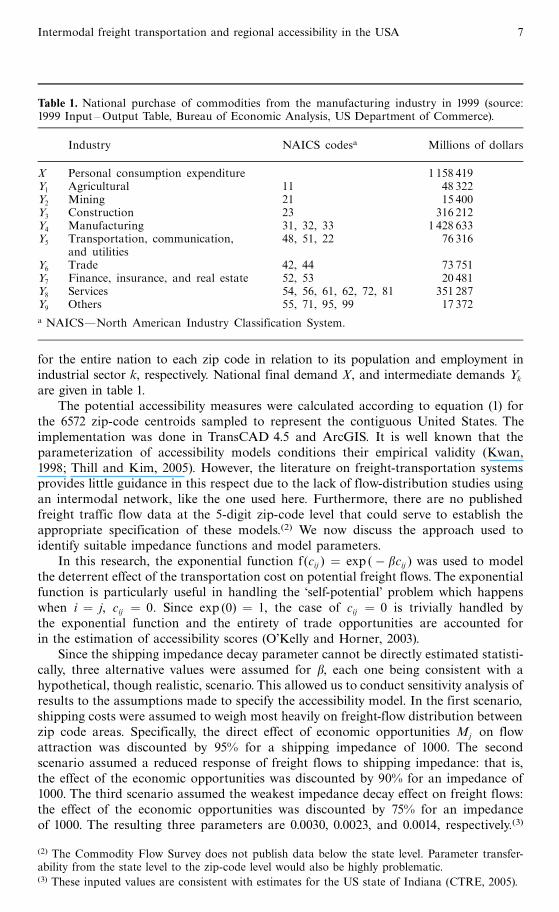
Table 1. National purchase of commodities from the manufacturing industry in 1999 (source:1999 Input ^Output Table, Bureau of Economic Analysis, US Department of Commerce).
Industry NAICS codesa Millions of dollars
X Personal consumption expenditure 1 158 419Y1 Agricultural 11 48 322Y2 Mining 21 15 400Y3 Construction 23 316 212Y4 Manufacturing 31, 32, 33 1 428 633Y5 Transportation, communication, 48, 51, 22 76 316
and utilitiesY6 Trade 42, 44 73 751Y7 Finance, insurance, and real estate 52, 53 20 481Y8 Services 54, 56, 61, 62, 72, 81 351 287Y9 Others 55, 71, 95, 99 17 372
a NAICSÐNorth American Industry Classification System.
(2) The Commodity Flow Survey does not publish data below the state level. Parameter transfer-ability from the state level to the zip-code level would also be highly problematic.(3) These inputed values are consistent with estimates for the US state of Indiana (CTRE, 2005).
Intermodal freight transportation and regional accessibility in the USA 7

Following the work of Gordon (1978), the three sets of parameters can also be interpretedas relevant to three representative types of containerized cargo differentiated on thebasis of their value:weight ratio, from low to high, respectively.
4.2 Modeling changes in accessibility surfacesAlternative gravity-type accessibility measures were first computed on the highwaynetwork and subsequently on the intermodal network described above. As indicatedby Transport Canada (1996), Tsamboulas and Kapros (2000), Beuthe and Kreutzberger(2001), Resor and Blaze (2004), and others, rail intermodal equipment becomescompetitive with trucking in terms of cost and time only if the line haul is largeenough. Since the major reductions in rail hauling costs experienced since the 1980s,it is usually accepted that rail intermodal service is not competitive in North Americafor less than a 500-mile range (Resor and Blaze, 2004; Transport Canada, 1996).Therefore, short-haul routes were excluded from this study of containerized domestictrade. Potential OD pairs of less than 500 highway miles were left out of the compu-tation of accessibility measures. Measures derived on the basis of the national highwaynetwork were taken as the baseline against which the reality of intermodal cargoshipping was compared. When accessibility is modeled on the intermodal network,the least-impedance shipping route from a given origin to a given destination is eitheran all-highway route or a combination of highway and rail segments, depending on therespective route impedances.When modeled this way, intermodal accessibilities cannotbe worse than highway accessibilities computed under the same model parameteriza-tion. Therefore, discrepancies between the highway and intermodal accessibilities canbe imputed entirely to the benefit of intermodalism.
Accessibility indices computed for the sample of 6572 zip-code centroids werespatially interpolated in ArcGIS into two-dimensional continuous surfaces by theinverse distance weighted (IDW) method, where the power parameter is chosen tominimize the root mean squared error of interpolated values to original values (Haining,1990). An advantage of interpolated surface maps is that accessibility scores are repre-sented continuously over space, which is more consistent with reality and facilitatesinterpretation.
To better understand the locational advantage induced by intermodalism, statisticalmodels of the change in accessibility under each of the three scenarios of response toshipping impedances were estimated. Regression analysis of the accessibility improve-ment at 6572 zip-code centroids against variables of economic activity and access totransportation infrastructure was performed. By construct, the later variables exhibit aclear pattern of spatial autocorrelation. In addition, multiple test runs of ordinary leastsquares (OLS) linear regression consistently resulted in significant spatial autocorrela-tion in the residuals. Given the existence of significant spatial effects, we also estimategeographically weighted regression (GWR) (Brunsdon et al, 1996; Fotheringham et al,2002), which endogenizes spatial dependence relationships at a local scale. GWRenables the local analysis of the relationship between the gain in accessibility andfactors that may contribute to it. Unlike OLS regression, which produces a singleset of parameter estimates for the entire study area, GWR allows for the spatialvariation of parameters from place to place. GWR estimates regression coefficientsat each point i by assigning larger weights to data points in close geographic proximityto i than to calibration data further away.
Parameter estimates at any regression point are determined by the shape of thekernel and its bandwidth as well the data values on the points. A variable bandwidthwas applied such that a larger bandwidth was used for areas where spatial observationswere more widely spaced. The bandwidth was determined in such a way that the same
8 H Lim, J-C Thill

number N of points with nonzero weights was used to estimate parameters foreach spatial observation (Fotheringham et al, 2002). In all the models reported below,N was chosen to be 275öor about 4% of the total number of spatial observations.The computer application GWR 3.0, developed by Fotheringham et al (2002), was usedto estimate GWR by maximum likelihood.
5 Container shipping and accessibility gainsBased on the three scenarios of freight-flow response to shipping impedance, accessi-bility measures were calculated with the corresponding parameters both for highwayand for intermodal networks. Table 2 contains descriptive statistics on the accessibilitymeasures computed at 6572 selected zip-code locations for all three parametric speci-fications of the exponential impedance function. All accessibility measures exhibitlarge variations across the study area, and they are also very sensitive to the shippingimpedance decay parameter b: they increase as b becomes smaller since the contribu-tion of more remote potential shipping destinations is discounted less. A smallerparameter reduces the friction of impedance on the network, which increases theacessibility score. As part of their drift, the influence of shipping impedance wanesand the accessibility measure represents an increasingly global trend instead of thelocal effects tied to movements on the networks. Hence the decline in the coefficientsof variation for lower b values.
The continuous accessibility surfaces associated with medium shipping impedancedecay are displayed in figure 1.(4) When containerized freight is shipped by truckservice only [figure 1(a)], places in the highest accessibility category form a broadlongitudinal arc in the midwestern and southeastern portions of the country, fromKansas and Missouri to North and South Carolina, with an extension to Indianaand Michigan. All these areas enjoy good access to highly developed national highwaynetworks and are located in relatively close proximity to the large population centers ofthe Midwest and Northeast, yet a few hundred miles away from them. Accessibilitygradually decreases towards the Northeast and the Pacific Coast, where it reaches itslowest point. This map is generally consistent with the general market potential mapscomputed by O'Kelly and Horner (2003), given that potential interactions under 500miles are assumed away here. As indicated by the coefficient of variation (table 2),truck-service accessibility becomes more uniform over the lower forty-eight states as
Table 2. Descriptive statistics of accessibility measures under different scenarios of sensitivity toshipment impedances.
Scenario b Minimum Mean Maximum Standard Coefficient ofparameter deviation variation (%)
Highway network1 (high) 0.0030 21 411 136 064 244 615 53 113 39.032 (medium) 0.0023 51 077 248 418 396 763 82 984 33.403 (low) 0.0014 195 061 584 083 822 588 142 700 24.43
Intermodal network1 (high) 0.0030 21 457 136 221 244 657 52 969 38.882 (medium) 0.0023 51 305 248 955 396 791 82 424 33.113 (low) 0.0014 200 405 586 507 822 655 139 757 23.83
(4) Color surface maps of all three scenarios are available at http://www.envplan.com/misc/a38336.All three series of maps exhibit similar pattern. Hence, comments can be limited to the `medium'scenario without loss of generality.
Intermodal freight transportation and regional accessibility in the USA 9

0 250 500 750 1000 miles
Major cities
Interstates
States
53 170 to 109 000
109 000 to 163 000
163 000 to 217 000
217 000 to 267 000
267 000 to 319 000
319 000 to 395 796
Major cities
Rail lines
States
53 143 to 109 000
109 000 to 163 000
163 000 to 217 000
217 000 to 267 000
267 000 to 319 000
319 000 to 395 823
Measures of accessibility Measures of accessibility
(a)
(c)
(b)
(d)
Container terminals
Rail lines
States
0 to 250
250 to 800
800 to 1 500
1 500 to 3 000
3 000 to 5 000
5 000 to 7 457
Container terminals
Rail lines
States
0 to 0.2
0.2 to 1.0
1.0 to 3.0
3.0 to 6.0
6.0 to 8.7
Absolute increase Percentage increase
Figure 1. Accessibility surfaces under scenario 2ömoderate sensitivity to shipment impedances: (a) measures of accessibility on the highway network;(b) measures of accessibility on the intermodal network; (c) absolute gain in accessibility; (d) percentage gain in accessibility.
10H
Lim
,J-CThill
N:/pdf-prep/
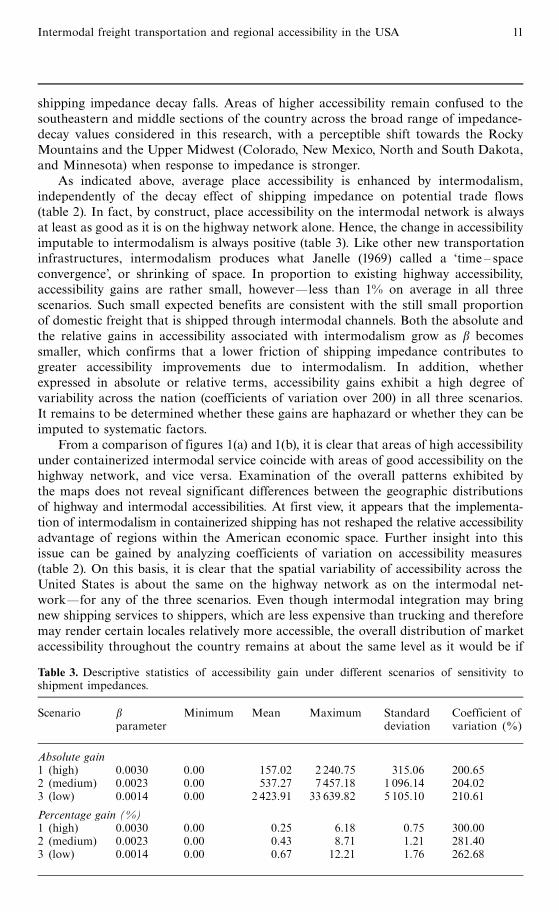
shipping impedance decay falls. Areas of higher accessibility remain confused to thesoutheastern and middle sections of the country across the broad range of impedance-decay values considered in this research, with a perceptible shift towards the RockyMountains and the Upper Midwest (Colorado, New Mexico, North and South Dakota,and Minnesota) when response to impedance is stronger.
As indicated above, average place accessibility is enhanced by intermodalism,independently of the decay effect of shipping impedance on potential trade flows(table 2). In fact, by construct, place accessibility on the intermodal network is alwaysat least as good as it is on the highway network alone. Hence, the change in accessibilityimputable to intermodalism is always positive (table 3). Like other new transportationinfrastructures, intermodalism produces what Janelle (1969) called a `time ^ spaceconvergence', or shrinking of space. In proportion to existing highway accessibility,accessibility gains are rather small, howeveröless than 1% on average in all threescenarios. Such small expected benefits are consistent with the still small proportionof domestic freight that is shipped through intermodal channels. Both the absolute andthe relative gains in accessibility associated with intermodalism grow as b becomessmaller, which confirms that a lower friction of shipping impedance contributes togreater accessibility improvements due to intermodalism. In addition, whetherexpressed in absolute or relative terms, accessibility gains exhibit a high degree ofvariability across the nation (coefficients of variation over 200) in all three scenarios.It remains to be determined whether these gains are haphazard or whether they can beimputed to systematic factors.
From a comparison of figures 1(a) and 1(b), it is clear that areas of high accessibilityunder containerized intermodal service coincide with areas of good accessibility on thehighway network, and vice versa. Examination of the overall patterns exhibited bythe maps does not reveal significant differences between the geographic distributionsof highway and intermodal accessibilities. At first view, it appears that the implementa-tion of intermodalism in containerized shipping has not reshaped the relative accessibilityadvantage of regions within the American economic space. Further insight into thisissue can be gained by analyzing coefficients of variation on accessibility measures(table 2). On this basis, it is clear that the spatial variability of accessibility across theUnited States is about the same on the highway network as on the intermodal net-worköfor any of the three scenarios. Even though intermodal integration may bringnew shipping services to shippers, which are less expensive than trucking and thereforemay render certain locales relatively more accessible, the overall distribution of marketaccessibility throughout the country remains at about the same level as it would be if
Table 3. Descriptive statistics of accessibility gain under different scenarios of sensitivity toshipment impedances.
Scenario b Minimum Mean Maximum Standard Coefficient ofparameter deviation variation (%)
Absolute gain1 (high) 0.0030 0.00 157.02 2 240.75 315.06 200.652 (medium) 0.0023 0.00 537.27 7 457.18 1 096.14 204.023 (low) 0.0014 0.00 2 423.91 33 639.82 5 105.10 210.61
Percentage gain (%)1 (high) 0.0030 0.00 0.25 6.18 0.75 300.002 (medium) 0.0023 0.00 0.43 8.71 1.21 281.403 (low) 0.0014 0.00 0.67 12.21 1.76 262.68
Intermodal freight transportation and regional accessibility in the USA 11

freight was shipped by trucks only, even though a slight tendency towards smalldisparities between the most and least accessible locales is perceptible. Vickerman(1998) went further and suggested that ` nothing can be done about geography''(page 81) because ` peripheral regions are by definition peripheral and no networkdevelopment can change this'' (page 81).(5) Although the issue of peripherality isaddressed later in this paper, it nonetheless remains that there is no compellingevidence to support the view that intermodal integration would lead in any meaningfulway to regional convergence nationwide.
The spatial pattern of high accessibility gains linked to intermodalism and evi-denced in figures 1(c) and 1(d) does not indicate a consistent link to peripheralitywithin the study area. Some of the highest gains were recorded in outlying states,such as the Pacific Northwest and Maine, while some of the lowest gains wereobserved in Tennessee, Kentucky, and Missouriöwhich are in close proximity to thegeographic center and population centroid of the United Statesöbut also in centralCalifornia and in Nevada. Clearly a more complex geography is in place and a simplecore ^ periphery model fails to account for all the regional variation of accessibilityimpacts of intermodal containerized transportation. Peripherality appears to be anecessary condition for a region to experience significant benefits from the presenceof a loading center, yet it is not sufficient. As evidenced by the low gains of central andsouthern California, not even the proximity of loading centers suffices to produce largeaccessibility gains. Ultimately, accessibility gains come down to economic considera-tions driven by the mileage traveled on highway versus rail networks, the connectivityof these networks, and the magnitude of intermodal transfer impedances.
In an attempt to understand the conditions under which intermodalism impactsaccessibility across communities of the United States further, linear regression analysiswas performed on the absolute and relative gains in accessibility under each of thethree scenarios described earlier. For the sake of brevity, only the results for scenario 2are presented here; as the results for scenarios 1 and 3 are qualitatively similar to thosefor scenario 2, we comment only briefly on some of the differencesönumerical resultsare available from the authors. The objective of this analysis was to identify significantcorrelates of accessibility gain induced by intermodalism. Accessibility gain wasregressed on a set of independent variables which typically set locales apart in thecontext of trading potentials within a given economic space. Particular emphasis wasplaced on the relation to channels of containerized freight shipment, namely: thehighway system; the rail network; and intermodal transfer facilities. Predictors ofinterest include: economic significance of locations (ECONPOT), as measured by theirpotential Mj for generating containerized freight traffic attraction [equation (2)];accessibility to the national highway system (ACSHWAY) [equation (1)]; proximity to arail line (RAILDIST), measured by the straight-line distance to the closest rail line; andproximity to an intermodal terminal (TERMIMPED), measured by the minimum highwayimpedance to such terminals. In all six OLS models, the variance inflation factors arein the range of 1 to 2, which is a strong indication that independent variables are notcollinear. Finally, variables ECONPOT and TERMIMPED were log transformed to removeheteroskedasticity.
The specification of the OLS model of absolute gain in accessibility (table 4)generates an R 2 of 0.332 with an F-statistic of 815.52 which is significant at p < 0:01.The global model of relative accessibility gains (table 5) has a similar goodness of fit(R 2 � 0:333). The OLS estimates indicate that the absolute and relative accessibility
(5) Some empirical evidence of lack of regional convergence on the basis of accessibility can befound in Vickerman et al (1999).
12 H Lim, J-C Thill

gains of a location are significantly related to all four predictors at p < 0:01. Accessibilityenhancements brought about by intermodalism are higher on average at locations thatdo not enjoy good highway accessibility. In conjunction with the fact that intermodal-ism has the effect of reducing the disparity between the most accessible and leastaccessible locations noted above, this result can be taken as evidence of regionalconvergence from an accessibility perspective. Nationwide, locales which are location-ally disadvantaged profit more than others from the intermodal revolution. On theother hand, intermodalism has actually created new locational advantages that do notnecessarily coincide with those predating the intermodal revolution. In particular,location in a rail corridor is a major asset that enables a community to take advantageof better connectivityöas revealed by the negative parameter of RAILDIST in the twoOLS models. the OLS regression analysis also reveals that the transportation impe-dance to a location's closest intermodal transfer facility is a significantly positive factorin the location's gain in accessibility, whether relative or absolute.
In addition, the OLS regression models indicate that intermodal containerizedservice is more beneficial to localities with a smaller economic baseöall other things
Table 4. Regression models of the absolute gain in accessibility (scenario 2).
Global regressionNumber of observations: 6572R 2: 0.332F-statistic � 815.521 ( p < 0:000)
Variable Description Coefficient Standard error t-value P-value
Intercept 3 334.014 71.581 46.716 <0.001ACSHWAY Highway accessibility ÿ0.00845 0.000 ÿ57.036 <0.001ln(ECONPOT) Economic attraction ÿ19.331 6.859 ÿ2.818 0.005ln(RAILDIST) Distance to the closest ÿ122.173 11.954 ÿ10.220 <0.001
rail lineTERMIMPED Impedance to closest ÿ2.851 0.144 ÿ19.818 <0.001
intermodal terminal
Geographically weighted regressionR 2: 0.911
Variable Coefficients
minimum lower quartile median upper quartile maximum
Intercept ÿ763.921 24.971 391.721 1 520.039 14 758.896ACSHWAY ÿ0.095 ÿ0.004 ÿ0.001 0.000 0.013ln(ECONPOT) ÿ66.108 0.442 2.890 10.088 145.361ln(RAILDIST) ÿ459.018 ÿ18.039 ÿ3.620 1.757 156.778TERMIMPED ÿ16.941 ÿ1.125 ÿ0.308 0.038 8.401
Test for spatial variability of coefficients
Parameter P-value
Intercept <0.001ACSHWAY <0.001ln(ECONPOT) 0.99ln(RAILDIST) 0.74TERMIMPED <0.001
Intermodal freight transportation and regional accessibility in the USA 13

being equal. This holds true whether the gain in accessibility is expressed in absoluteterms or with respect to accessibility with trucking service only.
By allowing for spatial variation of regression coefficients, GWR accounts for aconsiderably larger share of the sum of squares of the accessibility gain than does OLSregression, while controlling for estimation biases. When the dependent variable wasset to the absolute gain in accessibility due to intermodalism, the coefficient of deter-mination almost tripled from 33.2% to 91.1%; R 2 went from 0.333 to 0.948 when thegain is expressed in relative terms. The significance test for spatial nonstationarityindicates that ACSHWAY and TERMIMPED show significant spatial variations at 0.05across the country in the models of absolute and relative accessibility gains (tables 4and 5); the influence of the other two variables does not vary spatially. Interestingly,local coefficient estimates of ACSHWAY and TERMIMPED vary from positive to negativevalues across locations. It is clear that, contrary to what the OLS regression indicates,considerable heterogeneity exists in the contribution of spatioeconomic correlates ofthe geography of intermodal accessibility gains. It is much less so, however, if onlystatistically significant local coefficients are considered. For some correlates, median
Table 5. Regression results of the relative gain in accessibility (scenario 2).
Global regressionNumber of observations: 6572R 2: 0.333F-statistic � 818.939 ( p < 0:000)
Variable Description Coefficient Standard error t-value P-value
Intercept 3.534 0.079 44.631 <0.001ACSHWAY Highway accessibility ÿ0.009 0.000 ÿ57.126 <0.001
(�1000)ln(ECONPOT) Economic attraction ÿ0.028 0.008 ÿ3.693 <0.001ln(RAILDIST) Distance to the closest ÿ0.126 0.013 ÿ9.560 <0.001
rail lineTERMIMPED Impedance to closest ÿ0.003 0.000 ÿ18.966 <0.001
intermodal terminal
Geographically weighted regressionR 2: 0.948
Variable Coefficients
minimum lower quartile median upper quartile maximum
Intercept ÿ0.294 0.047 0.225 0.857 21.735ACSHWAY ÿ0.164 ÿ0.003 ÿ0.0005 ÿ0.0001 0.010ln(ECONPOT) ÿ0.090 0.000 0.001 0.004 0.121ln(RAILDIST) ÿ0.418 ÿ0.008 ÿ0.001 0.001 0.084TERMIMPED ÿ0.018 0.000 0.000 0.000 0.004
Test for spatial variability of coefficients
Parameter P-value
Intercept <0.001ACSHWAY <0.001ln(ECONPOT) 0.99ln(RAILDIST) 0.98TERMIMPED <0.001
14 H Lim, J-C Thill

0 250 500 750 1000 miles
GWR coefficients
GWR coefficientsGWR coefficients
GWR coefficients
Cities
States
p > 0:05
ÿ66 to ÿ20ÿ20 to 0
0 to 20
20 to 60
60 to 100
100 to 145
Container terminals
Rail lines
States
p > 0:05
ÿ17 to ÿ11ÿ11 to ÿ7ÿ7 to ÿ3ÿ3 to 0
0 to 2
2 to 8
Cities
Interstates
States
p > 0:05
ÿ0.09 to ÿ0.07ÿ0.07 to ÿ0.04ÿ0.04 to ÿ0.02ÿ0.02 to 0.00
0.00 to 0.013(a)
(c)
(b)
(d)
Major cities
Rail lines
States
p > 0:05
ÿ458 to ÿ300ÿ300 to ÿ160ÿ160 to ÿ70ÿ70 to 0
0 to 60
60 to 157
Figure 2. Geographically weighted regression (GWR) parameters of absolute gain in accessibility under scenario 2: (a) log of economic attractiveness;(b) highway accessibility; (c) log of distance to closest rail line; and (d) highway impedance to closest intermodal terminal.
Intermodal
freighttransportation
andregional
accessibilityin
theUSA
15

0 250 500 750 1000 miles
Container terminals
Rail lines
States
p > 0:05
ÿ0.018 to ÿ0.011ÿ0.011 to ÿ0.006ÿ0.006 to ÿ0.001ÿ0.001 to 0.000
0.000 to 0.005
(a)
(c)
(b)
(d)
Major cities
Rail lines
States
p > 0:05
ÿ0.42 to ÿ0.27ÿ0.27 to ÿ0.16ÿ0.16 to ÿ0.05ÿ0.05 to 0.00
0.00 to 0.084
Cities
Interstates
States
p > 0:05
ÿ0.16 to ÿ0.10ÿ0.10 to ÿ0.06ÿ0.06 to ÿ0.02ÿ0.02 to 0.00
0.00 to 0.01
GWR coefficientsGWR coefficients
GWR coefficients GWR coefficients
Cities
States
p > 0:05
ÿ0.090 to ÿ0.035ÿ0.035 to 0.000
0.000 to 0.030
0.030 to 0.072
0.072 to 0.121
Figure 3. Geographically weighted regression (GWR) parameters of relative gain in accessibility under scenario 2: (a) log of economic attractiveness;(b) highway accessibility; (c) log of distance to closest rail line; and (d) highway impedance to closest intermodal terminal.
16H
Lim
,J-CThill

local coefficients suggest different relations from those seen in the global regressionmodel. These differences can be analyzed as follows. The ECONPOT local coefficientmedian is positive both in the absolute-gain and in the relative-gain models: intermodalcontainerized service is more beneficial to localities with a larger economic base.While larger localities have the economic potential to generate a larger volume of con-tainerized freight traffic, they also tend to be better positioned to take advantage ofintermodal shipping arrangements. With lower transaction costs, they enjoy a compet-itive advantage over smaller localities, which contributes to maintaining the hierarchicalstructure of the spatial economy of the lower forty-eight states.While the global param-eter estimate of TERMIMPED is negative, the median of TERMIMPED local coefficients iszero in the relative-gain model; however, the negative skewness is consistent with theeconomic significance of the intermodal terminal in facilitating freight shipping andtrade at large.(6)
The regression coefficients for each data point location can be spatially interpo-lated and visualized as continuous surface maps, as shown in figures 2 and 3. Shadingon a map marks areas where the p-value of the GWR parameter is greater than 0.05,which implies statistical insignificance at the 5% level. All the maps of parametersshow significant regional contrast. Parameter estimates of economic attraction fail tobe statistically significant for most locations in the country [figures 2(a) and 3(a)].When it is statistically significant, the impact of economic attraction is usually positive.
In figures 2(b) and 3(b), most regions show negative regression coefficients ofhighway accessibility, which suggests that intermodalism is most beneficial whereaccessibility by highways is not so good.(7) Once again, regional economic convergenceis detected.With the exception of New England and southern Arizona, GWR coefficientestimates related to rail-line proximity [figures 2(c) and 3(c)] are uniformly negativeacross the country as less benefit from intermodalism is expected away from railcorridors. It can be said that these areas depend heavily on the rail infrastructure formaintaining high accessibilities to other places. Finally, figures 2(d) and 3(d) displayGWR coefficient estimates of intermodal terminal access that are predominantlynegative, except for New England. The accessibility impact of transfer terminals is,by all accounts, beneficial for most regions.
6 ConclusionsIntermodal transportation has become one of the cornerstones of economic vitality inthe United States, as well as in other countries. In this paper, we aimed to establish theimpact of the US intermodal freight transportation network on the ability of regions toenjoy advantageous transportation and logistics costs and turn these to competitiveadvantage in the national space economy. The net gain in accessibility associated withintermodal containerized transportation is a good indicator of the potential impactof intermodalism across the United States. The accessibility analysis was applied todomestic containerized freight traffic.
Accessibility surfaces exhibited a great deal of variability across the country and theaccessibilities are very sensitive to the impact of friction on the transportation network.Not surprisingly, our experiments show that intermodal networks enhance accessibilityöalthough rather weakly overall. More interestingly, accessibility gains due to inter-modalism exhibit a strong spatial dimension. Spatial equity in accessibility across theconterminous United States was found to be increased by the intermodal revolution in
(6) It should also be noted that the median of TERMIMPED local coefficients is zero in the relative-gainmodel under scenarios 1 and 3.(7) California and Arizona exhibit the reverse relationship.
Intermodal freight transportation and regional accessibility in the USA 17
modest proportions. From a public policy standpoint, the implication is that the widelyheralded economic development benefits of intermodalism are not quite reflected in theeconomic realities experienced by freight shippers. In particular, one should notanticipate this cornerstone of the US Intermodal Surface Transportation EfficiencyAct (ISTEA) and its successors to trigger a fundamental rebalancing of regionaleconomies over the United States.
While intermodalism enhances average accessibility overall, its impact on regionsdo not follow a simple core ^ periphery model. Indeed, many peripheral regions havegained better access to the business opportunities of large economic centers thanks tointermodalism in freight shipping. However, their absolute improvement in accessibilityis still not large enough to enable them to compete with the central regions of the UnitedStates [Vickerman's (1999) tyranny of geography]. The polarization of freight flows stillprevails in the sense that the accessibility gap between central and peripheral regionsremains wide. Regression analysis indicates that, all other things being equal, accessi-bility gains are smaller in areas that already enjoy good accessibility on highway-basedshipping routes. Proximity to intermodal transfer terminals and location in a railcorridor are also factors leading to a region's ability to take advantage of intermodaldeployment. In addition, intermodal containerized service is more beneficial to regionswith a large economic base, thus contributing to the upholding of hierarchical structuresof the space economy.
This study brings to light the effects of intermodal freight services on place acces-sibility and the changing geography of competitiveness on a national level. However,some caveats are in order given the limitations imposed on the research by dataavailability. The 1997 CTA database does not contain a complete set of intermodalinterchanges, yet is it the most comprehensive and consistent inventory in existence atthe national level. In addition, the level of service on trucking lines and rail lines (forexample, traffic congestion, unit trains, fast versus slow trains) varies considerably andis not compiled in any nationwide dataset. Thus the merit of this research is in lookingat nationwide patterns in physical accessibility for typical containerized trade, ratherthan the case of a particular shipment, shipper, or carrier.
This research could be enhanced in several ways in the future. First, implementa-tion of tapered freight rates would result in more realistic transportation costs betweenshipment origins and destinations. The per-kilometer transportation cost usuallydeclines with distance, which is not reflected in the current application for calculatingthe minimum path cost matrix. Given the long-haul cost advantage of rail overtrucking, it can be anticipated that greater accessibility gains would be identified,although their spatial expression remains to be established. Second, disaggregateempirical data would help the choice of the impedance function and of its parameterwith the commodity-flow information including origin, destination, commodity type,and the shipping costs. Alternatively, simulation of the distribution and routing ofcontainer flows on a national scale would improve our understanding of the impactof freight intermodalism.
In this research we disregarded trade with overseas economies, and centeredexclusively on domestic, interregional, trade. Similar effort could be conducted forinternational trade relations. This complementary research would prove particularlyimportant since intermodal transfers are extensively used by shippers and carriers fornational imports and exports. Taken together, the studies on domestic and interna-tional commerce would highlight regions which are endowed with a double locationaladvantage by intermodalism, regions that have a locational advantage for domestic orinternational trade, and regions left behind by intermodalism altogether.
18 H Lim, J-C Thill
Acknowledgements. The authors are grateful for the insightful advice received from Bruce Petersonand Frank Southworth, Oak Ridge National Laboratory, on the use of the CTA intermodal networkto elicit the structures of the national freight-transportation system as well as for comments on anearly draft of the manuscript.We have also benefited from fruitful discussions withWilliam R Blackon freight-distribution modeling. Thanks are also addressed to the referees, whose comments helpedus improve our research.
ReferencesBanister D, Berechman Y, 2001, ` Transport investment and the promotion of economic growth''
Journal of Transport Geography 9 209 ^ 218Berry B J L, Baker A M, 1968, ` Geographic sampling'', in Spatial Analysis: A Reader in Statistical
Geography Eds B J L Berry, D F Marble (Prentice-Hall, Englewood Cliffs, NJ) pp 91 ^ 100Beuthe M, Kreutzberger E, 2001, ` Consolidation and trans-shipment'', in Handbook of Logistics
and Supply-chain Management Eds A M Brewer, K J.Button, D A Hensher (Pergamon,Amsterdam) pp 239 ^ 252
Bruinsma F, Rietveld P, 1993, ` Urban agglomeration in European infrastructure networks''Urban Studies 30 919 ^ 934
Bruinsma F, Rietveld P, 1994, ` Borders as barriers in the European road network: a case studyon the accessibility of urban agglomerations'', in New Borders and Old Barriers in SpatialDevelopment Ed. P Nijkamp (Avebury, Brookfield,VT) pp 139 ^ 151
Bruinsma F, Rietveld P, 1998, ` The accessibility of European cities: theoretical framework andcomparison of approaches'' Environment and Planning A 30 499 ^ 521
Brunsdon C, Fotheringham A S, Charlton M E, 1996, ` Geographically weighted regression:a method for exploring spatial nonstationarity'' Geographical Analysis 28 281 ^ 298
CTRE, 2005 Statewide Transportation Planning Model and Methodology Development ProgramCenter for Transportation Research and Education, Iowa State University, Ames, IA,http://www.ctre.iastate.edu/Research/statmod/planning.htm
Dodgson J S, 1974, ` Motorway investment and sub-regional growth: the case of the M62''RegionalStudies 8 75 ^ 91
EC, 2001Transport in Figures: Statistical Pocket Book EU Transport, European Commission,Directorate General DG VII, Brussels
Fotheringham A S, Brunsdon C, Charlton M, 2002 GeographicallyWeighted Regression:The Analysis of Spatially Varying Relationships (JohnWiley, Chichester, Sussex)
Gordon I R, 1978, ` Distance deterrence and commodity values'' Environment and Planning A10 889 ^ 900
Gutierrez J, Urbano P,1996, `Accessibility in the EuropeanUnion: the impact of the trans-Europeanroad network'' Journal of Transport Geography 4 15 ^ 25
Gutierrez J, Gonzales R, Gomez G, 1996, ` The European high-speed train network'' Journal ofTransport Geography 4 227 ^ 238
Haining R, 1990 Spatial Data Analysis in the Social and Environmental Sciences (CambridgeUniversity Press, Cambridge)
Hanson S, Schwab M, 1987, `Accessibility and intraurban travel'' Environment and Planning A19 735 ^ 748
Helling A, 1998, ` Changing intra-metropolitan accessibility in the U.S.: evidence from Atlanta''Progress in Planning 49 55 ^ 108
Janelle D G, 1969, ` Spatial reorganization: a model and concept''Annals of the Association ofAmerican Geographers 59 348 ^ 364
Jourquin B, Beuthe M, 1996, ` Transportation policy analysis with a geographic informationsystem: the virtual network of freight transportation in Europe'' Transportation ResearchPart C 4 359 ^ 371
Koenig J G, 1980, ` Indicator of urban accessibility: theory and application'' Transportation 9145 ^ 172
Kwan M-P, 1998, ` Space ^ time and integral measures of individual accessibility: a comparativeanalysis using a point-based framework'' Geographical Analysis 30 191 ^ 216
Levinson D, 2003, ``Perspectives on efficiency in transportation'' International Journal of TransportManagement 1 145 ^ 155
Linneker B, Spence N A, 1991, `An accessibility analysis of the impact of the M25 London OrbitalMotorway on Britain''Regional Studies 26 31 ^ 47
Linneker B, Spence N A, 1992, `Accessibility measures compared in an analysis of the impact ofthe M25 London Orbital Motorway on Britain'' Environment and Planning A 24 1137 ^ 1154
Intermodal freight transportation and regional accessibility in the USA 19

O'Kelly M E, Horner M W, 2003, `Aggregate accessibility to population at the county level:U.S. 1940 ^ 2000'' Journal of Geographical Systems 5 5 ^ 23
Peterson B E, 2000 CFSMulti-modal Network Documentation Center for Transportation Analysis,Oak Ridge National Laboratory, Oak Ridge, TN
Priemus H, Konings R, 2001, ` Dynamics and spatial patterns of intermodal freight transportnetworks'', in Handbook of Logistics and Supply-chain Management Eds A M Brewer,K J Button, D A Hensher (Pergamon, Amsterdam) pp 481 ^ 499
Resor R, Blaze J R, 2004, ` Short-haul rail intermodal: can it compete with trucks?'' TransportationResearch Record number1873, 45 ^ 52
Rietveld P, 1997, ` Policy aspects of interconnectivity in networks'', in Networks in Transport andCommunication: A Policy Approach Eds C Capriani, PRietveld (Avebury, Aldershot, Hants)pp 177 ^ 192
Rietveld P, Bruinsma F, 1998 IsTransportation Infrastructure Effective? Transportation Infrastructureand Accessibility: Impacts on the Space Economy (Springer, Berlin)
Roson R, Soriani S, 2000, ` Intermodality and the changing role of nodes in transport networks''Transportation Planning and Technology 23 183 ^ 197
Slack B, 1990, ` Intermodal transportation in North America and the development of inlandload centers'' The Professional Geographer 42 72 ^ 83
SlackB, 2001,` Intermodal transportation'', inHandbookofLogistics andSupply-chainManagementEds A M Brewer, K.J Button, D A Hensher (Pergamon, Amsterdam) pp 141 ^ 154
Southworth F, Peterson B E, 2000, ` Intermodal and international freight network modeling''Transportation Research C 8 146 ^ 166
Southworth F, Xiong D, Middendorf D, 1997, ` Development of analytical intermodal freightnetworks for use within a GIS'', in Proceedings of the 1997 Geographic Information Systemsfor Transportation (GIS-T) Symposium American Association of State Highway andTransportation Officials Conference, pp 201 ^ 218
Spence N A, Linneker B, 1994, ` Evolution of the motorway network and changing levels ofaccessibility in Great Britain'' Journal of Transport Geography 2 247 ^ 264
Spiekermann K,Wegener M, 1994, ` The shrinking continent: new time ^ space maps in Europe''Environment and Planning B: Planning and Design 21 653 ^ 673
Thill J-C, Kim M, 2005, ` Trip making induced travel demand, and accessibility'' Journal ofGeographical Systems 7 229 ^ 248
Transport Canada, 1996, ` Intermodal freight'', inTransportation in Canada1996Transport Canada,Ottawa, http://www.tc.gc.ca/pol/en/report/anre1996/tc96 chapter 12.htm
Tsamboulas D A, Kapros S, 2000, ` Decision-making process in intermodal transportation''Transportation Research Record number 1707, 86 ^ 93
USDOT,1999 1997 Economic Census,Transportation, 1997Commodity Flow SurveyUSDepartmentof Transportation, Bureau of Transportation Statistics and US Department of Commerce,Census Bureau,Washington, DC
Vickerman R, 1998, `Accessibility, peripherality and spatial development: the question of choice'',in Accessibility, Trade and Locational Behaviour Ed. A Reggiani (Ashgate, Aldershot, Hants)pp 79 ^ 93
Vickerman R, Spiekermann K,Wegener M, 1999, `Accessibility and economic development inEurope''Regional Studies 33 1 ^ 15
ß 2008 Pion Ltd and its Licensors
20 H Lim, J-C Thill

This article is an advance online publication. It will not change in content under normalcircumstances but will be given full volume, issue, and page numbers in the final PDF version,which will be made available shortly before production of the printed version.
Conditions of use. This article may be downloaded from the E&P website for personal researchby members of subscribing organisations. This PDF may not be placed on any website (or otheronline distribution system) without permission of the publisher.
Related Documents