Intermodal energy transfer in a tapered optical fiber: optimizing transmission S. Ravets, 1,2 J. E. Hoffman, 1 P. R. Kordell, 1 J. D. Wong-Campos, 1 S. L. Rolston, 1 and L. A. Orozco 1, * 1 Joint Quantum Institute, Department of Physics, University of Maryland, and National Institute of Standards and Technology, College Park, Maryland 20742, USA 2 Laboratoire Charles Fabry, Institut d’Optique, CNRS, Univ Paris Sud, 2 avenue Augustin Fresnel, 91127 Palaiseau cedex, France *Corresponding author: [email protected] Received July 26, 2013; revised September 27, 2013; accepted September 30, 2013; posted October 3, 2013 (Doc. ID 194689); published October 25, 2013 We present an experimental and theoretical study of the energy transfer between modes during the tapering proc- ess of an optical nanofiber through spectrogram analysis. The results allow optimization of the tapering process, and we measure transmission in excess of 99.95% for the fundamental mode. We quantify the adiabaticity con- dition through calculations and place an upper bound on the amount of energy transferred to other modes at each step of the tapering, giving practical limits to the tapering angle. © 2013 Optical Society of America OCIS codes: (060.2310) Fiber optics; (060.2280) Fiber design and fabrication; (060.2270) Fiber characteri- zation; (060.2400) Fiber properties; (350.5500) Propagation; (030.4070) Modes. http://dx.doi.org/10.1364/JOSAA.30.002361 1. INTRODUCTION The study of mode coupling in an optical waveguide [ 1] is fun- damentally important for good control of connectorization and transmission. This is especially true for tapered optical fibers with subwavelength waists, where light propagates in a mode that exhibits a large evanescent component propagat- ing outside the waveguide. Nanofibers are ideal for probing nonlinear physics, atomic physics, and other sensing applica- tions [ 2– 5]. As the light propagates through the taper, it suc- cessively encounters regimes where the fiber is single mode, multimode, and then single mode again. Careful design of adiabatic tapers leads to ultralow loss fibers [ 6]. Adiabatic cri- teria give an upper limit on how steep a taper can be, but are too vague for optimization of transmission. Here we are inter- ested in giving quantitative bounds and constraints on the taper geometry. Using a spectrogram analysis of the transmission signal through the fiber [ 7], we are able to identify the modes excited during the tapering process and extract the amount of energy transferred to each of these modes. Using this analysis, we show the importance of geometry control and fiber cleanliness in reaching transmissions as high as 99.95% in commercial fibers at 780 nm. Our nanofibers can handle more than 400 mW of optical power in ultrahigh vacuum. After reaching the cut-off radius, the excited modes couple to radiative modes [ 8] and diffract outside of the fiber. Our analysis provides a path to fully model the electromag- netic field evolution in a nanofiber. This is crucial for a com- plete modeling of the coupling between light and matter [ 9, 10]. In the example of atoms trapped on the evanescent field around a nanofiber waist, it is necessary to know the coupling coefficients between the modes of the field and the atoms. This work details the modal evolution in the fiber, opening perspectives for the design of even more adiabatic fibers, making them usable in extreme conditions [ 11]. This paper presents our protocols, diagnostics, and characterization tools for fabricating nanofibers. It is struc- tured as follows: we first overview our experimental goals and conditions in Section 2. Section 3 presents the modal evolution in tapered fibers. We then study in Section 4 adia- baticity in tapered fibers. Section 5 analyzes in more detail the transmission signal. We introduce the spectrogram to an- alyze the transmission [ 7] in Section 6. By modeling and diag- nosing the fiber pull, we identify in Section 7 crucial elements to improve the transmission. Section 8 looks into the other losses present in the fiber. Section 9 is the conclusion of the paper. 2. MOTIVATION AND CONSTRUCTION OVERVIEW Controlling neutral atoms with dipole traps is a successful and promising avenue for the implementation of a growing number of scientific and technical applications [ 12]. The off- resonant interaction between light and atoms in the presence of an intensity gradient produces a dipole force that can gen- erate traps: detuning below atomic resonance attracts atoms to go to the most intense region, creating an optical tweezer [ 13, 14], and above-resonance detuning keeps the atom in the intensity minima, requiring more complicated geometries [ 15– 18]. One drawback of optical tweezers obtained by tightly focusing a laser beam comes from diffraction, which limits the trapping volume extension in the axial direction. One solution to this limitation is the use of optical nanofibers [ 4, 9, 19]. These devices offer enough light confinement and guidance to trap atoms over a few centimeters in the axial direction and present the advantage of being integrable to other devices [ 10, 20– 22]. We are interested in introducing this device into Ravets et al. Vol. 30, No. 11 / November 2013 / J. Opt. Soc. Am. A 2361 1084-7529/13/112361-11$15.00/0 © 2013 Optical Society of America

Welcome message from author
This document is posted to help you gain knowledge. Please leave a comment to let me know what you think about it! Share it to your friends and learn new things together.
Transcript
Intermodal energy transfer in a tapered optical fiber:optimizing transmission
S. Ravets,1,2 J. E. Hoffman,1 P. R. Kordell,1 J. D. Wong-Campos,1 S. L. Rolston,1 and L. A. Orozco1,*1Joint Quantum Institute, Department of Physics, University of Maryland, and National Institute of Standards and
Technology, College Park, Maryland 20742, USA2Laboratoire Charles Fabry, Institut d’Optique, CNRS, Univ Paris Sud, 2 avenue Augustin Fresnel,
91127 Palaiseau cedex, France*Corresponding author: [email protected]
Received July 26, 2013; revised September 27, 2013; accepted September 30, 2013;posted October 3, 2013 (Doc. ID 194689); published October 25, 2013
We present an experimental and theoretical study of the energy transfer between modes during the tapering proc-ess of an optical nanofiber through spectrogram analysis. The results allow optimization of the tapering process,and we measure transmission in excess of 99.95% for the fundamental mode. We quantify the adiabaticity con-dition through calculations and place an upper bound on the amount of energy transferred to other modes at eachstep of the tapering, giving practical limits to the tapering angle. © 2013 Optical Society of America
OCIS codes: (060.2310) Fiber optics; (060.2280) Fiber design and fabrication; (060.2270) Fiber characteri-zation; (060.2400) Fiber properties; (350.5500) Propagation; (030.4070) Modes.http://dx.doi.org/10.1364/JOSAA.30.002361
1. INTRODUCTIONThe study of mode coupling in an optical waveguide [1] is fun-damentally important for good control of connectorizationand transmission. This is especially true for tapered opticalfibers with subwavelength waists, where light propagates ina mode that exhibits a large evanescent component propagat-ing outside the waveguide. Nanofibers are ideal for probingnonlinear physics, atomic physics, and other sensing applica-tions [2–5]. As the light propagates through the taper, it suc-cessively encounters regimes where the fiber is single mode,multimode, and then single mode again. Careful design ofadiabatic tapers leads to ultralow loss fibers [6]. Adiabatic cri-teria give an upper limit on how steep a taper can be, but aretoo vague for optimization of transmission. Here we are inter-ested in giving quantitative bounds and constraints on thetaper geometry.
Using a spectrogram analysis of the transmission signalthrough the fiber [7], we are able to identify the modesexcited during the tapering process and extract the amountof energy transferred to each of these modes. Using thisanalysis, we show the importance of geometry controland fiber cleanliness in reaching transmissions as high as99.95% in commercial fibers at 780 nm. Our nanofiberscan handle more than 400 mW of optical power in ultrahighvacuum. After reaching the cut-off radius, the excited modescouple to radiative modes [8] and diffract outside ofthe fiber.
Our analysis provides a path to fully model the electromag-netic field evolution in a nanofiber. This is crucial for a com-plete modeling of the coupling between light and matter [9,10].In the example of atoms trapped on the evanescent fieldaround a nanofiber waist, it is necessary to know the couplingcoefficients between the modes of the field and the atoms.This work details the modal evolution in the fiber, opening
perspectives for the design of even more adiabatic fibers,making them usable in extreme conditions [11].
This paper presents our protocols, diagnostics, andcharacterization tools for fabricating nanofibers. It is struc-tured as follows: we first overview our experimental goalsand conditions in Section 2. Section 3 presents the modalevolution in tapered fibers. We then study in Section 4 adia-baticity in tapered fibers. Section 5 analyzes in more detailthe transmission signal. We introduce the spectrogram to an-alyze the transmission [7] in Section 6. By modeling and diag-nosing the fiber pull, we identify in Section 7 crucial elementsto improve the transmission. Section 8 looks into the otherlosses present in the fiber. Section 9 is the conclusion ofthe paper.
2. MOTIVATION AND CONSTRUCTIONOVERVIEWControlling neutral atoms with dipole traps is a successful andpromising avenue for the implementation of a growingnumber of scientific and technical applications [12]. The off-resonant interaction between light and atoms in the presenceof an intensity gradient produces a dipole force that can gen-erate traps: detuning below atomic resonance attracts atomsto go to the most intense region, creating an optical tweezer[13,14], and above-resonance detuning keeps the atom in theintensity minima, requiring more complicated geometries[15–18]. One drawback of optical tweezers obtained by tightlyfocusing a laser beam comes from diffraction, which limits thetrapping volume extension in the axial direction. One solutionto this limitation is the use of optical nanofibers [4,9,19]. Thesedevices offer enough light confinement and guidance to trapatoms over a few centimeters in the axial direction andpresent the advantage of being integrable to other devices[10,20–22]. We are interested in introducing this device into
Ravets et al. Vol. 30, No. 11 / November 2013 / J. Opt. Soc. Am. A 2361
1084-7529/13/112361-11$15.00/0 © 2013 Optical Society of America

a 12 mK cryogenic environment to probe interactionsbetween a trapped neutral atom and a superconductingcircuit [11].
Following the work of Warken in [23], we produce our fi-bers using a heat-and-pull technique, summarized below (seeRef. [24] for details on the algorithm and the hardware). Anoxyhydrogen flame at stoichiometric combination brings a0.75 mm long fiber portion to a temperature that exceedsits softening point. Two high-precision computer controlledmotors pull on the fiber ends at a typical velocity of0.1 mm∕s. We use an algorithm that relies on conservationof volume, which calculates the trajectories of the motorsto produce a fiber of chosen geometry. The code is availableat the DRUM Digital Repository of the University ofMaryland [25].
We pull a SM800 fiber from Fibercore that has a numericalaperture of 0.12 and a cutoff wavelength of 794 nm. Usingthe Sellmeier coefficients provided by Fibercore, we deter-mine the core (ncore 1.45861) and the cladding (nclad 1.45367) indices of refraction. The pull is divided into approx-imately 100 steps, such that the taper is composed of aseries of sections small enough to be considered linear.Our tapers are generally composed of a section with a con-stant few mrad taper angle that reduces the fiber to a radiusof 6 μm, and then connects to an exponential section that gen-tly reaches submicrometer radii (on the order of 250 nm). Thecentral waist is uniform, and its length can be between 5 mmand 10 cm. A pull generally lasts for a few hundreds ofseconds.
3. MODAL EVOLUTIONA. Modes in a Cylindrical WaveguideThe description of modes in a cylindrical waveguide usingMaxwell equations can be found in several references, e.g.,[8,26]. The modal fields vary as expiβlmz − ωt, where βlmis the propagation constant of the mode of symmetry and or-der l;m. The propagation of light inside a two-layered stepindex fiber depends on the V parameter of the fiber,
V 2πλa
n21 − n2
2
q; (1)
where a is the core radius, n1 is the core index of refraction,n2 is the surrounding medium index of refraction, and λ is thefree space wavelength. The relation between βlm and the Vparameter is called the dispersion relation of mode l;m.In our tapers, we can approximate the fiber as a two-layer stepindex cylindrical waveguide in two regions: at the beginningof the taper, the light is confined to the core and guidedthrough the core-to-cladding interface. We assume that thecore and the cladding radii decrease at the same rate alongthe taper, which implies that there is no diffusion of the coreinto the cladding during the tapering process. In the waist,what was initially the core in the center of the fiber is nownegligible (acore ≈ 10 nm ≪ λ). The light is then guidedthrough the cladding-to-air interface.
B. Three-Layer FiberSince we continuously decrease the fiber radius during thepull, the fundamental mode leaks from the core to the clad-ding. In that region, the presence of the core, the cladding,
and the air influence the mode (see Fig. 1). A proper treatmenthas to take into account all of those interfaces. We model ourfibers by a three-layered structure, and we calculate thedispersion relations for a series of modes using the fully vec-torial finite difference mode solver from commercial softwareFIMMWAVE [27]. Figure 2 shows a plot of neff β∕k0 as afunction of the radius of the SM800 fiber described inSection 2.
We are interested in modes that are initially launched intothe core, thus guided by the core-to-cladding interface. Coremodes have most of their energy contained in the core, andtheir effective indices of refraction satisfy nclad < neff < ncore.Figure 2 shows that the HE11 mode effective index is initiallygreater than nclad 1.45367 (green curve indicated by an ar-row). Some higher-order modes from the LP11 family may beaccepted in the core, close to their cutoff condition. (The fibercutoff wavelength is 792 nm > 780.24 nm, so strictly speak-ing, we are not working in the fiber single-mode regime.) Ex-perimentally, we filter higher-order modes that have beenlaunched or excited with a 1.27 cm diameter mandrel, effec-tively placing us into the single-mode regime.
When the fiber radius decreases, nHE11eff approaches nclad.
Since we model the fiber by a three-slab cylindrical wave-guide, the cladding area is finite: the core becomes toosmall to support the fundamental mode around the pointwhere nHE11
eff reaches nclad (R 19.43 μm in Fig. 2). The modeprogressively leaks into the cladding to be guided by the clad-ding-to-air interface. The characteristic length-scale of thewaveguide is R ≫ λ, and many modes can be guided by the
z00
z(L) w(L)
L
Core-claddingguidance
Taper Waist: Cladding-air
guidance
L
0
0.19
15
60
0
1
Normalized position
Fiber radius (µm)
Nor
mal
ized
pow
er
(a)
(b)
R
Fig. 1. (a) Schematic of the stretched fiber. At a given time, the fiberis composed of two tapers and a uniform waist of radius r and lengthw. The total stretch is equal to L. (b) Calculated intensity profile of themode for a radius of fiber equal to 60 μm, 15 μm, and 190 nm. Note thatthe position axes are not quantitative, and have been scaled to makethe plots visible. The profiles are normalized to their maximum power.
2362 J. Opt. Soc. Am. A / Vol. 30, No. 11 / November 2013 Ravets et al.

cladding-to-air interface (nair < neff < nclad), together with thefundamental mode. As long as R ≫ λ, the air has little influ-ence on the effective index of many of the accepted modes(neff ≈ nclad for all the modes shown in Fig. 2). The indicesare so close to each other that the modes interact and ex-change energy easily. For that reason, this is the critical regionof the taper, where the adiabaticity condition is the most strin-gent. By symmetry, for a fully cylindrical fiber, intermodal en-ergy transfer will only happen between modes of the samefamily (one color in Fig. 2). Energy transfers between modesfrom different families are a consequence of the presence ofasymmetries.
Further decreasing R, we observe that the modes’ effectiveindices approach nair 1. The dispersion curves separate,and adiabaticity can again be easily achieved. When the indexof refraction of a mode reaches nair, the mode is not guided bythe fiber anymore and radiates into the air. This radius, spe-cific to each mode, is called its cutoff. The highly excitedmodes leave the fiber first, and the number of modes allowedin the waveguide decreases progressively [see Fig. 2(c)].Under 0.3 μm, the only mode that can propagate is theHE11 mode, whose index asymptotically approaches 1. Thefiber is once again single mode.
4. ADIABATICITY IN FIBERSAchieving high transmission in nanofibers requires precisecontrol of the taper geometry, where the mode adiabaticallyescapes from the core to the cladding before coupling back tothe core [8,28]. High transmission through tapered nanofibersis indicative of their quality [6,29].
A. Adiabaticity CriterionThe mode conversion in a taper is strongly related to the tapergeometry. If a taper is too short (taper angle too steep), themode evolution is nonadiabatic, and we observe losses.Inversely, as the taper is lengthened, the mode conversionis more adiabatic. In the limit of a very shallow angle, we in-tuitively understand that the transmission can reach 100%,since all the energy remains in the fundamental mode through-out the evolution. Following this idea, an adiabaticity criterionhas been derived [8] relating the characteristic taper length, zt,to the characteristic beating length between two modes, zb.
zt is the length associated with the tapering angle Ω at ra-dius R, defined by
zt R
tanΩ : (2)
zb is the beat length between two modes (the spatial fre-quency of the beating)
zb 2π
β1 − β2 λ
neff;1 − neff;2; (3)
where β1 is the fundamental mode propagation constant atradius R and β2 is the propagation constant at radius R ofthe first excited mode with the same symmetry as the funda-mental mode (EH11). Equation (3) relates the beat length tothe inverse of the distance between two curves in Fig. 2. Modeconversion in a taper is adiabatic when the fiber is longenough: zt ≫ zb [8]. If the two modes are close, zb is large,making the adiabaticity condition more difficult to satisfy.The choice of EH11 gives the most stringent condition onthe fiber length, as it produces the shortest beat lengthbetween the fundamental mode and any mode with sym-metry l 1. Nevertheless, this condition remains too vaguewhen one wants to optimize the taper geometry for a giventransmission.
Using the dispersion relations from FIMMPROP, we cansolve the equation zt zb, when the beat length equals thetaper length. The blue curve in Fig. 3 separates the plane into
1030
50
0
nclad
ncore
1.0
01
2
01234561.0
1.2
1.4
R (µm)l order
n eff
123456
0 0.2 0.4 0.6 0.8 11.0
1.2
1.4
R (µm)
n eff
n eff
(b)
(a)
(c)
HE11
HE11
Fig. 2. Dispersion relations for various modes TE0m, TM0m, HElm,and EHlm (l 1 to 5) as a function of radius calculated for athree-layer model using FIMMPROP. Here, nair nvacuum 1. Weshow the first few modes of each family. (a) and (b) Three-dimensional representation of the dispersions for different modefamilies. (c) Projection for the smaller values of R.
0 10 20 30 40 50 60
10
100
Fiber radius (µm)
Tap
er a
ngle
(m
rad)
50
Non-adiabatic
Adiabatic
Fig. 3. Upper boundary for the taper angle Ω as a function of theradius of the fiber set by zb zt. Note the logarithmic scale forthe vertical axis. The core-to-cladding diameter ratio for this fiberis 2.535/62.55 and is fixed for the entirety of the pull. ncore 1.45861 and nclad 1.45367.
Ravets et al. Vol. 30, No. 11 / November 2013 / J. Opt. Soc. Am. A 2363
two regions: in order to be adiabatic, taper angles need to bemuch smaller than the ones indicated on the curve. Above thecurve, the angles correspond to nonadiabatic tapers.
Figure 3 gives an upper limit on the taper angle at a spe-cific radius using the condition zb zt from Eqs. (2) and(3). It does not provide any quantitative information onthe intermodal energy transfer for a given taper: calculationsin Section 4.D show that the angles in Fig. 3 lead to largeenergy transfers. We are interested in producing fibers withhigh transmissions, greater than 99.90%, and we need tofind the optimal geometry necessary to reach a specifictransmission.
B. Transmission of a Tapered Fiber SectionWe perform numerical simulations with FIMMPROP to ex-plore the parameter space and find the optimal adiabatic pro-file for a given transmission. The fiber tapers from 62.55 μmradius down to 250 nm radius. Using the indices of refractionfor our SM800 fiber (see Section 2), we divide the taper into adiscrete series of linear sections (32 sections in this work). Atthe end of each section we project the output field into thefirst family of modes (here we use the 15 first modes of family1) to obtain specific amplitude and phase information in termsof the excited modes. The S matrix, relating input and output,contains all the mode phases and amplitudes necessary to re-late the input and output fields of that particular section.
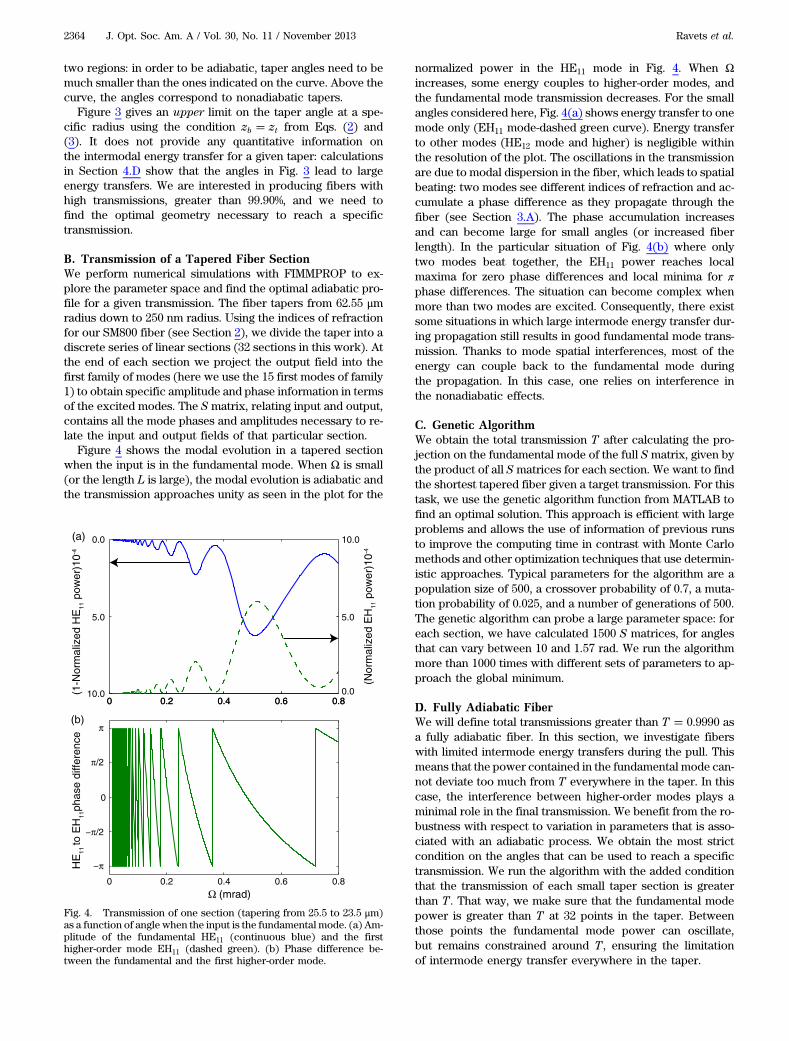
Figure 4 shows the modal evolution in a tapered sectionwhen the input is in the fundamental mode. When Ω is small(or the length L is large), the modal evolution is adiabatic andthe transmission approaches unity as seen in the plot for the
normalized power in the HE11 mode in Fig. 4. When Ωincreases, some energy couples to higher-order modes, andthe fundamental mode transmission decreases. For the smallangles considered here, Fig. 4(a) shows energy transfer to onemode only (EH11 mode-dashed green curve). Energy transferto other modes (HE12 mode and higher) is negligible withinthe resolution of the plot. The oscillations in the transmissionare due to modal dispersion in the fiber, which leads to spatialbeating: two modes see different indices of refraction and ac-cumulate a phase difference as they propagate through thefiber (see Section 3.A). The phase accumulation increasesand can become large for small angles (or increased fiberlength). In the particular situation of Fig. 4(b) where onlytwo modes beat together, the EH11 power reaches localmaxima for zero phase differences and local minima for πphase differences. The situation can become complex whenmore than two modes are excited. Consequently, there existsome situations in which large intermode energy transfer dur-ing propagation still results in good fundamental mode trans-mission. Thanks to mode spatial interferences, most of theenergy can couple back to the fundamental mode duringthe propagation. In this case, one relies on interference inthe nonadiabatic effects.
C. Genetic AlgorithmWe obtain the total transmission T after calculating the pro-jection on the fundamental mode of the full S matrix, given bythe product of all S matrices for each section. We want to findthe shortest tapered fiber given a target transmission. For thistask, we use the genetic algorithm function from MATLAB tofind an optimal solution. This approach is efficient with largeproblems and allows the use of information of previous runsto improve the computing time in contrast with Monte Carlomethods and other optimization techniques that use determin-istic approaches. Typical parameters for the algorithm are apopulation size of 500, a crossover probability of 0.7, a muta-tion probability of 0.025, and a number of generations of 500.The genetic algorithm can probe a large parameter space: foreach section, we have calculated 1500 S matrices, for anglesthat can vary between 10 and 1.57 rad. We run the algorithmmore than 1000 times with different sets of parameters to ap-proach the global minimum.
D. Fully Adiabatic FiberWe will define total transmissions greater than T 0.9990 asa fully adiabatic fiber. In this section, we investigate fiberswith limited intermode energy transfers during the pull. Thismeans that the power contained in the fundamental mode can-not deviate too much from T everywhere in the taper. In thiscase, the interference between higher-order modes plays aminimal role in the final transmission. We benefit from the ro-bustness with respect to variation in parameters that is asso-ciated with an adiabatic process. We obtain the most strictcondition on the angles that can be used to reach a specifictransmission. We run the algorithm with the added conditionthat the transmission of each small taper section is greaterthan T . That way, we make sure that the fundamental modepower is greater than T at 32 points in the taper. Betweenthose points the fundamental mode power can oscillate,but remains constrained around T , ensuring the limitationof intermode energy transfer everywhere in the taper.
0 0.2 0.4 0.6 0.810.0
5.0
0.0
(1-N
orm
aliz
ed H
E11
pow
er)1
0-4
0 0.2 0.4 0.6 0.80.0
5.0
10.0
0 0.2 0.4 0.6 0.8
−π
−π/2
0
π/2
π
Ω (mrad)
HE
11 to
EH
11ph
ase
diffe
renc
e
(b)
(a)
(Nor
mal
ized
EH
11 p
ower
)10-4
Fig. 4. Transmission of one section (tapering from 25.5 to 23.5 μm)as a function of angle when the input is the fundamental mode. (a) Am-plitude of the fundamental HE11 (continuous blue) and the firsthigher-order mode EH11 (dashed green). (b) Phase difference be-tween the fundamental and the first higher-order mode.
2364 J. Opt. Soc. Am. A / Vol. 30, No. 11 / November 2013 Ravets et al.

Figure 5 shows results from the genetic algorithm for opti-mized adiabatic fiber tapers using target transmissions of99.90% and 99.99%. We plot the taper angle as a function ofthe fiber radius as in Fig. 3. We observe similar behavior: largetaper angles are allowed for large fiber radii, and then reach aminimum around the transition region at 20 μm, before in-creasing again at smaller radii. For T 0.9999, the optimaltaper in Fig. 5 (red-dashed curve) shows angles as low as0.4 mrad, 30 times smaller than the zb zt criteria. The resultsin Fig. 5 give precise bounds on adiabaticity, with minimumpower transmitted to higher-order modes. This last point en-sures that this algorithm is insensitive to phase effects: thefinal transmission is not a consequence of constructive inter-ference between several modes and will be independent ofperturbation to the fiber geometry.
Figure 6 shows the optimized taper profiles correspondingto T 0.9990 (blue continuous line) and T 0.9999 (red-dashed line). Strikingly, for T 0.9999 the optimized adia-batic taper is only 4.5 cm long, on the order of typicalnonadiabatic taper lengths produced with a heat-and-pullmethod [24] (the 2 mrad taper presented Section 5 is≈6 cm long and still presents nonadiabaticities). Note, how-ever, that in Fig. 6, Ω varies continuously as a function of
z, and can be large at the beginning of the pull. Experimen-tally, we show below (see Section 7) that abrupt variationsof Ω during the pull can induce detrimental asymmetries inthe taper. With our apparatus, we have precise control ofthe taper geometry for linear and exponential profiles [24].Reaching adiabaticity that way would require a linear taperangle Ω ≈ 0.5 mrad, and a substantially increased length.One could chose to use smaller clad fibers [30] or to chemi-cally pre-etch fibers, allowing shorter adiabatic tapers withimproved handling.
E. Utilizing NonadiabaticityLimiting intermodal energy transfer in a taper to arbitrarilysmall values is possible, but can be impractical due to largetaper lengths. An alternative approach consists of allowinglarge energy transfers, yet reaching high transmissions bycareful design and phase control in the fiber. Section 3.Ashows that different modes interfere together as they propa-gate in the taper. Taking advantage of this spatial beating, wecan design fibers with particular phase combinations that al-low high transmission, despite the presence of nonadiabatic-ities. In this section, we run the genetic algorithm with only acondition on the final transmission (T ≥ 0.9999): intermodalenergy transfer in each section is no longer limited. Usingthis nonadiabaticity, it is possible to produce short high-transmission tapers.
We calculate the shortest fiber length that has 99.99% totaltransmission in the fundamental mode using the genetic algo-rithm. Figure 7(a) shows that the taper angles allowed hereare much larger than the ones presented above in the adia-batic case (Fig. 5). At large fiber radii, the taper angle reaches≈100 mrad. Closer to the transition region, the minimal taperangle can still be as large as 2 mrad. From the taper anglesused here, we know that the fundamental mode is not
0.93
0.94
0.95
0.96
0.97
0.98
0.99
EH
11re
wop dezil amr on edo
m
0 1 2 3 40
10
20
30
40
50
60
z axis (mm)
Fib
er r
adiu
s (µ
m)
0 20 40 601
10
100
Fiber radius (µm)
Tap
er a
ngle
(m
rad)
(a)
(c)
(b)
1.00
0204060 50 30 10
Fiber radius (µm)
Fig. 7. Study of fiber profile for 99.99% transmission with optimizedlength given by the genetic algorithm. (a) Taper angles and fiberradius, squares with the continuous line to guide the eye. (b) Fiberradius and fiber length with a final length of 3.7 mm using the resultsin (a). (c) Fundamental mode transmission as a function of fiberradius for the optimized adiabatic fiber (red-dashed line) and theoptimized nonadiabatic fiber (green continuous line).
0 10 20 30 40 50 60
1.0
10
Fiber radius (µm)
Tap
er a
ngle
(m
rad)
0.5
5.0
Fig. 5. Optimal adiabatic tapers calculated with the genetic algo-rithm for T 99.90% (blue crosses and continuous line) and T 99.99% (red-dotted and -dashed line), where the intermode energytransfers are limited. Each marker corresponds to the optimum anglefor a section. The lines are guides for the eye.
0 1 2 3 4 5
10
20
30
40
50
60
z (cm)
Fib
er r
adiu
s (µ
m)
0
Fig. 6. Optimal taper profiles for T 99.90% (continuous blue line)and T 99.99% (dashed red line). The profiles are only based on thedots from Fig. 5 and not on the continuous lines. Note that the hori-zontal axis scale is in centimeters, whereas the vertical axis scale is inmicrometers.
Ravets et al. Vol. 30, No. 11 / November 2013 / J. Opt. Soc. Am. A 2365

propagating adiabatically in this taper. Figure 7(b) shows thecorresponding profile. Figure 7(c) shows a 99.99% transmis-sion (green continuous line) fiber with a 3.7 mm length, a fac-tor of 12 shorter than in the adiabatic case (red-dashed line)calculated using FIMMPROP. This greatly reduces the lengthrequirements for high-transmission fibers, which is particu-larly relevant for our application.
Using FIMMPROP, we model the tapered structures pre-sented in Figs. 6 and 7 by putting together a succession of32 linear tapered sections obtained with the genetic algorithm.The input is set to 100% in the HE11 fundamental mode,and the simulation includes 15 modes of family l 1. We cal-culate the modal evolution (phases and amplitudes) along thetaper. In the adiabatic optimized case [red-dashed curveFig. 7(b)], we confirm that the power contained in the funda-mental mode is close to 99.99% throughout the taper. Higher-order mode excitations are negligible, and the evolution isadiabatic. Using nonadiabaticity [green curve Fig. 7(b)], weobserve large energy transfer to higher-order modes. AroundR 23 μm, more than 7% of the energy has been transferredto higher-order modes. However, using this particular geom-etry, the resulting phase combinations lead to high transmis-sion in the fundamental mode.
Nonadiabaticity can lead to high transmission with shortertapers, which is particularly useful for taper design. In the restof the paper, we experimentally study fibers that exhibit thisbehavior. Exploiting nonadiabaticity requires particular atten-tion because of their sensitivity to mode phases: deviationsfrom the calculated profile might lead to situations in whichmode interference causes large losses, with less energy end-ing in the fundamental mode than initially expected. Oneneeds to reproduce the calculated geometry as accuratelyas possible. As discussed above, producing the taper in Fig. 7with a continuously varying angle is not the best option for us,due to the presence of large angles and possible experimentalasymmetries. Moreover, this particular taper length (3.7 mm)is too small in comparison to the heating-zone size (0.75 mm inour experiment) to accurately produce such a profile. Our typ-ical profiles start with a linear section (Ω of a few mrad) downto 6 μm radius, followed by an exponential section down to250 nm radius. We calculate with FIMMPROP the HE11 modeevolution through such a taper (Ω 2 mrad) and showthat it benefits from nonadiabatic effects, leading to hightransmission.
We start by investigating geometries we can produce withgood accuracy using our fiber puller. Figure 8 shows the trans-mission of the first fewmodes of family l 1 through a 2 mradtaper. We create a taper with FIMMPROP that reproduces theexperimental profile, which has been validated with micros-copy measurements [24]. Initially, all the power is containedin the fundamental mode. Around R 23 μm, ≈0.4% of theenergy is transferred to higher-order modes because of non-adiabaticities (up to HE13, the fifth mode of family l 1). Thisillustrates that non-negligible higher-order mode excitationscan be observed below the zb zt limit (the taper angle Ω 2 mrad is at least a factor of five below the zb zt limit every-where in the taper). Those modes beat together, and by theend of the taper, 99.97% of the energy is transmitted throughthe fundamental mode. For different taper angles, we observethat our typical tapers benefit from nonadiabaticity (seeSection 5). If there is still room for optimization, the simplicity
of the linear geometry makes it the ideal candidate for ourapplication.
5. ANALYSIS OF THE TRANSMISSIONSIGNALWe evaluate the quality of a pull by monitoring the transmis-sion of a few milliwatts from a 780.24 nm laser through thefiber during the process. We normalize the signal to removefluctuations of the laser intensity. Figure 9(a) shows a typicaltransmission as a function of time for a successful 2 mradpull. The transmission and normalization fiber outputs areconnected to two Thorlabs DET10A photodetectors, whichdeliver a signal to a SR570 low-noise differential preamplifierfrom Stanford Research Systems. A Tektronix DPO7054 dig-ital oscilloscope set on high-resolution mode and sample rateof 10–20 ksample/s records the data. The fiber is thinned dur-ing the pull, and as its radius decreases, we observe differentnotable features in the transmission signal. Figure 9(b) showsthe relation between time and radius for the particular pull ofFig. 9(a) calculated using the algorithm for fiber pulling thatwas validated in [24], with a deviation from the experimentalmeasurements lower than 8% at all diameters.
A. Single-Mode SectionThe fiber is initially close to being single mode (V ≈ 2.45) atthe light wavelength we use to measure the transmission. Wecarefully launch the fundamental mode with a 1.27 cm radiusof curvature mandrel wrap, to filter higher-order modes fromthe initial launch. During the first 100 s (down to 25 μm ra-dius), we observe a constant transmission. A 2 mrad taperis completely adiabatic in this region (see Fig. 3). The funda-mental mode is confined to the core and does not interact withany other mode.
B. From Single Mode to MultimodeAs the fiber radius decreases, the fundamental mode effectiveindex approaches the cladding index of refraction (see Fig. 2).The fiber core becomes too small to support the fundamentalmode, which progressively leaks into the cladding to becomeguided by the cladding-to-air interface. The point at which the
0102030405060
0.996
0.997
0.998
0.999
1.000
Fiber radius
HE
11 n
orm
aliz
ed p
ower
01020304050600
0.001
0.002
0.003
0.004
0.005
HE11
EH11
HE12
EH12
HE13
Higher-order m
odes power
Fig. 8. Mode evolution for a 2 mrad linear fiber down to 250 nm ra-dius. During the propagation through the taper, some energy is trans-ferred from the fundamental HE11 (blue thin continuous line) to fourhigher-order modes EH11 (green long-dashed line), EH12 (light blue-dotted line), HE12 (red-dashed–dotted line), and EH13 (purple thickcontinuous line). The final transmission through one taper is 99.97%on the HE11 fundamental mode.
2366 J. Opt. Soc. Am. A / Vol. 30, No. 11 / November 2013 Ravets et al.

fundamental mode leaks into the cladding is nHE11eff nclad, at
R 19.43 μm. At that point, the waveguide is so large in com-parison to the wavelength of the light that the fiber is multi-mode (V ≈ 170). The dispersion relation curves of all themodes are close to each other [see Fig. 2(a)], and the modescan easily interact. Figure 5 shows that the tapering angle hasto be smaller than 0.3 mrad in order to be adiabatic in thatregion. The transmission signal therefore shows mode beating(see Fig. 10).
Energy transfer to higher-order modes occurs during thetransition from core to cladding because of this nonadiabatic-ity. For a cylindrically symmetric fiber, such a transfer of en-ergy is only possible from the fundamental mode to othermodes of order l 1 (by symmetry). Once they have been ex-cited in the fiber, those modes coexist and propagate togetherwith different propagation constants, given by the dispersionrelation curves (green curves in Fig. 2). The optical pathlength inside the fiber is
Ln Zfiber
nneffzdz: (4)
Equation (4) shows that different modes accumulate aphase difference. The modulation observed in the transmis-sion signal around radius 20 μm is a signature of the presenceof higher-order modes beating together.
The beating signal is related to the relative phases whenlight couples back into the fiber core as R increases in the
second taper. When R reaches 19.43 μm in the second taper,energy couples back into the core. Although the two tapersare identical, the presence of beating between modes breaksthe symmetry (see Fig. 11). Depending on the fiber length, thephase accumulation between modes leads to a different fielddistribution entering the core at 19.43 μm. The fraction of en-ergy that can couple back into the core depends on the fielddistribution at this point. If the modes travel through an inte-ger number of beat lengths, the field distribution returns to itsinitial input. The reciprocity theorem implies that all the en-ergy couples back into the core. If the modes experience a
(a)
(b)
Fig. 11. Schematic of the modal evolution in the transition region. Allthe power is initially contained in the fundamental mode (blue pro-file). When the core of the fiber becomes too small compared tothe wavelength, the light escapes into the cladding (green arrows)and some higher-order modes can be excited (red profile). The radiusof the waist is equal to 20 μm, so that the excited modes do not ex-perience any cutoff as they propagate through the waveguide. (a) Thelength of the fiber is an integer number of beating lengths. (b) Lengthof the fiber, not an integer of beating lengths. The mode profiles werecalculated with FIMMPROP.
0 100 200 300 4000.980
0.985
0.990
0.995
1.00
Nor
mal
ized
Tra
nsm
issi
on
0 100 200 300 4000
10
20
30
40
50
60
Time (s)
Wai
st R
adiu
s (µ
m)
(a)
(b)
Fig. 9. (a) Transmission through a 2 mrad fiber as a function of timeduring the manufacturing process. (b) Evolution of the waist radiusduring the pull, calculated from the algorithm described in [24]. Thefinal radius is 250 nm.
350 360 370 380 390 400 4100.982
0.984
0.986
0.988
0.99
0.992
0.994
0.996
0.998
1
Time (s)
Nor
mal
ized
Tra
nsm
issi
on
26 24 22 20 18 16 14 12 10Radius (µm)
Fig. 10. Zoom of the transmission of the 2 mrad pull shown in Fig. 9,when the radius of the waist is near 20 μm. We see oscillations in thetransmission signal, due to the beating between the fundamentalmode and higher-order modes excited at a radius of 20 μm. Thetop vertical scale is the fiber radius at the waist.
Ravets et al. Vol. 30, No. 11 / November 2013 / J. Opt. Soc. Am. A 2367
noninteger number of beat lengths, the field distribution isdifferent from what it was initially and only a fraction of en-ergy can couple back into the core: the rest of the energy cou-ples to cladding modes. The cladding light is not detectedsince we filter the higher-order modes placing a mandrel wrapin front of the detector. At the fiber output, we therefore onlyobserve on the detector the light that coupled back into thefiber core.
C. Single Mode AgainAs we continue to thin the fiber, the modes’ effective indicesapproach the air index of refraction. When R (equivalently, theV parameter) becomes small enough, the excited modes cutoff and couple to radiation modes in air. Meanwhile, the fun-damental mode’s effective index asymptotically approachesnair without reaching a cutoff. A small enough fiber can con-sequently be single mode again after all the higher-ordermodes cutoff. For the SM800 fiber, the single-mode cutoff oc-curs at 300 nm radius. After this cutoff, we do not see any beat-ing anymore, and the transmission is steady again: wemeasure a transmission of 99.950(23)%, where the dispersionof the distribution is 5.8 × 10⁻³ and the dispersion on the meanis 1.2 × 10⁻⁵. Possible systematic effects related to fiber clean-liness and the detectors’ and amplifiers’ long-term stabilityprevent us from giving a better bound than 0.023% to the mea-sured uncertainty in the transmission, but T is close to unity,both in the measurement and in the simulation. Note that thesimulation Section 4.E looks at the propagation through a sin-gle taper. In the present case, light goes through two tapers,explaining why the measured transmission is slightly smallerthan the simulated one.
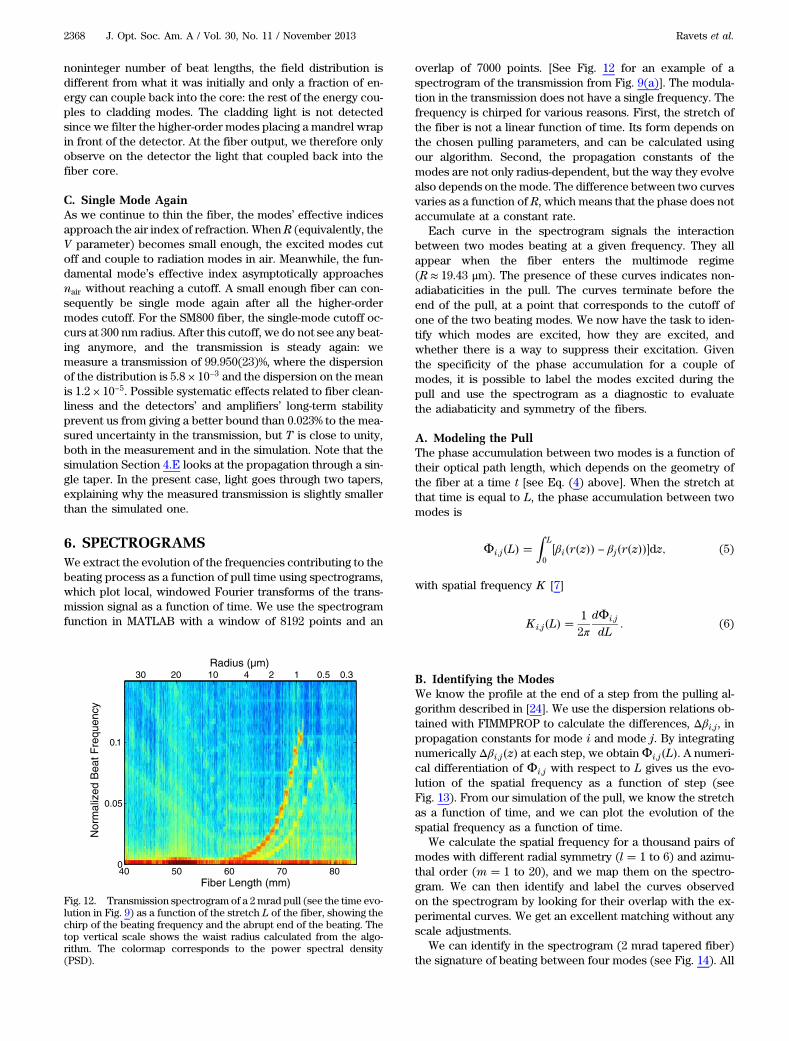
6. SPECTROGRAMSWe extract the evolution of the frequencies contributing to thebeating process as a function of pull time using spectrograms,which plot local, windowed Fourier transforms of the trans-mission signal as a function of time. We use the spectrogramfunction in MATLAB with a window of 8192 points and an
overlap of 7000 points. [See Fig. 12 for an example of aspectrogram of the transmission from Fig. 9(a)]. The modula-tion in the transmission does not have a single frequency. Thefrequency is chirped for various reasons. First, the stretch ofthe fiber is not a linear function of time. Its form depends onthe chosen pulling parameters, and can be calculated usingour algorithm. Second, the propagation constants of themodes are not only radius-dependent, but the way they evolvealso depends on the mode. The difference between two curvesvaries as a function of R, which means that the phase does notaccumulate at a constant rate.
Each curve in the spectrogram signals the interactionbetween two modes beating at a given frequency. They allappear when the fiber enters the multimode regime(R ≈ 19.43 μm). The presence of these curves indicates non-adiabaticities in the pull. The curves terminate before theend of the pull, at a point that corresponds to the cutoff ofone of the two beating modes. We now have the task to iden-tify which modes are excited, how they are excited, andwhether there is a way to suppress their excitation. Giventhe specificity of the phase accumulation for a couple ofmodes, it is possible to label the modes excited during thepull and use the spectrogram as a diagnostic to evaluatethe adiabaticity and symmetry of the fibers.
A. Modeling the PullThe phase accumulation between two modes is a function oftheir optical path length, which depends on the geometry ofthe fiber at a time t [see Eq. (4) above]. When the stretch atthat time is equal to L, the phase accumulation between twomodes is
Φi;jL Z
L
0βirz − βjrzdz; (5)
with spatial frequency K [7]
Ki;jL 12π
dΦi;j
dL: (6)
B. Identifying the ModesWe know the profile at the end of a step from the pulling al-gorithm described in [24]. We use the dispersion relations ob-tained with FIMMPROP to calculate the differences, Δβi;j , inpropagation constants for mode i and mode j. By integratingnumerically Δβi;jz at each step, we obtainΦi;jL. A numeri-cal differentiation of Φi;j with respect to L gives us the evo-lution of the spatial frequency as a function of step (seeFig. 13). From our simulation of the pull, we know the stretchas a function of time, and we can plot the evolution of thespatial frequency as a function of time.
We calculate the spatial frequency for a thousand pairs ofmodes with different radial symmetry (l 1 to 6) and azimu-thal order (m 1 to 20), and we map them on the spectro-gram. We can then identify and label the curves observedon the spectrogram by looking for their overlap with the ex-perimental curves. We get an excellent matching without anyscale adjustments.
We can identify in the spectrogram (2 mrad tapered fiber)the signature of beating between four modes (see Fig. 14). All
Fiber Length (mm)
Nor
mal
ized
Bea
t Fre
quen
cy
40 50 60 70 800
0.05
0.1
30 20 10 4 2 1 0.5 0.3Radius (µm)
Fig. 12. Transmission spectrogram of a 2mrad pull (see the time evo-lution in Fig. 9) as a function of the stretch L of the fiber, showing thechirp of the beating frequency and the abrupt end of the beating. Thetop vertical scale shows the waist radius calculated from the algo-rithm. The colormap corresponds to the power spectral density(PSD).
2368 J. Opt. Soc. Am. A / Vol. 30, No. 11 / November 2013 Ravets et al.

those modes have the symmetry l 1 (see Fig. 2) as expectedfor a cylindrically symmetric fiber. We observe higher-ordermode excitation up to the fifth mode of family l 1, whichis consistent with the simulations (Section 4.E). The totalHE11 transmission is 0.9995, meaning that 0.05% of the energyhas been transferred to the other modes. We suppose herethat all the losses come from the transfer of power to othermodes. This power is radiated in air when those modes reachcutoff. The contribution of other losses such as Rayleigh scat-tering is expected to be much smaller. The power spectraldensity (PSD), which defines the colormap in a spectrogram,gives a representation of how the remaining power is distrib-uted between the higher-order modes as a function of time. Byplotting the PSD at different times, we evaluate the power con-tained in each branch contributing to the beating. BelowR 4 μm, those contributions are almost constant, and thehigher-order mode relative power is distributed as follows:5.5 0.5% in HE12, 9 0.5% in EH12, and 85.5 0.5% inHE13. Note that we only resolve the beating between the fun-damental mode and one excited mode. The beating betweenexcited modes exists, but this second-order effect is too weakto be visible in the spectrogram.
7. APPLICATION: QUALITY OF THE PULLWe can use the spectrogram analysis to design and diagnoseits quality while pulling a fiber. The number of modes excitedand which modes are excited give us information about theadiabaticity, asymmetries, and quality of the fiber afterthe pull.
A. Multiangle TaperThe beating amplitude and higher-order modes excitationsseen in Figs. 9 and 12 show that the angle of tapering nearthe critical region at 19.43 μm is nonadiabatic. A shallowertaper angle around that region could lead to a more adiabatictransition. Following this idea, we study a fiber with a 2 mradangle until a radius of 20 μm, and then decrease the angle to0.75 mrad. After R 6 μm, the pull is exponential downto R 250 nm.
We see that the transmission at the end of the pull is only97.850% from Fig. 15. This corresponds to a transfer of energyto the higher-order modes larger than 3%, a factor of 60 worsethan in the linear 2 mrad pull (Fig. 9). The beating amplitude ismuch larger than in the 2 mrad case. This is surprising sincethis pull is designed to be more adiabatic, and simulationswith FIMMPROP confirm that we still expect a transmissionT ≥ 99.90%.
B. Tracking AsymmetriesThe spectrogram analysis in Fig. 16 shows excitation to theTE01, TM01, and HE21 modes, which do not belong to the fam-ily of the fundamental mode. The largest transfer is still to thesame family, with a different distribution. Coupling to otherfamilies should not be observed for a fiber with cylindricalsymmetry. This suggests that our multiple angle tapers intro-duce some asymmetries in the fiber. We imaged the fiber usingan optical microscope near the angle change regions (seeFig. 17) to further investigate the decrease of transmission.
Figure 17 shows that the bottom angle of the fiber exceedsthe top angle. Although the measured diameters are as ex-pected, superimposed plots of the top and bottom edges showthat there are imperfections around the transition. We observea peak at the transition radius (R ≈ 20 μm) in the distancebetween the edges. We believe that the excitation of higher-order modes at this radius is a consequence of this asymme-try. We do not observe the same imperfection around thetransition region for a 2 mrad flat fiber. The abrupt changein angle exacerbates imperfections in the pulling processby introducing some asymmetries. These results further sup-port the idea that single-angle linear tapers are good candi-dates for our application. Further increasing adiabaticitywould require us to decrease Ω, leading to large taper lengths.
0 20 40 60 800.00
0.01
0.02
z (mm)
0 20 40 60 80 970
10
20
30
Steps
Φ1,
j (ra
d)
79080.0
0.5
1.0
Steps
K1,
j (µm
-1n
)1,
1-n 1,
j
70
(a)
(b)
(c)
Fig. 13. Study of the differences between the fundamental mode andthe first four excited modes of family 1. (a) Δβ1;j as a function oflength along the fiber axis (difference between the indices of refrac-tion at step 75). (b) Phase accumulation Φ1;j as a function of step.(c) Spatial frequencyK1;j of the beating as a function of step. The lines(long-dashed red, continuous blue, short-dashed black, and long–short dashed green) join the calculated points.
Fiber Length (mm)
Nor
mal
ized
Bea
t Fre
quen
cy
40 50 60 70 800
0.05
0.1
30 20 10 4 2 1 0.5 0.3Radius (µm)
HE12HE12EH12EH12HE13HE13
Fig. 14. Identification of the modes beating for the 2 mrad taperedfiber spectrogram of Fig. 12. Only modes from family 1 are beating.
Ravets et al. Vol. 30, No. 11 / November 2013 / J. Opt. Soc. Am. A 2369

Because of geometrical and handling constraints, we find itideal to work with 2 mrad tapers. To work with steep andmultiple angles might require a smaller flame or a moresymmetric heating.
8. UNDERSTANDING THE LOSSESA. LossesUnderstanding the losses in nanofibers is important for ourfuture applications [11,24], which require knowledge of suchphoton loss. We identify two main loss mechanisms that con-tribute to the final losses: coupling to higher-order modesthrough nonadiabaticities and scattering around the waistof the nanofiber [8]. Systematic effects such as the presenceof impurities on the fiber surface, or asymmetries in the pull,enhance the losses through those mechanisms.
B. Coupling to Higher-Order ModesWe have observed and characterized in this paper the effect ofnonadiabaticities in the taper. Their presence induces energytransfer to higher-order modes. As we reach the single-moderegime, those higher-order modes cutoff. They cannot beguided by the fiber anymore, and they diffract out as radiativemodes. In a plane transverse to the fiber, one can observe acharacteristic diffraction pattern further supporting the factthat this effect is most the important for the pulls consideredin this study.
C. Rayleigh ScatteringRayleigh scattering is present in any glass, leading to scatter-ing of light and attenuation in the transmitted signal [8]. Theattenuation coefficient for fused silica is small at a wavelengthof 780.24 nm. By imaging the fiber, it is possible to directlyobserve the scattering. Experimentally, it is particularlyvisible on the fiber waist, but remains of the order of3 dB∕km, justifying the fact that we neglected it in this paper.
D. Systematic EffectsTransmission varies drastically with the surface state of thefiber. When the fiber is initially dirty, the spectrogram analysisshows the excitation of more modes corresponding to more
0 200 400 600 8000.94
0.95
0.96
0.97
0.98
0.99
1.0
Nor
mal
ized
Tra
nsm
issi
on
0 200 400 600 800 10000
10
20
30
40
50
60
Time (s)
Wai
st R
adiu
s (µ
m)
(a)
(b)
Fig. 15. (a) Normalized transmission through the fiber as a functionof time during the manufacturing process. (b) Evolution of the radiusof the waist during the pull. Based on the algorithm, we initially taperthe fiber with a 2 mrad angle until a radius of 20 μm; the angle changesto 0.75 mrad until the radius of the fiber is equal to 6 μm, where theradius exponentially decreases down to 250 nm.
Fiber Length (mm)
Nor
mal
ized
Bea
t Fre
quen
cy
90 100 110 120 1300
0.02
0.04
0.06
0.08
0.1
0.12
HE21HE21
EH11EH11HE12HE12
4 3 2 1 0.5 0.3Radius (µm)
TM01TM01TE01TE01
HE13HE13EH12EH12
Fig. 16. Spectrogram of the transmission data shown in Fig. 15. Thesolid black curves are the ones given by the simulation. The modes arelabeled in the figure. The total transmission in the fundamental is0.97850. For R ≤ 2 μm we calculate from the PSD that the remainingenergy is distributed between seven higher-order modes as follows:TE01 (0.08%), TM01 (0.05%), EH11 (0.35%), EH12 (0.05%), HE12(98.4%), HE13 (0.2%), and HE21 (0.87%).
0 20 40 60 800
50
100
150
z (mm)
Edg
e (p
ix)
0 20 40 60 80−0.02
0
0.02
0.04
0.06
z (mm)
Rel
ativ
e di
stan
ce
(a)
(b)
(c)
2 mrad
0.75 mrad
80 µm
10 mm
Fig. 17. Study of the asymmetry of a pulled fiber. The fiber has a10 μm radius with an angle change from 2 to 0.75 mrad at 20 μm.(a) 100 images taken with an optical microscope stacked and horizon-tally compressed to enhance any asymmetries. (b) Profile of the bot-tom edge (blue curve) and top edge (red curve) of the fiber. Theabrupt change in angle at 20 μm introduces an asymmetry at thisradius. (c) Relative difference between the two edges (normalizedby the diameter of the fiber) as a function of z.
2370 J. Opt. Soc. Am. A / Vol. 30, No. 11 / November 2013 Ravets et al.
losses. We attribute this to the presence of impurities on thesurface of the fiber at the beginning or during the pull. A dustparticle on the fiber waist leads to losses through coupling tohigher-order modes or scattering. The cleanliness of the fiberis critical before and during the pull. Such imperfections areavoidable by properly cleaning the fiber and imaging the fiberprior to a pull as explained in [24]. All the pulls presented inthis paper were performed after applying the cleaning pro-cedure described in [24].
9. CONCLUSIONWe have demonstrated our ability to produce ultralow lossoptical nanofibers. Reaching high transmissions is importantfor many nanofiber applications. We have described an algo-rithm that calculates the optimum taper length for a giventransmission, or equivalently the optimum transmission fora given taper length. This new approach concerning adiaba-ticity in tapered fibers gives more precise bounds than the tra-ditional adiabaticity condition, which helps in the design of asuitable taper geometry. We show that in our experiments, thetransition from the single-mode regime to the multimode re-gime is nonadiabatic, inducing excitations of higher-ordermodes during the tapering. Having good control of the tapergeometry is crucial for limiting losses due to those excitations.
The propagation of different modes during the pull leads toa characteristic beating pattern in the transmission. Plottingthe spectrogram of the transmission signal and using a modelof fiber pulling, we are able to identify the modes excitedduring the pull. This gives information for the analysis of thequality of a fiber and the understanding of loss factors, whichwill help in the manufacture of even more adiabatic fibers.
ACKNOWLEDGMENTSWe thank Prof. A. Rauschenbeutel for his interest and supporton this project. This work was funded by the National ScienceFoundation through the Physics Frontier Center at the JointQuantum Institute, and the Army Research Office Atom-tronics MURI. S. R. acknowledges support from the FulbrightFoundation.
REFERENCES1. A. Yariv, “Coupled-mode theory for guided-wave optics,” IEEE J.
Quantum Electron. 9, 919–933 (1973).2. F. L. Kien, J. Liang, K. Hakuta, and V. Balykin, “Field intensity
distributions and polarization orientations in a vacuum-clad sub-wavelength-diameter optical fiber,” Opt. Commun. 242, 445–455(2004).
3. S. Leon-Saval, T. Birks, W. Wadsworth, P. S. J. Russell, and M.Mason, “Supercontinuum generation in submicron fibre wave-guides,” Opt. Express 12, 2864–2869 (2004).
4. E. Vetsch, D. Reitz, G. Sagué, R. Schmidt, S. T. Dawkins, and A.Rauschenbeutel, “Optical interface created by laser-cooledatoms trapped in the evanescent field surrounding an opticalnanofiber,” Phys. Rev. Lett. 104, 203603 (2010).
5. J. Bures and R. Ghosh, “Power density of the evanescent field inthe vicinity of a tapered fiber,” J. Opt. Soc. Am. A 16, 1992–1996(1999).
6. L. Tong, R. R. Gattass, J. B. Ashcom, S. He, J. Lou, M. Shen, I.Maxwell, and E. Mazur, “Subwavelength-diameter silica wiresfor low-loss optical wave guiding,” Nature 426, 816–819 (2003).
7. F. Orucevic, V. Lefèvre-Seguin, and J. Hare, “Transmittance andnear-field characterization of sub-wavelength tapered opticalfibers,” Opt. Express 15, 13624–13629 (2007).
8. A. W. Snyder and J. D. Love, Optical Waveguide Theory
(Chapman & Hall, 1983).9. V. I. Balykin, K. Hakuta, F. L. Kien, J. Q. Liang, and M. Morinaga,
“Atom trapping and guiding with a subwavelength-diameter op-tical fiber,” Phys. Rev. A 70, 011401 (2004).
10. S. M. Spillane, T. J. Kippenberg, O. J. Painter, and K. J. Vahala,“Ideality in a fiber-taper-coupled microresonator system for ap-plication to cavity quantum electrodynamics,” Phys. Rev. Lett.91, 043902 (2003).
11. J. E. Hoffman, J. A. Grover, Z. Kim, A. K. Wood, J. R. Anderson,A. J. Dragt, M. Hafezi, C. J. Lobb, L. A. Orozco, S. L. Rolston, J. M.Taylor, C. P. Vlahacos, and F. C. Wellstood, “Atoms talking tosquids,” Rev. Mex. Fis. 57, 1–5 (2011).
12. R. Grimm, M. Weidemuller, and Y. B. Ovchinnikov, “Optical di-pole traps for neutral atoms,” Adv. At. Mol. Opt. Phys. 42, 95–170(2000).
13. A. Ashkin, “Trapping of atoms by resonance radiation pressure,”Phys. Rev. Lett. 40, 729–732 (1978).
14. S. Chu, J. E. Bjorkholm, A. Ashkin, and A. Cable, “Experimentalobservation of optically trapped atoms,” Phys. Rev. Lett. 57,314–317 (1986).
15. R. J. Cook and R. K. Hill, “An electromagnetic mirror for neutralatoms,” Opt. Commun. 43, 258–260 (1982).
16. K.-H. Yang, W. C. Stwalley, S. P. Heneghan, J. T. Bahns, K.-K.Wang, and T. R. Hess, “Examination of effects of TEM
01-modelaser radiation in the trapping of neutral potassium atoms,”Phys. Rev. A 34, 2962–2967 (1986).
17. N. Davidson, H. Jin Lee, C. S. Adams, M. Kasevich, and S. Chu,“Long atomic coherence times in an optical dipole trap,” Phys.Rev. Lett. 74, 1311–1314 (1995).
18. S. Kulin, S. Aubin, S. Christe, B. Peker, S. L. Rolston, and L. A.Orozco, “A single hollow-beam optical trap for cold atoms,”J. Opt. B 3, 353–357 (2001).
19. A. Goban, K. Choi, D. Alton, D. Ding, C. Lacroûte, M.Pototschnig, T. Thiele, N. Stern, and H. Kimble, “Demonstrationof a state-insensitive, compensated nanofiber trap,” Phys. Rev.Lett. 109, 1–5 (2012).
20. X. Jiang, L. Tong, G. Vienne, X. Guo, A. Tsao, Q. Yang, and D.Yang, “Demonstration of optical microfiber knot resonators,”Appl. Phys. Lett. 88, 223501 (2006).
21. K. P. Nayak, F. L. Kien, Y. Kawai, K. Hakuta, K. Nakajima, H. T.Miyazaki, and Y. Sugimoto, “Cavity formation on an opticalnanofiber using focused ion beam milling technique,” Opt.Express 19, 14040–14050 (2011).
22. C. Wuttke, M. Becker, S. Brückner, M. Rothhardt, and A.Rauschenbeutel, “Nanofiber Fabry–Perot microresonator fornonlinear optics and cavity quantum electrodynamics,” Opt.Lett. 37, 1949–1951 (2012).
23. F. Warken, “Ultra thin glass fibers as a tool for coupling light andmatter,” Ph.D. thesis (Rheinische Friedrich-Wilhelms Universi-tat, 2007).
24. J. E. Hoffman, S. Ravets, J. Grover, P. Solano, P. R. Kordell, J. D.Wong-Campos, S. L. Rolston, and L. A. Orozco, “Heat and pullapparatus for ultrahigh transmission optical nanofibers,” (inpreparation).
25. http://drum.lib.umd.edu.26. A. Yariv, Optical Electronics in Modern Communications
(Oxford University, 1997).27. Photon Design Ltd., “FIMMWAVE/FIMMPROP,” http://www
.photond.com.28. T. Birks and Y. Li, “The shape of fiber tapers,” J. Lightwave Tech-
nol. 10, 432–438 (1992).29. M. Fujiwara, K. Toubaru, and S. Takeuchi, “Optical transmit-
tance degradation in tapered fibers,” Opt. Express 19,8596–8601 (2011).
30. S. Ravets, J. E. Hoffman, L. A. Orozco, S. L. Rolston, G. Beadie,and F. K. Fatemi, “A low-loss photonic silica nanofiber forhigher-order modes,” Opt. Express 21, 18325–18335 (2013).
Ravets et al. Vol. 30, No. 11 / November 2013 / J. Opt. Soc. Am. A 2371
Related Documents