RESEARCH ARTICLE Interkinetic nuclear movements promote apical expansion in pseudostratified epithelia at the expense of apicobasal elongation Marina A. Ferreira 1¤ , Evangeline Despin-Guitard ID 2 , Fernando Duarte ID 2 , Pierre DegondID 1 *, Eric TheveneauID 2 * 1 Department of Mathematics, Imperial College London, London, United Kingdom, 2 Centre for Developmental Biology, Centre for Integrative Biology, CNRS, Universite ´ Paul Sabatier, France ¤ Current address: University of Helsinki, Department of Mathematics and Statistics, FI, Helsingin yliopisto, Finland. * [email protected] (PD); [email protected] (ET) Abstract Pseudostratified epithelia (PSE) are a common type of columnar epithelia found in a wealth of embryonic and adult tissues such as ectodermal placodes, the trachea, the ureter, the gut and the neuroepithelium. PSE are characterized by the choreographed displacement of cells’ nuclei along the apicobasal axis according to phases of their cell cycle. Such move- ments, called interkinetic movements (INM), have been proposed to influence tissue expan- sion and shape and suggested as culprit in several congenital diseases such as CAKUT (Congenital anomalies of kidney and urinary tract) and esophageal atresia. INM rely on cyto- skeleton dynamics just as adhesion, contractility and mitosis do. Therefore, long term impairment of INM without affecting proliferation and adhesion is currently technically unac- hievable. Here we bypassed this hurdle by generating a 2D agent-based model of a prolifer- ating PSE and compared its output to the growth of the chick neuroepithelium to assess the interplay between INM and these other important cell processes during growth of a PSE. We found that INM directly generates apical expansion and apical nuclear crowding. In addi- tion, our data strongly suggest that apicobasal elongation of cells is not an emerging prop- erty of a proliferative PSE but rather requires a specific elongation program. We then discuss how such program might functionally link INM, tissue growth and differentiation. Author summary Pseudostratified epithelia (PSE) are a common type of epithelia characterized by the cho- reographed displacement of cells’ nuclei along the apicobasal axis during proliferation. These so-called interkinetic movements (INM) were proposed to influence tissue expan- sion and suggested as culprit in several congenital diseases. INM rely on cytoskeleton dynamics. Therefore, longer term impairment of INM without affecting proliferation and adhesion is currently technically unachievable. We bypassed this hurdle by generating a mathematical model of PSE and compared it to the growth of an epithelium of reference. PLOS Computational Biology | https://doi.org/10.1371/journal.pcbi.1007171 December 23, 2019 1 / 24 a1111111111 a1111111111 a1111111111 a1111111111 a1111111111 OPEN ACCESS Citation: Ferreira MA, Despin-Guitard E, Duarte F, Degond P, Theveneau E (2019) Interkinetic nuclear movements promote apical expansion in pseudostratified epithelia at the expense of apicobasal elongation. PLoS Comput Biol 15(12): e1007171. https://doi.org/10.1371/journal. pcbi.1007171 Editor: Philip K. Maini, Oxford, UNITED KINGDOM Received: June 6, 2019 Accepted: November 17, 2019 Published: December 23, 2019 Peer Review History: PLOS recognizes the benefits of transparency in the peer review process; therefore, we enable the publication of all of the content of peer review and author responses alongside final, published articles. The editorial history of this article is available here: https://doi.org/10.1371/journal.pcbi.1007171 Copyright: © 2019 Ferreira et al. This is an open access article distributed under the terms of the Creative Commons Attribution License, which permits unrestricted use, distribution, and reproduction in any medium, provided the original author and source are credited. Data Availability Statement: All relevant data are within the manuscript and its Supporting Information files.

Welcome message from author
This document is posted to help you gain knowledge. Please leave a comment to let me know what you think about it! Share it to your friends and learn new things together.
Transcript
RESEARCH ARTICLE
Interkinetic nuclear movements promote
apical expansion in pseudostratified epithelia
at the expense of apicobasal elongation
Marina A. Ferreira1¤, Evangeline Despin-GuitardID2, Fernando DuarteID
2,
Pierre DegondID1*, Eric TheveneauID
2*
1 Department of Mathematics, Imperial College London, London, United Kingdom, 2 Centre for
Developmental Biology, Centre for Integrative Biology, CNRS, Universite Paul Sabatier, France
¤ Current address: University of Helsinki, Department of Mathematics and Statistics, FI, Helsingin yliopisto,
Finland.
* [email protected] (PD); [email protected] (ET)
Abstract
Pseudostratified epithelia (PSE) are a common type of columnar epithelia found in a wealth
of embryonic and adult tissues such as ectodermal placodes, the trachea, the ureter, the gut
and the neuroepithelium. PSE are characterized by the choreographed displacement of
cells’ nuclei along the apicobasal axis according to phases of their cell cycle. Such move-
ments, called interkinetic movements (INM), have been proposed to influence tissue expan-
sion and shape and suggested as culprit in several congenital diseases such as CAKUT
(Congenital anomalies of kidney and urinary tract) and esophageal atresia. INM rely on cyto-
skeleton dynamics just as adhesion, contractility and mitosis do. Therefore, long term
impairment of INM without affecting proliferation and adhesion is currently technically unac-
hievable. Here we bypassed this hurdle by generating a 2D agent-based model of a prolifer-
ating PSE and compared its output to the growth of the chick neuroepithelium to assess the
interplay between INM and these other important cell processes during growth of a PSE.
We found that INM directly generates apical expansion and apical nuclear crowding. In addi-
tion, our data strongly suggest that apicobasal elongation of cells is not an emerging prop-
erty of a proliferative PSE but rather requires a specific elongation program. We then
discuss how such program might functionally link INM, tissue growth and differentiation.
Author summary
Pseudostratified epithelia (PSE) are a common type of epithelia characterized by the cho-
reographed displacement of cells’ nuclei along the apicobasal axis during proliferation.
These so-called interkinetic movements (INM) were proposed to influence tissue expan-
sion and suggested as culprit in several congenital diseases. INM rely on cytoskeleton
dynamics. Therefore, longer term impairment of INM without affecting proliferation and
adhesion is currently technically unachievable. We bypassed this hurdle by generating a
mathematical model of PSE and compared it to the growth of an epithelium of reference.
PLOS Computational Biology | https://doi.org/10.1371/journal.pcbi.1007171 December 23, 2019 1 / 24
a1111111111
a1111111111
a1111111111
a1111111111
a1111111111
OPEN ACCESS
Citation: Ferreira MA, Despin-Guitard E, Duarte F,
Degond P, Theveneau E (2019) Interkinetic nuclear
movements promote apical expansion in
pseudostratified epithelia at the expense of
apicobasal elongation. PLoS Comput Biol 15(12):
e1007171. https://doi.org/10.1371/journal.
pcbi.1007171
Editor: Philip K. Maini, Oxford, UNITED KINGDOM
Received: June 6, 2019
Accepted: November 17, 2019
Published: December 23, 2019
Peer Review History: PLOS recognizes the
benefits of transparency in the peer review
process; therefore, we enable the publication of
all of the content of peer review and author
responses alongside final, published articles. The
editorial history of this article is available here:
https://doi.org/10.1371/journal.pcbi.1007171
Copyright: © 2019 Ferreira et al. This is an open
access article distributed under the terms of the
Creative Commons Attribution License, which
permits unrestricted use, distribution, and
reproduction in any medium, provided the original
author and source are credited.
Data Availability Statement: All relevant data are
within the manuscript and its Supporting
Information files.

Our data show that INM drive expansion of the apical domain of the epithelium and sug-
gest that apicobasal elongation of cells is not an emerging property of a proliferative PSE
but might rather requires a specific elongation program.
Introduction
Pseudostratified epithelia (PSE) are a special type of columnar epithelia in which cells are thin
and elongated. Nuclei packing is very high and forces cells to distribute their nuclei along the
apicobasal axis creating multiple layers of nuclei within a monolayer of cells, hence the term
pseudostratification. PSE are found across the animal kingdom from invertebrates to verte-
brates [1]. During development, several structures adopt a pseudostratified configuration such
as the placodes and the central nervous system in vertebrates or the imaginal discs in Drosoph-
ila. In adults, PSE can be found along the respiratory, urinary and digestive tracts (e.g. trachea,
ureter, midgut) [2, 3] and various organs such as the gonads (e.g. epididymis) or the eye (lens,
retina) [1]. One characteristic feature of PSE is the coordinated movements of nuclei during
the cell cycle called interkinetic nuclear movements (INM) [4]. INM are decomposed in sev-
eral steps: an apical to basal movement occurring during the G1 and S phases of the cell cycle
and a basal to apical nuclear movement occurring during the G2 and M phases. The apical-
ward movement, sometimes referred to as PRAM (Pre-mitotic Rapid Apical Movement), can
be achieved via microtubules like in the chick neuroepithelium [5] or in the brain of mouse
and rat embryos [6, 7] as well as in the retina of post-natal mice [8]. Such movements can also
occur in an actomyosin-dependent manner as observed in the retina of fish embryos [9]. The
return of nuclei to basal positions after mitoses was initially proposed to be passive and a direct
consequence of nuclear crowding in the apical region of PSE. However, there are numerous
evidences indicating an active role of the cytoskeleton in apical to basal nuclear displacement.
For instance, Kif1A, an anterograde molecular motor of microtubules, is required for the api-
cal to basal movement of nuclei in rat brain [7]. In addition, in mouse telencephalon, myosin
II was shown to be essential for apical to basal movement [10]. Further, in ferrets’ brains apical
to basal movements of nuclei are faster than basal to apical movements suggesting that the
nuclear movement towards basal regions of the brain is active while the opposite is observed
in mouse [11]. All these observations indicate that INM are regulated by cytoskeleton-depen-
dent mechanisms and that the actual mechanism employed differs from species to species and
organ to organ.
One consequence of the cytoskeleton-based regulation of INM is that it renders INM
difficult to study in vivo since it is far from the only cell process that relies on cytoskeleton
dynamics. Cell-cell junctions, cell-matrix adhesions and cell contractility require normal
microfilaments and microtubules dynamics. Mitosis relies on microtubules-driven separation
of chromosomes and actomyosin-dependent cytokinesis. Therefore, it is currently technically
impossible to study the specific roles that INM might have in PSE dynamics, growth and shape
over long periods of time (hours to days) without impairing adhesions, contractility or cell
division. This motivates the use of alternative approaches, such as computational modelling.
Many models of cell tissue mechanics can be found in the literature, ranging from agent-
based [12] to continuum models [13, 14]. Agent-based models describe the tissue at the cell
scale and have been used to study local phenomena, such as the influence of the variation of
spatial constraints in the cell cycle [15], how curvature of an epithelial sheet is determined by
mechanical tensions [16] or how contact inhibition of locomotion generates forces in the tis-
sue [17]. Continuum models instead describe the system at the tissue scale (cell density) and
Interkinetic movements impact the growth of pseudostratified epithelia
PLOS Computational Biology | https://doi.org/10.1371/journal.pcbi.1007171 December 23, 2019 2 / 24
Funding: ET acknowledges support from the
Fondation pour la Recherche Medicale (FRM
AJE201224), the Region Midi-Pyrenees
(13053025), Toulouse Cancer Sante (DynaMeca),
the CNRS and Universite Paul Sabatier
(UMR5547). FD and EDG were supported by
Toulouse Cancer Sante (DynaMeca). PD
acknowledges support by the Engineering and
Physical Sciences Research Council (EPSRC)
under grants no. EP/M006883/1 and EP/N014529/
1, by the Royal Society International Exchanges
under grant no. IE160750, by the Royal Society
and the Wolfson Foundation through a Royal
Society Wolfson Research Merit Award no.
WM130048 and by the National Science
Foundation (NSF) under grant no. RNMS11-07444
(KI-Net). PD is on leave from CNRS, Institut de
Mathematiques de Toulouse, France. MF
acknowledges support by Imperial College,
Department of Mathematics, through a Roth PhD
studentship, by The Company of Biologists,
Disease Models and Mechanisms, through a
Travelling fellowship and by the AtMath
Collaboration of the Faculty of Science of the
University of Helsinki. MF short-term stays at
CNRS and Universite Paul Sabatier (UMR5547)
were further supported by Toulouse Cancer Sante
via the DynaMeca grant. The funders had no role in
study design, data collection and analysis, decision
to publish, or preparation of the manuscript.
Competing interests: The authors have declared
that no competing interests exist.
study global properties, such as the tissue curvature, resistance to deformation [18], contrac-
tion-elongation and tissue shear flow [13]. Despite being easier to treat, both computationally
and analytically, continuum models do not incorporate all information about individual cell
shape and position. An agent-based model instead is able to provide detailed spatial informa-
tion and, in particular, it can account for variability in cell characteristics associated with the
different stages of the cell cycle and variability in cell shape associated with the dynamics of
INM (see [19] for a comparison between the continuum and agent-based frameworks). For
these reasons, we opted for the agent-based approach. A large number of agent-based models
of cell tissues have been developed in the last decades. The well-known Potts model [20] is a
lattice-based model in which the cells may have complex shapes with a desired resolution.
However, it has been reported that grid artefacts occur in cell movement and intercellular
interactions [21] and they increase with particle density [22], which makes this model unsuited
to describe crowded systems. Off-lattice models include for example the vertex model [15, 18,
23–25] and the Voronoi model [26, 27]. The tissue is regarded as a partition of space where
each part represents one cell that is contiguous to its neighbours with no intercellular space
between them. These models are able to describe densely packed systems. However, conges-
tion is encoded into the model. In a PSE, nuclear crowding may not occur every time nor
everywhere, so it should not be included in the model but rather occur as an emergent
phenomenon.
Therefore, we reasoned that an appropriate framework to model a PSE would be an agent-
based model where each cell moves in an off-lattice domain and interacts with its neighbours.
Using such model, and comparing it with the chick neuroepithelium as a biological PSE of ref-
erence, we have explored the impact of INM, proliferation, adhesion and contractility on tissue
shape, position of mitoses, pseudostratification and growth. Our results indicate that INM gen-
erate apical nuclear crowding, oppose apical shrinkage due to apical contractility and directly
favor tissue growth oriented perpendicularly to the apicobasal axis (dorsoventrally, anteropos-
teriorly). Interestingly, all characteristics observed in the chick neuroepithelium such as apical
positioning of mitoses, apical straightness, apical nuclear crowding and pseudostratification
emerge from a combination of INM, proliferation, apical contractility and cell adhesion. How-
ever, the sustained linear apicobasal growth observed during development of the chick spinal
cord cannot be reproduced with this combination of parameters. We show that neuroepithelial
cells undergo a dramatic change of shape concomitantly to a reduction of cell volume while
elongating along the apicobasal axis. This change of cell shape exceeds what is needed to
accommodate new nuclei added by proliferation. Therefore, our simulations and in vivo
observations strongly suggest that, while INM contribute to the expansion of the apical
domain, the observed in vivo apicobasal elongation requires a specific elongation program.
We then discuss whether such program, together with INM promoting apical nuclear crowd-
ing, might be a way to coordinate tissue growth and differentiation.
Results
Evolution of the chick trunk neuroepithelium from two to four days of
development
As a biological PSE of reference, we chose the trunk neuroepithelium of the chick embryo. The
neuroepithelium is a well-described PSE and has the advantage of being easily accessible for
observation and manipulation. We started by monitoring the evolution of the neuroepithelium
at the level of the prospective forelimb (somites 15–20) between two and four days of develop-
ment [28], corresponding to developmental stage HH13- (18 somites, 48h of incubation) to
stage HH23 (96 hours of incubation) and performed transversal cryosections (Fig 1A and 1B).
Interkinetic movements impact the growth of pseudostratified epithelia
PLOS Computational Biology | https://doi.org/10.1371/journal.pcbi.1007171 December 23, 2019 3 / 24

Importantly, we focused on the intermediate region (half way between the dorsal and ventral
sides of the tissue) to avoid the effect of extensive neuronal delamination and differentiation
occurring in the ventral region of the tissue at these stages. We then performed immunostain-
ing for phospho-histone H3 to label cells in mitosis and counterstained for actin and DNA
(Fig 1C and 1D). We found that the dorsoventral size of the neuroepithelium increases
2.45-fold over two days, going from an average of 133μm to 326μm (Fig 1E), while the apico-
basal size of the tissue grows by 2.3-fold from 50μm to 115μm (Fig 1F). Over the same period,
the antero-posterior distance from somite 15 caudalward increases 3.56-fold, going from 2.6 to
9.4mm (S1 Fig). This indicates that growth of the posterior neuroepithelium between 2 and 4
days of development is biased toward anteroposterior growth. The number of pseudolayers of
nuclei from apical to basal increases by 2.5-fold (Fig 1G). Interestingly, the distribution of
nuclei changes from a homogenous distribution along the apicobasal axis in 48h-old embryos
Fig 1. Growth of caudal neuroepithelium of the chicken embryo from 2 to 4 days of development. A. Diagram of a chicken embryo at 48h of incubation (stage
HH13-, 18 somites). B, transversal cryosections at the level of the forelimb at 48h, 72 and 96h of incubation. C-D, Confocal images of the intermediate region of the
neuroepithelium at the level of the forelimb at 48, 72 and 96h of incubation, nuclei are stained with DAPI (grey) and actin with Phalloidin (green). Magenta line,
apical domain; cyan line, basal domain. Note that the basal region progressively becomes devoid of nuclei. E, net dorsoventral length of the neural tube. F, net
apicobasal length of the neural tube. G, number of pseudolayers of nuclei along the apicobasal axis. H, distribution of DAPI intensity along the apicobasal axis,
normalized to the peak intensity in each dataset and to the apicobasal size so that the various stages can be compared. I, ratio of apicobasal and dorsoventral length of
nuclei. J, straightness of apical domain (net distance between dorsal-most and ventral-most points of the apical surface divided by the actual length of the apical
surface between these two points). K, positions of mitotic cells (either phospho-histone H3-positive cells or cells with condensed chromosomes from DAPI staining),
at scale with the actual apicobasal size of the neural tube. L, positions of mitoses, raw data. Descriptive data collected from 20 embryos. Dots represent mean values.
Error bars show the standard deviation. Box and whiskers plot: the box extends from the 25th to the 75th percentile; the whiskers show the extent of the whole
dataset. The median is plotted as a line inside the box. AB, apicobasal; DV, dorsoventral; HH, Hamburger-Hamilton stages of chicken development; ss, somites.
https://doi.org/10.1371/journal.pcbi.1007171.g001
Interkinetic movements impact the growth of pseudostratified epithelia
PLOS Computational Biology | https://doi.org/10.1371/journal.pcbi.1007171 December 23, 2019 4 / 24

(Fig 1H, light green curve) to an accumulation of nuclei in the apical region in 72 and 96h-old
embryos (Fig 1H, dark green curves). Note that nuclei density is lower in the basal region of
the epithelium (Fig 1D). A change of average nuclear shape is also observed. The aspect ratio
goes from 1.67 at 2 days to 2.01 at 4 days (Fig 1I). Nuclei become more elongated along the api-
cobasal axis (Fig 1D). This is due to a shortening of the nuclear length along the DV axis
between 2 and 3 days of development while the length along the AB axis remains constant. By
contrast, other parameters such as the straightness of the apical domain (Fig 1J), or the mean
position of mitoses along the apicobasal axis (Fig 1K and 1L) do not significantly change (fold
change inferior to 1.1). From these observations, we next wondered whether the balance
between cell adhesion, proliferation and INM would be sufficient to drive the growth of the
neuroepithelium, the progressive apical accumulation of nuclei and the increased pseudostrati-
fication, while apical positioning of mitoses and apical straightness remain constant.
Agent-based model of PSE dynamics
To be able to assess the impact of INM versus other cytoskeleton-dependent processes (e.g.
adhesion, mitosis), we built an agent-based model of the neuroepithelium. The chick neuroe-
pithelium is an elongated PSE meaning that cells are very thin tubes with a large protruding
nucleus giving them a watermelon-in-a-sock morphology (Fig 2A, S1 Movie). Cells are polar-
ized according to the apicobasal axis with most of the cell-cell junctions localized apically and,
conversely, the cell-matrix adhesions located basally [29]. In the model, each cell is approxi-
mated to a nucleus, an apical point and a basal point. The two points are attached to the
nucleus via dynamic adjustable springs representing the viscoelastic properties of the cyto-
plasm (Fig 2B). Cells are placed next to one another along a lateral axis perpendicular to the
apicobasal axis. Since the model is in 2D, this lateral axis can represent either the dorsoventral
axis or the anteroposterior axis. Importantly, cells cannot intercalate nor swap positions. To
model cell-cell and cell-matrix interactions, we use simple mechanical and behavioural rules.
On the apical side, apical points are attached to each other by apical-apical springs represent-
ing cell-cell adhesion. On the basal side, basal points are attached to a fixed basal line repre-
senting the basal lamina of the epithelium. Basal points can only move along the basal line and
a maximum distance between adjacent basal points is implemented to avoid uncontrolled flat-
tening of the tissue along the basal line. As in the real epithelium, apical points are only
attached to their direct neighbors and thus can move within the 2D domain. Neuroepithelial
cells are known to keep a straight shape. Therefore, an alignment mechanism is set to prevent
the apical point, the nucleus and the basal point of each cell from deviating significantly from a
straight line. Nuclei cannot overlap. In the literature, non-overlapping constraints are approxi-
mated by a soft repulsion potential [30]. However, despite being computationally less expen-
sive, this approximation becomes less and less accurate as the compression forces generated by
congestion increase. Instead, we consider the nucleus being formed by an inner sphere (the
hard core) and an outer sphere (the soft core). This representation allows soft cores to overlap
with one another representing the deformation that would occur when two nuclei are pressed
against each other [31]. In the chick neuroepithelium, nuclei are slightly compressed along the
dorsoventral axis, giving them an elongated form along the apicobasal axis (see Fig 1C and
1D). Overlap of soft cores leads to a repulsive force. In addition, there is a non-overlapping
constraint imposed to the nuclei hard cores.
A clock, representing a simplified cell cycle, rules the proliferation rate. This in silico cycle
has 3 phases. A first phase corresponding to G1, S and the part of G2 during which no directed
movements of nuclei take place (Fig 2C; G1/S/passive G2). A second phase accounting for the
active nuclear movements occurring in G2 known as pre-mitotic rapid apical movements
Interkinetic movements impact the growth of pseudostratified epithelia
PLOS Computational Biology | https://doi.org/10.1371/journal.pcbi.1007171 December 23, 2019 5 / 24

(PRAM; Fig 2C, PRAM/active G2). A third phase representing Mitosis (Fig 2C; M). PRAM are
implemented as follows: in cells entering active G2, the preferred rest length of apical-nucleus
springs is set to 0 and the preferred rest length of the nucleus-basal spring is set to the current
height of the cell. This drives an active apical-ward movement of the nuclei. In addition, dur-
ing mitosis, the hard core of the nucleus increases (Fig 2C). Given that in our model cells have
no cytoplasm, the increase of the hard core represents the known swelling and stiffening of
cells during mitoses [32, 33]. At the end of mitosis daughter cells can be kept within the 2D-
plane of the model or excluded. Thus, by systematically excluding 50% of the daughter cells we
can keep the size of the cell population constant. This allows us to decouple the cell cycle and
INM from actual proliferation (increase of cell number over time). Importantly, given the cur-
rent lack of consensus about systematic active basal-ward movement of nuclei during G1 and
S phases, we chose not to implement active movements of nuclei toward the basal side of the
tissue in our model.
Outside of the PRAM/active G2 and M phases, apical-nucleus and nucleus-basal springs
adjust their preferred rest length to their actual length, thus incorporating viscous behavior
into the cytoplasm dynamics. This allows cells to accommodate their nuclei all along the apico-
basal axis according to local constraints and forces (e.g., the position of the other nuclei or the
forces on the various springs). Furthermore, there is a noise factor that allows nuclei to ran-
domly move from their current location at each iteration of the simulation. In the chick neu-
roepithelium, nuclei are not known to display large scale random movements outside of
PRAM. Consequently, in our simulations, the noise is set very low compared to PRAM.
Each simulation is initialized with 30 cells. All cells have their apical point, nucleus and
basal point aligned. Apical points and basal points are evenly distributed. This can be seen in
the first frame of S2–S6 Movies. Then, at each time-iteration, the simulation runs as follows:
springs and nuclei are updated according to the position of each cell in the cell cycle, cells that
are in mitosis divide and noise is implemented. Mitosis and noise may lead to the violation of
the non-overlapping constraints on the nuclei hard cores. A minimization algorithm devel-
oped in [34] is then used to obtain an admissible configuration. This configuration
Fig 2. Agent-based model of the pseudostratified epithelium. A. 3D confocal image of a single neuroepithelial cells expressing membrane-GFP, in a
2-day old chick neuroepithelium (see S1 Movie). B. Cells in the model are abstracted to a nucleus attached to a set of springs. C, implementation of cell
cycle and INM during the simulation. Cells in the model constantly proliferate by going through a simplified cell cycle corresponding to three phases: a
G1/S/passive G2 phase during which springs connected to the nucleus adjust to local constraints, a PRAM/active G2 phase during which apical-nucleus
springs shrink while nucleus-basal springs elongate to recapitulate INM movements and the M phase during which springs behave as in G2. In addition,
the hard core of nuclei enlarges in M phase to account for cell swelling and stiffening. Finally, at the end of the M phase each cell gives two daughter cells.
One is systematically kept within the 2D-plane, the other daughter cell can be excluded. This parameter allows to control the rate of growth of the tissue
independently of the pace of the cell cycle. See S1 Information for a detailed description of the model.
https://doi.org/10.1371/journal.pcbi.1007171.g002
Interkinetic movements impact the growth of pseudostratified epithelia
PLOS Computational Biology | https://doi.org/10.1371/journal.pcbi.1007171 December 23, 2019 6 / 24

corresponds to a local minimizer of the total mechanical energy in the system associated to the
springs, nuclei soft core and alignment forces. A complete description of the mathematical
model can be found in S1 Information and all parameters used for the simulations presented
in all figures hereafter are summarized in S1 Table.
INM oppose apicobasal elongation, generate apical nuclear crowding and
enlarge the apical domain
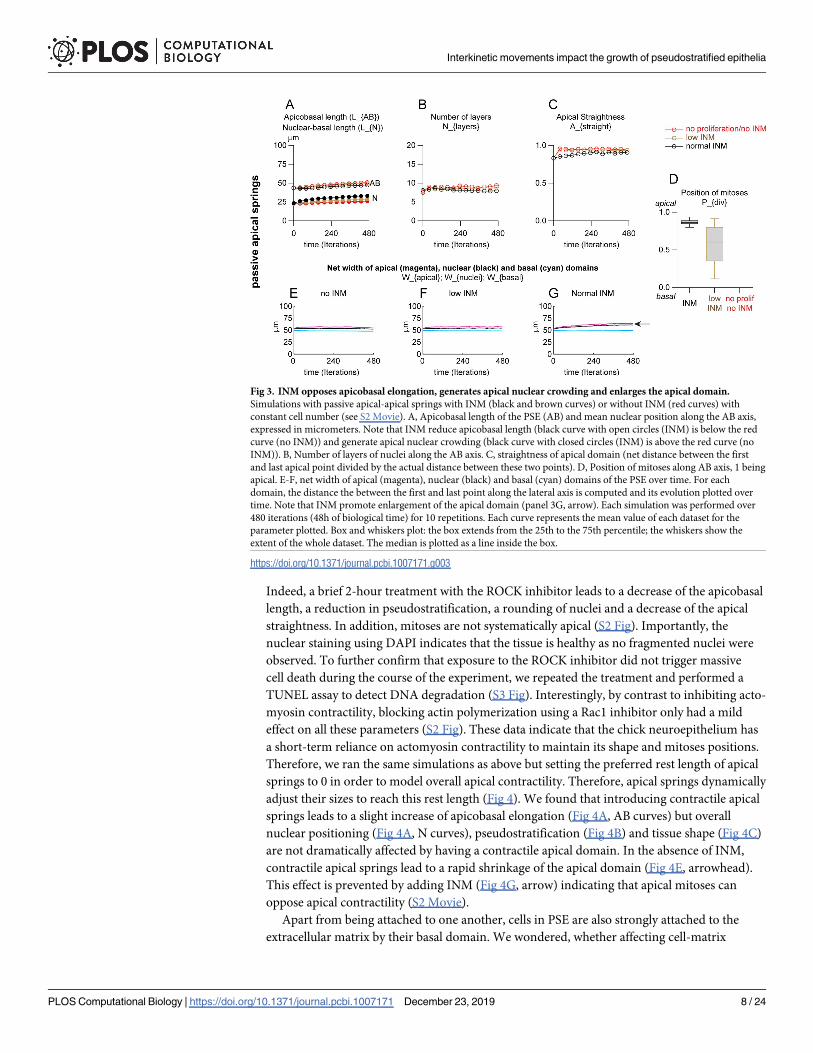
To start with, we checked the evolution of the tissue in absence of proliferation (no INM, Fig
3) to assess the influence of cell-cell, cell-matrix adhesions and the non-overlapping con-
straints between nuclei. To do so, we set the minimum duration of the cell cycle to 10000
hours making it unlikely that any cells would divide during the course of the 48-hour simula-
tion. The apical-apical springs were set to be passive, meaning that they do not adjust their size
in response to stretch or compression. In these conditions, there is no change in apicobasal
size of the tissue (Fig 3A, red curve, AB) with nuclei distributing homogenously halfway along
the apicobasal axis (Fig 3A, red curve, N). The number of pseudolayers remains constant (Fig
3B, red curve) and the apical domain stays flat (Fig 3C, red curve). See S2 Movie. In order to
assess the effect of INM without adding more cells to the tissue, we set the exclusion rate of
daughter cells to 50%. This means that after mitosis only one of the daughter cells is kept in the
2D-plane, keeping the total cell number constant. The total cell cycle duration is set to a range
of 10 to 21 hours corresponding to averages of the known values for the duration of the cell
cycle in the chick trunk neuroepithelium between 2 and 4 days of development [35]. G2 and
M phases respectively last 90 and 30 minutes each, however active nuclear movements corre-
sponding to PRAM only occur in a fraction of the total G2. Thus, in the model to generate nor-
mal INM conditions we set PRAM/active G2 and M phases to 30 min each (normal INM, Fig
3A–3C, black curves). To generate low INM conditions where cells actively displace their
nuclei for a shorter period, we set the duration of PRAM/active G2 to 0 and M to 6 minutes
(one iteration only) (low INM, Fig 3A–3C, brown curves). Introducing low or normal INM
slightly reduces the apicobasal size of the tissue (Fig 3A, brown and black curves AB are below
the corresponding red curve) and the average position of nuclei shifted apically (Fig 3A,
brown and black curves N are above the corresponding red curve). Adding INM also leads to a
slight decrease in terms of pseudolayers (Fig 3B, black curve) and apical straightness (Fig 3C,
black curve). Normal INM parameters lead to apical mitosis whereas low INM lead to a wide-
spread distribution of mitoses along the apicobasal axis (Fig 3D). These data indicate that INM
are sufficient to drive global nuclear apical crowding (Fig 3A, black curve), to slightly destabi-
lize apical straightness and of course to control apical positioning of mitoses. In addition, we
checked the net lateral expansion of the apical, nuclear and basal domains under each of these
3 conditions. Each domain is defined by the length between the proximal and distal apical,
nuclear and basal points along the lateral axis, respectively (Fig 3E–3G). These analyses reveal
that INM promote the expansion of the apical domain, especially when all mitoses are apical
(Fig 3E–3G, magenta curves, arrow). See S2 Movie.
Apical domains of epithelia are known to be dynamic and to display actomyosin contractil-
ity [36]. In addition, epithelial cells are known to resolve local imbalances in tension, compres-
sion and shear by aligning their cytoskeleton [37]. Further, apical contractility is known to be
important for epithelial cell shape changes from squamous to columnar which corresponds to
an apicobasal elongation [16, 36]. Thus, apical contractility may be an important driving force
for apicobasal elongation in PSE. To explore this hypothesis, we first check that actomyosin
contractility was important in the chick neuroepithelium by treating samples with the ROCK
inhibitor, a compound specifically blocking Rho-dependent myosin contractility (S2 Fig).
Interkinetic movements impact the growth of pseudostratified epithelia
PLOS Computational Biology | https://doi.org/10.1371/journal.pcbi.1007171 December 23, 2019 7 / 24
Indeed, a brief 2-hour treatment with the ROCK inhibitor leads to a decrease of the apicobasal
length, a reduction in pseudostratification, a rounding of nuclei and a decrease of the apical
straightness. In addition, mitoses are not systematically apical (S2 Fig). Importantly, the
nuclear staining using DAPI indicates that the tissue is healthy as no fragmented nuclei were
observed. To further confirm that exposure to the ROCK inhibitor did not trigger massive
cell death during the course of the experiment, we repeated the treatment and performed a
TUNEL assay to detect DNA degradation (S3 Fig). Interestingly, by contrast to inhibiting acto-
myosin contractility, blocking actin polymerization using a Rac1 inhibitor only had a mild
effect on all these parameters (S2 Fig). These data indicate that the chick neuroepithelium has
a short-term reliance on actomyosin contractility to maintain its shape and mitoses positions.
Therefore, we ran the same simulations as above but setting the preferred rest length of apical
springs to 0 in order to model overall apical contractility. Therefore, apical springs dynamically
adjust their sizes to reach this rest length (Fig 4). We found that introducing contractile apical
springs leads to a slight increase of apicobasal elongation (Fig 4A, AB curves) but overall
nuclear positioning (Fig 4A, N curves), pseudostratification (Fig 4B) and tissue shape (Fig 4C)
are not dramatically affected by having a contractile apical domain. In the absence of INM,
contractile apical springs lead to a rapid shrinkage of the apical domain (Fig 4E, arrowhead).
This effect is prevented by adding INM (Fig 4G, arrow) indicating that apical mitoses can
oppose apical contractility (S2 Movie).
Apart from being attached to one another, cells in PSE are also strongly attached to the
extracellular matrix by their basal domain. We wondered, whether affecting cell-matrix
Fig 3. INM opposes apicobasal elongation, generates apical nuclear crowding and enlarges the apical domain.
Simulations with passive apical-apical springs with INM (black and brown curves) or without INM (red curves) with
constant cell number (see S2 Movie). A, Apicobasal length of the PSE (AB) and mean nuclear position along the AB axis,
expressed in micrometers. Note that INM reduce apicobasal length (black curve with open circles (INM) is below the red
curve (no INM)) and generate apical nuclear crowding (black curve with closed circles (INM) is above the red curve (no
INM)). B, Number of layers of nuclei along the AB axis. C, straightness of apical domain (net distance between the first
and last apical point divided by the actual distance between these two points). D, Position of mitoses along AB axis, 1 being
apical. E-F, net width of apical (magenta), nuclear (black) and basal (cyan) domains of the PSE over time. For each
domain, the distance the between the first and last point along the lateral axis is computed and its evolution plotted over
time. Note that INM promote enlargement of the apical domain (panel 3G, arrow). Each simulation was performed over
480 iterations (48h of biological time) for 10 repetitions. Each curve represents the mean value of each dataset for the
parameter plotted. Box and whiskers plot: the box extends from the 25th to the 75th percentile; the whiskers show the
extent of the whole dataset. The median is plotted as a line inside the box.
https://doi.org/10.1371/journal.pcbi.1007171.g003
Interkinetic movements impact the growth of pseudostratified epithelia
PLOS Computational Biology | https://doi.org/10.1371/journal.pcbi.1007171 December 23, 2019 8 / 24

adhesion may lead to defects of nuclear, cell or tissue shape. To do so, we treated trunk
explants with Dispase, an enzyme capable of degrading collagens and fibronectin (S4 Fig).
Interestingly, decreasing cell-matrix adhesion led to a reduction of apicobasal size, nuclei
rounding, a decrease of pseudostratification, impaired apical straightness and to some non-
apical mitoses. These data indicate that the overall balance of tension across both cell-cell and
cell-matrix adhesion is important for the shape of the chick PSE. Impairing cell-matrix adhe-
sion sometimes triggered local apical extrusion. Importantly, all defects in nuclei and tissue
shape described above were also detected in regions where no apical extrusion had taken place
suggesting that the tissue relaxation occurs first and then some cells may extrude apically as a
consequence of the loss of cell-matrix adhesion.
Increase in cell number strongly increases pseudostratification but has a
weak effect on apicobasal elongation
Since neither INM nor apical contractility are sufficient to drive extensive apicobasal elonga-
tion, we next wanted to compare the impact of having passive or contractile apical-apical
springs in the context of increasing cell number by proliferation (allowing more than one
daughter cell to remain in the 2D plane after mitosis). For that, we ran two sets of simulations
with passive or contractile apical-apical springs and with different rates of exclusion of daugh-
ter cells ranging from 0% (all cells generated by mitosis are added to the 2D plane) to 50% (one
daughter cell is systematically excluded). INM are set to normal with PRAM/active G2 and M
phases lasting 30 min each in all conditions. All outputs of simulations with passive apical-
Fig 4. INM opposes apical contractility. Same simulations as in Fig 3 but with contractile apical-apical springs with INM
(black and brown curves) or without INM (red curve), with constant cell number (see S2 Movie). A, Apicobasal length of
the PSE (AB) and mean nuclear position along the AB axis, expressed in micrometers. B, Number of layers of nuclei along
the AB axis. C, straightness of apical domain (net distance between the first and last apical point divided by the actual
distance between these two points). D, Position of mitoses along AB axis, 1 being apical. E-G, net width of apical
(magenta), nuclear (black) and basal (cyan) domains of the PSE over time. For each domain, the distance between the first
and last point along the lateral axis is computed and its evolution plotted over time. Note that apical contractility reduces
the width of the apical domain (panel 4E, arrow), whereas introducing INM opposes apical contractility (panel 4G, arrow;
red curve in G is higher than in E). Each simulation was performed over 480 iterations (48h of biological time) for 10
repetitions. Each curve represents the mean value of each dataset for the parameter plotted. Box and whiskers plot: the
box extends from the 25th to the 75th percentile; the whiskers show the extent of the whole dataset. The median is plotted
as a line inside the box.
https://doi.org/10.1371/journal.pcbi.1007171.g004
Interkinetic movements impact the growth of pseudostratified epithelia
PLOS Computational Biology | https://doi.org/10.1371/journal.pcbi.1007171 December 23, 2019 9 / 24

apical springs are plotted in shades of grey to black whereas outputs for simulations with con-
tractile apical-apical springs are plotted in shades of hot colors from yellow to dark red. Con-
tractile apical-apical springs have a slight positive impact on tissue apicobasal elongation (Fig
5A, AB curves; all colored curves are above their corresponding grey-to-black curves). This is
accompanied by a slight apical shift of nuclei (Fig 5A, N curves). Pseudostratification correlates
directly with the number of cells retained in the 2D plane (Fig 5B). At maximal (50%) or inter-
mediate (40%, 30%) exclusion rates of daughter cells, contractile apical-apical springs further
increase pseudostratification (Fig 5B, orange and red curves are above their cognate grey-to-
black curves; S3 Movie). This effect is lost when all cells are retained (Fig 5B, 0% exclusion, yel-
low and grey curves overlap). With passive apical-apical springs, the PSE shape becomes very
sensitive to an increase of cell number. The more cells are kept within the 2D plane of the epi-
thelium the faster apical straightness decreases (Fig 5C). Introducing contractile apical-apical
springs mitigates the effect of hyper-proliferation (Fig 5C, orange and red curves stay close to
straightness of 0.9). We then monitored the net lateral expansion of apical, nuclear and basal
domains over time for all conditions (Fig 5D–5I). An increase in cell number induces a rapid
expansion of the apical domain (Fig 5D–5F). Interestingly, the apical shrinkage induced by
contractile apical springs (Fig 5G, red curve) can be opposed by increasing the number of cells
(Fig 5H and 5I, magenta curves). In addition, apical contractility positively feeds back into
basal expansion. Note that the cyan curves in panels 5H and 5I increase faster than in panels
5E and 5F. These data indicate that an increase in total cell number drives a slight increase in
apicobasal length, strongly drives pseudostratification and, in addition to INM, leads to an
expansion of the apical domain. Interestingly, in the context of increasing cell number, apical
contractility promotes basal rearrangements, an effect not seen with constant cell numbers
(compare the cyan curves in panels 3E-G and 4E-G, with cyan curves in panel 5D, 5G). Fur-
ther, apicobasal constriction slightly contributes to pseudostratification and helps maintain tis-
sue shape during tissue growth.
Fig 5. Increase in cell number drives pseudostratification and apical contractility feeds back into basal rearrangements. Simulations with passive or
contractile apical springs, normal INM and various rates of exclusion of daughter cells (see S3 Movie). A, apicobasal length of the PSE (AB) and mean nuclear
position along the AB axis (N) over time expressed in micrometers. B, Number of pseudolayers of nuclei along the AB axis. C, straightness of apical domain (net
distance between the first and last apical point divided by the actual distance between these two points). D-F, net width of apical (magenta), nuclear (black) and
basal (cyan) domains of the PSE with passive apical-apical springs over time with 50 (D), 40 (E) and 30% (F) of daughter cells being excluded from the 2D plane.
G-I, net width of apical (magenta), nuclear (black) and basal (cyan) domains of the PSE with contractile apical-apical springs over time with 50 (G), 40 (H) and
30% (I) of daughter cells being excluded from the 2D plane. For each domain, the distance between the first and last point along the lateral axis is computed and
its evolution plotted over time. Note that apical contractility leads to basal rearrangements (compare cyan curves in H-I grow faster than in E-F). Each simulation
was performed over 480 iterations (48h of biological time) for 10 repetitions. Each curve represents the mean value of each dataset for the parameter plotted.
https://doi.org/10.1371/journal.pcbi.1007171.g005
Interkinetic movements impact the growth of pseudostratified epithelia
PLOS Computational Biology | https://doi.org/10.1371/journal.pcbi.1007171 December 23, 2019 10 / 24

In vivo, the chick neuroepithelium is a closed tube and is surrounded by other structures
(e.g. superficial ectoderm, paraxial mesoderm). It experiences physical constraints that may
contribute to its overall shape. To assess whether restricting lateral expansion of our growing
simulated PSE would help maintain tissue shape, we ran simulations with passive apical
springs and different exclusion rates of daughter cells as in Fig 5 and added lateral walls (S5
Fig, S4 Movie). With constant cell number (exclusion rate of daughter cells at 50%) the
straightness of the apical surface is low but constant. When including cell proliferation (exclu-
sion rates of 40 and 30%), intense buckling of the apical surface is observed, indicating that
adding lateral physical constraints do not contribute to maintaining tissue shape during tissue
growth contrary to what apical contractility does.
Neuroepithelial cells undergo a dramatic change in shape that exceeds what
is needed to accommodate nuclei along the apicobasal axis
So far, our simulations reveal that a progressive increase of pseudostratification, apical nuclear
accumulation and apical mitoses can emerge from cell-cell/cell-matrix adhesion, proliferation
and INM. However, none of the conditions tested allows a rapid apicobasal elongation of the
tissue over 48h. This suggests that something is missing in our model. To achieve fast apicoba-
sal elongation, cells could either get bigger (increase of cell volume) or elongate beyond what is
necessary to accommodate the increase in number of nuclei due to proliferation. Our descrip-
tive in vivo data (Fig 1A and 1B) show that a region of low nuclei density is formed in the basal
domain of the chick neuroepithelium between 48 to 96 hours of incubation. This is driven by
INM in our model (Fig 3A). Such low basal density of nuclei has been seen in other elongated
PSE as well [29]. This observation suggests that apicobasal elongation of cells may not be
driven by the pilling of nuclei along the apicobasal axis. Could elongation be caused by a
change of cell shape or are cells also changing in size? To answer this question, we dissected
explants of the neuroepithelium from the forelimb region (facing somites 15 to 20) in embryos
at 2, 3 and 4 days of development (Fig 6A). Neural tubes were enzymatically isolated from sur-
rounding tissues and dissociated to produce a suspension of single neuroepithelial cells (see
material and methods). Cells were automatically counted and their diameters retrieved using a
cell counter. From these measurements, volumes were calculated. This analysis reveals that the
mean volume of neuroepithelial cells decreases between 2 and 3 days of development and
remains stable from 3 to 4 days (Fig 6B and 6C). We next checked the size of the apical
domains by performing en face microscopy on neuroepithelia from the same stages (Fig 6A,
6D and 6E). We found that the mean area occupied by the cells’ apical sides is also significantly
getting smaller between 2 and 3 days of development but does not significantly change from 3
to 4 days (Fig 6D and 6E). These data indicate that neuroepithelial cells undergo a dramatic
change of cell shape, together with a reduction of cell volume, which appear to exceed what
would be needed to accommodate the increase of cell nuclei along the apicobasal axis. This
strongly suggests that undifferentiated PSE cells specifically elongate rather than simply adjust
to local nuclear crowding.
Apicobasal elongation requires a specific elongation force
Therefore, we wondered whether adding a global non-oriented expansion force might account
for the apicobasal elongation observed in vivo. To do that, we increased the amount of noise
on nuclear position at each iteration. All nuclei are allowed to move in a random direction at
each iteration of the simulation. Since apical-nucleus and nucleus-basal springs are able to
update their rest length to adjust to their actual size, any increase in random nuclear move-
ments forces the apical-nucleus and nucleus-basal springs to stretch. Given that cells are
Interkinetic movements impact the growth of pseudostratified epithelia
PLOS Computational Biology | https://doi.org/10.1371/journal.pcbi.1007171 December 23, 2019 11 / 24

attached to the basal line, to each other and that cells are prevented from bending due to an
imposed alignment force, increasing random nuclear noise should generate a linear apicobasal
elongation force. We ran simulations with conditions similar to those presented in Fig 4 but
with a 25-fold increase of random nuclear movements (Fig 7). Under these conditions, we
observed a 2-fold increase in apicobasal length (Fig 7A, S5 Movie) whereas the number of
pseudolayers (Fig 7B) and apical straightness (Fig 7C) were similar to the values obtained with
low noise (Fig 5B and 5C). In addition, increasing noise does not affect the overall dynamics of
lateral expansion of the tissue (Fig 7D–7F). At low percentages of exclusion of daughter cells
(30%) the lateral expansion of the apical domain is faster than that of the basal domain (Fig 7F,
compare magenta and cyan curves). We attempted to solve this issue by allowing basal points
to update their positions at a faster rate. This was sufficient to allow an isotropic expansion of
the tissue (Fig 7G, black, cyan and magenta curves grow at the same pace; S5 Movie). Finally,
our previous simulations (Figs 3 and 4) hinted that INM were capable of opposing apicobasal
elongation. We wanted to check if this was still true under the extensive apicobasal growth
generated by increased noise. We repeated the same simulations as shown in Fig 7, excluding
50% of daughter cells to keep total cell number constant, but setting low INM conditions with
PRAM/active G2 set to 0 and M to 6min. (S6 Fig). Under low INM conditions, the PSE elon-
gates along the apicobasal axis faster than with normal INM and there is a shrinkage of the api-
cal domain (S6 Movie) confirming our previous observations.
In conclusion, our data indicate that: i/ pseudostratification is mainly controlled by the
increase of cell number, ii/ apical contractility is essential to maintain tissue shape in the con-
text of a high proliferation rate, iii/ INM promote the expansion of the apical domain, iv/ INM
oppose pseudostratification, apical contractility and apicobasal elongation whereas they
Fig 6. Mean volume and mean apical surface of chick neuroepithelial cells decreases between 2 and 3 days of development. A, Diagram depicting the
regions used for the preparation of cell suspensions and open book histology from chicken embryos at 2, 3 and 4 days of development (see Methods for
details of the experimental procedures). Region monitored (from somite 15 to 20, forelimb region) is indicated by a dotted line. B, representative images
of neuroepithelial cells in suspension after neural tube dissection and enzymatic dissociation. C, mean volume of neuroepithelial cells over time (n48h =
82; n72h = 568; n96h = 1168). Cells get significantly smaller from 2 to 3 days of development and remain stable. Box and whiskers plot: the box extends
from the 25th to the 75th percentile; the whiskers show the extent of the whole dataset. The median is plotted as a line inside the box. One-way ANOVA
(Kruskal-Wallis) followed by Dunn’s multiple comparisons. ����, p<0.0001; ns, p>0.9999. D, en face view of the apical domain of the intermediate region
of the neuroepithelium (actin is stained by Phalloidin). E, mean area of the individual apical surfaces over time (n48h = 67; n72h = 66; n96h = 81). Apical
surfaces shrink from 2 to 3 days of development and remain stable. Dots represent mean of the dataset, error bars represent S.D. One-way ANOVA
followed by multiple comparisons. ����, p<0.0001; ns, p = 0.1586.
https://doi.org/10.1371/journal.pcbi.1007171.g006
Interkinetic movements impact the growth of pseudostratified epithelia
PLOS Computational Biology | https://doi.org/10.1371/journal.pcbi.1007171 December 23, 2019 12 / 24
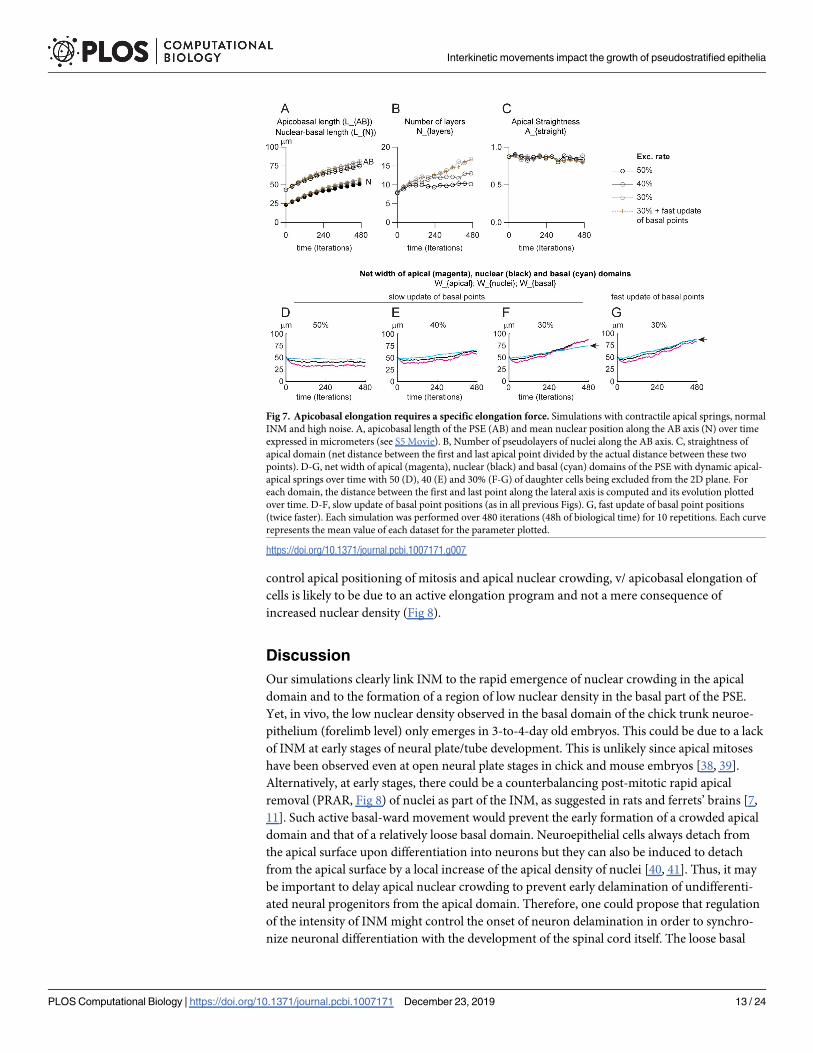
control apical positioning of mitosis and apical nuclear crowding, v/ apicobasal elongation of
cells is likely to be due to an active elongation program and not a mere consequence of
increased nuclear density (Fig 8).
Discussion
Our simulations clearly link INM to the rapid emergence of nuclear crowding in the apical
domain and to the formation of a region of low nuclear density in the basal part of the PSE.
Yet, in vivo, the low nuclear density observed in the basal domain of the chick trunk neuroe-
pithelium (forelimb level) only emerges in 3-to-4-day old embryos. This could be due to a lack
of INM at early stages of neural plate/tube development. This is unlikely since apical mitoses
have been observed even at open neural plate stages in chick and mouse embryos [38, 39].
Alternatively, at early stages, there could be a counterbalancing post-mitotic rapid apical
removal (PRAR, Fig 8) of nuclei as part of the INM, as suggested in rats and ferrets’ brains [7,
11]. Such active basal-ward movement would prevent the early formation of a crowded apical
domain and that of a relatively loose basal domain. Neuroepithelial cells always detach from
the apical surface upon differentiation into neurons but they can also be induced to detach
from the apical surface by a local increase of the apical density of nuclei [40, 41]. Thus, it may
be important to delay apical nuclear crowding to prevent early delamination of undifferenti-
ated neural progenitors from the apical domain. Therefore, one could propose that regulation
of the intensity of INM might control the onset of neuron delamination in order to synchro-
nize neuronal differentiation with the development of the spinal cord itself. The loose basal
Fig 7. Apicobasal elongation requires a specific elongation force. Simulations with contractile apical springs, normal
INM and high noise. A, apicobasal length of the PSE (AB) and mean nuclear position along the AB axis (N) over time
expressed in micrometers (see S5 Movie). B, Number of pseudolayers of nuclei along the AB axis. C, straightness of
apical domain (net distance between the first and last apical point divided by the actual distance between these two
points). D-G, net width of apical (magenta), nuclear (black) and basal (cyan) domains of the PSE with dynamic apical-
apical springs over time with 50 (D), 40 (E) and 30% (F-G) of daughter cells being excluded from the 2D plane. For
each domain, the distance between the first and last point along the lateral axis is computed and its evolution plotted
over time. D-F, slow update of basal point positions (as in all previous Figs). G, fast update of basal point positions
(twice faster). Each simulation was performed over 480 iterations (48h of biological time) for 10 repetitions. Each curve
represents the mean value of each dataset for the parameter plotted.
https://doi.org/10.1371/journal.pcbi.1007171.g007
Interkinetic movements impact the growth of pseudostratified epithelia
PLOS Computational Biology | https://doi.org/10.1371/journal.pcbi.1007171 December 23, 2019 13 / 24

region may also be needed to accommodate the cell body of delaminating neurons which accu-
mulate in the basal side of the epithelium. In addition, or alternatively, INM might control the
onset of neuron delamination in order to synchronize neuronal differentiation with the devel-
opment of adjacent structures awaiting innervation. For instance, it would be interesting to see
if somites (or the myotome), which produce muscles to be innervated, interfere with the pat-
terns of INM in the adjacent neural tube.
Apical contractility is known to be essential to promote the apicobasal elongation driving
the switch from squamous to cuboidal epithelial sheets [36]. Yet, in our simulation apical con-
tractility was a poor driver of apicobasal elongation. This is likely due to the fact that in elon-
gated PSE the apical surface is small compared to the size of the basolateral membrane of cells.
In the trunk of a 2-day old chicken embryo, the diameter of the apical surface is around 5
microns whereas cells are already 50 microns tall. Thus, any change of the apical size will only
have a marginal effect on cell height. At early stages, during the folding of the neural plate,
actomyosin contractility is important and Rho and myosin are detected in the apical region of
most neuroepithelial cells [42]. It is proposed that apical contractility may drive cell shape
changes contributing to neural plate bending. However, the region that undergoes the most
dramatic change of shape, the medial hinge point located at the midline above the notochord,
has little and only transient accumulation of Rho. In addition, in mice with targeted defects in
cytoskeletal genes, neurulation of the caudal neural tube is rarely affected [43]. Following
observations in chick [44] and mouse [38, 45] embryos, it was alternatively proposed, that the
change in cell shape at the medial hinge point could be driven by local differences in INM in
the neural plate, with cells above the notochord having longer S-phase. The nuclei would
spend more time in the basal regions favoring an enlargement of the basal domain. This would
Fig 8. Interplay between INM, proliferation and cell adhesion in the context of a specific apicobasal elongation
program are needed to recapitulate normal PSE dynamics. Green arrows indicate positive action, red arrows
indicate negative/inhibitory action. Dotted line indicate weaker effect than plain lines. PRAM, pre-mitotic rapid apical
migration; PRAR, post-mitotic rapid apical removal; INM, interkinetic nuclear movement.
https://doi.org/10.1371/journal.pcbi.1007171.g008
Interkinetic movements impact the growth of pseudostratified epithelia
PLOS Computational Biology | https://doi.org/10.1371/journal.pcbi.1007171 December 23, 2019 14 / 24

let cells adopt a pyramidal shape promoting tissue folding. As for the effect of apical contractil-
ity, a longer S-phase is unlikely to generate any significant change in cell shape in elongated
PSE since the width of the nucleus only represent a small fraction of the total cell height. It is
interesting to note that while the intermediate region of the neuroepithelium exhibits a fast lin-
ear increase in apicobasal size from 2 to 4 days of development, the cells located in the floor
plate of the neural tube do not change significantly in height during this period. If indeed their
pyramidal shape is linked to a specific cell cycle with a long S-phase, this relationship can only
be maintained if the cells do not elongate beyond a size that would mitigate the effect of the
position of the nucleus. Furthermore, some PSE, such as the retina, exhibit an extreme curva-
ture and cells are relatively short along the apicobasal axis. It would be interesting to explore
the putative contribution of specific INM patterns to the cell and tissue shape. In particular, it
would be interesting to see whether a longer S-phase or active basal-ward movements might
contribute to cell wedging and tissue folding together with apical contractility or other actin
based mechanism such as the actomyosin-dependent apicobasal pulling that has been
described in the drosophila leg disc [46].
Histological analyses in mice with CAKUT (congenital anomalies of the kidney and urinary
tract) or EA/TEF (Esophageal atresia/tracheoesophageal fistula) [2, 3] show a correlation
between tissue expansion defects and local lack of INM. The local loss of INM (basal mitoses)
correlates with problems of convergence extension and defects in tissue separation which were
proposed to be due to a loss of apicobasal polarity in these syndromes. Interestingly, INM is
not a permanent feature of all PSE. In mouse, INM stops around E13 in the esophagus mean-
ing that from this stage basal mitoses naturally occur in this tissue [2]. By contrast, by E14,
INM and apical mitoses can still be observed in the brain, the trachea, the ureter and the intes-
tine. As with the correlation between lack of expansion and lack of INM in the aforementioned
syndromes, it was proposed that INM might be a driving force of tissue expansion, since the
organs in which it persists expand at a faster rate than the overall growth of the embryo at
these stages. Here we show that INM directly contributes to expansion of the apical domain
and thus promotes growth in axes perpendicular to the apicobasal axis (DV, AP). In vivo,
other mechanisms likely contribute to tissue expansion along the dorsoventral or anteropos-
terior axis. One possibility is cell intercalation. This has been observed during neurulation in
mouse [38]. The dorsal regions of the neural plate grow faster than the ventral regions. This is
due in part to a faster cell cycle but also to significant cell intercalation from ventral to dorsal.
Another mechanism that could contribute to tissue expansion in one direction is the orien-
tation of mitotic spindles. It was observed in the chick neural tube that, at early stages (HH7 to
HH12, corresponding to 24 to 44h of incubation), most mitoses (circa 55%) were oriented
along the anteroposterior axis [39]. Such percentages would correspond to an exclusion rate of
daughter cells of 27% in our simulation. Therefore, with such a biased orientation, prolifera-
tion would favor anteroposterior elongation of the neuroepithelium compared to expansion in
apicobasal and dorsoventral orientations. In addition, in most PSE studied, the mean cell cycle
length tends to change over time. It can get longer as in the caudal neural tube [35] and in the
brain [47] or shorter as in the ureteric epithelium [3] and the midgut [48]. Changes in cell
cycle length will obviously change the rate at which a tissue increases in terms of cell number
but will also affect the frequency of INM events. Given that apical localization of mitoses drives
expansion of the apical domain by opposing apical contractility, such changes in cell cycle
pace may also affect tissue shape. Indeed, in our simulations, imbalances in proliferation and
apical contractility were sufficient to promote either bending or buckling of the apical surface
(see S5 Movie). To maintain tissue shape and straightness of the apical domain, the rapid
expansion of the apical domain needs to be compensated by an equivalent expansion of the
basal domain or hindered by extensive apical contractility.
Interkinetic movements impact the growth of pseudostratified epithelia
PLOS Computational Biology | https://doi.org/10.1371/journal.pcbi.1007171 December 23, 2019 15 / 24

Further, defects in microtubule dynamics can lead to lissencephaly and microcephaly two
common neurodevelopmental defects due to improper growth of the brain. This prompted
some to suggest that impaired INM, a microtubule-dependent phenomenon, might contribute
to these pathologies [49, 50]. However, all of these microtubule-related defects have also prob-
lems in neuronal migration, mitotic spindle positioning and proliferation making it difficult to
identify the effects specifically due to a lack of INM.
Finally, our data indicate that apicobasal elongation is not a consequence of nuclear crowd-
ing linked to the increasing pseudostratification but is likely to require a specific cell elonga-
tion program. This is corroborated by the observation that during Xenopus neurulation the
neuroepithelium thickens while not being pseudostratified [51], indicating that indeed length-
ening along the apicobasal axis and pseudostratification are uncoupled. In the model, we gen-
erated the elongation force using an artificially increased nuclear noise. Given that, outside of
PRAM, such large scale random nuclear movements were never observed in the chick neuroe-
pithelium, it is very unlikely that in vivo apicobasal elongation comes from a progressive
increase in random nuclear movements. Most likely, it comes from an extensive reorganiza-
tion of the cytoskeleton. Experimentally disentangling the various putative cytoskeleton-
related mechanisms involved in INM (PRAM or PRAR) and cell elongation will require the
generation of new tools for the fine-tuning of specific subsets of actin/tubulin dynamics over
long periods of time (hours to days) without affecting proliferation.
Materials and methods
Ethics statement
This research only used chicken embryos at early stages of development (before the 6th day).
None of the procedures fall under legal requirements for animal use and can be performed by
anyone without animal licence.
Chicken eggs
Fertilized chicken eggs were obtained from S.C.A.L (Societe Commerciale Avicole du Langue-
doc) and incubated at 38˚C until the desired stage [28].
Enzymatic and drug treatments
10-somite long portion of the trunk at the level of the prospective forelimb region were dis-
sected from embryos at stage HH12. Explants were then cultured in suspension in DMEM for
2 hours at 37˚C with Rock inhibitor (Y27632), Rac1 inhibitor (NSC 23766) at 400 μM, 1/250
dilution from 100mM stock solution or Dispase II (Stem Cell Technologies; #07923, at 0.2U/
mL). All drugs are dissolved in DMSO, therefore control conditions for the drugs correspond
to DMSO only at 0.4% in DMEM.
TUNEL assay
Trunk explants were dissected and incubated in suspension under control, DMSO or Rock
inhibitor conditions, fixed in formaldehyde 4% in PBS1X, washed in PBS 0.1% Tween and
incubated overnight with the terminal transferase (Invitrogen, dTT 1730750) and a Dig-UTP
nucleotide mix (Roche, 11093088910). The Dig-UTP was then detected using and anti-Dig
coupled with alkaline phosphatase using NBT/BCIP as a substrate to generate a purple precipi-
tate at the site of DNA degradation.
Interkinetic movements impact the growth of pseudostratified epithelia
PLOS Computational Biology | https://doi.org/10.1371/journal.pcbi.1007171 December 23, 2019 16 / 24

Histology and staining of chicken embryo samples
Fixed embryos were soaked in Phosphate Buffer 15% sucrose overnight at 4˚C. Then, embryos
were transferred for 2 hours in gelatin 7.5%/ sucrose 15%. Small weighing boats are used as
molds. A small layer of gelatin/sucrose is deposited at the bottom and left to set. Embryos are
then transferred on the gelatin layer using a 2.5mL plastic pipette. Each embryo is placed in a
single drop and left to set. Once all drops are set, an excess of gelatin/sucrose solution is poured
on to the weighing boat to fill it. Once again gelatin is left to set on the bench. After setting, the
dish is placed at 4˚C for 1 hour to harden the gelatin. Once ready, the block of gelatin contain-
ing the embryos is placed under a dissecting microscope and individual blocks are carved to
position the embryos in the desired orientation for sectioning. Cryosections were performed
using a Leica CM1950 cryostat. Sections were incubated in PBS1X at 42˚C for 30 minutes to
remove the gelatin, treated with PBS1X, 1% triton, 2% serum for permeabilization and block-
ing. Primary antibodies were diluted in PBS1X 2% newborn calf serum and applied overnight
at 4˚C under a coverslip. Secondary antibodies were diluted in PBS1X and applied for 2 hours
at room temperature. Washes were done in PBS1X. Antibodies used: mouse anti-phospho-his-
tone 3 (Cell Signaling, MA312B). Counterstaining for actin and DNA was done with Phalloi-
din (1/1000) and DAPI (1/1000).
Suspension of neuroepithelial cells
Samples of the whole trunk between somite 15 and 20 were taken from embryos at 2, 3 and 4
days of development. The explants were incubated in Dispase II (Stem Cell Technologies;
#07923, at 1U/mL in DMEM) at 37˚C for 20 minutes to degrade collagens and fibronectin.
Tissues were then separated using mounted needles. Neural tube explants were then incubated
in a trypsin solution (ThermoFisher, 25300054) to generate single cells. From neural tube
explants from 3-day and 4-day old embryos, numerous cells (most likely neurons) did not
adopt a round morphology after dissociation, instead they maintained an elongated fiber-like
morphology and accumulated at the bottom of the tubes. They were not included in the super-
natant used for cell diameter analysis.
Open book observation
Samples of the whole trunk between somite 15 and 20 were taken from embryos at 2, 3 and 4
days of development. The neural tube was open from its dorsal side using forceps. The tip of
one forceps is inserted in the neural tube lumen and moved along the anteroposterior axis to
open the whole explant. Explants are then squeezed in between two coverslips to maintain
them open. Apical side is positioned face down on an inverted microscope for observation.
Imaging
Confocal images were taken on a Zeiss 710 confocal microscope. Whole mount images were
acquired on a Leica MZ10F.
Statistics
Statistical analyses of in vivo data were performed with Prism 6 (GraphPad). Datasets were
tested for Gaussian distribution. Student t-tests or ANOVA followed by multiple comparisons
were used with the appropriate parameters depending on the Gaussian vs non-Gaussian char-
acteristics of the data distribution. Significance threshold was set at p<0.05.
Interkinetic movements impact the growth of pseudostratified epithelia
PLOS Computational Biology | https://doi.org/10.1371/journal.pcbi.1007171 December 23, 2019 17 / 24

In silico simulations and associated plots
The code was written in Fortran90 in sequential mode and the simulations were performed on
a DELL Precision T7810 with windows 8.1, 64 bits of RAM, with two CPU Intel Xeon E52637
3.8 GHZ processors. The computational time of each simulation of the tissue evolution for 48
hours (480 time iterations) ranges from 8 minutes with 30 cells and no proliferation to approx-
imately 40 minutes with proliferation and the exclusion rate of daughter cells set to 0%. For
each set of in silico conditions at least 10 repetitions were performed. Data were processed
using MatLab R2017b. Plots: for simplicity, mean values of each parameter were plotted at
every 40 iterations (4hours) over 480 iterations (48h) and error bars were not displayed. An
example of error bars representing standard deviation can be seen on S6 Fig. To help visualiz-
ing differences between each in silico conditions, min and max values of equivalent graphs
across the various Figs were kept constant.
Supporting information
S1 Fig. Anteroposterior growth from the forelimb to the tail bud from 2 to 4 days of devel-
opment. A. Representative images of chicken embryos at stage HH13-, 18 and 23 correspond-
ing to 48, 72 and 96 hours of incubation. The cephalic region of the embryo at stage HH18
removed prior to the picture. The green dotted line indicates the regions that was measured. B,
plot of the mean length of the portion indicated in green in panel A. Dots represent the mean,
error bars indicate standard deviation. Raw data of all plots provided in the S1 Spreadsheet.
(TIF)
S2 Fig. Maintenance of neuroepithelial architecture requires actomyosin contractility. A,
Explants of the trunk are incubated in suspension with culture medium, culture medium with
DMSO or culture medium with ROCK inhibitor (Y27632, 400μM) or Rac1 inhibitor
(NSC27633, 400μM). B, Transversal sections with nuclear (DAPI, grey) and actin staining
(Phalloidin, green). C, apicobasal length. D, number of pseudolayers of nuclei. E, straightness
of the apical domain. F, shape of nuclei. G, position of mitoses, at scale with the tissue. H, posi-
tion of mitoses, raw data (embryos/mitoses: ncontrol = 2/42, nDMSO = 2/66, nROCK = 3/153,
nRAC1 = 4/98; Kruskal-Wallis followed by multiple comparisons; ����, p<0.0001). Box and
whiskers plot: the box extends from the 25th to the 75th percentile; the whiskers show the
extent of the whole dataset. The median is plotted as a line inside the box. Raw data of all plots
provided in the S1 Spreadsheet.
(TIF)
S3 Fig. Inhibition of ROCK does not lead to cell death. A-E, transversal sections of chick
trunk explants after a 2-hour incubation in suspension in culture medium (A, control; n = 4
embryos), supplemented with DMSO (B-C, DMSO; n = 6 embryos) or with the ROCK inhibi-
tor at 400μm (D-E; n = 5 embryos) followed by fixation, TUNEL assays revealed by NBT/BCIP
(purple precipitate) and cryosectioning. C and E show portions of the extraembryonic tissues
where positive cells for TUNEL were detected in the DMSO and ROCK inhibitor conditions.
No TUNEL staining was found in the surface ectoderm, the neural tube, the paraxial meso-
derm nor the notochord in either condition. D’, is a zoom of the ROCK inhibitor condition
where one can see that tissue deformation caused by the treatment is not accompanied by a
massive induction of cell death (no TUNEL-positive cells). All images are at the same scale
apart from the zoom in D’ which is magnified twice compared to its cognate low magnification
image shown in D.
(TIF)
Interkinetic movements impact the growth of pseudostratified epithelia
PLOS Computational Biology | https://doi.org/10.1371/journal.pcbi.1007171 December 23, 2019 18 / 24

S4 Fig. Impairing cell-matrix adhesion leads to changes in nuclear, cell and tissue shape. A,
Explants of the trunk are incubated in suspension with culture medium (DMEM; n = 6
embryos) or culture medium with Dispase (0.2U/mL; n = 6 embryos). B, Transversal sections
with nuclear staining (DAPI, grey) and immunostaining for Fibronectin, laminin or N-cad-
herin (green). C, apicobasal length. D, number of pseudolayers of nuclei. E, straightness of the
apical domain. F, shape of nuclei. G, position of mitoses, at scale with the tissue. H, position of
mitoses, raw data (nDMEM = 46, nDispase = 46; ��non-parametric t-test p = 0.0017). Box and
whiskers plot: the box extends from the 25th to the 75th percentile; the whiskers show the
extent of the whole dataset. The median is plotted as a line inside the box. Raw data of all plots
provided in the S1 Spreadsheet.
(TIF)
S5 Fig. Restricting lateral expansion does not compensate for the lack of apical contractil-
ity. Simulations with passive apical springs, normal INM with different rates of exclusion of
daughter cells as in Fig 5 and lateral walls. A, apicobasal length of the PSE (AB) and mean
nuclear position along the AB axis (N) over time expressed in micrometers (see S5 Movie). B,
Number of pseudolayers of nuclei along the AB axis. C, straightness of apical domain (net dis-
tance between the first and last apical point divided by the actual distance between these two
points). D-F, net width of apical (magenta), nuclear (black) and basal (cyan) domains of the
PSE with 50 (D), 40 (E) and 30% (F) of daughter cells being excluded from the 2D plane. For
each domain, the net distance between the first and last point along the lateral axis is computed
and its evolution plotted over time. Note that for all conditions the net width of each domain
is constant over time confirming that the imposed lateral walls are indeed preventing lateral
expansion. Raw data of all plots provided in the S1 Spreadsheet.
(TIF)
S6 Fig. INM opposes apicobasal elongation, even with high random nuclear noise. A, Mean
apicobasal (AB, open circle) and nuclear-basal (N, closed circles) lengths with normal INM
(black) and low INM (red). Note that mean tissue height goes from 75μm to 89μm in absence
of INM. In the meantime, mean nuclear height goes from 51μm to 48μm representing a shift
from being located within the most apical top third of the tissue with normal INM (51μm
/75μm = 68%) to being located midway between the apical and basal domains (48μm/
89μm = 54%). B-C, Net width of apical (magenta), nuclear (black) and basal (cyan) domains
with normal INM (B) or low INM conditions (C). Note that low INM conditions lead to a
shrinkage of the apical domain (arrow). Error bars represent standard deviation. Raw data of
all plots provided in the S1 Spreadsheet.
(TIF)
S1 Table. List of parameters used in each simulation presented on Figs 3–5, 7, S5 and S6.
Yellow, passive apical-apical springs; Green, contractile apical-apical springs; blue frame, fast
update of basal points; magenta, high random nuclear movement (noise); light grey, no prolif-
eration and no INM; dark grey, low INM; bold text, normal INM conditions. The following
parameters were common to all simulations: radius of nucleus soft core (Rs = 5μm), radius of
nucleus hard core (Rh_S = 1.5μm), radius of nucleus hard core during mitosis (Rh_M =
3.5μm), maximum distance between two consecutive apical points (a0 = 1/6�Rs), maximum
distance between two consecutive basal points (b0 = 1/6�Rs). The relative strengths of the vari-
ous forces was set as follows: stiffness of soft core of the nucleus (alpha_X = 1), stiffness of api-
cal-nucleus spring (alpha_aX = 2), stiffness of nucleus-basal spring (alpha_bX = 2), stiffness of
apical-apical spring (alpha_aS = 5), stiffness of apical-apical spring during G2 phase and
Interkinetic movements impact the growth of pseudostratified epithelia
PLOS Computational Biology | https://doi.org/10.1371/journal.pcbi.1007171 December 23, 2019 19 / 24
mitosis (alpha_aM = 10), magnitude of the apical-nucleus-basal alignment force
(alpha_ab = 15).
(TIF)
S1 Movie. (related to Fig 2). Mosaic expression of membrane-GFP (green) and membrane-
mCherry (red) into the chick neuroepithelium at stage HH14 at the level of the intermediate
neural tube. Nuclei are counterstained with DAPI (grey).
(MOV)
S2 Movie. (related to Figs 3 and 4). All simulations start with 30 cells. Exclusion rate of
daughter cells is set to 50% keeping the total cell number constant. Top panels: simulations
with passive apical-apical springs without INM (left), with low INM (middle), with normal
INM (right). Bottom panels: simulations with contractile apical-apical springs without INM
(left), with low INM (middle), with normal INM (right). Note that in absence of INM there is
a rapid shrinkage of the apical domain giving the tissue a pyramidal shape. Also, INM leads
the rapid emergence of a low nuclear density region basally. Only hard cores of nuclei, apical
points and basal points are represented. Soft cores of nuclei and springs are not displayed. Red,
cells in mitosis; yellow cells in PRAM/active G2; black line, tracking of nuclei in PRAM/G2
and M. Each frame corresponds to one iteration of the simulation (circa. 6 minutes of biologi-
cal time). Total duration 480 iterations (48h of biological time).
(MOV)
S3 Movie. (related to Fig 5). All simulations start with 30 cells with normal INM. From left to
right, exclusion rate of daughter cells is set to 50% (constant cell number), 40%, 30%, 0% (all
daughter cells added to the 2D plane). Top panels: simulations with passive apical-apical
springs. Bottom panels: simulations with contractile apical-apical springs. Note that contractile
apical springs mitigates buckling of the apical domain and feeds back into basal rearrange-
ments. Red, cells in mitosis; yellow cells in PRAM/active G2; black line, tracking of nuclei in
PRAM/G2 and M. Each frame corresponds to one iteration of the simulation (circa. 6 minutes
of biological time). Total duration 480 iterations (48h of biological time).
(MOV)
S4 Movie. (related to S5 Fig). All simulations start with 30 cells with normal INM, passive api-
cal springs and lateral walls (dashed lines). From left to right, exclusion rate of daughter cells is
set to 50% (constant cell number), 40%, 30%.
(MOV)
S5 Movie. (related to Fig 7). All simulations start with 30 cells with normal INM and a 25-fold
increase of random nuclear displacement at each iteration (noise) compared to previous simu-
lations. From left to right, exclusion rate of daughter cells is set to 50% (constant cell number),
40% and 30%. The fourth condition at the far-right is with 30% of exclusion rate and fast
update of basal points. Note that the global non-oriented force generated by increased noise is
converted into apicobasal elongation. Also, allowing fast reorganization of the basal points
promotes isotropic expansion of the apical and basal domain. Red, cells in mitosis; yellow, cells
in PRAM/active G2; black line, tracking of nuclei in PRAM/G2 and M. Each frame corre-
sponds to one iteration of the simulation (circa. 6 minutes of biological time). Total duration
480 iterations (48h of biological time).
(MOV)
S6 Movie. (related to S6 Fig). Simulations start with 30 cells. Exclusion rate is set to 50% (con-
stant cell number). Left panel, normal INM. Right panel, low INM conditions. Note that with-
out normal INM the apicobasal expansion is faster and that there is a shrinkage of the apical
Interkinetic movements impact the growth of pseudostratified epithelia
PLOS Computational Biology | https://doi.org/10.1371/journal.pcbi.1007171 December 23, 2019 20 / 24

domain.
(MOV)
S1 Information. This file contains the details about the mathematical model.
(PDF)
S1 Spreadsheet. This file contains raw data for all plots in main and supplementary figures.
(XLSX)
Acknowledgments
We thank Drs Sara Merino-Aceituno, Samuel Tozer, Bertrand Benazeraf, Fabienne Pituello,
Julie Batut, Ariane Trescases and Elisa Marti for critical reading of the manuscript. We are
grateful to Dr. Diane Peurichard for helpful comments on the code and to Dr Angie Molina
for providing the data to estimate the diffusion coefficient.
Author Contributions
Conceptualization: Pierre Degond, Eric Theveneau.
Data curation: Evangeline Despin-Guitard, Fernando Duarte, Eric Theveneau.
Formal analysis: Marina A. Ferreira, Pierre Degond, Eric Theveneau.
Funding acquisition: Marina A. Ferreira, Pierre Degond, Eric Theveneau.
Investigation: Marina A. Ferreira, Evangeline Despin-Guitard, Fernando Duarte, Pierre
Degond, Eric Theveneau.
Methodology: Marina A. Ferreira, Evangeline Despin-Guitard, Pierre Degond, Eric
Theveneau.
Project administration: Pierre Degond, Eric Theveneau.
Resources: Pierre Degond, Eric Theveneau.
Software: Marina A. Ferreira, Pierre Degond.
Supervision: Pierre Degond, Eric Theveneau.
Validation: Marina A. Ferreira, Eric Theveneau.
Visualization: Marina A. Ferreira.
Writing – original draft: Marina A. Ferreira, Pierre Degond, Eric Theveneau.
Writing – review & editing: Marina A. Ferreira, Evangeline Despin-Guitard, Pierre Degond,
Eric Theveneau.
References1. Norden C. Pseudostratified epithelia—cell biology, diversity and roles in organ formation at a glance.
Journal of cell science. 2017; 130(11):1859–63. https://doi.org/10.1242/jcs.192997 PMID: 28455413.
2. Kaneda R, Saeki Y, Getachew D, Matsumoto A, Furuya M, Ogawa N, et al. Interkinetic nuclear migra-
tion in the tracheal and esophageal epithelia of the mouse embryo: Possible implications for tracheo-
esophageal anomalies. Congenit Anom (Kyoto). 2018; 58(2):62–70. https://doi.org/10.1111/cga.12241
PMID: 28782137.
3. Motoya T, Ogawa N, Nitta T, Rafiq AM, Jahan E, Furuya M, et al. Interkinetic nuclear migration in the
mouse embryonic ureteric epithelium: Possible implication for congenital anomalies of the kidney and
urinary tract. Congenit Anom (Kyoto). 2016; 56(3):127–34. https://doi.org/10.1111/cga.12150 PMID:
26710751.
Interkinetic movements impact the growth of pseudostratified epithelia
PLOS Computational Biology | https://doi.org/10.1371/journal.pcbi.1007171 December 23, 2019 21 / 24

4. Spear PC, Erickson CA. Interkinetic nuclear migration: a mysterious process in search of a function.
Development, growth & differentiation. 2012; 54(3):306–16. https://doi.org/10.1111/j.1440-169X.2012.
01342.x PMID: 22524603; PubMed Central PMCID: PMC3357188.
5. Spear PC, Erickson CA. Apical movement during interkinetic nuclear migration is a two-step process.
Developmental biology. 2012; 370(1):33–41. https://doi.org/10.1016/j.ydbio.2012.06.031 PMID:
22884563; PubMed Central PMCID: PMC3935435.
6. Kosodo Y, Suetsugu T, Suda M, Mimori-Kiyosue Y, Toida K, Baba SA, et al. Regulation of interkinetic
nuclear migration by cell cycle-coupled active and passive mechanisms in the developing brain. The
EMBO journal. 2011; 30(9):1690–704. https://doi.org/10.1038/emboj.2011.81 PMID: 21441895;
PubMed Central PMCID: PMC3101991.
7. Tsai JW, Lian WN, Kemal S, Kriegstein AR, Vallee RB. Kinesin 3 and cytoplasmic dynein mediate inter-
kinetic nuclear migration in neural stem cells. Nature neuroscience. 2010; 13(12):1463–71. https://doi.
org/10.1038/nn.2665 PMID: 21037580; PubMed Central PMCID: PMC3059207.
8. Yu J, Lei K, Zhou M, Craft CM, Xu G, Xu T, et al. KASH protein Syne-2/Nesprin-2 and SUN proteins
SUN1/2 mediate nuclear migration during mammalian retinal development. Human molecular genetics.
2011; 20(6):1061–73. https://doi.org/10.1093/hmg/ddq549 PMID: 21177258; PubMed Central PMCID:
PMC3043658.
9. Norden C, Young S, Link BA, Harris WA. Actomyosin is the main driver of interkinetic nuclear migration
in the retina. Cell. 2009; 138(6):1195–208. https://doi.org/10.1016/j.cell.2009.06.032 PMID: 19766571;
PubMed Central PMCID: PMC2791877.
10. Schenk J, Wilsch-Brauninger M, Calegari F, Huttner WB. Myosin II is required for interkinetic nuclear
migration of neural progenitors. Proceedings of the National Academy of Sciences of the United States
of America. 2009; 106(38):16487–92. https://doi.org/10.1073/pnas.0908928106 PMID: 19805325;
PubMed Central PMCID: PMC2752599.
11. Okamoto M, Shinoda T, Kawaue T, Nagasaka A, Miyata T. Ferret-mouse differences in interkinetic
nuclear migration and cellular densification in the neocortical ventricular zone. Neuroscience research.
2014; 86:88–95. https://doi.org/10.1016/j.neures.2014.10.006 PMID: 24780233.
12. Osborne JM, Fletcher AG, Pitt-Francis JM, Maini PK, Gavaghan DJ. Comparing individual-based
approaches to modelling the self-organization of multicellular tissues. PLoS computational biology.
2017; 13(2):e1005387. https://doi.org/10.1371/journal.pcbi.1005387 PMID: 28192427; PubMed Central
PMCID: PMC5330541.
13. Ishihara S, Marcq P, Sugimura K. From cells to tissue: A continuum model of epithelial mechanics.
Phys Rev E. 2017; 96(2–1):022418. https://doi.org/10.1103/PhysRevE.96.022418 PMID: 28950595.
14. Kopf MH, Pismen LM. A continuum model of epithelial spreading. Soft matter. 2013; 9(14):3727–34.
https://doi.org/10.1039/c3sm26955h WOS:000316118300005.
15. Streichan SJ, Hoerner CR, Schneidt T, Holzer D, Hufnagel L. Spatial constraints control cell prolifera-
tion in tissues. Proceedings of the National Academy of Sciences of the United States of America.
2014; 111(15):5586–91. https://doi.org/10.1073/pnas.1323016111 PMID: 24706777; PubMed Central
PMCID: PMC3992650.
16. Hannezo E, Prost J, Joanny JF. Theory of epithelial sheet morphology in three dimensions. Proceed-
ings of the National Academy of Sciences of the United States of America. 2014; 111(1):27–32. https://
doi.org/10.1073/pnas.1312076111 PMID: 24367079; PubMed Central PMCID: PMC3890844.
17. Zimmermann J, Camley BA, Rappel WJ, Levine H. Contact inhibition of locomotion determines cell-cell
and cell-substrate forces in tissues. Proceedings of the National Academy of Sciences of the United
States of America. 2016; 113(10):2660–5. https://doi.org/10.1073/pnas.1522330113 PMID: 26903658;
PubMed Central PMCID: PMC4791011.
18. Alt S, Ganguly P, Salbreux G. Vertex models: from cell mechanics to tissue morphogenesis. Philosophi-
cal transactions of the Royal Society of London Series B, Biological sciences. 2017; 372(1720). https://
doi.org/10.1098/rstb.2015.0520 PMID: 28348254; PubMed Central PMCID: PMC5379026.
19. Byrne H, Drasdo D. Individual-based and continuum models of growing cell populations: a comparison.
Journal of mathematical biology. 2009; 58(4–5):657–87. https://doi.org/10.1007/s00285-008-0212-0
PMID: 18841363.
20. Scianna M, Preziosi L, Wolf K. A Cellular Potts Model simulating cell migration on and in matrix environ-
ments. Math Biosci Eng. 2013; 10(1):235–61. https://doi.org/10.3934/mbe.2013.10.235 PMID:
23311371.
21. Plank MJ, Simpson MJ. Models of collective cell behaviour with crowding effects: comparing lattice-
based and lattice-free approaches. Journal of the Royal Society, Interface / the Royal Society. 2012; 9
(76):2983–96. https://doi.org/10.1098/rsif.2012.0319 PMID: 22696488; PubMed Central PMCID:
PMC3479911.
Interkinetic movements impact the growth of pseudostratified epithelia
PLOS Computational Biology | https://doi.org/10.1371/journal.pcbi.1007171 December 23, 2019 22 / 24

22. Meinecke L, Eriksson M. Excluded volume effects in on- and off-lattice reaction-diffusion models. Iet
Syst Biol. 2017; 11(2):55–64. https://doi.org/10.1049/iet-syb.2016.0021 WOS:000398811200001.
PMID: 28476973
23. Farhadifar R, Roper JC, Aigouy B, Eaton S, Julicher F. The influence of cell mechanics, cell-cell interac-
tions, and proliferation on epithelial packing. Current biology: CB. 2007; 17(24):2095–104. https://doi.
org/10.1016/j.cub.2007.11.049 PMID: 18082406.
24. Fletcher AG, Osterfield M, Baker RE, Shvartsman SY. Vertex models of epithelial morphogenesis. Bio-
physical journal. 2014; 106(11):2291–304. https://doi.org/10.1016/j.bpj.2013.11.4498 PMID:
24896108; PubMed Central PMCID: PMC4052277.
25. Staple DB, Farhadifar R, Roper JC, Aigouy B, Eaton S, Julicher F. Mechanics and remodelling of cell
packings in epithelia. Eur Phys J E Soft Matter. 2010; 33(2):117–27. https://doi.org/10.1140/epje/i2010-
10677-0 PMID: 21082210.
26. Bock M, Tyagi AK, Kreft JU, Alt W. Generalized Voronoi Tessellation as a Model of Two-dimensional
Cell Tissue Dynamics. Bulletin of mathematical biology. 2010; 72(7):1696–731. https://doi.org/10.1007/
s11538-009-9498-3 WOS:000282427900003. PMID: 20082148
27. Meineke FA, Potten CS, Loeffler M. Cell migration and organization in the intestinal crypt using a lattice-
free model. Cell proliferation. 2001; 34(4):253–66. https://doi.org/10.1046/j.0960-7722.2001.00216.x
WOS:000170564500006. PMID: 11529883
28. Hamburger V, Hamilton HL. A series of normal stages in the development of the chick embryo. 1951.
Developmental dynamics: an official publication of the American Association of Anatomists. 1992; 195
(4):231–72. https://doi.org/10.1002/aja.1001950404 PMID: 1304821.
29. Strzyz PJ, Matejcic M, Norden C. Heterogeneity, Cell Biology and Tissue Mechanics of Pseudostratified
Epithelia: Coordination of Cell Divisions and Growth in Tightly Packed Tissues. Int Rev Cell Mol Biol.
2016; 325:89–118. https://doi.org/10.1016/bs.ircmb.2016.02.004 PMID: 27241219.
30. Van Liedekerke P, Palm MM, Jagiella N, Drasdo D. Simulating tissue mechanics with agent-based
models: concepts, perspectives and some novel results. Comput Part Mech. 2015; 2(4):401–44. https://
doi.org/10.1007/s40571-015-0082-3 WOS:000417453500008.
31. Pfisterer K, Jayo A, Parsons M. Control of nuclear organization by F-actin binding proteins. Nucleus.
2017; 8(2):126–33. https://doi.org/10.1080/19491034.2016.1267093 PMID: 28060557; PubMed Cen-
tral PMCID: PMC5403142.
32. Zlotek-Zlotkiewicz E, Monnier S, Cappello G, Le Berre M, Piel M. Optical volume and mass measure-
ments show that mammalian cells swell during mitosis. The Journal of cell biology. 2015; 211(4):765–
74. https://doi.org/10.1083/jcb.201505056 PMID: 26598614; PubMed Central PMCID: PMC4657168.
33. Son S, Kang JH, Oh S, Kirschner MW, Mitchison TJ, Manalis S. Resonant microchannel volume and
mass measurements show that suspended cells swell during mitosis. The Journal of cell biology. 2015;
211(4):757–63. https://doi.org/10.1083/jcb.201505058 PMID: 26598613; PubMed Central PMCID:
PMC4657169.
34. Degond P, Ferreira MA, Motsch S. Damped Arrow-Hurwicz algorithm for sphere packing. J Comput
Phys. 2017; 332:47–65. https://doi.org/10.1016/j.jcp.2016.11.047 WOS:000393250800003.
35. Molina A, Pituello F. Playing with the cell cycle to build the spinal cord. Developmental biology. 2017;
432(1):14–23. https://doi.org/10.1016/j.ydbio.2016.12.022 PMID: 28034699.
36. St Johnston D, Sanson B. Epithelial polarity and morphogenesis. Current opinion in cell biology. 2011;
23(5):540–6. https://doi.org/10.1016/j.ceb.2011.07.005 PMID: 21807488.
37. Ladoux B, Mege RM, Trepat X. Front-Rear Polarization by Mechanical Cues: From Single Cells to Tis-
sues. Trends in cell biology. 2016; 26(6):420–33. https://doi.org/10.1016/j.tcb.2016.02.002 PMID:
26920934; PubMed Central PMCID: PMC5421599.
38. McShane SG, Mole MA, Savery D, Greene ND, Tam PP, Copp AJ. Cellular basis of neuroepithelial
bending during mouse spinal neural tube closure. Developmental biology. 2015; 404(2):113–24. https://
doi.org/10.1016/j.ydbio.2015.06.003 PMID: 26079577; PubMed Central PMCID: PMC4528075.
39. Sausedo RA, Smith JL, Schoenwolf GC. Role of nonrandomly oriented cell division in shaping and
bending of the neural plate. The Journal of comparative neurology. 1997; 381(4):473–88. PMID:
9136804.
40. Miyata T, Okamoto M, Shinoda T, Kawaguchi A. Interkinetic nuclear migration generates and opposes
ventricular-zone crowding: insight into tissue mechanics. Frontiers in cellular neuroscience. 2014;
8:473. https://doi.org/10.3389/fncel.2014.00473 PMID: 25674051; PubMed Central PMCID:
PMC4309187.
41. Hiscock TW, Miesfeld JB, Mosaliganti KR, Link BA, Megason SG. Feedback between tissue packing
and neurogenesis in the zebrafish neural tube. Development. 2018; 145(9). https://doi.org/10.1242/dev.
157040 PMID: 29678815; PubMed Central PMCID: PMC5992593.
Interkinetic movements impact the growth of pseudostratified epithelia
PLOS Computational Biology | https://doi.org/10.1371/journal.pcbi.1007171 December 23, 2019 23 / 24

42. Kinoshita N, Sasai N, Misaki K, Yonemura S. Apical accumulation of Rho in the neural plate is important
for neural plate cell shape change and neural tube formation. Molecular biology of the cell. 2008; 19
(5):2289–99. https://doi.org/10.1091/mbc.E07-12-1286 PMID: 18337466; PubMed Central PMCID:
PMC2366863.
43. Copp AJ. Neurulation in the cranial region—normal and abnormal. Journal of anatomy. 2005; 207
(5):623–35. https://doi.org/10.1111/j.1469-7580.2005.00476.x PMID: 16313396; PubMed Central
PMCID: PMC1571567.
44. Schoenwolf GC, Franks MV. Quantitative analyses of changes in cell shapes during bending of the
avian neural plate. Developmental biology. 1984; 105(2):257–72. https://doi.org/10.1016/0012-1606
(84)90284-7 PMID: 6479439.
45. Smith JL, Schoenwolf GC, Quan J. Quantitative analyses of neuroepithelial cell shapes during bending
of the mouse neural plate. The Journal of comparative neurology. 1994; 342(1):144–51. https://doi.org/
10.1002/cne.903420113 PMID: 8207124.
46. Monier B, Gettings M, Gay G, Mangeat T, Schott S, Guarner A, et al. Apico-basal forces exerted by apo-
ptotic cells drive epithelium folding. Nature. 2015; 518(7538):245–8. https://doi.org/10.1038/
nature14152 PMID: 25607361.
47. Mitsuhashi T, Takahashi T. Genetic regulation of proliferation/differentiation characteristics of neural
progenitor cells in the developing neocortex. Brain & development. 2009; 31(7):553–7. https://doi.org/
10.1016/j.braindev.2009.05.002 PMID: 19464833.
48. Yamada M, Udagawa J, Hashimoto R, Matsumoto A, Hatta T, Otani H. Interkinetic nuclear migration
during early development of midgut and ureteric epithelia. Anat Sci Int. 2013; 88(1):31–7. https://doi.
org/10.1007/s12565-012-0156-8 PMID: 23054939.
49. Reiner O, Sapir T. LIS1 functions in normal development and disease. Current opinion in neurobiology.
2013; 23(6):951–6. https://doi.org/10.1016/j.conb.2013.08.001 PMID: 23973156.
50. Doobin DJ, Dantas TJ, Vallee RB. Microcephaly as a cell cycle disease. Cell cycle. 2017; 16(3):247–8.
https://doi.org/10.1080/15384101.2016.1252591 PMID: 27792466; PubMed Central PMCID:
PMC5345203.
51. Inoue Y, Suzuki M, Watanabe T, Yasue N, Tateo I, Adachi T, et al. Mechanical roles of apical constric-
tion, cell elongation, and cell migration during neural tube formation in Xenopus. Biomech Model
Mechanobiol. 2016; 15(6):1733–46. https://doi.org/10.1007/s10237-016-0794-1 PMID: 27193152;
PubMed Central PMCID: PMC5106510.
Interkinetic movements impact the growth of pseudostratified epithelia
PLOS Computational Biology | https://doi.org/10.1371/journal.pcbi.1007171 December 23, 2019 24 / 24
Related Documents