Welcome message from author
This document is posted to help you gain knowledge. Please leave a comment to let me know what you think about it! Share it to your friends and learn new things together.
Transcript


Interim Report 1
CONTENTS
Vision, Mission and Values 2
Company Information 3
Shareholders’ Information 4
Company Profile 5
Directors’ Review 7
Condensed Interim Balance Sheet 8
Condensed Interim Profit and Loss Account 10
Condensed Interim Statement of Comprehensive Income 11
Condensed Interim Cash Flow Statement 12
Condensed Interim Statement of Changes in Equity 13
Selected Notes to the Condensed Interim Financial Information 14

Interim Report2
To gain and maintain leadership in the industries it competes in by producing the best quality products
with lowest possible cost.
To give the best returns to shareholders by optimal allocation of resources to the products and markets the
Company competes in.
To provide the best value products and services to its customers through investment in technology, human
resources, operational systems and processes.
To provide the best working environment to its employees and provide opportunities to them for
enhancing their skills.
To work with its farmers, suppliers and distributors as partners developing their expertise and profitability.
To pursue environment friendly policies and effectively and efficiently use all energy resources aiming for zero waste and a clean healthy environment in its vicinity.
To be a socially responsible corporate citizen supporting education, health, environment and socio
economic development of the society.
ViSiON, MiSSiON & ValuES

Interim Report 3
COMPaNY iNFORMaTiON
Board of Directors 1 Chairman (Non-Executive) Mazhar Karim 2. Chief Executive Officer Ahsan M. Saleem In alphabetic order:3. Executive Director Ali Altaf Saleem4. Non-Executive Director Khalid Bashir5. Non-Executive Director Muhammad Anwar6. Non-Executive Director Muhammad Arshad7. Non-Executive Director Rubina Rizvi (NIT)
Audit CommitteeChairman Khalid BashirMember Muhammad AnwarMember Ali Altaf Saleem
Human Resource & Remuneration CommitteeChairman Muhammad Anwar Member Khalid Bashir Member Ali Altaf Saleem
Chief Financial Officer S. M. Chaudhry
Company Secretary Asif Ali
Management Committees
Executive CommitteeChairman Ahsan M. Saleem Anjum M. Saleem Ali Altaf Saleem
Business Strategy CommitteeChairman Ahsan M. Saleem Anjum M. Saleem Ali Altaf Saleem Muhammad Pervaiz Akhter S.M. Chaudhry Manzoor Hussain Malik
System & Technology CommitteeChairman Muhammad Pervaiz Akhtar S.M. Chaudhry Ibrahim Ahmad Cheema

Interim Report4
Stock Exchange Listing Shakarganj Mills Limited is a listedcompany and its shares are traded on all the three stock exchanges of Pakistan. Daily quotes on the Company’s stock can be obtained from leading newspapers. Shakarganj is listed under ‘Food Producers’
Public InformationFinancial analysts, Stock brokers,interested investors and financialmedia desiring information about“Shakarganj” should contact Asif Ali at Company’s Office, Jhang.Tel: 047 765 2801 - 06Fax: 047 765 2811E-mail: [email protected]
Shareholders’ InformationInquiries concerning lost stockcertificates, dividend payment,change of address, verification oftransfer deeds and share transfersshould be directed to CorpTec Associates (Pvt) Limited Share Registrar of the Company at Lahore.Tel: 042 3517 0336 - 7Fax: 042 3517 0338E-mail: [email protected]
Products• Sugar• BioFuel• BioPower• BuildingMaterials• Yarn
Legal AdvisorHassan & Hassan Advocates, Lahore
BankersAllied Bank LimitedMCB Bank LimitedNational Bank of PakistanThe Bank of PunjabUnited Bank LimitedStandard Chartered Bank Silk Bank LimitedBank Alfalah LimitedFaysal Bank Limited
ShaREhOldERS’ iNFORMaTiON
Works
Principal Facility
Management House, Toba Road Jhang, PakistanTel: 047 765 2801 - 06Fax: 047 765 2811E-mail: [email protected]
Satellite Facility
Shakarganj Bhone63 km Jhang Sargodha Road, Bhone, PakistanTel: 048 688 9210, 12Fax: 048 688 9211
Websitewww.shakarganj.com.pkNote: This Interim Report isavailable on Shakarganj website.
Registered and Principal Office 10th Floor, BOP Tower,10-B Block E 2, Gulberg III,Lahore, PakistanTel: 042 3578 3801- 06Fax: 042 3578 3811
Karachi Office12th Floor, Sidco Avenue Centre,264 R.A. Lines, Karachi, PakistanTel: 021 3568 8149Fax: 021 3568 0476
Faisalabad OfficeNishatabad, New Lahore Road,Faisalabad, PakistanTel: 041 875 2810Fax: 041 875 2811
Share Registrar CorpTec Associates (Pvt) Limited503-E, Johar TownLahoreTel: 042 3517 0336 - 7Fax: 042 3517 0338E-mail: [email protected]

Interim Report 5
Shakarganj Mills Limited was incorporated in Pakistan in 1967 as a Public Limited Company and is listed on all three stock exchanges of Pakistan. Shakarganj is a leading manufacturer of food products, bio fuel and building materials as well as textiles. We transform renewable crops such as sugarcane and cotton into value added products comprising refined sugar, textiles, bio fuel and building materials in addition to generating bio power from biogas. The Company has two manufacturing facilities in Jhang District. Our registered office is in Lahore.
Shakarganj Mills, through its interest in Shakarganj Food Products Limited, is also active in production of dairy and fruit products.
Sugar Business:
We have two manufacturing facilities, located in District Jhang. We produce different types of sugar comprising pharmaceutical, beverage and commercial grades sugar as well as soft brown sugar, castor and icing sugar, sugar cubes, sachets and retail packs.
Our combined crushing capacity is of 20,000 MT of sugarcane per day which is extendable to 32,000 MT per day.
Bio Fuel Business:
We have distilleries located at Jhang and Bhone where various grades of bio fuel are produced. Our products include rectified bio fuel for industrial and food grades, anhydrous bio fuel for fuel grade and extra neutral bio fuel for pharmaceutical and perfume grades. The combined capacity of our distilleries is 280,000 - 300,000 litres per day.
Bio Power Business:
Biogas power generation facility is located at Jhang. This facility comprises an Effluent Treatment Plant (ETP) and a Power Generation Facility. ETP operations involve biological treatment of distillery waste to produce methane and a biological de-sulphurization
plant to remove sulphur from the methane gas. This gas is then used in the power house to produce electricity which is sold to a utility company on the national grid. The present capacity of this plant is 8 megawatts. For better control, from January 2013 ETP has been transferred to Bio Fuel Business.
Building Materials Business:
Our Building Materials Division is located at Jhang facility, with a capability to produce 12 x 4 feet sheets of particle board of varying thickness. Our daily production capacity is 30 cubic metres.
Textile Business:
Located at Jhang, this cotton spinning unit produces carded cotton yarns ranging from 10/s to 30/s and doubled cotton yarn ranging from 8 to 15 TPI. The installed capacity is 25,856 spindles for cotton spinning and 2,304 spindles for doubling.
Farming & Allied Business:
This comprises different parcels of land mainly located at Jhang Division nearby our manufacturing facilities. Total area under cultivation is over 1,766 acres of which nearly 1,355 acres is owned land and rest is leased. The main crops include sugarcane, wheat, gram, maize, fodder and seasonal vegetables. A dairy farm located at Jhang has been developed, with a herd of 200 milking and fattening cattle. Small herd of rams and bucks for fattening purpose has also been developed.
Shakarganj has also launched a new product in the area of non chemicals fertilizers under the brand name of “Shakarganj Tiger Compost”. The product as organic fertilizer has been developed using aerobic decomposition process with addition of standardized microbial culture in filter cake. The compost is a rich source of organic matter, with macro and micro nutrients to help improve soil is very useful for better growth, yield and quality of
COMPaNY PROFilE

Interim Report6
all field crops in general and specifically for sugarcane. This is at its initial stage and would grow up in the farmer’s community with the practical exposures.
Business Vision and Strategy:
Shakarganj’s vision is to create country’s leading renewable ingredients business. We aim to achieve this by building a consistent portfolio of distinctive, profitable, high-value solutions in products and services for our customers. Shakarganj is committed to provide long-term value for our shareholders. Our strategy is to build a stronger value added business with a low-cost commodity base. We focus on five key business objectives to deliver consistent growth.
- Serve our Customers:
Delivering excellent customer service is at the core of everything we do. Our aim is to be the partner of choice in our customers’ processes and to help them develop more successful consumer products.
- Operate Efficiently and Safely:
We aim to be the lowest-cost and most efficient producer in all our markets. Through our expertise in high-volume process management, our focus is on technical and manufacturing excellence and the efficient use of services such as logistics and utilities. We are continually working to improve operational efficiency and strive to ensure safe and healthy conditions for everyone at our sites.
- Invest in Long Term Assets and Partnerships:
We continually evaluate investment opportunities that would add strategic value by enabling us to enter new markets or add products, technologies and knowledge more efficiently than we could organically. We also aim to grow our business by forming joint ventures and partnerships to enhance the capabilities of our existing product portfolio. Using alliances and joint ventures can be an efficient way to lower our cost of investing in new areas and markets, and will help secure access to new and complementary technology and expertise.
- Invest in Technology and People:
We are investing in our research and development capabilities to help us in developing innovative solutions that meet our customers’ product challenges. We are also complementing our own capabilities through business and technology partnerships, and university collaborations. To develop talent, improve leadership and help our employees succeed, we operate various programs designed to ensure the right skills at all levels to grow our business.
- Grow the Contribution from Value Added Products:
We are committed to grow the contribution from our value added products. Value added products utilize technology and intellectual property enabling us to obtain a price premium along with sustainable and/or higher margins.

Interim Report 7
I am pleased to present the unaudited condensed interim financial information of the Company for the nine months period ended 30 June 2013.
Overall performance of our Company during the period under review has remained satisfactory. Higher bio power, building material and yarn productions, and better results from associated companies all contributed our positive results i.e. an after tax profit of Rs. 428 million in nine months of FY2013 compared to Rs. 297 million incorresponding period, as detailed below:
Our Sugar Division crushed 1,409,811 MT of sugarcane to produce 133,753 MT of sugar at an average recovery of 9.49 percent. This was an overall increase of 7 percent in sugar recovery compared to same period last year when we produced 173,620 MT of sugar from 1,957,358 MT of sugarcane at a sugar recovery of 8.87 percent.
In the period under review, the performance of our Bio Fuel Division remained reasonable, which produced 61.1 million litres, lower from 71.4 million litres in the corresponding period last year due to late start. Exports accounted for around 93 percent of total sales.
During the period under review, the performance of our Bio Power Division remained good. We generated 22.9 million units of bio power, up by 12% as compared to 20.5 million units during the nine months of last year.
In the period under review, our Building Materials Division produced 6,855 cubic metres of particle board compared to 6,824 cubicmetresinninemonthsofFY2012.
Yarn production at our Textile Divisionincreased to 5.13 million kg in the period under review, in comparison to 5.03 million
kg in nine months of FY2012. Capacityutilization was better due to regular arrival of cotton and with increased production and better yarn prices, this division contributed significantly toward bottom line results.
Due to non-availability of sugarcane, crushing season 2012-13 was closed in last week of March 2013. Depressed market prices of sugar also affected our core business so far, however, we anticipate an improvement in sale prices due to export of sugar. Performance of our Bio Fuel, Bio Power and Textile Divisions were remained satisfactory contributing positively to our bottom line and we are hopeful that the Company would achieve positive results in Fiscal 2013.
On behalf of the Board
Ahsan M. SaleemChief Executive Officer
Date: 25 July 2013
diRECTORS’ REViEW

Interim Report8
CONdENSEd iNTERiM BalaNCE ShEETAs at 30 June 2013 (Un-Audited)
Note June September 2013 2012 Un-Audited Audited (Rupees in thousand)EQUITY AND LIABILITIES Share capital and reserves Authorised capital 80,000,000 (30 September 2012: 80,000,000) ordinary shares of Rs. 10 each 800,000 800,000 50,000,000 (30 September 2012: 50,000,000) preference shares of Rs. 10 each 500,000 500,000 1,300,000 1,300,000 Issued, subscribed and paid up capital 69,523,798 (30 September 2012: 69,523,798) ordinary shares of Rs. 10 each 695,238 695,238 Reserves 1,086,825 970,230 Accumulated loss (1,798,289) (2,268,692)
(16,226) (603,224) Surplus on revaluation of property, plant and equipment 2,239,561 2,281,579 Non-current liabilities Long term finances 7 322,528 459,964 Liabilities against assets subject to finance lease 11,861 18,793 Employees’ retirement benefits - -
334,389 478,757 Current liabilities Current portion of long term liabilities 1,871,878 1,959,402 Short term borrowings - secured 1,880,697 2,507,350 Trade and other payables 3,165,923 1,979,617 Accrued finance cost 964,305 1,122,448 Provision for taxation - 504
7,882,803 7,569,321 Contingencies and commitments 8 10,440,527 9,726,433
The annexed notes 1 to 17 form an integral part of this condensed interim financial information.
Chief Executive

Interim Report 9
Note June September 2013 2012 Un-Audited Audited (Rupees in thousand)ASSETS Non-current assets Property, plant and equipment 9 6,402,519 6,401,019 Intangible assets 1,015 1,045 Biological assets 10,504 8,895 Investments - related parties 10 943,451 750,895 Employees’ retirement benefits 5,070 5,071 Long term loans, advances, deposits and prepayments 39,588 39,969 Deferred taxation - -
7,402,147 7,206,894 Current assets Biological assets 21,771 37,395 Stores, spares and loose tools 136,474 129,862 Stock-in-trade 2,063,536 1,765,735 Trade debts 354,164 243,138 Investments 11 154,878 119,041 Loans, advances, deposits, prepayments and other receivables 262,238 154,767 Cash and bank balances 45,319 69,601
3,038,380 2,519,539
10,440,527 9,726,433
Director
Interim Report10
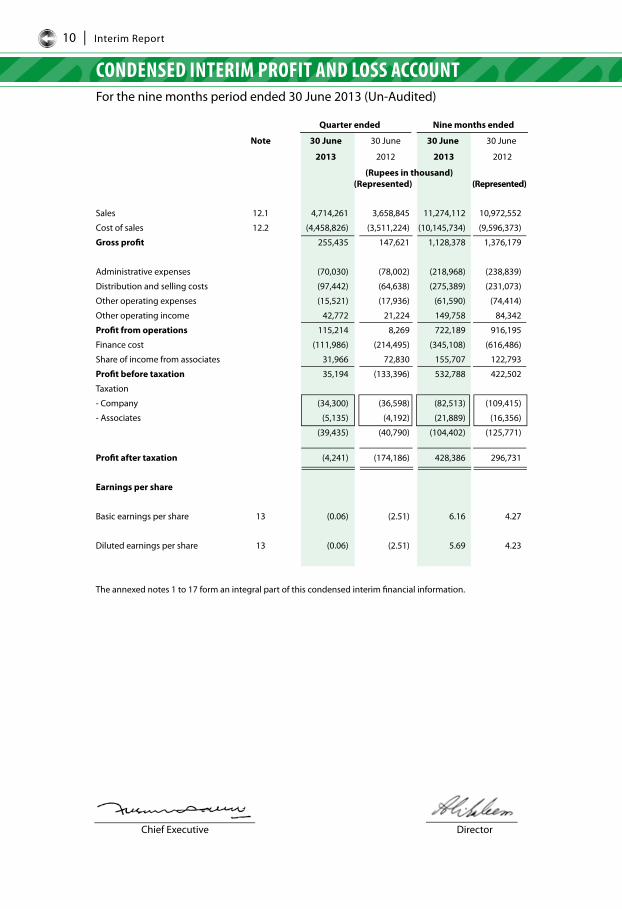
CONdENSEd iNTERiM PROFiT aNd lOSS aCCOuNTFor the nine months period ended 30 June 2013 (Un-Audited)
Quarter ended Nine months ended
Note 30 June 30 June 30 June 30 June
2013 2012 2013 2012
(Rupees in thousand) (Represented) (Represented)
Sales 12.1 4,714,261 3,658,845 11,274,112 10,972,552
Cost of sales 12.2 (4,458,826) (3,511,224) (10,145,734) (9,596,373)
Gross profi t 255,435 147,621 1,128,378 1,376,179
Administrative expenses (70,030) (78,002) (218,968) (238,839)
Distribution and selling costs (97,442) (64,638) (275,389) (231,073)
Other operating expenses (15,521) (17,936) (61,590) (74,414)
Other operating income 42,772 21,224 149,758 84,342
Profi t from operations 115,214 8,269 722,189 916,195
Finance cost (111,986) (214,495) (345,108) (616,486)
Share of income from associates 31,966 72,830 155,707 122,793
Profi t before taxation 35,194 (133,396) 532,788 422,502
Taxation
- Company (34,300) (36,598) (82,513) (109,415)
- Associates (5,135) (4,192) (21,889) (16,356)
(39,435) (40,790) (104,402) (125,771)
Profi t after taxation (4,241) (174,186) 428,386 296,731
Earnings per share
Basic earnings per share 13 (0.06) (2.51) 6.16 4.27
Diluted earnings per share 13 (0.06) (2.51) 5.69 4.23
The annexed notes 1 to 17 form an integral part of this condensed interim fi nancial information.
Chief Executive Director

Interim Report 11
CONdENSEd iNTERiM STaTEMENT OF COMPREhENSiVE iNCOMEFor the nine months period ended 30 June 2013 (Un-Audited)
Quarter ended Nine months ended
30 June 30 June 30 June 30 June
2013 2012 2013 2012
(Rupees in thousand)
Profi t for the period (4,241) (174,186) 428,386 296,731
Other comprehensive income
Fair value gain on ‘ Available for sale’
investments 60,277 35,089 112,515 60,661
Share of other comprehensive (loss) / income
of associates 2,025 1,127 4,080 2,818
62,302 36,216 116,595 63,479
Total comprehensive income for the period 58,061 (137,970) 544,981 360,210
The annexed notes 1 to 17 form an integral part of this condensed interim fi nancial information.
Chief Executive Director

Interim Report12
CONdENSEd iNTERiM CaSh FlOW STaTEMENTFor the nine months period ended 30 June 2013 (Un-Audited)
Nine months ended Note June June 2013 2012 (Rupees in thousand)Cash flows from operating activities Cash generated from / (used in) operations 14 1,660,723 186,537 Finance cost paid (379,351) (447,956)Taxes paid (128,493) (146,826)WPPF Paid (19,519) Employees’ retirement benefits paid (9,083) (10,257)Net (increase)/decrease in long term advances, loans, deposits and prepayments 381 (33,237) Net cash used in operating activities 1,124,658 (451,739) Cash flows from investing activities Fixed capital expenditure (266,986) (253,802)Dividend received 31,765 33,371 Income from bank deposits received 420 12,395 Sale proceeds from sale of livestock 602 1,533 Sale proceeds from sale of property, plant and equipment 20,725 57,205 Net cash used in investing activities (213,474) (149,298) Cash flows from financing activities Repayment of finance lease (7,272) (536,190)Short term financing - net (465,572) 1,064,409 Long term financing - net (462,622) (21,474) Net cash (used in) / generated from financing activities (935,466) 506,744 Net decrease in cash and cash equivalents (24,282) (94,293)Cash and cash equivalents at the beginning of the period 69,601 119,169
Cash and cash equivalents at the end of the period 45,319 24,876
The annexed notes 1 to 17 form an integral part of this condensed interim financial information.
Chief Executive Director

Interim Report 13
CONdENSEd iNTERiM STaTEMENT OF ChaNGES iN EQuiTYFor the nine months period ended 30 June 2013 (Un-Audited)
CA
PITA
L RE
SERV
E
RE
VEN
UE
RESE
RVE
D
iffer
ence
of
Shar
e in
Capi
tal U
nder
Eq
uity
capi
tal
Fair
Sc
hem
e of
In
vest
men
t
Sh
are
Shar
e re
serv
es o
f Va
lue
Arr
ange
men
t
Div
iden
d M
arke
t Val
ue
Acc
umul
ated
C
apit
al
Prem
ium
as
soci
ates
Re
serv
e of
Mer
ger
Gen
eral
Eq
ualiz
atio
n Eq
ualiz
atio
n (
loss
) / p
rofit
To
tal
Bala
nce
as o
n 30
Sep
tem
ber 2
011
695
,238
2
43,2
82
15,
904
(3
8,43
7)
155
,930
4
10,6
06
22,
700
8
3,00
0
(2,7
67,1
68)
(1,1
78,9
45)
Tota
l com
preh
ensi
ve in
com
e fo
r nin
e m
onth
s pe
riod
en
ded
30 Ju
ne 2
012
-
-
2,8
18
60,
661
-
-
-
-
2
96,7
31
360
,210
Tr
ansf
er fr
om s
urpl
us o
n re
valu
atio
n of
pro
pert
y,
plan
t and
equ
ipm
ent -
net
of d
efer
red
tax
- inc
rem
enta
l dep
reci
atio
n fo
r the
per
iod
- -
- -
- -
- -
9
9
Bala
nce
as a
t 30
June
201
2 6
95,2
38
243
,282
1
8,72
2
22,
224
1
55,9
30
410
,606
2
2,70
0
83,
000
(2
,470
,428
) (8
18,7
26)
Tota
l com
preh
ensi
ve in
com
e fo
r thr
ee m
onth
s pe
riod
en
ded
30 S
epte
mbe
r 201
2 -
-
1
,101
1
2,66
5
-
-
-
-
201
,736
2
15,5
02
Bala
nce
as a
t 30
Sept
embe
r 201
2 6
95,2
38
243
,282
1
9,82
3
34,
889
1
55,9
30
410
,606
2
2,70
0
83,
000
(2
,268
,692
) (6
03,2
24)
Tota
l com
preh
ensi
ve in
com
e fo
r nin
e m
onth
s pe
riod
en
ded
30 Ju
ne 2
013
-
-
4,0
80
112
,515
-
-
-
-
4
28,3
86
544
,981
Tr
ansf
er fr
om s
urpl
us o
n re
valu
atio
n of
pro
pert
y,
pl
ant a
nd e
quip
men
t - n
et o
f def
erre
d ta
x
- inc
rem
enta
l dep
reci
atio
n fo
r the
per
iod
-
-
-
-
-
-
-
-
40,
040
4
0,04
0 - o
n ac
coun
t of d
ispo
sal o
f lan
d
1
,978
1
,978
Ba
lanc
e as
at 3
0 Ju
ne 2
013
695
,238
2
43,2
82
23,
903
1
47,4
04
155
,930
4
10,6
06
22,
700
8
3,00
0
(1,7
98,2
89)
(16,
226)
The
anne
xed
note
s 1
to 1
7 fo
rm a
n in
tegr
al p
art o
f thi
s co
nden
sed
inte
rim fi
nanc
ial i
nfor
mat
ion.
(Rup
ees
in th
ousa
nd)
Ch
ief E
xecu
tive
Dire
ctor

Interim Report14
NOTES TO ThE CONdENSEd iNTERiM FiNaNCial iNFORMaTiONFor the nine months period ended 30 June 2013 (Un-Audited)
1. The Company and its operations 1.1 The Company is incorporated in Pakistan on 20 September 1967 and is listed on Karachi, Lahore
and Islamabad Stock Exchanges. It is principally engaged in manufacture, purchase and sale of sugar, bio fuel, building materials, yarn (textile) and engaged in generation and sale of electricity (bio power). The Company has its principal manufacturing facilities at Jhang and satellite manufacturing facilities at Bhone. The registered office of the Company is situated in Lahore.
1.2 Going concern assumption As at the reporting date, the current liabilities of the Company have exceeded its current
assets by Rs. 4,844 million (30 September 2012: Rs. 5,050 million), the equity has been eroded and stands at negative Rs. 16 million (30 September 2012 Rs. 603 million). The Company has not been able to meet its various obligations for long term loans and short term borrowings. Borrowings (including mark-up payable thereon) aggregating Rs. 2,390 million (30 September 2012: Rs. 2,855 million) are over-due for payment.
The Company has been facing liquidity crunch for the last few years. In February 2010 the
Company entered into agreement for a bridge finance facility of Rs. 2,466 million and short term running finance facility of Rs. 2,980 million from a consortium of its existing lenders. The bridge finance was envisaged to be operational by April 2010 and fully repaid by June 2011 through sale of certain assets of the Company, identified in the agreement. However, neither the bridge finance facility nor the consortium cash finance could become operative due to delays in obtaining No-objection certificate from National Bank of Pakistan for creation of pari passu charge on the assets against the above new facilities. Furthermore, the Company was not able to liquidate all of the specified assets as per timelines identified in the bridge loan agreement and subsequent to 30 June 2011, these facilities stood expired.
Furthermore, the Company issued redeemable preference shares in 2005 to the shareholders
of the Company which were to be redeemed along with any outstanding dividend payable in December 2009. Due to liquidity crunch and negative equity the Company has not been able to redeem the preference shares and preference dividend amounting to Rs. 64.792 million which was also outstanding as on 30 June 2013.
The above conditions raise significant doubts on the Company’s ability to continue as a going
concern. However, the management is confident of the Company’s ability to continue as a going concern based on its concerted effort to re-profile borrowings and utilisation of improved liquidity in higher operational levels of cane crushing and ethanol manufacturing.
The steps taken by management up till now and planned in future are as follows: The Company took significant operational measures in previous year to improve its productivity
and financial results in order to generate liquidity for financing of operations and repayment of borrowings. During the period to date, the operational performance of the sugar division remained low as the Company was only able to crush 1.410 million tons of sugarcane as compared to 1.957 million tons of sugarcane during the last period. The production of ethanol decreased from 71.418 million liters in last period to 61.052 million liters in current period. The textile unit of the Company has generated positive cash flows for the Company as the production of yarn increased from 110,972 bags in last period to 113,142 bags in current period.

Interim Report 15
To date the Company has repaid Rs. 1,979 million of the bridge loan through utilization of improved liquidity resulting from better operational results as explained above and sale of certain assets of the Company.
Short term secured financing The Company requested its lenders for following short term secured financing for operational
liquidity: - Working capital line against pledge of sugar at 20% margin for 120 to 150 days with an
incentive for lender to adjust 10% of the new disbursement against settlement of existing over-due loans (principal only); and
- An FE 25 loan in US Dollars with a maturity of 120-150 days after settlement of working capital against pledge of sugar. Such loan is being offered to be securitised against pledge of molasses/ethanol with an incentive for lender to adjust 20% of the new disbursement against settlement of existing over-due loans (principal only).
Newly disbursed facilities shall be settled upon sale of respective commodities (sugar/
ethanol). The Company after successfully negotiating with some of its lenders on bilateral terms received
responses from a number of banks and obtained working capital lines of Rs. 1,000 million from MCB Bank Limited, Rs. 240 million from NIB Bank Limited, Rs. 200 million from Bank Alfalah Limited, Rs. 200 million from The Bank of Punjab and an FE 25 loan of Rs. 100 million from Faysal Bank Limited. The facilities have been obtained against pledge of sugar at margin ranging from 15% to 25% and have resulted in improved operational results in current period.
Relaxations in repayments of existing loans To date the Company has been able to restructure/reschedule various loans from its lenders
resulting in relaxation in payments, the details of which are as follows: - Restructuring of Rs. 473 million of various over-due borrowings to long term loans and
rescheduling of long term loan of Rs. 92 million from MCB Bank Limited;
- Restructuring of Rs. 176 million of over-due long term running finance and Rs. 75 million of overdue accrued mark-up under bridge finance to long term demand finance from The Bank of Punjab;
- Restructuring of Rs. 161 million of short term running finance and Rs. 76 million of overdue accrued mark-up under bridge finance to long term loan from Allied Bank Limited;
- Restructuring of Bridge finance of Rs. 181 million to long term loan from United Bank Limited;
- Restructuring of Bridge finance of Rs. 57 million to long term loan and rescheduling of over-due markup of Rs. 23 million from Habib Bank Limited.
- Restructuring of PPTFC of Rs. 80 million to long term loan from UBL Fund Manager.

Interim Report16
The condensed interim financial information have been prepared on a going concern basis based on management’s expectation that:
- the Company will continue to get support of its lenders and will be able to obtain relaxation
in payment terms of its over-due borrowings; and
- the Company will be able to generate adequate liquidity through new short term borrowings and will be successful in utilising such funds to increase its operations and achieve its budgeted targets for production of sugar, ethanol etc.
The condensed interim financial information consequently, do not include any adjustments
relating to the realisation of its assets and liquidation of any liabilities that might be necessary should the Company be unable to continue as a going concern.
2. Basis of preparation This condensed interim financial information is un-audited and has been prepared in accordance
with approved accounting standards as applicable in Pakistan for interim financial reporting. The disclosures in this condensed interim financial information does not include all the information reported for full annual financial statements and should be read in conjunction with the annual financial statements for the year ended 30 September 2012.
This condensed interim financial information is being submitted to the shareholders as required
by section 245 the Companies Ordinance, 1984. 3. Significant Accounting Policies 3.1 The accounting policies and methods of computation adopted for the preparation of this
condensed interim financial information are the same as those applied in the preparation of the financial statements for the year ended 30 September 2012 and should be read in conjunction with those financial statements.
4. Estimates The preparation of condensed interim financial information requires management to make
judgements, estimates and assumptions that affect the application of accounting policies and the reported amounts of assets and liabilities, income and expense. Actual results may differ from these estimates.
In preparing this condensed interim financial information, the significant judgements made by
management in applying the Company’s accounting policies and the key sources of estimation uncertainty were the same as those that applied to the financial statements for the year ended 30 September 2012.
5. Seasonality of operations Due to seasonal nature of sugar segment lower operating profits are usually expected in the
last quarter than the first nine months. 6. Taxation The provision for taxation for the nine months ended 30 June 2013 has been made on an
estimated basis.

Interim Report 17
Note June September 2013 2012 (Rupees in thousand)
7. Long term finances Long term loans - secured 1,412,133 1,579,622 Redeemable Capital Preference shares (non-voting) - unsecured 345,756 345,756 Term finance certificates (non-voting) - secured 428,060 485,192 773,816 830,948 Long term running finances - secured - -
2,185,949 2,410,570 Less: Current portion shown under current liabilities 7.1 - Long term loans - secured (1,089,605) (1,119,658) - Redeemable capital - Preference Shares (non-voting) - secured (345,756) (345,756) - Redeemable capital - term finance certificates (non-voting) - secured (428,060) (485,192) - Long term running finances - secured - -
(1,863,421) (1,950,606)
322,528 459,964
7.1 The aggregate current portion of Rs. 1,863 million (30 September 2012: Rs. 1,951 million) includes over due principal installments aggregating to Rs. 583 million (30 September 2012: Rs. 640 million) and Rs. 592 million (30 September 2012: Rs. 760 million) representing princi-pal installments which under the term of original loan agreements are due for repayment in period subsequent to 30 June 2014. However, as the Company could not repay on a timely basis the installments due uptill the period ended 30 June 2013 and is non-compliant with certain debt covenants, which represents a breach of the respective agreements , therefore these loans are required to be disclosed as a current liability under the guidance contained in IAS 1 “Presentation of financial statements”. The banks have not demanded an early repayment nor have levied any penalties.
8. Contingencies and commitments 8.1 Contingencies (i) The Company has issued following guarantees: Bank guarantee of Rs. 9.552 million (30 September 2012: Rs. 9.552 million) in favour of Sui
Northern Gas Pipelines Limited against performance of contracts. Cross corporate guarantee in favour of Allied Bank Limited to secure long term finance
facility availed by the Company’s associate, Shakarganj Food Products Limited of Rs. 467 million (30 September 2012: Rs. 467 million).
(ii) The Company has issued a post dated cheque in favour of the Collector of Customs against
custom duty clearance in respect of import of plant and machinery amounting to Rs. 5.040 million (30 September 2012: Rs. 5.040 million).

Interim Report18
(iii) As referred to in note 1.2, the Company entered into a bridge finance agreement with a consortium of banks for Rs. 2,466 million to be repaid by 30 June 2011 from the sale of assets, identified in the agreement. For reasons specified in the note 1.2, the bridge facility could not become operative and expired on 30 June 2011. The Company has, in these financial statements, accrued markup based on the reduced rates contained in the bridge finance agreement on its respective borrowings to the tune of Rs. 2,466 million. Had the markup been accrued at the terms of original agreements, it would have been higher by Rs. 151.609 million (30 September 2012: Rs. 144.398 million) approximately. However, as explained in note 1.2, the Company is in process of negotiation with lenders for restructuring of overdue balances and is confident that the lenders will not demand markup as per original agreements.
Moreover, pending the finalisation of restructured terms of payments with all lenders, the Company has not recognised penalties of Rs. 365.212 million (30 September 2012: Rs. 433.313 million) approximately which may be leviable under the terms of borrowings agreements including the bridge finance facility. None of the lenders has demanded any payment for the above referred penalties and the Company is confident that it will be able to negotiate restructured terms for repayment of loans and no penalty shall be levied by the lenders.
(iv) The Sindh High Court through its order dated 01 March 2013 declared the amendments
made in the WWF Ordinance, 1971 through Finance Act, 2008 applicable through which WWF is applicable on accounting profits rather than on the taxable income computed after incorporating the brought forward losses. In the light of the above order, the provision to date based on accounting profit comes to Rs. 18.8 million (30 September 2012: Rs. 8.8 million). However, this condensed financial information does not include any adjustment to this effect since the Company is of the opinion that it does not come under the purview of the order of the Sindh High Court and that the Lahore high Court had already declared the above amendments unconstitutional via the case reported as 2011 PLD 2643.
8.2 Commitments The Company has the following commitments in respect of: (i) Contracts for capital expenditure amounting to Rs. 65.213 million (30 September 2012:
Rs. 65.213 million). (ii) Contracts for acquisition of intangible (computer software) amounting to Rs. 20 million
(30 September 2012: Rs. 20 million). (iii) Contracts for other than capital expenditures Rs. 1.73 million (30 September 2012:
Rs. 7.29 million).
(iv) The amount of future payments under operating leases and the period in which these payments will become due are as follows:
June September 2013 2012 (Rupees in thousand) Not later than one year 2,836 4,992 Later than one and not later than five years 1,380 1,350
4,216 6,342

Interim Report 19
Note June September 2013 2012 Un-Audited Audited (Rupees in thousand)9. Property, plant and equipment Operating assets - at net book value - Owned assets 6,014,462 5,950,551 - Leased assets 61,754 67,296
9.1 6,076,216 6,017,847 Capital work in progress 9.2 326,303 383,172
6,402,519 6,401,019 9.1 Operating assets - at net book value Net book value at the beginning of the period / year 6,017,847 4,969,048 Add: Additions during the period / year 9.1.1 318,313 311,170 Revaluation during the period / year - 1,059,400 Less: Deletions during the period / year (5,363) (36,021) Depreciation charged during the period / year (254,581) (285,750)
6,076,216 6,017,847 9.1.1 Additions during the period / year Freehold Land 12,559 1,670 Building and roads on freehold land 40,392 51,374 Plant and machinery 250,884 199,234 Tools and equipments 2,534 4,139 Laboratory equipment 1,185 3,516 Office equipments 3,251 6,424 Water, electric and weighbridge equipments 2,490 7,038 Furniture and fixtures 2,560 3,587 Vehicles 2,393 33,993 Library books 65 195
318,313 311,170 9.2 Capital work in progress Civil works 4,869 8,399 Plant and machinery 163,505 111,528 168,374 119,927 Advances to suppliers 170,913 280,143 Less: Provision for doubtful advances (12,984) (12,984) Impairment charged during the period / year - (3,914)
157,929 263,245 Total 326,303 383,172

Interim Report20
Note June September 2013 2012 Un-Audited Audited (Rupees in thousand)10. Investments - related parties In equity instruments of associates 10.1 768,758 652,880 Available for sale 10.3 174,693 98,015
943,451 750,895 10.1 In equity instruments of associates Cost 545,793 545,793 Brought forward amounts of post acquisition reserves, profits and negative goodwill recognized directly in profit and loss account 107,086 (1,926)
652,879 543,867 Share of movement in reserves during the period / year 4,080 3,919 Share of profit for the period / year - before taxation 155,707 138,580 - provision for taxation (21,889) (8,117)
133,818 130,463 790,777 678,249 Dividend received during the period / year (22,019) (25,369) Balance as at period / year end 10.2 768,758 652,880 10.2 In equity instruments of associates Quoted Crescent Steel and Allied Products Limited 2,720,062 (30 September 2012: 2,720,062) fully paid ordinary shares of Rs. 10 each 235,949 204,715 Equity held: 4.82% (30 September 2012: 4.82%) Safeway Mutual Fund Limited 16,579,143 (30 September 2012: 16,579,143) fully paid ordinary shares of Rs. 10 each 206,175 148,771 Equity held: 30.45% (30 September 2012: 30.45%) Unquoted Shakarganj Food Products Limited 74,654,596 (30 September 2012: 74,654,596) fully paid ordinary shares of Rs. 10 each 326,634 299,394 Equity Held: 49.24% (30 September 2012: 49.24%) 768,758 652,880

Interim Report 21
10.2.1 Investments in associates include goodwill amounting to Rs. 82.886 million (30 September 2012: Rs. 82.886 million).
10.2.2 The Company’s share of the results of its principal associates, all of which are incorporated in Pakistan, and its share of the assets (including goodwill) and liabilities are as follow:
For the nine months ended 30 June 2013
Percentage Name interest Assets Liabilities Revenues Profit / held (loss) ---------- (Rupees in thousand) ----------
Crescent Steel and Allied
Products Limited 4.82% 297,160 (72,727) 188,160 32,778
Safeway Mutual Fund Limited 30.45% 292,422 (1,108) 79,476 73,983
Shakarganj Food Products Limited 49.24% 750,387 (495,029) 1,678,172 27,057
1,339,970 (568,865) 1,945,808 133,818
For the year ended 30 September 2012
Percentage Name (interest Assets Liabilities Revenues Profit / held) (loss) ---------- (Rupees in thousand) ----------
Crescent Steel and Allied
Products Limited 4.82% 244,845 (51,661) 190,046 22,690
Safeway Mutual Fund Limited 30.45% 234,740 (833) 56,491 66,042
Shakarganj Food Products Limited 49.24% 652,447 (424,329) 1,986,195 41,731
1,132,032 (476,823) 2,232,732 130,463
10.2.3 The Company’s investment in Crescent Steel and Allied Products Limited is less than 20% but it is considered to be associate as per the requirements of IAS - 28 ‘Investments in As-sociates’ because the Company has significant influence over its financial and operating policies through the director and chief executive of the Company.
10.2.4 The above figures of Crescent Steel and Allied Products Limited & Safeway Mutual Fund
Limited are based on un-audited condensed interim consolidated financial information and un-audited condensed interim financial information as at 31 March 2013.
10.2.5 The Company has assessed the recoverable amount of investment in Crescent Steel and
Allied Products Limited based on value in use calculation. This calculation has been made on discounted cashflow methodology which assumes gross profit margin of 14.44% - 16.54%, EBITDA of 22.20% - 25.42%, terminal growth rate of 9% and weighted average cost of capital of approximately 16.50%.
10.2.6 The Company has assessed the recoverable amount of investment in Shakarganj Food
Products Limited based on value in use calculation. This calculation has been made on discounted cashflow methodology which assumes gross profit margin of 12.74% - 13.93%, EBITDA of 3.67% - 4.28%, terminal growth rate of 8% and weighted average cost of capital of approximately 14.71%.

Interim Report22
Note June September 2013 2012 (Rupees in thousand)
10.3 Available for sale Associated companies - at cost 10.3.1 147,917 147,917 Others - at cost 10.3.2 2,200 2,200
150,117 150,117 Add: Cumulative fair value gain 10.3.3 117,833 41,155 Less: Cumulative impairment losses recognized 10.3.4 (93,257) (93,257)
Fair value gain / (loss) 24,576 (52,102)
174,693 98,015 10.3.1 Associated companies
Quoted Crescent Jute Products Limited 536,817 (30 September 2012: 536,817) fully paid ordinary shares of Rs.10 each - - Asian Stocks Fund Limited 16,245,673 (30 September 2012: 16,245,673) fully paid ordinary shares of Rs. 10 each 144,917 144,917 Equity held 18.05% (30 September 2013: 18.05%) Unquoted Crescent Standard Telecommunications Limited 300,000 (30 September 2012: 300,000) fully paid ordinary shares of Rs. 10 each 3,000 3,000 147,917 147,917 10.3.2 Others Unquoted Crescent Group Services (Private) Limited 220,000 (30 September 2012: 220,000) fully paid ordinary shares of Rs. 10 each 2,200 2,200 10.3.3 Cumulative fair value gain As at 1 October 41,155 17,325 Fair value gain during the period / year 76,678 23,830 117,833 41,155 Impairment loss transferred to profit and loss account - -
As at period / year end 117,833 41,155

Interim Report 23
Note June September 2013 2012 (Rupees in thousand)
10.3.4 Cumulative impairment losses recognized As at 1 October 93,257 93,257 Recognized during the period / year - -
As at period / year end 93,257 93,257 10.4 Investments with face value of Rs. 922.486 million (30 September 2012: Rs. 922.486 million)
and market value of Rs. 1,181.824 million (30 September 2012: Rs. 903.817 million) are pledged as security against long term running finances and short term borrowings.
June September 2013 2012 (Rupees in thousand)
11. Investments Available for sale - cost 11.1 125,307 125,307 Add: Cumulative fair value gain / (loss) 11.2 29,571 (6,266)
154,878 119,041 11.1 Available for sale - at cost Altern Energy Limited - Quoted 12,530,582 (30 September 2012: 12,530,582) fully paid ordinary shares of Rs. 10 each 125,307 125,307 Innovative Investment Bank Limited - Unquoted 51,351 (30 September 2012: 51,351) fully paid ordinary shares of Rs. 10 each - - 125,307 125,307 11.2 Cumulative fair value gain / (loss) As at 1 October (6,266) (55,762) Fair value gain during period / year 35,837 49,496
As at period / year end 29,571 (6,266)
11.3 Investments with face value of Rs. 124.66 million (30 September 2012: Rs. 124.66 million) and market value of Rs. 154.080 million (30 September 2012: Rs. 118.427 million) are pledged as security against long term running finances and short term borrowings.

Interim Report24
Sug
ar
B
io F
uel
Bio
Pow
er
B
uild
ing
mat
eria
ls
Sub
-tot
al c
arri
ed fo
rwar
d
Qua
rter
end
ed
N
ine
mon
ths
ende
d
Qua
rter
end
ed
Nin
e m
onth
s en
ded
Q
uart
er e
nded
N
ine
mon
ths
ende
d
Q
uart
er e
nded
N
ine
mon
ths
ende
d
Q
uart
er e
nded
Nin
e m
onth
s en
ded
30
June
30
June
30
June
30
June
30
June
30
June
30
June
30
June
30
June
30
June
30
June
30
June
30
June
30
June
30
June
30
June
30
June
30
June
30
June
30
June
20
13
2012
20
13
2012
20
13
2012
20
13
2012
20
13
2012
20
13
2012
20
13
2012
20
13
2012
20
13
2012
20
13
2012
12.1
S
ales
- Ext
erna
l 2,
756,
351
2,
342,
253
5,
386,
290
6,
187,
591
1,
408,
417
76
1,44
2
4,20
4,12
3
3,21
7,65
5
21,4
72
66,6
45
155,
532
17
3,88
1
13,8
93
19,6
48
59,3
58
82,9
66
4,20
0,13
3
3,18
9,98
9
9,80
5,30
3
9,66
2,09
4 - I
nter
segm
ent
182,
972
24
3,92
8
991,
577
1,
213,
741
36
,094
40
,965
12
1,55
0
91,9
31
38,7
32
969
47
,044
96
9
-
-
915
-
25
7,79
8
285,
862
1,
161,
086
1,
306,
641
2,
939,
324
2,
586,
181
6,
377,
868
7,
401,
333
1,
444,
511
80
2,40
7
4,32
5,67
3
3,30
9,58
6
60,2
03
67,6
14
202,
575
17
4,85
0
13,8
93
19,6
48
60,2
73
82,9
66
4,45
7,93
1
3,47
5,85
1
10,9
66,3
89
10,9
68,7
35
12.2
Se
gmen
t
ex
pens
es
Co
st o
f sal
es
- N
et o
f int
erse
gmen
t cos
ts
2,91
7,37
2
2,64
4,52
8
6,31
1,13
3
7,27
2,12
0
1,05
8,31
9
394,
635
2,
376,
840
98
9,73
1
31,5
59
14,9
60
80,8
86
55,2
31
(70)
3,
708
18
,974
31
,703
4,
007,
180
3,
057,
831
8,
787,
833
8,
348,
785
- Int
erse
gmen
t cos
ts
-
-
7,59
2
3,39
2
174,
205
18
8,86
1
952,
520
1,
145,
687
36
,094
40
,965
12
1,55
0
91,9
31
13,0
79
19,9
37
39,5
07
46,2
99
223,
378
24
9,76
2
1,12
1,16
8
1,28
7,30
8
2,
917,
372
2,
644,
528
6,
318,
725
7,
275,
512
1,
232,
524
58
3,49
6
3,32
9,36
0
2,13
5,41
8
67,6
53
55,9
25
202,
436
14
7,16
2
13,0
09
23,6
45
58,4
81
78,0
02
4,23
0,55
8
3,30
7,59
3
9,90
9,00
2
9,63
6,09
3
G
ross
pro
fit /
(loss
) 21
,952
(5
8,34
7)
59,1
43
125,
821
21
1,98
7
218,
911
99
6,31
3
1,17
4,16
8
(7,4
50)
11,6
89
139
27
,688
88
4
(3,9
97)
1,79
2
4,96
4
227,
373
16
8,25
7
1,05
7,38
7
1,33
2,64
1
- A
dmin
istr
ativ
e ex
pens
es
(41,
699)
(5
0,67
3)
(112
,186
) (1
46,4
19)
(18,
380)
(1
7,44
1)
(77,
052)
(6
5,47
3)
(729
) (1
,048
) (3
,628
) (3
,459
) (1
95)
(403
) (1
,138
) (1
,641
) (6
1,00
3)
(69,
565)
(1
94,0
04)
(216
,992
)- D
istr
ibut
ion
and
selli
ng c
ost
(15,
043)
(4
,094
) (2
3,68
0)
(10,
837)
(8
1,89
8)
(59,
798)
(2
50,1
32)
(218
,006
) -
(1
43)
-
(328
) (1
1)
(42)
(4
6)
(137
) (9
6,95
2)
(64,
077)
(2
73,8
58)
(229
,308
)
(5
6,74
2)
(54,
767)
(1
35,8
66)
(157
,256
) (1
00,2
78)
(77,
239)
(3
27,1
84)
(283
,479
) (7
29)
(1,1
91)
(3,6
28)
(3,7
87)
(206
) (4
45)
(1,1
84)
(1,7
78)
(157
,955
) (1
33,6
42)
(467
,862
) (4
46,3
00)
Segm
ent r
esul
ts
(34,
790)
(1
13,1
14)
(76,
723)
(3
1,43
5)
111,
709
14
1,67
2
669,
129
89
0,68
9
(8,1
79)
10,4
98
(3,4
89)
23,9
01
678
(4
,442
) 60
8
3,18
6
69,4
19
34,6
15
589,
526
88
6,34
1
12.
Segm
ents
info
rmat
ion
(Rup
ees
in th
ousa
nd)

Interim Report 25
S
ub-t
otal
bro
ught
forw
ard
Text
ile
Fa
rms
Oth
ers
Tota
l
Qua
rter
end
ed
N
ine
mon
ths
ende
d
Qua
rter
end
ed
Nin
e m
onth
s en
ded
Q
uart
er e
nded
N
ine
mon
ths
ende
d
Q
uart
er e
nded
N
ine
mon
ths
ende
d
Q
uart
er e
nded
Nin
e m
onth
s en
ded
30
June
30
June
30
June
30
June
30
June
30
June
30
June
30
June
30
June
30
June
30
June
30
June
30
June
30
June
30
June
30
June
30
June
30
June
30
June
30
June
20
13
2012
20
13
2012
20
13
2012
20
13
2012
20
13
2012
20
13
2012
20
13
2012
20
13
2012
20
13
2012
20
13
2012
(Rep
rese
nted
)
(
Repr
esen
ted)
12.1
S
ales
- Ext
erna
l 4,
200,
133
3,
189,
989
9,
805,
303
9,
662,
094
47
9,79
8
430,
378
1,
406,
795
1,
243,
394
12
,186
14
,920
23
,837
31
,080
22
,144
23
,559
38
,177
35
,985
4,
714,
261
3,
658,
845
11
,274
,112
10
,972
,552
- I
nter
segm
ent
257,
798
28
5,86
2
1,16
1,08
6
1,30
6,64
1
-
-
-
-
-
-
12,2
32
3,39
2
-
-
-
-
-
-
4,
457,
931
3,
475,
851
10,
966,
389
10
,968
,735
47
9,79
8
430,
378
1,
406,
795
1,
243,
394
12
,186
14
,920
36
,069
34
,472
22
,144
23
,559
38
,177
35
,985
4,
714,
261
3,
658,
845
11
,274
,112
10
,972
,552
12.2
Se
gmen
t
ex
pens
es
Co
st o
f sal
es
- N
et o
f int
erse
gmen
t cos
ts
4,00
7,18
0
3,05
7,83
1
8,78
7,83
3
8,34
8,78
5
426,
565
43
0,00
0
1,29
9,06
5
1,19
3,56
8
12,1
21
12,1
51
34,7
63
36,6
15
12,9
59
11,2
41
24,0
72
17,4
04
4,45
8,82
6
3,51
1,22
4
10,1
45,7
34
9,59
6,37
3 - I
nter
segm
ent c
osts
22
3,37
8
249,
762
1,
121,
168
1,
287,
308
34
,825
4,
928
46
,412
22
,725
-
-
5,
482
-
-
-
25
6
-
-
-
4,
230,
558
3,
307,
593
9,
909,
002
9,
636,
093
46
1,39
0
434,
928
1,
345,
477
1,
216,
293
12
,121
12
,151
40
,245
36
,615
12
,959
11
,241
24
,328
17
,404
4,
458,
826
3,
511,
224
10
,145
,734
9,
596,
373
Gro
ss p
rofit
/ (lo
ss)
227,
373
16
8,25
7
1,05
7,38
7
1,33
2,64
1
18,4
08
(4,5
50)
61,3
18
27,1
01
64
2,76
9
(4,1
76)
(2,1
44)
9,18
5
12,3
18
13,8
49
18,5
81
255,
435
14
7,62
1
1,12
8,37
8
1,37
6,17
9
- A
dmin
istr
ativ
e ex
pens
es
(61,
003)
(6
9,56
5)
(194
,004
) (2
16,9
92)
(7,9
69)
(7,1
42)
(22,
426)
(1
9,41
1)
(708
) (5
83)
(1,8
62)
(1,7
24)
(349
) (7
12)
(675
) (7
12)
(70,
030)
(7
8,00
2)
(218
,968
) (2
38,8
39)
- Dis
trib
utio
n an
d se
lling
cos
t (9
6,95
2)
(64,
077)
(2
73,8
58)
(229
,308
) (4
90)
(561
) (1
,531
) (1
,743
) -
-
-
-
-
(1
) -
(2
2)
(97,
442)
(6
4,63
8)
(275
,389
) (2
31,0
73)
(1
57,9
55)
(133
,642
) (4
67,8
62)
(446
,300
) (8
,459
) (7
,703
) (2
3,95
7)
(21,
154)
(7
08)
(583
) (1
,862
) (1
,724
) (3
49)
(713
) (6
75)
(734
) (1
67,4
72)
(142
,640
) (4
94,3
57)
(469
,912
)
Se
gmen
t res
ults
69
,419
34
,615
58
9,52
6
886,
341
9,
949
(1
2,25
3)
37,3
61
5,94
7
(644
) 2,
186
(6
,039
) (3
,868
) 8,
836
11
,605
13
,174
17
,847
87
,963
4,
981
63
4,02
1
906,
267
Oth
er o
pera
ting
expe
nses
(1
5,52
1)
(17,
936)
(6
1,59
0)
(74,
414)
Fina
nce
Cost
s
(1
11,9
86)
(214
,495
) (3
45,1
08)
(616
,486
)O
ther
Ope
ratin
g In
com
e
42
,772
21
,224
14
9,75
8
84,3
42
Shar
e of
inco
me
of a
ssoc
iate
s
31
,966
72
,830
15
5,70
7
122,
793
Taxa
tion
(39,
435)
(4
0,79
0)
(104
,402
) (1
25,7
71)
Profi
t / (l
oss)
for t
he p
erio
d
(4
,241
) (1
74,1
86)
428,
386
29
6,73
1
12.
Segm
ents
info
rmat
ion
(Rup
ees
in th
ousa
nd)

Interim Report26
Segment assets Segment liabilities
30 June 30 September 30 June 30 September 2013 2012 2013 2012 (Rupees in thousand)12.3 Segment assets and liabilities Sugar 6,151,915 3,272,704 5,625,932 5,280,716 Bio Fuel 1,283,571 1,579,188 2,350,386 1,234,749 Building materials 49,132 47,390 2,238 255 Bio Power 495,614 745,653 22,580 117,341 Textile 315,093 342,358 87,782 154,609 Farms 752,003 754,214 15,627 14,379 Others 2,693 4,610 - - Unallocated 1,390,506 2,980,316 112,647 1,246,029 10,440,527 9,726,433 8,217,192 8,048,078
Quarter ended Nine months ended
30 June 30 June 30 June 30 June 2013 2012 2013 2012
13. Earnings per share 13.1 Basic earnings per share
Profit for the period Rupees (4,241,000) (174,186,000) 428,386,000 296,731,000 Weighted average number of ordinary shares in issue during the period Number 69,523,798 69,523,798 69,523,798 69,523,798 Earnings per share - basic Rupees (0.06) (2.51) 6.16 4.27
13.2 Diluted earnings per share Diluted loss per share is calculated by adjusting the weighted average number of ordinary shares outstanding
to assume conversion of all dilutive potential ordinary shares. The company has a commitment to convert 1,000 preference shares into 167 ordinary shares of Rs. 10 each. For the purposes of computing the diluted EPS the convertible preference shares are assumed to have been converted into ordinary shares, and the profit is adjusted to eliminate the preference dividend.
Quarter ended Nine months ended
30 June 30 June 30 June 30 June 2013 2012 2013 2012 Profit for the period Rupees (4,241,000) (174,186,000) 428,386,000 296,731,000 Preference dividend on convertible preference shares Rupees - 7,327,175 - 21,981,526 Profit used to determine diluted earnings per shares Rupees (4,241,000) (166,858,825) 428,386,000 318,712,526 Weighted average number of ordinary shares in issue during the period Number 69,523,798 69,523,798 69,523,798 69,523,798 Assumed conversion of convertible preference shares into ordinary shares Number 5,774,108 5,774,108 5,774,108 5,774,108 Weighted average number of ordinary shares for diluted earnings per share Number 75,297,906 75,297,906 75,297,906 75,297,906 Earnings per share - diluted Rupees (0.06) (2.22) 5.69 4.23
Interim Report 27
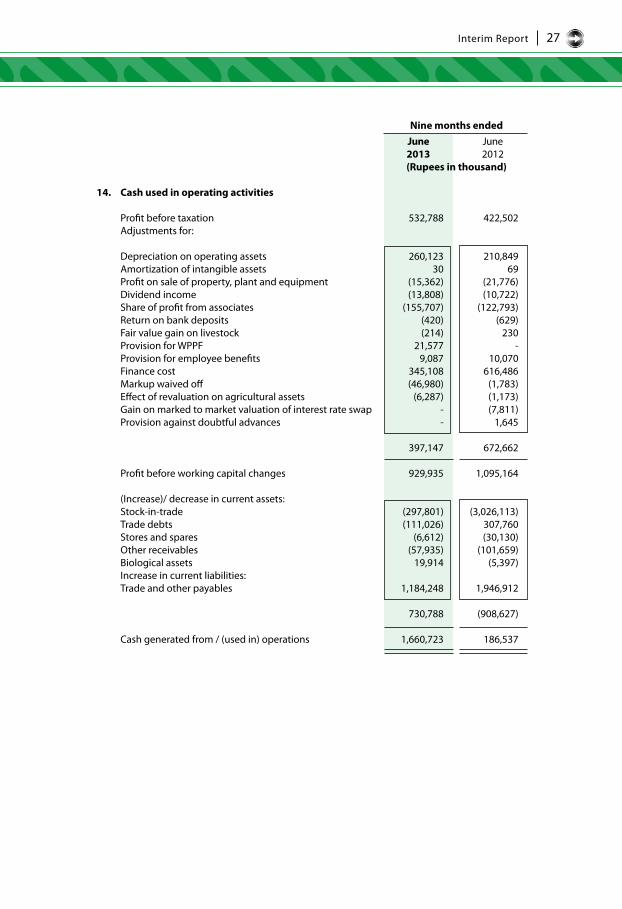
Nine months ended June June 2013 2012 (Rupees in thousand)
14. Cash used in operating activities Profit before taxation 532,788 422,502 Adjustments for: Depreciation on operating assets 260,123 210,849 Amortization of intangible assets 30 69 Profit on sale of property, plant and equipment (15,362) (21,776) Dividend income (13,808) (10,722) Share of profit from associates (155,707) (122,793) Return on bank deposits (420) (629) Fair value gain on livestock (214) 230 Provision for WPPF 21,577 - Provision for employee benefits 9,087 10,070 Finance cost 345,108 616,486 Markup waived off (46,980) (1,783) Effect of revaluation on agricultural assets (6,287) (1,173) Gain on marked to market valuation of interest rate swap - (7,811) Provision against doubtful advances - 1,645
397,147 672,662 Profit before working capital changes 929,935 1,095,164 (Increase)/ decrease in current assets: Stock-in-trade (297,801) (3,026,113) Trade debts (111,026) 307,760 Stores and spares (6,612) (30,130) Other receivables (57,935) (101,659) Biological assets 19,914 (5,397) Increase in current liabilities: Trade and other payables 1,184,248 1,946,912
730,788 (908,627) Cash generated from / (used in) operations 1,660,723 186,537

Interim Report28
Nine months ended June June 2013 2012 (Rupees in thousand)15. Transactions with related parties Relationship with Nature of transactions the company
i. Associated undertakings Purchase of goods and services 38,584 127,180 Sale of goods and services 14,250 5,901 Share of common expenses 3,152 2,357 Health and vehicle insurance expenses 3,918 2,969 Dividend income 35,828 33,371 Advance for purchase of material - 441 Advance against sale of land 70,000 - Payments made on behalf of related parties - 6,238 ii. Post employment Expense charged in respect of retirement benefit plans benefit plans 12,815 12,763 Transactions with gratuity and pension fund account - Funds received - 208,420 - Funds repaid - 208,473 - Markup expense - 11,952 iii. Key Management Personnel Salaries and other employee benefits 59,681 57,135
15.1 All transactions with related parties have been carried out on bilaterally agreed terms. 16. Date of authorisation for issue This condensed interim financial information was authorised for issue on 25 July 2013 by the
Board of Directors of the Company.
17. General
Corresponding figures have been re-arranged and re-classified, wherever necessary, for the purposes of comparison and better presentation as per reporting framework.
Chief Executive Director

Related Documents