Interim report | for the six months ended 31 December 2017

Welcome message from author
This document is posted to help you gain knowledge. Please leave a comment to let me know what you think about it! Share it to your friends and learn new things together.
Transcript
Interim report | for the six months ended 31 December 2017
01
Contents
02 CEO’s report
08 Directors’ declaration
09 Auditor’s review report
10 Consolidated statement of comprehensive income
11 Consolidated statement of changes in equity
12 Consolidated statement of financial position
13 Consolidated statement of cash flows
14 Notes to the interim financial statements
IBC Corporate directory
Interim report

02 03
This has been partially offset by an increase in infant formula
inventory of $25.2 million as the Company seeks to build
progressively to more sustainable levels during the year.
This included an increase in China label inventory in response to
regulatory changes from January 2018 and increasing demand.
The Board continues to consider the appropriate use of the
Company’s available capital in the best long-term interest of
shareholders. This includes a review of opportunities to invest
directly in blending and canning capability as part of our
longer-term nutritional products sourcing plan, as well as continued
consideration of an on-market share buyback and implementation
of a dividend policy.
Strategic focus
The Company’s growth strategy has three priorities:
– Building a broad portfolio of dairy-based nutritional products
based on the A1 protein-free proposition
– Targeting attractive regions globally
– Continuing to invest in proprietary know-how and
A2 protein expertise
Stage 4 a2 Platinum® infant formula, for children three years and
over, was launched in Australia and China in August 2017 and has
performed above expectations. The launch of a further specialised
milk powder product is scheduled to occur by the end of the
financial year and additional products are planned for the remainder
of calendar 2018.
We progressed our strategy for growth in emerging markets through
the launch of a2 Milk™ branded fresh milk in Singapore, and
through discussions with potential partners in various other markets.
The Singapore launch, in August 2017, achieved positive sales
momentum with good in-store velocities. Shipments are now being
made weekly from Australia and we are considering the potential to
broaden the product range and distribution for this market.
We also established a small test market, for a2 Milk™ branded whole
milk powder, with a partner in Vietnam.
Revenue, earnings and cash flow continue to grow strongly
Half-year earnings exceed those for the 2017 full financial year The Company made further substantial gains in revenue, earnings
and cash flow in the first half of the 2018 financial year. Growth
continued at a very strong rate in the infant formula business,
and liquid milk sales were again higher in each of the Company’s
core markets.
Sales of a2 Platinum® infant formula again grew substantially in
Australia and China supported by an increase in market share
in those regions. Key first half sales events in China have also
contributed to a strong 1H18 result, particularly in November and
December. a2 Platinum® sales revenue was $341.0 million, 78% of
the Company’s total revenue for the half-year. Investment continued
in building brand awareness and consumer engagement, expanding
distribution for a2 Platinum® in multiple channels and adapting to
new regulatory requirements in China.
Significant progress was achieved in the United States, with
further growth in brand awareness, sales velocities and store
numbers within the established footprint of California and the
Southeast. The US business also further expanded geographically,
culminating in the announcement in January 2018 that the
a2 Milk™ brand would become available through major retailers
across the Northeast region.
Fresh milk sales in the United Kingdom continued to build, driven
by further improvement in sales velocities in-store and gains
in distribution.
Total Group marketing investment increased by $10.0 million over
the pcp, due primarily to programmes supporting growth in the
United States and China.
The Company’s cash position continued to increase along with
growth in revenue and earnings. Net operating cash flow was
$116.4 million, compared with $38.1 million in the pcp. Cash on
hand at 31 December 2017 was $240.2 million, compared with
$121.0 million at the end of June 2017. Working capital benefited
from improved debtor days and timing of payments with suppliers.
CEO’s report
The a2 Milk Company Limited Interim report
Overview Financial results for the half-year ended 31 December 2017 (NZ$)
Total revenue of
$434.7mAn increase of 70% over
the prior corresponding period (pcp)
EBITDA1 of
$143.0m123% ahead of the pcp
Net profit after tax of
$98.5m150% ahead of the pcp
Basic earning per share (EPS) of
13.6¢an increase of 147% on pcp
Operating cash flow of
$116.4mand a cash balance of $240.2 million at period end
CEO’s report (cont.)
1 Earnings before interest, tax, depreciation and amortisation (EBITDA) is a non GAAP measure. However, the Company believes that it assists in providing investors with a comprehensive understanding of the underlying performance of the business. A reconciliation of EBITDA to net profit after tax is shown on page 7

04 05
The Company remains committed to its low capital model supported
by mutually beneficial medium-term relationships with processing
and distribution partners, in line with its multi-site, multi-product
and geographic diversification strategy. As part of this, the Company
is continuing to assess its medium-term manufacturing strategy
for nutritional products, including the possible ownership, either in
full or in partnership, of blending and canning assets as part of the
supply solution.
The agreement with our infant formula supply partner Synlait Milk
is operating very well, with increasing order quantities being supplied
and both management teams working to achieve efficiencies
through increased throughput.
During the half-year, the Company continued to invest in enhancing
and protecting its intellectual property, including support for scientific
research and development and investment in brands, trademarks,
patents and proprietary know-how across identified markets.
The Company expects broader interest in the A1 protein-free
category over time. Given its pioneering heritage, its comprehensive
suite of intellectual property and a business model focused solely on
products free of the A1 protein type, the Company is well positioned
to respond.
Board and Management
As announced in December 2017, Managing Director and CEO
Geoffrey Babidge will retire during calendar 2018 and be succeeded
by Jayne Hrdlicka. Ms Hrdlicka was CEO of Jetstar for more than
five years before assuming another senior role with Jetstar’s parent
company Qantas Airways Limited. She has also been a senior partner
at Bain & Company, focused on customer-oriented businesses. It is
expected that she will join the Company around the commencement
of the 2019 financial year. Mr Babidge will be available until
December 2018 to assist the transition.
A reorganisation of the senior leadership team announced in June
2017 was completed in August with Peter Nathan appointed to
the new role of Chief Executive Asia Pacific and Jane Xu appointed
Executive Vice President China. The new structure is focused on
maximising opportunities within the ANZ and China markets and
across the broader Asia Pacific region over time.
ANZ
The ANZ business continued to grow strongly, with total revenue
across all product categories up by 47% to NZ$304.3 million and
EBITDA by 65% to NZ$116.4 million.
Revenue growth for a2 Platinum® infant formula was particularly
strong, driven by continued growth in consumer awareness in
Australia and China. a2 Platinum® remains the fastest growing infant
formula brand by value in Australia, with market share in mainstream
retailers up from ~26% to ~30%2.
Fresh milk revenue rose by ~3% over the pcp. Market share by value
for a2 Milk™ branded fresh milk rose to ~9.5%3. a2 Milk™ remains
the only milk brand distributed through all six key grocery retailers in
the Australian market.
Total sales of a2 Milk™ branded milk powder products – whole milk
powder and skim milk powder (the latter introduced in May 2017) –
were significantly higher than in the pcp.
The Company continued to invest strongly in its brands, through
the highest national advertising spend in both the infant formula
and fresh milk categories in the Australian market and through
strong editorial media coverage. Both spontaneous and prompted
consumer brand awareness grew sharply in both categories.
a2 Milk™ was recently named the top brand of choice for
Australian ‘millennials’4.
Close attention continued on the infant formula supply chain
resulting in an improved level of inventory at the end of the half.
The Company also introduced an on-line platform to improve access
of a2 Platinum® for Australian consumers.
The Company continues to engage with and closely monitor the
personal shopper (“Daigou”) channel, recognising its importance
as a continuing driver for the business.
As announced in December 2017, a confidential settlement was
reached in respect of the legal dispute with Lion Dairy & Drinks Pty
Limited whereby the parties agreed not to proceed with their cases
against each other.
2 Aztec Australian Grocery and Pharmacy Scan, 31/12/17 MAT 3 Aztec Australian Grocery Weighted Scan, 31/12/17 MAT 4 Number 1 brand on millennial shopping lists, The Urban List, Food & Drink Survey May 2017
CEO’s report (cont.)
comprehensive and includes testing of raw materials and finished
products, certification of manufacturing standards and formulation
assessment, and packaging changes in response to labelling and
branding requirements.
The Company continues to monitor changes in the regulatory regime
closely and respond as appropriate.
United States
The US business continued to progress its strategy to build
brand awareness and sales velocities while further expanding its
distribution footprint.
Investment continued in a multi-media marketing strategy including
the Love Milk Again advertising campaign, an active editorial
media programme, strong digital media and shopper marketing
programmes. Sales velocities continued to grow in a number
of key accounts.
a2 Milk™ is available in four variants (including chocolate) within the
specialty milk segment, the fastest growing segment of the total
milk category. At the end of the reporting period the Company
had distribution in ~3,600 stores, in California and the South East
and through natural retail chains including Sprouts Farmers Market
(nationally) and Whole Foods Market (in seven of 11 regions).
It was announced in January 2018 that distribution would be
expanded to major retailers across the Northeast region, building
on a growing presence already in the natural channel in the region.
The Northeast is home to ~60 million consumers and accounts for
about 20% of the total milk category volume in the US. It includes
New York, New Jersey, Pennsylvania, Connecticut, Rhode Island,
New Hampshire, Massachusetts, Vermont and Maine. The Love Milk
Again campaign and associated programmes are being broadened
to support the expansion to this region.
Along with prior distribution growth in California, the South-East
and the natural channel, the Northeast expansion is expected to
increase total distribution numbers to ~5,000 stores across the US.
As previously advised, the financial outlook for the US business
assumes investment of approximately US$25 million over the course
of FY18 and FY19 before positive monthly EBITDA is achieved in the
2020 fiscal year. A significant component of this investment relates
to building brand awareness and product trial in support of the
growth in distribution.
China and Other Asia
The China and Other Asia business recorded exceptional growth,
with revenue up by 204% to $114.4 million and EBITDA by 252%
to $48.3 million.
The business has a flexible multi-channel infant formula strategy in
both China label (offline and online) and cross border English label
(online) to best position the brand for growth in the medium term.
Total market share for a2 Platinum® infant formula in the targeted
regions continued to grow rapidly. Consumption market share
by value grew from ~3.5% (quarter ending 30/06/17) to ~5.4%
(quarter ending 31/12/17) as measured by Kantar5.
Increased marketing and sales investment remained a key driver
of rising brand awareness. The announcement, in November 2017,
of the publication of research findings from a major clinical trial
conducted in China (see below) provided further impetus.
a2 Platinum® again participated successfully in key online sales
events. In the major ‘11/11 Singles Day’ event it was the top-selling
infant formula on Kaola.com, second on JD.com and third on T-mall.
In the offline (bricks and mortar) segment, distribution grew
to ~6,700 Mother & Baby Stores supported by an in-store
communication programme including deployment of promotional
staff who provide consumers with product and category advice.
Further expansion is planned for this channel during the second half,
backed by an enhanced marketing programme including investment
in mainstream media in targeted provinces and in social media.
The China business also launched a2 Platinum® infant formula in
Hong Kong, with distribution through ~350 high-end pharmacy
outlets, supported by brand advertising in high-profile outdoor
media. Hong Kong presents an attractive opportunity, both in
regard to local consumers and as a channel for Mainland China.
The Company continues to strengthen the organisation in China,
with further development in the latest period across all key functions
including sales, distribution, marketing, quality, regulatory affairs
and finance.
Synlait Milk achieved registration of our China label infant formula
products with the China Food and Drug Administration (CFDA) in
September 2017. Under regulations applying from 1 January 2018,
only China label infant formula products (Stages 1, 2 and 3)
registered by the CFDA are permitted to be imported into
China through traditional channels. The registration process is
5 Kantar Infant Formula market tracking of Tier 1 and Key A cities comprising a substantial proportion of the total China infant formula market
CEO’s report (cont.)
Interim reportThe a2 Milk Company Limited
06 07
Meanwhile the Company is investigating specific new product
opportunities for the US market to further capitalise on the
expanded distribution.
United Kingdom
The United Kingdom business achieved further gains in revenue and
positive operating earnings, driven by continuing improvement in sales
rates and an expanding distribution footprint.
Volume sales of a2 Milk™ branded fresh milk increased by more
than 50% against the pcp.
Improving sales rates reflect growing brand recognition achieved
through the a2tonishing marketing campaign and improvements in
merchandising, including increased in-store facings and greater point
of sale presence.
Distribution grew from ~1,600 stores to more than 2,000, with
gains across the three largest supermarket chains – Tesco, Sainsbury
and Asda. In the UK’s largest retailer, a2 Milk™ is now sold in stores
comprising 70% of its weighted distribution. The distribution gains
across all major chains are, in turn, creating new promotional and
marketing opportunities.
As in the pcp, results also include a contribution from the sale
of a2 Platinum® infant formula in the wholesale market.
The Company is continuing to assess opportunities for incremental
business in Europe and the Middle East.
Science, research and development
A recently published clinical trial conducted in China, involving
~600 adult participants with self-reported lactose intolerance, found
that those who consumed milk containing only the A2 beta-casein
protein type had reduced acute gastrointestinal symptoms compared
with those from milk containing the A1 and A2 beta-casein protein
types. The authors said their findings demonstrated that, in some
individuals, symptoms from consumption of conventional milk
may be related to the presence of A1 beta-casein protein rather
than lactose.
A pilot human study carried out under the New Zealand
Government High Value Nutrition programme is now complete
and being submitted for publication. The study compared the
digestive effects of lactose-free milk, a2Milk™ and conventional
milk amongst milk intolerant participants. Subsequent follow-on
studies have now commenced.
A clinical study in China amongst pre-school children, examining
digestive benefits of milk free of the A1 beta casein protein type has
been completed and submitted for publication.
Studies in progress at the end of the period included a clinical
examination at Pennington Biomedical Research Centre, in the
United States, with regard to digestive function, inflammation and
aspects of metabolic function and a clinical study in association with
Monash University, in Australia, with regard to irritable
bowel syndrome.
Outlook
The Company has delivered a very strong first half-year, and
performance in January 2018 has been pleasing. Continued
revenue growth is expected in nutritional products in ANZ and
China, along with further growth in fresh milk in the United
States in consequence of the Northeast expansion. The focus on
growth initiatives in targeted emerging markets and new product
development will continue.
Gross margin percentage was higher than expected in the first
half primarily due to the higher proportion of infant formula sales,
currency movements and favourable net selling prices relative
to plan. This was partially offset by product cost increases and
margin mix within nutritionals. Subject to currency movements and
realisation of throughput efficiencies, the Company expects the gross
margin percentage to be broadly consistent in the second half.
As advised at the annual meeting in November 2017, earnings
growth in the second half will be tempered by a higher marketing
expense, with a half-on-half increase now likely to be in the range
of~NZ$35 - $40 million given the timing and scope of marketing
programmes in China and the United States. This increased brand
investment will further support future growth in these key markets.
Geoffrey Babidge
Managing Director & CEO
20 February 2018
CEO’s report (cont.)
Half year ended
31 Dec 17 NZ $000’s
Half year ended
31 Dec 16 NZ $000’s
Movement %
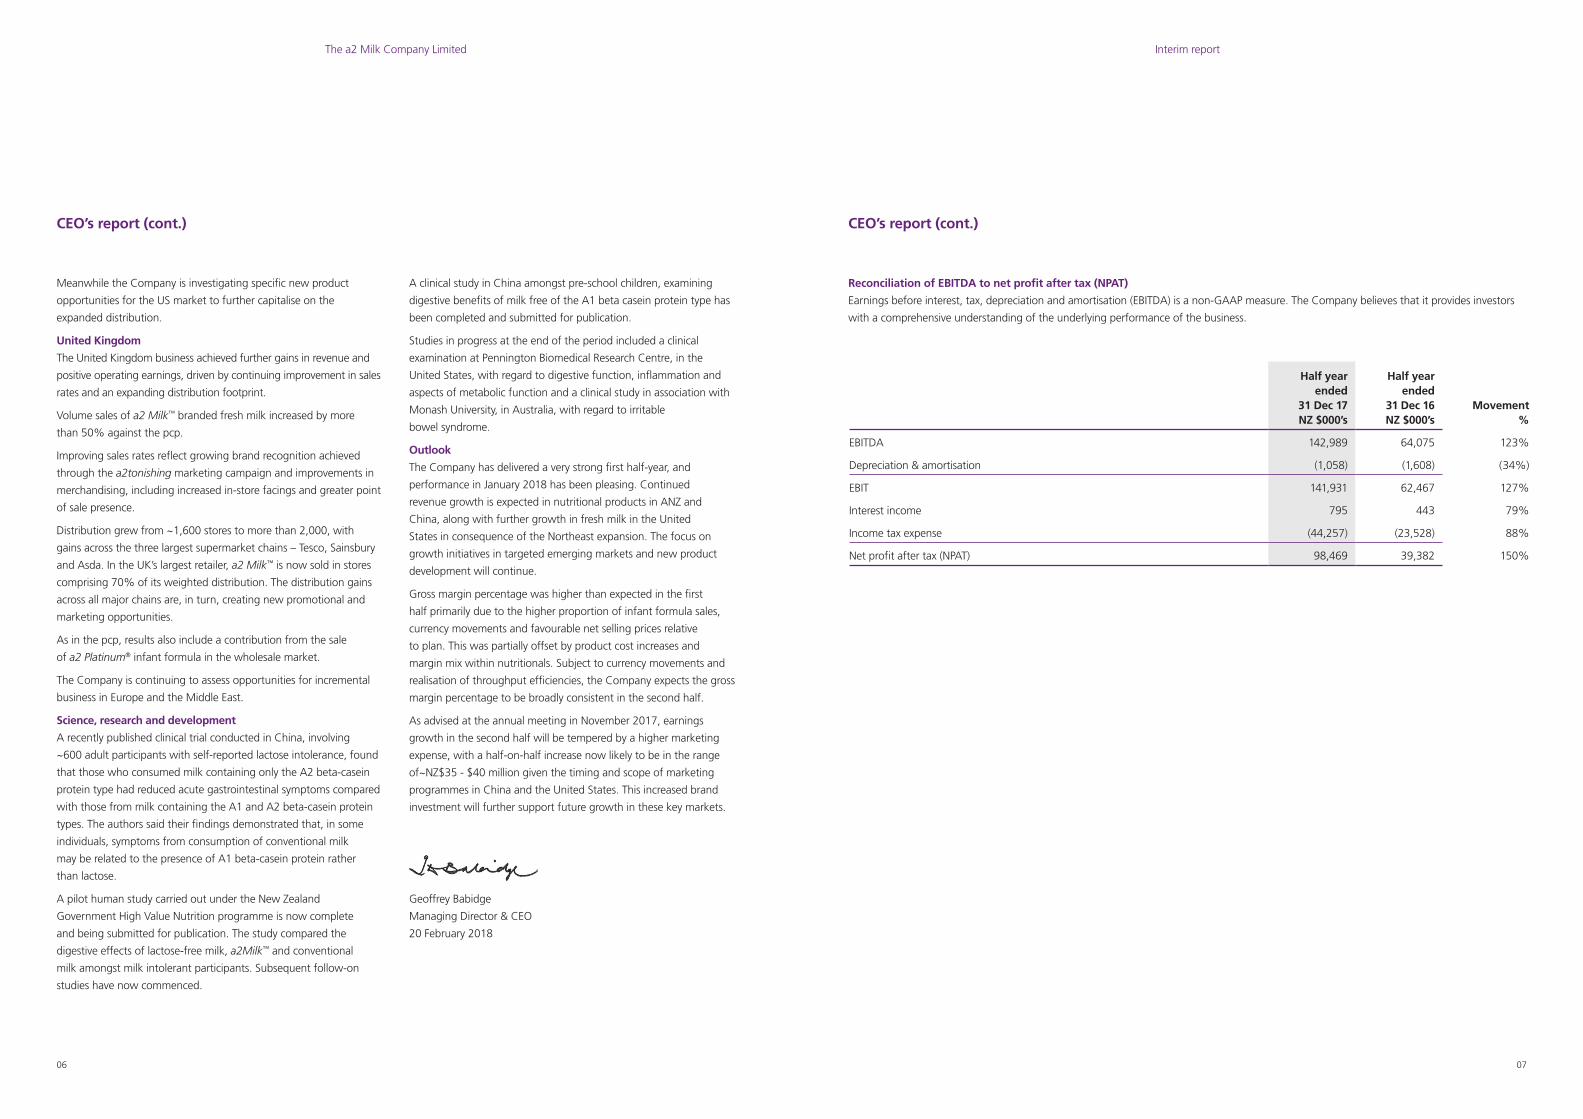
EBITDA 142,989 64,075 123%
Depreciation & amortisation (1,058) (1,608) (34%)
EBIT 141,931 62,467 127%
Interest income 795 443 79%
Income tax expense (44,257) (23,528) 88%
Net profit after tax (NPAT) 98,469 39,382 150%
Reconciliation of EBITDA to net profit after tax (NPAT)
Earnings before interest, tax, depreciation and amortisation (EBITDA) is a non-GAAP measure. The Company believes that it provides investors
with a comprehensive understanding of the underlying performance of the business.
CEO’s report (cont.)
Interim reportThe a2 Milk Company Limited
08 09
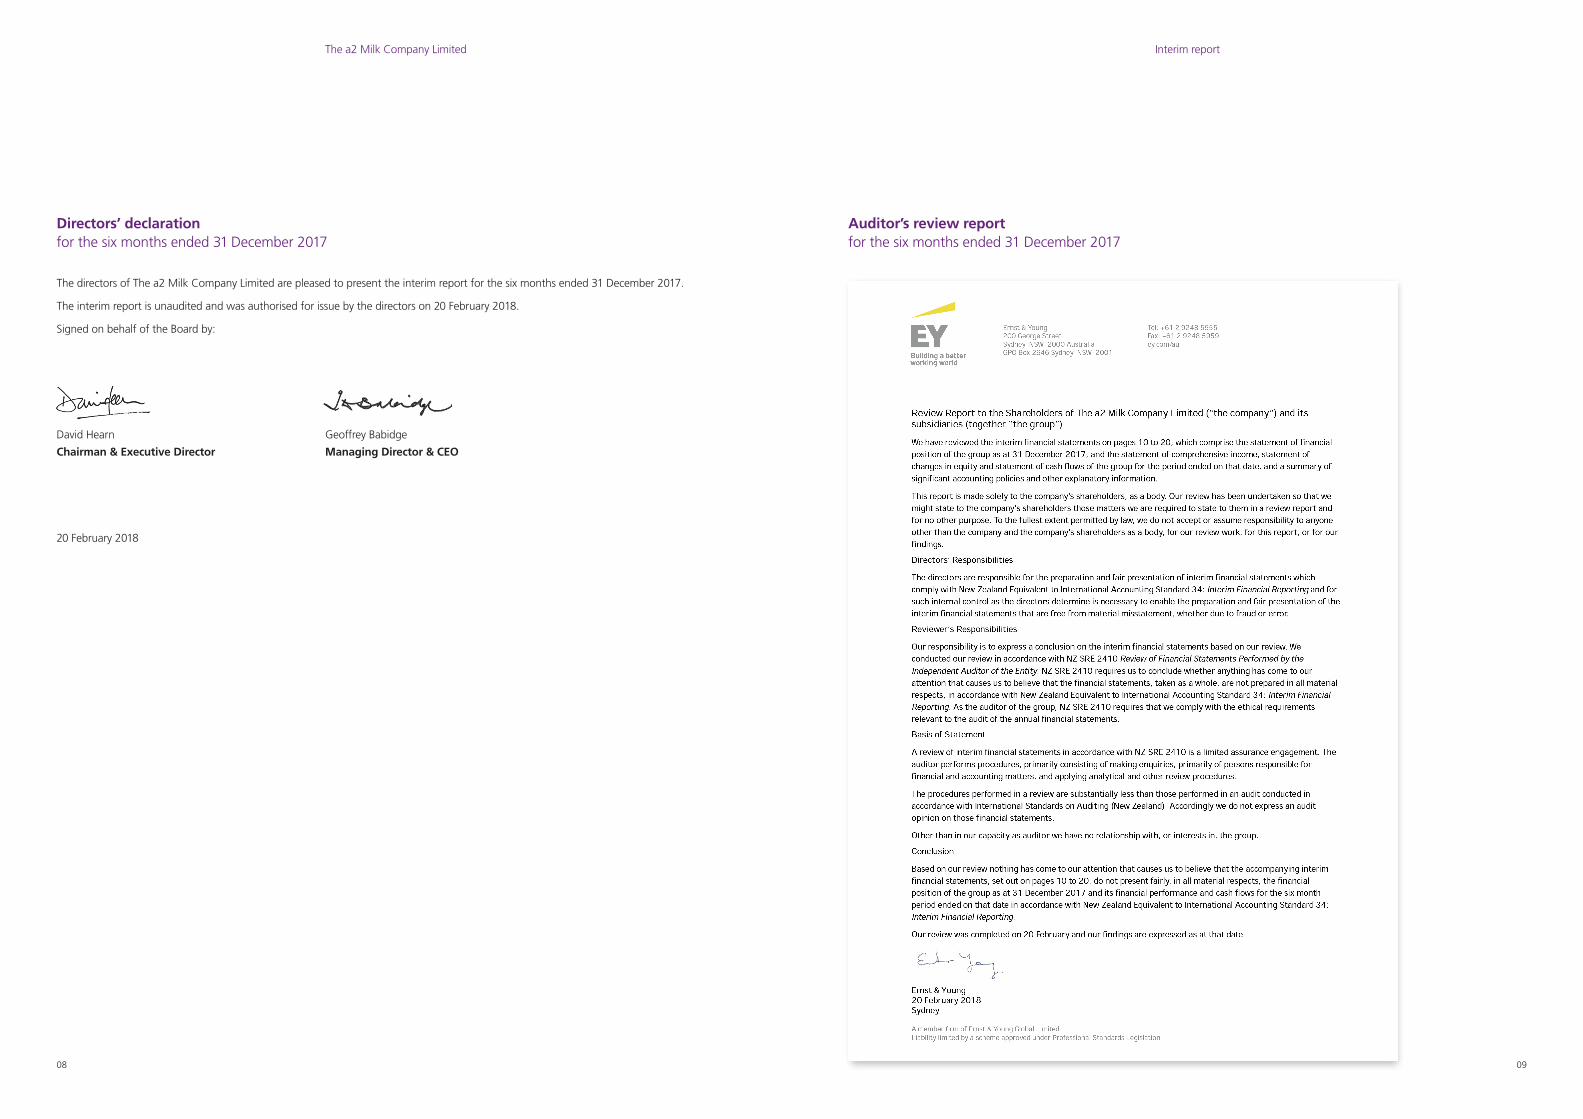
The directors of The a2 Milk Company Limited are pleased to present the interim report for the six months ended 31 December 2017.
The interim report is unaudited and was authorised for issue by the directors on 20 February 2018.
Signed on behalf of the Board by:
Directors’ declaration for the six months ended 31 December 2017
David Hearn
Chairman & Executive Director
20 February 2018
Geoffrey Babidge
Managing Director & CEO
Auditor’s review report for the six months ended 31 December 2017
Interim reportThe a2 Milk Company Limited

10 11
Notes31 Dec 17
$000’s31 Dec 16
$000’s
Sales 434,629 255,982
Cost of sales (218,166) (136,982)
Gross Margin 216,463 119,000
Other revenue 106 145
Distribution expenses (13,031) (9,526)
Administrative expenses 3 (21,757) (13,707)
Marketing expenses (26,007) (16,037)
Other expenses 4 (13,772) (17,328)
Operating profit 142,002 62,547
Finance income 795 443
Finance costs (71) (80)
Net finance income 724 363
Profit before tax 142,726 62,910
Income tax expense (44,257) (23,528)
Profit after tax for the period 98,469 39,382
Other comprehensive income Items that may be reclassified to profit or loss: Foreign currency translation gain/(loss) 2,189 (1,442)
Items not to be reclassified to profit or loss: Listed investment fair value gain 43,317 -
Total comprehensive income 143,975 37,940
Earnings per share
Basic (cents per share) 13.64 5.51
Diluted (cents per share) 13.25 5.37
The accompanying notes form part of these financial statements.
Consolidated statement of comprehensive income (Unaudited) for the six months ended 31 December 2017
Six months ended 31 December 2017
Foreign currency
translation reserve
$’000
Fair value revaluation
reserve $’000
Employee equity settled
payments reserve
$’000
Total reserves
$’000
Retained earnings
$’000
Share capital
$’000
Total equity $’000
Balance 1 July 2017 (10,948) 13,372 9,739 12,163 95,017 134,302 241,482
Profit after tax for the period - - - - 98,469 - 98,469
Foreign currency translation differences – foreign operations 2,369 - - 2,369 - - 2,369
Listed investment – fair value movement - 43,317 - 43,317 - - 43,317
Income tax (180) - - (180) - - (180)
Total comprehensive income for the period 2,189 43,317 - 45,506 98,469 - 143,975
Transactions with owners in their capacity as owners:
Issue of ordinary shares - - - - - 2,951 2,951
Share issue costs - - - - - (18) (18)
Share-based payments - - 1,243 1,243 - - 1,243
Total transactions with owners - - 1,243 1,243 - 2,933 4,176
Balance 31 December 2017 (8,759) 56,689 10,982 58,912 193,486 137,235 389,633
Six months ended 31 December 2016
Foreign currency
translation reserve
$’000
Employee equity settled
payments reserve
$’000
Total reserves
$’000
Retained earnings
$’000
Share capital
$’000
Total equity $’000
Balance 1 July 2016 (9,052) 7,211 (1,841) 4,371 130,548 133,078
Profit after tax for the period - - - 39,382 - 39,382
Foreign currency translation differences – foreign operations (1,800) - (1,800) - - (1,800)
Income tax 358 - 358 - - 358
Total comprehensive income for the period (1,442) - (1,442) 39,382 - 37,940
Transactions with owners in their capacity as owners:
Issue of ordinary shares - - - - 2,206 2,206
Share issue costs - - - - (6) (6)
Share-based payments - 1,146 1,146 - - 1,146
Total transactions with owners - 1,146 1,146 - 2,200 3,346
Balance 31 December 2016 (10,494) 8,357 (2,137) 43,753 132,748 174,364
The accompanying notes form part of these financial statements.
Consolidated statement of changes in equity (Unaudited) for the six months ended 31 December 2017
Interim reportThe a2 Milk Company Limited

12 13
Notes31 Dec 17
$000’s30 Jun 17
$000’s
Assets
Current assets
Cash & short-term deposits 240,172 121,020
Trade & other receivables 75,435 72,874
Prepayments 46,400 35,957
Inventories 6 53,606 28,437
Total current assets 415,613 258,288
Non-current assets
Property, plant & equipment 9,611 8,358
Intangible assets 13,905 13,281
Other financial assets 7 105,366 62,049
Deferred tax assets 3,155 1,954
Total non-current assets 132,037 85,642
Total assets 547,650 343,930
Liabilities
Current liabilities
Trade & other payables 123,502 71,350
Income tax payable 34,390 30,998
Total current liabilities 157,892 102,348
Non-current liabilities
Trade & other payables 125 100
Total non-current liabilities 125 100
Total liabilities 158,017 102,448
Net assets 389,633 241,482
Equity attributable to owners of the Company
Share capital 5 137,235 134,302
Retained earnings 193,486 95,017
Reserves 58,912 12,163
Total equity 389,633 241,482
The accompanying notes form part of these financial statements.
Consolidated statement of financial position (Unaudited) as at 31 December 2017
Notes31 Dec 17
$000’s31 Dec 16
$000’s
Cash flows from operating activities
Receipts from customers 440,765 237,823
Payments to suppliers & employees (278,627) (175,695)
Interest received 795 443
Taxes paid (46,491) (24,448)
Net cash inflow from operating activities 8 116,442 38,123
Cash flows from investing activities
Payments for property, plant & equipment (1,568) (614)
Investment in other intangible assets (578) (330)
Net cash outflow from investing activities (2,146) (944)
Cash flows from financing activities
Proceeds from issue of equity shares 2,933 2,200
Net cash inflow from financing activities 2,933 2,200
Net increase in cash & short-term deposits 117,229 39,379
Cash & short-term deposits at the beginning of the period 121,020 69,361
Effect of exchange rate changes on cash 1,923 (361)
Cash & short-term deposits at the end of the period 240,172 108,379
The accompanying notes form part of these financial statements.
Consolidated statement of cash flows (Unaudited) for the six months ended December 2017
Interim reportThe a2 Milk Company Limited

14 15
Adoption of NZ IFRS 9 (2014) Financial Instruments
The Group has early adopted NZ IFRS 9 Financial Instruments with
a date of initial application of 1 July 2017. The requirements of
NZ IFRS 9 represent a significant change from NZ IAS 39 Financial
Instruments: Recognition and Measurement.
The key changes to the Group’s accounting policies resulting from
its adoption of NZ IFRS 9 are summarised below.
As a result of the adoption of NZ IFRS 9, the Group has adopted
consequential amendments to NZ IAS 1 Presentation of Financial
Statements which requires impairment of financial assets to be
presented in a separate line item in the statement of comprehensive
income. Previously, the Group’s approach was to include the
impairment of trade receivables in other expenses.
Classification of financial assets
NZ IFRS 9 contains three principal classification categories for
financial assets: measured at amortised cost, fair value through
other comprehensive income (FVOCI) and fair value through profit
or loss (FVTPL). The classification of financial assets under NZ IFRS 9
is generally based on the business model in which a financial asset
is managed and its contractual cash flow characteristics. Compared
to NZ IAS 39, the standard imposes stricter requirements for
determining those financial assets that can be recognised at
amortised cost or fair value.
Under NZ IFRS 9, the Group’s financial assets consist of: cash and
short-term deposits and trade receivables, measured at amortised
cost; and a listed equity investment measured at FVOCI.
Classification of financial liabilities
Under NZ IFRS 9, the Group’s financial liabilities are trade
and other payables, measured at amortised cost.
Classification impact
The adoption of NZ IFRS 9 has not had a significant effect on
classification or the Group’s accounting policies for financial assets
and liabilities.
Impairment of financial assets
NZ IFRS 9 replaces the ‘incurred loss’ model in NZ IAS 39 with an
‘expected credit loss’ model. The new impairment model applies
to financial assets measured at amortised cost, but not to FVOCI
equity investments. Under NZ IFRS 9, credit losses are recognised
earlier than under NZ IAS 39.
Given the nature of the Group’s trade receivables, the expected
credit loss model did not materially change the impairment
allowance for doubtful debts.
1 Basis of preparation
The a2 Milk Company Limited (the Company) and its subsidiaries
(together the Group) is a for-profit entity incorporated and
domiciled in New Zealand.
The Company is registered in New Zealand under the Companies
Act 1993, and is an FMC reporting entity under the Financial
Markets Conduct Act 2013. The Company is also registered as a
foreign company in Australia under the Corporations Act 2001
(Cth, Australia). The shares of The a2 Milk Company Limited are
publicly traded on the New Zealand Stock Exchange (NZX), the
Australian Securities Exchange (ASX) and Chi-X Australia (Chi-X).
The financial report is presented in New Zealand dollars, and
all values are rounded to the nearest thousand ($’000), unless
otherwise indicated.
The principal activity of the Company is the commercialisation
of a2 Milk™ branded milk and related products as supported by the
ownership of intellectual property.
These consolidated financial statements were authorised for issue
by the directors on 20 February 2018.
Statement of compliance
These interim financial statements have not been audited.
The interim financial statements have been prepared in accordance
with Generally Accepted Accounting Practice in New Zealand,
comply with NZ IAS 34 Interim Financial Reporting and IAS 34
Interim Financial Reporting, and have been the subject of a review
by the auditors.
This interim report should be read in conjunction with the Group’s
annual report for the year ended 30 June 2017, available at
www.thea2milkcompany.com.
The same accounting policies and methods of computation are
followed in this interim report as were applied in the preparation
of the Group’s financial statements for the year ended 30 June
2017, other than the changes arising from the early adoption
of NZ IFRS 9 (2014): Financial Instruments, noted below.
Changes in significant accounting policies
The Group has applied all of the new and revised Standards and
Interpretations issued by the New Zealand External Reporting
Board that are relevant to the Group’s operations and effective for
the current accounting period. Their application has not had any
material impact on the Group’s assets, profits or earnings per share
for the half-year ended 31 December 2017.
Notes to the interim financial statements for the six months ended 31 December 2017
Other than cash and short-term deposits and trade and other
receivables and payables, and the listed equity investment as
noted above, the Group had no other financial assets and liabilities
as at 1 July 2017, or in prior periods, requiring transition
treatment consideration.
New standards and interpretations not yet adopted
Certain new accounting standards and interpretations have
been published that are relevant to the Group’s operations but
are not yet mandatory for the 31 December 2017 accounting
period. The Group’s current assessment of the impact of these
is set out below.
1 Basis of preparation (cont.)
Adoption of NZ IFRS 9 (2014) Financial Instruments (cont.)
Transition
Changes in accounting policies resulting from the adoption of
NZ IFRS 9 (2014) are applied retrospectively. There is no restatement
of prior periods as there is no significant change in the recognition
and measurement of cash and short-term deposits and trade and
other receivables and payables under the new standard.
The Group has made an irrevocable election to classify the listed
equity investment made in March 2017 at FVOCI, which does not
result in any restatement of prior periods.
Notes to the interim financial statements for the six months ended 31 December 2017
Accounting standard Requirement Impacts in future periods
NZ IFRS 15:
Revenue from Contracts with Customers
NZ IFRS 15 will become mandatory for
the Group’s annual reporting period
ending 30 June 2019.
It replaces the existing revenue
standard and interpretations and is based
on the identification of performance
obligations under a contract to determine
revenue treatment.
The Group has commenced an implementation project to assess
the impact of this standard.
Material contracts have been reviewed, establishing that the
Group’s current contractual arrangements generally result in single
performance obligations, with revenue recognised on delivery
to the customer.
It is expected that the implementation of the standard will result
in minimal change to revenue recognition and measurement.
Consideration is also being given to additional disclosures that
may be required, including: the disaggregation of total revenue;
information about performance obligations; movements in
contract receivable and payables; and key judgements and
estimates employed.
The Group does not expect to adopt the new standard
before 1 July 2018.
NZ IFRS 16:
LeasesNZ IFRS 16 will become mandatory
for the Group’s annual reporting period
ending 30 June 2020, replacing the
existing leases standard.
The new standard removes the distinction
between operating and finance leases,
recognising all lease assets and liabilities
on balance sheet, with limited exceptions
for short-term leases and low value assets.
As a right-to-use asset and a lease liability will be recognised
for operating leases, the change will result in a more front-loaded
expense pattern for operating leases as compared to current
straight-lining, with lease expense allocated to interest
and depreciation.
The Group does not plan to adopt this standard early, and the
full extent of the impact has not yet been determined.
There are no other standards that are not yet effective and that are expected to have a material impact on the Group in the current or future
reporting periods.
Interim reportThe a2 Milk Company Limited

16 17
– The China and other Asia segment receives external
revenue from infant formula, milk and other dairy products.
This segment is responsible for the infant formula supply chain
from New Zealand to all markets
– The United Kingdom and USA segment receives external
revenue from milk and infant formula sales
Management monitors the operating results of its business
units separately for the purpose of making decisions about
resource allocation and performance assessment. Segment
performance is assessed on segment EBITDA and is measured
consistently with operating profit or loss in the consolidated
financial statements.
2 Operating Segments
The Group’s key performance measures are segment revenue and
segment results before interest, tax, depreciation and amortisation
(Segment EBITDA, a non-GAAP measure1). Further information
and analysis of performance can be found in the CEO’s report,
which forms part of this Interim Report.
For management purposes, the Group is organised into business
units based on geographical location along with a corporate
function, and has three reportable operating segments as follows:
– The Australia and New Zealand segment receives external
revenue from infant formula, milk and other dairy products
along with royalty and licence fee income
Six months ended 31 December 2017
Australia and New Zealand
$’000
China and other Asia
$’000
UK and USA
$’000Total$’000
Consolidated sales 304,197 114,370 16,062 434,629
Other revenue 106 - - 106
Reportable segment revenue 304,303 114,370 16,062 434,735
Reportable segment results (Segment EBITDA) 116,402 48,322 (8,374) 156,350
Corporate EBITDA (13,361)
Group EBITDA 142,989
Reconciliation to consolidated statement of comprehensive income
Interest income 795
Depreciation & amortisation (1,058)
Income tax expense (44,257)
Consolidated profit after tax 98,469
1 A reconciliation of EBITDA to net profit after tax (NPAT) can be found on page 7
Notes to the interim financial statements for the six months ended 31 December 2017
2 Operating segments (cont.) Six months ended 31 December 2016
Australia and New Zealand
$’000
China and other Asia
$’000
UK and USA
$’000Total $’000
Consolidated sales 206,496 37,651 11,835 255,982
Other revenue 145 - - 145
Reportable segment revenue 206,641 37,651 11,835 256,127
Reportable segment results (Segment EBITDA) 70,379 13,728 (7,712) 76,395
Corporate EBITDA (12,320)
Group EBITDA 64,075
Reconciliation to consolidated statement of comprehensive income
Interest income 443
Depreciation & amortisation (1,608)
Income tax expense (23,528)
Consolidated profit after tax 39,382
Revenue by product type31 Dec 17
$’00031 Dec 16
$’000
Infant formula 340,955 184,487
Liquid milk 69,386 60,762
Other 24,394 10,878
434,735 256,127
Other segment information
Australia and New Zealand
$’000
China and other Asia
$’000
UK and USA
$’000
Total reportable
segments$’000
Corporate $’000
Total $’000
Segment assets
31 December 2017 128,255 184,025 16,419 328,699 218,951 547,650
30 June 2017 101,472 108,816 10,877 221,165 122,765 343,930
Segment liabilities
31 December 2017 23,823 87,155 6,503 117,481 40,536 158,017
30 June 2017 24,759 37,461 4,904 67,124 35,324 102,448
The China and other Asia segment includes assets and liabilities related to the infant formula supply chain from New Zealand to all markets.
Notes to the interim financial statements for the six months ended 31 December 2017
Interim reportThe a2 Milk Company Limited

18 19
4 Other expenses31 Dec 17
$’00031 Dec 16
$’000
Directors’ fees and expenses 427 315
Consultancy, accounting and secretarial fees 3,455 4,624
Legal expenses 3,875 1,783
Depreciation and amortisation 1,058 1,608
Patents, trademarks and research and development 1,796 1,896
Occupancy expenses 964 769
Impairment of intangible assets - 2,435
Other operating expenses 2,197 3,898
13,772 17,328
3 Administrative expenses31 Dec 17
$’00031 Dec 16
$’000
Equity settled share-based payments 1,243 1,146
Salary and wage costs 15,159 8,769
Travel costs 2,441 1,861
Other administrative expenses 2,914 1,931
21,757 13,707
The increase in salary and wage costs reflects increased resources to support growth in key markets.
Notes to the interim financial statements for the six months ended 31 December 2017
5 Share capitalNumber
of sharesShare capital
$’000
Movements in contributed equity:
Fully paid ordinary shares:
Balance 30 June 2017 718,238,067 134,302
Exercise of options 3,231,000 2,036
Vesting of rights 320,000 -
Partly paid shares fully paid 1,500,000 915
Share issue costs - (18)
Balance 31 December 2017 723,289,067 137,235
Partly paid ordinary shares:
Balance 30 June 2017 8,750,000 -
Partly paid shares fully paid (1,500,000) -
Balance 31 December 2017 7,250,000 -
Total ordinary shares on issue:
30 June 2017 726,988,067 134,302
31 December 2017 730,539,067 137,235
Partly paid ordinary shares carry the same rights and entitlements on a fractional basis, as fully paid ordinary shares, with such fractions being equivalent to the proportion which the amount paid is of the total amount paid and amounts still payable on the shares.
Notes to the interim financial statements for the six months ended 31 December 2017
6 Inventories31 Dec 17
$’00030 Jun 17
$’000
Raw materials 1,486 1,142
Finished goods 43,757 10,028
Goods in transit 8,363 17,267
Total inventories at the lower of cost and net realisable value 53,606 28,437
The increase in finished goods relates primarily to planned build in stock levels of infant formula for the China and ANZ businesses.
Interim reportThe a2 Milk Company Limited

20
9 Net tangible assets per security31 Dec 17
$30 Jun 17
$
Net tangible assets per security 0.51 0.31
8 Reconciliation of profit after tax with net cash flows from operating activities31 Dec 17
$’00031 Dec 16
$’000
Profit after tax for the period 98,469 39,382
Adjustments for non-cash items:
Depreciation and amortisation 1,058 1,608
Share-based payments 1,243 1,146
Net foreign exchange gain (522) (925)
Deferred tax (1,202) 2,087
Impairment of goodwill, trademarks and project development costs - 2,435
Changes in working capital:
Trade and other receivables (2,561) (22,456)
Prepayments (10,443) (2,513)
Inventories (25,169) 22,548
Trade and other payables 52,177 (6,462)
Income tax payable 3,392 1,273
Net cash inflow from operating activities 116,442 38,123
Notes to the interim financial statements for the six months ended 31 December 2017
7 Financial assets and liabilities
Other financial assets of $105,366,000 (30 June 2017: $62,049,000) consist of shares in Synlait Milk Limited, a dairy processing company
listed on the New Zealand Stock Exchange. This listed investment is the only financial instrument carried by the Group at fair value and
is classified at fair value through other comprehensive income; valued using Level 1 valuation inputs: quoted prices (unadjusted) in active
markets for identical assets or liabilities.
The carrying amounts of cash and short-term deposits, and trade and other receivables and payables are a reasonable approximation
of their fair values.
Corporate directory
Company The a2 Milk Company Limited
Level 10
51 Shortland Street
Auckland 1010
New Zealand
Auditor Ernst & Young
200 George Street
Sydney NSW 2000
Australia
New Zealand
share registry
Link Market Services Limited
PO Box 91976
Victoria Street West
Auckland 1142
New Zealand
Telephone +64 9 375 5998
Australian
share registry
Link Market Services Limited
Locked Bag A14
Sydney South NSW 1235
Australia
Telephone +61 1300 554 474
Legal
advisors
Simpson Grierson
Level 27
88 Shortland Street
Auckland 1010
New Zealand
Johnson Winter & Slattery
Level 25
20 Bond Street
Sydney NSW 2000
Australia
Registered
offices
Level 10
51 Shortland Street
Auckland 1010
New Zealand
Telephone: +64 9 972 9802
Level 4
182 Blues Point Road
McMahons Point NSW 2060
Australia
Telephone: +61 2 9697 7000
Company directors David Hearn (Chairman & Executive Director)
Julia Hoare (Deputy Chairman & Non-Executive Director)
Geoffrey Babidge (Managing Director & CEO)
Peter Hinton (Non-Executive Director)
Warwick Every-Burns (Non-Executive Director)
Jesse Wu (Non-Executive Director)
Corporate website www.thea2milkcompany.com
Interim reportThe a2 Milk Company Limited

thea2milkcompany.com
Related Documents