Scan to learn more about YTWO Formative January - March 2017 Interim Report

Welcome message from author
This document is posted to help you gain knowledge. Please leave a comment to let me know what you think about it! Share it to your friends and learn new things together.
Transcript

Scan to learn more about YTWO Formative
January - March 2017
Interim Report

LETTER TO OUR SHAREHOLDERS
Thomas Wolf, Chairman of the Administrative Board, CEO
DEAR SHAREHOLDERS, DEAR FRIENDS OF RIB SOFTWARE SE,
Despite a strong Q1 2016 with three Phase-II-contracts in-
cluded, the RIB Group was able to achieve growth in sales
and earnings in the first quarter of 2017 according to plan. In
addition, a Phase-III-contract was signed with Carillion plc,
a leading UK construction services company. Furthermore,
the first strategic partnership for the usage of the YTWO
platform was concluded with CG Gruppe AG.
In recent years, from 2011 to 2016, our iTWO community
and iTWO brand have reached a high level. For the new five
year plan from 2017 to 2021, and the years thereafter un-
til 2026, the outlook is positive throughout. Governments
worldwide, the IT industry and clients are discovering the
benefits of integrating two (iTWO) worlds, the virtual into the
physical. iTWO stands for this MR (Mixed Reality) process in
the construction industry.
1. We are on a strong path to reach our 2021 – 2026 tar-
gets: building up a community of 1,000 iTWO 5D techno-
logy partners and iTWO key account clients as the engi-
ne to transform the traditional building and infrastructure
industry into one of the most advanced industries on the
planet, keeping a steady EBITDA margin of approx.
30% in the software business.
2. We are on a strong path to support with iTWO³ - New
Thinking, New Working, New IT Technology - and the
iTWO City Technology the development of the 21st cen-
tury City and Infrastructure, also known as “Smart Cities”.
3. We are on a strong path to support with iTWO 4.0 the
next generation of IT, the Internet of Things (IoT). With
the new iTWO 4.0 platform and YTWO platform, iTWO
SP (smart production) and the xTWO platform, we have
LETTER TO OUR ShAREhOLDERS
2 RIB SOFTWARE SE | INTERIM REPORT JANUARY - MARCH 2017

developed exactly those solutions that the market is de-
manding and requiring for the digitalization and industri-
alization.
The global building and construction industry has re-
ached a size of almost USD 9 trillion and will grow to
USD 15 trillion by 2025. The IT spending can grow
from around USD 90 billion (1%) today to around USD
500 billion (3.3%). To position ourselves as a lea-
ding supplier tapping into this USD 500 billion mar-
ket, we will work hard on our organizational foundation.
Following RIB’s philosophy, we consider ourselves an IT
partner and enabler, which creates value to our clients,
rather than just a software vendor. To achieve this goal, we
have trained world-leading experts in the areas of business
process management, technical enterprise resource plan-
ning & controlling. Our RIB top experts have deep practical
knowledge in the macro- and micro-economic dynamics in
the global made-to-order and process industry. Together
with our clients, we are determined to halve their current
and future risks and double their profits. We are deter-
mined to reduce up to 50% waste in different sectors and
to achieve 30% benefits for the whole iTWO community, as
well as a contribution to the greater society. We are also
determined to support our industry by developing the next
generation of talents together with the leading technology
universities in the world, such as Georgia Institute of Tech-
nology in Atlanta, USA.
In 2016, we have completed the R&D work on the iTWO 4.0
Release 1.0, the next generation platform which will be the
main RIB technology in 2017 - 2021. Consequently we are
continuing the shift, which we started in the last year, from
a more R&D driven organization into a stronger marketing
driven organization. We are now able to offer standardized
IT solutions based on global “best practices”, which include
industry-specific content. In 2016, we have also positioned
YTWO in the market, the perfect IT platform and supply
chain solution for real estate developers and construction
materials suppliers.
In summary, with iTWO³, iTWO 4.0, YTWO Formative (SCM),
iTWO SP (PPS and smart production), iTWO PCI (project
cost insurance), iTWOtx (tender exchange platform), iTWO
FM (facility management), iTWO City (project developer plat-
form), iTWO World (communication platform), xTWOstore
(e-commerce platform for sanitaryware), iTWOscm, iTWOcx
(Collaboration Platform) and iTWO LAB (conceptual working
environment), we are working with maximum speed on
the end-to-end construction process.
The iTWO Technology development is done in close part-
nership and cooperation with our key iTWO Technology
Partners, such as clients, enablers and universities. here we
have formed together with our investors one of the stron-
gest IT teams in the world.
The world economy has slowed down in the last months
and some sectors like Oil & Gas and regions like China have
reduced their growth outlook for the next 12 months. But,
based on the 4.0 (IoT) and mass customization opportunity
for the process and made-to-order industry and on the infra-
structure needs of a 4 billion strong middle class of consu-
mers (today: 2 billion) in the next years, the fundamentals
are extremely supportive for a strong business development
in 2017 - 2026. Moreover, RIB also has a strong financial
foundation, which enables it to win a significant stake of the
expected USD 500 billion market opportunity in the future.
Thanks for your trust and support. I can promise the RIB
team will not rest and work hard to reach the next record
level and reach a real break-through for our technology, for
our management and for our investors.
Kind regards
Thomas Wolf
LETTER TO OUR ShAREhOLDERS
3INTERIM REPORT JANUARY - MARCH 2017 | RIB SOFTWARE SE

RIB OVERVIEW
COMPANY PROFILERIB Software SE is an innovator in construction business. The company creates, develops, and offers iTWO³
– new thinking, new working method and new technology - for construction projects across various industries
worldwide. iTWO today is the world’s first Cloud / License based Big Data 5D BIM enterprise solution for con-
struction companies, industrial companies, developers and investors.
Since its inception in 1961, RIB Software SE has been the pioneer in construction innovation, exploring and
bringing in new thinking, new working method and new technology to enhance construction productivity, and
transforming the construction industry into the most advanced and digitalized industry in the 21st century.
RIB is headquartered in Stuttgart, Germany, and listed in Prime Standard Frankfurt Stock Exchange since
2011. With more than 750 talents located in over 30 offices worldwide, RIB is serving 100,000 clients including
construction contractors, sub-contractors, developers, owners, investors and governments, in the field of buil-
ding construction, infrastructure, EPC sector and more.
For more information visit www.rib-software.com
CONSOLIDATED FIGURES - OVERVIEW
€ million unless otherwise indicated 1st quarter 2017 1st quarter 2016 change
Revenue 26.2 25.3 3.6%
Software licenses 6.5 7.7 -15.6%
Software as a Service / Cloud 4.3 3.8 13.2%
Maintenance 8.1 6.6 22.7%
Consulting 5.7 5.2 9.6%
e-Commerce 1.6 2.1 -23.8%
Operating EBITDA* 15.3 7.1 115.5%
as % of revenue 58.4% 28.1% .
Operating EBT* 11.8 4.9 140.8%
as % of revenue 45.0% 19.4% .
Write-downs from purchase price allocations (PPA amortisation) 0.9 1.0 -10.0%
Cash generated from operations 25.3 15.9 59.1%
Cash incl. available-for-sale securities** 165.4 135.4 22.2%
Equity ratio** 79.5% 82.1% -
Average number of employees 785 741 5.9%
* EBITDA and EBIT adjusted for currency effects (Q1 2017: € -0.1 million; Q1 2016: € -2.9 million) and one-time/special items
(Q1 2017: € +0.4 million; Q1 2016: 0.0)
** Previous year as of 31 December 2016
RIB OvERvIEW
4 RIB SOFTWARE SE | INTERIM REPORT JANUARY - MARCH 2017

RIB ON THE CAPITAL MARKET
RIB SHARE PRICE PERFORMANCE JANUARY - MARCH 2017
EVALUATION OF THE ANALYSTSShares in RIB have received a buy recommendation from the analysts Berenberg, Kepler Cheuvreux, hauck &
Aufhäuser and Equinet, while the share was assessed as “hold” by Warburg Research and as “neutral” by UBS.
Experts and analysts have allocated shares in RIB a target price of between € 11.00 and € 16.50.
SHAREHOLDER STRUCTUREAs of 27 April 2017
Shareholder Shares in %
Thomas Wolf & Family 18.65
Capital Group Companies, Inc. 7.90
Ameriprise Financial, Inc. 4.54
RIB Software SE (Treasury stock) 4.00
Lagoda Investment Management L.P. 3.19
Credit Suisse Fund Management S.A. 3.03
Schroders Investment Management Limited 2.99
henderson Global Investors Limited 2.97
hans-Joachim Sander & Family 2.92
Shares outstanding: 46,845,657
80%
90%
100%
110%
120% 14.88 €
13.64 €
12.40 €
11.16 €
9.92 € JANUARY FEBRUARY MARCH
RIB Software SE TecDax
RIB ON ThE CAPITAL MARKET
5INTERIM REPORT JANUARY - MARCH 2017 | RIB SOFTWARE SE

INTERIM GROUP MANAGEMENT REPORTREPORT ON EARNINGS, FINANCIAL POSITION AND NET WORTH
SALES IN THE SEGMENT ITWO MASS MARKET INCREASES BY 39.3% TO € 3.9 MILLION MAINTENANCE AND SAAS INCREASES BY 19.2%Despite a very strong prior-year quarter Q1 2016, the RIB Group was able to achieve rates of growth in sales
and earnings.
Even though there were recognized two very large Phase II orders in the amount of € 2.9 million in the Key
Account segment in the first quarter of 2016, the software licence sales amounted to € 6.5 million, only € 1.2
million below the previous year. This is mainly due to a gratifying growth in software licence sales in the Mass
Market, which rose by 39.3% to € 3.9 million (previous year: € 2.8 million). The in Q1 2017 announced Pha-
se-III-contract will be recognized as revenue in Q2 2017.
The accrued maintenance sales increased by 22.7% to € 8.1 million (previous year: € 6.6 million) and are con-
tinuing to account for a large proportion of recurring sales. In total, recurring sales (maintenance and SaaS)
rose by 19.2% to € 12.4 million (previous year: € 10.4 million). Sales of the consulting services increased by
9.6% to € 5.7 million (previous year: € 5.2 million).
Taking the aforementioned effects into account the high-margin iTWO segment sales rose from € 23.3 million
by € 1.4 million to € 24.7 million. During the reporting period, no transaction revenues were generated in the
xTWO segment from the YTWO joint venture. In the e-Commerce segment the focus was furthermore on
increasing output and consolidating the service range. Accordingly, sales in the period were under review
amounted to € 1.6 million (previous year: € 2.1 million) at the level planned for Q1 2017 (FY: € 6-7 million). Group
sales rose by 3.6% to € 26.2 million (previous year: € 25.3 million).
OPERATING EBITDA* INCREASES BY 115.5% TO € 15.3. MILLION OPERATING EBT* INCREASES BY 140.8% TO € 11.8 MILLION The operating earnings before interest, taxes, depreciation and amortisation (operating EBITDA*) increased
by 115.5% to € 15.3 million compared with the previous year (previous year: € 7.1 million). The operating
EBITDA-margin amounted to 58.4% (previous year: 28.1%). The operating earnings before taxes (operating
EBT*) rose during the reporting period by 140.8% to € 11.8 million (previous year: € 4.9 million). The main
reason for that is the sale of software licences to the joint venture YTWO in the amount of € 7.6 million (please
see also Note 5 Appendix Interim Report RIB Software SE).
The tax rate amounted to 34.7% and was significant lower than in the previous year (40.0%). The main reason
for this is that in the reporting period, higher results of foreign companies with lower income tax rates were
achieved compared to the previous year.
The gross margin increased about 3 percentage points to 58.4% (previous year: 55.7%).
*) EBITDA and EBT adjusted for currency effects (Q1 2017: € -0.1 million; Q1 2016: € -2.9 million) and one-time/special items (Q1 2017: € +0.4 million;
Q1 2016: 0.0)
6 RIB SOFTWARE SE | INTERIM REPORT JANUARY - MARCH 2017
INTERIM GROUP MANAGEMENT REPORT | REPORT ON EARNINGS, FINANCIAL POSITION AND NET WORTh

R&D expenditure increased by 37.5% to € 3.3 million during the reporting period (previous year: € 2.4 million).
The increase essentially occurred on the basis of the boost to our iTWO 4.0 development team and a lower
capitalization of development costs. The administrative costs have increased from € 2.4 million to € 2.7 million.
The expenditure of marketing and distribution amounted to € 4.6 million (previous year: € 4.5 million).
The average number of employees changed by 5.9% to 785 (previous year: 741 employees).
CASH GENERATED FROM OPERATIONS INCREASES BY 59.1% TO € 25.3 MILLIONThe RIB Group generated pre-tax cash flow from operating activities of € 25.3 million (previous year: € 15.9
million), which equates to an increase of 59.1% compared with the last year. The cash flow from operating
activities reached € 23.8 million (previous year: € 11.2 million). The cash flow from investing activities was with
€ 1.0 million significant higher than in the previous year (€ 0.2 million). The main reason for that are the receipt
of payments through the sale of the MAC International to the joint venture YTWO in the amount of € 2.9 million.
The cash flow from financing activities in the amount of € 6.0 million includes mainly receipt of payments of
bank loans in the context of the sale of our office building in Stuttgart (€ 6.0 million). In the previous year, no
payments were made or received.
As at 31.03.2017, the Group held liquid assets, including securities available-for-sale, of € 165.4 million
(31.12.2016: € 135.4 million). Total equity amounted to € 298.7 million (31.12.2016: € 291.8 million). The equity
ratio decreased slightly to 79.5% (31.12.2016: 82.1%).
Trade payables decreased by 32.0% to € 1.7 million (31.12.2016: € 2.5 million). Trade receivable increased to
€ 19.4 million (31.12.2016: € 18.4 million).
OPPORTUNITY AND RISK REPORTWith regard to the important opportunities and risks of the expected development of the RIB Group, please
refer to the opportunities and risks described in the management report of 31 December 2016.
FORECAST REPORTDue to the clearly increased demand for our software and SaaS/Cloud solutions in the last few years, we cont-
inue to see good growth opportunities for 2017 for the RIB Group. The market roll-out of our new cloud-based
iTWO 4.0 software platform opens the possibility of opening new markets outside the DACh region significantly
more efficiently and addressing individual customer wishes without significant development expenditures.
The new area YTWO (SCM) offers a fully integrated cloud-based supply chain management solution, based on
the iTWO 4.0 software platform, with which we will tap into new customer segments and give existing custo-
mers the possibility to digitally plan, manage, and monitor their complete material and service needs.
Due to the positive development in the first quarter 2017 and the assumption based on otherwise stable
framework conditions in the market, RIB Group confirms the guidance for the fiscal year 2017, with sales bet-
ween € 98 million and € 108 million and an EBITDA of between € 28 million and € 38 million.
7INTERIM REPORT JANUARY - MARCH 2017 | RIB SOFTWARE SE
REPORT ON EARNINGS, FINANCIAL POSITION AND NET WORTh | INTERIM GROUP MANAGEMENT REPORT

CONSOLIDATED INCOME STATEMENT
For the period: 01.01.2017 to 31.03.2017
figures in € thousand, unless otherwise indicated Note 3 months 2017 3 months 2016
Revenue (4) 26,218 25,345
Cost of sales -10,939 -11,229
Gross profit 15,279 14,116
Other operating income (5) 8,512 116
Marketing and distribution costs -4,622 -4,535
General administrative expenses -2,674 -2,368
Research and development expenses -3,344 -2,392
Other operating expenses (6) -110 -2,966
Financial income 28 95
Finance costs -48 -69
Share of profit and losses of associates -918 3
Profit before tax 12,103 2,000
Income taxes -4,227 -825
Profit after tax 7,876 1,175
Loss attributable to non-controlling interests -18 -49
Profit attributable to owners of the parent company 7,894 1,224
Result per share on the basis of the share earnings of the
shareholders of RIB Software SE:
basic (8) 0.18 € 0.03 €
diluted (8) 0.17 € 0.03 €
CONSOLIDATED INTERIM FINANCIAL STATEMENTS
8 RIB SOFTWARE SE | INTERIM REPORT JANUARY - MARCH 2017
CONSOLIDATED INTERIM FINANCIAL STATEMENTS | CONSOLIDATED INCOME STATEMENT

CONSOLIDATED STATEMENT OF COMPREHENSIVE INCOME
For the period: 01.01.2017 to 31.03.2017
Figures in € thousand 3 months 2017 3 months 2016
Profit after tax 7,876 1,175
Components reclassified with no effect on profit and loss: . .
Revaluations -46 8
Other consolidated comprehensive income after taxes for com-ponents reclassified with no effect on profit and loss -46 8
Components reclassified in subsequent periods with an effect on
profit and loss:
Exchange differences -1,256 -1,643
Changes in value of available-for-sale securities 0 0
Other consolidated comprehensive income after taxes for com-ponents reclassified with an effect on profit and loss -1,256 -1,643
Other consolidated comprehensive income after taxes -1,302 -1,635
Total consolidated comprehensive income 6,574 -460
of which attributable to non-controlling interests -18 -49
of which attributable to owners of the parent company 6,592 -411
9INTERIM REPORT JANUARY - MARCH 2017 | RIB SOFTWARE SE
CONSOLIDATED STATEMENT OF COMPREhENSIvE INCOME | CONSOLIDATED INTERIM FINANCIAL STATEMENTS

CONSOLIDATED STATEMENT OF FINANCIAL POSITION AS OF 31.03.2017 AND 31.12.2016
Figures in € thousand Note 31.03.2017 31.12.2016
Goodwill (9) 67,268 67,166
Other intangible assets 49,417 50,005
Property, plant and equipment 16,035 16,185
Investment properties 5,208 5,272
Investments accounted for using the equity method (10) 42,705 52,166
Prepaid land use lease payments 996 1,006
Other assets 16 16
Deferred tax assets 2,700 1,541
Total non-current assets 184,345 193,358
Inventories 1,649 1,432
Trade receivables 19,443 18,420
Gross amounts due from customers for contract
work 404 136
Available-for-sale securities 98 98
Other assets 4,602 6,650
Cash and cash equivalents 165,277 135,323
Total current assets 191,473 162,059
Total assets 375,818 355,417
10 RIB SOFTWARE SE | INTERIM REPORT JANUARY - MARCH 2017
CONSOLIDATED INTERIM FINANCIAL STATEMENTS | CONSOLIDATED STATEMENT OF FINANCIAL POSITION AS OF 31.03.2017 AND 31.12.2016

Figures in € thousand Note 31.03.2017 31.12.2016
Subscribed capital 46,846 46,846
Treasury shares -10,597 -10,597
Capital reserves 182,585 182,284
Legal reserves 95 95
Accumulated other consolidated comprehensive income 10,050 11,352
Retained earnings 69,814 61,926
Equity attributable to owners of the parent company 298,793 291,906
Non-controlling interests (11) -141 -123
Total equity 298,652 291,783
Pension provisions 3,883 3,840
Bank loans 5,500 0
Other provisions 299 286
Other finance liabilities 1,922 1,882
Deferred tax liabilities 11,888 12,116
Total non-current liabilities 23,492 18,124
Bank loans 401 0
Trade payables 1,744 2,456
Provisions for income taxes 8,125 4,337
Other provisions 1,194 1,153
Accruals 3,866 4,496
Deferred revenue 35,394 12,817
Other financial liabilities 200 579
Other liabilities 2,750 19,672
Total current liabilities 53,674 45,510
Total liabilities 77,166 63,634
Total equity and liabilities 375,818 355,417
11INTERIM REPORT JANUARY - MARCH 2017 | RIB SOFTWARE SE
CONSOLIDATED STATEMENT OF FINANCIAL POSITION AS OF 31.03.2017 AND 31.12.2016 | CONSOLIDATED INTERIM FINANCIAL STATEMENTS

CONSOLIDATED STATEMENT OF CHANGES IN EQUITY
For the period: 01.01.2017 to 31.03.2017
Accumulated other comprehensive income
Figures in € thousand
Issued
capital
Capital
reserves
Legal
reserves
Changes in
value of avai-
lable-for-sale
securities
Foreign
currency
translation
reserve
Revalua-
tions
Treasury
shares
Retained
earnings
Equity attributa-
ble to owners of
parent
Non-con-
trolling
interests
Total equity
according to
consolidated
statement
of financial
position
As of 1 January 2016 46,846 181,396 95 1 8,332 -390 -4,828 54,657 286,109 -167 285,942
Profit after tax - - - - - - - 1,224 1,224 -49 1,175
Other comprehensive income - - - - -1,643 8 - - -1,635 - -1,635
Total comprehensive income 0 0 0 0 -1,643 8 0 1,224 -411 -49 -460
Disposal of treasury shares - - - - - - - - - - -
Dividend payment - - - - - - - - - - -
Capital increase - - - - - - - - - - -
Other changes - 0 - - - - - - - - -
Share-based remuneration - 268 - - - - - - 268 - 268
As of 31 March 2016 46,846 181,664 95 1 6,689 -382 -4,828 55,881 285,966 -216 285,750
46,846 181,664 95
As of 1 January 2017 46,846 182,284 95 0 11,925 -573 -10,597 61,926 291,906 -123 291,783
Profit after tax - - - - - - - 7,894 7,894 -18 7,876
Other comprehensive income - - - - -1,256 -46 - - -1,302 - -1,302
Total comprehensive income 0 0 0 0 -1,256 -46 0 7,894 6,592 -18 6,574
Purchase of treasury shares - - - - - - - - - - -
Dividend payment - - - - - - - - - - -
Capital increase - - - - - - - - - - -
Other changes - 0 - - - - - -6 -6 - -6
Share-based remuneration - 301 - - - - - - 301 - 301
As of 31 March 2017 46,846 182,585 95 0 10,669 -619 -10,597 69,814 298,793 -141 298,652
12 RIB SOFTWARE SE | INTERIM REPORT JANUARY - MARCH 2017
CONSOLIDATED INTERIM FINANCIAL STATEMENTS | CONSOLIDATED STATEMENT OF ChANGES IN EQUITY

CONSOLIDATED STATEMENT OF CHANGES IN EQUITY
For the period: 01.01.2017 to 31.03.2017
Accumulated other comprehensive income
Figures in € thousand
Issued
capital
Capital
reserves
Legal
reserves
Changes in
value of avai-
lable-for-sale
securities
Foreign
currency
translation
reserve
Revalua-
tions
Treasury
shares
Retained
earnings
Equity attributa-
ble to owners of
parent
Non-con-
trolling
interests
Total equity
according to
consolidated
statement
of financial
position
As of 1 January 2016 46,846 181,396 95 1 8,332 -390 -4,828 54,657 286,109 -167 285,942
Profit after tax - - - - - - - 1,224 1,224 -49 1,175
Other comprehensive income - - - - -1,643 8 - - -1,635 - -1,635
Total comprehensive income 0 0 0 0 -1,643 8 0 1,224 -411 -49 -460
Disposal of treasury shares - - - - - - - - - - -
Dividend payment - - - - - - - - - - -
Capital increase - - - - - - - - - - -
Other changes - 0 - - - - - - - - -
Share-based remuneration - 268 - - - - - - 268 - 268
As of 31 March 2016 46,846 181,664 95 1 6,689 -382 -4,828 55,881 285,966 -216 285,750
46,846 181,664 95
As of 1 January 2017 46,846 182,284 95 0 11,925 -573 -10,597 61,926 291,906 -123 291,783
Profit after tax - - - - - - - 7,894 7,894 -18 7,876
Other comprehensive income - - - - -1,256 -46 - - -1,302 - -1,302
Total comprehensive income 0 0 0 0 -1,256 -46 0 7,894 6,592 -18 6,574
Purchase of treasury shares - - - - - - - - - - -
Dividend payment - - - - - - - - - - -
Capital increase - - - - - - - - - - -
Other changes - 0 - - - - - -6 -6 - -6
Share-based remuneration - 301 - - - - - - 301 - 301
As of 31 March 2017 46,846 182,585 95 0 10,669 -619 -10,597 69,814 298,793 -141 298,652
13INTERIM REPORT JANUARY - MARCH 2017 | RIB SOFTWARE SE
CONSOLIDATED STATEMENT OF ChANGES IN EQUITY | CONSOLIDATED INTERIM FINANCIAL STATEMENTS

CONSOLIDATED STATEMENT OF CASH FLOWS
For the period: 01.01.2017 to 31.03.2017
Figures in € thousand 3 months 2017 3 months 2016
Cash flows from operating activities:
Profit before tax 12,103 2,000
Adjustments for:
Depreciation of property, plant and equipment 222 176
Amortisation of intangible assets 2,309 2,025
Depreciation of investment property 34 38
Changes in valuation allowances for trade receivables 18 84
Other non-cash items 7,450 3,154
Interest expense and other finance cost 48 69
Financial income -28 -95
22,156 7,451
Working capital adjustments:
Increase/decrease(-) in provisions and deferred liabilities 473 -399
Increase(-)/decrease in receivables and other assets -2,304 -1,618
Increase/decrease(-) in received payments -15,782 -34
Increase/decrease(-) in liabilities from trade payables and other liabilities 20,718 10,548
Cash generated from operations 25,261 15,948
Interest paid -13 -17
Interest received 3 64
Income taxes paid -1,500 -4,819
Cash flow from operating activities 23,751 11,176
Proceeds from the disposal of non-current assets 2 0
Purchase of property, plant and equipment -115 -132
Purchase/production of intangible assets -1,753 -2,190
Disposal of consolidated companies less cash disposed 2,878 0
Purchase(-)/sale of available-for-sale securities 0 2,561
Cash flow from investing activities 1,012 239
Dividend received from investments accounted for using the equity method 97 0
Cash received from bank loans 6,000 0
Repayment of bank loans -100 0
Cash flow from financing activities 5,997 0
Change in cash and cash equivalents impacting cash flow 30,760 11,415
Cash and cash equivalents at the beginning of the period 135,323 174,335
Currency-related change in cash and cash equivalents -806 -3,440
Cash and cash equivalents at the end of the period 165,277 182,310
Composition of cash and cash equivalents:
Liquid funds, unrestricted 161,644 180,905
Liquid funds, restricted 3,633 1,405
Total 165,277 182,310
14 RIB SOFTWARE SE | INTERIM REPORT JANUARY - MARCH 2017
CONSOLIDATED INTERIM FINANCIAL STATEMENTS | CONSOLIDATED STATEMENT OF CASh FLOWS

NOTES TO THE CONSOLIDATED INTERIM FINANCIAL STATEMENTS
1. CORPORATE INFORMATION
RIB Software AG has entered into a European Stock Company (Societas Europaea / SE) and is now trading as
RIB Software SE. The new legal form has been registered in the commercial register on 3 April 2017.
This condensed consolidated interim financial statement of RIB Software SE (the “Company”) and its subsidia-
ries (collectively the “Group”) was drawn up according to the regulations of the International Financial Repor-
ting Standards (IFRS). It complies in particular with the IAS 34 regulations “Interim reporting”.
The condensed consolidated interim financial statement has not been subjected to auditing inspection or a
general audit.
Our business activity is in some respects subject to seasonal fluctuations.
In the past the revenue in the fourth quarter tended to be higher than in the individual preceding quarters. The
interim results can therefore only be regarded as an indicator for the results of the entire financial year.
This condensed and unaudited consolidated interim financial statement should be read with the audited IFRS
consolidated financial statements of RIB Software SE as of 31 December 2016.
Due to the representation of the numbers in € thousands, rounding differences may arise in individual items.
2. ACCOUNTING POLICIES
In drawing up the consolidated interim financial report the same accounting policies and calculation methods
were used as in the consolidated financial statements as of 31 December 2016.
3. CONSOLIDATED GROUP
Compared to the consolidated financial statements as of 31 December 2016, the scope of consolidation as of
31 March 2017 remained unchained.
4. REVENUE
Revenue breaks down as follows:
Figures in € thousand 3 months 2017 3 months 2016
Software licences 6,482 7,690
Software as a service / cloud 4,346 3,757
Total software licences and software as a service / cloud 10,828 11,447
Maintenance 8,149 6,643
Consulting 5,683 5,190
e-Commmerce 1,558 2,065
Total revenue 26,218 25,345
15INTERIM REPORT JANUARY - MARCH 2017 | RIB SOFTWARE SE
NOTES TO ThE CONSOLIDATED INTERIM FINANCIAL STATEMENTS | CONSOLIDATED INTERIM FINANCIAL STATEMENTS

The total software licence revenue is subdivided as follows:
Figures in € thousand 3 months 2017 3 months 2016
iTWO Key Account 621 2,931
iTWO Mass Market 3,949 2,774
SaaS / Cloud 4,346 3,757
Legacy Products 1,912 1,985
Total software licences and software as a service / cloud 10,828 11,447
5. OTHER OPERATING INCOME
Other operating income primarily include income from the software delivery to YTWO of € 7,601 thousand and
income from purchase price liabilities adjustments of € 380 thousand.
6. OTHER OPERATING EXPENSES
Other operating expenses include foreign exchange expenses arising from cash and cash equivalents amoun-
ting to around € 71 thousand.
7. EXPENSES FOR EMPLOYEE BENEFITS AND NUMBER OF EMPLOYEES
Expenses for employee benefitsFigures in € thousand 3 months 2017 3 months 2016
Wages and salaries 10,352 9,688
Social security and pension costs 1,793 1,683
Total 12,145 11,371
Average number of employees 3 months 2017 3 months 2016
General administration 99 96
Research & development 317 290
Sales & marketing 149 123
Support & consulting 220 232
Total 785 741
16 RIB SOFTWARE SE | INTERIM REPORT JANUARY - MARCH 2017
CONSOLIDATED INTERIM FINANCIAL STATEMENTS | NOTES TO ThE CONSOLIDATED INTERIM FINANCIAL STATEMENTS

8. EARNINGS PER SHARE – BASIC AND DILUTED
Earnings per share are calculated on the basis of the profit share of the shareholders in RIB Software SE as
shown in the following table:
figures in € thousand 3 months 2017 3 months 2016
Profit share of the shareholders of RIB Software SE – basic and diluted 7,894 1,224
figures in thousand shares 3 months 2017 3 months 2016
Weighted average of shares in circulation - basic 44,973 45,645
Dilution effect 490 331
Weighted average of shares in circulation - diluted 45,463 45,976
The average commercial value of the Company’s shares used to calculate the dilution effect of existing share
options is based on the quoted market prices for the period in which the options were in circulation.
9. GOODWILLFigures in € thousand 31.03.2017 31.12.2016
Licence/software business segment 43,754 43,730
SaaS/Cloud business segment 12,898 12,770
Consulting business segment 5,785 5,815
iTWO reporting segment 62,437 62,315
YTWO (SCM) business segment 0 0
xTWO (e-Commerce) business segment 689 689
xTWO reporting segment 689 689
GZ TWO development entity 3,248 3,268
Arriba Finance 894 894
Total 67,268 67,166
The change in carrying amounts by € 102 thousand was attributable to currency translation effects of goodwill
held in local currency, which were recognised outside profit or loss.
10. INVESTMENTS ACCOUNTED FOR USING THE EQUITY METHOD
YTWO Exactal Others Total
Carrying amounts as of 31.12.2016 49,170 2,892 104 52,166
Elimination of unrealized profits from “downstream
sales” -7,601 0 0 -7,601
Dividend paid to the group 0 -97 0 -97
Comprehensive income attributable to the group -1,710 -53 0 -1,763
Carrying amounts as of 31.03.2017 39,859 2,742 104 42,705
17INTERIM REPORT JANUARY - MARCH 2017 | RIB SOFTWARE SE
NOTES TO ThE CONSOLIDATED INTERIM FINANCIAL STATEMENTS | CONSOLIDATED INTERIM FINANCIAL STATEMENTS

11. NON-CONTROLLING INTERESTS
The non-controlling interests relates to 25% of the shares of xTWOmarket Gmbh.
12. SEGMENT INFORMATION
Please refer to section (7) of our consolidated financial statements for the 2016 financial year for information on
the basis of our segment reporting and notes on the segments.
The tables below show the segment revenue, segment results and reconciliations with the revenue shown in
the consolidated income statement and comprehensive income.
3 months 2017
Figures in € thousand iTWO xTWO Total
Revenue, external 24,660 1,558 26,218
License / Software 14,631 - 14,631
SaaS / Cloud 4,346 - 4,346
Consulting 5,683 - 5,683
xTWO (e-Commerce) - 1,558 1,558
Production costs -9,575 -1,364 -10,939
License / Software -4,636 - -4,636
SaaS / Cloud -774 - -774
Consulting -4,165 - -4,165
xTWO (e-Commerce) - -1,364 -1,364
Research and development expenses -3,339 -5 -3,344
License / Software -2,381 - -2,381
SaaS / Cloud -958 - -958
Consulting - - 0
xTWO (e-Commerce) - -5 -5
Distribution and marketing costs -4,361 -261 -4,622
General administrative expenses -2,483 -191 -2,674
Other operating income and expenses 8,389 13 8,402
EBIT Segment 13,291 -250 13,041
Financial result -938
thereof profit shares from investments accoun-
ted for using the equity method 51 -969 -918
Income taxes -4,227
Consolidated net profit 7,876
EBITDA Segment 15,879 -220 15,659
EBITDA-margin 64.4% -14.1% 59.7%
Other segment information:
Segment amortisation and adjustments 2,588 30 2,618
Carrying amount of participation in the joint
venture YTWO accounted for using the equity
method - 39,859 39,859
18 RIB SOFTWARE SE | INTERIM REPORT JANUARY - MARCH 2017
CONSOLIDATED INTERIM FINANCIAL STATEMENTS | NOTES TO ThE CONSOLIDATED INTERIM FINANCIAL STATEMENTS

3 months 2016
Figures in € thousand iTWO xTWO Total
Revenue, external 23,280 2,065 25,345
License / Software 14,333 - 14,333
SaaS / Cloud 3,757 - 3,757
Consulting 5,190 - 5,190
xTWO (e-Commerce) - 2,065 2,065
Production costs -9,206 -2,023 -11,229
License / Software -4,592 - -4,592
SaaS / Cloud -444 - -444
Consulting -4,170 - -4,170
xTWO (e-Commerce) - -2,023 -2,023
Research and development expenses -2,378 -14 -2,392
License / Software -1,855 - -1,855
SaaS / Cloud -523 - -523
Consulting - - 0
xTWO (e-Commerce) - -14 -14
Distribution and marketing costs -4,148 -387 -4,535
General administrative expenses -2,150 -218 -2,368
Other operating income and expenses -2,885 35 -2,850
EBIT Segment 2,513 -542 1,971
Financial result 29
thereof profit shares from investments accoun-
ted for using the equity method 3 - 3
Income taxes -825
Consolidated net profit 1,175
EBITDA Segment 4,760 -520 4,240
EBITDA-margin 20.4% -25.2% 16.7%
Other segment information:
Segment amortisation and adjustments 2,247 22 2,269
Carrying amount of participation in the joint
venture YTWO accounted for using the equity
method - - 0
The Managing Directors as the chief operating decision-makers do not request submission of any regular de-
tails of segment assets and segment liabilities.
19INTERIM REPORT JANUARY - MARCH 2017 | RIB SOFTWARE SE
NOTES TO ThE CONSOLIDATED INTERIM FINANCIAL STATEMENTS | CONSOLIDATED INTERIM FINANCIAL STATEMENTS

Geographic informationRevenue by geographic area (based on the location of customers) breaks down as follows:
Figures in € thousand 3 months 2017 3 months 2016
EMEA (Europe, Middle East and Africa) 21,785 21,244
APAC (Asia Pacific) 889 760
North America 3,544 3,341
Total revenue 26,218 25,345
13. FINANCIAL INSTRUMENTS - FAIR VALUE
Classifications and fair valuesThe following table shows the book values and fair values of financial assets and financial liabilities, including
their levels in the fair value hierarchy. It does not contain any information on the fair value of financial assets
and financial debts that are not assessed at fair value if the book value is an appropriate approximation of the
fair value.
20 RIB SOFTWARE SE | INTERIM REPORT JANUARY - MARCH 2017
CONSOLIDATED INTERIM FINANCIAL STATEMENTS | NOTES TO ThE CONSOLIDATED INTERIM FINANCIAL STATEMENTS

Carrying amount Fair value
Figures in € thousand
Available
for sale
Loans and
receivables
Level
1
Level
2
Level
3 Total
As of 31 March 2017
Financial assets at fair value . .
Cash market and invest-
ment funds 86 - 86 - - 86
Corporate Bonds 12 - 12 - - 12
Total 98 - 98 - - 98
Financial assets not mea-sured at fair value
Accounts receivable trade - 19,443 - - - -
Other Assets* 4,453
Cash and cash equivalents - 165,277 - - - -
Total - 189,173 - - - -
Held for trading
Other finan-cial liabilities
Level
1
Level
2
Level
3 Total
Financial liabilities at fair value
Derivates 1,915 - - - 1,915 1,915
Financial liabilities not measured at fair value
Accounts payable trade - 1,744 - - - -
Other financial liabilities - 6,120 - - - -
Other liabilities** - 714 - - - -
Total 1,915 8,578 - - 1,915 1,915
* This item does not include other assets in the amount of € 165 thousand, which are not financial assets.
** This item does not include other liabilities in the amount of € 2,036 thousand, which are not financial
liabilities.
21INTERIM REPORT JANUARY - MARCH 2017 | RIB SOFTWARE SE
NOTES TO ThE CONSOLIDATED INTERIM FINANCIAL STATEMENTS | CONSOLIDATED INTERIM FINANCIAL STATEMENTS

Carrying amount Fair value
Figures in € thousand
Available
for sale
Loans and
receivables
Level
1
Level
2
Level
3 Total
As of 31 December 2016
Financial assets at fair value . .
Cash market and invest-
ment funds 86 - 86 - - 86
Corporate Bonds 12 - 12 - - 12
Total 98 - 98 - - 98
Financial assets not mea-sured at fair value
Accounts receivable trade - 18,420 - - - -
Other Assets* 4,594
Cash and cash equivalents - 135,323 - - - -
Total - 158,337 - - - -
Held for trading
Other finan-cial liabilities
Level
1
Level
2
Level
3 Total
Financial liabilities at fair value
Derivates 2,239 - - 379 1,860 2,239
Financial liabilities not measured at fair value
Accounts payable trade - 2,456 - - - -
Other financial liabilities - 222 - - - -
Other liabilities** - 1,455 - - - -
Total 2,239 4,133 - 379 1,860 2,239
* This item does not include other assets in the amount of € 2,072 thousand, which are not financial assets.
** This item does not include other liabilities in the amount of € 18,217 thousand, which are not financial
liabilities.
22 RIB SOFTWARE SE | INTERIM REPORT JANUARY - MARCH 2017
CONSOLIDATED INTERIM FINANCIAL STATEMENTS | NOTES TO ThE CONSOLIDATED INTERIM FINANCIAL STATEMENTS

Determination of the fair valuesThe Group uses the following hierarchy for determining and disclosing the fair value of financial instruments:
Level 1:
fair values measured based on quoted prices (unadjusted) in active markets for identical assets or liabilities
Level 2:
fair values measured based on valuation techniques for which any inputs which have a significant effect on
the recorded fair value are not observable, either directly or indirectly
Level 3:
fair values measured based on valuation techniques for which any inputs which have a significant effect on
the recorded fair value are not observable, either directly or indirectly
In determining the time when re-groupings are to be deemed to have occurred between different levels, we
refer to the date of the event or the change in the circumstances that caused the regrouping.
The financial liabilities measured at fair value are derivative financial liabilities from company acquisitions.
The derivatives classified as level 2 as of 31 December 2016 were liabilities from the acquisition of the sub-
sidiary RIB US Cost whose amount depends in particular on the future share price development of the RIB
Software SE. As of 31 March 2017 it was clear that the share price targets were no longer reached within the
agreed period, the liability of € 380 thousand was charged to the income statement as of 31 March 2017.
The derivatives assigned to level 3 are the liability under the option agreement in connection with the acquisi-
tion of the company RIB SAA.
In the 2015 financial year, the group acquired 75% of the shares in RIB SAA. At the same time, purchase and
sale options for the transfer of outstanding shares of 25% were concluded with the sellers. From the holding
position within the scope of the sale option agreement, the group has a financial liability for which an amortized
fair value of € 2,632 thousand was calculated. Of this, a partial amount of € 1,582 thousand was assigned to
the company acquisition and a partial amount in the amount of € 1,050 thousand in a separate transaction in
the form of a pay agreement.
The financial liability attributable to the acquisition of companies was estimated in full in the context of the
accounting for the acquisition of the company. The financial liability assigned to the separate transaction is
accrued over a period of 66 months at the charge of personnel expenses and is recognized as of the balance
sheet date with an amount of € 306 thousand in the financial liabilities. The personnel expenses attributable to
the reporting period amount to € 48 thousand. The interest on financial liabilities resulted in an interest expense
of € 8 thousand.
23INTERIM REPORT JANUARY - MARCH 2017 | RIB SOFTWARE SE
NOTES TO ThE CONSOLIDATED INTERIM FINANCIAL STATEMENTS | CONSOLIDATED INTERIM FINANCIAL STATEMENTS
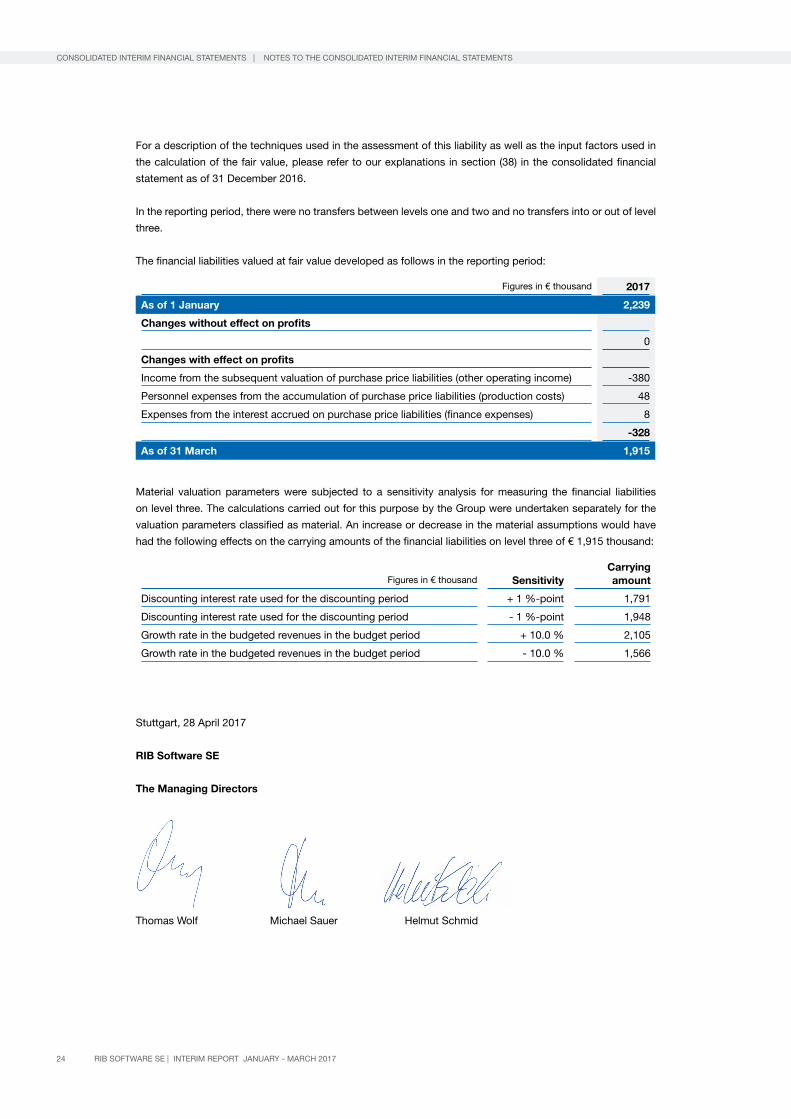
For a description of the techniques used in the assessment of this liability as well as the input factors used in
the calculation of the fair value, please refer to our explanations in section (38) in the consolidated financial
statement as of 31 December 2016.
In the reporting period, there were no transfers between levels one and two and no transfers into or out of level
three.
The financial liabilities valued at fair value developed as follows in the reporting period:
Figures in € thousand 2017
As of 1 January 2,239
Changes without effect on profits .
0
Changes with effect on profits
Income from the subsequent valuation of purchase price liabilities (other operating income) -380
Personnel expenses from the accumulation of purchase price liabilities (production costs) 48
Expenses from the interest accrued on purchase price liabilities (finance expenses) 8
-328
As of 31 March 1,915
Material valuation parameters were subjected to a sensitivity analysis for measuring the financial liabilities
on level three. The calculations carried out for this purpose by the Group were undertaken separately for the
valuation parameters classified as material. An increase or decrease in the material assumptions would have
had the following effects on the carrying amounts of the financial liabilities on level three of € 1,915 thousand:
Figures in € thousand
Sensitivity
Carrying amount
Discounting interest rate used for the discounting period + 1 %-point 1,791
Discounting interest rate used for the discounting period - 1 %-point 1,948
Growth rate in the budgeted revenues in the budget period + 10.0 % 2,105
Growth rate in the budgeted revenues in the budget period - 10.0 % 1,566
Stuttgart, 28 April 2017
RIB Software SE
The Managing Directors
Thomas Wolf Michael Sauer helmut Schmid
24 RIB SOFTWARE SE | INTERIM REPORT JANUARY - MARCH 2017
CONSOLIDATED INTERIM FINANCIAL STATEMENTS | NOTES TO ThE CONSOLIDATED INTERIM FINANCIAL STATEMENTS

25INTERIM REPORT JANUARY - MARCH 2017 | RIB SOFTWARE SE
| CONSOLIDATED INTERIM FINANCIAL STATEMENTS

IMPRINT
Published by:RIB Software SE
vaihinger Straße 151
70567 Stuttgart
Responsible for content:RIB Software SE, Stuttgart
Photos:Page 2: Andreas Dalferth
Design and realisation:RIB Software SE, Stuttgart.
All rights and technical alterations reserved.
Copyright 2017RIB Software SE
April 2017
Trademarks:RIB, RIB iTWO, ARRIBA, the RIB logo and the iTWO logo are registered Trademarks of RIB Software SE in Ger-
many und optionally in other countries. All other trademarks and product names is property of the respective
owners. After deadline changes may have occurred. RIB does not guarantee its accuracy.
Translation of the original German version:The English version of the Interim Report is a translation of the original German version; in the event of varian-
ces, the German version shall take precedence over the English translation.
FURTHER INFORMATION
FURThER INFORMATION
26 RIB SOFTWARE SE | INTERIM REPORT JANUARY - MARCH 2017

RIB Software SEvaihinger Straße 151
70567 Stuttgart
Investor RelationsPhone: +49 (0) 711 7873-191
Fax: +49 (0) 711 7873-311
E-Mail: [email protected]
Internet: group.rib-software.com
CareersInternet: group.rib-software.com/en/careers
Product information and References
www.rib-software.com/itwo-references
www.rib-software.com/itwo-broschuere
CONTACT
FINANCIAL CALENDAR30 May 2017Ordinary Annual General Meeting
31 July 2017Publication Interim Report (January - June 2017)
Analyst Conference Call
30 October 2017Publication Interim Report (January - September 2017)
Analyst Conference Call
FURThER INFORMATION
27INTERIM REPORT JANUARY - MARCH 2017 | RIB SOFTWARE SE

Scan to learn more about YTWO Formative
January - March 2017
Interim Report
RIB Software SE
Investor Relations Vaihinger Straße 151 70567 Stuttgart
Phone: +49 711 7873-191 Fax: +49 711 7873-311
E-Mail: [email protected] Internet: group.rib-software.com
Related Documents