INTERIM REPORT 2016 Q2

Welcome message from author
This document is posted to help you gain knowledge. Please leave a comment to let me know what you think about it! Share it to your friends and learn new things together.
Transcript

INTERIM REPORT 2016
Q2

Key figures
All amounts in this interim report are disclosed in millions of euros (€ million) unless stated otherwise. The addition of the totals presented may
result in minor rounding differences. The percentages shown are calculated on the basis of the respective amounts, rounded to the nearest
thousand euros.
This interim report is available in German and English at www.kiongroup.com under Investor Relations / Financial Reports. Only the content of
the German version is authoritative.
KION Group overview
in € million Q2 2016 Q2 2015 Change Q1 – Q2 2016 Q1 – Q2 2015 Change
Order intake 1,427.1 1,317.3 8.3% 2,723.8 2,565.2 6.2%
Revenue 1,343.8 1,256.0 7.0% 2,564.5 2,420.8 5.9%
Order book1 1,009.4 864.0 16.8%
Financial performance
EBITDA 222.8 196.9 13.2% 412.7 374.5 10.2%
Adjusted EBITDA² 238.2 206.6 15.3% 430.0 388.0 10.8%
Adjusted EBITDA margin² 17.7% 16.4% – 16.8% 16.0% −
EBIT 116.8 99.4 17.5% 205.8 181.5 13.4%
Adjusted EBIT² 140.8 116.4 20.9% 239.4 209.8 14.1%
Adjusted EBIT margin² 10.5% 9.3% – 9.3% 8.7% −
Net income for the period 64.0 52.5 21.9% 97.1 94.3 2.9%
Financial position1
Total assets 6,729.1 6,440.2 4.5%
Equity 1,690.5 1,848.7 – 8.6%
Net financial debt 721.2 573.5 25.8%
ROCE3 – 11.9% −
Cash flow
Free cash flow4 9.9 28.8 – 65.5% – 10.5 9.2 <– 100%
Capital expenditure5 36.6 32.4 12.8% 64.3 59.8 7.5%
Employees6 23,804 23,506 1.3%
1 Figure as at 30/06/2016 compared with 31/12/20152 Adjusted for KION acquisition items and non-recurring items3 ROCE is defined as the proportion of EBIT adjusted to capital employed; ROCE is only calculated at the end of the year4 Free cash flow is defined as cash flow from operating activities plus cash flow from investing activities5 Capital expenditure including capitalised development costs, excluding leased and rental assets6 Number of employees (full-time equivalents) as at 30/06/2016 compared with 31/12/2015

The KION Group sells forklift trucks, warehouse technology and associated services from its seven brand companies around the world. It is the European market leader, number two in the world and the leading international supplier in China.
Linde and STILL serve the premium segment worldwide, while Baoli focuses on the economy segment. Fenwick is the material-handling market leader in France. OM STILL is a market leader in Italy. Voltas is one of the two market leaders in India. Egemin Automation is a leading inter-national specialist in logistics automation.
Building on these strong foundations, the KION Group and its approximately 23,500 employees generated revenue of €5.1 billion in 2015, never losing sight of what is most important: our custom-ers, innovation and quality. We gave concrete illustrations of how this works in practice in the innovation section of our 2015 annual report. In addition, we have provided in-depth features on our website, where further articles will be added over the course of 2016.
We keep the world moving.
Q2 Interim report2016
Register for our – newsletter
kiongroup.com/ newsletter
Investor – relations
kiongroup.com/ ir
Facts, figures – & key data
reports.kiongroup.com

Highlights of the second quarter of 2016
KION Group prepares for the future by acquiring Dematic
KION Group remains firmly on a path of profitable growth
– Total value of order intake improves by more than 8 per cent
– Order book grows by almost 17 per cent
– Revenue for the quarter rises by 7 per cent year on year
– Adjusted EBIT goes up by roughly 21 per cent
– Adjusted EBIT margin reaches 10.5 per cent, the highest
level ever for a second quarter
– Net income rises by almost 22 per cent
– Acquisition of Dematic creates a world-leading provider of
cutting-edge material handling solutions
– KION Group will offer a complete portfolio of material-handling
solutions in future
– Dematic generated revenue of €1.6 billion and adjusted EBIT
of around €150 million in the 2015 calendar year
– KION Group will be able to use the acquisition to strengthen
its foothold in the Americas while continuing to drive business
in Europe and Asia
– Transaction expected to be completed in the fourth quarter
of 2016
4
KION GROUP AG | Interim report Q2 2016Moving Forward Innovation

Contents
KION SHARES 6
INTERIM GROUP MANAGEMENT REPORT 9
Fundamentals of the KION Group 9
Report on the economic position 10
Outlook, risk report and opportunity report 25
CONDENSED CONSOLIDATED INTERIM FINANCIAL STATEMENTS 26
NOTES TO THE CONDENSED CONSOLIDATED INTERIM FINANCIAL STATEMENTS 34
Basis of presentation 34
Selected notes to the consolidated income statement 38
Selected notes to the consolidated statement of financial position 39
Other disclosures 41
REVIEW REPORT 53
RESPONSIBILITY STATEMENT 54
QUARTERLY INFORMATION 55
DISCLAIMER 56
FINANCIAL CALENDAR / CONTACT INFORMATION 57
PUBLISHER 58
5
KION GROUP AG | Interim report Q2 2016 We keep the world moving.

DIAGRAM 01Share price performance from 30 December 2015 to 30 June 2016
* Closing price
€ 43.44 *
€ 52
€ 50
€ 48
€ 46
€ 44
€ 42
€ 40
€ 38
€ 36
January 2016 February 2016 March 2016 April 2016 May 2016 June 2016
KION GROUP – 5.6% MDAX – 4.5% DAX – 9.9%
€ 46.02 *
Price falls during the downturn
Following a good start to the second quarter, April saw the German
stock market make up for most of the price falls of the first three
months of the year. Amid a great deal of volatility, a downward trend
then emerged, ending in plummeting share prices following the
United Kingdom’s vote to leave the European Union. The DAX closed
at 9,680 points on 30 June 2016, which was 9.9 per cent lower than
at the end of 2015. The MDAX declined by 4.5 per cent over the six-
month period.
KION shares initially defended their position above the €50 mark
that they had reached in the first quarter and, on 14 April 2016,
achieved their highest price of the year so far of €52.04. After the
technical ex-dividend markdown in May, the shares passed the €50
mark again in June but then ceded all of the previous gains following
the announcement of the Dematic acquisition and the downturn on
the stock markets in the wake of the referendum in the UK. Falling by
5.6 per cent in the first half of 2016 to €43.44 (end of 2015: €46.02),
KION shares outperformed the DAX, but not the MDAX. At the end
of June, market capitalisation stood at €4.3 billion, of which €2.6 billion
was attributable to shares in free float. > DIAGRAM 01
KION shares
6
KION GROUP AG | Interim report Q2 2016Moving Forward Innovation

Shareholder structure as at 30 June 2016 DIAGRAM 02
61.5%FREE FLOAT
38.3%WEICHAI POWER
0.2%KION GROUP AG
Annual General Meeting
The Annual General Meeting on 12 May 2016, at which 85.8 per cent
of the share capital was represented, voted in favour of the Supervi-
sory Board and Executive Board’s proposals by a large majority,
including a dividend distribution of €0.77 per share. This represents
an increase of 40.0 per cent on the previous year’s dividend and a
rise in the dividend payout rate from 30.7 per cent to 35.0 per cent.
The Annual General Meeting also renewed the authorisation to pur-
chase treasury shares for five years. This will enable more shares
to be repurchased, for example for the successful KION employee
equity programme.
Stable shareholder structure
The shareholder structure remained stable in the reporting period.
Holding a 38.3 per cent stake in the KION Group, Weichai Power Co.
Ltd. continues to be the largest single shareholder. Weichai Power
has undertaken not to acquire more than 49.9 per cent of KION
shares before 28 June 2018 (so-called standstill agreement). KION
GROUP AG continued to hold 0.2 per cent of the shares. The free
float thus still accounted for 61.5 per cent. > DIAGRAM 02
Comprehensive coverage
Seventeen brokerage houses currently publish regular reports on the
KION Group. As at 30 June 2016, nine analysts recommended KION
shares as a buy and eight rated them as neutral. The median target
price specified for the shares was €53.00 as at the reporting date.
> TABLE 01
Credit rating adjustments
Two rating agencies publish credit ratings on the KION Group. After
the announcement of the Dematic acquisition in June, Standard &
Poor’s rated the KION Group as BB+ with a negative outlook (previ-
ously: positive outlook). In June 2016, Moody’s adjusted its rating
from Ba1 with a stable outlook to Ba1 with negative credit watch.
7
KION GROUP AG | Interim report Q2 2016 We keep the world moving.
KION SHARES
7

TABLE 01Share data
Issuer KION GROUP AG
Registered office Wiesbaden
Share capital €98,900,000; divided into 98,900,000 no-par-value shares
Share class No-par-value shares
Stock exchange Frankfurt Stock Exchange
Market segment Regulated market (Prime Standard)
Index membership MDAX, STOXX Europe 600, FTSE EuroMid, MSCI Germany Small Cap
Stock exchange symbol KGX
ISIN DE000KGX8881
WKN KGX888
Bloomberg / Reuters KGX:GR / KGX.DE
Closing price as at 30/06/2016 €43.44
Performance since beginning of 2016 – 5.62%
Market capitalisation as at 30/06/2016 €4,295.7 million
Free float 61.5%
Earnings per share* €0.97
* For the reporting period 01/01/ – 30/06/2016
8
KION GROUP AG | Interim report Q2 2016Moving Forward Innovation

FUNDAMENTALS OF THE KION GROUP
Management and control
The Annual General Meeting elected Dr Christina Reuter to the
Supervisory Board on 12 May 2016. Dr Reuter is chief engineer and
head of department at the Laboratory for Machine Tools and Pro-
duction Engineering at RWTH Aachen University which is part of a
cluster of excellence under the German government’s project Indus-
trie 4.0. She replaces Wolfgang Faden, who stepped down from the
Supervisory Board. There were no changes on the Executive Board
during the first half of the year.
Strategy of the KION Group
The KION Group Strategy 2020, described in the 2015 group man-
agement report, is aimed at leveraging cross-regional and cross-
brand synergies even more effectively and closing the gap on the
global market leader by 2020. To achieve this, the KION Group is
relying on its successful multi-brand approach, underpinned by a
comprehensive modular and platform strategy. It is strengthening its
presence in key markets and resolutely stepping up its activities in
the fields of automation and service. Furthermore, in order to
entrench its position as the most profitable supplier in the market,
the KION Group aims to improve its EBIT margin so it is permanently
in the double-digit range – a target that remains unchanged in com-
munications since the IPO. Further details on the Strategy 2020 can
be found in the 2015 group management report.
A comprehensive portfolio of solutions for Intralogistics 4.0 is at
the core of the Strategy 2020. The KION Group believes that con-
nected machinery, products, processes and logistics are essential to
creating intelligent supply chains and value chains.
KION Group signs sale and purchase agreement for Dematic
The KION Group will become one of the leading global providers of
intelligent intralogistics solutions by acquiring Dematic, a best-in-class
Interim group management report
automation provider and specialist in supply chain optimisation. The
KION Group agreed with funds managed by AEA Investors and
Ontario Teachers’ Pension Plan as the sellers on this landmark trans-
action to create a true global provider with close to 30,000 employ-
ees, more than €6.7 billion in revenue on the basis of calendar year
2015 and a strong profitability with a combined adjusted EBIT margin
of approx. 9.4 per cent for this period. After deductions for certain
liabilities, the KION Group expects the purchase price for the shares
to amount to approx. € 1.9 billion, based on an enterprise value of
Dematic of € 2.9 billion. The transaction is subject to customary clos-
ing conditions, including regulatory approvals, and is expected to be
closed in the course of the fourth quarter of 2016.
Dematic is a leading global supplier of advanced integrated
automation technology, software and services to optimize supply
chains and to meet the material handling automation needs of its
customers. The company’s product and systems portfolio ranges
from Automated Guided Vehicles (AGVs), palletizers, storage and
picking equipment including automated storage and retrieval sys-
tems, sorters and conveyors to a leading integrated software plat-
form and automation technologies. Dematic has been growing
annually by more than 12 per cent since 2013. It generated approx.
€ 1.6 billion in revenue and achieved an adjusted EBIT of around
€150 million during the calendar year 2015. Dematic employs almost
6,000 skilled logistics professionals - including over 3,000 engineers
in software development, R&D, engineering, project management
and customer service - to support its customers globally, with engi-
neering centers and manufacturing facilities located around the
globe. With more than 100 locations Dematic is present in 22 coun-
tries. The company is a leading player in the USA, Europe, and
worldwide. Dematic has implemented more than 4,500 integrated
systems for small, medium and large companies with business in a
broad variety of industries around the globe including the fast-grow-
ing e-commerce business.
The purchase of Dematic will establish the KION Group as a
global leader in Intralogistics 4.0. Leveraging its sales and service
networks, technologies and resources, the enlarged company will
be able to seamlessly offer the full material handling product and ser-
vice offering to customers of all sizes in a broad range of industries
across the world. This most comprehensive material handling solu-
tions offering in the market ranges from manually operated industrial
trucks to complete fully automated warehouses. The KION Group
will thus enhance its position as one-stop supplier for intelligent supply
9
KION GROUP AG | Interim Report Q2 2016 We keep the world moving.
INTERIM GROUP MANAGEMENT REPORT
Fundamentals of the KION Group

chain and automation solutions and is now perfectly positioned for
attractive and profitable growth driven by megatrends like Industry 4.0,
digitalization and e-commerce.
Both companies contribute strong complementary market posi-
tions and geographical footprint as an opportunity for revenue
growth. Dematic will leverage the KION Group’s service network and
brand reputation in key markets like Europe, China and Brazil,
whereas the KION Group will take advantage of Dematic’s strong
position in the US and European automation markets in particular.
This complementarity is also the source of cost synergies from this
combination. KION Group’s strong sales and service network
together with Dematic’s sizeable installed base provides the basis for
unlocking further revenue potential from services and systems
upgrades.
In the past year, the KION Group already started to build up a
strong position as provider of automated systems solutions by
acquiring Egemin Automation and Retrotech, thereby making further
inroads in this attractive and growing market.
REPORT ON THE ECONOMIC POSITION
Macroeconomic and sector-specific conditions
MACROECONOMIC CONDITIONS
According to current estimates, global economic growth this year
will remain at a similarly low level to 2015. In June, the World Bank
lowered its growth forecast from January by 0.5 percentage points
to 2.4 per cent. In particular, the United States and Japan plus
emerging markets and developing countries that export commodi-
ties – including Brazil and Russia – have been weaker than initially
assumed. Moreover, countries that import commodities have not
benefited from the low prices to the extent expected.
Faltering growth was accompanied by increasing uncertainty
about the effectiveness of expansionary monetary policy in indus-
trialised nations and about the sharp rise in personal debt in many
developing countries and emerging markets. By contrast, the sit-
uation in China appears to have stabilised following a weak start to
the year: industrial output and foreign trade have shown a positive
trend again recently.
The recovery in the eurozone continued at a modest pace, driven
mainly by strong domestic demand. Germany recorded robust
growth fuelled by higher consumer spending and capital investment.
The vote by the British people in favour of leaving the European
Union increased economic risk towards the end of the reporting
period. However, the consequences of the UK referendum are
almost impossible to predict at present. The ifo Institute of Economic
Research expects Germany’s upturn to continue, although eco-
nomic growth in 2016 is likely to be 0.1 percentage points lower
because of the referendum result.
SECTORAL CONDITIONS
Sales markets
The global market for industrial trucks slightly expanded in the sec-
ond quarter. Primarily driven by growth in Europe, the number of
trucks sold rose by 1.8 per cent globally.
The rate of growth was 2.7 per cent in the first half of the year.
Western Europe saw double-digit increases in sales in the first half of
the year on the back of a continuing robust uptrend in Germany and
France as well as healthy gains in Spain and Italy. The United King-
dom was the only market with a pronounced reluctance to invest in
the second quarter. Eastern Europe showed strong growth as well
and amongst others benefited from Russia’s recovery. In North
America, order numbers hovered slightly below the prior-year level,
whereas South America saw a sharp decline, mainly due to the
ongoing downward trend in Brazil. China registered slight growth in
the first half of the year that was primarily attributable to the tighten-
ing of emissions regulations and the related increase in orders in the
first quarter.
Broken down by product segment, the bulk of the growth was
generated by warehouse trucks, followed by electric forklift trucks.
Demand for trucks powered by internal combustion engines (IC
trucks) continued to fall sharply. > TABLE 02
10
KION GROUP AG | Interim Report Q2 2016Moving Forward Innovation

Procurement markets and conditions in the financial markets
Prices for steel, which is the most important raw material for the
KION Group, and for copper remained at a very low level in the first
half of the year and their average was considerably lower than in the
corresponding period of 2015. Oil prices rose steadily but were still
lower on average than in the prior-year period.
Overall, currency effects had a negative impact on exports in the
first six months of 2016. The euro rose slightly against the Chinese
renminbi and pound sterling during the half-year period. However,
pound sterling and the euro came under strong pressure at the end
of the second quarter due to the outcome of the UK referendum. The
Brazilian real persisted at a low level.
Business performance
The KION Group’s new plant in Stříbro near Plzeň in the Czech
Republic has been designed as a smart factory with digitally con-
nected systems. Production got under way in January 2016. The
Stříbro plant is initially building reach trucks for the Linde brand.
Employing around 150 people to begin with, the factory has the
capacity to manufacture 12,000 trucks per year.
The restructuring of the KION Group’s funding was completed on
15 February 2016. This included repayment ahead of schedule of
the last corporate bond and the arrangement of a new credit facility
that offers far more favourable terms with investment-grade charac-
teristics.
Back at the start of March, the KION Group had further strength-
ened its automated warehouse systems expertise in North America
by acquiring Retrotech Inc., an established US systems integrator of
warehouse and distribution solutions.
In June, KION GROUP AG signed a sale and purchase agree-
ment to acquire all of the shares in the Dematic parent company, DH
Services Luxembourg Holding S.à r.l., Luxembourg. The Dematic
Group is a leading global supplier of advanced integrated automa-
tion technology and the associated software and services for opti-
mising supply chains. The KION Group will thus enhance its position
as a one-stop supplier of intelligent supply chain solutions for Indus-
try 4.0. With more than 100 locations, Dematic is present in 22 coun-
tries. Closing of the transaction is subject to the customary closing
conditions and regulatory approvals, and is likely to take place during
the fourth quarter of 2016. The provisional purchase price for the
shares is the equivalent of around €1.9 billion. The transaction will
initially be funded by a €3.0 billion bridge loan that has been firmly
committed.
TABLE 02Global industrial truck market (order intake)
in thousand units Q2 2016 Q2 2015 Change Q1 – Q2 2016 Q1 – Q2 2015 Change
Western Europe 89.4 80.3 11.3% 187.6 167.6 11.9%
Eastern Europe 15.9 12.4 28.6% 29.5 24.9 18.4%
North America 59.8 60.4 – 1.0% 116.5 117.6 – 0.9%
Central & South America 10.0 10.6 – 5.1% 19.1 21.6 – 11.9%
Asia (excl. Japan) 92.7 95.0 – 2.5% 180.2 180.0 0.1%
Rest of world 29.7 33.7 – 11.8% 58.1 63.7 – 8.8%
World 297.5 292.4 1.8% 591.0 575.4 2.7%
Source: WITS/FEM
11INTERIM GROUP MANAGEMENT REPORT
Report on the economic position
KION GROUP AG | Interim Report Q2 2016 We keep the world moving.

Financial position and financial performance
OVERALL ASSESSMENT OF THE ECONOMIC SITUATION
In the first half of this year, the KION Group achieved significant
growth in revenue and earnings. The total value of order intake also
increased year on year in the second quarter. The KION Group ben-
efited from the continued good order situation in Europe. Elsewhere,
it expanded its market share in Asian and American markets despite
the prevailing challenges. Overall, the KION Group’s orders grew
faster than those of the world market as a whole. This was also sup-
ported by the progressive expansion of the premium range to include
product platforms for the volume and economy segments.
Consolidated revenue advanced by 5.9 per cent year on year.
New truck business and the service business contributed to this
increase. In the second quarter, organic revenue growth continued
to accelerate. The newly acquired Egemin Automation (including
Retrotech) also played a part in this rise in revenue. Negative cur-
rency effects depressed revenue, however.
There were sharp year-on-year increases in adjusted EBIT and
the EBIT margin. Profitability improved again in the second quarter,
easily outstripping the first three months of the year with an adjusted
EBIT margin of 10.5 per cent (Q1 2016: 8.1 per cent). Net income was
slightly higher than in the first half of last year despite the one-off
financial expenses incurred in the first quarter in connection with the
restructuring and optimisation of the Group’s funding. Earnings per
share stood at €0.97 (H1 2015: €0.94).
Level of orders
Order intake rose by 6.2 per cent or €158.6 million to €2,723.8 million
in the first six months of 2016. Egemin Automation (including Retro-
tech Inc., which was acquired in the first quarter of 2016) had not
been included in the results for the first half of 2015 but contributed
orders of €79.5 million in the period under review. Negative currency
effects reduced order intake by €57.0 million.
The number of trucks ordered increased to approximately
89.2 thousand, which was 4.4 per cent higher than in the first six
months of 2015. The strongest growth was in electric forklift trucks,
followed by warehouse trucks. Orders for IC trucks fell year on year,
although less pronounced than in the market as a whole. The total
value of the order book amounted to €1,009.4 million, an increase of
16.8 per cent on the value at the end of last year (31 December 2015:
€864.0 million). This growth mainly stemmed from Europe and Asia.
Revenue
Thanks to continuous growth in the new trucks, aftersales, used
trucks and rental businesses, the KION Group increased its revenue
by 5.9 per cent to €2,564.5 million (H1 2015: €2,420.8 million).
Egemin Automation (including Retrotech) contributed an additional
€47.3 million to revenue, but this was more than offset by negative
currency effects of €53.4 million at Group level.
Revenue from new truck business went up by 4.1 per cent to
€1,370.7 million, compared with €1,317.0 million in the first half of
2015. Electric forklift trucks registered a sharp year-on-year increase.
There was slight growth for IC trucks, while revenue from warehouse
trucks was around the same level as in the prior-year period.
Contributions from all areas of the service business resulted in
an 8.2 per cent increase in revenue to €1,193.8 million (H1 2015:
€1,103.7 million). The biggest percentage gain was generated by the
used truck business. There was also an increase as a result of the
acquisition of Egemin Automation (including Retrotech), which is
reported in the ‘other’ product category. Overall, the service busi-
ness contributed 46.6 per cent of the KION Group’s total revenue in
the first six months (H1 2015: 45.6 per cent). > TABLE 03
The rise in revenue was predominantly the result of growth in west-
ern and eastern Europe. The slight increase in the Americas was
largely accounted for by North America, while Brazil saw a further
decline. Asia was also unable to match the level of revenue gener-
ated in the first half of 2015, registering a decrease of 9.3 per cent.
Overall, the growth markets accounted for 22.6 per cent of consoli-
dated revenue in the first six months (H1 2015: 25.1 per cent). The
proportion generated outside Germany came to 74.7 per cent
(H1 2015: 75.4 per cent). > TABLE 04
12
KION GROUP AG | Interim Report Q2 2016Moving Forward Innovation

TABLE 03
TABLE 04
Revenue by product category
in € million Q2 2016 Q2 2015 Change Q1 – Q2 2016 Q1 – Q2 2015 Change
New business 731.9 695.0 5.3% 1,370.7 1,317.0 4.1%
Service business 612.0 561.0 9.1% 1,193.8 1,103.7 8.2%
- Aftersales 337.8 331.8 1.8% 667.7 657.7 1.5%
- Rental business 136.5 129.5 5.5% 268.1 256.5 4.5%
- Used trucks 74.5 66.6 12.0% 144.6 128.0 13.0%
- Other 63.1 33.2 90.3% 113.3 61.6 84.1%
Total revenue 1,343.8 1,256.0 7.0% 2,564.5 2,420.8 5.9%
Revenue by customer location
in € million Q2 2016 Q2 2015 Change Q1 – Q2 2016 Q1 – Q2 2015 Change
Western Europe 1,012.6 910.2 11.2% 1,918.6 1,763.4 8.8%
Eastern Europe 109.4 100.7 8.7% 206.3 195.2 5.7%
Americas 71.9 71.4 0.7% 134.3 130.5 3.0%
Asia 113.6 133.9 – 15.1% 234.2 258.1 – 9.3%
Rest of world 36.3 39.8 – 8.8% 71.1 73.6 – 3.4%
Total revenue 1,343.8 1,256.0 7.0% 2,564.5 2,420.8 5.9%
13INTERIM GROUP MANAGEMENT REPORT
Report on the economic position
KION GROUP AG | Interim Report Q2 2016 We keep the world moving.

Earnings
EBIT and EBITDA
Earnings before interest and tax (EBIT) increased by 13.4 per cent
year on year to reach €205.8 million (H1 2015: €181.5 million).
Although there was a volume-related improvement in gross
profit of 7.4 per cent, selling expenses, administrative expenses and
development costs also increased. Adjusted EBIT excluding non-re-
curring items and KION acquisition items amounted to €239.4 million
(H1 2015: €209.8 million). The adjusted EBIT margin was 9.3 per cent,
a year-on-year improvement of 0.6 percentage points (H1 2015:
8.7 per cent). > TABLE 05
Earnings before interest, tax, depreciation and amortisation (EBITDA)
improved to €412.7 million, compared with €374.5 million in the cor-
responding period of 2015. Adjusted EBITDA rose to €430.0 million
(H1 2015: €388.0 million). This equates to an adjusted EBITDA mar-
gin of 16.8 per cent (H1 2015: 16.0 per cent). > TABLE 06
TABLE 05
TABLE 06
EBIT
in € million Q2 2016 Q2 2015 Change Q1 – Q2 2016 Q1 – Q2 2015 Change
Net income for the period 64.0 52.5 21.9% 97.1 94.3 2.9%
Income taxes – 30.0 – 24.3 – 23.3% – 45.5 – 43.9 – 3.6%
Net financial expenses – 22.8 – 22.6 – 1.0% – 63.3 – 43.3 – 46.2%
EBIT 116.8 99.4 17.5% 205.8 181.5 13.4%
+ Non-recurring items 17.1 10.2 68.6% 20.0 14.6 36.6%
+ KION acquisition items 6.9 6.9 0.0% 13.6 13.7 – 0.5%
Adjusted EBIT 140.8 116.4 20.9% 239.4 209.8 14.1%
Adjusted EBIT margin 10.5% 9.3% – 9.3% 8.7% –
EBITDA
in € million Q2 2016 Q2 2015 Change Q1 – Q2 2016 Q1 – Q2 2015 Change
EBIT 116.8 99.4 17.5% 205.8 181.5 13.4%
Amortisation and depreciation 106.0 97.5 8.7% 207.0 193.0 7.2%
EBITDA 222.8 196.9 13.2% 412.7 374.5 10.2%
+ Non-recurring items 15.4 9.6 60.2% 17.2 13.4 28.3%
+ KION acquisition items – 0.0 0.1 <– 100% 0.0 0.1 – 100.0%
Adjusted EBITDA 238.2 206.6 15.3% 430.0 388.0 10.8%
Adjusted EBITDA margin 17.7% 16.4% – 16.8% 16.0% –
14
KION GROUP AG | Interim Report Q2 2016Moving Forward Innovation

Key influencing factors for earnings
The cost of sales increased by 5.3 per cent to €1,804.1 million
(H1 2015: €1,712.7 million), which was below the rate of growth in rev-
enue. Gross profit improved to €760.4 million (H1 2015: €708.1 mil-
lion). The gross margin therefore advanced from 29.3 per cent to
29.6 per cent.
Selling expenses grew by 8.2 per cent to €318.8 million in the
first half of this year (H1 2015: €294.7 million) as a result of the step-
ping up of sales activities – including the consolidation of Egemin
Automation. Development costs totalled €72.0 million (H1 2015:
€70.7 million). At €192.2 million, administrative expenses were higher
than in the corresponding prior-year period (H1 2015: €178.1 million)
because of consultancy expenses incurred ahead of the planned
Dematic acquisition. The ‘other’ item came to €28.4 million (H1 2015:
€16.9 million). This included the share of profit (loss) of equity-ac-
counted investments, which amounted to a profit of €9.6 million
(H1 2015: profit of €6.4 million). > TABLE 07
TABLE 07(Condensed) income statement
in € million Q2 2016 Q2 2015 Change Q1 – Q2 2016 Q1 – Q2 2015 Change
Revenue 1,343.8 1,256.0 7.0% 2,564.5 2,420.8 5.9%
Cost of sales – 943.9 – 889.2 – 6.2% – 1,804.1 – 1,712.7 – 5.3%
Gross profit 399.9 366.8 9.0% 760.4 708.1 7.4%
Selling expenses – 161.5 – 146.2 – 10,5 % – 318.8 – 294.7 – 8.2%
Research and development costs – 34.9 – 36.7 4,7 % – 72.0 – 70.7 – 1.8%
Administrative expenses – 106.2 – 93.7 – 13,3 % – 192.2 – 178.1 – 7.9%
Other 19.5 9.2 > 100% 28.4 16.9 68.1%
Earnings before interest and taxes (EBIT) 116.8 99.4 17.5% 205.8 181.5 13.4%
Net financial expenses – 22.8 – 22.6 – 1.0% – 63.3 – 43.3 – 46.2%
Earnings before taxes 94.0 76.8 22.4% 142.5 138.2 3.1%
Income taxes – 30.0 – 24.3 – 23.3% – 45.5 – 43.9 – 3.6%
Net income for the period 64.0 52.5 21.9% 97.1 94.3 2.9%
15INTERIM GROUP MANAGEMENT REPORT
Report on the economic position
KION GROUP AG | Interim Report Q2 2016 We keep the world moving.

Net financial income/expenses
There was a significant decline in the balance of financial income and
financial expenses, leading to net financial expenses of €63.3 million
(H1 2015: net financial expenses of €43.3 million) mainly due to one-
off expenses of €25.7 million incurred in February 2016 in connection
with the restructuring and optimisation of the Group’s funding.
Income taxes
Income tax expenses amounted to €45.5 million (H1 2015: €43.9 mil-
lion). Current income taxes came to €31.3 million (H1 2015: €67.6 mil-
lion). The tax rate was 31.9 per cent, which was up slightly year on
year (H1 2015: 31.7 per cent).
Net income for the period
The KION Group’s net income after taxes was €97.1 million (H1 2015:
€94.3 million). Diluted and basic earnings per share for the reporting
period came to €0.97 (H1 2015: €0.94).
BUSINESS SITUATION AND FINANCIAL PERFORMANCE
OF THE SEGMENTS
Linde Material Handling segment
Despite negative currency effects, order intake in the Linde Material
Handling (LMH) segment amounted to €1,782.1 million in the half-
year period, which was slightly above the high level reported a year
earlier (H1 2015: €1,760.9 million).
Segment revenue improved by 3.4 per cent to €1,706.6 million
(H1 2015: €1,650.3 million). The main factor in this increase was
higher unit sales of new trucks in western Europe. In the service
business, the increase in revenue from short-term rentals was par-
ticularly strong.
The positive effect from revenue combined with the achieved
margin improvements resulted in adjusted EBIT of €209.5 million,
which was significantly higher than in the prior-year period (H1 2015:
€172.1 million). Consequently, the adjusted EBIT margin increased to
12.3 per cent (H1 2015: 10.4 per cent). > TABLE 08
TABLE 08Key figures − LMH −
in € million Q2 2016 Q2 2015 Change Q1 – Q2 2016 Q1 – Q2 2015 Change
Order intake 938.7 917.0 2.4% 1,782.1 1,760.9 1.2%
Revenue 891.7 862.9 3.3% 1,706.6 1,650.3 3.4%
EBITDA 163.4 131.6 24.1% 290.5 246.2 18.0%
Adjusted EBITDA 163.8 133.1 23.1% 290.6 248.9 16.8%
EBIT 115.9 87.1 33.1% 197.8 157.7 25.4%
Adjusted EBIT 122.1 94.3 29.4% 209.5 172.1 21.7%
Adjusted EBITDA margin 18.4% 15.4% − 17.0% 15.1% −
Adjusted EBIT margin 13.7% 10.9% − 12.3% 10.4% −
16
KION GROUP AG | Interim Report Q2 2016Moving Forward Innovation
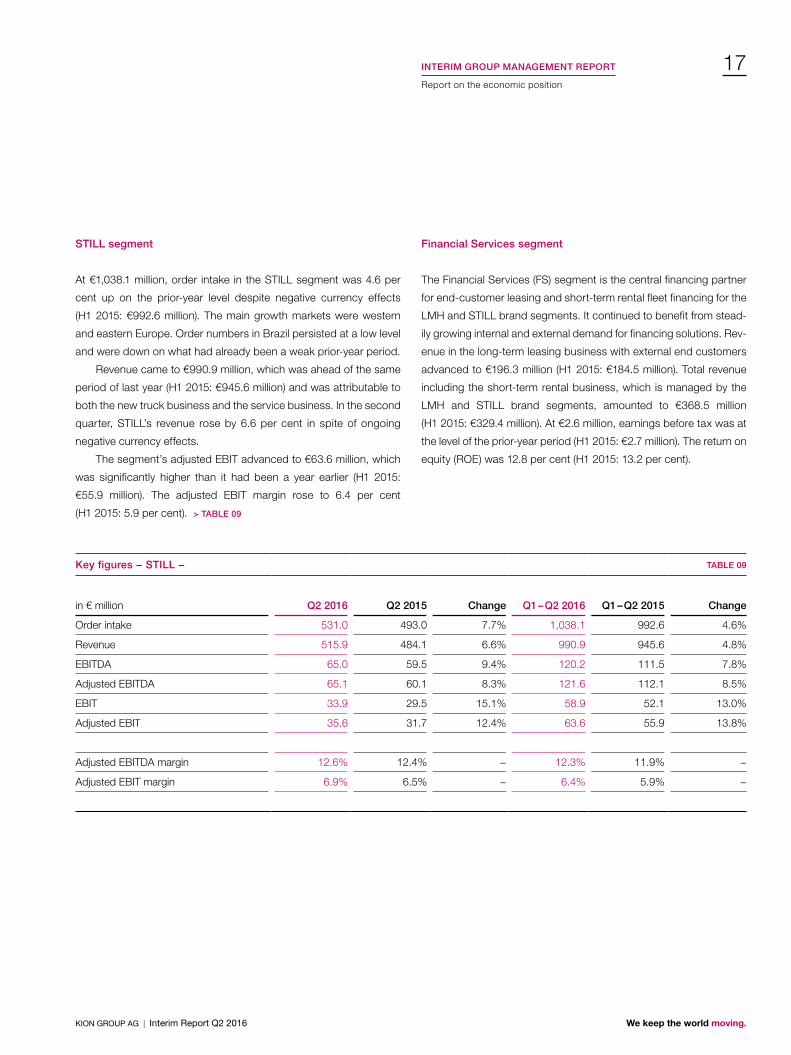
STILL segment
At €1,038.1 million, order intake in the STILL segment was 4.6 per
cent up on the prior-year level despite negative currency effects
(H1 2015: €992.6 million). The main growth markets were western
and eastern Europe. Order numbers in Brazil persisted at a low level
and were down on what had already been a weak prior-year period.
Revenue came to €990.9 million, which was ahead of the same
period of last year (H1 2015: €945.6 million) and was attributable to
both the new truck business and the service business. In the second
quarter, STILL’s revenue rose by 6.6 per cent in spite of ongoing
negative currency effects.
The segment’s adjusted EBIT advanced to €63.6 million, which
was significantly higher than it had been a year earlier (H1 2015:
€55.9 million). The adjusted EBIT margin rose to 6.4 per cent
(H1 2015: 5.9 per cent). > TABLE 09
Financial Services segment
The Financial Services (FS) segment is the central financing partner
for end-customer leasing and short-term rental fleet financing for the
LMH and STILL brand segments. It continued to benefit from stead-
ily growing internal and external demand for financing solutions. Rev-
enue in the long-term leasing business with external end customers
advanced to €196.3 million (H1 2015: €184.5 million). Total revenue
including the short-term rental business, which is managed by the
LMH and STILL brand segments, amounted to €368.5 million
(H1 2015: €329.4 million). At €2.6 million, earnings before tax was at
the level of the prior-year period (H1 2015: €2.7 million). The return on
equity (ROE) was 12.8 per cent (H1 2015: 13.2 per cent).
TABLE 09Key figures − STILL −
in € million Q2 2016 Q2 2015 Change Q1 – Q2 2016 Q1 – Q2 2015 Change
Order intake 531.0 493.0 7.7% 1,038.1 992.6 4.6%
Revenue 515.9 484.1 6.6% 990.9 945.6 4.8%
EBITDA 65.0 59.5 9.4% 120.2 111.5 7.8%
Adjusted EBITDA 65.1 60.1 8.3% 121.6 112.1 8.5%
EBIT 33.9 29.5 15.1% 58.9 52.1 13.0%
Adjusted EBIT 35.6 31.7 12.4% 63.6 55.9 13.8%
Adjusted EBITDA margin 12.6% 12.4% − 12.3% 11.9% −
Adjusted EBIT margin 6.9% 6.5% − 6.4% 5.9% −
17INTERIM GROUP MANAGEMENT REPORT
Report on the economic position
KION GROUP AG | Interim Report Q2 2016 We keep the world moving.

At €1,689.3 million, the FS segment’s assets had increased slightly
compared with the end of last year (31 December 2015: €1,603.4 mil-
lion) and were up substantially year on year due to the increase in the
volume of orders (30 June 2015: €1,466.3 million).
As at 30 June 2016, the FS segment had intra-group lease
receivables of €581.3 million from the LMH and STILL brand seg-
ments relating to the intra-group financing of the short-term rental
fleet (31 December 2015: €549.2 million; 30 June 2015: €516.0 mil-
lion). The funding of intra-group long-term leases (finance leases)
with LMH and STILL resulted in lease liabilities of €411.4 million
(31 December 2015: €400.6 million; 30 June 2015: €377.5 million).
Net financial debt amounted to €213.9 million at the end of June
(31 December 2015: €185.6 million; 30 June 2015: €174.1 million).
> TABLE 10
TABLE 10Key figures − Financial Services −
in € million Q2 2016 Q2 2015 Change Q1 – Q2 2016 Q1 – Q2 2015 Change
Revenue 206.0 182.1 13.2% 368.5 329.4 11.9%
Adjusted EBITDA 23.8 22.1 7.7% 47.5 43.8 8.3%
Adjusted EBIT – 0.8 – 0.1 <– 100% – 2.0 – 0.2 <– 100%
Earnings before taxes (EBT) 1.3 1.3 – 2.7% 2.6 2.7 – 2.7%
Total segment assets 1,689.3 1,466.3 15.2% 1,689.3 1,466.3 15.2%
Leased assets 345.3 288.5 19.7% 345.3 288.5 19.7%
Lease receivables 1,231.3 1,078.0 14.2% 1,231.3 1,078.0 14.2%
thereof lease receivables from long-term leases to third parties 650.0 562.0 15.7% 650.0 562.0 15.7%
thereof lease receivables from LMH and STILL from funding of the short-term rental business 581.3 516.0 12.7% 581.3 516.0 12.7%
Lease liabilities¹ 1,313.4 1,138.6 15.4% 1,313.4 1,138.6 15.4%
thereof liabilities from funding of the long-term leases with third parties 902.0 761.1 18.5% 902.0 761.1 18.5%
thereof liabilities from funding of the short-term rental business of LMH and STILL 411.4 377.5 9.0% 411.4 377.5 9.0%
Net financial debt 213.9 174.1 22.8% 213.9 174.1 22.8%
Equity 43.8 43.5 0.5% 43.8 43.5 0.5%
Return on equity² 12.8% 13.2% −
1 Includes liabilities from financing of the short-term rental fleet reported as other financial liabilities2 Earnings before taxes divided by average equity employed excluding net income (loss) for the current period
18
KION GROUP AG | Interim Report Q2 2016Moving Forward Innovation

Other segment
Group head office functions that do not come under any other seg-
ment are reported in the Other segment, as are the intralogistics
activities of Egemin Automation. Retrotech Inc., which has been con-
solidated since 1 March 2016, is included under and reported
together with Egemin Automation. Revenue generated outside the
KION Group totalled €56.2 million (H1 2015: €8.9 million), of which
€47.3 million was attributable to Egemin Automation, which secured
attractive new orders in the field of warehouse automation and distri-
bution systems. The segment reported adjusted EBIT of €6.3 million
(H1 2015: €12.4 million). > TABLE 11
FINANCIAL POSITION
The principles and objectives applicable to financial management as
at 30 June 2016 were the same as those described in the 2015
group management report.
In the first quarter of 2016, the KION Group renewed its funding
with much better terms and thus successfully ended the funding
structure that had dated back to the time before the IPO. The new
senior facilities agreement comprises a revolving credit facility of
€1,150.0 million (maturing in February 2021) and a fixed-term tranche
of €350.0 million (maturing in February 2019). As part of this restruc-
turing and optimisation, the syndicated loan dating from 2006 and
the corporate bond (€450.0 million) were repaid.
TABLE 11Key figures − Other −
in € million Q2 2016 Q2 2015 Change Q1 – Q2 2016 Q1 – Q2 2015 Change
Order intake 101.0 54.2 86.5% 189.2 108.4 74.4%
Revenue 84.1 54.2 55.3% 157.0 108.4 44.7%
EBITDA 9.1 15.9 – 42.6% – 0.1 1.7 <– 100%
Adjusted EBITDA 24.1 23.5 2.8% 15.5 20.9 – 25.6%
EBIT 3.2 11.6 – 72.6% – 11.0 – 6.8 – 62.3%
Adjusted EBIT 19.3 19.2 0.8% 6.3 12.4 – 48.7%
19INTERIM GROUP MANAGEMENT REPORT
Report on the economic position
KION GROUP AG | Interim Report Q2 2016 We keep the world moving.

KION GROUP AG has issued guarantees to the banks for all of the
payment obligations under the new senior facilities agreement and
for compliance with the related covenants. All covenants were com-
plied with as at 30 June 2016.
A firm agreement has been reached with a group of banks for a
bridge loan of €3.0 billion as funding for the planned acquisition of
Dematic. This bridge loan is to be refinanced partly by long-term
capital-market and bank debt and partly by equity.
Analysis of capital structure
The total financial debt recognised as at 30 June 2016 came to
€805.6 million, which was higher than the figure at the end of 2015 of
€676.5 million. After deduction of cash and cash equivalents of
€84.3 million, net financial debt amounted to €721.2 million, com-
pared with €573.5 million at the end of last year. Net debt as at
30 June 2016 was 0.8 times adjusted EBITDA for the past twelve
months. It had therefore held fairly steady relative to earnings.
> TABLE 12
Pension provisions had increased from €798.0 million at 31 Decem-
ber 2015 to €993.8 million as at 30 June 2016 due to a lower level of
interest rates. The lease liabilities resulting from sale and leaseback
transactions used to fund long-term leases with end customers rose
to €904.3 million (31 December 2015: €855.6 million) on the back of
the expansion of financial services activities. Of this total, €650.4 mil-
lion related to non-current lease liabilities and €253.9 million to cur-
rent lease liabilities. Other financial liabilities also included liabilities of
€418.9 million from sale and leaseback transactions used to finance
the short-term rental fleet (31 December 2015: €403.2 million).
Equity was lower overall than at the end of 2015, falling by
€158.2 million to €1,690.5 million as at 30 June 2016 (31 Decem-
ber 2015: €1,848.7 million). This decrease was largely attributable to
a significantly lower interest rate level for pensions. Further negative
effects recognised in other comprehensive income and the dividend
payment were largely offset by the level of net income. The equity
ratio reduced to 25.1 per cent (31 December 2015: 28.7 per cent).
> TABLE 13
Analysis of capital expenditure
The KION Group’s total capital expenditure on property, plant and
equipment and on intangible assets (excluding leased and rental
assets) came to €64.3 million, compared with €59.8 million in the first
half of 2015. The main areas of spending in the second quarter were
again capitalised development costs in the LMH and STILL brand
segments and the expansion and modernisation of production and
technology sites.
TABLE 12Net financial debt
in € million 30/06/2016 31/12/2015 Change
Corporate bond (2013/2020) – fixed rate (gross) − 450.0 – 100.0%
Liabilities to banks (gross) 800.4 225.9 > 100%
Liabilities to non-banks (gross) 5.9 6.2 – 4.9%
./. Capitalised borrowing costs – 0.7 – 5.5 87.2%
Financial debt 805.6 676.5 19.1%
./. Cash and cash equivalents – 84.3 – 103.1 18.2%
Net financial debt 721.2 573.5 25.8%
20
KION GROUP AG | Interim Report Q2 2016Moving Forward Innovation

Analysis of liquidity
The KION Group’s net cash provided by operating activities totalled
€191.5 million, which was higher than the comparable prior-year
figure of €171.2 million. Even though the volume of business went up,
the KION Group further optimised its working capital, which, along
with the rise in EBIT, significantly boosted the cash position. How-
ever, as a result of the higher tax prepayments of €56.2 million
(H1 2015: €28.1 million), the net cash provided by operating activities
improved by just €20.3 million year on year.
The net cash used for investing activities rose to €202.0 million
as a result of acquisitions (H1 2015: €161.9 million). Cash payments
for capital expenditure on property, plant and equipment and on
intangible assets and the rental business totalled €179.2 million in the
first six months of 2016, representing a year-on-year increase
(H1 2015: €160.9 million). Net cash of €27.3 million was used for
acquisitions, €23.2 million of which related to the acquisition of
Retrotech Inc.
Free cash flow – the sum of cash flow from operating activities
and investing activities – was down year on year at minus €10.5 mil-
lion (H1 2015: €9.2 million).
Cash flow from financing activities amounted to minus €7.1 mil-
lion in the reporting period (H1 2015: minus €49.6 million). The distri-
bution of a dividend of €0.77 per share resulted in an outflow of funds
of €76.0 million (H1 2015: €54.3 million). Owing to the repayment
ahead of schedule of the corporate bond and the restructuring of
funding in February 2016, the financial debt taken up totalled
€1,020.4 million, whereas repayments came to €917.2 million. Net
cash of €40.4 million was used for regular interest payments
(H1 2015: €26.0 million). The year-on-year rise in interest payments
was attributable to the early repayment charge of €15.2 million result-
ing from the early repayment of the bond. > TABLE 14
TABLE 13(Condensed) statement of financial position – equity and liabilities
in € million 30/06/2016 in % 31/12/2015 in % Change
Equity 1,690.5 25.1% 1,848.7 28.7% – 8.6%
Non-current liabilities 2,922.4 43.4% 2,860.0 44.4% 2.2%
thereof:
Retirement benefit obligation 993.8 14.8% 798.0 12.4% 24.5%
Financial liabilities 381.0 5.7% 557.2 8.7% – 31.6%
Deferred tax liabilities 297.5 4.4% 302.7 4.7% – 1.7%
Lease liabilities 650.4 9.7% 617.7 9.6% 5.3%
Current liabilities 2,116.2 31.4% 1,731.5 26.9% 22.2%
thereof:
Financial liabilities 424.6 6.3% 119.3 1.9% > 100%
Trade payables 635.6 9.4% 574.6 8.9% 10.6%
Lease liabilities 253.9 3.8% 237.9 3.7% 6.7%
Total equity and liabilities 6,729.1 6,440.2 4.5%
21INTERIM GROUP MANAGEMENT REPORT
Report on the economic position
KION GROUP AG | Interim Report Q2 2016 We keep the world moving.

TABLE 14(Condensed) statement of cash flows
in € million Q2 2016 Q2 2015 Change Q1 – Q2 2016 Q1 – Q2 2015 Change
EBIT 116.8 99.4 17.5% 205.8 181.5 13.4%
Cash flow from operating activities 112.7 114.1 – 1.3% 191.5 171.2 11.9%
Cash flow from investing activities – 102.7 – 85.3 – 20.4% – 202.0 – 161.9 – 24.7%
Free cash flow 9.9 28.8 – 65.5% – 10.5 9.2 <– 100%
Cash flow from financing activities – 22.4 – 49.3 54.7% – 7.1 – 49.6 85.6%
Effect of foreign exchange rate changes on cash 0.1 – 1.0 > 100% – 1.1 3.3 <– 100%
Change in cash and cash equivalents – 12.3 – 21.4 42.5% – 18.7 – 37.0 49.3%
TABLE 15(Condensed) statement of financial position – assets
in € million 30/06/2016 in % 31/12/2015 in % Change
Non-current assets 4,905.9 72.9% 4,810.3 74.7% 2.0%
thereof:
Goodwill 1,576.9 23.4% 1,548.1 24.0% 1.9%
Brand names 604.8 9.0% 604.1 9.4% 0.1%
Deferred tax assets 378.8 5.6% 349.0 5.4% 8.5%
Rental assets 570.5 8.5% 544.0 8.4% 4.9%
Leased assets 377.6 5.6% 334.4 5.2% 12.9%
Lease receivables 487.3 7.2% 472.0 7.3% 3.3%
Current assets 1,823.2 27.1% 1,629.9 25.3% 11.9%
thereof:
Inventories 660.0 9.8% 553.5 8.6% 19.2%
Trade receivables 721.2 10.7% 670.5 10.4% 7.6%
Lease receivables 187.8 2.8% 181.7 2.8% 3.4%
Other current financial assets 72.9 1.1% 58.4 0.9% 24.7%
Cash and cash equivalents 84.3 1.3% 103.1 1.6% – 18.2%
Total assets 6,729.1 6,440.2 4.5%
22
KION GROUP AG | Interim Report Q2 2016Moving Forward Innovation

NET ASSETS
Non-current assets had increased to €4,905.9 million as at
30 June 2016 (31 December 2015: €4,810.3 million). Intangible
assets accounted for €2,484.6 million (31 December 2015:
€2,452.5 million). Goodwill and the KION Group’s brand names rep-
resented €2,181.7 million of that amount (31 December 2015:
€2,152.2 million). This small increase compared with 31 Decem-
ber 2015 was mainly attributable to the acquisition of Retrotech Inc.
Rental assets in the brand segments’ short-term rental fleet rose
to €570.5 million (31 December 2015: €544.0 million). Leased assets
for leases with end customers that are classified as operating leases
increased to €377.6 million (31 December 2015: €334.4 million).
Long-term lease receivables arising from leases with end customers
that are classified as finance leases advanced to €487.3 million
(31 December 2015: €472.0 million).
Current assets rose to €1,823.2 million (31 December 2015:
€1,629.9 million) owing to higher inventories and receivables. At
€187.8 million, short-term lease receivables from end customers
were slightly higher than at the end of last year (31 December 2015:
€181.7 million).
Cash and cash equivalents totalled €84.3 million at the end of
the half-year period (31 December 2015: €103.1 million). Taking into
account the unused credit facility, the cash and cash equivalents
available to the KION Group at 30 June 2016 amounted to
€858.0 million. > TABLE 15
Non-financial performance indicators
EMPLOYEES
As at 30 June 2016, the KION Group employed 23,804 full-time
equivalents (31 December 2015: 23,506). The increase in the num-
ber of employees is largely due to first-time consolidations in the first
quarter as well as growth in eastern Europe.
Personnel expenses rose by 6.2 per cent to €729.2 million in the
first half of the year (H1 2015: €686.4 million), mainly as a result of the
increase in the number of employees and changes to collective bar-
gaining agreements. Other factors were the acquisition of Egemin
Automation (including Retrotech Inc.) and the opening of the new
plant in Stříbro, Czech Republic. > TABLE 16
RESEARCH AND DEVELOPMENT
Total spending on research and development came to €67.5 million
in the first half of 2016 (H1 2015: €64.1 million), which equates to
2.6 per cent of revenue. The number of full-time jobs in R&D stood at
1,036 as at 30 June 2016 (31 December 2015: 1,056).
To support the Strategy 2020, the new CTO organisation was
successfully put in place in the first half of 2016. It covers product
strategy, research and development, innovation, procurement, qual-
ity assurance and production systems. The key R&D projects relating
to the reduction of emissions and fuel consumption, the modular and
TABLE 16Employees (full-time equivalents)
30/06/2016 31/12/2015 Change
Western Europe 16,556 16,515 0.2%
Eastern Europe 2,064 1,921 7.4%
Americas 873 693 26.0%
Asia 3,727 3,812 – 2.2%
Rest of world 584 565 3.4%
Total 23,804 23,506 1.3%
23INTERIM GROUP MANAGEMENT REPORT
Report on the economic position
KION GROUP AG | Interim Report Q2 2016 We keep the world moving.

platform strategy, drive technology, automation and connectivity,
and workplace safety and ergonomics continued. Numerous new
developments were unveiled at trade fairs and customer events dur-
ing the first half of the year. A particular focus was on automation
solutions, which should be available for core product series in the
medium term and, in combination with digital fleet management, will
play a crucial role in increasing efficiency. The portfolio consists of
picking solutions such as the iGo neo CX 20 robotics system from
STILL as well as driverless, robot-controlled industrial trucks that
Linde Material Handling is developing for its Linde-MATIC model
series. In addition, STILL presented the LiftRunner tugger train sys-
tem, an automated forklift-free solution for transporting materials
within internal operations.
To expand the functionality of the ‘connect:’ fleet management
solution and broaden its scope of application, LMH has developed a
new localisation technology that pinpoints the location of trucks and
transport containers to within centimetres in real time. Another new
feature is the pre-op check app for ‘connect:’, which can be used to
check all of a truck’s key parameters at the start of a shift. The truck
cannot be activated until the driver has used the app to conduct this
check. The ‘connect: desk’ software consolidates this information
with other data and evaluates it. In the service business, Linde Mate-
rial Handling is testing a mobile service manager app that sends
requests, together with the truck’s QR code and a photo of the
defective function, directly to the LMH service organisation. STILL
has developed neXXt fleet, a new platform for intelligent and efficient
fleet management that makes logistics processes simpler, faster,
more cost-effective and transparent.
The KION Group continued to forge ahead with the develop-
ment of lithium-ion drive systems in the reporting period. LMH show-
cased its first counterbalance trucks with lithium-ion batteries, which
had previously only been fitted in pallet trucks, order pickers and tow
tractors. Linde also presented warehouse trucks and counterbal-
ance trucks fitted with hydrogen fuel cells. Alongside its existing fuel-
cell-powered trucks, STILL also presented new lithium-ion trucks,
including order pickers, tow tractors, low-lift and double-stacker pal-
let trucks and counterbalance trucks. STILL also converted a cus-
tomer’s entire fleet to lithium-ion technology. LMH and STILL both
further expanded their customer-specific products for optimising
fleet deployment as a way of supporting logistics processes even
more efficiently. The focus of development work at Baoli was the
upgrading of its diesel engines to meet the new China 3 emissions
standard. Baoli is also working on new electric counterbalance
trucks. At Voltas, a total of six product series are currently being
updated or are due for launch in 2016. > TABLE 17
CUSTOMERS
The KION brand companies regularly exhibit at the leading trade
fairs for their sector so that they can strengthen their relationships
with customers and partners. Contact with customers at trade fairs
also makes it possible to gauge interest in the product innovations
on show among new and existing customers. In the first half of the
year, the KION brands STILL, LMH and Egemin took part in the Logi-
MAT trade fair in Stuttgart. STILL and Egemin also featured at
CeMAT in Hannover, where STILL registered more than 30,000 visi-
tors to the stand.
The new version of LMH’s customer event, World of Material
Handling, which is held at its own premises, attracted 7,000 custom-
ers, dealers and business partners, setting a new visitor record.
TABLE 17Research and development (R&D)
in € million Q2 2016 Q2 2015 Change Q1 – Q2 2016 Q1 – Q2 2015 Change
Research and development costs (P&L) 34.9 36.7 – 4.7% 72.0 70.7 1.8%
Amortisation expense (R&D) – 12.3 – 13.2 6.3% – 24.6 – 26.1 5.7%
Capitalised development costs 12.1 9.9 22.1% 20.2 19.5 3.5%
Total R&D spending 34.7 33.4 3.8% 67.5 64.1 5.4%
R&D spending as percentage of revenue 2.6% 2.7% − 2.6% 2.6% −
24
KION GROUP AG | Interim Report Q2 2016Moving Forward Innovation

STILL also presented its new products at the customer day that it
held at the start of the new year at its new branch in Nurem-
berg / Fürth.
In April, Landshut University of Applied Sciences opened its Puls
technology centre for production and logistics systems in Dingolfing.
The technology centre serves as an interface between lean manage-
ment theory and practice. It also offers training courses for compa-
nies. STILL played a big part in bringing this project to fruition and is
providing support in the form of two STILL tugger trains. The centre
has been built to resemble a fully-fledged medium-sized business. It
investigates the latest research on intelligent material handling and
lean management in production operations.
OUTLOOK, RISK REPORT AND OPPORTUNITY REPORT
Outlook
FORWARD-LOOKING STATEMENTS
The forward-looking statements and information given below are
based on the Company’s current expectations and assessments.
Consequently, they involve a number of risks and uncertainties.
Many factors, several of which are beyond the control of the KION
Group, affect the Group’s business activities and profitability. Any
unexpected developments in the global economy would result in
the KION Group’s performance and profits differing significantly
from those forecast below. The KION Group does not undertake
to update forward-looking statements to reflect subsequently
occurring events or circumstances. Furthermore, the KION Group
cannot guarantee that future performance and actual profits gen-
erated will be consistent with the stated assumptions and esti-
mates and can accept no liability in this regard.
Actual business performance may deviate from the forecasts
due, among other factors, to the opportunities and risks described in
the 2015 group management report. Performance particularly
depends on macroeconomic and industry-specific conditions and
may be negatively affected by increasing uncertainty or a worsening
of the economic and political situation.
EXPECTED BUSINESS PERFORMANCE
Given its good business and earnings performance in the first half
of 2016, the KION Group is confirming the outlook for 2016 as a
whole that was published in the 2015 group management report.
The effects of the planned acquisition of Dematic have not yet
been taken into account because the transaction has not yet
been closed.
In 2016, the Group aims to build on its successful performance
in 2015 and, based on the forecasts for market growth, achieve fur-
ther increases in order intake, revenue and adjusted EBIT. Order
intake is expected to be between €5,350 million and €5,500 million.
The target figure for consolidated revenue is in the range of
€5,200 million to €5,350 million. The KION Group predicts higher vol-
umes of revenue and orders, particularly in western Europe.
The targeted range for adjusted EBIT is €510 million to €535 mil-
lion. The adjusted EBIT margin is predicted to increase above the
margin of 9.5 per cent that was generated in 2015. This improvement
will stem from significant positive effects, such as a further increase
in the efficiency of the production network. Free cash flow is expected
to be in a range between €280 million and €320 million after taking
account of the acquisition of Retrotech Inc. ROCE is expected to go
up slightly. The forecast is based on the assumption that material
prices will hold steady and the current exchange rate environment
will remain as it is.
Opportunity and risk report
The KION Group’s overall risk and opportunity situation has not
changed significantly compared with the description in the 2015
group management report. As things stand at present, there are
no indications of any risks that could jeopardise the Company’s
continuation as a going concern.
25INTERIM GROUP MANAGEMENT REPORT
Outlook, risk report and opportunity report
KION GROUP AG | Interim Report Q2 2016 We keep the world moving.

Condensed consolidated interim financial statements
TABLE 18Consolidated income statement
in € million Q2 2016 Q2 2015 Q1 – Q2 2016 Q1 – Q2 2015
Revenue 1,343.8 1,256.0 2,564.5 2,420.8
Cost of sales – 943.9 – 889.2 – 1,804.1 – 1,712.7
Gross profit 399.9 366.8 760.4 708.1
Selling expenses – 161.5 – 146.2 – 318.8 – 294.7
Research and development costs – 34.9 – 36.7 – 72.0 – 70.7
Administrative expenses – 106.2 – 93.7 – 192.2 – 178.1
Other income 17.6 19.3 34.7 42.6
Other expenses – 7.5 – 18.2 – 16.0 – 32.1
Profit from equity-accounted investments 9.4 8.0 9.6 6.4
Earnings before interest and taxes 116.8 99.4 205.8 181.5
Financial income 14.6 13.2 33.5 25.6
Financial expenses – 37.4 – 35.8 – 96.8 – 68.8
Net financial expenses – 22.8 – 22.6 – 63.3 – 43.3
Earnings before taxes 94.0 76.8 142.5 138.2
Income taxes – 30.0 – 24.3 – 45.5 – 43.9
Current taxes – 16.0 – 45.0 – 31.3 – 67.6
Deferred taxes – 14.0 20.7 – 14.2 23.7
Net income for the period 64.0 52.5 97.1 94.3
Attributable to shareholders of KION GROUP AG 63.2 51.7 95.5 92.5
Attributable to non-controlling interests 0.8 0.8 1.6 1.8
Earnings per share according to IAS 33 (in €)
Basic earnings per share 0.64 0.52 0.97 0.94
Diluted earnings per share 0.64 0.52 0.97 0.94
26
KION GROUP AG | Interim report Q2 2016Moving Forward Innovation

TABLE 19Consolidated statement of comprehensive income
in € million Q2 2016 Q2 2015 Q1 – Q2 2016 Q1 – Q2 2015
Net income for the period 64.0 52.5 97.1 94.3
Items that will not be reclassified subsequently to profit or loss – 87.5 134.5 – 144.5 23.0
Gains / losses on defined benefit obligation – 87.5 134.9 – 144.5 23.4
thereof changes in unrealised gains and losses – 122.4 192.2 – 202.7 35.1
thereof tax effect 35.0 – 57.3 58.3 – 11.6
Changes in unrealised gains and losses from equity-accounted investments – 0.0 – 0.4 – 0.0 – 0.4
Items that may be reclassified subsequently to profit or loss – 16.6 – 11.0 – 33.8 42.3
Impact of exchange differences – 8.1 – 15.0 – 34.4 47.7
thereof changes in unrealised gains and losses – 8.1 – 15.0 – 34.4 47.7
Gains / losses on hedge reserves – 8.7 3.4 – 0.1 – 6.0
thereof changes in unrealised gains and losses – 4.9 – 2.9 6.8 – 19.5
thereof realised gains (–) and losses (+) – 3.4 7.5 – 3.9 12.1
thereof tax effect – 0.4 – 1.3 – 3.0 1.4
Gains / losses from equity-accounted investments 0.1 0.6 0.7 0.6
thereof changes in unrealised gains and losses 0.1 0.6 0.7 0.6
Other comprehensive loss (income) – 104.1 123.5 – 178.3 65.3
Total comprehensive loss (income) – 40.1 176.0 – 81.2 159.6
Attributable to shareholders of KION GROUP AG – 40.9 175.3 – 82.8 158.0
Attributable to non-controlling interests 0.8 0.6 1.6 1.7
27
KION GROUP AG | Interim report Q2 2016 We keep the world moving.
CONDENSED CONSOLIDATED
INTERIM FINANCIAL STATEMENTS
Consolidated income statementConsolidated statement of comprehensive income

TABLE 20Consolidated statement of financial position – assets
in € million 30/06/2016 31/12/2015
Goodwill 1,576.9 1,548.1
Other intangible assets 907.6 904.4
Leased assets 377.6 334.4
Rental assets 570.5 544.0
Other property, plant and equipment 504.8 508.8
Equity-accounted investments 77.1 73.6
Lease receivables 487.3 472.0
Other financial assets 25.3 45.9
Other assets 0.0 30.2
Deferred taxes 378.8 349.0
Non-current assets 4,905.9 4,810.3
Inventories 660.0 553.5
Trade receivables 721.2 670.5
Lease receivables 187.8 181.7
Income tax receivables 16.5 7.9
Other financial assets 72.9 58.4
Other assets 80.5 54.8
Cash and cash equivalents 84.3 103.1
Current assets 1,823.2 1,629.9
Total assets 6,729.1 6,440.2
28
KION GROUP AG | Interim report Q2 2016Moving Forward Innovation

TABLE 21Consolidated statement of financial position – equity and liabilities
in € million 30/06/2016 31/12/2015
Subscribed capital 98.7 98.7
Capital reserves 1,996.9 1,996.6
Retained earnings 30.7 11.3
Accumulated other comprehensive loss – 443.8 – 265.5
Non-controlling interests 8.0 7.7
Equity 1,690.5 1,848.7
Retirement benefit obligation 993.8 798.0
Non-current financial liabilities 381.0 557.2
Lease liabilities 650.4 617.7
Other non-current provisions 77.6 83.4
Other financial liabilities 325.7 315.6
Other liabilities 196.4 185.4
Deferred taxes 297.5 302.7
Non-current liabilities 2,922.4 2,860.0
Current financial liabilities 424.6 119.3
Trade payables 635.6 574.6
Lease liabilities 253.9 237.9
Income tax liabilities 62.9 79.8
Other current provisions 124.5 111.5
Other financial liabilities 202.8 194.4
Other liabilities 412.1 414.0
Current liabilities 2,116.2 1,731.5
Total equity and liabilities 6,729.1 6,440.2
29
KION GROUP AG | Interim report Q2 2016 We keep the world moving.
CONDENSED CONSOLIDATED
INTERIM FINANCIAL STATEMENTS
Consolidated statement of financial position

TABLE 22Consolidated statement of cash flows
in € million Q1 – Q2 2016 Q1 – Q2 2015
Earnings before interest and taxes 205.8 181.5
Amortisation, depreciation and impairment charges of non-current assets 207.0 193.0
Other non-cash income (–) and expenses (+) 21.5 9.7
Gains (–) / losses (+) on disposal of non-current assets 0.4 – 0.6
Changes in leased assets (excluding depreciation) and lease receivables / liabilities – 58.5 – 37.9
Change in inventories – 107.4 – 80.6
Change in trade receivables / payables – 2.1 – 85.2
Cash payments for defined benefit obligations – 11.5 – 12.2
Change in other provisions 8.2 – 0.5
Change in other operating assets / liabilities – 15.7 32.1
Taxes paid – 56.2 – 28.1
Cash flow from operating activities 191.5 171.2
Cash payments for purchase of non-current assets – 64.3 – 59.8
Cash receipts from disposal of non-current assets 1.4 9.7
Change in rental assets (excluding depreciation) – 114.9 – 101.1
Dividends received 6.5 6.4
Acquisition of subsidiaries (net of cash acquired) and other equity investments – 27.3 – 2.7
Cash payments for sundry assets – 3.3 – 14.5
Cash flow from investing activities – 202.0 – 161.9
30
KION GROUP AG | Interim report Q2 2016Moving Forward Innovation
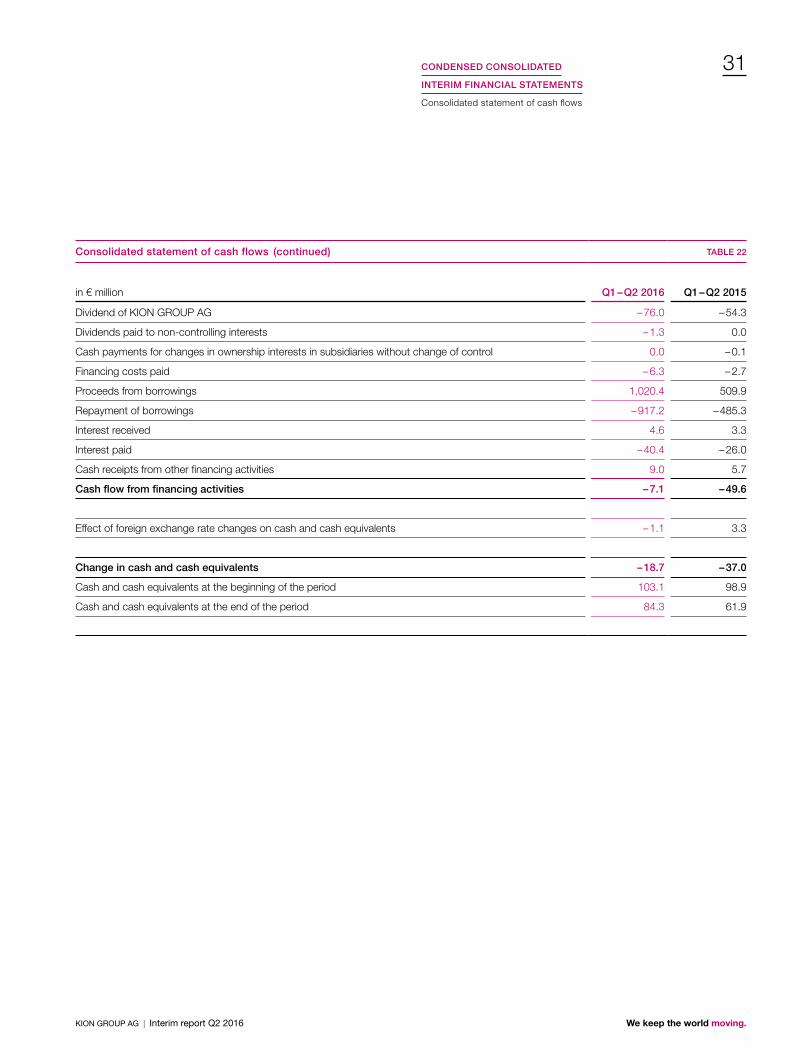
TABLE 22(continued)Consolidated statement of cash flows
in € million Q1 – Q2 2016 Q1 – Q2 2015
Dividend of KION GROUP AG – 76.0 – 54.3
Dividends paid to non-controlling interests – 1.3 0.0
Cash payments for changes in ownership interests in subsidiaries without change of control 0.0 – 0.1
Financing costs paid – 6.3 – 2.7
Proceeds from borrowings 1,020.4 509.9
Repayment of borrowings – 917.2 – 485.3
Interest received 4.6 3.3
Interest paid – 40.4 – 26.0
Cash receipts from other financing activities 9.0 5.7
Cash flow from financing activities – 7.1 – 49.6
Effect of foreign exchange rate changes on cash and cash equivalents – 1.1 3.3
Change in cash and cash equivalents – 18.7 – 37.0
Cash and cash equivalents at the beginning of the period 103.1 98.9
Cash and cash equivalents at the end of the period 84.3 61.9
31
KION GROUP AG | Interim report Q2 2016 We keep the world moving.
CONDENSED CONSOLIDATED
INTERIM FINANCIAL STATEMENTS
Consolidated statement of cash flows

Consolidated statement of changes in equity
Accumulated other comprehensive income (loss)
in € millionSubscribed
capitalCapital
reservesRetained earnings
Cumulative exchange
differences
Gains / losses on defined benefit
obligationsGains / losses on
hedge reserves
Gains / losses from equity-accounted
investments
Equity attributable to shareholders of KION GROUP AG
Non-controlling interests Total
Balance as at 1/1/2015 98.7 1,996.2 – 148.2 – 31.7 – 264.6 – 4.2 – 4.3 1,641.8 5.3 1,647.1
Net income for the period 92.5 92.5 1.8 94.3
Other comprehensive income (loss) 47.9 23.4 – 6.0 0,2 65.5 – 0.2 65.3
Comprehensive income (loss) 0.0 0.0 92.5 47.9 23.4 – 6.0 0.2 158.0 1.7 159.6
Dividend of KION GROUP AG – 54.3 – 54.3 0.0 – 54.3
Changes from employee share option programme 0.1 0.1 0.0 0.1
Changes from application of the equity-method 0.7 0.7 0.0 0.7
Other changes – 0.1 – 0.1 0.0 – 0.1
Balance as at 30/06/2015 98.7 1,996.3 – 109.4 16.1 – 241.2 – 10.2 – 4.2 1,746.2 7.0 1,753.2
Balance as at 1/1/2016 98.7 1,996.6 11.3 – 11.4 – 251.9 – 0.2 – 2.0 1,841.0 7.7 1,848.7
Net income for the period 95.5 95.5 1.6 97.1
Other comprehensive income (loss) – 34.4 – 144.5 – 0.1 0.7 – 178.3 – 0.0 – 178.3
Comprehensive income (loss) 0.0 0.0 95.5 – 34.4 – 144.5 – 0.1 0.7 – 82.8 1.6 – 81.2
Dividend of KION GROUP AG – 76.0 – 76.0 0.0 – 76.0
Dividends paid to non-controlling interests 0.0 – 1.3 – 1.3
Changes from employee share option programme 0.3 0.3 0.0 0.3
Balance as at 30/06/2016 98.7 1,996.9 30.7 – 45.8 – 396.3 – 0.3 – 1.4 1,682.5 8.0 1,690.5
32
KION GROUP AG | Interim report Q2 2016Moving Forward Innovation

TABLE 23Consolidated statement of changes in equity
Accumulated other comprehensive income (loss)
in € millionSubscribed
capitalCapital
reservesRetained earnings
Cumulative exchange
differences
Gains / losses on defined benefit
obligationsGains / losses on
hedge reserves
Gains / losses from equity-accounted
investments
Equity attributable to shareholders of KION GROUP AG
Non-controlling interests Total
Balance as at 1/1/2015 98.7 1,996.2 – 148.2 – 31.7 – 264.6 – 4.2 – 4.3 1,641.8 5.3 1,647.1
Net income for the period 92.5 92.5 1.8 94.3
Other comprehensive income (loss) 47.9 23.4 – 6.0 0,2 65.5 – 0.2 65.3
Comprehensive income (loss) 0.0 0.0 92.5 47.9 23.4 – 6.0 0.2 158.0 1.7 159.6
Dividend of KION GROUP AG – 54.3 – 54.3 0.0 – 54.3
Changes from employee share option programme 0.1 0.1 0.0 0.1
Changes from application of the equity-method 0.7 0.7 0.0 0.7
Other changes – 0.1 – 0.1 0.0 – 0.1
Balance as at 30/06/2015 98.7 1,996.3 – 109.4 16.1 – 241.2 – 10.2 – 4.2 1,746.2 7.0 1,753.2
Balance as at 1/1/2016 98.7 1,996.6 11.3 – 11.4 – 251.9 – 0.2 – 2.0 1,841.0 7.7 1,848.7
Net income for the period 95.5 95.5 1.6 97.1
Other comprehensive income (loss) – 34.4 – 144.5 – 0.1 0.7 – 178.3 – 0.0 – 178.3
Comprehensive income (loss) 0.0 0.0 95.5 – 34.4 – 144.5 – 0.1 0.7 – 82.8 1.6 – 81.2
Dividend of KION GROUP AG – 76.0 – 76.0 0.0 – 76.0
Dividends paid to non-controlling interests 0.0 – 1.3 – 1.3
Changes from employee share option programme 0.3 0.3 0.0 0.3
Balance as at 30/06/2016 98.7 1,996.9 30.7 – 45.8 – 396.3 – 0.3 – 1.4 1,682.5 8.0 1,690.5
33
KION GROUP AG | Interim report Q2 2016 We keep the world moving.
CONDENSED CONSOLIDATED
INTERIM FINANCIAL STATEMENTS
Consolidated statement of changes in equity

BASIS OF PRESENTATION
General information on the Company
KION GROUP AG, whose registered office is at Abraham- Lincoln-
Strasse 21, 65189 Wiesbaden, is entered in the commercial register
at the Wiesbaden local court under reference HRB 27060.
The condensed consolidated interim financial statements and
the interim group management report were prepared by the Execu-
tive Board of KION GROUP AG on 26 July 2016.
Basis of preparation
The condensed consolidated interim financial statements of the
KION Group for the six months ended 30 June 2016 have been pre-
pared in line with International Accounting Standard (IAS) 34 ‘Interim
Financial Reporting’ and other International Financial Reporting
Standards (IFRSs) as adopted by the European Union in accordance
with Regulation (EC) No. 1606/2002 of the European Parliament and
of the Council concerning the application of international accounting
standards for interim financial statements. A condensed scope of
interim reporting has been prepared in accordance with IAS 34.
All of the IFRSs and the related interpretations (IFRICs / SICs) of
the IFRS Interpretations Committee (IFRS IC) that had been issued
by the reporting date and that were required to be applied for finan-
cial years commencing on or after 1 January 2016 have been applied
in preparing these condensed consolidated interim financial state-
ments. These condensed consolidated interim financial statements
do not contain all the information and disclosures required of a set of
consolidated annual financial statements and should therefore be
read in conjunction with the consolidated financial statements pre-
pared for the year ended 31 December 2015.
The reporting currency is the euro. All amounts are disclosed in
millions of euros (€ million) unless stated otherwise. The addition of
the totals presented may result in minor rounding differences. The
percentages shown are calculated on the basis of the respective
amounts, rounded to the nearest thousand euros.
FINANCIAL REPORTING STANDARDS TO BE ADOPTED FOR
THE FIRST TIME IN THE CURRENT FINANCIAL YEAR
The following financial reporting standards were adopted for the first
time with effect from 1 January 2016:
– Amendments to IFRS 11 ‘Joint Arrangements’: clarification relat-
ing to the acquisition of interests in joint operations
– Amendments to IAS 1 ‘Presentation of Financial Statements’:
amendments in connection with the initiative to improve disclo-
sure requirements
– Amendments to IAS 16 ‘Property, Plant and Equipment’ and
IAS 38 ‘Intangible Assets’: clarification relating to revenue-based
depreciation and amortisation
– Amendments to IAS 16 ‘Property, Plant and Equipment’ and
IAS 41 ‘Agriculture’: amendments relating to the financial report-
ing for bearer plants
– Amendments to IAS 19 ‘Employee Benefits’: defined benefit
plans: employee contributions
– Amendments to IAS 27 ‘Separate Financial Statements’: amend-
ments relating to the application of the equity method for sub-
sidiaries, joint ventures and associates in separate financial
statements
– Annual Improvements to IFRSs (2010–2012)
– Annual Improvements to IFRSs (2012–2014).
The first-time adoption of these amendments to standards has had
no significant effect on the financial performance, financial position
or notes to the interim financial statements of the KION Group.
FINANCIAL REPORTING STANDARDS RELEASED
BUT NOT YET ADOPTED
In its condensed consolidated interim financial statements for the
six months ended 30 June 2016, the KION Group has not applied –
besides the standards and interpretations reported on as at
31 December 2015 – the following standards and amendments to
standards, which have been issued by the IASB but are not yet
required to be applied in 2016:
Notes to the condensed consolidated interim financial statements
34
KION GROUP AG | Interim report Q2 2016Moving Forward Innovation

– Amendments to IFRS 2 ‘Share-based Payment’: amendments
relating to the classification and measurement of share-based
payment transactions
– Clarifications to IFRS 15 ‘Revenue from Contracts with Custom-
ers’: amendments relating to the identification of performance
obligations, classification as principal or agent, revenue from
licenses and transition relief.
These standards are expected to be applied by the entities included in
the KION Group only from the date on which they must be adopted for
the first time. The effects on the financial performance and financial
position of the KION Group resulting from the first-time adoption of
IFRS 9 ‘Financial Instruments’, IFRS 16 ‘Leases’ and IFRS 15 ‘Revenue
from Contracts with Customers’ (including the clarifications to IFRS 15),
particularly with regard to contracts with multiple components and
contracts for indirect end customer finance, are still being analysed.
The effects of the first-time adoption of the other standards and inter-
pretations on the presentation of the financial position and financial
performance of the KION Group are expected to be insignificant.
Basis of consolidation
A total of 23 German (31 December 2015: 22) and 83 foreign
(31 December 2015: 80) subsidiaries were fully consolidated in addi-
tion to KION GROUP AG as at 30 June 2016.
In addition, nine joint ventures and associates were consolidated
and accounted for using the equity method as at 30 June 2016,
which was the same number as at 31 December 2015.
52 (31 December 2015: 55) subsidiaries with minimal business
volumes or no business operations and other equity investments
were not included in the consolidation.
Sale and purchase agreement signed
On 21 June 2016, KION GROUP AG reached agreement with the
sellers to acquire 100.0 per cent of the capital and voting shares in
DH Services Luxembourg Holding S.à r.l., Luxembourg. Closing of
the transaction is subject to the customary closing conditions and
regulatory approvals, and is likely to take place during the fourth
quarter of 2016.
DH Services Luxembourg Holding S.à r.l. is the parent company
of the Dematic Group. Dematic is a leading global supplier of
advanced integrated automation technology, software and services
for optimising supply chains. Its product portfolio ranges automated
guided vehicles, palletisers, storage and picking equipment includ-
ing automated storage and retrieval systems, sorters and conveyors,
a leading integrated software platform and automation technologies.
Dematic has engineering centres and manufacturing facilities located
around the world. With more than 100 locations Dematic is present
in 22 countries. Following the acquisition of Retrotech Inc. in Febru-
ary 2016 and Egemin Automation in 2015, this latest acquisition
represents a further expansion of the KION Group’s expertise in sys-
tem solutions for intralogistics and automation, fields that are seeing
increasingly strong demand and will play a crucial role in connection
with Industry 4.0.
The provisional purchase price for the net assets acquired is the
equivalent of around €1.9 billion. Dematic, which employs almost
6,000 skilled professionals, generated revenue of roughly €1.6 billion
and adjusted EBIT of around €150.0 million in the 2015 calendar year.
An agreement has been reached with a group of banks for a
bridge loan of €3.0 billion as funding for the acquisition of Dematic.
This bridge loan is to be refinanced partly by long-term capital-mar-
ket and bank debt and partly by equity.
Acquisitions
RETROTECH INC.
On 8 February 2016, the KION Group reached agreement on the
acquisition of Retrotech Inc., a US systems integrator of automated
warehouse and distribution solutions. The transaction was closed on
1 March 2016. The purchase price for the 100.0 per cent stake in
Retrotech Inc., which is headquartered in Rochester, New York
State, was €25.0 million.
The incidental acquisition costs incurred by this business com-
bination amounted to €0.7 million. They have been recognised as an
expense for the current period and reported as administrative
expenses in the consolidated income statement. The impact of this
acquisition on the consolidated financial statements of KION
GROUP AG based on the provisional figures available at the acquisi-
tion date is shown in > TABLE 24.
35NOTES TO THE CONDENSED CONSOLIDATED
INTERIM FINANCIAL STATEMENTS
Basis of presentation
KION GROUP AG | Interim report Q2 2016 We keep the world moving.

As part of this transaction, receivables in a gross amount of €8.8 mil-
lion were acquired, of which €5.3 million constituted gross amounts
due from customers for contract work that have not yet been
invoiced. At the acquisition date, it was assumed that the amount of
irrecoverable trade receivables was insignificant. Consolidated reve-
nue rose by €8.8 million as a result of the acquisition. The net income
reported for the first half of 2016 contains a loss totalling €2.5 million
attributable to the entity acquired. If this business combination had
been completed by 1 January 2016, this would have had no material
impact on either the revenue or the net income (loss) reported by the
KION Group for the first six months of this year.
The purchase price allocation for the acquisition described
above was only provisional as at 30 June 2016 because some
details, particularly in the area of long-term construction contracts,
had not yet been fully evaluated. In the second quarter of 2016, the
main item was a change in the measurement of other intangible
assets within the measurement period. In addition to the increase in
other intangible assets, this adjustment also caused a countervailing
increase in the deferred tax liabilities recognised thereon, which
caused the goodwill recognised as at 30 June 2016 to reduce by a
total of €2.0 million.
Goodwill constitutes the strategic and geographical synergies
that the KION Group expects to derive from this business combina-
tion plus the highly trained workforce. The goodwill arising from this
acquisition is currently not tax deductible.
The line item ‘Acquisition of subsidiaries (net of cash acquired)
and other equity investments’ in the consolidated statement of cash
flows contains a net cash outflow of €23.2 million for the acquisition
of Retrotech Inc.
TABLE 24Impact of the acquisition of Retrotech Inc. on the financial position of the KION Group
in € millionFair value at the acquisition date
Goodwill 24.3
Other intangible assets 15.4
Trade receivables 8.8
Cash and cash equivalents 1.7
Other assets 3.0
Total assets 53.2
Financial liabilities 9.6
Trade payables 7.5
Other current liabilities 5.0
Other liabilities 6.2
Total liabilities 28.3
Total net assets 25.0
Cash payment 25.0
Consideration transferred 25.0
36
KION GROUP AG | Interim report Q2 2016Moving Forward Innovation

OTHER ACQUISITIONS
In October 2015, 100.0 per cent of the shares in the dealer Moden
Diesel S.p.A. (formerly MODEN DIESEL S.R.L.), Modena, Italy, were
acquired. At the end of October 2015, 100.0 per cent of the shares in
LR Intralogistik GmbH, Wörth an der Isar, Germany, a specialist in
intralogistics concepts that eschew forklift trucks in favour of tugger
trains, were also acquired. These two subsidiaries were included in
the KION Group’s basis of consolidation for the first time in January
2016 because they had become more financially important.
The impact of these acquisitions on the consolidated financial
statements of KION GROUP AG based on the provisional figures
available at their acquisition dates is shown in > TABLE 25.
Impact of other acquisitions on the financial position of the KION Group
in € millionFair value at the acquisition date
Goodwill 9.1
Other intangible assets 4.2
Leased / Rental assets 10.9
Trade receivables 4.3
Cash and cash equivalents 2.5
Other assets 3.4
Total assets 34.4
Financial liabilities 1.2
Trade payables 3.9
Other liabilities 9.7
Total liabilities 14.8
Total net assets 19.6
Cash payment 13.6
Contingent consideration 6.0
Consideration transferred 19.6
TABLE 25
37
KION GROUP AG | Interim report Q2 2016 We keep the world moving.
NOTES TO THE CONDENSED CONSOLIDATED
INTERIM FINANCIAL STATEMENTS
Basis of presentation

The purchase price allocations for the acquisitions described
above were only provisional as at 30 June 2016 because some
details in the area of intangible assets and leasing had not yet been
fully evaluated. In the second quarter of 2016, the main item was a
change in the recognition of the rental / leased assets within the
measurement period. Analysis of the acquired leases resulted in
additional rental/leased assets in an amount of €6.1 million and an
increase in other liabilities of the same amount. Goodwill consti-
tutes the strategic, technological and geographical synergies that
the KION Group expects to derive from these business combina-
tions. None of the goodwill arising from the other acquisitions is
currently tax deductible.
The contingent considerations in connection with the acquisition
of LR Intralogistik GmbH contractually oblige the KION Group to
make additional payments to the previous shareholders that are
mainly dependent on the usability of certain intangible assets. The
line item ‘Acquisition of subsidiaries (net of cash acquired) and other
equity investments’ in the consolidated statement of cash flows con-
tains a cash outflow totalling €4.1 million that relates to these contin-
gent considerations.
Accounting policies
With the exception of the new and amended IFRSs described above,
the accounting policies applied in these condensed consolidated
interim financial statements are fundamentally the same as those
used for the year ended 31 December 2015. These condensed con-
solidated interim financial statements are based on the interim finan-
cial statements of the parent company and its consolidated subsi-
diaries prepared in accordance with the standard accounting
policies applicable throughout the KION Group.
ASSUMPTIONS AND ESTIMATES
The preparation of these condensed IFRS consolidated interim
financial statements requires the use of assumptions and estimates
for certain line items that affect recognition and measurement in the
statement of financial position and the income statement. The actual
amounts realised may differ from estimates. Assumptions and esti-
mates are applied in particular:
– in assessing the need for and the amount of impairment losses
on intangible assets, property, plant and equipment, and
inventories;
– in determining the useful life of non-current assets;
– in classifying leases;
– in recognising and measuring defined benefit pension obliga-
tions and other provisions;
– in recognising and measuring current and deferred taxes;
– in recognising and measuring assets acquired and liabilities
assumed in connection with business combinations.
The estimates may be affected, for example, by deteriorating global
economic conditions or by changes in exchange rates, interest rates
or commodity prices. Production errors, the loss of key customers
and changes in financing can also impact on the Company’s perfor-
mance going forward. Changes are recognised in profit or loss when
they become known and assumptions are adjusted accordingly.
SELECTED NOTES TO THE CONSOLIDATED INCOME STATEMENT
Net financial income / expenses
Financial expenses rose by €27.9 million year on year. This increase
was attributable to one-off expenses in connection with the repay-
ment of the syndicated loan dated 23 December 2006 that took
the form of a revolving credit facility of €1,243.0 million and the
€450.0 million corporate bond, which had been issued in 2013 and
was due to mature in 2020. An amount of €5.4 million representing
the deferred borrowing costs relating to the corporate bond at the
time of early repayment and a cash payment of €15.2 million repre-
senting early repayment charges were recognised as financial
expenses. In addition, an amount of €5.1 million representing the
deferred borrowing costs relating to the previous syndicated loan at
the time of early repayment was included in financial expenses.
38
KION GROUP AG | Interim report Q2 2016Moving Forward Innovation
Income taxes
In the consolidated interim financial statements, income taxes for the
current reporting period are calculated on the basis of the expected
income tax rate for the full year.
Earnings per share
Basic earnings per share are calculated by dividing the net income
(loss) accruing to the KION GROUP AG shareholders by the weighted
average number of shares outstanding during the reporting period
(H1 2016: 98,739,950 no-par-value shares; H1 2015: 98,736,438
no-par-value shares; Q2 2016: 98,739,950 no-par-value shares;
Q2 2015: 98,736,438 no-par-value shares). In the first half of 2016,
the KION Group generated net income accruing to the shareholders
of KION GROUP AG of €95.5 million (H1 2015: €92.5 million). Infor-
mation about determining the net income (loss) accruing to the KION
GROUP AG shareholders can be found in the consolidated income
statement. Basic earnings per share for the reporting period came to
€0.97 (H1 2015: €0.94). The 160,050 no-par-value treasury shares
repurchased by KION GROUP AG were not included in this figure as
at 30 June 2016 (30 June 2015: 163,562).
Diluted earnings per share are calculated by adding the potential
dilutive no-par-value shares that employees can obtain for free under
the employee share option programme to the weighted average
number of shares outstanding during the reporting period. The cal-
culation of diluted earnings per share was based on a weighted aver-
age for the first half of 2016 of 98,770,779 no-par-value shares issued
(H1 2015: 98,750,371 no-par-value shares; Q2 2016: 98,771,614
no-par-value shares; Q2 2015: 98,751,492 no-par-value shares).
Diluted earnings per share for the reporting period came to €0.97
(H1 2015: €0.94).
SELECTED NOTES TO THE CONSOLIDATED STATEMENT OF FINANCIAL POSITION
Goodwill and other intangible assets
The change in goodwill in the first half of 2016 resulted from three
acquisitions from which – according to the preliminary purchase
price allocations – goodwill totalling €33.4 million arose, and from
currency effects.
The total carrying amount for technology and development
assets as at 30 June 2016 was €188.7 million (31 December 2015:
€194.1 million). Development costs of €12.1 million were capitalised
in the second quarter of 2016 (Q2 2015: €9.9 million); the corre-
sponding figure for the first half of 2016 was €20.2 million (H1 2015:
€19.5 million). Total research and development costs of €34.9 million
were expensed in the second quarter of 2016 (Q2 2015: €36.7 mil-
lion), while €72.0 million was expensed in the first half of 2016
(H1 2015: €70.7 million). Of these respective amounts, €12.3 million
related to amortisation in the second quarter of 2016 (Q2 2015:
€13.2 million) and €24.6 million to amortisation in the first half of 2016
(H1 2015: €26.1 million).
Inventories
The rise in inventories compared with 31 December 2015 was largely
attributable to the increase in work in progress (up by 24.1 per cent)
and finished goods (up by 22.1 per cent). Impairment losses of
€5.5 million were recognised on inventories in the second quarter of
2016 (Q2 2015: €1.3 million) and of €9.0 million in the first six months
of 2016 (H1 2015: €4.0 million). Reversals of impairment losses had
to be recognised in the amount of €0.7 million in the second quarter
of 2016 (Q2 2015: €0.8 million) and in the amount of €1.2 million in the
first half of 2016 (H1 2015: €1.7 million) because the reasons for
impairment no longer existed.
39
KION GROUP AG | Interim report Q2 2016 We keep the world moving.
NOTES TO THE CONDENSED CONSOLIDATED
INTERIM FINANCIAL STATEMENTS
Notes to the consolidated income statementNotes to the consolidated statement of financial position

Trade receivables
The rise in trade receivables compared with 31 December 2015 was
largely due to the increase of €42.6 million in receivables due from
third parties and the increase of €10.5 million in gross amounts due
from customers for contract work. Receivables due from non-
consolidated subsidiaries, equity-accounted investments and other
equity investments rose by €1.3 million. Valuation allowances of
€42.2 million (31 December 2015: €38.5 million) were recognised for
trade receivables.
Equity
As at 30 June 2016, the Company’s share capital amounted to
€98.9 million, which was unchanged on 31 December 2015, and
was fully paid up. It was divided into 98.9 million no-par-value shares.
The total number of shares outstanding as at 30 June 2016 was
98,739,950 no-par-value shares (31 December 2015: 98,739,950
no-par-value shares). At the reporting date, KION GROUP AG held
160,050 treasury shares, as it had at 31 December 2015.
The distribution of a dividend of €0.77 per share (H1 2015: €0.55
per share) to the shareholders of KION GROUP AG resulted in an
outflow of funds of €76.0 million (H1 2015: €54.3 million).
Retirement benefit obligation
For the purposes of the interim report, a qualified estimate of the
defined benefit obligation was made based on the change in actuarial
parameters in the period under review.
The retirement benefit obligation was higher than it had been at
the end of 2015 owing, above all, to actuarial losses resulting from
lower discount rates in connection with the generally volatile situation
in the capital markets and the UK referendum. The present value of
the defined benefit obligation was calculated on the basis of the dis-
count rates shown in > TABLE 26.
The change in estimates in relation to defined benefit pension entitle-
ments resulted in a decrease of €144.5 million in equity as at
30 June 2016 (after deferred taxes). The net defined benefit obliga-
tion increased to €993.8 million (31 December 2015: €767.8 million).
In connection with the valuation of the pension plans for the
employees of the KION Group’s UK companies as at 1 January 2015,
the Company and the trustees of the pension funds agreed on cer-
tain assumptions relevant to the valuation in March 2016, according
to which the deficit for the two pension plans amounted to €11.1 mil-
lion as at 1 January 2015. On this basis, the KION Group agreed with
the trustees that it would pay approximately the equivalent of
€4.4 million in 2016 and €4.4 million in 2017 in order to reduce the
deficit. However, these payments are subject to the condition that
the annual review of the pension plans’ funding position continues to
reveal a deficit. If a payment would result in the pension plans being
overfunded, the KION Group would be exempt from its payment
obligation in that year.
In addition, collateral in rem in the form of charges on the real
estate of Group companies in the UK and flexible collateral in respect
of the rental fleets of UK dealers within a maximum overall limit of
approximately €21.6 million were extended for the benefit of the
pension funds. The term of this collateral is limited to five years
(1 July 2021), and the overall limit will not be reduced by payments
made by the KION Group.
TABLE 26Discount rate
30/06/2016 31/12/2015
Germany 1.55% 2.35%
UK 2.75% 3.75%
Other (weighted average) 0.94% 1.61%
40
KION GROUP AG | Interim report Q2 2016Moving Forward Innovation

Financial liabilities
KION GROUP AG signed a new syndicated loan agreement (senior
facilities agreement) totalling €1,500.0 million with a syndicate of
international banks on 28 October 2015. The senior facilities agree-
ment enables the KION Group to obtain finance on far more favour-
able terms than has been possible in the past. On 25 January 2016,
the Executive Board of KION GROUP AG decided to overhaul the
funding structure of the KION Group by repaying the syndicated loan
dated 23 December 2006 that took the form of a revolving credit
facility of €1,243.0 million and the KION Group corporate bond of
€450.0 million that was issued in 2013 and was due to mature in
2020. The associated repayment was made on 15 February 2016
using funds drawn down under the new senior facilities agreement.
The new senior facilities agreement comprises a revolving credit
facility of €1,150.0 million maturing in February 2021 and a fixed-term
tranche of €350.0 million maturing in February 2019 that has been
fully drawn down. Both the revolving credit facility and the fixed-term
tranche have a variable interest rate. As at 30 June 2016, an amount
of €374.3 million had been drawn down from the revolving credit
facility, which includes other loan liabilities and contingent liabilities.
The drawdowns from the revolving credit facility were classified as
short term.
Arrangement of the revolving credit facility of €1,150.0 million
resulted in directly attributable transaction costs of €3.9 million. The
transaction costs are recognised as prepaid expenses under current
financial assets and expensed over the term of the credit facility.
Arrangement of the fixed-term tranche of €350.0 million resulted in
directly attributable transaction costs of €0.8 million. The transaction
costs were deducted from the fair value of this tranche in the first
period in which they were recognised and will be amortised as an
expense in subsequent periods.
KION GROUP AG has issued guarantees to the banks for all of
the payment obligations under the new senior facilities agreement.
Unlike the previous syndicated loan and the repaid corporate bond,
the new syndicated loan agreement is not collateralised. Following
repayment of the syndicated loan from 23 December 2006, all collat-
eral furnished under the previous loan agreement has now been
released.
Among other stipulations, the contractual terms of the senior
facilities agreement require compliance with certain covenants. They
also contain a financial covenant that requires adherence to a maxi-
mum level of gearing (the ratio of financial liabilities to EBITDA).
Non-compliance with the covenants may, for example, give lenders
the right to terminate the new syndicated loan agreement. All the
covenants, including the financial covenant, were complied with as
at the reporting date.
OTHER DISCLOSURES
Information on financial instruments
The carrying amounts and fair values of financial assets and liabilities
in accordance with IFRS 7 are shown in > TABLE 27.
Whereas lease liabilities arising from sale and leaseback trans-
actions stood at €904.3 million (31 December 2015: €855.6 million),
lease receivables arising from sale and leaseback transactions
amounted to €606.4 million (31 December 2015: €592.0 million) and
leased assets under sale and leaseback transactions totalled
€325.0 million (31 December 2015: €285.9 million).
The finance lease obligations reported in other financial liabilities
comprise liabilities arising from the financing of industrial trucks for
short-term rental of €418.9 million (31 December 2015: €403.2 mil-
lion). They are mainly allocated to the Financial Services segment
and result from the intra-group financing provided by the Financial
Services segment for the short-term rental business of the Linde
Material Handling and STILL brand segments. Within other financial
liabilities, the KION Group has also recognised finance lease obliga-
tions amounting to €19.4 million (31 December 2015: €18.1 million)
arising from procurement leases, which are classified as finance
leases due to their terms and conditions.
The non-consolidated subsidiaries and other equity investments
that are shown as at 30 June 2016 in > TABLE 27 are carried at cost
less impairment losses, as observable fair values are not available
and reliable results cannot be obtained using other permitted meas-
urement techniques. At present there is no intention to sell these
financial instruments. At the end of 2015, non-consolidated subsidi-
aries and other equity investments had also included the shares,
measured at fair value, in Moden Diesel S.p.A. (formerly MODEN
DIESEL S.R.L.) and LR Intralogistik GmbH, which were fully consoli-
dated on 1 January 2016.
41NOTES TO THE CONDENSED CONSOLIDATED
INTERIM FINANCIAL STATEMENTS
Other disclosures
KION GROUP AG | Interim report Q2 2016 We keep the world moving.

TABLE 27Carrying amounts and fair values broken down by class
30/06/2016 31/12/2015
in € millionCarrying amount Fair value
Carrying amount Fair value
Financial assets
Non-consolidated subsidiaries and other investments 22.4 22.4 42.4 42.4
Loans receivable 2.1 2.1 2.7 2.7
Financial receivables 21.3 21.3 15.4 15.4
Non-current securities 0.8 0.8 0.8 0.8
Lease receivables¹ 675.2 678.3 653.7 658.4
Trade receivables 721.2 721.2 670.5 670.5
thereof gross amount due from customers for contract work² 12.1 12.1 1.5 1.5
Other financial receivables 51.6 51.6 43.0 43.0
thereof non-derivative receivables 37.5 37.5 37.7 37.7
thereof derivative financial instruments 14.0 14.0 5.3 5.3
Cash and cash equivalents 84.3 84.3 103.1 103.1
Financial liabilities
Liabilities to banks 799.7 799.7 225.9 225.9
Corporate bond – – 444.5 469.5
Other financial liabilities to non-banks 5.9 5.9 6.2 6.2
Lease liabilities¹ 904.3 908.7 855.6 860.0
Trade payables 635.6 635.6 574.6 574.6
Other financial liabilities 528.5 530.7 510.1 512.2
thereof non-derivative liabilities 44.2 44.2 58.6 58.6
thereof liabilities from finance leases¹ 456.2 458.4 439.0 441.2
thereof derivative financial instruments 28.1 28.1 12.4 12.4
1 as defined by IAS 172 as defined by IAS 11
42
KION GROUP AG | Interim report Q2 2016Moving Forward Innovation

Level 1 comprises long-term securities for which the fair value is
calculated using prices quoted in an active market.
All currency forwards are classified as Level 2. The fair value of
the currency forwards is calculated by the system using the dis-
counting method based on forward rates on the reporting date. The
default risk for the Group and for the counterparty is taken into
account on the basis of gross figures.
FAIR VALUE MEASUREMENT AND ASSIGNMENT TO
CLASSIFICATION LEVELS
The following tables show the assignment of fair values to the indi-
vidual classification levels as defined by IFRS 13 for financial instru-
ments measured at fair value. > TABLES 28–29
TABLE 28
TABLE 29
Financial instruments measured at fair value
Fair Value Hierarchy
in € million Level 1 Level 2 Level 3 30/06/2016
Financial assets 14.8
thereof non-current securities 0.8 0.8
thereof derivative instruments 14.0 14.0
Financial liabilities 28.1
thereof derivative instruments 27.6 0.5 28.1
Financial instruments measured at fair value
Fair Value Hierarchy
in € million Level 1 Level 2 Level 3 31/12/2015
Financial assets 25.7
thereof investments in non-consolidated subsidiaries and other investments 19.6 19.6
thereof non-current securities 0.8 0.8
thereof derivative instruments 5.3 5.3
Financial liabilities 12.4
thereof derivative instruments 11.9 0.6 12.4
43NOTES TO THE CONDENSED CONSOLIDATED
INTERIM FINANCIAL STATEMENTS
Other disclosures
KION GROUP AG | Interim report Q2 2016 We keep the world moving.

For the first time, the currency forwards at Level 2 included deal con-
tingent currency forwards that are used to hedge currency risk aris-
ing on the acquisition of the Dematic Group. The notional amount of
these currency forwards totalled US$ 2.5 billion. Currency forwards
with a total notional amount of US$ 2.1 billion serve to hedge the pur-
chase price obligation for the shares and are accounted for as
hedges. The fair value of the currency forwards designated as cash
flow hedging instruments was minus €9.8 million as at 30 June 2016
and was recognised in other comprehensive income (loss).
The financial liabilities allocated to Level 3 relate to a call option
of Weichai Power on 10.0 per cent of the shares in Linde Hydraulics.
The unobservable inputs that were significant to fair value measure-
ment as at the reporting date were almost unchanged compared
with the end of 2015.
At 30 June 2016, the changes in fair value and the impact on the
income statement for the first six months of the year were as follows.
> TABLE 30
In order to eliminate default risk to the greatest possible extent, the
KION Group only ever enters into derivatives with investment-grade
counterparties.
If events or changes in circumstances make it necessary to
reclassify financial instruments as a different level, they are reclassi-
fied at the end of a reporting period. No financial instruments were
transferred between Levels 1, 2 or 3 in the first six months of 2016.
TABLE 30Change in financial assets / liabilities classified as level 3
in € million Q1 – Q2 2016 Q1 – Q2 2015
Value as at 1/1/ – 0.6 31.7
Gains recognised in net financial income / expenses 0.1 2.4
Value as at 30/06/ – 0.5 34.1
Gains for the period relating to financial assets / liabilities classified as Level 3 0.1 2.4
Change in unrealised gains for the period relating to financial assets / liabilities held as at 30/06/ 0.1 2.4
44
KION GROUP AG | Interim report Q2 2016Moving Forward Innovation

Variable remuneration
KEEP EMPLOYEE SHARE OPTION PROGRAMME
As at 30 June 2016, KION Group employees held options on a total
of 52,532 no-par-value shares (31 December 2015: 53,220). The
total number of bonus shares granted therefore declined by 688 for-
feited bonus shares in the first half of 2016. A pro-rata expense of
€0.3 million for six months was recognised for bonus shares under
functional costs in the first half of 2016 (H1 2015: €0.1 million).
KION PERFORMANCE SHARE PLAN (PSP) FOR MANAGERS
In March 2016, the 2016 tranche of the long-term, variable remuner-
ation component (the KION Long-Term Incentive Plan) with a defined
period (three years) was introduced retrospectively from 1 January
for the managers in the KION Group. At the beginning of the perfor-
mance period on 1 January 2016, the managers were allocated a
total of 0.1 million virtual shares for this tranche with a specific fair
value. The allocation was based on a particular percentage of each
manager’s individual gross annual remuneration at the time of grant.
The total carrying amount for liabilities in connection with share-
based remuneration as at 30 June 2016 was €14.2 million (31 Decem-
ber 2015: €8.5 million). Of this amount, €8.3 million related to the
2014 tranche (31 December 2015: 5.7 million), €4.9 million to the
2015 tranche (31 December 2015: €2.7 million) and €1.0 million to the
2016 tranche.
KION PERFORMANCE SHARE PLAN (PSP) FOR THE
EXECUTIVE BOARD
As part of the KION GROUP AG performance share plan, the Exec-
utive Board members are allocated virtual shares over a fixed period
(three years). At the beginning of the performance period on 1 Janu-
ary 2016, the Executive Board members were allocated a total of
0.1 million virtual shares for this tranche with a specific fair value. The
shares were allocated on the basis of an allocation value in euros
specified in each Executive Board member’s service contract.
In April 2016, the first payment from the 2013 tranche was made
on the basis of the achievement of the long-term targets that were
defined in 2013 at the start of the performance period.
The total carrying amount for liabilities in connection with share-
based remuneration relating to the current tranches as at 30 June
2016 was €12.2 million (31 December 2015: €7.5 million). Of this
amount, €7.4 million related to the 2014 tranche (31 December 2015:
5.3 million), €3.9 million to the 2015 tranche (31 December 2015:
€2.2 million) and €0.8 million to the 2016 tranche.
Segment report
The Executive Board divides the KION Group into financial services
activities, the activities grouped in the Other segment and the Linde
Material Handling (LMH) and STILL brands for management pur-
poses. Segment reporting follows the same breakdown, taking into
account the relevant organisational structures and corporate strat-
egy of the KION Group. Retrotech Inc. has been included in the
Other segment under Egemin Automation since completion of the
acquisition on 1 March 2016.
The KPIs used to manage the brand segments are order intake,
revenue and adjusted EBIT. Segment reporting therefore includes a
reconciliation of externally reported consolidated earnings before
interest and tax (EBIT) – including KION acquisition items and non-
recurring items – to the adjusted EBIT for the segments (‘adjusted
EBIT’).
Earnings before tax (EBT) and return on equity (ROE) are the
KPIs used to manage the Financial Services segment. ROE is calcu-
lated on the basis of average equity employed excluding net income
(loss) for the current period. As at 30 June 2016, ROE – earnings
before tax as a percentage of average equity – was 12.8 per cent
(31 December 2015: 13.1 per cent).
The tables below show information on the KION Group’s operat-
ing segments for the second quarter of 2016 and 2015 and for the
first half of 2016 and 2015. > TABLES 31–34
45NOTES TO THE CONDENSED CONSOLIDATED
INTERIM FINANCIAL STATEMENTS
Other disclosures
KION GROUP AG | Interim report Q2 2016 We keep the world moving.

TABLE 31Segment report for Q2 2016
in € million LMH STILLFinancial Services Other
Consolidation / Reconciliation Total
Revenue from external customers 793.1 415.0 103.4 32.4 − 1,343.8
Intersegment revenue 98.6 101.0 102.7 51.7 – 353.9 −
Total revenue 891.7 515.9 206.0 84.1 – 353.9 1,343.8
Earnings before taxes 111.6 25.1 1.3 – 8.9 – 35.1 94.0
Financial income 2.5 3.2 16.8 3.3 – 11.2 14.6
Financial expenses – 6.9 – 12.0 – 14.6 – 15.4 11.5 – 37.4
= Net financial expenses / income – 4.4 – 8.8 2.1 – 12.1 0.3 – 22.8
EBIT 115.9 33.9 – 0.8 3.2 – 35.4 116.8
+ Non-recurring items 0.9 0.1 0.0 16.2 − 17.1
+ KION acquisition items 5.2 1.6 0.0 0.0 − 6.9
= Adjusted EBIT 122.1 35.6 – 0.8 19.3 – 35.4 140.8
Profit from equity-accounted investments 4.8 1.6 3.0 0.0 – 9.4
Capital expenditure¹ 20.6 10.5 0.0 5.5 − 36.6
Amortisation and depreciation² 22.5 11.1 0.0 5.9 − 39.6
Order intake 938.7 531.0 207.0 101.0 – 350.5 1,427.1
1 Capital expenditure including capitalised development costs, excluding leased and rental assets2 On intangible assets and property, plant and equipment excluding leased and rental assets
46
KION GROUP AG | Interim report Q2 2016Moving Forward Innovation

TABLE 32Segment report for Q2 2015
in € million LMH STILLFinancial Services Other
Consolidation / Reconciliation Total
Revenue from external customers 765.1 386.6 99.5 4.7 – 1,256.0
Intersegment revenue 97.8 97.5 82.6 49.5 – 327.3 –
Total revenue 862.9 484.1 182.1 54.2 – 327.3 1,256.0
Earnings before taxes 83.1 21.0 1.3 – 0.5 – 28.1 76.8
Financial income 3.3 0.3 15.8 5.8 – 12.1 13.2
Financial expenses – 7.3 – 8.9 – 14.4 – 18.0 12.7 – 35.8
= Net financial expenses / income – 4.0 – 8.5 1.5 – 12.1 0.6 – 22.6
EBIT 87.1 29.5 – 0.1 11.6 – 28.6 99.4
+ Non-recurring items 2.0 0.7 0.0 7.5 – 10.2
+ KION acquisition items 5.3 1.6 0.0 0.1 – 6.9
= Adjusted EBIT 94.3 31.7 – 0.1 19.2 – 28.6 116.4
Profit from equity-accounted investments 3.3 1.8 2.9 0.0 – 8.0
Capital expenditure¹ 15.1 13.6 0.0 3.8 – 32.4
Amortisation and depreciation² 23.1 11.6 0.0 4.3 – 39.0
Order intake 917.0 493.0 182.2 54.2 – 329.1 1,317.3
1 Capital expenditure including capitalised development costs, excluding leased and rental assets2 On intangible assets and property, plant and equipment excluding leased and rental assets
47NOTES TO THE CONDENSED CONSOLIDATED
INTERIM FINANCIAL STATEMENTS
Other disclosures
KION GROUP AG | Interim report Q2 2016 We keep the world moving.

Segment report Q1 – Q2 2016
in € million LMH STILLFinancial Services Other
Consolidation / Reconciliation Total
Revenue from external customers 1,524.3 787.7 196.3 56.2 − 2,564.5
Intersegment revenue 182.3 203.3 172.3 100.7 – 658.5 −
Total revenue 1,706.6 990.9 368.5 157.0 – 658.5 2,564.5
Earnings before taxes 189.6 42.2 2.6 – 54.5 – 37.5 142.5
Financial income 5.3 6.4 33.3 11.2 – 22.6 33.5
Financial expenses – 13.5 – 23.0 – 28.7 – 54.7 23.2 – 96.8
= Net financial expenses / income – 8.3 – 16.7 4.6 – 43.5 0.6 – 63.3
EBIT 197.8 58.9 – 2.0 – 11.0 – 38.1 205.8
+ Non-recurring items 1.2 1.5 0.0 17.3 − 20.0
+ KION acquisition items 10.4 3.2 0.0 0.0 − 13.6
= Adjusted EBIT 209.5 63.6 – 2.0 6.3 – 38.1 239.4
Segment assets 5,252.1 2,394.4 1,689.3 744.7 – 3,351.5 6,729.1
Segment liabilities 1,919.0 1,551.6 1,645.5 3,293.6 – 3,371.1 5,038.7
Carrying amount of equity-accounted investments 51.2 4.2 21.7 0.0 – 77.1
Profit from equity-accounted investments 5.0 1.6 3.0 0.0 – 9.6
Capital expenditure¹ 34.7 21.8 0.0 7.9 − 64.3
Amortisation and depreciation² 44.9 22.1 0.0 10.9 − 77.9
Order intake 1,782.1 1,038.1 369.5 189.2 – 655.1 2,723.8
Number of employees³ 14,590 8,090 64 1,060 − 23,804
1 Capital expenditure including capitalised development costs, excluding leased and rental assets2 On intangible assets and property, plant and equipment excluding leased and rental assets3 Number of employees (full-time equivalents) as at 30/06/2016; allocation according to the contractual relationships
TABLE 33
48
KION GROUP AG | Interim report Q2 2016Moving Forward Innovation

Segment report Q1 – Q2 2015
in € million LMH STILLFinancial Services Other
Consolidation / Reconciliation Total
Revenue from external customers 1,475.2 752.1 184.5 8.9 − 2,420.8
Intersegment revenue 175.0 193.5 144.9 99.5 – 612.9 –
Total revenue 1,650.3 945.6 329.4 108.4 – 612.9 2,420.8
Earnings before taxes 150.5 35.5 2.7 – 29.9 – 20.7 138.2
Financial income 6.7 0.6 31.5 11.0 – 24.2 25.6
Financial expenses – 13.8 – 17.2 – 28.6 – 34.1 24.9 – 68.8
= Net financial expenses / income – 7.2 – 16.6 2.9 – 23.1 0.7 – 43.3
EBIT 157.7 52.1 – 0.2 – 6.8 – 21.4 181.5
+ Non-recurring items 3.9 0.6 0.0 19.1 – 9.0 14.6
+ KION acquisition items 10.5 3.1 0.0 0.1 – 13.7
= Adjusted EBIT 172.1 55.9 – 0.2 12.4 – 30.3 209.8
Segment assets 5,156.3 2,242.0 1,466.3 543.7 – 2,969.4 6,438.9
Segment liabilities 1,776.7 1,388.7 1,422.8 3,085.3 – 2,987.8 4,685.7
Carrying amount of equity-accounted investments 49.7 4.2 19.5 0.0 – 73.4
Profit from equity-accounted investments 1.7 1.8 2.9 0.0 – 6.4
Capital expenditure¹ 29.1 23.1 0.0 7.6 − 59.8
Amortisation and depreciation² 46.1 23.0 0.0 8.5 − 77.6
Order intake 1,760.9 992.6 334.4 108.4 – 631.1 2,565.2
Number of employees³ 14,385 7,990 60 528 − 22,963
1 Capital expenditure including capitalised development costs, excluding leased and rental assets2 On intangible assets and property, plant and equipment excluding leased and rental assets3 Number of employees (full-time equivalents) as at 30/06/2015; allocation according to the contractual relationships
TABLE 34
49NOTES TO THE CONDENSED CONSOLIDATED
INTERIM FINANCIAL STATEMENTS
Other disclosures
KION GROUP AG | Interim report Q2 2016 We keep the world moving.

The non-recurring items mainly comprise consultancy costs –
primarily relating to the planned Dematic acquisition – and expenses
in connection with severance payments. In addition, write-downs
and other expenses in relation to hidden reserves / liabilities identified
in the process of acquiring equity investments are eliminated.
Non-recurring items resulted in an overall net expense of €20.0 mil-
lion in the first six months of 2016 (H1 2015: €14.6 million).
The KION acquisition items relate to the acquisition of the KION
Group, which was formed at the end of 2006 when it was spun off
from Linde AG, Munich. These items comprise net write-downs and
other expenses in relation to the hidden reserves identified as part of
the purchase price allocation.
Related party disclosures
In addition to the subsidiaries included in the condensed consoli-
dated interim financial statements, the KION Group has direct or
indirect business relationships with a number of non-consolidated
subsidiaries, joint ventures and associates in the course of its ordi-
nary business activities. According to IAS 24, related parties include
entities that have control or significant influence over KION GROUP
AG. An entity is usually assumed to have control (parent) if it holds
more than 50 per cent of the shares in another entity. Significant
influence generally exists if an entity holds between 20 per cent and
50 per cent of the shares in another entity.
The related parties that are solely or jointly controlled by the
KION Group or over which significant influence can be exercised are
included in the list of shareholdings as at 31 December 2015. Another
related party is Weichai Power Co. Ltd., Weifang, China, which indi-
rectly holds a 38.3 per cent stake in KION GROUP AG and is thus the
largest single shareholder.
The revenue generated by the KION Group in the first half of
2016 and second quarter of 2016 from selling goods and services to
related parties is shown in > TABLE 35 along with the receivables that
were outstanding at the reporting date. The receivables include a
loan that the KION Group has granted to Linde Hydraulics GmbH &
Co. KG, Aschaffenburg. The total commitment is €5.3 million, of
which €3.0 million had been disbursed up to 30 June 2016. The loan
has a variable interest rate. No valuation allowances for receivables
from related parties had been recognised as at the reporting date, a
situation that was unchanged on 31 December 2015.
The goods and services obtained from related parties in the first
half of 2016 and second quarter of 2016 are shown in > TABLE 36
along with the liabilities that were outstanding at the reporting date.
50
KION GROUP AG | Interim report Q2 2016Moving Forward Innovation

TABLE 35
TABLE 36
Related party disclosures: receivables and sales
Receivables Sales of goods and services
in € million 30/06/2016 31/12/2015 Q2 2016 Q2 2015 Q1 – Q2 2016 Q1 – Q2 2015
Non-consolidated subsidiaries 18.9 24.9 6.3 2.9 11.4 4.9
Equity-accounted associates 29.2 19.3 43.4 30.1 84.7 63.3
Equity-accounted joint ventures 5.4 1.3 15.1 11.1 25.6 20.3
Other related parties* 4.1 4.3 3.3 2.3 6.5 6.5
Total 57.5 49.8 68.0 46.4 128.2 94.9
* ‘Other related parties’ include, among others, transactions with Weichai and its affiliated companies
Related party disclosures: liabilities and purchases
Liabilities Purchases of goods and services
in € million 30/06/2016 31/12/2015 Q2 2016 Q2 2015 Q1 – Q2 2016 Q1 – Q2 2015
Non-consolidated subsidiaries 12.1 13.6 8.9 2.4 16.9 4.5
Equity-accounted associates 13.8 8.2 31.1 30.0 62.2 61.2
Equity-accounted joint ventures 55.6 53.7 20.4 8.0 38.4 16.5
Other related parties* 1.6 0.2 5.1 0.1 8.6 1.0
Total 83.1 75.7 65.6 40.5 126.1 83.2
* ‘Other related parties’ include, among others, transactions with Weichai and its affiliated companies
51NOTES TO THE CONDENSED CONSOLIDATED
INTERIM FINANCIAL STATEMENTS
Other disclosures
KION GROUP AG | Interim report Q2 2016 We keep the world moving.
Material events after the reporting date
With the consent of the Supervisory Board, the Executive Board of
KION GROUP AG decided on 18 July 2016 to fully utilise the author-
ised capital that has existed since the 2014 Annual General Meeting.
The Company’s share capital was increased by 10.0 per cent in
return for cash contributions; shareholders’ pre-emption rights were
excluded. The share capital rose from €98.9 million to €108.79 mil-
lion as a result of issuing 9.89 million new no-par-value bearer shares
that are dividend-bearing from the 2016 financial year. The new
shares were successfully issued at a price of €46.44. The gross pro-
ceeds from the capital increase amounted to €459.3 million. This
capital increase is to be used to partly fund the acquisition of
Dematic. The capital increase was entered in the commercial regis-
ter on 20 July 2016.
Weichai Power Co., Ltd., Weifang, China, acquired 60.0 per cent
of the new shares issued as part of the capital increase at a price per
share that was determined in an accelerated bookbuilding process.
This increased Weichai Power’s shareholding from 38.3 per cent to
40.2 per cent. The remaining new shares were offered to institutional
investors as part of this process and are now in free float. The pro-
portion of shares in free float fell from 61.5 per cent to 59.6 per cent.
The KION GROUP continues to hold 0.2 per cent of the shares.
Wiesbaden, 26 July 2016
The Executive Board
Gordon Riske Dr Eike Böhm
Ching Pong Quek Dr Thomas Toepfer
52
KION GROUP AG | Interim report Q2 2016Moving Forward Innovation

Review report
To the KION GROUP AG, Wiesbaden
We have reviewed the condensed interim consolidated financial
statements of the KION GROUP AG, Wiesbaden, comprising the
consolidated income statement, consolidated statement of compre-
hensive income, consolidated statement of financial position, consoli-
dated statement of cash flows, consolidated statement of changes in
equity and selected explanatory notes, together with the interim
group management report of the KION GROUP AG, Wiesbaden, for
the period from 1 January to 30 June 2016, that are part of the semi
annual financial report pursuant to § 37w paragraph 2 WpHG (Wert-
papierhandelsgesetz: German Securities Trading Act). The prepara-
tion of the condensed interim consolidated financial statements in
accordance with those IFRSs applicable to interim financial reporting
as adopted by the EU, and of the interim group management report
in accordance with the requirements of the WpHG applicable to
interim group management reports, is the responsibility of the com-
pany’s management. Our responsibility is to issue a report on the
condensed interim consolidated financial statements and on the
interim group management report based on our review.
We conducted our review of the condensed interim consoli-
dated financial statements and of the interim group management
report in accordance with the German generally accepted stand-
ards for the review of financial statements promulgated by the Institut
der Wirtschaftsprüfer (IDW). Those standards require that we plan
and perform the review such that we can preclude through critical
evaluation, with a certain level of assurance, that the condensed
interim consolidated financial statements have not been prepared,
in material respects, in accordance with those IFRSs applicable to
interim financial reporting as adopted by the EU, or that the interim
group management report has not been prepared, in material
respects, in accordance with the requirements of the WpHG appli-
cable to interim group management reports. A review is limited pri-
marily to inquiries of company employees and analytical assess-
ments and therefore does not provide the assurance attainable in a
financial statement audit. Since, in accordance with our engage-
ment, we have not performed a financial statement audit, we can-
not issue an auditor’s report.
Based on our review no matters have come to our attention that
cause us to presume that the condensed interim consolidated finan-
cial statements of the KION GROUP AG, Wiesbaden, have not been
prepared, in material respects, in accordance with those IFRSs
applicable to interim financial reporting as adopted by the EU, or that
the interim group management report has not been prepared, in
material respects, in accordance with the requirements of the WpHG
applicable to interim group management reports.
Frankfurt am Main, 26 July 2016
Deloitte GmbH
Wirtschaftsprüfungsgesellschaft
(Crampton) (Gräbner-Vogel)
Wirtschaftsprüfer Wirtschaftsprüferin
(German Public Auditor) (German Public Auditor)
53
KION GROUP AG | Interim report for Q2 2016 We keep the world moving.
ADDITIONAL INFORMATION
Review Report

Responsibility statement
To the best of our knowledge, and in accordance with the applicable
reporting principles for interim financial reporting, the condensed
consolidated interim financial statements give a true and fair view of
the financial position and financial performance of the Group, and
the interim group management report includes a fair review of the
development and performance of the business and the position of
the Group, together with a description of the principal opportunities
and risks associated with the expected development of the Group
for the remaining months of the financial year.
Wiesbaden, 26 July 2016
The Executive Board
Gordon Riske Dr. Eike Böhm
Ching Pong Quek Dr. Thomas Toepfer
54
KION GROUP AG | Interim report for Q2 2016Moving Forward Innovation

Quarterly information
TABLE 37Quarterly information
in € million Q2 2016 Q1 2016 Q4 2015 Q3 2015 Q2 2015 Q1 2015
Order intake 1,427.1 1,296.7 1,397.1 1,253.3 1,317.3 1,247.9
Revenue 1,343.8 1,220.6 1,440.7 1,236.5 1,256.0 1,164.8
EBIT 116.8 89.0 132.6 108.8 99.4 82.1
Adjusted EBIT 140.8 98.6 151.8 121.2 116.4 93.4
Adjusted EBIT margin 10.5% 8.1% 10.5% 9.8% 9.3% 8.0%
Adjusted EBITDA 238.2 191.7 250.0 212.0 206.6 181.4
Adjusted EBITDA margin 17.7% 15.7% 17.4% 17.1% 16.4% 15.6%
55
KION GROUP AG | Interim report for Q2 2016 We keep the world moving.
ADDITIONAL INFORMATION
Responsibility statementQuarterly information
DISCLAIMER
Forward-looking statementsThis interim report contains forward-looking statements that relate to the current plans, objectives, forecasts and estimates of the management of KION GROUP AG. These statements only take into account information that was available up to and including the date that this interim report was prepared. The management of KION GROUP AG makes no guarantee that these for-ward-looking statements will prove to be right. The future development of KION GROUP AG and its subsidiaries and the results that are actually achieved are subject to a variety of risks and uncertainties which could cause actual events or results to differ significantly from those reflected in the forward-looking statements. Many of these factors are beyond the control of KION GROUP AG and its subsidiaries and therefore cannot be precisely predicted. Such factors include, but are not limited to, changes in economic conditions and the competitive situation, changes in the law, interest rate or exchange rate fluctuations, legal disputes and investigations, and the availability of funds. These and other risks and uncertainties are set forth in the 2015 group man-agement report and in this interim group management report. However, other factors could also have an adverse effect on our business performance and results. KION GROUP AG neither intends to nor assumes any separate obligation to update forward-looking statements or to change these to reflect events or developments that occur after the publication of this interim report.
RoundingCertain numbers in this interim report have been rounded to the nearest whole number. There may therefore be discrepancies between the actual totals of the individual amounts in the tables and the totals shown as well as between the numbers in the tables and the numbers given in the corresponding analyses in the text of the interim report. All percentage changes and key figures were calculated using the underlying data in thousands of euros (€ thousand).
56
KION GROUP AG | Interim report for Q2 2016Moving Forward Innovation

kiongroup.com/ ir
FINANCIAL CALENDAR
27 October 2016
Interim report for the period ended
30 September 2016
Conference call for analysts
2 March 2017
Financial statements press conference
Publication of 2016 annual report
Conference call for analysts
27 April 2017
Interim report for the period ended
31 March 2017
Conference call for analysts
Subject to change without notice
Securities identification numbers
ISIN: DE000KGX8881
WKN: KGX888
CONTACT INFORMATION
Contacts for the media
Michael Hauger
Head of Corporate Communications
Phone: +49 611 770 655
Frank Brandmaier
Head of Corporate Media Relations
Phone: +49 611 770 752
Contacts for investors
Frank W. Herzog
Head of Corporate Finance
Phone: +49 611 770 303
Dr Karoline Jung-Senssfelder
Head of Investor Relations and M&A
Phone: +49 611 770 450
KION GROUP AG
Abraham-Lincoln-Strasse 21
65189 Wiesbaden | Germany
Phone: +49 611 770 0
Fax: +49 611 770 269
www.kiongroup.com
This interim report is available in German
and English at kiongroup.com under
Investor Relations / Financial Reports.
Only the content of the German version
is authoritative.
57
KION GROUP AG | Interim report for Q2 2016 We keep the world moving.
ADDITIONAL INFORMATION
DisclaimerFinancial calendar / Contact information

KION GROUP AG
Corporate Communications
Abraham-Lincoln-Strasse 21
65189 Wiesbaden | Germany
Phone: +49 611 770 0
Fax: +49 611 770 269
www.kiongroup.com
Related Documents