Interim Report January-September 2013 CEO Börje Ekholm

Welcome message from author
This document is posted to help you gain knowledge. Please leave a comment to let me know what you think about it! Share it to your friends and learn new things together.
Transcript

Interim Report January-September 2013 CEO Börje Ekholm

Third quarter highlights
> Net asset value increased by SEK 18.2 bn. – Corresponds to +10 percent including
reinvested dividend
> Refinancing of Mölnlycke Health Care completed
> Divestiture of Gambro closed
2

Core Investments
Listed > Acquired shares in ABB
Subsidiaries > Refinancing of Mölnlycke Health Care completed
– We contributed EUR 544 m., of which EUR 225 m. related to mezzanine debt
> Continuous improvement actions in Aleris to build for the future
> Strong organic growth in Permobil
Third quarter highlights

Financial Investments
> Cash flow of SEK 267 m. from IGC and SEK 1.8 bn. from EQT
> Stable performance in Lindorff, initiatives to improve operating efficiency continued
> 3 Scandinavia’s service revenue broadly unchanged. SEK 200 m. to the owners, SEK 80 m. to Investor
> Divestiture of Gambro closed, SEK 10.2 bn. in proceeds to Investor, of which SEK 1.2 bn. in escrow
Third quarter highlights

Financials CFO Susanne Ekblom

Financial highlights
> Net Asset Value SEK 200.9 bn. (174.7) > Injected SEK 2.8 bn. in Mölnlycke Health Care > Divestiture of Gambro completed > Leverage 9.8% (11.5%)
> TSR Investor B-share 19% > SIXRX Index 20%
January-September 2013
6

Net Asset Value 1993- Q3 2013
SEK bn.
200.9
2013, SEK 200.9 bn. Contribution Jan-Sep SEK 26.2 bn Contribution Q3 SEK 18.2 bn
7
0
50
100
150
200
93 94 95 96 97 98 99 00 01 02 03 04 05 06 07 08 09 10 11 12 13

Net Asset Value
(SEK m.) Sep 30, 2013 Dec 31, 2012
Core Investments 190 614 162 747
Financial Investments 30 811 35 144
Other assets & liabilities 1 363 -428
Total assets 222 788 197 463
Net debt -21 928 -22 765
Net asset value 200 860 174 698
8
September 30, 2013 vs. December 31, 2012

Contribution to Net Asset Value Q3 2013 vs. 2012
9
(SEK m.) Q3 2013 YTD 2013 YTD 2012
Core Investments 13 756 25 942 11 993
Financial Investments 4 610 6 442 471
Business Areas 18 366 32 384 12 464
Group-wide -205 -891 -595
Dividend - -5 331 -4 563
Contribution to NAV 18 161 26 162 7 306

Core Investments Net Asset Value September 30, 2013
SEK 3 427 m.
Divested Q3 2013
Invested Q3 2013
SEK 0 m.
10
SEK 190.6 bn. 86% of total assets
of which Subsidiaries SEK 28.7 bn.
SEK 38.7 bn.
SEK 28.2 bn.
SEK 31.0 bn.
SEK 17.2 bn.
SEK 19.8 bn.
SEK 14.5 bn.
SEK 8.0 bn.
SEK 4.2 bn.
SEK 4.0 bn. SEK 4.0 bn.
SEK 4.0 bn.
SEK 6.9 bn.
SEK 1.2 bn.
SEK 5.0 bn.
Mölnlycke 2 767 ABB 660
SEK 3.7 bn.

-75
-62
-61
17
143
257
381
885
1 044
2 337
2 980
3 208
3 821
4 070
7 107
Core Investments Contribution to Net Asset Value, January-September, 2013
11
SEK m.
SEK 26 052 m.

0%
6%
12%
18%
24%
30%
36%
0
200
400
600
800
1 000
1 200
1 400
1 600
1 800
Net sales (rolling 4Q) EBITDA margin (rolling 4Q)
EBITDA margin Net sales EUR m. EBITDA margin Net sales EUR m.
Mölnlycke Health Care - Subsidiary
> Q3 sales growth +6% in constant currency > Continued but slower growth in the U.S.,
strong growth in APAC, improved growth in EMEA
> Stable quarter for Surgical > Continued good growth within Wound Care > Good EBITDA growth, margin +2 p.p. to
31 percent > Refinancing completed, net gearing 2.4x
12-month rolling EBITDA
12
SEK m.
Invested up to Dec. 31 2012 13 182
Accumulated effect on value up to 2013 2 876
Invested/Divested in 2013 2 771
Effect on value in 2013 1 002
Closing balance 19 831
Q3 2013 EUR m.
YTD 2013
EUR m. Q3 2012 EUR m.
YTD 2012
EUR m.
Net Sales 284 853 279 825
EBITDA 87 247 81 232
EBITDA % 31 29 29 28
Operating Cash Flow 75 171 80 176
Increase(-)/ decrease (+) in net debt
536 561 38 32
EUR m. 9/30 2013
12/31 2012
Net debt 822 1 383
Net Sales
EBITDA margin

0%
3%
6%
9%
12%
15%
0
1 000
2 000
3 000
4 000
5 000
6 000
7 000
Net sales (rolling 4Q) EBITDA margin (rolling 4Q)
Net sales SEK m.
Q3 2013 SEK m.
YTD 2013
SEK m. Q3 2012 SEK m.
YTD 2012
SEK m.
Net Sales 1 645 5 168 1 569 4 953
EBITDA 79 269 38 272
EBITDA % 5 5 2 5
Operating Cash Flow -25 49 -95 119
Increase(-)/ decrease (+) in net debt
13 191 -98 127
SEK m. 9/30 2013
12/31 2012
Net debt 1 970 2 161
Aleris – Subsidiary
> Q3 organic sales growth +6% in constant currency
> EBITDA improved, margin increased to 5% > Reorganization of operations to simplify
structure, improve performance and efficiency
> Solid performance in Norway > Continued improvement in Denmark,
although still challenging > Challenges remain in parts of the Swedish
operations, actions taken
13
SEK m.
Invested up to Dec. 31, 2012 4 341
Accumulated effect on value up to 2012 -411
Invested/Divested in 2013 86
Effect on value in 2013 -59
Closing balance 3 957
Net Sales
EBITDA margin
EBITDA margin

Q3 2013 SEK m.
YTD 2013
SEK m. Q3 2012 SEK m.
YTD 2012
SEK m.
Net Sales 450 1 270 392 1 149
EBITDA 68 178 74 227
EBITDA % 15 14 19 20
Operating Cash Flow 74 84 58 186
Increase(-)/ decrease (+) in net debt
130 121 34 41
SEK m. 9/30 2013
12/31 2012
Net debt 1 161 1 282
Permobil – Subsidiary
> Q3 organic sales growth +15 percent in constant currency
> Strong growth, driven by the U.S., Europe outside Scandinavia more challenging
> Adjusted EBITDA SEK 92 m., margin 20 percent, better than last year
14
SEK m.
Invested/Divested in 2013 3 700
Effect on value in 2013 18
Closing balance 3 718

Q3 2013 SEK m.
YTD 2013
SEK m.
Q3 20121)
SEK m.
YTD 20121)
SEK m.
Net Sales 32 86 32 86
EBITDA 21 48 19 43
EBITDA % 66 56 59 50
Q3 2013 SEK m.
YTD 2013
SEK m.
Q3 20121)
SEK m.
YTD 20121)
SEK m.
Net Sales 131 317 95 271
EBITDA 3 -12 1 -2
EBITDA % 2 -4 1 -1
Grand Hôtel and Vectura - Subsidiary
Grand Hôtel > Q3 organic sales growth +11 percent > Profitability improved but still
unsatisfactory > Hotel revenues increased from last
year > Acquired Lydmar operations
developed well > Pia Djupmark appointed new CEO
Vectura > Q3 sales flat > EBITDA improved > Näckström Fastigheter’s first project
completed, Aleris started operations
15
SEK m. – Grand Hôtel and Vectura
Investor’s ownership (capital), % 100
Reported value, Investor’s share, SEK m. 1 242
Net debt, SEK m. 986
1) Proforma

Financial Investments
SEK 11 102 m.
SEK 10 305 m.
SEK 4 759 m.
SEK 2 474 m.
16
Net Asset Value September 30, 2013
SEK 30 811 m. 14% of total assets
Other partner-owned investments SEK 193 m.
Other financial investments SEK 1 978 m.
2 190 1 955
415 126
1 517 3 399
798 137
SEK 544 m.
Proceeds Q3 2013
Invested Q3 2013
SEK -10 129 m.
EQT 543 Other 1
Gambro -7 442 EQT -2 339 IGC -267 3 -80 Other -1

EQT
Q3 2013 SEK m.
YTD 2013 SEK m.
YTD 2012 SEK m.
NAV beginning of period 11 816 10 984 13 214
Contribution to NAV 285 1 145 16
Draw downs 543 1 308 1 194
Proceeds to Investor -2 339 -3 132 -3 157
NAV end of period 10 305 10 305 11 267
Change in Net Asset Value September 30, 2013
MV Asset SEK m. % of total assets
Total 10 305 5
17
> 4 percent value increase in constant currencies third quarter 2013
> EQT IV distributed the funds from the sale of Gambro
> Investor's total outstanding commitment SEK 6.4 bn. (5.5)

Investor Growth Capital
Q3 2013 SEK m.
YTD 2013 SEK m.
YTD 2012 SEK m.
NAV beginning of period 10 772 10 727 10 188
Contribution to NAV 597 1 005 379
Capital Contribution - - 750
Distribution to Investor -267 -630 -526
NAV end of period 11 102 11 102 10 791
Change in Net Asset Value September 30, 2013
MV Asset SEK m. % of total assets
Total 11 102 5
Of which net cash 2 584
18
> 10 percent value change in constant currencies third quarter 2013
> Investor received a distribution of SEK 267 m. from IGC
> U.S., Asia and Europe represented 75, 15 and 10 percent of the total value, excluding net cash

0%
5%
10%
15%
20%
25%
30%
35%
40%
45%
0
50
100
150
200
250
300
350
400
450
Net sales (rolling 4Q) EBITdA margin (rolling 4Q)
EBITdA margin Net sales EUR m.
Q3 2013 EUR m.
YTD 2013
EUR m. Q3 2012 EUR m.
YTD 2012
EUR m.
Net Sales 101 307 103 281
EBITdA 41 106 44 88
EBITdA % 41 35 43 31
EUR m. Q3 2013 Q4 2012
Net debt 770 764
Lindorff – Partner-owned
> Q3 sales growth + 1 percent in constant currency
> EBITDA slightly lower > Growth in both third party collection and
own portfolios > Growing pipeline going into the fourth
quarter > Initiatives to improve operational
efficiency continued
19
Uppdaterad 18/4
SEK m.
Invested up to Dec. 31, 2012 3 969
Accumulated effect on value up to 2013 515
Effect on value in 2013 275
Closing balance 4 759
Net Sales
EBITdA
Note: Income statement and balance sheet items are reported with one month’s delay.

0
50
100
150
200
250
300
350
400
450
500
0250 000500 000750 000
1 000 0001 250 0001 500 0001 750 0002 000 0002 250 0002 500 0002 750 0003 000 000
Subscribers ARPU (SEK)
ARPU (SEK) Subscribers
Q3 2013 SEK m.
YTD 2013
SEK m. Q3 2012 SEK m.
YTD 2012
SEK m.
Net Sales 2 228 6 889 2 113 6 880
EBITDA 568 1 539 651 1 742
EBITDA % 25 22 31 25
SEK m. Q3 2013 Q4 2012
Net debt 9 612 9 652
3 Scandinavia – Partner-owned
> Q3 sales growth +5 percent, service revenue broadly flat
> Underlying EBITDA roughly unchanged > +60,000 subscribers > SEK 200 m. distributed end of September,
SEK 80 m. to Investor
20
SEK m.
Invested/Divested up to Dec. 31, 2012* 6 286
Accumulated effect on value up to 2013 -3 919
Invested/Divested in 2013 -80
Effect on value in 2013 187
Closing balance 2 474
* In addition Investor AB, has provided loan guarantees to 3 totaling SEK 4.2 bn. plus interest
Subscribers
ARPU
Note: Income statement and balance sheet items are reported with one month’s delay.

Platform to generate cash flow
Core Investments Listed
Dividend/redemptions
Core Investments Subsidiaries
Cash flow
Financial Investments Distribution from EQT, IGC & partner-owned investments
Cash flow from assets
- Management costs
Investment and distribution capacity
Exit proceeds from partner-owned investments
21

Q & A


Our Wound Care division provides health care professionals and patients with solutions that prevent, protect, and heal wounds. Dressings Negative pressure Electro-stimulation Compression Dermatology

Our Surgical division provides products and services to health care professionals in the O.R. that improve safety, efficiency and clinical outcome
Gloves Staff clothing Drapes Procedure trays Antiseptics Warming blankets
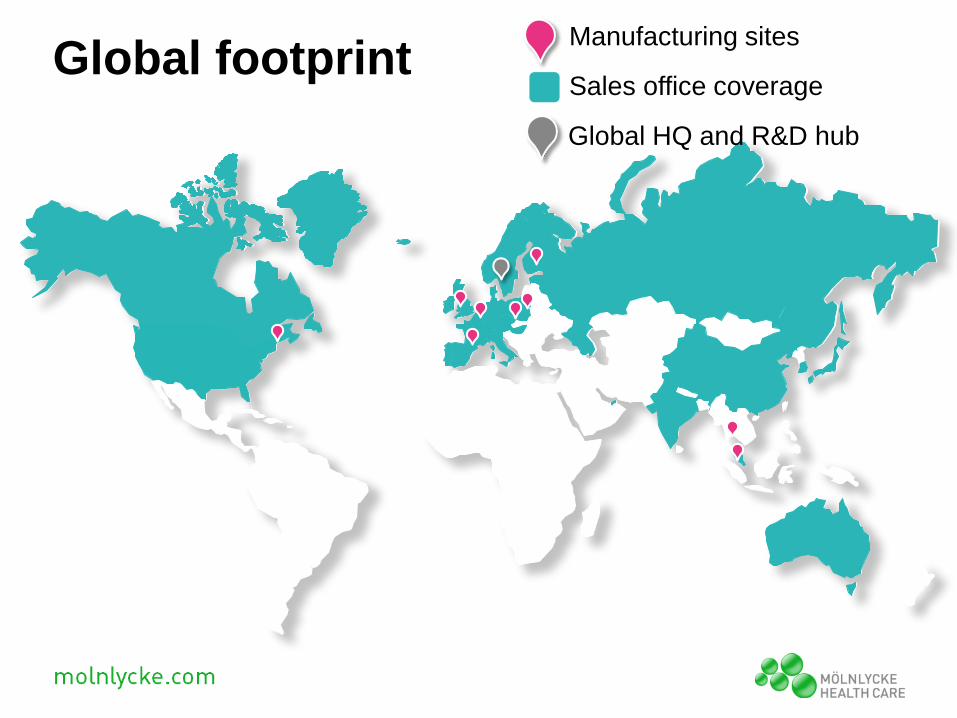
Global footprint Manufacturing sites
Sales office coverage
Global HQ and R&D hub

Adapting and evolving Key events in our history
2010
2007 Acquired by
Investor AB and Morgan Stanley
Principal Investments
(MSPI)
2010 Investor AB
acquires MSPI’s stake in
Mölnlycke and becomes a 96%
owner (now 98%)
1990 1995 2000 2005
2005 Acquired by
Apax Partners and merged with Regent Medical
and Medlock Medical
2001 Acquires BARRIER®, the single-use surgical product line, from Johnson & Johnson
2008 – 2010 (Acquisitions)
• Rynel (2010): Wound Care
• JKT (2009): Surgical
• Pharmaset (2008): Surgical
2012 (Acquisitions)
• Assets of Brennen Medical (Burn and Wound Care)
• Electrical Stimulation Technology (WoundEL®)
1990 Mepitel®
Launch of first wound treatment
product with Safetac®
technology
1999 ProcedurePak®
Begin selling custom
procedure trays; launch of hospital
efficiency product concept
2007 Mepilex® Ag Launch of the
first silver wound dressing with
Safetac® technology
2010 Avance® Launch of negative
pressure wound therapy
2012
1999 Mepilex®
Launch of the Mepilex® family
of wound dressings with
Safetac® technology
2012 BARRIER®
EasyWarm® Launch of active
self-warming blanket

Healthcare sector continues to evolve
Ageing populations Budget constraints
HC worker shortages
Increase in chronic and multiple diseases
Increasing expectations of citizens
Increase in e-solutions
Increased demand for medical technologies and services
Declining power of healthcare professionals
Increasing role of purchasing and paying institutions
Shift towards community and home care
Shift from public to private funding
Increased focus on prevention

Strategic focus areas Perpetuating a virtuous circle
Develop Superior Products
Shorten treatment / recovery times
Drive innovation to fulfil customer needs
Therapy and prevention focus
World-class innovation Deliver savings to care providers supported by
health economics
Increase Operating Room (OR) and hospital efficiency
Improve standard of care
Sustainable Expansion
Focus on high value market segments
Asia-Pacific, with focus on China and India
Sustained growth opportunities in North and Latin America
Investing in people and culture
Proud, motivated workforce improves customer value proposition
Culture of leadership and innovation

Strategic achievements
Successful expansion into high growth markets outside of Europe; global diversification
Solidifying undisputed #1 position in European surgical market
Bringing new, innovative products to market
Moving to #1 player in Advanced Wound Care
Completed refinancing

R&D expenditure / sales
Strong, organic, innovative growth
0,0%
1,0%
2,0%
3,0%
2008 2009 2010 2011 20120%
20%
40%
60%
80%
100%
2008 2009 2010 2011 2012
Sales of new products
Legacy products
New products, line extentions and upgrades
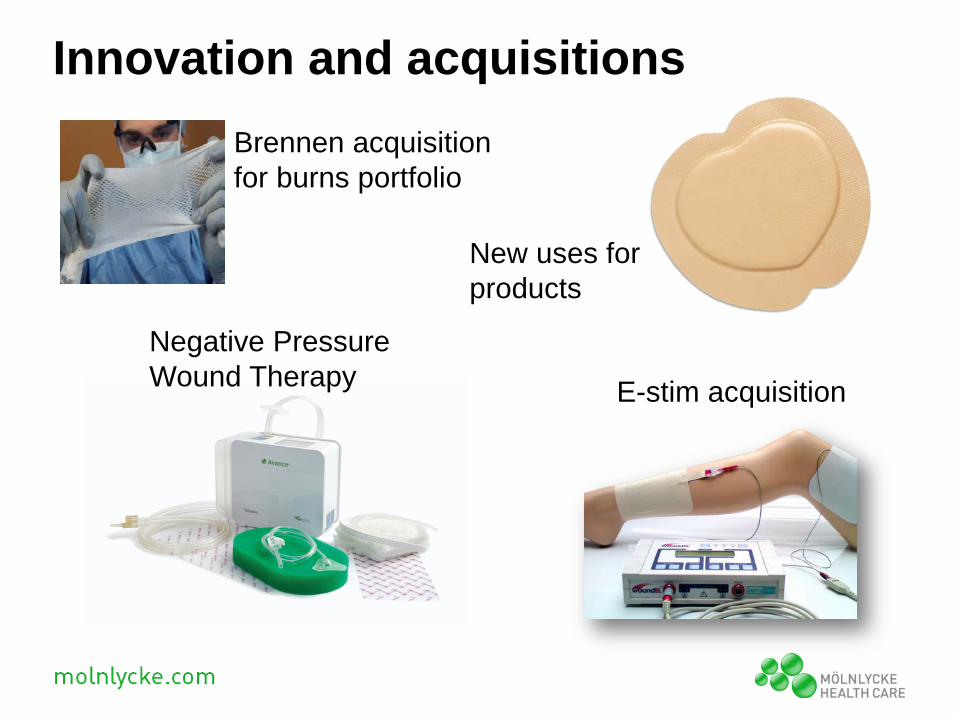
Innovation and acquisitions Brennen acquisition for burns portfolio
Negative Pressure Wound Therapy E-stim acquisition
New uses for products

Leading player across key segments(1)
21%
6% 0,30%
37%
23% 26% 29%
7%
21%
20%
87% 14%
13%
22% 21%
20%
16%
13%
7%
14%
8%
21% 20%
16%
42%
61%
5%
35%
56%
31% 30%
57%
0%
25%
50%
75%
100%
AdvancedWound Care
Conventional NPWT Drapes Trays Gloves Gowns Antiseptics
Wound Care Surgical
Our position #1 #7 #3 #1 #1 #1 #1 #7
Largest competitor S&N Hartmann KCI Medline Medline Cardinal Medline Carefusion
2nd largest competitor Convatec Covidien S&N 3M Alcom Ansell Hartmann Hartmann
1. Market share data is 2013E Globally apart from Conventional, Drapes, Trays, Gloves, Gowns, and Antiseptics which is 2011 market data. Market share data for Drapes, Trays and Gowns is Europe only. Conventional: market is limited to the segments that are relevant to Mölnlycke, i.e. Compression, Island Dressings, Fixation, Swabs and Wipes. Drapes: includes drapes sold as part of ProcedurePak®.

Top-line growth
Proven financial performance
0
200
400
600
800
1000
1200
2009 2010 2011 20120
50
100
150
200
250
300
350
2009 2010 2011 2012
EBITDA growth EUR m EUR m
Surgical
Wound Care
CAGR CAGR
Surgical
Wound Care
10,7%
3,5%
6,6%
13,7%
-1,4%
8,4%

Proven financial performance
Strong cash conversion (1)
0%
25%
50%
75%
100%
2009 2010 2011 2012
1. Cash conversion is defined as a % of EBITDA. Cash is calculated as EBITDA less movements in three elements of working capital (accounts receivable, inventory and accounts payable) less capital expenditures.
Reduction in net debt
0
4
8
12
0
500
1 000
1 500
2 000
2008 2009 2010 2011 2012 2013 1-9
Leverage (x) Net debt (EUR)
Net debt Leverage (x)

Wound Care Division
0
100
200
300
400
500
600
2009 2010 2011 2012
EUR m
Conventional Advanced Wound Care NPWT & E-stim
Sales
ADVANCED WOUND CARE CONVENTIONAL NPWT & E-stim
CAGR
0%
25%
50%
75%
100%
2007 2012
EMEA Americas Asia Pacific
Geographical split
12,7%
2,9%

A journey towards market leadership US wound care
10%
15%
20%
25%
30%
20
40
60
80
100
120
140
160
2007 2008 2009 2010 2011 2012
Market share Total sales (USD)
CAGR 31%
19%
26%
44%
30%
32%
21%
Sales (USD) Market share (%)

Surgical Division
0
100
200
300
400
500
600
2009 2010 2011 2012
EUR m
Trays Gloves Drapes
Sales
Antiseptics Clothing
GLOVES ANTISEPTICS DRAPES TRAYS CLOTHING
CAGR
0%
25%
50%
75%
100%
2007 2012
EMEA Americas Asia Pacific
Geographical split
4,7%
-1,8%
2,7%
10,1%
2,3%

Group profit & loss Q3 2013 vs Q3 2012
EUR million Q3 2013 Q3 2012 Reported growth
Constant FX growth
Net sales 284 279 +2% +6%
EBITDA 87 81 +9% +15%
EBITDA margin 31% 29% - -

Leading player across key segments
Proven financial performance
Strong organic growth
Outperforming the industry
Key take-aways
Strong track record

Q & A

Disclaimer These materials are confidential and are made available to the recipient on the understanding that they are confidential. Recipients of these materials must ensure that the terms of the confidentiality agreement are observed. These materials do not constitute research. The materials have been prepared based upon information that the Company believes to be reliable. Market data presented is based on the information and belief of the Company’s management and has not been independently verified. However, none of the information contained in these materials has been independently verified and the Company makes no representation or warranty, express or implied, as to the accuracy or completeness of the information contained in these materials and accordingly, the Company accepts no responsibility or liability for the information contained herein. These materials may contain forward-looking statements. These forward-looking statements are based on management’s current expectations and beliefs, as well as a number of assumptions concerning future events. These statements are subject to risks, uncertainties, assumptions and other important factors, many of which are outside management’s control, that could cause actual results to differ materially from the results discussed in the forward-looking statements. You are cautioned not to put undue reliance on such forward-looking statements because actual results may vary materially from those expressed or implied. All forward-looking statements are based on information available to management on this date and Mölnlycke Health Care Group assumes no obligation to, and expressly disclaims any obligation to, update or revise any forward-looking statements, whether as a result of new information, future events or otherwise. The Company does not provide legal, accounting or tax advice and the recipient of these materials is strongly advised to consult its own independent advisors on any legal, tax or accounting issues relating to these materials. The circulation of these materials may, in certain countries, be subject to specific regulation. Consequently, persons in possession of this information notice are deemed to be advised of possible local restrictions and to have complied with them. Nothing in these materials shall constitute or form part of any legal agreement, or any offer to sell or the solicitation of any offer to buy any securities or to syndicate or the solicitation of any offer to syndicate any loans.
Related Documents