Interim Financial Statements September 30, 2017 IFRS in US$

Welcome message from author
This document is posted to help you gain knowledge. Please leave a comment to let me know what you think about it! Share it to your friends and learn new things together.
Transcript
Interim Financial Statements September 30, 2017
IFRS in US$
2
Vale S.A. Interim Financial Statements Contents
Page Report of independent registered public accounting firm 3 Consolidated Income Statement 4 Consolidated Statement of Comprehensive Income 5 Consolidated Statement of Cash Flows 6 Consolidated Statement of Financial Position 7 Consolidated Statement of Changes in Equity 8 Selected Notes to the Interim Financial Statements 9 1. Corporate information 2. Basis for preparation of the interim financial statements 3. Information by business segment and by geographic area 4. Special events occurred during the period 5. Costs and expenses by nature 6. Financial result 7. Income taxes 8. Basic and diluted earnings per share 9. Accounts receivable 10. Inventories 11. Other financial assets and liabilities 12. Non-current assets and liabilities held for sale and discontinued operations 13. Acquisitions and divestitures 14. Investments in associates and joint ventures 15. Intangibles 16. Property, plant and equipment 17. Loans, borrowings, cash and cash equivalents and financial investments 18. Liabilities related to associates and joint ventures 19. Financial instruments classification 20. Fair value estimate 21. Derivative financial instruments 22. Provisions 23. Litigation 24. Employee postretirement obligations 25. Stockholders’ equity 26. Related parties 27. Commitments 28. Additional information about derivatives financial instruments
3
KPMG Auditores Independentes
Rua do Passeio, 38 Setor 2 17º andar
20021-290 - Rio de Janeiro, RJ - Brasil
Central Tel 55 (21) 2207-9400
Fax 55 (21) 2207-9000
Internet www.kpmg.com.br
Report of independent registered public accounting firm
To the Board of Directors and Stockholders of
Vale S.A.
Rio de Janeiro - RJ
We have reviewed the accompanying condensed consolidated balance sheet of Vale S.A. (“the Company”) and subsidiaries
as of September 30, 2017, the related condensed consolidated statements of income, comprehensive income and cash flows
for the three and nine-month periods ended on September 30, 2017 and 2016, and the related condensed consolidated
statement of changes in equity for the nine-month periods ended on September 30, 2017 and 2016. These condensed
consolidated financial statements are the responsibility of the Company’s management.
We conducted our review in accordance with the standards of the Public Company Accounting Oversight Board (United
States). A review of interim financial information consists principally of applying analytical procedures and making
inquiries of persons responsible for financial and accounting matters. It is substantially less in scope than an audit conducted
in accordance with the standards of the Public Company Accounting Oversight Board (United States), the objective of
which is the expression of an opinion regarding the financial statements taken as a whole. Accordingly, we do not express
such an audit opinion.
Based on our review, we are not aware of any material modification that should be made to the condensed consolidated
financial statements referred to above for them to be in conformity with the International Financial Reporting Standards
(IFRS) as issued by the International Accounting Standards Board (IASB).
We have previously audited, in accordance with standards of the Public Company Accounting Oversight Board (United
States), the consolidated balance sheet of Vale S.A. and subsidiaries as of December 31, 2016 and the related consolidated
statements of income, comprehensive income, changes in equity and cash flows for the year then ended (not presented
herein); and in our report dated February 22, 2017, we expressed an unqualified opinion on those consolidated financial
statements. In our opinion, the information set forth in the accompanying condensed consolidated balance sheet as of
December 31, 2016, is fairly stated, in all material respects, in relation to the consolidated balance sheet from which it has
been derived.
KPMG Auditores Independentes
Rio de Janeiro, Brazil
October 25, 2017
4
Consolidated Income Statement In millions of United States dollars, except earnings per share data
Three-month period ended
September 30, Nine-month period ended
September 30,
Notes 2017 2016 2017 2016
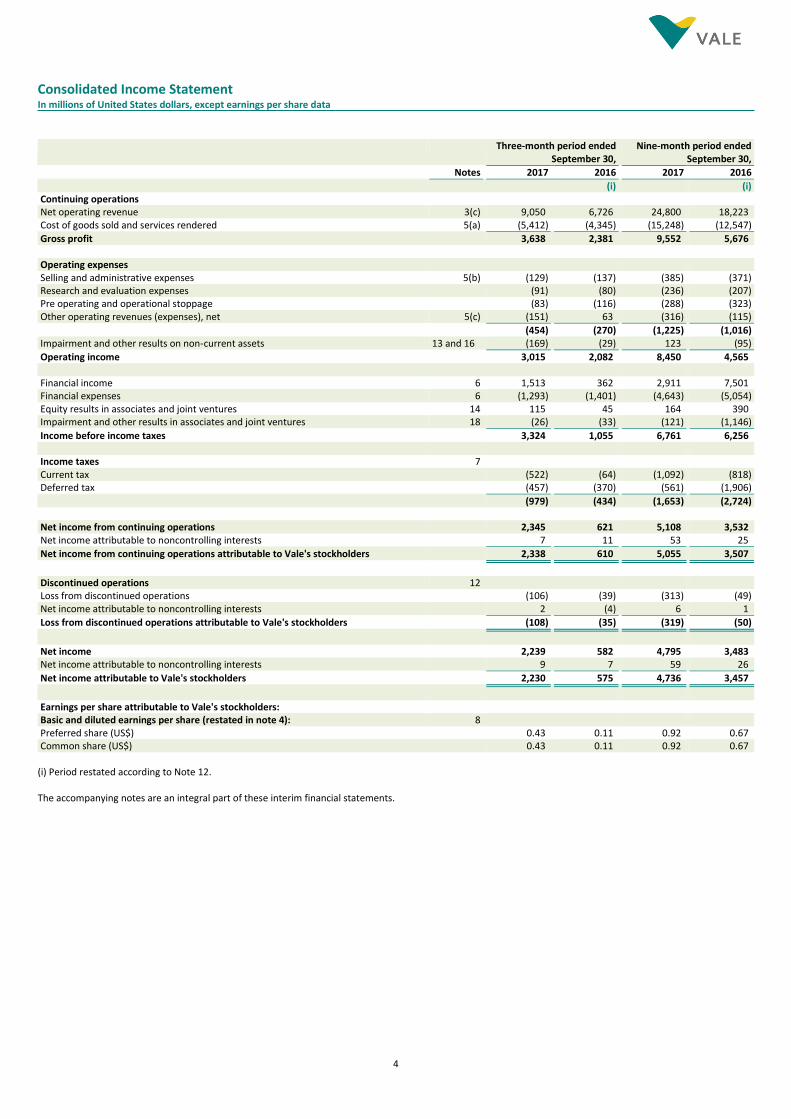
(i) (i) Continuing operations Net operating revenue 3(c) 9,050 6,726 24,800 18,223 Cost of goods sold and services rendered 5(a) (5,412) (4,345) (15,248) (12,547)
Gross profit 3,638 2,381 9,552 5,676 Operating expenses Selling and administrative expenses 5(b) (129) (137) (385) (371) Research and evaluation expenses (91) (80) (236) (207) Pre operating and operational stoppage (83) (116) (288) (323) Other operating revenues (expenses), net 5(c) (151) 63 (316) (115)
(454) (270) (1,225) (1,016) Impairment and other results on non-current assets 13 and 16 (169) (29) 123 (95)
Operating income 3,015 2,082 8,450 4,565 Financial income 6 1,513 362 2,911 7,501 Financial expenses 6 (1,293) (1,401) (4,643) (5,054) Equity results in associates and joint ventures 14 115 45 164 390 Impairment and other results in associates and joint ventures 18 (26) (33) (121) (1,146)
Income before income taxes 3,324 1,055 6,761 6,256 Income taxes 7 Current tax (522) (64) (1,092) (818) Deferred tax (457) (370) (561) (1,906)
(979) (434) (1,653) (2,724) Net income from continuing operations 2,345 621 5,108 3,532 Net income attributable to noncontrolling interests 7 11 53 25
Net income from continuing operations attributable to Vale's stockholders 2,338 610 5,055 3,507
Discontinued operations 12 Loss from discontinued operations (106) (39) (313) (49) Net income attributable to noncontrolling interests 2 (4) 6 1
Loss from discontinued operations attributable to Vale's stockholders (108) (35) (319) (50)
Net income 2,239 582 4,795 3,483 Net income attributable to noncontrolling interests 9 7 59 26
Net income attributable to Vale's stockholders 2,230 575 4,736 3,457
Earnings per share attributable to Vale's stockholders: Basic and diluted earnings per share (restated in note 4): 8 Preferred share (US$) 0.43 0.11 0.92 0.67 Common share (US$) 0.43 0.11 0.92 0.67
(i) Period restated according to Note 12. The accompanying notes are an integral part of these interim financial statements.
5
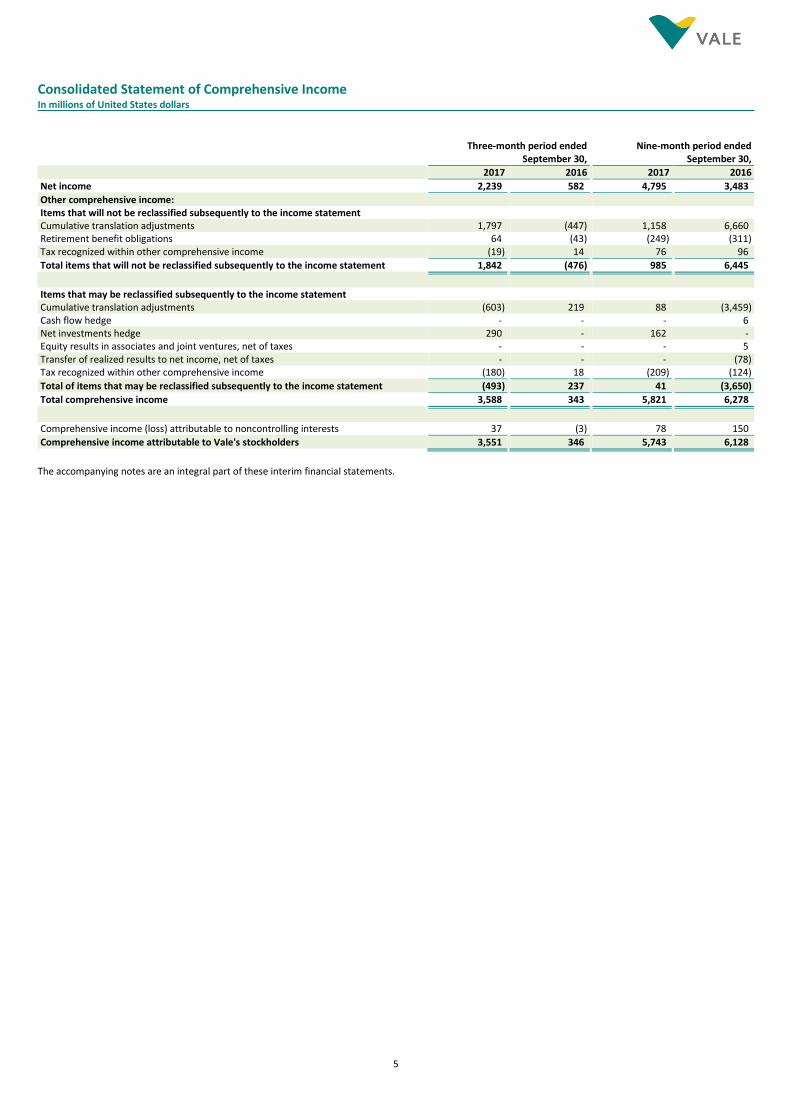
Consolidated Statement of Comprehensive Income In millions of United States dollars
Three-month period ended
September 30, Nine-month period ended
September 30,
2017 2016 2017 2016
Net income 2,239 582 4,795 3,483
Other comprehensive income: Items that will not be reclassified subsequently to the income statement Cumulative translation adjustments 1,797 (447) 1,158 6,660 Retirement benefit obligations 64 (43) (249) (311) Tax recognized within other comprehensive income (19) 14 76 96
Total items that will not be reclassified subsequently to the income statement 1,842 (476) 985 6,445
Items that may be reclassified subsequently to the income statement Cumulative translation adjustments (603) 219 88 (3,459) Cash flow hedge - - - 6 Net investments hedge 290 - 162 - Equity results in associates and joint ventures, net of taxes - - - 5 Transfer of realized results to net income, net of taxes - - - (78) Tax recognized within other comprehensive income (180) 18 (209) (124)
Total of items that may be reclassified subsequently to the income statement (493) 237 41 (3,650)
Total comprehensive income 3,588 343 5,821 6,278
Comprehensive income (loss) attributable to noncontrolling interests 37 (3) 78 150
Comprehensive income attributable to Vale's stockholders 3,551 346 5,743 6,128
The accompanying notes are an integral part of these interim financial statements.
6
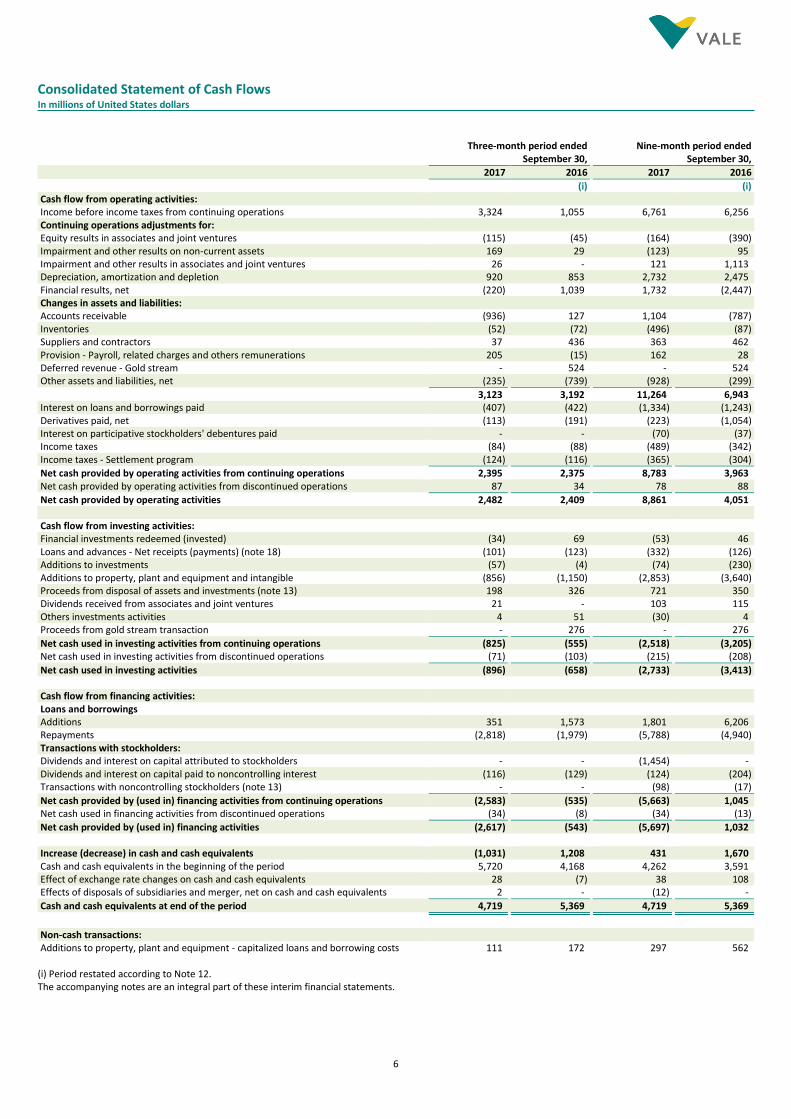
Consolidated Statement of Cash Flows In millions of United States dollars
Three-month period ended
September 30, Nine-month period ended
September 30,
2017 2016 2017 2016
(i) (i) Cash flow from operating activities: Income before income taxes from continuing operations 3,324 1,055 6,761 6,256 Continuing operations adjustments for: Equity results in associates and joint ventures (115) (45) (164) (390) Impairment and other results on non-current assets 169 29 (123) 95 Impairment and other results in associates and joint ventures 26 - 121 1,113 Depreciation, amortization and depletion 920 853 2,732 2,475 Financial results, net (220) 1,039 1,732 (2,447) Changes in assets and liabilities: Accounts receivable (936) 127 1,104 (787) Inventories (52) (72) (496) (87) Suppliers and contractors 37 436 363 462 Provision - Payroll, related charges and others remunerations 205 (15) 162 28 Deferred revenue - Gold stream - 524 - 524 Other assets and liabilities, net (235) (739) (928) (299)
3,123 3,192 11,264 6,943 Interest on loans and borrowings paid (407) (422) (1,334) (1,243) Derivatives paid, net (113) (191) (223) (1,054) Interest on participative stockholders' debentures paid - - (70) (37) Income taxes (84) (88) (489) (342) Income taxes - Settlement program (124) (116) (365) (304)
Net cash provided by operating activities from continuing operations 2,395 2,375 8,783 3,963 Net cash provided by operating activities from discontinued operations 87 34 78 88
Net cash provided by operating activities 2,482 2,409 8,861 4,051 Cash flow from investing activities: Financial investments redeemed (invested) (34) 69 (53) 46 Loans and advances - Net receipts (payments) (note 18) (101) (123) (332) (126) Additions to investments (57) (4) (74) (230) Additions to property, plant and equipment and intangible (856) (1,150) (2,853) (3,640) Proceeds from disposal of assets and investments (note 13) 198 326 721 350 Dividends received from associates and joint ventures 21 - 103 115 Others investments activities 4 51 (30) 4 Proceeds from gold stream transaction - 276 - 276
Net cash used in investing activities from continuing operations (825) (555) (2,518) (3,205) Net cash used in investing activities from discontinued operations (71) (103) (215) (208)
Net cash used in investing activities (896) (658) (2,733) (3,413) Cash flow from financing activities: Loans and borrowings Additions 351 1,573 1,801 6,206 Repayments (2,818) (1,979) (5,788) (4,940) Transactions with stockholders: Dividends and interest on capital attributed to stockholders - - (1,454) - Dividends and interest on capital paid to noncontrolling interest (116) (129) (124) (204) Transactions with noncontrolling stockholders (note 13) - - (98) (17)
Net cash provided by (used in) financing activities from continuing operations (2,583) (535) (5,663) 1,045 Net cash used in financing activities from discontinued operations (34) (8) (34) (13)
Net cash provided by (used in) financing activities (2,617) (543) (5,697) 1,032 Increase (decrease) in cash and cash equivalents (1,031) 1,208 431 1,670 Cash and cash equivalents in the beginning of the period 5,720 4,168 4,262 3,591 Effect of exchange rate changes on cash and cash equivalents 28 (7) 38 108 Effects of disposals of subsidiaries and merger, net on cash and cash equivalents 2 - (12) -
Cash and cash equivalents at end of the period 4,719 5,369 4,719 5,369
Non-cash transactions: Additions to property, plant and equipment - capitalized loans and borrowing costs 111 172 297 562
(i) Period restated according to Note 12. The accompanying notes are an integral part of these interim financial statements.
7
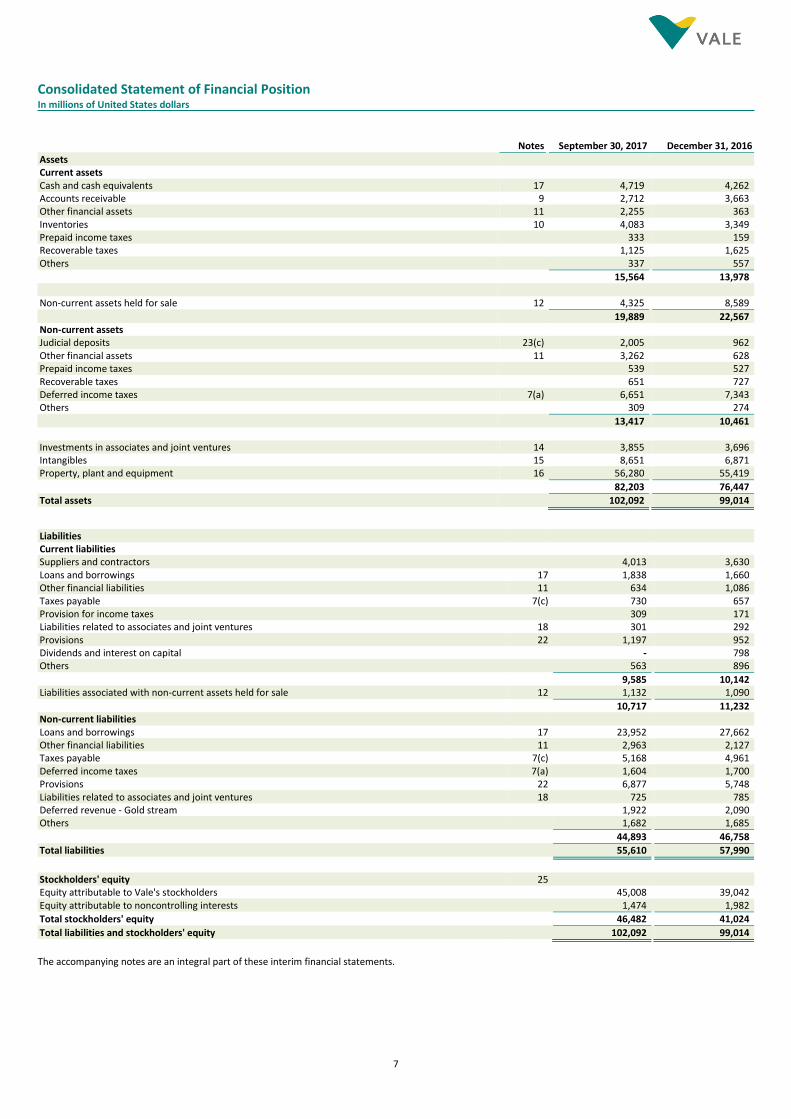
Consolidated Statement of Financial Position In millions of United States dollars
Notes September 30, 2017 December 31, 2016
Assets Current assets Cash and cash equivalents 17 4,719 4,262 Accounts receivable 9 2,712 3,663 Other financial assets 11 2,255 363 Inventories 10 4,083 3,349 Prepaid income taxes 333 159 Recoverable taxes 1,125 1,625 Others 337 557
15,564 13,978 Non-current assets held for sale 12 4,325 8,589
19,889 22,567 Non-current assets Judicial deposits 23(c) 2,005 962 Other financial assets 11 3,262 628 Prepaid income taxes 539 527 Recoverable taxes 651 727 Deferred income taxes 7(a) 6,651 7,343 Others 309 274
13,417 10,461 Investments in associates and joint ventures 14 3,855 3,696 Intangibles 15 8,651 6,871 Property, plant and equipment 16 56,280 55,419
82,203 76,447
Total assets 102,092 99,014
Liabilities Current liabilities Suppliers and contractors 4,013 3,630 Loans and borrowings 17 1,838 1,660 Other financial liabilities 11 634 1,086 Taxes payable 7(c) 730 657 Provision for income taxes 309 171 Liabilities related to associates and joint ventures 18 301 292 Provisions 22 1,197 952 Dividends and interest on capital - 798 Others 563 896
9,585 10,142 Liabilities associated with non-current assets held for sale 12 1,132 1,090
10,717 11,232 Non-current liabilities Loans and borrowings 17 23,952 27,662 Other financial liabilities 11 2,963 2,127 Taxes payable 7(c) 5,168 4,961 Deferred income taxes 7(a) 1,604 1,700 Provisions 22 6,877 5,748 Liabilities related to associates and joint ventures 18 725 785 Deferred revenue - Gold stream 1,922 2,090 Others 1,682 1,685
44,893 46,758
Total liabilities 55,610 57,990
Stockholders' equity 25 Equity attributable to Vale's stockholders 45,008 39,042 Equity attributable to noncontrolling interests 1,474 1,982
Total stockholders' equity 46,482 41,024
Total liabilities and stockholders' equity 102,092 99,014
The accompanying notes are an integral part of these interim financial statements.
8
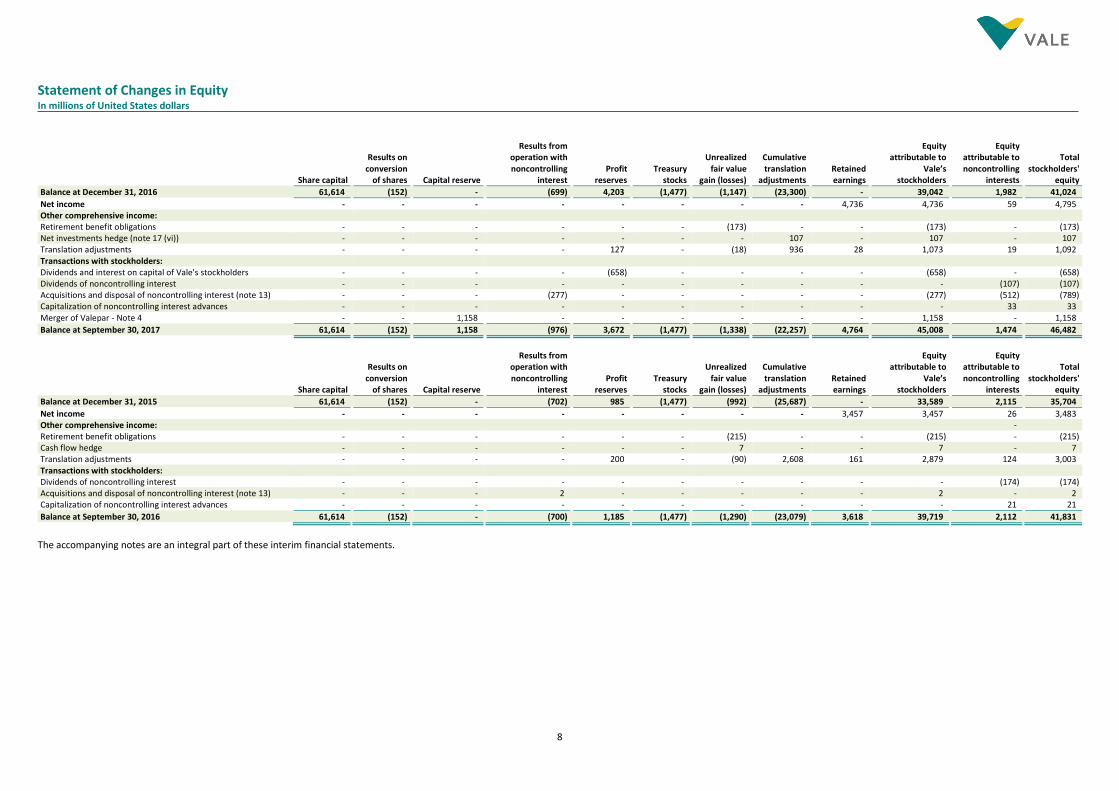
Statement of Changes in Equity In millions of United States dollars
Share capital
Results on conversion
of shares Capital reserve
Results from operation with noncontrolling
interest Profit
reserves Treasury
stocks
Unrealized fair value
gain (losses)
Cumulative translation
adjustments Retained earnings
Equity attributable to
Vale’s stockholders
Equity attributable to noncontrolling
interests
Total stockholders'
equity
Balance at December 31, 2016 61,614 (152) - (699) 4,203 (1,477) (1,147) (23,300) - 39,042 1,982 41,024
Net income - - - - - - - - 4,736 4,736 59 4,795 Other comprehensive income: Retirement benefit obligations - - - - - - (173) - - (173) - (173) Net investments hedge (note 17 (vi)) - - - - - - - 107 - 107 - 107 Translation adjustments - - - - 127 - (18) 936 28 1,073 19 1,092 Transactions with stockholders: Dividends and interest on capital of Vale's stockholders - - - - (658) - - - - (658) - (658) Dividends of noncontrolling interest - - - - - - - - - - (107) (107) Acquisitions and disposal of noncontrolling interest (note 13) - - - (277) - - - - - (277) (512) (789) Capitalization of noncontrolling interest advances - - - - - - - - - - 33 33 Merger of Valepar - Note 4 - - 1,158 - - - - - - 1,158 - 1,158
Balance at September 30, 2017 61,614 (152) 1,158 (976) 3,672 (1,477) (1,338) (22,257) 4,764 45,008 1,474 46,482
Share capital
Results on conversion
of shares Capital reserve
Results from operation with noncontrolling
interest Profit
reserves Treasury
stocks
Unrealized fair value
gain (losses)
Cumulative translation
adjustments Retained earnings
Equity attributable to
Vale’s stockholders
Equity attributable to noncontrolling
interests
Total stockholders'
equity
Balance at December 31, 2015 61,614 (152) - (702) 985 (1,477) (992) (25,687) - 33,589 2,115 35,704
Net income - - - - - - - - 3,457 3,457 26 3,483 Other comprehensive income: - Retirement benefit obligations - - - - - - (215) - - (215) - (215) Cash flow hedge - - - - - - 7 - - 7 - 7 Translation adjustments - - - - 200 - (90) 2,608 161 2,879 124 3,003 Transactions with stockholders: Dividends of noncontrolling interest - - - - - - - - - - (174) (174) Acquisitions and disposal of noncontrolling interest (note 13) - - - 2 - - - - - 2 - 2 Capitalization of noncontrolling interest advances - - - - - - - - - - 21 21
Balance at September 30, 2016 61,614 (152) - (700) 1,185 (1,477) (1,290) (23,079) 3,618 39,719 2,112 41,831
The accompanying notes are an integral part of these interim financial statements.
9
Selected Notes to the Interim Financial Statements Expressed in millions of United States dollar, unless otherwise stated
1. Corporate information Vale S.A. (the “Parent Company”) is a public company headquartered in the city of Rio de Janeiro, Brazil with securities traded on the stock exchanges of São Paulo – B3 S.A. (Vale3 and Vale5), New York - NYSE (VALE and VALE.P), Paris - NYSE Euronext (Vale3 and Vale5) and Madrid – LATIBEX (XVALO and XVALP). Vale S.A. and its direct and indirect subsidiaries (“Vale” or “Company”) are global producers of iron ore and iron ore pellets, key raw materials for steelmaking, and producers of nickel, which is used to produce stainless steel and metal alloys employed in the production of several products. The Company also produces copper, metallurgical and thermal coal, manganese ore, ferroalloys, platinum group metals, gold, silver and cobalt. The information by segment is presented in note 3. 2. Basis for preparation of the interim financial statements a) Statement of compliance The condensed consolidated interim financial statements of the Company (“interim financial statements”) present the accounts of the Company and have been prepared in accordance with IAS 34 Interim Financial Reporting of the International Financial Reporting Standards (“IFRS”) as issued by the International Accounting Standards Board (“IASB”). b) Basis of presentation The interim financial statements have been prepared under the historical cost convention as adjusted to reflect: (i) the fair value of financial instruments measured at fair value through the income statement or available-for-sale financial instruments measured at fair value through the statement of comprehensive income; and (ii) impairment of assets. The accounting practices, accounting estimates and judgments, risk management and measurement methods are the same as those adopted when preparing the financial statements for the year ended December 31, 2016. The accounting policy for recognizing and measuring income taxes in the interim period is described in note 7. These interim financial statements were prepared to update users about relevant information presented in the period and should be read in conjunction with the financial statements for the year ended December 31, 2016. The consolidated comparative information for the periods ended September 30, 2016 was restated for the purposes of applying IFRS 5 "Non-current assets held for sale and discontinued operations" after approval by the Board of Directors of the sale of the fertilizers assets, as presented in Note 12. Also earnings per share were restated as disclosed in note 4. The interim financial statements of the Company and its associates and joint ventures are measured using the currency of the primary economic environment in which the entity operates (“functional currency”), which in the case of the Parent Company is the Brazilian real (“BRL” or “R$”). For presentation purposes, these interim financial statements are presented in United States dollar (“USD” or “US$”) as the Company believes that this is how international investors analyze the interim financial statements. The exchange rates used by the Company for major currencies to translate its operations are as follows: Average rate for the
Closing rate Three-month period ended Nine-month period ended
September 30,
2017 December 31,
2016 September 30,
2017 September 30,
2016 September 30,
2017 September 30,
2016
US Dollar ("US$") 3.1680 3.2591 3.1639 3.2460 3.1750 3.5450 Canadian dollar ("CAD") 2.5334 2.4258 2.5235 2.4881 2.4319 2.6802 Australian dollar ("AUD") 2.4837 2.3560 2.4969 2.4616 2.4320 2.6273 Euro ("EUR" or "€") 3.7430 3.4384 3.7162 3.6232 3.5392 3.9549
Subsequent events were evaluated through October 25, 2017, which is the date the interim financial statements were approved by the Board of Directors.
10
c) Accounting standards issued but not yet effective The standards and interpretations issued by IASB relevant to the Company but not yet effective are the same as those applicable when preparing the financial statements for the year ended December 31, 2016.
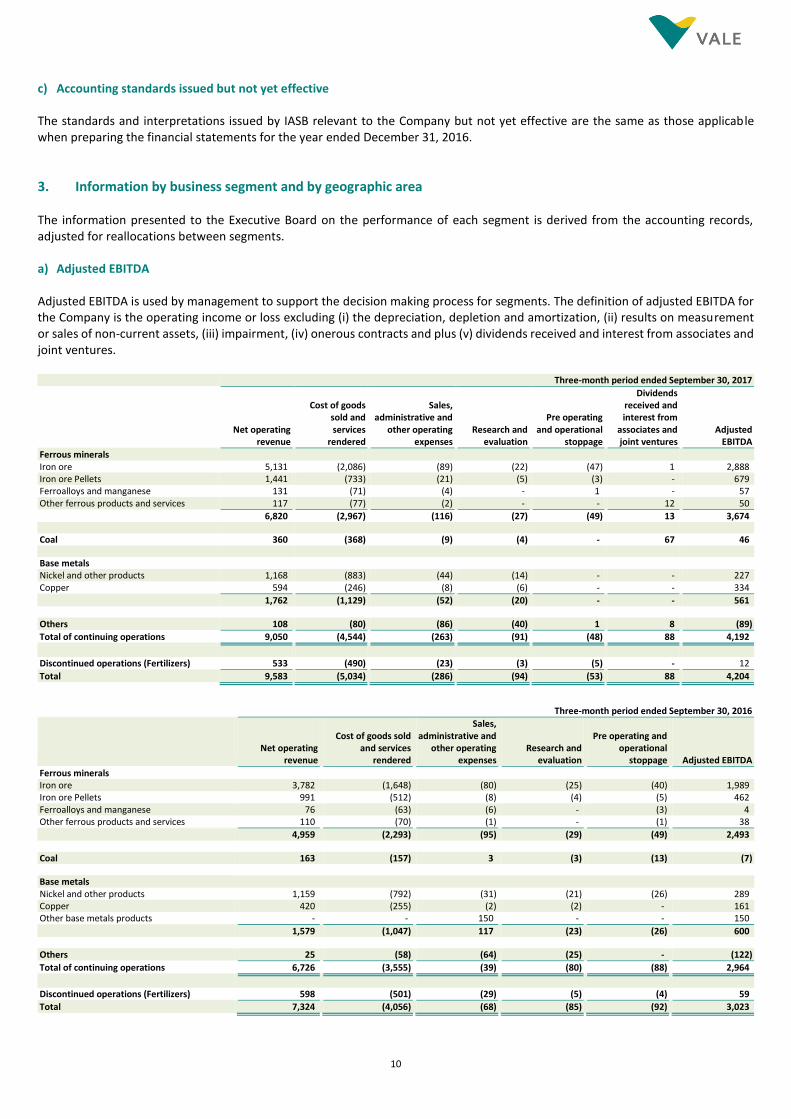
3. Information by business segment and by geographic area The information presented to the Executive Board on the performance of each segment is derived from the accounting records, adjusted for reallocations between segments. a) Adjusted EBITDA Adjusted EBITDA is used by management to support the decision making process for segments. The definition of adjusted EBITDA for the Company is the operating income or loss excluding (i) the depreciation, depletion and amortization, (ii) results on measurement or sales of non-current assets, (iii) impairment, (iv) onerous contracts and plus (v) dividends received and interest from associates and joint ventures. Three-month period ended September 30, 2017
Net operating revenue
Cost of goods sold and services
rendered
Sales, administrative and
other operating expenses
Research and evaluation
Pre operating and operational
stoppage
Dividends received and interest from
associates and joint ventures
Adjusted EBITDA
Ferrous minerals
Iron ore 5,131 (2,086) (89) (22) (47) 1 2,888
Iron ore Pellets 1,441 (733) (21) (5) (3) - 679
Ferroalloys and manganese 131 (71) (4) - 1 - 57
Other ferrous products and services 117 (77) (2) - - 12 50
6,820 (2,967) (116) (27) (49) 13 3,674
Coal 360 (368) (9) (4) - 67 46
Base metals
Nickel and other products 1,168 (883) (44) (14) - - 227
Copper 594 (246) (8) (6) - - 334
1,762 (1,129) (52) (20) - - 561
Others 108 (80) (86) (40) 1 8 (89)
Total of continuing operations 9,050 (4,544) (263) (91) (48) 88 4,192
Discontinued operations (Fertilizers) 533 (490) (23) (3) (5) - 12
Total 9,583 (5,034) (286) (94) (53) 88 4,204
Three-month period ended September 30, 2016
Net operating revenue
Cost of goods sold and services
rendered
Sales, administrative and
other operating expenses
Research and evaluation
Pre operating and operational
stoppage Adjusted EBITDA
Ferrous minerals
Iron ore 3,782 (1,648) (80) (25) (40) 1,989
Iron ore Pellets 991 (512) (8) (4) (5) 462
Ferroalloys and manganese 76 (63) (6) - (3) 4
Other ferrous products and services 110 (70) (1) - (1) 38
4,959 (2,293) (95) (29) (49) 2,493
Coal 163 (157) 3 (3) (13) (7)
Base metals
Nickel and other products 1,159 (792) (31) (21) (26) 289
Copper 420 (255) (2) (2) - 161
Other base metals products - - 150 - - 150
1,579 (1,047) 117 (23) (26) 600
Others 25 (58) (64) (25) - (122)
Total of continuing operations 6,726 (3,555) (39) (80) (88) 2,964
Discontinued operations (Fertilizers) 598 (501) (29) (5) (4) 59
Total 7,324 (4,056) (68) (85) (92) 3,023
11
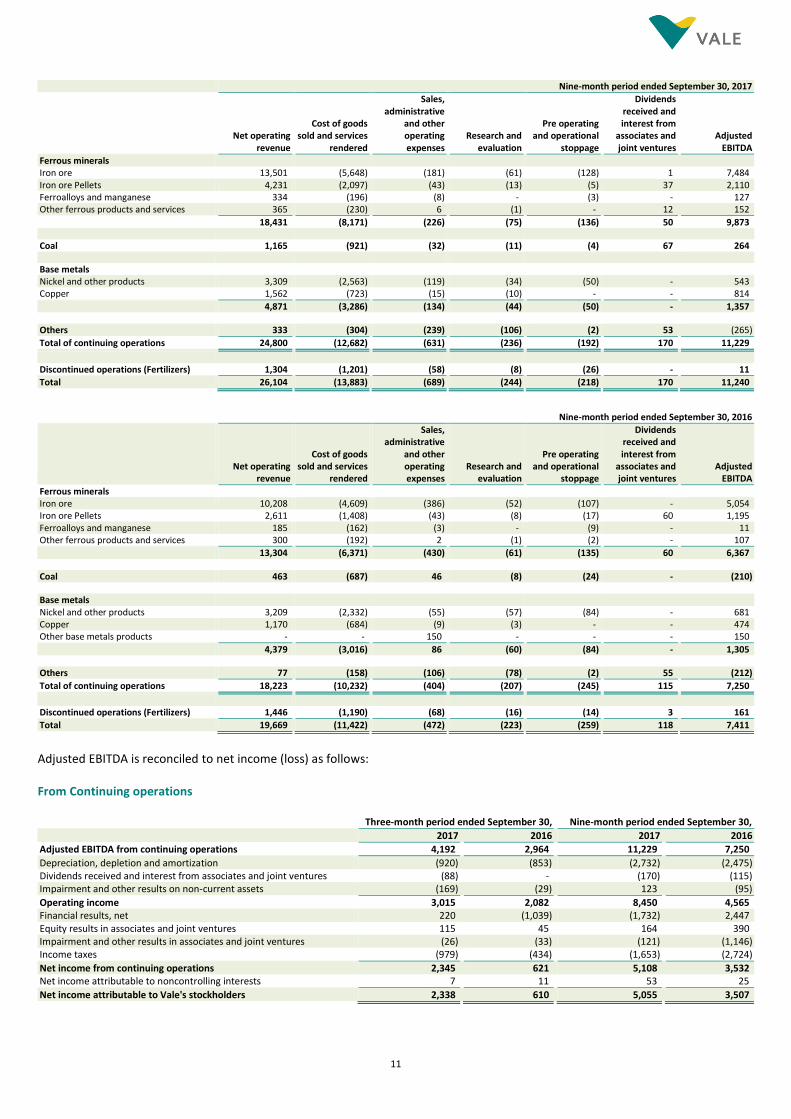
Nine-month period ended September 30, 2017
Net operating revenue
Cost of goods sold and services
rendered
Sales, administrative
and other operating expenses
Research and evaluation
Pre operating and operational
stoppage
Dividends received and interest from
associates and joint ventures
Adjusted EBITDA
Ferrous minerals
Iron ore 13,501 (5,648) (181) (61) (128) 1 7,484
Iron ore Pellets 4,231 (2,097) (43) (13) (5) 37 2,110
Ferroalloys and manganese 334 (196) (8) - (3) - 127
Other ferrous products and services 365 (230) 6 (1) - 12 152
18,431 (8,171) (226) (75) (136) 50 9,873
Coal 1,165 (921) (32) (11) (4) 67 264
Base metals
Nickel and other products 3,309 (2,563) (119) (34) (50) - 543
Copper 1,562 (723) (15) (10) - - 814
4,871 (3,286) (134) (44) (50) - 1,357
Others 333 (304) (239) (106) (2) 53 (265)
Total of continuing operations 24,800 (12,682) (631) (236) (192) 170 11,229
Discontinued operations (Fertilizers) 1,304 (1,201) (58) (8) (26) - 11
Total 26,104 (13,883) (689) (244) (218) 170 11,240
Nine-month period ended September 30, 2016
Net operating revenue
Cost of goods sold and services
rendered
Sales, administrative
and other operating expenses
Research and evaluation
Pre operating and operational
stoppage
Dividends received and interest from
associates and joint ventures
Adjusted EBITDA
Ferrous minerals
Iron ore 10,208 (4,609) (386) (52) (107) - 5,054
Iron ore Pellets 2,611 (1,408) (43) (8) (17) 60 1,195
Ferroalloys and manganese 185 (162) (3) - (9) - 11
Other ferrous products and services 300 (192) 2 (1) (2) - 107
13,304 (6,371) (430) (61) (135) 60 6,367
Coal 463 (687) 46 (8) (24) - (210)
Base metals
Nickel and other products 3,209 (2,332) (55) (57) (84) - 681
Copper 1,170 (684) (9) (3) - - 474
Other base metals products - - 150 - - - 150
4,379 (3,016) 86 (60) (84) - 1,305
Others 77 (158) (106) (78) (2) 55 (212)
Total of continuing operations 18,223 (10,232) (404) (207) (245) 115 7,250
Discontinued operations (Fertilizers) 1,446 (1,190) (68) (16) (14) 3 161
Total 19,669 (11,422) (472) (223) (259) 118 7,411
Adjusted EBITDA is reconciled to net income (loss) as follows: From Continuing operations Three-month period ended September 30, Nine-month period ended September 30,
2017 2016 2017 2016
Adjusted EBITDA from continuing operations 4,192 2,964 11,229 7,250
Depreciation, depletion and amortization (920) (853) (2,732) (2,475) Dividends received and interest from associates and joint ventures (88) - (170) (115) Impairment and other results on non-current assets (169) (29) 123 (95)
Operating income 3,015 2,082 8,450 4,565 Financial results, net 220 (1,039) (1,732) 2,447 Equity results in associates and joint ventures 115 45 164 390 Impairment and other results in associates and joint ventures (26) (33) (121) (1,146) Income taxes (979) (434) (1,653) (2,724)
Net income from continuing operations 2,345 621 5,108 3,532 Net income attributable to noncontrolling interests 7 11 53 25
Net income attributable to Vale's stockholders 2,338 610 5,055 3,507
12
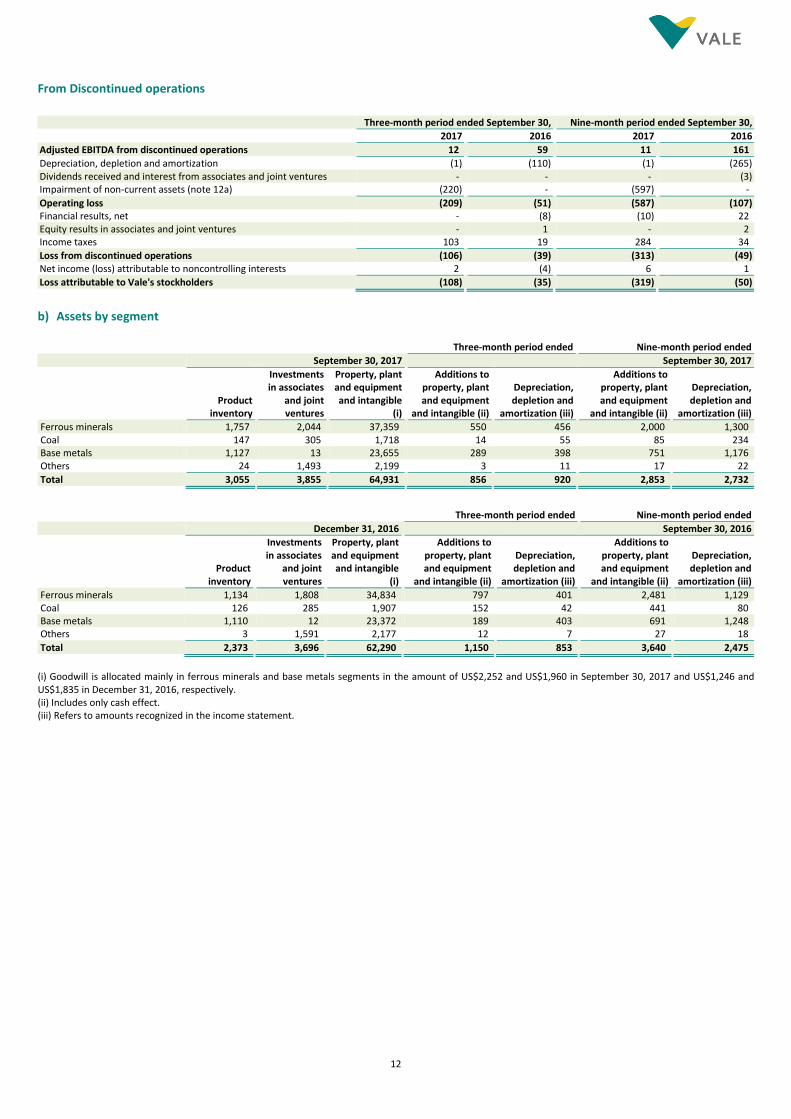
From Discontinued operations
Three-month period ended September 30, Nine-month period ended September 30,
2017 2016 2017 2016
Adjusted EBITDA from discontinued operations 12 59 11 161
Depreciation, depletion and amortization (1) (110) (1) (265) Dividends received and interest from associates and joint ventures - - - (3) Impairment of non-current assets (note 12a) (220) - (597) -
Operating loss (209) (51) (587) (107) Financial results, net - (8) (10) 22 Equity results in associates and joint ventures - 1 - 2 Income taxes 103 19 284 34
Loss from discontinued operations (106) (39) (313) (49) Net income (loss) attributable to noncontrolling interests 2 (4) 6 1
Loss attributable to Vale's stockholders (108) (35) (319) (50)
b) Assets by segment Three-month period ended Nine-month period ended
September 30, 2017 September 30, 2017
Product
inventory
Investments in associates
and joint ventures
Property, plant and equipment and intangible
(i)
Additions to property, plant and equipment
and intangible (ii)
Depreciation, depletion and
amortization (iii)
Additions to property, plant and equipment
and intangible (ii)
Depreciation, depletion and
amortization (iii)
Ferrous minerals 1,757 2,044 37,359 550 456 2,000 1,300 Coal 147 305 1,718 14 55 85 234 Base metals 1,127 13 23,655 289 398 751 1,176 Others 24 1,493 2,199 3 11 17 22
Total 3,055 3,855 64,931 856 920 2,853 2,732
Three-month period ended Nine-month period ended
December 31, 2016 September 30, 2016
Product
inventory
Investments in associates
and joint ventures
Property, plant and equipment and intangible
(i)
Additions to property, plant and equipment
and intangible (ii)
Depreciation, depletion and
amortization (iii)
Additions to property, plant and equipment
and intangible (ii)
Depreciation, depletion and
amortization (iii)
Ferrous minerals 1,134 1,808 34,834 797 401 2,481 1,129 Coal 126 285 1,907 152 42 441 80 Base metals 1,110 12 23,372 189 403 691 1,248 Others 3 1,591 2,177 12 7 27 18
Total 2,373 3,696 62,290 1,150 853 3,640 2,475
(i) Goodwill is allocated mainly in ferrous minerals and base metals segments in the amount of US$2,252 and US$1,960 in September 30, 2017 and US$1,246 and US$1,835 in December 31, 2016, respectively. (ii) Includes only cash effect. (iii) Refers to amounts recognized in the income statement.
13
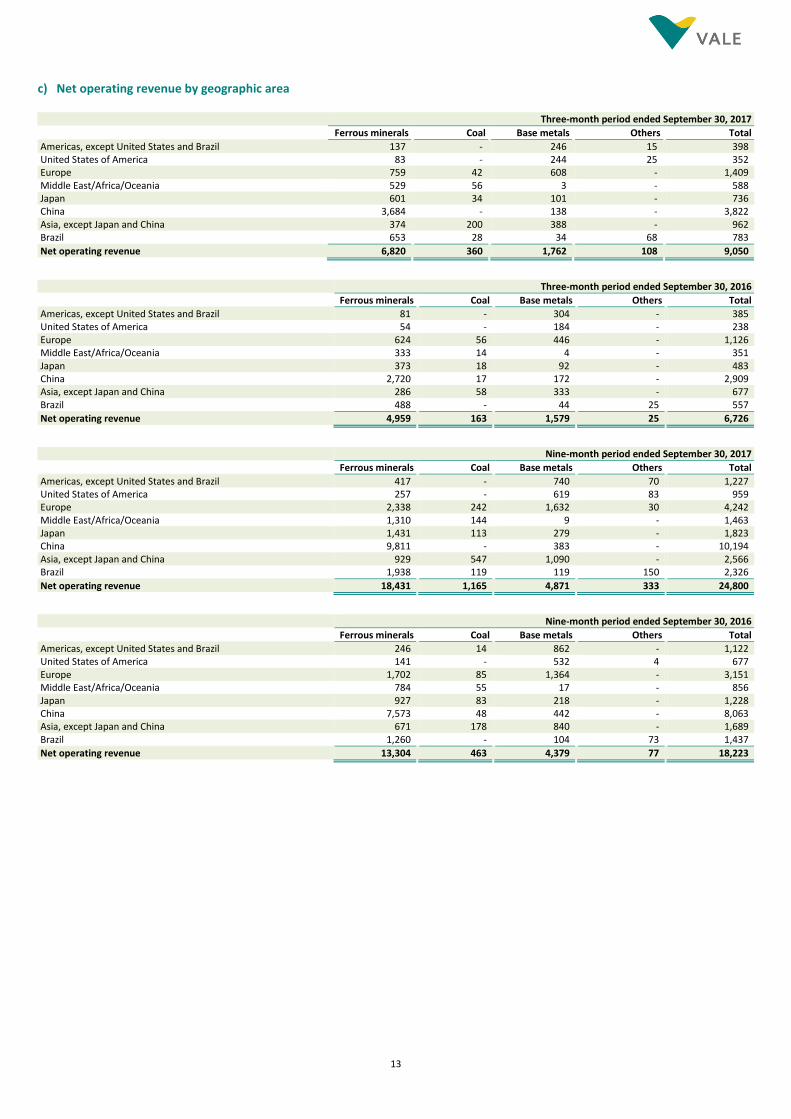
c) Net operating revenue by geographic area Three-month period ended September 30, 2017
Ferrous minerals Coal Base metals Others Total
Americas, except United States and Brazil 137 - 246 15 398 United States of America 83 - 244 25 352 Europe 759 42 608 - 1,409 Middle East/Africa/Oceania 529 56 3 - 588 Japan 601 34 101 - 736 China 3,684 - 138 - 3,822 Asia, except Japan and China 374 200 388 - 962 Brazil 653 28 34 68 783
Net operating revenue 6,820 360 1,762 108 9,050
Three-month period ended September 30, 2016
Ferrous minerals Coal Base metals Others Total
Americas, except United States and Brazil 81 - 304 - 385 United States of America 54 - 184 - 238 Europe 624 56 446 - 1,126 Middle East/Africa/Oceania 333 14 4 - 351 Japan 373 18 92 - 483 China 2,720 17 172 - 2,909 Asia, except Japan and China 286 58 333 - 677 Brazil 488 - 44 25 557
Net operating revenue 4,959 163 1,579 25 6,726
Nine-month period ended September 30, 2017
Ferrous minerals Coal Base metals Others Total
Americas, except United States and Brazil 417 - 740 70 1,227 United States of America 257 - 619 83 959 Europe 2,338 242 1,632 30 4,242 Middle East/Africa/Oceania 1,310 144 9 - 1,463 Japan 1,431 113 279 - 1,823 China 9,811 - 383 - 10,194 Asia, except Japan and China 929 547 1,090 - 2,566 Brazil 1,938 119 119 150 2,326
Net operating revenue 18,431 1,165 4,871 333 24,800
Nine-month period ended September 30, 2016
Ferrous minerals Coal Base metals Others Total
Americas, except United States and Brazil 246 14 862 - 1,122 United States of America 141 - 532 4 677 Europe 1,702 85 1,364 - 3,151 Middle East/Africa/Oceania 784 55 17 - 856 Japan 927 83 218 - 1,228 China 7,573 48 442 - 8,063 Asia, except Japan and China 671 178 840 - 1,689 Brazil 1,260 - 104 73 1,437
Net operating revenue 13,304 463 4,379 77 18,223
14
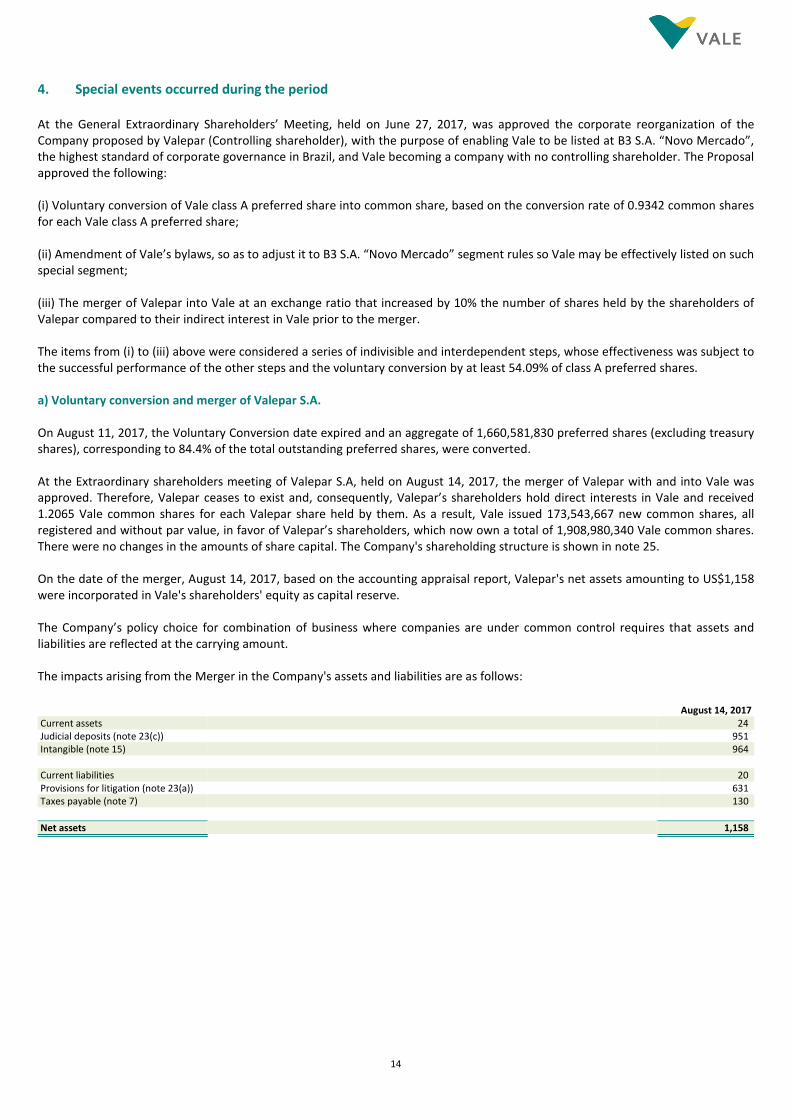
4. Special events occurred during the period At the General Extraordinary Shareholders’ Meeting, held on June 27, 2017, was approved the corporate reorganization of the Company proposed by Valepar (Controlling shareholder), with the purpose of enabling Vale to be listed at B3 S.A. “Novo Mercado”, the highest standard of corporate governance in Brazil, and Vale becoming a company with no controlling shareholder. The Proposal approved the following: (i) Voluntary conversion of Vale class A preferred share into common share, based on the conversion rate of 0.9342 common shares for each Vale class A preferred share; (ii) Amendment of Vale’s bylaws, so as to adjust it to B3 S.A. “Novo Mercado” segment rules so Vale may be effectively listed on such special segment; (iii) The merger of Valepar into Vale at an exchange ratio that increased by 10% the number of shares held by the shareholders of Valepar compared to their indirect interest in Vale prior to the merger. The items from (i) to (iii) above were considered a series of indivisible and interdependent steps, whose effectiveness was subject to the successful performance of the other steps and the voluntary conversion by at least 54.09% of class A preferred shares. a) Voluntary conversion and merger of Valepar S.A. On August 11, 2017, the Voluntary Conversion date expired and an aggregate of 1,660,581,830 preferred shares (excluding treasury shares), corresponding to 84.4% of the total outstanding preferred shares, were converted. At the Extraordinary shareholders meeting of Valepar S.A, held on August 14, 2017, the merger of Valepar with and into Vale was approved. Therefore, Valepar ceases to exist and, consequently, Valepar’s shareholders hold direct interests in Vale and received 1.2065 Vale common shares for each Valepar share held by them. As a result, Vale issued 173,543,667 new common shares, all registered and without par value, in favor of Valepar’s shareholders, which now own a total of 1,908,980,340 Vale common shares. There were no changes in the amounts of share capital. The Company's shareholding structure is shown in note 25. On the date of the merger, August 14, 2017, based on the accounting appraisal report, Valepar's net assets amounting to US$1,158 were incorporated in Vale's shareholders' equity as capital reserve. The Company’s policy choice for combination of business where companies are under common control requires that assets and liabilities are reflected at the carrying amount. The impacts arising from the Merger in the Company's assets and liabilities are as follows:
August 14, 2017
Current assets 24 Judicial deposits (note 23(c)) 951 Intangible (note 15) 964
Current liabilities 20 Provisions for litigation (note 23(a)) 631 Taxes payable (note 7) 130
Net assets 1,158
15
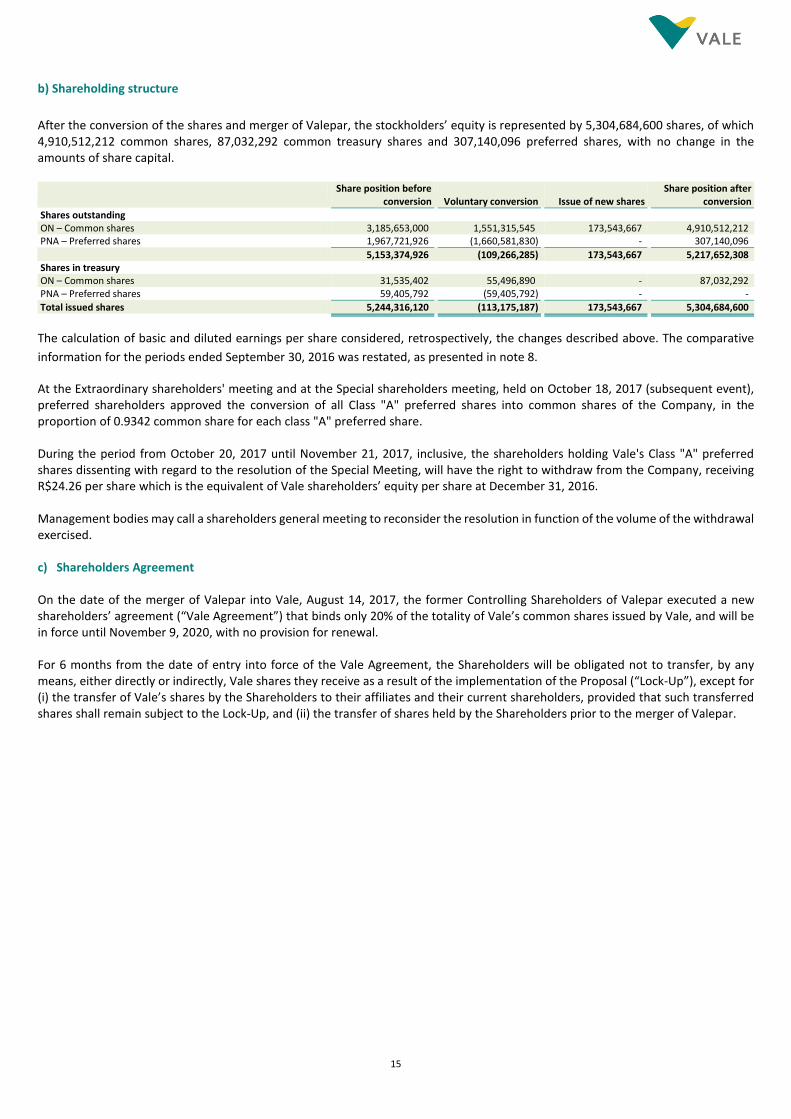
b) Shareholding structure
After the conversion of the shares and merger of Valepar, the stockholders’ equity is represented by 5,304,684,600 shares, of which 4,910,512,212 common shares, 87,032,292 common treasury shares and 307,140,096 preferred shares, with no change in the amounts of share capital.
Share position before
conversion Voluntary conversion Issue of new shares Share position after
conversion
Shares outstanding ON – Common shares 3,185,653,000 1,551,315,545 173,543,667 4,910,512,212 PNA – Preferred shares 1,967,721,926 (1,660,581,830) - 307,140,096
5,153,374,926 (109,266,285) 173,543,667 5,217,652,308 Shares in treasury ON – Common shares 31,535,402 55,496,890 - 87,032,292 PNA – Preferred shares 59,405,792 (59,405,792) - -
Total issued shares 5,244,316,120 (113,175,187) 173,543,667 5,304,684,600
The calculation of basic and diluted earnings per share considered, retrospectively, the changes described above. The comparative
information for the periods ended September 30, 2016 was restated, as presented in note 8.
At the Extraordinary shareholders' meeting and at the Special shareholders meeting, held on October 18, 2017 (subsequent event), preferred shareholders approved the conversion of all Class "A" preferred shares into common shares of the Company, in the proportion of 0.9342 common share for each class "A" preferred share. During the period from October 20, 2017 until November 21, 2017, inclusive, the shareholders holding Vale's Class "A" preferred shares dissenting with regard to the resolution of the Special Meeting, will have the right to withdraw from the Company, receiving R$24.26 per share which is the equivalent of Vale shareholders’ equity per share at December 31, 2016. Management bodies may call a shareholders general meeting to reconsider the resolution in function of the volume of the withdrawal exercised. c) Shareholders Agreement On the date of the merger of Valepar into Vale, August 14, 2017, the former Controlling Shareholders of Valepar executed a new shareholders’ agreement (“Vale Agreement”) that binds only 20% of the totality of Vale’s common shares issued by Vale, and will be in force until November 9, 2020, with no provision for renewal. For 6 months from the date of entry into force of the Vale Agreement, the Shareholders will be obligated not to transfer, by any means, either directly or indirectly, Vale shares they receive as a result of the implementation of the Proposal (“Lock-Up”), except for (i) the transfer of Vale’s shares by the Shareholders to their affiliates and their current shareholders, provided that such transferred shares shall remain subject to the Lock-Up, and (ii) the transfer of shares held by the Shareholders prior to the merger of Valepar.
16
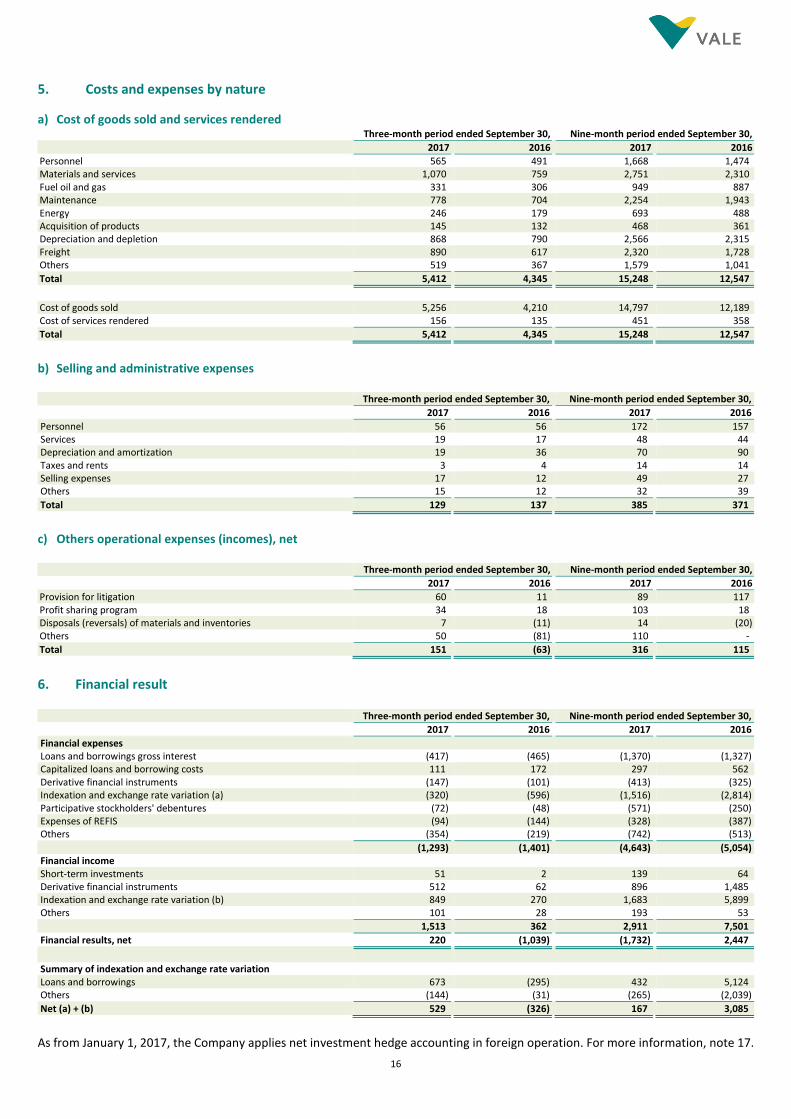
5. Costs and expenses by nature
a) Cost of goods sold and services rendered Three-month period ended September 30, Nine-month period ended September 30,
2017 2016 2017 2016
Personnel 565 491 1,668 1,474 Materials and services 1,070 759 2,751 2,310 Fuel oil and gas 331 306 949 887 Maintenance 778 704 2,254 1,943 Energy 246 179 693 488 Acquisition of products 145 132 468 361 Depreciation and depletion 868 790 2,566 2,315 Freight 890 617 2,320 1,728 Others 519 367 1,579 1,041
Total 5,412 4,345 15,248 12,547
Cost of goods sold 5,256 4,210 14,797 12,189 Cost of services rendered 156 135 451 358
Total 5,412 4,345 15,248 12,547
b) Selling and administrative expenses Three-month period ended September 30, Nine-month period ended September 30,
2017 2016 2017 2016
Personnel 56 56 172 157 Services 19 17 48 44 Depreciation and amortization 19 36 70 90 Taxes and rents 3 4 14 14 Selling expenses 17 12 49 27 Others 15 12 32 39
Total 129 137 385 371
c) Others operational expenses (incomes), net Three-month period ended September 30, Nine-month period ended September 30,
2017 2016 2017 2016
Provision for litigation 60 11 89 117 Profit sharing program 34 18 103 18 Disposals (reversals) of materials and inventories 7 (11) 14 (20) Others 50 (81) 110 -
Total 151 (63) 316 115
6. Financial result
Three-month period ended September 30, Nine-month period ended September 30,
2017 2016 2017 2016
Financial expenses Loans and borrowings gross interest (417) (465) (1,370) (1,327) Capitalized loans and borrowing costs 111 172 297 562 Derivative financial instruments (147) (101) (413) (325) Indexation and exchange rate variation (a) (320) (596) (1,516) (2,814) Participative stockholders' debentures (72) (48) (571) (250) Expenses of REFIS (94) (144) (328) (387) Others (354) (219) (742) (513)
(1,293) (1,401) (4,643) (5,054) Financial income Short‐term investments 51 2 139 64 Derivative financial instruments 512 62 896 1,485 Indexation and exchange rate variation (b) 849 270 1,683 5,899 Others 101 28 193 53
1,513 362 2,911 7,501
Financial results, net 220 (1,039) (1,732) 2,447
Summary of indexation and exchange rate variation Loans and borrowings 673 (295) 432 5,124 Others (144) (31) (265) (2,039)
Net (a) + (b) 529 (326) 167 3,085
As from January 1, 2017, the Company applies net investment hedge accounting in foreign operation. For more information, note 17.
17
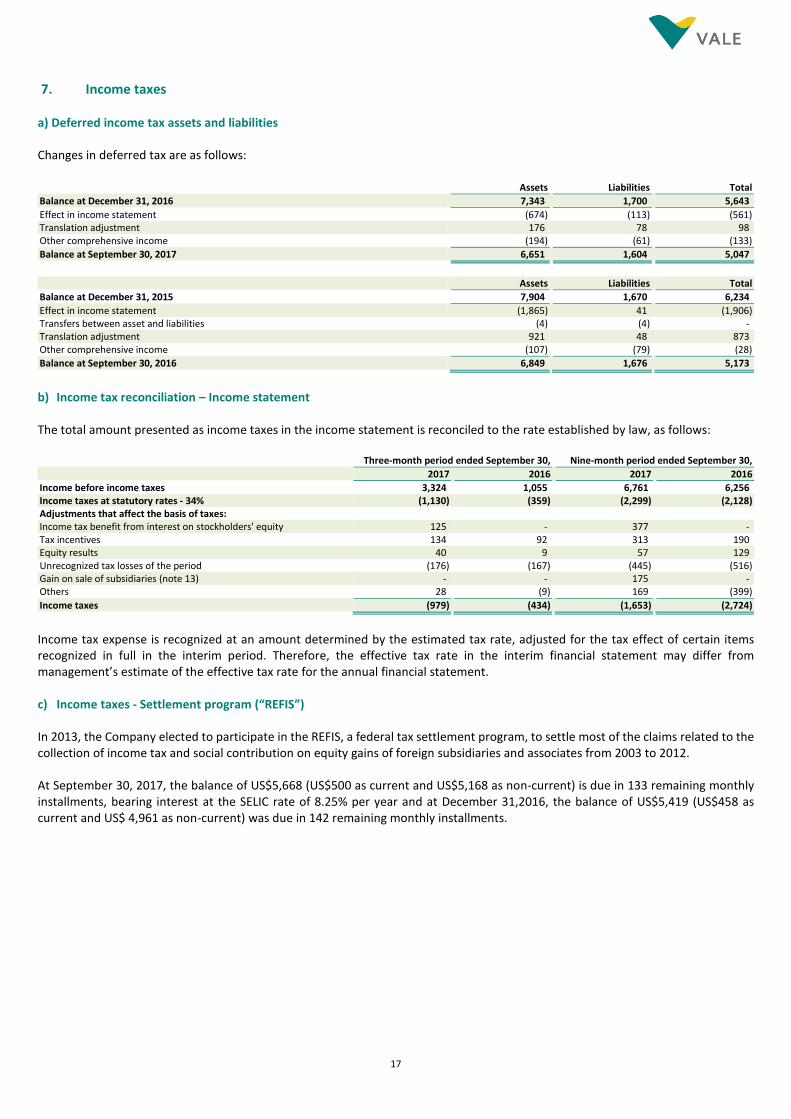
7. Income taxes a) Deferred income tax assets and liabilities Changes in deferred tax are as follows:
Assets Liabilities Total
Balance at December 31, 2016 7,343 1,700 5,643
Effect in income statement (674) (113) (561) Translation adjustment 176 78 98 Other comprehensive income (194) (61) (133)
Balance at September 30, 2017 6,651 1,604 5,047
Assets Liabilities Total
Balance at December 31, 2015 7,904 1,670 6,234
Effect in income statement (1,865) 41 (1,906) Transfers between asset and liabilities (4) (4) - Translation adjustment 921 48 873 Other comprehensive income (107) (79) (28)
Balance at September 30, 2016 6,849 1,676 5,173
b) Income tax reconciliation – Income statement The total amount presented as income taxes in the income statement is reconciled to the rate established by law, as follows: Three-month period ended September 30, Nine-month period ended September 30,
2017 2016 2017 2016
Income before income taxes 3,324 1,055 6,761 6,256 Income taxes at statutory rates ‐ 34% (1,130) (359) (2,299) (2,128) Adjustments that affect the basis of taxes: Income tax benefit from interest on stockholders' equity 125 - 377 - Tax incentives 134 92 313 190 Equity results 40 9 57 129 Unrecognized tax losses of the period (176) (167) (445) (516) Gain on sale of subsidiaries (note 13) - - 175 - Others 28 (9) 169 (399)
Income taxes (979) (434) (1,653) (2,724)
Income tax expense is recognized at an amount determined by the estimated tax rate, adjusted for the tax effect of certain items recognized in full in the interim period. Therefore, the effective tax rate in the interim financial statement may differ from management’s estimate of the effective tax rate for the annual financial statement. c) Income taxes - Settlement program (“REFIS”) In 2013, the Company elected to participate in the REFIS, a federal tax settlement program, to settle most of the claims related to the collection of income tax and social contribution on equity gains of foreign subsidiaries and associates from 2003 to 2012. At September 30, 2017, the balance of US$5,668 (US$500 as current and US$5,168 as non-current) is due in 133 remaining monthly installments, bearing interest at the SELIC rate of 8.25% per year and at December 31,2016, the balance of US$5,419 (US$458 as current and US$ 4,961 as non-current) was due in 142 remaining monthly installments.
18
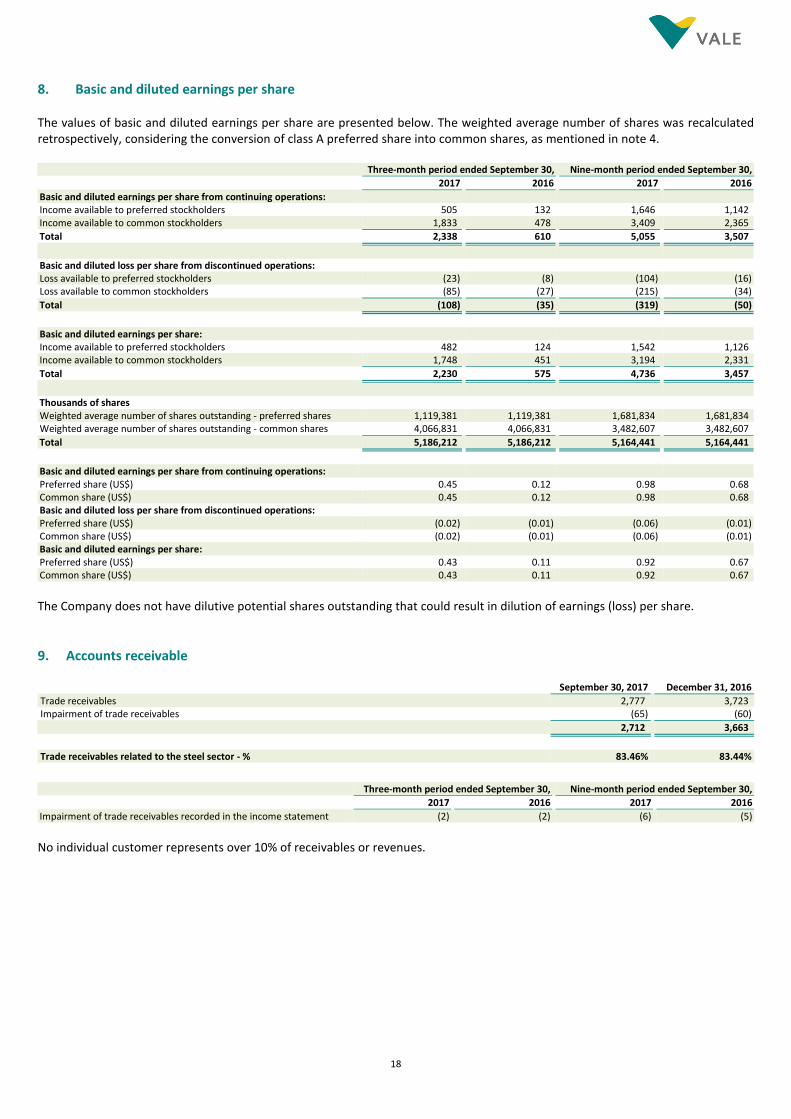
8. Basic and diluted earnings per share The values of basic and diluted earnings per share are presented below. The weighted average number of shares was recalculated retrospectively, considering the conversion of class A preferred share into common shares, as mentioned in note 4. Three-month period ended September 30, Nine-month period ended September 30,
2017 2016 2017 2016
Basic and diluted earnings per share from continuing operations: Income available to preferred stockholders 505 132 1,646 1,142 Income available to common stockholders 1,833 478 3,409 2,365
Total 2,338 610 5,055 3,507
Basic and diluted loss per share from discontinued operations: Loss available to preferred stockholders (23) (8) (104) (16) Loss available to common stockholders (85) (27) (215) (34)
Total (108) (35) (319) (50)
Basic and diluted earnings per share: Income available to preferred stockholders 482 124 1,542 1,126 Income available to common stockholders 1,748 451 3,194 2,331
Total 2,230 575 4,736 3,457
Thousands of shares Weighted average number of shares outstanding - preferred shares 1,119,381 1,119,381 1,681,834 1,681,834 Weighted average number of shares outstanding - common shares 4,066,831 4,066,831 3,482,607 3,482,607
Total 5,186,212 5,186,212 5,164,441 5,164,441
Basic and diluted earnings per share from continuing operations: Preferred share (US$) 0.45 0.12 0.98 0.68 Common share (US$) 0.45 0.12 0.98 0.68 Basic and diluted loss per share from discontinued operations: Preferred share (US$) (0.02) (0.01) (0.06) (0.01) Common share (US$) (0.02) (0.01) (0.06) (0.01) Basic and diluted earnings per share: Preferred share (US$) 0.43 0.11 0.92 0.67 Common share (US$) 0.43 0.11 0.92 0.67
The Company does not have dilutive potential shares outstanding that could result in dilution of earnings (loss) per share.
9. Accounts receivable September 30, 2017 December 31, 2016
Trade receivables 2,777 3,723 Impairment of trade receivables (65) (60)
2,712 3,663
Trade receivables related to the steel sector - % 83.46% 83.44%
Three-month period ended September 30, Nine-month period ended September 30,
2017 2016 2017 2016
Impairment of trade receivables recorded in the income statement (2) (2) (6) (5)
No individual customer represents over 10% of receivables or revenues.
19
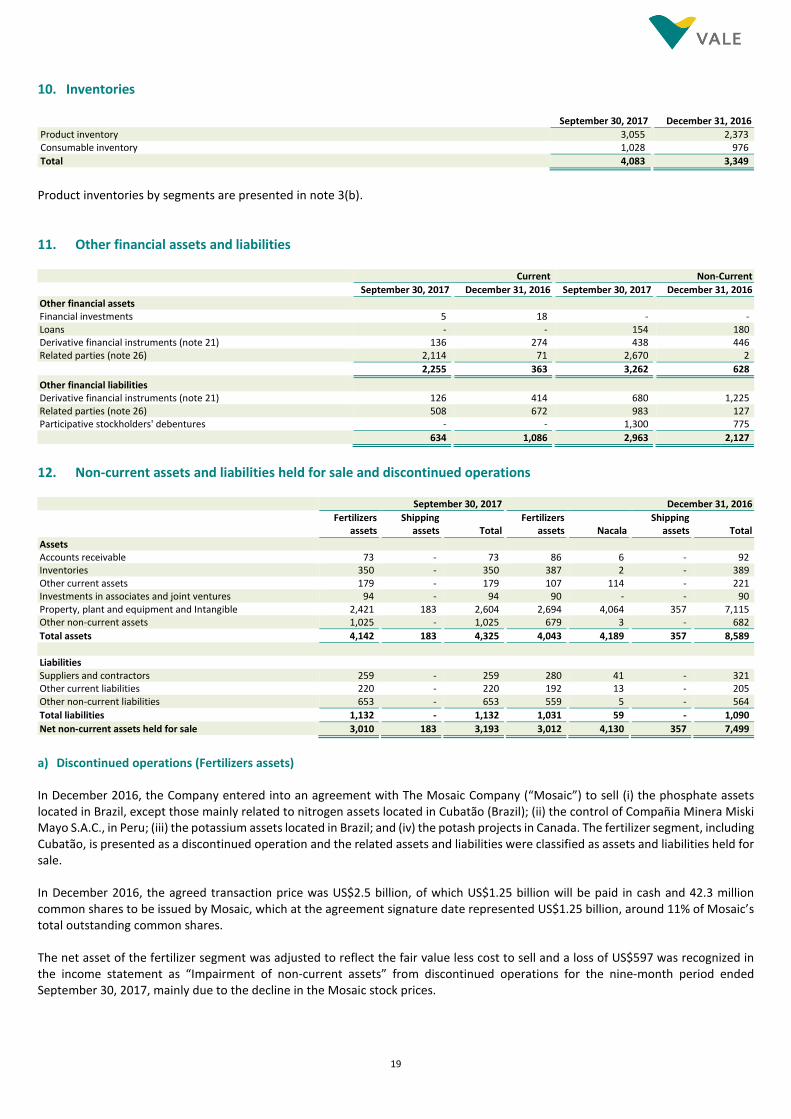
10. Inventories September 30, 2017 December 31, 2016
Product inventory 3,055 2,373 Consumable inventory 1,028 976
Total 4,083 3,349
Product inventories by segments are presented in note 3(b).
11. Other financial assets and liabilities Current Non-Current
September 30, 2017 December 31, 2016 September 30, 2017 December 31, 2016
Other financial assets Financial investments 5 18 - - Loans - - 154 180 Derivative financial instruments (note 21) 136 274 438 446 Related parties (note 26) 2,114 71 2,670 2
2,255 363 3,262 628
Other financial liabilities Derivative financial instruments (note 21) 126 414 680 1,225 Related parties (note 26) 508 672 983 127 Participative stockholders' debentures - - 1,300 775
634 1,086 2,963 2,127
12. Non-current assets and liabilities held for sale and discontinued operations September 30, 2017 December 31, 2016
Fertilizers
assets Shipping
assets Total Fertilizers
assets Nacala Shipping
assets Total
Assets Accounts receivable 73 - 73 86 6 - 92 Inventories 350 - 350 387 2 - 389 Other current assets 179 - 179 107 114 - 221 Investments in associates and joint ventures 94 - 94 90 - - 90 Property, plant and equipment and Intangible 2,421 183 2,604 2,694 4,064 357 7,115 Other non-current assets 1,025 - 1,025 679 3 - 682
Total assets 4,142 183 4,325 4,043 4,189 357 8,589
Liabilities Suppliers and contractors 259 - 259 280 41 - 321 Other current liabilities 220 - 220 192 13 - 205 Other non-current liabilities 653 - 653 559 5 - 564
Total liabilities 1,132 - 1,132 1,031 59 - 1,090
Net non-current assets held for sale 3,010 183 3,193 3,012 4,130 357 7,499
a) Discontinued operations (Fertilizers assets) In December 2016, the Company entered into an agreement with The Mosaic Company (“Mosaic”) to sell (i) the phosphate assets located in Brazil, except those mainly related to nitrogen assets located in Cubatão (Brazil); (ii) the control of Compañia Minera Miski Mayo S.A.C., in Peru; (iii) the potassium assets located in Brazil; and (iv) the potash projects in Canada. The fertilizer segment, including Cubatão, is presented as a discontinued operation and the related assets and liabilities were classified as assets and liabilities held for sale. In December 2016, the agreed transaction price was US$2.5 billion, of which US$1.25 billion will be paid in cash and 42.3 million common shares to be issued by Mosaic, which at the agreement signature date represented US$1.25 billion, around 11% of Mosaic’s total outstanding common shares. The net asset of the fertilizer segment was adjusted to reflect the fair value less cost to sell and a loss of US$597 was recognized in the income statement as “Impairment of non-current assets” from discontinued operations for the nine-month period ended September 30, 2017, mainly due to the decline in the Mosaic stock prices.
20
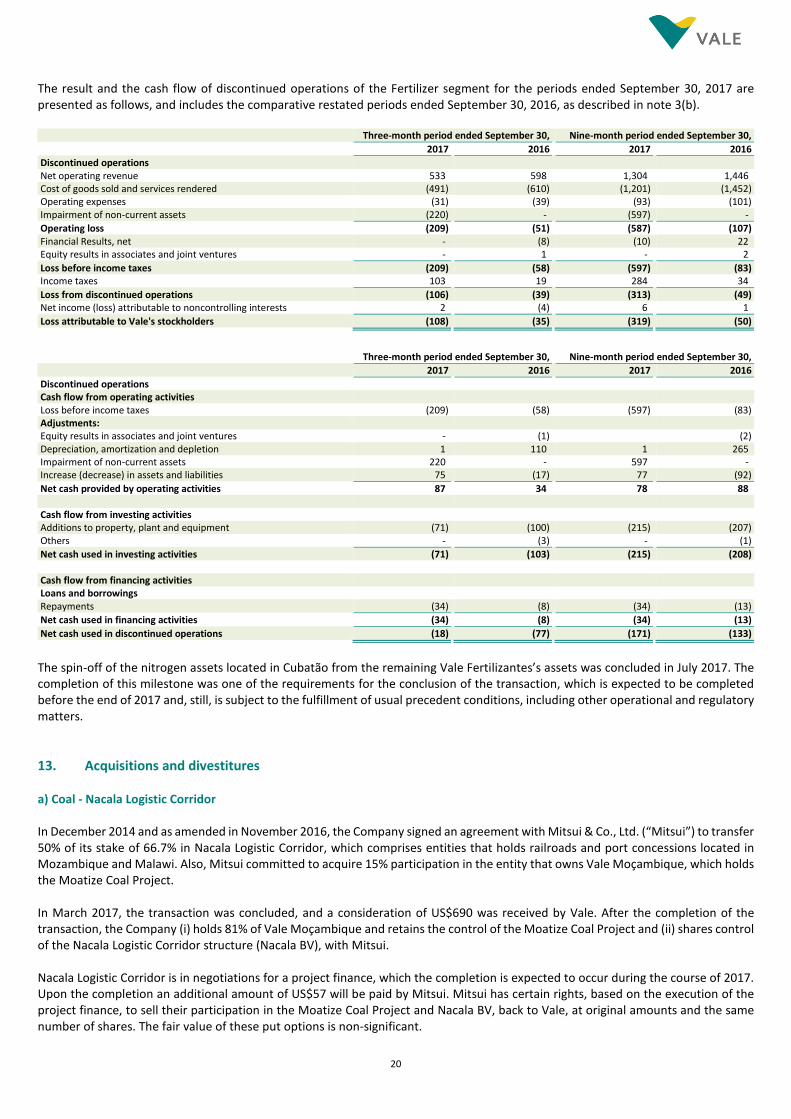
The result and the cash flow of discontinued operations of the Fertilizer segment for the periods ended September 30, 2017 are presented as follows, and includes the comparative restated periods ended September 30, 2016, as described in note 3(b). Three-month period ended September 30, Nine-month period ended September 30,
2017 2016 2017 2016
Discontinued operations Net operating revenue 533 598 1,304 1,446 Cost of goods sold and services rendered (491) (610) (1,201) (1,452) Operating expenses (31) (39) (93) (101) Impairment of non-current assets (220) - (597) -
Operating loss (209) (51) (587) (107) Financial Results, net - (8) (10) 22 Equity results in associates and joint ventures - 1 - 2
Loss before income taxes (209) (58) (597) (83) Income taxes 103 19 284 34
Loss from discontinued operations (106) (39) (313) (49) Net income (loss) attributable to noncontrolling interests 2 (4) 6 1
Loss attributable to Vale's stockholders (108) (35) (319) (50)
Three-month period ended September 30, Nine-month period ended September 30,
2017 2016 2017 2016
Discontinued operations Cash flow from operating activities Loss before income taxes (209) (58) (597) (83) Adjustments: Equity results in associates and joint ventures - (1) (2) Depreciation, amortization and depletion 1 110 1 265 Impairment of non-current assets 220 - 597 - Increase (decrease) in assets and liabilities 75 (17) 77 (92)
Net cash provided by operating activities 87 34 78 88 Cash flow from investing activities Additions to property, plant and equipment (71) (100) (215) (207) Others - (3) - (1)
Net cash used in investing activities (71) (103) (215) (208) Cash flow from financing activities Loans and borrowings Repayments (34) (8) (34) (13)
Net cash used in financing activities (34) (8) (34) (13)
Net cash used in discontinued operations (18) (77) (171) (133)
The spin-off of the nitrogen assets located in Cubatão from the remaining Vale Fertilizantes’s assets was concluded in July 2017. The completion of this milestone was one of the requirements for the conclusion of the transaction, which is expected to be completed before the end of 2017 and, still, is subject to the fulfillment of usual precedent conditions, including other operational and regulatory matters.
13. Acquisitions and divestitures a) Coal - Nacala Logistic Corridor In December 2014 and as amended in November 2016, the Company signed an agreement with Mitsui & Co., Ltd. (“Mitsui”) to transfer 50% of its stake of 66.7% in Nacala Logistic Corridor, which comprises entities that holds railroads and port concessions located in Mozambique and Malawi. Also, Mitsui committed to acquire 15% participation in the entity that owns Vale Moçambique, which holds the Moatize Coal Project. In March 2017, the transaction was concluded, and a consideration of US$690 was received by Vale. After the completion of the transaction, the Company (i) holds 81% of Vale Moçambique and retains the control of the Moatize Coal Project and (ii) shares control of the Nacala Logistic Corridor structure (Nacala BV), with Mitsui. Nacala Logistic Corridor is in negotiations for a project finance, which the completion is expected to occur during the course of 2017. Upon the completion an additional amount of US$57 will be paid by Mitsui. Mitsui has certain rights, based on the execution of the project finance, to sell their participation in the Moatize Coal Project and Nacala BV, back to Vale, at original amounts and the same number of shares. The fair value of these put options is non-significant.
21
As a consequence of sharing control of Nacala BV, the Company: (i) derecognized the assets and liabilities classified as held for sale in the total amount of US$4,144, from which US$4,063 refers to property, plant and equipment and intangibles; (ii) derecognized US$14 related to cash and cash equivalents; (iii) recognized a gain of US$504 in the income statement related to the sale and the re-measurement at fair value, of its remaining interest at Nacala BV based on the consideration received; (iv) reclassified the gain related to the cumulative translation adjustments on to income statements in the amount of US$11; The result of the transaction regarding the assets from Nacala’s corridor was recognized in the income statement as “Impairment and other results on non-current assets”. The results of the transaction with the Moatize Coal Project was recognized in “Results from operation with noncontrolling interest” in the amount of US$105, directly in Stockholders’ Equity. The consideration received was recognized in the statement of cash flows in “Proceeds from disposal of assets and investments” in the amount of US$435 and “Transactions with noncontrolling stockholders” in the amount of US$255. Due to the deconsolidation of Nacala Logistic Corridor, Vale has after the transaction, outstanding loan balances with Nacala BV and Pangea Emirates Ltd stated as Related parties, as described in note 26. The use of proceeds of the project finance is expected to settle part of this debt. b) Floating Transfer Stations (“FTS”) In June 2017, the Company completed the sale of one of its Floating Transfer Stations in Philippines in the amount of US$15. In this transaction, Vale recognized a loss of US$55 as “Impairment and other results on non-current assets”. c) Shipping assets In August 2017, the Company concluded the sale of two Very Large Ore Carriers (“VLOC’s”) for US$178, which were recognized as “Non-current assets and liabilities held for sale and discontinued operations”.
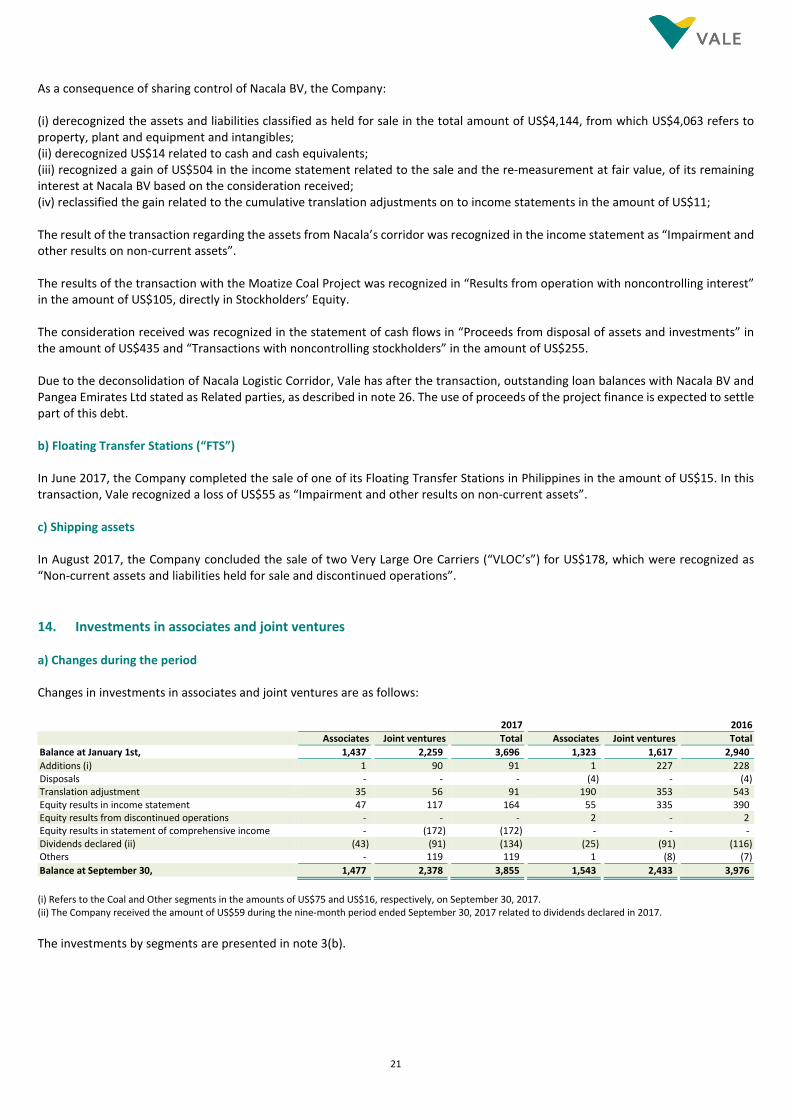
14. Investments in associates and joint ventures a) Changes during the period Changes in investments in associates and joint ventures are as follows:
2017 2016
Associates Joint ventures Total Associates Joint ventures Total
Balance at January 1st, 1,437 2,259 3,696 1,323 1,617 2,940
Additions (i) 1 90 91 1 227 228 Disposals - - - (4) - (4) Translation adjustment 35 56 91 190 353 543 Equity results in income statement 47 117 164 55 335 390 Equity results from discontinued operations - - - 2 - 2 Equity results in statement of comprehensive income - (172) (172) - - - Dividends declared (ii) (43) (91) (134) (25) (91) (116) Others - 119 119 1 (8) (7)
Balance at September 30, 1,477 2,378 3,855 1,543 2,433 3,976
(i) Refers to the Coal and Other segments in the amounts of US$75 and US$16, respectively, on September 30, 2017. (ii) The Company received the amount of US$59 during the nine-month period ended September 30, 2017 related to dividends declared in 2017.
The investments by segments are presented in note 3(b).
22
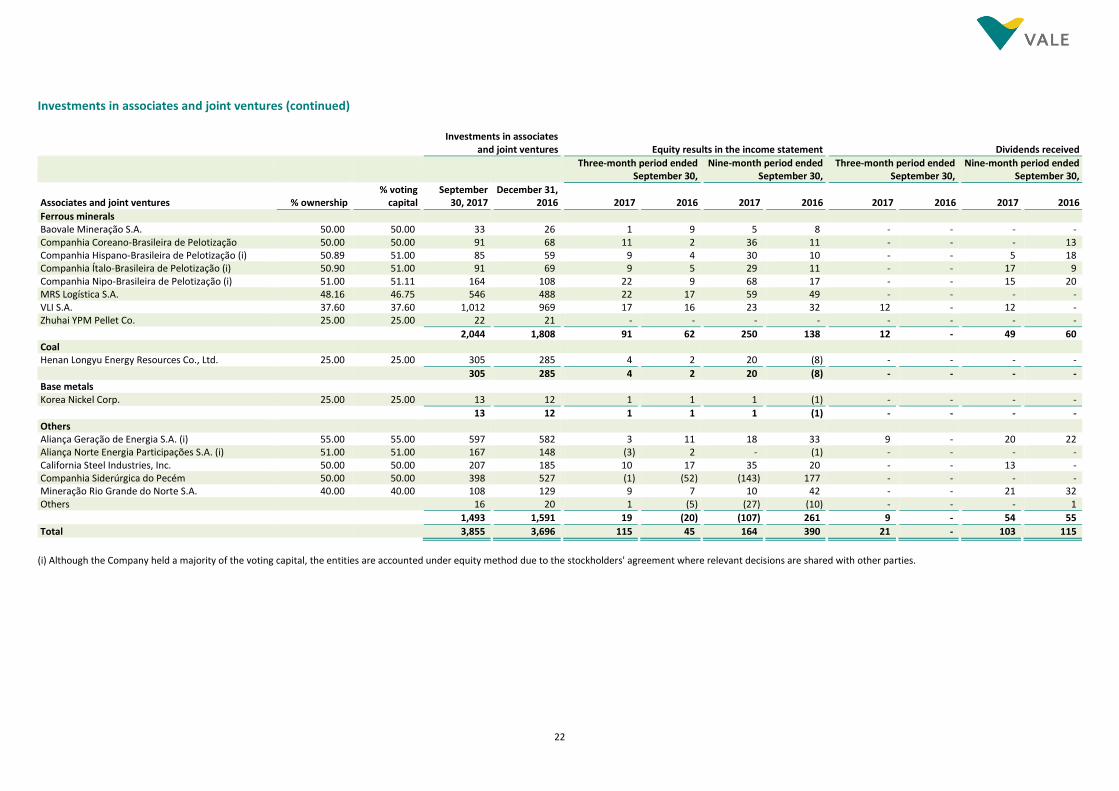
Investments in associates and joint ventures (continued)
Investments in associates
and joint ventures Equity results in the income statement Dividends received
Three-month period ended September 30,
Nine-month period ended
September 30,
Three-month period ended September 30,
Nine-month period ended
September 30,
Associates and joint ventures % ownership % voting
capital September
30, 2017 December 31,
2016 2017 2016 2017 2016 2017 2016 2017 2016
Ferrous minerals Baovale Mineração S.A. 50.00 50.00 33 26 1 9 5 8 - - - - Companhia Coreano-Brasileira de Pelotização 50.00 50.00 91 68 11 2 36 11 - - - 13 Companhia Hispano-Brasileira de Pelotização (i) 50.89 51.00 85 59 9 4 30 10 - - 5 18 Companhia Ítalo-Brasileira de Pelotização (i) 50.90 51.00 91 69 9 5 29 11 - - 17 9 Companhia Nipo-Brasileira de Pelotização (i) 51.00 51.11 164 108 22 9 68 17 - - 15 20 MRS Logística S.A. 48.16 46.75 546 488 22 17 59 49 - - - - VLI S.A. 37.60 37.60 1,012 969 17 16 23 32 12 - 12 - Zhuhai YPM Pellet Co. 25.00 25.00 22 21 - - - - - - - -
2,044 1,808 91 62 250 138 12 - 49 60 Coal Henan Longyu Energy Resources Co., Ltd. 25.00 25.00 305 285 4 2 20 (8) - - - -
305 285 4 2 20 (8) - - - - Base metals Korea Nickel Corp. 25.00 25.00 13 12 1 1 1 (1) - - - -
13 12 1 1 1 (1) - - - - Others Aliança Geração de Energia S.A. (i) 55.00 55.00 597 582 3 11 18 33 9 - 20 22 Aliança Norte Energia Participações S.A. (i) 51.00 51.00 167 148 (3) 2 - (1) - - - - California Steel Industries, Inc. 50.00 50.00 207 185 10 17 35 20 - - 13 - Companhia Siderúrgica do Pecém 50.00 50.00 398 527 (1) (52) (143) 177 - - - - Mineração Rio Grande do Norte S.A. 40.00 40.00 108 129 9 7 10 42 - - 21 32 Others 16 20 1 (5) (27) (10) - - - 1
1,493 1,591 19 (20) (107) 261 9 - 54 55
Total 3,855 3,696 115 45 164 390 21 - 103 115
(i) Although the Company held a majority of the voting capital, the entities are accounted under equity method due to the stockholders' agreement where relevant decisions are shared with other parties.
23
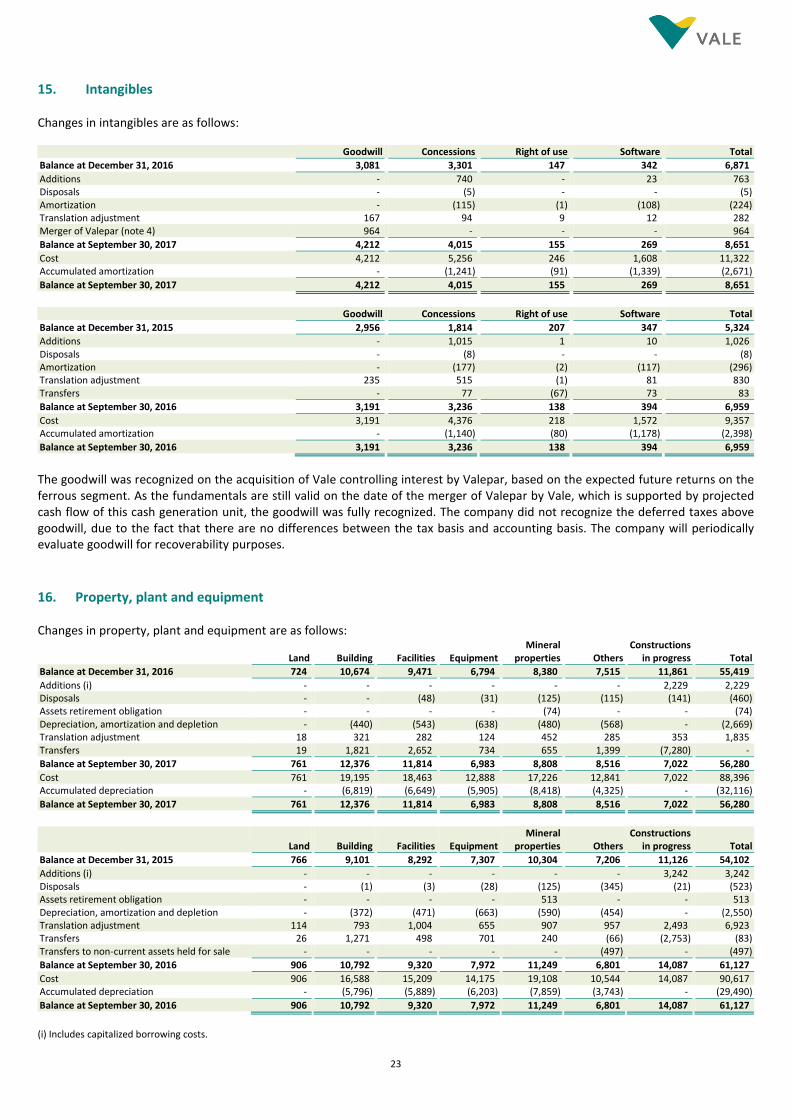
15. Intangibles Changes in intangibles are as follows: Goodwill Concessions Right of use Software Total
Balance at December 31, 2016 3,081 3,301 147 342 6,871
Additions - 740 - 23 763 Disposals - (5) - - (5) Amortization - (115) (1) (108) (224) Translation adjustment 167 94 9 12 282 Merger of Valepar (note 4) 964 - - - 964
Balance at September 30, 2017 4,212 4,015 155 269 8,651
Cost 4,212 5,256 246 1,608 11,322 Accumulated amortization - (1,241) (91) (1,339) (2,671)
Balance at September 30, 2017 4,212 4,015 155 269 8,651
Goodwill Concessions Right of use Software Total
Balance at December 31, 2015 2,956 1,814 207 347 5,324
Additions - 1,015 1 10 1,026 Disposals - (8) - - (8) Amortization - (177) (2) (117) (296) Translation adjustment 235 515 (1) 81 830 Transfers - 77 (67) 73 83
Balance at September 30, 2016 3,191 3,236 138 394 6,959
Cost 3,191 4,376 218 1,572 9,357 Accumulated amortization - (1,140) (80) (1,178) (2,398)
Balance at September 30, 2016 3,191 3,236 138 394 6,959
The goodwill was recognized on the acquisition of Vale controlling interest by Valepar, based on the expected future returns on the ferrous segment. As the fundamentals are still valid on the date of the merger of Valepar by Vale, which is supported by projected cash flow of this cash generation unit, the goodwill was fully recognized. The company did not recognize the deferred taxes above goodwill, due to the fact that there are no differences between the tax basis and accounting basis. The company will periodically evaluate goodwill for recoverability purposes.
16. Property, plant and equipment Changes in property, plant and equipment are as follows:
Land Building Facilities Equipment Mineral
properties Others Constructions
in progress Total
Balance at December 31, 2016 724 10,674 9,471 6,794 8,380 7,515 11,861 55,419
Additions (i) - - - - - - 2,229 2,229 Disposals - - (48) (31) (125) (115) (141) (460) Assets retirement obligation - - - - (74) - - (74) Depreciation, amortization and depletion - (440) (543) (638) (480) (568) - (2,669) Translation adjustment 18 321 282 124 452 285 353 1,835 Transfers 19 1,821 2,652 734 655 1,399 (7,280) -
Balance at September 30, 2017 761 12,376 11,814 6,983 8,808 8,516 7,022 56,280
Cost 761 19,195 18,463 12,888 17,226 12,841 7,022 88,396 Accumulated depreciation - (6,819) (6,649) (5,905) (8,418) (4,325) - (32,116)
Balance at September 30, 2017 761 12,376 11,814 6,983 8,808 8,516 7,022 56,280
Land Building Facilities Equipment Mineral
properties Others Constructions
in progress Total
Balance at December 31, 2015 766 9,101 8,292 7,307 10,304 7,206 11,126 54,102
Additions (i) - - - - - - 3,242 3,242 Disposals - (1) (3) (28) (125) (345) (21) (523) Assets retirement obligation - - - - 513 - - 513 Depreciation, amortization and depletion - (372) (471) (663) (590) (454) - (2,550) Translation adjustment 114 793 1,004 655 907 957 2,493 6,923 Transfers 26 1,271 498 701 240 (66) (2,753) (83) Transfers to non-current assets held for sale - - - - - (497) - (497)
Balance at September 30, 2016 906 10,792 9,320 7,972 11,249 6,801 14,087 61,127
Cost 906 16,588 15,209 14,175 19,108 10,544 14,087 90,617 Accumulated depreciation - (5,796) (5,889) (6,203) (7,859) (3,743) - (29,490)
Balance at September 30, 2016 906 10,792 9,320 7,972 11,249 6,801 14,087 61,127
(i) Includes capitalized borrowing costs.
24
There are no material changes to the net book value of consolidated property, plant and equipment pledged to secure judicial claims and loans and borrowings (note 17(c)) compared to those disclosed in the financial statements as at December 31, 2016. In the nine-month period ended in September, 2017, Vale placed an underground mine, which is part of Sudbury operations, in Canada, on care and maintenance. Parts of the mine, affected by seismic activity, for which repairs would be uneconomical, are not expected to resume operations in the future, was derecognized from property, plant and equipment. As a result, the Company recognized a loss of US$133 in the income statement as “Impairment and other results on non-current assets”. As other parts of the mine are subject to resume operation in the future, a net book value in the amount of US$232 remains as part of the cost of the mine.
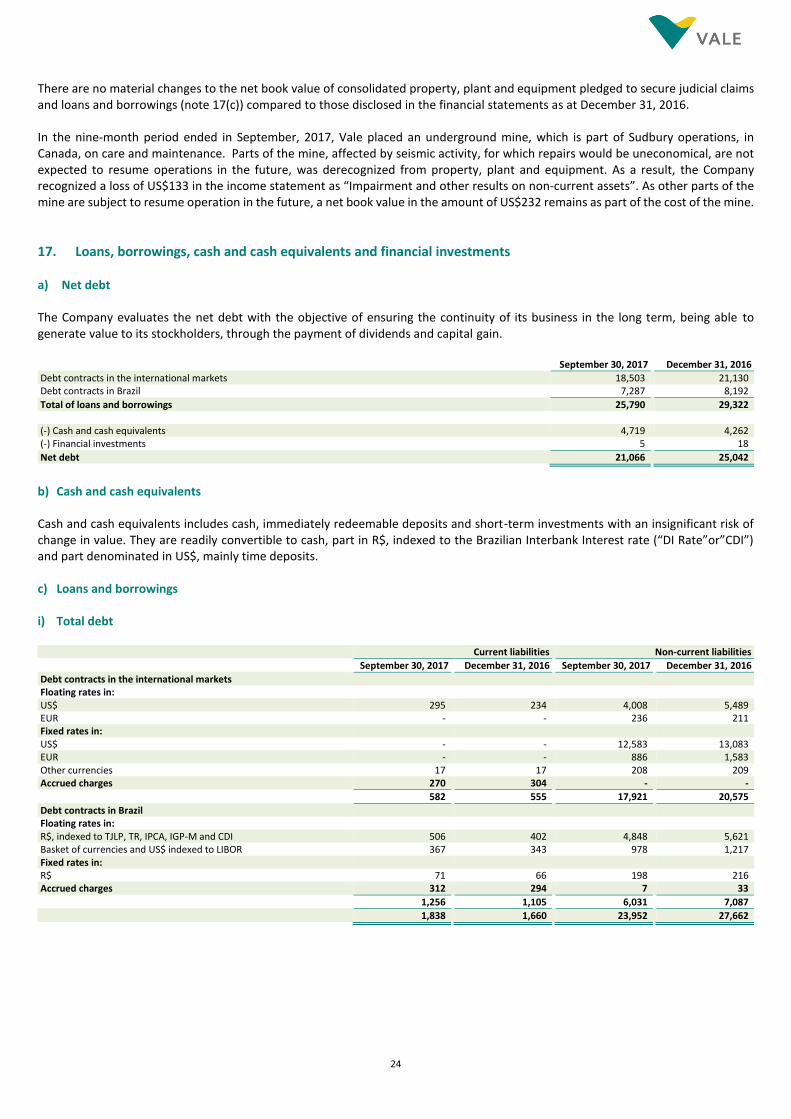
17. Loans, borrowings, cash and cash equivalents and financial investments a) Net debt The Company evaluates the net debt with the objective of ensuring the continuity of its business in the long term, being able to generate value to its stockholders, through the payment of dividends and capital gain. September 30, 2017 December 31, 2016
Debt contracts in the international markets 18,503 21,130 Debt contracts in Brazil 7,287 8,192
Total of loans and borrowings 25,790 29,322 (-) Cash and cash equivalents 4,719 4,262 (-) Financial investments 5 18
Net debt 21,066 25,042
b) Cash and cash equivalents Cash and cash equivalents includes cash, immediately redeemable deposits and short-term investments with an insignificant risk of change in value. They are readily convertible to cash, part in R$, indexed to the Brazilian Interbank Interest rate (“DI Rate”or”CDI”) and part denominated in US$, mainly time deposits. c) Loans and borrowings i) Total debt Current liabilities Non-current liabilities
September 30, 2017 December 31, 2016 September 30, 2017 December 31, 2016
Debt contracts in the international markets Floating rates in: US$ 295 234 4,008 5,489 EUR - - 236 211 Fixed rates in: US$ - - 12,583 13,083 EUR - - 886 1,583 Other currencies 17 17 208 209 Accrued charges 270 304 - -
582 555 17,921 20,575
Debt contracts in Brazil Floating rates in: R$, indexed to TJLP, TR, IPCA, IGP-M and CDI 506 402 4,848 5,621 Basket of currencies and US$ indexed to LIBOR 367 343 978 1,217 Fixed rates in: R$ 71 66 198 216 Accrued charges 312 294 7 33
1,256 1,105 6,031 7,087
1,838 1,660 23,952 27,662
25
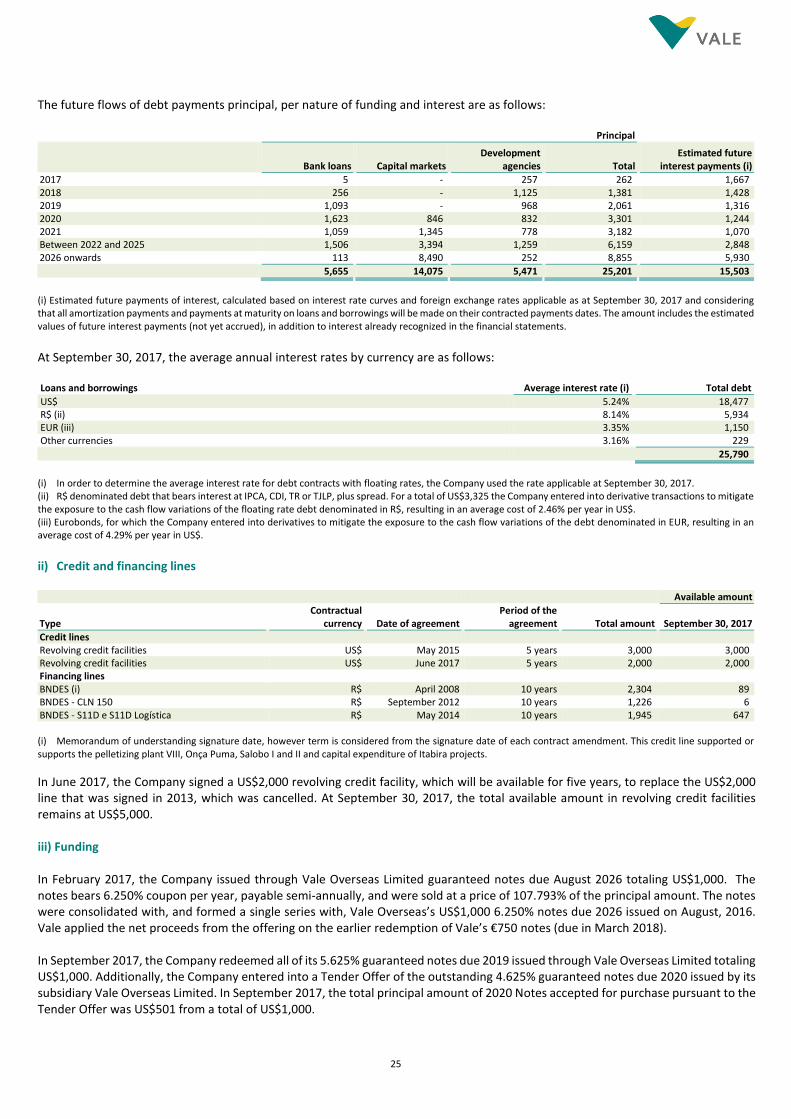
The future flows of debt payments principal, per nature of funding and interest are as follows: Principal
Bank loans Capital markets Development
agencies Total Estimated future
interest payments (i)
2017 5 - 257 262 1,667 2018 256 - 1,125 1,381 1,428 2019 1,093 - 968 2,061 1,316 2020 1,623 846 832 3,301 1,244 2021 1,059 1,345 778 3,182 1,070 Between 2022 and 2025 1,506 3,394 1,259 6,159 2,848 2026 onwards 113 8,490 252 8,855 5,930
5,655 14,075 5,471 25,201 15,503
(i) Estimated future payments of interest, calculated based on interest rate curves and foreign exchange rates applicable as at September 30, 2017 and considering that all amortization payments and payments at maturity on loans and borrowings will be made on their contracted payments dates. The amount includes the estimated values of future interest payments (not yet accrued), in addition to interest already recognized in the financial statements.
At September 30, 2017, the average annual interest rates by currency are as follows: Loans and borrowings Average interest rate (i) Total debt
US$ 5.24% 18,477 R$ (ii) 8.14% 5,934 EUR (iii) 3.35% 1,150 Other currencies 3.16% 229
25,790
(i) In order to determine the average interest rate for debt contracts with floating rates, the Company used the rate applicable at September 30, 2017. (ii) R$ denominated debt that bears interest at IPCA, CDI, TR or TJLP, plus spread. For a total of US$3,325 the Company entered into derivative transactions to mitigate the exposure to the cash flow variations of the floating rate debt denominated in R$, resulting in an average cost of 2.46% per year in US$. (iii) Eurobonds, for which the Company entered into derivatives to mitigate the exposure to the cash flow variations of the debt denominated in EUR, resulting in an average cost of 4.29% per year in US$.
ii) Credit and financing lines Available amount
Type Contractual
currency Date of agreement Period of the
agreement Total amount September 30, 2017
Credit lines Revolving credit facilities US$ May 2015 5 years 3,000 3,000 Revolving credit facilities US$ June 2017 5 years 2,000 2,000 Financing lines BNDES (i) R$ April 2008 10 years 2,304 89 BNDES - CLN 150 R$ September 2012 10 years 1,226 6 BNDES - S11D e S11D Logística R$ May 2014 10 years 1,945 647 (i) Memorandum of understanding signature date, however term is considered from the signature date of each contract amendment. This credit line supported or supports the pelletizing plant VIII, Onça Puma, Salobo I and II and capital expenditure of Itabira projects.
In June 2017, the Company signed a US$2,000 revolving credit facility, which will be available for five years, to replace the US$2,000 line that was signed in 2013, which was cancelled. At September 30, 2017, the total available amount in revolving credit facilities remains at US$5,000. iii) Funding In February 2017, the Company issued through Vale Overseas Limited guaranteed notes due August 2026 totaling US$1,000. The notes bears 6.250% coupon per year, payable semi-annually, and were sold at a price of 107.793% of the principal amount. The notes were consolidated with, and formed a single series with, Vale Overseas’s US$1,000 6.250% notes due 2026 issued on August, 2016. Vale applied the net proceeds from the offering on the earlier redemption of Vale’s €750 notes (due in March 2018). In September 2017, the Company redeemed all of its 5.625% guaranteed notes due 2019 issued through Vale Overseas Limited totaling US$1,000. Additionally, the Company entered into a Tender Offer of the outstanding 4.625% guaranteed notes due 2020 issued by its subsidiary Vale Overseas Limited. In September 2017, the total principal amount of 2020 Notes accepted for purchase pursuant to the Tender Offer was US$501 from a total of US$1,000.
26
iv) Guarantees As at September 30, 2017 and December 31, 2016, loans and borrowings are secured by property, plant and equipment and receivables in the amount of US$378 and US$472, respectively. The securities issued through Vale’s 100%-owned finance subsidiary Vale Overseas Limited are fully and unconditionally guaranteed by Vale. v) Covenants Some of the Company’s debt agreements with lenders contain financial covenants. The primary financial covenants in those agreements require maintaining certain ratios, such as debt to EBITDA and interest coverage. The Company has not identified any instances of noncompliance as at September 30, 2017 and December 31, 2016. vi) Hedge in foreign operations Implementation of net investment hedge As at January 1, 2017, Vale S.A., which the functional currency is Reais, designated its debts in US$ and Euro, as an instrument in a hedge of its investment in foreign operations (Vale International S.A. and Vale International Holding GmbH; hedging objects) to mitigate part of the foreign exchange risk on financial statements. At September 30, 2017 the carrying value of the designated debts are US$6,162 and EUR750. The foreign exchange gains of US$290 and US$162 (US$191 and US$107, net of taxes), were recognized in the “Cumulative translation adjustments” in stockholders’ equity for the three and nine month periods ended September 30, 2017, respectively. This hedge was highly effective throughout the period ended on September 30, 2017. Accounting policy Foreign currency differences arising on the translation of a financial liability designated as a hedge of a net investment in a foreign operation are recognized in other comprehensive income to the extent that the hedge is effective and regardless of whether the net investment is held directly or through an intermediate parent. The hedging instrument is accounted for in the same way as a cash flow hedge, i.e. translated at the closing rate with the gain or loss on the effective hedge being recognized in equity. Gains or losses in the reserves will only be realized when the foreign operation is disposed of.
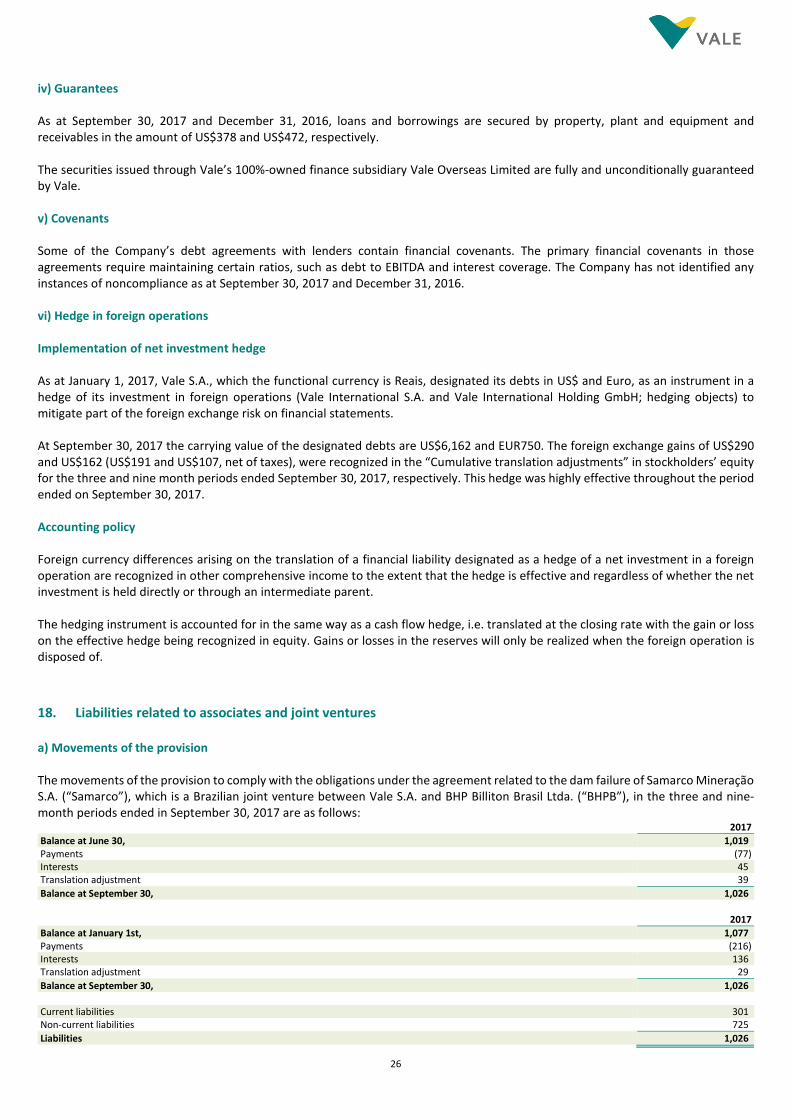
18. Liabilities related to associates and joint ventures a) Movements of the provision The movements of the provision to comply with the obligations under the agreement related to the dam failure of Samarco Mineração S.A. (“Samarco”), which is a Brazilian joint venture between Vale S.A. and BHP Billiton Brasil Ltda. (“BHPB”), in the three and nine-month periods ended in September 30, 2017 are as follows: 2017
Balance at June 30, 1,019 Payments (77) Interests 45 Translation adjustment 39
Balance at September 30, 1,026 2017
Balance at January 1st, 1,077 Payments (216) Interests 136 Translation adjustment 29
Balance at September 30, 1,026 Current liabilities 301 Non-current liabilities 725
Liabilities 1,026
27
In addition to the provision above, Vale S.A. made available in the three-month and nine-month periods ended in September 30, 2017 the amount US$26 (R$78 million) and US$117 (R$370 million), respectively, to fund the working capital of Samarco, which was recognized in Vale´s income statement as “Impairment and other results in associates and joint ventures”. Vale S.A might make available until December, 2017 of up to US$51 (R$188 million) to Samarco to support its operations, without undertaking an obligation to Samarco. Funds for working capital requirements will be released as needed by the shareholder’s subject to achieving certain milestone, on the same basis. At each reporting period, Vale S.A. will reassess the key assumptions used by Samarco in the preparation of the projected future cash flows and will adjust the provision, if required. b) Contingencies related to Samarco accident (i) Public civil lawsuit filed by the Federal Government and others The federal government, the two Brazilian states affected by the failure (Espirito Santo and Minas Gerais) and other governmental authorities have initiated a public civil lawsuit against Samarco and its shareholders, Vale S.A. and BHPB, with an estimated value indicated by the plaintiffs of US$6,3 billion (R$20.2 billion). On May 5, 2016, the Framework Agreement, which was signed on March 2, 2016, was ratified by the Federal Regional Court (“TRF”), 1st Region. In June 2016 the Superior Court of Justice (“STJ”) in Brazil issued an interim order, suspending the decision of TRF, which ratified the Framework Agreement until the final judgments of the claim. On August 17, 2016, the TRF of the 1st Region rejected the appeal presented by Samarco, Vale S.A. and BHPB against the interim order, and overruled the judicial decision that ratified the Framework Agreement. This decision of the TRF of the 1st Region, among other measures, confirmed a prior injunction that prohibited the defendants from transferring or conveying any of their interest in its Brazilian iron ore concessions, without, however, limiting their production and commercial activities and ordered a deposit with the court of US$379 (R$1.2 billion) by January 2017. This US$379 (R$1.2 billion) cash deposit was provisionally replaced by the guarantees provided for under the agreements with MPF, as detailed in the item (ii) below. (ii) Public civil lawsuit filed by Federal Prosecution Office On May 3, 2016, the Federal Prosecution Office (MPF) filed a public civil lawsuit against Samarco and its shareholders and presented several demands, including: (i) the adoption of measures for mitigating the social, economic and environmental impacts resulting from the Fundão dam failure and other emergency measures; (ii) the payment of compensation to the community; and (iii) payments for the collective moral damage. The estimated action value indicated by the Federal Prosecution Office (MPF) is US$49 billion (R$155 billion). The first conciliatory hearing was held on September 13, 2016. On November 21, 2016, the court ordered that the defendants be served, and the defendants submitted their defense. In January 2017 Samarco, Vale S.A. and BHPB entered into two preliminary agreements with the Federal Prosecutor’s Office in Brazil (MPF). The first agreement (“First Agreement”) aims to outline the process and timeline for negotiations of a Final Agreement (“Final Agreement”), initially expected to occur by June 30, 2017 and now expected to occur by October 30, 2017. This First Agreement establishes a timeline and actions to set the ground for conciliation of two public civil lawsuits which aim to establish socio-economic and socio-environmental remediation and compensation programs for the impacts of the Fundão dam failure, respectively: claim nº 023863-07.2016.4.01.3800, filed by the Federal Prosecutors, as mentioned in this item, and claim nº 0069758-61.2015.4.01.3400, filed by the Federal Government, the states of Minas Gerais and Espírito Santo and other governmental authorities, as mentioned in the item (i) above. Both claims were filed with the 12th Judicial Federal Court of Belo Horizonte and are suspended as requested by the parties. In addition, the First Agreement provides for: (i) the appointment of experts to give support the Federal Prosecutors and paid for by the companies to conduct a diagnosis and monitor the progress of the 41 programs under the Framework Agreement signed on March 2nd, 2016 by the companies and the Federal Government and the states of Minas Gerais and Espírito Santo and other governmental authorities, and (ii) holding at least eleven public hearings, five of which are to be held in Minas Gerais, three in Espírito Santo and the remainder in the indigenous territories of the Krenak, Comboios and Caieiras Velhas, in order to allow these communities to take part in the definition of the content of the Final Agreement.
28
Samarco, Vale S.A. and BHPB has agreed to provide the 12th Judicial Federal Court of Belo Horizonte with a guarantee for fulfillment of the obligations regarding the financing and payment of the socio-environmental and socio-economic remediation programs resulting from the Fundão dam failure, pursuant to the two public civil actions, until the signing of the Final Agreement, amounting to US$694 (R$2.2 billion), of which (i) US$32 (R$100 million) in financial investments; (ii) US$410 (R$1.3 billion) in insurance bonds; and (iii) US$253 (R$800 million) in assets of Samarco. In order to implement the First Agreement, it has been requested that the 12th Judicial Federal Court of Belo Horizonte accept such guarantees until the completion of the negotiations and the signing of the Final Agreement, or until the deadline set by the parties – jointly postponed to October 30, 2017 –, whichever comes first; or until the parties reach a new agreement regarding the guarantees. If, by October 30th, the negotiations have not been completed, the Federal Prosecutor’s Office may require that the 12th Judicial Federal Court of Belo Horizonte re-institute the order for the deposit of US$379 (R$1.2 billion) in relation to the US$6.4 billion (R$20.2 billion) public civil action, which is currently suspended. The parties requested the partially ratification of the First Agreement, excluding only the engagement of the socio-economic expert condition. On March 16, 2017, the 12th Judicial Federal Court of Belo Horizonte partially ratified the First Agreement, being that this decision includes: (i) ratification of the engagement of experts to perform a socio-environmental impact assessment and assessment of programs under the Framework Agreement signed on March 2nd, 2016 and a period for the companies to engage an expert to perform the socio-economic impact assessment; (ii) the consolidation and suspension of related claims aiming to avoid contradictory or conflicting decisions and to establish a unified judicial procedure in order for the parties to be able to reach a final agreement; (iii) accepted the guarantees proposed by Samarco and its shareholders under the Preliminary Agreement on a temporary basis. Parties are still negotiating an agreement regarding the choice of the expert to perform the socio-economic impact assessment, and, alongside, are conducting the discussions regarding the Final Agreement. In addition, the Second Agreement (Second Agreement) was signed on January 19, 2017, which establishes a timetable to make funds available to remediate the social, economic and environmental damages caused by the Fundão dam failure in the municipalities of Barra Longa, Rio Doce, Santa Cruz do Escalvado and Ponte Nova, amounting to US$63 (R$200 million). The 12th Judicial Federal Court of Belo Horizonte ratified this Second Agreement. (iii) U.S. Securities class action suits Related to the Vale´s American Depositary Receipts On May 2, 2016, Vale S.A. and certain of its officers were named as defendants in securities class action suits in the Federal Court in New York brought by holders of Vale’s American Depositary Receipts under U.S. federal securities laws. The lawsuits allege that Vale S.A. made false and misleading statements or did not make disclosures concerning the risks and dangers of the operations of Samarco's Fundão dam and the adequacy of related programs and procedures. The plaintiffs have not specified an amount of alleged damages or indemnities in these actions. In July 2016, Vale S.A. and the individual defendants filed a motion to dismiss the Amended Complaint. On March 23, 2017 the judge issued a decision rejecting a significant portion of the claims against Vale S.A. and the individual defendants, and determining the prosecution of the action with respect to more limited claims. The portion of plaintiffs' case that remains is related to certain statements about procedures, policies and risk mitigation plans contained in Vale S.A.'s sustainability reports in 2013 and 2014, and certain statements regarding to the responsibility of Vale S.A. for the Fundão dam failure made in a conference call in November 2015. At the end of April 2017, it has started the Discovery phase, the plaintiffs have presented their Initial Disclosures, requesting the presentation of several sets of documents and listing and requesting names of persons that might be aware of the facts related to the action. On May 5, 2017 Vale S.A. has presented its Initial Disclosures. The Discovery is currently ongoing with the gathering of documents to be provided to the plaintiffs. Vale S.A. continues to contest the lawsuit and the outstanding points. Related to the Samarco bonds In March 2017, holders of bonds issued by Samarco, filed a class action suit in the Federal Court in New York against Samarco, Vale S.A. and BHPB under U.S. federal securities laws demanding for indemnification for alleged violation of U.S. federal securities laws. The plaintiffs allege that false and misleading statements were made or disclosures omitted concerning the risks and dangers of the operations of Samarco's Fundão dam and the adequacy of related programs and procedures.
29
It is alleged that with the Fundão dam collapse, the securities have dramatically decreased, in order that the investors who have purchased such securities in a misleading way should be compensated, without, however, specifying an amount for the alleged damages or indemnities in this action. In June 2017, Vale S.A. and the other defendants have jointly filed a Motion to Dismiss the Complaint. The Motion to Dismiss was responded by the plaintiffs and jointly replied by Vale S.A. and other defendants on August 31, 2017. A decision ruling the Motion to Dismiss is expected by Vale S.A. and other defendants. Vale S.A. continues to contest this lawsuit. (iv) Criminal lawsuit On October 20, 2016, the MPF brought a criminal lawsuit in the Brazilian Federal Justice Court against Vale S.A., BHPB, Samarco, VogBr Recursos Hídricos e Geotecnia Ltda. and 22 individuals for alleged crimes against the environment, urban planning and cultural heritage, flooding, landslide, as well as for alleged crimes against the victims of the Fundão dam failure. On November 16, 2016, the judge received the Federal Prosecutors Office criminal lawsuit and determined the summons of all defendants, granting 30 days each to file their defenses, to count from the day they receive the summon. Vale has already been served and its defense was presented in March 3, 2017. On May 8, 2017, Vale presented its manifestation against the Federal Prosecutors Office dismemberment requests and on June 6, 2017, the Federal Prosecutors Office presented its reply to the defenses, where it requested for the action to be regularly processed. On July 5, 2017, the judge decided to suspend the criminal lawsuit. (v) Other lawsuits In addition, Samarco and its shareholders were named as a defendant in several other lawsuits brought by individuals, corporations, governmental entities or public prosecutor seeking personal and property damages. These lawsuits and petitions are at early stages, so it is not possible to determine a range of outcomes or reliable estimates of the potential exposure at this time. No contingent liability has been quantified and no provision was recognized for lawsuits related to Samarco´s dam failure.
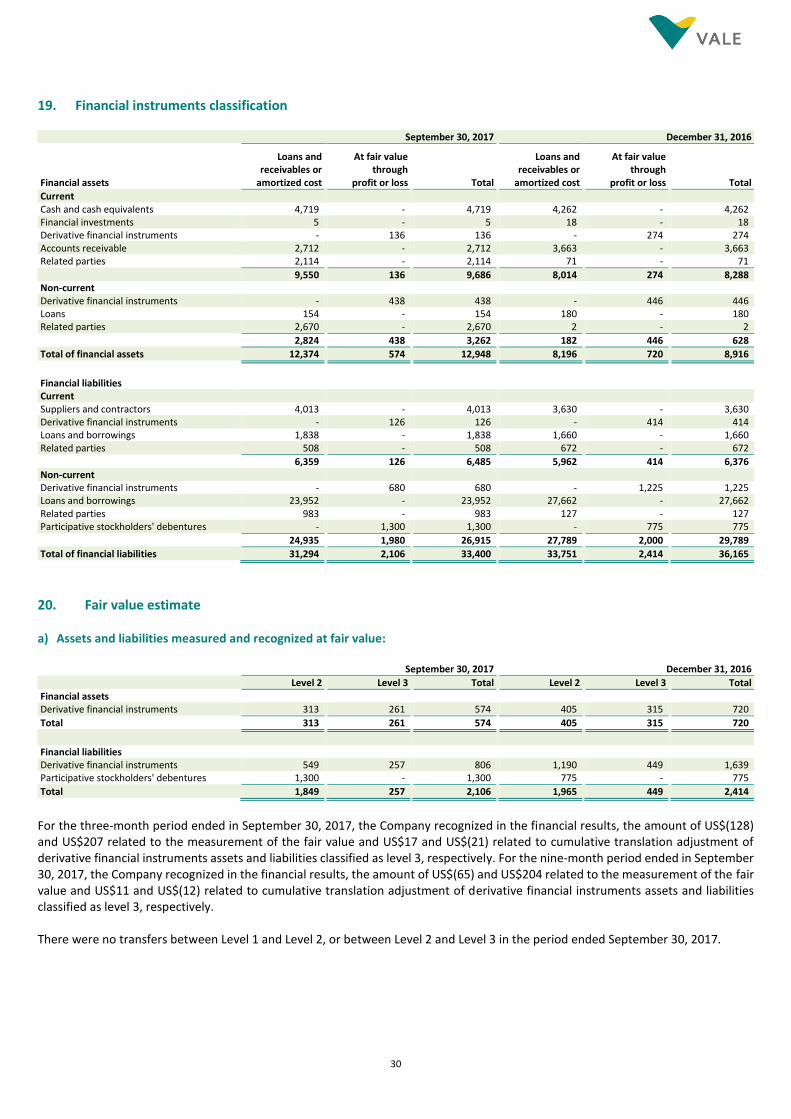
30
19. Financial instruments classification September 30, 2017 December 31, 2016
Financial assets
Loans and receivables or
amortized cost
At fair value through
profit or loss Total
Loans and receivables or
amortized cost
At fair value through
profit or loss Total
Current Cash and cash equivalents 4,719 - 4,719 4,262 - 4,262 Financial investments 5 - 5 18 - 18 Derivative financial instruments - 136 136 - 274 274 Accounts receivable 2,712 - 2,712 3,663 - 3,663 Related parties 2,114 - 2,114 71 - 71
9,550 136 9,686 8,014 274 8,288 Non-current Derivative financial instruments - 438 438 - 446 446 Loans 154 - 154 180 - 180 Related parties 2,670 - 2,670 2 - 2
2,824 438 3,262 182 446 628
Total of financial assets 12,374 574 12,948 8,196 720 8,916
Financial liabilities Current Suppliers and contractors 4,013 - 4,013 3,630 - 3,630 Derivative financial instruments - 126 126 - 414 414 Loans and borrowings 1,838 - 1,838 1,660 - 1,660 Related parties 508 - 508 672 - 672
6,359 126 6,485 5,962 414 6,376 Non-current Derivative financial instruments - 680 680 - 1,225 1,225 Loans and borrowings 23,952 - 23,952 27,662 - 27,662 Related parties 983 - 983 127 - 127 Participative stockholders' debentures - 1,300 1,300 - 775 775
24,935 1,980 26,915 27,789 2,000 29,789
Total of financial liabilities 31,294 2,106 33,400 33,751 2,414 36,165
20. Fair value estimate a) Assets and liabilities measured and recognized at fair value: September 30, 2017 December 31, 2016
Level 2 Level 3 Total Level 2 Level 3 Total
Financial assets Derivative financial instruments 313 261 574 405 315 720
Total 313 261 574 405 315 720
Financial liabilities Derivative financial instruments 549 257 806 1,190 449 1,639 Participative stockholders' debentures 1,300 - 1,300 775 - 775
Total 1,849 257 2,106 1,965 449 2,414
For the three-month period ended in September 30, 2017, the Company recognized in the financial results, the amount of US$(128) and US$207 related to the measurement of the fair value and US$17 and US$(21) related to cumulative translation adjustment of derivative financial instruments assets and liabilities classified as level 3, respectively. For the nine-month period ended in September 30, 2017, the Company recognized in the financial results, the amount of US$(65) and US$204 related to the measurement of the fair value and US$11 and US$(12) related to cumulative translation adjustment of derivative financial instruments assets and liabilities classified as level 3, respectively. There were no transfers between Level 1 and Level 2, or between Level 2 and Level 3 in the period ended September 30, 2017.
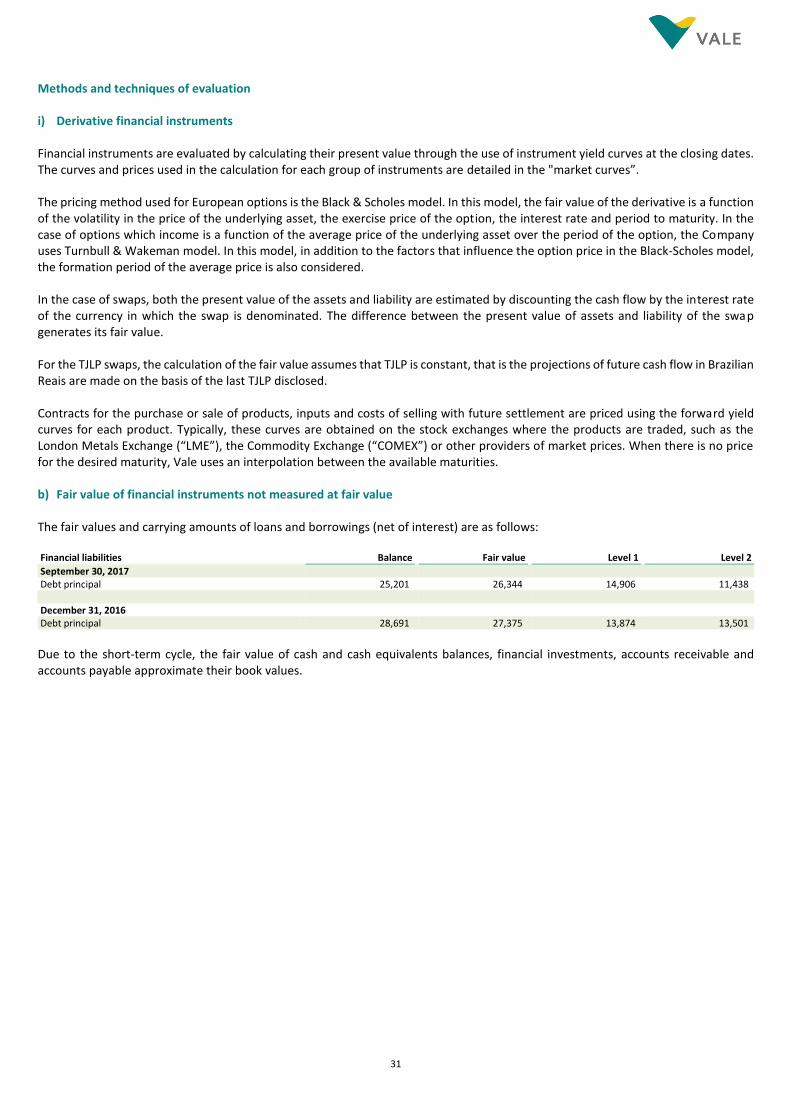
31
Methods and techniques of evaluation i) Derivative financial instruments Financial instruments are evaluated by calculating their present value through the use of instrument yield curves at the closing dates. The curves and prices used in the calculation for each group of instruments are detailed in the "market curves”. The pricing method used for European options is the Black & Scholes model. In this model, the fair value of the derivative is a function of the volatility in the price of the underlying asset, the exercise price of the option, the interest rate and period to maturity. In the case of options which income is a function of the average price of the underlying asset over the period of the option, the Company uses Turnbull & Wakeman model. In this model, in addition to the factors that influence the option price in the Black-Scholes model, the formation period of the average price is also considered. In the case of swaps, both the present value of the assets and liability are estimated by discounting the cash flow by the interest rate of the currency in which the swap is denominated. The difference between the present value of assets and liability of the swap generates its fair value. For the TJLP swaps, the calculation of the fair value assumes that TJLP is constant, that is the projections of future cash flow in Brazilian Reais are made on the basis of the last TJLP disclosed. Contracts for the purchase or sale of products, inputs and costs of selling with future settlement are priced using the forward yield curves for each product. Typically, these curves are obtained on the stock exchanges where the products are traded, such as the London Metals Exchange (“LME”), the Commodity Exchange (“COMEX”) or other providers of market prices. When there is no price for the desired maturity, Vale uses an interpolation between the available maturities. b) Fair value of financial instruments not measured at fair value The fair values and carrying amounts of loans and borrowings (net of interest) are as follows: Financial liabilities Balance Fair value Level 1 Level 2
September 30, 2017 Debt principal 25,201 26,344 14,906 11,438
December 31, 2016 Debt principal 28,691 27,375 13,874 13,501
Due to the short-term cycle, the fair value of cash and cash equivalents balances, financial investments, accounts receivable and accounts payable approximate their book values.
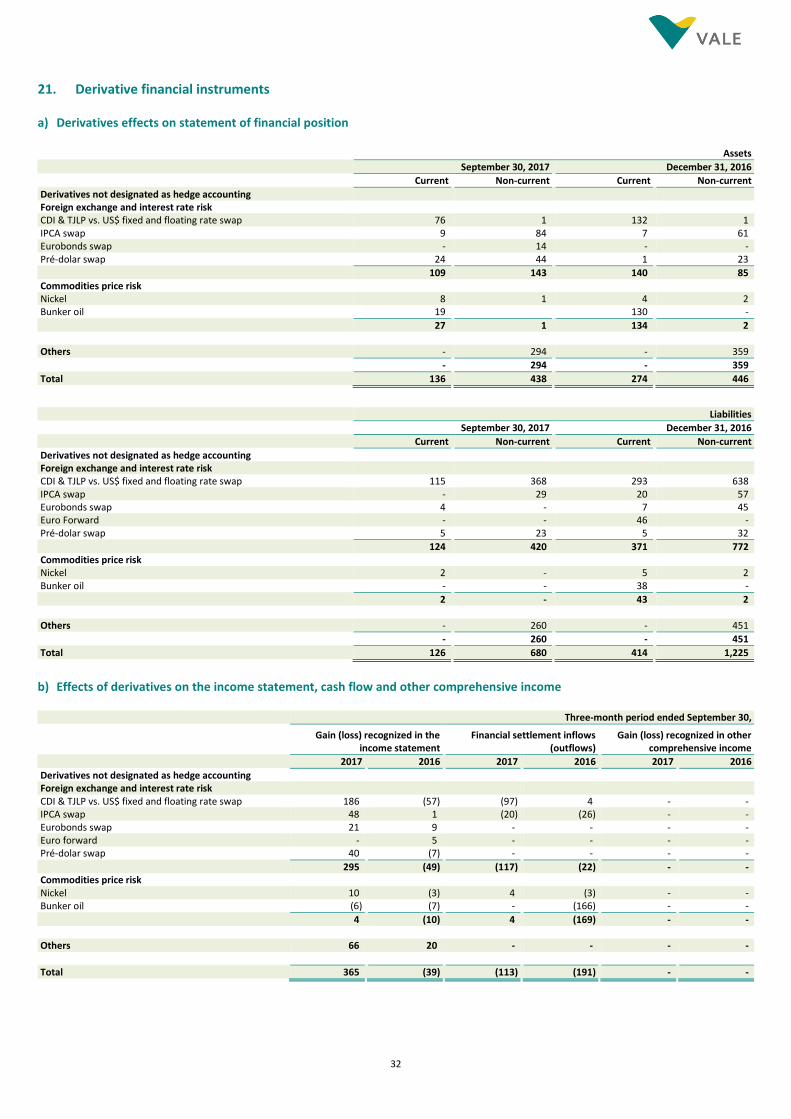
32
21. Derivative financial instruments a) Derivatives effects on statement of financial position Assets
September 30, 2017 December 31, 2016
Current Non-current Current Non-current
Derivatives not designated as hedge accounting Foreign exchange and interest rate risk CDI & TJLP vs. US$ fixed and floating rate swap 76 1 132 1 IPCA swap 9 84 7 61 Eurobonds swap - 14 - - Pré-dolar swap 24 44 1 23
109 143 140 85 Commodities price risk Nickel 8 1 4 2 Bunker oil 19 130 -
27 1 134 2 Others - 294 - 359
- 294 - 359
Total 136 438 274 446
Liabilities
September 30, 2017 December 31, 2016
Current Non-current Current Non-current
Derivatives not designated as hedge accounting Foreign exchange and interest rate risk CDI & TJLP vs. US$ fixed and floating rate swap 115 368 293 638 IPCA swap - 29 20 57 Eurobonds swap 4 - 7 45 Euro Forward - - 46 - Pré-dolar swap 5 23 5 32
124 420 371 772 Commodities price risk Nickel 2 - 5 2 Bunker oil - - 38 -
2 - 43 2 Others - 260 - 451
- 260 - 451
Total 126 680 414 1,225
b) Effects of derivatives on the income statement, cash flow and other comprehensive income Three-month period ended September 30,
Gain (loss) recognized in the
income statement Financial settlement inflows
(outflows) Gain (loss) recognized in other
comprehensive income
2017 2016 2017 2016 2017 2016
Derivatives not designated as hedge accounting Foreign exchange and interest rate risk CDI & TJLP vs. US$ fixed and floating rate swap 186 (57) (97) 4 - - IPCA swap 48 1 (20) (26) - - Eurobonds swap 21 9 - - - - Euro forward - 5 - - - - Pré-dolar swap 40 (7) - - - -
295 (49) (117) (22) - - Commodities price risk Nickel 10 (3) 4 (3) - - Bunker oil (6) (7) - (166) - -
4 (10) 4 (169) - - Others 66 20 - - - -
Total 365 (39) (113) (191) - -
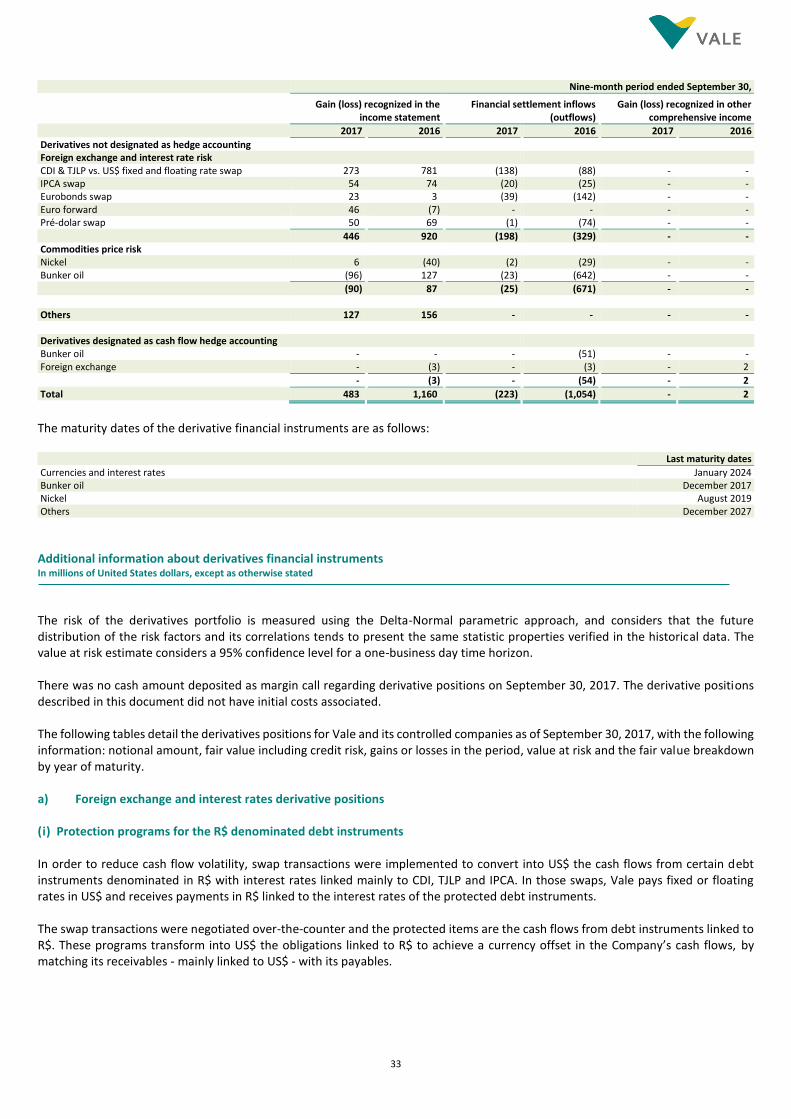
33
Nine-month period ended September 30,
Gain (loss) recognized in the
income statement Financial settlement inflows
(outflows) Gain (loss) recognized in other
comprehensive income
2017 2016 2017 2016 2017 2016
Derivatives not designated as hedge accounting Foreign exchange and interest rate risk CDI & TJLP vs. US$ fixed and floating rate swap 273 781 (138) (88) - - IPCA swap 54 74 (20) (25) - - Eurobonds swap 23 3 (39) (142) - - Euro forward 46 (7) - - - - Pré-dolar swap 50 69 (1) (74) - -
446 920 (198) (329) - - Commodities price risk Nickel 6 (40) (2) (29) - - Bunker oil (96) 127 (23) (642) - -
(90) 87 (25) (671) - - Others 127 156 - - - -
Derivatives designated as cash flow hedge accounting Bunker oil - - - (51) - - Foreign exchange - (3) - (3) - 2
- (3) - (54) - 2
Total 483 1,160 (223) (1,054) - 2
The maturity dates of the derivative financial instruments are as follows: Last maturity dates
Currencies and interest rates January 2024 Bunker oil December 2017 Nickel August 2019 Others December 2027
Additional information about derivatives financial instruments In millions of United States dollars, except as otherwise stated
The risk of the derivatives portfolio is measured using the Delta-Normal parametric approach, and considers that the future distribution of the risk factors and its correlations tends to present the same statistic properties verified in the historical data. The value at risk estimate considers a 95% confidence level for a one-business day time horizon. There was no cash amount deposited as margin call regarding derivative positions on September 30, 2017. The derivative positions described in this document did not have initial costs associated. The following tables detail the derivatives positions for Vale and its controlled companies as of September 30, 2017, with the following information: notional amount, fair value including credit risk, gains or losses in the period, value at risk and the fair value breakdown by year of maturity. a) Foreign exchange and interest rates derivative positions (i) Protection programs for the R$ denominated debt instruments In order to reduce cash flow volatility, swap transactions were implemented to convert into US$ the cash flows from certain debt instruments denominated in R$ with interest rates linked mainly to CDI, TJLP and IPCA. In those swaps, Vale pays fixed or floating rates in US$ and receives payments in R$ linked to the interest rates of the protected debt instruments. The swap transactions were negotiated over-the-counter and the protected items are the cash flows from debt instruments linked to R$. These programs transform into US$ the obligations linked to R$ to achieve a currency offset in the Company’s cash flows, by matching its receivables - mainly linked to US$ - with its payables.
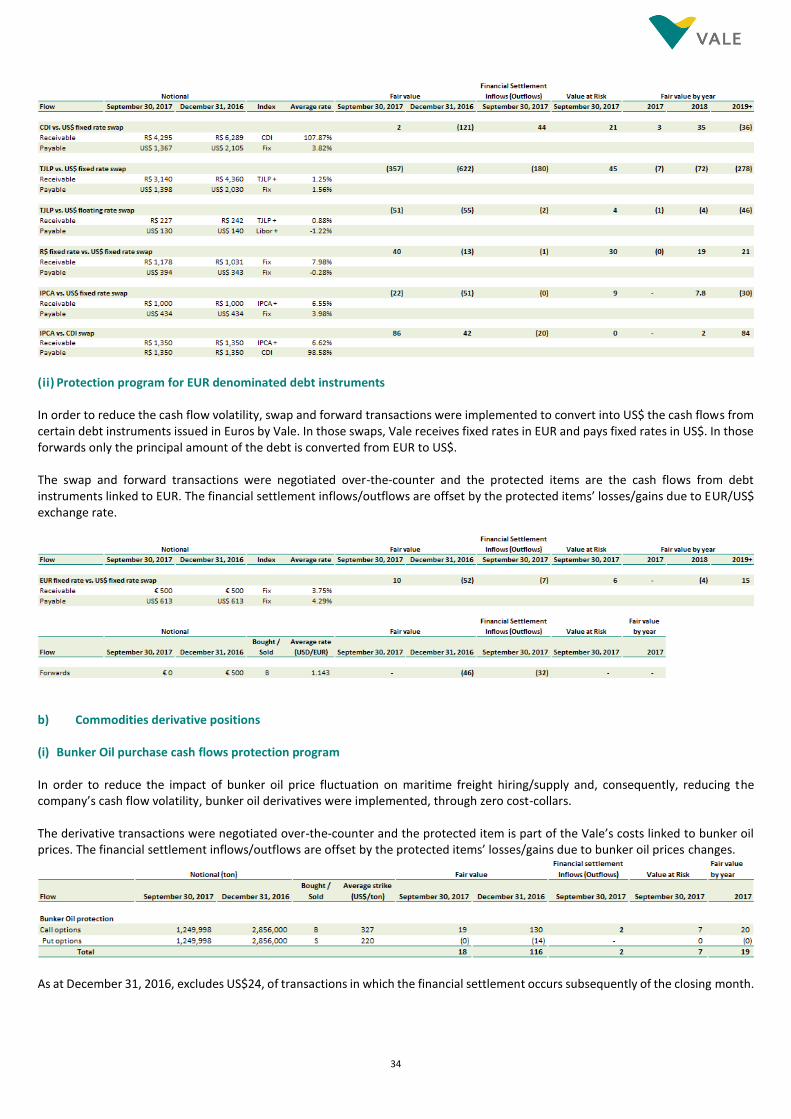
34
(ii) Protection program for EUR denominated debt instruments In order to reduce the cash flow volatility, swap and forward transactions were implemented to convert into US$ the cash flows from certain debt instruments issued in Euros by Vale. In those swaps, Vale receives fixed rates in EUR and pays fixed rates in US$. In those forwards only the principal amount of the debt is converted from EUR to US$. The swap and forward transactions were negotiated over-the-counter and the protected items are the cash flows from debt instruments linked to EUR. The financial settlement inflows/outflows are offset by the protected items’ losses/gains due to EUR/US$ exchange rate.
b) Commodities derivative positions (i) Bunker Oil purchase cash flows protection program In order to reduce the impact of bunker oil price fluctuation on maritime freight hiring/supply and, consequently, reducing the company’s cash flow volatility, bunker oil derivatives were implemented, through zero cost-collars. The derivative transactions were negotiated over-the-counter and the protected item is part of the Vale’s costs linked to bunker oil prices. The financial settlement inflows/outflows are offset by the protected items’ losses/gains due to bunker oil prices changes.
As at December 31, 2016, excludes US$24, of transactions in which the financial settlement occurs subsequently of the closing month.
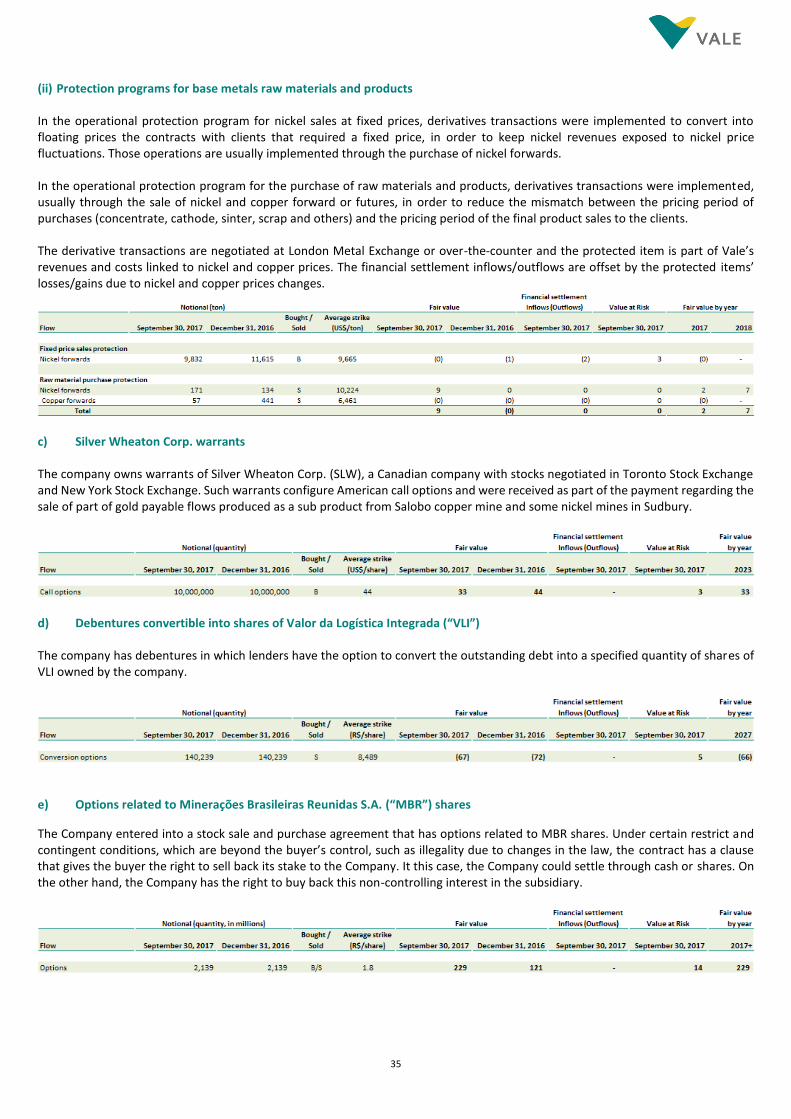
35
(ii) Protection programs for base metals raw materials and products
In the operational protection program for nickel sales at fixed prices, derivatives transactions were implemented to convert into floating prices the contracts with clients that required a fixed price, in order to keep nickel revenues exposed to nickel price fluctuations. Those operations are usually implemented through the purchase of nickel forwards. In the operational protection program for the purchase of raw materials and products, derivatives transactions were implemented, usually through the sale of nickel and copper forward or futures, in order to reduce the mismatch between the pricing period of purchases (concentrate, cathode, sinter, scrap and others) and the pricing period of the final product sales to the clients. The derivative transactions are negotiated at London Metal Exchange or over-the-counter and the protected item is part of Vale’s revenues and costs linked to nickel and copper prices. The financial settlement inflows/outflows are offset by the protected items’ losses/gains due to nickel and copper prices changes.
c) Silver Wheaton Corp. warrants The company owns warrants of Silver Wheaton Corp. (SLW), a Canadian company with stocks negotiated in Toronto Stock Exchange and New York Stock Exchange. Such warrants configure American call options and were received as part of the payment regarding the sale of part of gold payable flows produced as a sub product from Salobo copper mine and some nickel mines in Sudbury.
d) Debentures convertible into shares of Valor da Logística Integrada (“VLI”) The company has debentures in which lenders have the option to convert the outstanding debt into a specified quantity of shares of VLI owned by the company.
e) Options related to Minerações Brasileiras Reunidas S.A. (“MBR”) shares
The Company entered into a stock sale and purchase agreement that has options related to MBR shares. Under certain restrict and contingent conditions, which are beyond the buyer’s control, such as illegality due to changes in the law, the contract has a clause that gives the buyer the right to sell back its stake to the Company. It this case, the Company could settle through cash or shares. On the other hand, the Company has the right to buy back this non-controlling interest in the subsidiary.
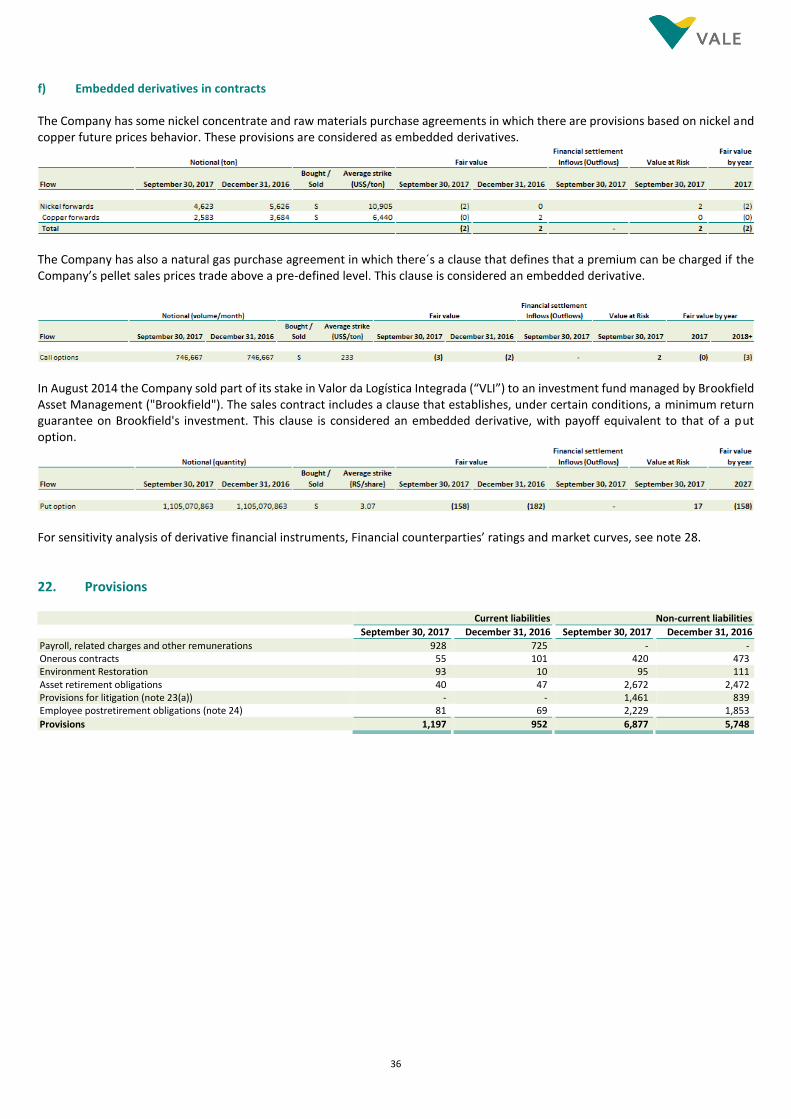
36
f) Embedded derivatives in contracts The Company has some nickel concentrate and raw materials purchase agreements in which there are provisions based on nickel and copper future prices behavior. These provisions are considered as embedded derivatives.
The Company has also a natural gas purchase agreement in which there´s a clause that defines that a premium can be charged if the Company’s pellet sales prices trade above a pre-defined level. This clause is considered an embedded derivative.
In August 2014 the Company sold part of its stake in Valor da Logística Integrada (“VLI”) to an investment fund managed by Brookfield Asset Management ("Brookfield"). The sales contract includes a clause that establishes, under certain conditions, a minimum return guarantee on Brookfield's investment. This clause is considered an embedded derivative, with payoff equivalent to that of a put option.
For sensitivity analysis of derivative financial instruments, Financial counterparties’ ratings and market curves, see note 28.
22. Provisions Current liabilities Non-current liabilities
September 30, 2017 December 31, 2016 September 30, 2017 December 31, 2016
Payroll, related charges and other remunerations 928 725 - - Onerous contracts 55 101 420 473 Environment Restoration 93 10 95 111 Asset retirement obligations 40 47 2,672 2,472 Provisions for litigation (note 23(a)) - - 1,461 839 Employee postretirement obligations (note 24) 81 69 2,229 1,853
Provisions 1,197 952 6,877 5,748
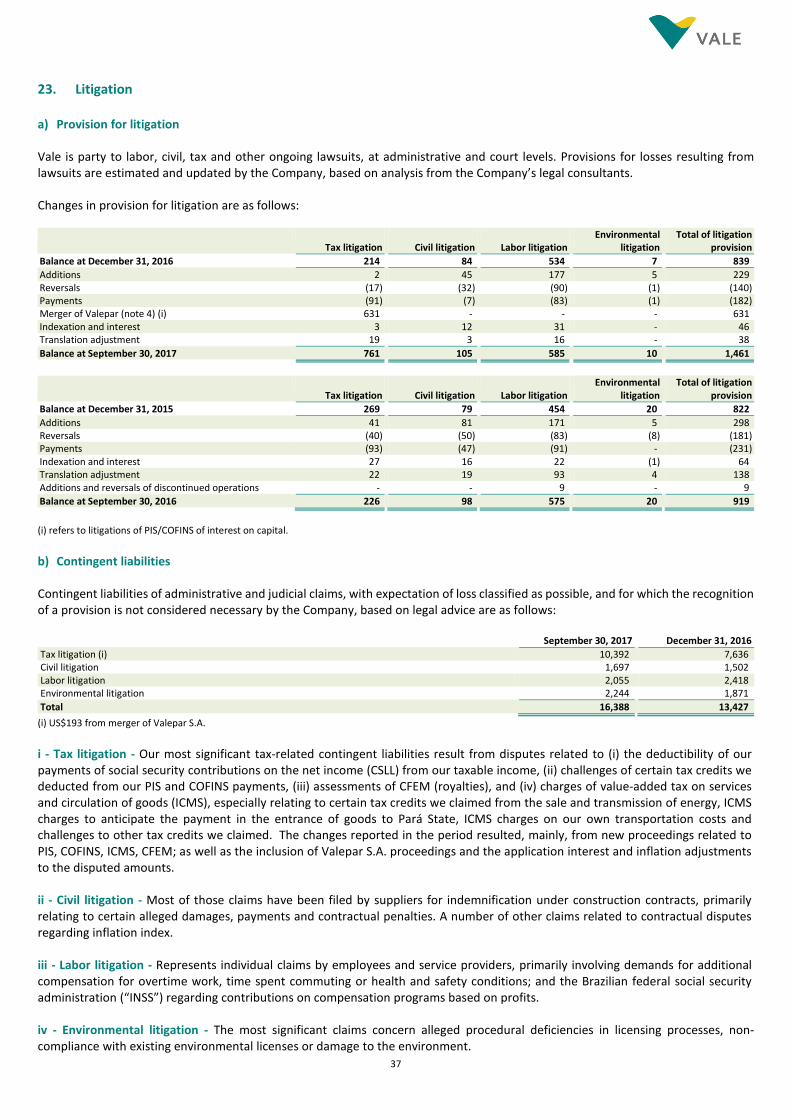
37
23. Litigation a) Provision for litigation Vale is party to labor, civil, tax and other ongoing lawsuits, at administrative and court levels. Provisions for losses resulting from lawsuits are estimated and updated by the Company, based on analysis from the Company’s legal consultants. Changes in provision for litigation are as follows:
Tax litigation Civil litigation Labor litigation Environmental
litigation Total of litigation
provision
Balance at December 31, 2016 214 84 534 7 839
Additions 2 45 177 5 229 Reversals (17) (32) (90) (1) (140) Payments (91) (7) (83) (1) (182) Merger of Valepar (note 4) (i) 631 - - - 631 Indexation and interest 3 12 31 - 46 Translation adjustment 19 3 16 - 38
Balance at September 30, 2017 761 105 585 10 1,461
Tax litigation Civil litigation Labor litigation Environmental
litigation Total of litigation
provision
Balance at December 31, 2015 269 79 454 20 822
Additions 41 81 171 5 298 Reversals (40) (50) (83) (8) (181) Payments (93) (47) (91) - (231) Indexation and interest 27 16 22 (1) 64 Translation adjustment 22 19 93 4 138 Additions and reversals of discontinued operations - - 9 - 9
Balance at September 30, 2016 226 98 575 20 919
(i) refers to litigations of PIS/COFINS of interest on capital. b) Contingent liabilities Contingent liabilities of administrative and judicial claims, with expectation of loss classified as possible, and for which the recognition of a provision is not considered necessary by the Company, based on legal advice are as follows: September 30, 2017 December 31, 2016
Tax litigation (i) 10,392 7,636 Civil litigation 1,697 1,502 Labor litigation 2,055 2,418 Environmental litigation 2,244 1,871
Total 16,388 13,427
(i) US$193 from merger of Valepar S.A. i - Tax litigation - Our most significant tax-related contingent liabilities result from disputes related to (i) the deductibility of our payments of social security contributions on the net income (CSLL) from our taxable income, (ii) challenges of certain tax credits we deducted from our PIS and COFINS payments, (iii) assessments of CFEM (royalties), and (iv) charges of value-added tax on services and circulation of goods (ICMS), especially relating to certain tax credits we claimed from the sale and transmission of energy, ICMS charges to anticipate the payment in the entrance of goods to Pará State, ICMS charges on our own transportation costs and challenges to other tax credits we claimed. The changes reported in the period resulted, mainly, from new proceedings related to PIS, COFINS, ICMS, CFEM; as well as the inclusion of Valepar S.A. proceedings and the application interest and inflation adjustments to the disputed amounts. ii - Civil litigation - Most of those claims have been filed by suppliers for indemnification under construction contracts, primarily relating to certain alleged damages, payments and contractual penalties. A number of other claims related to contractual disputes regarding inflation index. iii - Labor litigation - Represents individual claims by employees and service providers, primarily involving demands for additional compensation for overtime work, time spent commuting or health and safety conditions; and the Brazilian federal social security administration (“INSS”) regarding contributions on compensation programs based on profits. iv - Environmental litigation - The most significant claims concern alleged procedural deficiencies in licensing processes, non-compliance with existing environmental licenses or damage to the environment.
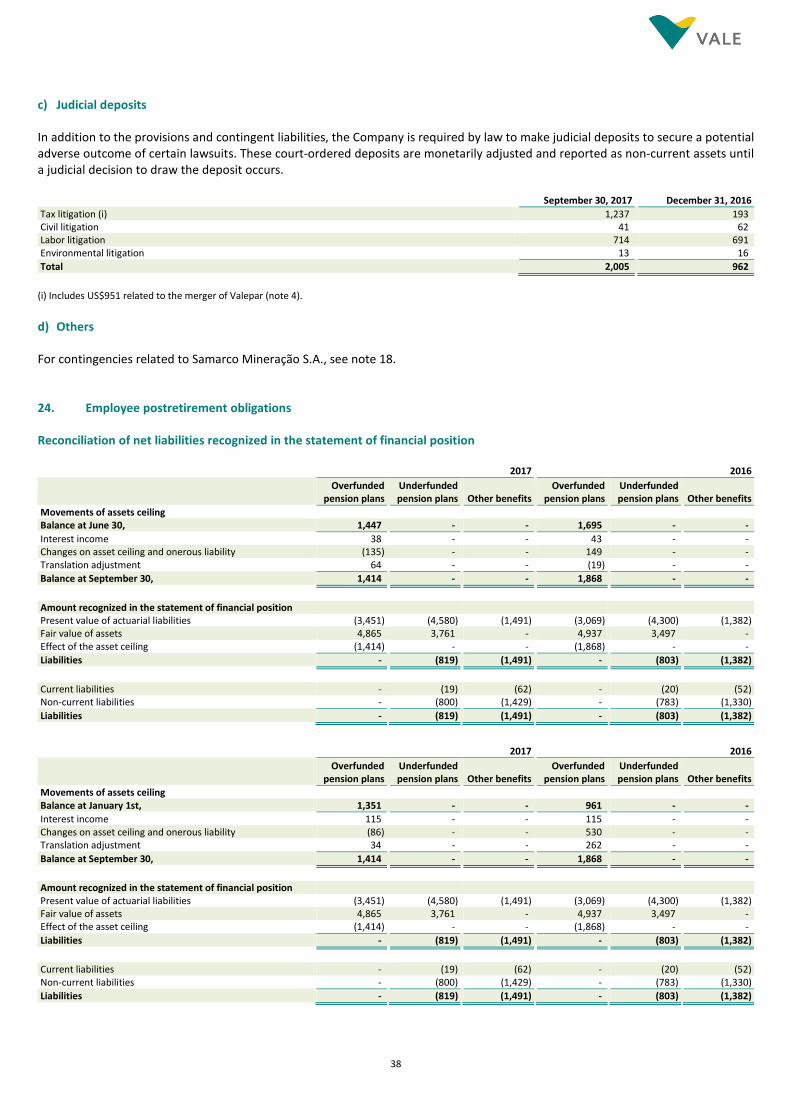
38
c) Judicial deposits In addition to the provisions and contingent liabilities, the Company is required by law to make judicial deposits to secure a potential adverse outcome of certain lawsuits. These court-ordered deposits are monetarily adjusted and reported as non-current assets until a judicial decision to draw the deposit occurs. September 30, 2017 December 31, 2016
Tax litigation (i) 1,237 193 Civil litigation 41 62 Labor litigation 714 691 Environmental litigation 13 16
Total 2,005 962
(i) Includes US$951 related to the merger of Valepar (note 4).
d) Others For contingencies related to Samarco Mineração S.A., see note 18. 24. Employee postretirement obligations Reconciliation of net liabilities recognized in the statement of financial position 2017 2016
Overfunded
pension plans Underfunded pension plans Other benefits
Overfunded pension plans
Underfunded pension plans Other benefits
Movements of assets ceiling Balance at June 30, 1,447 - - 1,695 - -
Interest income 38 - - 43 - - Changes on asset ceiling and onerous liability (135) - - 149 - - Translation adjustment 64 - - (19) - -
Balance at September 30, 1,414 - - 1,868 - -
Amount recognized in the statement of financial position Present value of actuarial liabilities (3,451) (4,580) (1,491) (3,069) (4,300) (1,382) Fair value of assets 4,865 3,761 - 4,937 3,497 - Effect of the asset ceiling (1,414) - - (1,868) - -
Liabilities - (819) (1,491) - (803) (1,382)
Current liabilities - (19) (62) - (20) (52) Non-current liabilities - (800) (1,429) - (783) (1,330)
Liabilities - (819) (1,491) - (803) (1,382)
2017 2016
Overfunded
pension plans Underfunded pension plans Other benefits
Overfunded pension plans
Underfunded pension plans Other benefits
Movements of assets ceiling Balance at January 1st, 1,351 - - 961 - -
Interest income 115 - - 115 - - Changes on asset ceiling and onerous liability (86) - - 530 - - Translation adjustment 34 - - 262 - -
Balance at September 30, 1,414 - - 1,868 - -
Amount recognized in the statement of financial position Present value of actuarial liabilities (3,451) (4,580) (1,491) (3,069) (4,300) (1,382) Fair value of assets 4,865 3,761 - 4,937 3,497 - Effect of the asset ceiling (1,414) - - (1,868) - -
Liabilities - (819) (1,491) - (803) (1,382)
Current liabilities - (19) (62) - (20) (52) Non-current liabilities - (800) (1,429) - (783) (1,330)
Liabilities - (819) (1,491) - (803) (1,382)
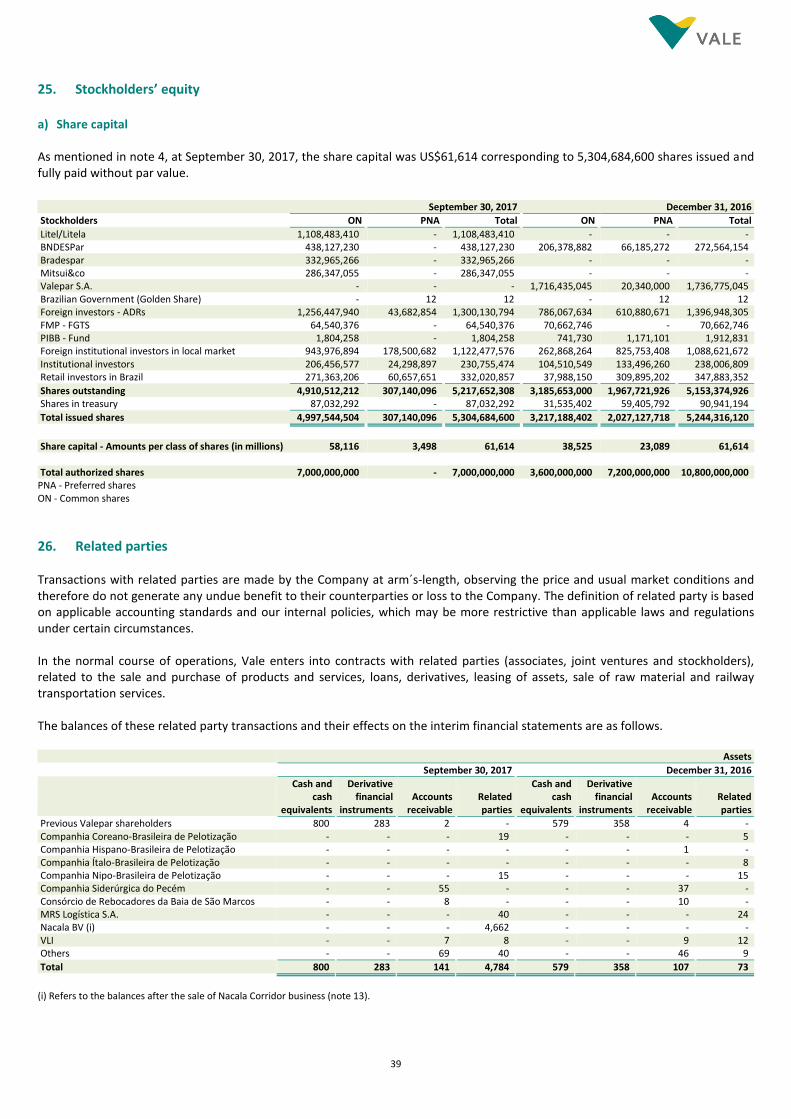
39
25. Stockholders’ equity a) Share capital As mentioned in note 4, at September 30, 2017, the share capital was US$61,614 corresponding to 5,304,684,600 shares issued and fully paid without par value.
September 30, 2017 December 31, 2016
Stockholders ON PNA Total ON PNA Total
Litel/Litela 1,108,483,410 - 1,108,483,410 - - - BNDESPar 438,127,230 - 438,127,230 206,378,882 66,185,272 272,564,154 Bradespar 332,965,266 - 332,965,266 - - - Mitsui&co 286,347,055 - 286,347,055 - - - Valepar S.A. - - - 1,716,435,045 20,340,000 1,736,775,045 Brazilian Government (Golden Share) - 12 12 - 12 12 Foreign investors - ADRs 1,256,447,940 43,682,854 1,300,130,794 786,067,634 610,880,671 1,396,948,305 FMP - FGTS 64,540,376 - 64,540,376 70,662,746 - 70,662,746 PIBB - Fund 1,804,258 - 1,804,258 741,730 1,171,101 1,912,831 Foreign institutional investors in local market 943,976,894 178,500,682 1,122,477,576 262,868,264 825,753,408 1,088,621,672 Institutional investors 206,456,577 24,298,897 230,755,474 104,510,549 133,496,260 238,006,809 Retail investors in Brazil 271,363,206 60,657,651 332,020,857 37,988,150 309,895,202 347,883,352
Shares outstanding 4,910,512,212 307,140,096 5,217,652,308 3,185,653,000 1,967,721,926 5,153,374,926 Shares in treasury 87,032,292 - 87,032,292 31,535,402 59,405,792 90,941,194
Total issued shares 4,997,544,504 307,140,096 5,304,684,600 3,217,188,402 2,027,127,718 5,244,316,120
Share capital - Amounts per class of shares (in millions) 58,116 3,498 61,614 38,525 23,089 61,614
Total authorized shares 7,000,000,000 - 7,000,000,000 3,600,000,000 7,200,000,000 10,800,000,000
PNA - Preferred shares ON - Common shares
26. Related parties Transactions with related parties are made by the Company at arm´s-length, observing the price and usual market conditions and therefore do not generate any undue benefit to their counterparties or loss to the Company. The definition of related party is based on applicable accounting standards and our internal policies, which may be more restrictive than applicable laws and regulations under certain circumstances. In the normal course of operations, Vale enters into contracts with related parties (associates, joint ventures and stockholders), related to the sale and purchase of products and services, loans, derivatives, leasing of assets, sale of raw material and railway transportation services. The balances of these related party transactions and their effects on the interim financial statements are as follows. Assets
September 30, 2017 December 31, 2016
Cash and cash
equivalents
Derivative financial
instruments Accounts
receivable Related parties
Cash and cash
equivalents
Derivative financial
instruments Accounts
receivable Related parties
Previous Valepar shareholders 800 283 2 - 579 358 4 - Companhia Coreano-Brasileira de Pelotização - - - 19 - - - 5 Companhia Hispano-Brasileira de Pelotização - - - - - - 1 - Companhia Ítalo-Brasileira de Pelotização - - - - - - - 8 Companhia Nipo-Brasileira de Pelotização - - - 15 - - - 15 Companhia Siderúrgica do Pecém - - 55 - - - 37 - Consórcio de Rebocadores da Baia de São Marcos - - 8 - - - 10 - MRS Logística S.A. - - - 40 - - - 24 Nacala BV (i) - - - 4,662 - - - - VLI - - 7 8 - - 9 12 Others - - 69 40 - - 46 9
Total 800 283 141 4,784 579 358 107 73
(i) Refers to the balances after the sale of Nacala Corridor business (note 13).
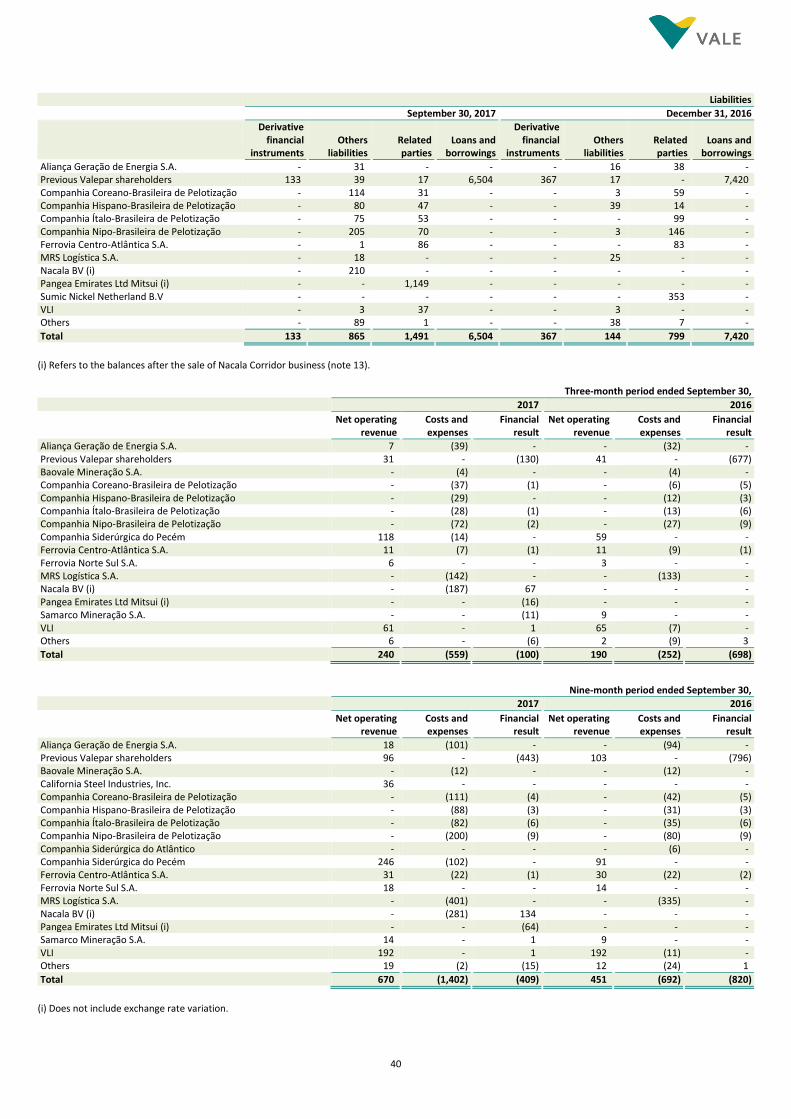
40
Liabilities
September 30, 2017 December 31, 2016
Derivative financial
instruments Others
liabilities Related parties
Loans and borrowings
Derivative financial
instruments Others
liabilities Related parties
Loans and borrowings
Aliança Geração de Energia S.A. - 31 - - - 16 38 - Previous Valepar shareholders 133 39 17 6,504 367 17 - 7,420 Companhia Coreano-Brasileira de Pelotização - 114 31 - - 3 59 - Companhia Hispano-Brasileira de Pelotização - 80 47 - - 39 14 - Companhia Ítalo-Brasileira de Pelotização - 75 53 - - - 99 - Companhia Nipo-Brasileira de Pelotização - 205 70 - - 3 146 - Ferrovia Centro-Atlântica S.A. - 1 86 - - - 83 - MRS Logística S.A. - 18 - - - 25 - - Nacala BV (i) - 210 - - - - - - Pangea Emirates Ltd Mitsui (i) - - 1,149 - - - - - Sumic Nickel Netherland B.V - - - - - - 353 - VLI - 3 37 - - 3 - - Others - 89 1 - - 38 7 -
Total 133 865 1,491 6,504 367 144 799 7,420
(i) Refers to the balances after the sale of Nacala Corridor business (note 13). Three-month period ended September 30,
2017 2016
Net operating
revenue Costs and expenses
Financial result
Net operating revenue
Costs and expenses
Financial result
Aliança Geração de Energia S.A. 7 (39) - - (32) - Previous Valepar shareholders 31 - (130) 41 - (677) Baovale Mineração S.A. - (4) - - (4) - Companhia Coreano-Brasileira de Pelotização - (37) (1) - (6) (5) Companhia Hispano-Brasileira de Pelotização - (29) - - (12) (3) Companhia Ítalo-Brasileira de Pelotização - (28) (1) - (13) (6) Companhia Nipo-Brasileira de Pelotização - (72) (2) - (27) (9) Companhia Siderúrgica do Pecém 118 (14) - 59 - - Ferrovia Centro-Atlântica S.A. 11 (7) (1) 11 (9) (1) Ferrovia Norte Sul S.A. 6 - - 3 - - MRS Logística S.A. - (142) - - (133) - Nacala BV (i) - (187) 67 - - - Pangea Emirates Ltd Mitsui (i) - - (16) - - - Samarco Mineração S.A. - - (11) 9 - - VLI 61 - 1 65 (7) - Others 6 - (6) 2 (9) 3
Total 240 (559) (100) 190 (252) (698)
Nine-month period ended September 30,
2017 2016
Net operating
revenue Costs and expenses
Financial result
Net operating revenue
Costs and expenses
Financial result
Aliança Geração de Energia S.A. 18 (101) - - (94) - Previous Valepar shareholders 96 - (443) 103 - (796) Baovale Mineração S.A. - (12) - - (12) - California Steel Industries, Inc. 36 - - - - - Companhia Coreano-Brasileira de Pelotização - (111) (4) - (42) (5) Companhia Hispano-Brasileira de Pelotização - (88) (3) - (31) (3) Companhia Ítalo-Brasileira de Pelotização - (82) (6) - (35) (6) Companhia Nipo-Brasileira de Pelotização - (200) (9) - (80) (9) Companhia Siderúrgica do Atlântico - - - - (6) - Companhia Siderúrgica do Pecém 246 (102) - 91 - - Ferrovia Centro-Atlântica S.A. 31 (22) (1) 30 (22) (2) Ferrovia Norte Sul S.A. 18 - - 14 - - MRS Logística S.A. - (401) - - (335) - Nacala BV (i) - (281) 134 - - - Pangea Emirates Ltd Mitsui (i) - - (64) - - - Samarco Mineração S.A. 14 - 1 9 - - VLI 192 - 1 192 (11) - Others 19 (2) (15) 12 (24) 1
Total 670 (1,402) (409) 451 (692) (820)
(i) Does not include exchange rate variation.
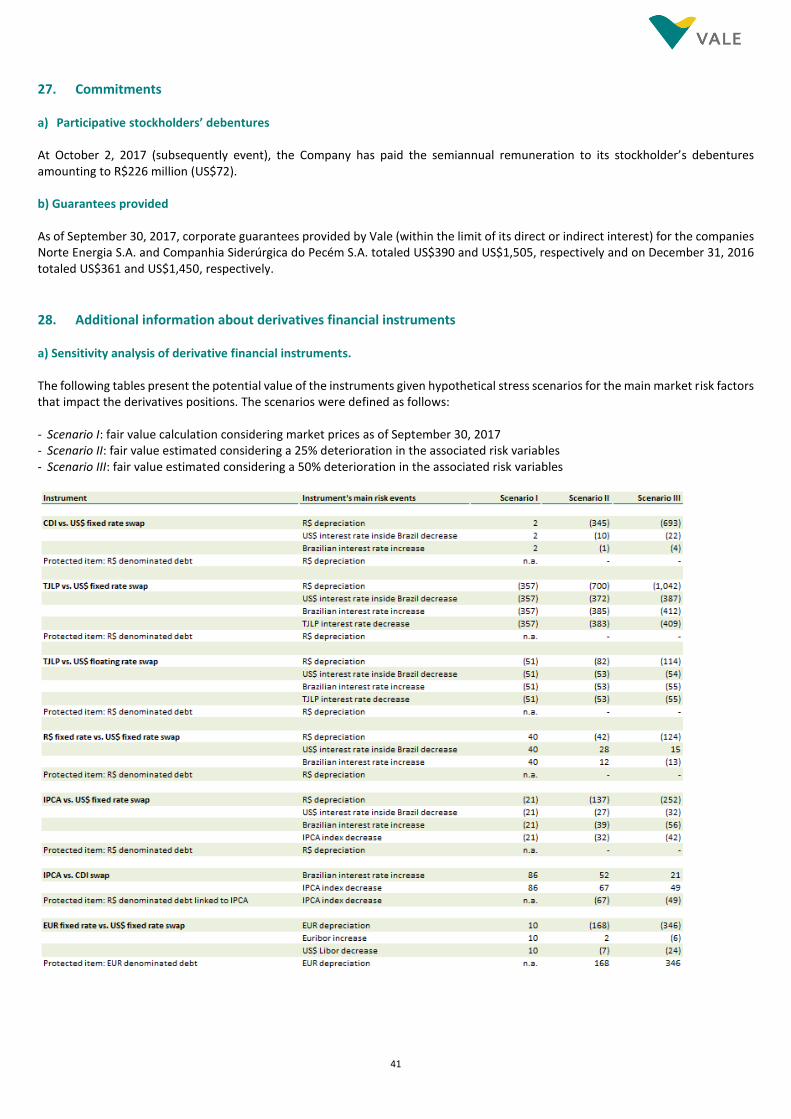
41
27. Commitments a) Participative stockholders’ debentures At October 2, 2017 (subsequently event), the Company has paid the semiannual remuneration to its stockholder’s debentures amounting to R$226 million (US$72). b) Guarantees provided As of September 30, 2017, corporate guarantees provided by Vale (within the limit of its direct or indirect interest) for the companies Norte Energia S.A. and Companhia Siderúrgica do Pecém S.A. totaled US$390 and US$1,505, respectively and on December 31, 2016 totaled US$361 and US$1,450, respectively.
28. Additional information about derivatives financial instruments a) Sensitivity analysis of derivative financial instruments. The following tables present the potential value of the instruments given hypothetical stress scenarios for the main market risk factors that impact the derivatives positions. The scenarios were defined as follows: - Scenario I: fair value calculation considering market prices as of September 30, 2017 - Scenario II: fair value estimated considering a 25% deterioration in the associated risk variables - Scenario III: fair value estimated considering a 50% deterioration in the associated risk variables
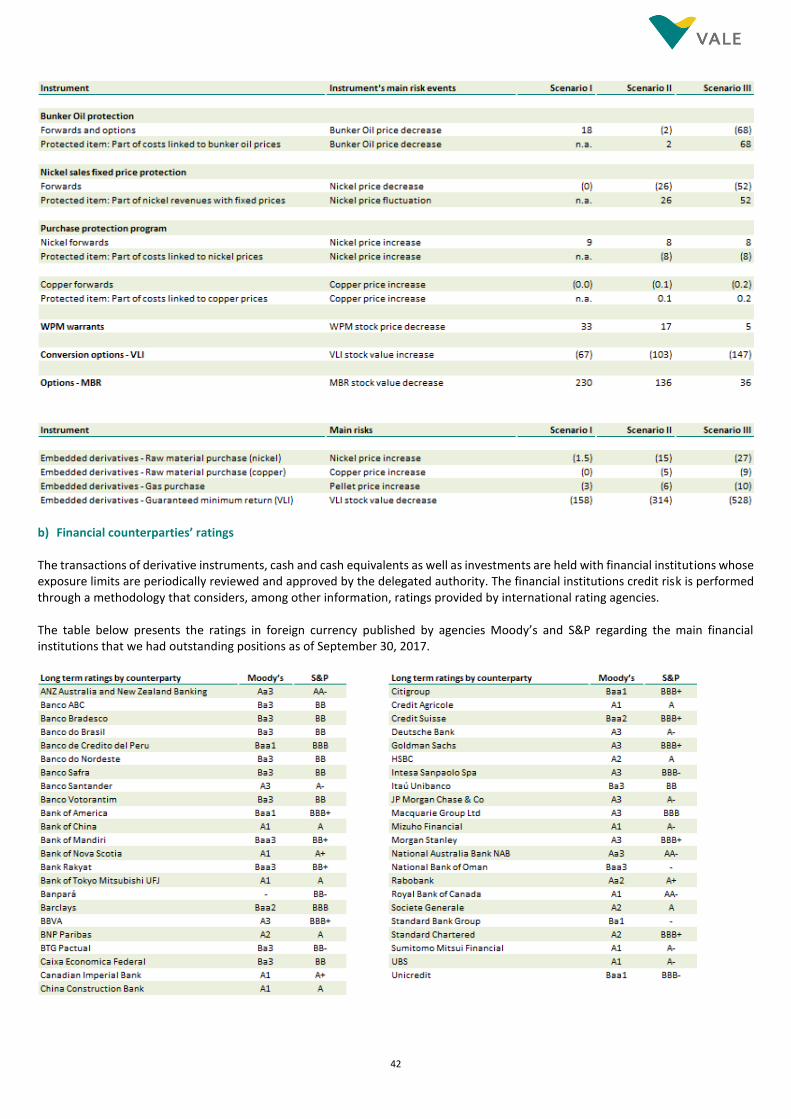
42
b) Financial counterparties’ ratings The transactions of derivative instruments, cash and cash equivalents as well as investments are held with financial institutions whose exposure limits are periodically reviewed and approved by the delegated authority. The financial institutions credit risk is performed through a methodology that considers, among other information, ratings provided by international rating agencies. The table below presents the ratings in foreign currency published by agencies Moody’s and S&P regarding the main financial institutions that we had outstanding positions as of September 30, 2017.
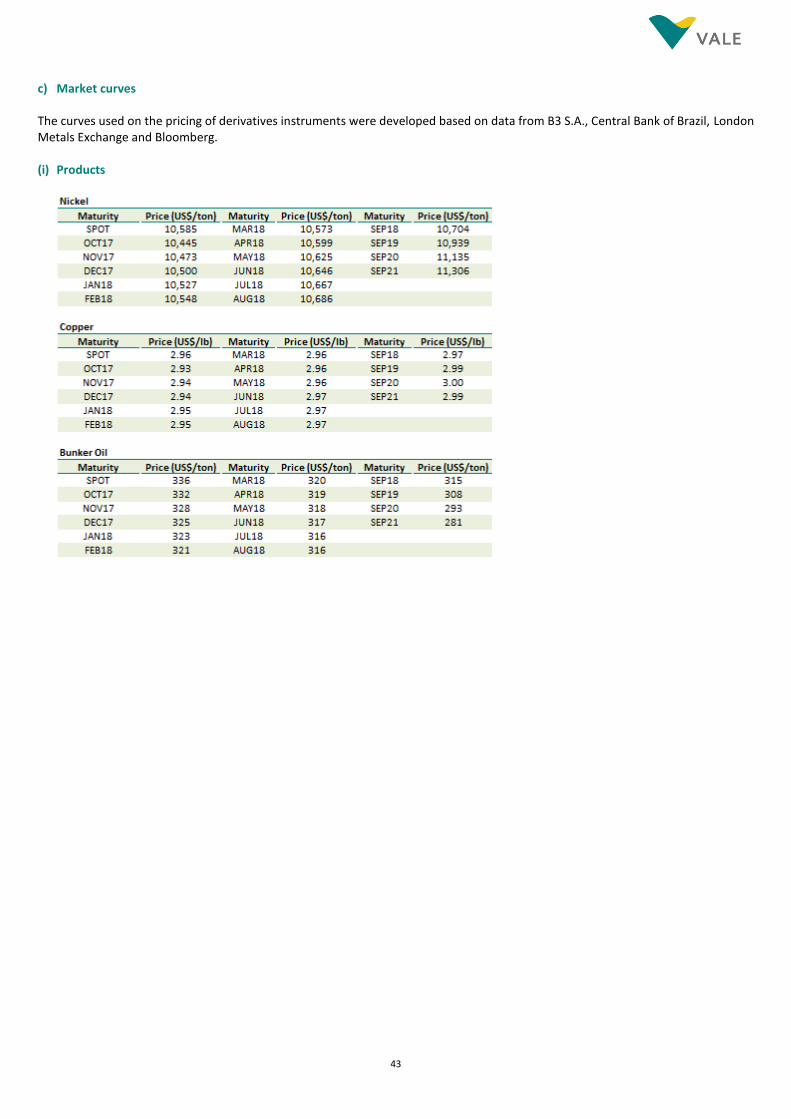
43
c) Market curves The curves used on the pricing of derivatives instruments were developed based on data from B3 S.A., Central Bank of Brazil, London Metals Exchange and Bloomberg. (i) Products
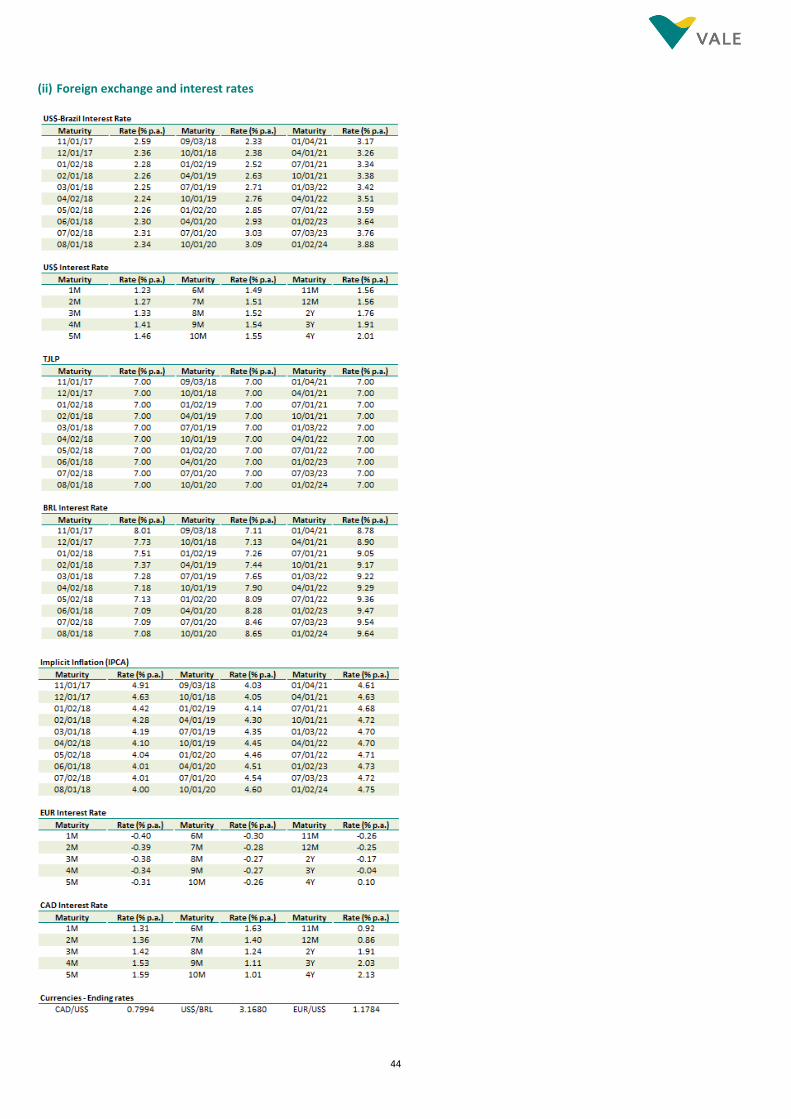
44
(ii) Foreign exchange and interest rates
Related Documents


![Department of Pesticide Regulation Environmental Monitoring Branch … · 2014. 11. 2. · Halosulfuron-methyl 3919 Herbicide Sulfonylurea 3,457 [2] 5.3 [4] IUPAC 8 Trifluralin Herbicide](https://static.cupdf.com/doc/110x72/60ac51b5a570615dc05cabbc/department-of-pesticide-regulation-environmental-monitoring-branch-2014-11-2.jpg)