INTERIM EVALUATION OF THE ENTREPRENEURSHIP AND INNOVATION PROGRAMME DG ENTERPRISE AND INDUSTRY EUROPEAN COMMISSION Final Report Submitted by GHK and Technopolis within the framework of ENTR/04/093-FC-Lot 1 Specific Contract No ENTR/A4/04/093/1/08/18 30 th April 2009 Contact person for this Report: Charu Wilkinson GHK Consulting Ltd. 30 St. Paul’s Square Birmingham B3 1QZ Tel: +44 (0)12 1233 8900 Email: [email protected]

Welcome message from author
This document is posted to help you gain knowledge. Please leave a comment to let me know what you think about it! Share it to your friends and learn new things together.
Transcript
INTERIM EVALUATION OF THE
ENTREPRENEURSHIP AND INNOVATION PROGRAMME
DG ENTERPRISE AND INDUSTRY
EUROPEAN COMMISSION
Final Report
Submitted by GHK and Technopolis within the framework of ENTR/04/093-FC-Lot 1
Specific Contract No ENTR/A4/04/093/1/08/18
30th April 2009
Contact person for this Report:
Charu Wilkinson
GHK Consulting Ltd.
30 St. Paul’s Square
Birmingham B3 1QZ
Tel: +44 (0)12 1233 8900
Email: [email protected]
CONTENTS LIST OF ACRONYMS ............................................................................................................................. I
SUMMARY OF KEY CONCLUSIONS AND RECOMMENDATIONS ..................................................... I
The Relevance of Entrepreneurship and Innovation Programme (EIP) .................................................. i
The Efficiency of EIP .............................................................................................................................. iv
The Effectiveness of EIP ........................................................................................................................ ix
Information and awareness of EIP .........................................................................................................xii
1 INTRODUCTION ............................................................................................................................... 1
1.1 The Entrepreneurship and Innovation Programme ........................................................................ 1
1.2 Aims and Objectives of the Interim Evaluation .............................................................................. 2
1.3 Evaluation Context ......................................................................................................................... 3
1.4 Changing Economic Context.......................................................................................................... 4
1.5 Structure of this Report .................................................................................................................. 6
2 RESEARCH METHODOLOGY ........................................................................................................ 7
2.1 Introduction..................................................................................................................................... 7
2.2 Evaluation Issues and Questions ................................................................................................... 7
2.3 Study Approach ............................................................................................................................ 10
2.4 Specific Empirical Work: Enterprise Europe Network .................................................................. 11
2.5 Specific Empirical Work: Financial Instruments ........................................................................... 12
3 IMPLEMENTATION OF THE ENTREPRENEURSHIP AND INNOVATION PROGRAMME ........ 15
3.1 Aims and Objectives of the EIP.................................................................................................... 15
3.2 Use of Funds ................................................................................................................................ 22
3.3 Qualitative Analysis of Progress .................................................................................................. 24
4 EVALUATION FINDINGS: FINANCIAL INSTRUMENTS .............................................................. 31
4.1 Introduction................................................................................................................................... 31
4.2 Overview of EIP Financial Instruments ........................................................................................ 31
4.3 Relevance of EIP Financial Instruments ...................................................................................... 33
4.4 Effectiveness ................................................................................................................................ 55
4.5 Efficiency of Financial Instruments .............................................................................................. 66
4.6 Utility of the Financial Instruments ............................................................................................... 70
4.7 Sustainability of Financial Instruments ......................................................................................... 72
4.8 Information and Awareness ......................................................................................................... 73
4.9 Other Findings .............................................................................................................................. 74
4.10 Summary of Conclusions ........................................................................................................... 74
5 EVALUATION FINDINGS: ENTERPRISE EUROPE NETWORK ................................................. 76
5.1 Evaluation scope .......................................................................................................................... 76
5.2 Specific Evaluation Questions ..................................................................................................... 76
5.3 Background to the Evaluation ...................................................................................................... 76
5.4 Relevance .................................................................................................................................... 81
5.5 Efficiency ...................................................................................................................................... 86

5.6 Effectiveness ................................................................................................................................ 94
5.7 Information and Awareness ....................................................................................................... 100
5.8 Coherence and Synergies.......................................................................................................... 101
5.9 Conclusions ................................................................................................................................ 102
6 EVALUATION FINDINGS: OTHER EIP ACTIVITIES .................................................................. 104
6.1 Introduction................................................................................................................................. 104
6.2 Relevance .................................................................................................................................. 105
6.3 Efficiency .................................................................................................................................... 106
6.4 Effectiveness .............................................................................................................................. 106
6.5 Information and Awareness ....................................................................................................... 110
6.6 Conclusions ................................................................................................................................ 110
7 SUMMARY OF CONCLUSIONS AND RECOMMENDATIONS .................................................. 112
7.1 Introduction................................................................................................................................. 112
7.2 Relevance .................................................................................................................................. 112
7.3 The efficiency of EIP .................................................................................................................. 117
7.4 The effectiveness of EIP ............................................................................................................ 122
7.5 Information and awareness of EIP ............................................................................................. 127

LIST OF ACRONYMS
CBS Capacity Building Scheme
CIP Competitiveness and Innovation Framework Programme (2007 to 2013)
EBAN European Business Angels Network
EACI Executive Agency for Competitiveness and Innovation
EC European Commission
EFTA European Free Trade Association
EEA European Economic Area
EIB European Investment Bank
EIC Euro Information Centre
EIF European Investment Fund
EIP Entrepreneurship and Innovation Programme
ERDF European Regional Development Fund
FI Financial Intermediary
FMA Fiduciary Management Agreement
FP5 Fifth Framework Programme for Research and Technological Development (1998 - 2002)
FP6 Sixth Framework Programme for Research and Technological Development (2002 – 2006)
FP7 Seventh Framework Programme for Research and Technological Development (2007 – 2013)
GIF High Growth and Innovative SME Facility
IPR Intellectual Property Rights
IRC Innovation Relay Centre
JEREMIE Joint European Resources for Micro to Medium Enterprises
JASMINE Joint Action to Support Micro-finance Institutions in Europe
MAP Multi Annual Programme for Enterprise and Entrepreneurship, and in particular for small and medium-sized enterprises (SMEs) (2001-2005)
NEFI Network of European Financial Institutions for SMEs

PA Partnership Action
SCA Seed Capital Action
SME Small and Medium-sized Enterprise
SMEG SME Guarantee Facility
UEAPME European Association of Craft, Small and Medium-Sized Enterprises
VC Venture Capital
WEF World Economic Forum

i
SUMMARY OF KEY CONCLUSIONS AND RECOMMENDATIONS
The Relevance of Entrepreneurship and Innovation Programme (EIP)
The objectives of EIP are highly pertinent as they address the most important barriers and
constraints facing European SMEs – such as regulatory and administrative burden; limited
access to finance; and the availability and cost of appropriate labour. The identified needs
remain and European added value is being achieved – although for some actions
(specifically, the numerous events and reports to support policy development), it is not
always visible to stakeholders other than those directly involved with the initiative.
The CIP Framework Programme has a complex architecture. This is in part a consequence
of the programmes having been formed through the restructuring and rebranding of
preceding activities and programmes. EIP itself has a complex architecture. It is designed
to be a policy orientated programme which is reflected in its relatively small budget
allocation. The programme supports a number of diverse actions tackling a wide range of
issues. However, sometimes the lack of direct and visible links between individual actions
and global EIP objectives makes it difficult to identify the added value of what can seem a
disparate array of actions.
Recommendations:
Further steps to streamline CIP/ EIP programme architecture could contribute to an
increase in its relevance and European added value. This issue should be fully examined
as part of the CIP Interim Evaluation.
The Annual Implementation Reports should include a clear statement of intervention logic
for each measure in order to improve the overall coherence of the programme and to
demonstrate impact. This is particularly important for policy support measures where the
link between individual measures and policy developments is not obvious to stakeholders,
other than those directly involved in the programme.
The Relevance of Enterprise Europe Network
The objectives of the Enterprise Europe Network are relevant to the needs of the SME
sector. Less than 10 per cent of network partner survey respondents felt that the relevance
had diminished with the introduction of the Enterprise Europe Network, and 25 per cent felt
that the relevance was greater than before. In addition, nearly 90 per cent of respondents
considered the range of services to be the same or better than under the previous
networks, and 76 per cent felt that the Enterprise Europe Network did not leave any gaps
in service delivery that were previously covered by the former networks. The services are
directly relevant to the wider enterprise and innovation policy objectives.
The Enterprise Europe Network has kept open important channels of communication with
the European Commission (EC) such as previous Euro Information Centre (EIC)
participation in the EC‟s Interactive Policy Making tool through the SME feedback process.
However this remains the least well developed element of the Network activities.

ii
Recommendations:
The services provided by the Enterprise Europe Network should be kept under review in
case new needs or issues emerge as a result of changing economic context, or a
refocusing of effort is required.
The feedback element of the Network activities should be further developed. In particular
the Network should be kept informed of the outcomes of the feedback so that this in turn
can be promoted to the SME stakeholders. This will demonstrate the relevance of the
system and encourage participation.
The Relevance of the Financial Instruments
EIP has been designed to create and develop framework conditions for innovation and
competitiveness. There is considerable empirical evidence to demonstrate a strong link
between the availability of finance and a country‟s competitiveness. A core objective of the
programme therefore, is to facilitate SME access to external finance. Intervention is based
on the belief that SMEs in general, and technology-based companies in particular, are a
key source of innovation, job creation and productivity growth. However, the ability of SMEs
to access external finance is hindered by persistent market failures which create funding
gaps. This is supported by evidence presented in the 2007 SME Observatory survey
according to which limited access to finance was a constraint for 21 per cent of European
SMEs. More recent evidence, collected in the wake of the credit crisis, suggests that SMEs
are facing an increasingly tight squeeze on their credit, as banks, the main source of credit
for smaller firms, become more risk averse. According to the data gathered by
Eurochambres, the association of European chambers of commerce, some 30 per cent of
EU SMEs are facing liquidity problems1 and this is threatening their survival.
The financial instruments supported by EIP and its predecessor programme, the Multi
Annual Programme for Enterprise and Entrepreneurship (MAP) are underpinned by a
strong market failure rationale – addressing the financing constraints faced by start-up and
growing SMEs across the EU. EIP financial instruments represent an innovative approach
to addressing market failures in SME financing. The financial instruments operate on a
commercial basis and are designed to promote good practice and professional standards
among financial intermediaries and Venture Capital (VC) fund managers by leveraging the
expertise of the European Investment Fund (EIF). The programme is a test-bed for
launching new and innovative instruments (such as the securitisation window and capacity
building instruments) that can be piloted through the programme and subsequently scaled-
up or adopted by other EU, national or regional programmes or schemes. Importantly, EIP
financial instruments are not designed to operate as „top-ups‟ for existing European/
national or regional financing schemes; but rather seek to achieve demonstration effect.
Given the commercial focus of the financial instruments, their geographical coverage is
indicative of the institutional and operational capacity of financial institutions across the
Member States. For example, the ETF Start-up facility operates in only ten Member States
– the limited geographical coverage reflecting the under-developed nature of VC markets in
1 “Giving SMEs the credit they need”, The magazine of Enterprise Policy, 12.02.2009
http://ec.europa.eu/enterprise/e_i/news/article_8750_en.htm
iii
Europe. This raises the question whether existing or new EIP financial instruments (and in
particular, the VC based instruments) could be designed in a way that supports the
development of financial markets through greater incentivisation or more flexibility in risk
sharing arrangements. This issue could usefully be explored through the CIP Interim
Evaluation.
The financial instruments comprise a portfolio of debt (loan window), equity (GIF) and
hybrid instruments (equity window) to cater to a range of financing needs of SMEs at
different stages of their development and for different levels of financing (ranging from as
low as EUR 3,000 to almost EUR 3 million).
EIP financial instruments offer a mix of pro-cyclical (venture capital) and counter-cyclical
(guarantees) instruments which allows for responsiveness to changing market conditions;
flexible design allows for adaptability to local conditions; and a global budget (with the
possibility to transfer budget easily between different instruments) facilitates absorption and
maximum utilisation of available funds.
EIP instruments are a continuation and evolution of MAP instruments. For example, the
SMEG Loan window under EIP is more flexible as compared to MAP, as it allows lending
for both, investment and working capital purposes (under MAP, only loans for investment
purposes were eligible) . Similarly, the GIF instrument is more flexible than the ETF Start-up
facility in relation to the criteria for investment in SMEs (for example, it allows investments
in companies older than five years in certain industries such as life science). Moreover,
GIF2 was created to increase the supply of development equity for innovative SMEs in their
expansion stage and to create an exit market for seed/ early stage Venture Capital funds.
Recent economic developments however, raise questions about the underlying intervention
logic for the financial instruments. On one hand, the credit crisis has resulted in a sharp fall
in availability of financing for SMEs; on the other hand, SMEs are facing a „demand shock‟
as consumers cut back spending in the face of an economic downturn and mounting job
losses. The scale of EIP financial instruments is however, small relative to reductions in
availability of finance; and accordingly, EIP‟s main focus is not and should not be on crisis
management. In order to maximise European added value, it is important for EIP to support
and enhance the capacity of EU SMEs to deal with the longer term challenges such as
climate change and global competition. The underlying intervention strategy of the financial
instruments remains valid; and the evidence of this evaluation points to the need to place
greater emphasis in future, on risk-capital and hybrid instruments (as compared to purely
debt based instruments) to support the financing needs of innovative SMEs with high
growth potential. In this context, the Commission should undertake research to examine the
scope for introducing specific measures designed to facilitate the supply of angel finance
and to assess the relevance of new instruments such as venture debt in the context of the
financing needs of SMEs. Finally, the Commission should also re-assess the rationale for
continuing the micro-credit window in future programmes considering that it has only been
taken –up by six Member States and that it is more geared towards social objectives. It is
important that the programme‟s scarce resources are focused on instruments that support
the core objectives of competitiveness and innovation by targeting companies with high
growth potential; Arguably, micro-credit schemes can be more efficiently and effectively
delivered through other EU funding streams such as European Regional Development
Fund (ERDF) or national and regional initiatives.
The relevance of the EIP financial instruments will be maximised if they are complementary
to and provide lessons for the wealth of other public sector support for SME finance. The
iv
evaluation evidence points to a risk of overlap between ERDF programmes managed by
DG Regional Policy and EIP in the area of access to finance. The 2007-13 Structural Fund
Regulations place significant emphasis on the use of Venture Capital and Loan Fund
(VCLF) instruments including the introduction of specific joint initiatives with EIF such as the
Joint European Resources for Micro and Medium Enterprises (JEREMIE) and Joint Action
to Support Micro Finance in Europe (JASMINE). Member States have allocated over EUR 3
billion of ERDF to venture capital funds, over a seven year period (in addition to resources
allocated to other financial instruments such as micro-credit schemes). This shift in ERDF
emphasis could potentially result in a situation where different EU funded schemes are
competing with each other at various levels (at the level of deal allocation as well as the
level of SME financing) and potentially crowding-out private sector activity. Over the course
of this evaluation, progress has been made to enhance joint working and policy
coordination between various DGs and the EIF. A procedure with regular consultations has
been established between DG Enterprise and Industry, DG Economic and Financial Affairs,
DG Regional Policy and the EIF to ensure that there are no overlaps or loss of potential
synergies and that the Structural Funds and EIP operate in a complementary manner. It is
now critical that this leads to the introduction of a clear and visible deal allocation policy by
the EIF. The deal allocation policy should set out the criteria to be applied by EIF in
allocating deals to its several mandates.
Recommendations:
EIP Financial Instruments‟ main focus is not and should not be on crisis management. The
focus should be on responding to the longer term challenges facing Europe (such as
climate change and increasing global competition) by enhancing the innovation capacity of
European SMEs.
The Commission should consider the case for re-focussing EIP (and future programmes)
towards risk-capital and hybrid instruments. Specifically, the Commission should:
Monitor the supply of early-stage venture capital to innovative firms with high
growth potential and take appropriate action in case of any shortfalls;
Re-assess the rationale for continuing micro-credit window in future programmes;
Examine ways of stimulating the supply of angel finance. In doing so, consideration
should be given to whether it is more appropriate to support business angel activity
at a national or a regional level (via ERDF programmes) or whether it should be
supported via EIP; and
Commission research to examine the scope and relevance of new financial
instruments such as venture debt (in addition to or in place of existing quasi-equity
instruments supported through SMEG/ GIF).
Finally, the Commission should encourage EIF to develop a clear and visible deal allocation
policy for its different mandates (EIP, JEREMIE, etc.).
The Efficiency of EIP
It is difficult to judge, at this stage, if EIP activities are being implemented at reasonable
costs without excessive burdens on participants, beneficiaries and stakeholders. The
Annual Implementation Reports do not provide any details of actual expenditure defrayed
v
during a year. Financial data are only available in terms of budget allocation and
commitments.
The lack of expenditure breakdown also makes it difficult to judge the relative efficiency of
different aspects of the EIP.
Recommendations:
Annual Implementation Reports should include details of actual expenditure to improve
transparency and to provide a basis of for evaluation of efficiency.
Future Annual Implementation Reports should provide an appropriate breakdown of
expenditure for direct business support actions and other EIP actions. This would facilitate
cost effectiveness analysis of EIP business support activities in relation to other EU or
national benchmarks.
The Efficiency of the Enterprise Europe Network
Given the level of leverage achieved by the Enterprise Europe Network funding structure,
the Network is achieved at a level of cost to the EU that is reasonable. The level of human
resources involved in the management of the programme reflects a saving on the previous
situation, and appears to be adequate for the programme as implemented. There were
resource constraints in some areas during the transition period. However, this appears to
have been an issue of timing and distribution rather than overall resource levels.
There are differences in the funding ratios between the two previous networks and the
Enterprise Europe Network. However, in practice the actual level of funding under the
previous and current regimes was generally less than the maximum provided for. Until the
new network has been operational for a slightly longer period it will not be possible to
compare actual costs with actual results and thus make judgements on efficiency at that
level.
According to the participants, the Enterprise Europe Network carries out similar levels of
activities as the previous two preceding networks. This view was substantiated by the
findings of the case studies. The IRCs tended to deliver services „face to face‟ whilst the
EICs used a range of delivery mechanisms. The Enterprise Europe Network uses all types
of service delivery mechanisms as appropriate.
In terms of staff levels (Full Time Equivalent), there has been a saving of 16 per cent.
Financial savings may also have been made through the change in balance of the staff
between permanent staff/Temporary Agents and Contract Agents, which can be assessed
once the new system has been running for enough time.
A major saving has been achieved under the new structure with the change of the
contracting arrangements to Framework Partnership Agreements for periods of six years,
with Specific Grant Agreements, running for three years. These procedures have generated
significant savings through the reduction in contracting costs for the EU and for the Network
partners.
The design of the Enterprise Europe Network addressed some of the issues relating to the
previous multiplicity of networks and the opportunities for synergy. However, there remains
some overlap with the Seventh Framework Programme (FP7) National Contact Points
(NCPs), because Enterprise Europe Network shares the objective of promoting access to
vi
the RTD Framework Programme. This has been identified as an issue and there is a
process of cooperation in progress.
The implementation of Enterprise Europe Network in the Member States has been
undertaken in a flexible way in order to capitalise on existing structures and relationships.
Comparisons with the previous structures are difficult. The partners had a free hand in
defining the internal structure of the networks. While many of the members of the previous
networks are now part of the new network, they have been joined by many new partners.
This should extend the range of resources available to provide the services of the
Enterprise Europe Network.
Exchange of information and best practice is important and had been identified as an area
where there was scope for improvement in the previous networks, particularly the IRC
network. The Enterprise Europe Network has undertaken major work in this area through a
series of working groups, and the annual conference. As some of these activities had
declined during the period between the end of the MAP and the launch of the Enterprise
Europe Network, this renewed activity should address these issues within the Network.
The transfer of the networks involved a large number of activities, many of which had to be
carried out simultaneously. These included: closure of the preceding networks including the
processing of all final payments; calls for proposals for the new network consortia, including
drafting and publication of calls, assessment of offers, contracting procedures; closing down
of the technical assistance contracts, take-over of tools and procedures, processing of final
payments; transfer of responsibilities to the Executive Agency for Competitiveness and
Innovation (EACI) including amendment of the legal base, establishment of new units within
the EACI and staff recruitment; merging of the two management systems and IT tools and
the development of new network tools; identification of monitoring indicators and success
criteria; development of new “corporate identity” for the Enterprise Europe Network; and,
the launch of the network
Certain of these activities were still under way during the course of the interim evaluation, in
particular the roll out of the new corporate identity, the development of the performance
indicators, the development of the IT tools, and the staffing up of the EACI and the transfer
of activities. During the process of the transfer of responsibility to the EACI there was a lack
of clarity as to the relevant contact points that led to confusion and frustration among the
network partners. Now that the transfer has been completed this issue should be resolved.
However, there is a need to clarify some of the inevitable grey areas between the policy
responsibility of the Commission and the implementation role of the EACI.
Major difficulties stemmed from the delay in implementation of the IT tools. This led to:
reductions in service quality, some loss of clients due to the diminishing credibility and
reputation; and difficulties regarding the fulfilment of the contractual monitoring obligations
towards the Commission. At the same time, the Enterprise Europe Network members
understand the anticipated benefits of the merger of the predecessor networks and
welcome the single network idea. Following the transition period there is a strong likelihood
of effective cooperation.
The results of the survey of network partners highlighted a perceived increase in the
reporting burden. This perception was influenced by the delays in implementation of the
support and reporting tools. This was at odds with the responses on other aspects of the
service which generally signalled improvements and thus, even allowing for a degree of
“frustration bias” should be taken as a signal that this is an area that merits careful follow-
up. If this perception persists once the network has had the opportunity to become
vii
accustomed to the new arrangements then the issue will need to be addressed, since one
of the objectives of the Enterprise Europe Network was to streamline procedures.
It is so far too early to identify within the Enterprise Europe Network portfolio which
elements are the most efficient or represent good value for money. This is because of a
lack of reporting data and because the Network has not been operating at maximum
efficiency until very recently. However, one of the achievements has been the development
of the new performance monitoring system for the Network, with 50 indicators encoded in
the IT system and 8 defined performance indicators of which 7 are drawn from
combinations of these data and one from a client survey. Given the range of activities of
Enterprise Europe Network, the changing needs and demands of SME clients and the
varying contexts within the EU there will be a continuing need to review efficiency and learn
from the experience of Network participants.
The most challenging aspects of the Enterprise Europe Network services to deliver are:
international partner search; innovation support; and, assistance with international business
regulation and law. The most resource intensive activities are international partner search
followed by training, events and preparation of applications for funding. The individual
Network members are best place to judge the areas where investment is required.
However, there is a general trend towards the needs of SME to become more sophisticated
as basic information is becoming available to them at lower cost. It can be anticipated that
the Enterprise Europe Network will need to evolve in line with this trend.
The key aspect of leverage is the involvement of a large number and wide range of
organisations at national, regional and local levels that are close to the client group. It is
important that the leadership and management arrangements of the Enterprise Europe
Network ensure that this commitment and leverage is maintained and that it is a catalyst for
the Network generating added value, rather than being seen solely as an EC service.
Recommendations:
As the formal reporting cycle has been extended to 18 months to reduce the reporting
overhead, it is all the more important to us continuous monitoring data effectively in order to
steer the programme.
The increasing complexity of information sought by SMEs should be recognised and
continued to be taken into account in the future management of the network.
If in future it is decided to change the management/administration structure of the
programme, the handover process should be more effectively carried out and specific
provision made for this. Some flexibility in resources for the handover period should also be
provided.
The documentation of all IT systems should be maintained and dependence on specific
contractors should be avoided, to ensure future problems can be minimised.
The Efficiency of the Financial Instruments.
The financial instruments are efficiently managed by the whole delivery chain (EC, EIF, FI).
They are an efficient form of intervention because they are implemented on a commercial
basis and target financially viable SMEs. The average cost (to EU budget) of assisting an
viii
SME through MAP financial instruments is estimated to be EUR 2,127 and the cost of
creating or safeguarding a job is estimated to be in the range of EUR 1,672. Although, the
actual costs are expected to be much lower if the revenues generated by the ETF Start-up
facility are factored in the calculations.
By the end of 2008, The ETF Start up Facility under the Growth and Employment (G&E)
initiative had generated revenues of EUR 61.6 million. Since, the net asset value currently
held is equal to EUR 44 million, it is expected that the entire budget invested2 will be
returned to the EU budget.
As for the SMEG facility, the actual losses have so far been lower than expected. But this
could change in the coming months and years. Nonetheless, maximum exposure to EU
budget would be limited to the cap amount (amount set aside to cover losses on
guarantees).
The application and reporting requirements were seen to be burdensome by SMEG
financial intermediaries and imposed additional costs in terms of time and resources.
Financial intermediaries have to adapt their databases to collect additional information
(such as employment data which is not typically collected by lenders) and report to EIF on a
quarterly basis which requires additional staffing resources. However, with the exception of
the collection of employment data (currently collected on an annual basis for the MAP Loan
Guarantee Scheme; although reduced to three employment surveys over a seven year
period under EIP), which may be better collected through direct contacts with the SME
beneficiaries (through SME surveys undertaken as part of programme evaluation), the
reporting requirement are not onerous and it is important that the FIs are fully accountable
for the publicly supported financial instruments in their charge.
Recommendations:
There is scope to improve the efficiency of the financial instruments by speeding-up the
application process and reducing the reporting requirements. Specific recommendations in
this regard are:
Application process: The Commission should review with the EIF how the
processing of FI applications can be streamlined.
Reporting requirements: The reporting requirements for FIs should be reviewed in
parallel with improving data collection and monitoring arrangements so as to
improve the basis for future evaluation work. A distinction should be made between
financial reporting (strict requirements for accountability purposes) and statistical
reporting (such as SME employment, sector etc. which can be more efficiently
collected through programme evaluations). Requiring beneficiaries to contribute to
follow up surveys would be one very useful way of gaining additional information on
the impact of financial instruments. Having e-mail addresses could mean that a
comprehensive EU-wide survey, could be undertaken in a cost-effective manner.
2 As of 31
st December 2008, committed capital under G&E Start-up Facility stood at EUR 108.5
million and paid-in capital stood at EUR 104.2 million (source: ETF Start-up Quarterly Report, 31 December 2008).

ix
The Effectiveness of EIP
The Annual Work Programmes reflect the objectives of the EIP. There are however, some
weaknesses in the intervention logic of individual EIP actions. In particular there is a need
to more clearly indicate the links between the activities and the anticipated effects on
competitiveness and innovation at the EU level. The credit crisis itself raises questions over
the intervention logic that was developed during and following a period of relatively good
and stable EU economic performance.
The management methods that have been adopted are appropriate and build on the
experience of the Commission Services whilst making use of the potential of the Executive
Agency arrangements. The current monitoring and reporting arrangements for the financial
instruments do not provide a good basis for subsequent evaluation. There would be benefit
in the systematic follow up of SMEs that benefit from financial instruments so that changes
in employment levels could be monitored accurately and questions relating to „deadweight‟
market displacement, innovation, and multiplier effects could be asked. Such data would be
different from the information collected by financial intermediaries. Stakeholders have been
involved appropriately and the arrangements for exchange of information on best practice
are in place but need to be strengthened in the area of venture capital.
The EIP is not well known in its own right, though the aegis of the management committee
could affect this. The EIP is a pillar within the CIP Framework Programme and an umbrella
for a diverse set of activities. This may make good sense in terms of the architecture of the
CIP programme but is not necessarily a source of added value. Some components of the
EIP and in particular the Enterprise Europe Network have the potential to have a EU brand
and presence far greater than the EIP. Within the individual components there is scope for
added value.
Recommendations:
The Commission should consider developing a standard set of monitoring indicators
(outputs, results, outcomes and impacts) to record and report programme progress. The
Impact Assessment3 contains a set of monitoring indicators which should be reviewed,
updated and applied. In the work programmes relevant indicators and expected results
should be included. This would also provide the basis for future evaluations.
Future implementation reports should give a more expressive review of the whole
programme and an overview of all completed actions. Furthermore, the Implementation
report should present outcomes by means of performance indicators (participants,
deliverables, implementation) and use quantitative indicators where possible (number of
meetings, number of participants and Member States represented, number of reports,
means of distribution and edition, etc.).
The Effectiveness of Enterprise Europe Network
The activities undertaken by the Network address the issues as set out in the Programme
intervention logic. However, under the current economic conditions there is a need to be
3 p34 Commission Staff Working Document, Annex to the Proposal for a Decision of the European
Parliament and of the Council establishing a Competitiveness and Innovation Framework Programme (2007-2013), COM(2005) 121

x
able to respond flexibly to the changing needs of SMEs. The design of the Network permits
this, both through the nature of the participants in the consortia, and the
advisory/governance structures of the Network.
The governance structures of the Network are inclusive and can ensure that these issues
are addressed. The combination of the networks specifically addressed the issue of
perceived weakness of the IRCs in having too narrow a focus and thus not reaching the full
spectrum of potential beneficiary organisations, and the nature of the host organisations
and consortium members brings the opportunity for a continued high quality service.
Reporting remains an area of weakness. The previous networks provided a great deal of
data on their activities but this was not held in a consistent or accessible format and it
seems that much of the potential information has not been exploited. Under the Enterprise
Europe Network much effort has been devoted to the issue of reporting, through the
definition of indicators and the 50 data items to be collected.
The reporting period has been changed from 12 to 18 months in order to reduce the
reporting burden. However, this has not been recognised as an improvement by the
beneficiaries who, if anything, feel the burden has increased. Clearly there is a mismatch
here to be addressed. The extension to 18 months also means that there is a lack of
information, not only for this evaluation but also for the steering of activities in uncertain
times.
Assessing the effectiveness of the Enterprise Europe Network at this stage would be
inappropriate given its only recent establishment and the delays in the provision of some of
its key operating tools. However, it is possible to assess the extent to which the issues
identified for the previous networks have been addressed in the design and implementation
of the Enterprise Europe Network. In the FP6 evaluation it was suggested that the services
of the IRC were perhaps too specialised for many SMEs. At the same time the work they
did made a significant impact on technology transfer in Europe. The Enterprise Europe
Network was designed to consolidate services and create a balance that was not to the
detriment of the specialised and high impact activity. It is too early to say whether this has
yet been managed under the Enterprise Europe Network but judging by the number of
organisations continuing to provide specific „module B‟ functions, the balance is in place.
The work programmes of the Enterprise Europe Network reflect the overall objectives of the
EIP. The activities meet the requirements of users as set out in the needs statements and
the objectives hierarchy. Whether this is reflected in the implementation cannot be judged
until the first activity reports are received. These cover an 18 month period and have not yet
been received.
The most significant barrier to the effectiveness of the Enterprise Europe Network at all
levels, from management to operation on the ground, was the absence of the integrated IT
tools. The significance of the problem is a reflection of the importance of the tools to the
network partners, and the potential they have to facilitate or hinder the effective functioning
of the network.
Almost all network partners are involved in information related tasks. There is however a
clear level of specialism exhibited within the networks highlighted by the fact that partners
refer on to other partners, especially in areas such as Eco-Innovation and IPR for example.
The effects of network services relevant to eco-innovation cannot yet be judged.
The network has to ensure a high standard of service with regard to: targeting of SMEs;
access to programmes for SMEs; monitoring of results; involvement of stakeholders; and,

xi
exchange of information and best practice. The network members have close links to
SMEs. The implementation of the SGA is monitored by the EACI. Progress has been made
with the plans for the monitoring of results with the implementation of the work from the
quality working group on the performance indicators. The EACI is implementing further
quality assurance mechanisms. Performance indicators, satisfaction surveys and codes of
practice will be delivered in 2009.
The added value of the Enterprise Europe Network lies in two areas: the European added
value provided through the international dimension, which ensures that beneficiaries can
benefit from the knowledge of the wider network, especially in the field of international
partner search in its various forms; and, the bringing together of the consortium partners at
the national and regional level that contributes to the defragmentation of the European
advisory services and the implementation of the “no wrong door” policy. The wide range of
services provided also adds value.
Recommendations:
The results of the monitoring of the network should be widely used. In particular they should
enable the Network to focus its resources on areas of specific need as identified through
these new monitoring mechanisms, and to respond to emerging issues.
The Commission and the Agency should further clarify the boundaries of responsibility for
the animation-related activities of the Network so that the partners have a clear interface.
This is still not the case. This division of work need not be apparent to the Network partners
who should have a single consistent point of entry. This means there needs to be a high
level of co-operation and trust between the Commission and the EACI.
The Effectiveness of Financial Instruments
It is too early to judge the effects and impacts of the EIP financial instruments; however,
evidence is available for MAP financial instruments. Over 234,000 SMEs across Europe
have so far, received financing through MAP financial instruments – this represents 6 per
cent of the EU SMEs facing a financing constraint4. It is estimated that by the end of 2008,
MAP financial instruments had created or safeguarded over 297,000 gross jobs in
beneficiary firms. Most were a result of loan guarantees.
Thirty nine VC funds have been set-up with investment from the G&E initiative and MAP.
Collectively, these funds have invested in over 500 companies and this number is expected
to rise as a number of MAP funds are still in their investment phase. The leverage effect on
VC investment was 1 to 4.8 for G&E and 1 to 6.5 under MAP. MAP guarantee schemes
achieved a significantly higher leverage effect of 1 to 67, resulting from the risk-sharing
arrangements between financial intermediaries and the use of cap rate to limit EU
exposure.
4 According to eurostat statistics, there were 19.6 million SMEs in Europe in 2005. According to the
SME Observatory survey (2007), 21 per cent of EU SMEs (or 4.1 million) reported a financing constraint. MAP has reached almost 235,000 SMEs – covering 6 per cent of SMEs reporting a financing constraint.

xii
The SMEG facility under G&E, has provided guaranteed loans to 136, 860 SMEs in Europe.
An additional 233, 892 European SMEs received financing through the SMEG facility under
MAP (which also assisted 313 companies outside EU – in other participating countries).
The Equity Guarantee window was little used. It only operated in two countries – France
and Austria. It guarantees larger investments for fast-growing high-tech companies, which
means that the target group is similar to that of Venture Capital funds.
Additionally, the financial instruments have generated significant non-quantifiable benefits.
For example, EIF (via funds under mandate from the European Commission) has often had
a catalytic effect on the establishment of early stage VC funds making it possible for them
to attract more investors and thereby allowing funds to invest larger amounts, to have more
resources available for follow-on investments in selected SMEs and to achieve a more
commercially viable size. EIF‟s due diligence process is seen by market players as a
“quality stamp” that adds credibility to the VC fund and acts as a catalyst for raising funds
from private investors. In several cases, VC funds would not have materialised unless EIF
had not made an early commitment to the fund. EU-backed VC funds have had
demonstration effects. The added value of VC funds also accrues at the level of the SME.
The appointment of a non executive director, financial advice and specialist business
advice are the most appreciated sources of support from the external equity investment
VC fund managers interviewed for this evaluation, pointed out that VC investment activity is
constrained by weak exit markets in Europe. They also suggested that g the added value of
VC instruments could be enhanced by organising an investors club or other similar
platforms for creating networking opportunities.
Recommendations:
Research should be commissioned to improve understanding of the underlying causes for
weaknesses in VC exit markets and to develop recommendations for tackling issues that
are policy tractable.
The Commission should liaise with EIF to develop initiatives aimed at facilitating networking
between VC fund managers.
Information and awareness of EIP
The EIP itself does not have a strong brand as it is one pillar of the CIP Framework
Programme. It is too early for the results and impacts to have been communicated. The
question of diffusion of information on the programme can best be addressed through a
consideration of the main components of the EIP.
Information and Awareness of Enterprise Europe Network
The Enterprise Europe Network has a corporate identity. Both the Commission and the
network partners have websites.
There was the lack of a corporate identity at the time of the launch of the Enterprise Europe
Network. At the time of the network partner survey (September/October 2008), only 43 per
cent of respondents had promoted and made the Enterprise Europe Network “brand” highly
xiii
visible and within their organisation. Some 83 per cent had a website up and running but
the links from Commission website were often unsatisfactory. With the distribution of the
new corporate identity and the implementation of the graphic charter the awareness should
have improved. The network websites demonstrably improved during the course of the
interim evaluation.
Now the network is established it will be worthwhile to examine the behaviour of web users
which will provide more information on user behaviours and referring sites. Europa has the
capacity to provide the requisite statistics.
The added value of the Enterprise Europe Network lies in two areas: the European added
value provided through the international dimension, which ensures that beneficiaries can
benefit from the knowledge of the wider network, especially in the field of international
partner search in its various forms; and, the bringing together of the consortium partners at
the national and regional level that contributes to the defragmentation of the European
advisory services and the implementation of the “no wrong door” policy. The wide range of
services provided also adds value.
Recommendations:
The efforts to increase the visibility of the Enterprise Europe Network need to be maintained
and several minor issues such as the absence of basic web links need to be addressed
urgently to avoid a loss of momentum.
The promotion of the Network as a vehicle for information to and from SMEs within the
Commission needs to continue as this remains an area of weakness. Opportunities to build
and further develop links with other EU networks should also be sought.
Information and awareness of Financial Instruments
Financial Intermediaries were generally aware of EU funding for the SMEG facility (MAP);
but, the visibility of EU funding was low for SMEs. Fifty four per cent of the beneficiaries of
the loan window and 70 per cent of the micro-credit beneficiaries were not aware that their
loans/ borrowing were guaranteed by the EU. This is despite the rules imposed on financial
intermediaries regarding publicity of EU funding (for example, through specific mention of
the EC role in contracts with final beneficiaries). The visibility of EU funding was very low for
VC funds and limited for SME beneficiaries supported through MAP. CIP introduces
additional requirements to tackle the issue of low visibility.
A related issue that came up during the course of the evaluation was the perception of
Italian financial intermediaries that the programme approach to calculation of cap rate and
additionality requirements is inflexible and does not take into account the specific
characteristics of the Italian market. This appears to be an issue of communication from the
EIF, as the rules under the legal framework allow financial instruments to be tailored to
specific markets and institutions. For example, the cap rate is a function of expected losses
and is uniquely estimated for each financial intermediary.
xiv
Recommendations:
To improve the overall visibility of EU funding, the Commission should introduce the
requirement of press releases in prominent local newspapers on signature of contract
between the EIF and financial intermediary. The local press material should be prepared by
the financial intermediary in conjunction with EIF.
Further action to improve visibility, particularly among the SME beneficiaries, is not
recommended considering that SMEs are not particularly interested in this information;
additional publicity requirements (beyond those already in place) are likely to have
diminishing returns. They would also increase the cost and administrative burden for
financial intermediaries.
EIF should improve communication with FIs so that they have a better understanding of the
rules governing the financial instruments.
.
1
1 INTRODUCTION
This is the final report of the interim evaluation of the Entrepreneurship and Innovation
Programme (EIP). The interim evaluation was commissioned by Directorate-General
Enterprise and Industry in May 2008; and undertaken by GHK Consulting in association
with Technopolis, within the framework contract for the provision of studies and other
supporting services on Commission evaluations (ENTR/04/093-FC-Lot 1).
The independent interim evaluation of EIP was designed to be both summative and
formative. To achieve this, quantitative and qualitative evidence was drawn from five main
sources: stakeholder consultations; an SME survey; an online survey of network members;
programme documentation; and, existing evaluation material. The final report details the
work undertaken and highlights the conclusions reached in response to the key evaluation
questions. It also provides a series of recommendations to improve the quality and
relevance of the programme going forward.
1.1 The Entrepreneurship and Innovation Programme
EIP is one of the three pillars of the Competitiveness and Innovation Framework
Programme (CIP). CIP was established in 20065 to contribute to the goal for Europe “to
become the most competitive and dynamic knowledge-based economy in the world capable
of sustainable economic growth with more and better jobs and greater social cohesion” - as
initially set out in the Lisbon Strategy6 and further reinforced in the Growth and Jobs
Agenda7. With a budget allocation of EUR 3.6 billion, CIP will run from 2007 to 2013. EIP
represents the largest expenditure component of CIP (with EUR 2.17 billion or 60 per cent
of the CIP budget allocation). It is aimed at improving the growth and innovation potential of
small and medium-sized enterprises (SMEs).
EIP focuses in particular on the following objectives:
To facilitate access to finance for the start-up and growth of SMEs and
encourage investment in innovation activities: This is done mainly via
financial instruments providing debt finance or risk capital to companies in
different phases of their lifecycle (seed, start up and expansion). These financial
instruments are managed by the European Investment Fund (EIF) under
mandate from the Commission.
To create an environment favourable to SME cooperation, particularly in the
field of cross-border cooperation: EIP gives businesses access to information
and advice on the functioning and opportunities of the internal market; as well as
information on Community legislation applying to them and on future legislation
so that they can prepare to adapt in a cost-effective way. This is done via the
5 Decision No 1639/2006/EC of the European parliament and of the Council of 24 October 2006
establishing a Competitiveness and Innovation Framework Programme (2007 to 2013) OJ L 310/15, 09.11.2006
6 LISBON EUROPEAN COUNCIL 23 AND 24 MARCH 2000, Presidency Conclusions
http://www.europarl.europa.eu/summits/lis1_en.htm
7 COM (2005) 4 dated 2.2.2005, COMMUNICATION TO THE SPRING EUROPEAN COUNCIL,
Working together for growth and jobs: A new start for the Lisbon Strategy

2
Enterprise Europe Network which operates as a network of regional centres
providing integrated business and innovation support services, drawing on the
experience of the Euro Info Centres (EIC) and Innovation Relay Centres (IRC)
that were merged to form the Enterprise Europe Network.
To promote an entrepreneurship and innovation culture: Support is given to
encourage the trans-national networking of innovative companies and other
actors involved in the innovation process, including benchmarking initiatives and
the exchange of best practice; this is done via initiatives such as the IPR
Helpdesk which provides assistance on intellectual property issues for EU funded
projects; initiatives such as PRO INNO Europe initiative (policy cooperation),
Europe INNOVA (partnership platforms between European innovation
professionals ) also contribute to this objective by facilitating the development of
regional programmes for business innovation and cooperation between regional
actors, while promoting consensus and best practice on regional priorities in the
field of innovation.
To promote eco-innovation by encouraging efforts to tap the full potential
of environmental technologies: This is done via direct funding of pilot and
market replication projects through co-investment in risk capital funds that provide
equity to companies investing in eco-innovation as well as through fostering eco-
innovation networks.
To promote enterprise and innovation-related economic and administrative
reform: This objective is pursued through activities such as production of studies,
data collection, surveys and publications based, where possible, on official
statistics; meetings of experts, awareness raising, networking and benchmarking
of national and regional performances, and work on good practices including their
dissemination and implementation.
The objectives and activities of EIP are elaborated in further detail in Section 3.1 of this
report.
1.2 Aims and Objectives of the Interim Evaluation
The interim evaluation is required under the legal basis for the CIP - Article 8 of Decision
No 1639/2006/EC8. This interim evaluation of EIP will ultimately contribute towards the
interim evaluation of the CIP Framework Programme which is to be completed by 31st
December 2009.
The overall aim of this interim evaluation is to assess the initial results of all activities
launched to date under the EIP. The evaluation focuses on two specific issues:
The performance of the EIC and IRC Networks and of the setting-up of the
Enterprise Europe Network; and,
The impacts of the financial instruments funded under EIP and its
predecessor programme.
8 Decision No 1639/2006/EC of the European Parliament and of the Council of 24 October 2006
establishing a Competitiveness and Innovation Framework Programme (2007 to 2013) OJ L 310/15, 09.11.2006
http://ec.europa.eu/cip/ciplegalbase_en.htm

3
The evaluative focus on networks and the financial instruments can be explained by:
The budgetary significance of these two elements – almost 63 per cent of the
overall EIP budget allocation relates to the financial instruments (EUR 1.13
billion) and the Enterprise Europe Network (EUR 230 million).
Continuity with respect to former interventions – the EIP financial instruments
represent an evolution of MAP financial instruments; the new Enterprise Europe
Network brings together the two separate networks managed by DG Enterprise
and Industry (EIC and IRC).
The specific objectives of the evaluation, as given in the terms of reference are to:
Identify, test and apply methodologies for evaluating (both qualitatively and
quantitatively) the relevance, coherence and synergies, effectiveness, efficiency,
sustainability, utility and, where possible and appropriate, distribution of funding
with regard to sectors;
Analyse and compare the data collected, and draw substantiated conclusions;
Assess initial outcomes of the EIP; and,
Provide relevant, realistic and impartial recommendations, aimed in particular at
identifying possible necessary and appropriate adjustments to the implementation
of the EIP. The evaluation may also give some first indications for the preparation
of the next generation of the programme.
The interim evaluation thus provides an opportunity to improve pro-actively the performance
of the programme, by responding to identified constraints to delivery and building on the
progress being made. These constraints and opportunities may be due to the design or
operation of the programme itself, or because of conditions imposed by other policies. The
interim evaluation would ensure that the programme benefits positively from the issues
identified and addressed.
1.3 Evaluation Context
1.3.1 Timing of the Evaluation
The programme was launched on 1st January 2007. The scope of the interim evaluation
was thus limited because the programme was at a very early stage of its implementation,
where not all actions had been launched and fewer still were able to demonstrate results.
Consequently, as already noted in the ToR and in line with Article 8 of the CIP decision9,
the evaluation relied heavily on the evaluations of predecessor programmes and evidence
on the effects of analogous interventions in preceding programmes.
Evidence was drawn from other evaluations, most notably:
Evaluation of the first three years of operation of the Executive Agency for
Competitiveness and Innovation (DG Energy and Transport, 2009);
9 According to Article 8 of Decision No 1639/2006/EC “the interim evaluations may also
include ex post evaluation elements with regard to previous programmes”.

4
Evaluation of data and sources of information underlying the analysis of market
gaps in access to finance for SMEs (DG Enterprise and Industry, 2007);
Ex-post evaluation of innovation and space research activities carried out under
the Sixth Framework Programme for Research and Technological Development
(DG Enterprise and Industry, 2008) – this provided evidence on the performance
of EIP innovation activities including IRCs;
Mid Term Evaluation on the Implementation of the LIFE Financial Instrument (DG
Environment, 2003) – since the ex-post evaluation of the LIFE Financial
Instrument (due to be published later this year) was not available at the time of
writing this report, the mid term evaluation was reviewed for evidence on eco-
innovation that could be relevant to this study;
Evaluation of DG Enterprise and Industry activities in the field of innovation
(2005) – this provided pointers to the performance of EIP innovation activities as
well as EICs;
Evaluation of the Multi-annual Programme for enterprise and entrepreneurship
(MAP), and in particular for SME (2001-2005), (DG Enterprise and Industry,
2004) – this provided pointers to the performance of EIP financial instruments;
Evaluation of communication links with SME stakeholders (DG Enterprise and
Industry, 2007); and,
The report has also drawn on evidence that was collected as part of a concurrent
study undertaken by GHK – Evaluation of DG Enterprise and Industry‟s policies in
view of the new Commission: External Stakeholders‟ views. The study explored
and analysed external stakeholders‟ opinions of DG Enterprise and Industry
policy actions and achievements including the competitiveness and innovation
policy areas.
1.4 Changing Economic Context
Soon after the launch of the EIP, the first wave of what has come to be known as the “credit
crisis” hit global financial markets. The credit crisis began in July 2007 when leading
international financial institutions made significant losses on investments linked to the US
sub-prime housing market. A loss of confidence by investors in the value of securitised10
mortgages in the United States resulted in a liquidity crisis that quickly transmitted across
the world through global financial markets and prompted a substantial injection of capital
into financial markets by the United States Federal Reserve, Bank of England and the
European Central Bank. In September 2008, the crisis deepened with the collapse of
Lehman Brothers; and stock markets world-wide crashed and entered a period of high
volatility. A number of banks, mortgage lenders and insurance companies failed in the
following weeks – a considerable number were bailed out by governments across the world.
According to a recent International Monetary Fund (IMF) estimate, the total near-term
10 securitisation is the mechanism by which individually illiquid financial assets such as loans are
converted into tradable capital market instruments (securities). More specifically, selected receivable (assets) of the originator are packaged together in an underlying pool and sold by issuing debt instruments (Asset Backed Securities or ABS) on the capital markets.
5
global losses resulting from the credit crisis are expected to be in the order of $4.1 trillion11
(roughly equal to 8 per cent of global GDP in 2008).
As well as affecting the price and availability of credit, the turbulence in financial markets
has led to increased uncertainty; reduced business and consumer confidence; and a led to
a general downturn in economic activity. The start of 2009 has seen a significant rise in
announcements of job losses and foreclosures by businesses. As many EU Member State
economies slip into recession12
, the European Commission released on 19 January 2009
its extended interim forecast. The Commission estimated that the economy of both the EU
and the euro area reduced by around one per cent in 2008, as compared with a growth of
three per cent in 2007. In 2009, real GDP is expected to fall by circa two per cent in both
the EU and the euro area (although growth is projected to remain positive in nine Member
States).
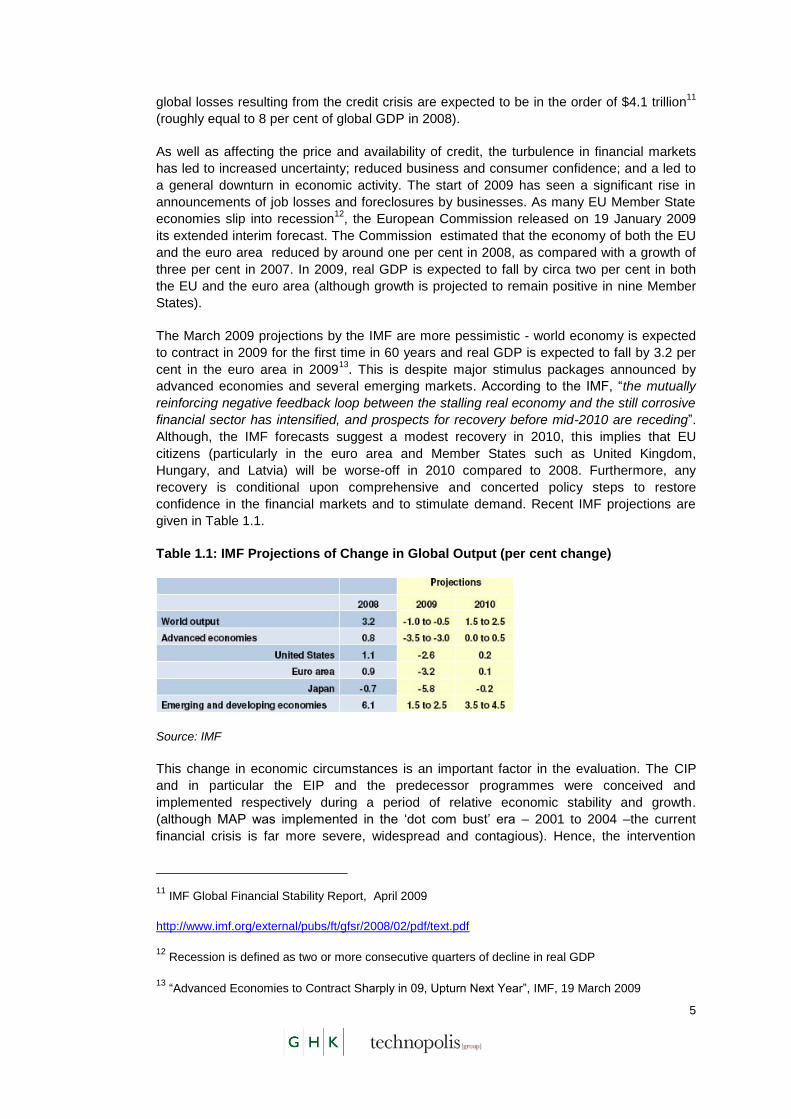
The March 2009 projections by the IMF are more pessimistic - world economy is expected
to contract in 2009 for the first time in 60 years and real GDP is expected to fall by 3.2 per
cent in the euro area in 200913
. This is despite major stimulus packages announced by
advanced economies and several emerging markets. According to the IMF, “the mutually
reinforcing negative feedback loop between the stalling real economy and the still corrosive
financial sector has intensified, and prospects for recovery before mid-2010 are receding”.
Although, the IMF forecasts suggest a modest recovery in 2010, this implies that EU
citizens (particularly in the euro area and Member States such as United Kingdom,
Hungary, and Latvia) will be worse-off in 2010 compared to 2008. Furthermore, any
recovery is conditional upon comprehensive and concerted policy steps to restore
confidence in the financial markets and to stimulate demand. Recent IMF projections are
given in Table 1.1.
Table 1.1: IMF Projections of Change in Global Output (per cent change)
Source: IMF
This change in economic circumstances is an important factor in the evaluation. The CIP
and in particular the EIP and the predecessor programmes were conceived and
implemented respectively during a period of relative economic stability and growth.
(although MAP was implemented in the „dot com bust‟ era – 2001 to 2004 –the current
financial crisis is far more severe, widespread and contagious). Hence, the intervention
11 IMF Global Financial Stability Report, April 2009
http://www.imf.org/external/pubs/ft/gfsr/2008/02/pdf/text.pdf
12 Recession is defined as two or more consecutive quarters of decline in real GDP
13 “Advanced Economies to Contract Sharply in 09, Upturn Next Year”, IMF, 19 March 2009

6
logic for the financial instruments for example, was one of addressing „market gaps‟ (i.e. the
debt and equity financing gap for SMEs), testing new approaches (such as securitisation)
and stimulating activity by private sector finance providers (leverage). The dramatic
changes in economic conditions due to the credit crisis, where, for example, there are plans
for massive increases in the use of loan guarantees in some Member States and marked
reductions in the supply of private sector finance mean that the EIP may need to adjust to a
new intervention logic. These issues are considered further in Section 4 on financial
instruments.
1.5 Structure of this Report
The remainder of this report is structured as follows:
Section 2 describes the method of approach to the evaluation;
Section 3 presents an overview of the Entrepreneurship and Innovation Programme
and reports the progress to date;
Section 4 sets out the evaluation findings for the Financial Instruments;
Section 5 describes the evaluation findings in relation to the Enterprise Europe
Network;
Section 6 sets out the evaluation findings for other EIP actions; and,
Section 7 presents a synthesis of overall conclusions and recommendations for EIP.
The Annexes to this report (provided as a separate document, titled “Technical Annex”)
contain supporting material. Specifically:
Annex 1 contains a glossary of key terms used in this report;
Annex 2 sets out a detailed breakdown of programme allocation and commitments for
the years 2007 and 2008;
Annex 3 describes the SME survey results;
Annex 4 presents a summary of the interviews with FIs;
Annex 5 presents a summary on the interviews with VC fund managers;
Annex 6 presents the data on sectoral distribution of financial instruments;
Annex 7 provides a comparison of IRCs, EICs and the Enterprise Europe Network;
Annex 8 describes the Enterprise Europe Network survey results;
Annex 9 presents a set of case studies; and,
Annex 10 provides the list of organisations consulted for this evaluation.

7
2 RESEARCH METHODOLOGY
2.1 Introduction
This section of the report describes the method of approach used to address the aims and
objectives of the interim evaluation (set out in Section 1.2). It commences with a summary
of the evaluation questions and then presents a description of the key research tasks
undertaken.
2.2 Evaluation Issues and Questions
The key evaluation questions for the assignment were grouped around the criteria of
relevance, efficiency, and effectiveness. In addition, some questions on information and
awareness were addressed. The questions given in the ToR were elaborated by more
specific evaluation questions concerning the network and financial instruments. These
questions were agreed with DG Enterprise and Industry and are given in Table 2.1.
Table 2.1: Key Evaluation Issues and Questions
General questions for the EIP
Specific questions for the Enterprise Europe Network
Specific questions for the financial instruments
Evaluation Issue: Relevance
To what extent are the programme's objectives pertinent to the needs, problems and issues it was designed to address?
How could the relevance of the programme be maximised?
Are the objectives coherent with other national and EU activities designed to foster the Lisbon objectives?
What are the objectives of the Enterprise Europe Network?
To what extent does the network provide information to the Commission on emerging issues, needs and requirements, and how are these taken into account?
What are the objectives of the financial instruments?
What is the identified need and how have the financial instruments been designed to meet this?
How have the needs changed over time?
Has the programme responded to these changes? Is it able to respond to any future changes?
Is there an overlap/ interplay between EIP financial instruments and other publicly / privately funded instruments? or what is the degree to which particular markets are not met by them?
In what ways do the financial instruments influence policy?
Evaluation Issue: Efficiency
To what extent are the desired effects achieved at a reasonable cost (including the burden on participants, beneficiaries, stakeholders)?
What aspects of the EIP are the most efficient or inefficient, especially in terms of resources that are
What are the costs of the network to the Commission, the host structures and network partners and to beneficiaries? Can these be benchmarked against other networks?
How have costs changed over time (specifically have there been any gains as a result of the combination of the networks)?
The costs of managing, administering and operating the financial instruments and whether the resources used to operate the financial instruments could be used more efficiently to produce similar results at lower costs? More specifically, What is the rate of return on each financial instrument?

8
General questions for the EIP
Specific questions for the Enterprise Europe Network
Specific questions for the financial instruments
mobilised by stakeholders during the different phases of the process?
How does the new method of management compare to the previous system?
How has the transition to the new management methods been managed?
What are the implications of the new contracts for the programme participants?
What activities represent good value for money?
Is there scope for improving efficiency of the Enterprise Europe Network?
Which services provided by the network are considered the best value for money?
What elements of the service require most investment (money/people/time)?
What is the level of leverage of the service (co-financing)?
What are the actual costs to intermediaries of administering and operating the financial instruments?
What are the costs to the SMEs (for reporting collateral, applications made etc)?
How can the efficiency of the financial instruments be improved?
Evaluation Issue: Effectiveness
To what extent have the relevant annual work programmes been designed to effectively contribute to the objectives they were designed to address – i.e. is the intervention logic system of the programme functioning effectively or does it need further refinement – and if so how should this be implemented?
How far do the management methods and their implementation ensure a high standard of service in the following areas: targeting of SMEs and access for SMEs to programmes, monitoring of results, involvement of stakeholders, exchange of information (in particular methods of best practice) between actors?
What is the added value of the programme for stakeholders? Have there been any unintended effects on stakeholders
To what extent do the activities meet the requirements of users as set out in the needs statements and the objectives hierarchy? What feedback mechanisms exist?
Do the activities of the network as set out in their contracts and as realised meet the objectives set out in the EIP work programmes?
What can be done to make the network more effective?
Are there any aspects/means/actors that render certain aspects of the network more or less effective than others, and – if there are – what lessons can be drawn from this?
To what extent has eco-innovation supported or will it be able to support progress towards the goal of sustainable development through reducing impacts on the environment or achieving a more efficient and responsible use of natural resources?
How is service quality defined and measured?
What mechanisms are in place to
What was the impact (both gross and net) of the Financial Instruments (i.e. taking in to account estimated finance to SMEs that would have happened in the absence of the MAP and Growth and Employment Initiative)?
What were the gross and net quantitative effects (of financial instruments under MAP and G&E), taking into account the indicators as specified in Annex II 5 to Decision 1639/2006, in particular, has a appropriate number of SMEs been reached and have adequate leverage effects and cost benefits been achieved?
Are supported Venture Capital funds delivering qualitative value added?
What is the creditworthiness of SMEs supported through the financial instruments?
How can the use of the Seed Capital Action be further developed?
To what extent has eco-innovation been addressed in

9
General questions for the EIP
Specific questions for the Enterprise Europe Network
Specific questions for the financial instruments
and, if so, how can the programme take these into account?
ensure the quality of the centres?
What has been the effect of the changes in the management structure?
Where does the European added value lie in the network activities?
Does the added value of Enterprise Europe Network vary between stakeholders/beneficiary types?
the implementation of the financial instruments to date?
Evaluation Issue: Information and awareness
How effectively has information about the availability of the programme instruments and the results and impacts of actions been transmitted to potential stakeholders and beneficiaries?
What are the mechanisms in use?
How have they changed since the amalgamation?
What mechanisms are in place to monitor the transmission of information (both within and outside the network) and the potential impact?
What is the level of awareness about the financial instruments among potential stakeholders and beneficiaries?
The ToR also identified some additional questions on coherence and synergies, utility and
sustainability for the Enterprise Europe Network and the financial instruments. These are
summarised in Table 2.2.
Table 2.2: Additional Evaluation Questions for the Enterprise Europe Network and
Financial Instruments
Additional questions for Enterprise Europe Network
Additional questions for financial instruments
Coherence and Synergies
To what extent is the intervention logic of the programme coherent with and complementary to other Community and/or Member State interventions that are designed to contribute to the Lisbon objectives?
To what extent do the programme results complement other Community and/or Member State interventions that are designed to contribute to the Lisbon objectives?
Are there other overlaps/ or realised or potential complementarities between the CIP and any other Community or Member State actions in the relevant areas?
How could the coherence and synergies of the CIP with other Community and/or Member State interventions that are designed to contribute to the Lisbon objectives be improved?
Distribution of funding with regard to sectors
To what extent has the programme contributed
Utility
To what extent do the effects of the Financial Instruments under the MAP and the Growth and Employment Initiative correspond to the needs, problems and issues that it was designed to address?
What lessons from the implementation to date of Financial Instruments are useful for the implementation of other relevant current or future Community activities? To what extent could measures be taken to improve the utility of future Financial Instruments, and what measures would these be?
Sustainability
Are the financial instruments likely to become self-sustaining in the longer term without the need for continuing public support, or with lower amounts of public support?
Are any changes brought about by the Financial Instruments self-sustaining?
In the cases where sustainability is identified,
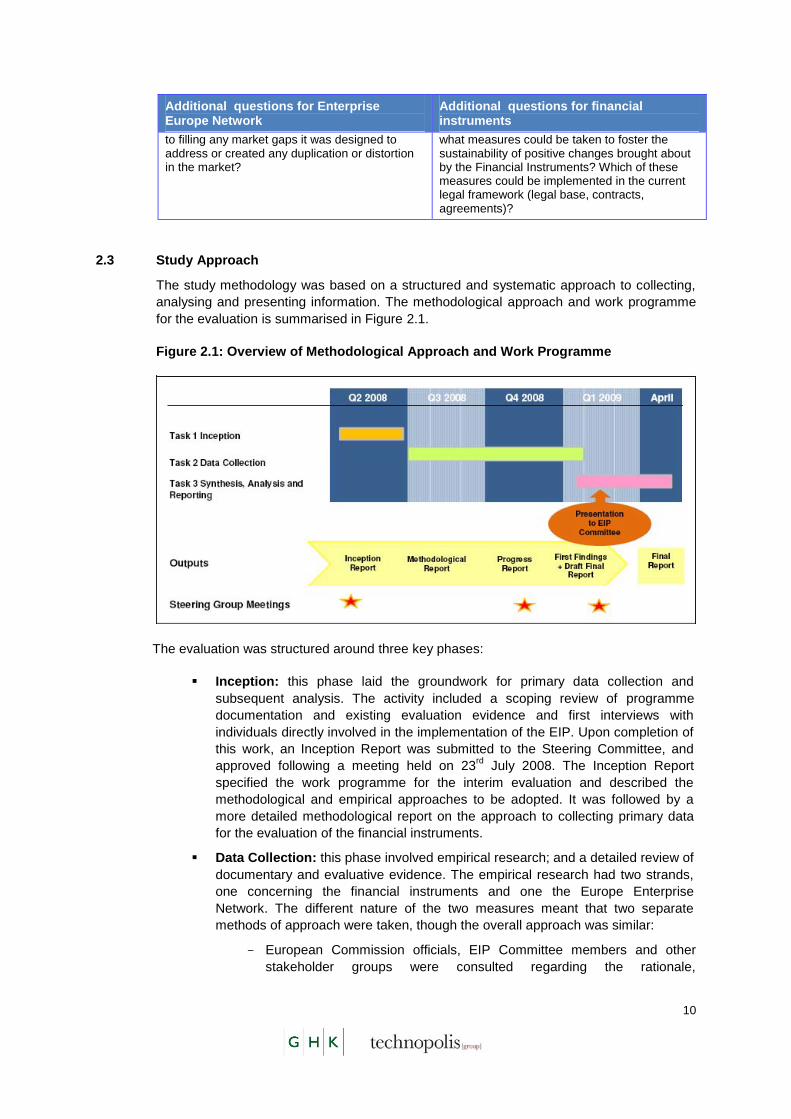
10
Additional questions for Enterprise Europe Network
Additional questions for financial instruments
to filling any market gaps it was designed to address or created any duplication or distortion in the market?
what measures could be taken to foster the sustainability of positive changes brought about by the Financial Instruments? Which of these measures could be implemented in the current legal framework (legal base, contracts, agreements)?
2.3 Study Approach
The study methodology was based on a structured and systematic approach to collecting,
analysing and presenting information. The methodological approach and work programme
for the evaluation is summarised in Figure 2.1.
Figure 2.1: Overview of Methodological Approach and Work Programme
The evaluation was structured around three key phases:
Inception: this phase laid the groundwork for primary data collection and
subsequent analysis. The activity included a scoping review of programme
documentation and existing evaluation evidence and first interviews with
individuals directly involved in the implementation of the EIP. Upon completion of
this work, an Inception Report was submitted to the Steering Committee, and
approved following a meeting held on 23rd
July 2008. The Inception Report
specified the work programme for the interim evaluation and described the
methodological and empirical approaches to be adopted. It was followed by a
more detailed methodological report on the approach to collecting primary data
for the evaluation of the financial instruments.
Data Collection: this phase involved empirical research; and a detailed review of
documentary and evaluative evidence. The empirical research had two strands,
one concerning the financial instruments and one the Europe Enterprise
Network. The different nature of the two measures meant that two separate
methods of approach were taken, though the overall approach was similar:
- European Commission officials, EIP Committee members and other
stakeholder groups were consulted regarding the rationale,
11
implementation and achievements of the EIP, financial instruments and
the network;
- All documentary evidence available was analysed, most notably the
annual work programmes and implementation reports; and monitoring
information and reports relating to the financial instruments;
- All relevant past and parallel evaluations were reviewed;
- A sample survey was undertaken of SMEs that had received loans or
equity investments through EU backed financial instruments. Interviews
were held with 413 SMEs across 10 Member States; and,
- An online survey of Enterprise Europe Network members was
undertaken to which 157 responses were received.
The specific empirical work carried out in relation to the evaluations of the
Enterprise Europe Network and financial instruments is detailed in Sections 2.4
and 2.5 respectively.
Synthesis, Analysis and Reporting: this phase involved a desk-based
synthesis and analysis of data collected during the second phase; structured
around key evaluation issues relating to relevance, effectiveness, efficiency and
information and awareness. A First Findings Report was submitted to the
Steering Committee on 12th January 2009. This report presented the preliminary
findings and results of the evaluation; and formed the basis for discussion at the
Steering Group meeting on 27th February 2009 and the EIP Committee meeting
on 12th March 2009. It was followed by a more detailed Draft Final Report on the
26th March 2009 incorporating the feedback received at the two meetings. This is
the Final Report.
2.4 Specific Empirical Work: Enterprise Europe Network
This included a web based survey of all EIC, IRC and Enterprise Europe Network partners.
The survey explored questions relating to relevance of the objectives set out for the
Enterprise Europe Network and questions related to efficiency and effectiveness of the
services provided. It therefore aimed to compare past and present performance where this
was relevant. In terms of the implementation of the new Enterprise Europe Network, it was
too soon to be able to make evaluative judgements. However it was intended to collect the
baseline information that will be needed when the next evaluation takes place.
It was clear from the responses that the transition process was by no means fully complete,
and initial judgements on the effectiveness of the new system should therefore be treated
with a degree of caution. It has thus been necessary to focus on the implementation
aspects of the Network.
The initial questionnaire was presented in the inception report. This was then refined in
collaboration with the Commission and reviewed by the EACI.
In addition a series of case studies of individual Enterprise Europe Network partners were
carried out to explore issues in more detail. The case studies covered six Member States:
Greece, Hungary, Italy, Malta, Sweden and United Kingdom. Additionally, a case study was
also prepared for Eurochile – the correspondence centre in Chile. The case studies
examined issues such as variations in the structure and scale of the Enterprise Europe
Network, degree of embededness in local and regional SME support networks, range of

12
partners, specific foci (topics/sectors), range and diversity of funding sources, the degree of
integration of previous partners/networks and the nature of the host organisation. These
case studies are included in the Technical Annex to the final report. Finally, the evaluation
team attended the Enterprise Europe Network annual meeting in Strasbourg in November
2008, which permitted informal discussion with a wide range of network partners.
The evaluation team encountered a number of constraints and delays to accessing
information and contacts. Several stakeholders felt that the evaluation work was indeed
premature given the complexities of the merger of networks to form the Enterprise Europe
Network and the absence of a sufficiently long period of operation of the new Network to
provide evaluable results.
2.5 Specific Empirical Work: Financial Instruments
Two specific fieldwork activities were undertaken in respect of the financial instruments.
These are summarised in the following sub-sections.
2.5.1 Interviews with Financial Intermediaries
In-depth, semi-structured interviews (either via telephone or face to face) were carried out
with 24 Financial Intermediaries and 23 Fund Managers involved in the delivery of MAP and
EIP instruments to:
Seek their views on the design and implementation of the financial instruments;
Understand the lending practices of Financial Intermediaries and investment
policy of fund managers including the SME investment appraisal and approval
criteria applied by lenders/ investors; and,
Determine the impact of the credit crisis on the supply of finance for SMEs.
This aspect of the fieldwork covered 15 Member States: Belgium, Estonia, Finland, France,
Germany, Greece, Hungary, Ireland, Italy, Lithuania, Luxembourg, Poland, Portugal, Spain
and the United Kingdom.
2.5.2 SME Survey
A telephone based survey of 413 SMEs which had received financial support through the
financial instruments was also carried out. The purpose of the survey was to explore, in
detail, the behaviour of the beneficiary firms; and the scale and nature of the gross and net
impacts of the financial instruments accruing to beneficiary firms. The survey focussed on
a selection of twelve Member States (highlighted in bluein Table 2.3): Finland, France,
Germany, Greece, Hungary, Ireland, Italy, Lithuania, Poland, Portugal, Spain and the UK.
Collectively these Member States account for 88 per cent of the total SMEG beneficiaries
and 75 per cent of the beneficiaries of ETF start-up facility. The selected Member States
also provided good coverage in terms of new and old Member States; southern and
northern Member States; and, differing levels of development of financial markets and
banking intermediation.

13
Table 2.3: Geographical distribution of beneficiaries of SME Guarantee Facility and
ETF Start-up Facility under MAP (2001 to June 2007)
Source: SMEG 2001 Facility, Annual Report dated 30 June 2007 issued on 31 October 2007 ETF Start-up Facility: EIF; data extraction: 2 May 2007
The sample frame was drawn from an up to date list (dated October 2008) of SME
beneficiaries satisfying the following criteria:
Those obtaining guaranteed loans or investments during the years 2006 and
2007 (it was considered as not useful to approach beneficiaries who had
obtained loans prior to 2006 as it can be difficult for beneficiaries to recall
background information and circumstances change overtime);
Loan had not defaulted;
Guarantees had not been cancelled; and,
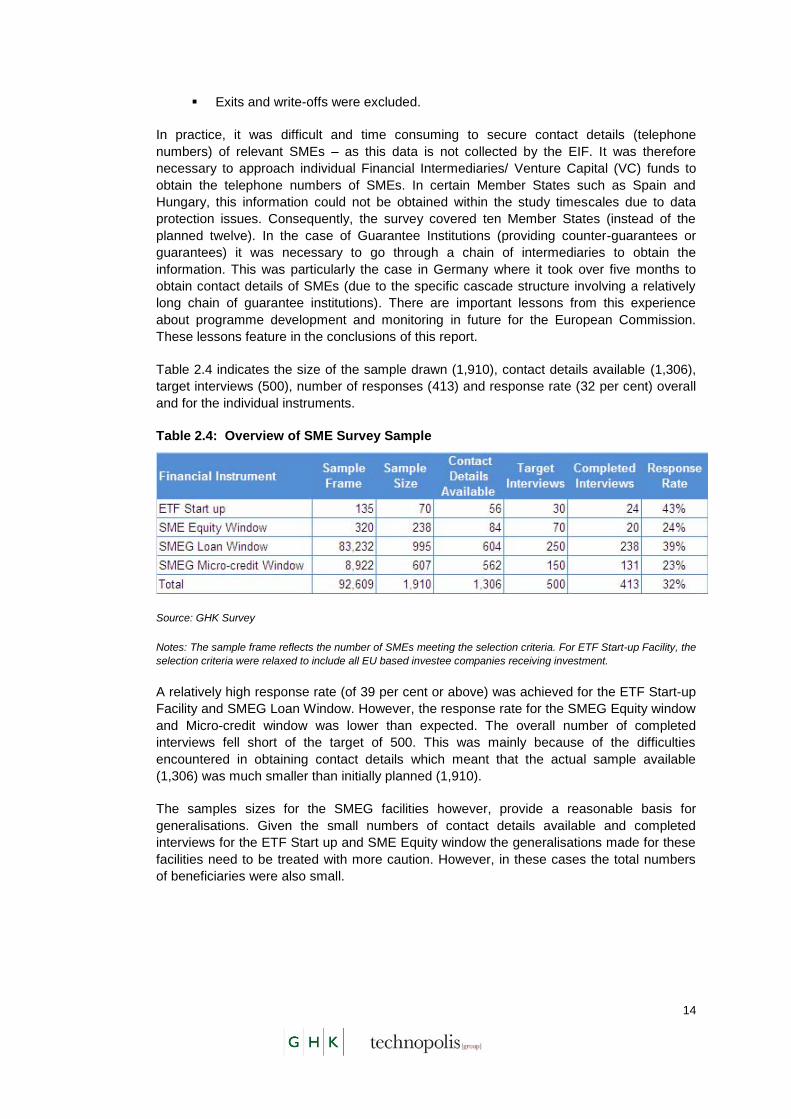
14
Exits and write-offs were excluded.
In practice, it was difficult and time consuming to secure contact details (telephone
numbers) of relevant SMEs – as this data is not collected by the EIF. It was therefore
necessary to approach individual Financial Intermediaries/ Venture Capital (VC) funds to
obtain the telephone numbers of SMEs. In certain Member States such as Spain and
Hungary, this information could not be obtained within the study timescales due to data
protection issues. Consequently, the survey covered ten Member States (instead of the
planned twelve). In the case of Guarantee Institutions (providing counter-guarantees or
guarantees) it was necessary to go through a chain of intermediaries to obtain the
information. This was particularly the case in Germany where it took over five months to
obtain contact details of SMEs (due to the specific cascade structure involving a relatively
long chain of guarantee institutions). There are important lessons from this experience
about programme development and monitoring in future for the European Commission.
These lessons feature in the conclusions of this report.
Table 2.4 indicates the size of the sample drawn (1,910), contact details available (1,306),
target interviews (500), number of responses (413) and response rate (32 per cent) overall
and for the individual instruments.
Table 2.4: Overview of SME Survey Sample
Source: GHK Survey
Notes: The sample frame reflects the number of SMEs meeting the selection criteria. For ETF Start-up Facility, the
selection criteria were relaxed to include all EU based investee companies receiving investment.
A relatively high response rate (of 39 per cent or above) was achieved for the ETF Start-up
Facility and SMEG Loan Window. However, the response rate for the SMEG Equity window
and Micro-credit window was lower than expected. The overall number of completed
interviews fell short of the target of 500. This was mainly because of the difficulties
encountered in obtaining contact details which meant that the actual sample available
(1,306) was much smaller than initially planned (1,910).
The samples sizes for the SMEG facilities however, provide a reasonable basis for
generalisations. Given the small numbers of contact details available and completed
interviews for the ETF Start up and SME Equity window the generalisations made for these
facilities need to be treated with more caution. However, in these cases the total numbers
of beneficiaries were also small.

15
3 IMPLEMENTATION OF THE ENTREPRENEURSHIP AND
INNOVATION PROGRAMME
3.1 Aims and Objectives of the EIP
EIP is one of the three pillars of the CIP Framework Programme. CIP was established to
address Europe‟s productivity gap (in relation to the US economy) and the competitiveness
challenges facing the EU in a coherent, efficient and effective manner. It brought together
the specific Community support programmes - Multi Annual Programme for Enterprise and
Entrepreneurship (MAP) and parts of other Community programmes (namely, FP6 and LIFE
III Financial Instrument for Environment) - in the fields critical to increasing productivity,
innovation and sustainable growth. The structure of the CIP is shown in Figure 3.1.
The overall aim of CIP is to increase Europe's productivity, innovation capacity and
sustainable growth whilst simultaneously addressing complementary environmental
concerns. Programme actions are therefore geared towards creating appropriate framework
conditions for competitiveness and innovation. With SMEs as its main target, the EIP pillar
of CIP was designed to support innovation activities (including eco-innovation), provide
improved access to finance and deliver business support services in the regions. Through
the ICT policy component (ICT-PSP) the CIP will encourage a better take-up and use of
information and communications technologies and help to develop the information society.
CIP will also promote the increased use of new and renewable energies sources, support
energy diversification, foster energy efficiency and rational use of energy sources as well as
promote clean and efficient transport through Intelligent Energy-Europe (IEE) Programme.
Figure 3.1: Structure of the Competiveness and Innovation Framework Programme
2007 – 2013
Source: Adapted from a presentation by Enterprise and Industry Directorate-General
CIP is managed and implemented by the Commission in conjunction with EACI (IEE and
parts of EIP) and the EIF (EIP financial instruments). The Commission is advised by a
Strategic Advisory Board on Competitiveness and Innovation composed of 20

16
representatives of industry and business associations, including those representing SMEs,
and other experts. The expertise of its members is related to the sectors and issues
addressed by CIP, including financing, ICT, energy and eco-innovation. This Advisory Board
meets about once per year in Brussels.
Activity in each CIP pillar is overseen by a management committee which is composed of
representatives of each EU Member State and observers from non-EU countries that
participate in the respective programmes. The committees meet two or three times every
year. Their main tasks are to approve the annual work programmes and to discuss issues
related to policies.
EIP has six main objectives (A to F) as set out in Article 10 of the CIP Decision:
A: To facilitate access to finance for the start-up and growth of SMEs and to
encourage investment in innovation activities;
B: To create an environment favourable to SME cooperation, particularly in the
field of cross-border cooperation;
C: To promote all forms of innovation in enterprises;
D: To support eco-innovation;
E: To promote an entrepreneurship and innovation culture; and
F: To promote enterprise and innovation-related economic and administrative
reform.
These objectives are to be delivered through four key actions:
1. Community financial instruments for SMEs - the overall objective of the
financial instruments is to improve access to finance for the start-up and growth
of SMEs (and investment in innovation activities, including eco-innovation), by
increasing investment volumes of risk capital funds and other investment
vehicles; and providing leverage to SME debt financing instruments thus
increasing the supply of debt finance to SMEs. The legal base for the CIP
Framework Programme allows EU investment in three types of financial
instruments for SMEs:
The High Growth and Innovative SME Facility (GIF) - to increase the supply
of equity for innovative SMEs in their early stages (GIF1) and in the
expansion phase (GIF2). Investment proposals by Financial Intermediaries
are selected on the basis of an open call for expressions of interest. An
indicative budget of EUR 228 million (2007-2013) has been earmarked for
backing funds active in eco-innovation;
The SME Guarantee Facility (SMEG) - to provide direct or counter- or co-
guarantees to guarantee schemes operating in eligible countries, and direct
guarantees to Financial Intermediaries, in order to increase the supply of debt
finance to SMEs. Intermediaries are selected on the basis of an open call for
expressions of interest; and,
A Capacity Building Scheme (CBS) - capacity building support aimed at
improving the investment and technology expertise of funds or by enhancing
the credit appraisal procedures of financial intermediaries for SME lending.
CBS consists of:

17
Seed Capital Action - aimed at the long-term recruitment of additional
investment managers to increase the number of qualified personnel
and to reinforce the capacity of the venture capital and incubator
industries to cater for investments in seed capital.
The Partnership Action - designed to provide grants to financial
intermediaries to cover the cost of technical assistance to improve
their credit appraisal procedures for SME debt financing, in order to
stimulate the supply of finance to SMEs in countries with low banking
intermediation.
2. "Enterprise Europe Network": a network of business and innovation
service centres - The Enterprise Europe Network was launched in 2008 and
comprises 618 consortia members providing integrated business and innovation
support services in the EU and in 17 other countries. The Enterprise Europe
Network acts as a single decentralised access point for SMEs for: information
and advice, feedback, business cooperation, internationalisation services;
services for innovation and the transfer of technology and knowledge; and,
services encouraging participation in the 7th Framework Programme for
Research and Technological Development (FP7).
3. Innovation including eco-innovation pilot and market replication projects –
An indicative budget EUR 195 million over the period 2008 to 2013has been
allocated to eco-innovation pilot and market replication projects concerned with
the first application or market replication of eco-innovative techniques, products,
services or practices of Community relevance, which have already been
technically demonstrated with success but which, owing to residual risk, have not
yet penetrated the market. The implementation of this measure is delegated to
the Executive Agency for Competitiveness and Innovation (EACI), which closely
coordinates its activities with DG Environment . Additionally, EIP also aims to
support eco-innovation through networks of national and regional actors (with an
indicative budget of EUR 10 million).
This strand also includes support for activities designed to encourage the trans-
national networking of innovative companies and all other actors in the
innovation process, including benchmarking initiatives and the exchange of best
practice. Key initiatives launched to date include:
Intellectual Property Rights Helpdesk (IPR Helpdesk) - established by DG
Enterprise and Industry in 1998 and continued under CIP/EIP, the IPR
Helpdesk provides comprehensive information on IPR in general and
assists in the resolution of IPR issues within research and technological
development (RTD) projects financed within the Framework Research
Programmes (FP6 and FP7);
PRO INNO Europe - an innovation policy initiative of the DG Enterprise
and Industry (launched in 2006 under FP6 and continued under CIP/ EIP)
in cooperation with other relevant DGs (e.g. DG Environment) that
provides innovation policy and performance analysis and promotes
mutual learning among innovation policy-makers for better innovation
policy development throughout Europe. The initiative unites the
innovation policy TrendChart, the European Innovation Scoreboard,
Innobarometer, INNO-Appraisal for evaluation of national innovation

18
programmes, studies on innovation policy, networks among innovation
policy-makers and an exchange platform for them; and,
Europe INNOVA - launched in 2005 under FP6 and continued under CIP/
EIP, Europe INNOVA is an initiative of DG Enterprise and Industry in
cooperation with other relevant DGs (e.g. DG Environment) which aspires
to become the laboratory for the development and testing of new tools
and instruments in support of innovation with the view to help innovative
enterprises innovate faster and better. It brings together public and
private innovation support providers such as innovation agencies,
technology transfer offices, business incubators, financing intermediaries,
cluster organisations and others.
The first call for proposals for eco-innovation and market replication
projects was launched in April 2008.
4. Policy analyses, development, coordination and twinning – EIP also funds a
number of initiatives in support of policy analyses, development and coordination
with participating countries. These include:
a. Studies, data collection, surveys and publications;
b. Twinning and meetings of experts, including experts from public
institutions, experts sent by SMEs and other interested parties, to
facilitate coordination of activities and the transfer of knowledge;
c. Conferences and other events;
d. Awareness raising and networking activities;
e. Benchmarking of national and regional performances, and work on good
practices, including their dissemination and implementation; and
f. Best practice actions to spread knowledge and share experience across
Europe.
Table 3.1 indicates how the main instruments contribute to one or several EIP objectives:

19
Table 3.1: EIP Instruments and Policy Objectives
EIP Objectives
A: To facilitate access to finance; B: To create an environment favourable to SME cooperation; C: To
promote all forms of innovation in enterprises; D: To support eco-innovation; E: To promote an
entrepreneurship and innovation culture; F: To promote enterprise and innovation-related economic
and administrative reform
Detailed information on the specific actions to be supported during each year is set out in
the annual EIP Work Programme and its associated support measures. After receiving a
favorable opinion from the EIP management committee, the Commission adopts, at the
beginning of each year, the work programme and publishes it on its website. The relevant
Commission department(s) and EACI manage the activities under the work programme. An
implementation plan is produced annually.
Box 3.1 elaborates the intervention logic for the EIP as initially envisaged by the
Commission and as set out in the Commission‟s Proposal for a Decision of the European
Parliament and of the Council establishing a Competitiveness and Innovation Framework
Programme (2007-2013).
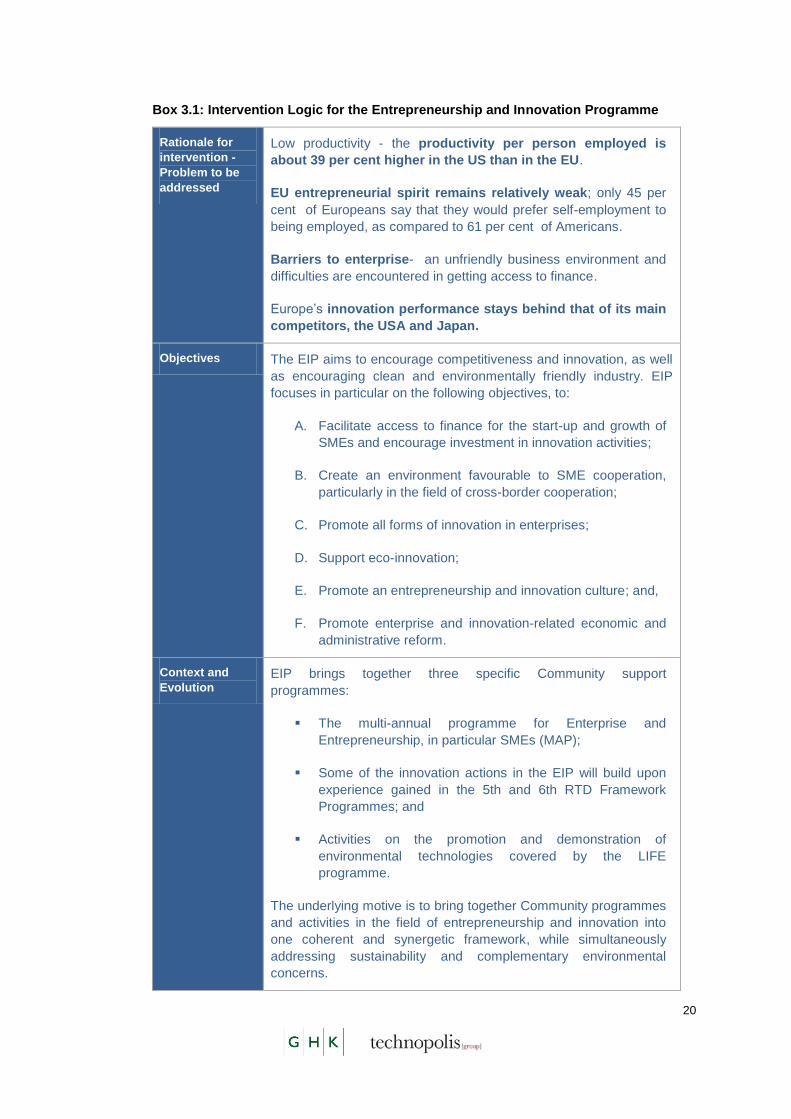
20
Box 3.1: Intervention Logic for the Entrepreneurship and Innovation Programme
Rationale for
intervention -
Problem to be
addressed
Low productivity - the productivity per person employed is
about 39 per cent higher in the US than in the EU.
EU entrepreneurial spirit remains relatively weak; only 45 per
cent of Europeans say that they would prefer self-employment to
being employed, as compared to 61 per cent of Americans.
Barriers to enterprise- an unfriendly business environment and
difficulties are encountered in getting access to finance.
Europe‟s innovation performance stays behind that of its main
competitors, the USA and Japan.
Objectives The EIP aims to encourage competitiveness and innovation, as well
as encouraging clean and environmentally friendly industry. EIP
focuses in particular on the following objectives, to:
A. Facilitate access to finance for the start-up and growth of
SMEs and encourage investment in innovation activities;
B. Create an environment favourable to SME cooperation,
particularly in the field of cross-border cooperation;
C. Promote all forms of innovation in enterprises;
D. Support eco-innovation;
E. Promote an entrepreneurship and innovation culture; and,
F. Promote enterprise and innovation-related economic and
administrative reform.
Context and
Evolution EIP brings together three specific Community support
programmes:
The multi-annual programme for Enterprise and
Entrepreneurship, in particular SMEs (MAP);
Some of the innovation actions in the EIP will build upon
experience gained in the 5th and 6th RTD Framework
Programmes; and
Activities on the promotion and demonstration of
environmental technologies covered by the LIFE
programme.
The underlying motive is to bring together Community programmes
and activities in the field of entrepreneurship and innovation into
one coherent and synergetic framework, while simultaneously
addressing sustainability and complementary environmental
concerns.

21
Geographical
Coverage EU Member States
Non-EU countries: Norway, Iceland, Liechtenstein, Croatia, the
former Yugoslav Republic of Macedonia, Montenegro, Turkey and
Serbia can fully participate in the EIP; Israel and Albania can
participate in certain activities.
Activities The programme is being delivered through four key actions:
1: Community financial instruments for SMEs;
2: Enterprise Europe Network – a network of business and
innovation service centres;
3: Innovation including eco-innovation pilot and market replication
projects; and
4: Policy analyses, development, coordination and twinning.
Expected
Results and
Impacts
The Community Financial Instruments for SMEs will result in:
An increase the supply of seed and early-stage capital for
start-ups and young companies.
An increase in supply of development equity for SMEs in
their expansion stage
This in turn will facilitate SMEs investments in knowledge-related
activities, innovation and environmental technologies, where they
are currently hindered by the difficult access to finance.
Some of the major economic impacts of the EIP are expected to be
delivered by Financial Instruments for SMEs:
Between 325,000 and 400,000 SMEs to be assisted over a
7 year period.
Up to 380,000 jobs to be created or maintained in assisted
SMEs.
The Enterprise Europe Network will support SMEs to identify and
exploit business opportunities outside their home country, and to get
the most out of the enlarged internal market (by providing
information on legislation, standards, public tenders). It will also
enable business concerns to be integrated into EU policy making,
ensuring that the voice of businesses is heard, and the impact of
existing legislation on SMEs will be monitored.
For the Enterprise Europe Network, the expected impacts per EUR
1,000,000 expenditure are as follows:
Around 45,000 SMEs could be reached by the European
awareness-raising activities.

22
Around 112 events dealing with European issues with
relevance for SMEs could be organised.
Around 2,500 enterprises looking for a partner in another
country could be put in contact through the business
cooperation tools.
The innovation strand of the Programme will encourage
entrepreneurial innovation, including organisational and non-
technological innovation. Expected impacts would include an
improvement in the innovation input (such as more enterprise-
university and SME cooperation for innovation; increase of
innovation expenditure as a percentage of turnover, more SMEs
using non-technological innovation; more accessibility of risk-capital
and leveraging national and regional funding for business innovation
projects) and output (such as an increase in sales of new-to-market
products/services and of new-to-firm products/services; increase in
EPO patent registrations; increase in employment in medium-high
and high-tech manufacturing).
Other, less tangible, impacts include:
Increased interaction among policy players in the innovation
systems in Europe with more trans-national cooperation;
Increased interaction among innovation players in Europe
and thus better access to technologies, talents, finance,
business partners;
Disseminating know-how about innovation policy design;
and,
Shaping of new / improved innovation support measures.
3.2 Use of Funds
Table 3.2 and Figure 3.2 summarise the financial progress. It is based on programme
management data as set out in the Annual Work Programmes and Annual Implementation
Reports for the years 2007 and 2008.
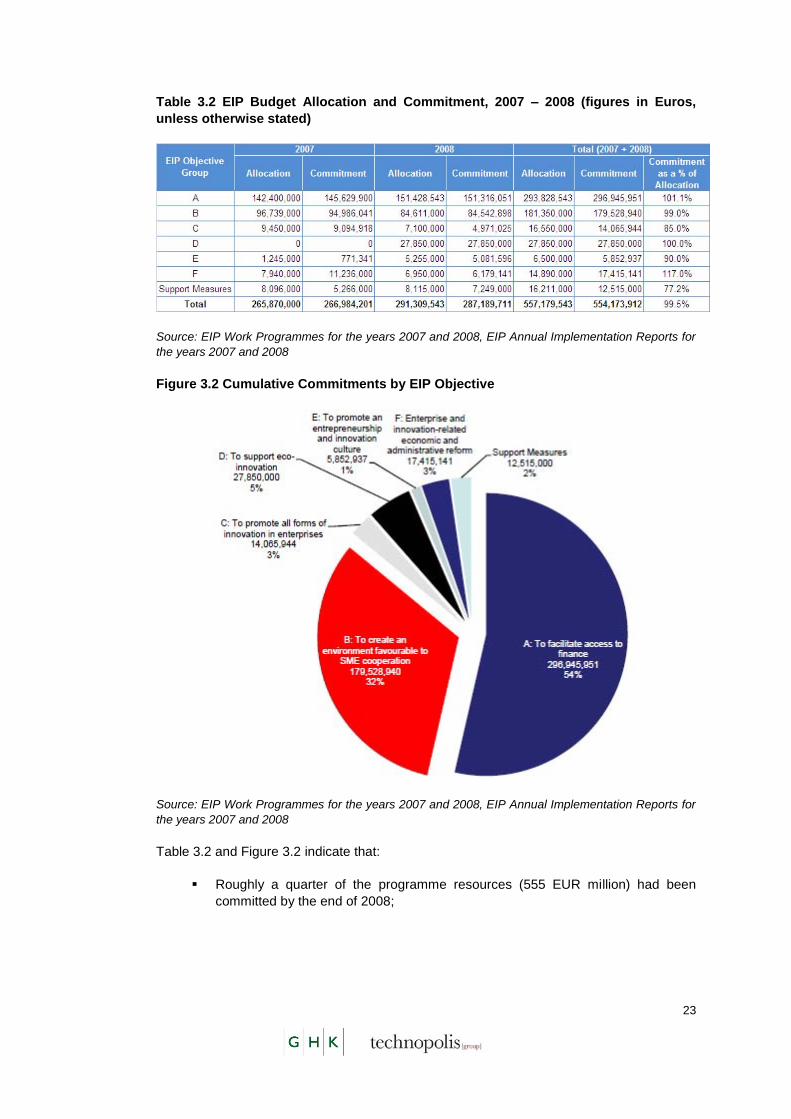
23
Table 3.2 EIP Budget Allocation and Commitment, 2007 – 2008 (figures in Euros,
unless otherwise stated)
Source: EIP Work Programmes for the years 2007 and 2008, EIP Annual Implementation Reports for
the years 2007 and 2008
Figure 3.2 Cumulative Commitments by EIP Objective
Source: EIP Work Programmes for the years 2007 and 2008, EIP Annual Implementation Reports for
the years 2007 and 2008
Table 3.2 and Figure 3.2 indicate that:
Roughly a quarter of the programme resources (555 EUR million) had been
committed by the end of 2008;

24
Approximately 80 per cent of the budget commitment over this period relates to
the implementation of the financial instruments (296.5 EUR million14
) and the
networks (156 EUR million15
); and,
Almost EUR 13 million has been committed to the implementation of support
measures under Article 24 of the CIP legal base (see section 3.3.7).
A comprehensive analysis of budget commitments is presented in the annual work
programmes and is therefore not repeated here. However, it was noted that the
implementation reports do not present data on actual expenditure. For greater transparency
and to facilitate evaluation, it would be helpful if information on actual expenditure were also
included in the implementation reports. A more detailed breakdown of budget – showing the
budget allocation and commitment to individual measures - is presented in Annex 2.
3.3 Qualitative Analysis of Progress
The following sub-sections summarise the progress of actions in relation to each headline
objective of EIP.
3.3.1 Objective A: To facilitate access to finance for the start-up and growth of SMEs and
encourage investment in innovation activities.
This sub-section summarises the current status of the financial instruments.
The High Growth and Innovative SME Facility (GIF)
By the end of March 2009, 15 deals with Venture Capital Funds had been approved (of
which 13 were signed by the EIF), committing16
around EUR 173 million of EU funds. The
deals approved to date cover the following Member States: Belgium, Estonia, France,
Finland, Germany, Ireland, Luxembourg, Latvia, Lithuania, Portugal, Sweden, Spain and
the United Kingdom. Three of these Venture Capital Funds are investing in eco-innovation,
with EU commitments of nearly EUR 34 million. By the end of 2008, investments had been
made in 27 SMEs by the EIP backed VC funds.
The SME Guarantee Facility (SMEG Facility)
By the end of March 2009, 17 deals had been approved (of which 9 were signed by the
EIF), committing EUR 112.3 million from the EU budget for guarantees or counter-
guarantees. The deals approved to date cover the following Member States: Austria,
Belgium, France, Germany, Hungary, Italy, Lithuania, Spain, Slovenia and Poland. By the
end of 2008, guaranteed loans had been provided to 24,551 SMEs.
14 The overall commitment under Objective A is composed of EUR 296,515,370 for financial
instruments and EUR 430,581 for other activities (such as policy, SME Finance Days etc.)
15 This figure represents the share of Enterprise Europe Network in overall budget commitment
corresponding to Objective B in Table 3.1.
16 “Budgetary Commitments" means the budgetary resources committed by the Commission for the
Financial Instrument in any given year during 2007 to 2013.
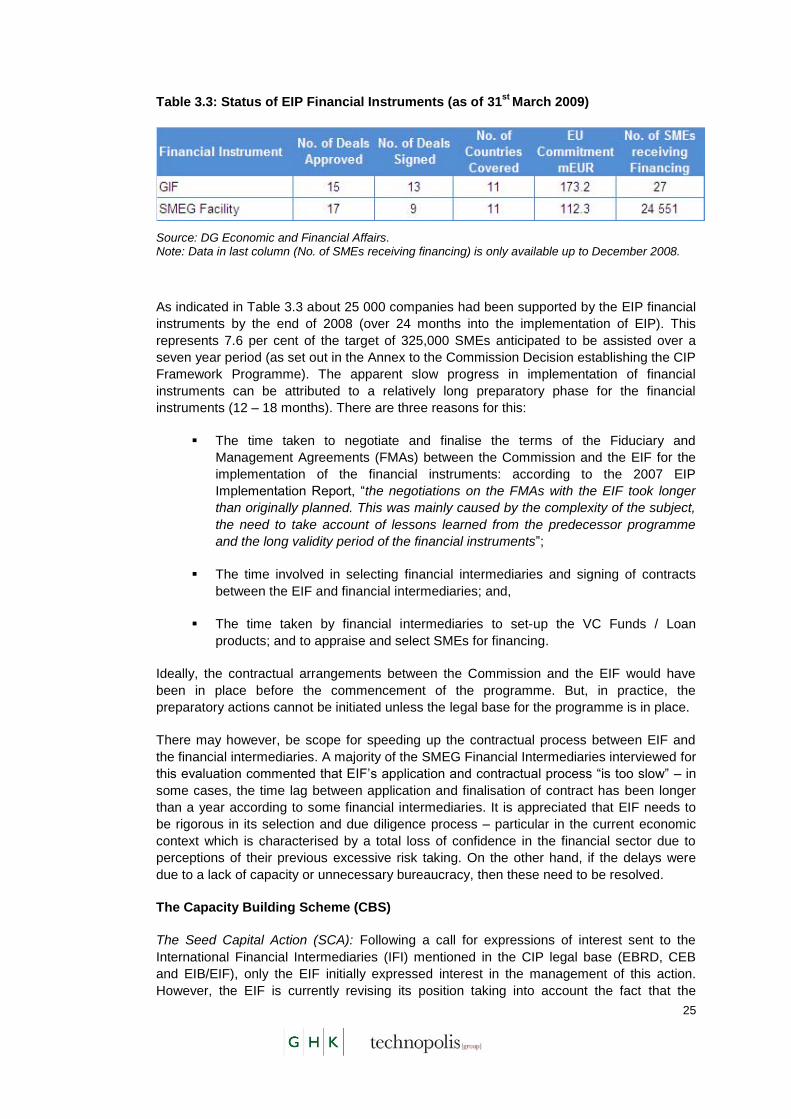
25
Table 3.3: Status of EIP Financial Instruments (as of 31st
March 2009)
Source: DG Economic and Financial Affairs. Note: Data in last column (No. of SMEs receiving financing) is only available up to December 2008.
As indicated in Table 3.3 about 25 000 companies had been supported by the EIP financial
instruments by the end of 2008 (over 24 months into the implementation of EIP). This
represents 7.6 per cent of the target of 325,000 SMEs anticipated to be assisted over a
seven year period (as set out in the Annex to the Commission Decision establishing the CIP
Framework Programme). The apparent slow progress in implementation of financial
instruments can be attributed to a relatively long preparatory phase for the financial
instruments (12 – 18 months). There are three reasons for this:
The time taken to negotiate and finalise the terms of the Fiduciary and
Management Agreements (FMAs) between the Commission and the EIF for the
implementation of the financial instruments: according to the 2007 EIP
Implementation Report, “the negotiations on the FMAs with the EIF took longer
than originally planned. This was mainly caused by the complexity of the subject,
the need to take account of lessons learned from the predecessor programme
and the long validity period of the financial instruments”;
The time involved in selecting financial intermediaries and signing of contracts
between the EIF and financial intermediaries; and,
The time taken by financial intermediaries to set-up the VC Funds / Loan
products; and to appraise and select SMEs for financing.
Ideally, the contractual arrangements between the Commission and the EIF would have
been in place before the commencement of the programme. But, in practice, the
preparatory actions cannot be initiated unless the legal base for the programme is in place.
There may however, be scope for speeding up the contractual process between EIF and
the financial intermediaries. A majority of the SMEG Financial Intermediaries interviewed for
this evaluation commented that EIF‟s application and contractual process “is too slow” – in
some cases, the time lag between application and finalisation of contract has been longer
than a year according to some financial intermediaries. It is appreciated that EIF needs to
be rigorous in its selection and due diligence process – particular in the current economic
context which is characterised by a total loss of confidence in the financial sector due to
perceptions of their previous excessive risk taking. On the other hand, if the delays were
due to a lack of capacity or unnecessary bureaucracy, then these need to be resolved.
The Capacity Building Scheme (CBS)
The Seed Capital Action (SCA): Following a call for expressions of interest sent to the
International Financial Intermediaries (IFI) mentioned in the CIP legal base (EBRD, CEB
and EIB/EIF), only the EIF initially expressed interest in the management of this action.
However, the EIF is currently revising its position taking into account the fact that the

26
current market conditions are not favourable for the implementation of this instrument.
There is limited appetite for this instrument as institutional investors retreat from seed/
early-stage investments. For example, in the UK (which has one of EU‟s most developed
venture capital sectors), early-stage investments have slumped from 11 per cent of total
equity value invested in 2000 to less than 4 per cent in 200717
.
The Partnership Action (PA): this should have constituted an element of the CBS as
described in Article 20 of the CIP decision. A significant part of the action should have
related to improving banks' and financial institutions capacity to assess the commercial
viability of projects with a significant eco-innovation component. The action was presented
to the IFIs mentioned in the legal basis (EBRD, CEB and EIB/EIF). All IFIs expressed
fundamental doubts about the viability of this instrument, due to the restriction on incentives
(due to State aid rules) and the resulting limited size of projects, and in the end declined to
participate. The Partnership Action cannot therefore be implemented on the basis of the
principles set out in the legal basis. Discussions have taken place between the responsible
Commission services to explore options on how to use the resources of the PA.
Other activities
In addition to the implementation of the financial instruments, the following actions outlined
in the Communication “Financing SME growth” 18
were also delivered during 2007 - 2008:
Workshops on cross border investments and publication of an expert group report
on reducing obstacles to cross-border venture capital investments;
Commission Communication on removing obstacles to cross-border investments by
venture capital funds
Study on cyclicality of SME finance;
Development of the Enterprise Finance Index and SME access to finance website;
Workshops on enhancing the availability of seed finance and micro-financing;
Completion of the expert group and publication of a report on the regulation of
micro-credit;
Round table for banks and SMEs;
Organisation of “Finance Days” i.e. publicising the EIP financial instruments
(ongoing but have so far taken place in 12 Member States); and
Workshops on risk capital.
A detailed assessment of the financial instruments in relation to the evaluation questions is
presented in Section 4.
3.3.2 Objective B: To create an environment favourable to SME cooperation, particularly in
the field of cross-border cooperation.
The most important output under this strand was the launch of the Enterprise Europe
Network. Other activities to date include:
17 As a share of total investment by value. See BVCA (2006) „Report on investment activity.‟ London:
BVCA
18 June 2006, Commission Communication 'Financing SME Growth - Adding European Value'
27
Studies, workshops and conferences to inform policy on strengthening the IPR
dimension of EU industry;
Participation in World Health Organisation (WHO) activities aimed at addressing
counterfeiting problems in the pharmaceutical sector;
The fourth European Conference on crafts and small enterprises was staged in
2007;
Launch of up to date website devoted to standardisation and SME issues
(http://www.normapme.com/);
The PATINNOVA conference that was held in 2007 bringing together patent
professionals and the innovation community;
Support for SME and craft enterprises participation in the European standardisation
process;
Policy relevant research on SMEs; and,
European e-Business Support Network for SMEs (eBSN) workshops and meetings.
3.3.3 Objective C: to promote all forms of innovation in enterprises.
Activities launched to date include the continuation and expansion of the European
Innovation Scoreboard (economic and statistical analyses of innovation performance in
Europe) and Innobarometer (a Eurobarometer poll on innovation in firms or views of
European citizens). These activities are part of the analytical tools for innovation besides
the INNO Policy TrendChart, the European Cluster Observatory, the Sectoral Innovation
Watch, the INNO-Appraisal (for the strengthening of the evaluation culture for evidence-
based policy-making), the INNO-Views expert workshops and the INNO-GRIPS studies
and identification of new innovation issues. Other outputs include:
Launch of the European Innovation Platform for Knowledge Intensive Services (KIS
Platform) in 2008. The KIS Platform will develop new tools for innovation support,
addressing the needs of innovative service companies with the ambition to grow and
internationalise rapidly;
The second Europe INNOVA annual conference was staged in October 2008 in
Lyon, France19
. The conference attracted some 550 participants from 30 countries;
A report on the impact of global sourcing on e-skills that was published at the end of
September 2008. The results were discussed at the European e-Skills 2008
Conference in Thessaloniki;
A study was commissioned in 2007 to evaluate emerging technologies that may
impact on EU ICT competitiveness in the future. This study which includes a
technological and a competitiveness analysis is expected to be finalised in 2010;
A study on the nature of the specific skills problems in the construction sector. The
results were foreseen for the first quarter of 2009;
In 2008, a study was commissioned to identify and characterise industrial process
technologies and the industries producing these technologies that have the highest
potential to further reduce industrial „Greenhouse Gas‟ emissions; and,
19 The first Europe INNOVA annual conference which took place in 2007 was funded through FP6.

28
An enterprise survey on: the use of internet and other electronic networks by
enterprises; e-Commerce and e-Business processes; ICT competences in
enterprises; and, the demand for ICT skills.
3.3.4 Objective D: To support eco-innovation
A call for pilot and market replication projects for eco-innovation was launched in April
2008 focusing on the following priority areas:
Materials recycling: better sorting processes, innovative recycling products, new
recycling solutions and new markets for recycling products;
Buildings: such as innovative processes and products in the building sector,
sustainable construction materials, water treatment/saving, etc;
Food and drink sector: cleaner production processes aiming at higher resources
efficiency, reduction of waste and increasing recycling and recovery, high efficiency
in the water process; and,
Greening business and smart purchasing: application of (new) EMAS, cluster
approach, eco-design, support to eco-labelling, integration of eco-innovation in
supply chains.
This first call on eco-innovation attracted participants from 33 countries, including non- EU
countries. 74 per cent of participants were SMEs. The budget committed with this 2008
call for pilot and market replication projects is EUR 28 million. The implementation of the
first projects is expected to start in the spring of 2009. These projects therefore cannot be
assessed at this stage.
3.3.5 Objective E: To promote an entrepreneurship and innovation culture.
Key activities and events delivered under this objective include:
Exchange of good practice under the European Charter for Small Enterprises:
organisation of conferences to exchange good practice and publication of good
practice cases;
Evaluation of SMEs access to procurement: the project aimed at measuring
progress in the participation of SMEs in European and national public procurement
contracts. The final report constituted the basis for the current policy actions on
SME‟s access to public procurement;
Dissemination of agro-food industry innovation: to disseminate to the agro-food
SMEs within the 27 Member States the necessary information for innovation in their
field of activities by way of appropriate regional conferences;
Implementation of „Think Small Principle‟: an evaluation on the application of „Think
Small First‟ principle in EU legislation and programmes and revised Commission
Impact Assessment Guidelines stressing considerations relating to SMEs were
published on the Commission website; and,
Entrepreneurship education: preparatory actions were launched in 2008 for the
setting-up and organisation of the Joint Entrepreneurship Education Steering Group
and the Expert Group on Entrepreneurship and Vocational Education. These groups
will meet in 2009.
3.3.6 Objective F: To promote enterprise and innovation-related economic and
administrative reform
The following outputs have been delivered so far in support of objective F:

29
Approximately EUR 6 million was committed to the Community programme for the
reduction of regulatory administrative costs which includes: the mapping and
measurement of administrative costs associated with EU legislation in 13 priority
areas; and, delivery of IT tools (EU database, administrative burdens calculator and
a starter kit for measuring and reducing administrative burdens at Member State
level);
A conference on “Streamlining the implementation of environment-related regulatory
requirements” took place in 2007;
OECD peer reviews of five countries over the period 2008/09 on better regulation
practices; and,
Research into family business relevant issues: two Expert Group meetings took
place in 2007 bringing together experts nominated by the Member States and some
experts from the field. The study “Overview of family business relevant issues” was
published at the end of 2008.
3.3.7 Support Measures
In accordance with Article 24 of the legal base, the Commission is expected to regularly
undertake the following:
Analysis and monitoring of competitiveness and sectoral issues, including for the
Commission's annual report on the competitiveness of European industry;
Preparation of impact assessments of Community measures of particular
relevance for the competitiveness of enterprises and their publication with a view
to identifying areas of existing legislation requiring simplification or the need for
new legislative measures to make innovation more attractive in the Community;
Evaluation of specific aspects or specific implementation measures in relation to
the EIP; and,
Dissemination of appropriate information in relation to the EIP.
This is accomplished through support measures which, as stated in Article 25 of Decision
1639/2006, are not covered by the annual work programme and do not involve the
procedure referred to in Article 46(2) of Decision 1639/2006. In 2007 and 2008, this
included six types of support measures:
Sectoral studies in several areas of European Industry such as ceramics,
pressure equipment, glass, aerospace, shipbuilding and pharmaceuticals;
Dissemination activities relating to SMEs such as promoting entrepreneurship to
specific target groups;
Competitiveness and cross-sectoral studies, such as the annual competitiveness
report;
Conferences, study groups and technical support such as the High-level Group
on Chemicals and the High-level Group on Administrative Burdens;
Preparation of impact assessments of Community measures such as the
simplification of Directive 1999/5/EC on Radio and Telecommunications Terminal
Equipment or the possible amendment of Directive 97/68/EC on Non-road Mobile
Machinery; and,

30
Communication and information activities, such as web portals and newsletters.
One of the major events financed under the support measures was the award ceremony for
the European Enterprise Awards and Conference on SMEs and entrepreneurship which
took place in Porto on 6 and 7 December 2007. The website for EIP was also improved in
2008.
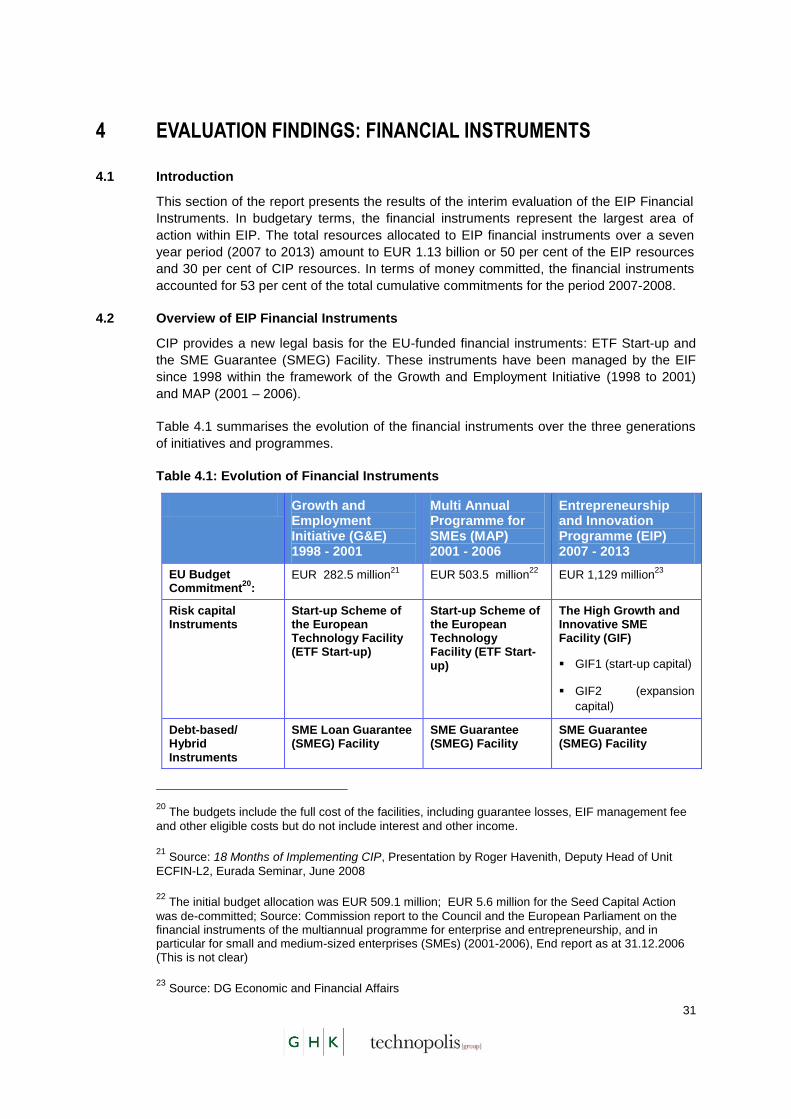
31
4 EVALUATION FINDINGS: FINANCIAL INSTRUMENTS
4.1 Introduction
This section of the report presents the results of the interim evaluation of the EIP Financial
Instruments. In budgetary terms, the financial instruments represent the largest area of
action within EIP. The total resources allocated to EIP financial instruments over a seven
year period (2007 to 2013) amount to EUR 1.13 billion or 50 per cent of the EIP resources
and 30 per cent of CIP resources. In terms of money committed, the financial instruments
accounted for 53 per cent of the total cumulative commitments for the period 2007-2008.
4.2 Overview of EIP Financial Instruments
CIP provides a new legal basis for the EU-funded financial instruments: ETF Start-up and
the SME Guarantee (SMEG) Facility. These instruments have been managed by the EIF
since 1998 within the framework of the Growth and Employment Initiative (1998 to 2001)
and MAP (2001 – 2006).
Table 4.1 summarises the evolution of the financial instruments over the three generations
of initiatives and programmes.
Table 4.1: Evolution of Financial Instruments
Growth and Employment Initiative (G&E) 1998 - 2001
Multi Annual Programme for SMEs (MAP) 2001 - 2006
Entrepreneurship and Innovation Programme (EIP) 2007 - 2013
EU Budget Commitment
20:
EUR 282.5 million21
EUR 503.5 million22
EUR 1,129 million23
Risk capital Instruments
Start-up Scheme of the European Technology Facility (ETF Start-up)
Start-up Scheme of the European Technology Facility (ETF Start-up)
The High Growth and Innovative SME Facility (GIF)
GIF1 (start-up capital)
GIF2 (expansion
capital)
Debt-based/ Hybrid Instruments
SME Loan Guarantee (SMEG) Facility
SME Guarantee (SMEG) Facility
SME Guarantee (SMEG) Facility
20 The budgets include the full cost of the facilities, including guarantee losses, EIF management fee
and other eligible costs but do not include interest and other income.
21 Source: 18 Months of Implementing CIP, Presentation by Roger Havenith, Deputy Head of Unit
ECFIN-L2, Eurada Seminar, June 2008
22 The initial budget allocation was EUR 509.1 million; EUR 5.6 million for the Seed Capital Action
was de-committed; Source: Commission report to the Council and the European Parliament on the financial instruments of the multiannual programme for enterprise and entrepreneurship, and in particular for small and medium-sized enterprises (SMEs) (2001-2006), End report as at 31.12.2006 (This is not clear)
23 Source: DG Economic and Financial Affairs

32
Growth and Employment Initiative (G&E) 1998 - 2001
Multi Annual Programme for SMEs (MAP) 2001 - 2006
Entrepreneurship and Innovation Programme (EIP) 2007 - 2013
The Facility had four guarantee windows:
Loans
Microcredit
Equity
ICT loans24
This Facility has four windows
Loans
Microcredit
Equity & mezzanine
Securitisation
Capacity Building Seed Capital
Joint European Venture
25
Seed Capital Action
Partnership Action
Figure 4.1 shows the allocation of resources between venture capital and SMEG facilities
over the three programming periods.
Figure 4.1: Allocation of Resources to Venture Capital and SMEG Facilities
Note: a) The above chart does not include EUR 73 million initially allocated to Capacity Building
Schemes under EIP; b) Figures have been rounded-off to the nearest million
24 The ICT window was dropped due to lack of demand for sectoral windows.
25 The objective of the JEV programme was to support the creation of transnational partnerships
established by at least two SMEs from different states within the European Economic Area. Due to low take-up of the JEV programme by the market, limited job creation effect and the high administrative cost, The JEV programme was closed to new applications on 29.12.04.
33
The main differences between EIP and MAP financial instruments, in summary, are:
Resources
The budget allocation to financial instruments under EIP has almost doubled in
relation to MAP;
There has been a shift in the allocation of resources in favour of risk-capital under
EIP;
An indicative budget of EUR 228 million (over 20 per cent of the total budget
commitment to financial instruments) has been earmarked for supporting funds active
in eco-innovation;
New / Modified Instruments
SMEG equity window has been extended to cover quasi-equity or mezzanine finance;
EIP (specifically, GIF1) foresees provisions for higher investment rates for combined
deal sourcing from VC funds and Business Angel Networks (BANs), thus providing
incentives for structured cooperation between VC funds and Business Angels;
A new instrument in the form of SME securitisation has been launched under EIP to
enable Financial Intermediaries to: raise additional funding at attractive conditions;
accommodate their capital requirements; facilitate access to capital markets,
especially for unrated or low rated entities, such as smaller banks; and, support the
launching of new SME products;
A new capacity building instrument called the „Partnership Action‟ has also been
introduced in the CIP legal base for the provision of support to improve banks‟ and
financial institutions‟ capacities to assess the commercial viability of projects with a
significant eco-innovation component. Although as explained in section 3.3 this
instrument is not being implemented due to lack of demand among financial
institutions;
Discontinued Instruments
The sectoral window (ICT loans) introduced under MAP (which was later
discontinued due to a lack of demand for a sectorally focussed window) has not been
carried over to EIP; and,
Due to low take-up of the JEV programme by the market, limited job creation effect
and the high administrative cost, the JEV programme was discontinued in December
2004. JEV is not available under EIP.
4.3 Relevance of EIP Financial Instruments
The following sub-sections examine the relevance of EIP financial instruments to identified
needs and overall EIP objectives. The analysis is structured around the core evaluation
questions set out in Table 2.1.

34
4.3.1 What are the objectives of the financial instruments?
The objectives of the financial instruments, as set out in the CIP legal base, are to:
Foster private investment for the creation of new innovative companies and
support companies with a high growth potential in their expansion phase to
reduce a recognised equity gap; and,
Improve access to loan finance by existing SMEs for activities that support their
competitiveness and growth potential.
4.3.2 What is the identified need and how have the financial instruments been designed to
meet this?
Existing empirical evidence demonstrates that the lack of access to finance, constrains the
ability of SMEs to undertake productive investments; and to grow and create jobs26
. Given
that SMEs are a key source of innovation, job creation and productivity growth in an
economy27
, the public sector potentially, has an important role to play in supporting the
SME sector, in particular, in cases of market failures and incomplete markets that inhibit the
provision of adequate financing or financing on terms suitable for the stage of SME
development.
26GHK Consulting and Technopolis Ltd (2007), Evaluation of data and sources underlying the
analysis of market gaps in access to finance for SMEs: Report produced for DG Enterprise and Industry.
27 According to Eurostat data, there were an estimated 19.6 million SMEs in the EU in 2005 – that is
over 99% of all enterprises; employing 85 million people (accounting for 67% of the total employment) and contributing over EUR 3 trillion to the economy as added value (almost 58% of the GVA). Source: Eurostat publication “Enterprises by size class - overview of SMEs in the EU”, 2008. Available on http://epp.eurostat.ec.europa.eu/cache/ITY_OFFPUB/KS-SF-08-031/EN/KS-SF-08-031-EN.PDF

35
There is a well established body of theoretical and empirical literature confirming that the
ability of small firms to access finance is hindered by persistent „market failures‟28
.
According to the literature29
, market failure in financial markets results from the existence of
information asymmetries. This has two dimensions. First, one party to a transaction is in
possession of relevant information that is not known by the other party. Specifically,
entrepreneurs possess more information about their own abilities and the prospects of their
firm than the provider of finance and may misrepresent this information. This creates the
risk of adverse selection by the funder which can only be mitigated by incurring the expense
of a lengthy screening or due diligence process to obtain relevant information about the
entrepreneur and the business (which because of its private nature may not be available)
and interpret it. This is particularly problematic in technology sectors where it is difficult to
value the firm‟s scientific knowledge and intellectual property, the products are likely to be
new and untested in the market, and the management may lack commercial skills. Second,
the provider of finance cannot observe relevant actions taken by the entrepreneur that
might influence the outcome of the investment. Dealing with this problem – moral hazard –
is also costly to the lender or investor, requiring complicated contracts that are time
consuming to design and negotiate and labour-intensive monitoring systems. Because
transaction costs (i.e. costs involved in the provision of finance - costs of application,
screening, monitoring and enforcing) are fixed regardless of the size of loan (or
investment), this makes small loans (investments) uneconomic for funders.
Market failure typically manifests itself in the form of market or financing gaps where
profitable opportunities to provide SMEs with finance are missed due to lack of interest
among potential private sector finance suppliers. These financing gaps are greatest for:
New firms seeking external finance for the first time;
Firms seeking small amounts of finance;
Technology-based firms; and,
Firms located in peripheral regions.
A recent OECD Report30
highlights that innovative SMEs face particular problems when
attempting to access financing in most OECD countries, as they represent a higher risk
than traditional SMEs or large firms.
SME financing Gap in Europe
Recent survey and economic data confirms the importance of facilitating access to finance
for EU SMEs. The 2007 SME Observatory Survey showed that limited access to finance
was a problem for 21 per cent of European SMEs (Figure 4.2)31. The overall SME financing
gap appears to be more pressing in new Member States, since a higher proportion of SMEs
report shortages of finance.
28 The term market failure refers to a situation in which economic efficiency is not achieved owing to
imperfections in the market mechanism.
29 GHK Consulting and Technopolis Ltd (2007) op cit.
30 OECD (2006), The SME Financing Gap, Volume 1, Theory and Evidence
31 EOS Gallup (2007), Flash Eurobarometer Series #196, Observatory of European SMEs, 2007,
http://ec.europa.eu/public_opinion/flash/fl196_en.pdf
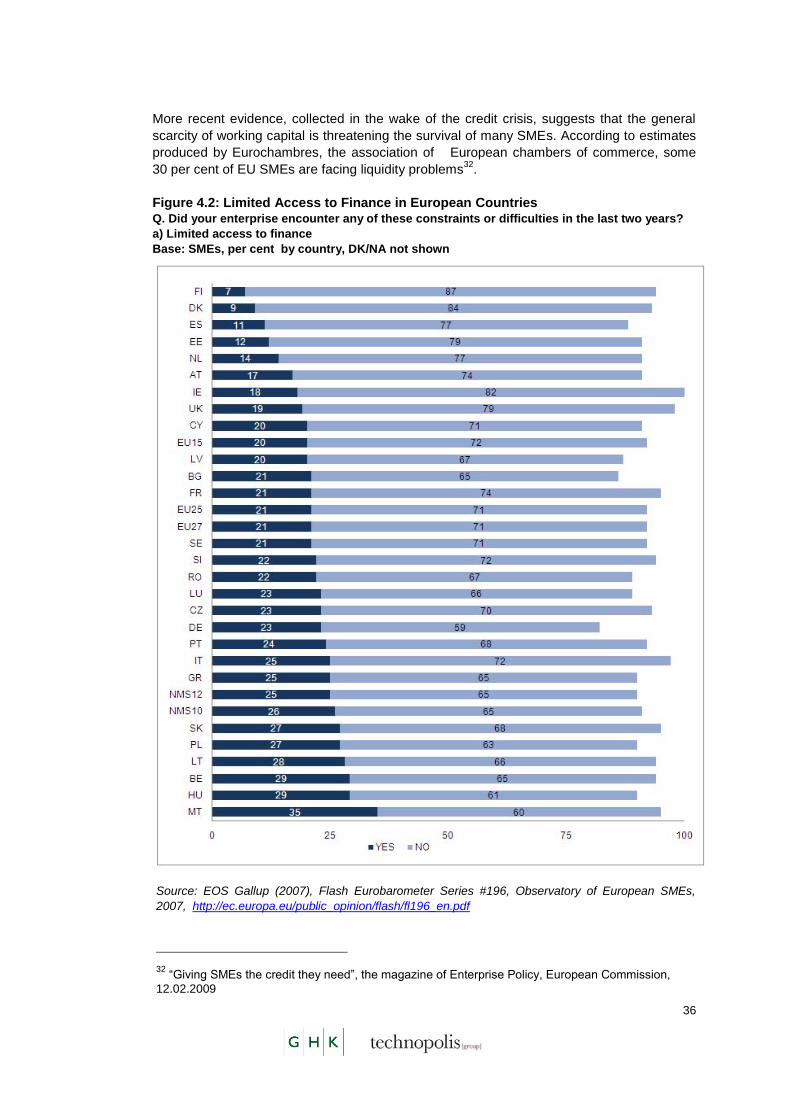
36
More recent evidence, collected in the wake of the credit crisis, suggests that the general
scarcity of working capital is threatening the survival of many SMEs. According to estimates
produced by Eurochambres, the association of European chambers of commerce, some
30 per cent of EU SMEs are facing liquidity problems32
.
Figure 4.2: Limited Access to Finance in European Countries Q. Did your enterprise encounter any of these constraints or difficulties in the last two years?
a) Limited access to finance
Base: SMEs, per cent by country, DK/NA not shown
Source: EOS Gallup (2007), Flash Eurobarometer Series #196, Observatory of European SMEs,
2007, http://ec.europa.eu/public_opinion/flash/fl196_en.pdf
32 “Giving SMEs the credit they need”, the magazine of Enterprise Policy, European Commission,
12.02.2009
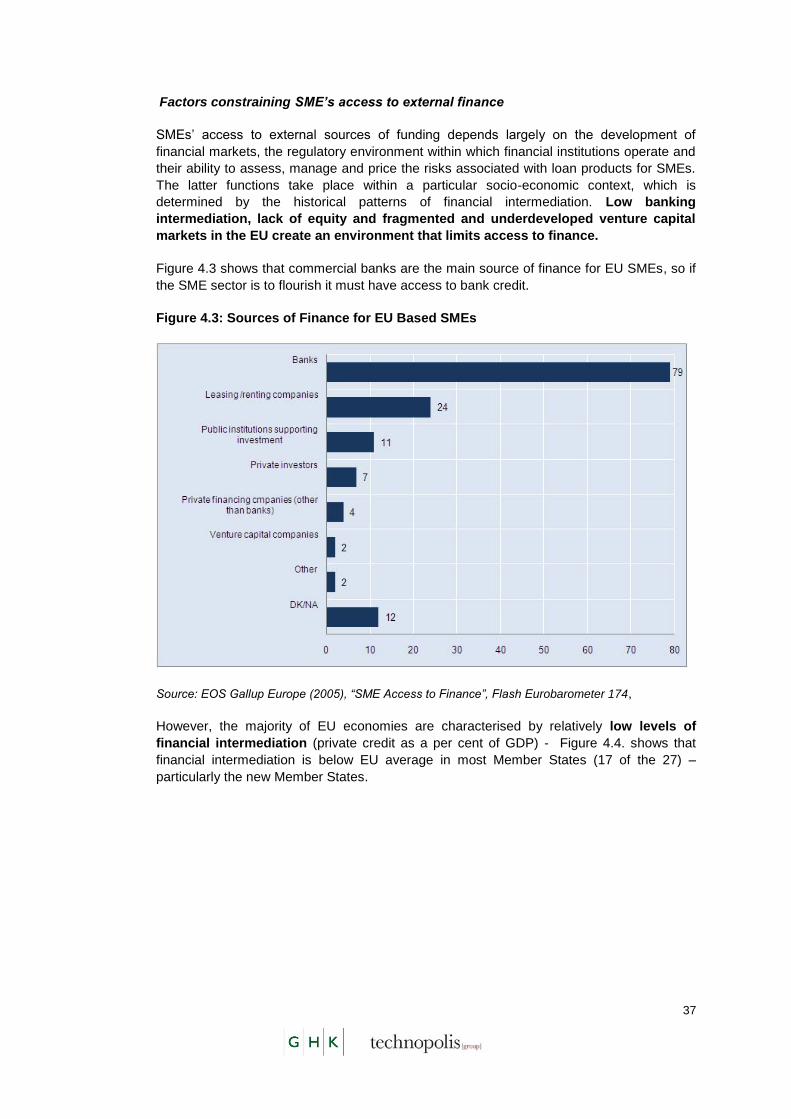
37
Factors constraining SME’s access to external finance
SMEs‟ access to external sources of funding depends largely on the development of
financial markets, the regulatory environment within which financial institutions operate and
their ability to assess, manage and price the risks associated with loan products for SMEs.
The latter functions take place within a particular socio-economic context, which is
determined by the historical patterns of financial intermediation. Low banking
intermediation, lack of equity and fragmented and underdeveloped venture capital
markets in the EU create an environment that limits access to finance.
Figure 4.3 shows that commercial banks are the main source of finance for EU SMEs, so if
the SME sector is to flourish it must have access to bank credit.
Figure 4.3: Sources of Finance for EU Based SMEs
Source: EOS Gallup Europe (2005), “SME Access to Finance”, Flash Eurobarometer 174,
However, the majority of EU economies are characterised by relatively low levels of
financial intermediation (private credit as a per cent of GDP) - Figure 4.4. shows that
financial intermediation is below EU average in most Member States (17 of the 27) –
particularly the new Member States.

38
Figure 4.4: Private Credit as a per cent of GDP, 2007
Source: European Innovation Scoreboard, 2008
Moreover, the use of venture capital is limited and uneven across the Member States.
This is an issue because venture capital is critical for the emergence and growth of
innovative companies, particularly technology-based companies which require financing to
make significant investment in Research and development (R&D) and product development
prior to generating sales (banks are typically reluctant to lend money to a company that is
pre-profitability, or pre-sales).
The 2005 Flash Eurobarometer survey on access to finance found that the use of venture
capital was extremely uncommon among SMEs in the new Member States and for
managers its use was not anticipated in the near future. The use of venture capital was
more common in the EU-15 which has more developed financial markets: 6 per cent of
SMEs in the EU-15 had used capital from venture capital funds and around 14 per cent of
managers intended to use venture capital funds in the future33
. Hard data shows that
venture capital investments in the EU in 2007 varied from 0.008 per cent in Greece to 0.34
per cent of the GDP in the UK (Figure 4.5).
33 The 2005 Flash Eurobarometer survey on access for SMEs to finance in the EU countries,
produced separately for the EU-15 and EU-10 countries using the same questionnaire
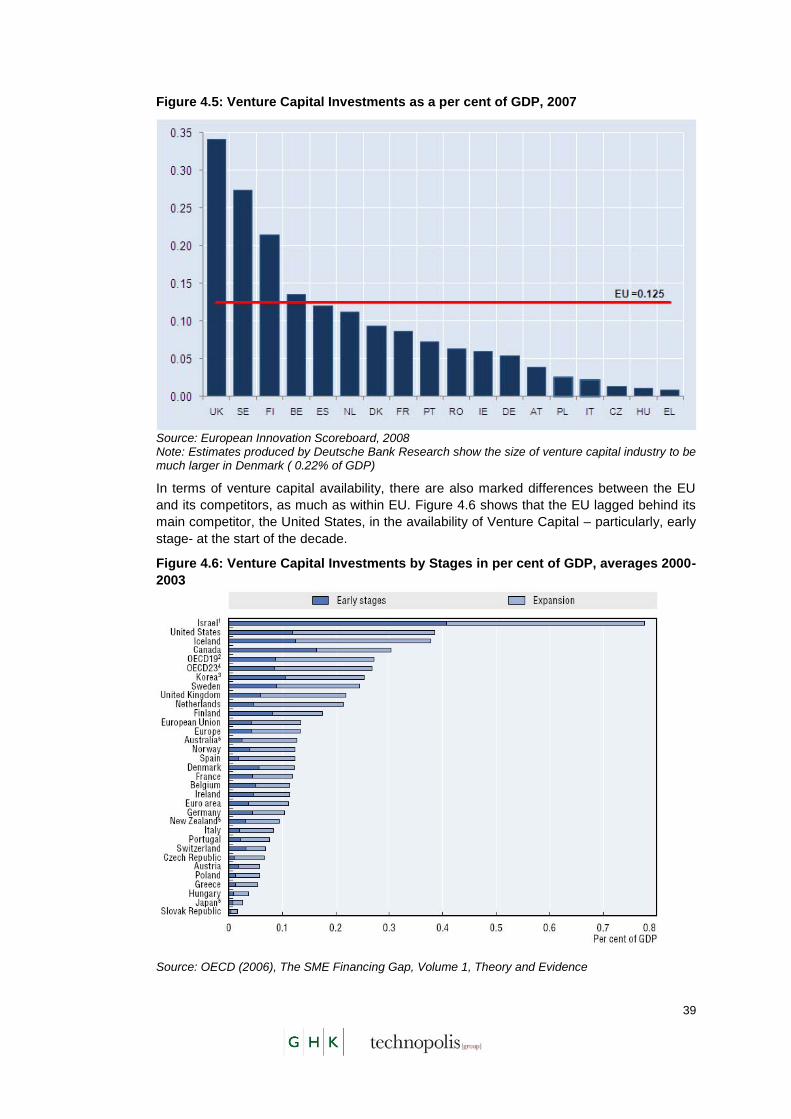
39
Figure 4.5: Venture Capital Investments as a per cent of GDP, 2007
Source: European Innovation Scoreboard, 2008 Note: Estimates produced by Deutsche Bank Research show the size of venture capital industry to be much larger in Denmark ( 0.22% of GDP)
In terms of venture capital availability, there are also marked differences between the EU
and its competitors, as much as within EU. Figure 4.6 shows that the EU lagged behind its
main competitor, the United States, in the availability of Venture Capital – particularly, early
stage- at the start of the decade.
Figure 4.6: Venture Capital Investments by Stages in per cent of GDP, averages 2000-
2003
Source: OECD (2006), The SME Financing Gap, Volume 1, Theory and Evidence

40
More recent data indicates that the European venture capital industry continues to lag
behind the United States. In 2005, for example, European venture capitalists invested EUR
12.7 billion in Europe whereas American venture capitalists invested EUR 17.4 billion in
America. Moreover, America has at least 50 times as many “angel” investors as Europe34
.
The above evidence clearly demonstrates that low financial intermediation coupled with
underdeveloped venture capital markets in the EU, create an environment that limits the
supply of SME finance from the private sector; and that public sector intervention to
address this market failure (in the availability of external finance for SMEs) is both relevant
and necessary.
Rationale for EIP financial instruments – European Added Value
The Community Financial Instruments for SMEs under EIP (and its predecessor
programme, MAP) are thus underpinned by a strong market failure rationale, being
driven by the access to finance constraints faced by start-up and growing SMEs. Moreover,
EIP financial instruments represent an innovative approach to addressing market failures in
SME financing. The financial instruments operate on a commercial basis and are designed
to promote good practice and professional standards among financial intermediaries and
Venture Capital (VC) fund managers by leveraging the expertise of the European
Investment Fund (EIF). The programme is a test-bed for launching new and innovative
instruments (such as the securitisation window and capacity building instruments) that can
be piloted through the programme and subsequently scaled-up or adopted by other EU,
national or regional programmes or schemes. Importantly, EIP financial instruments are not
designed to operate as „top-ups‟ for existing European, national or regional financing
schemes; but rather seek to achieve demonstration effect. Given the commercial focus of
the financial instruments, the geographical coverage of financial instruments (Table 4.2) is
indicative of the institutional and operational capacity of financial institutions in a particular
Member State context. For example, the ETF Start-up facility covers ten Member States –
the limited geographical coverage reflecting the under-developed nature of VC markets in a
majority of the Member States. This raises the question whether new EIP financial
instruments (and in particular, the VC based instruments) could be designed in a way that
supports the development of financial markets through greater incentivisation or more
flexibility in risk sharing arrangements. This issue could usefully be explored through the
CIP Interim Evaluation.
34 The Economist (14
th March 2009), A special report on entrepreneurship

41
Table 4.2 Geographical Coverage of MAP Financial Instruments
Source: European Innovation Scoreboard, 2008 WEF Global Competitiveness Report 2008 Note: Loan Window also operating in Norway and Turkey; Micro-credit also operating in Norway; According to Deutsche Bank Research, Denmark is estimated to have the largest VC industry in EU at 0.22% of GDP
Are EIP financial instruments creating moral hazard?
The involvement of the public sector in the provision of finance to SMEs to overcome
market failures has not been without its detractors who have questioned the need for, and
nature of, public sector intervention. Critics of such interventions argue that public
intervention in financial markets may increase moral hazard for both lenders and borrowers.
For example, borrowers that know that their loans are guaranteed by the public sector may
not feel obligated to repay them or may take unnecessary risks. At the same time lenders
may have fewer incentives for screening and monitoring borrowers, as guarantees cover
the potential losses.
An open question is whether the financial instruments can be designed in a market-friendly
way – minimising their unintended consequences while at the same time promoting private
financial market activity. The interim evaluation offers positive conclusions in this regard.
The following design features of the financial instruments limit the potential for moral
hazard:
As specified in the FMA between the EIF and the Commission, the EIF is
expected to operate commercially, seeking an appropriate return on investment;

42
The EIF identifies, appraises and selects potential FIs for the SMEG Facility in
accordance with the relevant Guarantee Policy. Some FIs may employ stricter
SME eligibility criteria, depending on their specific guarantee or loan products. In
all cases, the origination and risk assessment as well as monitoring and recovery
actions with regard to the final SME beneficiaries remain the full responsibility of
the selected FIs;
The SMEG Facility is designed on the basis of a risk sharing principle according
to which the EIF provides capped guarantees partially covering portfolios of
financing to SMEs; thus limiting the downside risk to EU budget and discouraging
intermediaries from irresponsible lending;
As per the FMA, ETF Start-up and GIF investment in risk capital funds ranks pari
passu (i.e. Like Risk, Like Reward) with private investors;
The ETF Start-up Investment Guidelines specify that investments under the
Facility cannot exceed EUR 10 million in the case of ETF Start-up and EUR 30
million in the case of GIF (or 25 per cent of the committed capital in the case of
GIF 1 and 15 per cent of commitment capital in the case of GIF 235
). This limits
the risk exposure to EU budget;
“Early expansion capital” under GIF 2 will enable VC companies to hold
investments longer, allowing them to grow in value;
EU backed VC funds are selected on the basis of a rigorous due-diligence
process (carried out by the EIF). According to the fund managers interviewed as
part of this evaluation, the EIF‟s due diligence process is acknowledged by
market players as a “quality stamp”, adding credibility to the Fund and having a
catalytic effect in raising funds from private investors; and,
The issue of moral hazard is less of a concern in the case of VC funds (as
compared to debt financing) as fund managers tend to be active investors in
portfolio companies- this is done mostly via formal representation on the board of
directors. Moreover, fund managers have a strong incentive in ensuring success
of the portfolio company as ultimately they strive to achieve a profitable exit
(positive exit multiples) - they generally want to cash-out their gains in five to ten
years after the initial investment. Performance track record and reputation is
absolutely critical in the venture capital industry in order to raise funds in the
future - so the stakes are high for fund managers to achieve profitable exits and
successful fund closings.
35 The limit is 50 per cent for funds likely to have a particularly strong catalytic role in case of GIF 1
and 25 per cent for first time funds or funds likely to have a particularly strong catalytic role in case of
GIF 2
43
Has the intervention induced market distortion?
Again the evaluation offers positive conclusions in this regard. The VC funds operate on a
commercial basis and so do not cause any market distortions. Moreover, they focus
on early-stage investments (seed and start up) - private sector interest in these market
segments has been limited and gradually declining; and so there is little or no likelihood of
private sector crowding-out. Recent research commissioned in the UK confirms that private
funds are moving away from early stage investments; while the public sector is gaining
significance36
. This trend was more generally highlighted by VC Fund Managers
interviewed during the course of this evaluation.
In the case of SMEG facility, the Commission’s ‘additionality’ rules prevent market
distortions or private sector crowding-out from occurring. Additionality is a legally
binding concept and refers to the difference in the volume that could be achievable without
the EIF support against that achieved with the EIF support during a given period.
Additionality rules prevent intermediaries from substituting their own lending with European
funds and encourage them to lend to segments not covered by the private sector. The
SMEG instrument thus allows for „quantitative additionality‟ by guaranteeing larger volumes
of loans; and „qualitative additionality‟ by reducing collateral requirements and acceptance
of higher risk (in SME lending) by the banking sector.
Financial Intermediaries were also probed on areas of overlap between SMEG facility and
private sector initiatives as part of this evaluation. None of the 24 Financial Intermediaries
interviewed, indicated the existence of any overlaps between the SMEG facility and private
sector activity in their respective national markets.
Has there been a demonstration effect?
In theory, publicly funded financial instruments should act as „commercial operators‟ or
„demonstrator projects‟. In order to demonstrate to the private sector that returns can be
made from a given market, a publicly funded fund or portfolio would need to generate
commercial rates of return given a certain level of risk.
However, EU backed financial instruments can only act as demonstrators if the market
systematically underestimated the true net returns from certain classes of investment. It is
possible to see how this is plausible for venture capital, where the market is relatively young
and expectations of returns are very much in flux (The EU market for venture capital in
particular is rather fragmented and the stage of maturity in different Member States varies
considerably37
).
36 Yannis Pierrakis and Colin Mason (2009), Shifting sands - The changing nature of the early stage
venture capital market in the UK, NESTA
37 Commission Staff Working Document accompanying the Document Communication from the
Commission “Removing obstacles to cross-border investments by venture capital funds - Glossary and Expert group report”, {COM(2007) 853 final}

44
Furthermore, European funds typically operate on a sub-optimal scale (fund size is typically
less than EUR 100 million) due to lack of well developed venture capital markets38
. Given
the embryonic stage of the EU venture capital industry, EIF (via funds mandated by the
Commission) has played a critical part in market-making through its role as a cornerstone
investor. EIF has backed a number of first-time and second-time funds giving them
legitimacy; and allowing fund managers to develop a performance track record and
subsequently raise money exclusively from the private sector for future funds– for example,
Mangrove Capital Partners developed their first two funds (New Tech I and New Tech II)
with investment from the ETF Start-up Facility; their third fund, New Tech III which closed in
July 2008, is completely funded by private investors (see Box 4.1). There are therefore
some positive signals that EU backed financial instruments have achieved some
‘demonstration effect’.
Box 4.1: Demonstration Effect of ETF Start-up Facility
Mangrove Capital Partners (Mangrove) provides venture capital to seed and early stage
technology companies, principally in e-commerce, digital media, communications and
application software fields. Mangrove was founded in 2000 by Mr. Mark Tluszcz, Mr.
Gerard Lopez, and Mr. Hans-Jürgen Schmitz. This Luxembourg based team is
composed of seasoned operational executives and successful entrepreneurs
representing six different nationalities and is one of Europe‟s most culturally diverse
venture capital team. Their mission is “to help turn visions into realities by providing
financing, thoughtful advice, relevant experience and deep industry relationships to
portfolio companies”.
Mangrove is currently managing three funds:
Their first fund, New Tech Venture Capital Fund I was set up in 2000. EIF invested
EUR 10 million in this EUR 50 million fund via the ETF Start-up Facility.
Mangrove II is a EUR 120 million venture capital fund which was established in
2005 with investment from the EIF via the ETF Start-up Facility. The fund has a ten
year life, extendable up to twelve years. EIF has committed to invest EUR 15
million in Mangrove II over its lifetime.
In July 2008, Mangrove successfully closed their third fund, Mangrove III. This
EUR 180 million fund is entirely privately funded and has a global investor base.
New Tech Venture Capital I ranks among the top-performing venture capital funds with a
2000 vintage year. Exits, to date, from the fund include the sale of Skype Technologies
which was acquired by eBay in 2005 for $2.6 billion in cash and stock plus about $1.5
billion in contingent payments39
. It is reported that Mangrove made this successful exit in
less than three years of their initial investment.
Mangrove is one of the biggest success stories of European venture capital industry.
Mangrove has been named on the 2007 and 2008 Forbes' Midas List which ranks the
world‟s best dealmakers in high-tech and life sciences. Through New Tech Venture
Capital I and Mangrove II, the management team has succeeded in identifying high-
profile investments with attractive exit potential. A core part of their strategy is to invest in
38 Information on the size of investment portfolio of VC funds in countries is in Annex III available at:
http://ec.europa.eu/enterprise/entrepreneurship/financing/docs/cross_border_investment_report_30m
arc h07.pdf
39 Source: Mergerstat M&A Database

45
companies developing disruptive technologies at an early stage (prior to product launch).
Their philosophy is to back “entrepreneurs with a dream” and products and services that
have the potential to be “game changers” in their respective industries.
Another indicator of Mangrove‟s success is its high rate of deal flow – every year
Mangrove receives 750 to 1000 business plans of which only 6 to 7 are funded
(representing less than 1 per cent of the deal flow).
EIF (via the ETF Start up Facility) has played a crucial role in Mangrove‟s success - as a
cornerstone investor in their first time fund and by making an early commitment in their
second fund. Furthermore, the due diligence carried out by EIF, as part of its investment
process, made it easier for Mangrove to raise funds from other investors. Mangrove
closed their third fund in three months without any public support. This is a good example
of the „demonstration effect‟ of publicly backed venture capital funds – EIF‟s investment
in Mangrove has positively demonstrated to the private sector that returns can be made
from investing in the seed/ early-stage segment.
4.3.3 Are the financial instruments relevant to the objectives of the programme?
The EIP has been designed to create and develop wider framework conditions for
innovation and competitiveness – access to finance being one of them. There is
considerable empirical evidence to demonstrate a strong link between the availability of
finance and a country‟s competitiveness. For example, the Global Competitiveness Report
for 2008-9 shows a strong correlation between availability of venture capital/ access to
loans and competitiveness score/ ranking of a country (Figures 4.7 and 4.8).
Figure 4.7: Scatter Diagram: GCI Score and Access to Loans (R= 0.65)
Q: How easy is it to obtain a bank loan in your country with only a good business plan and
no collateral? (1 = impossible, 7 = very easy)
Source: Global Competitiveness Report 2008-2009, World Economic Forum

46
Figure 4.8: Scatter Diagram: GCI Score and Venture Capital Availability (R=0.84)
Q: In your country, how easy is it for entrepreneurs with innovative but risky projects to find
venture capital? (1 = impossible, 7 = very easy)
Source: Global Competitiveness Report 2008-2009, World Economic Forum
Given that the availability of finance is an important framework condition for
competitiveness, there is a valid justification for supporting financial instruments such as
loan guarantees and venture capital funds, as these contribute to overall EIP objectives.
Venture capital, in particular, plays a crucial role from an economic standpoint and
is important to the commercialisation of R&D. It is a well documented fact that start-ups
funded by venture capital tend to be the more innovative firms in an economy, contributing
to economic productivity and growth. For example, between 2000 and 2004, European
venture-capital financed companies created 630,000 new jobs in investee companies40
.
Empirical evidence also shows that a start-up‟s chances for success will increase if it can
attract venture capital. A study conducted in the US41
found that 90 per cent of start-ups
that were unable to attract venture capital within the first three years failed, while the failure
rate dropped to 33 per cent for those that did attract venture capital. This is because in
addition to finance, venture capitalists provide crucial value-added services such as their
expertise and experience.
40 EVCA Yearbook 2008
41 Paul A. Gompers & Josh Lerner (2001) The Money of Invention: How Venture Capital creates New
Wealth
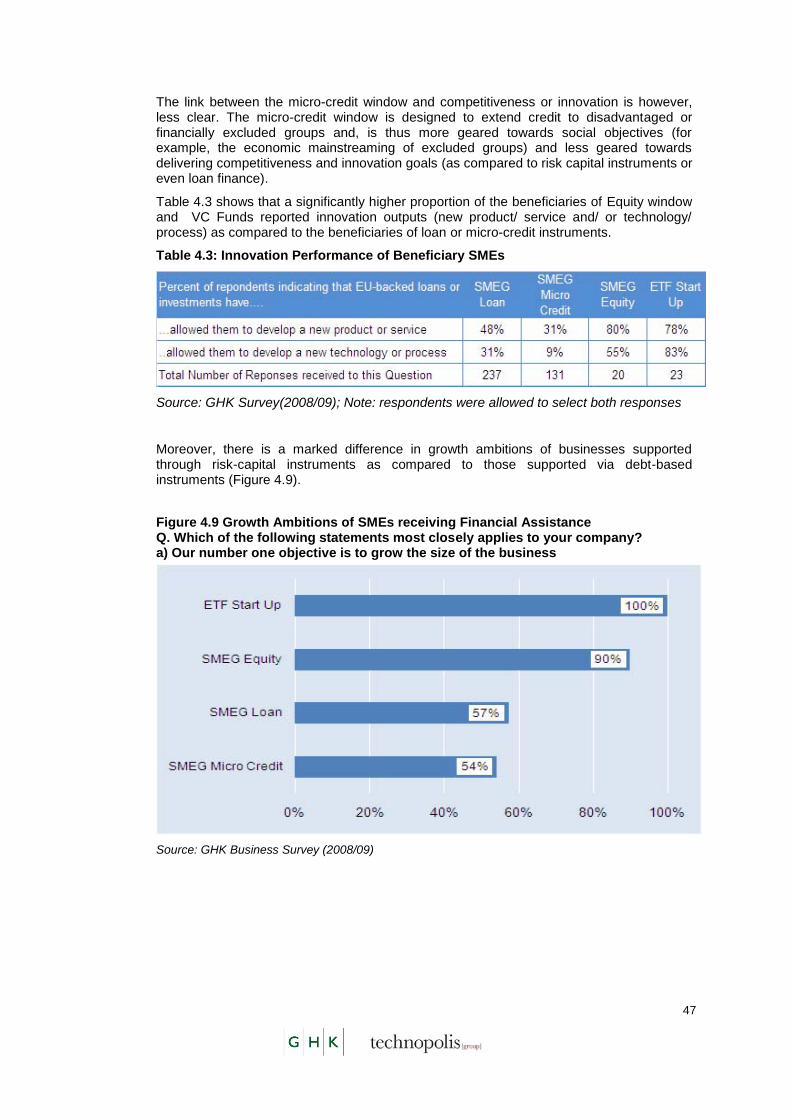
47
The link between the micro-credit window and competitiveness or innovation is however, less clear. The micro-credit window is designed to extend credit to disadvantaged or financially excluded groups and, is thus more geared towards social objectives (for example, the economic mainstreaming of excluded groups) and less geared towards delivering competitiveness and innovation goals (as compared to risk capital instruments or even loan finance).
Table 4.3 shows that a significantly higher proportion of the beneficiaries of Equity window and VC Funds reported innovation outputs (new product/ service and/ or technology/ process) as compared to the beneficiaries of loan or micro-credit instruments.
Table 4.3: Innovation Performance of Beneficiary SMEs
Source: GHK Survey(2008/09); Note: respondents were allowed to select both responses
Moreover, there is a marked difference in growth ambitions of businesses supported through risk-capital instruments as compared to those supported via debt-based instruments (Figure 4.9).
Figure 4.9 Growth Ambitions of SMEs receiving Financial Assistance Q. Which of the following statements most closely applies to your company? a) Our number one objective is to grow the size of the business
Source: GHK Business Survey (2008/09)
48
This difference in ambition is also reflected in the job-creation potential of loan/ micro-credit guarantee instruments –existing evaluation evidence from Growth and Employment initiative
42, suggests that the loan/ micro-credit window on average created 1.2 jobs per
assisted SME as compared to the ETF start-up programme, which on average created 15 jobs (and supported 37 existing jobs) per investee company.
4.3.4 How have the needs changed overtime? Has the programme responded to the
changes? Is it able to respond to any future changes?
The EIP instruments represent a continuation and evolution of MAP instruments in
response to changing market conditions and lessons learned from implementation. For
example, the SMEG Loan window under EIP is more flexible as compared to MAP as it
allows lending for both investment and working capital purposes (under MAP, only loans for
investment purposes were eligible). This is a positive change particularly in the current
economic context. Tightening market conditions for access to credit and late payment
issues from clients are making it hard for SMEs to meet their working capital requirements
and consequently threatening their survival. To alleviate the problem, the Commission is
presently considering how trade credit may be supported through the financial instruments.
Similarly, the GIF instrument is more flexible than the ETF Start-up facility in relation to the
criteria for investment in SMEs (for example, it allows investments in older companies in
certain industries such as life sciences). GIF2 was created to increase the supply of
development equity for innovative SMEs in their expansion stage and to create an exit
market for seed/ early stage VC funds.
The financial instruments comprise a portfolio of debt (loan window), equity (GIF) and
hybrid instruments (equity window) to cater to a range of financing needs of SMEs at
different stages of their development and for different levels of financing (ranging from as
low as EUR 3,000 to almost EUR 3 million).
EIP offers a mix of pro-cyclical (venture capital) and counter-cyclical (guarantees)
instruments which allows for responsiveness to changing market conditions; flexible design
permits adaptability to local conditions; and, a global budget (with the possibility to transfer
resources easily between different instruments facilitates absorption and the maximum
utilisation of available funds.
42 Growth and Employment data quoted in Commission‟s impact assessment of EIP and further
evidence drawn from EIF, “The Economic Impact of Venture Capital – A Study based on the experience of the EIF with ETF Start-up Programme”

49
Recent economic developments have, however, raised questions about the
underlying intervention logic for the financial instruments. The credit crisis is having
an extremely negative effect on availability of bank credit. All the FIs interviewed confirmed
tightening of credit conditions – both in terms of price and availability of credit (credit
rationing). Some of the FIs interviewed, are cutting unused credit lines or withdrawing
overdraft facilities. This is corroborated by the January 2009 ECB Bank Lending Survey
which reports that about 63 per cent of the banks have tightened their lending conditions to
SMEs in the fourth quarter of 2008 (in relation to the previous quarter). Moreover, net
demand for loans by enterprises is reported to have declined considerably and remained
negative in the fourth quarter of 2008, standing at -40 per cent. The negative net demand
was driven by a decline in the financing needs for fixed investment (to -60 per cent) and by
a further drop in the demand stemming from M&A activity and corporate restructuring (-44
per cent).
Current Government support is addressing the immediate problems of the crisis – through
massive increases in the use of loan guarantees to improve access to loan capital, bail-outs
and coordinated policy responses. Measures recently announced to support small
businesses will assist those most immediately affected by the credit crisis. But there are
longer term challenges – exacerbated by the current recession – which must be addressed.
The challenge for public policy beyond the immediate fiscal and monetary measures to
stimulate the economy is to create opportunity out of adversity and to strengthen the
capacity of EU SMEs to deal with the long-term challenges (climate change, rising
competition from Asian economies etc.). It would be all too easy for innovation to be
sidelined by the recession. Investment in new technologies is likely to be reduced. R&D
spending is usually pared back by cash-strapped firms. Start-ups will have to compete more
fiercely for venture capital that will be in shorter supply. In this context, it is important for
the programme to maintain the supply of venture capital to innovative firms with high
growth potential.
It should also be borne in mind that most venture capital goes to a narrow sliver of
businesses: ICT, biotechnology etc. and that venture capitalists fund only a small fraction of
start-ups. Venture capitalists are credited for Silicon Valley success stories such as Google,
Amazon.com and Apple Computer. But each of these companies first relied on angels and
might never have attracted venture capital without them43
. Monitor, has recently conducted
an extensive survey of entrepreneurs, emphasises the importance of “angel” investors, who
operate in the middle ground between venture capitalists and family and friends44
. In the
United States, for example, federal and state governments provide 23–30 percent of early
stage technology development finance, while angel investors contribute 24–27 percent.
Venture capital contributes only 3–8 percent45
. Moreover, there is a discernable shift in
venture capital activity from seed/ early-stage to later stages and evidence of widening
market gap caused by the credit crisis. In 2008 early-stage investment deals in Europe
dropped to EUR 1.6 billion from EUR 1.7 billion in 200746
.
43 Mark Van Osnabrugge & Robert J. Robinson (2005), Angel Investing: Matching Start-up Funds with
Start-up Companies.
44 Monitor (2009), Paths to Prosperity, Promoting Entrepreneurship in the 21st Century
45 Based on lower-case and upper-case modelling by Auerswald and Branscomb (2003).
46 Private Equity Barometer Q4 2008 Preliminary Data, 22 January 2009
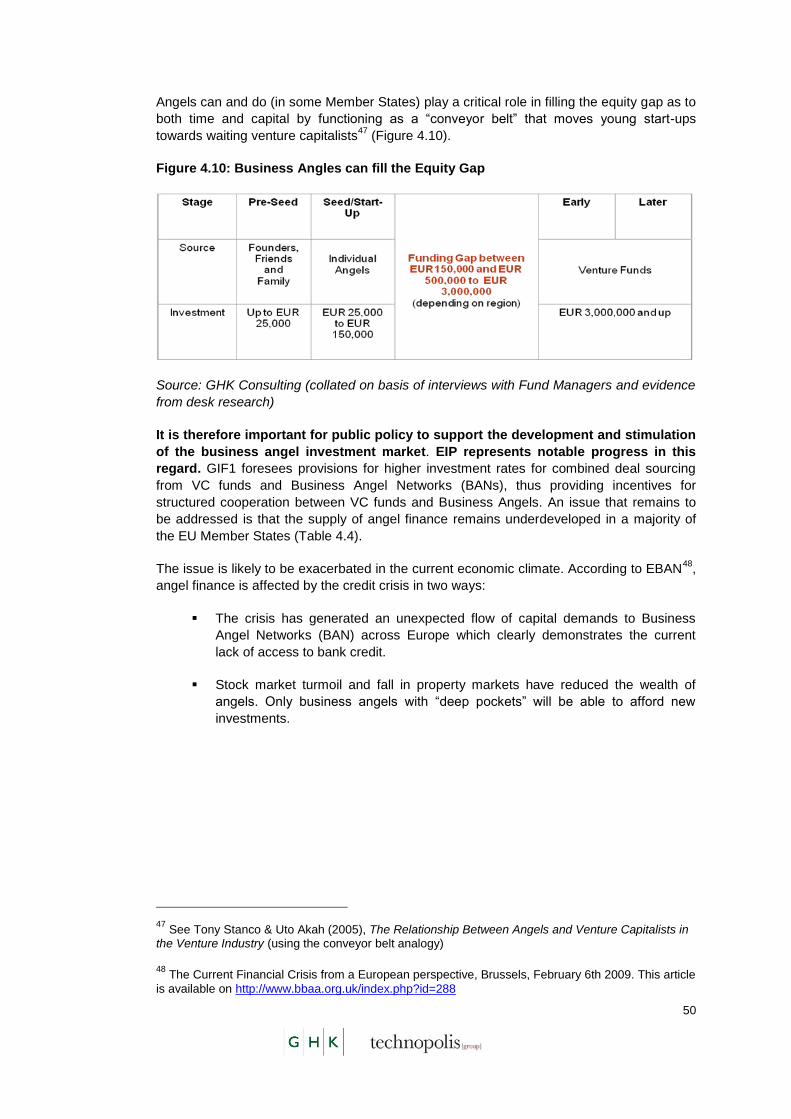
50
Angels can and do (in some Member States) play a critical role in filling the equity gap as to
both time and capital by functioning as a “conveyor belt” that moves young start-ups
towards waiting venture capitalists47
(Figure 4.10).
Figure 4.10: Business Angles can fill the Equity Gap
Source: GHK Consulting (collated on basis of interviews with Fund Managers and evidence
from desk research)
It is therefore important for public policy to support the development and stimulation
of the business angel investment market. EIP represents notable progress in this
regard. GIF1 foresees provisions for higher investment rates for combined deal sourcing
from VC funds and Business Angel Networks (BANs), thus providing incentives for
structured cooperation between VC funds and Business Angels. An issue that remains to
be addressed is that the supply of angel finance remains underdeveloped in a majority of
the EU Member States (Table 4.4).
The issue is likely to be exacerbated in the current economic climate. According to EBAN48
,
angel finance is affected by the credit crisis in two ways:
The crisis has generated an unexpected flow of capital demands to Business
Angel Networks (BAN) across Europe which clearly demonstrates the current
lack of access to bank credit.
Stock market turmoil and fall in property markets have reduced the wealth of
angels. Only business angels with “deep pockets” will be able to afford new
investments.
47 See Tony Stanco & Uto Akah (2005), The Relationship Between Angels and Venture Capitalists in
the Venture Industry (using the conveyor belt analogy)
48 The Current Financial Crisis from a European perspective, Brussels, February 6th 2009. This article
is available on http://www.bbaa.org.uk/index.php?id=288
51
Table 4.4 Business Angel Activity in EU Member States, 2008
Source: Enterprise Finance Index
Note:
Data for Belgium, Finland, France, Italy, Spain, Sweden, Netherlands, Portugal and UK
have been provided by the national federations of angel networks/groups
"-" = No data available
[1] Data collected via a research project of the Bocconi University on the informal venture
capital market, and not through networks belonging to EBAN
[2] Data refer only to the Catalonia region
52
The above discussion demonstrates that the underlying intervention strategy of the financial
instruments remains valid and the evidence of this evaluation points to the need for EIP to
place greater emphasis on risk-capital and hybrid instruments (as compared to purely debt
based instruments) to support the financing needs of innovative SMEs with high growth
potential.. However, specific financial instruments should be developed in the future
programmes – such as those aimed at enhancing the supply of angel finance49
. In doing
so, consideration should be given to special characteristics of business angel activity: angel
investing tends to be highly localised, relationship-driven and industry-specific; and this
raises the question whether it is more appropriate to support business angel activity at a
national or a regional level (via ERDF programmes) or whether it should be supported via
EIP.
The Commission should also examine the rationale and scope for use of new instruments
such as venture debt in future programmes (Box 4.2).
Box 4.2: What is Venture Debt?
Venture debt funding provides emerging, venture backed companies with the additional
capital needed for the purchase of hardware and infrastructure equipment, enabling venture
backed companies to reserve the equity capital investments for business critical activities
such as research and development, marketing practices, and hiring. Additionally, venture
debt can be used to finance inventory and demonstration equipment and can be purely
offered as growth capital.Venture debt is an attractive option for emerging companies,
venture capitalists and for investors. For emerging, venture-backed companies, venture
debt reduces equity dilution by slowing the burn rate of the company‟s cash reserves,
lengthening the cycles it goes through in securing new and costly rounds of venture capital.
For the venture capitalists, venture debt leverages equity capital investments, providing
stability to a VC‟s portfolio by adding additional financial sources. In addition, venture debt
augments equity returns through its lower capital costs. For the investor, venture debt
provides a hybrid alternative to a traditional venture capital fund, combining the
predictability of fixed income with the potential returns of venture capital.
The use of venture debt has risen sharply in recent years50
:
In 2007 $2bn of venture debt loans were granted in the USA (or 7 per cent of all
money invested in venture capital backed companies), an increase from $500m in
2002. Companies that have taken on venture debt include: MySpace;
Cooking.com; and Athena health.
In Europe, $500m of venture debt loans were granted in 2007, an increase from
almost zero in 1997. Companies that have used venture debt include: Last.fm;
Codemasters; Lovefilm.
49 According to European Business Angels Network, equity gap is the phase between EUR 500,000
and EUR 3 million where high potential start-ups have the greatest difficulties in accessing finance. In some countries the gap is from EUR 150.000 to EUR 3 million. http://www.bbaa.org.uk/index.php?id=288
50 FT Article “Orix deal highlights growth of 'venture debt' in Europe” by Martin Arnold,
Private Equity Correspondent, Published: June 26 2008

53
4.3.5 Is there overlap/ interplay between EIP financial instruments and other publicly /
privately funded instruments? Or is there a market gap that could usefully be met
through the financial instruments?
Overlap/ interplay between EIP instruments and national/ regional schemes
Most Member States operate loan guarantee schemes (and their use has been extended in
response to the credit crisis). It appears that in some Member States (such as Hungary,
Poland and Finland), SMEG facility is preferred over national guarantee schemes because
guarantee fees are not charged to borrowers (whereas national schemes charge guarantee
fees) making the scheme attractive for SMEs. Feedback from Financial Intermediaries
however, suggests that the eligibility criteria and operational conditions (such as sector,
purpose etc.) for national schemes usually differs from EIP/ MAP guarantee schemes and
consequently, the latter are seen to complement existing national and regional schemes.
None of the Financial Intermediaries interviewed could give an example of a privately
funded guarantee scheme in their respective Member State.
As regards the VC facility, the geographical scale of EIP funded VC funds distinguishes
them from nationally/ regionally sponsored initiatives. VC funds supported through EIP (and
its predecessor programme, MAP) operate on an EU wide scale i.e. they can make
investments anywhere in the EU. Publicly funded national / regional schemes on the other
hand, can only invest in national/ regional businesses. As already indicated in Section
4.3.2, there is no evidence of private sector crowing out in the VC markets.
Overlap/ interplay between EIP instruments and EU Structural Funds
There is a risk of overlap between European Regional Development Fund (ERDF)
programmes managed by DG Regional Policy and EIP in the area of access to finance. The
2000-06 Structural Fund Regulations placed increased emphasis on the use of Venture
Capital and Loan Fund (VCLF) instruments as a more cost-effective and sustainable public
policy instrument than traditional grant-based aid. The Regulations for the current (2007-
13) Structural Fund programming period continue this emphasis.
During the 1994-99 Structural Fund programming period, accounted for some EUR 570
million (2.7 per cent of the total support to SMEs)51
. In the 2000-06 period, it had increased
to an estimated EUR 1,256 million52
. In the 2007 – 2013 round, EU Member States have
allocated around EUR 3,107 million of ERDF to venture capital funds alone53
. This dwarfs
the EUR 550 million allocated to venture capital funds under EIP.
Historically, a key difference between DG Regional Policy‟s programmes (such as ERDF)
and DG Enterprise and Industry‟s programmes (such as MAP) has been that ERDF was not
only little used for financial instruments; but where it was, it funded instruments only in
eligible areas defined at a local or regional level; whereas MAP funds focussed on financial
instruments which were used across the EU (although mostly at the national level). Under
EIP, VC funds are of two types: multi-country funds or funds with essentially national
coverage.
51 Ernst & Young (1999), Impact of the Structural Funds on SMEs
52 CSES (2008) Evaluation of ERDF Supported Venture Capital And Loan Funds
53 Based on data from Inforegio as of 10
th March 2008

54
In the 2007-2013 programming period, the geographical restrictions on ERDF have been
lifted and all EU regions are now eligible for ERDF through either the Convergence
objective or the Competitiveness and Employment objective (which covers all regions not
already covered by the Convergence Objective). Moreover, DG Regional Policy has
introduced specific instruments in the new programmes that Member States may choose to
opt into. These are:
Joint European Resources for Micro and Medium Enterprises (JEREMIE) - a joint
initiative between DG Regional Policy and the EIF. The aim of JEREMIE is to
enhance access to finance and innovation in the context of the 2007-2013
Cohesion Policy. Under this initiative, launched in October 2005, national and
regional authorities can opt to deploy resources from their ERDF programme in
the form of a revolving Holding Fund acting as an umbrella fund or „fund of funds‟.
Under JEREMIE, the Holding Fund would finance a tailor made portfolio of
financial instruments to address Member States needs in SME Finance. The
portfolio can include different financial products varying from equity and quasi-
equity to venture capital, loans or guarantees and micro finance; and,
Joint Action to Support Micro-finance Institutions in Europe (JASMINE) –
launched on 10th September 2008, this initiative seeks to improve access to
finance for small businesses and for socially excluded people, also ethnic
minorities, who want to become self-employed. This facility would also be
managed by the EIF.
It may be argued that the management and implementation of ERDF programmes is
decentralised and therefore, ERDF programmes are more aligned with national and
regional policy objectives as compared to the EIP which focuses on issues that require a
coherent policy response at an EU level. While in theory, this may appear to be a clear-cut
and logical distinction; in practice it is not so clear and poses practical difficulties. For
example, it is not clear at present how EIF will allocate deals between its different mandates
(EIB, DG Enterprise and Industry, external mandates and in future, ERDF-backed
mandates). With the implementation of JEREMIE, a transparent deal allocation policy
becomes an even more important issue. Although policy and project coordination meetings
with DG Regional Policy have been initiated by DG Enterprise and Industry since the
beginning of 2008 (now including also DG Economic and Financial Affairs and the EIF), it is
more the need to apply a deal allocation policy where work remains to be done.
EIP financial instruments partly suffer from lack of visibility among beneficiaries – this issue
may be exacerbated by the implementation of JEREMIE and JASMINE. Although JEREMIE
and JASMINE are optional instruments for Member States to adopt, National/ Regional
Authorities that do not opt-in for JEREMIE or JASMINE can nevertheless allocate
(significant) ERDF resources to Venture Capital and Loan funds (VCLFs). This could
potentially result in a situation where different EU funded schemes are competing
with each other at various levels (at the level of deal allocation and at the level of
SME financing) and potentially crowding-out private sector activity.
4.3.6 In what ways do the EIP financial instruments influence policy?
Given the credit crisis, the widespread perception that financial institutions, particularly
private banks have through their behaviour been a prime contributor to the crisis and the
radical re-appraisal of public policies (from bail outs to initiatives to stimulate demand and
coordinated international responses) it is especially difficult to judge the effects of EIP
financial instruments on policy. However, the following can be said at this stage:

55
The scale of EIP financial instruments is small relative to overall levels of funding
and indeed to the scale of reductions in availability of finance (from private
suppliers) that have occurred as a result of the crisis;
The rationale of the EIP to help generate a set „menu‟ of alternative means of
accessing finance and stimulating the development of financial markets remains
valid;
The notion of public sector loan guarantees is in very good currency but not so
much as a means of „filling gaps‟ but as a means of stimulating the economy
because of the „market failures‟ of banks that have led them to withdraw from
lending in some Member States;
The notion that there is a strong social rationale for some forms of public sector
support to finance SMEs is also in good currency as Member states face the
prospect of higher levels of unemployment; and,
The EIP programme offers a test-bed for new financial instruments and
innovative approaches – such as the securitisation window.
4.4 Effectiveness
4.4.1 What was the impact (both gross and net) of the Financial Instruments (i.e. taking in
account estimated finance to SMEs that would have happened in the absence of the
MAP and Growth and Employment Initiative)?
Number of SMEs receiving Financing
Latest monitoring data (as of 30 September 2008) shows that the MAP financial
instruments have provided equity or loan financing to 241,969 SMEs - thus exceeding the
programme target of 200,000 by over 20 percent. In relation to the scale of the financing
gap, approximately 6 per cent of the EU SMEs facing a financing constraint have so far
been assisted via MAP financial instruments (Table 4.5. To note that breakdown of assisted
SMEs by country is only available until 30 June 2008).

56
Table 4.5 Breakdown of Assisted SMEs (MAP) by Country and in relation to the
Financing Gap
Sources: Eurostat (2008) Enterprises by size class - Overview of SMEs in the EU 2007 SME Observatory Survey SMEG 2001 Facility, Annual Report dated 31 October 2008 with data as at 30 June 2008 ETF Start-up, Annual Report dated 31 October 2008 with data as at 30 June 2008 Notes: „-' Data not available Loan window - other countries include Norway (44) and Turkey (196) Micro window - other countries include Norway ETF Start-up - other countries include Israel (1), Singapore (1), Switzerland (5) and USA (11)

57
Jobs Created or Safeguarded in Assisted Companies
Although, the evaluation requires an estimation of gross and net impact of the financial
instruments; in practice the monitoring systems for the financial instruments do not enable
this. EIF compiles and presents data on two-year employment forecasts (in relation to the
year of inclusion in the portfolio)54
for assisted companies in the SMEG annual report.
However, this information is not very useful for evaluative purposes because:
The inclusion year (or the baseline year) varies for each SME making it difficult to
establish employment during a specific year; and,
The forecasts are of limited use in absence corresponding data reporting actual
employment and related information on SME characteristics (such as business
survival rate, industry, product development, innovation, markets etc.). Such
information is more effectively and efficiently collected through independent
evaluation surveys.
Moreover, the annual reports do not include employment data for micro-credit and equity
windows as under the guarantee agreements for these windows, its optional for FIs to
report employment forecasts.
The SME survey carried out as part of this evaluation, included questions to determine the
baseline position of assisted companies and any changes in their headcount . However, a
relatively large number of SMEs could not provide precise details and instead they chose
to provide an indicative range - this was because a number of financial intermediaries could
not send a „warm-up‟ letter to the SMEs ahead of the fieldwork and consequently, many
respondents did not have this information at hand at the time of the telephone interview.
Estimates of MAP employment effects have therefore been made on the basis of the
following existing evidence:
According to the 2007 employment survey of the loan guarantee scheme, SMEs
reported a 17 per cent change in employment since receiving the loan55
(this is
consistent with G&E evidence which demonstrates that on average beneficiary
SMEs created 1.2 jobs over a 5 year period);
Evidence from G&E initiative56
indicates that:
The micro-credit window on average, created1 job per assisted SME over
a 5 year horizon; and,
VC funds created, on average, 15 jobs (and supported 37 existing jobs)
per SME over a 5 year horizon.
These assumptions have been used to estimate the gross employment effects of MAP
financial instruments (Table 4.6).
54 Year of inclusion refers to the year the SME is included in the portfolio i.e. the year it receives the
loan or investment .
55 SMEG 2001 Facility, Annual Report issued on 31 October 2008 with data as of 30 June 2008.
56 p(19) Annex to the Proposal for a Decision of the European Parliament and of the Council
establishing a Competitiveness and Innovation Framework Programme (2007 – 2013)

58
Table 4.6: Estimates of Gross Jobs Created or Safeguarded (MAP financial
instruments)
Data on SMEs receiving financing sourced from Annual Report, SMEG 2001 Facility dated 31
October 2008 (data as of 30 June 2008); and Annual Report, ETF Start-up Facility dated 31 October
2008 (data as of 30 June 2008)
Gross outputs, however, need to be adjusted to take account of various factors:
Leakage – the extent to which the intervention has benefited firms outside the target
area or target group;
Deadweight – the extent to which effects would have occurred even in the absence
of SMEG funding / intervention;
Displacement – the extent to which the impact of the intervention has been offset by
reductions in activity elsewhere in the economy. For example, support to a firm in
form of a guaranteed loan results in the firm taking business from other, non-
assisted, European companies. Consequently, the gross new jobs generated in the
assisted SME will be partly or wholly offset by job losses in non-assisted European
companies. The result of displacement is to reduce the scale of net additional
employment impacts; and,
Economic Multiplier Effects – the extent to which the economic benefits of funded
activities have additional benefits through money being re-spent in the region by
firms and their employees. The two types of multipliers are supplier linkages, that is,
the impact of the purchases of local goods and services by assisted firms which is
attributable to the project; and income multipliers i.e. the impact of the expenditures
of those receiving a wage as a result of the project.
Leakage
Countries participating in MAP included EU Member States, Candidate Countries (except
Croatia) and EFTA/EEA countries. Consequently a small proportion of the assisted
companies were located outside the EU. Table 4.7 shows the estimated employment
impact of MAP financial instruments in each Member State.
59
Table 4.7 Estimated Jobs Created or Safeguarded in Assisted SMEs located in the EU
Sources: SMEG 2001 Facility, Annual Report dated 31 October 2008 with data as at 30 June 2008 ETF Start-up, Annual Report dated 31 October 2008 with data as at 30 June 2008
Deadweight
Companies were asked, using a series of questions exploring alternative scenarios, the
extent to which the anticipated business change or investment would have occurred in the
absence of finance from the MAP financial instruments. The responses to these questions
(Table 4.8) have informed estimates of the extent of deadweight associated with the
investment, which when applied to the estimated change employment provide an estimate
of the net additional change at the level of the SMEs. The survey results indicate that two
out of three companies would not have undertaken the project without the guaranteed loan
(SMEG), or would have done less. Only one out of three companies surveyed, responded
that they would have either set up the business or undertaken the project even without the
guaranteed loan. In case of companies receiving investments through the SMEG equity
window, deadweight is lower with only one in five companies reporting that they would have
either set up the business or undertaken the project even without the external equity.
60
Investments via the ETF Start-up Facility demonstrate an even lower level of deadweight –
only one in 25 companies would have been set-up without the investment from EU backed
VC funds. The majority of the start-ups (57 per cent) would not have been set-up in absence
of the investment from EU backed VC Funds; a smaller proportion (about 39 per cent) would
have been set-up at a smaller scale.
Table 4.8 SME Survey: Effect of Not Obtaining Finance
Q. Would you still have set up the business or undertaken the project that was
financed by the guaranteed loan (or external equity) had you not been successful in
obtaining the guaranteed loan (or external equity)?
Source: GHK Business Survey (2008/09)
Companies indicating partial deadweight were asked to specify the scale of their investments
in absence of the guaranteed loan or external equity (Table 4.9).
Table 4.9 SME Responses to Follow-up Question relating to Deadweight
Q. If the project or business would have been set up on a smaller scale - approximately
what percentage of the investment would you have secured without the guaranteed
loan or external equity from the ETF Start-up Facility?
Source: GHK Survey (2008/09)
Taking into account the above responses, the overall assessment of deadweight (obtained by
summing up full deadweight and partial deadweight estimates) is summarised in Table 4.10.
Table 4.10 Quantified Estimates of Deadweight for MAP Financial Instruments
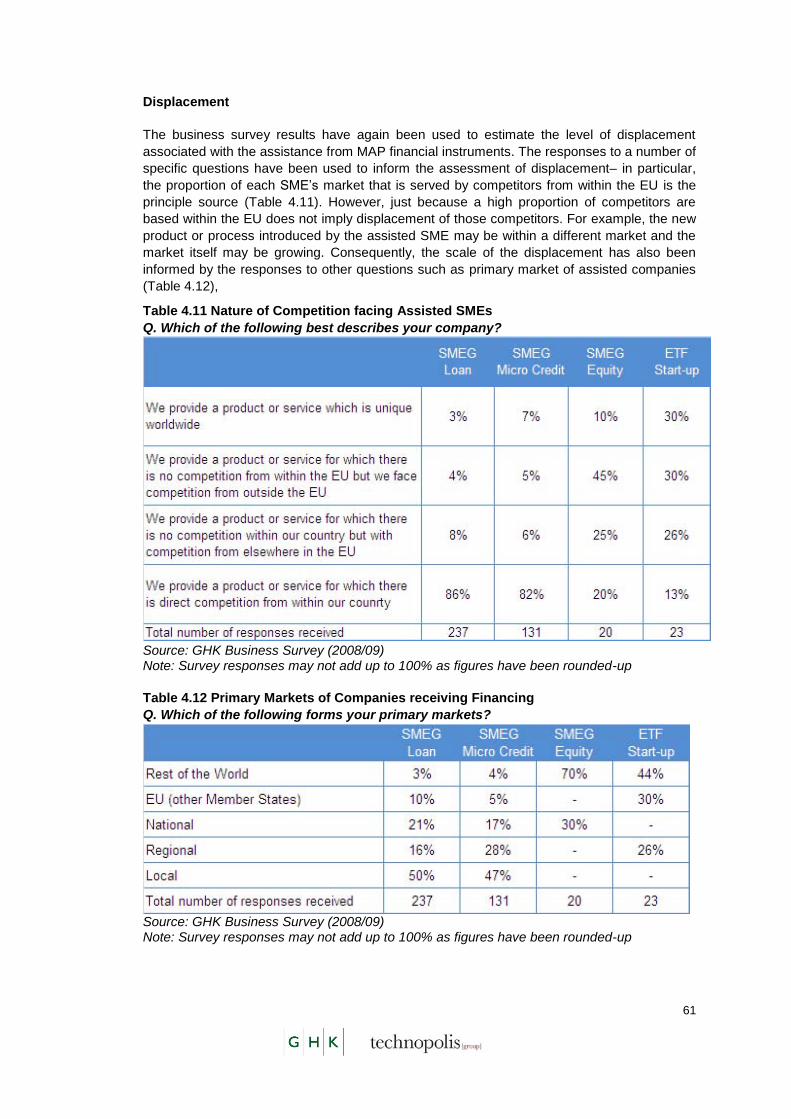
61
Displacement
The business survey results have again been used to estimate the level of displacement
associated with the assistance from MAP financial instruments. The responses to a number of
specific questions have been used to inform the assessment of displacement– in particular,
the proportion of each SME‟s market that is served by competitors from within the EU is the
principle source (Table 4.11). However, just because a high proportion of competitors are
based within the EU does not imply displacement of those competitors. For example, the new
product or process introduced by the assisted SME may be within a different market and the
market itself may be growing. Consequently, the scale of the displacement has also been
informed by the responses to other questions such as primary market of assisted companies
(Table 4.12),
Table 4.11 Nature of Competition facing Assisted SMEs
Q. Which of the following best describes your company?
Source: GHK Business Survey (2008/09) Note: Survey responses may not add up to 100% as figures have been rounded-up
Table 4.12 Primary Markets of Companies receiving Financing
Q. Which of the following forms your primary markets?
Source: GHK Business Survey (2008/09) Note: Survey responses may not add up to 100% as figures have been rounded-up
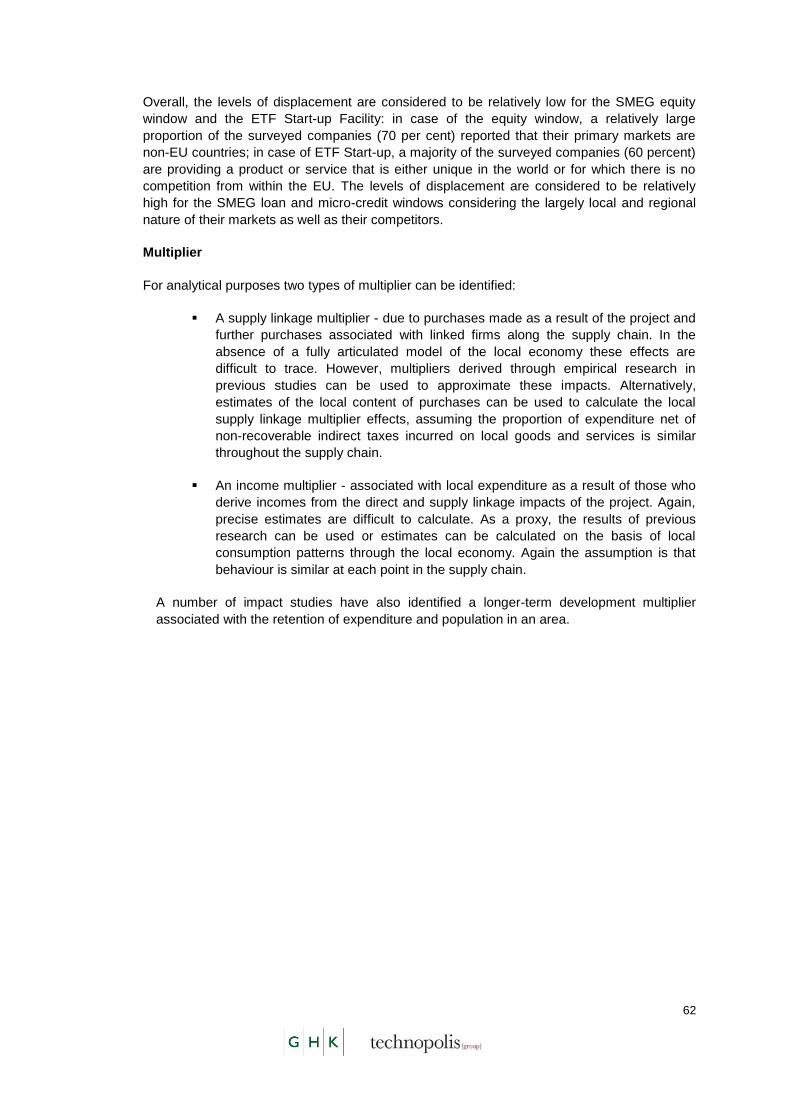
62
Overall, the levels of displacement are considered to be relatively low for the SMEG equity
window and the ETF Start-up Facility: in case of the equity window, a relatively large
proportion of the surveyed companies (70 per cent) reported that their primary markets are
non-EU countries; in case of ETF Start-up, a majority of the surveyed companies (60 percent)
are providing a product or service that is either unique in the world or for which there is no
competition from within the EU. The levels of displacement are considered to be relatively
high for the SMEG loan and micro-credit windows considering the largely local and regional
nature of their markets as well as their competitors.
Multiplier
For analytical purposes two types of multiplier can be identified:
A supply linkage multiplier - due to purchases made as a result of the project and
further purchases associated with linked firms along the supply chain. In the
absence of a fully articulated model of the local economy these effects are
difficult to trace. However, multipliers derived through empirical research in
previous studies can be used to approximate these impacts. Alternatively,
estimates of the local content of purchases can be used to calculate the local
supply linkage multiplier effects, assuming the proportion of expenditure net of
non-recoverable indirect taxes incurred on local goods and services is similar
throughout the supply chain.
An income multiplier - associated with local expenditure as a result of those who
derive incomes from the direct and supply linkage impacts of the project. Again,
precise estimates are difficult to calculate. As a proxy, the results of previous
research can be used or estimates can be calculated on the basis of local
consumption patterns through the local economy. Again the assumption is that
behaviour is similar at each point in the supply chain.
A number of impact studies have also identified a longer-term development multiplier
associated with the retention of expenditure and population in an area.

63
4.4.2 What were the gross and net quantitative effects (of financial instruments under MAP
and G&E), taking into account the indicators as specified in Annex II 5 to Decision
1639/2006, in particular, has a appropriate number of SMEs been reached and have
adequate leverage effects and cost benefits been achieved?
The effectiveness of the financial instruments can more reliably be assessed through
performance indicators such as number of SMEs receiving funds, investment volumes and
leverage. The data for these indicators is summarised in Table 4.13.
Table 4.13: Key Performance Indicators – ETF Start Up Facility (mEUR unless
indicated otherwise)
Source: Quarterly Report, ETF Start-up, 31 December 2008
* Data sourced from Annual Report, ETF Start-up, 31 October 2008 (data as at 30 June 2008)
Over the last decade (1998 – 2008), 39 venture capital funds have been set-up with
investment from the G&E initiative and the MAP. So far, these funds have invested in over
500 companies and this number is expected to rise as a number of MAP funds are still in
their investment phase. Investment in VC funds generates a leverage effect (defined here
as target fund size divided by ETF committed capital) of 1:6.5 (MAP) i.e. every 1 EUR of
EU investment generates EUR 6.5 for SME financing. A higher leverage effect was
achieved under MAP as compared to G&E, even though average ETF commitment has
significantly increased over the programming periods and the average fund size under MAP
was over twice the fund size under G&E.
The SMEG facility in general has achieved a very high leverage effect (defined here as
estimated underlying loan volume divided by the cap amount (the amount allocated to cover
losses under guarantee operations). This is due to two reasons:
The EU budget covers a maximum risk exposure at portfolio level that is capped
on the basis of expected losses, net of expected recoveries and risk premiums
received by the Financial Intermediaries. This capped amount allows the
leveraging of a significantly higher amount of SME loans; and,
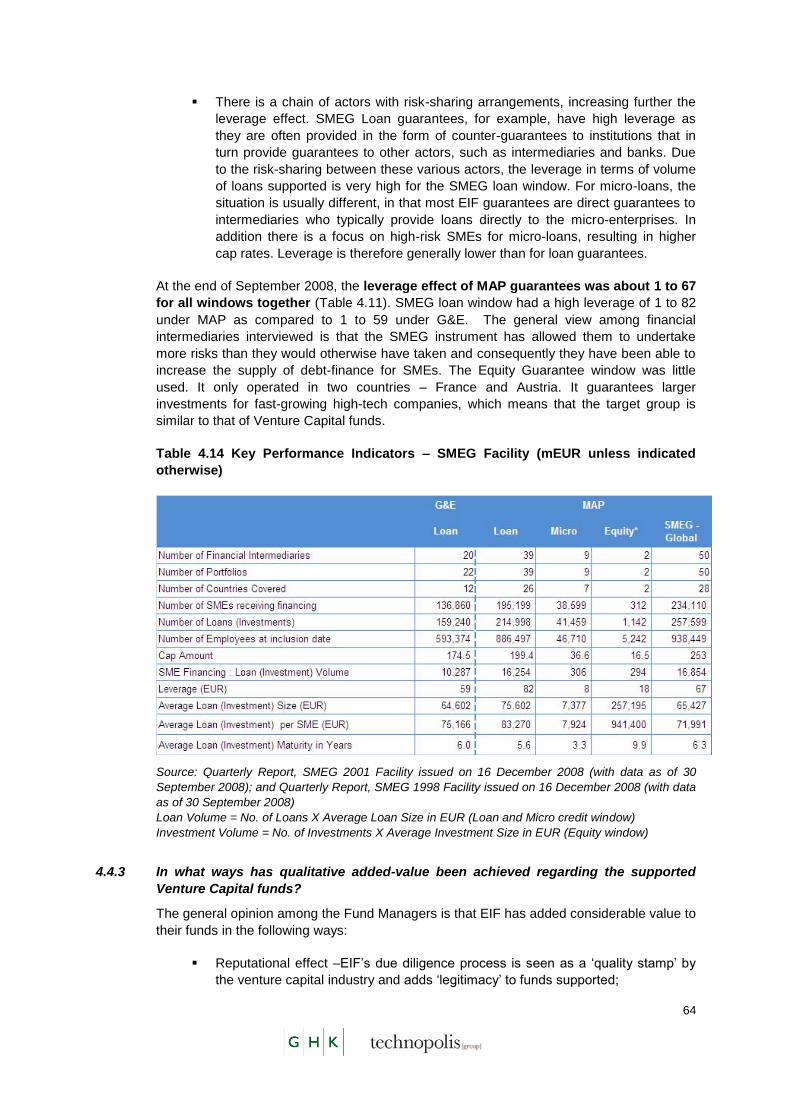
64
There is a chain of actors with risk-sharing arrangements, increasing further the
leverage effect. SMEG Loan guarantees, for example, have high leverage as
they are often provided in the form of counter-guarantees to institutions that in
turn provide guarantees to other actors, such as intermediaries and banks. Due
to the risk-sharing between these various actors, the leverage in terms of volume
of loans supported is very high for the SMEG loan window. For micro-loans, the
situation is usually different, in that most EIF guarantees are direct guarantees to
intermediaries who typically provide loans directly to the micro-enterprises. In
addition there is a focus on high-risk SMEs for micro-loans, resulting in higher
cap rates. Leverage is therefore generally lower than for loan guarantees.
At the end of September 2008, the leverage effect of MAP guarantees was about 1 to 67
for all windows together (Table 4.11). SMEG loan window had a high leverage of 1 to 82
under MAP as compared to 1 to 59 under G&E. The general view among financial
intermediaries interviewed is that the SMEG instrument has allowed them to undertake
more risks than they would otherwise have taken and consequently they have been able to
increase the supply of debt-finance for SMEs. The Equity Guarantee window was little
used. It only operated in two countries – France and Austria. It guarantees larger
investments for fast-growing high-tech companies, which means that the target group is
similar to that of Venture Capital funds.
Table 4.14 Key Performance Indicators – SMEG Facility (mEUR unless indicated
otherwise)
Source: Quarterly Report, SMEG 2001 Facility issued on 16 December 2008 (with data as of 30
September 2008); and Quarterly Report, SMEG 1998 Facility issued on 16 December 2008 (with data
as of 30 September 2008)
Loan Volume = No. of Loans X Average Loan Size in EUR (Loan and Micro credit window)
Investment Volume = No. of Investments X Average Investment Size in EUR (Equity window)
4.4.3 In what ways has qualitative added-value been achieved regarding the supported
Venture Capital funds?
The general opinion among the Fund Managers is that EIF has added considerable value to
their funds in the following ways:
Reputational effect –EIF‟s due diligence process is seen as a „quality stamp‟ by
the venture capital industry and adds „legitimacy‟ to funds supported;

65
Technical Assistance – EIF has provided fund managers with technical expertise,
legal support and “valuable feedback” to help them establish the fund; and,
Good practice and information sharing - EIF has been a source of information on
industry trends, good practice and market data; and has promoted good
governance standards among funds supported.
In section 4.3.1 the demonstration effect of EU-backed VC funds was described.
There is however, scope for the Commission to enhance the added value of VC
instruments. Fund managers suggested that EIF could play a facilitating role by organising
an investors club and other similar platforms for creating networking opportunities.
The added value of VC funds also accrues at the level of the SME. As part of the survey,
businesses were asked to comment upon the non-financial support they received through
the VC funds. Businesses were asked to select the one (out of five) support elements that
they appreciated the most and the results indicate that the appointment of a non executive
director, financial advice and specialist business advice are the most appreciated sources
of support from the external equity investment.
Figure 4.11: SMEs opinion on the most valuable forms of non-financial support
offered by VC Funds (number of responses: 23)
Source: GHK Business Survey (2008/09)
4.4.4 What is the creditworthiness of SMEs supported through the financial instruments?
An assessment of the creditworthiness of SMEs supported through the financial
instruments would not have been possible within the scope of this evaluation as such an
analysis would require detailed financial information (financial accounts such as balance
sheets, credit ratings where available, business plans) for a representative sample of
SMEs.
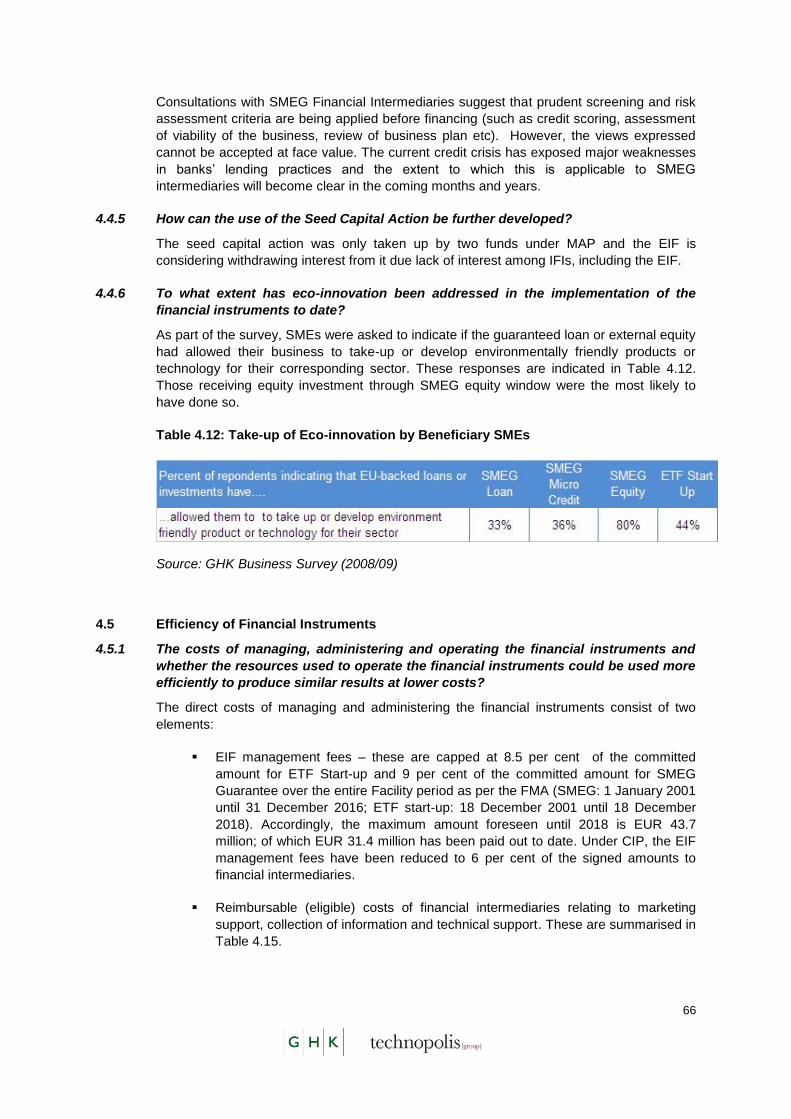
66
Consultations with SMEG Financial Intermediaries suggest that prudent screening and risk
assessment criteria are being applied before financing (such as credit scoring, assessment
of viability of the business, review of business plan etc). However, the views expressed
cannot be accepted at face value. The current credit crisis has exposed major weaknesses
in banks‟ lending practices and the extent to which this is applicable to SMEG
intermediaries will become clear in the coming months and years.
4.4.5 How can the use of the Seed Capital Action be further developed?
The seed capital action was only taken up by two funds under MAP and the EIF is
considering withdrawing interest from it due lack of interest among IFIs, including the EIF.
4.4.6 To what extent has eco-innovation been addressed in the implementation of the
financial instruments to date?
As part of the survey, SMEs were asked to indicate if the guaranteed loan or external equity
had allowed their business to take-up or develop environmentally friendly products or
technology for their corresponding sector. These responses are indicated in Table 4.12.
Those receiving equity investment through SMEG equity window were the most likely to
have done so.
Table 4.12: Take-up of Eco-innovation by Beneficiary SMEs
Source: GHK Business Survey (2008/09)
4.5 Efficiency of Financial Instruments
4.5.1 The costs of managing, administering and operating the financial instruments and
whether the resources used to operate the financial instruments could be used more
efficiently to produce similar results at lower costs?
The direct costs of managing and administering the financial instruments consist of two
elements:
EIF management fees – these are capped at 8.5 per cent of the committed
amount for ETF Start-up and 9 per cent of the committed amount for SMEG
Guarantee over the entire Facility period as per the FMA (SMEG: 1 January 2001
until 31 December 2016; ETF start-up: 18 December 2001 until 18 December
2018). Accordingly, the maximum amount foreseen until 2018 is EUR 43.7
million; of which EUR 31.4 million has been paid out to date. Under CIP, the EIF
management fees have been reduced to 6 per cent of the signed amounts to
financial intermediaries.
Reimbursable (eligible) costs of financial intermediaries relating to marketing
support, collection of information and technical support. These are summarised in
Table 4.15.
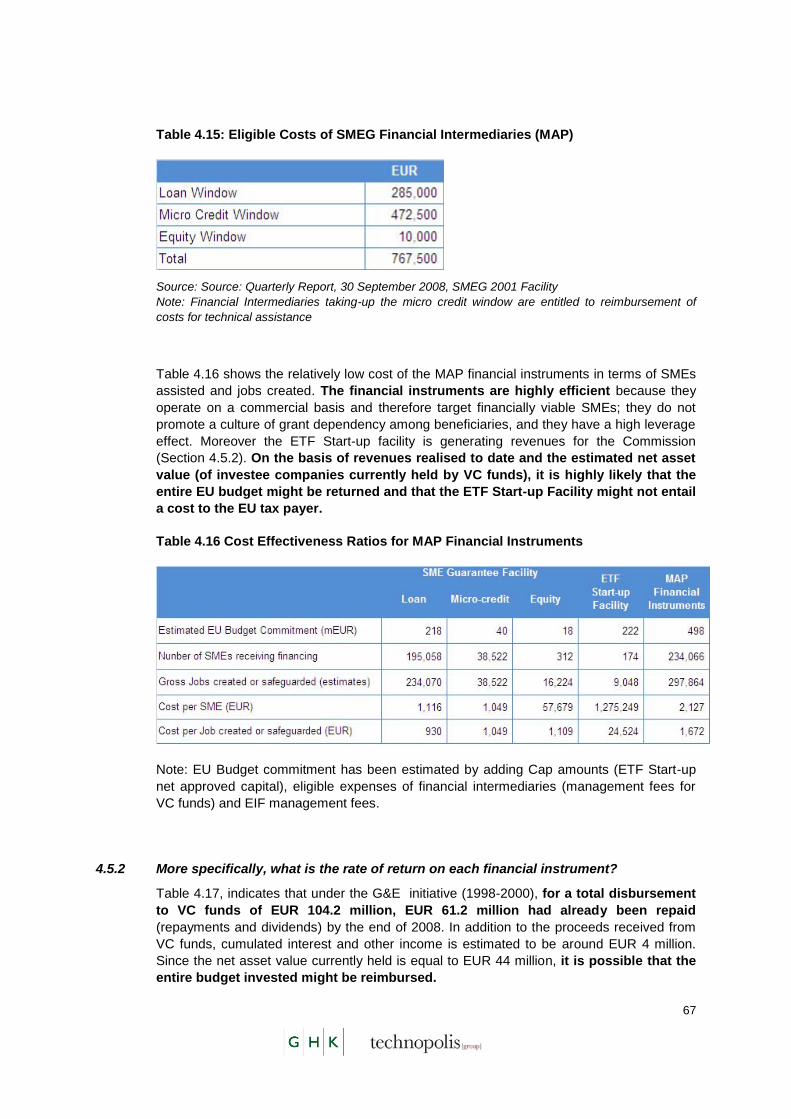
67
Table 4.15: Eligible Costs of SMEG Financial Intermediaries (MAP)
Source: Source: Quarterly Report, 30 September 2008, SMEG 2001 Facility
Note: Financial Intermediaries taking-up the micro credit window are entitled to reimbursement of
costs for technical assistance
Table 4.16 shows the relatively low cost of the MAP financial instruments in terms of SMEs
assisted and jobs created. The financial instruments are highly efficient because they
operate on a commercial basis and therefore target financially viable SMEs; they do not
promote a culture of grant dependency among beneficiaries, and they have a high leverage
effect. Moreover the ETF Start-up facility is generating revenues for the Commission
(Section 4.5.2). On the basis of revenues realised to date and the estimated net asset
value (of investee companies currently held by VC funds), it is highly likely that the
entire EU budget might be returned and that the ETF Start-up Facility might not entail
a cost to the EU tax payer.
Table 4.16 Cost Effectiveness Ratios for MAP Financial Instruments
Note: EU Budget commitment has been estimated by adding Cap amounts (ETF Start-up
net approved capital), eligible expenses of financial intermediaries (management fees for
VC funds) and EIF management fees.
4.5.2 More specifically, what is the rate of return on each financial instrument?
Table 4.17, indicates that under the G&E initiative (1998-2000), for a total disbursement
to VC funds of EUR 104.2 million, EUR 61.2 million had already been repaid
(repayments and dividends) by the end of 2008. In addition to the proceeds received from
VC funds, cumulated interest and other income is estimated to be around EUR 4 million.
Since the net asset value currently held is equal to EUR 44 million, it is possible that the
entire budget invested might be reimbursed.
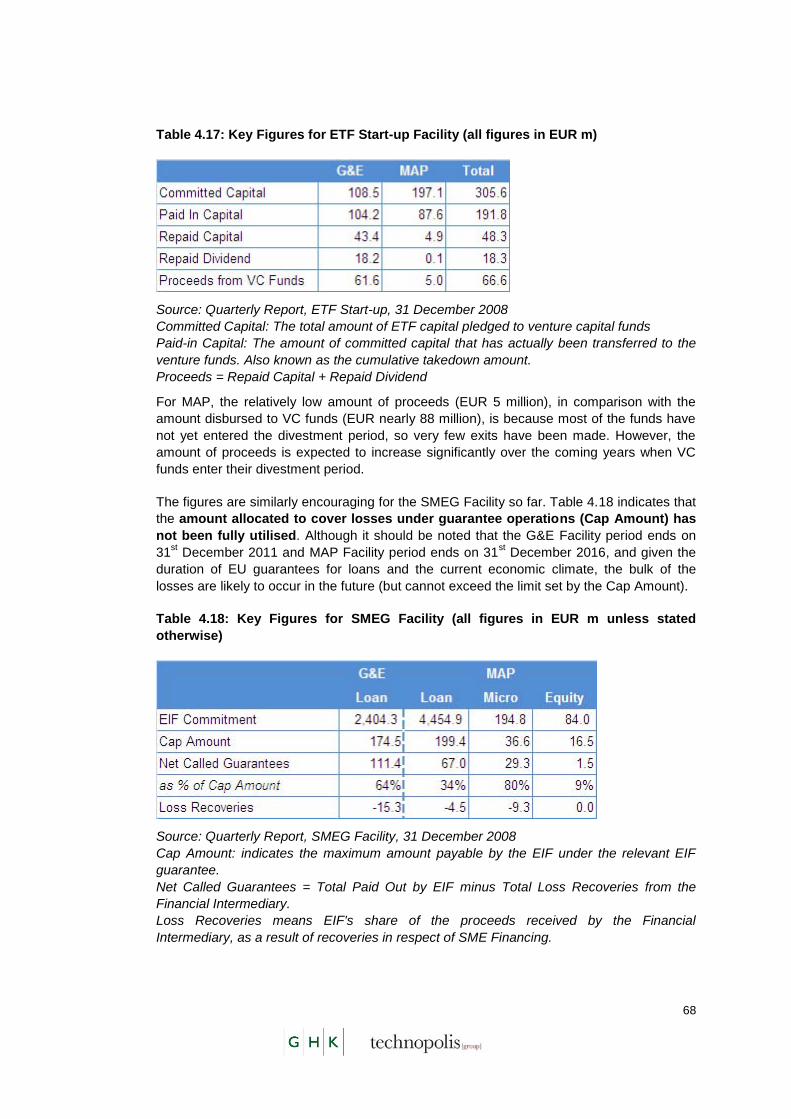
68
Table 4.17: Key Figures for ETF Start-up Facility (all figures in EUR m)
Source: Quarterly Report, ETF Start-up, 31 December 2008
Committed Capital: The total amount of ETF capital pledged to venture capital funds
Paid-in Capital: The amount of committed capital that has actually been transferred to the
venture funds. Also known as the cumulative takedown amount.
Proceeds = Repaid Capital + Repaid Dividend
For MAP, the relatively low amount of proceeds (EUR 5 million), in comparison with the
amount disbursed to VC funds (EUR nearly 88 million), is because most of the funds have
not yet entered the divestment period, so very few exits have been made. However, the
amount of proceeds is expected to increase significantly over the coming years when VC
funds enter their divestment period.
The figures are similarly encouraging for the SMEG Facility so far. Table 4.18 indicates that
the amount allocated to cover losses under guarantee operations (Cap Amount) has
not been fully utilised. Although it should be noted that the G&E Facility period ends on
31st December 2011 and MAP Facility period ends on 31
st December 2016, and given the
duration of EU guarantees for loans and the current economic climate, the bulk of the
losses are likely to occur in the future (but cannot exceed the limit set by the Cap Amount).
Table 4.18: Key Figures for SMEG Facility (all figures in EUR m unless stated
otherwise)
Source: Quarterly Report, SMEG Facility, 31 December 2008
Cap Amount: indicates the maximum amount payable by the EIF under the relevant EIF
guarantee.
Net Called Guarantees = Total Paid Out by EIF minus Total Loss Recoveries from the
Financial Intermediary.
Loss Recoveries means EIF's share of the proceeds received by the Financial
Intermediary, as a result of recoveries in respect of SME Financing.

69
4.5.3 What are the actual costs to intermediaries of administering and operating the
financial instruments?
The reporting requirements are seen to be burdensome and an ‘obstacle’ to efficient
management of the programme by SMEG Financial Intermediaries. The ex-post
evaluation of MAP also found that reporting is generally regarded as „too complex‟ by
financial intermediaries57
. In light of these findings one would have expected to see some
simplification in the CIP/ EIP programme. However, the reporting requirements for CIP are
perceived by the FIs to be „worse than the requirements under MAP‟
FIs have to adapt their databases to collect additional information (such as, seize-band,
NACE code, employment data which is not typically collected by lenders) and report to EIF
on a quarterly basis which requires additional staffing resources. However, with the
exception of the collection of employment data (currently collected on an annual basis for
the MAP Loan Guarantee Scheme; although reduced to three employment surveys over a
seven year period under EIP), which may be better collected through direct contacts with
the SME beneficiaries (through SME surveys undertaken as part of programme evaluation),
the reporting requirement are not onerous and it is important that the financial
intermediaries are fully accountable for the publicly supported financial instruments in their
charge.
4.5.4 What are the costs to the SMEs (for reporting collateral, applications made etc)?
There is no evidence to demonstrate that SMEs incur additional costs that are specifically
associated with these financial instruments. If anything, the SMEG facility offers a free
guarantee which is an added benefit of the scheme for SMEs.
4.5.5 How can the efficiency of the financial instruments be improved?
There is scope to improve the efficiency of the instruments by speeding-up the application
process and reducing the reporting requirements. Employment data provided by SMEs is
often not accurate as they are not willing to share it on a regular basis (i.e. quarterly or
annually) and it is costly for Financial Intermediaries to collect (and also difficult for them to
validate) this data as they have to modify their IT systems and deploy staff to collect
employment data from SMEs and address any queries from EIF. A more efficient method
for estimating the impact would be to carry out a detailed beneficiary survey as part of
evaluation work. This would have the advantage of allowing appropriate follow up questions
that would inform the crucial evaluation questions of deadweight and market displacement
and to identify factors which lead to EIP financial instruments having the greatest impact.
However, such evaluation activity should be built into the programme development and
implementation process, in order that:
- Delivery partners such as EIF and Financial Intermediaries know that
external evaluation will occur;
- It is known that readily accessible beneficiary contact data will be
required;
57 SEC(2004) 1460, Commission Staff Working paper: Report on a multiannual programme for
enterprise and entrepreneurship and in particular for small and medium sized enterprises (SMEs) (2001 – 2005).
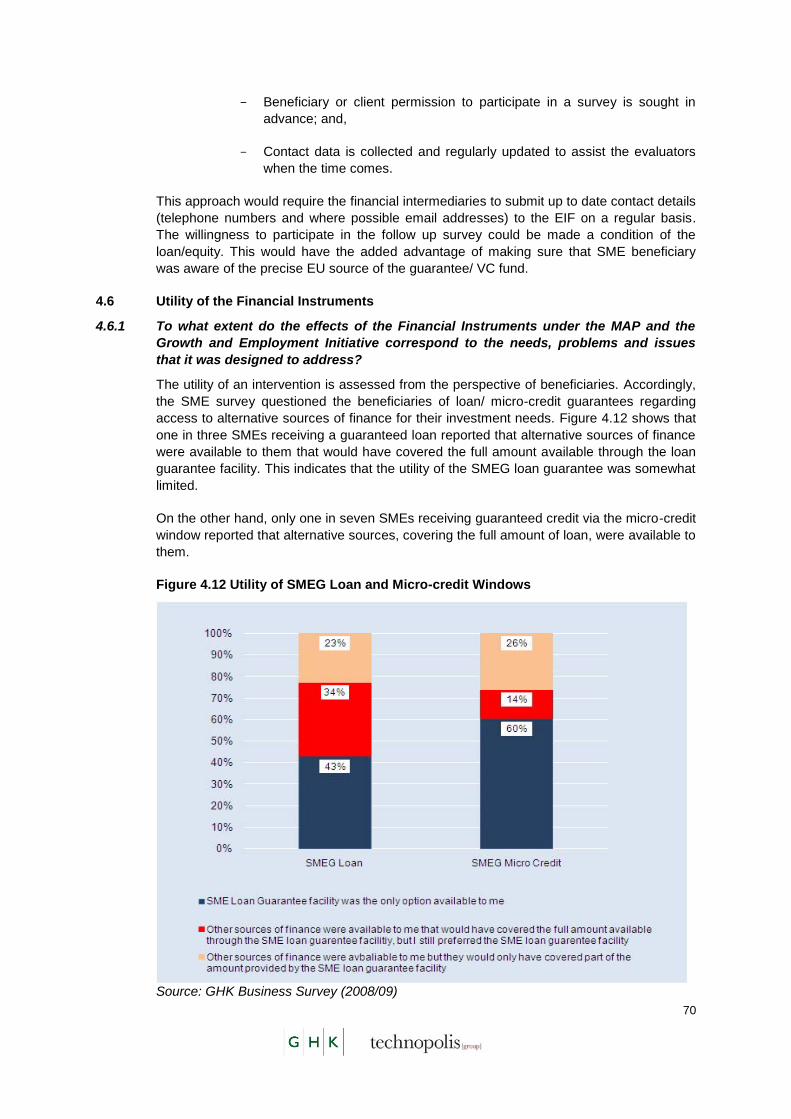
70
- Beneficiary or client permission to participate in a survey is sought in
advance; and,
- Contact data is collected and regularly updated to assist the evaluators
when the time comes.
This approach would require the financial intermediaries to submit up to date contact details
(telephone numbers and where possible email addresses) to the EIF on a regular basis.
The willingness to participate in the follow up survey could be made a condition of the
loan/equity. This would have the added advantage of making sure that SME beneficiary
was aware of the precise EU source of the guarantee/ VC fund.
4.6 Utility of the Financial Instruments
4.6.1 To what extent do the effects of the Financial Instruments under the MAP and the
Growth and Employment Initiative correspond to the needs, problems and issues
that it was designed to address?
The utility of an intervention is assessed from the perspective of beneficiaries. Accordingly,
the SME survey questioned the beneficiaries of loan/ micro-credit guarantees regarding
access to alternative sources of finance for their investment needs. Figure 4.12 shows that
one in three SMEs receiving a guaranteed loan reported that alternative sources of finance
were available to them that would have covered the full amount available through the loan
guarantee facility. This indicates that the utility of the SMEG loan guarantee was somewhat
limited.
On the other hand, only one in seven SMEs receiving guaranteed credit via the micro-credit
window reported that alternative sources, covering the full amount of loan, were available to
them.
Figure 4.12 Utility of SMEG Loan and Micro-credit Windows
Source: GHK Business Survey (2008/09)

71
The VC funds on the other hand, have addressed a market gap in the field of access to
early stage, pre-seed and seed capital with positive results and impacts on the needs of
start-up businesses. Almost two out of three companies surveyed (65 per cent) indicated
that their company would not still be trading if they had not been successful in raising
external equity via the ETF Start-up Facility. In case of SMEG equity window, 55 per cent of
the respondents indicated that their company would have ceased to exist if they had not
been successful in raising external equity.
Overall, the financial instruments appear to address a well identified need and market
failure – they are addressing clear gaps in availability of debt or equity finance for
start-up and early growth SMEs.
4.6.2 What lessons from the implementation to date of Financial Instruments are useful for
the implementation of other relevant current or future Community activities? To what
extent could measures be taken to improve the utility of future Financial Instruments,
and what measures would these be?
According to Commission‟s own research58
a key supply side barrier to developing
European venture capital markets is that the European venture capital funds are on
average small and many of them are regionally focused; and to achieve an operating scale
and liquidity for a sustainable industry requires operating across borders. EIP can deal with
this issue better than ERDF for example (which can only support regional or national funds
and may even be counter-productive to achieving a European venture capital market).
Furthermore, as the credit crisis turns into recession there is a strong argument for
supporting investment in SMEs with innovation potential or companies with growth potential
that are temporarily affected by the economic downturn. Recent evaluations of FP659
show
that there continues to be a problem of the exploitation of the research results and support
for technology transfer remains a pertinent issue. The issue of access to finance,
particularly venture capital, is also raised in these reports.
EIP has limited resources in relation to other European programmes (such as ERDF or
FP7) and on that basis it should focus on activities that are closely related to its objective of
supporting a knowledge based economy and competitive European economy and offer
clear European added value. There may be scope for the Commission to consider
streamlining its approach to financial instruments. There is a case for concentrating on
financial instruments where markets are essentially global / European in nature (such as
venture capital) and further developing risk capital instruments (such as angel finance) or
hybrid instruments (such as venture debt) for innovative or high tech start-ups and fast-
growing SMEs (or gazelles). VC funds have another advantage over SMEG facility – they
invest in companies across EU and their operations are not restricted to the country in
which they are based.
58 Commission Staff Working Document accompanying the Document Communication from the
Commission “Removing obstacles to cross-border investments by venture capital funds - Glossary and Expert group report”, {COM(2007) 853 final}
59 Evaluation of the Sixth Framework Programmes for Research And Technological Development
2002-2006 Report of the Expert Group, (and contributing studies); Ex-Post Evaluation of the IST activities in the Sixth Framework Programme 2002-2006; Aggregate reports on the studies being carried out to assess the impacts originating from the IST activities funded under the Framework Programmes for Research and Technological Development during the period 1999-2006.

72
Based on the arguments considered in the above sub- section, there appears to be a case
for re-focussing the EIP financial instruments from debt-based instruments to risk
capital instruments. These recommendations are in line with the findings of the parallel
evaluation of stakeholder views on DG Enterprise and Industry‟s policies according to which
the consultees generally offered support towards DG Enterprise and Industry‟s measures
aimed at improving access to finance for SMEs; but pointed out that venture capital market
remains fragmented at a national level and more attention needs to be given to risk capital
(for example the promotion of business angels)60
.
4.7 Sustainability of Financial Instruments
4.7.1 Are the financial instruments likely to become self-sustaining in the longer term
without the need for continuing public support, or with lower amounts of public
support?
As per the terms of the FMAs signed (Article 17: Return of Community Funds) between the
Commission and the EIF, upon expiry of guarantee in the case of SMEG Facility and upon
realisation of ETF/ GIF investments, the net balance of funds remaining in the Trust
account (adjusted contingencies, eligible expenses and EIF remuneration) will be returned
to the EU budget.
4.7.2 Are any changes brought about by the Financial Instruments self-sustaining?
To assess the sustainability of impacts at SME level, businesses were asked to comment
on the influence of the MAP financing over their long term growth prospects, as part of the
survey. The survey results (Table 4.19) indicate that VC investments are more likely to
have a positive influence on the longer term growth prospects as compared to loan or
micro-credit. As regards the changes brought about by the financial instruments (such as
businesses and jobs created; demonstration effect), their sustainability is likely to be
affected in the current economic climate – given the broad macro-economic trends.
Table 4.19 Influence of Financial Instruments on Long Term Growth Prospects of
SMEs
Q. How much influence would you say the guaranteed loan/ external equity has had
on the long term growth prospects (over two years) of your company, would you
say...?
Source: GHK Survey
60 Draft Final Report, Evaluation of DG Enterprise and Industry‟s policies in view of the new
Commission: External Stakeholders‟ views.

73
4.7.3 In the cases where sustainability is identified, what measures could be taken to
foster the sustainability of positive changes brought about by the Financial
Instruments? Which of these measures could be implemented in the current legal
framework (legal base, contracts, agreements)?
No such measures have been identified at this stage.
4.8 Information and Awareness
4.8.1 What is the level of awareness about the financial instruments among potential
stakeholders and beneficiaries?
The financial intermediaries were generally aware of EU funding for the financial
instruments; but the visibility of EU funding (MAP) was somewhat limited for SMEs. Over
one in two beneficiaries of MAP loan window and three in four beneficiaries of MAP micro-
credit beneficiaries were not aware that their loans were guaranteed by the EU.
The visibility of EU funding was very low for VC funds supported via MAP - fund managers
could not distinguish between the various mandates implemented by EIF. The visibility of
EU funding was low for investee companies– only one in two respondents was aware that
the external equity investment in their company was backed by the EU. This is
disappointing considering that these companies had only recently (prior to the
commencement of fieldwork) received „warm-up‟ letters (or emails) from fund managers
regarding the evaluation.
Table 4.20 Visibility of MAP Financial Instruments among Assisted SMEs
Q (SMEG Loan/ Micro-credit): Was your company aware at all about the fact the loan
has been counter guaranteed by the EU?
Q (Equity window/ ETF Start-up): Was your business made aware at all about the fact
that the VC Fund (investing in your company) has been set-up with funding from the
European Commission?
Source: GHK Business Survey (2008/09)
The visibility of MAP funding remains low despite the publicity and promotion rules
applicable to financial intermediaries – such as the specification of the Commission
contribution in contracts with final beneficiaries. Intermediaries were also required to ensure
that their specific promotional material, specific promotion campaigns and information on
their webpage(s) relating to the financing supported by the MAP financial instruments
include the EU logo. CIP introduces additional publicity requirements as follows:
Promotional material must specify that the instrument is funded through CIP; and,
Intermediaries must provide a link with information for SMEs to the EU‟s Access
to Finance Website (www.access2finance.eu).

74
4.9 Other Findings
Some other issues that arose during the fieldwork are summarised below:
Some of the Fund Managers interviewed, expressed the view that effective exit
mechanisms for VC funds do not exist in Europe – such as the lack of a well-
developed stock market system, which allows venture capitalists the ability to exit
via initial public offerings or the absence of large corporates willing to acquire
high-tech, innovative start-ups or early growth SMEs. According to these fund
managers, the lack of exit-friendly markets is a major barrier inhibiting growth of
venture capital markets. It is beyond the scope of this evaluation to test or
validate these views. However, it could be an area of further research;
Some Fund Managers are also of the opinion that the limits on EIF investment in
a fund are set too low (25 per cent of the committed capital in the case of GIF 1
and 15 per cent of commitment capital in the case of GIF 261
). While it is rational
behaviour on part of an investor to limit exposure; there is scope to be flexible on
these limits – particularly, if the Commission wishes to encourage larger funds
(according to Commission paper cited earlier, size matters in the VC industry).
Some fund managers suggested that the EIF commitment could be front-loaded
(and tailed off in subsequent closings such that overall commitment levels are not
exceeded). EIF could thus provide the critical mass, but entry would still be
attractive for subsequent investors;
A general perception among the Italian financial intermediaries is that the
programme approach to calculation of cap rate and additionality requirements is
inflexible and does not take into account the specific characteristics of the Italian
market (such as its level of maturity). This appears to be an issue of
communication from EIF, as the rules under the legal framework allow financial
instruments to be tailored to the requirements of specific markets and institutions.
For example, the cap rate is a function of expected losses and is uniquely
estimated for each financial intermediary; and,
An overwhelming majority of the Italian Financial Intermediaries expressed the
concern that guarantees may be classed as state aid and that this would increase
the reporting requirements (they would have to collect SME declarations to check
and certify that any assistance falls within de minimis limits).
4.10 Summary of Conclusions
Financial instruments supported by EIP (and its predecessor programme, MAP)
are underpinned by a strong market failure rationale, being driven by the access
to finance constraints faced by start-up and growing SMEs. The programme
comprises a portfolio of debt (loan window), equity (GIF) and hybrid instruments
(equity window) to cater to the financing needs of SMEs at different stages of
their development and for different levels of financing.
61 The limit is 50 per cent for funds likely to have a particularly strong catalytic role in case of GIF 1
and 25 per cent for first time funds or funds likely to have a particularly strong catalytic role in case of
GIF 2
75
The financial instruments are designed in a market-friendly way i.e. minimising
their unintended consequences (such as moral hazard or crowding out effect)
while at the same time promoting private financial market activity (for example,
through demonstration effect).
The link between the micro-credit window and the Lisbon objectives of
competitiveness/ innovation is tenuous. The micro-credit window is designed to
extend credit to disadvantaged or financially excluded groups and, is thus more
geared towards social than competitiveness objectives.
There is a risk of overlap between ERDF programmes managed by DG Regional
Policy and EIP in the area of access to finance. The 2007-13 Structural Fund
Regulations place significant emphasis on the use of Venture VCLF instruments
including the introduction of specific joint initiatives with EIF such as JEREMIE
and JASMINE.. MS‟ have allocated over EUR 3 billion of ERDF to venture capital
funds over a seven year period and further sums to other financial instruments
such as micro-credit schemes. This growing overlap between ERDF
programmes and EIP could potentially result in a situation where different EU
funded schemes are competing with each other at various levels (at the level of
deal allocation as well as the level of SME financing) and potentially crowding-out
private sector activity.
The financial instruments are highly effective and efficient: they have reached a
large number of SMEs at a relatively low cost to the EU; they have demonstrated
leverage in SME financing; increased the supply of debt and equity finance in
most Member States; and the ETF Facility has actually generated revenue.
The application process is considered to be too complex and time consuming;
and reporting is considered to be resource intensive and onerous by the financial
intermediaries. FI have to adapt their databases to collect additional information
(such as employment data which is not typically collected by lenders) and report
to EIF on a quarterly basis which requires additional staffing resources. However,
with the exception of the collection of employment data, which may be better
collected through direct contacts with the SME beneficiaries (through SME
surveys undertaken as part of programme evaluation), the reporting requirement
are not onerous and it is important that the FI are fully accountable for the
publicly supported financial instruments in their charge.
The visibility of EU funding (MAP) was very low among VC fund managers and
somewhat limited for SME beneficiaries. The financial intermediaries are
generally aware of EU funding for the financial instruments.
76
5 EVALUATION FINDINGS: ENTERPRISE EUROPE NETWORK
5.1 Evaluation scope
This part of the interim evaluation was designed to provide an evaluation of the
performance of the former Euro Info Centres (EIC) and Innovation Relay Centres (IRC) and
of the setting up of the Enterprise Europe network. In order to achieve this the evaluation
includes an ex-post assessment of the performance of the former networks.
The evaluation was undertaken at a difficult time for the Network – the transfer of
responsibilities to the CIP Executive Agency (EACI) was only completed towards the end of
the evaluation period, which means that the new arrangements had not yet achieved
cruising speed. In addition, a period of uncertainly had limited the activities of the previous
networks during the build-up to the introduction of the CIP, which meant that the networks
were working on the basis of contract extensions and in an atmosphere of some insecurity.
However, the planned annual work programmes of the networks were fully executed during
this period
5.2 Specific Evaluation Questions
As with the evaluation of the other activities, and of the overall programme, the analysis
covers the issues of
Relevance
Efficiency
Effectiveness
Information and awareness
Coherence and Synergies
The remainder of this section addresses each of these issues in turn, focusing on the
specific questions raised, looking back at the previous networks and the progress and likely
success of the new organisational arrangements. Although not strictly part of this evaluation,
the SME National Contact Points are also referred to where relevant and where information
exists.
5.3 Background to the Evaluation
Prior to the introduction of the CIP, support to business was supplied through a range of
networks and services covering specific advisory services or more general signposting.
These networks were the Euro Info Centres, funded under MAP, the last action plan
covered the period 2001-2005, and the IRC funded under the RTD Framework
Programmes, ending with FP6 (2002-2006) that closed on 31 March 2008. Other SME
support networks with EU support from various sources also existed dealing with
eBusiness, Business and Innovation62
, and access to the RTD Framework Programme
62 The Business and Innovation Centre (BIC) Network was originally set up in 1984 with
support from DG Regional Policy and continues to provide services, often with the support
of the Structural Funds. The aim of the BICs is to support the emergence of new SMEs and
develop activities in existing businesses based on new ideas with growth potential.
77
(SME National Contact Points). In addition to these there were services dealing with
specific issues such as intellectual property rights (IPR Helpdesk), and access to finance
(Gate2Growth).
For some time there had been discussion as to the merits of combining the EIC and IRC
networks with various justifications being advanced for the options of continuation or
merger. These finally came to a head with the introduction of the CIP which brought
together both networks within the same funding instrument but, more importantly, coincided
with a significant shift in the Commission‟s policy on communication and support to SMEs
with the introduction of the “no wrong door” concept, and the discussions leading up to the
Small Business Act.
5.3.1 The Euro Info Centre Network
The EIC network covered 48 countries with 264 fully fledged EIC offices located in host
organizations. There were 24 associate members - European or national organisations
representing SMEs, either by sector or specialization, and a sub-network of 269 relays,
which were smaller local centres, located all round the world complementing the work of
EICs at local level. There were also 15 Euro Info Correspondence Centres in third
countries. The EICs worked directly with businesses providing general information, offering
specialist advice and answering specific questions. They also organised a range of events
and provided feedback to the Commission on issues of relevance, through for example,
participation in the Interactive Policy Making (IPM) feedback mechanism. The network was
first set up in 1987, thus had a tradition and experience of more than 20 years of activity.
Over the life of the network many members also developed specific areas of advisory
specialisation such as internationalisation, public procurement, tendering procedures etc.
EICs were normally based in a host structure – public or private organisations such as
chambers of commerce, professional federations, national or regional institutions. Host
structures were selected on the basis of their comprehensive knowledge of the local
economic environment, and generally sustained the majority of the financing of each EIC
point. As a consequence, the direct EC contribution could be very limited. It covered on
average between 12% and 15% of the total budget of each centre.
The EIC network activities were managed by a unit in DG Enterprise and Industry, with a
EIC Technical Assistance Office63
(TAO), an Audit Technical Assistance Office and an IT
services provider. There was also input from the network itself through its Steering Group.
However, as the Financial Regulation strictly limits the externalisation to Technical
Assistance Offices of all tasks associated with contracting and the making of payments,
these tasks were undertaken by DG Enterprise and Industry, although the TAOs were
involved in the initial preparation of dossiers.
5.3.2 The Innovation Relay Centres
The IRCs were a much younger network, being set up in 1995 with a specific focus on
international technology transfer. At the end there were 71 consortia involving more than
250 partner organisations (averaging 3 per centre) covering the EU15, the Candidate
Countries/New Member States plus Iceland, Norway, Israel, Cyprus and Switzerland – a
total of 33 countries. Consortium partners included chambers of commerce and other public
or semi-public bodies, university technology transfer centres, regional development
agencies and a range of private, non-profit making organisations.
63 Provided by external contractors appointed following open calls for tender
78
The IRC network had a secretariat (TAO) that acted as a service provider to the network. It
provided common communication tools, undertook a benchmarking service, linked up the
IRCs and provided brokerage and training. The Commission was responsible for all political
and policy tasks and for all the contracting and contract management activities.
The objectives of the IRC network were to support innovative European SMEs and
research centres and assist them to pursue their innovation strategy at an international
level. The high-level purpose of the IRC network was to enhance the competitiveness of the
European economy by strengthening the technology base and innovation potential of
European SMEs and research centres through offering services such as assistance in the
marketing of new technologies, finding innovative solutions to technical problems
encountered by European SMEs or research centres and through promoting and facilitating
transnational technology co-operation supporting the implementation of research results
into innovative products, technologies or processes.
5.3.3 The Enterprise Europe Network
The Enterprise Europe Network brings together these two networks, plus a responsibility for
promoting access to the RTD Framework Programmes under the EIP objective of fostering
the competitiveness of enterprise, especially of SMEs64
. The pivotal role of the network and
its proximity to SMEs means it has also subsidiary objectives related to the remaining
objectives of the EIP, and indeed to the objectives of the CIP itself.
The network is bound to provide65
:
(a) information, feedback, business cooperation and internationalisation services;
(b) services for innovation and for the transfer of both technology and knowledge; and
(c) services encouraging the participation of SMEs in the Seventh RTD Framework
Programme.
The objectives can thus be taken with their subsequent developments to provide an overall
objectives hierarchy as indicated in Figure 5.1.
64 Decision No 1639/2006/EC of the European Parliament and of the Council establishing a
Competitiveness and Innovation Programme (2007-2013), Article 2.1
65 ibid Article 21
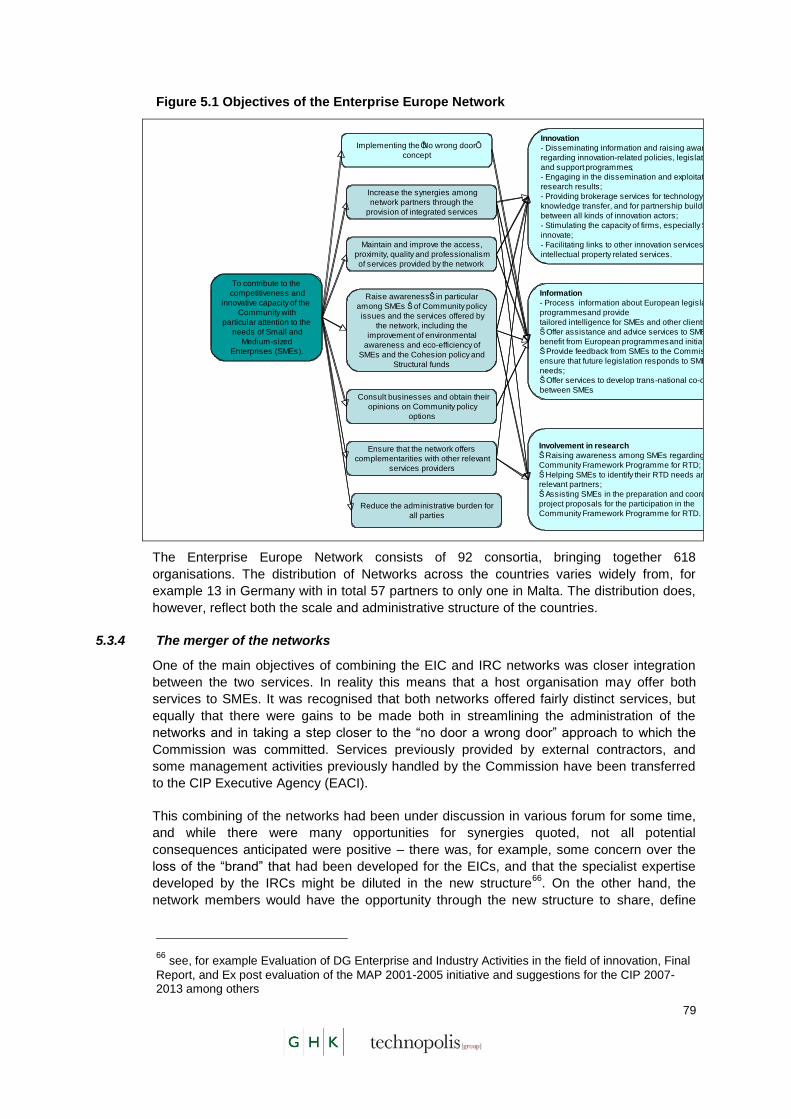
79
Figure 5.1 Objectives of the Enterprise Europe Network
Increase the synergies among
network partners through the
provision of integrated services
Maintain and improve the access,
proximity, quality and professionalism
of services provided by the network
Raise awareness Š in particular
among SMEs Š of Community policy
issues and the services offered by
the network, including the
improvement of environmental
awareness and eco-efficiency of
SMEs and the Cohesion policy and
Structural funds
Consult businesses and obtain their
opinions on Community policy
options
Ensure that the network offers
complementarities with other relevant
services providers
Reduce the administrative burden for
all parties
Implementing the ŌNo wrong doorÕ
concept
Information
- Process information about European legislation and
programmes and provide
tailored intelligence for SMEs and other clients;
Š Offer assistance and advice services to SMEs to
benefit from European programmes and initiatives;
Š Provide feedback from SMEs to the Commission to
ensure that future legislation responds to SME
needs;
Š Offer services to develop trans-national co-operation
between SMEs
To contribute to the
competitiveness and
innovative capacity of the
Community with
particular attention to the
needs of Small and
Medium-sized
Enterprises (SMEs).
Innovation
- Disseminating information and raising awareness
regarding innovation-related policies, legislation,
and support programmes;
- Engaging in the dissemination and exploitation of
research results;
- Providing brokerage services for technology and
knowledge transfer, and for partnership building
between all kinds of innovation actors;
- Stimulating the capacity of firms, especially SMEs to
innovate;
- Facilitating links to other innovation services including
intellectual property related services.
Involvement in research
Š Raising awareness among SMEs regarding the
Community Framework Programme for RTD;
Š Helping SMEs to identify their RTD needs and find
relevant partners;
Š Assisting SMEs in the preparation and coordination of
project proposals for the participation in the
Community Framework Programme for RTD.
The Enterprise Europe Network consists of 92 consortia, bringing together 618
organisations. The distribution of Networks across the countries varies widely from, for
example 13 in Germany with in total 57 partners to only one in Malta. The distribution does,
however, reflect both the scale and administrative structure of the countries.
5.3.4 The merger of the networks
One of the main objectives of combining the EIC and IRC networks was closer integration
between the two services. In reality this means that a host organisation may offer both
services to SMEs. It was recognised that both networks offered fairly distinct services, but
equally that there were gains to be made both in streamlining the administration of the
networks and in taking a step closer to the “no door a wrong door” approach to which the
Commission was committed. Services previously provided by external contractors, and
some management activities previously handled by the Commission have been transferred
to the CIP Executive Agency (EACI).
This combining of the networks had been under discussion in various forum for some time,
and while there were many opportunities for synergies quoted, not all potential
consequences anticipated were positive – there was, for example, some concern over the
loss of the “brand” that had been developed for the EICs, and that the specialist expertise
developed by the IRCs might be diluted in the new structure66
. On the other hand, the
network members would have the opportunity through the new structure to share, define
66 see, for example Evaluation of DG Enterprise and Industry Activities in the field of innovation, Final
Report, and Ex post evaluation of the MAP 2001-2005 initiative and suggestions for the CIP 2007-2013 among others

80
and disseminate best practices in fields such as innovation, expansion to new markets,
enlargement of the client base, improvement of market position, etc.
A brief overview of the development of the networks into the new structure can be seen in
Figure 5.2. A detailed comparison can be found in annex to the report.
Figure 5.2 Comparison of EIC/IRC networks and Enterprise Europe Network
The transfer of the networks involved a large number of activities, many of which had to be
carried out simultaneously. These included:
Close out of the preceding networks including the processing of all final
payments.
Calls for proposals for the new network consortia, including drafting and
publication of calls, assessment of offers, contracting procedures.
Closing down of the technical assistance contracts, take-over of tools and
procedures, processing of final payments.
Transfer of responsibilities to the EACI including amendment of the legal
base, establishment of new units within the Agency and staff recruitment.67
Merging of the two management systems and IT tools and the development
of new network tools.
67 Staff had to be recruited for the Agency; they could not, for example, be transferred from the TAOs
even were that desirable. Certain grades of staff could, however, be seconded from the Commission.
81
Identification of monitoring indicators and success criteria.
Development of new “corporate identity” for the Enterprise Europe Network.
Launch of the new network.
Certain of these activities were still under way during the course of the interim evaluation, in
particular the roll out of the new corporate identity, the development of the performance
indicators and the development of the IT tools, all of which were highly visible to (and
involved) the Network members, and the staffing up of the EACI and the transfer of
activities. This is highlighted as it affects the interpretation of some of the data collected –
some of which was revisited at the end of the evaluation to assess progress.
The official dates for transfer of responsibilities to the EACI were as follows:
from November 2007 - project management tasks starting with signature of specific grant agreements;
30th April 2008 transfer of network animation activities
23rd July 2008 IPeuropAware project
23rd February 2009 responsibility for IT tools.
5.4 Relevance
Extent to which programme objectives are pertinent to the needs problems and
issues it was designed to address
The previous networks were designed to address a range of different needs:
5.4.1 Innovation Relay Centres
The Innovation Relay Centres were designed to address an identified gap in the innovation
system in Europe compared with, for example the USA, and to stimulate technology
transfer activity. Initially this was seen as more closely aligned with the exploitation of
research results, hence the funding under the RTD Framework Programmes, but over time
was increasingly been seen as a key element of overall enterprise policy, particularly as it
concerns SMEs.
Under FP6 the IRCs formed part of the activities aimed at “structuring the European
Research Area” with a relatively downstream emphasis seeking tangible results in terms of
technology transfer.
The evaluation of the DG Enterprise and Industry activities in the field of innovation found
that the objectives were relevant to the IRCs‟ organisations, to SMEs and the regions.68
Specific value was added by the transnational element and the policy initiative at the
European level and by addressing a lack of resources at national or regional level. The
potential to exchange experience was also important.
68 Results of eSurvey carried out as part of the evaluation of the DG Enterprise and Industry activities
in the field of innovation,

82
5.4.2 SME National Contact Points
The SME NCPs are not part of the new Enterprise Europe Network directly, but promoting
access to FP7 is one of the objectives of the Network. This section therefore examines the
role of the NCPs in that light.
The role of the SME NCPs was to assist SMEs in accessing the RTD Framework
Programmes. Policymakers consider SME participation to be an important element of the
structuring effect of the RTD Framework Programmes. In addition in many research areas
SMEs are seen as one of the major sources of technological or scientific innovation.
However, at the start of FP6 there was a marked downturn in the participation of SMEs. To
an extent this mirrored the downward trend in industrial participation overall but was
highlighted as an area for concern.
Various factors contributing to the problems of SMEs were put forward, including the design
of the implementation mechanisms69
, and the complexity and burdens of the participation
processes. Various corrective measures were taken over the life of the programme but a
basic need for promotion of participation opportunities and for support to potential SME
participants remained an important need.
With the introduction of FP7, steps to reduce the burdens and simplify the procedures have
been taken. However the objective of involving SMEs remains an important priority and the
information and support activities remain a relevant action for promoting their participation.
5.4.3 Euro Info Centres
The role of the EICs was somewhat different to the rather specialised services of IRC and
SME NCPs. Their objective was to contribute to the fifth objective of the MAP – “giving
business easier access to Community support services, programmes and networks and
improving the coordination of these activities”. The network had been adapting over time to
the increasingly complex needs of SMEs, and to taking into account the specific
requirements arising from the enlargement of the EU. The EICs played two roles – on the
one hand advising and informing SMEs on EU matters, and on the other providing feedback
on SMEs to the Commission.
The network provided information on business cooperation, Community programmes and
sources of finance, internationalisation of SMEs, EU legislation and public procurement.
The distribution of these activities is shown in Figure 5.3.
69 The so called “New Instruments” of Integrated Projects and Networks of Excellence
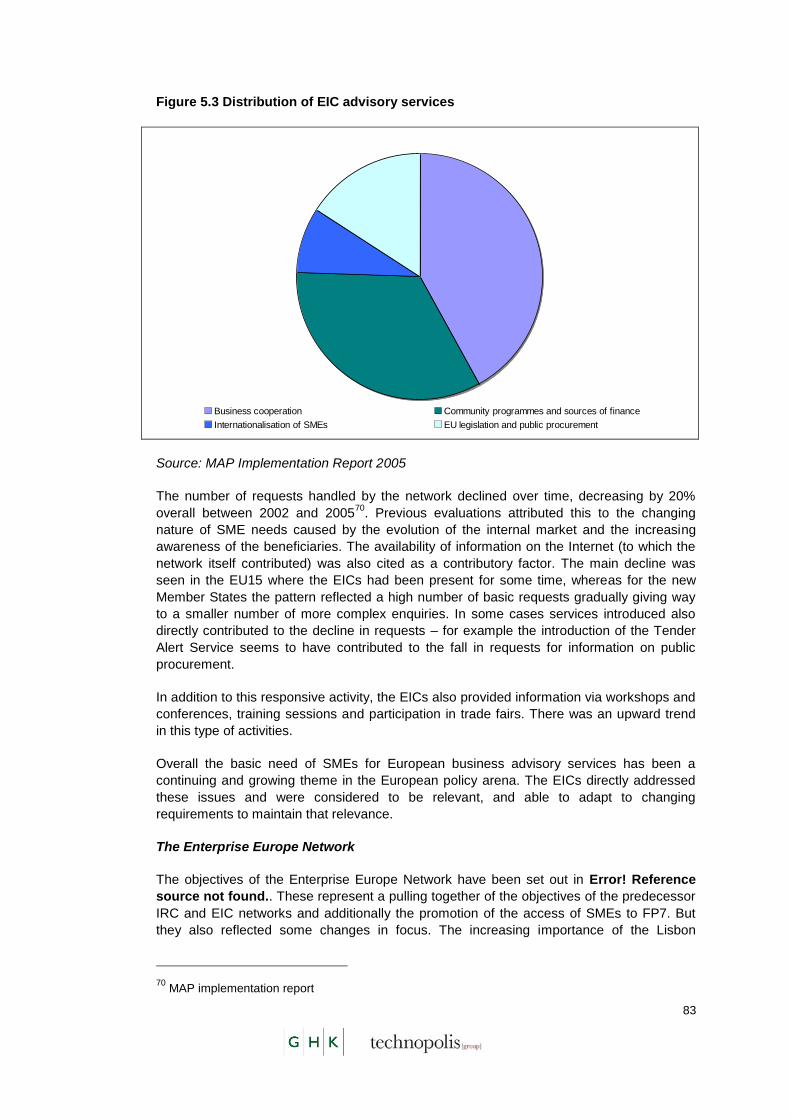
83
Figure 5.3 Distribution of EIC advisory services
Business cooperation Community programmes and sources of finance
Internationalisation of SMEs EU legislation and public procurement
Source: MAP Implementation Report 2005
The number of requests handled by the network declined over time, decreasing by 20%
overall between 2002 and 200570
. Previous evaluations attributed this to the changing
nature of SME needs caused by the evolution of the internal market and the increasing
awareness of the beneficiaries. The availability of information on the Internet (to which the
network itself contributed) was also cited as a contributory factor. The main decline was
seen in the EU15 where the EICs had been present for some time, whereas for the new
Member States the pattern reflected a high number of basic requests gradually giving way
to a smaller number of more complex enquiries. In some cases services introduced also
directly contributed to the decline in requests – for example the introduction of the Tender
Alert Service seems to have contributed to the fall in requests for information on public
procurement.
In addition to this responsive activity, the EICs also provided information via workshops and
conferences, training sessions and participation in trade fairs. There was an upward trend
in this type of activities.
Overall the basic need of SMEs for European business advisory services has been a
continuing and growing theme in the European policy arena. The EICs directly addressed
these issues and were considered to be relevant, and able to adapt to changing
requirements to maintain that relevance.
The Enterprise Europe Network
The objectives of the Enterprise Europe Network have been set out in Error! Reference
source not found.. These represent a pulling together of the objectives of the predecessor
IRC and EIC networks and additionally the promotion of the access of SMEs to FP7. But
they also reflected some changes in focus. The increasing importance of the Lisbon
70 MAP implementation report
84
objective71
, the Kok report72
the deliberations surrounding the Small Business Act for
Europe and the move of the focus of policy from infrastructure investments to
competitiveness and innovation have all increased the importance of activities to support
entrepreneurial development – an area where Europe is still seen as weak compared to its
main competitors.
The new network was also seen as being able to address some of the perceived weakness
of its predecessors – such as the potential difficulties of the IRCs reaching reaching
elements of their potential market due to their specialist nature73
, or the potential problems
of the EICs in being able to deal with some specialist issues. It was also designed to
overcome the potential overlaps in the information provision landscape and resulting
confusion for potential users. There was also a risk that previous services would be diluted
through the loss of the perceived specialisation or through the disappearance of the 20 year
old EIC “brand”.
In practice the Enterprise Europe Network brought together many of the organisation who
had previously been involved in IRC and EIC networks, but also brought in a range of other
players in the SME support landscape.
The analysis of the objectives of the Network shows that it is relevant to the needs of the
SME sector and responds to the policy requirements of the Commission. From the survey
of network partners, less than 10% of respondents felt that the relevance had diminished
with the introduction of the new Network, and 25% felt that the relevance was better than
before. In addition, nearly 90% of respondents considered the range of services to be the
same or better than under the previous networks, and 76% felt that the Enterprise Europe
Network does not leave any gaps in service delivery that were previously covered by the
former networks. The new Network also kept open important channels towards the EC such
as previous EIC participation in the Interactive Policy Making tool through the SME
feedback process. Of the services provided, the Network partners categorised International
Partner Search as the most important service that can be provided. It is also, according to
the survey results, the most challenging and resource intensive of the services. This does
also, however, reinforce the perception that the services provided and demanded are
directly relevant to the objectives of the programme, which are in turn directly related to the
wider enterprise and innovation policy objectives.
5.4.4 How could relevance of the programme be maximised
The area of weakness highlighted in previous evaluations both of the IRC and EIC networks
and of DG Enterprise and Industry communication activities towards SMEs was that the
considerable potential of the networks to act as a two way communication channel to SMEs
did not reach its full potential. Thus the capacity of the networks to provide information to
the Commission on emerging issues, needs and requirements has not been fully realised.
One element of this was the problem of the slow implementation of IT tools, which has now
been addressed. An improvement is to be expected.
71 “to become the world‟s most competitive and dynamic knowledge-based economy capable of
sustainable economic growth with more and better jobs, greater social cohesion and respect for the environment”
72Facing the challenge: The Lisbon strategy for growth and employment Report from the High Level
Group. chaired by Wim Kok. November 2004
73 as identified in previous evaluations

85
The new Network did, however, keep open important channels towards the European
Commission such as previous EIC participation in the SME Panels and in the EC‟s
Interactive Policy Making tool through the SME feedback process.
Better links with other EU information sources and information providers would also
contribute to improving the relevance of the services to the beneficiaries and reinforce the
“no wrong door” policy. The interviews did see an increase in internal visibility of the
Network across the Commission compared to the situation two years ago. In addition
consultations on Tourism Industry and Effectiveness on Innovation Support have been
launched with the Enterprise Europe Network acting as one of the referral points. However,
there are still many areas where simple steps could be taken to improve the coherence.
This would include activities such as closer links with the EU Representations74
in the
participating countries and very practical actions such as making the link from the Your
Europe – Business web pages to the Enterprise Europe Network75
live. Currently national
pages refer to the Network but not all mention it in the support section, and the Enterprise
Europe Network logo is present but the link is not active, although this is apparently in
hand. The existing links to the Enterprise Europe Network website from EU representation
sites are shown in Figure 5.4.
74 Or Delegations where appropriate
75 Your Europe – Business is provided jointly by the Commission and the national authorities and
provides practical information for European Union enterprises and entrepreneurs looking for business in another European Union country
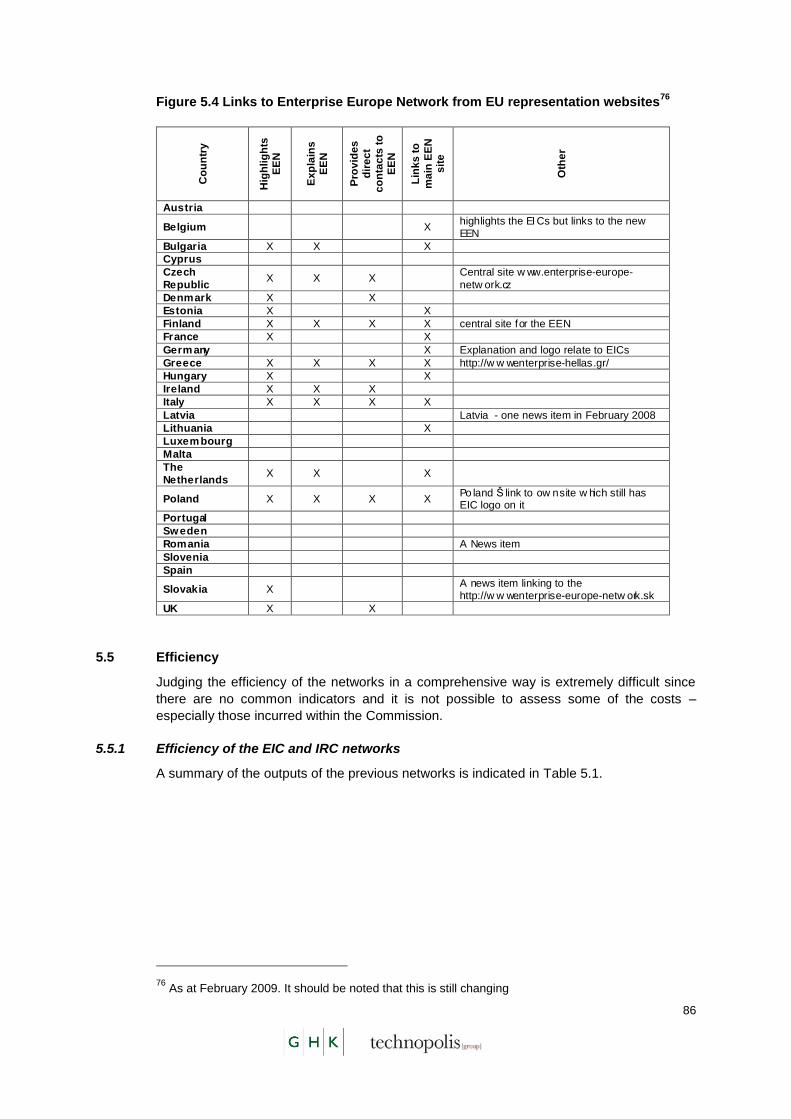
86
Figure 5.4 Links to Enterprise Europe Network from EU representation websites76
Co
un
try
Hig
hlig
hts
E
EN
Ex
pla
ins
E
EN
Pro
vid
es
d
ire
ct
co
nta
cts
to
E
EN
Lin
ks
to
ma
in E
EN
s
ite
Oth
er
Austria
Belgium X highlights the EI Cs but links to the new EEN
Bulgaria X X X Cyprus
Czech
Republic X X X
Central site w ww.enterprise-europe-
netw ork.cz
Denmark X X
Estonia X X
Finland X X X X central site for the EEN France X X
Germany X Explanation and logo relate to EICs
Greece X X X X http://w w w .enterprise-hellas.gr/ Hungary X X
Ireland X X X
Italy X X X X
Latvia Latvia - one news item in February 2008 Lithuania X
Luxembourg
Malta
The
Netherlands X X X
Poland X X X X Po land Š link to ow n site w hich still has EIC logo on it
Portugal
Sweden
Romania A News item
Slovenia
Spain
Slovakia X A news item linking to the http://w w w .enterprise-europe-netw ork.sk
UK X X
5.5 Efficiency
Judging the efficiency of the networks in a comprehensive way is extremely difficult since
there are no common indicators and it is not possible to assess some of the costs –
especially those incurred within the Commission.
5.5.1 Efficiency of the EIC and IRC networks
A summary of the outputs of the previous networks is indicated in Table 5.1.
76 As at February 2009. It should be noted that this is still changing

87
Table 5.1 Achievements of the IRCs and EICs
IRC – 2004 to 2008 EIC – Average annual figures
Nearly 900,000 clients (companies, research centres, universities and agencies) supported
Mass communication activities: more than 12 million individuals received various type of information through the EICs in 2005-06 (the number is 5million for 2006-07)
Around 60,000 company visits, technology audits / assessments carried out Publications: around 600-740 articles, 450-630 different newsletters, bulletins published, produces about 60-90 databases, about 200 policy guides and 250-350 leaflets, 30-90 press releases annually
More than 10.000 BBS technology profiles published Business Co-operation Database contained more than 5,000 active profiles (5,229 at the end of 2006)
More than 15,000 clients received information regularly due to their registration with the Automatic Matching Tool
Info Watch Services were available for about 100,000 subscribers
66,000 expression of interest generated and more than 30,000 clients met partners through technology brokerage events (about 90 annually)
Information requests replied: 310,000 per annum which equals over 95 requests per EIC each month in 2004
In total 28 internal training and good practice workshops delivered (11 Induction Workshops, 5 "Spring Schools" and 13 advanced training sessions organised
Internal training and events, learning courses for the EIC staff in various thematic areas (in 2006: 17 various courses with more than 500 participants; in 2005: 37 training with over 720 participants) in addition to the introduction of e-learning courses in 2007
3 IRC Annual Meetings between 2005 and 2008 Annual meeting every was held in every year
Annually about 8000 companies participated in TTT events, with about 21,500 transnational meetings, which resulted agreements in case of 14%
Events organised over 3,000 events involving more than 200,000 participants from small businesses - five key topics include internationalisation and business cooperation; funding opportunities; entrepreneurship and SME policies; Structural Funds and regional development; market information.
Achieved TTT agreements by type: 2,462 in total including: - technical co-operational agreements: 1151
- joint venture: 70
- manufacturing agreement: 102
- licensing agreement: 212
- commercial agreements with technical assistance: 927
SME feedback mechanism (IPM): 1,600-5,500-5,700 cases encoded each year around diverse range of issues including the following topics: rules, access to information, public procurement, e-commerce, taxation, food labelling, internal market, employment and social affairs or different thematic areas
On average a Full Time Employee achieved 1.8 TTT agreement per year
Tender Alert Services: almost 270,000 clients benefited in 2004
Participation in 6 Pan-European Business Co-operation Schemes project during 2005
88
IRC – 2004 to 2008 EIC – Average annual figures
EICs managed an EC grant, „aimed at stimulating entrepreneurship and raising awareness of its importance‟ 37 proposals were granted with worth over €1.9 million (Source: annual report 2005/06)

89
A comparison between the networks is not particularly helpful since the services provided
differed in range and input intensity. The cost of the EICs was assessed as EUR 11.4
million in 2007, made up and indicated in Table 5.2.
Table 5.2 Cost of EIC Networks
200277
2007
EU budget for implementation €8,960,000 €8,097,993
Maximum co-funding by EC 50% 50%
EC promotional costs n/a €350,180
Technical Assistance Office n/a €3,000,000
Total financial cost €11,448.174
FTEs 1,200 912
Enquiries handled 361,053 206,025
The 2008 Report on Streamlining the EU information Networks78
provided the costs for the
various networks, as far as possible. However this estimated that the IRCs involved 482
FTEs. It is understood that this does not include the inputs from the Commission. The
number of enquiries handled by the IRCs in 2007 was 60,750. The budget for the IRCs and
the IPR helpdesk over the life of FP6 was €81.4 million, of which €73.5 million was for the
IRCs in FP6, an increase from €71.5million under FP5. Under FP6 the IRC secretariat had
a budget of €3.7 million.
The trends in the numbers of transnational transfers of technology are given in Figure 5.5.
77 2005 ex-post evaluation of the MAP
78 Report on Streamlining the EU (add reference)

90
Figure 5.5 Number of Transnational Transfers of Technology achieved by the IRC
network
125 125 140
190
240
366
554
674
770
974
12601282 1298
868
1190 1204
0
200
400
600
800
1000
1200
1400
1995-1996 1996-1997 1997-1998 1998-1999 1999-2000 2000-2001 2001-2002 2002-2003 2003-2004 2005-2005 2005-2006 2006-2007 2007-2008
Number of clients End of reporting period
Source: IRC Annual Activity Report 2008
The evaluations to date agree that the EICs normally seemed to obtain their results at
reasonable cost. They benefited from their situation within host organisations and leveraged
a significant additional input, since on average only 12-15% of an EIC‟s financial inputs
were covered by EU financing. The funding for EICs did not change significantly over the
whole lifetime of the network, and by the end there were signs that this was causing
problems, with some host organisations withdrawing their support and closing centres. A
further issue was the instability of the funding since under the MAP it was based on annual
contracts. This not only caused uncertainty for the EICs and host organisations but also
generated a significant administrative overhead both for them and for the Commission.
The evaluation of the IRC network concluded that the network as a whole was efficient but
that there was scope for improvement, with 80% of IRC survey respondents reporting that
operational management was efficient or very efficient79
. IRC operating tools also scored
very highly. The level of reporting, and the opportunity cost of this was raised as an issue,
however, which was also the case for the EICs.
5.5.2 Efficiency of the Enterprise Europe Network
According to the participants, the new Network tends to carry out the same level of tasks as
the previous networks, a more in-depth assistance to complicated issues is reported as the
trend by the Commission. Under the old networks the IRCs tended to perform more face to
face functions in delivering services and the EICs used a wider range of delivery
mechanisms. Although merged into one service, the survey results would support the
79 Evaluation of DG Enterprise and Industry activities in the field of innovation op cit

91
findings that all types of service delivery are still being performed under the new Network
using the appropriate delivery mechanisms.
In terms of staff levels, in 2006 a total of 30.5 FTEs were identified as involved in the
management of the two networks (including in the financial units), plus a further 46 in the
various Technical Assistance Units80
. In 2009 the Commission has identified 14 FTEs
working on the Network, plus a staff complement of 50 in the EACI. This represents slightly
more in the Commission than the original plan as set out in 2006, but still represents a
saving of 16%. Financial savings may also have been made through the change in balance
of the staff between permanent staff/Temporary Agents and Contract Agents, which can be
assessed once the new system has been running for enough time.
A major saving has been achieved under the new structure with the change of the
contracting arrangements. DG Enterprise and Industry launched the call for proposals for
the Enterprise Europe Network in 2007. The Commission signed Framework Partnership
Agreements (FPA) for periods of six years. The Specific Grant Agreements (SPA), running
for three years, were signed by the EACI. A new call for proposals will only be launched, if
the EIP programme is renewed, after 2013. These procedures have generated significant
savings through the reduction in contracting costs for the EU and for the Network partners.
However, the survey showed that over 60% of respondents felt that there had been a
worsening in the burden of management and reporting overhead with the new Network, and
of these over 30% felt that this was a serious worsening. This was at odds with the
responses on other aspects of the service that generally signalled improvements and thus,
even allowing for a degree of “frustration bias” should be taken as a signal that this is an
area that merits careful follow-up. This is particularly the case since the new system is
supposed to represent a diminution in the burden – partly through an extension of the
reporting period to 18 months from the previous 12 (or sometimes 6) month cycle. The
findings of the case studies suggest that some of the perception may be due to
administrative difficulties in the set-up processes (for example, provision of guarantees for
non-public bodies) that led to delays in financing and other related problems, rather than
the burden of regular reporting. However, the evaluators have some concerns that the 18-
month reporting cycle will not provide information frequently enough to enable effective
steering during the current period of some turbulence. The situation needs to be kept under
review, as it may be that a more frequent but streamlined reporting system may be more
effective. However, this is something that can only be assessed once a full cycle has been
completed and the reporting criteria tested.
There seems to be consensus among the views expressed that major difficulties stemmed
from the delay in implementation of the IT tools. The most often cited negative effects
included: serious drop in service quality; unprofessional service provided to the clients; loss
of clients due to the diminishing credibility and reputation caused by the catastrophic
implementation; and, difficulties regarding the fulfilment of the contractual monitoring
obligations towards the Commission. Since the questionnaire was administered, the BCD
and BBS databases have been loaded with 5,750 active and published requests and offers
for cooperation, and the Automatic Matching tools (local and central) send profile
information to about 20,000 subscribed companies. It was reported to the evaluation team
that 436,000 profiles were sent in March 2009 via 68,365 emails to 8,589 companies. In
addition a minimum of 30 events are organised each month.
80 Cost Benefit Analysis of the externalisation of the certain tasks regarding the implementation of the
Competitiveness and Innovation Framework Programme (2007-2013) through an Executive Agency

92
On the other hand, Enterprise Europe Network members understand the benefits of the
merger of the predecessor networks, welcome the singe network idea and are looking
forward to the end of the transition period hoping for an effective cooperation in the future.
Typical comments were of the type:
“Unsuccessful implementation of necessary tools has caused a loss of momentum and
made it impossible to provide a professional service to our clients.”
“It will take time to bed down and integrate fully: the Enterprise Europe Network has after
all only been fully functional since April 2008 when the old IRC functions joined: eg six
months. The standard of service is currently not as good as possible because of the various
teething problem, that are mainly due to lack of functioning central structures, tools, and
communication systems. In the longer term the overall standard should be well improved”
“If the network works as it is supposed to, the services represent an improvement because
the businesses have access to a much wider range of services than they had before in a
one stop shop. Whether or not it is actually working is perhaps too soon to tell...”
It should be noted that the survey was undertaken at a period of maximum frustration and
that since then the situation has markedly improved. The promising element is that there is
an underlying support of the principles of the network, and a very positive approach from
the Network partners.
Nevertheless there is now a major job seen by all concerned to rebuild the Network
following these difficulties.
5.5.3 What aspects are the most efficient or inefficient, with regard to resources mobilised
by the stakeholders during the different stages of the process
At this stage it is still too early to identify within the Network portfolio which elements are the
most efficient or cost effective, since adequate reporting data are not available and in any
case the network has been operating under somewhat of a handicap until very recently.
However, one of the achievements has been the development of the new performance
monitoring system for the Network, with 50 indicators encoded in the IT system and 8
defined performance indicators of which 7 are drawn from combinations of these data and
one from a client survey. The quality working group agreed that the purpose of this was not
to benchmark Network partners but to enable partners to assess performance and provide
an incentive for improvement.
According to the survey, the most challenging aspects of the service to deliver are: the
international partner search; innovation support; and, assistance with international
business regulation and law. By contrast the most resource intensive activity (apart from
international partner search) was training and events and preparation of applications for
funding.
The overall picture is as shown below in Figure 5.681
.
81 Calculated using a scoring factor on the survey results
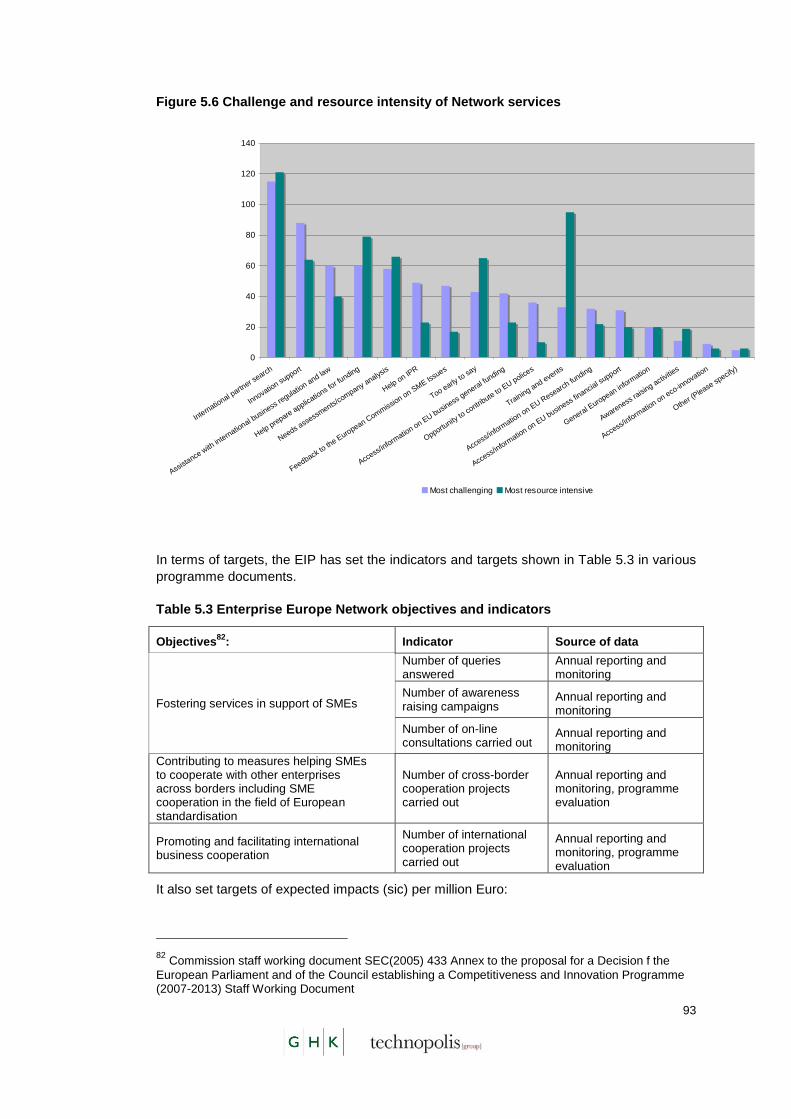
93
Figure 5.6 Challenge and resource intensity of Network services
0
20
40
60
80
100
120
140
Internatio
nal partn
er search
Innovation support
Assistance with
intern
ational b
usiness regulatio
n and law
Help prepare
applicatio
ns for f
unding
Needs assessments/company analysis
Help on IPR
Feedback to th
e Euro
pean Commission on S
ME Issues
Too early to
say
Access/inform
ation on E
U business general fu
nding
Opportunity
to contrib
ute to E
U polices
Training and events
Access/inform
ation on E
U Research fu
nding
Access/inform
ation on E
U business financial s
upport
General E
uropean in
formatio
n
Awareness ra
ising activitie
s
Access/inform
ation on eco-in
novation
Other (Please specify
)
Most challenging Most resource intensive
In terms of targets, the EIP has set the indicators and targets shown in Table 5.3 in various
programme documents.
Table 5.3 Enterprise Europe Network objectives and indicators
Objectives82
: Indicator Source of data
Fostering services in support of SMEs
Number of queries answered
Annual reporting and monitoring
Number of awareness raising campaigns
Annual reporting and monitoring
Number of on-line consultations carried out
Annual reporting and monitoring
Contributing to measures helping SMEs to cooperate with other enterprises across borders including SME cooperation in the field of European standardisation
Number of cross-border cooperation projects carried out
Annual reporting and monitoring, programme evaluation
Promoting and facilitating international business cooperation
Number of international cooperation projects carried out
Annual reporting and monitoring, programme evaluation
It also set targets of expected impacts (sic) per million Euro:
82 Commission staff working document SEC(2005) 433 Annex to the proposal for a Decision f the
European Parliament and of the Council establishing a Competitiveness and Innovation Programme (2007-2013) Staff Working Document

94
45,000 SMEs reached by awareness raising activities
112 events dealing with European issues with relevance for SMEs
2500 enterprises put in contact with potential partners through the business
cooperation tools.
These are significantly lower outputs than the previous networks achieved, and on the basis
of current data the Network is on target to achieve them. However, in assessing value for
money/efficiency the increasing complexity of the information sought and increased
sophistication of the clients does need to be taken into account, and the indicators and
targets will need to be reviewed in the light of changes in the client demand over the life of
the network.
5.6 Effectiveness
5.6.1 Innovation Relay Centres
Innovation Relay Centres were generally considered effective – and Figure 5.7 shows that
the major indicator of completed TTTs experienced a continuing upward path. However, the
last evaluation identified a potential issue in the single product offering of the IRCs, and this
in an area which was not always perceived as immediately relevant by SMEs. This led to
IRCs spending more time on marketing and gaining access to SMEs.
A further issue was that the individual IRCs were evaluated but there was little opportunity
to take account of the second element of the network – the ability of the wider network to
co-operate and provide support. This suggested that the organisation structure and
organisation did not always allow IRCs network to leverage to the maximum, some of its
key strengths. It should also be noted that the IRC constituency was in fact somewhat wider
than the EICs‟ since it also included universities and research centres. They also provided
services to large companies and corporations.
Areas identified by the network participants as providing scope for improvement included:
Project planning and coordination
Monitoring and evaluation processes
Communication between partners
Application of learning gained through the project
Improving existing or developing new services
This was all, however, against a background of general satisfaction, and thus reflected
opportunity rather than criticism. A need was expressed to integrate the network better in
the business support activities of the Commission.
The IRC also network felt it suffered with problems of lack of visibility and knowledge
among its target populations. Geographical coverage was good across the EU 15 and the
new Member States.
One of the major contributing factors to this effectiveness was the Business Bulletin System
provided by the IRC secretariat, and indeed the various tools provided all scored highly as
contributing to the success of the network.

95
In terms of reaching their target audiences, the IRCs dealt with questions from across its
potential audience, with a strong dominance of the industry sector as would be expected,
with the general distribution being as indicated in Figure 5.883
:
Figure 5.7 Distribution of IRC clients
IndustryResearch centres /
universities
Service sector
Technical sector
Other
Not known
The IRC network contributed to the realization of about 2500 TTT agreements during 2002-
2006. The agreements covered the following main technology areas
Industry
Manufacturing
Materials
Transport technologies
Electronics
IT
Telecommunications
Biological sciences
Science environment
Energy and agrofood
5.6.2 Euro Info Centres
The effectiveness of the EICs was analysed as being affected by three factors:
The reputation of the EIC and the degree to which it was embedded in its
local business support structure.
The characteristics of the region concerned – the level of development and
the number of potential client enterprises could influence performance –
especially as there was a significant reliance on the host organisations own
resources.
83 IRC Final Report, 2002-2006
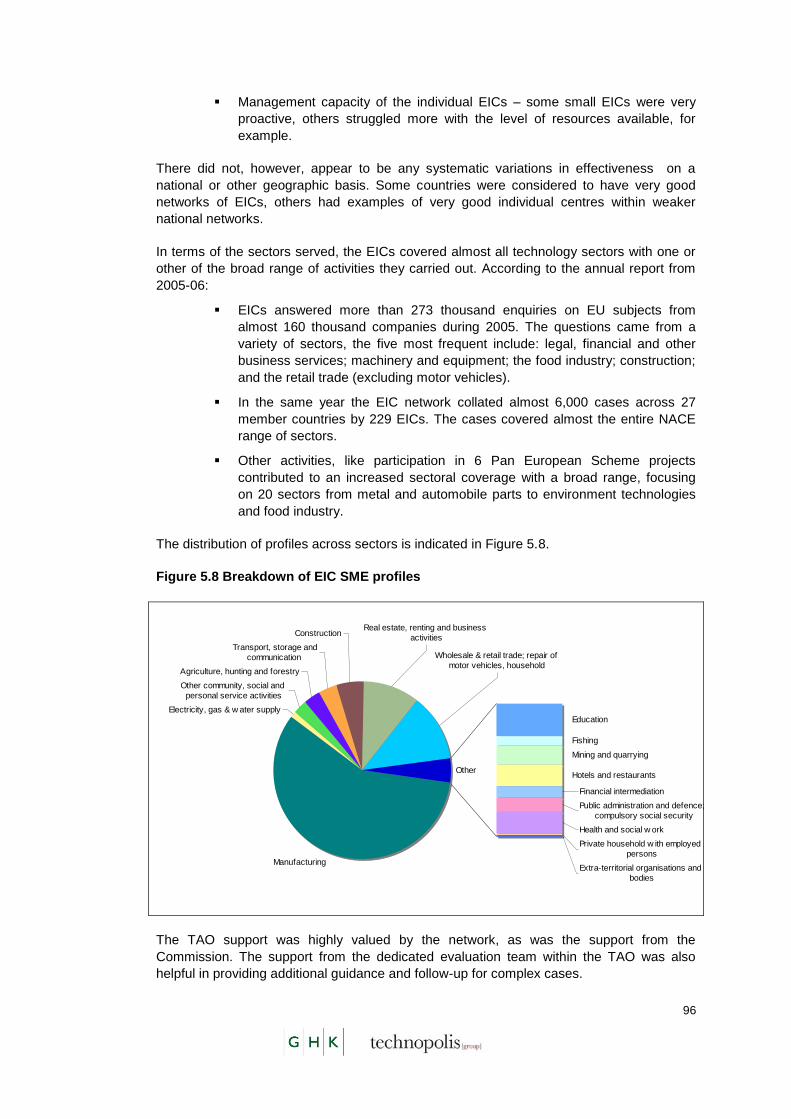
96
Management capacity of the individual EICs – some small EICs were very
proactive, others struggled more with the level of resources available, for
example.
There did not, however, appear to be any systematic variations in effectiveness on a
national or other geographic basis. Some countries were considered to have very good
networks of EICs, others had examples of very good individual centres within weaker
national networks.
In terms of the sectors served, the EICs covered almost all technology sectors with one or
other of the broad range of activities they carried out. According to the annual report from
2005-06:
EICs answered more than 273 thousand enquiries on EU subjects from
almost 160 thousand companies during 2005. The questions came from a
variety of sectors, the five most frequent include: legal, financial and other
business services; machinery and equipment; the food industry; construction;
and the retail trade (excluding motor vehicles).
In the same year the EIC network collated almost 6,000 cases across 27
member countries by 229 EICs. The cases covered almost the entire NACE
range of sectors.
Other activities, like participation in 6 Pan European Scheme projects
contributed to an increased sectoral coverage with a broad range, focusing
on 20 sectors from metal and automobile parts to environment technologies
and food industry.
The distribution of profiles across sectors is indicated in Figure 5.8.
Figure 5.8 Breakdown of EIC SME profiles
Education
Manufacturing
Electricity, gas & w ater supply
Other community, social and
personal service activities
Agriculture, hunting and forestry
Transport, storage and
communication
Construction
Fishing
Mining and quarrying
Hotels and restaurants
Financial intermediation
Public administration and defence;
compulsory social security
Health and social w ork
Private household w ith employed
persons
Extra-territorial organisations and
bodies
Other
Real estate, renting and business
activities
Wholesale & retail trade; repair of
motor vehicles, household
The TAO support was highly valued by the network, as was the support from the
Commission. The support from the dedicated evaluation team within the TAO was also
helpful in providing additional guidance and follow-up for complex cases.
97
One of the weaknesses of the network that was picked up in both of the recent evaluations
was that of the difficulty of the network in mastering the increasing volume of European
information. Resources had been dedicated to both increasing the familiarity of the EICs
with information from Commission sources, and of familiarising the other Commission
departments and DGs with the potential of the EIC network. The interviews carried out for
this interim evaluation showed an increase in general knowledge within the Commission,
over the past two years.
Overall the network was generally perceived as effective. Many EICs also carried out
customer satisfaction surveys that fed into their internal management systems. The breadth
of the offering, the complementary activities of the host organisations and the degree to
which they were embedded in their local business support landscape were also contributory
factors.
However, an area of consistent weakness identified was the feedback role of the EICs. This
had been specifically addressed over the past few years, coinciding with the introduction of
the Interactive Policy Making system, but there was still some disappointment with the
functioning of the mechanism overall.
Finally a factor contributing to the effectiveness of the EICs was the length of history and
the level of brand recognition that had been developed. That was challenged by the
multiplication of European networks with potentially overlapping remits, even though it was
considered that actual overlap was minimal.
5.6.3 Enterprise Europe Network
Assessing the effectiveness of the Network at this stage would be inappropriate, given the
delays in the provision of some of its key operating tools.
However, what is possible is to assess the extent to which the issues identified for the
previous networks have been addressed in the design and implementation of the Enterprise
Europe Network.
Network design, membership and work programmes
The design of the Network addressed the some of the issues of the multiplicity of networks
and the opportunities for synergy – although there remains some overlap with the FP7
NCPs, given that the Enterprise Europe Network has similar objectives of promoting access
to the RTD Framework Programme. This has been identified as an issue and there is a
process of cooperation in progress.
The work programmes reflect the overall relevant objectives of the EIP. The activities
prioritised meet the requirements of users as set out in the needs statements and the
objectives hierarchy. Whether this is reflected in the implementation cannot be judged until
the first activity reports are received. These cover an 18 month period and have not yet
been received.
The implementation of the new Enterprise Europe Network in the Member States has been
done in a flexible way in order to capitalise on existing structural links and relationships.
This has meant that „counting‟ of numbers of Networks is slightly meaningless as they vary
in size from one Network Partner to more than 20. This makes it difficult to compare them
to the previous structures. Furthermore the partners had a total free hand in defining the
internal structure of the networks, whether it should be centralised or decentralised. While
many of the previous network members are now part of the new Network, they have been

98
joined by a significant number of new partners, which should have extended the range of
resources available to provide the services of the Network.
5.6.4 Management methods and their implementation
The Network has to ensure a high standard of service with regard to
Targeting of SMEs;
Access to programmes for SMEs;
Monitoring of results;
Involvement of stakeholders; and
Exchange of information and best practice.
With regard to targeting of SMEs, the Network members are drawn from a range of
business support organisations – Chambers of Commerce and Regional Development
Organisations being the most common in the respondents to the survey (23% and 20%
respectively). Other organisations representing between 10% and 5% of respondents
included: universities, foundations, innovation centres, regional/local government bodies,
and private companies. Almost all Network partners are involved in information related
tasks. There is however, a clear level of specialism exhibited within the Networks
highlighted by the fact that partners do refer on to other partners, especially in areas such
as Eco-Innovation and IPR for example. Very few partners indicated a change in source of
customer since the introduction of the Enterprise Europe Network.
There are no statistics yet available on the profile of SMEs contacting the Enterprise
Europe Network. However, the case studies revealed, that in general Enterprise Europe
Network Partners have no specialisation in distinct sectors (although there might be some
specialisation by individual consortium members). The Partners might deal more with a
given sector, this tends to be based on the region‟s technological orientation rather a
decision made by the Partners. Other defining factors include the profile of the host
institution and the division of labour between the consortium members based on the needs
of the territory they supply.
Examples from the case studies regarding technical specialisation include:
The Chilean correspondence centre deals, mostly in line with its host
institutions core thematic activity areas, with enterprises specialised in food
(fresh fruit, salmon, various agricultural products and wine) and special
interest tourism;
The Maltese partner did not mention any sector, they pay primary attention by
intention. However, due to the changes during the last decade, when SMEs
began to move away from the traditional manufacturing sectors, they now
have collaborations with businesses mostly from the two most important
sectors: ICT and tourism;
Greek partners agreed that for some consortium members, direct contact
with, and support for, enterprises, in combination with sectoral orientation and
customisation of services, are paramount. In addition, interviewees reported
benefits such as enhanced relationship networks, more intensive international
cooperation, extended opportunities for collaboration, more successful
partner searches and wider sectoral coverage as an advantage for the new
network; and,
99
In the United Kingdom the activity areas of the businesses supported by
Enterprise Europe Network Partners reflect the economic focus of the given
region rather than any intention of the participating organisations to promote
one sector over another. Usually the participating organisations have a remit
to supply all types of companies, although historically and based on
previously gained experiences, existing client databases there might be some
differences, specialisations. Regarding the technological sectors, Enterprise
Europe Network representatives interviewed listed the following as the most
significant, since the majority of the companies they work with are active in
these fields:
Region 1: Environment, health and medicines, ICT and security;
Region 2: Energy, environment, food and drink, ICT and life sciences;
Region 3: Energy, tourism, distinct technology areas.
The MAP evaluation highlighted that the function of the IRC was perhaps too specialised
and SMEs may not come to them for that level of support. At the same time the work they
did made a significant impact on the level of technology transfer in Europe. The new
Network was meant to consolidate services and at the same time create a balance but not
to the detriment of the specialised and high impact activity. It is too early to say whether this
has yet been managed under the Enterprise Europe Network. Judging by the number of
organisations continuing to provide specific „module B‟ function, the balance is in place.
The implementation of the Specific Grant Agreement is monitored by the EACI. Progress
has been made with the plans for the monitoring of results with the implementation of the
work from the quality working group on the performance indicators. The EACI is
implementing further quality assurance mechanisms. Performance indicators, satisfaction
surveys and codes of conduct will be delivered in early 2009.
However, the results of the network survey also highlighted a perceived increase in the
reporting burden, which is an issue that needs to be kept under review. It would not be
abnormal for a perception of increased burden to be generated by change – in this case for
members of both the previous networks. This was of course also conditioned by the delays
in implementation of the supporting and reporting tools. If, however, the perception persists
once the Enterprise Europe Network members have had the opportunity to become
accustomed to the new arrangements then the issue will need to be addressed, since one
of the objectives of the new Network was a streamlining of procedures.
Involvement of stakeholders has been assured in several ways:
Through the range of organisations involved in the Network;
Through the establishment of a range of working groups in the Network
covering both implementation and management issues and wider policy
issues. For example, 18 Sector Groups were established in the last quarter of
2008, with 15-25 Network partners involved each. These groups should also
assist in the communication with other departments within DG Enterprise and
Industry; and,
Through the implementation of feedback mechanisms at consortium level.
Exchange of information and best practice is important and had been identified as an area
where there was scope for improvement in at least the IRC network. The organisation of the
regular Network annual meeting should also contribute to this objective.

100
Exchange of information internally within the consortia is also potentially an issue. In the
survey it could be seen, for example, that the frequency with which services were provided
through consortium partners rather than directly, increased with the complexity of the issue.
IPR and international business law were the most likely to be referred on followed by
access to research funding, eco-innovation and, interestingly, feedback to the European
Commission.
There are also five current working groups:
Working Group on Communication;
Working Group on Quality and Performance;
Working Group on Partnership Tools;
Working Group on FP7 to define synergies and ways of cooperation between
the NCP network and the Enterprise Europe Network; and,
Working Group on internationalisation.
The most significant barrier to the effectiveness of the network at all levels, from
management to operation on the ground, was the absence of the integrated IT tools
necessary for the smooth functioning of the Network. The size of the problem reflects the
importance of the tools to the Network partners, and the potential they have to facilitate or
hinder the effective functioning of the network. In addition, during the process of the transfer
of responsibility to the Agency there was a lack of clarity as to the relevant contact points
that led to confusion and frustration among the Network partners, and indeed caused some
obstacles for this evaluation. Now that the transfer has been completed this issue should
resolve itself. However, there appears still to be some work to do to clarify some of the
inevitable grey areas between the policy responsibility of the Commission and the
implementation role of the EACI.
The added value of the Enterprise Europe Network lies in two areas – the European added
value provided by the coverage and international dimension, which should ensure that
beneficiaries can benefit from the knowledge of the wider Network, especially in the field of
international partner search in its various forms, which was identified as the most frequently
sought service, and the bringing together of the consortium partners on the national and
regional scale which should contribute to the defragmentation of the European advisory
services and the implementation in real terms of the “no wrong door” policy. The range of
services provided from the general to the specific also adds value as it addresses the issue
of marketing for the specific services such as technology transfer.
5.7 Information and Awareness
Information and awareness were areas of general strength of the previous networks. As
already noted, however, the IRCs were having to spend a high level of resources to reach
SMEs because of the specialist nature of the offering and some resulting communication
barriers. In the case of the EICs, there was however, quite a high level of brand recognition
on the ground. Information on the products and services of the networks was therefore
quite widely distributed – EIC info documents were distributed to 5,000,000 clients in 2005,
for example, and this does not take into account the number of SMEs obtaining information
from the various web presences of the networks and their members.
The level of recognition among the potential information providers, particularly at European
level has, however been acknowledged as weak. This reflects the fact that the role of the
networks themselves as communicators to the Commission was not well developed. This

101
refers partly to the capabilities of the network and the opportunities they offered, and also to
the dissemination of the results of their activities beyond the reporting of output indicators.
For the Enterprise Europe Network there have been a number of issues relating to
information and awareness. One of these was the lack of a corporate identity at the time of
the launch of the Network. At the time of the survey undertaken as part of this evaluation
(September/October) 2008, only 43% of respondents rated the Enterprise Europe Network
“brand” highly visible and promoted within their organisation, others rated it visible among
others but 5% considered it had no specific visibility. Some 83% had a website up and
running. However, at that time the links from the Commission Enterprise Europe Network
website to these were of varying quality, often being generic links to the host organisation
homepage with no visible links to specific Enterprise Europe Network content. Only 15% of
respondents felt the transition was complete and the new brand widely disseminated, with
46% agreeing transition was complete but the new structure and brand was not yet fully in
place.
With the distribution of the new corporate identity and the implementation of the graphic
charter which was launched at the Strasbourg event these perceptions should have
improved.
At the beginning of the evaluation (August 2008), the fact that many of the Enterprise
Europe Networks had yet to complete their own transition from EICs/IRCs to an Enterprise
Europe Networks was reflected in the websites which contained a number of mixed
identities (host organisation as well as defunct networks) and also in the names of the
organisations involved. Revisiting the Network websites in February 2009 showed a
significant increase in the Enterprise Europe Network branding although there are still
remnants of the previous EIC/IRC identities. Hungary has its own national website, in the
UK there are regional websites associated with each Enterprise Europe Network, giving
prominence to the Enterprise Europe Networks logo. Some of the countries with bigger
networks (e.g. Spain, Italy) still have a large number of different websites with a low
prominence of the Enterprise Europe Network identity. There are also a number of links to
the websites which don‟t work from the central Enterprise Europe Network page of the
European Commission and others direct users to generic host organisations, even when
there exists a specific national Enterprise Europe Network website, for example as in
Finland.
The Commission claims a high level of online visibility with more than 13 million results (sic)
in Google, up from 5 million in October 2008 and 2 million in March 2008. A Google search
on the entire phrase “Enterprise Europe Network”, however, yields 494,000 results. These
results are, however, almost all directly relevant, with the Commission Enterprise Europe
Network site as first hit and the remainder down to page 11 being largely those of the
individual Networks. Google links identifies 1,540 pages as linked to the Enterprise Europe
Network homepage. This is likely to be an understatement due to the limitations of the tool,
however. The top links are from the individual consortium/country web pages and other
Commission pages. Links from other organisations are rare down to the 20th page.
Now the Network is established it would be worthwhile to examine the behaviour of web
users which will provide more information on user behaviour and referring sites. Europa has
the capacity to provide the requisite statistics.
5.8 Coherence and Synergies
The intervention logics of the EIC and IRC programmes were developed over time and
suffered from the fact that the two networks were funded by different programmes with
102
different objectives. As time elapsed there was convergence in the objectives and the issue
of synergies was identified as an area for potential development. However, at the same
time, other networks and initiatives were emerging in the field of SME support without any
apparent consideration of how they might fit within the landscape and limitations on the
capacity of the EIC, at least due to the ending of the MAP and the introduction of the CIP.
Some tensions with Member State policies and initiatives could potentially arise – the same
principles driving the EU “no wrong door” policy also applied at national and regional level
with the risk that the Enterprise Europe Network would either be invisible behind the
national identity or lost in a constellation of initiative logos. At present the landscape is too
varied to be able to draw conclusions.
5.9 Conclusions
5.9.1 EIC and IRC networks
Both the EICs and the IRCs were seen as highly relevant to overall European objectives on
competitiveness, innovation and SME support within those. The networks achieved
satisfactory results, with the IRCs showing an upward trend in outputs and the EICs,
although showing a reduction on basic outputs were developing an increasingly
sophisticated service and meeting needs of more demanding clients.
The role of feedback to the Commission, by contrast was poorly developed. The main factor
identified here was the internal lack of awareness of the information potential of the
networks by the various departments and DGs of the Commission.
The managerial efficiency of the networks was also relatively highly scored by the
members. In terms of financial efficiency, since the funding represented, especially in the
case of the EICs, a very small part of the centres‟ financial needs, the networks arguably
leveraged a high level of activity. However, this was counterbalanced by the risk that the
low level of funding led to a low priority for the actions within the host organisations and to
the withdrawal of several host organisations.
The proliferation of networks became increasingly an issue – not only in the field of
innovation and SME support, and opportunities for synergy were highlighted. However, both
the breadth of the EIC offer and the specialised offer of the IRCs had merits which could be
lost in any amalgamation of networks.
5.9.2 Enterprise Europe Network
The transfer to the Agency has been achieved and the Network is almost fully operational.
However, there were certain delays in implementation which led to frustration from the
Network members on the ground. This can almost all be traced to the failure to ensure the
IT tools were in place and integrated in good time which was a major handicap and delayed
the full implementation of network activities. However, this does mean that once this
obstacle has been surmounted, any remaining issues should be of relatively small scale.
Overall the combining of the networks has been well received by the stakeholders. Areas
where an improvement was reported in the survey included joint working with other
organisations, contact with other networks and support from the host organisations. The
range of information, quality of client service and visibility of the service also improved to
some extent. Support from the Commission during the transition was, however perceived to
have declined.
However, there is overall a high degree of support and motivation among the Network
members that offers a firm platform for the delivery of the services to SMEs. This was

103
particularly evident at the annual conference. This does need to be matched by a fully
functioning central support system, including both the Commission and the EACI and the
implementation tools.
None of the weaknesses identified were not already known to the Commission and the
EACI, steps have been taken to address them. Over the life of the interim evaluation there
was evidence of progress on all fronts. The division of roles and responsibilities between the
Commission and the EACI, particularly in the area of animation, still needs to be clarified,
particularly in the perception of the Network partners.
Care needs to be taken to ensure the integration of the new Network members and that the
members of previous networks are able to develop their services in line with the new scope
of the enlarged network. Individual Network partners from the previous networks still in
some cases appeared not to have taken on board the full scope of the changes. This may
be mitigated at the level of the consortia and eventually, as the new systems and culture are
established, cease to be an issue.
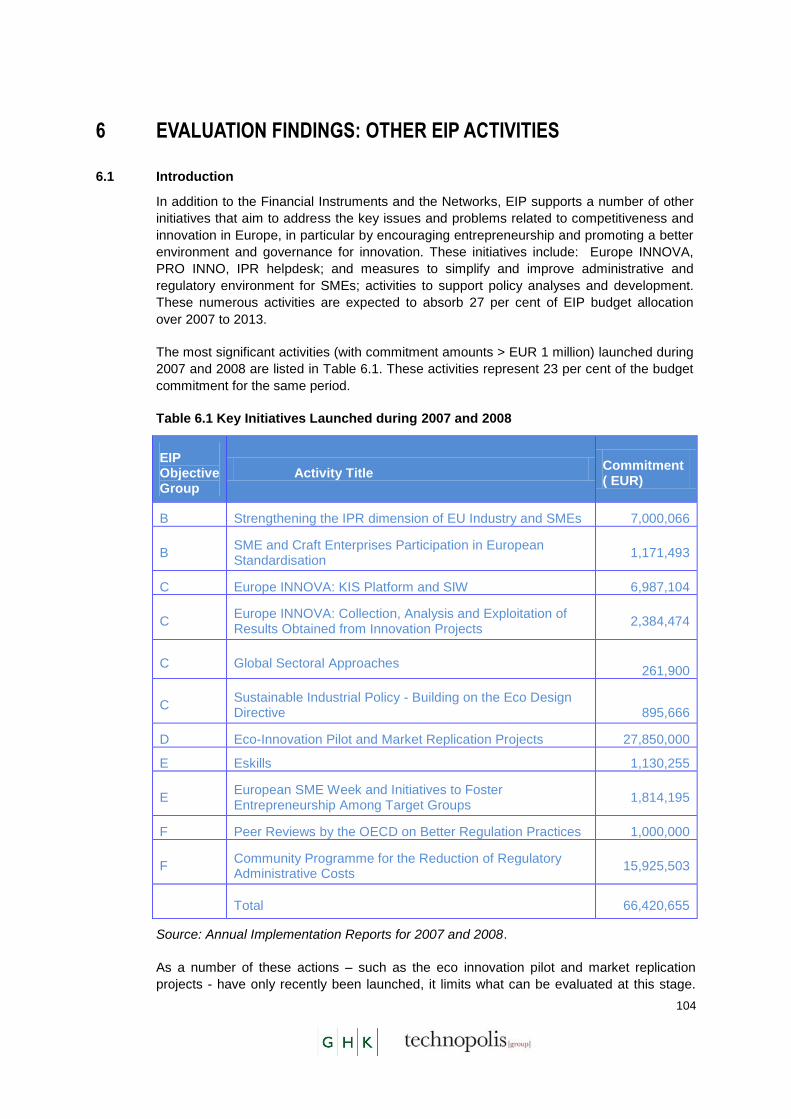
104
6 EVALUATION FINDINGS: OTHER EIP ACTIVITIES
6.1 Introduction
In addition to the Financial Instruments and the Networks, EIP supports a number of other
initiatives that aim to address the key issues and problems related to competitiveness and
innovation in Europe, in particular by encouraging entrepreneurship and promoting a better
environment and governance for innovation. These initiatives include: Europe INNOVA,
PRO INNO, IPR helpdesk; and measures to simplify and improve administrative and
regulatory environment for SMEs; activities to support policy analyses and development.
These numerous activities are expected to absorb 27 per cent of EIP budget allocation
over 2007 to 2013.
The most significant activities (with commitment amounts > EUR 1 million) launched during
2007 and 2008 are listed in Table 6.1. These activities represent 23 per cent of the budget
commitment for the same period.
Table 6.1 Key Initiatives Launched during 2007 and 2008
EIP Objective Group
Activity Title Commitment ( EUR)
B Strengthening the IPR dimension of EU Industry and SMEs 7,000,066
B SME and Craft Enterprises Participation in European Standardisation
1,171,493
C Europe INNOVA: KIS Platform and SIW 6,987,104
C Europe INNOVA: Collection, Analysis and Exploitation of Results Obtained from Innovation Projects
2,384,474
C Global Sectoral Approaches
261,900
C Sustainable Industrial Policy - Building on the Eco Design Directive
895,666
D Eco-Innovation Pilot and Market Replication Projects 27,850,000
E Eskills 1,130,255
E European SME Week and Initiatives to Foster Entrepreneurship Among Target Groups
1,814,195
F Peer Reviews by the OECD on Better Regulation Practices 1,000,000
F Community Programme for the Reduction of Regulatory Administrative Costs
15,925,503
Total 66,420,655
Source: Annual Implementation Reports for 2007 and 2008.
As a number of these actions – such as the eco innovation pilot and market replication
projects - have only recently been launched, it limits what can be evaluated at this stage.
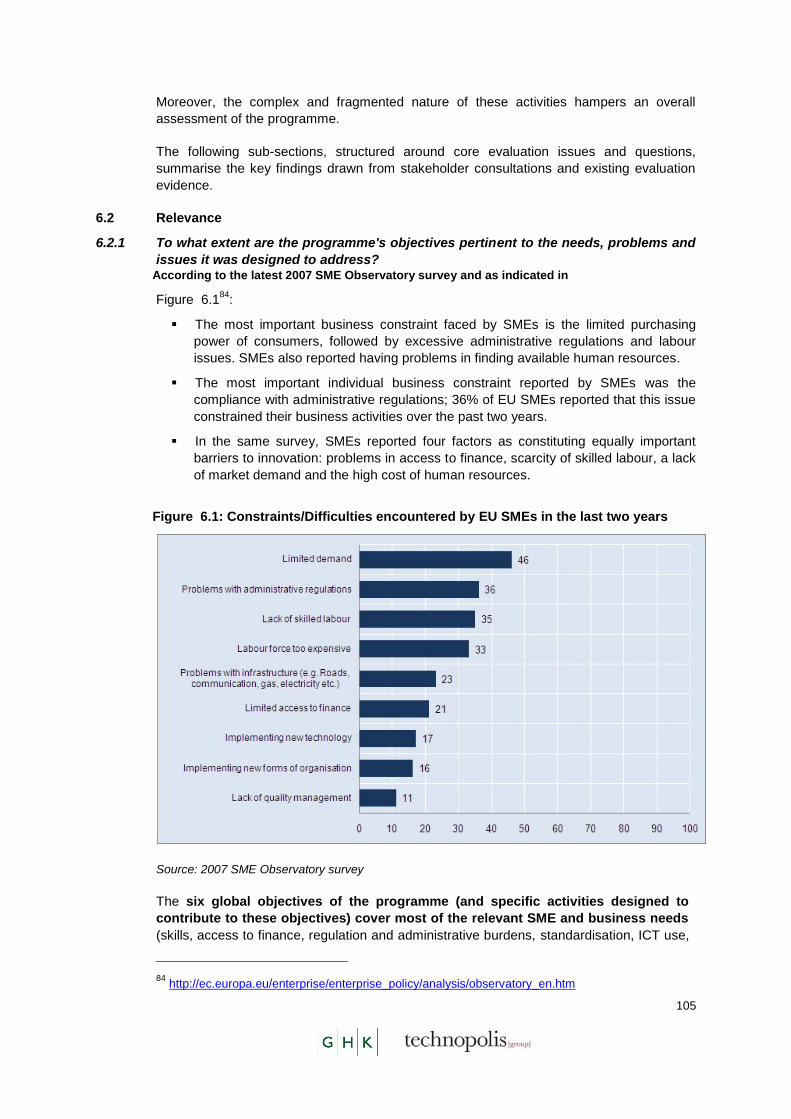
105
Moreover, the complex and fragmented nature of these activities hampers an overall
assessment of the programme.
The following sub-sections, structured around core evaluation issues and questions,
summarise the key findings drawn from stakeholder consultations and existing evaluation
evidence.
6.2 Relevance
6.2.1 To what extent are the programme's objectives pertinent to the needs, problems and
issues it was designed to address? According to the latest 2007 SME Observatory survey and as indicated in
Figure 6.184
:
The most important business constraint faced by SMEs is the limited purchasing
power of consumers, followed by excessive administrative regulations and labour
issues. SMEs also reported having problems in finding available human resources.
The most important individual business constraint reported by SMEs was the
compliance with administrative regulations; 36% of EU SMEs reported that this issue
constrained their business activities over the past two years.
In the same survey, SMEs reported four factors as constituting equally important
barriers to innovation: problems in access to finance, scarcity of skilled labour, a lack
of market demand and the high cost of human resources.
Figure 6.1: Constraints/Difficulties encountered by EU SMEs in the last two years
Source: 2007 SME Observatory survey
The six global objectives of the programme (and specific activities designed to
contribute to these objectives) cover most of the relevant SME and business needs
(skills, access to finance, regulation and administrative burdens, standardisation, ICT use,
84 http://ec.europa.eu/enterprise/enterprise_policy/analysis/observatory_en.htm
106
information and networking). EIP is designed to be a policy orientated programme with a
relatively modest budget allocation; nonetheless, EIP actions have the potential to
generate significant impact. For example, the Community programme for the reduction of
regulatory and administrative costs aims at providing recommendations on how to reduce
administrative burdens imposed by EU obligations and their transposition by the Member
States. The review of 42 EU acts showed that administrative costs amount to EUR 110-
130 billion and that 1,000 out of 10,000 (or 10 per cent) national obligations across EU27
go beyond what is required by EU law. Thus reduction of the administrative costs would
bring savings of billions of euro. Although the amount committed in 2008 for this action
was relatively modest at EUR 5.9 million, the potential impact (savings to businesses from
reduced bureaucracy) is expected to be significant.
6.2.2 How could the relevance of the programme be maximised?
The CIP Framework Programme has a complex architecture. This is in part a consequence
of the programmes having been formed through the restructuring and rebranding of
preceding activities and programmes. Further steps to streamline the architecture could
contribute to an increase in its relevance and European added value. EIP itself has a
complex architecture: the programme supports a number of diverse actions addressing a
wide range of issues. However, sometimes the lack of a visible, direct link between
individual actions and global EIP objectives, makes it difficult to identify the added value of
what can seem a disparate array of actions. For example, the annual Small Firms Charter
conference has proved to be a popular and well attended event, but it is less clear how the
event has impacted on policy development. According to stakeholders the added value of
such events is not always apparent.
..
6.2.3 To what extent are the objectives coherent with other national and EU activities
designed to foster the Lisbon objectives?
A comprehensive assessment of coherence will be undertaken as part of the CIP interim
evaluation – which will examine both, the internal coherence of CIP (i.e. the extent to which
the three pillars come together to address the overall objectives of CIP), as well as its
external coherence with other European and national initiatives.
This evaluation, however, did not find any evidence to suggest lack of coherence between
EIP objectives and other EU or national activities designed to foster the Lisbon objectives.
6.3 Efficiency
It is difficult so far to judge the efficiency of other EIP activities given that majority of the
actions have only recently been launched and fewer still are able to demonstrate results.
The non-use of performance indicators in work programmes / implementation reports
makes it difficult to aggregate outputs and calculate cost per output metrics.
6.4 Effectiveness
6.4.1 To what extent have the relevant annual work programmes been designed to
effectively contribute to the objectives they were designed to address – i.e. is the
intervention logic system of the programme functioning effectively or does it need
further refinement – and if so how should this be implemented?
As the intervention logic for individual actions is typically not well articulated in the work
programmes, it is often difficult to see the link between the activities and the anticipated

107
effects on competitiveness at the EU level and innovation, which in turn makes it difficult to
assess the overall effectiveness of other EIP activities.
The non-use of a consistent set of performance indicators in implementation reports makes
it difficult to see and use the Implementation Report as a real monitoring tool or in the
evaluation process. For example, it was not possible to carry out a systematic reporting and
analysis of outputs and results for a number of activities funded through the EIP. This was
because the work programmes for 2007 and 2008 do not use a consistent set of
measurable indicators capable of aggregation across the programme (e.g. number of
seminars/training sessions organised, number of seminars, trainings for SMEs and experts,
number of SMEs participating in workshops etc.). Also a number of activities and measures
deliver „soft‟ and difficult to quantify results, making the aggregation of results problematic
(e.g. increase in knowledge or awareness as a result of participation in a workshop,
network and good practice sharing).
Given the varied nature of the elements of the programme, DG Enterprise and Industry
does not plan to introduce a standard set of indicators; instead it favours a more flexible
approach that allows project officers to use appropriate indicators for each measure. This is
understandable, however one purpose of using indicators is to facilitate monitoring and
evaluation through aggregation and analysis (such as cost effectiveness analysis) of
reported outputs and results. In the case of EIP, the indicators in the work programmes are
currently not serving this purpose.
This evaluation therefore, can only offer conclusions with regards to individual actions
launched in 2007 to 2008 or more generally supported through EIP (on the basis of
stakeholder interviews and existing evaluation evidence:
Evidence concerning the effectiveness of Europe INNOVA and PRO INNO
Europe initiatives is available from the ex-post evaluation of activities carried out
by DG Enterprise and Industry under FP685
which concluded that – on the basis
of results which could be observed at the time of the evaluation – the networks
of innovation stakeholders created through Europe INNOVA, PRO INNO Europe
had „generated successes in terms of networking, coordination, community
building, information-gathering and reporting, and exchanges of ideas and
experiences‟. For many participating regions this was very new and was a
significant result; whilst for others the European aspect provided a „different
dimension‟ to existing national activity i.e. an increasingly European focus to
innovation policy making and delivery at national level. However, expert
reviewers who analysed a number of project outputs generated through PRO
INNO Europe suggested that there already existed a plethora of toolkits,
methods, strategies and policies available to policy makers across Europe and
that the added value of these activities need to be clearly articulated. The
concurrent study86
found support among some stakeholders for initiatives such
as PRO INNO Europe - Inno-Metrics and the European Innovation Scoreboard
(EIS) were viewed as „very well established and useful tools‟. However, other
opinions indicated that PRO INNO Europe lacked a general overview and was
85 GHK Consulting and Technopolis Ltd (2008) Ex-post Evaluation of the activities carried out by DG
Enterprise and Industry under the Sixth Framework Programme for Research, technological Development and Demonstration Activities.
86 GHK Consulting (2009) Evaluation of DG Enterprise and Industry‟s policies in view of the new
Commission: External Stakeholders‟ views.
108
complex and too fragmented. Europa INNOVA was also welcomed by the
stakeholders, because it was an action promoting innovation and
competitiveness.
Evidence concerning the effectiveness of the IPR Helpdesk is available from the
2005 evaluation of DG Enterprise and Industry‟s innovation activities87
, and from
a survey sent to the IPR Helpdesk team as part of the ex-post evaluation of
activities carried out by DG Enterprise and Industry under FP688
. The 2005
evaluation of the IPR Helpdesk concluded that, overall, the service provided was
being implemented effectively, that satisfaction rates amongst participants were
high and that the helpdesk resulted in improvements to firms‟ understanding of
IPR issues. However, the study indicated that referral arrangements were not
operating effectively (though 76 per cent of survey respondents agreed that the
Helpdesk had pointed them towards other relevant services). Following the 2005
evaluation, the Helpdesk set up a specific cooperation scheme with the IRC
Network and national patent offices, and the project officer from DG Enterprise
and Industry reported satisfaction with the quality of the arrangements. The 2008
evaluation reported that the overall satisfaction rate amongst helpline users was
93 per cent, whilst the satisfaction rate amongst helpline users in relation to the
response time for queries was 92 per cent. These results are similar to those
reported as part of the 2005 evaluation, and indicate that the service continued to
be well regarded by beneficiaries.
Consultations carried out as part of the concurrent study89
revealed that the IPR
Help Desk is regarded by stakeholders, as “a very useful tool” to assist
businesses participating in EU-funded research and innovation projects in
planning and managing intellectual property issues. Stakeholders however
voiced the concern that it is not available in all EU languages. In stakeholders‟
view the utility and accessibility of the Help Desk could be enhanced by making
it available all EU languages. However, the resources available under EIP to do
so are limited – there is a restricted budget for IPR helpdesk under the EIP. IPR
awareness and enforcement activities (including the IPR-Helpdesk) account for
approximately EUR 6.5 million (less than 4 per cent) of the budget commitment
relating to objective B. Prior to the EIP, the IPR helpdesk was funded under the
FP6 programme – with an overall budget of EUR 4 million, it ran from 2005 to
the end of 2007.
The ex-post evaluation of MAP90
concluded that policy development actions
tackle very diverse areas, but demonstrated added value while they fulfilled
complementary horizontal functions (exchange of best practice, guidelines,
awareness-raising, development of indicators and tools, etc.), by adding a
European dimension to national SME policies, increasing transparency in
87 TEEC (2005) Evaluation of DG Enterprise and Industry activities in the field of innovation
88 GHK Consulting and Technopolis Ltd (2008) Ex-post Evaluation of the activities carried out by DG
Enterprise and Industry under the Sixth Framework Programme for Research, technological Development and Demonstration Activities.
89 GHK Consulting (2009) op cit.
90 SEC(2004)1460, Commission Staff Working Paper: Report on a multiannual programme for
enterprise and entrepreneurship and in particular for small and medium sized enterprises (SMEs) (2001 – 2005)

109
enterprise and SME policies, and offering alternative approaches to common
problems (particularly in New Member States). According to the report, MAP
policy development activities have led indirectly to some policy and regulatory
changes in the participating countries. Most impacts have been on new or
adapted legislation, or within framework programmes, but there has also been
an impact on publications and awareness raising activities. The Commission‟s
role can be seen as a catalyst and co-ordinator of Member State‟s efforts, where
there is a clear European added value.
The work on SME access to public procurement and implementation of „Think
Small Principle‟ demonstrates the contribution of EIP to informing and shaping
policy in critical areas such as administrative reform. Consultations carried out as
part of the concurrent study91
revealed that business organisations acknowledged
DG Enterprise and Industry‟s work and activities which have helped to bring
practitioners together to identify and share best practices in the area of SME
access to public procurement. In their view it is vital to open up the procurement
market to SMEs. Business organisations also welcomed the exchange of good
practices and considered it to be a good way of learning by sharing ideas and
experiences. They felt that the outputs of the projects can be used as supporting
material for future policy decisions. In addition, they recognised and encouraged
the Commission in its efforts to promote the best practices amongst the Member
States.
6.4.2 How far do the management methods and their implementation ensure a high
standard of service in the following areas: targeting of SMEs and access for SMEs to
programmes, monitoring of results, involvement of stakeholders, exchange of
information (in particular methods of best practice) between actors?
As regards management methods and delivery arrangements, the evaluation found that:
The involvement of EIP Committee in programme development and implementation is
limited - it was suggested that the EIP Committee should have an earlier and
stronger role in providing feedback on the annual Work Programme,
The role of the Strategic Advisory Board is not clear. Some external stakeholders
suggested that there should there be more visibility and engagement between the
Committee and Board members, including feedback on its deliberations and
decisions.
However, the role of these bodies is clearly defined in the legal base. Following the rules on
the comitology procedure, the Commission consults the Committee for its opinion on the
Work Programme. Any other arrangements would require not only a change in the legal
base, but also in the comitology system.
6.4.3 What is the added value of the programme for stakeholders? Have there been any
unintended effects on stakeholders and, if so, how can the programme take these
into account?
As discussed in section 6.4.1, added value of the programming lies in informing and
shaping policy at both a European and a national level; bringing practitioners together to
identify and share best practices in the areas of innovation policy and business reform; and
activities designed to encourage transnational working of businesses, such as the IPR
Helpdesk. However, some activities such as events and reports to support policy
91 GHK Consulting (2009) op cit.
110
development, are perceived to generate limited added value by the stakeholders (such as
EIP Committee members and business organisations interviewed as part of this evaluation
and the concurrent study on stakeholders‟ views). This perception is mainly a result of the
limited awareness and knowledge of projects and their resultant outcomes (for example,
where workshops or reports lead to specific policy recommendations), among parties other
than the stakeholders directly involved in each project.
There is no evidence to demonstrate that the programme is generating any unintended
consequences. It is however, too early a stage in the implementation of the programme to
observe these effects.
6.5 Information and Awareness
6.5.1 How effectively has information about the availability of the programme instruments
and the results and impacts of actions been transmitted to potential stakeholders
and beneficiaries?
The ex-post evaluation of MAP concluded that a major constraint to the whole programme
(of many activities and/or of its umbrella structure) was its poor visibility even to relevant
stakeholders such as policy makers (particularly if they were not directly involved in any
MAP action), business organisations, and Business Support Providers. Although it is too
early to make judgements about the diffusion of EIP programme information, consultations
with external stakeholders indicate that this continues to be an issue with EIP. Being one
pillar of the COP Framework Programme, EIP itself does not appear to have a strong
brand .
6.6 Conclusions
Overall conclusions emerging from this section, in summary, are:
EIP objectives address the most pertinent issues facing EU SMEs: skills, access
to finance, regulation and administrative burdens, standardisation, ICT use,
information and networking;
EIP has a complex architecture. With a relatively small budget allocation; the
programme funds a number of diverse actions aimed at a wide range of issues.
The lack of a clearly articulated link between individual actions and global EIP
objectives (in programme documentation such as work programmes or
implementation reports), makes it difficult to identify the added value of what can
seem a disparate array of actions. The annual work programmes reflect the
objectives of EIP - individual actions in the work programme are grouped under
the global objectives of the programme;
A number of stakeholders were of the opinion that the role and involvement of
EIP Committee Members and Strategic Advisory Board in managing the
programme is limited. However, the role of these bodies is clearly defined in the
legal base and is consistent with comitology procedures;
A major constraint to the whole programme (of many activities and/or of its
umbrella structure) is its limited visibility among stakeholders; and,
The non-use of a consistent set of performance indicators in implementation
reports makes it difficult to see and use the implementation report as a real
monitoring tool or in the evaluation process – particularly for an assessment of

111
efficiency or effectiveness of the programme actions. This issue should be further
explored through the CIP interim evaluation.
112
7 SUMMARY OF CONCLUSIONS AND RECOMMENDATIONS
7.1 Introduction
This section summarises the conclusions of the interim evaluation with respect to the key
evaluation questions on relevance, efficiency, effectiveness and information awareness
identified in section 2. Where applicable, pointers are provided for policy and subsequent
evaluation work.
7.2 Relevance
7.2.1 The relevance of EIP
To what extent are the programme's objectives pertinent to the needs, problems and issues it was designed to address?
The objectives of EIP are highly pertinent as they address the most important barriers and
constraints facing European SMEs, such as: excessive bureaucracy; limited access to
finance; availability and cost of appropriate labour; problems of accessing finance, and
difficulties with new technology, organisation or regulations. The identified needs remain
and European added value is being achieved, although for some actions (specifically, the
numerous events and reports to support policy development), it is not always visible to
stakeholders other than those directly involved with the initiative.
How could the relevance of the programme be maximised?
EIP has a complex architecture. This is in part a consequence of the programmes having
been formed through the restructuring and rebranding of preceding activities and
programmes. Further steps to streamline the architecture could contribute to an increase in
its relevance and European added value.
To what extent are the objectives coherent with other national and EU activities designed to foster the Lisbon objectives?
A comprehensive assessment of coherence will be undertaken as part of the CIP interim
evaluation – which will examine both, the internal coherence of CIP (i.e. the extent to which
the three pillars come together to address the overall objectives of CIP), as well as its
external coherence with other European and national initiatives.
This evaluation, however, did not find any evidence to suggest lack of coherence between
EIP objectives and other EU or national activities designed to foster the Lisbon objectives.
Recommendations:
Further steps to streamline the EIP programme architecture could contribute to an
increase in its relevance and European added value. This issue should be fully examined
as part of the CIP Interim Evaluation.
The Annual Implementation Reports should include a clear statement of intervention logic
for each measure in order to improve overall coherence of the programme and to
demonstrate impact. This is particularly important for policy support measures where the
link between individual measures and the policy is not clear

113
7.2.2 The relevance of Enterprise Europe Network
To what extent are the programme's objectives pertinent to the needs, problems and issues it was designed to address?
How could the relevance of the programme be maximised?
The objectives of the Enterprise Europe Network are relevant to the needs of the SME
sector. Less than 10 per cent of network partner survey respondents felt that the relevance
had diminished with the introduction of the Enterprise Europe Network, and 25 per cent felt
that the relevance was greater than before. In addition, nearly 90 per cent of respondents
considered the range of services to be the same or better than under the previous
networks, and 76 per cent felt that the Enterprise Europe Network did not leave any gaps
in service delivery that were previously covered by the former networks. The services are
directly relevant to the wider enterprise and innovation policy objectives.
To what extent does the network provide information to the Commission on emerging
issues, needs and requirements, and how are these taken into account?
The Enterprise Europe Network has kept open important channels of communication with
the European Commission such as previous EIC participation in the EC‟s Interactive Policy
Making tool through the SME feedback process. However this remains the least well
developed element of the Network activities.
Recommendations:
The services provided by the Enterprise Europe Network should be kept under review in
case new needs or issues emerge as a result of current economic developments, or a
refocusing of effort is required.
The feedback element of the Network activities should be further developed. In particular
the Network should be kept informed of the outcomes of the feedback so that this in turn
can be promoted to the SME stakeholders. This will demonstrate the relevance of the
system and encourage participation.
7.2.3 The relevance of the Financial Instruments
To what extent are the programme's objectives pertinent to the needs, problems and issues it was designed to address?
How could the relevance of the programme be maximised?
EIP has been designed to create and develop framework conditions for innovation and
competitiveness. There is considerable empirical evidence to demonstrate a strong link
between the availability of finance and a country‟s competitiveness. A core objective of the
programme therefore, is to facilitate SME access to external finance. Intervention is based
on the belief that SMEs in general, and technology-based companies in particular, are a
key source of innovation, job creation and productivity growth. However, the ability of SMEs
to access external finance is hindered by persistent market failures which create funding
gaps. This is supported by evidence presented in the 2007 SME Observatory survey -
according to which limited access to finance was a constraint for 21 per cent of European
SMEs. More recent evidence, collected in the wake of the credit crisis, suggests that SMEs
are facing an increasingly tight squeeze on their credit, as banks, the main source of credit
for smaller firms, become more risk averse. According to the data gathered by

114
Eurochambres, the association of European chambers of commerce, some 30 per cent of
EU SMEs are facing liquidity problems92
and this is threatening their survival.
What is the identified need and how have the financial instruments been designed to meet this?
The financial instruments supported by EIP and its predecessor programme, the Multi
Annual Programme for Enterprise and Entrepreneurship (MAP) are underpinned by a
strong market failure rationale, addressing the financing constraints faced by start-up and
growing SMEs across the EU. Moreover, EIP financial instruments represent an innovative
approach to addressing market failures in SME financing. The financial instruments operate
on a commercial basis and are designed to promote good practice and professional
standards among Financial Intermediaries and Venture Capital (VC) fund managers by
leveraging the expertise of the European Investment Fund (EIF). The programme is a test-
bed for launching new and innovative instruments (such as the securitisation window and
capacity building instruments) that can be piloted through the programme and subsequently
scaled-up or adopted by other EU, national or regional programmes or schemes.
Importantly, EIP financial instruments are not designed to operate as „top-ups‟ for existing
European, national or regional financing schemes; but rather seek to achieve
demonstration effects. Given the commercial focus of the financial instruments, the
geographical take-up of financial instruments is indicative of the institutional and operational
capacity of financial institutions in a particular Member State context. For example, the ETF
Start-up facility covers ten Member States – the limited take-up reflecting the under-
developed nature of VC markets in the remaining MS. This raises the question whether new
EIP financial instruments (and in particular, the VC based instruments) could be designed in
a way that supports the development of financial markets through greater incentivisation or
more flexibility in risk sharing arrangements. This issue could usefully be explored through
the CIP Interim Evaluation.
The financial instruments comprise a portfolio of debt (loan window), equity (GIF) and
hybrid instruments (equity window) to cater to a range of financing needs of SMEs at
different stages of their development and for different levels of financing (ranging from as
low as EUR 3,000 to almost EUR 3 million).
How have the needs changed over the period? Have the financial instruments responded to the changes? Are they able to respond to any future changes?
EIP offers a mix of pro-cyclical (venture capital) and counter-cyclical (guarantees)
instruments which allows for responsiveness to changing market conditions; flexible design
permits adaptability to local conditions; and, a global budget (with the possibility to transfer
resources easily between different instruments facilitates absorption and the maximum
utilisation of available funds.
EIP instruments are a continuation and evolution of MAP instruments. For example, the
SMEG Loan window under EIP is more flexible as compared to MAP as it allows lending for
both investment and working capital purposes (under MAP, only loans for investment
purposes were eligible) . Similarly, the GIF instrument is more flexible than the ETF Start-up
facility in relation to the criteria for investment in SMEs (for example, it allows investments
in companies older than five years in certain industries such as life sciences). Moreover,
92 “Giving SMEs the credit they need”, The magazine of Enterprise Policy, 12.02.2009
http://ec.europa.eu/enterprise/e_i/news/article_8750_en.htm
115
GIF2 was created to increase the supply of development equity for innovative SMEs in their
expansion stage and to create an exit market for seed/ early stage Venture Capital funds.
Recent economic developments raise questions about the underlying intervention logic for
the financial instruments. On one hand, the credit crisis has resulted in a sharp fall in
availability of financing for SMEs; on the other hand, SMEs are facing a „demand shock‟ as
consumers cut back spending in the face of an economic downturn and mounting job
losses. However, the scale of EIP financial instruments is small relative to reductions in
availability of finance; and accordingly, EIP‟s main focus is not and should not be on crisis
management.
In order to maximise European Added value, it is important for the EIP to support and
enhance the capacity of EU SMEs to deal with the longer term challenges such as climate
change and global competition. The underlying intervention strategy of the financial
instruments remains valid and the evidence of this evaluation points to the need for EIP to
place greater emphasis on risk-capital and hybrid instruments (as compared to purely debt
based instruments) to support the financing needs of innovative SMEs with high growth
potential.
The Commission should undertake research to examine the scope for introducing specific
measures designed to facilitate the supply of angel finance and to assess the relevance of
new instruments such as venture debt in the context of the financing needs of SMEs.
Finally, the Commission should also re-assess the rationale for continuing the micro-credit
window in future programmes, considering that it has only been taken-up by six MS and
that it is more geared towards social objectives . It is important that the programme‟s scarce
resources are focused on instruments that support the core objectives of competitiveness
and innovation by targeting companies with high growth potential. Arguably, micro-credit
schemes can be more efficiently and effectively delivered through other EU funding streams
such as European Regional Development Fund (ERDF) or national and regional initiatives.
Is there overlap/ interplay between EIP financial instruments and other publicly / privately
funded instruments? Or, what is the degree to which particular markets are not met by them?
The relevance of the EIP financial instruments will be maximised if they are complementary
to and provide lessons for the wealth of other public sector support for SME finance. In this
respect, the evaluation evidence suggests a risk of overlap between ERDF programmes
managed by DG Regional Policy and EIP in the area of access to finance. The 2007-13
Structural Fund Regulations place significant emphasis on the use of Venture Capital and
Loan Fund (VCLF) instruments including the introduction of specific joint initiatives with EIF
such as the Joint European Resources for Micro and Medium Enterprises (JEREMIE) and
Joint Action to Support Micro Finance in Europe (JASMINE). Member States have allocated
over EUR 3 billion of ERDF to venture capital funds over a seven year period (in addition to
resources allocated to other financial instruments such as micro-credit schemes). This shift
in ERDF emphasis could potentially result in a situation where different EU funded schemes
are competing with each other at various levels (at the level of deal allocation as well as the
level of SME financing) and potentially crowding-out private sector activity. Over the course
of this evaluation, progress has been made to enhance joint working and policy
coordination between various DGs and the EIF. A procedure with regular consultations has
been established between DG Enterprise and Industry, DG Economic and Financial Affairs,
DG Regional Policy and the EIF to ensure that there are no overlaps or loss of potential
synergies and that the Structural Funds and EIP operate in a complementary manner. It is
now critical that this leads to the introduction of a clear and visible deal allocation policy by

116
the EIF. The deal allocation policy should set out the criteria to be applied by EIF in
allocating deals to its several mandates.
In what ways do the financial instruments influence policy?
Given the credit crisis, the widespread perception that financial institutions, particularly
private banks have through their behaviour been a prime contributor to the crisis and the
radical re-appraisal of public policies (from bail outs to initiatives to stimulate demand and
coordinated international responses) it is especially difficult to judge the effects of EIP
financial instruments on policy. However, the following can be said:
The scale of EIP financial instruments is small relative to overall levels of funding
and indeed to the scale of reductions in availability of finance (from private
suppliers) that have occurred as a result of the crisis.
The rationale of the EIP to help generate a set „menu‟ of alternative means of
accessing finance and stimulating the development of financial markets remains
valid.
The notion of public sector loan guarantees is in very good currency but not so
much as a means of „filling gaps‟ but as a means of stimulating the economy
because of the „market failures‟ of banks that have led them to withdraw from
lending in some Member States.
Recommendations:
EIP Financial Instruments‟ main focus is not and should not be on crisis management. The
focus should be on responding to the longer term challenges facing Europe (such as
climate change and increasing global competition) by enhancing the innovation capacity of
European SMEs.
The Commission should consider the case for re-focussing EIP (and future programmes)
towards risk-capital and hybrid instruments. Specifically, the Commission should:
Monitor the supply of early-stage venture capital to innovative firms with high
growth potential and take appropriate action in case of any shortfalls;
Re-assess the rationale for continuing micro-credit window in future programmes;
Examine ways of stimulating the supply of angel finance. In doing so, consideration
should be given to whether it is more appropriate to support business angel activity
at a national or a regional level via ERDF programmes or whether it should be
supported via EIP;
Commission research to examine the scope and relevance of new financial
instruments such as venture debt (in addition to or in place of existing quasi-equity
instruments supported through SMEG/ GIF).
Finally, the Commission should encourage EIF to develop a clear and visible deal allocation
policy for its different mandates (EIP, JEREMIE, etc.).

117
7.3 The efficiency of EIP
To what extent are the desired effects achieved at a reasonable cost (including the burden on participants, beneficiaries, stakeholders)?
The evidence of this evaluation indicates that the EIP activities are being implemented at
reasonable costs without excessive burdens on participants, beneficiaries and
stakeholders.
What aspects of the EIP are the most efficient or inefficient, especially in terms of resources that are mobilised by stakeholders during the different phases of the process?
It is difficult so far to judge the relative efficiency of different aspects of the EIP. The
anticipated costs and returns appear efficient. However, it took some time to put in place
the administrative arrangements for the financial instruments and, with the benefit of
hindsight the merger of the preceding networks to form the Enterprise Europe Network
could have been achieved at less cost relative to desired effects if the IT tools had
functioned correctly earlier.
Recommendation:
Annual Implementation Reports should include details of actual expenditure to improve
transparency and to provide a basis of for evaluation of efficiency.
Future Annual Implementation Reports should provide an appropriate breakdown of
expenditure for direct business support actions and other EIP actions. This would facilitate
cost effectiveness analysis of EIP business support activities in relation to other EU or
national benchmarks.
7.3.1 The efficiency of the Enterprise Europe Network
To what extent are the desired effects achieved at a reasonable cost (including the burden on participants, beneficiaries, stakeholders)? To what extent have the human resources (in terms of quality and quantity) and financial resources been appropriate for an efficient application of the management methods chosen for the various types of programme?
Given the level of leverage achieved by the Enterprise Europe Network funding structure,
the Network is achieved at a level of cost to the EU that is reasonable. The level of human
resources involved in the management of the programme reflects a saving on the previous
situation, and appears to be adequate for the programme as implemented. There were
resource constraints in some areas during the transition period. However, this appears to
have been an issue of timing and distribution rather than overall resource levels.
There are differences in the funding ratios between the two previous networks and the
Enterprise Europe Network. However, in practice the actual level of funding under the
previous and current regimes was generally less than the maximum provided for. Until the
new network has been operational for a slightly longer period it will not be possible to
compare actual costs with actual results and thus make judgements on efficiency at that
level.
What are the costs of the network to the Commission, the host structures and network partners and to beneficiaries? Can these be benchmarked against other networks? How have costs changed over time (specifically have there been any gains as a result of the combination of the networks)?

118
According to the participants, the Enterprise Europe Network carries out the similar levels of
activities as the previous two preceding networks. This view was substantiated by the
findings of the case studies. The IRCs tended to deliver services „face to face‟ whilst the
EICs used a range of delivery mechanisms. The Enterprise Europe Network uses all types
of service delivery mechanisms as appropriate.
In terms of staff levels (FTE), there has been a saving of 16%. Financial savings may also
have been made through the change in balance of the staff between permanent
staff/Temporary Agents and Contract Agents, which can be assessed once the new system
has been running for enough time.
A major saving has been achieved under the new structure with the change of the
contracting arrangements to Framework Partnership Agreements for periods of seven
years, with Specific Grant Agreements, running for three years. These procedures have
generated significant savings through the reduction in contracting costs for the EU and for
the Network partners.
To what extent does the new method of management improve efficiency as compared with the previous system?
The design of the Enterprise Europe Network addressed some of the issues relating to the
previous multiplicity of networks and the opportunities for synergy. However, there remains
some overlap with the Seventh Framework Programme (FP7) National Contact Points
(NCPs), because Enterprise Europe Network shares the objective of promoting SME
access to the RTD Framework Programme. This has been identified as an issue and there
is a process of cooperation in progress.
The implementation of Enterprise Europe Network in the Member States has been
undertaken in a flexible way in order to capitalise on existing structures and relationships.
Comparisons with the previous structures are difficult. The partners had a free hand in
defining the internal structure of the networks. While many of the members of the previous
networks are now part of the new network, they have been joined by many new partners.
This should extend the range of resources available to provide the services of the
Enterprise Europe Network.
Exchange of information and best practice is important and had been identified as an area
where there was scope for improvement in the previous networks, particularly the IRC
network. The Enterprise Europe Network has undertaken major work in this area through a
series of working groups, and the annual conference. As some of these activities had
declined during the period between the end of the MAP and the launch of the Enterprise
Europe Network, this renewed activity should address these issues within the Network.
To what extent has the transition to the new management methods been efficient?
The transfer of the networks involved a large number of activities, many of which had to be
carried out simultaneously. These included: close out of the preceding networks including
the processing of all final payments; calls for proposals for the new network consortia,
including drafting and publication of calls, assessment of offers, contracting procedures;
closing down of the technical assistance contracts, take-over of tools and procedures,
processing of final payments; transfer of responsibilities to the EACI including amendment
of the legal base, establishment of new units within the EACI and staff recruitment; merging
of the two management systems and IT tools and the development of new network tools;
identification of monitoring indicators and success criteria; development of new “corporate
identity” for the Enterprise Europe Network; and, the launch of the network.
119
Certain of these activities were still under way during the course of the interim evaluation, in
particular the roll out of the new corporate identity, the development of the performance
indicators, the development of the IT tools, and the staffing up of the EACI and the transfer
of activities. During the process of the transfer of responsibility to the EACI there was a lack
of clarity as to the relevant contact points that led to confusion and frustration among the
network partners. Now that the transfer has been completed this issue should be resolved.
However, there is a need to clarify some of the inevitable grey areas between the policy
responsibility of the Commission and the implementation role of the EACIMajor difficulties
stemmed from the delay in implementation of the IT tools. This led to: reductions in service
quality, some loss of clients due to the diminishing credibility and reputation; and‟ difficulties
regarding the fulfilment of the contractual monitoring obligations towards the Commission.
At the same time, the Enterprise Europe Network members understand the anticipated
benefits of the merger of the predecessor networks and welcome the single network idea.
Following the transition period there is a strong likelihood of effective cooperation.
To what extent do the new contracts for the Enterprise Europe Network increase efficiency of participants?
The results of the survey of network partners highlighted a perceived increase in the future
reporting burden. This perception was influenced by the delays in implementation of the
support and reporting tools.. This was at odds with the responses on other aspects of the
service which generally signalled improvements and thus, even allowing for a degree of
“frustration bias” should be taken as a signal that this is an area that merits careful follow-
up. If the perception persists once the network has had the opportunity to become
accustomed to the new arrangements and to actually carry out its reporting requirements
then the issue will need to be addressed, since one of the objectives of the Enterprise
Europe Network was to streamline procedures.
What activities represent good value for money? Which services provided by the network are considered the best value for money? Is there scope for improving efficiency of the Enterprise Europe Network?
When these questions were agreed it was anticipated that sufficient progress would have
been made and adequate data would have been available. However, in practice it is so far
too early to identify within the Enterprise Europe Network portfolio which elements are the
most efficient or represent good value for money. This is because of a lack of reporting data
and because the network has not been operating at maximum efficiency until very recently.
However, one of the achievements has been the development of the new performance
monitoring system for the network, with 50 indicators encoded in the IT system and 8
defined performance indicators of which 7 are drawn from combinations of these data and
one from a client survey. Given the range of activities of Enterprise Europe Network, the
changing needs and demands of SME clients and the varying contexts within the EU there
will be a continuing need to review efficiency and learn from the experience of Network
participants.
What elements of the service require most investment (money/people/time)?
The most challenging aspects of the Enterprise Europe Network services to deliver are:
international partner search; innovation support; and, assistance with international business
regulation and law. The most resource intensive activities are international partner search
followed by training, events and preparation of applications for funding. The individual
Network members are best place to judge the areas where investment is required.
However, there is a general trend towards the needs of SME to become more sophisticated
as basic information is becoming available to them at lower cost. It can be anticipated that
the Enterprise Europe Network will need to evolve in line with this trend.
120
What is the level of leverage of the service (co-financing)?
The key aspect of leverage is the involvement of a large number and wide range of
organisations at national regional and local levels that are close to the client group. It is
important that the leadership and management arrangements of the Enterprise Europe
Network ensure that this commitment and leverage is maintained and that it is a catalyst for
the Network generating added value, rather than being seen solely as an EC service.
Recommendations:
As the formal reporting cycle has been extended to 18 months to reduce the reporting
overhead, it is all the more important to use continuous monitoring data effectively in order
to steer the Network.
The increasing complexity of information sought by SMEs should be recognised and
continued to be taken into account in the future management of the Network.
If in future it is decided to change the management/administration structure of the
programme, the handover process should be more effectively carried out and specific
provision made for this. Some flexibility in resources for the handover period should also be
provided.
The documentation of all IT systems should be maintained and dependence on specific
contractors should be avoided, to ensure future problems can be minimised.
7.3.2 The efficiency of the Financial Instruments.
What are the costs of managing, administering and operating the financial instruments and whether the resources used to operate the financial instruments could be used more efficiently to produce similar results at lower costs? More specifically, what is the rate of return on each financial instrument?
The financial instruments are efficiently managed by the whole delivery chain (EC, EIF, FI).
A review of the contractual documentation (such as FMA, guarantee policy etc.) relating to
the financial instruments indicates that they have appropriate legal and management
structures that provide a suitable basis for the strategic and operational management of EU
funds. This is in large part because the EIF is an established player with considerable
relevant experience and expertise. They are an efficient form of intervention because they
are implemented on a commercial basis and target financially viable SMEs. The average
cost (to EU budget) of assisting an SME through MAP financial instruments is estimated to
be EUR 2,127 and the cost of creating or safeguarding a job is estimated to be in the range
of EUR 1,672. Although, the actual costs are expected to be much lower if the revenues
generated by the ETF Start-up facility are factored in.
By the end of 2008, The ETF Start up Facility under the G&E initiative generated revenue of
EUR 61.6 million. Since, the net asset value currently held is equal to EUR 44 million, it is
expected that the entire budget invested will be made available.
As for the SMEG facility the actual losses have so far been lower than expected. But this
could change in the coming months and years.
121
What are the actual costs to intermediaries of administering and operating the financial instruments?
The costs of financial intermediaries (marketing support, collection of information and
technical support) seem commensurate with their activities. The application and reporting
requirements were however, seen to be burdensome by SMEG financial intermediaries and
imposed additional costs in terms of time and resources. Financial intermediaries have to
adapt their databases to collect additional information (such as employment data which is
not typically collected by lenders) and report to EIF on a quarterly basis which requires
additional staffing resources. However, with the exception of the collection of employment
data (currently collected on an annual basis for the MAP Loan Guarantee Scheme;
although reduced to three employment surveys over a seven year period under EIP), which
may be better collected through direct contacts with the SME beneficiaries (through SME
surveys undertaken as part of programme evaluation), the reporting requirement are not
onerous and it is important that the FIs are fully accountable for the publicly supported
financial instruments in their charge.
What are the costs to the SMEs (for reporting collateral, applications made etc)?
There is no evidence that SMEs incur additional costs specifically associated with these
financial instruments. Indeed, the SMEG facility offers free guarantees, which is an added
benefit of the scheme for SMEs.
How can the efficiency of the financial instruments be improved?
There is scope to improve the efficiency of the financial instruments by speeding-up the
application process and reducing the reporting requirements. The turnover and employment
data provided by SMEs is often not accurate as they are not willing to share it and is difficult
for financial intermediaries to collect (and validate) these data on a regular basis. A more
efficient method for estimating the impact would be to carry out a detailed beneficiary
survey as part of evaluation work. However, such evaluation activity should be built into the
programme development and implementation process.
Recommendations:
There is scope to improve the efficiency of the financial instruments by speeding-up the
application process and reducing the reporting requirements. Specific recommendations in
this regard are:
Application process: The Commission should review with the EIF how the processing of
financial intermediaries‟ applications can be streamlined.
Reporting requirements: The reporting requirements for financial intermediaries should be
reviewed in parallel with improving data collection and monitoring arrangements so as to
improve the basis for future evaluation work. A distinction should be made between
financial reporting (strict requirements for accountability purposes) and statistical reporting
(such as SME employment, sector etc. which can be more efficiently collected through
programme evaluations). Requiring beneficiaries to contribute to follow up surveys would
be one very useful way of gaining additional information on the impact of financial
instruments. Having e-mail addresses could mean that a comprehensive EU-wide survey
could be undertaken in a cost-effective manner.

122
7.4 The effectiveness of EIP
To what extent have the relevant annual work programmes been designed to effectively contribute to the objectives they were designed to address – i.e. is the intervention logic system of the programme functioning effectively or does it need further refinement – and if so how should this be implemented?
The Annual Work Programmes reflect the objectives of the EIP. There are however, some
weaknesses in the intervention logic of individual EIP actions. In particular there is a need
to more clearly indicate the links between the activities and the anticipated effects on
competitiveness and innovation at the EU level. The credit crisis itself raises questions
over the intervention logic that was developed during and following a period of relatively
good and stable EU economic performance. The Annual Work Programmes reflect the
objectives of the EIP. There are however, some weaknesses in the intervention logic of
individual EIP actions. In particular there is a need to more clearly indicate the links
between the activities and the anticipated effects on competitiveness and innovation at the
EU level. The credit crisis itself raises questions over the intervention logic that was
developed during and following a period of relatively good and stable EU economic
performance.
How far do the management methods and their implementation ensure a high standard of service in the following areas: targeting of SMEs and access for SMEs to programmes, monitoring of results, involvement of stakeholders, exchange of information (in particular methods of best practice) between actors?
The management methods that have been adopted are appropriate and build on the
experience of the Commission Services whilst making use of the potential of the Executive
Agency arrangements. The current monitoring and reporting arrangements for the financial
instruments do not provide a good basis for subsequent evaluation. There would be
benefit in the systematic follow up of SMEs that benefit from financial instruments so that
changes in employment levels could be monitored accurately and questions relating to
„deadweight‟ market displacement, innovation, and multiplier effects could be asked. Such
data would be different from the information collected by financial intermediaries.
Stakeholders have been involved appropriately and the arrangements for exchange of
information on best practice are in place but need to be strengthened in the area of venture
capital.
What is the added value of the programme for stakeholders? Have there been any unintended effects on stakeholders and, if so, how can the programme take these into account?
The EIP is a pillar within the CIP Framework Programme and an umbrella for a diverse set
of activities. Some components of the EIP and in particular the Enterprise Europe Network
have the potential to have an EU brand and presence far greater than the EIP.
123
Recommendations:
The Commission should consider developing a standard set of monitoring indicators
(outputs, results, outcomes and impacts) to record and report programme progress. The
Impact Assessment93
contains a set of monitoring indicators which should be reviewed,
updated and applied. In the work programmes relevant indicators and expected results
should be included. This would also provide the basis for future evaluations.
Future implementation reports should give a more expressive review of the whole
programme and an overview of all completed actions. Furthermore, the Implementation
report should present outcomes by means of performance indicators (participants,
deliverables, implementation) and use quantitative indicators where possible (number of
meetings, number of participants and Member States represented, number of reports,
means of distribution and edition, etc.).
7.4.1 The effectiveness of Enterprise Europe Network
To what extent have the relevant annual work programmes been designed to effectively contribute to the objectives they were designed to address – i.e. is the intervention logic system of the programme functioning efficiently or does it need further refinement – and if so how should this be implemented?
The activities undertaken by the Network address the issues as set out in the Programme
logic. However, under the current economic conditions there is a need to be able to
respond flexibly to the changing needs of SMEs. The design of the Network permits this,
both through the nature of the participants in the consortia, and the advisory/governance
structures of the Network.
How far do the management methods and their implementation ensure a high standard of service in the following areas: targeting of SMEs and access for SMEs to programmes, monitoring of results, involvement of stakeholders, exchange of information (in particular methods of best practice) between actors?
The governance structures of the network are inclusive and can ensure that these issues
are addressed. The combination of the networks specifically addressed the issue of
perceived weakness of the IRCs in having too narrow a focus and thus not reaching the full
spectrum of potential beneficiary organisations, and the nature of the host organisations
and consortium members brings the opportunity for a continued high quality service.
Reporting remains an area of weakness. The previous networks provided a great deal of
data on their activities but this was not held in a consistent or accessible format and it
seems that much of the potential information has not been exploited. Under the Enterprise
Europe Network much effort has been devoted to the issue of reporting, through the
definition of indicators and the 50 data items to be collected.
The reporting period has been changed from 12 to 18 months in order to reduce the
reporting burden. However, this has not been recognised as an improvement by the
beneficiaries who, if anything, feel the burden has increased. Clearly there is a mismatch
here to be addressed. The extension to 18 months also means that there is a lack of
93 p34 Commission Staff Working Document, Annex to the Proposal for a Decision of the European
Parliament and of the Council establishing a Competitiveness and Innovation Framework Programme (2007-2013), COM(2005) 121

124
information, not only for this evaluation but also for the steering of activities in uncertain
times.
To what extent do the activities meet the requirements of users as set out in the needs statements and the objectives hierarchy? What feedback mechanisms exist?
Assessing the effectiveness of the Enterprise Europe Network at this stage would be
inappropriate given its only recent establishment and the delays in the provision of some of
its key operating tools. However, it is possible is to assess the extent to which the issues
identified for the previous networks have been addressed in the design and implementation
of the Enterprise Europe Network. In the MAP evaluation it was suggested that the services
of the IRC were perhaps too specialised for many SMEs. At the same time the work they
did made a significant impact on technology transfer in Europe. The Enterprise Europe
Network was designed to consolidate services and create a balance that was not to the
detriment of the specialised and high impact activity. It is too early to say whether this has
yet been managed under the Enterprise Europe Network but judging by the number of
organisations continuing to provide specific „module B‟ functions, the balance is in place.
Do the activities of the network as set out in their contracts and as realised meet the objectives set out in the EIP work programmes?
The work programmes of the Enterprise Europe Network reflect the overall objectives of the
EIP. The activities meet the requirements of users as set out in the needs statements and
the objectives hierarchy. Whether this is reflected in the implementation cannot be judged
until the first activity reports are received. These cover an 18 month period and have not yet
been received.
What can be done to make the network more effective? Are there any aspects/means/actors that render certain aspects more or less effective than others, and if there are, what lessons can be drawn from this?
The most significant barrier to the effectiveness of the Enterprise Europe Network at all
levels, from management to operation on the ground, was the absence of the integrated IT
tools. The significance of the problem is a reflection of the importance of the tools to the
network partners, and the potential they have to facilitate or hinder the effective functioning
of the network.
To what extent has eco-innovation supported or will it be able to support progress towards the goal of sustainable development through reducing impacts on the environment or achieving a more efficient and responsible use of natural resources?
Almost all network partners are involved in information related tasks. There is however a
clear level of specialism exhibited within the networks highlighted by the fact that partners
refer on to other partners, especially in areas such as Eco-Innovation and IPR for example.
The effects of network services relevant to eco-innovation cannot yet be judged.
How is service quality defined and measured? What mechanisms are in place to ensure the quality of the centres? What has been the effect of the changes in the management structure?
The network has to ensure a high standard of service with regard to: targeting of SMEs;
access to programmes for SMEs; monitoring of results; involvement of stakeholders; and,
exchange of information and best practice. The network members have close links to
SMEs. The implementation of the SGA is monitored by the EACI. Progress has been made
with the plans for the monitoring of results with the implementation of the work from the
quality working group on the performance indicators. The EACI is implementing further
quality assurance mechanisms. Performance indicators, satisfaction surveys and codes of
practice will be delivered in early 2009.

125
Where does the European added value lie in the network activities? Does the added value of Enterprise Europe Network vary between stakeholders/beneficiary types?
The added value of the Enterprise Europe Network lies in two areas: the European added
value provided through the international dimension, which ensures that beneficiaries can
benefit from the knowledge of the wider network, especially in the field of international
partner search in its various forms; and, the bringing together of the consortium partners at
the national and regional level that contributes to the defragmentation of the European
advisory services and the implementation of the “no wrong door” policy. The wide range of
services provided also adds value.
Recommendations:
The results of the monitoring of the Network should be widely used. In particular they
should enable the Network to focus its resources on areas of specific need as identified
through these new monitoring mechanisms, and to respond to emerging issues.
The Commission and the Agency should further clarify the boundaries of responsibility for
the animation-related activities of the Network so that the partners have a clear interface.
This is still not the case. This division of work need not be apparent to the Network partners
who should have a single consistent point of entry. This means there needs to be a high
level of co-operation and trust between the Commission and the EACI.
7.4.2 The effectiveness of Financial Instruments
What was the impact (both gross and net) of the Financial Instruments (i.e. taking in account estimated finance to SMEs that would have happened in the absence of the MAP and Growth and Employment Initiative)?
What were the gross and net quantitative effects (of financial instruments under MAP and G&E), taking into account the indicators as specified in Annex II 5 to Decision 1639/2006, in particular, has a appropriate number of SMEs been reached and have adequate leverage effects and cost benefits been achieved?
It is too early to judge the effects and impacts of the EIP financial instruments; however,
evidence is available for MAP financial instruments. Over, 234,000 SMEs across Europe
have so far, received financing through MAP financial instruments – this represents 6 per
cent of the EU SMEs facing a financing constraint94
. It is estimated that by the end of 2008,
MAP financial instruments had created or safeguarded over 297,000 gross jobs in
beneficiary firms. Most were a result of loan guarantees.
39 VC funds have been set-up with investment from the G&E initiative and MAP.
Collectively, these funds have invested in over 500 companies and this number is expected
to rise as a number of MAP funds are still in their investment phase. The leverage effect on
VC investment was 1 to 4.8 for G&E and 1 to 6.5 under MAP. MAP guarantee schemes
achieved a significantly higher leverage effect of 1 to 67, resulting from the risk-sharing
arrangements between financial intermediaries and the use of cap rate to limit EU
exposure.
94 According to eurostat statistics, there were 19.6 million SMEs in Europe in 2005. According to the
SME Observatory survey (2007), 21 per cent of EU SMEs (or 4.1 million) reported a financing constraint. MAP has reached almost 235,000 SMEs – covering 6 per cent of SMEs reporting a financing constraint.
126
The SMEG facility under G&E, has provided guaranteed loans to 136, 860 SMEs in Europe.
An additional 233, 892 European SMEs received financing through the SMEG facility under
MAP (which also assisted 313 companies outside EU – in other participating countries).
The Equity Guarantee window was little used. It only operated in two countries – France
and Austria. It guarantees larger investments for fast-growing high-tech companies, which
means that the target group is similar to that of Venture Capital funds.
Which qualitative added-value has been achieved regarding the supported Venture Capital funds?
The EIF has often had a catalytic effect in the establishment of early stage VC funds
making it possible to attract more investors and thereby allowing funds to invest larger
amounts, to have more resources available for follow-on investments in selected SMEs and
to achieve a more commercially viable size. EIF‟s due diligence process is seen by market
players as a “quality stamp” that adds credibility to the VC fund and acts as a catalyst for
raising funds from private investors. In several cases, VC funds would not have
materialised unless EIF had not made an early commitment to the fund. EU-backed VC
funds have had demonstration effects.
There is scope for enhancing the added value of VC instruments through organising an
investors club and other similar platforms for creating networking opportunities. The added
value of VC funds also accrues at the level of the SME. The appointment of a non executive
director, financial advice and specialist business advice are the most appreciated sources
of support from the external equity investment.
What is the creditworthiness of SMEs supported through the financial instruments?
An assessment of the creditworthiness of SMEs supported through the financial
instruments would not have been possible within the scope of this evaluation as such an
analysis would require detailed financial information (financial accounts such as balance
sheets, credit ratings where available, business plans) for a representative sample of SMEs
Consultations with SMEG FI suggest that prudent screening and risk assessment criteria
are being applied before financing (such as credit scoring, assessment of viability of the
business, review of business plan etc). However, the views expressed cannot be accepted
at face value. The current credit crisis has exposed major weaknesses in banks‟ lending
practices and the extent to which this is applicable to SMEG intermediaries will become
clear in the coming months and years.
How can the use of the Seed Capital Action be further developed?
The seed capital action was only taken up by 2 funds under MAP and is being considered
to be dropped under EIP due lack of interest among IFIs, including the EIF.
To what extent has eco-innovation been addressed in the implementation of the financial instruments to date?
As part of the survey, SMEs were asked to indicate if the guaranteed loan or external equity
investment had allowed their business to take-up or develop environmentally friendly
products or technology for their corresponding sector.

127
These responses are indicated in the following table. Survey results show a majority of the
VC backed SMEs were taking-up eco innovation.
Take-up of Eco-innovation by Beneficiary SMEs
Source: GHK Business Survey (2008/09)
Recommendations:
Research should be commissioned to improve understanding of the underlying causes for
weaknesses in VC exit markets and to develop recommendations for tackling issues that
are policy tractable.
The Commission should liaise with EIF to develop initiatives aimed at facilitating networking
between VC fund managers.
7.5 Information and awareness of EIP
How effectively has information about the availability of the programme instruments and the results and impacts of actions been transmitted to potential stakeholders and beneficiaries?
The EIP itself does not have a strong brand as it is one pillar of the CIP Framework
Programme. It is too early for the results and impacts to have been communicated. The
question of diffusion of information on the programme can best be addressed through a
consideration of the main components of the EIP.
7.5.1 Information and Awareness of Enterprise Europe Network
What are the mechanisms in use?
The Enterprise Europe Network has corporate identity. Both the Commission and the
network partners have websites
How have they changed since the amalgamation?
There was the lack of a corporate identity at the time of the launch of the Enterprise Europe
Network. At the time of the network partner survey (September/October 2008), only 43 per
cent of respondents had promoted and made the Enterprise Europe Network “brand” highly
visible and within their organisation. Some 83 per cent had a website up and running but
the links from Commission website were often unsatisfactory. With the distribution of the
new corporate identity and the implementation of the graphic charter the awareness should
have improved. The network websites demonstrably improved during the course of the
interim evaluation.
What mechanisms are in place to monitor the transmission of information (both within and outside the network) and the potential impact?
128
Now the network is established it will be worthwhile to examine the behaviour of web users
which will provide more information on user behaviours and referring sites. Europa has the
capacity to provide the requisite statistics.
Where does the European added value lie in the network activities? Does the added value
of Enterprise Europe Network vary between stakeholders/beneficiary types?
The added value of the Enterprise Europe Network lies in two areas: the European added
value provided through the international dimension, which ensures that beneficiaries can
benefit from the knowledge of the wider network, especially in the field of international
partner search in its various forms; and, the bringing together of the consortium partners at
the national and regional level that contributes to the defragmentation of the European
advisory services and the implementation of the “no wrong door” policy. The wide range of
services provided also adds value.
Recommendations:
The efforts to increase the visibility of the Enterprise Europe Network need to be maintained
and several minor issues such as the absence of basic web links need to be addressed
urgently to avoid a loss of momentum.
The promotion of the Network as a vehicle for information to and from SMEs within the
Commission needs to continue as this remains an area of weakness. Opportunities to build
and further develop links with other EU networks should also be sought.
7.5.2 Information and awareness of Financial Instruments
What is the level of awareness about the financial instruments among potential stakeholders and beneficiaries?
Under MAP, the visibility of EU funding was limited for FIs, and low for SMEs. Fifty four per
cent of the beneficiaries of the loan window and 70 per cent of the micro-credit beneficiaries
were not aware that their loans/ borrowing was guaranteed by the EU. This is despite the
rules imposed on financial intermediaries regarding publicity of EU funding (for example,
through specific mention of the EC role in contracts with final beneficiaries). The visibility of
EU funding was very low for VC funds and limited for SME beneficiaries supported through
MAP.
CIP introduces additional requirements to tackle the issue of low visibility.
A related issue that came up during the course of the evaluation was the perception of
Italian financial intermediaries that the programme approach to calculation of cap rate and
additionality requirements is inflexible and does not take into account the specific
characteristics of the Italian market. This appears to be an issue of communication from
EIF, as the rules under the legal framework allow financial instruments to be tailored to
specific markets and institutions. For example, the cap rate is a function of expected losses
and is uniquely estimated for each financial intermediary.
Recommendations:
To improve the overall visibility of EU funding, the Commission should introduce the
requirement of press releases in prominent local newspapers on signature of contract
between the EIF and financial intermediaries. The local press material should be prepared

129
by the financial intermediary in conjunction with EIF.
Further action to improve visibility particularly among the SME beneficiaries is not
recommended considering that SMEs are not particularly interested in this information;
additional publicity requirements (beyond those already in place) are likely to have
diminishing returns. They would also increase the cost and administrative burden for
financial intermediaries.
EIF should improve communication with financial intermediaries so that they have a better
understanding of the rules governing the financial instruments.
Related Documents