INTERGOVERNMENTAL PANEL FOR CLIMATE CHANGE (IPCC) AND ATTRIBUTION AND PREDICTION OF CLIMATE: PROGRESS SINCE THE FOURTH ASSESSMENT Kevin E. Trenberth (1) , Magdalena Balmaseda (2) , Nathaniel L. Bindoff (3) , John Church (4) , Howard J. Freeland (5) , Gary Lagerloef (6) , R. Steven Nerem (7) , Matthew Palmer (8) , Steve Rintoul (9) , Dean Roemmich (10) , Christopher L. Sabine (11) , Detlef Stammer (12) and Peter Stott (13) (1) National Center for Atmospheric Research, P.O. Box 3000, Boulder, CO, 80307, USA. [email protected] (2) ECMWF, Shinfield Park, Reading, RG2 9AX, UK [email protected] (3) CSIRO, CAWCR, ACE CRC, IASOS, U. Tasmania, Pvt Bag 80, Hobart, TAS 7001, Australia [email protected] (4) CSIRO Marine and Atmospheric Research and Antarctic Climate and Ecosystems CRC, GPO Box 1538, Hobart, TAS 7001, Australia [email protected] (5) Department of Fisheries and Oceans, Institute of Ocean Sciences ( DFO-IOS), 9860 West Saanich Road, Sidney BC V8L-4B2, Canada [email protected] (6) Earth Space Res, 2101 Fourth Ave, Suite 1310, Seattle, WA 98121, USA [email protected] (7) Colorado Center for Astrodynamics Research, Dept of Aerospace Engineering Sciences, 431 UCB, U. Colorado, Boulder, CO 80309, USA [email protected] (8) Met. Office Hadley Centre, FitzRoy Road, Exeter, EX1 3PB, U.K. [email protected] (9) CSIRO Marine and Atmospheric Research, GPO Box 1538, Hobart, TAS 7001, Australia [email protected] (10) Scripps Inst. Oceanogr., 8622 Discovery Way, La Jolla, CA 92037, USA [email protected] (11) NOAA/PMEL, 7600 Sand Point Way NE, Seattle, WA 98115, USA [email protected] (12) U. Hamburg, Bundesstraße 53. D-20146, Hamburg, Germany [email protected] (13) Met. Office Hadley Centre, FitzRoy Road, Exeter, EX1 3PB, U.K. [email protected] Abstract: The IPCC is a primary user of studies of the ocean and how it is changing. Following an introduction to the IPCC, the role of the ocean in climate is outlined, and the main findings from the 2007 IPCC assessment are described, along with outstanding issues for ocean science. The progress in addressing these issues is briefly discussed along with some recommendations for ocean observations. 1. INTRODUCTION In 2007 the Fourth Assessment Report of the Intergovernmental Panel on Climate Change (IPCC) [1], known as AR4, clearly stated that “Warming of the climate system is unequivocal” and it is “very likely” due to human activities. Since the IPCC report, nature continues to provide evidence that it is under duress with impacts affecting people and animals. Increasing rates of carbon dioxide emissions raise the spectre that future climate changes could be larger and come much quicker than IPCC suggests (e.g., [2]). The AR4 found that warming of the climate system is unequivocal based on an increasing body of evidence showing discernible physically consistent changes. These include increases in global average surface air temperature; atmospheric temperatures above the surface, surface and sub-surface ocean water temperature; widespread melting of snow; decreases in Arctic sea-ice extent and thickness; decreases in glacier and small ice cap extent and mass; and rising global mean sea level. The observed surface warming at global and continental scales is also consistent with reduced duration of freeze seasons; increased heat waves; increased atmospheric water vapour content and heavier precipitation events; changes in patterns of precipitation; increased drought; increases in intensity of hurricane activity, and changes in atmospheric winds. This wide variety of observations gives a very high degree of confidence to the overall findings. Because these changes are now simulated in climate models for the past 100 years to a reasonable degree, there is added confidence in future projections for more warming and increased impacts. Moreover, these changes in physical variables are reflected in changes in ecosystems and human health. Ocean studies played a major role in the AR4. The fundamental basis for the studies were ocean observations, their analysis and synthesis, empirical studies, ocean and coupled climate system modelling of the climate record, detection and attribution studies, and the projection of climate into the future using models. In this paper, a brief outline is given of important ocean- related findings in AR4 and the outstanding issues, followed by summary of progress since AR4 in addressing those issues. Further issues for AR5 are addressed with a focus on the implications for ocean observations and their processing. 2. THE IPCC The IPCC is a body of scientists from around the world convened by the United Nations jointly under the

Welcome message from author
This document is posted to help you gain knowledge. Please leave a comment to let me know what you think about it! Share it to your friends and learn new things together.
Transcript

INTERGOVERNMENTAL PANEL FOR CLIMATE CHANGE (IPCC) AND ATTRIBUTION AND PREDICTION OF CLIMATE:
PROGRESS SINCE THE FOURTH ASSESSMENT
Kevin E. Trenberth (1), Magdalena Balmaseda(2), Nathaniel L. Bindoff (3), John Church(4), Howard J. Freeland(5), Gary Lagerloef(6), R. Steven Nerem(7), Matthew Palmer(8), Steve Rintoul(9), Dean Roemmich(10),
Christopher L. Sabine(11), Detlef Stammer(12) and Peter Stott(13)
(1) National Center for Atmospheric Research, P.O. Box 3000, Boulder, CO, 80307, USA. [email protected] (2) ECMWF, Shinfield Park, Reading, RG2 9AX, UK [email protected] (3) CSIRO, CAWCR, ACE CRC, IASOS, U. Tasmania, Pvt Bag 80, Hobart, TAS 7001, Australia [email protected] (4) CSIRO Marine and Atmospheric Research and Antarctic Climate and Ecosystems CRC,
GPO Box 1538, Hobart, TAS 7001, Australia [email protected] (5) Department of Fisheries and Oceans, Institute of Ocean Sciences ( DFO-IOS),
9860 West Saanich Road, Sidney BC V8L-4B2, Canada [email protected] (6) Earth Space Res, 2101 Fourth Ave, Suite 1310, Seattle, WA 98121, USA [email protected] (7) Colorado Center for Astrodynamics Research, Dept of Aerospace Engineering Sciences, 431 UCB,
U. Colorado, Boulder, CO 80309, USA [email protected] (8) Met. Office Hadley Centre, FitzRoy Road, Exeter, EX1 3PB, U.K. [email protected] (9) CSIRO Marine and Atmospheric Research, GPO Box 1538, Hobart, TAS 7001, Australia [email protected] (10) Scripps Inst. Oceanogr., 8622 Discovery Way, La Jolla, CA 92037, USA [email protected] (11) NOAA/PMEL, 7600 Sand Point Way NE, Seattle, WA 98115, USA [email protected] (12) U. Hamburg, Bundesstraße 53. D-20146, Hamburg, Germany [email protected] (13) Met. Office Hadley Centre, FitzRoy Road, Exeter, EX1 3PB, U.K. [email protected]
Abstract: The IPCC is a primary user of studies of the ocean and how it is changing. Following an introduction to the IPCC, the role of the ocean in climate is outlined, and the main findings from the 2007 IPCC assessment are described, along with outstanding issues for ocean science. The progress in addressing these issues is briefly discussed along with some recommendations for ocean observations.
1. INTRODUCTION
In 2007 the Fourth Assessment Report of the Intergovernmental Panel on Climate Change (IPCC) [1], known as AR4, clearly stated that “Warming of the climate system is unequivocal” and it is “very likely” due to human activities. Since the IPCC report, nature continues to provide evidence that it is under duress with impacts affecting people and animals. Increasing rates of carbon dioxide emissions raise the spectre that future climate changes could be larger and come much quicker than IPCC suggests (e.g., [2]).
The AR4 found that warming of the climate system is unequivocal based on an increasing body of evidence showing discernible physically consistent changes. These include increases in global average surface air temperature; atmospheric temperatures above the surface, surface and sub-surface ocean water temperature; widespread melting of snow; decreases in Arctic sea-ice extent and thickness; decreases in glacier and small ice cap extent and mass; and rising global mean sea level. The observed surface warming at
global and continental scales is also consistent with reduced duration of freeze seasons; increased heat waves; increased atmospheric water vapour content and heavier precipitation events; changes in patterns of precipitation; increased drought; increases in intensity of hurricane activity, and changes in atmospheric winds. This wide variety of observations gives a very high degree of confidence to the overall findings. Because these changes are now simulated in climate models for the past 100 years to a reasonable degree, there is added confidence in future projections for more warming and increased impacts. Moreover, these changes in physical variables are reflected in changes in ecosystems and human health.
Ocean studies played a major role in the AR4. The fundamental basis for the studies were ocean observations, their analysis and synthesis, empirical studies, ocean and coupled climate system modelling of the climate record, detection and attribution studies, and the projection of climate into the future using models. In this paper, a brief outline is given of important ocean-related findings in AR4 and the outstanding issues, followed by summary of progress since AR4 in addressing those issues. Further issues for AR5 are addressed with a focus on the implications for ocean observations and their processing. 2. THE IPCC
The IPCC is a body of scientists from around the world convened by the United Nations jointly under the
United Nations Environment Programme (UNEP) and the World Meteorological Organization (WMO) initially in 1988. The IPCC’s mandate is to provide policy makers with an objective assessment of the scientific and technical information available on climate change, its environmental and socio-economic impacts, and possible response options. The IPCC reports on the science of global climate and the effects of human activities on climate in particular. Major assessments were made in 1990, 1995, 2001, and 2007. Each new IPCC report reviews all the published literature over the previous 5 to 7 years, and assesses the state of knowledge, while trying to reconcile disparate claims and discrepancies, and document the uncertainties.
Working Group (WG) I deals with how the climate has changed and the possible causes. It considers how the climate system responds to various agents of change and our ability to model the processes involved as well as the performance of the whole system. It further seeks to attribute recent changes to the possible various causes, including the human influences, and goes on to make projections for the future. WG II deals with the impacts of climate change, vulnerability, and options for adaptation to such changes, and WG III deals with options for mitigating and slowing the climate change, including possible policy options. Each WG is made up of participants from the United Nations countries, and for the 2007 assessment there were over 450 lead authors, 800 contributing authors, and over 2,500 reviewers from over 130 countries. The IPCC process is very open. Two major reviews were carried out in producing the report, and climate “skeptics” can and do participate, some as authors. All comments were responded to in writing and by changing the report. The process is overseen by two Review Editors for each chapter. The Policy Makers Summaries were approved line by line by governments. The rationale is that the scientists determine what can be said, but the governments help determine how it can best be said. Negotiations occur over wording to ensure accuracy, balance, clarity of message, and relevance to understanding and policy. The strength is that it is a consensus report but the process also makes it a conservative report. 3. THE ROLE OF THE OCEANS IN CLIMATE
The oceans cover about 71% of the Earth’s surface and contain 97% of the Earth’s water. Through their fluid motions, their high heat capacity, and their ecosystems, the oceans play a central role in shaping the Earth’s climate and its variability (as discussed by [3], [4]. The most important characteristic of the oceans is that they are wet and, while obvious, this is sometimes overlooked. Water vapour, evaporated from the ocean surface, provides latent heat energy to the atmosphere during precipitation. On average, this precipitation must be balanced by a return flow over and beneath the
ground through river and stream flows, and subsurface ground water flow. The average precipitation rate over the oceans exceeds that over land by a factor of 1.4 (allowing for the differences in areas), and precipitation exceeds evapotranspiration over land by this same amount [5]. This flow into the oceans occurs mainly in river mouths and is a substantial factor in the salinity of the oceans, thus affecting ocean density and currents. A simple calculation of the volume of the oceans of about 1335×106 km3 and the through-flow fluxes of evaporation E and precipitation P implies an average residence time of water in the ocean of over 3,000 years.
Many facets of the climate can be deduced simply by considering the heat capacity of the different components of the climate system, which includes the mass involved as well as its capacity for holding heat, as measured by the specific heat of each substance. The atmosphere does not have much capability to store heat. The heat capacity of the global atmosphere corresponds to that of only a 3.5 m layer of the ocean. However, the depth of ocean actively involved in climate is much greater than that. The specific heat of dry land is roughly a factor of 4.5 less than that of sea water (for moist land the factor is probably closer to 2). Moreover, heat penetration into land is limited by the low thermal conductivity of the land surface; as a result only the top two meters or so of the land typically play an active role in heat storage and release (e.g., as the depth for most of the variations over annual time scales). Accordingly, land plays a much smaller role than the ocean in the storage of heat and in providing a memory for the climate system. Major ice sheets over Antarctica and Greenland have a large mass but, like land, the penetration of heat occurs primarily through conduction so that the mass experiencing temperature changes from year to year is small. Hence, ice sheets and glaciers do not play a strong role in heat capacity, while sea ice is important where it forms. Unlike land, however, glaciers, ice caps and ice sheets change mass, and thus alter sea level albeit fairly slowly.
The seasonal variations in heating penetrate into the ocean through a combination of radiation, convective overturning (in which cooled surface waters sink while warmer more buoyant waters below rise) and mechanical stirring by winds. These processes mix heat through the mixed layer, which, on average, involves about the upper 90 m of ocean. The thermal inertia of a 90 m layer can add a delay of about 6 years to the temperature response to an instantaneous change (this time corresponds to an exponential time constant in which there is a 63% response toward a new equilibrium value following an abrupt change). With its mean depth of about 3800 m, the total ocean would add a delay of about 230 years to the response if rapidly mixed. However, mixing is not a rapid process for most of the ocean so that in reality the response depends on the rate of ventilation of water between the well-mixed

upper layers of the ocean and the deeper, more isolated layers that are separated by the thermocline. The rate of such mixing is not well established and varies greatly geographically. An overall estimate of the delay in surface temperature response caused by the oceans is 10–100 years. The slowest response should be in high latitudes where deep mixing and convection occur, and the fastest response is expected in the tropics. Consequently, the oceans are a great moderating effect on climate changes and greatly influence regional climate change.
Wind blowing on the sea surface drives the large-scale ocean circulation in its upper layers. The oceans move heat around through convection and advection (in which the heat is carried by the currents, whether small-scale short-lived eddies or large-scale currents). Hence ocean currents carry heat and salt along with the fresh water around the globe. The oceans therefore store heat, absorbed at the surface, for varying durations and release it in different places, thereby ameliorating temperature changes over nearby land and contributing substantially to variability of climate on many time scales.
The ocean thermohaline circulation (THC), which is the circulation driven by changes in sea water density arising from temperature (thermal) and salt (haline) effects, allows water from the surface to be carried into the deep ocean, where it is isolated from atmospheric influence and hence it may sequester heat for periods of a thousand years or more. The Meridional Overturning Circulation (MOC) involves not only the THC but also wind-driven currents. The oceans also absorb carbon dioxide and other gases and exchange them with the atmosphere in ways that change with ocean circulation and climate change and which affect the acidity of the ocean. In addition, it is likely that marine biotic responses to climate change will result in subsequent changes, for instance by changing ocean colour and penetration of sunlight into the ocean.
4. OCEAN FINDINGS AND ISSUES ARISING
FROM AR4
4.1 Key Findings From AR4 Key findings from AR4 [6] include the following: • The oceans were warming. From 1961 to 2003, global ocean temperature rose by 0.10°C from the surface to a depth of 700 m and global ocean heat content (0–3,000 m) increased at a rate of 0.21 ± 0.04 W m–2. Two-thirds of this energy was absorbed between the surface and a depth of 700 m. The AR4 reported that after 2003 there had been some cooling in the record available at that time. • Global ocean heat content observations showed considerable interannual and inter-decadal variability
superimposed on the longer-term trend. Considerable spatial structure was also present in the warming. • Large-scale, coherent trends of salinity were observed for 1955 to 1998. In general the tropics were found to be becoming saltier, especially in the Atlantic and Indian Oceans, while the mid to high latitudes were freshening, especially in the North Atlantic and Pacific. This pattern is consistent with increased moisture transport by the atmosphere from lower to higher latitudes and from the Atlantic to the Pacific. • While oceanic water masses were found to be changing, there was no clear evidence for ocean circulation changes. AR4 found it is very likely that up to the end of the 20th century, the Atlantic meridional overturning circulation (AMOC) has changed significantly at interannual to decadal time scales. But over the last 50 years, no coherent evidence in the observations for a trend in the strength of the AMOC has been found. • Ocean biogeochemistry was found to be changing. The total inorganic carbon content of the oceans increased by 118 ± 19 GtC between the end of the pre-industrial period (about 1750) and 1994 and continued to increase. However, the ocean uptake appeared to have slowed after the 1990s, consistent with the expected rate at which the oceans can absorb carbon. Ocean acidity had also increased and there was evidence for decreased oxygen concentrations in the thermocline (~100–1,000 m) in most ocean basins from the early 1970s to the late 1990s. • Global mean sea level rose from 1961 to 2003 at 1.8 ± 0.5 mm yr–1 or 1.7 ± 0.5 mm yr–1 for the 20th century but with large regional variations. The rate of sea level rise increased between the 19th and the 20th centuries. • The rise in global mean sea level featured considerable decadal variability. For 1993 to 2003, the rate of sea level rise was estimated from satellite altimetry as 3.1 ± 0.7 mm yr–1, significantly higher than the average rate for the 20th century. It was not clear whether the higher rate in 1993 to 2003 was due to decadal variability or an increase in the longer-term trend. • The AR4 found significant uncertainties in the estimates of the contributions to sea level change. For 1961 to 2003, the average contribution of thermal expansion to sea level rise was 0.4 ± 0.1 mm yr–1. It was not possible to satisfactorily account for the processes causing sea level rise. However, for 1993 to 2003, for which the observing system is much better, the contributions from thermal expansion (1.6 ± 0.5 mm yr–1) and loss of mass from glaciers, ice caps and the Greenland and Antarctic Ice Sheets together gave 2.8 ± 0.7 mm yr–1. For the latter period, the climate contributions constitute the main factors in the sea level budget, which was closed to within known errors.

4.2 Key Issues Arising From AR4
Hence some key issues emerging from AR4 with regard to oceans, discussed further below, include:
1) Is the ocean warming accelerating? In AR4, it was not possible to make a statement about this largely because of the large decadal variability in the global ocean heat content that now appears to have been partly spurious. Some of the decadal variability has since been eliminated with reprocessing of expendable bathythermographs (XBT) data to correct for fall rate errors. In addition, the sharp drop in ocean heat content after 2003 was related to Argo problems.
2) In AR4 the ocean warming was found to be strongest at the surface but also penetrated to lower depths, especially in the Atlantic. The question is why some regions were cooling? Presumably this relates to the role of natural variability, as is clearly evident in sea level variations.
3) Ocean salinities were indicated to be changing, suggesting mainly changes in (E-P), although freshening overall from melting land ice contributes in some places. Any land-ice melt contribution to freshening is too small and had not been detected.
4) Global warming from increasing greenhouse gases creates an imbalance in radiation at the Top-Of-Atmosphere (TOA) now of order 0.9 W m-2 [7]. Where does this heat go? The main sink is the ocean especially through changes in ocean heat content. Melting of land and sea ice contributes small amounts. Both changes in ocean heat and melting land ice contribute to sea level rise. Can the sea level rise changes be accounted for prior to 1993 and after 1993 (the altimetry era) including the post 2003 period (the Argo era)? Can the heat budget be more closely balanced at the same time?
5) Land ice and Arctic sea ice were noted to be decreasing, and post-2002 evidence suggests accelerated melting of the two major ice sheets of Greenland and Antarctica. Is this acceleration sustained or is it a transient?
6) IPCC estimated melting ice contribution to sea level rise was 1.2 mm/yr for 1992 to 2003. Many glaciers are not monitored. So how much is missed? Ocean warming may change basal melting of ice sheets and ice shelves, and this effect is poorly known. Ice sheets are buttressed by ice shelves and this is poorly modelled. Hence there were major concerns that future sea level rise was underestimated.
7) Spatial and temporal observations of ocean salinity were deemed not sufficient, for example in the Southern Ocean. Some issues in the measurements available include instrumental biases, a lack of deep-water salinity data (particularly at high latitudes), insufficient global data analyses and incomplete coverage of surface ocean salinities. Argo measurements alleviate this issue a great deal, and reanalyses of past data are needed to the extent possible. Moreover recent trend reversals in the Nordic Seas are
apparently related to a change in ocean surface currents, emphasizing the need to resolve the relative influence of moisture fluxes and surface circulation.
8) Temporal sampling issues have recently been revealed to the full extent for the first time in measurements of overturning transport in the Atlantic at 26.5°N, suggesting that earlier AMOC trends may have been aliased.
9) The oceans have been a sink for order 30% of the emitted carbon dioxide, thereby increasing acidity with biological impacts. Because solubility decreases as the ocean warms, to what degree will the ocean continue to be a sink for carbon dioxide and what are the implications for marine life? Are there other feedbacks, such as from the destabilization of methane clathrates? How should these be tracked?
10) In previous IPCC reports, only projections of climate change from models have been performed. In projections, models are not initialized with the observed state and differences in response to the radiative forcings are used to project future climate corresponding to assumed prescribed emissions scenarios. There is a great need to perform actual predictions of future climate to the extent possible. For times up to about 30 years, initial conditions are essential as they capture the current commitment to future change through the radiative imbalance and slow adjustment of the oceans and other parts of the climate system. Some predictability is also thought to exist from slow evolution of the ocean through, for example, the AMOC. Accordingly, establishing the state of the climate system for purposes of initializing models is essential. The AR5 will, for the first time, include results of experimental predictions for up to a few decades based on models initialized with observations. For the ocean, the key variables are temperatures and salinity, and questions remain about how well this can be done prior to the Argo era. 5. PROGRESS SINCE AR4
In this section a brief outline is given of some new science findings related to the issues arising from AR4. More complete reviews are included in other white papers.
5.1 Where is Heat Going?
The present-day climate is changing mainly in response to human-induced changes in the composition of the atmosphere as increases in greenhouse gases promote warming, while changes in aerosols can increase or diminish this warming regionally depending on the nature of the aerosols and their interactions with clouds. The current radiative imbalance at the TOA has increased from a very small imbalance only 40 years ago when carbon dioxide increases and radiative forcing were less than half of those today. Aspects of the recent energy imbalance of the Earth are reviewed in [8].
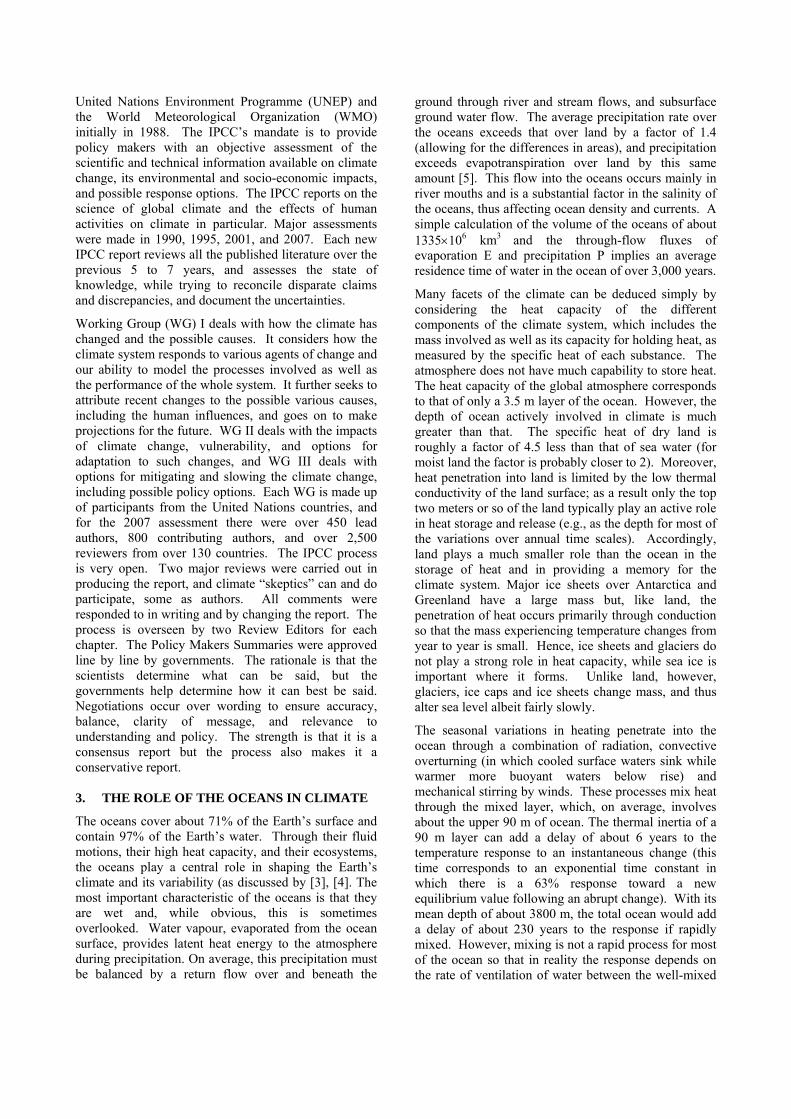
The excess in heat does several things. (i) It warms the planet, increasing temperatures that in turn increase the radiation back to space. (ii) It melts snow and ice on land, and sea ice, and melting of land ice contributed to eustatic sea level rise at a rate of about 1.2±0.4 mm yr-1 from 1993 to 2003. (iii) It goes into the ocean and increases ocean heat content, contributing to what is called thermosteric sea level rise, estimated at a rate of 1.6±0.5 mm yr-1 for 1993 to 2003 in AR4. (iv) It changes evaporation and the hydrological cycle, that in turn alter atmospheric heating and clouds. As clouds have both a greenhouse effect and reflect solar radiation, they can both heat or cool the Earth radiatively—which of these dominates in a given region depends upon the cloud properties (e.g., coverage, height and thickness). Generally there is large cancellation, but averaged globally, it is the radiative cooling effect of clouds that dominates. For example, strong cancellation occurs in deep convective clouds which have cold cloud tops (which is relevant for how much clouds emit towards space) and are bright. Shallow low-level cloud decks, such as stratocumulus, on the other hand, are bright but relatively warm, and thus mostly act to cool the planet. An exception is in the polar regions in winter [9].
Figure 1. Energy content changes in different components of the Earth system for two periods (1961–2003 and 1993–2003). Blue bars are for 1961 to 2003, burgundy bars for 1993 to 2003. From [6]. Over the past 50 years, the oceans have absorbed more than 90% of the total heat added to the climate system [6]; see Figs. 1, 2 and 3). From 1993 to 2003 there is a reasonable accounting for both the energy imbalance and the sea level rise [6]. About 60% of the sea level rise is from ocean expansion and 40% from melting land ice, as discussed in AR4. Major questions have arisen since then.
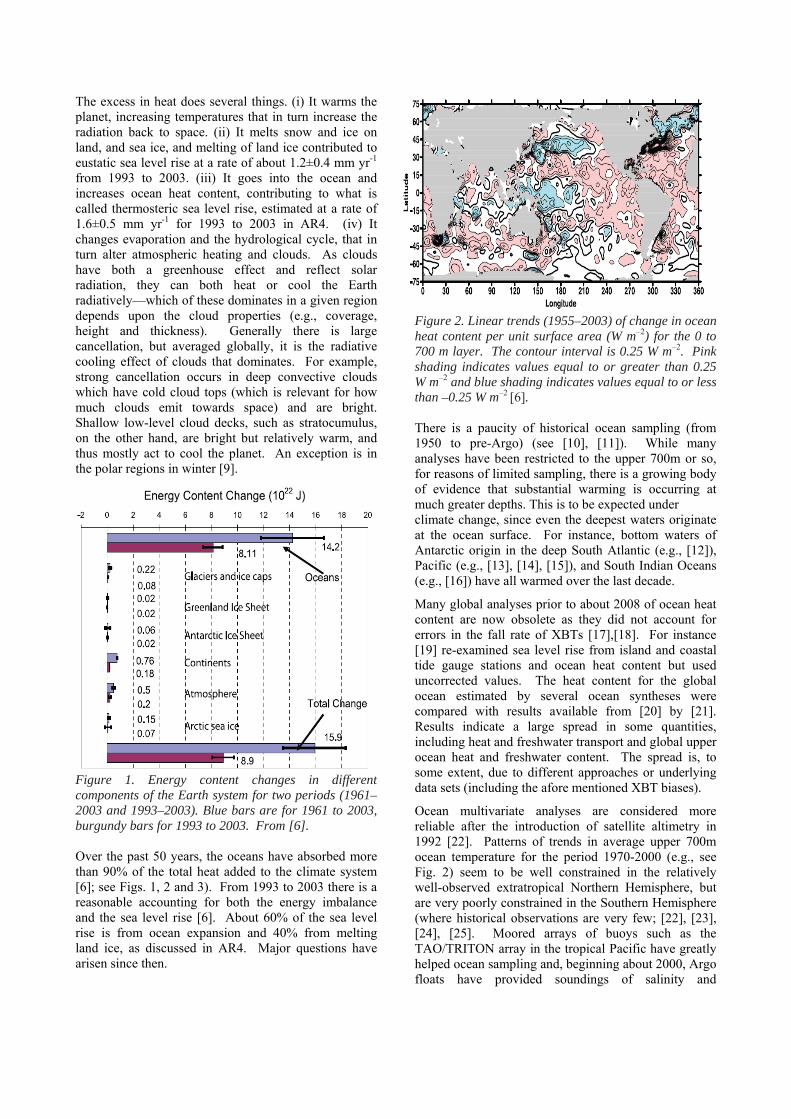
Figure 2. Linear trends (1955–2003) of change in ocean heat content per unit surface area (W m–2) for the 0 to 700 m layer. The contour interval is 0.25 W m–2. Pink shading indicates values equal to or greater than 0.25 W m–2 and blue shading indicates values equal to or less than –0.25 W m–2 [6]. There is a paucity of historical ocean sampling (from 1950 to pre-Argo) (see [10], [11]). While many analyses have been restricted to the upper 700m or so, for reasons of limited sampling, there is a growing body of evidence that substantial warming is occurring at much greater depths. This is to be expected under climate change, since even the deepest waters originate at the ocean surface. For instance, bottom waters of Antarctic origin in the deep South Atlantic (e.g., [12]), Pacific (e.g., [13], [14], [15]), and South Indian Oceans (e.g., [16]) have all warmed over the last decade.
Many global analyses prior to about 2008 of ocean heat content are now obsolete as they did not account for errors in the fall rate of XBTs [17],[18]. For instance [19] re-examined sea level rise from island and coastal tide gauge stations and ocean heat content but used uncorrected values. The heat content for the global ocean estimated by several ocean syntheses were compared with results available from [20] by [21]. Results indicate a large spread in some quantities, including heat and freshwater transport and global upper ocean heat and freshwater content. The spread is, to some extent, due to different approaches or underlying data sets (including the afore mentioned XBT biases).
Ocean multivariate analyses are considered more reliable after the introduction of satellite altimetry in 1992 [22]. Patterns of trends in average upper 700m ocean temperature for the period 1970-2000 (e.g., see Fig. 2) seem to be well constrained in the relatively well-observed extratropical Northern Hemisphere, but are very poorly constrained in the Southern Hemisphere (where historical observations are very few; [22], [23], [24], [25]. Moored arrays of buoys such as the TAO/TRITON array in the tropical Pacific have greatly helped ocean sampling and, beginning about 2000, Argo floats have provided soundings of salinity and

temperature from a depth of about 2000 m to the surface with increasing global coverage. The robust patterns and sensitivity to trend period (e.g., 1970-2000 or 1993-2006) suggest that climate modes play a dominant role in determining the spatial character [26], [27].
Several new reanalyses have been made of the ocean heat content based upon corrected XBT fall rates and other adjustments to the basic data, which tend to remove a lot of decadal variability. For the upper 700 m, the increase in heat content was about 16 x 1022 J or equivalently 37×1020 J/yr, or for sea level 1.6±0.2 mm/yr from 1961 to 2003 [18], [20], [28], [29]. Evidence that warming of the southern oceans is real in spite of the data shortcomings is provided by [25]. This is consistent with the comparison by [30] of Argo data with the global temperature time-series of [31], finding a warming of the 0-2000 m ocean by 0.06°C since the (pre-XBT) early 1960s.
Figure 3. Yearly time series of ocean heat content (1022 J) for the 0-700 m layer from [29], [20] and [28] with a base period of 1957-1990. Linear trends for 1969-2007 are given in the upper portion of the figure.
A key emerging issue is where has the energy gone since 2003? Presuming that there is a current radiative imbalance at the top-of-the-atmosphere of about 0.9 W m-2 [32], then this is 1.45×10²² J/yr integrated globally. At the same time since 2003, sea level rise has slowed somewhat and averages about 2.5 mm/yr from 2003 to early 2008 [33]. Sea ice is important where it forms. Record losses of Arctic sea ice of about 106 km2 occurred in summer of 2007 relative to the previous lowest year of 2005 (e.g., [34]), although the thickness and volume of the ice is quite uncertain. To melt 106 km2 of ice 1 m thick and raise the temperature of the water by 10°C requires 3.4×10²⁰ J, or globally 0.02 W m-2. For 2004-2008 this is about 0.9x10²⁰ J/yr.
The ocean has the capacity to change heat storage and plays a strong role in the annual cycle and interannual variability [4]). Between 2003 and 2005 early estimates of ocean heat content suggested a downturn [35], while sea level continued to rise [36]. This inconsistency stemmed partly from Argo float data problems that have been corrected or omitted [37]. Even so, recent analyses of ocean heat content changes ([20], [26], [28],
[29], [33], [38]; see Fig. 3) appear to show a slow-down in the rise since 2003, although [39] found sampling to be inadequate in the early Argo data of [38]. Further discussion related to this issue occurs under sea level (section 5.5), below.
5.2 Effects on Regional Changes
The Earth's climate possesses a broad range of temporal variations, with those extending from the interannual to longer times fundamentally involving ocean dynamics. The dominance of internal variability (climate modes) on the spatial patterns of ocean warming was extensively reviewed in AR4 and discussed by [26] and [27]. In addition, [40] have shown that the regional differences in ocean warming observed in the North Atlantic are mainly associated with the North Atlantic Oscillation.
In the Atlantic, a basin-wide fluctuation known as the Atlantic Multi-decadal Oscillation (AMO) is evidenced by 50-70 year swings in sea surface temperature (SST). While anthropogenic radiative forcing factors (greenhouse gases and aerosols) may have contributed to shaping the observed AMO during the last 80 years, model simulations suggest that similar variability can be generated naturally as a result of variations in the strength of the AMOC. The AMO is known to influence the position of the Intertropical Convergence Zone over northern Africa, causing multi-year droughts. Predicting the variations of the AMOC poses an important challenge to state-of-the art climate models, because of existing modelling uncertainties, difficulties in assimilating observed climate data into climate models and a lack of reliable long-term data to validate predictions (see section 5.7).
The AMOC includes both thermohaline and wind driven components but is largely buoyancy-forced. In contrast to the thermohaline circulation the AMOC can be uniquely defined and observed. Temporal sampling issues have recently been revealed to the full extent for the first time in measurements of overturning transport in the Atlantic at 26.5°N, suggesting that earlier AMOC trends [41] may have been aliased [42]. Traditional hydrographic sections across the Atlantic give a mean view of the circulation with errors of around 30% but this is insufficient to resolve trends because of natural variability [43]. The current observational network provides only a partial view of the AMOC that does not unambiguously resolve the full variability of the circulation and is hence open to interpretation. An operational monitoring array at 26.5°N has been continuously measuring the strength and vertical structure of the AMOC since 31st March 2004.
In the Pacific, decadal variability is also large and affects temperature, sea-level, salinity, weather patterns, and marine ecosystems. The Pacific Decadal Oscillation (PDO) and related Inter-decadal Pacific

Oscillation (IPO) dominate and are related somewhat to El Niño-Southern Oscillation (ENSO) (see IPCC 2007) but with a much stronger extratropical component that involves the ocean gyres, Rossby waves and heat anomalies that are subducted and which re-emerge in winter.
5.3 Changes in the Hydrological Cycle and Ocean Salinity
Among the major societal impacts of climate change are those resulting from an increase in the global cycle of evaporation and rainfall caused by a warmer ocean surface layer and higher atmospheric temperatures. Regionally, ocean salinity accumulates the imbalances of E-P, becoming fresher or saltier where the balance tips in one direction or the other over time. Ocean salinity is thus an important quantity in attributing regional patterns of changes in E-P. A second application of salinity is to diagnose the global volume of ice. Melting of either floating ice or glaciers and ice sheets lowers ocean salinity.
In the AR4, [6] documented ocean salinity (hence freshwater) changes over recent decades on gyre and basin scales. The near-surface waters in the subtropical evaporative regions showed increasing salinity in almost all ocean basins. The high-latitude surface waters in both hemispheres were freshening, consistent with increased precipitation, although runoff, ice melting, and advection changes may have contributed. The Atlantic was also becoming saltier over much of the water column and on average the water column salinity in the Pacific Basin was decreasing. These patterns were consistent with inferred increased atmospheric water transport from low to high latitudes and from the Atlantic to the Pacific.
The spread in freshwater content variability between all estimates is very large in ocean syntheses [21], suggesting a general problem of existing ocean simulations in determining the salt content from observations. This also affects estimates of many climate indices, including global sea level rise.
More information has since been published on these general trends and links to the water cycle and circulation. An optimal detection analysis [44] attributed a human influence on increases in the observed salinity in recent decades from 20°–50°N in the Atlantic, whereas the analysis was inconclusive in other ocean regions. Opposing trends, increasing since the late-1980s, were found by [45] in the sub-tropical gyres of the North Atlantic and North Pacific, with the latter experiencing a relative freshening (Fig. 4).
The North Atlantic and Nordic Seas upper ocean freshening trend of the 1960s – 1990s has reversed over the last decade [46]. Temperature and salinity increases in the Atlantic Inflow from the eastern subpolar gyre to the Fram Strait are likely attributed to changes in the
ocean circulation [47]. Their analysis of surface drifter tracks in the North Atlantic Ocean from 1990 to 2007 showed that warm subtropical waters increased their penetration toward the Nordic seas, accompanied by continual weakening of the North Atlantic subpolar gyre (as measured by satellite altimetry). This suggests that salinity trends are related to changes in ocean circulation as well as the hydrologic cycle, and these different linkages need to be resolved.
Figure 4. Recently documented inversely correlated surface salinity trends in Atlantic and Pacific subtropical gyres [45], consistent with increasing atmospheric water transport from the Atlantic to Pacific.
Although the Argo record is not yet long enough to detect climatic salinity trends [10], analyses of the Argo sea surface salinity (SSS) data averaged over recent years and differenced from the historical record [48] also indicate general patterns of salinity increases in evaporative mid-latitude regions and freshening in tropical convergence zones and high latitudes, with the notable exception of increasing SSS in the subarctic Atlantic. Such changes are also generally consistent with a putative change in the global the hydrological cycle.
5.4 Changes in the Carbon Cycle and Acidity, and Effects on Climate
Using datasets from World Ocean Circulation Experiment (WOCE) and Joint Global Ocean Flux Study (JGOFS) combined with a back calculation technique for isolating the anthropogenic component of the measured Dissolved Inorganic Carbon (DIC), [49] estimated that 118±19 Pg C accumulated in the ocean between 1800 and 1994. This increase in inventory accounted for 48% of the fossil fuel and cement manufacturing CO2 emissions to the atmosphere during that time frame. In the early 2000s the physical and biogeochemical communities organized an effort to collect full water column boundary to boundary hydrographic and geochemical data along a subset of the cruises that were initially run as part of the WOCE/JGOFS global survey in the 1990s. At least

seven countries agreed to coordinate these repeat hydrographic survey cruises to monitor and quantify the decadal changes in ocean carbon storage (see [50]). The U.S. CLIVAR/CO2 Repeat Hydrography Program is slated to complete its first decadal survey by 2012. Similarly, programs to quantify the uptake of CO2 across the air-sea interface have expanded. The network of observations has been greatly expanded from research ship observations by adding instruments on commercial ships and moorings (see [51].
Since AR4, new studies and techniques have greatly improved understanding of the ocean uptake and storage of inorganic carbon. The latest anthropogenic CO2 uptake estimates were summarized by [52] from a variety of approaches including: air-sea CO2 partial pressure differences; inversion models together with measured changes in ocean interior carbon; changes in atmospheric oxygen together with concurrent measurements of atmospheric CO2; inversion models together with measured changes in atmospheric CO2; air-sea δ13C disequilibrium; deconvolution of atmospheric CO2 and δ 13C; joint atmosphere-ocean inversions; and a suite of prognostic ocean general circulation models. The uptake estimates ranged from 1.5±0.9 to 2.4±0.5 Pg C y-1. The latest estimates from all of these techniques for the period of the 1990s and early 2000s appear to be internally consistent within their uncertainties. Taking the best composite estimate of the rate of ocean carbon uptake based on all these techniques (~2.2 Pg C yr-1) however suggests that the ocean uptake does not seem to be keeping pace with the rate of growth in CO2 emissions [6].
While ocean uptake of CO2 has significantly reduced greenhouse gas levels in the atmosphere, the anthropogenic CO2 that is absorbed by seawater results in chemical changes that reduce both seawater pH and the concentration of carbonate ion. This process is referred to as ocean acidification. The decline in carbonate ion as a consequence of ocean acidification is of particular concern with respect to many shell-forming marine organisms. Carbonate ion is a basic building block of calcium carbonate, skeletons and shells for a large number of marine organisms, including corals, shellfish, and marine plankton. Thus, increased CO2 and its concomitant changes in ocean chemistry may alter species compositions and ecosystem structure. Thus ocean acidification could have profound impacts on some of the most fundamental geochemical and biological processes of the sea in coming decades (see [53]).
As understanding and observations have developed, so too have climate or Earth system models that include a carbon cycle and biogeochemistry, with vary degrees of sophistication. The credibility and magnitude of prospects for possible positive feedbacks to a warming climate through reductions in the uptake efficiency of
carbon dioxide by the ocean, as well as changes in soil and permafrost carbon stores as the land warms, highlight the need to improve the simulations and predictions of the carbon cycle. Many more models will be systematically run in AR5 to provide estimates of these effects and it is important that their uncertainties and dependencies on other chemical species (such as those involved in the nitrogen cycle, which affects the carbon cycle through biological activity) be documented and verified by sound process research and observations.
5.5 Sea Level
Adequately understanding sea-level rise requires consideration of not only full-depth ocean thermosteric sea-level rise but also the contributions from glaciers and ice caps, the ice sheets of Greenland and Antarctica and also changes in the terrestrial storage of water. Sea level measurements were limited in the past to those at coastal and island stations. In 1992 new observations became available for the first time from the TOPEX/Poseidon satellite that measured global sea level to a few millimeters accuracy every 10 days. This has continued with the Jason-1 and -2 missions resulting in a calibrated global sea level climate record which shows an increase of ∼3.1 mm yr-1 with a few short-term departures from a fairly linear trend (Fig. 5)
Figure 5. Sea level from altimetry since 1992 with the seasonal cycle removed and an inverse barometer correction [54]. Values are slightly higher after 2007 in alternative versions of this figure, such as from CSIRO (Church, personal communication) and the linear trend is 3.3 mm/yr.
There was a short-term increase above the trend line in 1997-98 associated with the major 1997-98 El Niño event, and a dip below the line in 2007-08 associated with the recent La Niña. These fluctuations in sea level with El Niño may come partly from changes in ocean heat content, but may also arise from changes in ocean mass when water is evaporated from the ocean (as it loses heat) and is precipitated on land in the changing precipitation patterns. From [55] linear regressions, a
1.5°C drop in Niño 3.4 SSTs for 6 months (as occurred from October 2007 to March 2008) would increase rainfall over land in the tropics (±25°) to such an extent as to lower sea level by 6.0 mm; hence the 2007-08 La Niña (Fig. 5) likely contributed to the recent temporary slowdown in sea level rise.
Estimated contributions to sea level from changes in storage of water on land in reservoirs and dams may account for –0.55 mm/yr sea level equivalent [56]), but these are compensated, at least partly, for by ground water mining, urbanization, and deforestation effects. This obviously depends on the time frame, and the net sum of land effects is possibly quite small (e.g., see [20].
The AR4 eustatic sea level rise of about 1.2 mm/yr up to 2003 appears to have accelerated since then with new assessments from glaciers [57], [58] of 1 to 1.4 mm/yr and from the major ice sheets in Antarctica [59] and Greenland [60], especially from 2003 to January 2008, where the contribution to sea level could be 1 mm/yr, coming roughly equally from both ice sheets, and hence these account for 1.35×10²⁰ J/yr in terms of energy sinks. However, the global freshwater flux and salinity are not well constrained by observations, and model synthesis results, such as from [61], depend on the deep ocean temperature trends that are also poorly constrained by observations. Changes in salinity affect density and thus contribute a very small halosteric contribution to sea level rise (see [38]).
The AR4 found that the rate of sea level rise during the 20th century was 1.7 ± 0.5 mm yr-1, there had been a clear increase in the rate of rise from the 19th to the 20th century, and that satellite-altimeter data indicated sea level rise at a rate of over 3 mm yr-1 (Fig. 5). In situ sea level data indicate that this faster rate of sea-level rise commenced in the late 1980s [62]. Both satellite and in situ data [63] indicate that sea level has been rising at close to the upper bound of the IPCC TAR projections since 1990. However, it is unclear whether this represents a further sustained increase in the rate of rise [6] or it is part of natural variability as seen in the longer in situ record [62], possibly in part a recovery from the volcanic eruption of El Chichon and Mt. Pinatubo [64], [65].
Successive IPCC reports since 1990 have failed to adequately explain the observed sea-level rise over decadal periods, with the sum of components being consistently smaller than the observational record. The AR4 did close the sea-level budget for 1993 to 2003 but the recognition of significant instrumental biases in ocean temperature records ([17], [18], [28], [29]) has raised concern that this closure was not appropriate. Using time variable corrections [18] for these instrumental biases, [20] estimated revised estimates of upper ocean heat content and thermosteric sea-level rise. There is relatively good agreement in the variability of
the observed and modelled (for those models that include all time variable forcing components) upper ocean heat content and thermosteric sea-level rise estimates for 1961 to 2003. However, there are indications that the model results are biased low. Models show a very different depth of ocean steric changes for the various ocean basins. Rigorous comparison of the observational patterns and the model results is urgently needed.
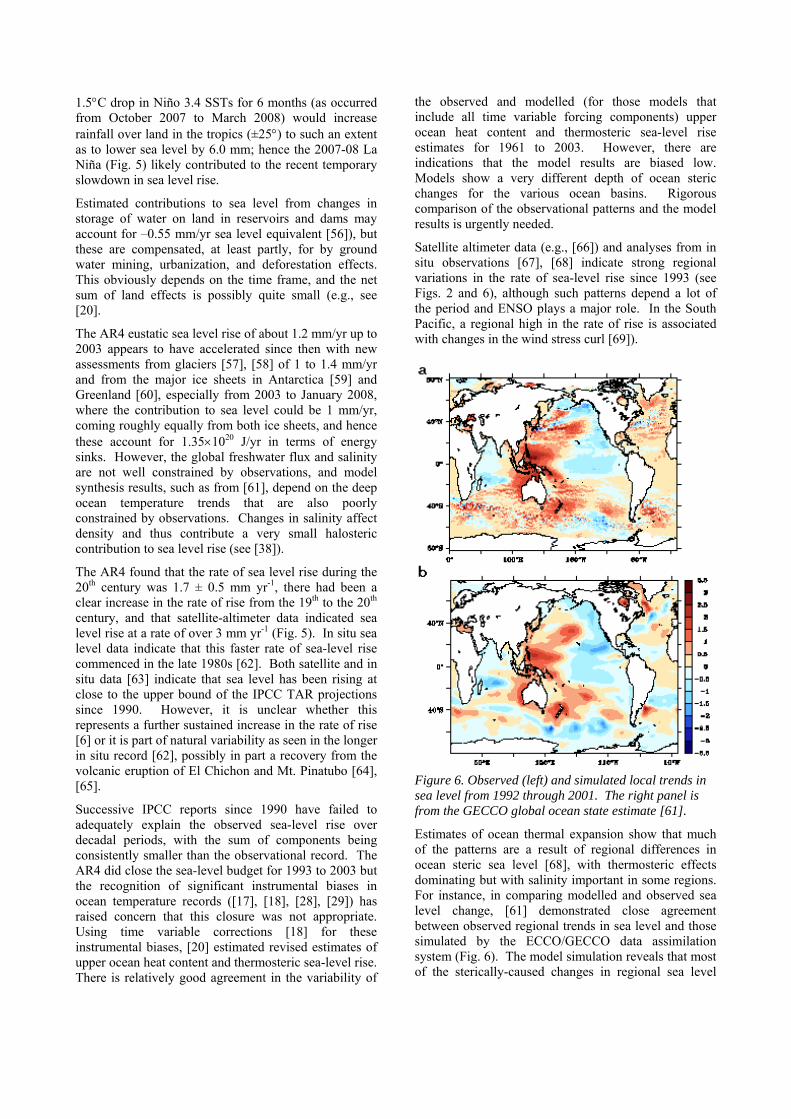
Satellite altimeter data (e.g., [66]) and analyses from in situ observations [67], [68] indicate strong regional variations in the rate of sea-level rise since 1993 (see Figs. 2 and 6), although such patterns depend a lot of the period and ENSO plays a major role. In the South Pacific, a regional high in the rate of rise is associated with changes in the wind stress curl [69]).
Figure 6. Observed (left) and simulated local trends in sea level from 1992 through 2001. The right panel is from the GECCO global ocean state estimate [61].
Estimates of ocean thermal expansion show that much of the patterns are a result of regional differences in ocean steric sea level [68], with thermosteric effects dominating but with salinity important in some regions. For instance, in comparing modelled and observed sea level change, [61] demonstrated close agreement between observed regional trends in sea level and those simulated by the ECCO/GECCO data assimilation system (Fig. 6). The model simulation reveals that most of the sterically-caused changes in regional sea level
arise from a redistribution of heat and salt through a changing ocean circulation, i.e. changing wind forcing. An increase in the impact of surface buoyancy forcing (especially heat flux) was estimated for the 1990s, however, especially in the North Atlantic. In comparing the simulated trends in local sea level available from several ocean syntheses, [21] showed that while large-scale patterns agree, details in the simulations depend fundamentally on the synthesis approach.
For the mid-2003 to 2008 period, additional data exist on changes in both ocean heat content from Argo floats down to 900 m (and XBT data can be omitted) and ocean mass from Gravity Recovery and Climate Experiment (GRACE) gravity satellite measurements. Their sum should amount to the sea level from altimetry estimates from satellites, but [38] found substantial discrepancies in trends of ∼2 mm/yr. Part of this discrepancy can be accounted for by improved land-sea masks and better resolution in the GRACE measurements. A claim was made to have resolved the discrepancies by [33], as they found increased contributions from melting land ice of 2 mm/yr for 2003 to 2008 based on an alternative GRACE data analysis that includes a significantly different Glacial Isostatic Adjustment (GIA) model. A later claim to also have closed the sea level budget [39] was based on increasing the ocean expansion component. The steric contributions range from -0.5±0.5 mm/yr for mid 2003 to mid 2007 [38]) to 0.4±0.1 mm/yr [33] to 0.8±0.8 mm/yr [39] for 2004 to mid-2008 (with 95% confidence limits). The disparate trends and non-overlapping error bars suggest that issues exist in processing Argo and GRACE data. The time period considered is important, because the rate of thermosteric sea level change appears to have flattened noticeably beginning in 2003. Recent sea level rise is roughly accounted for within 15% uncertainties, although large discrepancies exist among the components. The ice melt may be overestimated as the cooler year of 2008 observations are not included.
However, satisfying the sea level rise constraint by shifting the balance from thermosteric to eustatic components does not satisfy the energy constraint [8]. Accounting for the known contributions to energy uptake still leaves a likely residual of 30 to 100×1020 J/yr, although total error bars overlap. Possibly this heat is being sequestered in the deep ocean below the 900 m depth used for the Argo analyses, where it would contribute about 0.4 to 0.5 mm/yr sea level rise, but then the land ice melt estimate would have to decrease.
While differing conclusions have been published for the short available record (2003 to present), the power of the combined satellite altimetry, upper ocean density observations and time variable satellite gravity measurements is clear and will become increasingly valuable as the record length increases. The significant
progress in balancing the sea-level budget opens the way to attempt formal detection/attribution studies of sea-level rise and to use the results to constrain projections of future sea-level rise. A further energy constraint comes from TOA observations of the net radiation balance if they are accurate enough.
5.6 Detection and Attribution: What has Happened and Why?
Comparison of observed and modelled changes helps elucidate the causes of past changes and provides an important test of the reliability of models for predictions of future changes. In detection and attribution analyses, model simulations of the past decades with anthropogenic forcings (including well mixed greenhouse gases and sulphate aerosols) included are compared with model simulations in which only natural forcings from volcanic aerosols and changes in solar output are included. Such analyses applied to ocean heat content [70], [71] have investigated the long-term vertical penetration of anthropogenic warming in the World’s oceans in a basin-by-basin global analysis. The AR4 report concluded that the warming of the upper ocean during the latter half of the 20th century was “likely” due to anthropogenic forcing. However, while there was very strong statistical evidence that the warming could not be explained by internal variability as estimated by two different climate models, there were discrepancies between observed and modelled estimates of ocean heat content variability. As noted above, since AR4 a large part of this discrepancy has now been removed. There is much improved agreement between model simulations and observational estimates of ocean heat uptake when these instrumental errors are corrected for [20].
A new methodology for examining the processes of oceanic changes has been developed recently [27], [72]. Their technique attempts to separate ocean warming into a component largely associated with changes in air-sea heat flux (the temperature above the 14°C isotherm) and a component largely associated with advective re-distribution of heat (the depth of the 14°C isotherm). Note that the separation of air-sea flux induced changes from dynamical changes can be done more cleanly in analyses using ocean density (see below), but the lack of historical salinity observations limit the application of this approach prior to Argo. This method provides a clearer picture of the drivers of historical oceanic temperature changes. Fig. 7 (from [73]), compares observed and modelled analyses of ocean temperatures and shows that the HadCM3 climate model captures in remarkable detail the temporal evolution of temperatures associated with changes in air-sea heat flux. An advance on previous studies [73] attributes both the short term cooling episodes to volcanic eruptions and the multi-decadal warming to anthropogenic forcing.

Figure 7. Time series of global ocean temperature above the 14°C isotherm (T14C) relative to 1950-1999 average, for (a) Global Ocean, (b) Atlantic Ocean (c) Pacific Ocean, and (d) Indian Ocean. Shown are: the XBT-corrected observations (black); the HadCM3 ALL ensemble average (red) and ensemble standard deviation (orange shading); and the HadCM3 NAT ensemble average (blue) and ensemble standard deviation (light blue shading). The model data have been re-gridded and sub-sampled to match the observational coverage. The vertical lines show the approximate timing of the major volcanic eruptions. From [73].
5.7 Initial State for Prediction Large-scale coherent trends of salinity have been observed and the AR4 assessment concluded that they were consistent with increased moisture transport from lower to higher latitudes and from the Atlantic to the Pacific. While freshening at high latitudes in the Atlantic is consistent with observed increases in precipitation at high latitudes [6], climate model studies suggest that Atlantic freshening could be associated with changes in northward advection associated with variability of the meridional overturning circulation [74]. An optimal detection analysis of Atlantic salinity changes [44] detected a human influence on the observed increases in salinity at low latitudes but found that high latitude changes, including a recent reversal of the freshening observed previously, are consistent with internal variability. Ocean changes on density surfaces enable understanding of the observed ocean changes from a mechanistic point of view and will allow quantification of the extent to which external forcings have altered air-sea heat fluxes, the hydrological cycle and ocean circulation [40], [75], [76].
As noted above, AR5 will for the first time consider initialized predictions of climate change for several decades. This is in response to increasing interest in the possibility that decadal climate predictions may be able to provide information enabling better adaptation to climate change. For climate predictions at decadal timescales, the natural internal variability of the climate system should be taken into account as well as the radiative forcing resulting from greenhouse gases. Hence, knowledge of the current state of the ocean is thought to be of paramount importance. Several decadal prediction studies indicate that the quality of forecasts improves when the climate system is initialized with ocean observations and SST [77], [78], [79]. Beneficial impact of Argo on ocean analyses and positive impacts of ocean observations on seasonal predictions were found by [80], [81]. A thorough and comprehensive report on the scientific basis for decadal predictions, as well as a critical assessment of current

decadal predictions efforts is given in [82].
Predictability studies suggest that many parts of the ocean, notably the North Atlantic, are governed by predictable processes [83]. In particular, the AMO and the AMOC have received growing attention over the last few years. Low frequency variability in the Pacific, including the PDO may also indicate predictability. The relative importance of ocean initial conditions versus greenhouses gases in decadal predictions still needs to be established, and may depend on the variable and the region. Whereas the ocean initial conditions are important earlier in the forecast, the role of the radiative forcing will increase at longer lead times. Several studies find that for global surface temperature this is only a few years, but considerably longer for the AMOC [84], [85].
The paradigm for a decadal prediction system [86], [87] is similar to that followed in seasonal forecasts. However, in decadal forecasting there are some processes, often overlooked in seasonal forecasting, that should be fully represented and initialized including those associated with radiative forcing by greenhouse gases, the deep ocean, and the cryosphere. A typical seasonal/decadal forecasting system consists then of the following components:
1. Initialization: Most thermal inertia resides in the ocean along with sea ice at high latitudes. In the ocean temperature and salinity are required. Land soil moisture and vegetation conditions are also important.
2. Forward integration of the coupled model: The initial conditions are fed into the numerical models of the earth-system that predict the evolution of the climate. External forcing by greenhouse gases is prescribed.
3. Ensemble generation: The probabilistic nature is addressed through ensemble integrations to sample the probability density function, accounting for uncertainty in the atmosphere, ocean and other initial conditions.
4. Calibration of model output: Because of deficiencies in the component models the coupled model output needs calibration to correct errors in the mean. Calibration of higher moments of the distribution (variance, skewness, or extreme events) is also desirable, but usually not possible due to the limited length of the historical observational records.
5. Verification of results and skill assessment: An a priori knowledge of the quality of the forecast is achieved by objective measures of skill based on past performance, in which the forecasts are systematically compared with observations (or climate reanalyses) for a sufficiently long period. Observations used in calibration are not used in the skill assessment to prevent artificial skill.
As discussed in [88] and [21], long records of ocean
observations and analyses are needed for calibration and skill assessment of the decadal forecasts, as well as the generation of ocean initial conditions. The results from synthesis approaches [21] document the large spread that still exists in initial conditions, and so much still has to be learned. Ultimately such a synthesis needs to be performed by the model used to do the forecasts (coupled assimilation).
Evaluation of ocean reanalyses efforts [21], [89], [90], clearly show that the pre-Argo ocean observing system was insufficient to constrain the past history of the ocean. Synthetic observing system experiments [91] using a perfect model scenario showed that the 20th century observational network was not enough to constrain the AMOC, which was only successfully reproduced when the Argo observing system was simulated. With the 20th century observation network, it is therefore not surprising that model analyses depict considerable variation in the estimates of heat content and the AMOC strength and variability. For earlier years the uncertainty in ocean analyses is even larger. Hence decadal hindcasts initialized during the 20th century are unlikely to be accurate. Uncertainties in the reconstructions of 20th century climate will likely be reduced by improving ocean models, assimilation methods and surface fluxes from atmospheric reanalysis. Undoubtedly, more accurate decadal predictions will rely on ocean observing systems in the years to come.
6. SOME RECOMMENDATIONS FOR OCEAN
OBSERVATIONS
Some recommendations follow from the “IPCC Lessons Learned” workshop [92]. Others have been developed by the Argo and GODAE teams, and are discussed in other CWPs. The full observational requirement for improving our understanding of and the projections of sea level rise are set out in the report from the WCRP Workshop Understanding Sea-level Rise and Variability [93]; see also [54]. Detailed observational needs for the representation of decadal variability in ocean reanalyses are given in [90]. The most pressing need for the ocean observing system include the maintenance of the current global systems (at the very minimum), the inclusion of a deep ocean component, the improvement of coverage at high latitudes, and the production of climate-balanced forcing fluxes [94].
Virtually all that is known about ocean salinity variability is based on very sparse and irregularly sampled stations over the past century. The historical sampling is inadequate to map salinity variations on synoptic scale and with sufficient resolution to study the links to the water cycle and circulation. However, since about 2005 the Argo array has been fully deployed and now provides a more synoptic global ocean observing system sufficient to resolve seasonal to interannual

variability on basin scales. Within the next year, the SMOS and Aquarius/SAC-D satellite missions will be launched to provide higher resolution global surface salinity data [95]. The satellite and combined in situ observations will provide an unprecedented ocean salinity data set that will serve (a) the study of upper ocean circulation, air-sea interaction and other climatic processes that govern salinity variations, and (b) initialize and constrain the next generation ocean and coupled climate models for future IPCC assessments and predictions.
The top priority for Argo must be to “complete” and sustain the program with respect to its original objectives for coverage and data quality. Key issues are the need to understand the differences between the current estimates of global ocean heat uptake, which can arise from: (i) data quality control procedures; (ii) gridding and in-filling methodologies (i.e. assumptions made in areas of missing data); (iii) choice of reference climatology; (iv) treatment of data biases (e.g., XBT corrections). Accordingly, the quality control and analysis of observations remain areas where continuing progress is essential.
For the AMOC it is important to establish and maintain long-term baseline reference networks for ocean quantities, particularly in the North Atlantic. It is recommended that a major effort is placed on ocean data assimilation and nowcasting of the AMOC. Improved resolution of ocean model components in global comprehensive models will bring multiple benefits. Further improvements in ocean mixing processes and their parameterization in coupled climate models are also desirable. The global models should be explored in parameter space for possible thresholds related to abrupt climate change prospects.
Improving sea level rise projections and energy balance assessments require closing the sea-level budget (with observations and models) within realistic uncertainties and monitoring sea level and ocean heat and freshwater content. Specific needs include: • Continued high-quality satellite altimeter and gravity
records. • Continued in situ sea-level records with robust datum
control to independently measure sea level and to continue to carefully monitor altimeter biases.
• Sustained upper ocean measurements of temperature and salinity (the Argo Project); improved vertical sampling in the upper layers and also in timeliness (< 24 hours for near-real time data) would be beneficial.
• Extension of upper ocean measurements to marginal seas.
• Extension of Argo to higher latitudes in regions covered by sea ice is enabled by new techniques, not available ten years ago.
• Design and implementation of a program to obtain deep (> 2000m) ocean density measurements to
complement the upper ocean measurements from Argo. In future, hydrographic cruises must be augmented by an array of deep floats, moored instruments, gliders, improved bottom pressure measurements from space, or a combination thereof.
• Greater use of paleo sea-level measurements. • Data archaeology efforts to increase the amount of
historical sea-level and ocean density data. • Adding new sensors, such as dissolved oxygen, as
long as they do not impede the primary Argo mission. Issues include cost, energy requirements and impact on float lifetime, and compliance with the Law of the Sea as floats drift into Exclusive Economic Zones.
For ocean carbon and ecosystems, a coordinated long term ocean carbon observing program is needed to evaluate how the ocean uptake is changing over time and to monitor for fundamental shifts in the mechanisms controlling ocean carbon uptake and storage in the future as well as the impacts of the rising CO2 on marine ecosystems and biodiversity.
In AR5, the IPCC scoping meeting in July 2009 outlined an ocean observations chapter, once again, but also a sea level chapter. All of the topics listed above are included. In addition, ocean topics will be featured in the projections chapters, and a more complete synthesis of sea level projections is expected. Continued improved ocean observations provide the basis for the credibility of these projections.
7. REFERENCES 1. IPCC 2007: Climate Change 2007: The Physical Science
Basis. Edited by S. Solomon, D. Qin, M. Manning, Z. Chen, M. Marquis, K. B. Averyt, M. Tignor, H. L. Miller, Cambridge Univ Press, Cambridge, U.K. 996 pp.
2. Raupach, M. R., G. Marland, P. Ciais, C. Le Quéré, J. G. Canadell, G. Klepper and C. B. Field Global and regional drivers of accelerating CO2 emissions. PNAS, 104, 10288-10293, doi:10.1073_pnas.0700609104
3. Trenberth, K. E., and D. P. Stepaniak, 2004: The flow of energy through the Earth’s climate system. Quart. J. Roy. Meteor. Soc., 130, 2677−2701.
4. Trenberth, K. E., and J. T. Fasullo, 2009: Changes in the flow of energy through the climate system. Meteorologische Zeitschrift, 18, 369 −377.
5. Trenberth, K. E., L. Smith, T. Qian, A. Dai and J. Fasullo, 2007: Estimates of the global water budget and its annual cycle using observational and model data. J. Hydrometeor., 8, 758–769.
6. Bindoff, N. L., J. Willebrand, V. Artale, A. Cazenave, J. Gregory, S. Guleve, K. Hanawa, C. Le Quere, S. Levitus, Y. Nojiri, C. K. Shum, L. D. Talley, and A. Unnikrishnan, 2007: Observations: Oceanic Climate Change and Sea Level. In: Climate Change 2007: The Physical Science Basis. Contrib. Working Group I Fourth Assessment Report of the IPCC. [S. Solomon, D. Qin, J. Manning, Z. Chen, M. Marquis, K. B. Averyt, M. Tignor, and H. L. Miller (eds)]. Cambridge Univ. Press, Cambridge, U. K., 385−428.
7. Fasullo, J. T., and K. E. Trenberth, 2008a: The annual cycle of the energy budget: Pt I. Global mean and land-ocean
exchanges. J. Climate, 21, 2297−2312. 8. Trenberth, K. E., 2009: An imperative for adapting to
climate change: Tracking Earth’s global energy. Current Opinion in Environmental Sustainability, 1, 19−27.
9. Walsh, J. E., W. L. Chapman, D. H. Portis, 2009: Arctic cloud fraction and radiative fluxes in atmospheric reanalyses. J. Climate, 22, 2316−2334.
10. Freeland, H; D. Roemmich, S. Garzoli, P. LeTraon, M. Ravichandran, S. Riser, V. Thierry, S. Wijffels, M. Belbéoch, J. Gould, F. Grant, M. Ignazewski, B. King, B. Klein, K. Mork, B. Owens, S. Pouliquen, A. Sterl, T. Suga, M. Suk, P. Sutton, A. Troisi, P. Vélez-Belchi, J. Xu, 2010: Argo - A Decade of Progress. In Proc. "OceanObs’09: Sustained Ocean Observations and Information for Society" Conference (Vol. 2), Venice, Italy, 21-25 September 2009, Hall, J., Harrison D.E. and Stammer, D., Eds., ESA Publication WPP-306.
11. Palmer, M., J. Antonov, P. Barker, N. Bindoff, T. Boyer, M. Carson, C. Domingues, S. Gille, P. Gleckler, S. Good, V. Gouretski, S. Guinehut, K. Haines, D. E. Harrison, M. Ishii, G. Johnson, S. Levitus, S. Lozier, J. Lyman, A. Meijers, K. von Schuckmann, D. Smith, S. Wijffels, J. Willis, 2010: Future observations for monitoring global ocean heat content. In Proc. "OceanObs’09: Sustained Ocean Observations and Information for Society" Conference (Vol. 2), Venice, Italy, 21-25 September 2009, Hall, J., Harrison D.E. and Stammer, D., Eds., ESA Publication WPP-306.
12. Johnson, G. C. and S. C. Doney, 2006: Recent western South Atlantic bottom water warming. Geophys. Res. Lett., 33, L14614, doi:10.1029/2006GL026769.
13. Fukasawa, M., H. Freeland, R. Perkin, T. Watanabe, H. Uchida, and A. Nishina, 2004: Bottom water warming in the North Pacific Ocean. Nature, 427, 825–827, doi:10.1038/nature02337.
14. Kawano T., M. Fukasawa, S. Kouketsu, H. Uchida, T. Doi, I. Kaneko, M. Aoyama, and W. Schneider, 2006b: Bottom water warming along the pathway of Lower Circumpolar Deep Water in the Pacific Ocean. Geophys. Res. Lett., 33, L23613, doi:10.1029/2006GL027933.
15. Johnson, G. C., S. Mecking, B. M. Sloyan, and S. E. Wijffels, 2007. Recent bottom water warming in the Pacific Ocean. J. Climate, 20, 5365-5375, doi:10.1175/2007JCLI1879.1.
16. Johnson, G. C., S. G. Purkey, and J. L. Bullister, 2008: Warming and freshening in the abyssal southeastern Indian Ocean. J. Climate, 21, 5351-5363, doi:10.1175/2008JCLI2384.1.
17. Gouretski, V., and K. P. Koltermann, 2007: How much is the ocean really warming? Geophys. Res. Lett., 34: L01610, doi:10.1029/2006GL027834.
18. Wijffels, S. E., J. Willis, C. M. Domingues, P. Barker, N. J. White, A. Gronell, K. Ridgeway, J. A. Church, 2008: Changing eXpendable BathyThermograph fall-rates and their impact on estimates of thermosteric sea level rise. J. Climate, 21, 5657-5672.
19. Jevrejeva S, J. C. Moore, and A. Grinsted, 2008: Relative importance of mass and volume changes to global sea level rise. J. Geophys. Res., 113, D08105, doi:10.1029/2007JD009208.
20. Domingues, C. M., J. A. Church, N. J. White, P. J. Gleckler, S. E. Wijffels, P. M. Barker and J. R. Dunn, 2008: Improved estimates of upper-ocean warming and
multi-decadal sea-level rise, Nature, 453, 1090 – 1093, doi:10.1038/nature07080.
21. Stammer, D., A. Köhl, T. Awaji, M. Balmaseda, D. Behringer, J. Carton, N. Ferry, A. Fischer, I. Fukumori, B. Gise, K. Haines, D. E. Harrison, P. Heimbach, M. Kamachi, C. Keppenne, T.; Lee, S. Masina, D. Menemenlis, R. Ponte, E. Remy, M. Rienecker, A. Rosati, J. Schröter, D. Smith, A. Weaver, C. Wunsch, Y. Xue, 2010: Multi-Model Ensemble Ocean Synthesis in Support of Climate Diagnostics, In Proc. "OceanObs’09: Sustained Ocean Observations and Information for Society" Conference (Vol. 2), Venice, Italy, 21-25 September 2009, Hall, J., Harrison D.E. and Stammer, D., Eds., ESA Publication WPP-306.
22. Lyman J. M. and G. C. Johnson, 2008: Estimating annual global upper-ocean heat content anomalies despite irregular in situ ocean sampling. J. Climate, 21, 5629-5641.
23. Wunsch C, R. M. Ponte, P. Heimbach, 2007: Decadal trends in sea level patterns: 1993-2004. J. Climate, 20, 5889-5911.
24. Fasullo, J. T., and K. E. Trenberth, 2008b: The annual cycle of the energy budget: Pt II. Meridional structures and poleward transports. J. Climate, 21, 2313−2325.
25. Gille, S. T., 2008: Decadal-scale temperature trends in the Southern Hemisphere ocean. J. Climate, 21: 4749–4765.
26. Harrison, D. E. and M. Carson, 2007: Is the World Ocean warming? Upper-Ocean temperature trends: 1950-2000. J. Phys. Oceanogr., 37, 174-187.
27. Palmer, M., K. Haines, S. Tett, and T. Ansell, 2007: Isolating the signal of ocean global warming. Geophys. Res. Lett., 34, L23610, doi:10.1029/2007GL031712.
28. Ishii, M., and M. Kimoto, 2009: Reevaluation of historical ocean heat content variations with time-varying XBT and MBT depth bias correction. J. Phys. Oceanogr., 65, 287-299.
29. Levitus S., J. I. Antonov, T. P. Boyer, R. A. Locarnini, H. E. Garcia and A. V. Mishonov, 2009: Global ocean heat content 1955-2008 in light of recently revealed instrumentation problems. Geophys Res Lett., 36, L07608, doi:10.1029/2008GL037155.
30. Roemmich, D. and J. Gilson, 2009: The 2004–2008 mean and annual cycle of temperature, salinity and steric height in the global ocean from the Argo Program. Progr. Oceanogr., doi:10.1016/j.pocean.2009.03.004.
31. Levitus, S., J. Antonov, and T. Boyer, 2005: Warming of the world ocean, 1955–2003, Geophys. Res. Lett, 32, L02604, doi:10.1029/2004GL021592.
32. Trenberth, K. E., J. T. Fasullo, and J. Kiehl, 2009: Earth’s global energy budget. Bull. Amer. Meteor. Soc., 90, 311-323.
33. Cazenave, A., K. Dominh, S. Guinehut, E. Berthier, W. Llovel, G. Ramillien, M. Ablain and G. Larnicol, 2009: Sea level budget over 2003-2008: A reevaluation from GRACE space gravimetry satellite altimetry and Argo. Global Planet. Change, 65, 83-88. doi: 10:1-16/j.gloplacha.2008.10.004.
34. Kay J. E., T. L’Ecuyer, A. Gettelman, G. Stephens and C. O’Dell, 2008: The contribution of cloud and radiation anomalies to the 2007 Arctic sea ice extent minimum. Geophys. Res. Lett., 35, L08503, doi:10.1029/2008GL033451

35. Lyman J. M., J. K. Willis, and G. C. Johnson, 2006: Recent cooling of the upper ocean. Geophys. Res. Lett., 33, L18604, doi:10.1029/2006GL027033.
36. Lombard A., D. Garcia, G. Ramillien, A. Cazenave, F. Fetchtner, R. Biancale, M. Ishii, 2006: Estimation of steric sea level variations from combined GRACE and Jason-1 data. Earth Planet. Sci. Lett., 254, 194 –202.
37. Willis, J. K., J. M. Lyman, G. C. Johnson and J. Gilson, 2007: Correction to ‘Recent cooling of the upper ocean’. Geophys. Res. Lett., 34, L16601, doi:10.1029/2007GL030323.
38. Willis, J. K., D. P. Chambers, R. S. Nerem, 2008: Assessing the globally averaged sea level budget on seasonal to interannual timescales. J. Geophys. Res, 113, C06015, doi:10.1029/2007JC004517.
39. Leuliette E. W., and L. Miller, 2009: Closing the sea level rise budget with altimetry, Argo, and GRACE. Geophys. Res. Lett, 36: L04608, doi:10.1029/2008GL036010.
40. Lozier, M. S., S. Leadbetter, R. G. Williams, V. Roussenov, M. S. Reed and N. J. Moore, 2008: The spatial pattern and mechanisms of heat-content change in the North Atlantic, Science, 319, 800-803.
41. Bryden, H. L., H. R. Longworth, S. A. Cunningham 2005: Slowing of the Atlantic Meridional Overturning Circulation at 26.5°N, Nature, 438, 655-657.
42. Cunningham, S. A., T. Kanzow, D. Rayner, M. O. Baringer, W. E. Johns, J. Marotzke, H. R. Longworth, E. M. Grant, J. J.-M. Hirschi, L. M. Beal, C. S. Meinen, H. L. Bryden. 2007: Temporal variability of the Atlantic Meridional Overturning Circulation at 26.5°N, Science, 317, 935-938.
43. Cunningham, S., M. Baringer, J. Toole, S. Osterhaus, J. Fisher, A. Piola, E. McDonagah, S. Lozier, U. Send, T. Kanzow, J. Marotzke, M. Rhein, S. Garzoli, S. Rintoul, S. Speich, S. Wijffels, L. Talley, J. Baehr, C. Meinen, A-M. Treguier, P. Lherminier, 2010: The present and future system for measuring the Atlantic meridional overturning circulation and heat transport. In Proc. "OceanObs’09: Sustained Ocean Observations and Information for Society" Conference (Vol. 2), Venice, Italy, 21-25 September 2009, Hall, J., Harrison D.E. and Stammer, D., Eds., ESA Publication WPP-306.
44. Stott, P. A., R. T. Sutton, and D. M. Smith, 2008: Detection and attribution of Atlantic salinity changes. Geophys. Res. Lett., 35, doi:10.1029/2008GL035874.
45. Gordon, A. L. and C. F. Giulivi, 2008. Sea Surface Salinity trends over 50 years within the Subtropical North Atlantic. Oceanography, 21, 20-29.
46. Holliday, N. P., S. L. Hughes, S. Bcon, A. Beszczynska-Möller, B. Hansen, A. Lavin, H. Loeng, K. A. Monk, S Østerhuis, T. Sherwin, W. Walczowski, 2008: Reversal of the 1960s to 1990s freshening trend in the northeast North Atlantic and Nordic Seas, Geophys. Res. Lett., 35, L03614, doi:10.1029/2007GL032675.
47. Hakkinen, S., and P. B. Rhines 2009: Shifting surface currents in the northern North Atlantic Ocean, J. Geophys. Res., 114, C04005, doi:10.1029/2008JC004883
48. Johnson, G. C., and J. M. Lyman. 2008. Global oceans: Sea surface salinity. In State of the Climate in 2007, D. H. Levinson and J. H. Lawrimore, eds., Bull. Amer. Meteor. Soc. 89:S45–S47.
49. Sabine C. L., R. A. Feely, N. Gruber, R. M. Key, K. Lee, 2004. The oceanic sink for anthropogenic CO2. Science
305, 367-71 50. Hood, M., M. Fukasawa, N. Gruber, G. Johnson, A.
Koertzinger, C. Sabine, B. Sloyan, K. Stansfield, T. Tanhua, 2010: Ship-based Repeat Hydrography: A Strategy for a Sustained Global Program. In Proc. "OceanObs’09: Sustained Ocean Observations and Information for Society" Conference (Vol. 2), Venice, Italy, 21-25 September 2009, Hall, J., Harrison D.E. and Stammer, D., Eds., ESA Publication WPP-306.
51. Monteiro, P. M. S., U. Schuster, A. Lenton, B. Tilbrook, C. L. Sabine, R. Wanninkhof, T. Takahashi, M. Hood, A. Olsen, M. Bender, J. Yoder, K. Rogers, A. J. Watson, 2010: A global sea surface carbon observing system: assessment of changing sea surface CO2 and air-sea CO2 fluxes. In Proc. "OceanObs’09: Sustained Ocean Observations and Information for Society" Conference (Vol. 2), Venice, Italy, 21-25 September 2009, Hall, J., Harrison D.E. and Stammer, D., Eds., ESA Publication WPP-306.
52. Gruber, N., M. Gloor, S. E. Mikaloff Fletcher, S. C. Doney, S. Dutkiewicz, M. J. Follows, M. Gerber, A. R. Jacobson, F. Joos, K. Lindsay, D. Menemenlis, A. Mouchet, S. A. Müller, J. L. Sarmiento, and T. Takahashi, 2009. Ocean sources, sinks, and transport of atmospheric CO2. Glob. Biogeochem. Cycles, 23, GB1005, doi:10.1029/2008GB003349
53. Feely, R. A., V. Fabry, A. Dickson, J.-P. Gattuso, J. Bijma, U. Riebesell, S. Doney, C. Turley, T. Saino, K. Lee, K. Anthony, J. Kleypas, 2010: An International Observational Network for Ocean Acidification In Proc. "OceanObs’09: Sustained Ocean Observations and Information for Society" Conference (Vol. 2), Venice, Italy, 21-25 September 2009, Hall, J., Harrison D.E. and Stammer, D., Eds., ESA Publication WPP-306.
54. Nerem, S., D. Chambers, E. Leuliette, G. Mitchum, M. Merrifield, J. Willis, 2010: Observations of Sea Level Change: What have we learned and what are the remaining challenges? In Proc. "OceanObs’09: Sustained Ocean Observations and Information for Society" Conference (Vol. 2), Venice, Italy, 21-25 September 2009, Hall, J., Harrison D.E. and Stammer, D., Eds., ESA Publication WPP-306.
55. Gu, G., R. F. Adler, G. J. Huffman and S. Curtis, 2007: Tropical rainfall variability on interannual-to-interdecadal and longer time scales derived from the GPCP monthly product. J. Climate, 20, 4033–4046.
56. Chao, B. F., Y. H. Wu, and Y. S. Li, 2008: Impact of artificial reservoir water impoundment on global sea level. Science, 320, 212–214.
57. Meier M. F., M. B. Dyurgerov, U. K. Rick, S. O'Neel, W. T. Pfeffer, R. S. Anderson, S. P. Anderson, A. F. Glazovsky, 2007: Glaciers dominate eustatic sea-level rise in the 21st Century, Science, 317, 1064–1067.
58. Cogley, J. G. 2009: Geodetic and direct mass-balance measurements: comparison and joint analysis, Annals Glaciol., 50(50), 96-100.
59. Rignot, E, J. L. Bamber, M. R. van den Broeke, C. Davis, Y. Li, W. J. van de Berg, E. van Meijgaard, 2008: Recent Antarctic ice mass loss from radar interferometry and regional climate modeling. Nature Geoscience, 1: 106-110, doi:10.1038/ngeo102.
60. Wouters, B., D. Chambers, E. J. O. Schrama, 2008: GRACE observes small-scale mass loss in Greenland.

Geophys. Res. Lett., 35, L20501, doi:10.1029/2008GL034816.
61. Köhl, A., and D. Stammer, 2008: Decadal sea level changes in the 50-Year GECCO ocean synthesis. J. Climate, 21, 1876–1890.
62. Church, J. A., and N. J. White, 2006: A 20th century acceleration in global sea-level rise. Geophys. Res. Lett., 33,. L01602, doi:10.1029/2005GL024826.
63. Rahmstorf, S., A. Cazenave, J. A. Church, J. E. Hansen, R. F. Keeling, D. E. Parker and R. C. J. Somerville, 2007: Recent climate observations compared to projections. Science, 316, 709.
64. Gregory, J.M., J.A. Lowe, and S.F.B. Tett, 2006: Simulated global-mean sea level changes over the last half-millennium. J. Climate, 19, 4576–4591.
65. Church, J. A., N. J. White, and J. M. Arblaster, 2005: Significant decadal-scale impact of volcanic eruptions on sea level and ocean heat content. Nature, 438, 74-77.
66. Leuliette, E., R. Nerem, and T. Mitchum 2004: Calibration of TOPEX/Poseidon and Jason altimeter data to construct a continuous record of mean sea level change. Marine Geodesy, 27, 79–94.
67. Church, J. A., N. J. White, R. Coleman, K. Lambeck, and J. X. Mitrovica, 2004: Estimates of the regional distribution of sea-level rise over the 1950 to 2000 period. J. Climate, 17, 2609–2625.
68. Church, J. A., N. J. White, T. Aarup, W. S. Wilson, P. L. Woodworth, C. M. Domingues, J. R. Hunter and K. Lambeck, 2008: Understanding global sea levels: past, present and future. Sustain. Sci., 3, 9-22.
69. Roemmich, D., J. Gilson, R. Davis, P. Sutton, S. Wijffels, and S. Riser. 2007: Decadal spinup of the South Pacific subtropical gyre. J. Phys. Oceanogr., 37, 162-173.
70. Barnett, T. P., D. W. Pierce, K. M. AchutaRao, P. J. Gleckler, B. D. Santer, J. M. Gregory and W. M. Washington, 2005: Penetration of human-induced warming into the world's oceans. Science, 309, 284-287.
71. Pierce, D. W., T. P. Barnett, K. M. AchutaRao, P. J. Gleckler, J. M. Gregory and W. M. Washington, 2006: Anthropogenic warming of the oceans: observations and model results. J. Climate, 19, 1873-1900
72. Palmer, M. D., and K. Haines, 2009: Estimating oceanic heat content change using isotherms, J. Climate, 19, 4953-4969.
73. Palmer, M. D., S. A. Good, K. Haines, N. A. Rayner and P. A. Stott, 2009: A new perspective on warming of the global oceans, Geophys. Res. Lett., 36, In press.
74. Pardaens, A., M. Vellinga, P. Wu, and B. Ingleby. 2008. Large-scale Atlantic salinity changes over the last half-century: A model-observation comparison, J. Climate, 21, 1698-1720.
75. Böning, C. W., A. Dispert, M. Visbeck, S. R. Rintoul and F. U. Schwarzkopf, 2008: The response of the Antarctic Circumpolar Current to recent climate change, Nature Geoscience, 1, 864 – 869.
76. Helm, K. P., N. L. Bindoff, J. A. Church, 2009. Global hydrological-cycle changes inferred from observed ocean salinity. Geophys. Res. Lett, submitted.
77. Smith, D. M., S. Cusack, A. W. Colman, C. K. Folland, G. R. Harris, and J. M. Murphy, 2007: Improved surface temperature prediction for the coming decade from a global climate model. Science, 317, 796-799.
78. Keenlyside, N. S., M. Latif, J. Jungclaus, L. Kornblueh and E. Roeckner, 2008: Advancing decadal-scale
climate prediction in the North Atlantic sector. Nature, 453, 84-88.
79. Pohlmann, H., J.H. Jungclaus, A. Köhl, D. Stammer, and J. Marotzke, 2009: Initializing decadal climate predictions with the GECCO oceanic synthesis: effects on the North Atlantic. J. Climate, 22, 3926-3938.
80. Balmaseda, M., D. Anderson, and A. Vidard, 2007: Impact of Argo on analyses of the global ocean, Geophys. Res. Lett., 34, L16605, doi:10.1029/2007GL030452.
81. Balmaseda, M., and D. Anderson, 2009: Impact of initialization strategies and observations on seasonal forecast skill, Geophys. Res. Lett., 36, L01701, doi:10.1029/2008GL035561
82. Anderson, D.L.T., F.J. Doblas-Reyes, M. Balmaseda and A. Weisheimer, 2009: Decadal variability: processes, predictability and prediction. ECMWF Technical Memorandum 591, ECMWF.
83. Boer G.J. and S.J. Lambert, 2008: Multi-model decadal potential predictability of precipitation and temperature, Geophys. Res. Lett., 35, L05706, doi:10.1029/2008GL033234.
84. Latif, M., et al., 2004: Reconstructing, monitoring and predicting multi-decadal-scale changes in the north Atlantic thermohaline circulation with sea-surface temperature J. Climate, 17, 1605-1614.
85. Troccoli, A. and T. N. Palmer, 2007: Ensemble decadal predictions from analysed initial conditions. Phil. Trans. Roy. Soc. A365, 2179-2191.
86. Hurrell, J. W., T. Delworth, G. Danabasoglu, H. Drange, S. Griffies, N. Holbrook, B. Kirtman, N. Keenlyside, M. Latif, J. Marotzke, G. A. Meehl, T. Palmer, H. Pohlmann, T. Rosati, R. Seager, D. Smith, R. Sutton, A. Timmermann, K. E. Trenberth, and J. Tribbia, 2010: Decadal climate prediction: Opportunities and challenges. In Proc. "OceanObs’09: Sustained Ocean Observations and Information for Society" Conference (Vol. 2), Venice, Italy, 21-25 September 2009, Hall, J., Harrison D.E. and Stammer, D., Eds., ESA Publication WPP-306.
87. Latif, M, T. Delworrth, D. Dommenget, H. Drange, W. Hazeleger, J. Hurrell, N. Keenlyside, G. Meehl, R. Sutton, 2010: Dynamics of Decadal Climate Variability and Implications for its Prediction. In Proc. "OceanObs’09: Sustained Ocean Observations and Information for Society" Conference (Vol. 2), Venice, Italy, 21-25 September 2009, Hall, J., Harrison D.E. and Stammer, D., Eds., ESA Publication WPP-306.
88. Balmaseda. M. A., O. Alves, T. Awaji, D. Behringer, N. Ferry, Y. Fujii, T. Lee, M. Rienecker, T. Rosati, D. Stammer, D. Smith, F. Molteni, 2010: Initialization for Seasonal and Decadal Forecasts. In Proc. "OceanObs’09: Sustained Ocean Observations and Information for Society" Conference (Vol. 2), Venice, Italy, 21-25 September 2009, Hall, J., Harrison D.E. and Stammer, D., Eds., ESA Publication WPP-306.
89. Lee, T.; D. Stammer, T. Awaji, M. Balmaseda, D. Behringer, J. Carton, N. Ferry, A. Fischer, I. Fukumori, B. Giese, K. Haines, E. Harrison, P. Heimbach, M. Kamachi, C. Keppenne, A. Köhl, S. Masina, D. Menemenlis, R. Ponte, E. Remy, M. Rienecker, A. Rosati, J. Schroeter, D. Smith, A. Weaver, C. Wunsch, Y. Xue, 2010: Ocean State Estimation for Climate Research. In Proc. "OceanObs’09: Sustained Ocean Observations and Information for Society" Conference

(Vol. 2), Venice, Italy, 21-25 September 2009, Hall, J., Harrison D.E. and Stammer, D., Eds., ESA Publication WPP-306.
90. Heimbach, P., G. Forget, R. M. Ponte, C. Wunsch, M. Balmaseda, D. Stammer, T. Awaji, D. Behringer, J. Carton, N. Ferry, A. Fischer, I. Fukumori, B. Giese, K. Haines, D. E. Harrison, F. Hernandez, M. Kamachi, C. Keppenne, A. Koehl, T. Lee, D. Menemenlis, P. Oke, E. Remy, M. Rienecker, A. Rosati, D. Smith, K. Speer, A. Weaver, J. Baehr, 2010: Observational Requirements for Global-Scale Ocean Climate Analysis: Lessons from Ocean State Estimation In Proc. "OceanObs’09: Sustained Ocean Observations and Information for Society" Conference (Vol. 2), Venice, Italy, 21-25 September 2009, Hall, J., Harrison D.E. and Stammer, D., Eds., ESA Publication WPP-306.
91. Zhang, S., M. J. Harrison, A. Rosati, and A. Wittenberg 2007: System design and evaluation of coupled ensemble data assimilation for global oceanic studies. Mon. Wea. Rev., 135, 3541-3564.
92 Doherty, S. J., S. Bojinski, A. Henderson-Sellers, K. Noone, D. Goodrich, N. L. Bindoff, J. A. Church, K. A. Hibbard, T. R. Karl, L. Kajfez-Bogataj, A. H. Lynch, D. E. Parker, I. C. Prentice, V. Ramaswamy, R. W. Saunders, M. Stafford-Smith, K. Steffen, T. F. Stocker, P. W. Thorne, K. E. Trenberth, M. M. Verstraete, F. W. Zwiers, 2009: Lessons learned from IPCC AR4:
Scientific developments needed to understand, predict and respond to climate change. Bull Amer. Meteor. Soc., 90, 497−513.
93. Church, J. A., et al., 2010. Ocean temperature and salinity contributions to global and regional sea-level change, In: Understanding Sea-level Rise and Variability, Eds. J. A. Church, P. L. Woodworth, T. Aarup and W. S. Wilson. Blackwells Pub., London. Doi: 10.1007/s11625-008-0042-4. http://wcrp.wmo.int/pdf/summary%20statement%202006-1004_low-res.pdf
94. Trenberth, K. E., R. Dole, Y. Xue, K. Onogi, D. Dee, M. Balmaseda, M. Bosilovich, S. Schubert, W. Large, 2010: Atmospheric reanalyses: A major resource for ocean product development and modeling. In Proc. "OceanObs’09: Sustained Ocean Observations and Information for Society" Conference (Vol. 2), Venice, Italy, 21-25 September 2009, Hall, J., Harrison D.E. and Stammer, D., Eds., ESA Publication WPP-306.
95. Lagerloef, G., J. Boutin, J. Carton, Y. Chao, T. Delcroix, J. Font, J. Lilly, N. Reul, R. Schmitt, F. Wentz, 2010: Resolving the global surface salinity field and variations by blending satellite and in situ observations In Proc. "OceanObs’09: Sustained Ocean Observations and Information for Society" Conference (Vol. 2), Venice, Italy, 21-25 September 2009, Hall, J., Harrison D.E. and Stammer, D., Eds., ESA Publication WPP-306.
Related Documents