INTERFUND SICAV Annual report and audited financial statements AUGUST 31, 2018 R.C.S. Luxembourg B8074 No subscriptions can be received on the basis of annual reports. Subscriptions are only valid if made on the basis of the current prospectus accompanied by the last available annual and semi-annual reports.

Welcome message from author
This document is posted to help you gain knowledge. Please leave a comment to let me know what you think about it! Share it to your friends and learn new things together.
Transcript
INTERFUND SICAV
Annual report and audited financial statementsAUGUST 31, 2018
R.C.S. Luxembourg B8074
No subscriptions can be received on the basis of annual reports. Subscriptions are only valid if made on the basis of the current prospectus accompanied by the last available annual and semi-annual reports.

Board of Directors 2Management's report 3Performance of the Sub-funds 16Statements of Net Assets 18Statements of Operations and changes in Net Assets 25Information on Net Assets 32Statements of Investment Portfolio and Other Net Assets
INTERFUND EURO CURRENCY 34INTERFUND BOND GLOBAL HIGH YIELD 38INTERFUND EURO BOND MEDIUM TERM 42INTERFUND EURO BOND SHORT TERM 1-3 44INTERFUND EURO BOND LONG TERM 46INTERFUND BOND US PLUS 48INTERFUND BOND JAPAN 54INTERFUND EQUITY ITALY 55INTERFUND EURO CORPORATE BOND 58INTERFUND TEAM EQUITY USA 78INTERFUND GLOBAL CONVERTIBLES 88INTERFUND EQUITY JAPAN 93INTERFUND EQUITY EUROPE 99INTERFUND EQUITY PACIFIC EX JAPAN 102INTERFUND EQUITY USA ADVANTAGE 105INTERFUND BOND GLOBAL EMERGING MARKETS 107INTERFUND EQUITY GLOBAL EMERGING MARKETS 121INTERFUND INTERNATIONAL SECURITIES NEW ECONOMY 131INTERFUND EMERGING MARKETS LOCAL CURRENCY BOND 135INTERFUND INFLATION LINKED 139INTERFUND SYSTEM EVOLUTION 143INTERFUND EURO BOND SHORT TERM 3-5 152INTERFUND EURO LIQUIDITY 154INTERFUND CRESCITA PROTETTA 80 155INTERFUND TEAM EQUITY EUROPE 156
Geographical Breakdowns 159Economical Breakdowns 163Currency Exchange Rates 167Forward Foreign Exchange Contracts 168Commitments on Future Contracts 183Commitments on Swap Contracts 186Commitments on Option Contracts 204Notes to the financial statements 209Report of the Réviseur d'Entreprises agréé 217Other Information to Shareholders (unaudited) 219Addresses 237
INTERFUND SICAV
Table of Contents
Copies of the annual and semi-annual reports are available at the registered office of Interfund SICAV, 9-11 rue Goethe,Luxembourg. Financial notices and daily Net Asset Value per share of the Sub-funds of the SICAV are published in appropriatefinancial newspapers. Daily issue and redemption prices per share of the Sub-funds of the SICAV are available at the registeredand at the administrative offices of Interfund SICAV. Financial notices are also published in the "Luxemburger Wort". Therestated articles of incorporation were lodged at the offices of the "Registre de Commerce et des Sociétés" on April 10, 2017where they are available for inspection and where copies thereof can be obtained upon request.
Page
INTERFUND SICAV
BOARD OF DIRECTORS
2
BOARD OF DIRECTORS
Franco TUTINO Chairman
Professor at the University of the Studies of Roma “La Sapienza” Roma
Riccardo NEGRO Director
Head of Business Developpement & Operations at Fideuram Investimenti SGR S.p.A. Milano Alex SCHMITT Director Attorney-at-Law BONN & SCHMITT Luxembourg
INTERFUND SICAV
MANAGEMENT’S REPORT
3
MACROECONOMIC SCENARIO 2018 has seen less remarkable global growth than in the second half of 2017, which was largely characterised by surprising upswings and high cyclical synchronisation across different areas of the global economy. In the first few months of 2018, growth was instead rather disappointing in the Euro Area and in Japan (which had both seen a surprise upturn in the previous year) but it marked a significant acceleration in the US following a sluggish first quarter. Signs of economic slowdown also came from China, particularly evident in summer 2018. Inflation data (in particular, core inflation, which excludes energy and food) confirmed that the USA is in a different cyclical position compared to other major economies. In fact, during the spring, core inflation (measured by the consumption deflator) broadly met the Fed’s 2% target for the first time since April 2012, while in the Eurozone and Japan, core inflation remained well below the respective central bank targets. The sharp rise in oil prices also contributed to an increase in total inflation in both the US and the Eurozone. With such diverging performance between the USA and other major economies it comes as no surprise that the Fed has continued to raise rates gradually, by 25 basis points every quarter (in December 2017 and in March and June 2018), and is adopting an approach that is confirmed to be at the margin more aggressive than expected by markets. The ECB is instead taking a more cautious approach: an announcement was made at the June’s meeting to complete the Quantitative Easing programme by the end of the year 2018, but this decision was tempered by the commitment to keep rates stable for another year or so. On its part, the Bank of Japan - despite making minor changes to its stance in the meeting at the end of July 2018 - confirmed that the launch of its exit strategy from ultra-expansionary monetary policy is still very distant. Signs of monetary policy easing were also seen in China during the summer. On the political front, one recent development has had a significant impact on the markets - the US Administration’s move towards protectionism. Although no trade policies were adopted in 2017, as promised in Trump’s election campaign, tensions continued to escalate with all the main trading partners from early 2018. In addition to the tariffs imposed on solar panels and washing machines, in March the US Administration announced further tariffs on steel and aluminium imports on the grounds of national security. The tariffs came into immediate effect on Chinese and Japanese imports and, from June 2018, also on imports from the EU, Canada and Mexico. The US Administration has focussed in particular on China, imposing additional tariffs of 25% on 50 billion USD of Chinese imports from 6 July 2018, in response to the unfair trade practices adopted by the Asian country. The Trump Administration has launched a process to impose further tariffs on another 200 billion dollars’ worth of Chinese imports. The EU and China have retaliated against the US tariffs. The US Administration also seems set to impose tariffs on car imports, again for reasons linked to national security. The risk of a full-blown trade war has therefore increased substantially. Even the renegotiation of the NAFTA, which seemed to be nearing conclusion in mid-May, ended without an agreement. Instead, the USA and Mexico signed a preliminary bilateral agreement, but only at the end of August 2018. In the Euro Area, in late May, the political risk was once again at the top of the agenda following the rather chaotic events that led to the creation of the "populist" coalition government between Lega and the Five Star Movement in Italy - an event that had rather heavy impacts on Italian assets. The uncertainty surrounding the stance of the Italian government, particularly concerning fiscal policy, continued throughout the summer. August also brought news of a sharp depreciation in the Turkish lira, again triggered by political tensions with the USA, but which in reality reflect the gradual deterioration of the fundamentals of the Turkish economy and the failure of the Turkish authorities to take remedial measures over the last few years. In the first quarter 2018, GDP growth in the USA slowed considerably compared to the second half 2017, mainly due to a temporary deceleration in consumer spending. It then soared to over 4% annualized in the second quarter due to an upturn in consumption and the positive contribution of net exports. More generally, growth benefitted from the positive impact of both the tax reform approved at the end of 2017 and the sweeping public spending bill passed by Congress in February 2018. With performance well above the potential growth rate, employment levels have continued to rise at a fast pace and unemployment fell further to 3.8% in May 2018 after remaining stable at the beginning of the year. However, wage growth returned to relatively more moderate levels after an unexpected acceleration at the beginning of the year. On the other hand, inflation recovered following the surprising downward trend seen in 2017. In particular, core inflation (measured by the consumption deflator - the preferred measure of the Fed) returned to 2% (Fed target) for the first time since April 2012. During the first few months of 2018, businesses confidence in the Euro Area saw a marked downward correction, albeit, in part expected given the historically high levels seen between late 2017 and early 2018. This deterioration continued up to April 2018 and the first convincing signs of recovery were only seen in June 2018. Business confidence was in fact dampened by the climate of uncertainty caused by the US Administration’s drift towards protectionism - a particularly negative development in an area so open to international trade like the Eurozone. GDP growth also slowed in the first half of the year- from an average quarterly rate of 3% in 2017 to 1.5% - due mostly to a decline in exports. On the other hand, consumer spending remained solid (as did consumer confidence) thanks to the strong labour market conditions and sustained employment growth. Wages also returned to growth - at the highest rates seen in the last six years - more in line with the ECB's inflation target. Total inflation was below target in the first quarter but recovered in the spring, rising to 2% in June 2018 (from 1.3% in January 2018), still driven mainly by increases in energy and food prices. Core inflation was broadly stable at around 1% for the entire period. In Asia, economic growth was more stable with moderate inflationary pressure. In China, GDP growth was above expectations at the beginning of the year, but then began to slow - especially in terms of infrastructural investments- particularly evident in the data released in early summer, probably due to the restrictive policies adopted in relation to lending. To counteract the effects of these policies and for fear of a trade war with the US Administration, the monetary authorities have cut the required reserve ratio twice since the beginning of the year 2018. Again in response to the risk of a slowdown in growth, the authorities have also decided to move towards a more expansionary fiscal policy. Due to trade tensions, the Yuan quickly fell against the dollar over the summer 2018. In Japan GDP declined unexpectedly in the first quarter 2018, but subsequently growth recovered to almost 3% annualized in the second quarter. Despite some signs of improvement in wage growth, inflation is still low (especially core inflation), which has induced the BoJ to remove the timeframe to meet the 2% inflation target and to revise its inflation forecast downwards. In the meeting held at the end of July 2018, although the BoJ announced minor changes to its stance (adoption of forward-guidance and greater flexibility in defining ten-year yields) the monetary policy was still broadly expansionary and likely to remain so for a very long time.
INTERFUND SICAV
MANAGEMENT’S REPORT (CONTINUED)
4
EQUITY MARKETS We have so far witnessed a decade of an equity bull market; global markets have survived to any kind of event. Politics has continued to dominate the headlines: from the nuclear test from North Korea, to the ongoing Brexit negotiations, and the beginning of populism in Europe which threatened the integrity of the whole European project. One key feature of the global economy during the course of the year 2018 was that it was growing almost everywhere. For sure, it was not growing at its pre-financial crisis pace but at what appeared to be a sustainable level above 3%. Economists, on average, raised their growth forecasts since the start of the year, with Europe a key component of those upgrades, a welcomed development after years of unfulfilled promises. China also continued to defy the sceptics, with growth of 6.9% in both the first and second quarters 2018. If there was disappointment, this was probably due to the USA with its regular weak start to the year; which also raised questions about the reliability of the official macro data statistics. In Europe and in the UK in particular, the weight of the Brexit uncertainty and an inflationary squeeze on real incomes appeared to have had an increasingly negative effect on investment and consumption, although there were some positive signs in terms of exports. In Japan corporates continued to report good profit growth during the year benefiting from solid economic conditions and from political stability which translated into a tighter labour market. The performance of the Japanese market was nearly as positive as the rest of the world even if lagging behind the profit growth of the other countries. It did not slip back into negative growth thanks to what appears to be a nearly endless monetary stimulus from the Bank of Japan. There are pockets of growth that will always be under pressure because of the country’s demographic deficit, of an ageing and shrinking population. Better news at the margin have come from Japanese companies who, used to years of flat demand, have stockpiled cash, and are now more motivated to return it to shareholders thanks to improved corporate governance codes of practice. In the Emerging Markets, performance was good until fears of unfriendly US policies increased. China’s latest growth numbers were of benefit and so was the weakness of the US dollar, a currency in which many EM companies have large liabilities. Fears of another Asian Crisis remain present, even if we continue to believe that the majority of EM countries are in much better shape now than they were in the last decade. In the long term, we also believe that EM countries, in aggregate, will grow faster than Developed Market countries. Superior demographic and social mobility trends, although not universal, should help deliver superior returns in the long term. In the past year, we have seen a move from a central bank liquidity driven market to an earnings driven market that has proven to be trickier and more likely volatile. In addition to that, the market volatily increased due to the uncertainty arising from trade tensions continuously emanating from the US President. Most relevant of all is the trade war with China on tariffs involving more than $200 billion worth of exports. The main scenario remains a synchronised growth phase for the global economy that will possibly last for a few more years. It seems that we are not yet at the end of the current economic cycle; however, by factoring the threats of trade wars, risks to this view are skewed to the downside. Despite strong earnings, growth, and resilient prospects for further growth, over recent months investors have been more risk adverse and cautious. We expect this trend for equity markets over the next 12-18 months to remain intact but equally we recognize that there are short-term challenges and that markets may find it difficult to make much progress over coming months. As far as geopolitical challenges are concerned, Emerging Markets will be a focus due to trade wars where our expectation is negative, with nobody being a winner. The politics of Brexit, political instability in Germany and Italy, and US mid-term elections will also be a focus for the coming months. Moreover, any particular sign of further increases in inflation will raise concerns about further interest rate rises and higher bond yields; while the abundant liquidity of recent years will continue to diminish as a result of the ongoing quantitative tightening by the FED and the forthcoming end of QE program by the ECB. In summary, the medium term outlook is positive but there are reasons to expect little progress in the coming months.
INTERFUND SICAV
MANAGEMENT’S REPORT (CONTINUED)
5
FIXED INCOME MARKETS The last 12 months have been full on challenges for fixed income markets as unexpected events hit the news. Back in September 2017, the Fed was pausing. Data from Eurozone strengthened, Emerging markets were not a concern. Then the Fed resumed its hiking cycle in December 2017 before the new chairman, Jerome Powell, took over. The fixed income reacted by starting to revise the US rate cycle higher and US bond markets sold off, the US 10y rate moved from 2% in September 2017 to almost 3% in February 2018. The German 10y moved from 0.30% to 0.77%. Higher interest rate perspectives spook the US equity market, which was ripe for a correction as it was overbought. Moreover, while the US data was boosted by the tax cuts, the Euro data started to disappoint surprisingly at the beginning of 2018. Indeed the IFO index declined from November 2017 all the way to July 2018. Combined with a sticky low core CPI in the Eurozone, the rates in the Eurozone did not rise as much as expected, to a point where the 10y treasury-bund spread reached a more than 25y high at 260bps in June 2018. Turbulences arrived from two fronts in May 2018: Italian politics and Turkey. They had nothing in common but triggered a violent risk off on the European markets. In Italy, the coalition of the two populist parties, to form a government took the market by surprise. Positioning did not help as record low rates for years have pushed investors to riskier assets from Italian to Turkish bonds. The market reactions have been violent. The 10y BTP Bund spread reached 290bps very quickly. It also demonstrated the lack of liquidity in the market and the difficulty to absorb flows knowing that the ECB is still buying BTPS. The ECB announced in the June 2018 meeting that it would intend to stop the QE program at the end of the year but it would reinvest the proceeds of the maturing bonds. It also pre-committed not to raise rates before the 2019 summer, which was a surprise. The market took it as dovish and by summer 2019 it could be that the Fed is done with hiking. At the ECB, the leader of the hawks, Weidmann, is very quiet as if he wants to have a chance of succeed Draghi, he needs to be seen as more dovish. In Japan, despite massive QE and government pressure on wages, the inflation is not rising to its target of 2%. Nevertheless, BoJ has not moved the target for 10y JGBs from 0% to 0.10%. Less purchase of JGBs are expected. As we are entering soon the last quarter of 2018, looking back to the last 12 months, the fixed income is in a place that would have been hardly imaginable 12 months ago. This is more a reflection of dominant fear than central banks actions. The current market movers are the Italian budget, the Brexit ending discussions, the tariffs, the Chinese potential slowdown and the EM situation. It is very politically charged and hard to predict. FOREIGN EXCHANGE MARKET The past 12 months in foreign exchange markets resulted in contrasting outcomes for developed and emerging currencies. Whereas developed market currencies were stable with mild volatility, emerging market currencies suffered, and dramatically so towards the end of the period. The Euro declined modestly against the US Dollar, Sterling and Yen while outperforming against the commodity currencies of Australia, New Zealand and Canada as well as the Scandinavian currencies. The Euro had been particularly strong in the early months of the year but despite the ECB announcing an explicit end to QE by the end of the year 2018. The ECB also explained that no rate hike is going to be considered until at least summer 2019. This change in forward guidance was on the more dovish side, versus expectations of a first hike around June 2019 and placed the Euro at a significant yield disadvantage compared to other developed market currencies. The US Dollar was weak in the first half of the period but regained lost ground in the last few months. The Federal Reserve raised rates in December 2017 and twice more by the end of the summer 2018. This action allied to strong economic performance and the introduction of tax cuts, resulted in the turnaround for the US currency. Sterling started the period in a very weak position as fears of a disorderly Brexit gripped the market. While those fears still very much remain today, the Sterling managed to gain due to periods of optimism around a benign exit deal being reached with the European Union. A somewhat surprising rate hike by the Bank of England also temporarily shored up the currency. However, as the deadline to reach an agreement is fast approaching, Sterling finds itself not too far from the lows reached post the initial vote. The Yen performed well during periods of risk aversion and similarly suffered when optimism was high. The Bank of Japan adjusted policy so it could buy stocks and bonds more flexibly, including allowing the 10-year government bond yield to move in a slightly wider band around zero percent. The Bank is unlikely to raise interest rates for quite some time and recent steps to make policy more flexible are not to be considered as preparation for policy normalization. The Australian and New Zealand Dollars maintained their strong correlation with commodity prices and weakened in tandem with the gold price during the period. The Canadian Dollar also suffered as agreement on a new NAFTA deal for Canada remains elusive. In Scandinavia, The Swedish Krona was particularly weak as the Riksbank continued with their ultra-loose monetary policy. The situation for emerging market currencies took a turn for the worse during the summer. Countries with large current account deficits, including Turkey and South Africa, were particularly hard hit.
INTERFUND SICAV
MANAGEMENT’S REPORT (CONTINUED)
6
TRENDS OF SUB-FUNDS INTERFUND EURO CURRENCY German government short-term yields were rather stable over the period, reflecting a cautious approach by the ECB, which was finally crystallized in the commitment to keep rates unchanged through the summer of next year. Oppositely, other government curves were more volatile. The Italian short end came under remarkable pressure in May, and remained volatile since then due to the political developments. Credit spreads widened for most of the second part of the year. The activity of the Sub-fund in the first part of the year was focused on diversifying the portfolio into investment grade corporate bonds for a portion equivalent to less than half of the AUM. In the following months, the exposure to the Italian government bonds was opportunistically increased and then reduced, before and after the increase in volatility in late May. The negative performance is the result of various factors. Yields in the short end in Europe remained negative for many areas of the market, credit spreads widened and the Italian exposure gave a negative contribution to the bottom line. The Sub-fund underperformed both in absolute and relative terms. INTERFUND BOND GLOBAL HIGH YIELD Global high yield bonds posted negative returns over the year. Demand for the asset class was negatively impacted by trade-related tensions between the US and the rest of the world, as well as the political crisis in Turkey. Strong economic growth and good corporate fundamentals were the dominant themes at the beginning of 2018, leading to spread compression across geographies. However, more rigorous monetary policies in Europe and the US arose towards the end of the first quarter of 2018. This, along with geopolitical risks such as political woes in Italy and tensions between Britain/USA and Russia had a negative impact on regional indices. Global high yield bonds remain exposed to macroeconomic factors, such as uncertainty surrounding Italy’s new anti-establishment government coalition, ongoing trade tensions and weakness in emerging markets. While the total market capitalization of high yield bonds has plateaued in recent years due to light supply and few securities moving to investment grade rating, spreads have widened to a two-year high. From a regional perspective, European high yield bonds outperformed compared to their US counterparts, driven by B-rated credits. In terms of regional positioning, the holding in US high yield bonds was reduced following the increase this year as valuations now appear stretched. Meanwhile, the allocation to European credits was increased, as spreads widened due to concerns around Italy’s anti establishment government and the risk of a possible future breach of EU spending rules. From a ratings perspective, the Sub-fund rotated some of the exposure from single-B bonds into BB rated names. On the sector front, high oil prices make energy credits attractive. On the other hand, the position in communications was reduced amid concerns around the fundamental outlook for the sector following the double-digit earnings decline reported by a few large corporates. The Sub-fund had a negative performance in absolute and relative terms. The Sub-fund’s hedging strategy via the use of index credit default swaps had a negative impact on returns as spreads tightened. However, these losses were partially offset by positive credit selection in the financial sector. Holdings in Caixa Geral De Depositos and Ally Financial added value. In relation to ratings, the underweight positioning in euro denominated B-rated bonds reduced the performance. In contrast, the bias against US single B-rated credits supported relative returns. From an issuer standpoint, the overweight positioning in JC Penney was the main cause of low performance: the department store chain posted disappointing results and forecast a worse-than-expected full-year loss. INTERFUND EURO BOND MEDIUM TERM From September 2017 to end of August 2018, the main driver of movement has been the end of the ultra-loose financial conditions that Central banks had put in place post the financial and Euro crisis: the negative depot rate at the ECB and the ECB quantitative easing (QE). Indeed, low rates and multiple QEs were not supposed to last that long. The Fed has stopped its (“QE”) years ago and continued to increase interest rates as the US economy is still growing. So the widening of the spread between US yields and the German one has been incredible as the 10y spread reached a record level of 260bps. Looking forward, the market is concerned that the weight of the US rate hikes could jeopardise one of the longest US expansion. Another concern is the size of the US deficits. In Eurozone, the concerns are related to the Brexit, the Italian politics and also the overall low level of core inflation. The ECB has communicated that the QE will stop in December 2018 and that there will be no rate increase before summer 2019. Rate in core Euro-zone are low and they are starting to normalise. The Sub-fund carried a low risk in general versus its benchmark. Between September 2017 and the end of August 2018 almost all the European bonds ended lower as rates are higher. The most dramatic move has been on the Italian bonds where the difficult political situation has put extra pressure on them. This year the Sub-fund tried to add new sources of alpha, betting not only on higher rates in core Eurozone but also in the US. The Sub-fund also tried to be more constructive on the Italian debt but the price action was too dramatic. On the FX markets, the Sub-fund took various small positions. The Sub-fund recorded a negative performance in absolute term and a small in relative terms.
INTERFUND SICAV
MANAGEMENT’S REPORT (CONTINUED)
7
INTERFUND EURO BOND SHORT TERM 1-3 From September 2017 to end of August 2018, the main driver of movement has been the end of the ultra-loose financial conditions that Central banks had put in place post the financial and Euro crisis: the negative depot rate at the ECB and the ECB quantitative easing (QE). Indeed, low rates and multiple QEs were not supposed to last that long. The Fed has stopped its (“QE”) years ago and continued to increase interest rates as the US economy is still growing. So the widening of the spread between US yields and the German one has been incredible as the 10y spread reached a record level of 260bps. Looking forward, the market is concerned that the weight of the US rate hikes could jeopardise one of the longest US expansion. Another concern is the size of the US deficits. In Eurozone, the concerns are related to the Brexit, the Italian politics and also the overall low level of core inflation. The ECB has communicated that the QE will stop in December 2018 and that there will be no rate increase before summer 2019. Rate in core Euro-zone are low and they are starting to normalise. This Sub-fund is positioned at the beginning of the yield curve. So some of its constituents are made of bond with negative yield. Also, it is immune to the behaviour of the long-end bonds and therefore it is not a volatile Sub-fund unless the ECB starts hiking interest rates. On top of its benchmark, we tried this year to add positions that could help the performance of the Sub-fund, such as short position on rates which would perform if the rates were going higher while the benchmark would suffer. However, the impact on the performance of the Sub-fund was marginal, and the Sub-fund provided a negative performance in absolute terms and in relative terms. INTERFUND EURO BOND LONG TERM From September 2017 to the end of August 2018, the main driver of movement has been the end of the ultra-loose financial conditions that Central banks had put in place post the financial and Euro crisis: the negative depot rate at the ECB and the ECB quantitative easing (QE). Indeed, low rates and multiple QEs were not supposed to last that long. The Fed has stopped its (“QE”) years ago and continued to increase interest rates as the US economy is still growing. So the widening of the spread between US yields and the German one has been incredible as the 10y spread reached a record level of 260bps. Looking forward, the market is concerned that the weight of the US rate hikes could jeopardise one of the longest US expansion. Another concern is the size of the US deficits. In Eurozone, the concerns are related to the Brexit, the Italian politics and also the overall low level of core inflation. The ECB has communicated that the QE will stop in December 2018 and that there will be no rate increase before summer 2019. Rate in core Euro-zone are low and they are starting to normalise. The Sub-fund carried a low risk in general versus its benchmark. Between September 2017 and the end of August 2018 almost all the European bonds ended lower as rates are higher. The most dramatic move has been on the Italian bonds where the difficult political situation has put extra pressure on them. This Sub-fund carries a lot of duration due to its benchmark. It is also very sensitive to movement of spread within the countries of Eurozone. In September 2017, the Sub-fund performance suffered from active positions and so the positions were reduced then. In 2018, the Sub-fund active strategies have been managed with very tight risk control. As a result, over the year from September 2017, the Sub-fund had a negative performance. INTERFUND BOND US PLUS Over the past year the US yield curve reached its flattest point since 2007 and equities sold off violently in February. Trade war rhetoric escalation, an anti-establishment coalition in Italy and political and economic turbulence in Latin America added to uncertainty. The USD rallied against most developed and Emerging Market currencies, risk asset returns were mixed with credit spreads widening and Emerging Markets selling off markedly. The Sub-fund has been overall underweight duration with a preference for U.S. duration against short exposure in other developed regions including the U.K. and Japan; positioning in Japan serves as a cheap hedge against global rates moving higher. Credit exposure remains diversified beyond Investment Grade and High Yield as valuations warrant a more defensive line (shorter maturity, higher quality). The portfolio carries positions in mortgage credit – particularly agencies - and select High Yield issues. Currency wise the Sub-fund remains strategic due to the uncertainty on the fluctuation of the US dollar. Some strategic exposures to higher carry Emerging Market currencies remain in particular Russian ruble, Mexican peso and Indian rupee. The Sub-fund’s positions in non-agency Mortgage Back Securities contributed positively to performance. Developed market rate strategies - including underweight exposure to U.S. rates and select Eurozone positions (Italian BTP, German Bunds) – contributed positively to performance thanks to higher yields and policy normalization in the US. Strategic exposure to select Developed Market (Swedish krona) and high carry Emerging Market reduced the performance as they broadly depreciated on the back of dollar strength. The Sub-fund had an absolute positive performance but it underperformed the benchmark.
INTERFUND SICAV
MANAGEMENT’S REPORT (CONTINUED)
8
INTERFUND BOND JAPAN The Bank of Japan pledged to keep interest rates “extremely low” for an extended period and adjusted policy so it could buy stocks and bonds more flexibly, including allowing the 10-year government bond yield to move in a slightly wider band around zero percent. Governor Haruhiko Kuroda stated that the Bank is unlikely to raise interest rates for “quite some time” and recent steps to make policy more flexible are not preparation for policy normalization. Despite five years of massive asset buying and ultra-low rates under Kuroda, the BOJ remains far from achieving its 2 percent inflation target. The Sub-fund kept a full allocation to Japanese government bonds, with an overall neutral allocation in term of duration exposure. Tactical foreign exchange positions were enacted at various stages throughout the year. The absolute performance of the Sub-fund was positive and underperforming the benchmark. INTERFUND EQUITY ITALY During the end of 2017 and the first four months of 2018 the Italian equity market had a very positive performance. The problem started at the end of April, when after the Italian political election, a government was formed between the two most extremist parties: Lega Nord and 5Star Movement. This scenario was the worst in the market expectations because it could lead to frictions with the EU on budget, public spending and so on. Tensions with the Commission indeed flared up in late summer over several affairs such the stop to the immigration flow, proclamations of fiscal tax cut and basic income for the unemployed, which threatened EU fiscal compact rules and the debt/gdp ratio reduction trend. Faced with this situation the ‘Italian country risk’ reappeared massively, bringing a lot of sell off in the Italian equity market and also in the Italian sovereign bond, and pushing the spread between BTP and Bund near 300 basis point at the end of August. All sectors were penalized, with the financials being the most impacted. From an operational point of view, depending on the market situation, there has been a lot of trading in the more volatile stocks, in particular, banks. The weight of mid and small capitalizations was progressively reduced and the focus of the portfolio was concentrated more on stocks with higher and sustainable dividend. The Sub-fund had an absolute negative performance but it outperformed relative to the benchmark. INTERFUND EURO CORPORATE BOND The year ended 31 August 2018 can be characterised as having been dominated by macro and geopolitical themes as opposed to broader credit fundamentals or sectoral /single name developments. A prevalence of broad macro themes, such as trade wars and tariffs, politics and populism, Central Bank’s moves towards balance sheet normalisation and moderation of QE, to name only a few; all contributed towards a very challenging and at times volatile trading and investment backdrop. For the first half of the period, corporate credit enjoyed meaningful technical support thanks to the ECB’s QE asset purchase programme. Price insensitive buying resulted in an overriding beta compression regardless of credit quality, cumulating at times in a relentless melt up across credit spreads. This was driven by a combination of strong investor demand, positioning technical and a dearth of primary market issuance. In particular, this backdrop saw peripheral issuer bonds strongly outperforming, benefitting from a relentless reach for yield. This prevailing tone came to an abrupt halt around February, following a substantial uptick in volatility which had inevitable knock on effects across credit markets. In particular, financial assets as a whole began to drift materially wider, while corporate assets continued to benefit from the anchoring effect of the Corporate Sector Purchase Programme (CSPP). In addition to profit taking behaviour, the risk off tone in financial assets was further exacerbated by the extremely consensus overweight investor positioning, as well as some single name idiosyncratic stories which further undermined the overall tone. While the fundamental underpinnings of our selectively constructive view on credit broadly remained in place, (generally better fundamental credit health among mainstream IG issuers, benign supply expectations, supportive regulatory backdrop, CSPP technicals, among others), the Sub-fund recognised the impact of broader market volatility, and sought to proactively reshape Sub-fund exposures to take profits, manage potential downside risk, all while remaining primed to capitalise on constructive phases of opportunity. Core portfolio over weights were limited to the highest conviction positions only, cash balances were taken to considerably higher than average levels, all with an ultimate trading focus on risk optimising relative value opportunities. The Sub-fund had an absolute negative performance and underperformed relative to the benchmark.
INTERFUND SICAV
MANAGEMENT’S REPORT (CONTINUED)
9
INTERFUND TEAM EQUITY USA – Class A For the year ended 31 August 2018, the Sub-fund executed its investment strategy during a period of significant tax and trade policy upheaval, central bank transition, and single stock volatility. In the past year, significant fiscal stimulus was passed in the form of meaningful corporate tax cuts, repatriation incentives, and a large spending bill. Offsetting this was a steady and predictable Federal Reserve hiking cycle and US threats of tariff imposition including against the EU, China, and NAFTA, with subsequent counter threats from affected nations. This news flow prompted a record earnings surge for US companies in the first half of 2018 and a debate about the correct multiple to pay for those earnings based on peak of cycle fears and analysis. Year to date, the market’s conclusion was to advance equity prices but with a somewhat contracted multiple, assuming that current conditions were growing at peak rates. Resolution to the tariff uncertainties is key to the next several quarters’ equity prices. Additionally, the midterm election in November 2018 will determine whether Republican priorities can continue to advance or whether the US is in for a resumption of gridlock conditions. During this period, the Sub-fund selected industries and individual stocks which had exposure to a rising economy and reasonable valuations. The Sub-fund typically had a balance between growth and value factors within its holdings. During most of this period, equities which have high dividend characteristics (“bond proxies”) were often avoided in deference to their declining attractiveness while the Fed raised rates. The Sub-fund retained its preference for large cap equities over smaller market caps. Performance for the Sub-fund during this period was positive in absolute terms as growth’s persistent outperformance against value balanced out alpha across much of the portfolio. However, the Sub-fund underperformed relative to the benchmark. INTERFUND TEAM EQUITY USA – Class H For the year ended 31 August 2018, the Sub-fund executed its investment strategy during a period of significant tax and trade policy upheaval, central bank transition, and single stock volatility. In the past year, significant fiscal stimulus was passed in the form of meaningful corporate tax cuts, repatriation incentives, and a large spending bill. Offsetting this was a steady and predictable Federal Reserve hiking cycle and US threats of tariff imposition including against the EU, China, and NAFTA, with subsequent counter threats from affected nations. This news flow prompted a record earnings surge for US companies in the first half of 2018 and a debate about the correct multiple to pay for those earnings based on peak of cycle fears and analysis. Year to date, the market’s conclusion was to advance equity prices but with a somewhat contracted multiple, assuming that current conditions were growing at peak rates. Resolution to the tariff uncertainties is key to the next several quarters’ equity prices. Additionally, the midterm election in November 2018 will determine whether Republican priorities can continue to advance or whether the US is in for a resumption of gridlock conditions. During this period, the Sub-fund selected industries and individual stocks which had exposure to a rising economy and reasonable valuations. The Sub-fund typically had a balance between growth and value factors within its holdings. During most of this period, equities which have high dividend characteristics (“bond proxies”) were often avoided in deference to their declining attractiveness while the Fed raised rates. The Sub-fund retained its preference for large cap equities over smaller market caps. Performance for the Sub-fund during this period was positive in general terms as growth’s persistent outperformance against value balanced out alpha across much of the portfolio. However, the Sub-fund underperformed versus benchmark. INTERFUND GLOBAL CONVERTIBLES The second half of 2017 capped off a strong period for risk assets as market participants witnessed a profound increase in risk appetite as a result of encouraging corporate earnings and downside political risks failing to materialize. Risk assets continued their positive momentum into 2018, although increased levels of volatility returned to markets as a result of mixed macroeconomic data combined with trade-war tensions between the US and China. Global Convertibles delivered a modest return over the period while primary market issuance picked up markedly in 2018. The Sub-fund lost over the last 12 months and underperformed the benchmark which advanced in relative terms. From a performance point of view, sector attribution was the main positive driver, regional attribution was marginally negative while security selection detracted. On a regional basis, EMEA was the only positive contributor while other regions detracted overall for the period. With regards to security selection, the best individual performer on a relative basis was the timely decision to cut exposure to Steinhoff as the company's share price plummeted following an accounting scandal. The largest detractor was non-index name, Cobalt International Energy. Cobalt's bonds rallied after the firm filed for bankruptcy in December 2017 but fell sharply in March 2018 when the results of the auction for their Gulf of Mexico assets came in below expectations. The Sub-fund underperformed in both relative and absolute terms.
INTERFUND SICAV
MANAGEMENT’S REPORT (CONTINUED)
10
INTERFUND EQUITY JAPAN – Class A The last twelve months have seen the global stock markets reach new highs by the last quarter of 2017 and the beginning of 2018, on supportive economic Data from Japan and accommodative monetary policy. The sharp decline in February 2018 has put an end to the era of low volatility and brought the financial markets into a new environment of abrupt declines and sharp jumps in volatility. The latters were caused by geopolitical uncertainties in North Korea and Europe, alongside global trade concerns raised by the US administration undermining the free trade. The Japanese stock market struggle in a price range in since first quarter of 2018, and the Yen has been decreasing against the Dollar, whilst the US markets were reaching new highs. During the period, the Sub-fund had an underexposure on Industrials, Financials and Consumer discretionary stocks, while overweighting Energy and Real Estate. The Sub-fund performance was slightly lower than the benchmark in relative terms but recorded a positive performance in general terms. Financial stocks performed poorly, whilst Energy was the highest performing sector. INTERFUND EQUITY JAPAN – Class H The last twelve months have seen the global stock markets reach new highs by the last quarter of 2017 and the beginning of 2018, on supportive economic Data from Japan and accommodative monetary policy. The sharp decline in February has put an end to the era of low volatility and brought the financial markets into a new environment of abrupt declines and sharp jumps in volatility. The latters were caused by geopolitical uncertainties in North Korea and Europe, alongside global trade concerns raised by the US administration undermining the free trade. The Japanese stock market struggled in a price range in since first quarter of 2018, and the Yen has been decreasing against the Dollar, whilst the US markets were reaching new highs. During the period, the Sub-fund had an underexposure on Industrials, Financials and Consumer discretionary stocks, while overweighting Energy and Real Estate. The Sub-fund performance was slightly lower than the benchmark in relative terms but recorded a positive performance in general terms. Financial stocks performed poorly, whilst Energy was the highest performing sector. INTERFUND EQUITY EUROPE In 2018 European Equity Markets recorded a small positive performance continuing the trend of the last few years. It has been a year characterized and dominated by macro and political news even if the economic underlying trends has been relatively benign in Europe and Asia and above all in the U.S.A. where the tax reductions proposed by the new administration have helped to boost the American indexes. Notwithstanding this economic backdrop the uncertainty related to the rise in populism in Europe, the political situation in Italy and the fears related to the trade wars between the U.S.A. and China mainly have put a lid to the performances of the European Indexes. In terms of sectorial performances, the year has been characterized by a partial reversal of the previous year’s winner and losers with good performances recorded by Oil & Gas and Media sectors while the laggards have been mainly Telecom and Banks. The Technology sector continues to be the preferred choice by the investors, on the basis of the extraordinary performances recorded by the sector in the U.S.A and the continued growth in sales and earnings shown by these companies also in Europe. During the year strong focus was on the IT sector, given the appealing growth perspectives. Consumer discretionary sector and healthcare sectors were two other areas where analysis was focused, in relation to the valuations level and earnings growth potentials. The investment approach of the Sub-fund is anchored to the “Growth at reasonable price” philosophy and a medium term investment horizon. During the period, the Sub-fund recorded a positive performance in both absolute and relative terms.
INTERFUND SICAV
MANAGEMENT’S REPORT (CONTINUED)
11
INTERFUND EQUITY PACIFIC EX JAPAN – Class A MSCI Pacific ex Japan (developed countries) posted a positive performance. The best performer market was Australia followed by New Zealand while Hong Kong and Singapore were the worst ones. On a sector basis, Australian Energy, Australian and New Zealand Food Retailers along with Singapore Financials were the best performers while Hong Kong Real Estate and Australian Financials were the laggards. From September 2017 to January 2018, markets rallied in line with global equities driven by higher risk appetite and expectations of better global growth. The announcement of the fiscal reform in US and its potential effects, along with higher earnings expectations in US and China Tech and Financials sectors were major catalysts for local markets (Hong Kong and Singapore particularly). From February onwards, markets started to roll off mainly due to globally tighter financial conditions and political tensions. This political stress was at first between US and North Korea on nuclear disarmament and later between China and US starting a trade war with negative effects spilling over to the region. During this phase, Australian market held up better due to its more defensive nature and decent earnings profile. From a portfolio perspective, the Sub-fund maintained its bottom-up driven approach, focused on companies with sustainable competitive advantages, high cash-flow generation, compelling valuations and decent visibility on earnings. The Sub-fund maintained its underweight on Australian Banks throughout the year while it ran an over-weight on Singapore Banks particularly until January 2018. The Healthcare sector has been an underweight across the regions while Australian Airline and Leisure sectors have been over-weights and further increased during summer. The overweight on the Energy sector was trimmed during summer to further increase exposures to conglomerates in Hong Kong and Singapore. More recently a selective exposure to China has been built through quality names in Hong Kong Tech, and pro-cyclical sectors (Mining and Food Processors). The Sub-fund absolute performance was positive mainly due to Australia. The Sub-fund relative performance was positive due to the positioning described above. INTERFUND EQUITY PACIFIC EX JAPAN – Class H MSCI Pacific ex Japan (developed countries) posted a positive performance. The best performer market was Australia followed by New Zealand while Hong Kong and Singapore were the worst ones. On a sector basis, Australian Energy, Australian and New Zealand Food Retailers along with Singapore Financials were the best performers while Hong Kong Real Estate and Australian Financials were the laggards. From September to January, markets rallied in line with global equities driven by higher risk appetite and expectations of better global growth. The announcement of the fiscal reform in US and its potential effects, along with higher earnings expectations in US and China Tech and Financials sectors were major catalysts for local markets (Hong Kong and Singapore particularly). From February onwards, markets started to roll off mainly due to globally tighter financial conditions and political tensions. This political stress was at first between US and North Korea on nuclear disarmament and later between China and US starting a trade war with negative effects spilling over to the region. During this phase, Australian market held up better due to its more defensive nature and decent earnings profile. From a portfolio perspective, the Sub-fund maintained its bottom-up driven approach, focused on companies with sustainable competitive advantages, high cash-flow generation, compelling valuations and decent visibility on earnings. The Sub-fund maintained its underweight on Australian Banks throughout the year while it ran an over-weight on Singapore Banks particularly until January. The Healthcare sector has been an underweight across the regions while Australian Airline and Leisure sectors have been over-weights and further increased during summer. The overweight on the Energy sector was trimmed during summer to further increase exposures to conglomerates in Hong Kong and Singapore. More recently a selective exposure to China has been built through quality names in Hong Kong Tech, and pro-cyclical sectors (Mining and Food Processors). The Sub-fund absolute performance was positive mainly due to Australia and the hedging policy. The Sub-fund relative performance was positive due to the positioning described above. INTERFUND EQUITY USA ADVANTAGE The broad market advanced in Euro terms over the year ended August 31, 2018, with Information Technology and Consumer Discretionary the best performing sectors. Utilities was the relative underperformer in the index. The investment team continues to focus on bottom-up stock selection and the long-term outlook for companies owned in the Sub-fund. The Sub-fund’s turnover during the period was higher than the average past annual turnover, due to the shifting opportunity set and our view of the relative risk/reward profile of several holdings. Holdings that were eliminated over this period include Tiffany, MSCI, Verisk Analytics, IHS Markit, Trandsdigm, Ulta Beauty, MasterCard, Mohawk Industries, Nike, TJX Companies, and Berkshire Hathaway. These positions were eliminated in favor of investments the Sub-fund believe offer a superior relative risk/reward profile including Union Pacific, Canadian National Railway, Copart, Rollins, Broadridge Financial Solutions, Watsco, Ansys, Constellation Software, Ecolab, Praxair, Tyler Technologies, Waste Management, and Intuit. For the one year period ended August 31, 2018, the Sub-fund outperformed its benchmark, the MSCI USA index, due to favorable stock selection and sector allocations. Stock selection and an overweight position in both Consumer Discretionary and Information Technology, stock selection and an underweight in Health Care, and stock selection in Industrials accounted for the majority of the Sub-fund’s outperformance. Conversely, a lack of exposure to Energy and an overweight in Materials were the top detractors in the Sub-fund over this period. The Sub-fund outperformed both in absolute and relative terms.
INTERFUND SICAV
MANAGEMENT’S REPORT (CONTINUED)
12
INTERFUND BOND GLOBAL EMERGING MARKETS In September 2017 the Federal Reserve began to unwind its holdings of Treasuries and Mortgage Backed Securities. Since December 2017 the Federal Reserve has also continued to hike the Federal Funds rate by approximately 25 basis points each quarter. Also in December 2017, President Trump’s Tax Cuts and Jobs Act was approved in Congress. This resulted in further issuance of Treasury securities. Both of the above policy changes have resulted in US Dollar liquidity being drawn back to the US and away from Emerging markets, and led to a challenging period for emerging market debt. Sub-fund positioning was altered from being underweight higher yielding markets at the beginning of the year to then taking advantage of what the Sub-fund believed was an excessive sell-off at the beginning of the summer and adding back higher yielding exposure. In general over the course of the year, the Sub-fund has held overweight positions in Indonesia and Argentina and was underweight those quasi-sovereigns which bore more direct exposure to industrial metals. It also maintained an underweight position in Turkish risk, eventually covering this short position after a period of Turkish weakness by buying lower cash price longer securities. The Sub-fund recorded a negative performance in absolute terms and underperformed the benchmark. INTERFUND EQUITY GLOBAL EMERGING MARKETS Emerging market equities recorded strong performance during the first half of the year (until January 2018) benefitting from foreign investor inflows into the asset class, stable currencies and political backdrop. The second half of the year the exact opposite happened and the asset class severely underperformed developed market equities. Different factors contributed to the recent negative performance. Namely, a more confrontational stance from the US administration regarding trade policies and China had a negative impact on the CNY and on growth expectations. Monetary tightening and a growth acceleration in US lead to a return of strength for the US dollar and pressure on most emerging market currencies. Emerging market central banks had to respond to tighter liquidity conditions with tighter monetary policy to defend the currencies leading to a further weakening in growth expectations. Investor positioning which was overweight emerging markets at the end of calendar year made the asset class particularly vulnerable to the change in sentiment. The Sub-fund began 2018 with a cautious approach with an increasing underweight position towards the more glamorous tech sector (mainly in China) that was the main driver of market performance in the second half of calendar year 2017. In this period the Sub-fund was overweight more defensive regions like Middle East. During the sell off the Sub-fund increased the beta adding exposure to some high beta countries, like Brazil and South Africa and China where the underweight vs the tech sector was gradually closed. The lower beta of the portfolio paid off during the market sell-off but was partly offset by negative stock selection in some countries (Brazil and South Africa and Greece). During the last month of the year the Sub-fund also suffered from the extended weakness in some currencies relative to the benchmark considering the higher exposure towards high beta currencies taken during the summer of 2018. The Sub-fund underperformed in absolute terms but overperformed the benchmark in relative terms. INTERFUND INTERNATIONAL SECURITIES NEW ECONOMY The last twelve months have seen the global stock markets reach new highs by the last quarter of 2017 and the beginning of 2018, on supportive economic data and the FED continuing its monetary policy tightening. The sharp decline in February has put an end to the era of low volatility and brought the financial markets into a new environment of abrupt declines and sharp jumps in volatility. The latters were caused by geopolitical uncertainties in North Korea and Europe, alongside global trade concerns raised by the US administration undermining the free trade. The information technology sector suffered from Facebook scandal and Google probe in Europe. Despite those concerns, the US stock Markets reached new highs in August 2018, while the regional stock markets struggle in a price range. The Sub-fund maintained during the period the exposures to the sectors and the geographic regions close to those of the benchmark. The Sub-fund returned a positive performance in absolute terms but it slightly underperformed the benchmark, mainly driven by the selection in the Consumer Discretionary and Information Technology sectors; Adobe Systems and Micron Technology were the best performers.
INTERFUND SICAV
MANAGEMENT’S REPORT (CONTINUED)
13
INTERFUND EMERGING MARKETS LOCAL CURRENCY BOND – Class A Over the past year the US yield curve reached its flattest point since 2007 and equities sold off violently in February. Trade war rhetoric escalation, an anti-establishment coalition in Italy and political and economic turbulence in Latin America added to uncertainty. The USD rallied against most Developed and Emerging Market currencies and risk asset returns were mixed with credit spreads widened and Emerging Markets selling off. Over the past year the Sub-fund increased its local rates overweight on aggregate; Brazilian and Indonesian local rates exposure was reduced to flat whilst Hungarian and South African local exposure was inverted to overweight. Importantly the Sub-fund moved from short to long US duration given the significant volatility within Emerging Markets. Today the Sub-fund is tactically long US duration and is overweight Polish and South African rates whilst remaining underweight in Czech Republic, Malaysia and Romania. The Sub-fund is overweight the Thai baht, Egyptian pound and Nigerian naira whilst remaining underweight the US dollar, Romanian leu and the Taiwanese dollar. An overweight to Turkish local markets detracted as yields increased and volatility spiked as a result of rising inflation and doubts over Central Bank independence causing a contagion effect across Emerging Market nations. The Sub-fund’s overweight to Polish local markets detracted from performance as yields increased across maturities. Exposure to Mexican local rates was negative for performance. The Sub-fund’s underweight position in Hungarian local rates contributed positively as yields increased. Broader Brazilian duration positioning contributed to performance. The Sub-fund posted a negative performance in absolute terms and underperformed the benchmark. INTERFUND EMERGING MARKETS LOCAL CURRENCY BOND – Class H Over the past year the US yield curve reached its flattest point since 2007 and equities sold off violently in February. Trade war rhetoric escalation, an anti-establishment coalition in Italy and political and economic turbulence in Latin America added to uncertainty. The USD rallied against most Developed and Emerging Market currencies and risk asset returns were mixed with credit spreads widened and Emerging Markets selling off. Over the past year the Sub-fund increased its local rates overweight on aggregate; Brazilian and Indonesian local rates exposure was reduced to flat whilst Hungarian and South African local exposure was inverted to overweight. Importantly the Sub-fund moved from short to long US duration given the significant volatility within Emerging Markets. Today the Sub-fund is tactically long US duration and is overweight Polish and South African rates whilst remaining underweight in Czech Republic, Malaysia and Romania. The Sub-fund is overweight the Thai baht, Egyptian pound and Nigerian naira whilst remaining underweight the US dollar, Romanian leu and the Taiwanese dollar. An overweight to Turkish local markets detracted as yields increased and volatility spiked as a result of rising inflation and doubts over Central Bank independence causing a contagion effect across Emerging Market nations. The Sub-fund’s overweight to Polish local markets detracted from performance as yields increased across maturities. Exposure to Mexican local rates was negative for performance. The Sub-fund’s underweight position in Hungarian local rates contributed positively as yields increased. Broader Brazilian duration positioning contributed to performance. The Sub-fund posted a negative performance in absolute terms and underperformed the benchmark. INTERFUND INFLATION LINKED Over the past 12 months, the major developed market sovereign bond space was adjusting to more hawkish central bank rhetoric and action. The Federal Reserve raised rates in December 2017 and twice more by the end of the summer 2018, along with reducing the size of its balance sheet. The ECB announced an explicit end to QE by the end of 2018, however it also explained that no rate hike is considered until at least summer 2019. Despite the ongoing challenging Brexit negotiations, the Bank of England hiked rates over the summer. Inflation in the US has picked up steadily over the past year due to improving fundamentals and a tighter labour market. Core inflation in the Eurozone was more sluggish, with core rates hovering around 1% for the period. UK inflation dropped from the highs seen post the Brexit vote as the contribution from the weakening pound started to wane. In Japan, despite five years of massive asset buying and ultra-low rates, the Bank of Japan remains far from achieving its 2 percent inflation target. The Sub-fund while maintaining an overall duration and country allocation in the portfolio not far from that of the benchmark. A tactical long UK linkers versus short GBP position was implemented at times during the year. The absolute performance of the Sub-fund has been negative in absolute terms and underperforming the benchmark.
INTERFUND SICAV
MANAGEMENT’S REPORT (CONTINUED)
14
INTERFUND SYSTEM EVOLUTION European fixed-income markets posted mildly positive returns in the last four months of 2017, on the back of stable core yields and credit spreads that remained little moved (on higher quality bonds) or kept compressing (on the lower rated segments). This picture quickly changed in 2018, as core yield rose sharply in January to levels last seen in 2015, driven by a surge in U.S. inflation that caused steep losses across the fixed income spectrum. This yield spike gradually reversed – in Europe - during the course of the following months, but this easing was offset by credit spreads starting to widen across several asset classes: a strong US Dollar put pressure on emerging currencies and bonds, while escalating political tensions in Europe and Italy widened sovereign spreads and caused severe underperformance on financial and high yield issuers; this widening trend was particularly steep from mid-May to end-June, with another leg in August focused on Emerging countries – rocked by financial instability in Turkey and Argentina – and on Italian assets. On the Sub-fund, during the early months of 2018 and until the summer a cautious stance on interest-rate exposure was kept through the use of hedging positions; this strategy worked satisfactorily in January, protecting the Sub-fund from volatility, although for the following months it did not allow to benefit from the subsequent decline in core European yields. The portfolio remains extremely granular and diversified, and opportunistically kept tapping primary and secondary markets. During the first stage of credit market weakness in March, positions were accumulated on some financial names that had underperformed. Despite a good resilience in the first months of the year, the Sub-fund suffered in May and June through the exposure to Italian names, both on the sovereign and on the corporate space, in parallel with Italian sovereign spreads widening from late May onwards. The Sub-fund posted a negative performance for the period. INTERFUND EURO BOND SHORT TERM 3-5 From September 2017 to end of August 2018, the main driver of movement has been the end of the ultra-loose financial conditions that Central banks had put in place post the financial and Euro crisis: the negative depot rate at the ECB and the ECB quantitative easing (QE). Indeed, low rates and multiple QEs were not supposed to last that long. The Fed has stopped its (“QE”) years ago and continued to increase interest rates as the US economy is still growing. So the widening of the spread between US yields and the German one has been incredible as the 10y spread reached a record level of 260bps. Looking forward, the market is concerned that the weight of the US rate hikes could jeopardise one of the longest US expansion. Another concern is the size of the US deficits. In Eurozone, the concerns are related to the Brexit, the Italian politics and also the overall low level of core inflation. The ECB has communicated that the QE will stop in December 2018 and that there will be no rate increase before summer 2019. Rate in core Euro-zone are low and they are starting to normalise. The Sub-fund carried a low risk in general versus its benchmark. Between September 2017 and the end of August 2018 almost all the European bonds ended lower as rates are higher. The most dramatic move has been on the Italian bonds where the difficult political situation has put extra pressure on them. This Sub-fund has a benchmark invested in the “belly” of the yield curve and it is sensitive to any anticipation of rate hikes from the ECB. With some active strategies we tried to out-performed the benchmark like being short duration or long Euro. However, the results have been a little bit disappointing mainly from both the perspective of the benchmark performance as yields have been rising slowly, and also from some widening of the Italian-German bond spreads. The Sub-fund has underperformed both in absolute terms and against the benchmark. INTERFUND EURO LIQUIDITY The Euro money market was stable over the period, before the sudden move in Italian short dated paper in May 2018, consequently to a change in the national political landscape. This has been happening while the ECB has been starting communicating its exit from its Public Sector Purchase Programme. The situation is still developing and some pressure can be seen in the short dated part of European curves. For the whole period, the investment activity was focused on relative value trades within the government short term alternatives in the Euro area, with a small underweight in peripheral paper since the beginning of 2018. The Sub-fund underperformed the benchmark and performed as well negatively in absolute terms.
INTERFUND SICAV
MANAGEMENT’S REPORT (CONTINUED)
15
INTERFUND CRESCITA PROTETTA 80 During the period, divergence among main regional markets has been acute; S&P has been on the run, especially after the tax cuts were announced in late December 2017. S&P sold off in early February; all of the losses have since been recovered. However European and Emerging Markets equities were negatively affected by China-US trade war which has been escalating. In early 2018 the allocation between traditional and smart beta elements has been moved in favor of traditional betas; this reduction in the weight of the smart beta allocation was reversed in July 2018. A currency hedge to the USD was initiated in order to reduce the volatility of the strategy. Regional allocation has been kept in favor of US equities for most of the period but brought to a more balanced positioning in August 2018. During the period, Interfund Crescita Protetta 80 produced negative returns. The protection mechanism contained the level of volatility but detracted from overall performance. In 2018 smart beta strategies experienced a difficult environment as markets kept moving towards a clear leadership of the growth style which is not a factor contemplated in the smart beta universe. INTERFUND TEAM EQUITY EUROPE (first NAV 20/07/2018) European equities registered a negative absolute return since inception of the Sub-fund. Elevated trade tensions between US and China, negative news-flow from the Brexit negotiation and the formation of an Italian Anti Establishment government hurt investor sentiment. Large currencies’ devaluation in Turkey and Argentina led to a risk re-pricing across the Emerging Markets complex. In Europe the telecommunication and financial sectors led the market lower, while information technology was the best performing sector. Quality and growth stocks outperformed value stocks. At sector level, the portfolio had an overweight exposure versus the benchmark in energy, industrials and information technology, while consumer staples and consumer discretionary were the largest underweights. Exposure to Britain, Netherlands and Norway were the largest overweight versus the benchmark, while Switzerland and Sweden were the largest underweight. The portfolio is well diversified and focused on large capitalization companies in Europe. The Sub-fund performed largely in line with the benchmark, the underlying managers displayed high complementarity in their performances during the period. One manager gained from the overweight exposure to the information technology sector and from stock picking in the financials, energy and healthcare sector, while the second manager suffered from an overweight to the telecom and financial sector, and from the Italian exposure. The Sub-fund got a slightly better performance than the benchmark and performed as well negatively in absolute terms. The Chairman of the Board of Directors December 20, 2018 Franco TUTINO
INTERFUND SICAV
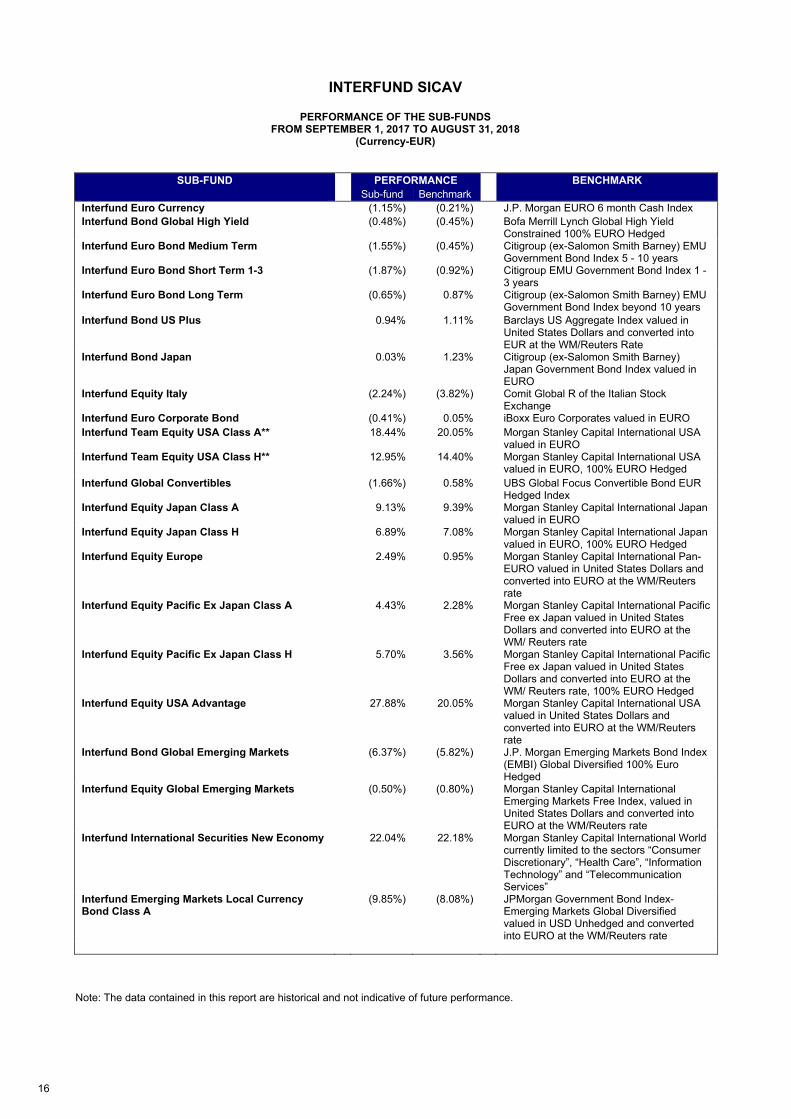
PERFORMANCE OF THE SUB-FUNDS FROM SEPTEMBER 1, 2017 TO AUGUST 31, 2018
(Currency-EUR)
16
SUB-FUND PERFORMANCE BENCHMARK
Sub-fund Benchmark
Interfund Euro Currency (1.15%) (0.21%) J.P. Morgan EURO 6 month Cash Index
Interfund Bond Global High Yield
(0.48%) (0.45%)
Bofa Merrill Lynch Global High Yield Constrained 100% EURO Hedged
Interfund Euro Bond Medium Term
(1.55%) (0.45%)
Citigroup (ex-Salomon Smith Barney) EMU Government Bond Index 5 - 10 years
Interfund Euro Bond Short Term 1-3
(1.87%) (0.92%)
Citigroup EMU Government Bond Index 1 - 3 years
Interfund Euro Bond Long Term
(0.65%) 0.87%
Citigroup (ex-Salomon Smith Barney) EMU Government Bond Index beyond 10 years
Interfund Bond US Plus
0.94% 1.11%
Barclays US Aggregate Index valued in United States Dollars and converted into EUR at the WM/Reuters Rate
Interfund Bond Japan
0.03% 1.23%
Citigroup (ex-Salomon Smith Barney) Japan Government Bond Index valued in EURO
Interfund Equity Italy
(2.24%) (3.82%)
Comit Global R of the Italian Stock Exchange
Interfund Euro Corporate Bond (0.41%) 0.05% iBoxx Euro Corporates valued in EURO
Interfund Team Equity USA Class A**
18.44% 20.05%
Morgan Stanley Capital International USA valued in EURO
Interfund Team Equity USA Class H** 12.95% 14.40% Morgan Stanley Capital International USA valued in EURO, 100% EURO Hedged
Interfund Global Convertibles
(1.66%) 0.58%
UBS Global Focus Convertible Bond EUR Hedged Index
Interfund Equity Japan Class A
9.13% 9.39%
Morgan Stanley Capital International Japan valued in EURO
Interfund Equity Japan Class H
6.89% 7.08%
Morgan Stanley Capital International Japan valued in EURO, 100% EURO Hedged
Interfund Equity Europe
2.49% 0.95%
Morgan Stanley Capital International Pan-EURO valued in United States Dollars and converted into EURO at the WM/Reuters rate
Interfund Equity Pacific Ex Japan Class A
4.43% 2.28%
Morgan Stanley Capital International Pacific Free ex Japan valued in United States Dollars and converted into EURO at the WM/ Reuters rate
Interfund Equity Pacific Ex Japan Class H
5.70% 3.56%
Morgan Stanley Capital International Pacific Free ex Japan valued in United States Dollars and converted into EURO at the WM/ Reuters rate, 100% EURO Hedged
Interfund Equity USA Advantage
27.88% 20.05%
Morgan Stanley Capital International USA valued in United States Dollars and converted into EURO at the WM/Reuters rate
Interfund Bond Global Emerging Markets
(6.37%) (5.82%)
J.P. Morgan Emerging Markets Bond Index (EMBI) Global Diversified 100% Euro Hedged
Interfund Equity Global Emerging Markets
(0.50%) (0.80%)
Morgan Stanley Capital International Emerging Markets Free Index, valued in United States Dollars and converted into EURO at the WM/Reuters rate
Interfund International Securities New Economy
22.04% 22.18%
Morgan Stanley Capital International World currently limited to the sectors “Consumer Discretionary”, “Health Care”, “Information Technology” and “Telecommunication Services”
Interfund Emerging Markets Local Currency Bond Class A
(9.85%) (8.08%)
JPMorgan Government Bond Index-Emerging Markets Global Diversified valued in USD Unhedged and converted into EURO at the WM/Reuters rate
Note: The data contained in this report are historical and not indicative of future performance.
INTERFUND SICAV
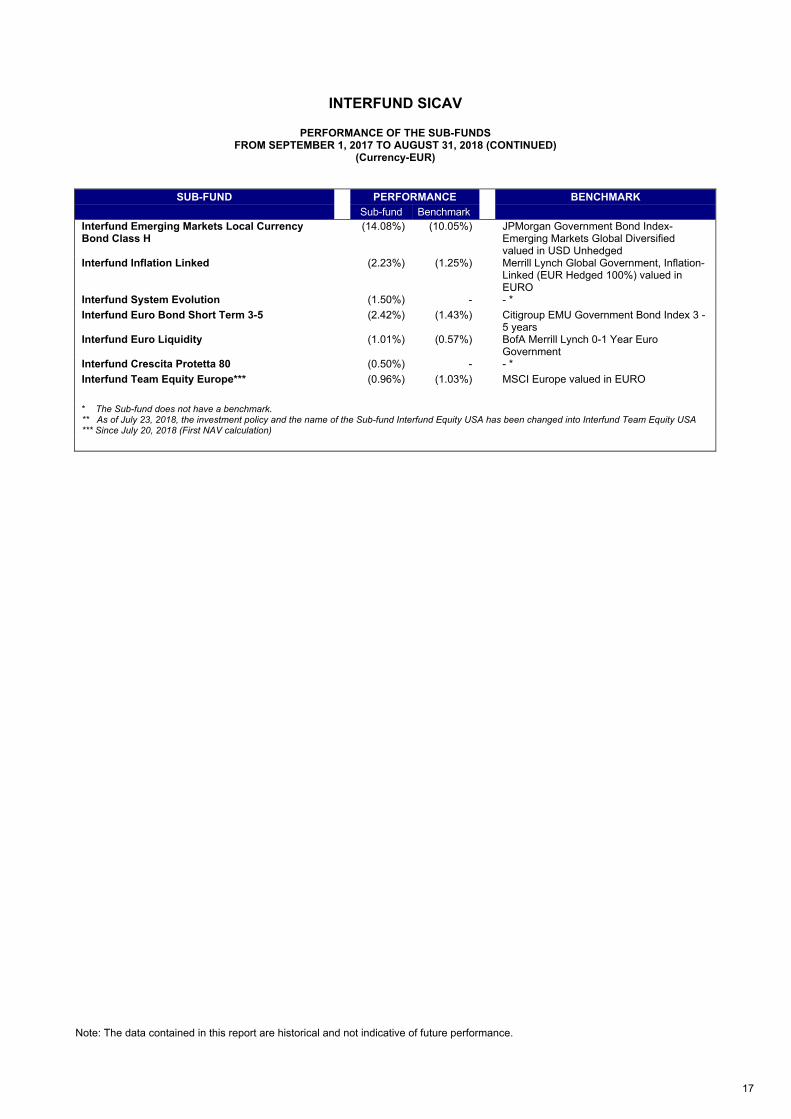
PERFORMANCE OF THE SUB-FUNDS FROM SEPTEMBER 1, 2017 TO AUGUST 31, 2018 (CONTINUED)
(Currency-EUR)
17
SUB-FUND PERFORMANCE BENCHMARK
Sub-fund Benchmark
Interfund Emerging Markets Local Currency Bond Class H
(14.08%) (10.05%)
JPMorgan Government Bond Index-Emerging Markets Global Diversified valued in USD Unhedged
Interfund Inflation Linked
(2.23%) (1.25%)
Merrill Lynch Global Government, Inflation-Linked (EUR Hedged 100%) valued in EURO
Interfund System Evolution (1.50%) - - *
Interfund Euro Bond Short Term 3-5
(2.42%) (1.43%)
Citigroup EMU Government Bond Index 3 - 5 years
Interfund Euro Liquidity
(1.01%) (0.57%)
BofA Merrill Lynch 0-1 Year Euro Government
Interfund Crescita Protetta 80 (0.50%) - - *
Interfund Team Equity Europe*** (0.96%) (1.03%) MSCI Europe valued in EURO
* The Sub-fund does not have a benchmark. ** As of July 23, 2018, the investment policy and the name of the Sub-fund Interfund Equity USA has been changed into Interfund Team Equity USA *** Since July 20, 2018 (First NAV calculation)
Note: The data contained in this report are historical and not indicative of future performance.
18
The accompanying notes are an integral part of these financial statements.General note: differences in sums, if any, are due to rounding.
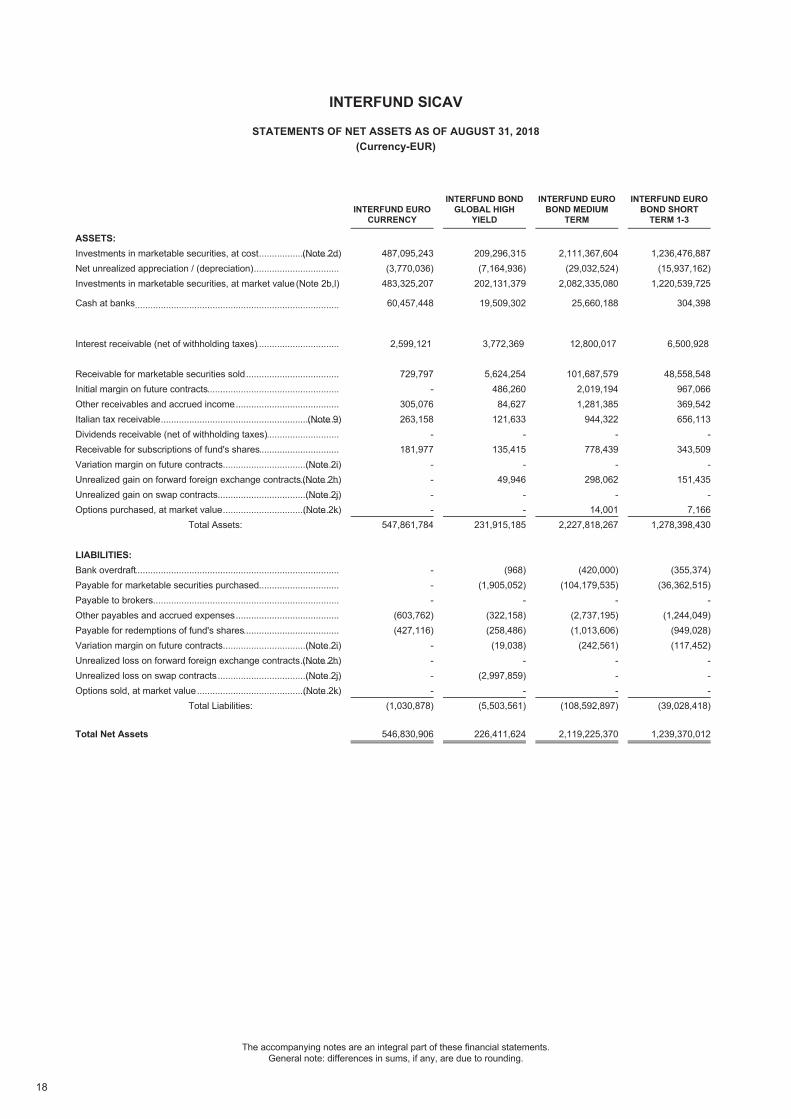
INTERFUND SICAV
STATEMENTS OF NET ASSETS AS OF AUGUST 31, 2018(Currency-EUR)
ASSETS:......................................................................................................Investments in marketable securities, at cost (Note 2d) 487,095,243......................................................................................................Net unrealized appreciation / (depreciation) (3,770,036)......................................................................................................Investments in marketable securities, at market value(Note 2b,l) 483,325,207
......................................................................................................Cash at banks 60,457,448
......................................................................................................Interest receivable (net of withholding taxes) 2,599,121
......................................................................................................Receivable for marketable securities sold 729,797
......................................................................................................Initial margin on future contracts -
......................................................................................................Other receivables and accrued income 305,076
......................................................................................................Italian tax receivable (Note 9) 263,158
......................................................................................................Dividends receivable (net of withholding taxes) -
......................................................................................................Receivable for subscriptions of fund's shares 181,977
......................................................................................................Variation margin on future contracts (Note 2i) -
......................................................................................................Unrealized gain on forward foreign exchange contracts (Note 2h) -
......................................................................................................Unrealized gain on swap contracts (Note 2j) -
......................................................................................................Options purchased, at market value (Note 2k) -Total Assets: 547,861,784
LIABILITIES:......................................................................................................Bank overdraft -......................................................................................................Payable for marketable securities purchased -......................................................................................................Payable to brokers -......................................................................................................Other payables and accrued expenses (603,762)......................................................................................................Payable for redemptions of fund's shares (427,116)......................................................................................................Variation margin on future contracts (Note 2i) -......................................................................................................Unrealized loss on forward foreign exchange contracts (Note 2h) -......................................................................................................Unrealized loss on swap contracts (Note 2j) -......................................................................................................Options sold, at market value (Note 2k) -
Total Liabilities: (1,030,878)
Total Net Assets 546,830,906
INTERFUND EUROCURRENCY
209,296,315(7,164,936)
202,131,379
19,509,302
3,772,369
5,624,254486,26084,627
121,633-
135,415-
49,946--
231,915,185
(968)(1,905,052)
-(322,158)(258,486)(19,038)
-(2,997,859)
-(5,503,561)
226,411,624
INTERFUND BONDGLOBAL HIGH
YIELD
2,111,367,604(29,032,524)
2,082,335,080
25,660,188
12,800,017
101,687,5792,019,1941,281,385
944,322-
778,439-
298,062-
14,0012,227,818,267
(420,000)(104,179,535)
-(2,737,195)(1,013,606)
(242,561)---
(108,592,897)
2,119,225,370
INTERFUND EUROBOND MEDIUM
TERM
1,236,476,887(15,937,162)
1,220,539,725
304,398
6,500,928
48,558,548967,066369,542656,113
-343,509
-151,435
-7,166
1,278,398,430
(355,374)(36,362,515)
-(1,244,049)
(949,028)(117,452)
---
(39,028,418)
1,239,370,012
INTERFUND EUROBOND SHORT
TERM 1-3
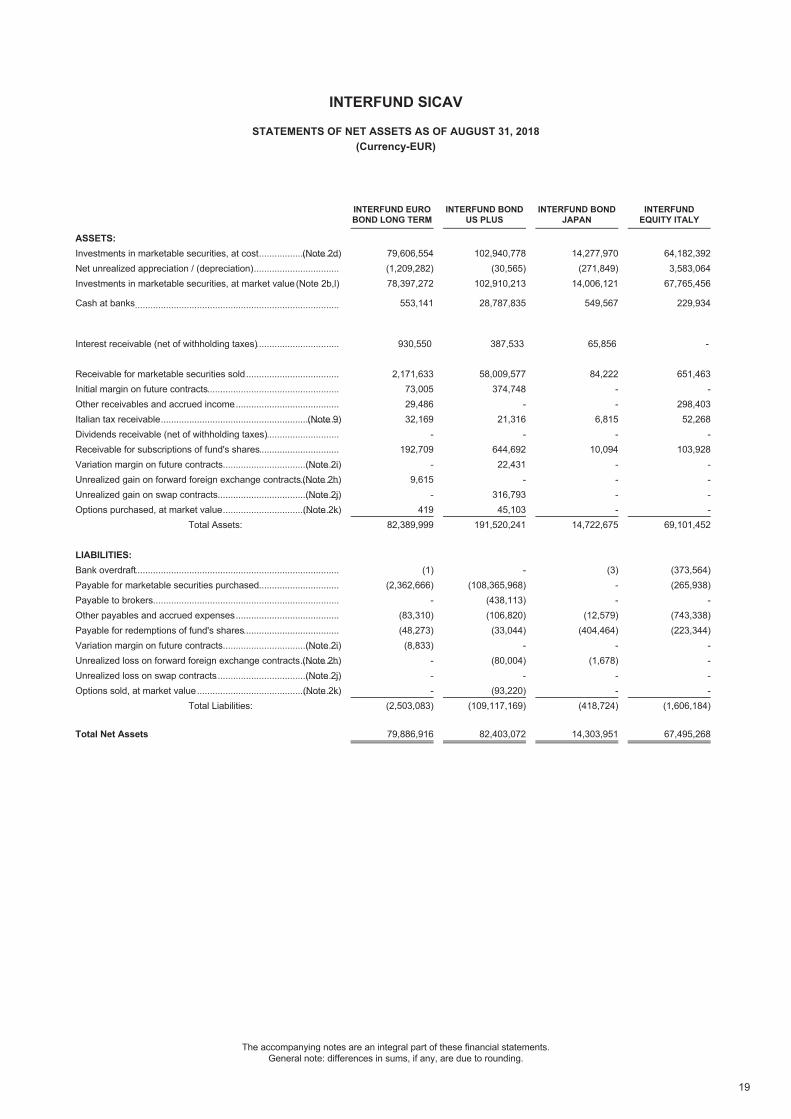
19
The accompanying notes are an integral part of these financial statements.General note: differences in sums, if any, are due to rounding.
INTERFUND SICAV
STATEMENTS OF NET ASSETS AS OF AUGUST 31, 2018(Currency-EUR)
ASSETS:......................................................................................................Investments in marketable securities, at cost (Note 2d) 79,606,554......................................................................................................Net unrealized appreciation / (depreciation) (1,209,282)......................................................................................................Investments in marketable securities, at market value(Note 2b,l) 78,397,272
......................................................................................................Cash at banks 553,141
......................................................................................................Interest receivable (net of withholding taxes) 930,550
......................................................................................................Receivable for marketable securities sold 2,171,633
......................................................................................................Initial margin on future contracts 73,005
......................................................................................................Other receivables and accrued income 29,486
......................................................................................................Italian tax receivable (Note 9) 32,169
......................................................................................................Dividends receivable (net of withholding taxes) -
......................................................................................................Receivable for subscriptions of fund's shares 192,709
......................................................................................................Variation margin on future contracts (Note 2i) -
......................................................................................................Unrealized gain on forward foreign exchange contracts (Note 2h) 9,615
......................................................................................................Unrealized gain on swap contracts (Note 2j) -
......................................................................................................Options purchased, at market value (Note 2k) 419Total Assets: 82,389,999
LIABILITIES:......................................................................................................Bank overdraft (1)......................................................................................................Payable for marketable securities purchased (2,362,666)......................................................................................................Payable to brokers -......................................................................................................Other payables and accrued expenses (83,310)......................................................................................................Payable for redemptions of fund's shares (48,273)......................................................................................................Variation margin on future contracts (Note 2i) (8,833)......................................................................................................Unrealized loss on forward foreign exchange contracts (Note 2h) -......................................................................................................Unrealized loss on swap contracts (Note 2j) -......................................................................................................Options sold, at market value (Note 2k) -
Total Liabilities: (2,503,083)
Total Net Assets 79,886,916
INTERFUND EUROBOND LONG TERM
102,940,778(30,565)
102,910,213
28,787,835
387,533
58,009,577374,748
-21,316
-644,69222,431
-316,79345,103
191,520,241
-(108,365,968)
(438,113)(106,820)(33,044)
-(80,004)
-(93,220)
(109,117,169)
82,403,072
INTERFUND BONDUS PLUS
14,277,970(271,849)
14,006,121
549,567
65,856
84,222--
6,815-
10,094----
14,722,675
(3)--
(12,579)(404,464)
-(1,678)
--
(418,724)
14,303,951
INTERFUND BONDJAPAN
64,182,3923,583,064
67,765,456
229,934
-
651,463-
298,40352,268
-103,928
----
69,101,452
(373,564)(265,938)
-(743,338)(223,344)
----
(1,606,184)
67,495,268
INTERFUNDEQUITY ITALY
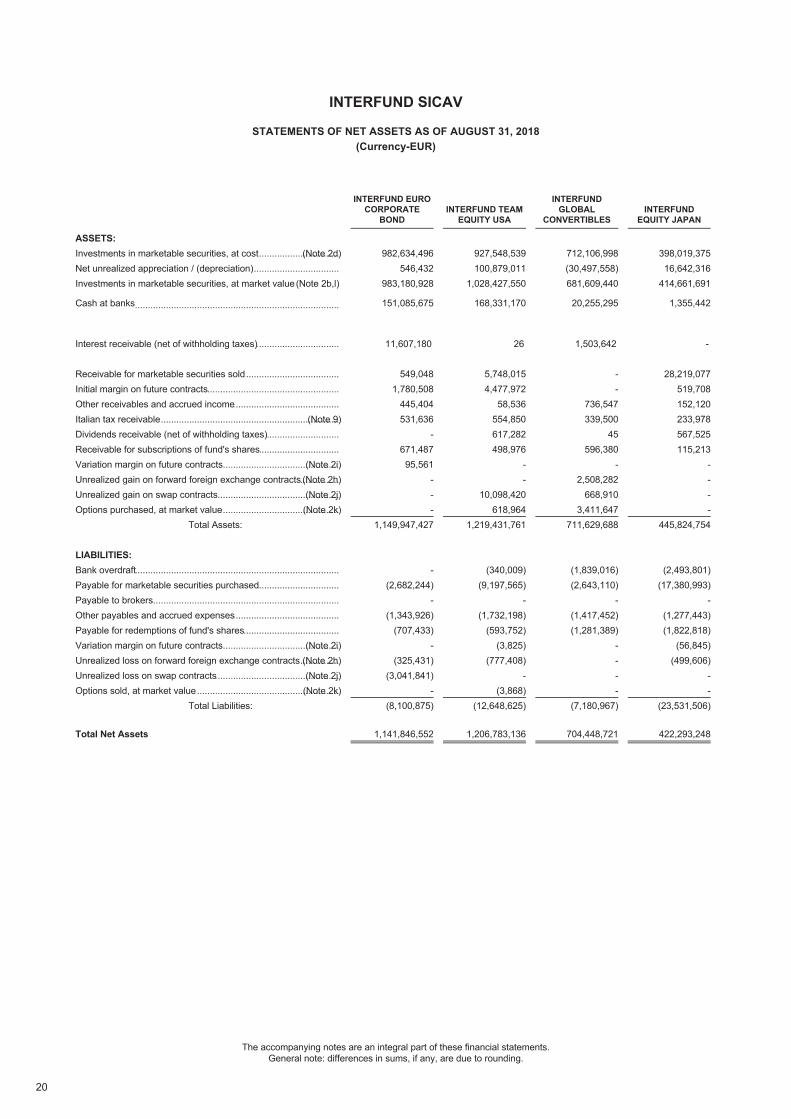
20
The accompanying notes are an integral part of these financial statements.General note: differences in sums, if any, are due to rounding.
INTERFUND SICAV
STATEMENTS OF NET ASSETS AS OF AUGUST 31, 2018(Currency-EUR)
ASSETS:......................................................................................................Investments in marketable securities, at cost (Note 2d) 982,634,496......................................................................................................Net unrealized appreciation / (depreciation) 546,432......................................................................................................Investments in marketable securities, at market value(Note 2b,l) 983,180,928
......................................................................................................Cash at banks 151,085,675
......................................................................................................Interest receivable (net of withholding taxes) 11,607,180
......................................................................................................Receivable for marketable securities sold 549,048
......................................................................................................Initial margin on future contracts 1,780,508
......................................................................................................Other receivables and accrued income 445,404
......................................................................................................Italian tax receivable (Note 9) 531,636
......................................................................................................Dividends receivable (net of withholding taxes) -
......................................................................................................Receivable for subscriptions of fund's shares 671,487
......................................................................................................Variation margin on future contracts (Note 2i) 95,561
......................................................................................................Unrealized gain on forward foreign exchange contracts (Note 2h) -
......................................................................................................Unrealized gain on swap contracts (Note 2j) -
......................................................................................................Options purchased, at market value (Note 2k) -Total Assets: 1,149,947,427
LIABILITIES:......................................................................................................Bank overdraft -......................................................................................................Payable for marketable securities purchased (2,682,244)......................................................................................................Payable to brokers -......................................................................................................Other payables and accrued expenses (1,343,926)......................................................................................................Payable for redemptions of fund's shares (707,433)......................................................................................................Variation margin on future contracts (Note 2i) -......................................................................................................Unrealized loss on forward foreign exchange contracts (Note 2h) (325,431)......................................................................................................Unrealized loss on swap contracts (Note 2j) (3,041,841)......................................................................................................Options sold, at market value (Note 2k) -
Total Liabilities: (8,100,875)
Total Net Assets 1,141,846,552
INTERFUND EUROCORPORATE
BOND
927,548,539100,879,011
1,028,427,550
168,331,170
26
5,748,0154,477,972
58,536554,850617,282498,976
--
10,098,420618,964
1,219,431,761
(340,009)(9,197,565)
-(1,732,198)
(593,752)(3,825)
(777,408)-
(3,868)(12,648,625)
1,206,783,136
INTERFUND TEAMEQUITY USA
712,106,998(30,497,558)681,609,440
20,255,295
1,503,642
--
736,547339,500
45596,380
-2,508,282
668,9103,411,647
711,629,688
(1,839,016)(2,643,110)
-(1,417,452)(1,281,389)
----
(7,180,967)
704,448,721
INTERFUNDGLOBAL
CONVERTIBLES
398,019,37516,642,316
414,661,691
1,355,442
-
28,219,077519,708152,120233,978567,525115,213
----
445,824,754
(2,493,801)(17,380,993)
-(1,277,443)(1,822,818)
(56,845)(499,606)
--
(23,531,506)
422,293,248
INTERFUNDEQUITY JAPAN
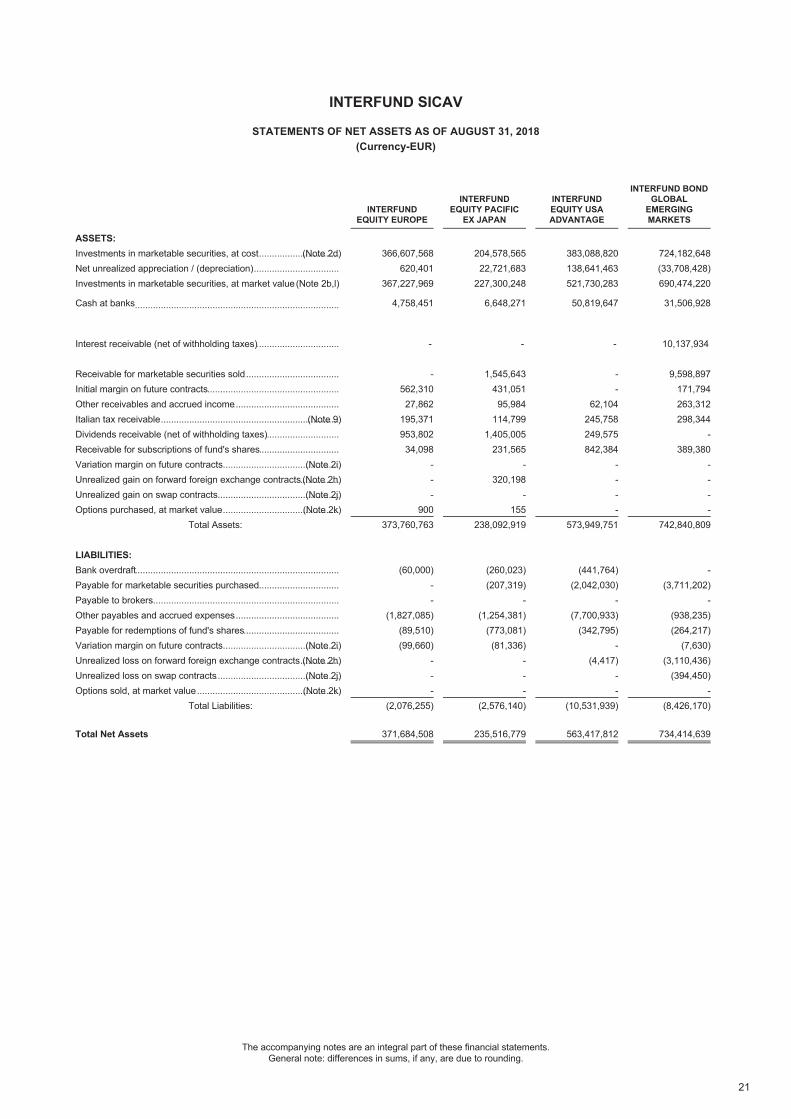
21
The accompanying notes are an integral part of these financial statements.General note: differences in sums, if any, are due to rounding.
INTERFUND SICAV
STATEMENTS OF NET ASSETS AS OF AUGUST 31, 2018(Currency-EUR)
ASSETS:......................................................................................................Investments in marketable securities, at cost (Note 2d) 366,607,568......................................................................................................Net unrealized appreciation / (depreciation) 620,401......................................................................................................Investments in marketable securities, at market value(Note 2b,l) 367,227,969
......................................................................................................Cash at banks 4,758,451
......................................................................................................Interest receivable (net of withholding taxes) -
......................................................................................................Receivable for marketable securities sold -
......................................................................................................Initial margin on future contracts 562,310
......................................................................................................Other receivables and accrued income 27,862
......................................................................................................Italian tax receivable (Note 9) 195,371
......................................................................................................Dividends receivable (net of withholding taxes) 953,802
......................................................................................................Receivable for subscriptions of fund's shares 34,098
......................................................................................................Variation margin on future contracts (Note 2i) -
......................................................................................................Unrealized gain on forward foreign exchange contracts (Note 2h) -
......................................................................................................Unrealized gain on swap contracts (Note 2j) -
......................................................................................................Options purchased, at market value (Note 2k) 900Total Assets: 373,760,763
LIABILITIES:......................................................................................................Bank overdraft (60,000)......................................................................................................Payable for marketable securities purchased -......................................................................................................Payable to brokers -......................................................................................................Other payables and accrued expenses (1,827,085)......................................................................................................Payable for redemptions of fund's shares (89,510)......................................................................................................Variation margin on future contracts (Note 2i) (99,660)......................................................................................................Unrealized loss on forward foreign exchange contracts (Note 2h) -......................................................................................................Unrealized loss on swap contracts (Note 2j) -......................................................................................................Options sold, at market value (Note 2k) -
Total Liabilities: (2,076,255)
Total Net Assets 371,684,508
INTERFUNDEQUITY EUROPE
204,578,56522,721,683
227,300,248
6,648,271
-
1,545,643431,05195,984
114,7991,405,005
231,565-
320,198-
155238,092,919
(260,023)(207,319)
-(1,254,381)
(773,081)(81,336)
---
(2,576,140)
235,516,779
INTERFUNDEQUITY PACIFIC
EX JAPAN
383,088,820138,641,463521,730,283
50,819,647
-
--
62,104245,758249,575842,384
----
573,949,751
(441,764)(2,042,030)
-(7,700,933)
(342,795)-
(4,417)--
(10,531,939)
563,417,812
INTERFUNDEQUITY USAADVANTAGE
724,182,648(33,708,428)690,474,220
31,506,928
10,137,934
9,598,897171,794263,312298,344
-389,380
----
742,840,809
-(3,711,202)
-(938,235)(264,217)
(7,630)(3,110,436)
(394,450)-
(8,426,170)
734,414,639
INTERFUND BONDGLOBAL
EMERGINGMARKETS
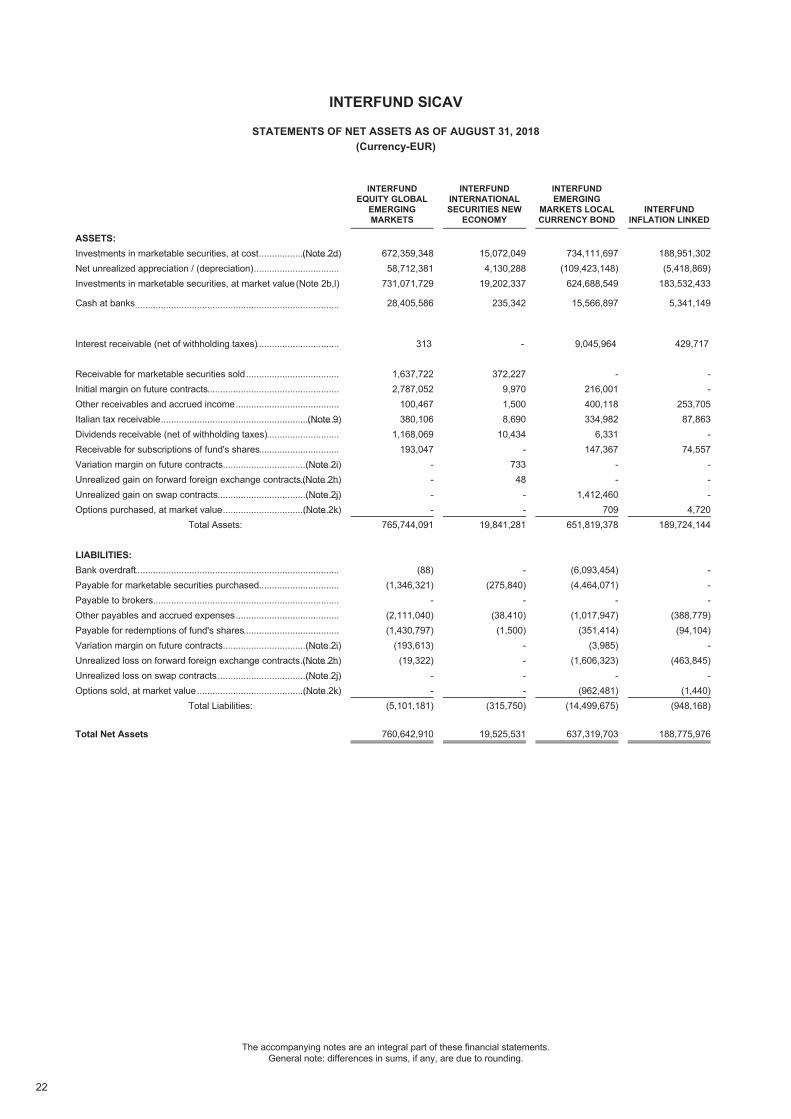
22
The accompanying notes are an integral part of these financial statements.General note: differences in sums, if any, are due to rounding.
INTERFUND SICAV
STATEMENTS OF NET ASSETS AS OF AUGUST 31, 2018(Currency-EUR)
ASSETS:......................................................................................................Investments in marketable securities, at cost (Note 2d) 672,359,348......................................................................................................Net unrealized appreciation / (depreciation) 58,712,381......................................................................................................Investments in marketable securities, at market value(Note 2b,l) 731,071,729
......................................................................................................Cash at banks 28,405,586
......................................................................................................Interest receivable (net of withholding taxes) 313
......................................................................................................Receivable for marketable securities sold 1,637,722
......................................................................................................Initial margin on future contracts 2,787,052
......................................................................................................Other receivables and accrued income 100,467
......................................................................................................Italian tax receivable (Note 9) 380,106
......................................................................................................Dividends receivable (net of withholding taxes) 1,168,069
......................................................................................................Receivable for subscriptions of fund's shares 193,047
......................................................................................................Variation margin on future contracts (Note 2i) -
......................................................................................................Unrealized gain on forward foreign exchange contracts (Note 2h) -
......................................................................................................Unrealized gain on swap contracts (Note 2j) -
......................................................................................................Options purchased, at market value (Note 2k) -Total Assets: 765,744,091
LIABILITIES:......................................................................................................Bank overdraft (88)......................................................................................................Payable for marketable securities purchased (1,346,321)......................................................................................................Payable to brokers -......................................................................................................Other payables and accrued expenses (2,111,040)......................................................................................................Payable for redemptions of fund's shares (1,430,797)......................................................................................................Variation margin on future contracts (Note 2i) (193,613)......................................................................................................Unrealized loss on forward foreign exchange contracts (Note 2h) (19,322)......................................................................................................Unrealized loss on swap contracts (Note 2j) -......................................................................................................Options sold, at market value (Note 2k) -
Total Liabilities: (5,101,181)
Total Net Assets 760,642,910
INTERFUNDEQUITY GLOBAL
EMERGINGMARKETS
15,072,0494,130,288
19,202,337
235,342
-
372,2279,9701,5008,690
10,434-
73348
--
19,841,281
-(275,840)
-(38,410)(1,500)
----
(315,750)
19,525,531
INTERFUNDINTERNATIONALSECURITIES NEW
ECONOMY
734,111,697(109,423,148)
624,688,549
15,566,897
9,045,964
-216,001400,118334,982
6,331147,367
--
1,412,460709
651,819,378
(6,093,454)(4,464,071)
-(1,017,947)
(351,414)(3,985)
(1,606,323)-
(962,481)(14,499,675)
637,319,703
INTERFUNDEMERGING
MARKETS LOCALCURRENCY BOND
188,951,302(5,418,869)
183,532,433
5,341,149
429,717
--
253,70587,863
-74,557
---
4,720189,724,144
---
(388,779)(94,104)
-(463,845)
-(1,440)
(948,168)
188,775,976
INTERFUNDINFLATION LINKED
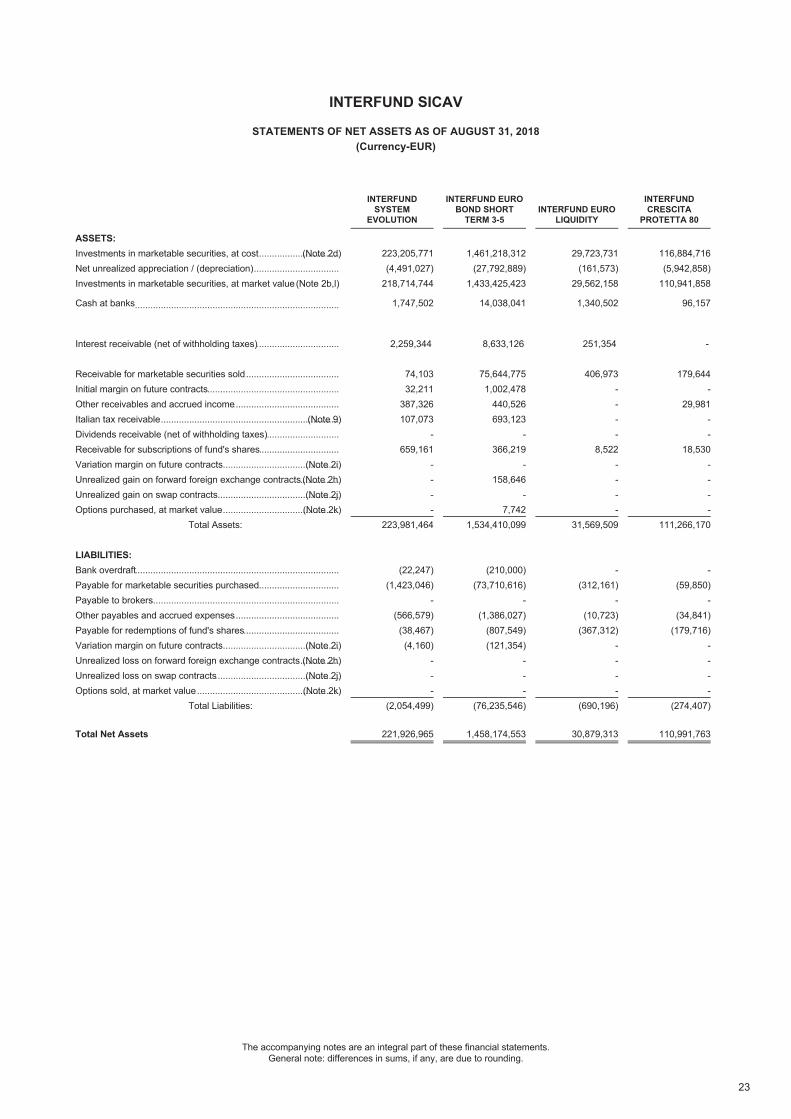
23
The accompanying notes are an integral part of these financial statements.General note: differences in sums, if any, are due to rounding.
INTERFUND SICAV
STATEMENTS OF NET ASSETS AS OF AUGUST 31, 2018(Currency-EUR)
ASSETS:......................................................................................................Investments in marketable securities, at cost (Note 2d) 223,205,771......................................................................................................Net unrealized appreciation / (depreciation) (4,491,027)......................................................................................................Investments in marketable securities, at market value(Note 2b,l) 218,714,744
......................................................................................................Cash at banks 1,747,502
......................................................................................................Interest receivable (net of withholding taxes) 2,259,344
......................................................................................................Receivable for marketable securities sold 74,103
......................................................................................................Initial margin on future contracts 32,211
......................................................................................................Other receivables and accrued income 387,326
......................................................................................................Italian tax receivable (Note 9) 107,073
......................................................................................................Dividends receivable (net of withholding taxes) -
......................................................................................................Receivable for subscriptions of fund's shares 659,161
......................................................................................................Variation margin on future contracts (Note 2i) -
......................................................................................................Unrealized gain on forward foreign exchange contracts (Note 2h) -
......................................................................................................Unrealized gain on swap contracts (Note 2j) -
......................................................................................................Options purchased, at market value (Note 2k) -Total Assets: 223,981,464
LIABILITIES:......................................................................................................Bank overdraft (22,247)......................................................................................................Payable for marketable securities purchased (1,423,046)......................................................................................................Payable to brokers -......................................................................................................Other payables and accrued expenses (566,579)......................................................................................................Payable for redemptions of fund's shares (38,467)......................................................................................................Variation margin on future contracts (Note 2i) (4,160)......................................................................................................Unrealized loss on forward foreign exchange contracts (Note 2h) -......................................................................................................Unrealized loss on swap contracts (Note 2j) -......................................................................................................Options sold, at market value (Note 2k) -
Total Liabilities: (2,054,499)
Total Net Assets 221,926,965
INTERFUNDSYSTEM
EVOLUTION
1,461,218,312(27,792,889)
1,433,425,423
14,038,041
8,633,126
75,644,7751,002,478
440,526693,123
-366,219
-158,646
-7,742
1,534,410,099
(210,000)(73,710,616)
-(1,386,027)
(807,549)(121,354)
---
(76,235,546)
1,458,174,553
INTERFUND EUROBOND SHORT
TERM 3-5
29,723,731(161,573)
29,562,158
1,340,502
251,354
406,973----
8,522----
31,569,509
-(312,161)
-(10,723)
(367,312)----
(690,196)
30,879,313
INTERFUND EUROLIQUIDITY
116,884,716(5,942,858)
110,941,858
96,157
-
179,644-
29,981--
18,530----
111,266,170
-(59,850)
-(34,841)
(179,716)----
(274,407)
110,991,763
INTERFUNDCRESCITA
PROTETTA 80
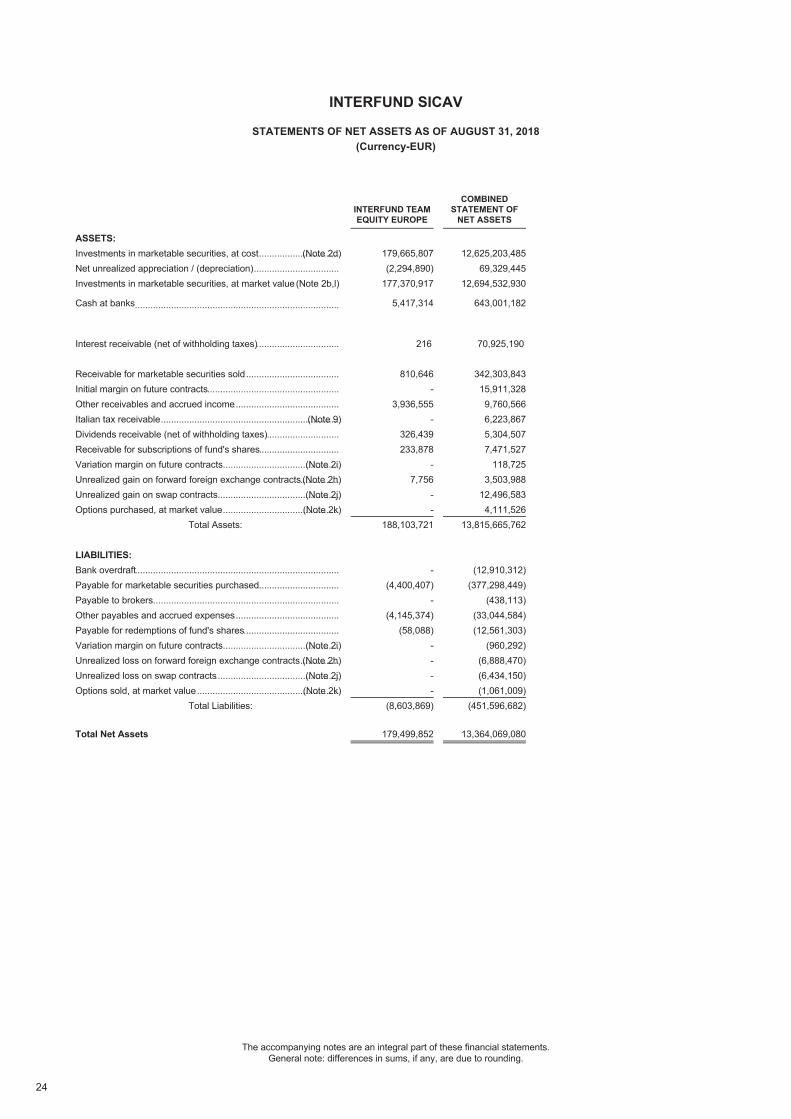
24
The accompanying notes are an integral part of these financial statements.General note: differences in sums, if any, are due to rounding.
INTERFUND SICAV
STATEMENTS OF NET ASSETS AS OF AUGUST 31, 2018(Currency-EUR)
ASSETS:......................................................................................................Investments in marketable securities, at cost (Note 2d) 179,665,807......................................................................................................Net unrealized appreciation / (depreciation) (2,294,890)......................................................................................................Investments in marketable securities, at market value(Note 2b,l) 177,370,917
......................................................................................................Cash at banks 5,417,314
......................................................................................................Interest receivable (net of withholding taxes) 216
......................................................................................................Receivable for marketable securities sold 810,646
......................................................................................................Initial margin on future contracts -
......................................................................................................Other receivables and accrued income 3,936,555
......................................................................................................Italian tax receivable (Note 9) -
......................................................................................................Dividends receivable (net of withholding taxes) 326,439
......................................................................................................Receivable for subscriptions of fund's shares 233,878
......................................................................................................Variation margin on future contracts (Note 2i) -
......................................................................................................Unrealized gain on forward foreign exchange contracts (Note 2h) 7,756
......................................................................................................Unrealized gain on swap contracts (Note 2j) -
......................................................................................................Options purchased, at market value (Note 2k) -Total Assets: 188,103,721
LIABILITIES:......................................................................................................Bank overdraft -......................................................................................................Payable for marketable securities purchased (4,400,407)......................................................................................................Payable to brokers -......................................................................................................Other payables and accrued expenses (4,145,374)......................................................................................................Payable for redemptions of fund's shares (58,088)......................................................................................................Variation margin on future contracts (Note 2i) -......................................................................................................Unrealized loss on forward foreign exchange contracts (Note 2h) -......................................................................................................Unrealized loss on swap contracts (Note 2j) -......................................................................................................Options sold, at market value (Note 2k) -
Total Liabilities: (8,603,869)
Total Net Assets 179,499,852
INTERFUND TEAMEQUITY EUROPE
12,625,203,48569,329,445
12,694,532,930
643,001,182
70,925,190
342,303,84315,911,3289,760,5666,223,8675,304,5077,471,527
118,7253,503,988
12,496,5834,111,526
13,815,665,762
(12,910,312)(377,298,449)
(438,113)(33,044,584)(12,561,303)
(960,292)(6,888,470)(6,434,150)(1,061,009)
(451,596,682)
13,364,069,080
COMBINEDSTATEMENT OF
NET ASSETS

25
The accompanying notes are an integral part of these financial statements.General note: differences in sums, if any, are due to rounding.
INTERFUND SICAV
STATEMENTS OF OPERATIONS AND CHANGES IN NET ASSETS FOR THE FINANCIAL YEAR ENDED AUGUST 31, 2018(Currency-EUR)
......................................................................................................Net assets at the beginning of the year 894,330,202
INCOME:......................................................................................................Dividends (net of withholding taxes) (Note 2c) 250Interest......................................................................................................- on Bonds (Note 2c) 7,513,391......................................................................................................- on Cash at banks (Note 2c) 283......................................................................................................Securities lending, net (Note 11) 35,055
Total income: 7,548,979
EXPENSES:......................................................................................................Management fees (Note 10) (2,590,146)......................................................................................................Depositary fees (Note 10) (311,424)......................................................................................................Luxembourg tax (Note 9) (323,568)......................................................................................................Transaction costs (Note 8) (6,961)......................................................................................................Central administration fees (Note 10) (903,357)......................................................................................................Performance fees (Note 10) -......................................................................................................Publication expenses (26,598)......................................................................................................Professional fees (18,303)......................................................................................................Domiciliation Fees (Note 10) (5,942)......................................................................................................Directors' fees (5,546)......................................................................................................Interest on bank accounts (153,513)......................................................................................................Other expenses -
Total expenses: (4,345,358)
Net investment income / (loss) 3,203,621
Net realized gains / (losses)
INTERFUND EUROCURRENCY
......................................................................................................- on options (Note 2k) -
......................................................................................................- on future contracts (Note 2i) 106,005
......................................................................................................- on foreign exchange (Note 2a) 820
......................................................................................................- on forward foreign exchange contracts (Note 2h) (127)
......................................................................................................- on swap contracts (Note 2j) -
......................................................................................................- on sale of marketable securities (8,106,718)
......................................................................................................Realized result for the year (4,796,398)
Net change in unrealized appreciation / (depreciation)......................................................................................................- on foreign exchange and forward foreign exchange contracts -......................................................................................................- on swap contracts -......................................................................................................- on marketable securities (3,273,935)......................................................................................................- on options -......................................................................................................Increase / (decrease) in net assets as result from operations (8,070,333)
......................................................................................................Amounts received from subscriptions of shares 578,093,182
......................................................................................................Amounts paid on redemptions of shares (917,522,144)
......................................................................................................Net assets at the end of the year 546,830,906
483,319,108
67,175
20,969,24323,652
163,85621,223,926
(3,222,382)(161,105)(164,943)(35,671)
(467,323)-
(6,328)(6,269)(5,925)(2,333)
(144,098)(9,948)
(4,226,325)
16,997,601
INTERFUND BONDGLOBAL HIGH YIELD
-2,226,911
333,540(10,303,682)(2,614,487)
(13,316,096)(6,676,213)
(2,492,489)48,530
8,878,867-
(241,305)
107,494,870(364,161,049)
226,411,624
2,381,294,019
-
32,809,3607,842
591,64533,408,847
(12,466,842)(1,001,299)(1,065,090)
(10,490)(2,903,523)
-(36,817)(37,081)(6,022)
(13,765)(94,814)(37,997)
(17,673,740)
15,735,107
INTERFUND EUROBOND MEDIUM TERM
(623,708)(4,147,520)
(214,562)(2,985,767)
-(1,345,076)
6,418,474
298,062-
(39,905,359)(115,353)
(33,304,176)
481,435,556(710,200,029)
2,119,225,370
966,736,843
-
12,581,3644,255
195,55212,781,171
(6,491,161)(598,292)(664,465)(11,193)
(1,735,485)-
(21,691)(20,681)(5,988)(7,230)
(46,143)(11,287)
(9,613,616)
3,167,555
INTERFUND EUROBOND SHORT TERM
1-3
(400,349)(2,012,795)
(113,095)(1,453,870)
-(10,410,709)(11,223,262)
151,435-
(13,722,482)(59,042)
(24,853,351)
884,778,096(587,291,575)
1,239,370,012
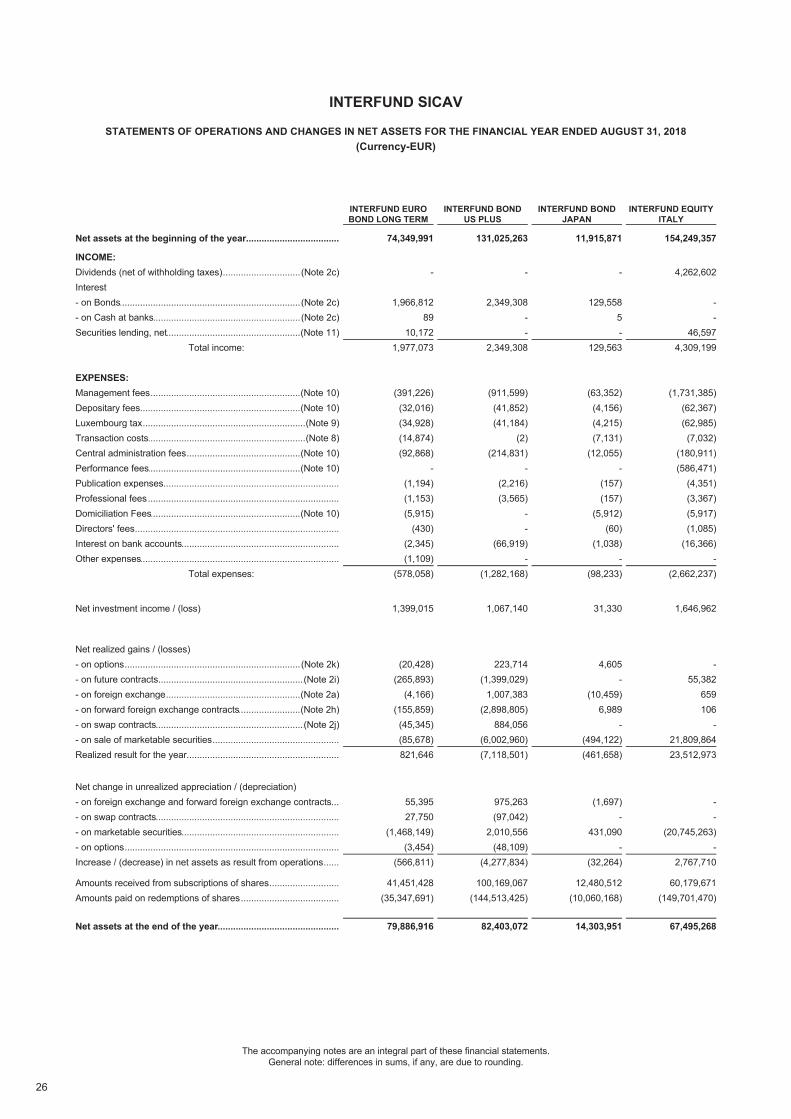
26
The accompanying notes are an integral part of these financial statements.General note: differences in sums, if any, are due to rounding.
INTERFUND SICAV
STATEMENTS OF OPERATIONS AND CHANGES IN NET ASSETS FOR THE FINANCIAL YEAR ENDED AUGUST 31, 2018(Currency-EUR)
......................................................................................................Net assets at the beginning of the year 74,349,991
INCOME:......................................................................................................Dividends (net of withholding taxes) (Note 2c) -Interest......................................................................................................- on Bonds (Note 2c) 1,966,812......................................................................................................- on Cash at banks (Note 2c) 89......................................................................................................Securities lending, net (Note 11) 10,172
Total income: 1,977,073
EXPENSES:......................................................................................................Management fees (Note 10) (391,226)......................................................................................................Depositary fees (Note 10) (32,016)......................................................................................................Luxembourg tax (Note 9) (34,928)......................................................................................................Transaction costs (Note 8) (14,874)......................................................................................................Central administration fees (Note 10) (92,868)......................................................................................................Performance fees (Note 10) -......................................................................................................Publication expenses (1,194)......................................................................................................Professional fees (1,153)......................................................................................................Domiciliation Fees (Note 10) (5,915)......................................................................................................Directors' fees (430)......................................................................................................Interest on bank accounts (2,345)......................................................................................................Other expenses (1,109)
Total expenses: (578,058)
Net investment income / (loss) 1,399,015
Net realized gains / (losses)
INTERFUND EUROBOND LONG TERM
......................................................................................................- on options (Note 2k) (20,428)
......................................................................................................- on future contracts (Note 2i) (265,893)
......................................................................................................- on foreign exchange (Note 2a) (4,166)
......................................................................................................- on forward foreign exchange contracts (Note 2h) (155,859)
......................................................................................................- on swap contracts (Note 2j) (45,345)
......................................................................................................- on sale of marketable securities (85,678)
......................................................................................................Realized result for the year 821,646
Net change in unrealized appreciation / (depreciation)......................................................................................................- on foreign exchange and forward foreign exchange contracts 55,395......................................................................................................- on swap contracts 27,750......................................................................................................- on marketable securities (1,468,149)......................................................................................................- on options (3,454)......................................................................................................Increase / (decrease) in net assets as result from operations (566,811)
......................................................................................................Amounts received from subscriptions of shares 41,451,428
......................................................................................................Amounts paid on redemptions of shares (35,347,691)
......................................................................................................Net assets at the end of the year 79,886,916
131,025,263
-
2,349,308--
2,349,308
(911,599)(41,852)(41,184)
(2)(214,831)
-(2,216)(3,565)
--
(66,919)-
(1,282,168)
1,067,140
INTERFUND BONDUS PLUS
223,714(1,399,029)
1,007,383(2,898,805)
884,056(6,002,960)(7,118,501)
975,263(97,042)
2,010,556(48,109)
(4,277,834)
100,169,067(144,513,425)
82,403,072
11,915,871
-
129,5585-
129,563
(63,352)(4,156)(4,215)(7,131)
(12,055)-
(157)(157)
(5,912)(60)
(1,038)-
(98,233)
31,330
INTERFUND BONDJAPAN
4,605-
(10,459)6,989
-(494,122)(461,658)
(1,697)-
431,090-
(32,264)
12,480,512(10,060,168)
14,303,951
154,249,357
4,262,602
--
46,5974,309,199
(1,731,385)(62,367)(62,985)(7,032)
(180,911)(586,471)
(4,351)(3,367)(5,917)(1,085)
(16,366)-
(2,662,237)
1,646,962
INTERFUND EQUITYITALY
-55,382
659106
-21,809,86423,512,973
--
(20,745,263)-
2,767,710
60,179,671(149,701,470)
67,495,268
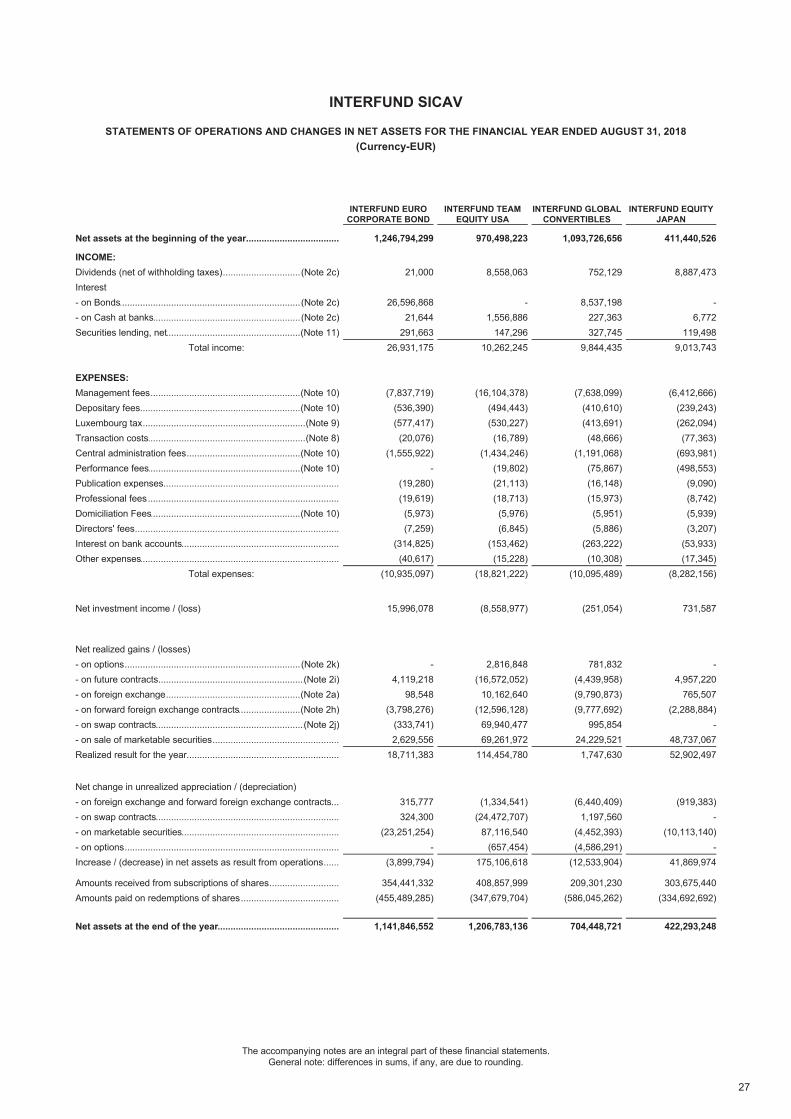
27
The accompanying notes are an integral part of these financial statements.General note: differences in sums, if any, are due to rounding.
INTERFUND SICAV
STATEMENTS OF OPERATIONS AND CHANGES IN NET ASSETS FOR THE FINANCIAL YEAR ENDED AUGUST 31, 2018(Currency-EUR)
......................................................................................................Net assets at the beginning of the year 1,246,794,299
INCOME:......................................................................................................Dividends (net of withholding taxes) (Note 2c) 21,000Interest......................................................................................................- on Bonds (Note 2c) 26,596,868......................................................................................................- on Cash at banks (Note 2c) 21,644......................................................................................................Securities lending, net (Note 11) 291,663
Total income: 26,931,175
EXPENSES:......................................................................................................Management fees (Note 10) (7,837,719)......................................................................................................Depositary fees (Note 10) (536,390)......................................................................................................Luxembourg tax (Note 9) (577,417)......................................................................................................Transaction costs (Note 8) (20,076)......................................................................................................Central administration fees (Note 10) (1,555,922)......................................................................................................Performance fees (Note 10) -......................................................................................................Publication expenses (19,280)......................................................................................................Professional fees (19,619)......................................................................................................Domiciliation Fees (Note 10) (5,973)......................................................................................................Directors' fees (7,259)......................................................................................................Interest on bank accounts (314,825)......................................................................................................Other expenses (40,617)
Total expenses: (10,935,097)
Net investment income / (loss) 15,996,078
Net realized gains / (losses)
INTERFUND EUROCORPORATE BOND
......................................................................................................- on options (Note 2k) -
......................................................................................................- on future contracts (Note 2i) 4,119,218
......................................................................................................- on foreign exchange (Note 2a) 98,548
......................................................................................................- on forward foreign exchange contracts (Note 2h) (3,798,276)
......................................................................................................- on swap contracts (Note 2j) (333,741)
......................................................................................................- on sale of marketable securities 2,629,556
......................................................................................................Realized result for the year 18,711,383
Net change in unrealized appreciation / (depreciation)......................................................................................................- on foreign exchange and forward foreign exchange contracts 315,777......................................................................................................- on swap contracts 324,300......................................................................................................- on marketable securities (23,251,254)......................................................................................................- on options -......................................................................................................Increase / (decrease) in net assets as result from operations (3,899,794)
......................................................................................................Amounts received from subscriptions of shares 354,441,332
......................................................................................................Amounts paid on redemptions of shares (455,489,285)
......................................................................................................Net assets at the end of the year 1,141,846,552
970,498,223
8,558,063
-1,556,886
147,29610,262,245
(16,104,378)(494,443)(530,227)(16,789)
(1,434,246)(19,802)(21,113)(18,713)(5,976)(6,845)
(153,462)(15,228)
(18,821,222)
(8,558,977)
INTERFUND TEAMEQUITY USA
2,816,848(16,572,052)
10,162,640(12,596,128)
69,940,47769,261,972
114,454,780
(1,334,541)(24,472,707)
87,116,540(657,454)
175,106,618
408,857,999(347,679,704)
1,206,783,136
1,093,726,656
752,129
8,537,198227,363327,745
9,844,435
(7,638,099)(410,610)(413,691)(48,666)
(1,191,068)(75,867)(16,148)(15,973)(5,951)(5,886)
(263,222)(10,308)
(10,095,489)
(251,054)
INTERFUND GLOBALCONVERTIBLES
781,832(4,439,958)(9,790,873)(9,777,692)
995,85424,229,5211,747,630
(6,440,409)1,197,560
(4,452,393)(4,586,291)
(12,533,904)
209,301,230(586,045,262)
704,448,721
411,440,526
8,887,473
-6,772
119,4989,013,743
(6,412,666)(239,243)(262,094)(77,363)
(693,981)(498,553)
(9,090)(8,742)(5,939)(3,207)
(53,933)(17,345)
(8,282,156)
731,587
INTERFUND EQUITYJAPAN
-4,957,220
765,507(2,288,884)
-48,737,06752,902,497
(919,383)-
(10,113,140)-
41,869,974
303,675,440(334,692,692)
422,293,248
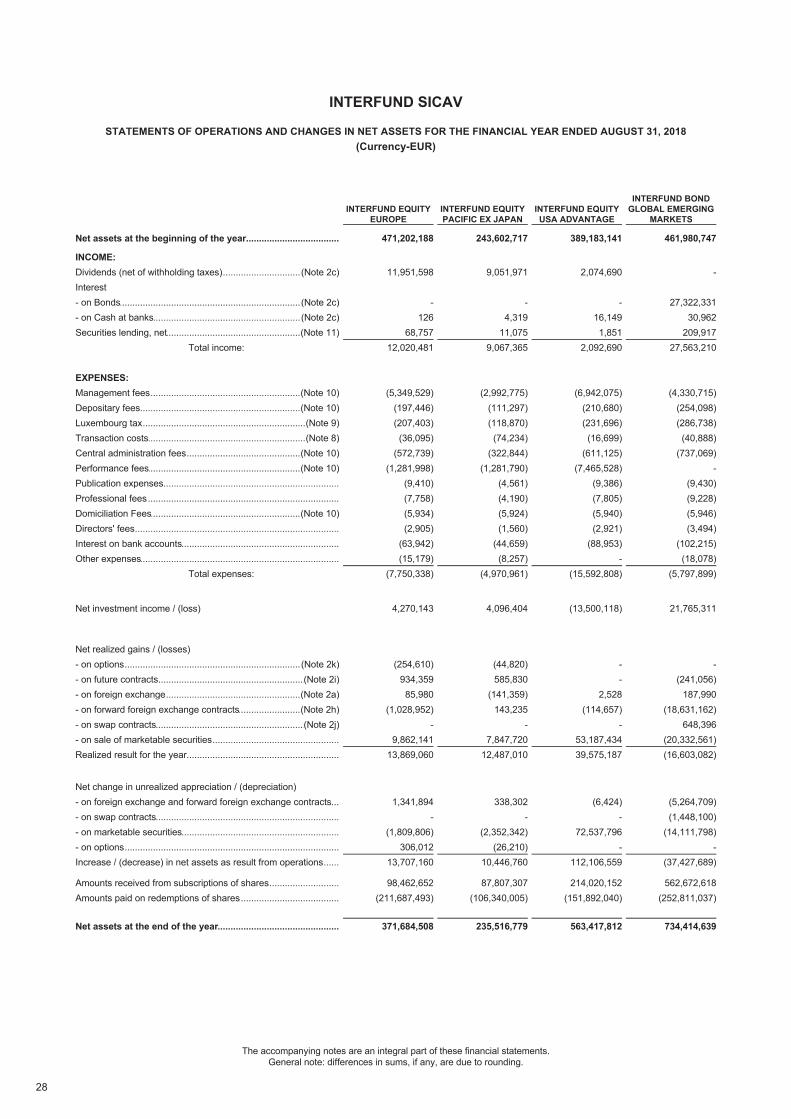
28
The accompanying notes are an integral part of these financial statements.General note: differences in sums, if any, are due to rounding.
INTERFUND SICAV
STATEMENTS OF OPERATIONS AND CHANGES IN NET ASSETS FOR THE FINANCIAL YEAR ENDED AUGUST 31, 2018(Currency-EUR)
......................................................................................................Net assets at the beginning of the year 471,202,188
INCOME:......................................................................................................Dividends (net of withholding taxes) (Note 2c) 11,951,598Interest......................................................................................................- on Bonds (Note 2c) -......................................................................................................- on Cash at banks (Note 2c) 126......................................................................................................Securities lending, net (Note 11) 68,757
Total income: 12,020,481
EXPENSES:......................................................................................................Management fees (Note 10) (5,349,529)......................................................................................................Depositary fees (Note 10) (197,446)......................................................................................................Luxembourg tax (Note 9) (207,403)......................................................................................................Transaction costs (Note 8) (36,095)......................................................................................................Central administration fees (Note 10) (572,739)......................................................................................................Performance fees (Note 10) (1,281,998)......................................................................................................Publication expenses (9,410)......................................................................................................Professional fees (7,758)......................................................................................................Domiciliation Fees (Note 10) (5,934)......................................................................................................Directors' fees (2,905)......................................................................................................Interest on bank accounts (63,942)......................................................................................................Other expenses (15,179)
Total expenses: (7,750,338)
Net investment income / (loss) 4,270,143
Net realized gains / (losses)
INTERFUND EQUITYEUROPE
......................................................................................................- on options (Note 2k) (254,610)
......................................................................................................- on future contracts (Note 2i) 934,359
......................................................................................................- on foreign exchange (Note 2a) 85,980
......................................................................................................- on forward foreign exchange contracts (Note 2h) (1,028,952)
......................................................................................................- on swap contracts (Note 2j) -
......................................................................................................- on sale of marketable securities 9,862,141
......................................................................................................Realized result for the year 13,869,060
Net change in unrealized appreciation / (depreciation)......................................................................................................- on foreign exchange and forward foreign exchange contracts 1,341,894......................................................................................................- on swap contracts -......................................................................................................- on marketable securities (1,809,806)......................................................................................................- on options 306,012......................................................................................................Increase / (decrease) in net assets as result from operations 13,707,160
......................................................................................................Amounts received from subscriptions of shares 98,462,652
......................................................................................................Amounts paid on redemptions of shares (211,687,493)
......................................................................................................Net assets at the end of the year 371,684,508
243,602,717
9,051,971
-4,319
11,0759,067,365
(2,992,775)(111,297)(118,870)(74,234)
(322,844)(1,281,790)
(4,561)(4,190)(5,924)(1,560)
(44,659)(8,257)
(4,970,961)
4,096,404
INTERFUND EQUITYPACIFIC EX JAPAN
(44,820)585,830
(141,359)143,235
-7,847,720
12,487,010
338,302-
(2,352,342)(26,210)
10,446,760
87,807,307(106,340,005)
235,516,779
389,183,141
2,074,690
-16,1491,851
2,092,690
(6,942,075)(210,680)(231,696)(16,699)
(611,125)(7,465,528)
(9,386)(7,805)(5,940)(2,921)
(88,953)-
(15,592,808)
(13,500,118)
INTERFUND EQUITYUSA ADVANTAGE
--
2,528(114,657)
-53,187,43439,575,187
(6,424)-
72,537,796-
112,106,559
214,020,152(151,892,040)
563,417,812
461,980,747
-
27,322,33130,962
209,91727,563,210
(4,330,715)(254,098)(286,738)(40,888)
(737,069)-
(9,430)(9,228)(5,946)(3,494)
(102,215)(18,078)
(5,797,899)
21,765,311
INTERFUND BONDGLOBAL EMERGING
MARKETS
-(241,056)
187,990(18,631,162)
648,396(20,332,561)(16,603,082)
(5,264,709)(1,448,100)
(14,111,798)-
(37,427,689)
562,672,618(252,811,037)
734,414,639
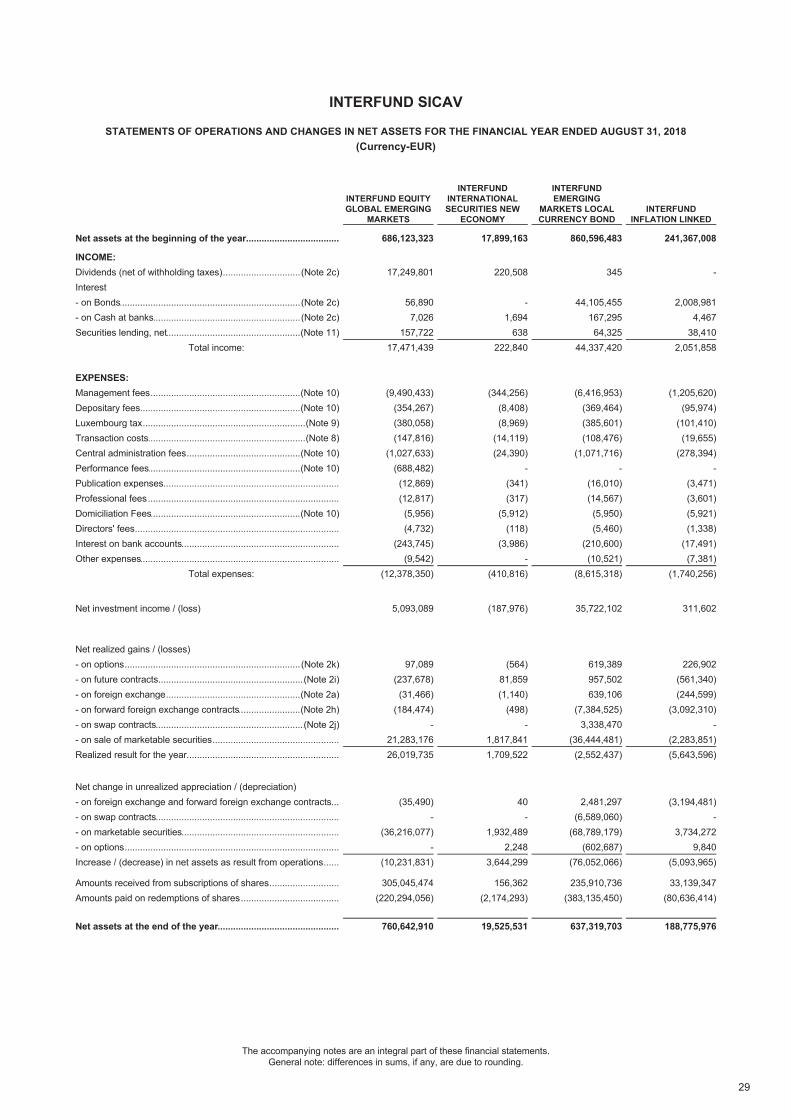
29
The accompanying notes are an integral part of these financial statements.General note: differences in sums, if any, are due to rounding.
INTERFUND SICAV
STATEMENTS OF OPERATIONS AND CHANGES IN NET ASSETS FOR THE FINANCIAL YEAR ENDED AUGUST 31, 2018(Currency-EUR)
......................................................................................................Net assets at the beginning of the year 686,123,323
INCOME:......................................................................................................Dividends (net of withholding taxes) (Note 2c) 17,249,801Interest......................................................................................................- on Bonds (Note 2c) 56,890......................................................................................................- on Cash at banks (Note 2c) 7,026......................................................................................................Securities lending, net (Note 11) 157,722
Total income: 17,471,439
EXPENSES:......................................................................................................Management fees (Note 10) (9,490,433)......................................................................................................Depositary fees (Note 10) (354,267)......................................................................................................Luxembourg tax (Note 9) (380,058)......................................................................................................Transaction costs (Note 8) (147,816)......................................................................................................Central administration fees (Note 10) (1,027,633)......................................................................................................Performance fees (Note 10) (688,482)......................................................................................................Publication expenses (12,869)......................................................................................................Professional fees (12,817)......................................................................................................Domiciliation Fees (Note 10) (5,956)......................................................................................................Directors' fees (4,732)......................................................................................................Interest on bank accounts (243,745)......................................................................................................Other expenses (9,542)
Total expenses: (12,378,350)
Net investment income / (loss) 5,093,089
Net realized gains / (losses)
INTERFUND EQUITYGLOBAL EMERGING
MARKETS
......................................................................................................- on options (Note 2k) 97,089
......................................................................................................- on future contracts (Note 2i) (237,678)
......................................................................................................- on foreign exchange (Note 2a) (31,466)
......................................................................................................- on forward foreign exchange contracts (Note 2h) (184,474)
......................................................................................................- on swap contracts (Note 2j) -
......................................................................................................- on sale of marketable securities 21,283,176
......................................................................................................Realized result for the year 26,019,735
Net change in unrealized appreciation / (depreciation)......................................................................................................- on foreign exchange and forward foreign exchange contracts (35,490)......................................................................................................- on swap contracts -......................................................................................................- on marketable securities (36,216,077)......................................................................................................- on options -......................................................................................................Increase / (decrease) in net assets as result from operations (10,231,831)
......................................................................................................Amounts received from subscriptions of shares 305,045,474
......................................................................................................Amounts paid on redemptions of shares (220,294,056)
......................................................................................................Net assets at the end of the year 760,642,910
17,899,163
220,508
-1,694
638222,840
(344,256)(8,408)(8,969)
(14,119)(24,390)
-(341)(317)
(5,912)(118)
(3,986)-
(410,816)
(187,976)
INTERFUNDINTERNATIONALSECURITIES NEW
ECONOMY
(564)81,859(1,140)
(498)-
1,817,8411,709,522
40-
1,932,4892,248
3,644,299
156,362(2,174,293)
19,525,531
860,596,483
345
44,105,455167,29564,325
44,337,420
(6,416,953)(369,464)(385,601)(108,476)
(1,071,716)-
(16,010)(14,567)(5,950)(5,460)
(210,600)(10,521)
(8,615,318)
35,722,102
INTERFUNDEMERGING
MARKETS LOCALCURRENCY BOND
619,389957,502639,106
(7,384,525)3,338,470
(36,444,481)(2,552,437)
2,481,297(6,589,060)
(68,789,179)(602,687)
(76,052,066)
235,910,736(383,135,450)
637,319,703
241,367,008
-
2,008,9814,467
38,4102,051,858
(1,205,620)(95,974)
(101,410)(19,655)
(278,394)-
(3,471)(3,601)(5,921)(1,338)
(17,491)(7,381)
(1,740,256)
311,602
INTERFUNDINFLATION LINKED
226,902(561,340)(244,599)
(3,092,310)-
(2,283,851)(5,643,596)
(3,194,481)-
3,734,2729,840
(5,093,965)
33,139,347(80,636,414)
188,775,976
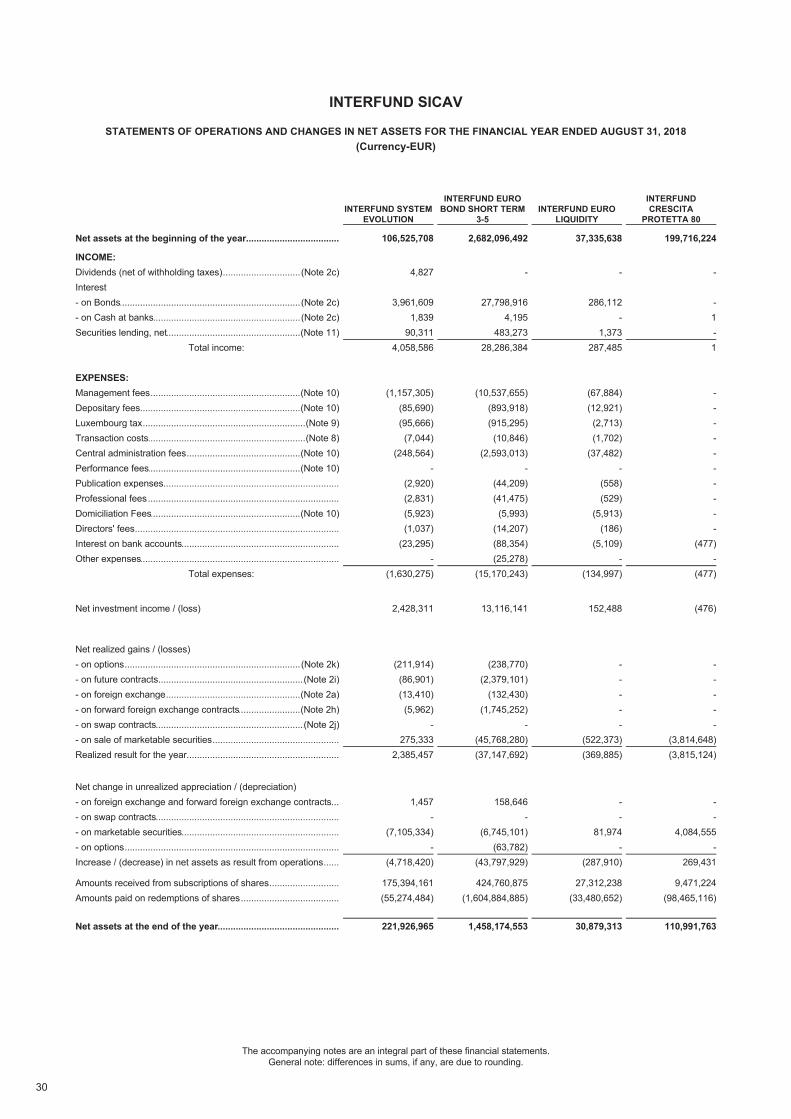
30
The accompanying notes are an integral part of these financial statements.General note: differences in sums, if any, are due to rounding.
INTERFUND SICAV
STATEMENTS OF OPERATIONS AND CHANGES IN NET ASSETS FOR THE FINANCIAL YEAR ENDED AUGUST 31, 2018(Currency-EUR)
......................................................................................................Net assets at the beginning of the year 106,525,708
INCOME:......................................................................................................Dividends (net of withholding taxes) (Note 2c) 4,827Interest......................................................................................................- on Bonds (Note 2c) 3,961,609......................................................................................................- on Cash at banks (Note 2c) 1,839......................................................................................................Securities lending, net (Note 11) 90,311
Total income: 4,058,586
EXPENSES:......................................................................................................Management fees (Note 10) (1,157,305)......................................................................................................Depositary fees (Note 10) (85,690)......................................................................................................Luxembourg tax (Note 9) (95,666)......................................................................................................Transaction costs (Note 8) (7,044)......................................................................................................Central administration fees (Note 10) (248,564)......................................................................................................Performance fees (Note 10) -......................................................................................................Publication expenses (2,920)......................................................................................................Professional fees (2,831)......................................................................................................Domiciliation Fees (Note 10) (5,923)......................................................................................................Directors' fees (1,037)......................................................................................................Interest on bank accounts (23,295)......................................................................................................Other expenses -
Total expenses: (1,630,275)
Net investment income / (loss) 2,428,311
Net realized gains / (losses)
INTERFUND SYSTEMEVOLUTION
......................................................................................................- on options (Note 2k) (211,914)
......................................................................................................- on future contracts (Note 2i) (86,901)
......................................................................................................- on foreign exchange (Note 2a) (13,410)
......................................................................................................- on forward foreign exchange contracts (Note 2h) (5,962)
......................................................................................................- on swap contracts (Note 2j) -
......................................................................................................- on sale of marketable securities 275,333
......................................................................................................Realized result for the year 2,385,457
Net change in unrealized appreciation / (depreciation)......................................................................................................- on foreign exchange and forward foreign exchange contracts 1,457......................................................................................................- on swap contracts -......................................................................................................- on marketable securities (7,105,334)......................................................................................................- on options -......................................................................................................Increase / (decrease) in net assets as result from operations (4,718,420)
......................................................................................................Amounts received from subscriptions of shares 175,394,161
......................................................................................................Amounts paid on redemptions of shares (55,274,484)
......................................................................................................Net assets at the end of the year 221,926,965
2,682,096,492
-
27,798,9164,195
483,27328,286,384
(10,537,655)(893,918)(915,295)(10,846)
(2,593,013)-
(44,209)(41,475)(5,993)
(14,207)(88,354)(25,278)
(15,170,243)
13,116,141
INTERFUND EUROBOND SHORT TERM
3-5
(238,770)(2,379,101)
(132,430)(1,745,252)
-(45,768,280)(37,147,692)
158,646-
(6,745,101)(63,782)
(43,797,929)
424,760,875(1,604,884,885)
1,458,174,553
37,335,638
-
286,112-
1,373287,485
(67,884)(12,921)(2,713)(1,702)
(37,482)-
(558)(529)
(5,913)(186)
(5,109)-
(134,997)
152,488
INTERFUND EUROLIQUIDITY
-----
(522,373)(369,885)
--
81,974-
(287,910)
27,312,238(33,480,652)
30,879,313
199,716,224
-
-1-1
----------
(477)-
(477)
(476)
INTERFUNDCRESCITA
PROTETTA 80
-----
(3,814,648)(3,815,124)
--
4,084,555-
269,431
9,471,224(98,465,116)
110,991,763
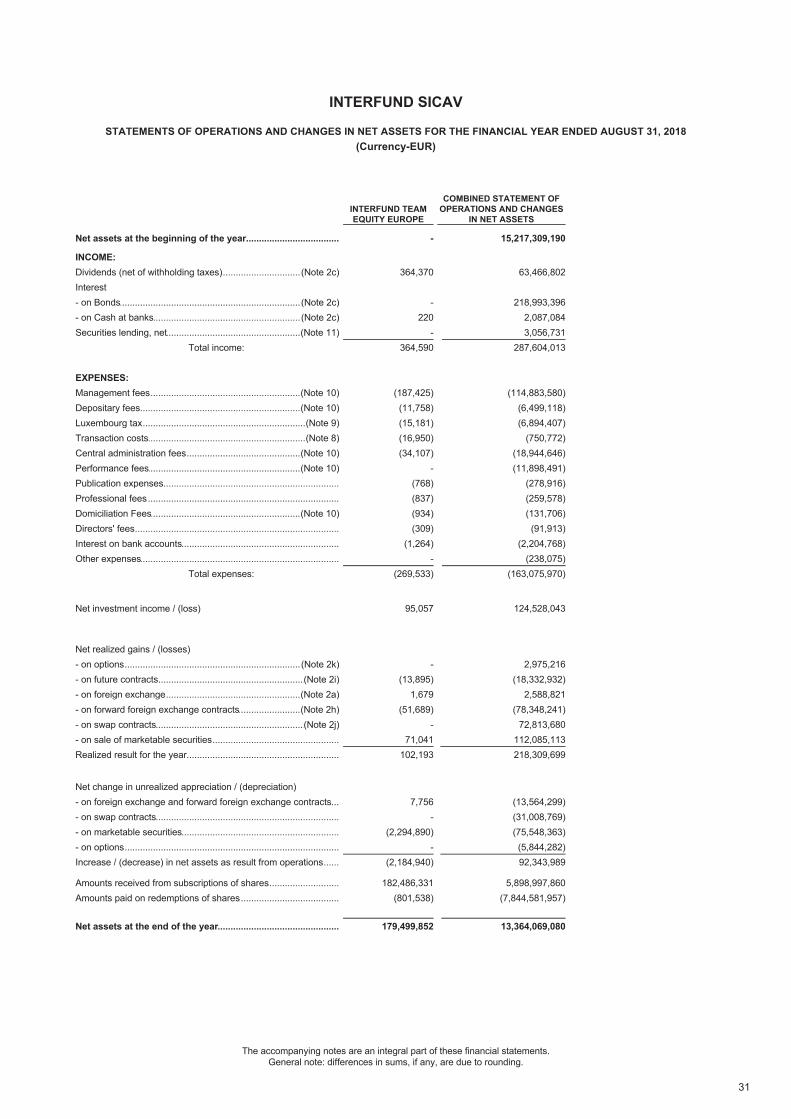
31
The accompanying notes are an integral part of these financial statements.General note: differences in sums, if any, are due to rounding.
INTERFUND SICAV
STATEMENTS OF OPERATIONS AND CHANGES IN NET ASSETS FOR THE FINANCIAL YEAR ENDED AUGUST 31, 2018(Currency-EUR)
......................................................................................................Net assets at the beginning of the year -
INCOME:......................................................................................................Dividends (net of withholding taxes) (Note 2c) 364,370Interest......................................................................................................- on Bonds (Note 2c) -......................................................................................................- on Cash at banks (Note 2c) 220......................................................................................................Securities lending, net (Note 11) -
Total income: 364,590
EXPENSES:......................................................................................................Management fees (Note 10) (187,425)......................................................................................................Depositary fees (Note 10) (11,758)......................................................................................................Luxembourg tax (Note 9) (15,181)......................................................................................................Transaction costs (Note 8) (16,950)......................................................................................................Central administration fees (Note 10) (34,107)......................................................................................................Performance fees (Note 10) -......................................................................................................Publication expenses (768)......................................................................................................Professional fees (837)......................................................................................................Domiciliation Fees (Note 10) (934)......................................................................................................Directors' fees (309)......................................................................................................Interest on bank accounts (1,264)......................................................................................................Other expenses -
Total expenses: (269,533)
Net investment income / (loss) 95,057
Net realized gains / (losses)
INTERFUND TEAMEQUITY EUROPE
......................................................................................................- on options (Note 2k) -
......................................................................................................- on future contracts (Note 2i) (13,895)
......................................................................................................- on foreign exchange (Note 2a) 1,679
......................................................................................................- on forward foreign exchange contracts (Note 2h) (51,689)
......................................................................................................- on swap contracts (Note 2j) -
......................................................................................................- on sale of marketable securities 71,041
......................................................................................................Realized result for the year 102,193
Net change in unrealized appreciation / (depreciation)......................................................................................................- on foreign exchange and forward foreign exchange contracts 7,756......................................................................................................- on swap contracts -......................................................................................................- on marketable securities (2,294,890)......................................................................................................- on options -......................................................................................................Increase / (decrease) in net assets as result from operations (2,184,940)
......................................................................................................Amounts received from subscriptions of shares 182,486,331
......................................................................................................Amounts paid on redemptions of shares (801,538)
......................................................................................................Net assets at the end of the year 179,499,852
15,217,309,190
63,466,802
218,993,3962,087,0843,056,731
287,604,013
(114,883,580)(6,499,118)(6,894,407)
(750,772)(18,944,646)(11,898,491)
(278,916)(259,578)(131,706)(91,913)
(2,204,768)(238,075)
(163,075,970)
124,528,043
2,975,216(18,332,932)
2,588,821(78,348,241)
72,813,680112,085,113218,309,699
(13,564,299)(31,008,769)(75,548,363)(5,844,282)92,343,989
5,898,997,860(7,844,581,957)
13,364,069,080
COMBINED STATEMENT OFOPERATIONS AND CHANGES
IN NET ASSETS
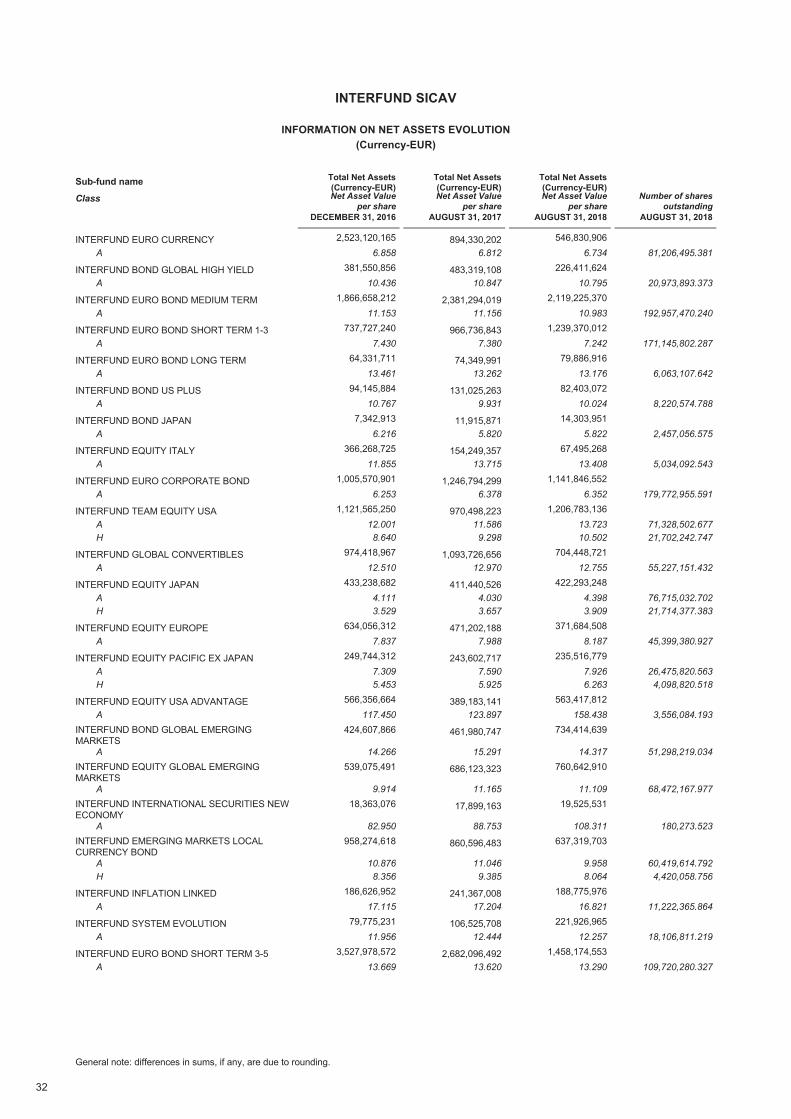
32
General note: differences in sums, if any, are due to rounding.
546,830,906894,330,2022,523,120,165INTERFUND EURO CURRENCYA 6.858 6.812 6.734 81,206,495.381
226,411,624483,319,108381,550,856INTERFUND BOND GLOBAL HIGH YIELDA 10.436 10.847 10.795 20,973,893.373
2,119,225,3702,381,294,0191,866,658,212INTERFUND EURO BOND MEDIUM TERMA 11.153 11.156 10.983 192,957,470.240
1,239,370,012966,736,843737,727,240INTERFUND EURO BOND SHORT TERM 1-3A 7.430 7.380 7.242 171,145,802.287
79,886,91674,349,99164,331,711INTERFUND EURO BOND LONG TERMA 13.461 13.262 13.176 6,063,107.642
82,403,072131,025,26394,145,884INTERFUND BOND US PLUSA 10.767 9.931 10.024 8,220,574.788
14,303,95111,915,8717,342,913INTERFUND BOND JAPANA 6.216 5.820 5.822 2,457,056.575
67,495,268154,249,357366,268,725INTERFUND EQUITY ITALYA 11.855 13.715 13.408 5,034,092.543
1,141,846,5521,246,794,2991,005,570,901INTERFUND EURO CORPORATE BONDA 6.253 6.378 6.352 179,772,955.591
1,206,783,136970,498,2231,121,565,250INTERFUND TEAM EQUITY USAAH
12.0018.640
11.5869.298
13.72310.502
71,328,502.67721,702,242.747
704,448,7211,093,726,656974,418,967INTERFUND GLOBAL CONVERTIBLESA 12.510 12.970 12.755 55,227,151.432
422,293,248411,440,526433,238,682INTERFUND EQUITY JAPANAH
4.1113.529
4.0303.657
4.3983.909
76,715,032.70221,714,377.383
371,684,508471,202,188634,056,312INTERFUND EQUITY EUROPEA 7.837 7.988 8.187 45,399,380.927
235,516,779243,602,717249,744,312INTERFUND EQUITY PACIFIC EX JAPANAH
7.3095.453
7.5905.925
7.9266.263
26,475,820.5634,098,820.518
563,417,812389,183,141566,356,664INTERFUND EQUITY USA ADVANTAGEA 117.450 123.897 158.438 3,556,084.193
734,414,639461,980,747424,607,866INTERFUND BOND GLOBAL EMERGINGMARKETS
A 14.266 15.291 14.317 51,298,219.034760,642,910686,123,323539,075,491INTERFUND EQUITY GLOBAL EMERGING
MARKETSA 9.914 11.165 11.109 68,472,167.977
19,525,53117,899,16318,363,076INTERFUND INTERNATIONAL SECURITIES NEWECONOMY
A 82.950 88.753 108.311 180,273.523637,319,703860,596,483958,274,618INTERFUND EMERGING MARKETS LOCAL
CURRENCY BONDAH
10.8768.356
11.0469.385
9.9588.064
60,419,614.7924,420,058.756
188,775,976241,367,008186,626,952INTERFUND INFLATION LINKEDA 17.115 17.204 16.821 11,222,365.864
221,926,965106,525,70879,775,231INTERFUND SYSTEM EVOLUTIONA 11.956 12.444 12.257 18,106,811.219
1,458,174,5532,682,096,4923,527,978,572INTERFUND EURO BOND SHORT TERM 3-5A 13.669 13.620 13.290 109,720,280.327
INTERFUND SICAV
(Currency-EUR)INFORMATION ON NET ASSETS EVOLUTION
Sub-fund name Total Net Assets(Currency-EUR)
Total Net Assets(Currency-EUR)
Total Net Assets(Currency-EUR)
Net Asset Valueper share
Net Asset Valueper share
Net Asset Valueper share
Number of shares outstanding
Class
DECEMBER 31, 2016 AUGUST 31, 2017 AUGUST 31, 2018 AUGUST 31, 2018
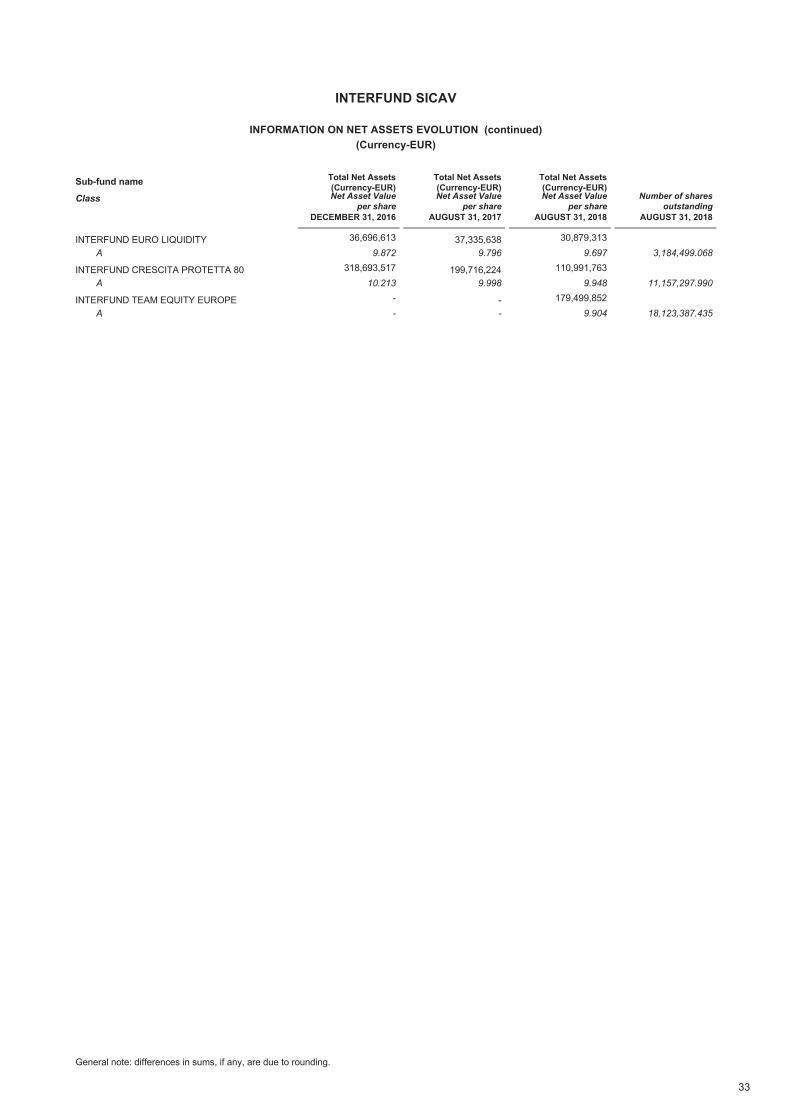
33
General note: differences in sums, if any, are due to rounding.
30,879,31337,335,63836,696,613INTERFUND EURO LIQUIDITYA 9.872 9.796 9.697 3,184,499.068
110,991,763199,716,224318,693,517INTERFUND CRESCITA PROTETTA 80A 10.213 9.998 9.948 11,157,297.990
179,499,852--INTERFUND TEAM EQUITY EUROPEA - - 9.904 18,123,387.435
INTERFUND SICAV
(Currency-EUR)INFORMATION ON NET ASSETS EVOLUTION (continued)
Sub-fund name Total Net Assets(Currency-EUR)
Total Net Assets(Currency-EUR)
Total Net Assets(Currency-EUR)
Net Asset Valueper share
Net Asset Valueper share
Net Asset Valueper share
Number of shares outstanding
Class
DECEMBER 31, 2016 AUGUST 31, 2017 AUGUST 31, 2018 AUGUST 31, 2018
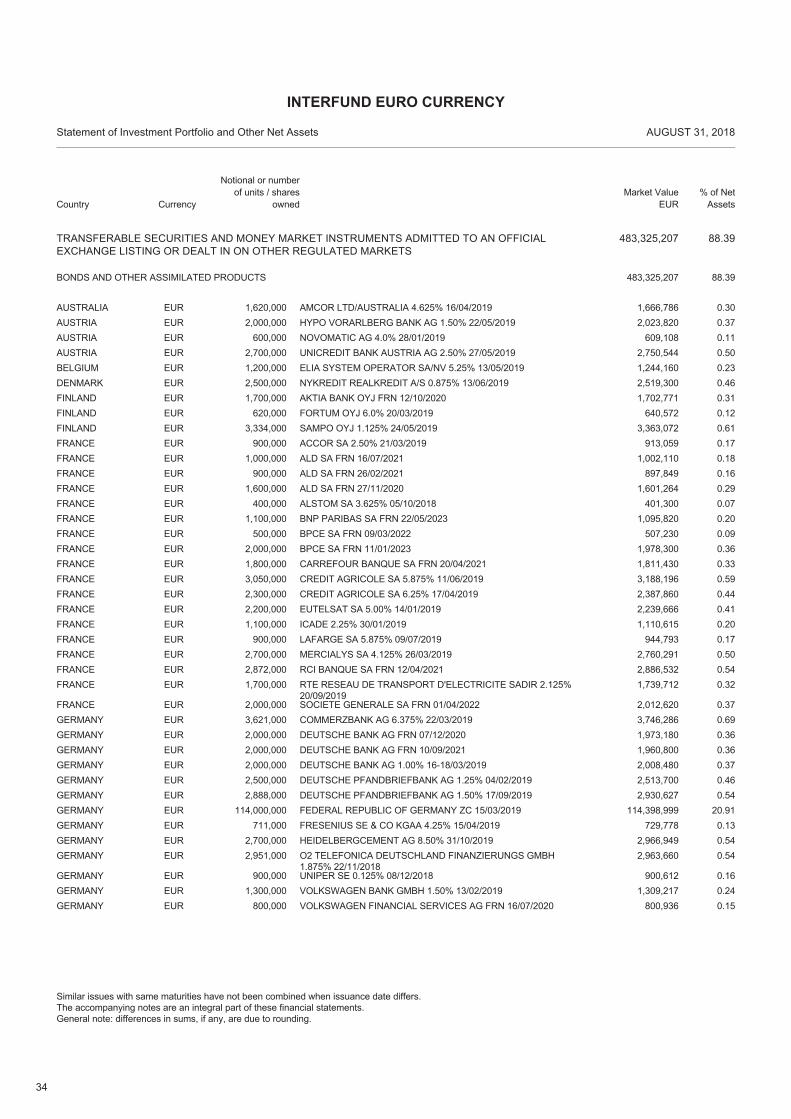
34
TRANSFERABLE SECURITIES AND MONEY MARKET INSTRUMENTS ADMITTED TO AN OFFICIALEXCHANGE LISTING OR DEALT IN ON OTHER REGULATED MARKETS
483,325,207 88.39
EUR 1,620,000 AMCOR LTD/AUSTRALIA 4.625% 16/04/2019 1,666,786 0.30AUSTRALIA
BONDS AND OTHER ASSIMILATED PRODUCTS 88.39483,325,207
EUR 2,000,000 HYPO VORARLBERG BANK AG 1.50% 22/05/2019 2,023,820 0.37AUSTRIAEUR 600,000 NOVOMATIC AG 4.0% 28/01/2019 609,108 0.11AUSTRIAEUR 2,700,000 UNICREDIT BANK AUSTRIA AG 2.50% 27/05/2019 2,750,544 0.50AUSTRIAEUR 1,200,000 ELIA SYSTEM OPERATOR SA/NV 5.25% 13/05/2019 1,244,160 0.23BELGIUMEUR 2,500,000 NYKREDIT REALKREDIT A/S 0.875% 13/06/2019 2,519,300 0.46DENMARKEUR 1,700,000 AKTIA BANK OYJ FRN 12/10/2020 1,702,771 0.31FINLANDEUR 620,000 FORTUM OYJ 6.0% 20/03/2019 640,572 0.12FINLANDEUR 3,334,000 SAMPO OYJ 1.125% 24/05/2019 3,363,072 0.61FINLANDEUR 900,000 ACCOR SA 2.50% 21/03/2019 913,059 0.17FRANCEEUR 1,000,000 ALD SA FRN 16/07/2021 1,002,110 0.18FRANCEEUR 900,000 ALD SA FRN 26/02/2021 897,849 0.16FRANCEEUR 1,600,000 ALD SA FRN 27/11/2020 1,601,264 0.29FRANCEEUR 400,000 ALSTOM SA 3.625% 05/10/2018 401,300 0.07FRANCEEUR 1,100,000 BNP PARIBAS SA FRN 22/05/2023 1,095,820 0.20FRANCEEUR 500,000 BPCE SA FRN 09/03/2022 507,230 0.09FRANCEEUR 2,000,000 BPCE SA FRN 11/01/2023 1,978,300 0.36FRANCEEUR 1,800,000 CARREFOUR BANQUE SA FRN 20/04/2021 1,811,430 0.33FRANCEEUR 3,050,000 CREDIT AGRICOLE SA 5.875% 11/06/2019 3,188,196 0.59FRANCEEUR 2,300,000 CREDIT AGRICOLE SA 6.25% 17/04/2019 2,387,860 0.44FRANCEEUR 2,200,000 EUTELSAT SA 5.00% 14/01/2019 2,239,666 0.41FRANCEEUR 1,100,000 ICADE 2.25% 30/01/2019 1,110,615 0.20FRANCEEUR 900,000 LAFARGE SA 5.875% 09/07/2019 944,793 0.17FRANCEEUR 2,700,000 MERCIALYS SA 4.125% 26/03/2019 2,760,291 0.50FRANCEEUR 2,872,000 RCI BANQUE SA FRN 12/04/2021 2,886,532 0.54FRANCEEUR 1,700,000 RTE RESEAU DE TRANSPORT D'ELECTRICITE SADIR 2.125%
20/09/20191,739,712 0.32FRANCE
EUR 2,000,000 SOCIETE GENERALE SA FRN 01/04/2022 2,012,620 0.37FRANCEEUR 3,621,000 COMMERZBANK AG 6.375% 22/03/2019 3,746,286 0.69GERMANYEUR 2,000,000 DEUTSCHE BANK AG FRN 07/12/2020 1,973,180 0.36GERMANYEUR 2,000,000 DEUTSCHE BANK AG FRN 10/09/2021 1,960,800 0.36GERMANYEUR 2,000,000 DEUTSCHE BANK AG 1.00% 16-18/03/2019 2,008,480 0.37GERMANYEUR 2,500,000 DEUTSCHE PFANDBRIEFBANK AG 1.25% 04/02/2019 2,513,700 0.46GERMANYEUR 2,888,000 DEUTSCHE PFANDBRIEFBANK AG 1.50% 17/09/2019 2,930,627 0.54GERMANYEUR 114,000,000 FEDERAL REPUBLIC OF GERMANY ZC 15/03/2019 114,398,999 20.91GERMANYEUR 711,000 FRESENIUS SE & CO KGAA 4.25% 15/04/2019 729,778 0.13GERMANYEUR 2,700,000 HEIDELBERGCEMENT AG 8.50% 31/10/2019 2,966,949 0.54GERMANYEUR 2,951,000 O2 TELEFONICA DEUTSCHLAND FINANZIERUNGS GMBH
1.875% 22/11/20182,963,660 0.54GERMANY
EUR 900,000 UNIPER SE 0.125% 08/12/2018 900,612 0.16GERMANYEUR 1,300,000 VOLKSWAGEN BANK GMBH 1.50% 13/02/2019 1,309,217 0.24GERMANYEUR 800,000 VOLKSWAGEN FINANCIAL SERVICES AG FRN 16/07/2020 800,936 0.15GERMANY
Country
Statement of Investment Portfolio and Other Net Assets AUGUST 31, 2018
Notional or number of units / shares
ownedMarket Value
EUR% of Net
Assets
INTERFUND EURO CURRENCY
Similar issues with same maturities have not been combined when issuance date differs.The accompanying notes are an integral part of these financial statements.General note: differences in sums, if any, are due to rounding.
Currency
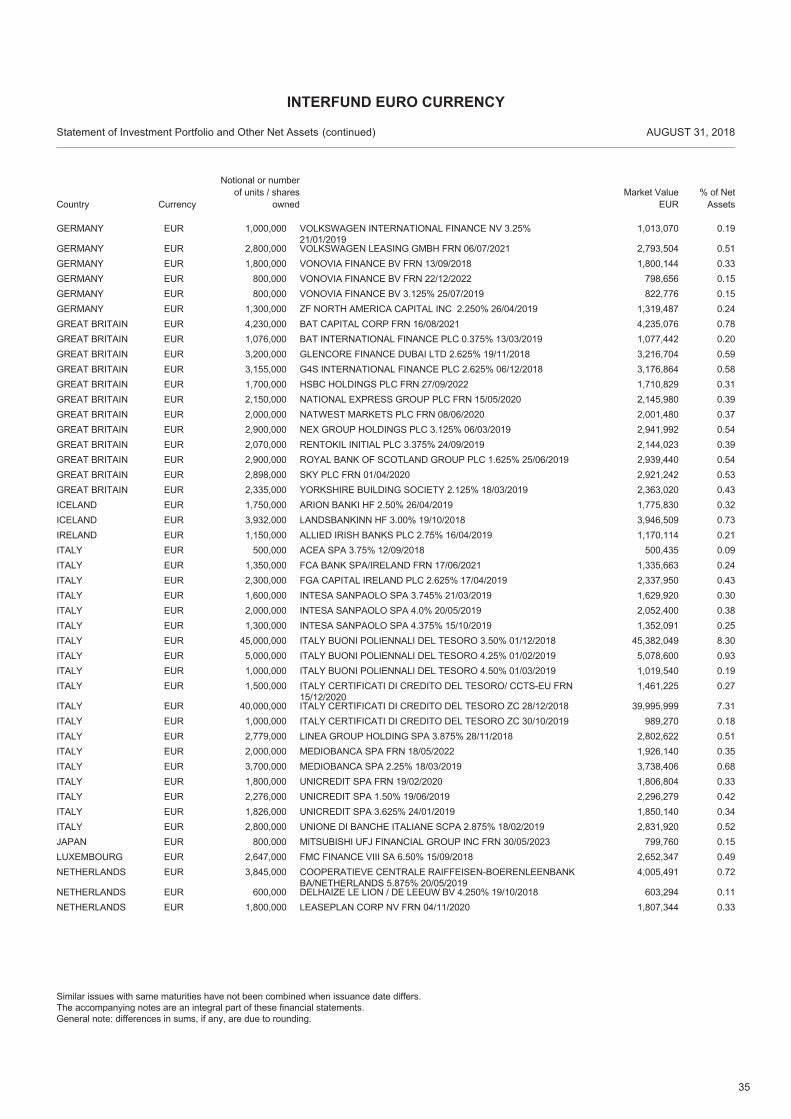
35
EUR 1,000,000 VOLKSWAGEN INTERNATIONAL FINANCE NV 3.25%21/01/2019
1,013,070 0.19GERMANY
EUR 2,800,000 VOLKSWAGEN LEASING GMBH FRN 06/07/2021 2,793,504 0.51GERMANYEUR 1,800,000 VONOVIA FINANCE BV FRN 13/09/2018 1,800,144 0.33GERMANYEUR 800,000 VONOVIA FINANCE BV FRN 22/12/2022 798,656 0.15GERMANYEUR 800,000 VONOVIA FINANCE BV 3.125% 25/07/2019 822,776 0.15GERMANYEUR 1,300,000 ZF NORTH AMERICA CAPITAL INC 2.250% 26/04/2019 1,319,487 0.24GERMANYEUR 4,230,000 BAT CAPITAL CORP FRN 16/08/2021 4,235,076 0.78GREAT BRITAINEUR 1,076,000 BAT INTERNATIONAL FINANCE PLC 0.375% 13/03/2019 1,077,442 0.20GREAT BRITAINEUR 3,200,000 GLENCORE FINANCE DUBAI LTD 2.625% 19/11/2018 3,216,704 0.59GREAT BRITAINEUR 3,155,000 G4S INTERNATIONAL FINANCE PLC 2.625% 06/12/2018 3,176,864 0.58GREAT BRITAINEUR 1,700,000 HSBC HOLDINGS PLC FRN 27/09/2022 1,710,829 0.31GREAT BRITAINEUR 2,150,000 NATIONAL EXPRESS GROUP PLC FRN 15/05/2020 2,145,980 0.39GREAT BRITAINEUR 2,000,000 NATWEST MARKETS PLC FRN 08/06/2020 2,001,480 0.37GREAT BRITAINEUR 2,900,000 NEX GROUP HOLDINGS PLC 3.125% 06/03/2019 2,941,992 0.54GREAT BRITAINEUR 2,070,000 RENTOKIL INITIAL PLC 3.375% 24/09/2019 2,144,023 0.39GREAT BRITAINEUR 2,900,000 ROYAL BANK OF SCOTLAND GROUP PLC 1.625% 25/06/2019 2,939,440 0.54GREAT BRITAINEUR 2,898,000 SKY PLC FRN 01/04/2020 2,921,242 0.53GREAT BRITAINEUR 2,335,000 YORKSHIRE BUILDING SOCIETY 2.125% 18/03/2019 2,363,020 0.43GREAT BRITAINEUR 1,750,000 ARION BANKI HF 2.50% 26/04/2019 1,775,830 0.32ICELANDEUR 3,932,000 LANDSBANKINN HF 3.00% 19/10/2018 3,946,509 0.73ICELANDEUR 1,150,000 ALLIED IRISH BANKS PLC 2.75% 16/04/2019 1,170,114 0.21IRELANDEUR 500,000 ACEA SPA 3.75% 12/09/2018 500,435 0.09ITALYEUR 1,350,000 FCA BANK SPA/IRELAND FRN 17/06/2021 1,335,663 0.24ITALYEUR 2,300,000 FGA CAPITAL IRELAND PLC 2.625% 17/04/2019 2,337,950 0.43ITALYEUR 1,600,000 INTESA SANPAOLO SPA 3.745% 21/03/2019 1,629,920 0.30ITALYEUR 2,000,000 INTESA SANPAOLO SPA 4.0% 20/05/2019 2,052,400 0.38ITALYEUR 1,300,000 INTESA SANPAOLO SPA 4.375% 15/10/2019 1,352,091 0.25ITALYEUR 45,000,000 ITALY BUONI POLIENNALI DEL TESORO 3.50% 01/12/2018 45,382,049 8.30ITALYEUR 5,000,000 ITALY BUONI POLIENNALI DEL TESORO 4.25% 01/02/2019 5,078,600 0.93ITALYEUR 1,000,000 ITALY BUONI POLIENNALI DEL TESORO 4.50% 01/03/2019 1,019,540 0.19ITALYEUR 1,500,000 ITALY CERTIFICATI DI CREDITO DEL TESORO/ CCTS-EU FRN
15/12/20201,461,225 0.27ITALY
EUR 40,000,000 ITALY CERTIFICATI DI CREDITO DEL TESORO ZC 28/12/2018 39,995,999 7.31ITALYEUR 1,000,000 ITALY CERTIFICATI DI CREDITO DEL TESORO ZC 30/10/2019 989,270 0.18ITALYEUR 2,779,000 LINEA GROUP HOLDING SPA 3.875% 28/11/2018 2,802,622 0.51ITALYEUR 2,000,000 MEDIOBANCA SPA FRN 18/05/2022 1,926,140 0.35ITALYEUR 3,700,000 MEDIOBANCA SPA 2.25% 18/03/2019 3,738,406 0.68ITALYEUR 1,800,000 UNICREDIT SPA FRN 19/02/2020 1,806,804 0.33ITALYEUR 2,276,000 UNICREDIT SPA 1.50% 19/06/2019 2,296,279 0.42ITALYEUR 1,826,000 UNICREDIT SPA 3.625% 24/01/2019 1,850,140 0.34ITALYEUR 2,800,000 UNIONE DI BANCHE ITALIANE SCPA 2.875% 18/02/2019 2,831,920 0.52ITALYEUR 800,000 MITSUBISHI UFJ FINANCIAL GROUP INC FRN 30/05/2023 799,760 0.15JAPANEUR 2,647,000 FMC FINANCE VIII SA 6.50% 15/09/2018 2,652,347 0.49LUXEMBOURGEUR 3,845,000 COOPERATIEVE CENTRALE RAIFFEISEN-BOERENLEENBANK
BA/NETHERLANDS 5.875% 20/05/20194,005,491 0.72NETHERLANDS
EUR 600,000 DELHAIZE LE LION / DE LEEUW BV 4.250% 19/10/2018 603,294 0.11NETHERLANDSEUR 1,800,000 LEASEPLAN CORP NV FRN 04/11/2020 1,807,344 0.33NETHERLANDS
Country
Statement of Investment Portfolio and Other Net Assets AUGUST 31, 2018
Notional or number of units / shares
ownedMarket Value
EUR% of Net
Assets
INTERFUND EURO CURRENCY
(continued)
Similar issues with same maturities have not been combined when issuance date differs.The accompanying notes are an integral part of these financial statements.General note: differences in sums, if any, are due to rounding.
Currency
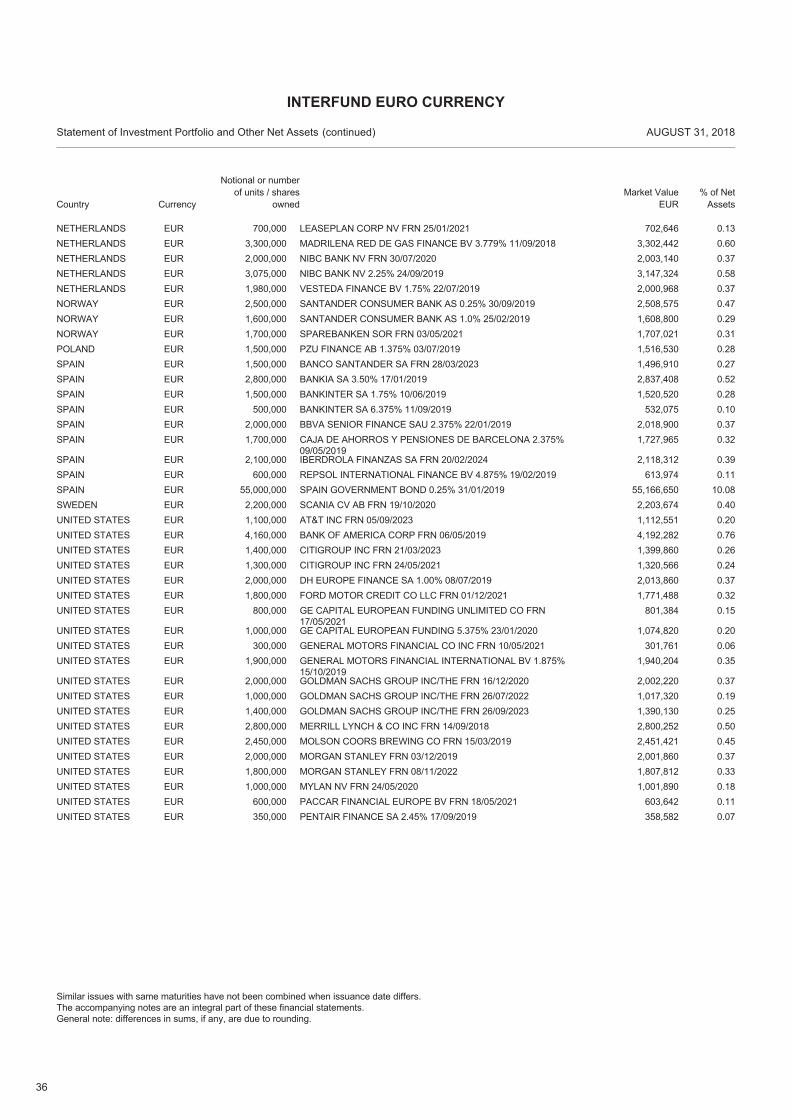
36
EUR 700,000 LEASEPLAN CORP NV FRN 25/01/2021 702,646 0.13NETHERLANDSEUR 3,300,000 MADRILENA RED DE GAS FINANCE BV 3.779% 11/09/2018 3,302,442 0.60NETHERLANDSEUR 2,000,000 NIBC BANK NV FRN 30/07/2020 2,003,140 0.37NETHERLANDSEUR 3,075,000 NIBC BANK NV 2.25% 24/09/2019 3,147,324 0.58NETHERLANDSEUR 1,980,000 VESTEDA FINANCE BV 1.75% 22/07/2019 2,000,968 0.37NETHERLANDSEUR 2,500,000 SANTANDER CONSUMER BANK AS 0.25% 30/09/2019 2,508,575 0.47NORWAYEUR 1,600,000 SANTANDER CONSUMER BANK AS 1.0% 25/02/2019 1,608,800 0.29NORWAYEUR 1,700,000 SPAREBANKEN SOR FRN 03/05/2021 1,707,021 0.31NORWAYEUR 1,500,000 PZU FINANCE AB 1.375% 03/07/2019 1,516,530 0.28POLANDEUR 1,500,000 BANCO SANTANDER SA FRN 28/03/2023 1,496,910 0.27SPAINEUR 2,800,000 BANKIA SA 3.50% 17/01/2019 2,837,408 0.52SPAINEUR 1,500,000 BANKINTER SA 1.75% 10/06/2019 1,520,520 0.28SPAINEUR 500,000 BANKINTER SA 6.375% 11/09/2019 532,075 0.10SPAINEUR 2,000,000 BBVA SENIOR FINANCE SAU 2.375% 22/01/2019 2,018,900 0.37SPAINEUR 1,700,000 CAJA DE AHORROS Y PENSIONES DE BARCELONA 2.375%
09/05/20191,727,965 0.32SPAIN
EUR 2,100,000 IBERDROLA FINANZAS SA FRN 20/02/2024 2,118,312 0.39SPAINEUR 600,000 REPSOL INTERNATIONAL FINANCE BV 4.875% 19/02/2019 613,974 0.11SPAINEUR 55,000,000 SPAIN GOVERNMENT BOND 0.25% 31/01/2019 55,166,650 10.08SPAINEUR 2,200,000 SCANIA CV AB FRN 19/10/2020 2,203,674 0.40SWEDENEUR 1,100,000 AT&T INC FRN 05/09/2023 1,112,551 0.20UNITED STATESEUR 4,160,000 BANK OF AMERICA CORP FRN 06/05/2019 4,192,282 0.76UNITED STATESEUR 1,400,000 CITIGROUP INC FRN 21/03/2023 1,399,860 0.26UNITED STATESEUR 1,300,000 CITIGROUP INC FRN 24/05/2021 1,320,566 0.24UNITED STATESEUR 2,000,000 DH EUROPE FINANCE SA 1.00% 08/07/2019 2,013,860 0.37UNITED STATESEUR 1,800,000 FORD MOTOR CREDIT CO LLC FRN 01/12/2021 1,771,488 0.32UNITED STATESEUR 800,000 GE CAPITAL EUROPEAN FUNDING UNLIMITED CO FRN
17/05/2021801,384 0.15UNITED STATES
EUR 1,000,000 GE CAPITAL EUROPEAN FUNDING 5.375% 23/01/2020 1,074,820 0.20UNITED STATESEUR 300,000 GENERAL MOTORS FINANCIAL CO INC FRN 10/05/2021 301,761 0.06UNITED STATESEUR 1,900,000 GENERAL MOTORS FINANCIAL INTERNATIONAL BV 1.875%
15/10/20191,940,204 0.35UNITED STATES
EUR 2,000,000 GOLDMAN SACHS GROUP INC/THE FRN 16/12/2020 2,002,220 0.37UNITED STATESEUR 1,000,000 GOLDMAN SACHS GROUP INC/THE FRN 26/07/2022 1,017,320 0.19UNITED STATESEUR 1,400,000 GOLDMAN SACHS GROUP INC/THE FRN 26/09/2023 1,390,130 0.25UNITED STATESEUR 2,800,000 MERRILL LYNCH & CO INC FRN 14/09/2018 2,800,252 0.50UNITED STATESEUR 2,450,000 MOLSON COORS BREWING CO FRN 15/03/2019 2,451,421 0.45UNITED STATESEUR 2,000,000 MORGAN STANLEY FRN 03/12/2019 2,001,860 0.37UNITED STATESEUR 1,800,000 MORGAN STANLEY FRN 08/11/2022 1,807,812 0.33UNITED STATESEUR 1,000,000 MYLAN NV FRN 24/05/2020 1,001,890 0.18UNITED STATESEUR 600,000 PACCAR FINANCIAL EUROPE BV FRN 18/05/2021 603,642 0.11UNITED STATESEUR 350,000 PENTAIR FINANCE SA 2.45% 17/09/2019 358,582 0.07UNITED STATES
Country
Statement of Investment Portfolio and Other Net Assets AUGUST 31, 2018
Notional or number of units / shares
ownedMarket Value
EUR% of Net
Assets
INTERFUND EURO CURRENCY
(continued)
Similar issues with same maturities have not been combined when issuance date differs.The accompanying notes are an integral part of these financial statements.General note: differences in sums, if any, are due to rounding.
Currency
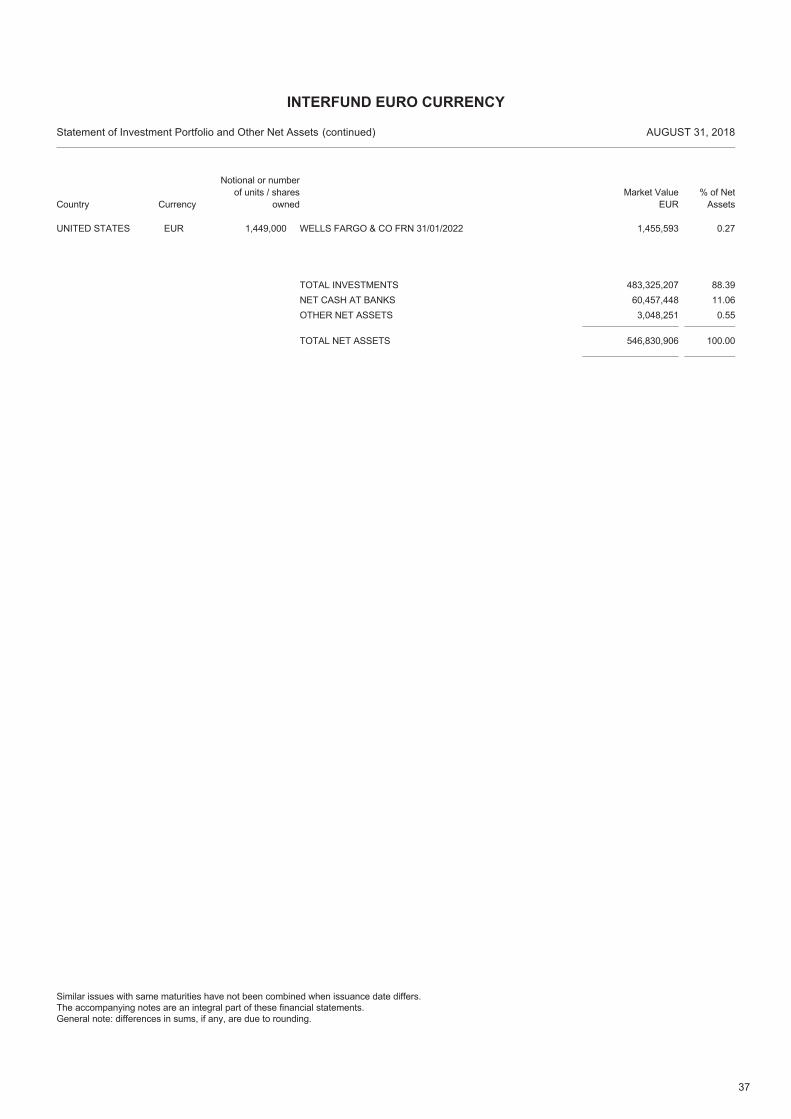
37
EUR 1,449,000 WELLS FARGO & CO FRN 31/01/2022 1,455,593 0.27UNITED STATES
TOTAL NET ASSETS 546,830,906 100.00
TOTAL INVESTMENTS 483,325,207 88.39NET CASH AT BANKS 60,457,448 11.06OTHER NET ASSETS 3,048,251 0.55
Country
Statement of Investment Portfolio and Other Net Assets AUGUST 31, 2018
Notional or number of units / shares
ownedMarket Value
EUR% of Net
Assets
INTERFUND EURO CURRENCY
(continued)
Similar issues with same maturities have not been combined when issuance date differs.The accompanying notes are an integral part of these financial statements.General note: differences in sums, if any, are due to rounding.
Currency
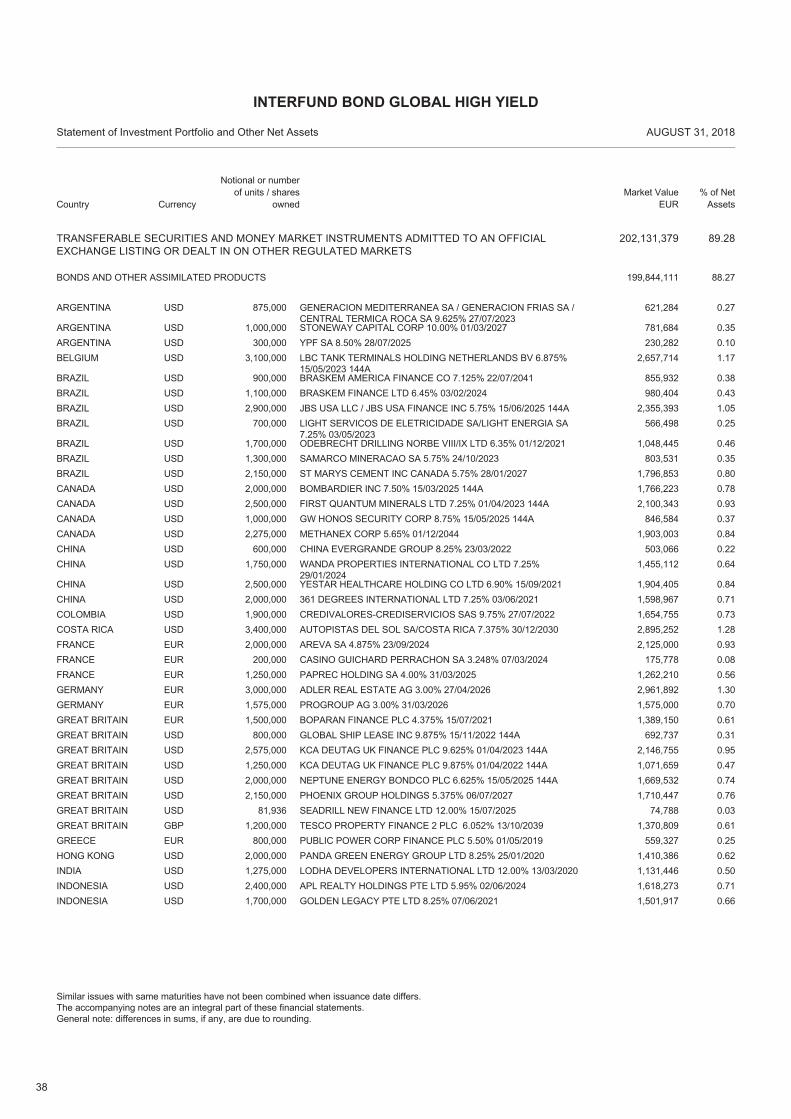
38
TRANSFERABLE SECURITIES AND MONEY MARKET INSTRUMENTS ADMITTED TO AN OFFICIALEXCHANGE LISTING OR DEALT IN ON OTHER REGULATED MARKETS
202,131,379 89.28
USD 875,000 GENERACION MEDITERRANEA SA / GENERACION FRIAS SA /CENTRAL TERMICA ROCA SA 9.625% 27/07/2023
621,284 0.27ARGENTINA
BONDS AND OTHER ASSIMILATED PRODUCTS 88.27199,844,111
USD 1,000,000 STONEWAY CAPITAL CORP 10.00% 01/03/2027 781,684 0.35ARGENTINAUSD 300,000 YPF SA 8.50% 28/07/2025 230,282 0.10ARGENTINAUSD 3,100,000 LBC TANK TERMINALS HOLDING NETHERLANDS BV 6.875%
15/05/2023 144A2,657,714 1.17BELGIUM
USD 900,000 BRASKEM AMERICA FINANCE CO 7.125% 22/07/2041 855,932 0.38BRAZILUSD 1,100,000 BRASKEM FINANCE LTD 6.45% 03/02/2024 980,404 0.43BRAZILUSD 2,900,000 JBS USA LLC / JBS USA FINANCE INC 5.75% 15/06/2025 144A 2,355,393 1.05BRAZILUSD 700,000 LIGHT SERVICOS DE ELETRICIDADE SA/LIGHT ENERGIA SA
7.25% 03/05/2023566,498 0.25BRAZIL
USD 1,700,000 ODEBRECHT DRILLING NORBE VIII/IX LTD 6.35% 01/12/2021 1,048,445 0.46BRAZILUSD 1,300,000 SAMARCO MINERACAO SA 5.75% 24/10/2023 803,531 0.35BRAZILUSD 2,150,000 ST MARYS CEMENT INC CANADA 5.75% 28/01/2027 1,796,853 0.80BRAZILUSD 2,000,000 BOMBARDIER INC 7.50% 15/03/2025 144A 1,766,223 0.78CANADAUSD 2,500,000 FIRST QUANTUM MINERALS LTD 7.25% 01/04/2023 144A 2,100,343 0.93CANADAUSD 1,000,000 GW HONOS SECURITY CORP 8.75% 15/05/2025 144A 846,584 0.37CANADAUSD 2,275,000 METHANEX CORP 5.65% 01/12/2044 1,903,003 0.84CANADAUSD 600,000 CHINA EVERGRANDE GROUP 8.25% 23/03/2022 503,066 0.22CHINAUSD 1,750,000 WANDA PROPERTIES INTERNATIONAL CO LTD 7.25%
29/01/20241,455,112 0.64CHINA
USD 2,500,000 YESTAR HEALTHCARE HOLDING CO LTD 6.90% 15/09/2021 1,904,405 0.84CHINAUSD 2,000,000 361 DEGREES INTERNATIONAL LTD 7.25% 03/06/2021 1,598,967 0.71CHINAUSD 1,900,000 CREDIVALORES-CREDISERVICIOS SAS 9.75% 27/07/2022 1,654,755 0.73COLOMBIAUSD 3,400,000 AUTOPISTAS DEL SOL SA/COSTA RICA 7.375% 30/12/2030 2,895,252 1.28COSTA RICAEUR 2,000,000 AREVA SA 4.875% 23/09/2024 2,125,000 0.93FRANCEEUR 200,000 CASINO GUICHARD PERRACHON SA 3.248% 07/03/2024 175,778 0.08FRANCEEUR 1,250,000 PAPREC HOLDING SA 4.00% 31/03/2025 1,262,210 0.56FRANCEEUR 3,000,000 ADLER REAL ESTATE AG 3.00% 27/04/2026 2,961,892 1.30GERMANYEUR 1,575,000 PROGROUP AG 3.00% 31/03/2026 1,575,000 0.70GERMANYEUR 1,500,000 BOPARAN FINANCE PLC 4.375% 15/07/2021 1,389,150 0.61GREAT BRITAINUSD 800,000 GLOBAL SHIP LEASE INC 9.875% 15/11/2022 144A 692,737 0.31GREAT BRITAINUSD 2,575,000 KCA DEUTAG UK FINANCE PLC 9.625% 01/04/2023 144A 2,146,755 0.95GREAT BRITAINUSD 1,250,000 KCA DEUTAG UK FINANCE PLC 9.875% 01/04/2022 144A 1,071,659 0.47GREAT BRITAINUSD 2,000,000 NEPTUNE ENERGY BONDCO PLC 6.625% 15/05/2025 144A 1,669,532 0.74GREAT BRITAINUSD 2,150,000 PHOENIX GROUP HOLDINGS 5.375% 06/07/2027 1,710,447 0.76GREAT BRITAINUSD 81,936 SEADRILL NEW FINANCE LTD 12.00% 15/07/2025 74,788 0.03GREAT BRITAINGBP 1,200,000 TESCO PROPERTY FINANCE 2 PLC 6.052% 13/10/2039 1,370,809 0.61GREAT BRITAINEUR 800,000 PUBLIC POWER CORP FINANCE PLC 5.50% 01/05/2019 559,327 0.25GREECEUSD 2,000,000 PANDA GREEN ENERGY GROUP LTD 8.25% 25/01/2020 1,410,386 0.62HONG KONGUSD 1,275,000 LODHA DEVELOPERS INTERNATIONAL LTD 12.00% 13/03/2020 1,131,446 0.50INDIAUSD 2,400,000 APL REALTY HOLDINGS PTE LTD 5.95% 02/06/2024 1,618,273 0.71INDONESIAUSD 1,700,000 GOLDEN LEGACY PTE LTD 8.25% 07/06/2021 1,501,917 0.66INDONESIA
Country
Statement of Investment Portfolio and Other Net Assets AUGUST 31, 2018
Notional or number of units / shares
ownedMarket Value
EUR% of Net
Assets
INTERFUND BOND GLOBAL HIGH YIELD
Similar issues with same maturities have not been combined when issuance date differs.The accompanying notes are an integral part of these financial statements.General note: differences in sums, if any, are due to rounding.
Currency
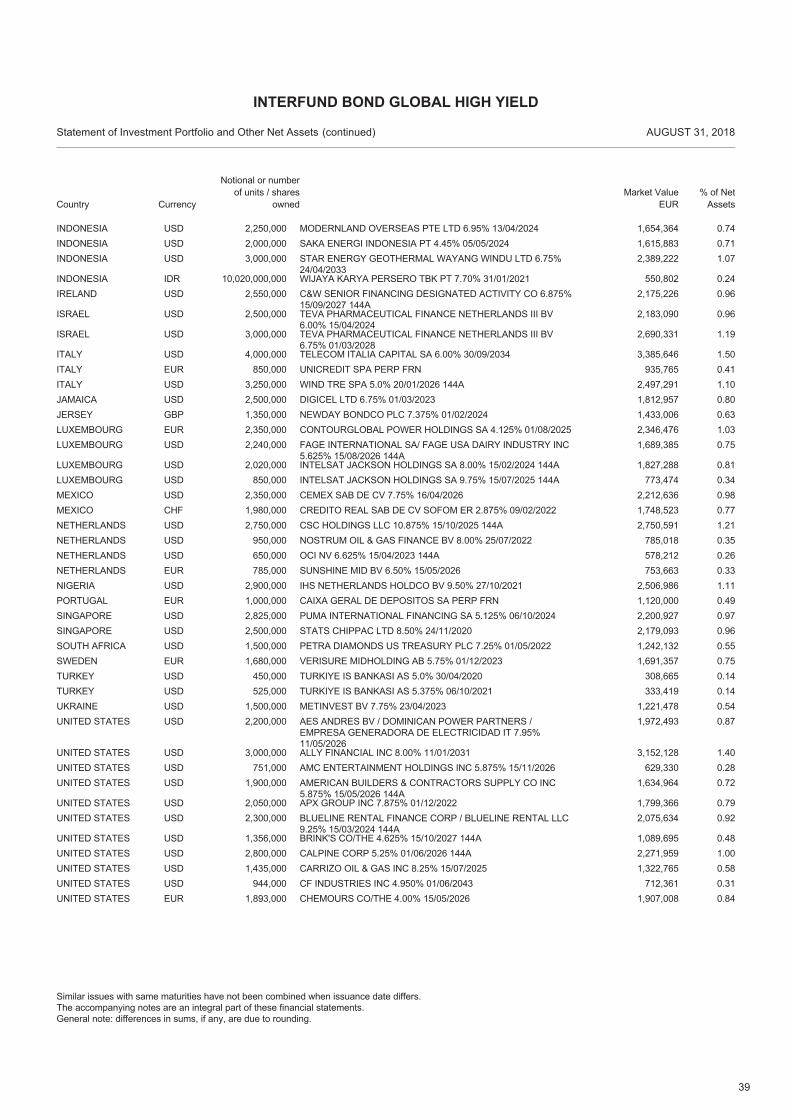
39
USD 2,250,000 MODERNLAND OVERSEAS PTE LTD 6.95% 13/04/2024 1,654,364 0.74INDONESIAUSD 2,000,000 SAKA ENERGI INDONESIA PT 4.45% 05/05/2024 1,615,883 0.71INDONESIAUSD 3,000,000 STAR ENERGY GEOTHERMAL WAYANG WINDU LTD 6.75%
24/04/20332,389,222 1.07INDONESIA
IDR 10,020,000,000 WIJAYA KARYA PERSERO TBK PT 7.70% 31/01/2021 550,802 0.24INDONESIAUSD 2,550,000 C&W SENIOR FINANCING DESIGNATED ACTIVITY CO 6.875%
15/09/2027 144A2,175,226 0.96IRELAND
USD 2,500,000 TEVA PHARMACEUTICAL FINANCE NETHERLANDS III BV6.00% 15/04/2024
2,183,090 0.96ISRAEL
USD 3,000,000 TEVA PHARMACEUTICAL FINANCE NETHERLANDS III BV6.75% 01/03/2028
2,690,331 1.19ISRAEL
USD 4,000,000 TELECOM ITALIA CAPITAL SA 6.00% 30/09/2034 3,385,646 1.50ITALYEUR 850,000 UNICREDIT SPA PERP FRN 935,765 0.41ITALYUSD 3,250,000 WIND TRE SPA 5.0% 20/01/2026 144A 2,497,291 1.10ITALYUSD 2,500,000 DIGICEL LTD 6.75% 01/03/2023 1,812,957 0.80JAMAICAGBP 1,350,000 NEWDAY BONDCO PLC 7.375% 01/02/2024 1,433,006 0.63JERSEYEUR 2,350,000 CONTOURGLOBAL POWER HOLDINGS SA 4.125% 01/08/2025 2,346,476 1.03LUXEMBOURGUSD 2,240,000 FAGE INTERNATIONAL SA/ FAGE USA DAIRY INDUSTRY INC
5.625% 15/08/2026 144A1,689,385 0.75LUXEMBOURG
USD 2,020,000 INTELSAT JACKSON HOLDINGS SA 8.00% 15/02/2024 144A 1,827,288 0.81LUXEMBOURGUSD 850,000 INTELSAT JACKSON HOLDINGS SA 9.75% 15/07/2025 144A 773,474 0.34LUXEMBOURGUSD 2,350,000 CEMEX SAB DE CV 7.75% 16/04/2026 2,212,636 0.98MEXICOCHF 1,980,000 CREDITO REAL SAB DE CV SOFOM ER 2.875% 09/02/2022 1,748,523 0.77MEXICOUSD 2,750,000 CSC HOLDINGS LLC 10.875% 15/10/2025 144A 2,750,591 1.21NETHERLANDSUSD 950,000 NOSTRUM OIL & GAS FINANCE BV 8.00% 25/07/2022 785,018 0.35NETHERLANDSUSD 650,000 OCI NV 6.625% 15/04/2023 144A 578,212 0.26NETHERLANDSEUR 785,000 SUNSHINE MID BV 6.50% 15/05/2026 753,663 0.33NETHERLANDSUSD 2,900,000 IHS NETHERLANDS HOLDCO BV 9.50% 27/10/2021 2,506,986 1.11NIGERIAEUR 1,000,000 CAIXA GERAL DE DEPOSITOS SA PERP FRN 1,120,000 0.49PORTUGALUSD 2,825,000 PUMA INTERNATIONAL FINANCING SA 5.125% 06/10/2024 2,200,927 0.97SINGAPOREUSD 2,500,000 STATS CHIPPAC LTD 8.50% 24/11/2020 2,179,093 0.96SINGAPOREUSD 1,500,000 PETRA DIAMONDS US TREASURY PLC 7.25% 01/05/2022 1,242,132 0.55SOUTH AFRICAEUR 1,680,000 VERISURE MIDHOLDING AB 5.75% 01/12/2023 1,691,357 0.75SWEDENUSD 450,000 TURKIYE IS BANKASI AS 5.0% 30/04/2020 308,665 0.14TURKEYUSD 525,000 TURKIYE IS BANKASI AS 5.375% 06/10/2021 333,419 0.14TURKEYUSD 1,500,000 METINVEST BV 7.75% 23/04/2023 1,221,478 0.54UKRAINEUSD 2,200,000 AES ANDRES BV / DOMINICAN POWER PARTNERS /
EMPRESA GENERADORA DE ELECTRICIDAD IT 7.95%11/05/2026
1,972,493 0.87UNITED STATES
USD 3,000,000 ALLY FINANCIAL INC 8.00% 11/01/2031 3,152,128 1.40UNITED STATESUSD 751,000 AMC ENTERTAINMENT HOLDINGS INC 5.875% 15/11/2026 629,330 0.28UNITED STATESUSD 1,900,000 AMERICAN BUILDERS & CONTRACTORS SUPPLY CO INC
5.875% 15/05/2026 144A1,634,964 0.72UNITED STATES
USD 2,050,000 APX GROUP INC 7.875% 01/12/2022 1,799,366 0.79UNITED STATESUSD 2,300,000 BLUELINE RENTAL FINANCE CORP / BLUELINE RENTAL LLC
9.25% 15/03/2024 144A2,075,634 0.92UNITED STATES
USD 1,356,000 BRINK'S CO/THE 4.625% 15/10/2027 144A 1,089,695 0.48UNITED STATESUSD 2,800,000 CALPINE CORP 5.25% 01/06/2026 144A 2,271,959 1.00UNITED STATESUSD 1,435,000 CARRIZO OIL & GAS INC 8.25% 15/07/2025 1,322,765 0.58UNITED STATESUSD 944,000 CF INDUSTRIES INC 4.950% 01/06/2043 712,361 0.31UNITED STATESEUR 1,893,000 CHEMOURS CO/THE 4.00% 15/05/2026 1,907,008 0.84UNITED STATES
Country
Statement of Investment Portfolio and Other Net Assets AUGUST 31, 2018
Notional or number of units / shares
ownedMarket Value
EUR% of Net
Assets
INTERFUND BOND GLOBAL HIGH YIELD
(continued)
Similar issues with same maturities have not been combined when issuance date differs.The accompanying notes are an integral part of these financial statements.General note: differences in sums, if any, are due to rounding.
Currency
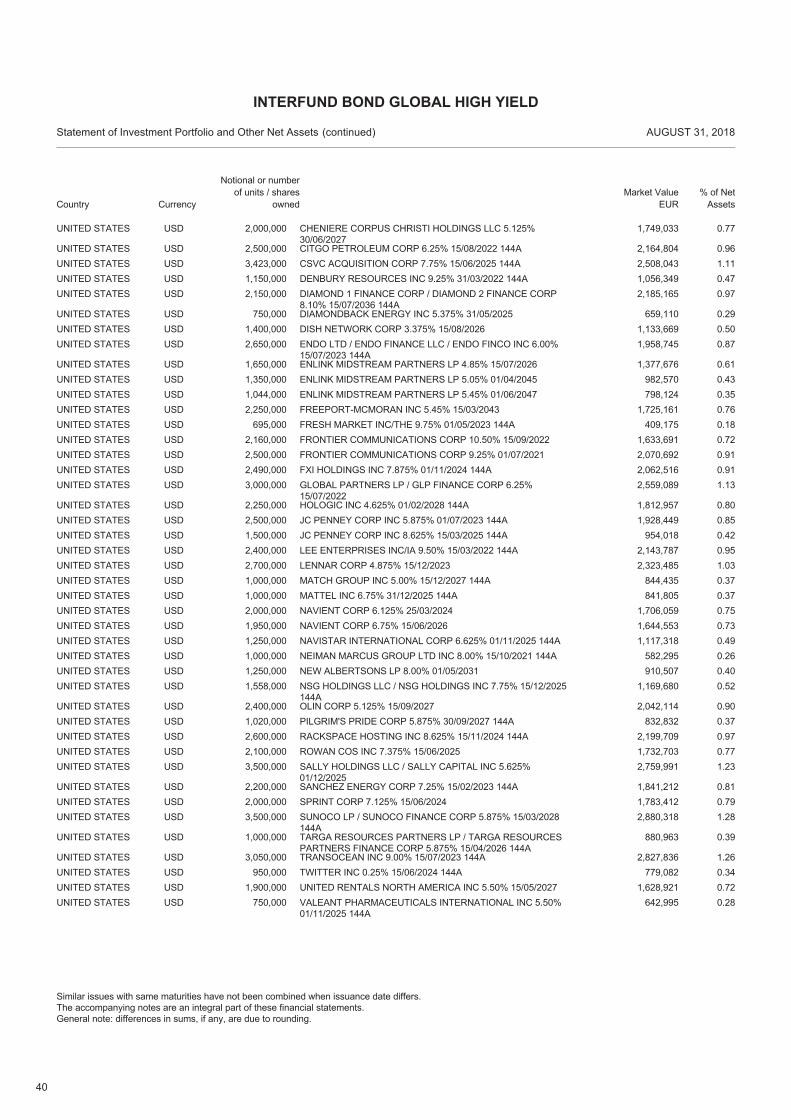
40
USD 2,000,000 CHENIERE CORPUS CHRISTI HOLDINGS LLC 5.125%30/06/2027
1,749,033 0.77UNITED STATES
USD 2,500,000 CITGO PETROLEUM CORP 6.25% 15/08/2022 144A 2,164,804 0.96UNITED STATESUSD 3,423,000 CSVC ACQUISITION CORP 7.75% 15/06/2025 144A 2,508,043 1.11UNITED STATESUSD 1,150,000 DENBURY RESOURCES INC 9.25% 31/03/2022 144A 1,056,349 0.47UNITED STATESUSD 2,150,000 DIAMOND 1 FINANCE CORP / DIAMOND 2 FINANCE CORP
8.10% 15/07/2036 144A2,185,165 0.97UNITED STATES
USD 750,000 DIAMONDBACK ENERGY INC 5.375% 31/05/2025 659,110 0.29UNITED STATESUSD 1,400,000 DISH NETWORK CORP 3.375% 15/08/2026 1,133,669 0.50UNITED STATESUSD 2,650,000 ENDO LTD / ENDO FINANCE LLC / ENDO FINCO INC 6.00%
15/07/2023 144A1,958,745 0.87UNITED STATES
USD 1,650,000 ENLINK MIDSTREAM PARTNERS LP 4.85% 15/07/2026 1,377,676 0.61UNITED STATESUSD 1,350,000 ENLINK MIDSTREAM PARTNERS LP 5.05% 01/04/2045 982,570 0.43UNITED STATESUSD 1,044,000 ENLINK MIDSTREAM PARTNERS LP 5.45% 01/06/2047 798,124 0.35UNITED STATESUSD 2,250,000 FREEPORT-MCMORAN INC 5.45% 15/03/2043 1,725,161 0.76UNITED STATESUSD 695,000 FRESH MARKET INC/THE 9.75% 01/05/2023 144A 409,175 0.18UNITED STATESUSD 2,160,000 FRONTIER COMMUNICATIONS CORP 10.50% 15/09/2022 1,633,691 0.72UNITED STATESUSD 2,500,000 FRONTIER COMMUNICATIONS CORP 9.25% 01/07/2021 2,070,692 0.91UNITED STATESUSD 2,490,000 FXI HOLDINGS INC 7.875% 01/11/2024 144A 2,062,516 0.91UNITED STATESUSD 3,000,000 GLOBAL PARTNERS LP / GLP FINANCE CORP 6.25%
15/07/20222,559,089 1.13UNITED STATES
USD 2,250,000 HOLOGIC INC 4.625% 01/02/2028 144A 1,812,957 0.80UNITED STATESUSD 2,500,000 JC PENNEY CORP INC 5.875% 01/07/2023 144A 1,928,449 0.85UNITED STATESUSD 1,500,000 JC PENNEY CORP INC 8.625% 15/03/2025 144A 954,018 0.42UNITED STATESUSD 2,400,000 LEE ENTERPRISES INC/IA 9.50% 15/03/2022 144A 2,143,787 0.95UNITED STATESUSD 2,700,000 LENNAR CORP 4.875% 15/12/2023 2,323,485 1.03UNITED STATESUSD 1,000,000 MATCH GROUP INC 5.00% 15/12/2027 144A 844,435 0.37UNITED STATESUSD 1,000,000 MATTEL INC 6.75% 31/12/2025 144A 841,805 0.37UNITED STATESUSD 2,000,000 NAVIENT CORP 6.125% 25/03/2024 1,706,059 0.75UNITED STATESUSD 1,950,000 NAVIENT CORP 6.75% 15/06/2026 1,644,553 0.73UNITED STATESUSD 1,250,000 NAVISTAR INTERNATIONAL CORP 6.625% 01/11/2025 144A 1,117,318 0.49UNITED STATESUSD 1,000,000 NEIMAN MARCUS GROUP LTD INC 8.00% 15/10/2021 144A 582,295 0.26UNITED STATESUSD 1,250,000 NEW ALBERTSONS LP 8.00% 01/05/2031 910,507 0.40UNITED STATESUSD 1,558,000 NSG HOLDINGS LLC / NSG HOLDINGS INC 7.75% 15/12/2025
144A1,169,680 0.52UNITED STATES
USD 2,400,000 OLIN CORP 5.125% 15/09/2027 2,042,114 0.90UNITED STATESUSD 1,020,000 PILGRIM'S PRIDE CORP 5.875% 30/09/2027 144A 832,832 0.37UNITED STATESUSD 2,600,000 RACKSPACE HOSTING INC 8.625% 15/11/2024 144A 2,199,709 0.97UNITED STATESUSD 2,100,000 ROWAN COS INC 7.375% 15/06/2025 1,732,703 0.77UNITED STATESUSD 3,500,000 SALLY HOLDINGS LLC / SALLY CAPITAL INC 5.625%
01/12/20252,759,991 1.23UNITED STATES
USD 2,200,000 SANCHEZ ENERGY CORP 7.25% 15/02/2023 144A 1,841,212 0.81UNITED STATESUSD 2,000,000 SPRINT CORP 7.125% 15/06/2024 1,783,412 0.79UNITED STATESUSD 3,500,000 SUNOCO LP / SUNOCO FINANCE CORP 5.875% 15/03/2028
144A2,880,318 1.28UNITED STATES
USD 1,000,000 TARGA RESOURCES PARTNERS LP / TARGA RESOURCESPARTNERS FINANCE CORP 5.875% 15/04/2026 144A
880,963 0.39UNITED STATES
USD 3,050,000 TRANSOCEAN INC 9.00% 15/07/2023 144A 2,827,836 1.26UNITED STATESUSD 950,000 TWITTER INC 0.25% 15/06/2024 144A 779,082 0.34UNITED STATESUSD 1,900,000 UNITED RENTALS NORTH AMERICA INC 5.50% 15/05/2027 1,628,921 0.72UNITED STATESUSD 750,000 VALEANT PHARMACEUTICALS INTERNATIONAL INC 5.50%
01/11/2025 144A642,995 0.28UNITED STATES
Country
Statement of Investment Portfolio and Other Net Assets AUGUST 31, 2018
Notional or number of units / shares
ownedMarket Value
EUR% of Net
Assets
INTERFUND BOND GLOBAL HIGH YIELD
(continued)
Similar issues with same maturities have not been combined when issuance date differs.The accompanying notes are an integral part of these financial statements.General note: differences in sums, if any, are due to rounding.
Currency
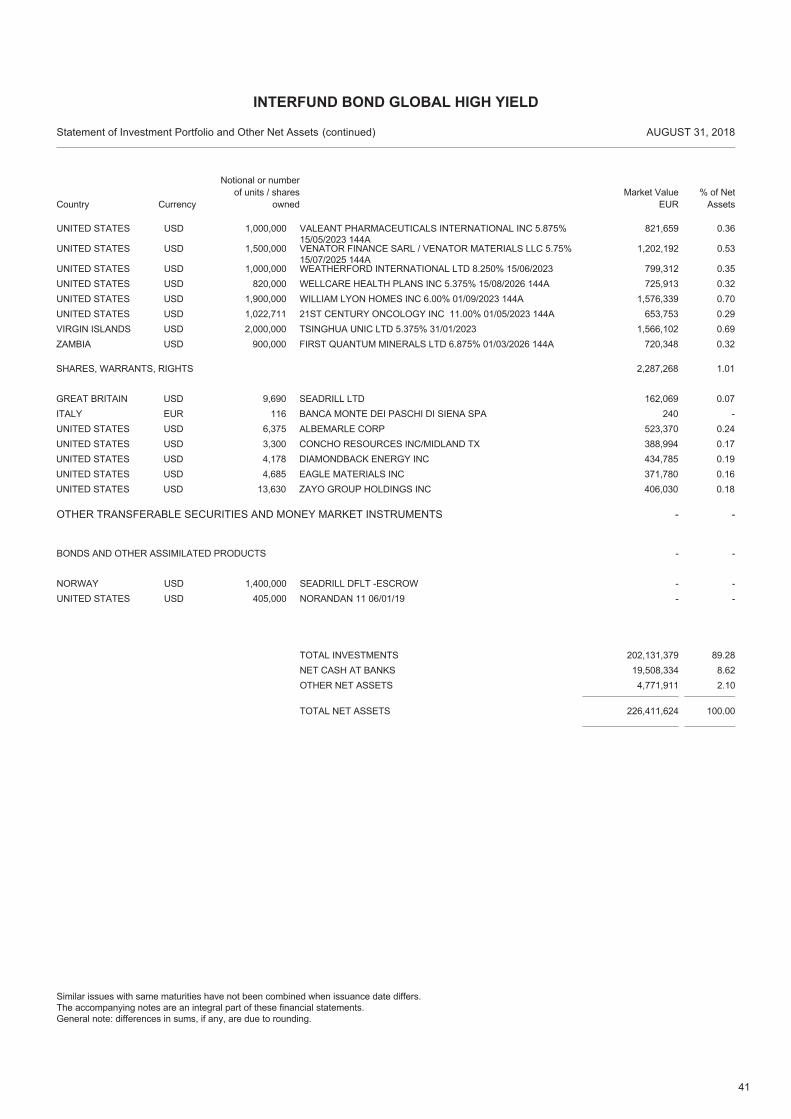
41
USD 1,000,000 VALEANT PHARMACEUTICALS INTERNATIONAL INC 5.875%15/05/2023 144A
821,659 0.36UNITED STATES
USD 1,500,000 VENATOR FINANCE SARL / VENATOR MATERIALS LLC 5.75%15/07/2025 144A
1,202,192 0.53UNITED STATES
USD 1,000,000 WEATHERFORD INTERNATIONAL LTD 8.250% 15/06/2023 799,312 0.35UNITED STATESUSD 820,000 WELLCARE HEALTH PLANS INC 5.375% 15/08/2026 144A 725,913 0.32UNITED STATESUSD 1,900,000 WILLIAM LYON HOMES INC 6.00% 01/09/2023 144A 1,576,339 0.70UNITED STATESUSD 1,022,711 21ST CENTURY ONCOLOGY INC 11.00% 01/05/2023 144A 653,753 0.29UNITED STATESUSD 2,000,000 TSINGHUA UNIC LTD 5.375% 31/01/2023 1,566,102 0.69VIRGIN ISLANDSUSD 900,000 FIRST QUANTUM MINERALS LTD 6.875% 01/03/2026 144A 720,348 0.32ZAMBIA
USD 9,690 SEADRILL LTD 162,069 0.07GREAT BRITAIN
SHARES, WARRANTS, RIGHTS 1.012,287,268
EUR 116 BANCA MONTE DEI PASCHI DI SIENA SPA 240 -ITALYUSD 6,375 ALBEMARLE CORP 523,370 0.24UNITED STATESUSD 3,300 CONCHO RESOURCES INC/MIDLAND TX 388,994 0.17UNITED STATESUSD 4,178 DIAMONDBACK ENERGY INC 434,785 0.19UNITED STATESUSD 4,685 EAGLE MATERIALS INC 371,780 0.16UNITED STATESUSD 13,630 ZAYO GROUP HOLDINGS INC 406,030 0.18UNITED STATES
OTHER TRANSFERABLE SECURITIES AND MONEY MARKET INSTRUMENTS - -
USD 1,400,000 SEADRILL DFLT -ESCROW - -NORWAY
BONDS AND OTHER ASSIMILATED PRODUCTS --
USD 405,000 NORANDAN 11 06/01/19 - -UNITED STATES
TOTAL NET ASSETS 226,411,624 100.00
TOTAL INVESTMENTS 202,131,379 89.28NET CASH AT BANKS 19,508,334 8.62OTHER NET ASSETS 4,771,911 2.10
Country
Statement of Investment Portfolio and Other Net Assets AUGUST 31, 2018
Notional or number of units / shares
ownedMarket Value
EUR% of Net
Assets
INTERFUND BOND GLOBAL HIGH YIELD
(continued)
Similar issues with same maturities have not been combined when issuance date differs.The accompanying notes are an integral part of these financial statements.General note: differences in sums, if any, are due to rounding.
Currency
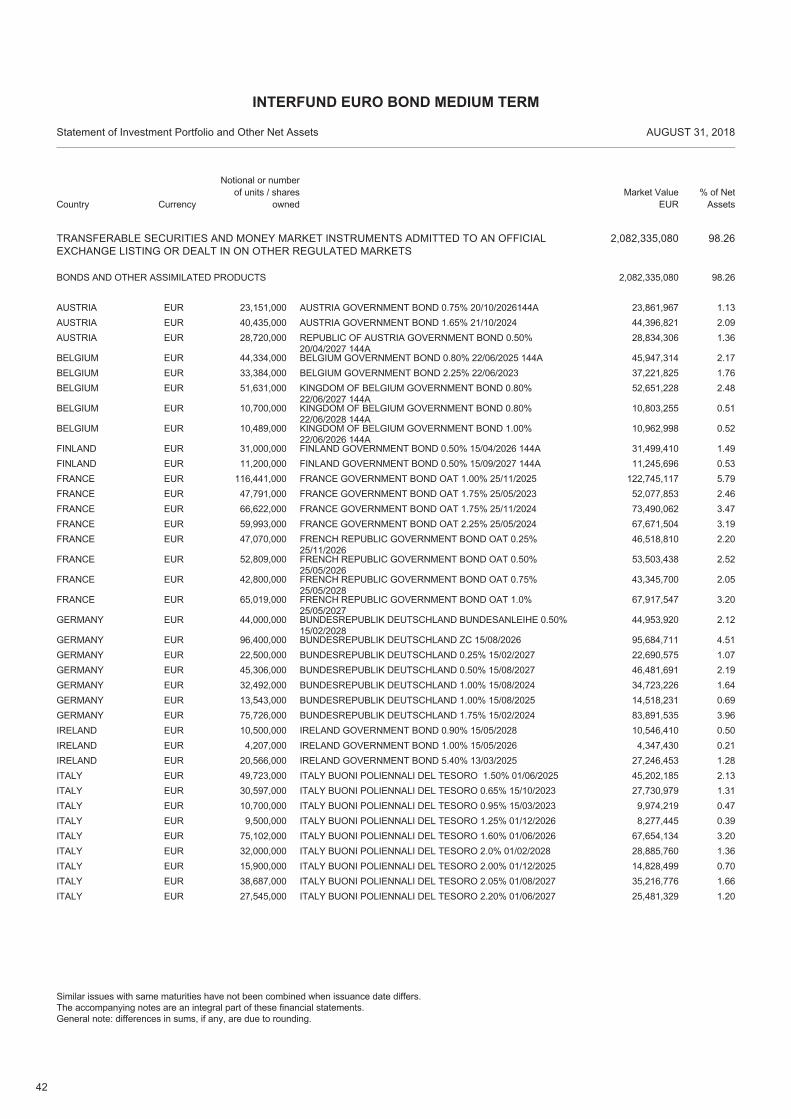
42
TRANSFERABLE SECURITIES AND MONEY MARKET INSTRUMENTS ADMITTED TO AN OFFICIALEXCHANGE LISTING OR DEALT IN ON OTHER REGULATED MARKETS
2,082,335,080 98.26
EUR 23,151,000 AUSTRIA GOVERNMENT BOND 0.75% 20/10/2026144A 23,861,967 1.13AUSTRIA
BONDS AND OTHER ASSIMILATED PRODUCTS 98.262,082,335,080
EUR 40,435,000 AUSTRIA GOVERNMENT BOND 1.65% 21/10/2024 44,396,821 2.09AUSTRIAEUR 28,720,000 REPUBLIC OF AUSTRIA GOVERNMENT BOND 0.50%
20/04/2027 144A28,834,306 1.36AUSTRIA
EUR 44,334,000 BELGIUM GOVERNMENT BOND 0.80% 22/06/2025 144A 45,947,314 2.17BELGIUMEUR 33,384,000 BELGIUM GOVERNMENT BOND 2.25% 22/06/2023 37,221,825 1.76BELGIUMEUR 51,631,000 KINGDOM OF BELGIUM GOVERNMENT BOND 0.80%
22/06/2027 144A52,651,228 2.48BELGIUM
EUR 10,700,000 KINGDOM OF BELGIUM GOVERNMENT BOND 0.80%22/06/2028 144A
10,803,255 0.51BELGIUM
EUR 10,489,000 KINGDOM OF BELGIUM GOVERNMENT BOND 1.00%22/06/2026 144A
10,962,998 0.52BELGIUM
EUR 31,000,000 FINLAND GOVERNMENT BOND 0.50% 15/04/2026 144A 31,499,410 1.49FINLANDEUR 11,200,000 FINLAND GOVERNMENT BOND 0.50% 15/09/2027 144A 11,245,696 0.53FINLANDEUR 116,441,000 FRANCE GOVERNMENT BOND OAT 1.00% 25/11/2025 122,745,117 5.79FRANCEEUR 47,791,000 FRANCE GOVERNMENT BOND OAT 1.75% 25/05/2023 52,077,853 2.46FRANCEEUR 66,622,000 FRANCE GOVERNMENT BOND OAT 1.75% 25/11/2024 73,490,062 3.47FRANCEEUR 59,993,000 FRANCE GOVERNMENT BOND OAT 2.25% 25/05/2024 67,671,504 3.19FRANCEEUR 47,070,000 FRENCH REPUBLIC GOVERNMENT BOND OAT 0.25%
25/11/202646,518,810 2.20FRANCE
EUR 52,809,000 FRENCH REPUBLIC GOVERNMENT BOND OAT 0.50%25/05/2026
53,503,438 2.52FRANCE
EUR 42,800,000 FRENCH REPUBLIC GOVERNMENT BOND OAT 0.75%25/05/2028
43,345,700 2.05FRANCE
EUR 65,019,000 FRENCH REPUBLIC GOVERNMENT BOND OAT 1.0%25/05/2027
67,917,547 3.20FRANCE
EUR 44,000,000 BUNDESREPUBLIK DEUTSCHLAND BUNDESANLEIHE 0.50%15/02/2028
44,953,920 2.12GERMANY
EUR 96,400,000 BUNDESREPUBLIK DEUTSCHLAND ZC 15/08/2026 95,684,711 4.51GERMANYEUR 22,500,000 BUNDESREPUBLIK DEUTSCHLAND 0.25% 15/02/2027 22,690,575 1.07GERMANYEUR 45,306,000 BUNDESREPUBLIK DEUTSCHLAND 0.50% 15/08/2027 46,481,691 2.19GERMANYEUR 32,492,000 BUNDESREPUBLIK DEUTSCHLAND 1.00% 15/08/2024 34,723,226 1.64GERMANYEUR 13,543,000 BUNDESREPUBLIK DEUTSCHLAND 1.00% 15/08/2025 14,518,231 0.69GERMANYEUR 75,726,000 BUNDESREPUBLIK DEUTSCHLAND 1.75% 15/02/2024 83,891,535 3.96GERMANYEUR 10,500,000 IRELAND GOVERNMENT BOND 0.90% 15/05/2028 10,546,410 0.50IRELANDEUR 4,207,000 IRELAND GOVERNMENT BOND 1.00% 15/05/2026 4,347,430 0.21IRELANDEUR 20,566,000 IRELAND GOVERNMENT BOND 5.40% 13/03/2025 27,246,453 1.28IRELANDEUR 49,723,000 ITALY BUONI POLIENNALI DEL TESORO 1.50% 01/06/2025 45,202,185 2.13ITALYEUR 30,597,000 ITALY BUONI POLIENNALI DEL TESORO 0.65% 15/10/2023 27,730,979 1.31ITALYEUR 10,700,000 ITALY BUONI POLIENNALI DEL TESORO 0.95% 15/03/2023 9,974,219 0.47ITALYEUR 9,500,000 ITALY BUONI POLIENNALI DEL TESORO 1.25% 01/12/2026 8,277,445 0.39ITALYEUR 75,102,000 ITALY BUONI POLIENNALI DEL TESORO 1.60% 01/06/2026 67,654,134 3.20ITALYEUR 32,000,000 ITALY BUONI POLIENNALI DEL TESORO 2.0% 01/02/2028 28,885,760 1.36ITALYEUR 15,900,000 ITALY BUONI POLIENNALI DEL TESORO 2.00% 01/12/2025 14,828,499 0.70ITALYEUR 38,687,000 ITALY BUONI POLIENNALI DEL TESORO 2.05% 01/08/2027 35,216,776 1.66ITALYEUR 27,545,000 ITALY BUONI POLIENNALI DEL TESORO 2.20% 01/06/2027 25,481,329 1.20ITALY
Country
Statement of Investment Portfolio and Other Net Assets AUGUST 31, 2018
Notional or number of units / shares
ownedMarket Value
EUR% of Net
Assets
INTERFUND EURO BOND MEDIUM TERM
Similar issues with same maturities have not been combined when issuance date differs.The accompanying notes are an integral part of these financial statements.General note: differences in sums, if any, are due to rounding.
Currency
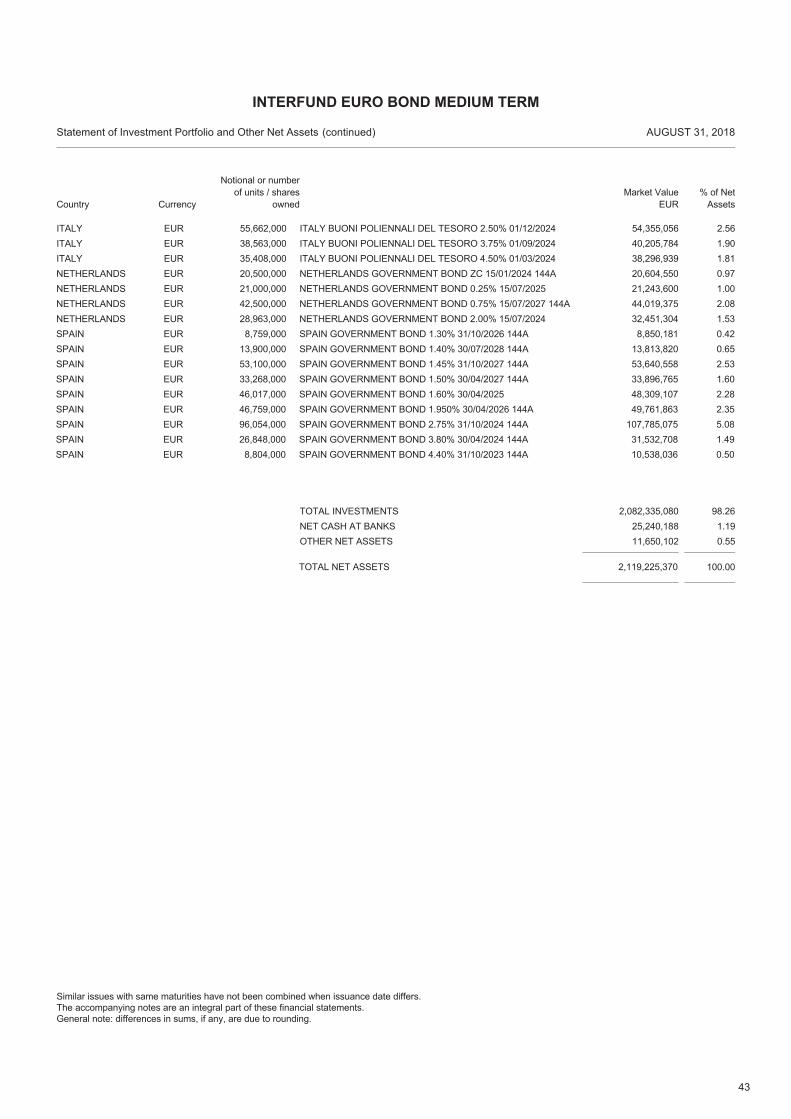
43
EUR 55,662,000 ITALY BUONI POLIENNALI DEL TESORO 2.50% 01/12/2024 54,355,056 2.56ITALYEUR 38,563,000 ITALY BUONI POLIENNALI DEL TESORO 3.75% 01/09/2024 40,205,784 1.90ITALYEUR 35,408,000 ITALY BUONI POLIENNALI DEL TESORO 4.50% 01/03/2024 38,296,939 1.81ITALYEUR 20,500,000 NETHERLANDS GOVERNMENT BOND ZC 15/01/2024 144A 20,604,550 0.97NETHERLANDSEUR 21,000,000 NETHERLANDS GOVERNMENT BOND 0.25% 15/07/2025 21,243,600 1.00NETHERLANDSEUR 42,500,000 NETHERLANDS GOVERNMENT BOND 0.75% 15/07/2027 144A 44,019,375 2.08NETHERLANDSEUR 28,963,000 NETHERLANDS GOVERNMENT BOND 2.00% 15/07/2024 32,451,304 1.53NETHERLANDSEUR 8,759,000 SPAIN GOVERNMENT BOND 1.30% 31/10/2026 144A 8,850,181 0.42SPAINEUR 13,900,000 SPAIN GOVERNMENT BOND 1.40% 30/07/2028 144A 13,813,820 0.65SPAINEUR 53,100,000 SPAIN GOVERNMENT BOND 1.45% 31/10/2027 144A 53,640,558 2.53SPAINEUR 33,268,000 SPAIN GOVERNMENT BOND 1.50% 30/04/2027 144A 33,896,765 1.60SPAINEUR 46,017,000 SPAIN GOVERNMENT BOND 1.60% 30/04/2025 48,309,107 2.28SPAINEUR 46,759,000 SPAIN GOVERNMENT BOND 1.950% 30/04/2026 144A 49,761,863 2.35SPAINEUR 96,054,000 SPAIN GOVERNMENT BOND 2.75% 31/10/2024 144A 107,785,075 5.08SPAINEUR 26,848,000 SPAIN GOVERNMENT BOND 3.80% 30/04/2024 144A 31,532,708 1.49SPAINEUR 8,804,000 SPAIN GOVERNMENT BOND 4.40% 31/10/2023 144A 10,538,036 0.50SPAIN
TOTAL NET ASSETS 2,119,225,370 100.00
TOTAL INVESTMENTS 2,082,335,080 98.26NET CASH AT BANKS 25,240,188 1.19OTHER NET ASSETS 11,650,102 0.55
Country
Statement of Investment Portfolio and Other Net Assets AUGUST 31, 2018
Notional or number of units / shares
ownedMarket Value
EUR% of Net
Assets
INTERFUND EURO BOND MEDIUM TERM
(continued)
Similar issues with same maturities have not been combined when issuance date differs.The accompanying notes are an integral part of these financial statements.General note: differences in sums, if any, are due to rounding.
Currency
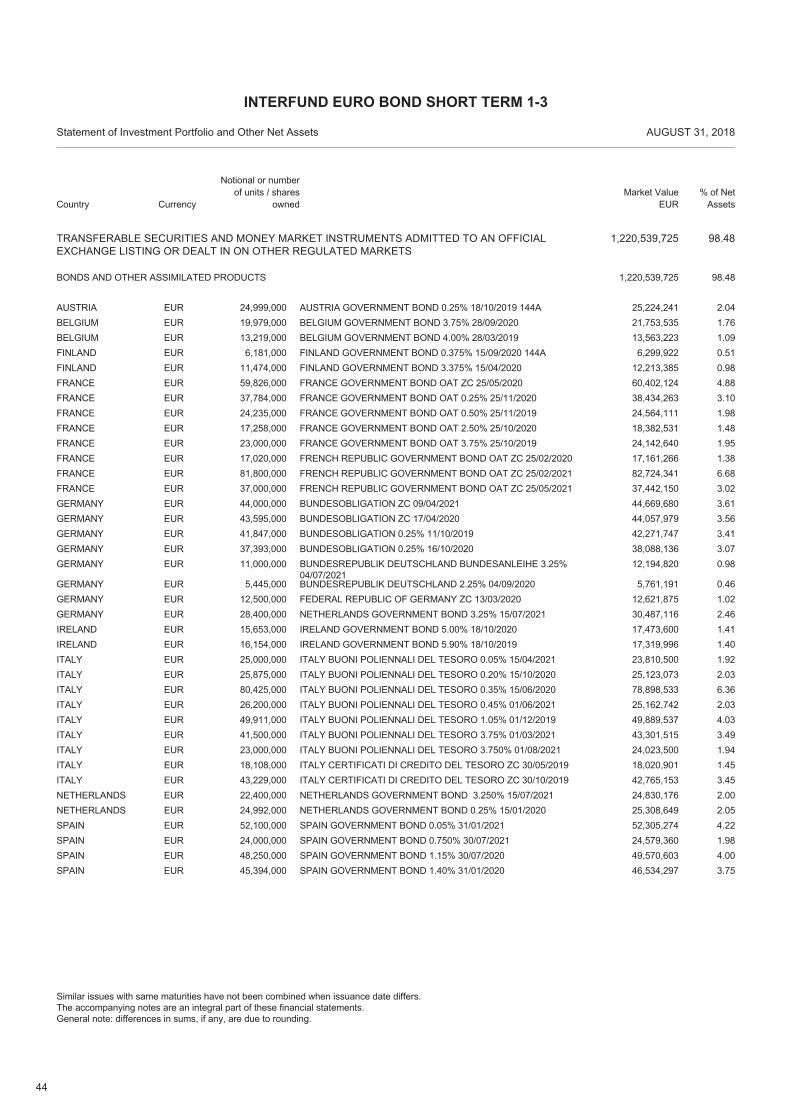
44
TRANSFERABLE SECURITIES AND MONEY MARKET INSTRUMENTS ADMITTED TO AN OFFICIALEXCHANGE LISTING OR DEALT IN ON OTHER REGULATED MARKETS
1,220,539,725 98.48
EUR 24,999,000 AUSTRIA GOVERNMENT BOND 0.25% 18/10/2019 144A 25,224,241 2.04AUSTRIA
BONDS AND OTHER ASSIMILATED PRODUCTS 98.481,220,539,725
EUR 19,979,000 BELGIUM GOVERNMENT BOND 3.75% 28/09/2020 21,753,535 1.76BELGIUMEUR 13,219,000 BELGIUM GOVERNMENT BOND 4.00% 28/03/2019 13,563,223 1.09BELGIUMEUR 6,181,000 FINLAND GOVERNMENT BOND 0.375% 15/09/2020 144A 6,299,922 0.51FINLANDEUR 11,474,000 FINLAND GOVERNMENT BOND 3.375% 15/04/2020 12,213,385 0.98FINLANDEUR 59,826,000 FRANCE GOVERNMENT BOND OAT ZC 25/05/2020 60,402,124 4.88FRANCEEUR 37,784,000 FRANCE GOVERNMENT BOND OAT 0.25% 25/11/2020 38,434,263 3.10FRANCEEUR 24,235,000 FRANCE GOVERNMENT BOND OAT 0.50% 25/11/2019 24,564,111 1.98FRANCEEUR 17,258,000 FRANCE GOVERNMENT BOND OAT 2.50% 25/10/2020 18,382,531 1.48FRANCEEUR 23,000,000 FRANCE GOVERNMENT BOND OAT 3.75% 25/10/2019 24,142,640 1.95FRANCEEUR 17,020,000 FRENCH REPUBLIC GOVERNMENT BOND OAT ZC 25/02/2020 17,161,266 1.38FRANCEEUR 81,800,000 FRENCH REPUBLIC GOVERNMENT BOND OAT ZC 25/02/2021 82,724,341 6.68FRANCEEUR 37,000,000 FRENCH REPUBLIC GOVERNMENT BOND OAT ZC 25/05/2021 37,442,150 3.02FRANCEEUR 44,000,000 BUNDESOBLIGATION ZC 09/04/2021 44,669,680 3.61GERMANYEUR 43,595,000 BUNDESOBLIGATION ZC 17/04/2020 44,057,979 3.56GERMANYEUR 41,847,000 BUNDESOBLIGATION 0.25% 11/10/2019 42,271,747 3.41GERMANYEUR 37,393,000 BUNDESOBLIGATION 0.25% 16/10/2020 38,088,136 3.07GERMANYEUR 11,000,000 BUNDESREPUBLIK DEUTSCHLAND BUNDESANLEIHE 3.25%
04/07/202112,194,820 0.98GERMANY
EUR 5,445,000 BUNDESREPUBLIK DEUTSCHLAND 2.25% 04/09/2020 5,761,191 0.46GERMANYEUR 12,500,000 FEDERAL REPUBLIC OF GERMANY ZC 13/03/2020 12,621,875 1.02GERMANYEUR 28,400,000 NETHERLANDS GOVERNMENT BOND 3.25% 15/07/2021 30,487,116 2.46GERMANYEUR 15,653,000 IRELAND GOVERNMENT BOND 5.00% 18/10/2020 17,473,600 1.41IRELANDEUR 16,154,000 IRELAND GOVERNMENT BOND 5.90% 18/10/2019 17,319,996 1.40IRELANDEUR 25,000,000 ITALY BUONI POLIENNALI DEL TESORO 0.05% 15/04/2021 23,810,500 1.92ITALYEUR 25,875,000 ITALY BUONI POLIENNALI DEL TESORO 0.20% 15/10/2020 25,123,073 2.03ITALYEUR 80,425,000 ITALY BUONI POLIENNALI DEL TESORO 0.35% 15/06/2020 78,898,533 6.36ITALYEUR 26,200,000 ITALY BUONI POLIENNALI DEL TESORO 0.45% 01/06/2021 25,162,742 2.03ITALYEUR 49,911,000 ITALY BUONI POLIENNALI DEL TESORO 1.05% 01/12/2019 49,889,537 4.03ITALYEUR 41,500,000 ITALY BUONI POLIENNALI DEL TESORO 3.75% 01/03/2021 43,301,515 3.49ITALYEUR 23,000,000 ITALY BUONI POLIENNALI DEL TESORO 3.750% 01/08/2021 24,023,500 1.94ITALYEUR 18,108,000 ITALY CERTIFICATI DI CREDITO DEL TESORO ZC 30/05/2019 18,020,901 1.45ITALYEUR 43,229,000 ITALY CERTIFICATI DI CREDITO DEL TESORO ZC 30/10/2019 42,765,153 3.45ITALYEUR 22,400,000 NETHERLANDS GOVERNMENT BOND 3.250% 15/07/2021 24,830,176 2.00NETHERLANDSEUR 24,992,000 NETHERLANDS GOVERNMENT BOND 0.25% 15/01/2020 25,308,649 2.05NETHERLANDSEUR 52,100,000 SPAIN GOVERNMENT BOND 0.05% 31/01/2021 52,305,274 4.22SPAINEUR 24,000,000 SPAIN GOVERNMENT BOND 0.750% 30/07/2021 24,579,360 1.98SPAINEUR 48,250,000 SPAIN GOVERNMENT BOND 1.15% 30/07/2020 49,570,603 4.00SPAINEUR 45,394,000 SPAIN GOVERNMENT BOND 1.40% 31/01/2020 46,534,297 3.75SPAIN
Country
Statement of Investment Portfolio and Other Net Assets AUGUST 31, 2018
Notional or number of units / shares
ownedMarket Value
EUR% of Net
Assets
INTERFUND EURO BOND SHORT TERM 1-3
Similar issues with same maturities have not been combined when issuance date differs.The accompanying notes are an integral part of these financial statements.General note: differences in sums, if any, are due to rounding.
Currency
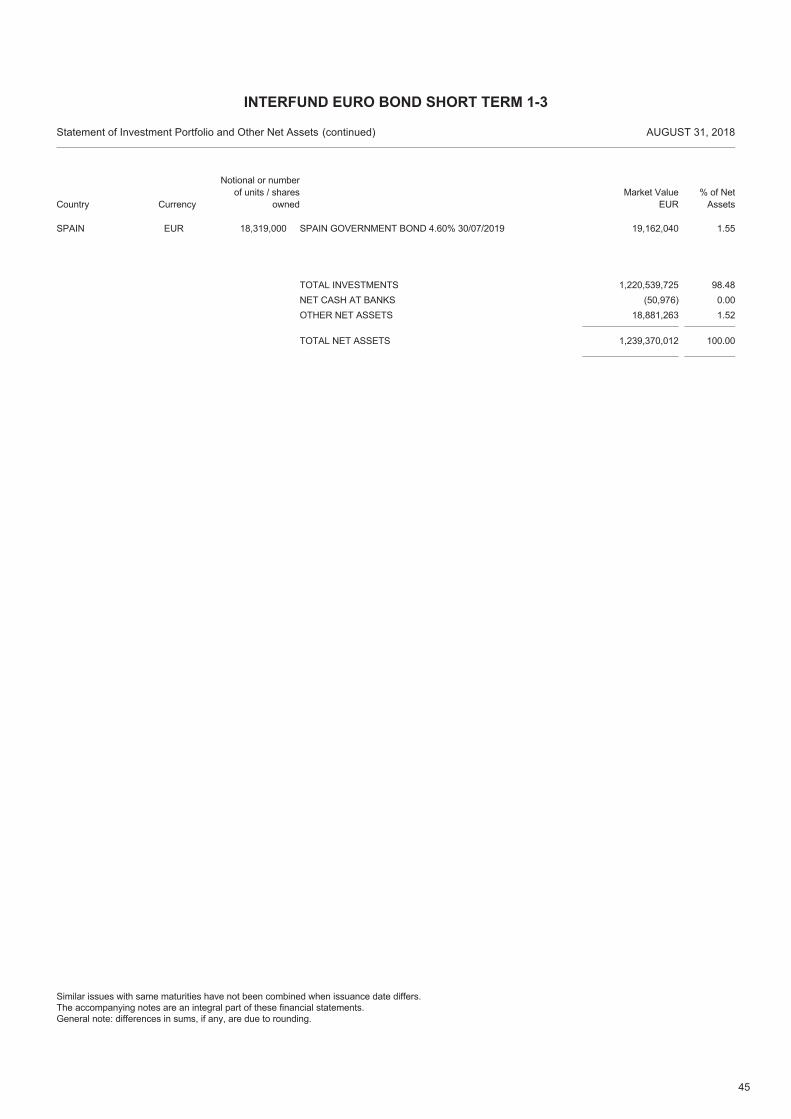
45
EUR 18,319,000 SPAIN GOVERNMENT BOND 4.60% 30/07/2019 19,162,040 1.55SPAIN
TOTAL NET ASSETS 1,239,370,012 100.00
TOTAL INVESTMENTS 1,220,539,725 98.48NET CASH AT BANKS (50,976) 0.00OTHER NET ASSETS 18,881,263 1.52
Country
Statement of Investment Portfolio and Other Net Assets AUGUST 31, 2018
Notional or number of units / shares
ownedMarket Value
EUR% of Net
Assets
INTERFUND EURO BOND SHORT TERM 1-3
(continued)
Similar issues with same maturities have not been combined when issuance date differs.The accompanying notes are an integral part of these financial statements.General note: differences in sums, if any, are due to rounding.
Currency
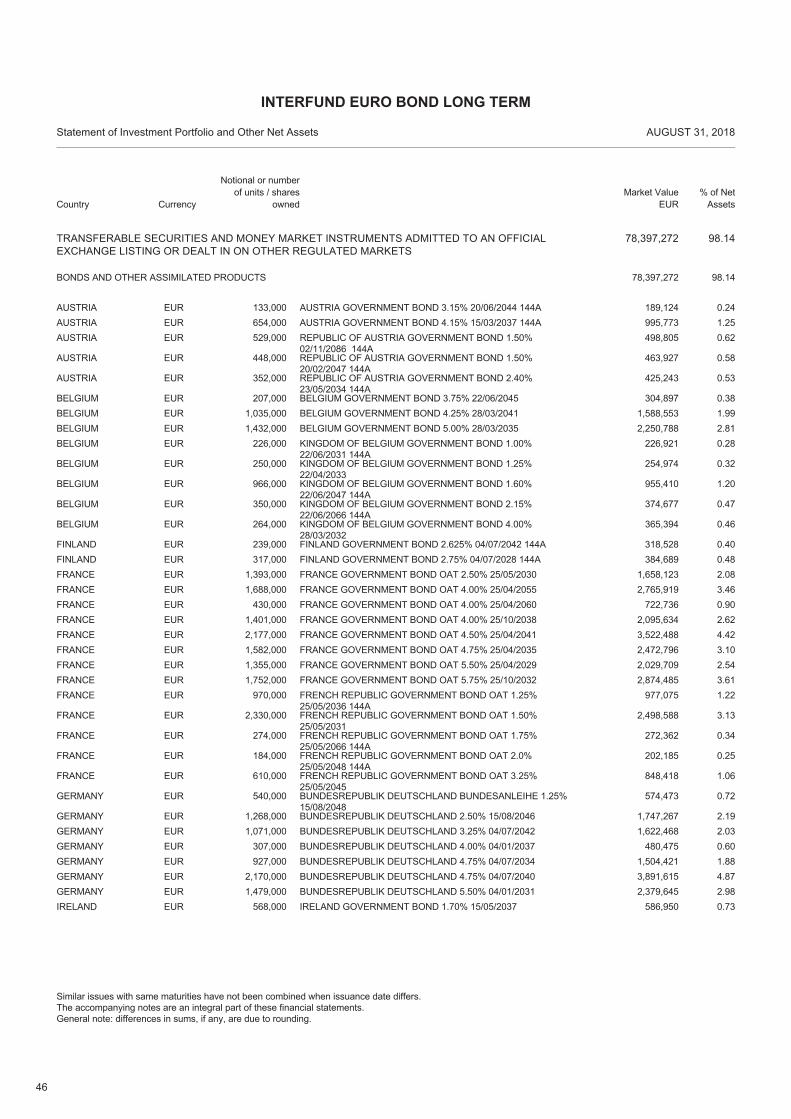
46
TRANSFERABLE SECURITIES AND MONEY MARKET INSTRUMENTS ADMITTED TO AN OFFICIALEXCHANGE LISTING OR DEALT IN ON OTHER REGULATED MARKETS
78,397,272 98.14
EUR 133,000 AUSTRIA GOVERNMENT BOND 3.15% 20/06/2044 144A 189,124 0.24AUSTRIA
BONDS AND OTHER ASSIMILATED PRODUCTS 98.1478,397,272
EUR 654,000 AUSTRIA GOVERNMENT BOND 4.15% 15/03/2037 144A 995,773 1.25AUSTRIAEUR 529,000 REPUBLIC OF AUSTRIA GOVERNMENT BOND 1.50%
02/11/2086 144A498,805 0.62AUSTRIA
EUR 448,000 REPUBLIC OF AUSTRIA GOVERNMENT BOND 1.50%20/02/2047 144A
463,927 0.58AUSTRIA
EUR 352,000 REPUBLIC OF AUSTRIA GOVERNMENT BOND 2.40%23/05/2034 144A
425,243 0.53AUSTRIA
EUR 207,000 BELGIUM GOVERNMENT BOND 3.75% 22/06/2045 304,897 0.38BELGIUMEUR 1,035,000 BELGIUM GOVERNMENT BOND 4.25% 28/03/2041 1,588,553 1.99BELGIUMEUR 1,432,000 BELGIUM GOVERNMENT BOND 5.00% 28/03/2035 2,250,788 2.81BELGIUMEUR 226,000 KINGDOM OF BELGIUM GOVERNMENT BOND 1.00%
22/06/2031 144A226,921 0.28BELGIUM
EUR 250,000 KINGDOM OF BELGIUM GOVERNMENT BOND 1.25%22/04/2033
254,974 0.32BELGIUM
EUR 966,000 KINGDOM OF BELGIUM GOVERNMENT BOND 1.60%22/06/2047 144A
955,410 1.20BELGIUM
EUR 350,000 KINGDOM OF BELGIUM GOVERNMENT BOND 2.15%22/06/2066 144A
374,677 0.47BELGIUM
EUR 264,000 KINGDOM OF BELGIUM GOVERNMENT BOND 4.00%28/03/2032
365,394 0.46BELGIUM
EUR 239,000 FINLAND GOVERNMENT BOND 2.625% 04/07/2042 144A 318,528 0.40FINLANDEUR 317,000 FINLAND GOVERNMENT BOND 2.75% 04/07/2028 144A 384,689 0.48FINLANDEUR 1,393,000 FRANCE GOVERNMENT BOND OAT 2.50% 25/05/2030 1,658,123 2.08FRANCEEUR 1,688,000 FRANCE GOVERNMENT BOND OAT 4.00% 25/04/2055 2,765,919 3.46FRANCEEUR 430,000 FRANCE GOVERNMENT BOND OAT 4.00% 25/04/2060 722,736 0.90FRANCEEUR 1,401,000 FRANCE GOVERNMENT BOND OAT 4.00% 25/10/2038 2,095,634 2.62FRANCEEUR 2,177,000 FRANCE GOVERNMENT BOND OAT 4.50% 25/04/2041 3,522,488 4.42FRANCEEUR 1,582,000 FRANCE GOVERNMENT BOND OAT 4.75% 25/04/2035 2,472,796 3.10FRANCEEUR 1,355,000 FRANCE GOVERNMENT BOND OAT 5.50% 25/04/2029 2,029,709 2.54FRANCEEUR 1,752,000 FRANCE GOVERNMENT BOND OAT 5.75% 25/10/2032 2,874,485 3.61FRANCEEUR 970,000 FRENCH REPUBLIC GOVERNMENT BOND OAT 1.25%
25/05/2036 144A977,075 1.22FRANCE
EUR 2,330,000 FRENCH REPUBLIC GOVERNMENT BOND OAT 1.50%25/05/2031
2,498,588 3.13FRANCE
EUR 274,000 FRENCH REPUBLIC GOVERNMENT BOND OAT 1.75%25/05/2066 144A
272,362 0.34FRANCE
EUR 184,000 FRENCH REPUBLIC GOVERNMENT BOND OAT 2.0%25/05/2048 144A
202,185 0.25FRANCE
EUR 610,000 FRENCH REPUBLIC GOVERNMENT BOND OAT 3.25%25/05/2045
848,418 1.06FRANCE
EUR 540,000 BUNDESREPUBLIK DEUTSCHLAND BUNDESANLEIHE 1.25%15/08/2048
574,473 0.72GERMANY
EUR 1,268,000 BUNDESREPUBLIK DEUTSCHLAND 2.50% 15/08/2046 1,747,267 2.19GERMANYEUR 1,071,000 BUNDESREPUBLIK DEUTSCHLAND 3.25% 04/07/2042 1,622,468 2.03GERMANYEUR 307,000 BUNDESREPUBLIK DEUTSCHLAND 4.00% 04/01/2037 480,475 0.60GERMANYEUR 927,000 BUNDESREPUBLIK DEUTSCHLAND 4.75% 04/07/2034 1,504,421 1.88GERMANYEUR 2,170,000 BUNDESREPUBLIK DEUTSCHLAND 4.75% 04/07/2040 3,891,615 4.87GERMANYEUR 1,479,000 BUNDESREPUBLIK DEUTSCHLAND 5.50% 04/01/2031 2,379,645 2.98GERMANYEUR 568,000 IRELAND GOVERNMENT BOND 1.70% 15/05/2037 586,950 0.73IRELAND
Country
Statement of Investment Portfolio and Other Net Assets AUGUST 31, 2018
Notional or number of units / shares
ownedMarket Value
EUR% of Net
Assets
INTERFUND EURO BOND LONG TERM
Similar issues with same maturities have not been combined when issuance date differs.The accompanying notes are an integral part of these financial statements.General note: differences in sums, if any, are due to rounding.
Currency
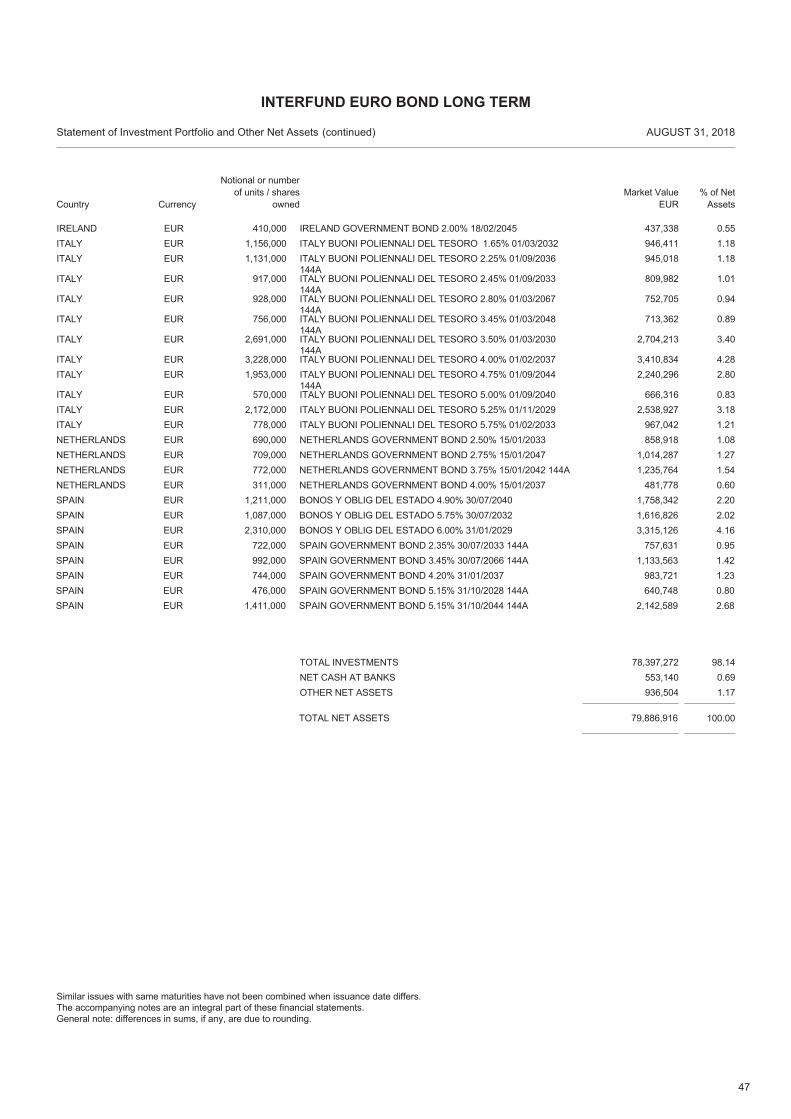
47
EUR 410,000 IRELAND GOVERNMENT BOND 2.00% 18/02/2045 437,338 0.55IRELANDEUR 1,156,000 ITALY BUONI POLIENNALI DEL TESORO 1.65% 01/03/2032 946,411 1.18ITALYEUR 1,131,000 ITALY BUONI POLIENNALI DEL TESORO 2.25% 01/09/2036
144A945,018 1.18ITALY
EUR 917,000 ITALY BUONI POLIENNALI DEL TESORO 2.45% 01/09/2033144A
809,982 1.01ITALY
EUR 928,000 ITALY BUONI POLIENNALI DEL TESORO 2.80% 01/03/2067144A
752,705 0.94ITALY
EUR 756,000 ITALY BUONI POLIENNALI DEL TESORO 3.45% 01/03/2048144A
713,362 0.89ITALY
EUR 2,691,000 ITALY BUONI POLIENNALI DEL TESORO 3.50% 01/03/2030144A
2,704,213 3.40ITALY
EUR 3,228,000 ITALY BUONI POLIENNALI DEL TESORO 4.00% 01/02/2037 3,410,834 4.28ITALYEUR 1,953,000 ITALY BUONI POLIENNALI DEL TESORO 4.75% 01/09/2044
144A2,240,296 2.80ITALY
EUR 570,000 ITALY BUONI POLIENNALI DEL TESORO 5.00% 01/09/2040 666,316 0.83ITALYEUR 2,172,000 ITALY BUONI POLIENNALI DEL TESORO 5.25% 01/11/2029 2,538,927 3.18ITALYEUR 778,000 ITALY BUONI POLIENNALI DEL TESORO 5.75% 01/02/2033 967,042 1.21ITALYEUR 690,000 NETHERLANDS GOVERNMENT BOND 2.50% 15/01/2033 858,918 1.08NETHERLANDSEUR 709,000 NETHERLANDS GOVERNMENT BOND 2.75% 15/01/2047 1,014,287 1.27NETHERLANDSEUR 772,000 NETHERLANDS GOVERNMENT BOND 3.75% 15/01/2042 144A 1,235,764 1.54NETHERLANDSEUR 311,000 NETHERLANDS GOVERNMENT BOND 4.00% 15/01/2037 481,778 0.60NETHERLANDSEUR 1,211,000 BONOS Y OBLIG DEL ESTADO 4.90% 30/07/2040 1,758,342 2.20SPAINEUR 1,087,000 BONOS Y OBLIG DEL ESTADO 5.75% 30/07/2032 1,616,826 2.02SPAINEUR 2,310,000 BONOS Y OBLIG DEL ESTADO 6.00% 31/01/2029 3,315,126 4.16SPAINEUR 722,000 SPAIN GOVERNMENT BOND 2.35% 30/07/2033 144A 757,631 0.95SPAINEUR 992,000 SPAIN GOVERNMENT BOND 3.45% 30/07/2066 144A 1,133,563 1.42SPAINEUR 744,000 SPAIN GOVERNMENT BOND 4.20% 31/01/2037 983,721 1.23SPAINEUR 476,000 SPAIN GOVERNMENT BOND 5.15% 31/10/2028 144A 640,748 0.80SPAINEUR 1,411,000 SPAIN GOVERNMENT BOND 5.15% 31/10/2044 144A 2,142,589 2.68SPAIN
TOTAL NET ASSETS 79,886,916 100.00
TOTAL INVESTMENTS 78,397,272 98.14NET CASH AT BANKS 553,140 0.69OTHER NET ASSETS 936,504 1.17
Country
Statement of Investment Portfolio and Other Net Assets AUGUST 31, 2018
Notional or number of units / shares
ownedMarket Value
EUR% of Net
Assets
INTERFUND EURO BOND LONG TERM
(continued)
Similar issues with same maturities have not been combined when issuance date differs.The accompanying notes are an integral part of these financial statements.General note: differences in sums, if any, are due to rounding.
Currency
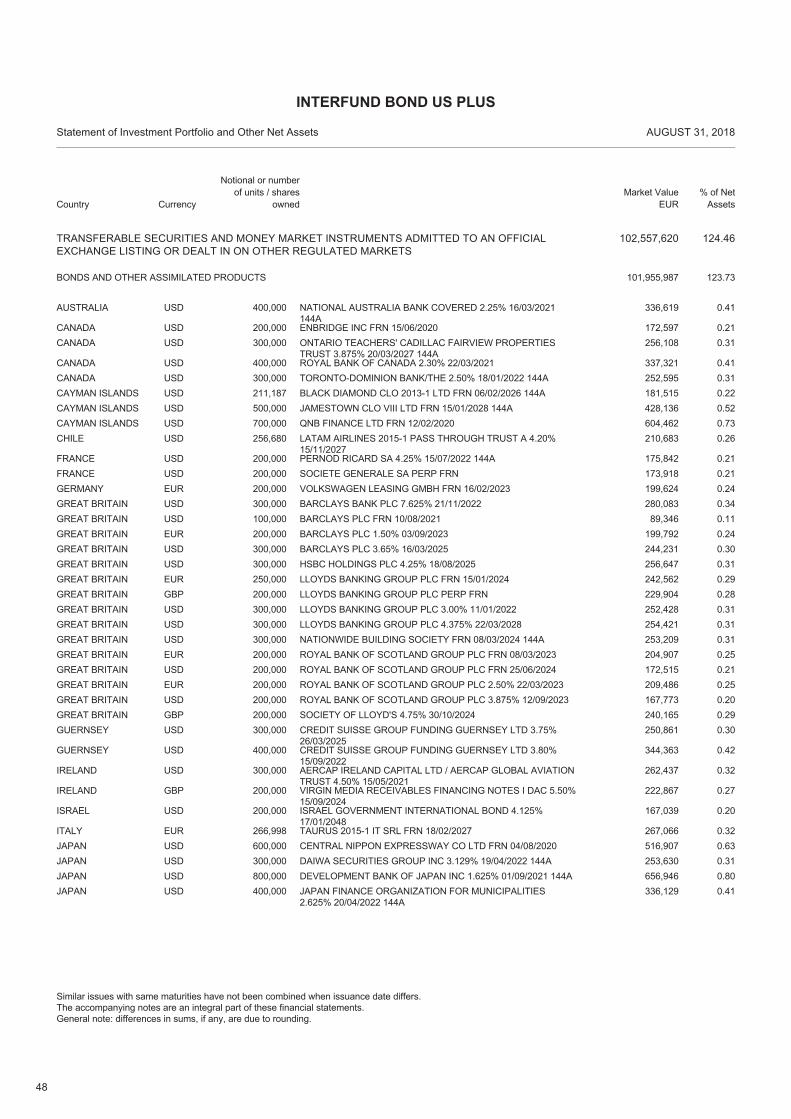
48
TRANSFERABLE SECURITIES AND MONEY MARKET INSTRUMENTS ADMITTED TO AN OFFICIALEXCHANGE LISTING OR DEALT IN ON OTHER REGULATED MARKETS
102,557,620 124.46
USD 400,000 NATIONAL AUSTRALIA BANK COVERED 2.25% 16/03/2021144A
336,619 0.41AUSTRALIA
BONDS AND OTHER ASSIMILATED PRODUCTS 123.73101,955,987
USD 200,000 ENBRIDGE INC FRN 15/06/2020 172,597 0.21CANADAUSD 300,000 ONTARIO TEACHERS' CADILLAC FAIRVIEW PROPERTIES
TRUST 3.875% 20/03/2027 144A256,108 0.31CANADA
USD 400,000 ROYAL BANK OF CANADA 2.30% 22/03/2021 337,321 0.41CANADAUSD 300,000 TORONTO-DOMINION BANK/THE 2.50% 18/01/2022 144A 252,595 0.31CANADAUSD 211,187 BLACK DIAMOND CLO 2013-1 LTD FRN 06/02/2026 144A 181,515 0.22CAYMAN ISLANDSUSD 500,000 JAMESTOWN CLO VIII LTD FRN 15/01/2028 144A 428,136 0.52CAYMAN ISLANDSUSD 700,000 QNB FINANCE LTD FRN 12/02/2020 604,462 0.73CAYMAN ISLANDSUSD 256,680 LATAM AIRLINES 2015-1 PASS THROUGH TRUST A 4.20%
15/11/2027210,683 0.26CHILE
USD 200,000 PERNOD RICARD SA 4.25% 15/07/2022 144A 175,842 0.21FRANCEUSD 200,000 SOCIETE GENERALE SA PERP FRN 173,918 0.21FRANCEEUR 200,000 VOLKSWAGEN LEASING GMBH FRN 16/02/2023 199,624 0.24GERMANYUSD 300,000 BARCLAYS BANK PLC 7.625% 21/11/2022 280,083 0.34GREAT BRITAINUSD 100,000 BARCLAYS PLC FRN 10/08/2021 89,346 0.11GREAT BRITAINEUR 200,000 BARCLAYS PLC 1.50% 03/09/2023 199,792 0.24GREAT BRITAINUSD 300,000 BARCLAYS PLC 3.65% 16/03/2025 244,231 0.30GREAT BRITAINUSD 300,000 HSBC HOLDINGS PLC 4.25% 18/08/2025 256,647 0.31GREAT BRITAINEUR 250,000 LLOYDS BANKING GROUP PLC FRN 15/01/2024 242,562 0.29GREAT BRITAINGBP 200,000 LLOYDS BANKING GROUP PLC PERP FRN 229,904 0.28GREAT BRITAINUSD 300,000 LLOYDS BANKING GROUP PLC 3.00% 11/01/2022 252,428 0.31GREAT BRITAINUSD 300,000 LLOYDS BANKING GROUP PLC 4.375% 22/03/2028 254,421 0.31GREAT BRITAINUSD 300,000 NATIONWIDE BUILDING SOCIETY FRN 08/03/2024 144A 253,209 0.31GREAT BRITAINEUR 200,000 ROYAL BANK OF SCOTLAND GROUP PLC FRN 08/03/2023 204,907 0.25GREAT BRITAINUSD 200,000 ROYAL BANK OF SCOTLAND GROUP PLC FRN 25/06/2024 172,515 0.21GREAT BRITAINEUR 200,000 ROYAL BANK OF SCOTLAND GROUP PLC 2.50% 22/03/2023 209,486 0.25GREAT BRITAINUSD 200,000 ROYAL BANK OF SCOTLAND GROUP PLC 3.875% 12/09/2023 167,773 0.20GREAT BRITAINGBP 200,000 SOCIETY OF LLOYD'S 4.75% 30/10/2024 240,165 0.29GREAT BRITAINUSD 300,000 CREDIT SUISSE GROUP FUNDING GUERNSEY LTD 3.75%
26/03/2025250,861 0.30GUERNSEY
USD 400,000 CREDIT SUISSE GROUP FUNDING GUERNSEY LTD 3.80%15/09/2022
344,363 0.42GUERNSEY
USD 300,000 AERCAP IRELAND CAPITAL LTD / AERCAP GLOBAL AVIATIONTRUST 4.50% 15/05/2021
262,437 0.32IRELAND
GBP 200,000 VIRGIN MEDIA RECEIVABLES FINANCING NOTES I DAC 5.50%15/09/2024
222,867 0.27IRELAND
USD 200,000 ISRAEL GOVERNMENT INTERNATIONAL BOND 4.125%17/01/2048
167,039 0.20ISRAEL
EUR 266,998 TAURUS 2015-1 IT SRL FRN 18/02/2027 267,066 0.32ITALYUSD 600,000 CENTRAL NIPPON EXPRESSWAY CO LTD FRN 04/08/2020 516,907 0.63JAPANUSD 300,000 DAIWA SECURITIES GROUP INC 3.129% 19/04/2022 144A 253,630 0.31JAPANUSD 800,000 DEVELOPMENT BANK OF JAPAN INC 1.625% 01/09/2021 144A 656,946 0.80JAPANUSD 400,000 JAPAN FINANCE ORGANIZATION FOR MUNICIPALITIES
2.625% 20/04/2022 144A336,129 0.41JAPAN
Country
Statement of Investment Portfolio and Other Net Assets AUGUST 31, 2018
Notional or number of units / shares
ownedMarket Value
EUR% of Net
Assets
INTERFUND BOND US PLUS
Similar issues with same maturities have not been combined when issuance date differs.The accompanying notes are an integral part of these financial statements.General note: differences in sums, if any, are due to rounding.
Currency
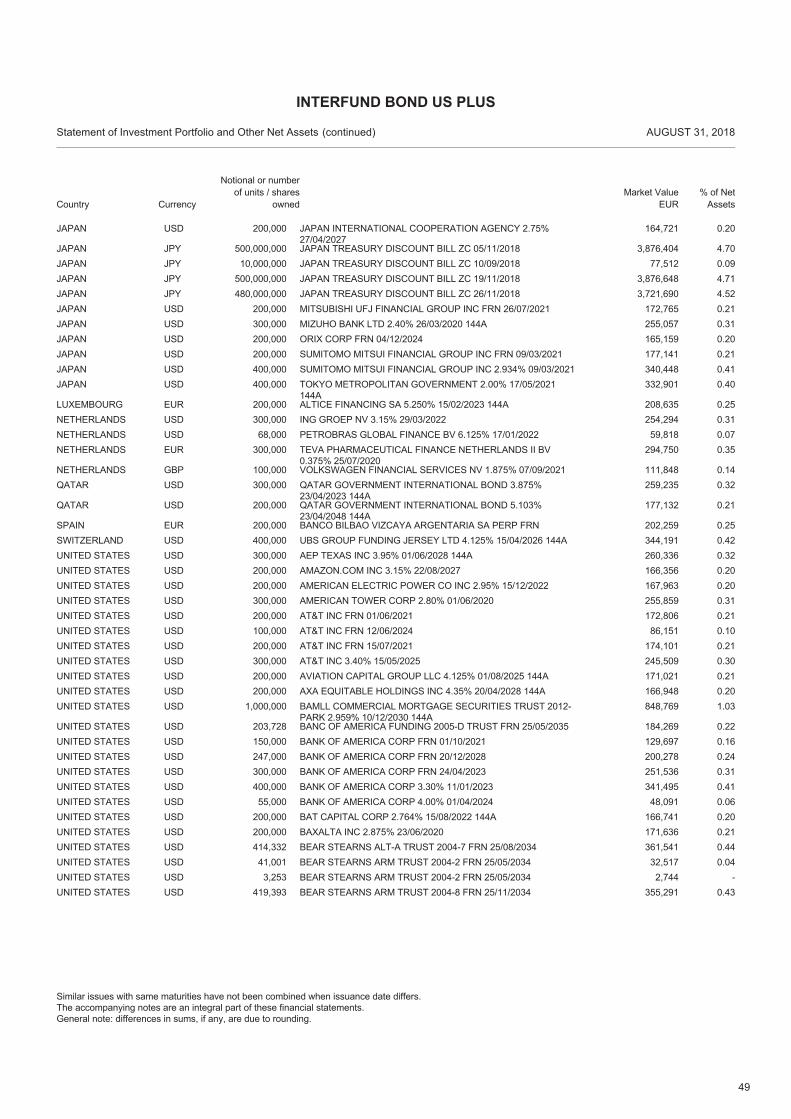
49
USD 200,000 JAPAN INTERNATIONAL COOPERATION AGENCY 2.75%27/04/2027
164,721 0.20JAPAN
JPY 500,000,000 JAPAN TREASURY DISCOUNT BILL ZC 05/11/2018 3,876,404 4.70JAPANJPY 10,000,000 JAPAN TREASURY DISCOUNT BILL ZC 10/09/2018 77,512 0.09JAPANJPY 500,000,000 JAPAN TREASURY DISCOUNT BILL ZC 19/11/2018 3,876,648 4.71JAPANJPY 480,000,000 JAPAN TREASURY DISCOUNT BILL ZC 26/11/2018 3,721,690 4.52JAPANUSD 200,000 MITSUBISHI UFJ FINANCIAL GROUP INC FRN 26/07/2021 172,765 0.21JAPANUSD 300,000 MIZUHO BANK LTD 2.40% 26/03/2020 144A 255,057 0.31JAPANUSD 200,000 ORIX CORP FRN 04/12/2024 165,159 0.20JAPANUSD 200,000 SUMITOMO MITSUI FINANCIAL GROUP INC FRN 09/03/2021 177,141 0.21JAPANUSD 400,000 SUMITOMO MITSUI FINANCIAL GROUP INC 2.934% 09/03/2021 340,448 0.41JAPANUSD 400,000 TOKYO METROPOLITAN GOVERNMENT 2.00% 17/05/2021
144A332,901 0.40JAPAN
EUR 200,000 ALTICE FINANCING SA 5.250% 15/02/2023 144A 208,635 0.25LUXEMBOURGUSD 300,000 ING GROEP NV 3.15% 29/03/2022 254,294 0.31NETHERLANDSUSD 68,000 PETROBRAS GLOBAL FINANCE BV 6.125% 17/01/2022 59,818 0.07NETHERLANDSEUR 300,000 TEVA PHARMACEUTICAL FINANCE NETHERLANDS II BV
0.375% 25/07/2020294,750 0.35NETHERLANDS
GBP 100,000 VOLKSWAGEN FINANCIAL SERVICES NV 1.875% 07/09/2021 111,848 0.14NETHERLANDSUSD 300,000 QATAR GOVERNMENT INTERNATIONAL BOND 3.875%
23/04/2023 144A259,235 0.32QATAR
USD 200,000 QATAR GOVERNMENT INTERNATIONAL BOND 5.103%23/04/2048 144A
177,132 0.21QATAR
EUR 200,000 BANCO BILBAO VIZCAYA ARGENTARIA SA PERP FRN 202,259 0.25SPAINUSD 400,000 UBS GROUP FUNDING JERSEY LTD 4.125% 15/04/2026 144A 344,191 0.42SWITZERLANDUSD 300,000 AEP TEXAS INC 3.95% 01/06/2028 144A 260,336 0.32UNITED STATESUSD 200,000 AMAZON.COM INC 3.15% 22/08/2027 166,356 0.20UNITED STATESUSD 200,000 AMERICAN ELECTRIC POWER CO INC 2.95% 15/12/2022 167,963 0.20UNITED STATESUSD 300,000 AMERICAN TOWER CORP 2.80% 01/06/2020 255,859 0.31UNITED STATESUSD 200,000 AT&T INC FRN 01/06/2021 172,806 0.21UNITED STATESUSD 100,000 AT&T INC FRN 12/06/2024 86,151 0.10UNITED STATESUSD 200,000 AT&T INC FRN 15/07/2021 174,101 0.21UNITED STATESUSD 300,000 AT&T INC 3.40% 15/05/2025 245,509 0.30UNITED STATESUSD 200,000 AVIATION CAPITAL GROUP LLC 4.125% 01/08/2025 144A 171,021 0.21UNITED STATESUSD 200,000 AXA EQUITABLE HOLDINGS INC 4.35% 20/04/2028 144A 166,948 0.20UNITED STATESUSD 1,000,000 BAMLL COMMERCIAL MORTGAGE SECURITIES TRUST 2012-
PARK 2.959% 10/12/2030 144A848,769 1.03UNITED STATES
USD 203,728 BANC OF AMERICA FUNDING 2005-D TRUST FRN 25/05/2035 184,269 0.22UNITED STATESUSD 150,000 BANK OF AMERICA CORP FRN 01/10/2021 129,697 0.16UNITED STATESUSD 247,000 BANK OF AMERICA CORP FRN 20/12/2028 200,278 0.24UNITED STATESUSD 300,000 BANK OF AMERICA CORP FRN 24/04/2023 251,536 0.31UNITED STATESUSD 400,000 BANK OF AMERICA CORP 3.30% 11/01/2023 341,495 0.41UNITED STATESUSD 55,000 BANK OF AMERICA CORP 4.00% 01/04/2024 48,091 0.06UNITED STATESUSD 200,000 BAT CAPITAL CORP 2.764% 15/08/2022 144A 166,741 0.20UNITED STATESUSD 200,000 BAXALTA INC 2.875% 23/06/2020 171,636 0.21UNITED STATESUSD 414,332 BEAR STEARNS ALT-A TRUST 2004-7 FRN 25/08/2034 361,541 0.44UNITED STATESUSD 41,001 BEAR STEARNS ARM TRUST 2004-2 FRN 25/05/2034 32,517 0.04UNITED STATESUSD 3,253 BEAR STEARNS ARM TRUST 2004-2 FRN 25/05/2034 2,744 -UNITED STATESUSD 419,393 BEAR STEARNS ARM TRUST 2004-8 FRN 25/11/2034 355,291 0.43UNITED STATES
Country
Statement of Investment Portfolio and Other Net Assets AUGUST 31, 2018
Notional or number of units / shares
ownedMarket Value
EUR% of Net
Assets
INTERFUND BOND US PLUS
(continued)
Similar issues with same maturities have not been combined when issuance date differs.The accompanying notes are an integral part of these financial statements.General note: differences in sums, if any, are due to rounding.
Currency
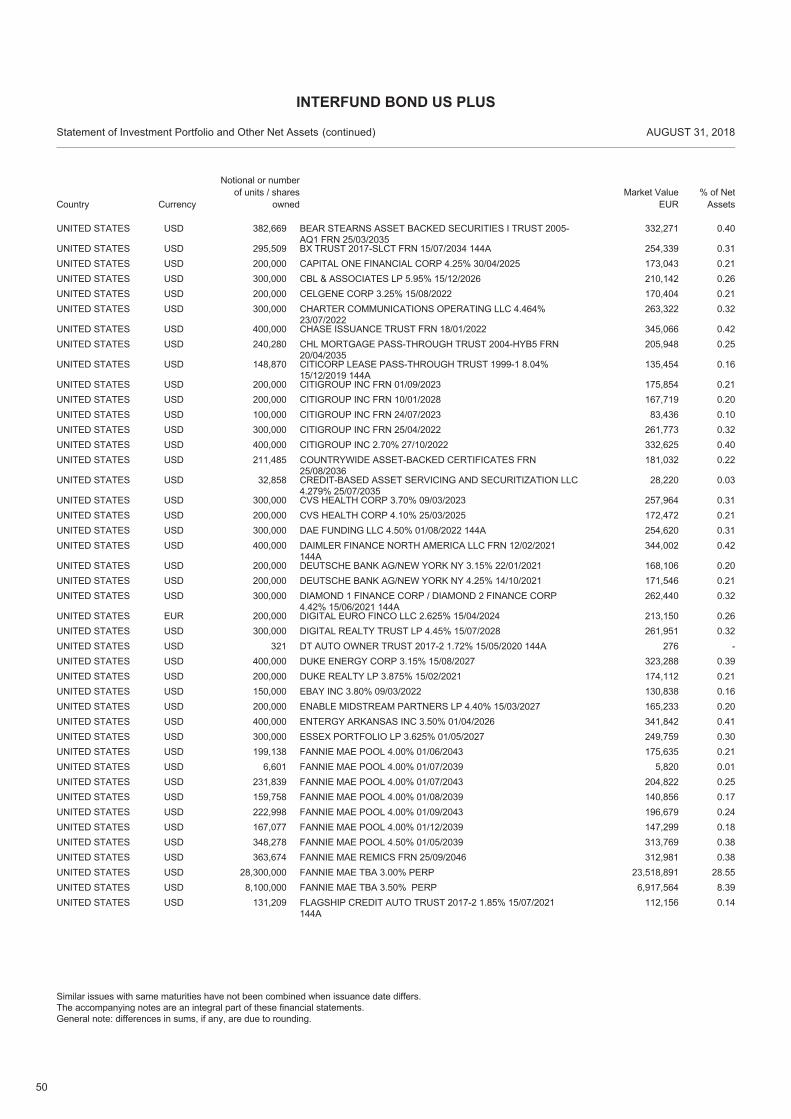
50
USD 382,669 BEAR STEARNS ASSET BACKED SECURITIES I TRUST 2005-AQ1 FRN 25/03/2035
332,271 0.40UNITED STATES
USD 295,509 BX TRUST 2017-SLCT FRN 15/07/2034 144A 254,339 0.31UNITED STATESUSD 200,000 CAPITAL ONE FINANCIAL CORP 4.25% 30/04/2025 173,043 0.21UNITED STATESUSD 300,000 CBL & ASSOCIATES LP 5.95% 15/12/2026 210,142 0.26UNITED STATESUSD 200,000 CELGENE CORP 3.25% 15/08/2022 170,404 0.21UNITED STATESUSD 300,000 CHARTER COMMUNICATIONS OPERATING LLC 4.464%
23/07/2022263,322 0.32UNITED STATES
USD 400,000 CHASE ISSUANCE TRUST FRN 18/01/2022 345,066 0.42UNITED STATESUSD 240,280 CHL MORTGAGE PASS-THROUGH TRUST 2004-HYB5 FRN
20/04/2035205,948 0.25UNITED STATES
USD 148,870 CITICORP LEASE PASS-THROUGH TRUST 1999-1 8.04%15/12/2019 144A
135,454 0.16UNITED STATES
USD 200,000 CITIGROUP INC FRN 01/09/2023 175,854 0.21UNITED STATESUSD 200,000 CITIGROUP INC FRN 10/01/2028 167,719 0.20UNITED STATESUSD 100,000 CITIGROUP INC FRN 24/07/2023 83,436 0.10UNITED STATESUSD 300,000 CITIGROUP INC FRN 25/04/2022 261,773 0.32UNITED STATESUSD 400,000 CITIGROUP INC 2.70% 27/10/2022 332,625 0.40UNITED STATESUSD 211,485 COUNTRYWIDE ASSET-BACKED CERTIFICATES FRN
25/08/2036181,032 0.22UNITED STATES
USD 32,858 CREDIT-BASED ASSET SERVICING AND SECURITIZATION LLC4.279% 25/07/2035
28,220 0.03UNITED STATES
USD 300,000 CVS HEALTH CORP 3.70% 09/03/2023 257,964 0.31UNITED STATESUSD 200,000 CVS HEALTH CORP 4.10% 25/03/2025 172,472 0.21UNITED STATESUSD 300,000 DAE FUNDING LLC 4.50% 01/08/2022 144A 254,620 0.31UNITED STATESUSD 400,000 DAIMLER FINANCE NORTH AMERICA LLC FRN 12/02/2021
144A344,002 0.42UNITED STATES
USD 200,000 DEUTSCHE BANK AG/NEW YORK NY 3.15% 22/01/2021 168,106 0.20UNITED STATESUSD 200,000 DEUTSCHE BANK AG/NEW YORK NY 4.25% 14/10/2021 171,546 0.21UNITED STATESUSD 300,000 DIAMOND 1 FINANCE CORP / DIAMOND 2 FINANCE CORP
4.42% 15/06/2021 144A262,440 0.32UNITED STATES
EUR 200,000 DIGITAL EURO FINCO LLC 2.625% 15/04/2024 213,150 0.26UNITED STATESUSD 300,000 DIGITAL REALTY TRUST LP 4.45% 15/07/2028 261,951 0.32UNITED STATESUSD 321 DT AUTO OWNER TRUST 2017-2 1.72% 15/05/2020 144A 276 -UNITED STATESUSD 400,000 DUKE ENERGY CORP 3.15% 15/08/2027 323,288 0.39UNITED STATESUSD 200,000 DUKE REALTY LP 3.875% 15/02/2021 174,112 0.21UNITED STATESUSD 150,000 EBAY INC 3.80% 09/03/2022 130,838 0.16UNITED STATESUSD 200,000 ENABLE MIDSTREAM PARTNERS LP 4.40% 15/03/2027 165,233 0.20UNITED STATESUSD 400,000 ENTERGY ARKANSAS INC 3.50% 01/04/2026 341,842 0.41UNITED STATESUSD 300,000 ESSEX PORTFOLIO LP 3.625% 01/05/2027 249,759 0.30UNITED STATESUSD 199,138 FANNIE MAE POOL 4.00% 01/06/2043 175,635 0.21UNITED STATESUSD 6,601 FANNIE MAE POOL 4.00% 01/07/2039 5,820 0.01UNITED STATESUSD 231,839 FANNIE MAE POOL 4.00% 01/07/2043 204,822 0.25UNITED STATESUSD 159,758 FANNIE MAE POOL 4.00% 01/08/2039 140,856 0.17UNITED STATESUSD 222,998 FANNIE MAE POOL 4.00% 01/09/2043 196,679 0.24UNITED STATESUSD 167,077 FANNIE MAE POOL 4.00% 01/12/2039 147,299 0.18UNITED STATESUSD 348,278 FANNIE MAE POOL 4.50% 01/05/2039 313,769 0.38UNITED STATESUSD 363,674 FANNIE MAE REMICS FRN 25/09/2046 312,981 0.38UNITED STATESUSD 28,300,000 FANNIE MAE TBA 3.00% PERP 23,518,891 28.55UNITED STATESUSD 8,100,000 FANNIE MAE TBA 3.50% PERP 6,917,564 8.39UNITED STATESUSD 131,209 FLAGSHIP CREDIT AUTO TRUST 2017-2 1.85% 15/07/2021
144A112,156 0.14UNITED STATES
Country
Statement of Investment Portfolio and Other Net Assets AUGUST 31, 2018
Notional or number of units / shares
ownedMarket Value
EUR% of Net
Assets
INTERFUND BOND US PLUS
(continued)
Similar issues with same maturities have not been combined when issuance date differs.The accompanying notes are an integral part of these financial statements.General note: differences in sums, if any, are due to rounding.
Currency
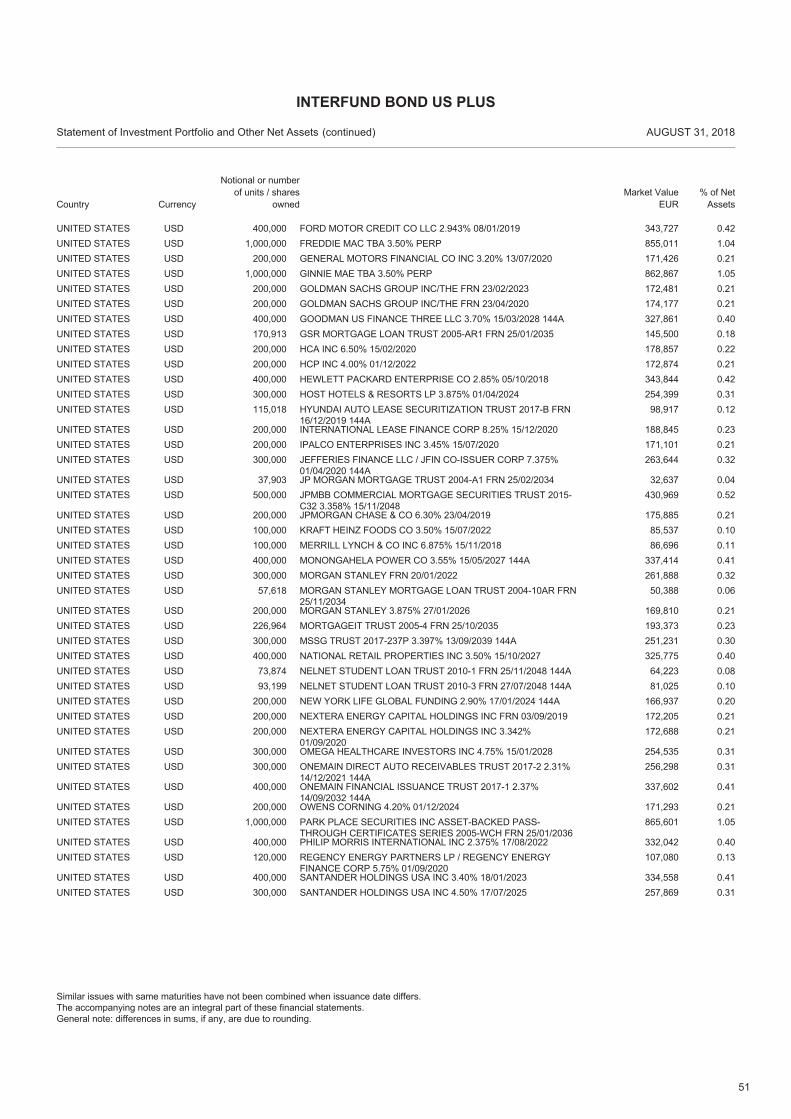
51
USD 400,000 FORD MOTOR CREDIT CO LLC 2.943% 08/01/2019 343,727 0.42UNITED STATESUSD 1,000,000 FREDDIE MAC TBA 3.50% PERP 855,011 1.04UNITED STATESUSD 200,000 GENERAL MOTORS FINANCIAL CO INC 3.20% 13/07/2020 171,426 0.21UNITED STATESUSD 1,000,000 GINNIE MAE TBA 3.50% PERP 862,867 1.05UNITED STATESUSD 200,000 GOLDMAN SACHS GROUP INC/THE FRN 23/02/2023 172,481 0.21UNITED STATESUSD 200,000 GOLDMAN SACHS GROUP INC/THE FRN 23/04/2020 174,177 0.21UNITED STATESUSD 400,000 GOODMAN US FINANCE THREE LLC 3.70% 15/03/2028 144A 327,861 0.40UNITED STATESUSD 170,913 GSR MORTGAGE LOAN TRUST 2005-AR1 FRN 25/01/2035 145,500 0.18UNITED STATESUSD 200,000 HCA INC 6.50% 15/02/2020 178,857 0.22UNITED STATESUSD 200,000 HCP INC 4.00% 01/12/2022 172,874 0.21UNITED STATESUSD 400,000 HEWLETT PACKARD ENTERPRISE CO 2.85% 05/10/2018 343,844 0.42UNITED STATESUSD 300,000 HOST HOTELS & RESORTS LP 3.875% 01/04/2024 254,399 0.31UNITED STATESUSD 115,018 HYUNDAI AUTO LEASE SECURITIZATION TRUST 2017-B FRN
16/12/2019 144A98,917 0.12UNITED STATES
USD 200,000 INTERNATIONAL LEASE FINANCE CORP 8.25% 15/12/2020 188,845 0.23UNITED STATESUSD 200,000 IPALCO ENTERPRISES INC 3.45% 15/07/2020 171,101 0.21UNITED STATESUSD 300,000 JEFFERIES FINANCE LLC / JFIN CO-ISSUER CORP 7.375%
01/04/2020 144A263,644 0.32UNITED STATES
USD 37,903 JP MORGAN MORTGAGE TRUST 2004-A1 FRN 25/02/2034 32,637 0.04UNITED STATESUSD 500,000 JPMBB COMMERCIAL MORTGAGE SECURITIES TRUST 2015-
C32 3.358% 15/11/2048430,969 0.52UNITED STATES
USD 200,000 JPMORGAN CHASE & CO 6.30% 23/04/2019 175,885 0.21UNITED STATESUSD 100,000 KRAFT HEINZ FOODS CO 3.50% 15/07/2022 85,537 0.10UNITED STATESUSD 100,000 MERRILL LYNCH & CO INC 6.875% 15/11/2018 86,696 0.11UNITED STATESUSD 400,000 MONONGAHELA POWER CO 3.55% 15/05/2027 144A 337,414 0.41UNITED STATESUSD 300,000 MORGAN STANLEY FRN 20/01/2022 261,888 0.32UNITED STATESUSD 57,618 MORGAN STANLEY MORTGAGE LOAN TRUST 2004-10AR FRN
25/11/203450,388 0.06UNITED STATES
USD 200,000 MORGAN STANLEY 3.875% 27/01/2026 169,810 0.21UNITED STATESUSD 226,964 MORTGAGEIT TRUST 2005-4 FRN 25/10/2035 193,373 0.23UNITED STATESUSD 300,000 MSSG TRUST 2017-237P 3.397% 13/09/2039 144A 251,231 0.30UNITED STATESUSD 400,000 NATIONAL RETAIL PROPERTIES INC 3.50% 15/10/2027 325,775 0.40UNITED STATESUSD 73,874 NELNET STUDENT LOAN TRUST 2010-1 FRN 25/11/2048 144A 64,223 0.08UNITED STATESUSD 93,199 NELNET STUDENT LOAN TRUST 2010-3 FRN 27/07/2048 144A 81,025 0.10UNITED STATESUSD 200,000 NEW YORK LIFE GLOBAL FUNDING 2.90% 17/01/2024 144A 166,937 0.20UNITED STATESUSD 200,000 NEXTERA ENERGY CAPITAL HOLDINGS INC FRN 03/09/2019 172,205 0.21UNITED STATESUSD 200,000 NEXTERA ENERGY CAPITAL HOLDINGS INC 3.342%
01/09/2020172,688 0.21UNITED STATES
USD 300,000 OMEGA HEALTHCARE INVESTORS INC 4.75% 15/01/2028 254,535 0.31UNITED STATESUSD 300,000 ONEMAIN DIRECT AUTO RECEIVABLES TRUST 2017-2 2.31%
14/12/2021 144A256,298 0.31UNITED STATES
USD 400,000 ONEMAIN FINANCIAL ISSUANCE TRUST 2017-1 2.37%14/09/2032 144A
337,602 0.41UNITED STATES
USD 200,000 OWENS CORNING 4.20% 01/12/2024 171,293 0.21UNITED STATESUSD 1,000,000 PARK PLACE SECURITIES INC ASSET-BACKED PASS-
THROUGH CERTIFICATES SERIES 2005-WCH FRN 25/01/2036865,601 1.05UNITED STATES
USD 400,000 PHILIP MORRIS INTERNATIONAL INC 2.375% 17/08/2022 332,042 0.40UNITED STATESUSD 120,000 REGENCY ENERGY PARTNERS LP / REGENCY ENERGY
FINANCE CORP 5.75% 01/09/2020107,080 0.13UNITED STATES
USD 400,000 SANTANDER HOLDINGS USA INC 3.40% 18/01/2023 334,558 0.41UNITED STATESUSD 300,000 SANTANDER HOLDINGS USA INC 4.50% 17/07/2025 257,869 0.31UNITED STATES
Country
Statement of Investment Portfolio and Other Net Assets AUGUST 31, 2018
Notional or number of units / shares
ownedMarket Value
EUR% of Net
Assets
INTERFUND BOND US PLUS
(continued)
Similar issues with same maturities have not been combined when issuance date differs.The accompanying notes are an integral part of these financial statements.General note: differences in sums, if any, are due to rounding.
Currency
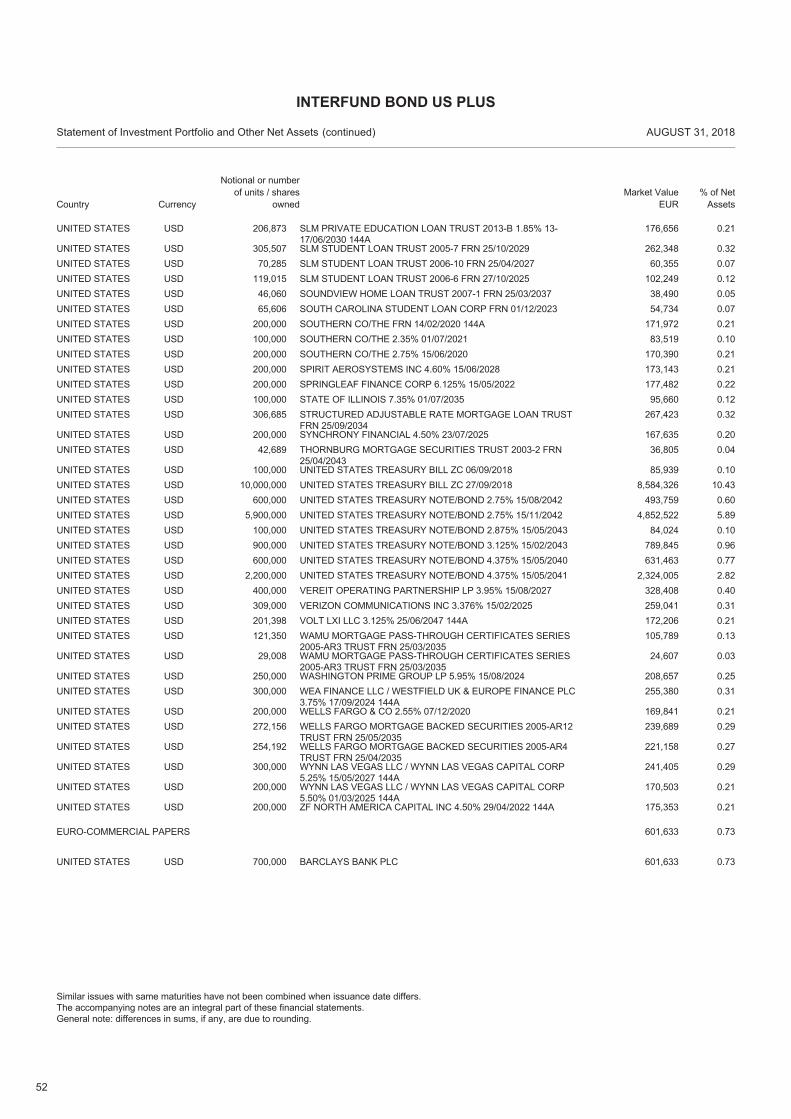
52
USD 206,873 SLM PRIVATE EDUCATION LOAN TRUST 2013-B 1.85% 13-17/06/2030 144A
176,656 0.21UNITED STATES
USD 305,507 SLM STUDENT LOAN TRUST 2005-7 FRN 25/10/2029 262,348 0.32UNITED STATESUSD 70,285 SLM STUDENT LOAN TRUST 2006-10 FRN 25/04/2027 60,355 0.07UNITED STATESUSD 119,015 SLM STUDENT LOAN TRUST 2006-6 FRN 27/10/2025 102,249 0.12UNITED STATESUSD 46,060 SOUNDVIEW HOME LOAN TRUST 2007-1 FRN 25/03/2037 38,490 0.05UNITED STATESUSD 65,606 SOUTH CAROLINA STUDENT LOAN CORP FRN 01/12/2023 54,734 0.07UNITED STATESUSD 200,000 SOUTHERN CO/THE FRN 14/02/2020 144A 171,972 0.21UNITED STATESUSD 100,000 SOUTHERN CO/THE 2.35% 01/07/2021 83,519 0.10UNITED STATESUSD 200,000 SOUTHERN CO/THE 2.75% 15/06/2020 170,390 0.21UNITED STATESUSD 200,000 SPIRIT AEROSYSTEMS INC 4.60% 15/06/2028 173,143 0.21UNITED STATESUSD 200,000 SPRINGLEAF FINANCE CORP 6.125% 15/05/2022 177,482 0.22UNITED STATESUSD 100,000 STATE OF ILLINOIS 7.35% 01/07/2035 95,660 0.12UNITED STATESUSD 306,685 STRUCTURED ADJUSTABLE RATE MORTGAGE LOAN TRUST
FRN 25/09/2034267,423 0.32UNITED STATES
USD 200,000 SYNCHRONY FINANCIAL 4.50% 23/07/2025 167,635 0.20UNITED STATESUSD 42,689 THORNBURG MORTGAGE SECURITIES TRUST 2003-2 FRN
25/04/204336,805 0.04UNITED STATES
USD 100,000 UNITED STATES TREASURY BILL ZC 06/09/2018 85,939 0.10UNITED STATESUSD 10,000,000 UNITED STATES TREASURY BILL ZC 27/09/2018 8,584,326 10.43UNITED STATESUSD 600,000 UNITED STATES TREASURY NOTE/BOND 2.75% 15/08/2042 493,759 0.60UNITED STATESUSD 5,900,000 UNITED STATES TREASURY NOTE/BOND 2.75% 15/11/2042 4,852,522 5.89UNITED STATESUSD 100,000 UNITED STATES TREASURY NOTE/BOND 2.875% 15/05/2043 84,024 0.10UNITED STATESUSD 900,000 UNITED STATES TREASURY NOTE/BOND 3.125% 15/02/2043 789,845 0.96UNITED STATESUSD 600,000 UNITED STATES TREASURY NOTE/BOND 4.375% 15/05/2040 631,463 0.77UNITED STATESUSD 2,200,000 UNITED STATES TREASURY NOTE/BOND 4.375% 15/05/2041 2,324,005 2.82UNITED STATESUSD 400,000 VEREIT OPERATING PARTNERSHIP LP 3.95% 15/08/2027 328,408 0.40UNITED STATESUSD 309,000 VERIZON COMMUNICATIONS INC 3.376% 15/02/2025 259,041 0.31UNITED STATESUSD 201,398 VOLT LXI LLC 3.125% 25/06/2047 144A 172,206 0.21UNITED STATESUSD 121,350 WAMU MORTGAGE PASS-THROUGH CERTIFICATES SERIES
2005-AR3 TRUST FRN 25/03/2035105,789 0.13UNITED STATES
USD 29,008 WAMU MORTGAGE PASS-THROUGH CERTIFICATES SERIES2005-AR3 TRUST FRN 25/03/2035
24,607 0.03UNITED STATES
USD 250,000 WASHINGTON PRIME GROUP LP 5.95% 15/08/2024 208,657 0.25UNITED STATESUSD 300,000 WEA FINANCE LLC / WESTFIELD UK & EUROPE FINANCE PLC
3.75% 17/09/2024 144A255,380 0.31UNITED STATES
USD 200,000 WELLS FARGO & CO 2.55% 07/12/2020 169,841 0.21UNITED STATESUSD 272,156 WELLS FARGO MORTGAGE BACKED SECURITIES 2005-AR12
TRUST FRN 25/05/2035239,689 0.29UNITED STATES
USD 254,192 WELLS FARGO MORTGAGE BACKED SECURITIES 2005-AR4TRUST FRN 25/04/2035
221,158 0.27UNITED STATES
USD 300,000 WYNN LAS VEGAS LLC / WYNN LAS VEGAS CAPITAL CORP5.25% 15/05/2027 144A
241,405 0.29UNITED STATES
USD 200,000 WYNN LAS VEGAS LLC / WYNN LAS VEGAS CAPITAL CORP5.50% 01/03/2025 144A
170,503 0.21UNITED STATES
USD 200,000 ZF NORTH AMERICA CAPITAL INC 4.50% 29/04/2022 144A 175,353 0.21UNITED STATES
USD 700,000 BARCLAYS BANK PLC 601,633 0.73UNITED STATES
EURO-COMMERCIAL PAPERS 0.73601,633
Country
Statement of Investment Portfolio and Other Net Assets AUGUST 31, 2018
Notional or number of units / shares
ownedMarket Value
EUR% of Net
Assets
INTERFUND BOND US PLUS
(continued)
Similar issues with same maturities have not been combined when issuance date differs.The accompanying notes are an integral part of these financial statements.General note: differences in sums, if any, are due to rounding.
Currency
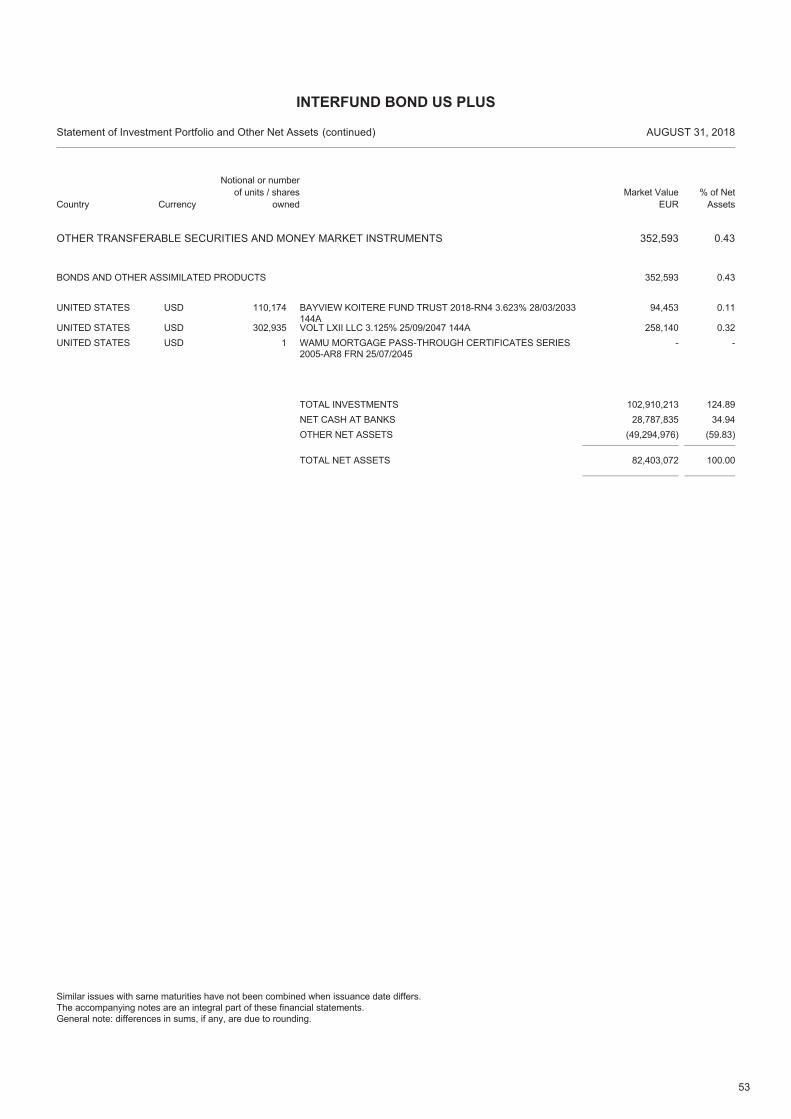
53
OTHER TRANSFERABLE SECURITIES AND MONEY MARKET INSTRUMENTS 352,593 0.43
USD 110,174 BAYVIEW KOITERE FUND TRUST 2018-RN4 3.623% 28/03/2033144A
94,453 0.11UNITED STATES
BONDS AND OTHER ASSIMILATED PRODUCTS 0.43352,593
USD 302,935 VOLT LXII LLC 3.125% 25/09/2047 144A 258,140 0.32UNITED STATESUSD 1 WAMU MORTGAGE PASS-THROUGH CERTIFICATES SERIES
2005-AR8 FRN 25/07/2045- -UNITED STATES
TOTAL NET ASSETS 82,403,072 100.00
TOTAL INVESTMENTS 102,910,213 124.89NET CASH AT BANKS 28,787,835 34.94OTHER NET ASSETS (49,294,976) (59.83)
Country
Statement of Investment Portfolio and Other Net Assets AUGUST 31, 2018
Notional or number of units / shares
ownedMarket Value
EUR% of Net
Assets
INTERFUND BOND US PLUS
(continued)
Similar issues with same maturities have not been combined when issuance date differs.The accompanying notes are an integral part of these financial statements.General note: differences in sums, if any, are due to rounding.
Currency
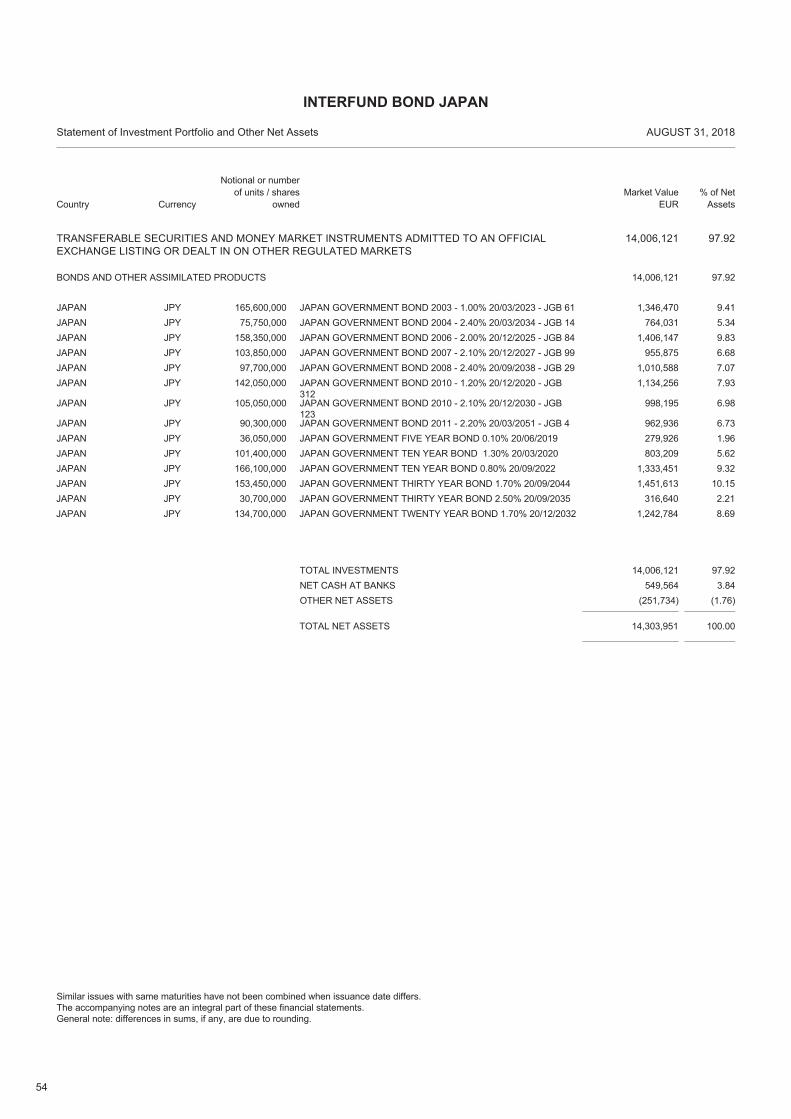
54
TRANSFERABLE SECURITIES AND MONEY MARKET INSTRUMENTS ADMITTED TO AN OFFICIALEXCHANGE LISTING OR DEALT IN ON OTHER REGULATED MARKETS
14,006,121 97.92
JPY 165,600,000 JAPAN GOVERNMENT BOND 2003 - 1.00% 20/03/2023 - JGB 61 1,346,470 9.41JAPAN
BONDS AND OTHER ASSIMILATED PRODUCTS 97.9214,006,121
JPY 75,750,000 JAPAN GOVERNMENT BOND 2004 - 2.40% 20/03/2034 - JGB 14 764,031 5.34JAPANJPY 158,350,000 JAPAN GOVERNMENT BOND 2006 - 2.00% 20/12/2025 - JGB 84 1,406,147 9.83JAPANJPY 103,850,000 JAPAN GOVERNMENT BOND 2007 - 2.10% 20/12/2027 - JGB 99 955,875 6.68JAPANJPY 97,700,000 JAPAN GOVERNMENT BOND 2008 - 2.40% 20/09/2038 - JGB 29 1,010,588 7.07JAPANJPY 142,050,000 JAPAN GOVERNMENT BOND 2010 - 1.20% 20/12/2020 - JGB
3121,134,256 7.93JAPAN
JPY 105,050,000 JAPAN GOVERNMENT BOND 2010 - 2.10% 20/12/2030 - JGB123
998,195 6.98JAPAN
JPY 90,300,000 JAPAN GOVERNMENT BOND 2011 - 2.20% 20/03/2051 - JGB 4 962,936 6.73JAPANJPY 36,050,000 JAPAN GOVERNMENT FIVE YEAR BOND 0.10% 20/06/2019 279,926 1.96JAPANJPY 101,400,000 JAPAN GOVERNMENT TEN YEAR BOND 1.30% 20/03/2020 803,209 5.62JAPANJPY 166,100,000 JAPAN GOVERNMENT TEN YEAR BOND 0.80% 20/09/2022 1,333,451 9.32JAPANJPY 153,450,000 JAPAN GOVERNMENT THIRTY YEAR BOND 1.70% 20/09/2044 1,451,613 10.15JAPANJPY 30,700,000 JAPAN GOVERNMENT THIRTY YEAR BOND 2.50% 20/09/2035 316,640 2.21JAPANJPY 134,700,000 JAPAN GOVERNMENT TWENTY YEAR BOND 1.70% 20/12/2032 1,242,784 8.69JAPAN
TOTAL NET ASSETS 14,303,951 100.00
TOTAL INVESTMENTS 14,006,121 97.92NET CASH AT BANKS 549,564 3.84OTHER NET ASSETS (251,734) (1.76)
Country
Statement of Investment Portfolio and Other Net Assets AUGUST 31, 2018
Notional or number of units / shares
ownedMarket Value
EUR% of Net
Assets
INTERFUND BOND JAPAN
Similar issues with same maturities have not been combined when issuance date differs.The accompanying notes are an integral part of these financial statements.General note: differences in sums, if any, are due to rounding.
Currency
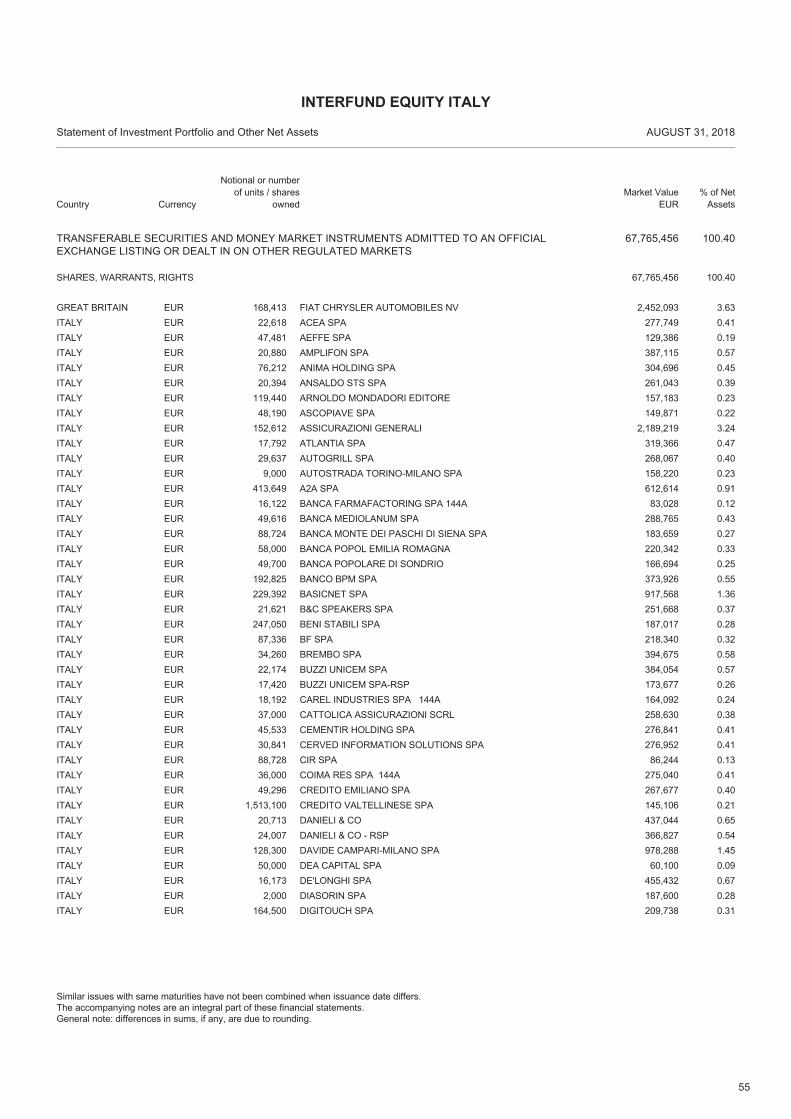
55
TRANSFERABLE SECURITIES AND MONEY MARKET INSTRUMENTS ADMITTED TO AN OFFICIALEXCHANGE LISTING OR DEALT IN ON OTHER REGULATED MARKETS
67,765,456 100.40
EUR 168,413 FIAT CHRYSLER AUTOMOBILES NV 2,452,093 3.63GREAT BRITAIN
SHARES, WARRANTS, RIGHTS 100.4067,765,456
EUR 22,618 ACEA SPA 277,749 0.41ITALYEUR 47,481 AEFFE SPA 129,386 0.19ITALYEUR 20,880 AMPLIFON SPA 387,115 0.57ITALYEUR 76,212 ANIMA HOLDING SPA 304,696 0.45ITALYEUR 20,394 ANSALDO STS SPA 261,043 0.39ITALYEUR 119,440 ARNOLDO MONDADORI EDITORE 157,183 0.23ITALYEUR 48,190 ASCOPIAVE SPA 149,871 0.22ITALYEUR 152,612 ASSICURAZIONI GENERALI 2,189,219 3.24ITALYEUR 17,792 ATLANTIA SPA 319,366 0.47ITALYEUR 29,637 AUTOGRILL SPA 268,067 0.40ITALYEUR 9,000 AUTOSTRADA TORINO-MILANO SPA 158,220 0.23ITALYEUR 413,649 A2A SPA 612,614 0.91ITALYEUR 16,122 BANCA FARMAFACTORING SPA 144A 83,028 0.12ITALYEUR 49,616 BANCA MEDIOLANUM SPA 288,765 0.43ITALYEUR 88,724 BANCA MONTE DEI PASCHI DI SIENA SPA 183,659 0.27ITALYEUR 58,000 BANCA POPOL EMILIA ROMAGNA 220,342 0.33ITALYEUR 49,700 BANCA POPOLARE DI SONDRIO 166,694 0.25ITALYEUR 192,825 BANCO BPM SPA 373,926 0.55ITALYEUR 229,392 BASICNET SPA 917,568 1.36ITALYEUR 21,621 B&C SPEAKERS SPA 251,668 0.37ITALYEUR 247,050 BENI STABILI SPA 187,017 0.28ITALYEUR 87,336 BF SPA 218,340 0.32ITALYEUR 34,260 BREMBO SPA 394,675 0.58ITALYEUR 22,174 BUZZI UNICEM SPA 384,054 0.57ITALYEUR 17,420 BUZZI UNICEM SPA-RSP 173,677 0.26ITALYEUR 18,192 CAREL INDUSTRIES SPA 144A 164,092 0.24ITALYEUR 37,000 CATTOLICA ASSICURAZIONI SCRL 258,630 0.38ITALYEUR 45,533 CEMENTIR HOLDING SPA 276,841 0.41ITALYEUR 30,841 CERVED INFORMATION SOLUTIONS SPA 276,952 0.41ITALYEUR 88,728 CIR SPA 86,244 0.13ITALYEUR 36,000 COIMA RES SPA 144A 275,040 0.41ITALYEUR 49,296 CREDITO EMILIANO SPA 267,677 0.40ITALYEUR 1,513,100 CREDITO VALTELLINESE SPA 145,106 0.21ITALYEUR 20,713 DANIELI & CO 437,044 0.65ITALYEUR 24,007 DANIELI & CO - RSP 366,827 0.54ITALYEUR 128,300 DAVIDE CAMPARI-MILANO SPA 978,288 1.45ITALYEUR 50,000 DEA CAPITAL SPA 60,100 0.09ITALYEUR 16,173 DE'LONGHI SPA 455,432 0.67ITALYEUR 2,000 DIASORIN SPA 187,600 0.28ITALYEUR 164,500 DIGITOUCH SPA 209,738 0.31ITALY
Country
Statement of Investment Portfolio and Other Net Assets AUGUST 31, 2018
Notional or number of units / shares
ownedMarket Value
EUR% of Net
Assets
INTERFUND EQUITY ITALY
Similar issues with same maturities have not been combined when issuance date differs.The accompanying notes are an integral part of these financial statements.General note: differences in sums, if any, are due to rounding.
Currency
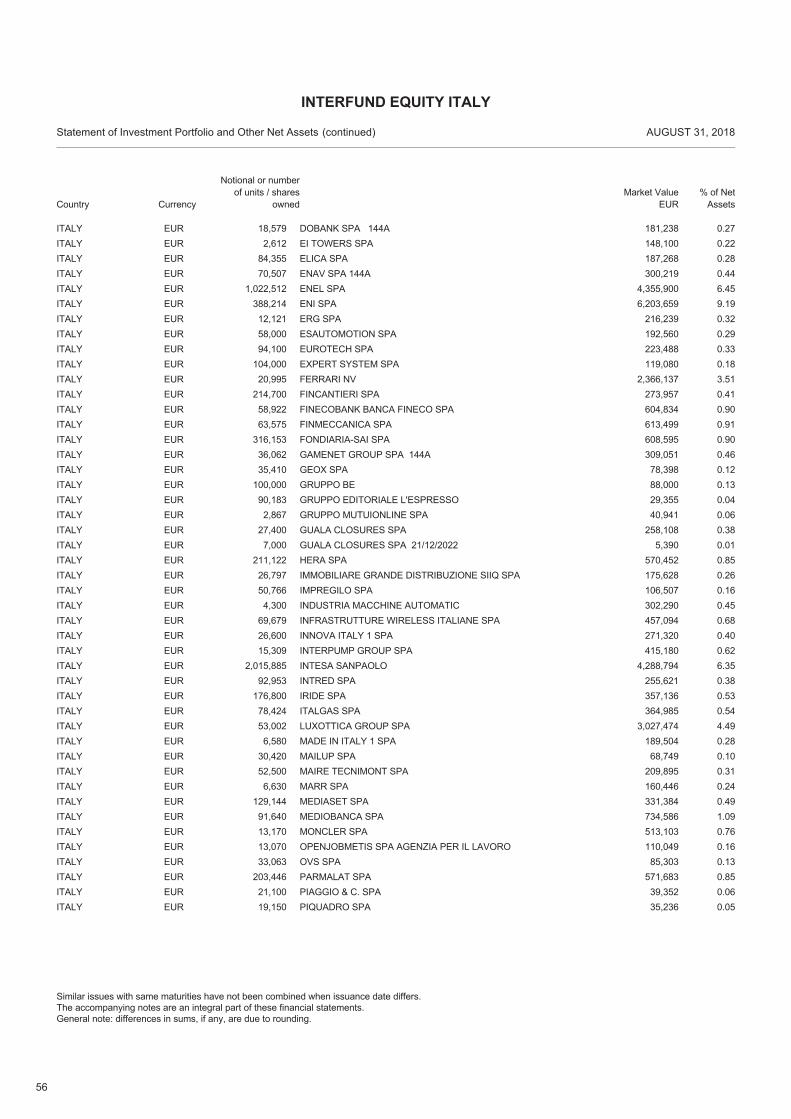
56
EUR 18,579 DOBANK SPA 144A 181,238 0.27ITALYEUR 2,612 EI TOWERS SPA 148,100 0.22ITALYEUR 84,355 ELICA SPA 187,268 0.28ITALYEUR 70,507 ENAV SPA 144A 300,219 0.44ITALYEUR 1,022,512 ENEL SPA 4,355,900 6.45ITALYEUR 388,214 ENI SPA 6,203,659 9.19ITALYEUR 12,121 ERG SPA 216,239 0.32ITALYEUR 58,000 ESAUTOMOTION SPA 192,560 0.29ITALYEUR 94,100 EUROTECH SPA 223,488 0.33ITALYEUR 104,000 EXPERT SYSTEM SPA 119,080 0.18ITALYEUR 20,995 FERRARI NV 2,366,137 3.51ITALYEUR 214,700 FINCANTIERI SPA 273,957 0.41ITALYEUR 58,922 FINECOBANK BANCA FINECO SPA 604,834 0.90ITALYEUR 63,575 FINMECCANICA SPA 613,499 0.91ITALYEUR 316,153 FONDIARIA-SAI SPA 608,595 0.90ITALYEUR 36,062 GAMENET GROUP SPA 144A 309,051 0.46ITALYEUR 35,410 GEOX SPA 78,398 0.12ITALYEUR 100,000 GRUPPO BE 88,000 0.13ITALYEUR 90,183 GRUPPO EDITORIALE L'ESPRESSO 29,355 0.04ITALYEUR 2,867 GRUPPO MUTUIONLINE SPA 40,941 0.06ITALYEUR 27,400 GUALA CLOSURES SPA 258,108 0.38ITALYEUR 7,000 GUALA CLOSURES SPA 21/12/2022 5,390 0.01ITALYEUR 211,122 HERA SPA 570,452 0.85ITALYEUR 26,797 IMMOBILIARE GRANDE DISTRIBUZIONE SIIQ SPA 175,628 0.26ITALYEUR 50,766 IMPREGILO SPA 106,507 0.16ITALYEUR 4,300 INDUSTRIA MACCHINE AUTOMATIC 302,290 0.45ITALYEUR 69,679 INFRASTRUTTURE WIRELESS ITALIANE SPA 457,094 0.68ITALYEUR 26,600 INNOVA ITALY 1 SPA 271,320 0.40ITALYEUR 15,309 INTERPUMP GROUP SPA 415,180 0.62ITALYEUR 2,015,885 INTESA SANPAOLO 4,288,794 6.35ITALYEUR 92,953 INTRED SPA 255,621 0.38ITALYEUR 176,800 IRIDE SPA 357,136 0.53ITALYEUR 78,424 ITALGAS SPA 364,985 0.54ITALYEUR 53,002 LUXOTTICA GROUP SPA 3,027,474 4.49ITALYEUR 6,580 MADE IN ITALY 1 SPA 189,504 0.28ITALYEUR 30,420 MAILUP SPA 68,749 0.10ITALYEUR 52,500 MAIRE TECNIMONT SPA 209,895 0.31ITALYEUR 6,630 MARR SPA 160,446 0.24ITALYEUR 129,144 MEDIASET SPA 331,384 0.49ITALYEUR 91,640 MEDIOBANCA SPA 734,586 1.09ITALYEUR 13,170 MONCLER SPA 513,103 0.76ITALYEUR 13,070 OPENJOBMETIS SPA AGENZIA PER IL LAVORO 110,049 0.16ITALYEUR 33,063 OVS SPA 85,303 0.13ITALYEUR 203,446 PARMALAT SPA 571,683 0.85ITALYEUR 21,100 PIAGGIO & C. SPA 39,352 0.06ITALYEUR 19,150 PIQUADRO SPA 35,236 0.05ITALY
Country
Statement of Investment Portfolio and Other Net Assets AUGUST 31, 2018
Notional or number of units / shares
ownedMarket Value
EUR% of Net
Assets
INTERFUND EQUITY ITALY
(continued)
Similar issues with same maturities have not been combined when issuance date differs.The accompanying notes are an integral part of these financial statements.General note: differences in sums, if any, are due to rounding.
Currency
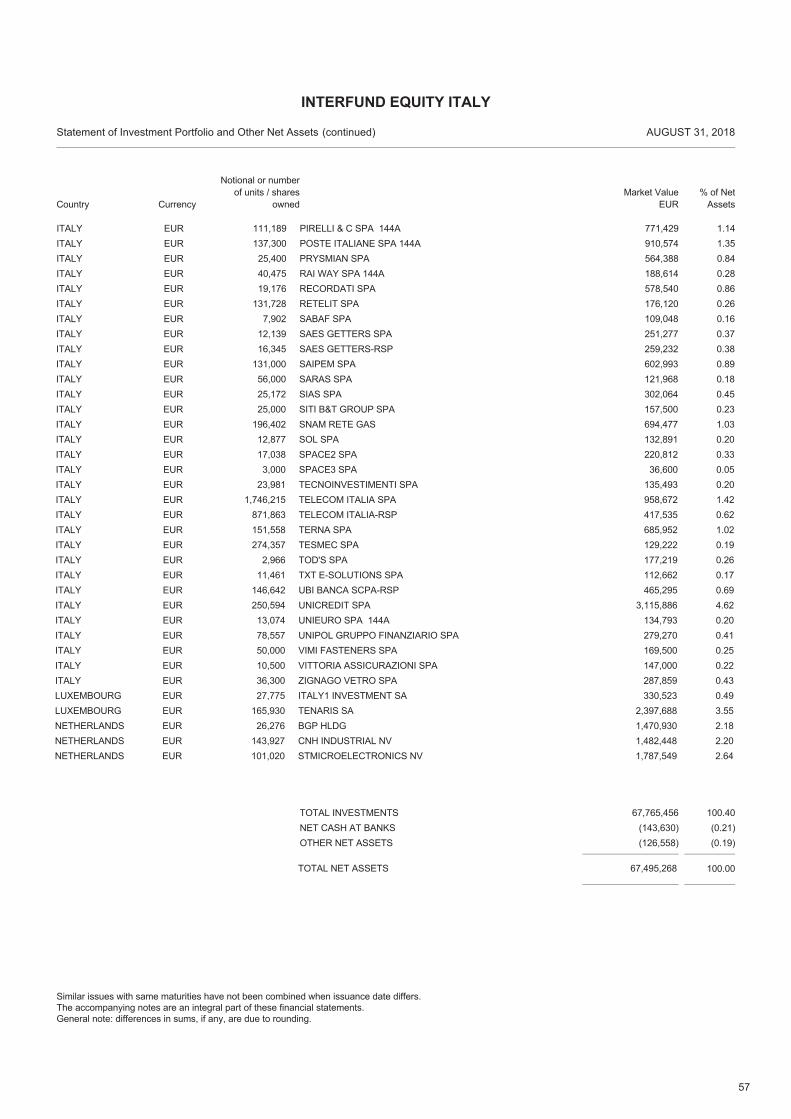
57
EUR 111,189 PIRELLI & C SPA 144A 771,429 1.14ITALYEUR 137,300 POSTE ITALIANE SPA 144A 910,574 1.35ITALYEUR 25,400 PRYSMIAN SPA 564,388 0.84ITALYEUR 40,475 RAI WAY SPA 144A 188,614 0.28ITALYEUR 19,176 RECORDATI SPA 578,540 0.86ITALYEUR 131,728 RETELIT SPA 176,120 0.26ITALYEUR 7,902 SABAF SPA 109,048 0.16ITALYEUR 12,139 SAES GETTERS SPA 251,277 0.37ITALYEUR 16,345 SAES GETTERS-RSP 259,232 0.38ITALYEUR 131,000 SAIPEM SPA 602,993 0.89ITALYEUR 56,000 SARAS SPA 121,968 0.18ITALYEUR 25,172 SIAS SPA 302,064 0.45ITALYEUR 25,000 SITI B&T GROUP SPA 157,500 0.23ITALYEUR 196,402 SNAM RETE GAS 694,477 1.03ITALYEUR 12,877 SOL SPA 132,891 0.20ITALYEUR 17,038 SPACE2 SPA 220,812 0.33ITALYEUR 3,000 SPACE3 SPA 36,600 0.05ITALYEUR 23,981 TECNOINVESTIMENTI SPA 135,493 0.20ITALYEUR 1,746,215 TELECOM ITALIA SPA 958,672 1.42ITALYEUR 871,863 TELECOM ITALIA-RSP 417,535 0.62ITALYEUR 151,558 TERNA SPA 685,952 1.02ITALYEUR 274,357 TESMEC SPA 129,222 0.19ITALYEUR 2,966 TOD'S SPA 177,219 0.26ITALYEUR 11,461 TXT E-SOLUTIONS SPA 112,662 0.17ITALYEUR 146,642 UBI BANCA SCPA-RSP 465,295 0.69ITALYEUR 250,594 UNICREDIT SPA 3,115,886 4.62ITALYEUR 13,074 UNIEURO SPA 144A 134,793 0.20ITALYEUR 78,557 UNIPOL GRUPPO FINANZIARIO SPA 279,270 0.41ITALYEUR 50,000 VIMI FASTENERS SPA 169,500 0.25ITALYEUR 10,500 VITTORIA ASSICURAZIONI SPA 147,000 0.22ITALYEUR 36,300 ZIGNAGO VETRO SPA 287,859 0.43ITALYEUR 27,775 ITALY1 INVESTMENT SA 330,523 0.49LUXEMBOURGEUR 165,930 TENARIS SA 2,397,688 3.55LUXEMBOURGEUR 26,276 BGP HLDG 1,470,930 2.18NETHERLANDSEUR 143,927 CNH INDUSTRIAL NV 1,482,448 2.20NETHERLANDSEUR 101,020 STMICROELECTRONICS NV 1,787,549 2.64NETHERLANDS
TOTAL NET ASSETS 67,495,268 100.00
TOTAL INVESTMENTS 67,765,456 100.40NET CASH AT BANKS (143,630) (0.21)OTHER NET ASSETS (126,558) (0.19)
Country
Statement of Investment Portfolio and Other Net Assets AUGUST 31, 2018
Notional or number of units / shares
ownedMarket Value
EUR% of Net
Assets
INTERFUND EQUITY ITALY
(continued)
Similar issues with same maturities have not been combined when issuance date differs.The accompanying notes are an integral part of these financial statements.General note: differences in sums, if any, are due to rounding.
Currency
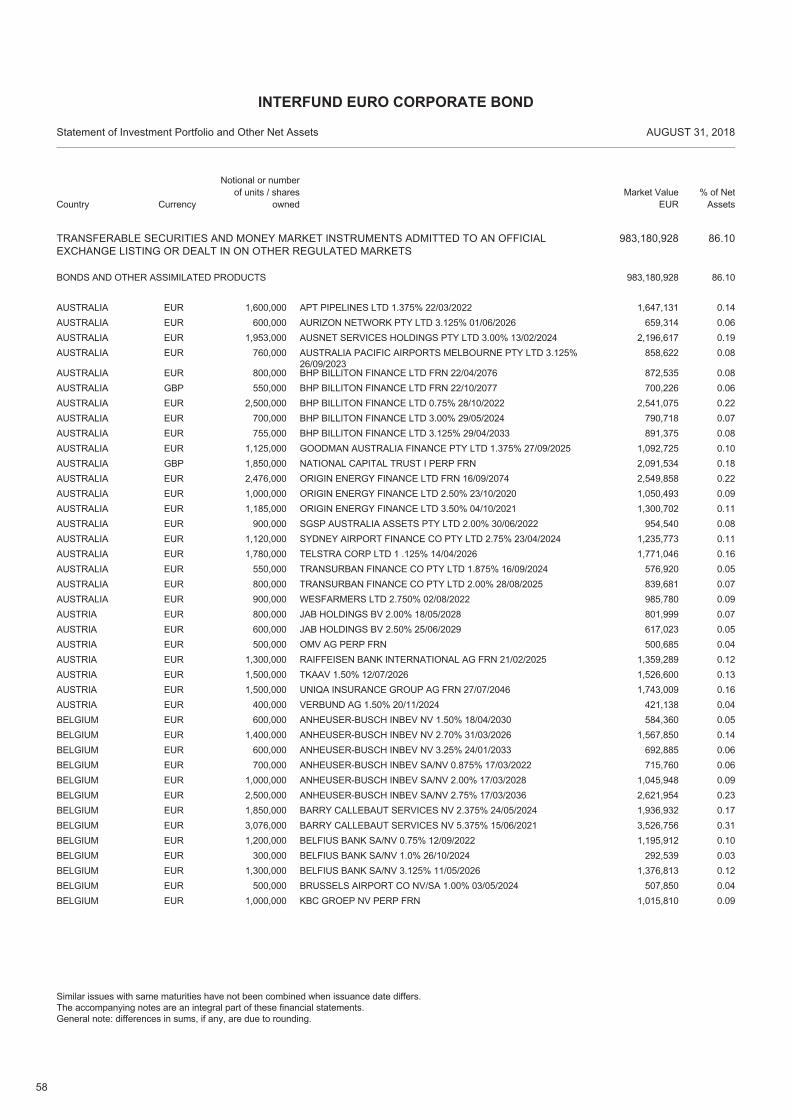
58
TRANSFERABLE SECURITIES AND MONEY MARKET INSTRUMENTS ADMITTED TO AN OFFICIALEXCHANGE LISTING OR DEALT IN ON OTHER REGULATED MARKETS
983,180,928 86.10
EUR 1,600,000 APT PIPELINES LTD 1.375% 22/03/2022 1,647,131 0.14AUSTRALIA
BONDS AND OTHER ASSIMILATED PRODUCTS 86.10983,180,928
EUR 600,000 AURIZON NETWORK PTY LTD 3.125% 01/06/2026 659,314 0.06AUSTRALIAEUR 1,953,000 AUSNET SERVICES HOLDINGS PTY LTD 3.00% 13/02/2024 2,196,617 0.19AUSTRALIAEUR 760,000 AUSTRALIA PACIFIC AIRPORTS MELBOURNE PTY LTD 3.125%
26/09/2023858,622 0.08AUSTRALIA
EUR 800,000 BHP BILLITON FINANCE LTD FRN 22/04/2076 872,535 0.08AUSTRALIAGBP 550,000 BHP BILLITON FINANCE LTD FRN 22/10/2077 700,226 0.06AUSTRALIAEUR 2,500,000 BHP BILLITON FINANCE LTD 0.75% 28/10/2022 2,541,075 0.22AUSTRALIAEUR 700,000 BHP BILLITON FINANCE LTD 3.00% 29/05/2024 790,718 0.07AUSTRALIAEUR 755,000 BHP BILLITON FINANCE LTD 3.125% 29/04/2033 891,375 0.08AUSTRALIAEUR 1,125,000 GOODMAN AUSTRALIA FINANCE PTY LTD 1.375% 27/09/2025 1,092,725 0.10AUSTRALIAGBP 1,850,000 NATIONAL CAPITAL TRUST I PERP FRN 2,091,534 0.18AUSTRALIAEUR 2,476,000 ORIGIN ENERGY FINANCE LTD FRN 16/09/2074 2,549,858 0.22AUSTRALIAEUR 1,000,000 ORIGIN ENERGY FINANCE LTD 2.50% 23/10/2020 1,050,493 0.09AUSTRALIAEUR 1,185,000 ORIGIN ENERGY FINANCE LTD 3.50% 04/10/2021 1,300,702 0.11AUSTRALIAEUR 900,000 SGSP AUSTRALIA ASSETS PTY LTD 2.00% 30/06/2022 954,540 0.08AUSTRALIAEUR 1,120,000 SYDNEY AIRPORT FINANCE CO PTY LTD 2.75% 23/04/2024 1,235,773 0.11AUSTRALIAEUR 1,780,000 TELSTRA CORP LTD 1 .125% 14/04/2026 1,771,046 0.16AUSTRALIAEUR 550,000 TRANSURBAN FINANCE CO PTY LTD 1.875% 16/09/2024 576,920 0.05AUSTRALIAEUR 800,000 TRANSURBAN FINANCE CO PTY LTD 2.00% 28/08/2025 839,681 0.07AUSTRALIAEUR 900,000 WESFARMERS LTD 2.750% 02/08/2022 985,780 0.09AUSTRALIAEUR 800,000 JAB HOLDINGS BV 2.00% 18/05/2028 801,999 0.07AUSTRIAEUR 600,000 JAB HOLDINGS BV 2.50% 25/06/2029 617,023 0.05AUSTRIAEUR 500,000 OMV AG PERP FRN 500,685 0.04AUSTRIAEUR 1,300,000 RAIFFEISEN BANK INTERNATIONAL AG FRN 21/02/2025 1,359,289 0.12AUSTRIAEUR 1,500,000 TKAAV 1.50% 12/07/2026 1,526,600 0.13AUSTRIAEUR 1,500,000 UNIQA INSURANCE GROUP AG FRN 27/07/2046 1,743,009 0.16AUSTRIAEUR 400,000 VERBUND AG 1.50% 20/11/2024 421,138 0.04AUSTRIAEUR 600,000 ANHEUSER-BUSCH INBEV NV 1.50% 18/04/2030 584,360 0.05BELGIUMEUR 1,400,000 ANHEUSER-BUSCH INBEV NV 2.70% 31/03/2026 1,567,850 0.14BELGIUMEUR 600,000 ANHEUSER-BUSCH INBEV NV 3.25% 24/01/2033 692,885 0.06BELGIUMEUR 700,000 ANHEUSER-BUSCH INBEV SA/NV 0.875% 17/03/2022 715,760 0.06BELGIUMEUR 1,000,000 ANHEUSER-BUSCH INBEV SA/NV 2.00% 17/03/2028 1,045,948 0.09BELGIUMEUR 2,500,000 ANHEUSER-BUSCH INBEV SA/NV 2.75% 17/03/2036 2,621,954 0.23BELGIUMEUR 1,850,000 BARRY CALLEBAUT SERVICES NV 2.375% 24/05/2024 1,936,932 0.17BELGIUMEUR 3,076,000 BARRY CALLEBAUT SERVICES NV 5.375% 15/06/2021 3,526,756 0.31BELGIUMEUR 1,200,000 BELFIUS BANK SA/NV 0.75% 12/09/2022 1,195,912 0.10BELGIUMEUR 300,000 BELFIUS BANK SA/NV 1.0% 26/10/2024 292,539 0.03BELGIUMEUR 1,300,000 BELFIUS BANK SA/NV 3.125% 11/05/2026 1,376,813 0.12BELGIUMEUR 500,000 BRUSSELS AIRPORT CO NV/SA 1.00% 03/05/2024 507,850 0.04BELGIUMEUR 1,000,000 KBC GROEP NV PERP FRN 1,015,810 0.09BELGIUM
Country
Statement of Investment Portfolio and Other Net Assets AUGUST 31, 2018
Notional or number of units / shares
ownedMarket Value
EUR% of Net
Assets
INTERFUND EURO CORPORATE BOND
Similar issues with same maturities have not been combined when issuance date differs.The accompanying notes are an integral part of these financial statements.General note: differences in sums, if any, are due to rounding.
Currency
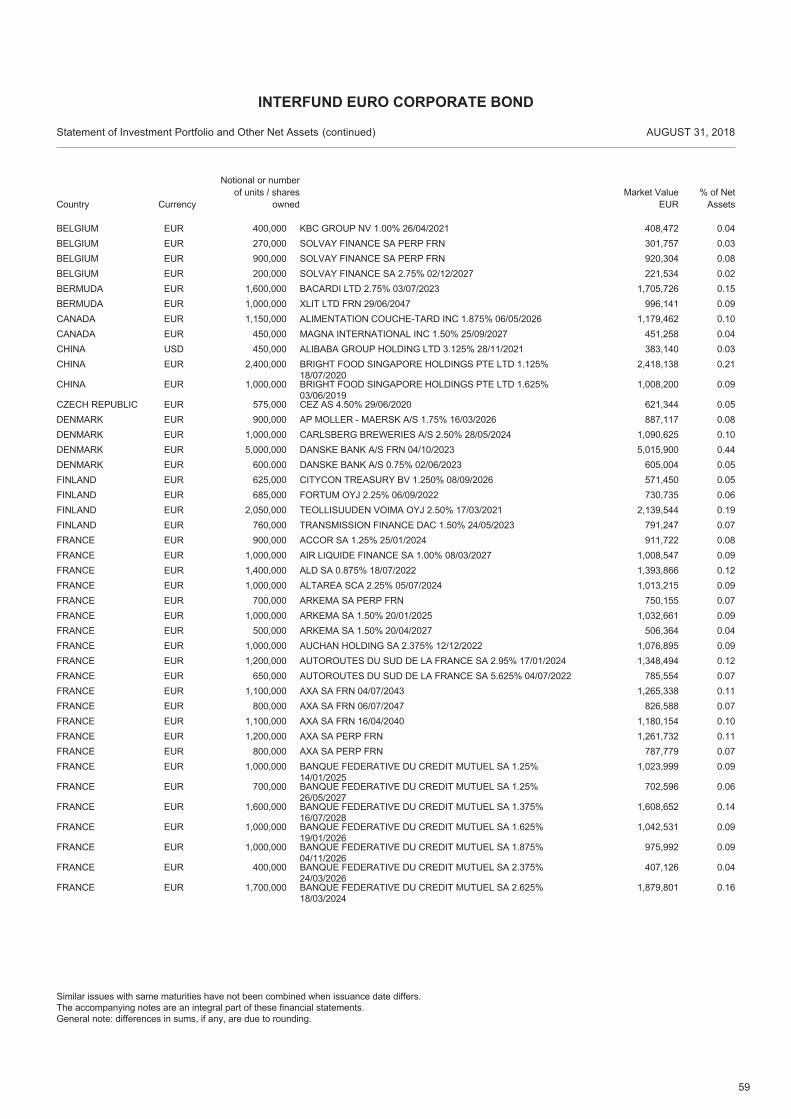
59
EUR 400,000 KBC GROUP NV 1.00% 26/04/2021 408,472 0.04BELGIUMEUR 270,000 SOLVAY FINANCE SA PERP FRN 301,757 0.03BELGIUMEUR 900,000 SOLVAY FINANCE SA PERP FRN 920,304 0.08BELGIUMEUR 200,000 SOLVAY FINANCE SA 2.75% 02/12/2027 221,534 0.02BELGIUMEUR 1,600,000 BACARDI LTD 2.75% 03/07/2023 1,705,726 0.15BERMUDAEUR 1,000,000 XLIT LTD FRN 29/06/2047 996,141 0.09BERMUDAEUR 1,150,000 ALIMENTATION COUCHE-TARD INC 1.875% 06/05/2026 1,179,462 0.10CANADAEUR 450,000 MAGNA INTERNATIONAL INC 1.50% 25/09/2027 451,258 0.04CANADAUSD 450,000 ALIBABA GROUP HOLDING LTD 3.125% 28/11/2021 383,140 0.03CHINAEUR 2,400,000 BRIGHT FOOD SINGAPORE HOLDINGS PTE LTD 1.125%
18/07/20202,418,138 0.21CHINA
EUR 1,000,000 BRIGHT FOOD SINGAPORE HOLDINGS PTE LTD 1.625%03/06/2019
1,008,200 0.09CHINA
EUR 575,000 CEZ AS 4.50% 29/06/2020 621,344 0.05CZECH REPUBLICEUR 900,000 AP MOLLER - MAERSK A/S 1.75% 16/03/2026 887,117 0.08DENMARKEUR 1,000,000 CARLSBERG BREWERIES A/S 2.50% 28/05/2024 1,090,625 0.10DENMARKEUR 5,000,000 DANSKE BANK A/S FRN 04/10/2023 5,015,900 0.44DENMARKEUR 600,000 DANSKE BANK A/S 0.75% 02/06/2023 605,004 0.05DENMARKEUR 625,000 CITYCON TREASURY BV 1.250% 08/09/2026 571,450 0.05FINLANDEUR 685,000 FORTUM OYJ 2.25% 06/09/2022 730,735 0.06FINLANDEUR 2,050,000 TEOLLISUUDEN VOIMA OYJ 2.50% 17/03/2021 2,139,544 0.19FINLANDEUR 760,000 TRANSMISSION FINANCE DAC 1.50% 24/05/2023 791,247 0.07FINLANDEUR 900,000 ACCOR SA 1.25% 25/01/2024 911,722 0.08FRANCEEUR 1,000,000 AIR LIQUIDE FINANCE SA 1.00% 08/03/2027 1,008,547 0.09FRANCEEUR 1,400,000 ALD SA 0.875% 18/07/2022 1,393,866 0.12FRANCEEUR 1,000,000 ALTAREA SCA 2.25% 05/07/2024 1,013,215 0.09FRANCEEUR 700,000 ARKEMA SA PERP FRN 750,155 0.07FRANCEEUR 1,000,000 ARKEMA SA 1.50% 20/01/2025 1,032,661 0.09FRANCEEUR 500,000 ARKEMA SA 1.50% 20/04/2027 506,364 0.04FRANCEEUR 1,000,000 AUCHAN HOLDING SA 2.375% 12/12/2022 1,076,895 0.09FRANCEEUR 1,200,000 AUTOROUTES DU SUD DE LA FRANCE SA 2.95% 17/01/2024 1,348,494 0.12FRANCEEUR 650,000 AUTOROUTES DU SUD DE LA FRANCE SA 5.625% 04/07/2022 785,554 0.07FRANCEEUR 1,100,000 AXA SA FRN 04/07/2043 1,265,338 0.11FRANCEEUR 800,000 AXA SA FRN 06/07/2047 826,588 0.07FRANCEEUR 1,100,000 AXA SA FRN 16/04/2040 1,180,154 0.10FRANCEEUR 1,200,000 AXA SA PERP FRN 1,261,732 0.11FRANCEEUR 800,000 AXA SA PERP FRN 787,779 0.07FRANCEEUR 1,000,000 BANQUE FEDERATIVE DU CREDIT MUTUEL SA 1.25%
14/01/20251,023,999 0.09FRANCE
EUR 700,000 BANQUE FEDERATIVE DU CREDIT MUTUEL SA 1.25%26/05/2027
702,596 0.06FRANCE
EUR 1,600,000 BANQUE FEDERATIVE DU CREDIT MUTUEL SA 1.375%16/07/2028
1,608,652 0.14FRANCE
EUR 1,000,000 BANQUE FEDERATIVE DU CREDIT MUTUEL SA 1.625%19/01/2026
1,042,531 0.09FRANCE
EUR 1,000,000 BANQUE FEDERATIVE DU CREDIT MUTUEL SA 1.875%04/11/2026
975,992 0.09FRANCE
EUR 400,000 BANQUE FEDERATIVE DU CREDIT MUTUEL SA 2.375%24/03/2026
407,126 0.04FRANCE
EUR 1,700,000 BANQUE FEDERATIVE DU CREDIT MUTUEL SA 2.625%18/03/2024
1,879,801 0.16FRANCE
Country
Statement of Investment Portfolio and Other Net Assets AUGUST 31, 2018
Notional or number of units / shares
ownedMarket Value
EUR% of Net
Assets
INTERFUND EURO CORPORATE BOND
(continued)
Similar issues with same maturities have not been combined when issuance date differs.The accompanying notes are an integral part of these financial statements.General note: differences in sums, if any, are due to rounding.
Currency
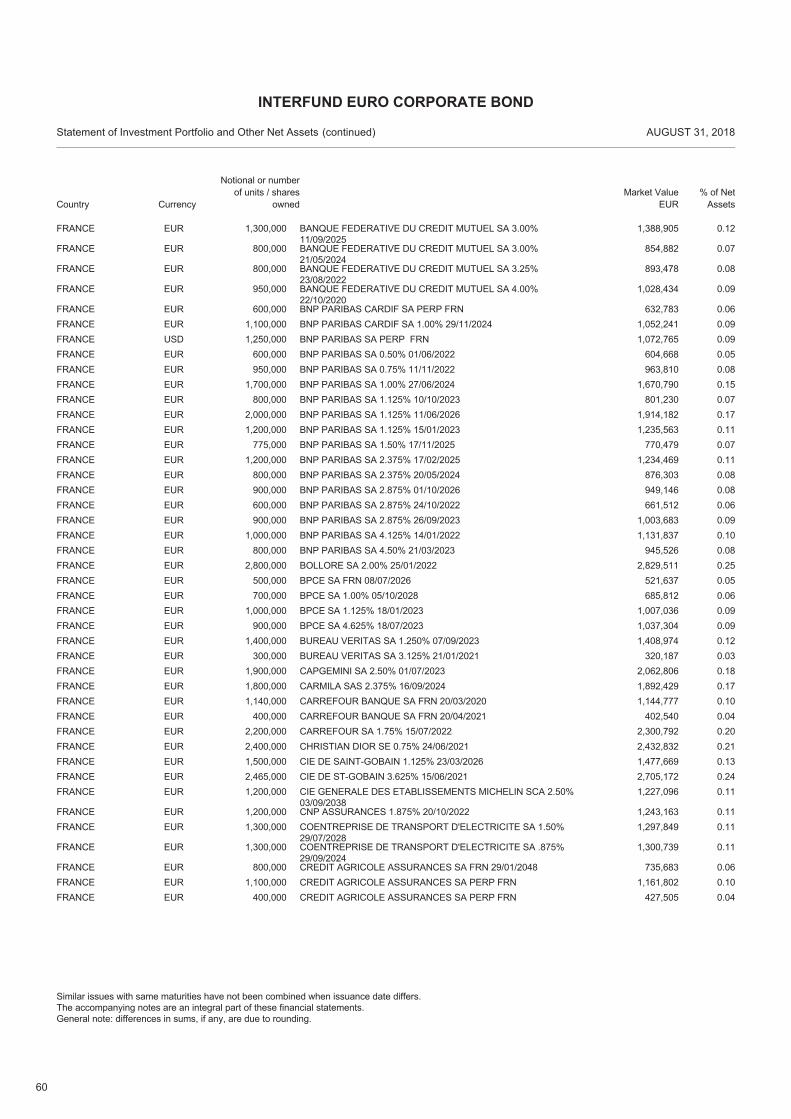
60
EUR 1,300,000 BANQUE FEDERATIVE DU CREDIT MUTUEL SA 3.00%11/09/2025
1,388,905 0.12FRANCE
EUR 800,000 BANQUE FEDERATIVE DU CREDIT MUTUEL SA 3.00%21/05/2024
854,882 0.07FRANCE
EUR 800,000 BANQUE FEDERATIVE DU CREDIT MUTUEL SA 3.25%23/08/2022
893,478 0.08FRANCE
EUR 950,000 BANQUE FEDERATIVE DU CREDIT MUTUEL SA 4.00%22/10/2020
1,028,434 0.09FRANCE
EUR 600,000 BNP PARIBAS CARDIF SA PERP FRN 632,783 0.06FRANCEEUR 1,100,000 BNP PARIBAS CARDIF SA 1.00% 29/11/2024 1,052,241 0.09FRANCEUSD 1,250,000 BNP PARIBAS SA PERP FRN 1,072,765 0.09FRANCEEUR 600,000 BNP PARIBAS SA 0.50% 01/06/2022 604,668 0.05FRANCEEUR 950,000 BNP PARIBAS SA 0.75% 11/11/2022 963,810 0.08FRANCEEUR 1,700,000 BNP PARIBAS SA 1.00% 27/06/2024 1,670,790 0.15FRANCEEUR 800,000 BNP PARIBAS SA 1.125% 10/10/2023 801,230 0.07FRANCEEUR 2,000,000 BNP PARIBAS SA 1.125% 11/06/2026 1,914,182 0.17FRANCEEUR 1,200,000 BNP PARIBAS SA 1.125% 15/01/2023 1,235,563 0.11FRANCEEUR 775,000 BNP PARIBAS SA 1.50% 17/11/2025 770,479 0.07FRANCEEUR 1,200,000 BNP PARIBAS SA 2.375% 17/02/2025 1,234,469 0.11FRANCEEUR 800,000 BNP PARIBAS SA 2.375% 20/05/2024 876,303 0.08FRANCEEUR 900,000 BNP PARIBAS SA 2.875% 01/10/2026 949,146 0.08FRANCEEUR 600,000 BNP PARIBAS SA 2.875% 24/10/2022 661,512 0.06FRANCEEUR 900,000 BNP PARIBAS SA 2.875% 26/09/2023 1,003,683 0.09FRANCEEUR 1,000,000 BNP PARIBAS SA 4.125% 14/01/2022 1,131,837 0.10FRANCEEUR 800,000 BNP PARIBAS SA 4.50% 21/03/2023 945,526 0.08FRANCEEUR 2,800,000 BOLLORE SA 2.00% 25/01/2022 2,829,511 0.25FRANCEEUR 500,000 BPCE SA FRN 08/07/2026 521,637 0.05FRANCEEUR 700,000 BPCE SA 1.00% 05/10/2028 685,812 0.06FRANCEEUR 1,000,000 BPCE SA 1.125% 18/01/2023 1,007,036 0.09FRANCEEUR 900,000 BPCE SA 4.625% 18/07/2023 1,037,304 0.09FRANCEEUR 1,400,000 BUREAU VERITAS SA 1.250% 07/09/2023 1,408,974 0.12FRANCEEUR 300,000 BUREAU VERITAS SA 3.125% 21/01/2021 320,187 0.03FRANCEEUR 1,900,000 CAPGEMINI SA 2.50% 01/07/2023 2,062,806 0.18FRANCEEUR 1,800,000 CARMILA SAS 2.375% 16/09/2024 1,892,429 0.17FRANCEEUR 1,140,000 CARREFOUR BANQUE SA FRN 20/03/2020 1,144,777 0.10FRANCEEUR 400,000 CARREFOUR BANQUE SA FRN 20/04/2021 402,540 0.04FRANCEEUR 2,200,000 CARREFOUR SA 1.75% 15/07/2022 2,300,792 0.20FRANCEEUR 2,400,000 CHRISTIAN DIOR SE 0.75% 24/06/2021 2,432,832 0.21FRANCEEUR 1,500,000 CIE DE SAINT-GOBAIN 1.125% 23/03/2026 1,477,669 0.13FRANCEEUR 2,465,000 CIE DE ST-GOBAIN 3.625% 15/06/2021 2,705,172 0.24FRANCEEUR 1,200,000 CIE GENERALE DES ETABLISSEMENTS MICHELIN SCA 2.50%
03/09/20381,227,096 0.11FRANCE
EUR 1,200,000 CNP ASSURANCES 1.875% 20/10/2022 1,243,163 0.11FRANCEEUR 1,300,000 COENTREPRISE DE TRANSPORT D'ELECTRICITE SA 1.50%
29/07/20281,297,849 0.11FRANCE
EUR 1,300,000 COENTREPRISE DE TRANSPORT D'ELECTRICITE SA .875%29/09/2024
1,300,739 0.11FRANCE
EUR 800,000 CREDIT AGRICOLE ASSURANCES SA FRN 29/01/2048 735,683 0.06FRANCEEUR 1,100,000 CREDIT AGRICOLE ASSURANCES SA PERP FRN 1,161,802 0.10FRANCEEUR 400,000 CREDIT AGRICOLE ASSURANCES SA PERP FRN 427,505 0.04FRANCE
Country
Statement of Investment Portfolio and Other Net Assets AUGUST 31, 2018
Notional or number of units / shares
ownedMarket Value
EUR% of Net
Assets
INTERFUND EURO CORPORATE BOND
(continued)
Similar issues with same maturities have not been combined when issuance date differs.The accompanying notes are an integral part of these financial statements.General note: differences in sums, if any, are due to rounding.
Currency
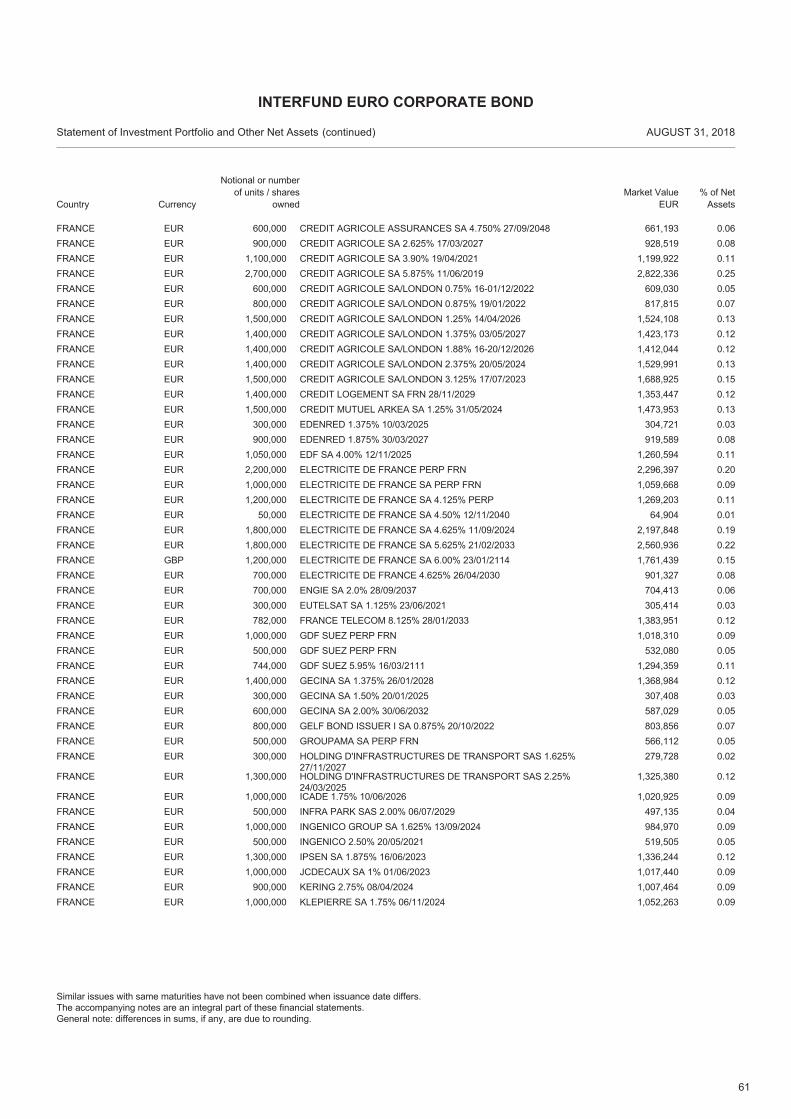
61
EUR 600,000 CREDIT AGRICOLE ASSURANCES SA 4.750% 27/09/2048 661,193 0.06FRANCEEUR 900,000 CREDIT AGRICOLE SA 2.625% 17/03/2027 928,519 0.08FRANCEEUR 1,100,000 CREDIT AGRICOLE SA 3.90% 19/04/2021 1,199,922 0.11FRANCEEUR 2,700,000 CREDIT AGRICOLE SA 5.875% 11/06/2019 2,822,336 0.25FRANCEEUR 600,000 CREDIT AGRICOLE SA/LONDON 0.75% 16-01/12/2022 609,030 0.05FRANCEEUR 800,000 CREDIT AGRICOLE SA/LONDON 0.875% 19/01/2022 817,815 0.07FRANCEEUR 1,500,000 CREDIT AGRICOLE SA/LONDON 1.25% 14/04/2026 1,524,108 0.13FRANCEEUR 1,400,000 CREDIT AGRICOLE SA/LONDON 1.375% 03/05/2027 1,423,173 0.12FRANCEEUR 1,400,000 CREDIT AGRICOLE SA/LONDON 1.88% 16-20/12/2026 1,412,044 0.12FRANCEEUR 1,400,000 CREDIT AGRICOLE SA/LONDON 2.375% 20/05/2024 1,529,991 0.13FRANCEEUR 1,500,000 CREDIT AGRICOLE SA/LONDON 3.125% 17/07/2023 1,688,925 0.15FRANCEEUR 1,400,000 CREDIT LOGEMENT SA FRN 28/11/2029 1,353,447 0.12FRANCEEUR 1,500,000 CREDIT MUTUEL ARKEA SA 1.25% 31/05/2024 1,473,953 0.13FRANCEEUR 300,000 EDENRED 1.375% 10/03/2025 304,721 0.03FRANCEEUR 900,000 EDENRED 1.875% 30/03/2027 919,589 0.08FRANCEEUR 1,050,000 EDF SA 4.00% 12/11/2025 1,260,594 0.11FRANCEEUR 2,200,000 ELECTRICITE DE FRANCE PERP FRN 2,296,397 0.20FRANCEEUR 1,000,000 ELECTRICITE DE FRANCE SA PERP FRN 1,059,668 0.09FRANCEEUR 1,200,000 ELECTRICITE DE FRANCE SA 4.125% PERP 1,269,203 0.11FRANCEEUR 50,000 ELECTRICITE DE FRANCE SA 4.50% 12/11/2040 64,904 0.01FRANCEEUR 1,800,000 ELECTRICITE DE FRANCE SA 4.625% 11/09/2024 2,197,848 0.19FRANCEEUR 1,800,000 ELECTRICITE DE FRANCE SA 5.625% 21/02/2033 2,560,936 0.22FRANCEGBP 1,200,000 ELECTRICITE DE FRANCE SA 6.00% 23/01/2114 1,761,439 0.15FRANCEEUR 700,000 ELECTRICITE DE FRANCE 4.625% 26/04/2030 901,327 0.08FRANCEEUR 700,000 ENGIE SA 2.0% 28/09/2037 704,413 0.06FRANCEEUR 300,000 EUTELSAT SA 1.125% 23/06/2021 305,414 0.03FRANCEEUR 782,000 FRANCE TELECOM 8.125% 28/01/2033 1,383,951 0.12FRANCEEUR 1,000,000 GDF SUEZ PERP FRN 1,018,310 0.09FRANCEEUR 500,000 GDF SUEZ PERP FRN 532,080 0.05FRANCEEUR 744,000 GDF SUEZ 5.95% 16/03/2111 1,294,359 0.11FRANCEEUR 1,400,000 GECINA SA 1.375% 26/01/2028 1,368,984 0.12FRANCEEUR 300,000 GECINA SA 1.50% 20/01/2025 307,408 0.03FRANCEEUR 600,000 GECINA SA 2.00% 30/06/2032 587,029 0.05FRANCEEUR 800,000 GELF BOND ISSUER I SA 0.875% 20/10/2022 803,856 0.07FRANCEEUR 500,000 GROUPAMA SA PERP FRN 566,112 0.05FRANCEEUR 300,000 HOLDING D'INFRASTRUCTURES DE TRANSPORT SAS 1.625%
27/11/2027279,728 0.02FRANCE
EUR 1,300,000 HOLDING D'INFRASTRUCTURES DE TRANSPORT SAS 2.25%24/03/2025
1,325,380 0.12FRANCE
EUR 1,000,000 ICADE 1.75% 10/06/2026 1,020,925 0.09FRANCEEUR 500,000 INFRA PARK SAS 2.00% 06/07/2029 497,135 0.04FRANCEEUR 1,000,000 INGENICO GROUP SA 1.625% 13/09/2024 984,970 0.09FRANCEEUR 500,000 INGENICO 2.50% 20/05/2021 519,505 0.05FRANCEEUR 1,300,000 IPSEN SA 1.875% 16/06/2023 1,336,244 0.12FRANCEEUR 1,000,000 JCDECAUX SA 1% 01/06/2023 1,017,440 0.09FRANCEEUR 900,000 KERING 2.75% 08/04/2024 1,007,464 0.09FRANCEEUR 1,000,000 KLEPIERRE SA 1.75% 06/11/2024 1,052,263 0.09FRANCE
Country
Statement of Investment Portfolio and Other Net Assets AUGUST 31, 2018
Notional or number of units / shares
ownedMarket Value
EUR% of Net
Assets
INTERFUND EURO CORPORATE BOND
(continued)
Similar issues with same maturities have not been combined when issuance date differs.The accompanying notes are an integral part of these financial statements.General note: differences in sums, if any, are due to rounding.
Currency
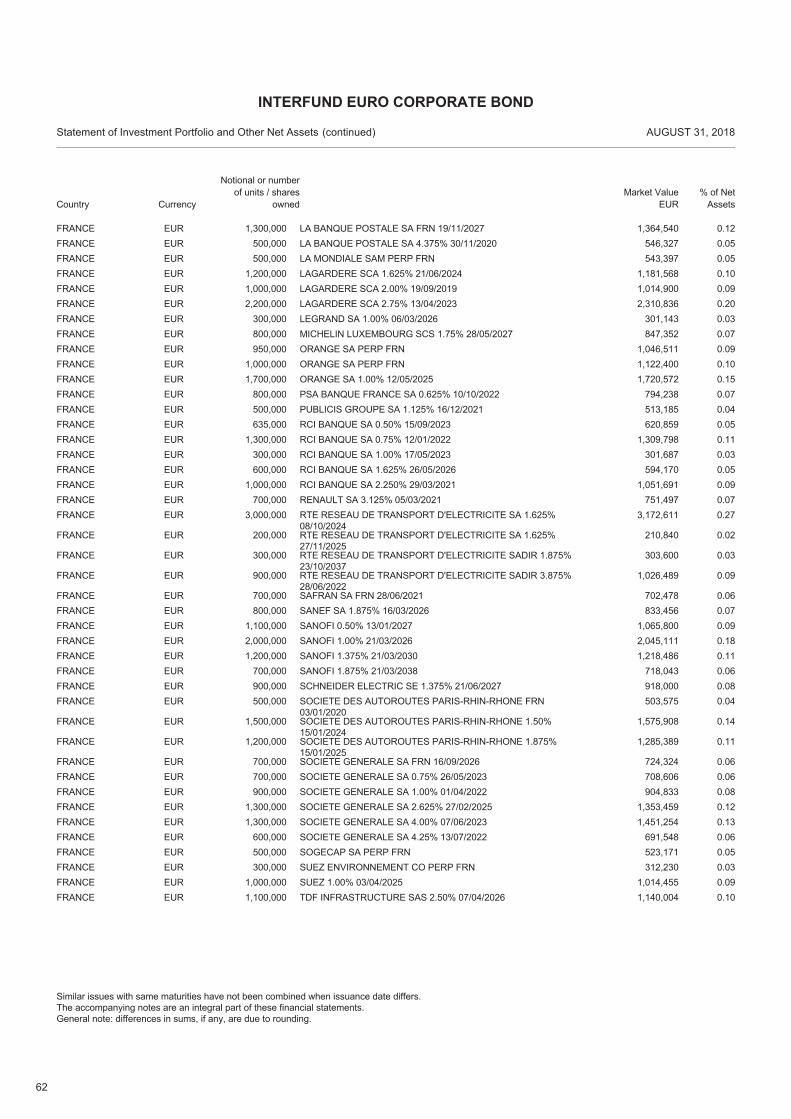
62
EUR 1,300,000 LA BANQUE POSTALE SA FRN 19/11/2027 1,364,540 0.12FRANCEEUR 500,000 LA BANQUE POSTALE SA 4.375% 30/11/2020 546,327 0.05FRANCEEUR 500,000 LA MONDIALE SAM PERP FRN 543,397 0.05FRANCEEUR 1,200,000 LAGARDERE SCA 1.625% 21/06/2024 1,181,568 0.10FRANCEEUR 1,000,000 LAGARDERE SCA 2.00% 19/09/2019 1,014,900 0.09FRANCEEUR 2,200,000 LAGARDERE SCA 2.75% 13/04/2023 2,310,836 0.20FRANCEEUR 300,000 LEGRAND SA 1.00% 06/03/2026 301,143 0.03FRANCEEUR 800,000 MICHELIN LUXEMBOURG SCS 1.75% 28/05/2027 847,352 0.07FRANCEEUR 950,000 ORANGE SA PERP FRN 1,046,511 0.09FRANCEEUR 1,000,000 ORANGE SA PERP FRN 1,122,400 0.10FRANCEEUR 1,700,000 ORANGE SA 1.00% 12/05/2025 1,720,572 0.15FRANCEEUR 800,000 PSA BANQUE FRANCE SA 0.625% 10/10/2022 794,238 0.07FRANCEEUR 500,000 PUBLICIS GROUPE SA 1.125% 16/12/2021 513,185 0.04FRANCEEUR 635,000 RCI BANQUE SA 0.50% 15/09/2023 620,859 0.05FRANCEEUR 1,300,000 RCI BANQUE SA 0.75% 12/01/2022 1,309,798 0.11FRANCEEUR 300,000 RCI BANQUE SA 1.00% 17/05/2023 301,687 0.03FRANCEEUR 600,000 RCI BANQUE SA 1.625% 26/05/2026 594,170 0.05FRANCEEUR 1,000,000 RCI BANQUE SA 2.250% 29/03/2021 1,051,691 0.09FRANCEEUR 700,000 RENAULT SA 3.125% 05/03/2021 751,497 0.07FRANCEEUR 3,000,000 RTE RESEAU DE TRANSPORT D'ELECTRICITE SA 1.625%
08/10/20243,172,611 0.27FRANCE
EUR 200,000 RTE RESEAU DE TRANSPORT D'ELECTRICITE SA 1.625%27/11/2025
210,840 0.02FRANCE
EUR 300,000 RTE RESEAU DE TRANSPORT D'ELECTRICITE SADIR 1.875%23/10/2037
303,600 0.03FRANCE
EUR 900,000 RTE RESEAU DE TRANSPORT D'ELECTRICITE SADIR 3.875%28/06/2022
1,026,489 0.09FRANCE
EUR 700,000 SAFRAN SA FRN 28/06/2021 702,478 0.06FRANCEEUR 800,000 SANEF SA 1.875% 16/03/2026 833,456 0.07FRANCEEUR 1,100,000 SANOFI 0.50% 13/01/2027 1,065,800 0.09FRANCEEUR 2,000,000 SANOFI 1.00% 21/03/2026 2,045,111 0.18FRANCEEUR 1,200,000 SANOFI 1.375% 21/03/2030 1,218,486 0.11FRANCEEUR 700,000 SANOFI 1.875% 21/03/2038 718,043 0.06FRANCEEUR 900,000 SCHNEIDER ELECTRIC SE 1.375% 21/06/2027 918,000 0.08FRANCEEUR 500,000 SOCIETE DES AUTOROUTES PARIS-RHIN-RHONE FRN
03/01/2020503,575 0.04FRANCE
EUR 1,500,000 SOCIETE DES AUTOROUTES PARIS-RHIN-RHONE 1.50%15/01/2024
1,575,908 0.14FRANCE
EUR 1,200,000 SOCIETE DES AUTOROUTES PARIS-RHIN-RHONE 1.875%15/01/2025
1,285,389 0.11FRANCE
EUR 700,000 SOCIETE GENERALE SA FRN 16/09/2026 724,324 0.06FRANCEEUR 700,000 SOCIETE GENERALE SA 0.75% 26/05/2023 708,606 0.06FRANCEEUR 900,000 SOCIETE GENERALE SA 1.00% 01/04/2022 904,833 0.08FRANCEEUR 1,300,000 SOCIETE GENERALE SA 2.625% 27/02/2025 1,353,459 0.12FRANCEEUR 1,300,000 SOCIETE GENERALE SA 4.00% 07/06/2023 1,451,254 0.13FRANCEEUR 600,000 SOCIETE GENERALE SA 4.25% 13/07/2022 691,548 0.06FRANCEEUR 500,000 SOGECAP SA PERP FRN 523,171 0.05FRANCEEUR 300,000 SUEZ ENVIRONNEMENT CO PERP FRN 312,230 0.03FRANCEEUR 1,000,000 SUEZ 1.00% 03/04/2025 1,014,455 0.09FRANCEEUR 1,100,000 TDF INFRASTRUCTURE SAS 2.50% 07/04/2026 1,140,004 0.10FRANCE
Country
Statement of Investment Portfolio and Other Net Assets AUGUST 31, 2018
Notional or number of units / shares
ownedMarket Value
EUR% of Net
Assets
INTERFUND EURO CORPORATE BOND
(continued)
Similar issues with same maturities have not been combined when issuance date differs.The accompanying notes are an integral part of these financial statements.General note: differences in sums, if any, are due to rounding.
Currency
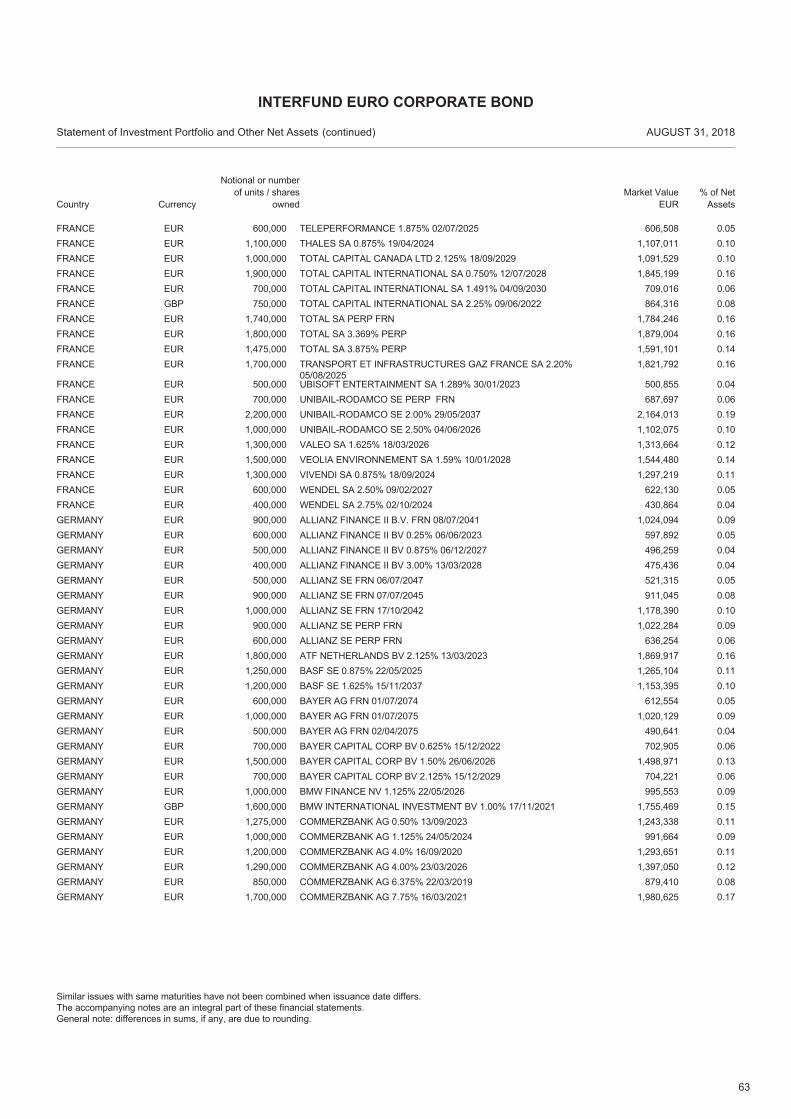
63
EUR 600,000 TELEPERFORMANCE 1.875% 02/07/2025 606,508 0.05FRANCEEUR 1,100,000 THALES SA 0.875% 19/04/2024 1,107,011 0.10FRANCEEUR 1,000,000 TOTAL CAPITAL CANADA LTD 2.125% 18/09/2029 1,091,529 0.10FRANCEEUR 1,900,000 TOTAL CAPITAL INTERNATIONAL SA 0.750% 12/07/2028 1,845,199 0.16FRANCEEUR 700,000 TOTAL CAPITAL INTERNATIONAL SA 1.491% 04/09/2030 709,016 0.06FRANCEGBP 750,000 TOTAL CAPITAL INTERNATIONAL SA 2.25% 09/06/2022 864,316 0.08FRANCEEUR 1,740,000 TOTAL SA PERP FRN 1,784,246 0.16FRANCEEUR 1,800,000 TOTAL SA 3.369% PERP 1,879,004 0.16FRANCEEUR 1,475,000 TOTAL SA 3.875% PERP 1,591,101 0.14FRANCEEUR 1,700,000 TRANSPORT ET INFRASTRUCTURES GAZ FRANCE SA 2.20%
05/08/20251,821,792 0.16FRANCE
EUR 500,000 UBISOFT ENTERTAINMENT SA 1.289% 30/01/2023 500,855 0.04FRANCEEUR 700,000 UNIBAIL-RODAMCO SE PERP FRN 687,697 0.06FRANCEEUR 2,200,000 UNIBAIL-RODAMCO SE 2.00% 29/05/2037 2,164,013 0.19FRANCEEUR 1,000,000 UNIBAIL-RODAMCO SE 2.50% 04/06/2026 1,102,075 0.10FRANCEEUR 1,300,000 VALEO SA 1.625% 18/03/2026 1,313,664 0.12FRANCEEUR 1,500,000 VEOLIA ENVIRONNEMENT SA 1.59% 10/01/2028 1,544,480 0.14FRANCEEUR 1,300,000 VIVENDI SA 0.875% 18/09/2024 1,297,219 0.11FRANCEEUR 600,000 WENDEL SA 2.50% 09/02/2027 622,130 0.05FRANCEEUR 400,000 WENDEL SA 2.75% 02/10/2024 430,864 0.04FRANCEEUR 900,000 ALLIANZ FINANCE II B.V. FRN 08/07/2041 1,024,094 0.09GERMANYEUR 600,000 ALLIANZ FINANCE II BV 0.25% 06/06/2023 597,892 0.05GERMANYEUR 500,000 ALLIANZ FINANCE II BV 0.875% 06/12/2027 496,259 0.04GERMANYEUR 400,000 ALLIANZ FINANCE II BV 3.00% 13/03/2028 475,436 0.04GERMANYEUR 500,000 ALLIANZ SE FRN 06/07/2047 521,315 0.05GERMANYEUR 900,000 ALLIANZ SE FRN 07/07/2045 911,045 0.08GERMANYEUR 1,000,000 ALLIANZ SE FRN 17/10/2042 1,178,390 0.10GERMANYEUR 900,000 ALLIANZ SE PERP FRN 1,022,284 0.09GERMANYEUR 600,000 ALLIANZ SE PERP FRN 636,254 0.06GERMANYEUR 1,800,000 ATF NETHERLANDS BV 2.125% 13/03/2023 1,869,917 0.16GERMANYEUR 1,250,000 BASF SE 0.875% 22/05/2025 1,265,104 0.11GERMANYEUR 1,200,000 BASF SE 1.625% 15/11/2037 1,153,395 0.10GERMANYEUR 600,000 BAYER AG FRN 01/07/2074 612,554 0.05GERMANYEUR 1,000,000 BAYER AG FRN 01/07/2075 1,020,129 0.09GERMANYEUR 500,000 BAYER AG FRN 02/04/2075 490,641 0.04GERMANYEUR 700,000 BAYER CAPITAL CORP BV 0.625% 15/12/2022 702,905 0.06GERMANYEUR 1,500,000 BAYER CAPITAL CORP BV 1.50% 26/06/2026 1,498,971 0.13GERMANYEUR 700,000 BAYER CAPITAL CORP BV 2.125% 15/12/2029 704,221 0.06GERMANYEUR 1,000,000 BMW FINANCE NV 1.125% 22/05/2026 995,553 0.09GERMANYGBP 1,600,000 BMW INTERNATIONAL INVESTMENT BV 1.00% 17/11/2021 1,755,469 0.15GERMANYEUR 1,275,000 COMMERZBANK AG 0.50% 13/09/2023 1,243,338 0.11GERMANYEUR 1,000,000 COMMERZBANK AG 1.125% 24/05/2024 991,664 0.09GERMANYEUR 1,200,000 COMMERZBANK AG 4.0% 16/09/2020 1,293,651 0.11GERMANYEUR 1,290,000 COMMERZBANK AG 4.00% 23/03/2026 1,397,050 0.12GERMANYEUR 850,000 COMMERZBANK AG 6.375% 22/03/2019 879,410 0.08GERMANYEUR 1,700,000 COMMERZBANK AG 7.75% 16/03/2021 1,980,625 0.17GERMANY
Country
Statement of Investment Portfolio and Other Net Assets AUGUST 31, 2018
Notional or number of units / shares
ownedMarket Value
EUR% of Net
Assets
INTERFUND EURO CORPORATE BOND
(continued)
Similar issues with same maturities have not been combined when issuance date differs.The accompanying notes are an integral part of these financial statements.General note: differences in sums, if any, are due to rounding.
Currency
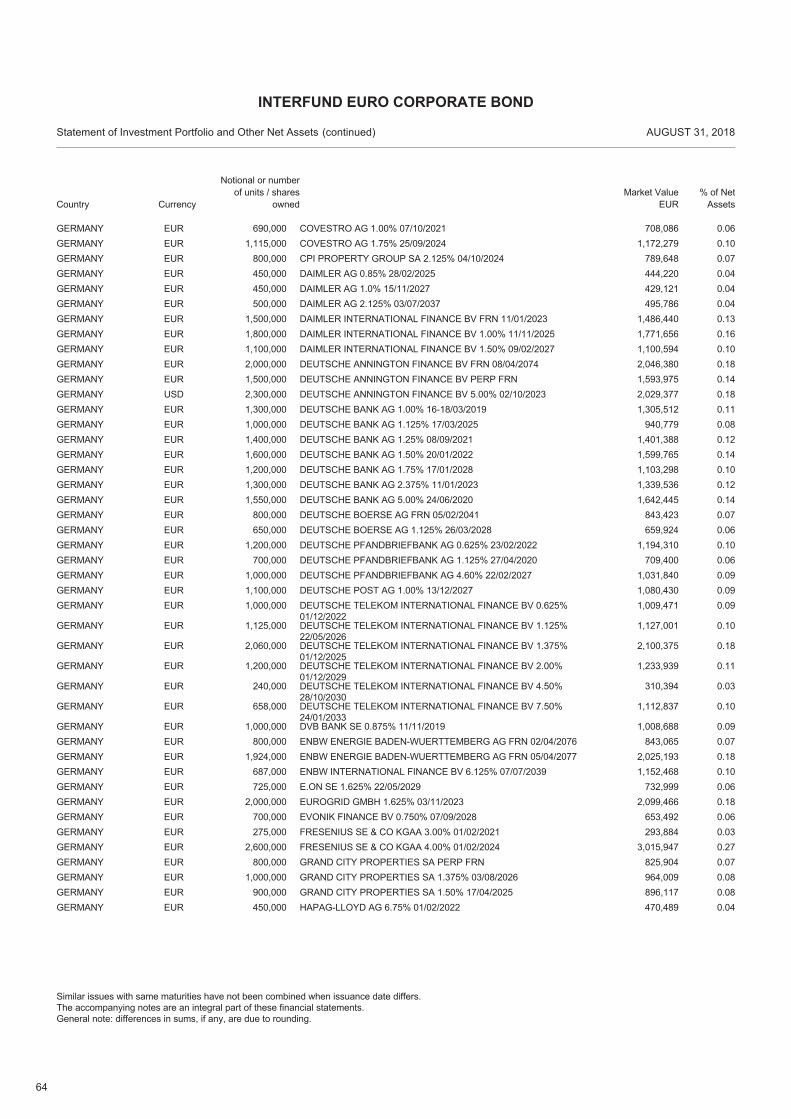
64
EUR 690,000 COVESTRO AG 1.00% 07/10/2021 708,086 0.06GERMANYEUR 1,115,000 COVESTRO AG 1.75% 25/09/2024 1,172,279 0.10GERMANYEUR 800,000 CPI PROPERTY GROUP SA 2.125% 04/10/2024 789,648 0.07GERMANYEUR 450,000 DAIMLER AG 0.85% 28/02/2025 444,220 0.04GERMANYEUR 450,000 DAIMLER AG 1.0% 15/11/2027 429,121 0.04GERMANYEUR 500,000 DAIMLER AG 2.125% 03/07/2037 495,786 0.04GERMANYEUR 1,500,000 DAIMLER INTERNATIONAL FINANCE BV FRN 11/01/2023 1,486,440 0.13GERMANYEUR 1,800,000 DAIMLER INTERNATIONAL FINANCE BV 1.00% 11/11/2025 1,771,656 0.16GERMANYEUR 1,100,000 DAIMLER INTERNATIONAL FINANCE BV 1.50% 09/02/2027 1,100,594 0.10GERMANYEUR 2,000,000 DEUTSCHE ANNINGTON FINANCE BV FRN 08/04/2074 2,046,380 0.18GERMANYEUR 1,500,000 DEUTSCHE ANNINGTON FINANCE BV PERP FRN 1,593,975 0.14GERMANYUSD 2,300,000 DEUTSCHE ANNINGTON FINANCE BV 5.00% 02/10/2023 2,029,377 0.18GERMANYEUR 1,300,000 DEUTSCHE BANK AG 1.00% 16-18/03/2019 1,305,512 0.11GERMANYEUR 1,000,000 DEUTSCHE BANK AG 1.125% 17/03/2025 940,779 0.08GERMANYEUR 1,400,000 DEUTSCHE BANK AG 1.25% 08/09/2021 1,401,388 0.12GERMANYEUR 1,600,000 DEUTSCHE BANK AG 1.50% 20/01/2022 1,599,765 0.14GERMANYEUR 1,200,000 DEUTSCHE BANK AG 1.75% 17/01/2028 1,103,298 0.10GERMANYEUR 1,300,000 DEUTSCHE BANK AG 2.375% 11/01/2023 1,339,536 0.12GERMANYEUR 1,550,000 DEUTSCHE BANK AG 5.00% 24/06/2020 1,642,445 0.14GERMANYEUR 800,000 DEUTSCHE BOERSE AG FRN 05/02/2041 843,423 0.07GERMANYEUR 650,000 DEUTSCHE BOERSE AG 1.125% 26/03/2028 659,924 0.06GERMANYEUR 1,200,000 DEUTSCHE PFANDBRIEFBANK AG 0.625% 23/02/2022 1,194,310 0.10GERMANYEUR 700,000 DEUTSCHE PFANDBRIEFBANK AG 1.125% 27/04/2020 709,400 0.06GERMANYEUR 1,000,000 DEUTSCHE PFANDBRIEFBANK AG 4.60% 22/02/2027 1,031,840 0.09GERMANYEUR 1,100,000 DEUTSCHE POST AG 1.00% 13/12/2027 1,080,430 0.09GERMANYEUR 1,000,000 DEUTSCHE TELEKOM INTERNATIONAL FINANCE BV 0.625%
01/12/20221,009,471 0.09GERMANY
EUR 1,125,000 DEUTSCHE TELEKOM INTERNATIONAL FINANCE BV 1.125%22/05/2026
1,127,001 0.10GERMANY
EUR 2,060,000 DEUTSCHE TELEKOM INTERNATIONAL FINANCE BV 1.375%01/12/2025
2,100,375 0.18GERMANY
EUR 1,200,000 DEUTSCHE TELEKOM INTERNATIONAL FINANCE BV 2.00%01/12/2029
1,233,939 0.11GERMANY
EUR 240,000 DEUTSCHE TELEKOM INTERNATIONAL FINANCE BV 4.50%28/10/2030
310,394 0.03GERMANY
EUR 658,000 DEUTSCHE TELEKOM INTERNATIONAL FINANCE BV 7.50%24/01/2033
1,112,837 0.10GERMANY
EUR 1,000,000 DVB BANK SE 0.875% 11/11/2019 1,008,688 0.09GERMANYEUR 800,000 ENBW ENERGIE BADEN-WUERTTEMBERG AG FRN 02/04/2076 843,065 0.07GERMANYEUR 1,924,000 ENBW ENERGIE BADEN-WUERTTEMBERG AG FRN 05/04/2077 2,025,193 0.18GERMANYEUR 687,000 ENBW INTERNATIONAL FINANCE BV 6.125% 07/07/2039 1,152,468 0.10GERMANYEUR 725,000 E.ON SE 1.625% 22/05/2029 732,999 0.06GERMANYEUR 2,000,000 EUROGRID GMBH 1.625% 03/11/2023 2,099,466 0.18GERMANYEUR 700,000 EVONIK FINANCE BV 0.750% 07/09/2028 653,492 0.06GERMANYEUR 275,000 FRESENIUS SE & CO KGAA 3.00% 01/02/2021 293,884 0.03GERMANYEUR 2,600,000 FRESENIUS SE & CO KGAA 4.00% 01/02/2024 3,015,947 0.27GERMANYEUR 800,000 GRAND CITY PROPERTIES SA PERP FRN 825,904 0.07GERMANYEUR 1,000,000 GRAND CITY PROPERTIES SA 1.375% 03/08/2026 964,009 0.08GERMANYEUR 900,000 GRAND CITY PROPERTIES SA 1.50% 17/04/2025 896,117 0.08GERMANYEUR 450,000 HAPAG-LLOYD AG 6.75% 01/02/2022 470,489 0.04GERMANY
Country
Statement of Investment Portfolio and Other Net Assets AUGUST 31, 2018
Notional or number of units / shares
ownedMarket Value
EUR% of Net
Assets
INTERFUND EURO CORPORATE BOND
(continued)
Similar issues with same maturities have not been combined when issuance date differs.The accompanying notes are an integral part of these financial statements.General note: differences in sums, if any, are due to rounding.
Currency
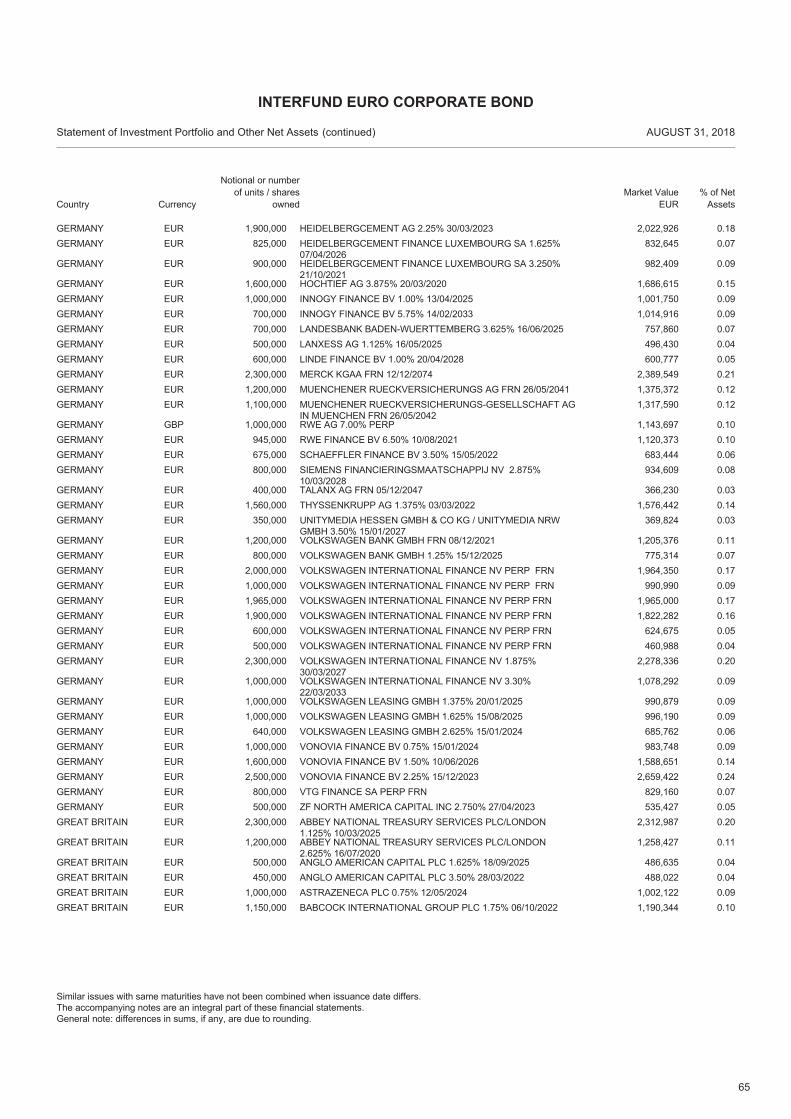
65
EUR 1,900,000 HEIDELBERGCEMENT AG 2.25% 30/03/2023 2,022,926 0.18GERMANYEUR 825,000 HEIDELBERGCEMENT FINANCE LUXEMBOURG SA 1.625%
07/04/2026832,645 0.07GERMANY
EUR 900,000 HEIDELBERGCEMENT FINANCE LUXEMBOURG SA 3.250%21/10/2021
982,409 0.09GERMANY
EUR 1,600,000 HOCHTIEF AG 3.875% 20/03/2020 1,686,615 0.15GERMANYEUR 1,000,000 INNOGY FINANCE BV 1.00% 13/04/2025 1,001,750 0.09GERMANYEUR 700,000 INNOGY FINANCE BV 5.75% 14/02/2033 1,014,916 0.09GERMANYEUR 700,000 LANDESBANK BADEN-WUERTTEMBERG 3.625% 16/06/2025 757,860 0.07GERMANYEUR 500,000 LANXESS AG 1.125% 16/05/2025 496,430 0.04GERMANYEUR 600,000 LINDE FINANCE BV 1.00% 20/04/2028 600,777 0.05GERMANYEUR 2,300,000 MERCK KGAA FRN 12/12/2074 2,389,549 0.21GERMANYEUR 1,200,000 MUENCHENER RUECKVERSICHERUNGS AG FRN 26/05/2041 1,375,372 0.12GERMANYEUR 1,100,000 MUENCHENER RUECKVERSICHERUNGS-GESELLSCHAFT AG
IN MUENCHEN FRN 26/05/20421,317,590 0.12GERMANY
GBP 1,000,000 RWE AG 7.00% PERP 1,143,697 0.10GERMANYEUR 945,000 RWE FINANCE BV 6.50% 10/08/2021 1,120,373 0.10GERMANYEUR 675,000 SCHAEFFLER FINANCE BV 3.50% 15/05/2022 683,444 0.06GERMANYEUR 800,000 SIEMENS FINANCIERINGSMAATSCHAPPIJ NV 2.875%
10/03/2028934,609 0.08GERMANY
EUR 400,000 TALANX AG FRN 05/12/2047 366,230 0.03GERMANYEUR 1,560,000 THYSSENKRUPP AG 1.375% 03/03/2022 1,576,442 0.14GERMANYEUR 350,000 UNITYMEDIA HESSEN GMBH & CO KG / UNITYMEDIA NRW
GMBH 3.50% 15/01/2027369,824 0.03GERMANY
EUR 1,200,000 VOLKSWAGEN BANK GMBH FRN 08/12/2021 1,205,376 0.11GERMANYEUR 800,000 VOLKSWAGEN BANK GMBH 1.25% 15/12/2025 775,314 0.07GERMANYEUR 2,000,000 VOLKSWAGEN INTERNATIONAL FINANCE NV PERP FRN 1,964,350 0.17GERMANYEUR 1,000,000 VOLKSWAGEN INTERNATIONAL FINANCE NV PERP FRN 990,990 0.09GERMANYEUR 1,965,000 VOLKSWAGEN INTERNATIONAL FINANCE NV PERP FRN 1,965,000 0.17GERMANYEUR 1,900,000 VOLKSWAGEN INTERNATIONAL FINANCE NV PERP FRN 1,822,282 0.16GERMANYEUR 600,000 VOLKSWAGEN INTERNATIONAL FINANCE NV PERP FRN 624,675 0.05GERMANYEUR 500,000 VOLKSWAGEN INTERNATIONAL FINANCE NV PERP FRN 460,988 0.04GERMANYEUR 2,300,000 VOLKSWAGEN INTERNATIONAL FINANCE NV 1.875%
30/03/20272,278,336 0.20GERMANY
EUR 1,000,000 VOLKSWAGEN INTERNATIONAL FINANCE NV 3.30%22/03/2033
1,078,292 0.09GERMANY
EUR 1,000,000 VOLKSWAGEN LEASING GMBH 1.375% 20/01/2025 990,879 0.09GERMANYEUR 1,000,000 VOLKSWAGEN LEASING GMBH 1.625% 15/08/2025 996,190 0.09GERMANYEUR 640,000 VOLKSWAGEN LEASING GMBH 2.625% 15/01/2024 685,762 0.06GERMANYEUR 1,000,000 VONOVIA FINANCE BV 0.75% 15/01/2024 983,748 0.09GERMANYEUR 1,600,000 VONOVIA FINANCE BV 1.50% 10/06/2026 1,588,651 0.14GERMANYEUR 2,500,000 VONOVIA FINANCE BV 2.25% 15/12/2023 2,659,422 0.24GERMANYEUR 800,000 VTG FINANCE SA PERP FRN 829,160 0.07GERMANYEUR 500,000 ZF NORTH AMERICA CAPITAL INC 2.750% 27/04/2023 535,427 0.05GERMANYEUR 2,300,000 ABBEY NATIONAL TREASURY SERVICES PLC/LONDON
1.125% 10/03/20252,312,987 0.20GREAT BRITAIN
EUR 1,200,000 ABBEY NATIONAL TREASURY SERVICES PLC/LONDON2.625% 16/07/2020
1,258,427 0.11GREAT BRITAIN
EUR 500,000 ANGLO AMERICAN CAPITAL PLC 1.625% 18/09/2025 486,635 0.04GREAT BRITAINEUR 450,000 ANGLO AMERICAN CAPITAL PLC 3.50% 28/03/2022 488,022 0.04GREAT BRITAINEUR 1,000,000 ASTRAZENECA PLC 0.75% 12/05/2024 1,002,122 0.09GREAT BRITAINEUR 1,150,000 BABCOCK INTERNATIONAL GROUP PLC 1.75% 06/10/2022 1,190,344 0.10GREAT BRITAIN
Country
Statement of Investment Portfolio and Other Net Assets AUGUST 31, 2018
Notional or number of units / shares
ownedMarket Value
EUR% of Net
Assets
INTERFUND EURO CORPORATE BOND
(continued)
Similar issues with same maturities have not been combined when issuance date differs.The accompanying notes are an integral part of these financial statements.General note: differences in sums, if any, are due to rounding.
Currency
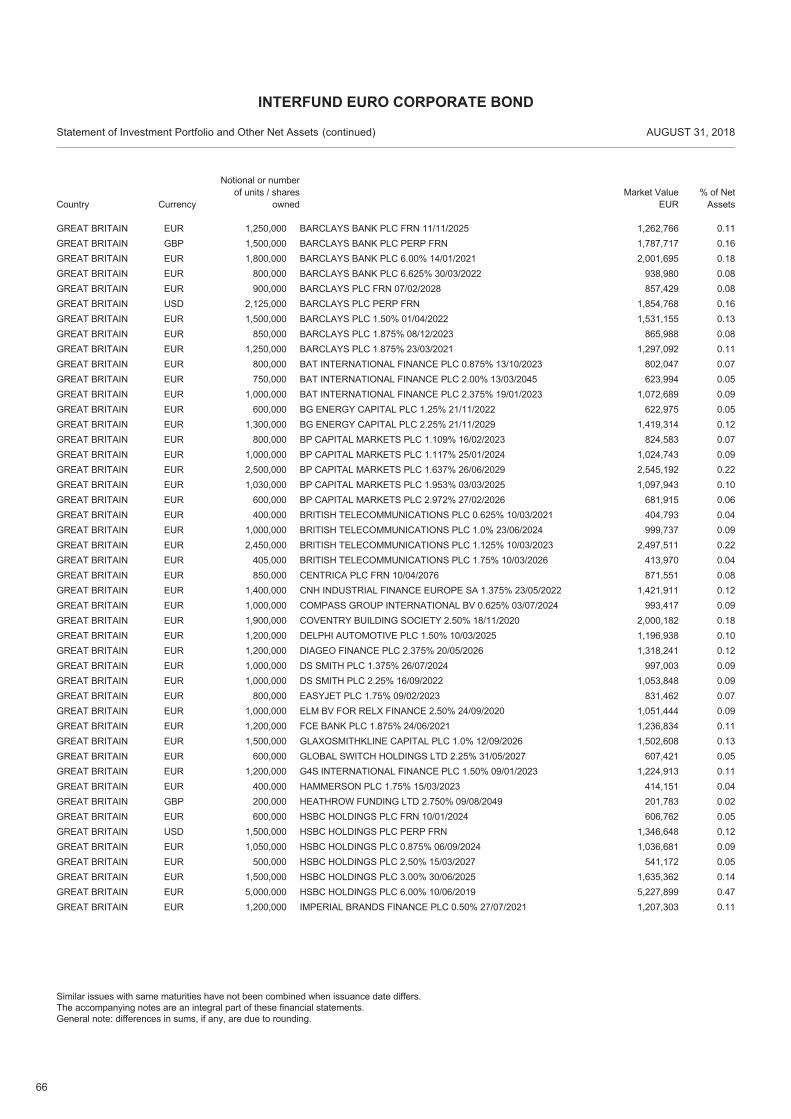
66
EUR 1,250,000 BARCLAYS BANK PLC FRN 11/11/2025 1,262,766 0.11GREAT BRITAINGBP 1,500,000 BARCLAYS BANK PLC PERP FRN 1,787,717 0.16GREAT BRITAINEUR 1,800,000 BARCLAYS BANK PLC 6.00% 14/01/2021 2,001,695 0.18GREAT BRITAINEUR 800,000 BARCLAYS BANK PLC 6.625% 30/03/2022 938,980 0.08GREAT BRITAINEUR 900,000 BARCLAYS PLC FRN 07/02/2028 857,429 0.08GREAT BRITAINUSD 2,125,000 BARCLAYS PLC PERP FRN 1,854,768 0.16GREAT BRITAINEUR 1,500,000 BARCLAYS PLC 1.50% 01/04/2022 1,531,155 0.13GREAT BRITAINEUR 850,000 BARCLAYS PLC 1.875% 08/12/2023 865,988 0.08GREAT BRITAINEUR 1,250,000 BARCLAYS PLC 1.875% 23/03/2021 1,297,092 0.11GREAT BRITAINEUR 800,000 BAT INTERNATIONAL FINANCE PLC 0.875% 13/10/2023 802,047 0.07GREAT BRITAINEUR 750,000 BAT INTERNATIONAL FINANCE PLC 2.00% 13/03/2045 623,994 0.05GREAT BRITAINEUR 1,000,000 BAT INTERNATIONAL FINANCE PLC 2.375% 19/01/2023 1,072,689 0.09GREAT BRITAINEUR 600,000 BG ENERGY CAPITAL PLC 1.25% 21/11/2022 622,975 0.05GREAT BRITAINEUR 1,300,000 BG ENERGY CAPITAL PLC 2.25% 21/11/2029 1,419,314 0.12GREAT BRITAINEUR 800,000 BP CAPITAL MARKETS PLC 1.109% 16/02/2023 824,583 0.07GREAT BRITAINEUR 1,000,000 BP CAPITAL MARKETS PLC 1.117% 25/01/2024 1,024,743 0.09GREAT BRITAINEUR 2,500,000 BP CAPITAL MARKETS PLC 1.637% 26/06/2029 2,545,192 0.22GREAT BRITAINEUR 1,030,000 BP CAPITAL MARKETS PLC 1.953% 03/03/2025 1,097,943 0.10GREAT BRITAINEUR 600,000 BP CAPITAL MARKETS PLC 2.972% 27/02/2026 681,915 0.06GREAT BRITAINEUR 400,000 BRITISH TELECOMMUNICATIONS PLC 0.625% 10/03/2021 404,793 0.04GREAT BRITAINEUR 1,000,000 BRITISH TELECOMMUNICATIONS PLC 1.0% 23/06/2024 999,737 0.09GREAT BRITAINEUR 2,450,000 BRITISH TELECOMMUNICATIONS PLC 1.125% 10/03/2023 2,497,511 0.22GREAT BRITAINEUR 405,000 BRITISH TELECOMMUNICATIONS PLC 1.75% 10/03/2026 413,970 0.04GREAT BRITAINEUR 850,000 CENTRICA PLC FRN 10/04/2076 871,551 0.08GREAT BRITAINEUR 1,400,000 CNH INDUSTRIAL FINANCE EUROPE SA 1.375% 23/05/2022 1,421,911 0.12GREAT BRITAINEUR 1,000,000 COMPASS GROUP INTERNATIONAL BV 0.625% 03/07/2024 993,417 0.09GREAT BRITAINEUR 1,900,000 COVENTRY BUILDING SOCIETY 2.50% 18/11/2020 2,000,182 0.18GREAT BRITAINEUR 1,200,000 DELPHI AUTOMOTIVE PLC 1.50% 10/03/2025 1,196,938 0.10GREAT BRITAINEUR 1,200,000 DIAGEO FINANCE PLC 2.375% 20/05/2026 1,318,241 0.12GREAT BRITAINEUR 1,000,000 DS SMITH PLC 1.375% 26/07/2024 997,003 0.09GREAT BRITAINEUR 1,000,000 DS SMITH PLC 2.25% 16/09/2022 1,053,848 0.09GREAT BRITAINEUR 800,000 EASYJET PLC 1.75% 09/02/2023 831,462 0.07GREAT BRITAINEUR 1,000,000 ELM BV FOR RELX FINANCE 2.50% 24/09/2020 1,051,444 0.09GREAT BRITAINEUR 1,200,000 FCE BANK PLC 1.875% 24/06/2021 1,236,834 0.11GREAT BRITAINEUR 1,500,000 GLAXOSMITHKLINE CAPITAL PLC 1.0% 12/09/2026 1,502,608 0.13GREAT BRITAINEUR 600,000 GLOBAL SWITCH HOLDINGS LTD 2.25% 31/05/2027 607,421 0.05GREAT BRITAINEUR 1,200,000 G4S INTERNATIONAL FINANCE PLC 1.50% 09/01/2023 1,224,913 0.11GREAT BRITAINEUR 400,000 HAMMERSON PLC 1.75% 15/03/2023 414,151 0.04GREAT BRITAINGBP 200,000 HEATHROW FUNDING LTD 2.750% 09/08/2049 201,783 0.02GREAT BRITAINEUR 600,000 HSBC HOLDINGS PLC FRN 10/01/2024 606,762 0.05GREAT BRITAINUSD 1,500,000 HSBC HOLDINGS PLC PERP FRN 1,346,648 0.12GREAT BRITAINEUR 1,050,000 HSBC HOLDINGS PLC 0.875% 06/09/2024 1,036,681 0.09GREAT BRITAINEUR 500,000 HSBC HOLDINGS PLC 2.50% 15/03/2027 541,172 0.05GREAT BRITAINEUR 1,500,000 HSBC HOLDINGS PLC 3.00% 30/06/2025 1,635,362 0.14GREAT BRITAINEUR 5,000,000 HSBC HOLDINGS PLC 6.00% 10/06/2019 5,227,899 0.47GREAT BRITAINEUR 1,200,000 IMPERIAL BRANDS FINANCE PLC 0.50% 27/07/2021 1,207,303 0.11GREAT BRITAIN
Country
Statement of Investment Portfolio and Other Net Assets AUGUST 31, 2018
Notional or number of units / shares
ownedMarket Value
EUR% of Net
Assets
INTERFUND EURO CORPORATE BOND
(continued)
Similar issues with same maturities have not been combined when issuance date differs.The accompanying notes are an integral part of these financial statements.General note: differences in sums, if any, are due to rounding.
Currency
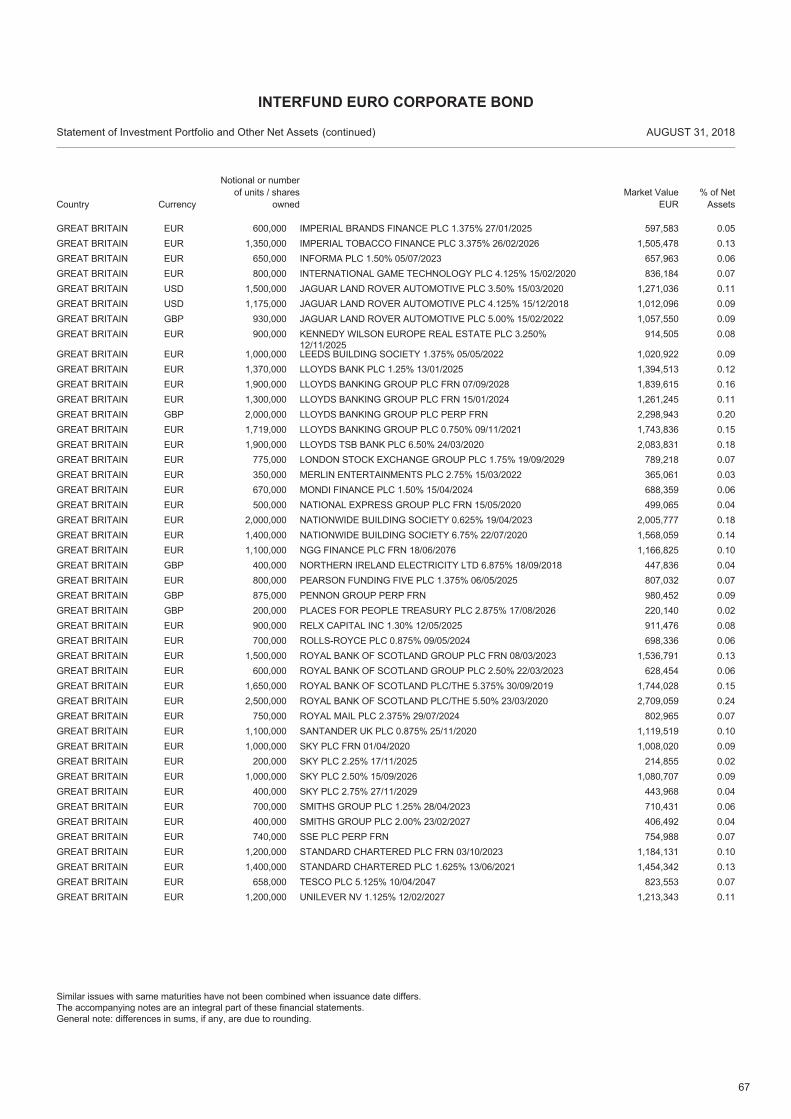
67
EUR 600,000 IMPERIAL BRANDS FINANCE PLC 1.375% 27/01/2025 597,583 0.05GREAT BRITAINEUR 1,350,000 IMPERIAL TOBACCO FINANCE PLC 3.375% 26/02/2026 1,505,478 0.13GREAT BRITAINEUR 650,000 INFORMA PLC 1.50% 05/07/2023 657,963 0.06GREAT BRITAINEUR 800,000 INTERNATIONAL GAME TECHNOLOGY PLC 4.125% 15/02/2020 836,184 0.07GREAT BRITAINUSD 1,500,000 JAGUAR LAND ROVER AUTOMOTIVE PLC 3.50% 15/03/2020 1,271,036 0.11GREAT BRITAINUSD 1,175,000 JAGUAR LAND ROVER AUTOMOTIVE PLC 4.125% 15/12/2018 1,012,096 0.09GREAT BRITAINGBP 930,000 JAGUAR LAND ROVER AUTOMOTIVE PLC 5.00% 15/02/2022 1,057,550 0.09GREAT BRITAINEUR 900,000 KENNEDY WILSON EUROPE REAL ESTATE PLC 3.250%
12/11/2025914,505 0.08GREAT BRITAIN
EUR 1,000,000 LEEDS BUILDING SOCIETY 1.375% 05/05/2022 1,020,922 0.09GREAT BRITAINEUR 1,370,000 LLOYDS BANK PLC 1.25% 13/01/2025 1,394,513 0.12GREAT BRITAINEUR 1,900,000 LLOYDS BANKING GROUP PLC FRN 07/09/2028 1,839,615 0.16GREAT BRITAINEUR 1,300,000 LLOYDS BANKING GROUP PLC FRN 15/01/2024 1,261,245 0.11GREAT BRITAINGBP 2,000,000 LLOYDS BANKING GROUP PLC PERP FRN 2,298,943 0.20GREAT BRITAINEUR 1,719,000 LLOYDS BANKING GROUP PLC 0.750% 09/11/2021 1,743,836 0.15GREAT BRITAINEUR 1,900,000 LLOYDS TSB BANK PLC 6.50% 24/03/2020 2,083,831 0.18GREAT BRITAINEUR 775,000 LONDON STOCK EXCHANGE GROUP PLC 1.75% 19/09/2029 789,218 0.07GREAT BRITAINEUR 350,000 MERLIN ENTERTAINMENTS PLC 2.75% 15/03/2022 365,061 0.03GREAT BRITAINEUR 670,000 MONDI FINANCE PLC 1.50% 15/04/2024 688,359 0.06GREAT BRITAINEUR 500,000 NATIONAL EXPRESS GROUP PLC FRN 15/05/2020 499,065 0.04GREAT BRITAINEUR 2,000,000 NATIONWIDE BUILDING SOCIETY 0.625% 19/04/2023 2,005,777 0.18GREAT BRITAINEUR 1,400,000 NATIONWIDE BUILDING SOCIETY 6.75% 22/07/2020 1,568,059 0.14GREAT BRITAINEUR 1,100,000 NGG FINANCE PLC FRN 18/06/2076 1,166,825 0.10GREAT BRITAINGBP 400,000 NORTHERN IRELAND ELECTRICITY LTD 6.875% 18/09/2018 447,836 0.04GREAT BRITAINEUR 800,000 PEARSON FUNDING FIVE PLC 1.375% 06/05/2025 807,032 0.07GREAT BRITAINGBP 875,000 PENNON GROUP PERP FRN 980,452 0.09GREAT BRITAINGBP 200,000 PLACES FOR PEOPLE TREASURY PLC 2.875% 17/08/2026 220,140 0.02GREAT BRITAINEUR 900,000 RELX CAPITAL INC 1.30% 12/05/2025 911,476 0.08GREAT BRITAINEUR 700,000 ROLLS-ROYCE PLC 0.875% 09/05/2024 698,336 0.06GREAT BRITAINEUR 1,500,000 ROYAL BANK OF SCOTLAND GROUP PLC FRN 08/03/2023 1,536,791 0.13GREAT BRITAINEUR 600,000 ROYAL BANK OF SCOTLAND GROUP PLC 2.50% 22/03/2023 628,454 0.06GREAT BRITAINEUR 1,650,000 ROYAL BANK OF SCOTLAND PLC/THE 5.375% 30/09/2019 1,744,028 0.15GREAT BRITAINEUR 2,500,000 ROYAL BANK OF SCOTLAND PLC/THE 5.50% 23/03/2020 2,709,059 0.24GREAT BRITAINEUR 750,000 ROYAL MAIL PLC 2.375% 29/07/2024 802,965 0.07GREAT BRITAINEUR 1,100,000 SANTANDER UK PLC 0.875% 25/11/2020 1,119,519 0.10GREAT BRITAINEUR 1,000,000 SKY PLC FRN 01/04/2020 1,008,020 0.09GREAT BRITAINEUR 200,000 SKY PLC 2.25% 17/11/2025 214,855 0.02GREAT BRITAINEUR 1,000,000 SKY PLC 2.50% 15/09/2026 1,080,707 0.09GREAT BRITAINEUR 400,000 SKY PLC 2.75% 27/11/2029 443,968 0.04GREAT BRITAINEUR 700,000 SMITHS GROUP PLC 1.25% 28/04/2023 710,431 0.06GREAT BRITAINEUR 400,000 SMITHS GROUP PLC 2.00% 23/02/2027 406,492 0.04GREAT BRITAINEUR 740,000 SSE PLC PERP FRN 754,988 0.07GREAT BRITAINEUR 1,200,000 STANDARD CHARTERED PLC FRN 03/10/2023 1,184,131 0.10GREAT BRITAINEUR 1,400,000 STANDARD CHARTERED PLC 1.625% 13/06/2021 1,454,342 0.13GREAT BRITAINEUR 658,000 TESCO PLC 5.125% 10/04/2047 823,553 0.07GREAT BRITAINEUR 1,200,000 UNILEVER NV 1.125% 12/02/2027 1,213,343 0.11GREAT BRITAIN
Country
Statement of Investment Portfolio and Other Net Assets AUGUST 31, 2018
Notional or number of units / shares
ownedMarket Value
EUR% of Net
Assets
INTERFUND EURO CORPORATE BOND
(continued)
Similar issues with same maturities have not been combined when issuance date differs.The accompanying notes are an integral part of these financial statements.General note: differences in sums, if any, are due to rounding.
Currency
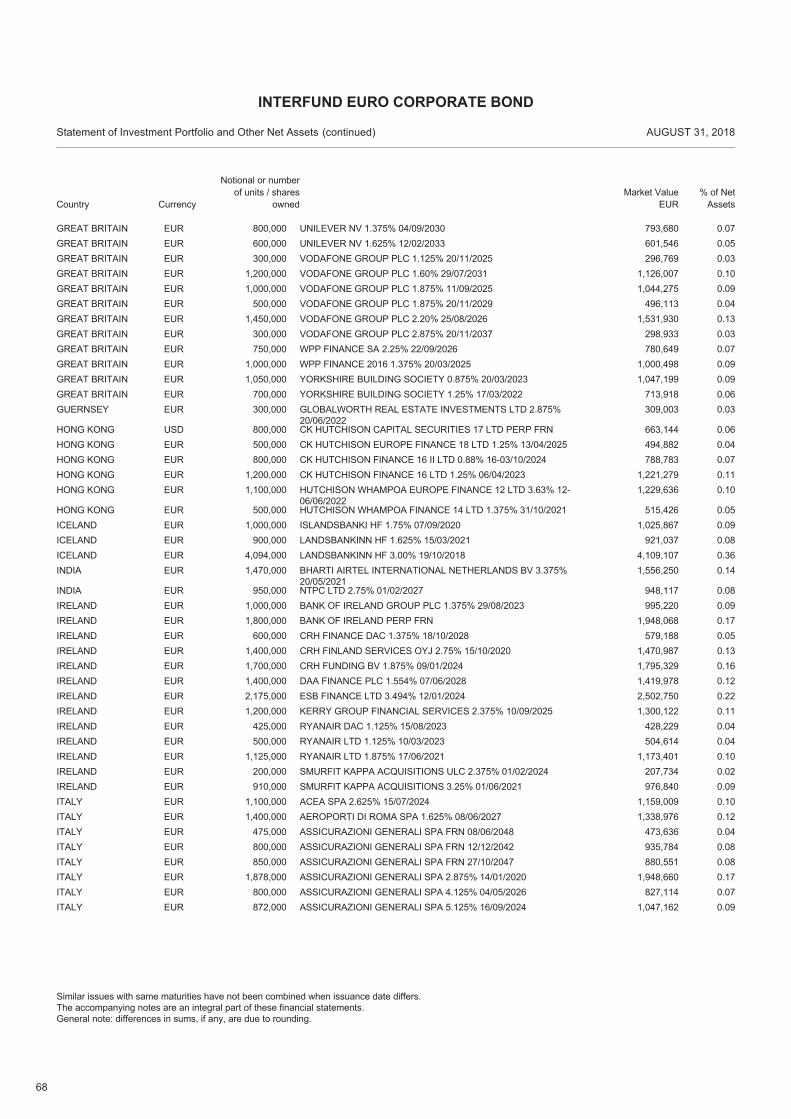
68
EUR 800,000 UNILEVER NV 1.375% 04/09/2030 793,680 0.07GREAT BRITAINEUR 600,000 UNILEVER NV 1.625% 12/02/2033 601,546 0.05GREAT BRITAINEUR 300,000 VODAFONE GROUP PLC 1.125% 20/11/2025 296,769 0.03GREAT BRITAINEUR 1,200,000 VODAFONE GROUP PLC 1.60% 29/07/2031 1,126,007 0.10GREAT BRITAINEUR 1,000,000 VODAFONE GROUP PLC 1.875% 11/09/2025 1,044,275 0.09GREAT BRITAINEUR 500,000 VODAFONE GROUP PLC 1.875% 20/11/2029 496,113 0.04GREAT BRITAINEUR 1,450,000 VODAFONE GROUP PLC 2.20% 25/08/2026 1,531,930 0.13GREAT BRITAINEUR 300,000 VODAFONE GROUP PLC 2.875% 20/11/2037 298,933 0.03GREAT BRITAINEUR 750,000 WPP FINANCE SA 2.25% 22/09/2026 780,649 0.07GREAT BRITAINEUR 1,000,000 WPP FINANCE 2016 1.375% 20/03/2025 1,000,498 0.09GREAT BRITAINEUR 1,050,000 YORKSHIRE BUILDING SOCIETY 0.875% 20/03/2023 1,047,199 0.09GREAT BRITAINEUR 700,000 YORKSHIRE BUILDING SOCIETY 1.25% 17/03/2022 713,918 0.06GREAT BRITAINEUR 300,000 GLOBALWORTH REAL ESTATE INVESTMENTS LTD 2.875%
20/06/2022309,003 0.03GUERNSEY
USD 800,000 CK HUTCHISON CAPITAL SECURITIES 17 LTD PERP FRN 663,144 0.06HONG KONGEUR 500,000 CK HUTCHISON EUROPE FINANCE 18 LTD 1.25% 13/04/2025 494,882 0.04HONG KONGEUR 800,000 CK HUTCHISON FINANCE 16 II LTD 0.88% 16-03/10/2024 788,783 0.07HONG KONGEUR 1,200,000 CK HUTCHISON FINANCE 16 LTD 1.25% 06/04/2023 1,221,279 0.11HONG KONGEUR 1,100,000 HUTCHISON WHAMPOA EUROPE FINANCE 12 LTD 3.63% 12-
06/06/20221,229,636 0.10HONG KONG
EUR 500,000 HUTCHISON WHAMPOA FINANCE 14 LTD 1.375% 31/10/2021 515,426 0.05HONG KONGEUR 1,000,000 ISLANDSBANKI HF 1.75% 07/09/2020 1,025,867 0.09ICELANDEUR 900,000 LANDSBANKINN HF 1.625% 15/03/2021 921,037 0.08ICELANDEUR 4,094,000 LANDSBANKINN HF 3.00% 19/10/2018 4,109,107 0.36ICELANDEUR 1,470,000 BHARTI AIRTEL INTERNATIONAL NETHERLANDS BV 3.375%
20/05/20211,556,250 0.14INDIA
EUR 950,000 NTPC LTD 2.75% 01/02/2027 948,117 0.08INDIAEUR 1,000,000 BANK OF IRELAND GROUP PLC 1.375% 29/08/2023 995,220 0.09IRELANDEUR 1,800,000 BANK OF IRELAND PERP FRN 1,948,068 0.17IRELANDEUR 600,000 CRH FINANCE DAC 1.375% 18/10/2028 579,188 0.05IRELANDEUR 1,400,000 CRH FINLAND SERVICES OYJ 2.75% 15/10/2020 1,470,987 0.13IRELANDEUR 1,700,000 CRH FUNDING BV 1.875% 09/01/2024 1,795,329 0.16IRELANDEUR 1,400,000 DAA FINANCE PLC 1.554% 07/06/2028 1,419,978 0.12IRELANDEUR 2,175,000 ESB FINANCE LTD 3.494% 12/01/2024 2,502,750 0.22IRELANDEUR 1,200,000 KERRY GROUP FINANCIAL SERVICES 2.375% 10/09/2025 1,300,122 0.11IRELANDEUR 425,000 RYANAIR DAC 1.125% 15/08/2023 428,229 0.04IRELANDEUR 500,000 RYANAIR LTD 1.125% 10/03/2023 504,614 0.04IRELANDEUR 1,125,000 RYANAIR LTD 1.875% 17/06/2021 1,173,401 0.10IRELANDEUR 200,000 SMURFIT KAPPA ACQUISITIONS ULC 2.375% 01/02/2024 207,734 0.02IRELANDEUR 910,000 SMURFIT KAPPA ACQUISITIONS 3.25% 01/06/2021 976,840 0.09IRELANDEUR 1,100,000 ACEA SPA 2.625% 15/07/2024 1,159,009 0.10ITALYEUR 1,400,000 AEROPORTI DI ROMA SPA 1.625% 08/06/2027 1,338,976 0.12ITALYEUR 475,000 ASSICURAZIONI GENERALI SPA FRN 08/06/2048 473,636 0.04ITALYEUR 800,000 ASSICURAZIONI GENERALI SPA FRN 12/12/2042 935,784 0.08ITALYEUR 850,000 ASSICURAZIONI GENERALI SPA FRN 27/10/2047 880,551 0.08ITALYEUR 1,878,000 ASSICURAZIONI GENERALI SPA 2.875% 14/01/2020 1,948,660 0.17ITALYEUR 800,000 ASSICURAZIONI GENERALI SPA 4.125% 04/05/2026 827,114 0.07ITALYEUR 872,000 ASSICURAZIONI GENERALI SPA 5.125% 16/09/2024 1,047,162 0.09ITALY
Country
Statement of Investment Portfolio and Other Net Assets AUGUST 31, 2018
Notional or number of units / shares
ownedMarket Value
EUR% of Net
Assets
INTERFUND EURO CORPORATE BOND
(continued)
Similar issues with same maturities have not been combined when issuance date differs.The accompanying notes are an integral part of these financial statements.General note: differences in sums, if any, are due to rounding.
Currency
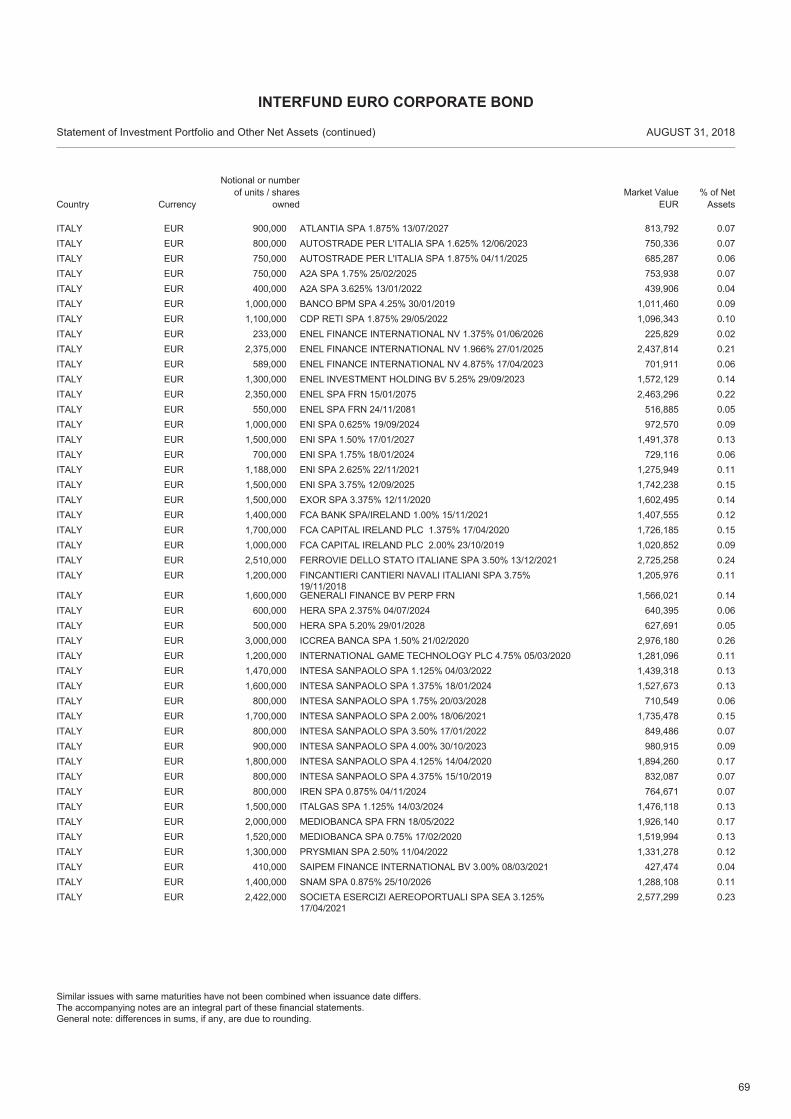
69
EUR 900,000 ATLANTIA SPA 1.875% 13/07/2027 813,792 0.07ITALYEUR 800,000 AUTOSTRADE PER L'ITALIA SPA 1.625% 12/06/2023 750,336 0.07ITALYEUR 750,000 AUTOSTRADE PER L'ITALIA SPA 1.875% 04/11/2025 685,287 0.06ITALYEUR 750,000 A2A SPA 1.75% 25/02/2025 753,938 0.07ITALYEUR 400,000 A2A SPA 3.625% 13/01/2022 439,906 0.04ITALYEUR 1,000,000 BANCO BPM SPA 4.25% 30/01/2019 1,011,460 0.09ITALYEUR 1,100,000 CDP RETI SPA 1.875% 29/05/2022 1,096,343 0.10ITALYEUR 233,000 ENEL FINANCE INTERNATIONAL NV 1.375% 01/06/2026 225,829 0.02ITALYEUR 2,375,000 ENEL FINANCE INTERNATIONAL NV 1.966% 27/01/2025 2,437,814 0.21ITALYEUR 589,000 ENEL FINANCE INTERNATIONAL NV 4.875% 17/04/2023 701,911 0.06ITALYEUR 1,300,000 ENEL INVESTMENT HOLDING BV 5.25% 29/09/2023 1,572,129 0.14ITALYEUR 2,350,000 ENEL SPA FRN 15/01/2075 2,463,296 0.22ITALYEUR 550,000 ENEL SPA FRN 24/11/2081 516,885 0.05ITALYEUR 1,000,000 ENI SPA 0.625% 19/09/2024 972,570 0.09ITALYEUR 1,500,000 ENI SPA 1.50% 17/01/2027 1,491,378 0.13ITALYEUR 700,000 ENI SPA 1.75% 18/01/2024 729,116 0.06ITALYEUR 1,188,000 ENI SPA 2.625% 22/11/2021 1,275,949 0.11ITALYEUR 1,500,000 ENI SPA 3.75% 12/09/2025 1,742,238 0.15ITALYEUR 1,500,000 EXOR SPA 3.375% 12/11/2020 1,602,495 0.14ITALYEUR 1,400,000 FCA BANK SPA/IRELAND 1.00% 15/11/2021 1,407,555 0.12ITALYEUR 1,700,000 FCA CAPITAL IRELAND PLC 1.375% 17/04/2020 1,726,185 0.15ITALYEUR 1,000,000 FCA CAPITAL IRELAND PLC 2.00% 23/10/2019 1,020,852 0.09ITALYEUR 2,510,000 FERROVIE DELLO STATO ITALIANE SPA 3.50% 13/12/2021 2,725,258 0.24ITALYEUR 1,200,000 FINCANTIERI CANTIERI NAVALI ITALIANI SPA 3.75%
19/11/20181,205,976 0.11ITALY
EUR 1,600,000 GENERALI FINANCE BV PERP FRN 1,566,021 0.14ITALYEUR 600,000 HERA SPA 2.375% 04/07/2024 640,395 0.06ITALYEUR 500,000 HERA SPA 5.20% 29/01/2028 627,691 0.05ITALYEUR 3,000,000 ICCREA BANCA SPA 1.50% 21/02/2020 2,976,180 0.26ITALYEUR 1,200,000 INTERNATIONAL GAME TECHNOLOGY PLC 4.75% 05/03/2020 1,281,096 0.11ITALYEUR 1,470,000 INTESA SANPAOLO SPA 1.125% 04/03/2022 1,439,318 0.13ITALYEUR 1,600,000 INTESA SANPAOLO SPA 1.375% 18/01/2024 1,527,673 0.13ITALYEUR 800,000 INTESA SANPAOLO SPA 1.75% 20/03/2028 710,549 0.06ITALYEUR 1,700,000 INTESA SANPAOLO SPA 2.00% 18/06/2021 1,735,478 0.15ITALYEUR 800,000 INTESA SANPAOLO SPA 3.50% 17/01/2022 849,486 0.07ITALYEUR 900,000 INTESA SANPAOLO SPA 4.00% 30/10/2023 980,915 0.09ITALYEUR 1,800,000 INTESA SANPAOLO SPA 4.125% 14/04/2020 1,894,260 0.17ITALYEUR 800,000 INTESA SANPAOLO SPA 4.375% 15/10/2019 832,087 0.07ITALYEUR 800,000 IREN SPA 0.875% 04/11/2024 764,671 0.07ITALYEUR 1,500,000 ITALGAS SPA 1.125% 14/03/2024 1,476,118 0.13ITALYEUR 2,000,000 MEDIOBANCA SPA FRN 18/05/2022 1,926,140 0.17ITALYEUR 1,520,000 MEDIOBANCA SPA 0.75% 17/02/2020 1,519,994 0.13ITALYEUR 1,300,000 PRYSMIAN SPA 2.50% 11/04/2022 1,331,278 0.12ITALYEUR 410,000 SAIPEM FINANCE INTERNATIONAL BV 3.00% 08/03/2021 427,474 0.04ITALYEUR 1,400,000 SNAM SPA 0.875% 25/10/2026 1,288,108 0.11ITALYEUR 2,422,000 SOCIETA ESERCIZI AEREOPORTUALI SPA SEA 3.125%
17/04/20212,577,299 0.23ITALY
Country
Statement of Investment Portfolio and Other Net Assets AUGUST 31, 2018
Notional or number of units / shares
ownedMarket Value
EUR% of Net
Assets
INTERFUND EURO CORPORATE BOND
(continued)
Similar issues with same maturities have not been combined when issuance date differs.The accompanying notes are an integral part of these financial statements.General note: differences in sums, if any, are due to rounding.
Currency
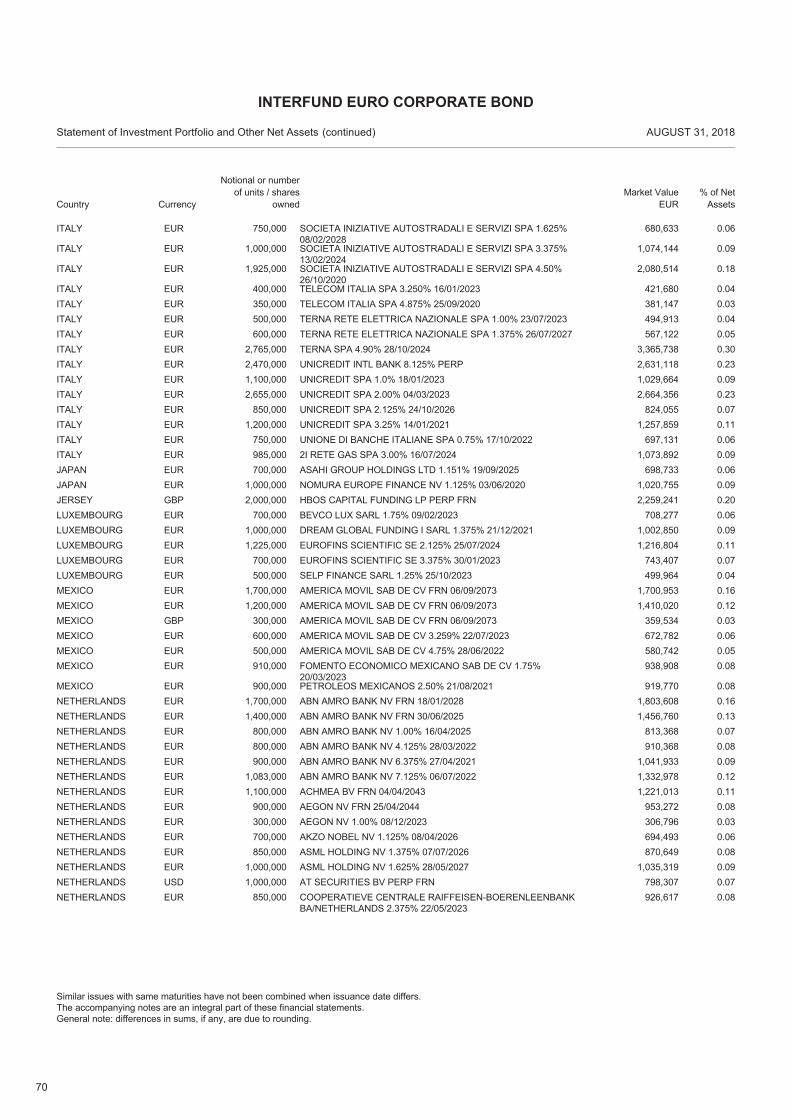
70
EUR 750,000 SOCIETA INIZIATIVE AUTOSTRADALI E SERVIZI SPA 1.625%08/02/2028
680,633 0.06ITALY
EUR 1,000,000 SOCIETA INIZIATIVE AUTOSTRADALI E SERVIZI SPA 3.375%13/02/2024
1,074,144 0.09ITALY
EUR 1,925,000 SOCIETA INIZIATIVE AUTOSTRADALI E SERVIZI SPA 4.50%26/10/2020
2,080,514 0.18ITALY
EUR 400,000 TELECOM ITALIA SPA 3.250% 16/01/2023 421,680 0.04ITALYEUR 350,000 TELECOM ITALIA SPA 4.875% 25/09/2020 381,147 0.03ITALYEUR 500,000 TERNA RETE ELETTRICA NAZIONALE SPA 1.00% 23/07/2023 494,913 0.04ITALYEUR 600,000 TERNA RETE ELETTRICA NAZIONALE SPA 1.375% 26/07/2027 567,122 0.05ITALYEUR 2,765,000 TERNA SPA 4.90% 28/10/2024 3,365,738 0.30ITALYEUR 2,470,000 UNICREDIT INTL BANK 8.125% PERP 2,631,118 0.23ITALYEUR 1,100,000 UNICREDIT SPA 1.0% 18/01/2023 1,029,664 0.09ITALYEUR 2,655,000 UNICREDIT SPA 2.00% 04/03/2023 2,664,356 0.23ITALYEUR 850,000 UNICREDIT SPA 2.125% 24/10/2026 824,055 0.07ITALYEUR 1,200,000 UNICREDIT SPA 3.25% 14/01/2021 1,257,859 0.11ITALYEUR 750,000 UNIONE DI BANCHE ITALIANE SPA 0.75% 17/10/2022 697,131 0.06ITALYEUR 985,000 2I RETE GAS SPA 3.00% 16/07/2024 1,073,892 0.09ITALYEUR 700,000 ASAHI GROUP HOLDINGS LTD 1.151% 19/09/2025 698,733 0.06JAPANEUR 1,000,000 NOMURA EUROPE FINANCE NV 1.125% 03/06/2020 1,020,755 0.09JAPANGBP 2,000,000 HBOS CAPITAL FUNDING LP PERP FRN 2,259,241 0.20JERSEYEUR 700,000 BEVCO LUX SARL 1.75% 09/02/2023 708,277 0.06LUXEMBOURGEUR 1,000,000 DREAM GLOBAL FUNDING I SARL 1.375% 21/12/2021 1,002,850 0.09LUXEMBOURGEUR 1,225,000 EUROFINS SCIENTIFIC SE 2.125% 25/07/2024 1,216,804 0.11LUXEMBOURGEUR 700,000 EUROFINS SCIENTIFIC SE 3.375% 30/01/2023 743,407 0.07LUXEMBOURGEUR 500,000 SELP FINANCE SARL 1.25% 25/10/2023 499,964 0.04LUXEMBOURGEUR 1,700,000 AMERICA MOVIL SAB DE CV FRN 06/09/2073 1,700,953 0.16MEXICOEUR 1,200,000 AMERICA MOVIL SAB DE CV FRN 06/09/2073 1,410,020 0.12MEXICOGBP 300,000 AMERICA MOVIL SAB DE CV FRN 06/09/2073 359,534 0.03MEXICOEUR 600,000 AMERICA MOVIL SAB DE CV 3.259% 22/07/2023 672,782 0.06MEXICOEUR 500,000 AMERICA MOVIL SAB DE CV 4.75% 28/06/2022 580,742 0.05MEXICOEUR 910,000 FOMENTO ECONOMICO MEXICANO SAB DE CV 1.75%
20/03/2023938,908 0.08MEXICO
EUR 900,000 PETROLEOS MEXICANOS 2.50% 21/08/2021 919,770 0.08MEXICOEUR 1,700,000 ABN AMRO BANK NV FRN 18/01/2028 1,803,608 0.16NETHERLANDSEUR 1,400,000 ABN AMRO BANK NV FRN 30/06/2025 1,456,760 0.13NETHERLANDSEUR 800,000 ABN AMRO BANK NV 1.00% 16/04/2025 813,368 0.07NETHERLANDSEUR 800,000 ABN AMRO BANK NV 4.125% 28/03/2022 910,368 0.08NETHERLANDSEUR 900,000 ABN AMRO BANK NV 6.375% 27/04/2021 1,041,933 0.09NETHERLANDSEUR 1,083,000 ABN AMRO BANK NV 7.125% 06/07/2022 1,332,978 0.12NETHERLANDSEUR 1,100,000 ACHMEA BV FRN 04/04/2043 1,221,013 0.11NETHERLANDSEUR 900,000 AEGON NV FRN 25/04/2044 953,272 0.08NETHERLANDSEUR 300,000 AEGON NV 1.00% 08/12/2023 306,796 0.03NETHERLANDSEUR 700,000 AKZO NOBEL NV 1.125% 08/04/2026 694,493 0.06NETHERLANDSEUR 850,000 ASML HOLDING NV 1.375% 07/07/2026 870,649 0.08NETHERLANDSEUR 1,000,000 ASML HOLDING NV 1.625% 28/05/2027 1,035,319 0.09NETHERLANDSUSD 1,000,000 AT SECURITIES BV PERP FRN 798,307 0.07NETHERLANDSEUR 850,000 COOPERATIEVE CENTRALE RAIFFEISEN-BOERENLEENBANK
BA/NETHERLANDS 2.375% 22/05/2023926,617 0.08NETHERLANDS
Country
Statement of Investment Portfolio and Other Net Assets AUGUST 31, 2018
Notional or number of units / shares
ownedMarket Value
EUR% of Net
Assets
INTERFUND EURO CORPORATE BOND
(continued)
Similar issues with same maturities have not been combined when issuance date differs.The accompanying notes are an integral part of these financial statements.General note: differences in sums, if any, are due to rounding.
Currency
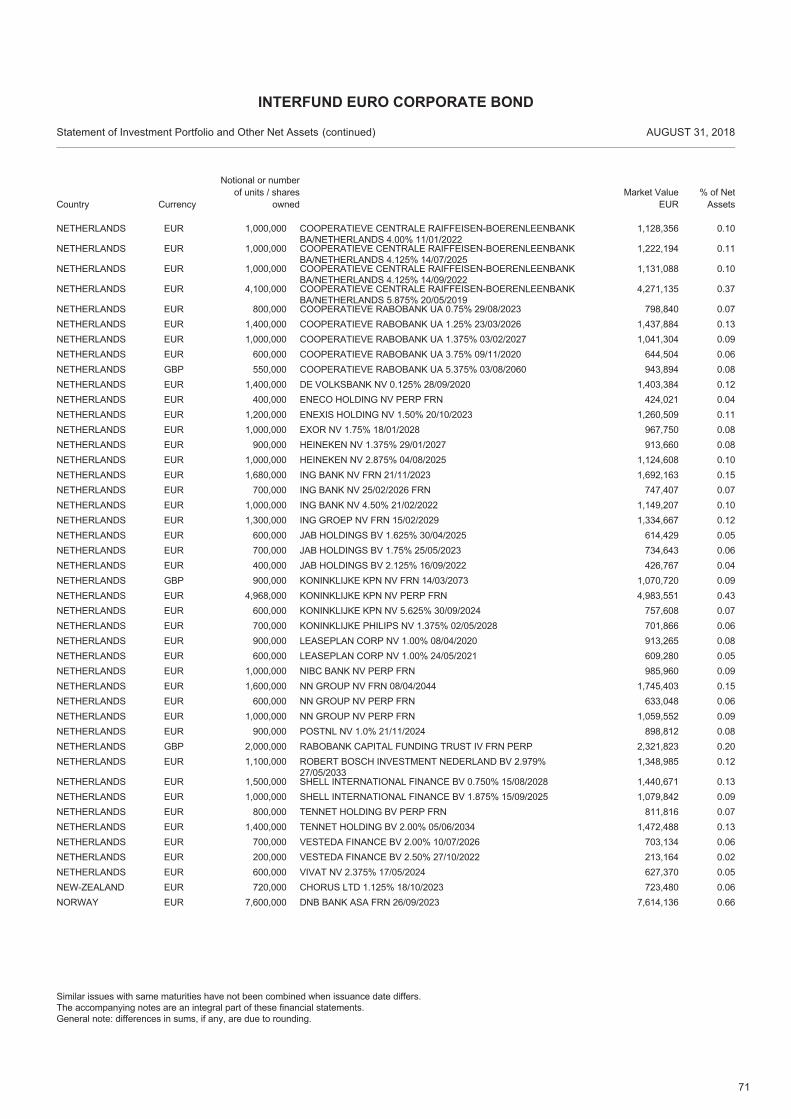
71
EUR 1,000,000 COOPERATIEVE CENTRALE RAIFFEISEN-BOERENLEENBANKBA/NETHERLANDS 4.00% 11/01/2022
1,128,356 0.10NETHERLANDS
EUR 1,000,000 COOPERATIEVE CENTRALE RAIFFEISEN-BOERENLEENBANKBA/NETHERLANDS 4.125% 14/07/2025
1,222,194 0.11NETHERLANDS
EUR 1,000,000 COOPERATIEVE CENTRALE RAIFFEISEN-BOERENLEENBANKBA/NETHERLANDS 4.125% 14/09/2022
1,131,088 0.10NETHERLANDS
EUR 4,100,000 COOPERATIEVE CENTRALE RAIFFEISEN-BOERENLEENBANKBA/NETHERLANDS 5.875% 20/05/2019
4,271,135 0.37NETHERLANDS
EUR 800,000 COOPERATIEVE RABOBANK UA 0.75% 29/08/2023 798,840 0.07NETHERLANDSEUR 1,400,000 COOPERATIEVE RABOBANK UA 1.25% 23/03/2026 1,437,884 0.13NETHERLANDSEUR 1,000,000 COOPERATIEVE RABOBANK UA 1.375% 03/02/2027 1,041,304 0.09NETHERLANDSEUR 600,000 COOPERATIEVE RABOBANK UA 3.75% 09/11/2020 644,504 0.06NETHERLANDSGBP 550,000 COOPERATIEVE RABOBANK UA 5.375% 03/08/2060 943,894 0.08NETHERLANDSEUR 1,400,000 DE VOLKSBANK NV 0.125% 28/09/2020 1,403,384 0.12NETHERLANDSEUR 400,000 ENECO HOLDING NV PERP FRN 424,021 0.04NETHERLANDSEUR 1,200,000 ENEXIS HOLDING NV 1.50% 20/10/2023 1,260,509 0.11NETHERLANDSEUR 1,000,000 EXOR NV 1.75% 18/01/2028 967,750 0.08NETHERLANDSEUR 900,000 HEINEKEN NV 1.375% 29/01/2027 913,660 0.08NETHERLANDSEUR 1,000,000 HEINEKEN NV 2.875% 04/08/2025 1,124,608 0.10NETHERLANDSEUR 1,680,000 ING BANK NV FRN 21/11/2023 1,692,163 0.15NETHERLANDSEUR 700,000 ING BANK NV 25/02/2026 FRN 747,407 0.07NETHERLANDSEUR 1,000,000 ING BANK NV 4.50% 21/02/2022 1,149,207 0.10NETHERLANDSEUR 1,300,000 ING GROEP NV FRN 15/02/2029 1,334,667 0.12NETHERLANDSEUR 600,000 JAB HOLDINGS BV 1.625% 30/04/2025 614,429 0.05NETHERLANDSEUR 700,000 JAB HOLDINGS BV 1.75% 25/05/2023 734,643 0.06NETHERLANDSEUR 400,000 JAB HOLDINGS BV 2.125% 16/09/2022 426,767 0.04NETHERLANDSGBP 900,000 KONINKLIJKE KPN NV FRN 14/03/2073 1,070,720 0.09NETHERLANDSEUR 4,968,000 KONINKLIJKE KPN NV PERP FRN 4,983,551 0.43NETHERLANDSEUR 600,000 KONINKLIJKE KPN NV 5.625% 30/09/2024 757,608 0.07NETHERLANDSEUR 700,000 KONINKLIJKE PHILIPS NV 1.375% 02/05/2028 701,866 0.06NETHERLANDSEUR 900,000 LEASEPLAN CORP NV 1.00% 08/04/2020 913,265 0.08NETHERLANDSEUR 600,000 LEASEPLAN CORP NV 1.00% 24/05/2021 609,280 0.05NETHERLANDSEUR 1,000,000 NIBC BANK NV PERP FRN 985,960 0.09NETHERLANDSEUR 1,600,000 NN GROUP NV FRN 08/04/2044 1,745,403 0.15NETHERLANDSEUR 600,000 NN GROUP NV PERP FRN 633,048 0.06NETHERLANDSEUR 1,000,000 NN GROUP NV PERP FRN 1,059,552 0.09NETHERLANDSEUR 900,000 POSTNL NV 1.0% 21/11/2024 898,812 0.08NETHERLANDSGBP 2,000,000 RABOBANK CAPITAL FUNDING TRUST IV FRN PERP 2,321,823 0.20NETHERLANDSEUR 1,100,000 ROBERT BOSCH INVESTMENT NEDERLAND BV 2.979%
27/05/20331,348,985 0.12NETHERLANDS
EUR 1,500,000 SHELL INTERNATIONAL FINANCE BV 0.750% 15/08/2028 1,440,671 0.13NETHERLANDSEUR 1,000,000 SHELL INTERNATIONAL FINANCE BV 1.875% 15/09/2025 1,079,842 0.09NETHERLANDSEUR 800,000 TENNET HOLDING BV PERP FRN 811,816 0.07NETHERLANDSEUR 1,400,000 TENNET HOLDING BV 2.00% 05/06/2034 1,472,488 0.13NETHERLANDSEUR 700,000 VESTEDA FINANCE BV 2.00% 10/07/2026 703,134 0.06NETHERLANDSEUR 200,000 VESTEDA FINANCE BV 2.50% 27/10/2022 213,164 0.02NETHERLANDSEUR 600,000 VIVAT NV 2.375% 17/05/2024 627,370 0.05NETHERLANDSEUR 720,000 CHORUS LTD 1.125% 18/10/2023 723,480 0.06NEW-ZEALANDEUR 7,600,000 DNB BANK ASA FRN 26/09/2023 7,614,136 0.66NORWAY
Country
Statement of Investment Portfolio and Other Net Assets AUGUST 31, 2018
Notional or number of units / shares
ownedMarket Value
EUR% of Net
Assets
INTERFUND EURO CORPORATE BOND
(continued)
Similar issues with same maturities have not been combined when issuance date differs.The accompanying notes are an integral part of these financial statements.General note: differences in sums, if any, are due to rounding.
Currency
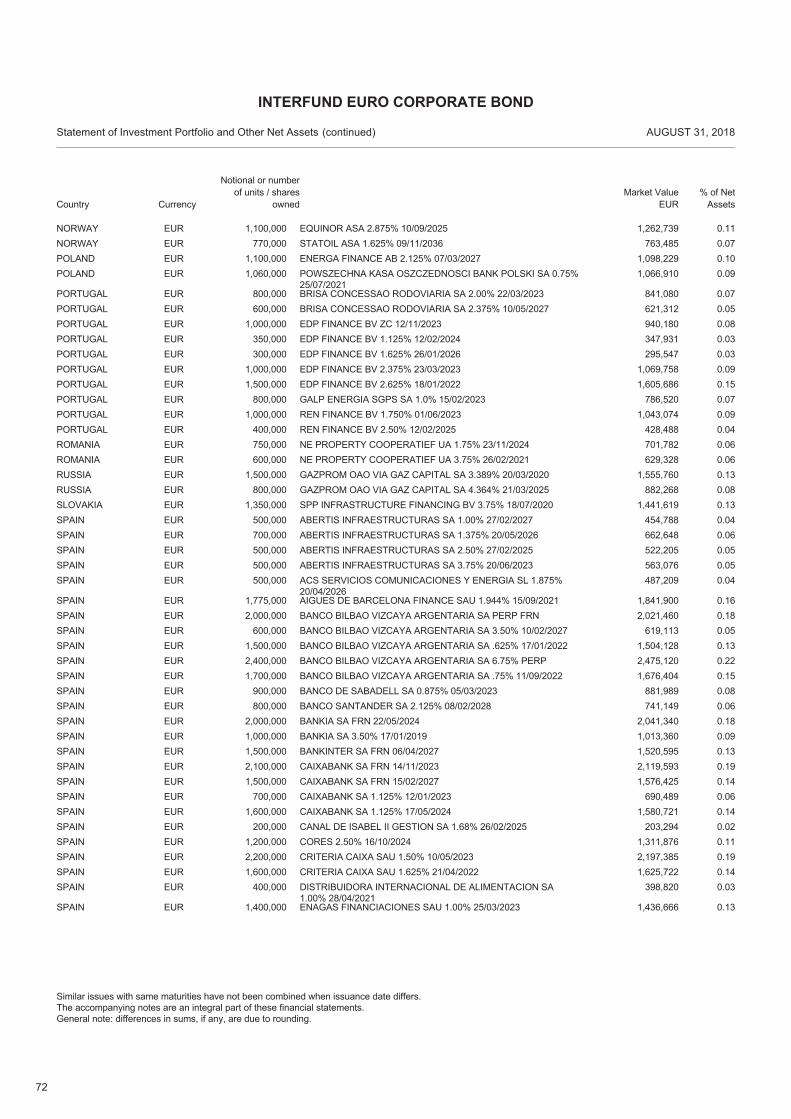
72
EUR 1,100,000 EQUINOR ASA 2.875% 10/09/2025 1,262,739 0.11NORWAYEUR 770,000 STATOIL ASA 1.625% 09/11/2036 763,485 0.07NORWAYEUR 1,100,000 ENERGA FINANCE AB 2.125% 07/03/2027 1,098,229 0.10POLANDEUR 1,060,000 POWSZECHNA KASA OSZCZEDNOSCI BANK POLSKI SA 0.75%
25/07/20211,066,910 0.09POLAND
EUR 800,000 BRISA CONCESSAO RODOVIARIA SA 2.00% 22/03/2023 841,080 0.07PORTUGALEUR 600,000 BRISA CONCESSAO RODOVIARIA SA 2.375% 10/05/2027 621,312 0.05PORTUGALEUR 1,000,000 EDP FINANCE BV ZC 12/11/2023 940,180 0.08PORTUGALEUR 350,000 EDP FINANCE BV 1.125% 12/02/2024 347,931 0.03PORTUGALEUR 300,000 EDP FINANCE BV 1.625% 26/01/2026 295,547 0.03PORTUGALEUR 1,000,000 EDP FINANCE BV 2.375% 23/03/2023 1,069,758 0.09PORTUGALEUR 1,500,000 EDP FINANCE BV 2.625% 18/01/2022 1,605,686 0.15PORTUGALEUR 800,000 GALP ENERGIA SGPS SA 1.0% 15/02/2023 786,520 0.07PORTUGALEUR 1,000,000 REN FINANCE BV 1.750% 01/06/2023 1,043,074 0.09PORTUGALEUR 400,000 REN FINANCE BV 2.50% 12/02/2025 428,488 0.04PORTUGALEUR 750,000 NE PROPERTY COOPERATIEF UA 1.75% 23/11/2024 701,782 0.06ROMANIAEUR 600,000 NE PROPERTY COOPERATIEF UA 3.75% 26/02/2021 629,328 0.06ROMANIAEUR 1,500,000 GAZPROM OAO VIA GAZ CAPITAL SA 3.389% 20/03/2020 1,555,760 0.13RUSSIAEUR 800,000 GAZPROM OAO VIA GAZ CAPITAL SA 4.364% 21/03/2025 882,268 0.08RUSSIAEUR 1,350,000 SPP INFRASTRUCTURE FINANCING BV 3.75% 18/07/2020 1,441,619 0.13SLOVAKIAEUR 500,000 ABERTIS INFRAESTRUCTURAS SA 1.00% 27/02/2027 454,788 0.04SPAINEUR 700,000 ABERTIS INFRAESTRUCTURAS SA 1.375% 20/05/2026 662,648 0.06SPAINEUR 500,000 ABERTIS INFRAESTRUCTURAS SA 2.50% 27/02/2025 522,205 0.05SPAINEUR 500,000 ABERTIS INFRAESTRUCTURAS SA 3.75% 20/06/2023 563,076 0.05SPAINEUR 500,000 ACS SERVICIOS COMUNICACIONES Y ENERGIA SL 1.875%
20/04/2026487,209 0.04SPAIN
EUR 1,775,000 AIGUES DE BARCELONA FINANCE SAU 1.944% 15/09/2021 1,841,900 0.16SPAINEUR 2,000,000 BANCO BILBAO VIZCAYA ARGENTARIA SA PERP FRN 2,021,460 0.18SPAINEUR 600,000 BANCO BILBAO VIZCAYA ARGENTARIA SA 3.50% 10/02/2027 619,113 0.05SPAINEUR 1,500,000 BANCO BILBAO VIZCAYA ARGENTARIA SA .625% 17/01/2022 1,504,128 0.13SPAINEUR 2,400,000 BANCO BILBAO VIZCAYA ARGENTARIA SA 6.75% PERP 2,475,120 0.22SPAINEUR 1,700,000 BANCO BILBAO VIZCAYA ARGENTARIA SA .75% 11/09/2022 1,676,404 0.15SPAINEUR 900,000 BANCO DE SABADELL SA 0.875% 05/03/2023 881,989 0.08SPAINEUR 800,000 BANCO SANTANDER SA 2.125% 08/02/2028 741,149 0.06SPAINEUR 2,000,000 BANKIA SA FRN 22/05/2024 2,041,340 0.18SPAINEUR 1,000,000 BANKIA SA 3.50% 17/01/2019 1,013,360 0.09SPAINEUR 1,500,000 BANKINTER SA FRN 06/04/2027 1,520,595 0.13SPAINEUR 2,100,000 CAIXABANK SA FRN 14/11/2023 2,119,593 0.19SPAINEUR 1,500,000 CAIXABANK SA FRN 15/02/2027 1,576,425 0.14SPAINEUR 700,000 CAIXABANK SA 1.125% 12/01/2023 690,489 0.06SPAINEUR 1,600,000 CAIXABANK SA 1.125% 17/05/2024 1,580,721 0.14SPAINEUR 200,000 CANAL DE ISABEL II GESTION SA 1.68% 26/02/2025 203,294 0.02SPAINEUR 1,200,000 CORES 2.50% 16/10/2024 1,311,876 0.11SPAINEUR 2,200,000 CRITERIA CAIXA SAU 1.50% 10/05/2023 2,197,385 0.19SPAINEUR 1,600,000 CRITERIA CAIXA SAU 1.625% 21/04/2022 1,625,722 0.14SPAINEUR 400,000 DISTRIBUIDORA INTERNACIONAL DE ALIMENTACION SA
1.00% 28/04/2021398,820 0.03SPAIN
EUR 1,400,000 ENAGAS FINANCIACIONES SAU 1.00% 25/03/2023 1,436,666 0.13SPAIN
Country
Statement of Investment Portfolio and Other Net Assets AUGUST 31, 2018
Notional or number of units / shares
ownedMarket Value
EUR% of Net
Assets
INTERFUND EURO CORPORATE BOND
(continued)
Similar issues with same maturities have not been combined when issuance date differs.The accompanying notes are an integral part of these financial statements.General note: differences in sums, if any, are due to rounding.
Currency
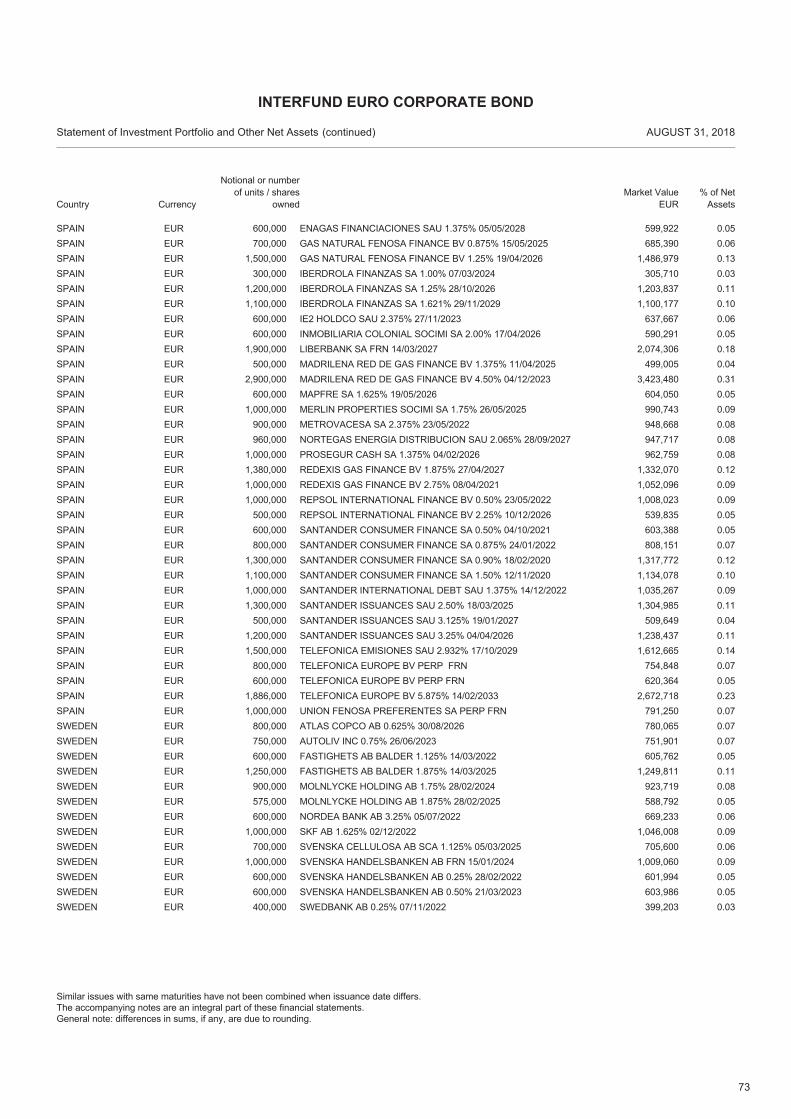
73
EUR 600,000 ENAGAS FINANCIACIONES SAU 1.375% 05/05/2028 599,922 0.05SPAINEUR 700,000 GAS NATURAL FENOSA FINANCE BV 0.875% 15/05/2025 685,390 0.06SPAINEUR 1,500,000 GAS NATURAL FENOSA FINANCE BV 1.25% 19/04/2026 1,486,979 0.13SPAINEUR 300,000 IBERDROLA FINANZAS SA 1.00% 07/03/2024 305,710 0.03SPAINEUR 1,200,000 IBERDROLA FINANZAS SA 1.25% 28/10/2026 1,203,837 0.11SPAINEUR 1,100,000 IBERDROLA FINANZAS SA 1.621% 29/11/2029 1,100,177 0.10SPAINEUR 600,000 IE2 HOLDCO SAU 2.375% 27/11/2023 637,667 0.06SPAINEUR 600,000 INMOBILIARIA COLONIAL SOCIMI SA 2.00% 17/04/2026 590,291 0.05SPAINEUR 1,900,000 LIBERBANK SA FRN 14/03/2027 2,074,306 0.18SPAINEUR 500,000 MADRILENA RED DE GAS FINANCE BV 1.375% 11/04/2025 499,005 0.04SPAINEUR 2,900,000 MADRILENA RED DE GAS FINANCE BV 4.50% 04/12/2023 3,423,480 0.31SPAINEUR 600,000 MAPFRE SA 1.625% 19/05/2026 604,050 0.05SPAINEUR 1,000,000 MERLIN PROPERTIES SOCIMI SA 1.75% 26/05/2025 990,743 0.09SPAINEUR 900,000 METROVACESA SA 2.375% 23/05/2022 948,668 0.08SPAINEUR 960,000 NORTEGAS ENERGIA DISTRIBUCION SAU 2.065% 28/09/2027 947,717 0.08SPAINEUR 1,000,000 PROSEGUR CASH SA 1.375% 04/02/2026 962,759 0.08SPAINEUR 1,380,000 REDEXIS GAS FINANCE BV 1.875% 27/04/2027 1,332,070 0.12SPAINEUR 1,000,000 REDEXIS GAS FINANCE BV 2.75% 08/04/2021 1,052,096 0.09SPAINEUR 1,000,000 REPSOL INTERNATIONAL FINANCE BV 0.50% 23/05/2022 1,008,023 0.09SPAINEUR 500,000 REPSOL INTERNATIONAL FINANCE BV 2.25% 10/12/2026 539,835 0.05SPAINEUR 600,000 SANTANDER CONSUMER FINANCE SA 0.50% 04/10/2021 603,388 0.05SPAINEUR 800,000 SANTANDER CONSUMER FINANCE SA 0.875% 24/01/2022 808,151 0.07SPAINEUR 1,300,000 SANTANDER CONSUMER FINANCE SA 0.90% 18/02/2020 1,317,772 0.12SPAINEUR 1,100,000 SANTANDER CONSUMER FINANCE SA 1.50% 12/11/2020 1,134,078 0.10SPAINEUR 1,000,000 SANTANDER INTERNATIONAL DEBT SAU 1.375% 14/12/2022 1,035,267 0.09SPAINEUR 1,300,000 SANTANDER ISSUANCES SAU 2.50% 18/03/2025 1,304,985 0.11SPAINEUR 500,000 SANTANDER ISSUANCES SAU 3.125% 19/01/2027 509,649 0.04SPAINEUR 1,200,000 SANTANDER ISSUANCES SAU 3.25% 04/04/2026 1,238,437 0.11SPAINEUR 1,500,000 TELEFONICA EMISIONES SAU 2.932% 17/10/2029 1,612,665 0.14SPAINEUR 800,000 TELEFONICA EUROPE BV PERP FRN 754,848 0.07SPAINEUR 600,000 TELEFONICA EUROPE BV PERP FRN 620,364 0.05SPAINEUR 1,886,000 TELEFONICA EUROPE BV 5.875% 14/02/2033 2,672,718 0.23SPAINEUR 1,000,000 UNION FENOSA PREFERENTES SA PERP FRN 791,250 0.07SPAINEUR 800,000 ATLAS COPCO AB 0.625% 30/08/2026 780,065 0.07SWEDENEUR 750,000 AUTOLIV INC 0.75% 26/06/2023 751,901 0.07SWEDENEUR 600,000 FASTIGHETS AB BALDER 1.125% 14/03/2022 605,762 0.05SWEDENEUR 1,250,000 FASTIGHETS AB BALDER 1.875% 14/03/2025 1,249,811 0.11SWEDENEUR 900,000 MOLNLYCKE HOLDING AB 1.75% 28/02/2024 923,719 0.08SWEDENEUR 575,000 MOLNLYCKE HOLDING AB 1.875% 28/02/2025 588,792 0.05SWEDENEUR 600,000 NORDEA BANK AB 3.25% 05/07/2022 669,233 0.06SWEDENEUR 1,000,000 SKF AB 1.625% 02/12/2022 1,046,008 0.09SWEDENEUR 700,000 SVENSKA CELLULOSA AB SCA 1.125% 05/03/2025 705,600 0.06SWEDENEUR 1,000,000 SVENSKA HANDELSBANKEN AB FRN 15/01/2024 1,009,060 0.09SWEDENEUR 600,000 SVENSKA HANDELSBANKEN AB 0.25% 28/02/2022 601,994 0.05SWEDENEUR 600,000 SVENSKA HANDELSBANKEN AB 0.50% 21/03/2023 603,986 0.05SWEDENEUR 400,000 SWEDBANK AB 0.25% 07/11/2022 399,203 0.03SWEDEN
Country
Statement of Investment Portfolio and Other Net Assets AUGUST 31, 2018
Notional or number of units / shares
ownedMarket Value
EUR% of Net
Assets
INTERFUND EURO CORPORATE BOND
(continued)
Similar issues with same maturities have not been combined when issuance date differs.The accompanying notes are an integral part of these financial statements.General note: differences in sums, if any, are due to rounding.
Currency
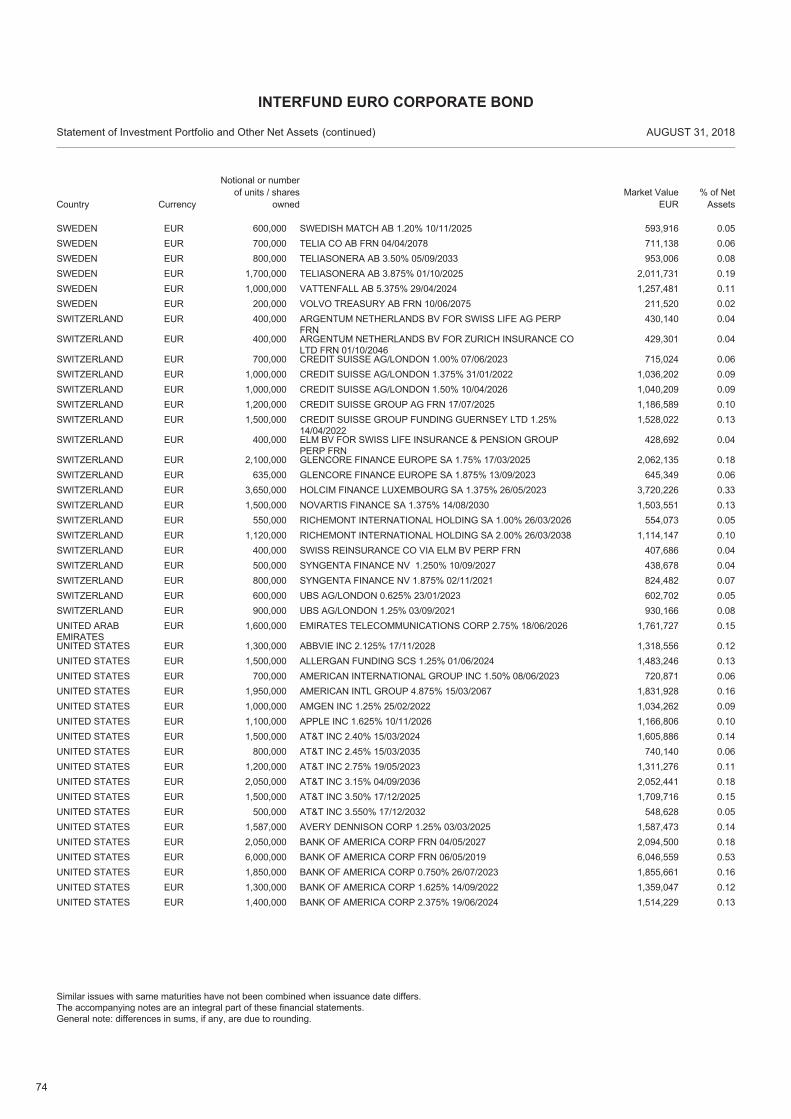
74
EUR 600,000 SWEDISH MATCH AB 1.20% 10/11/2025 593,916 0.05SWEDENEUR 700,000 TELIA CO AB FRN 04/04/2078 711,138 0.06SWEDENEUR 800,000 TELIASONERA AB 3.50% 05/09/2033 953,006 0.08SWEDENEUR 1,700,000 TELIASONERA AB 3.875% 01/10/2025 2,011,731 0.19SWEDENEUR 1,000,000 VATTENFALL AB 5.375% 29/04/2024 1,257,481 0.11SWEDENEUR 200,000 VOLVO TREASURY AB FRN 10/06/2075 211,520 0.02SWEDENEUR 400,000 ARGENTUM NETHERLANDS BV FOR SWISS LIFE AG PERP
FRN430,140 0.04SWITZERLAND
EUR 400,000 ARGENTUM NETHERLANDS BV FOR ZURICH INSURANCE COLTD FRN 01/10/2046
429,301 0.04SWITZERLAND
EUR 700,000 CREDIT SUISSE AG/LONDON 1.00% 07/06/2023 715,024 0.06SWITZERLANDEUR 1,000,000 CREDIT SUISSE AG/LONDON 1.375% 31/01/2022 1,036,202 0.09SWITZERLANDEUR 1,000,000 CREDIT SUISSE AG/LONDON 1.50% 10/04/2026 1,040,209 0.09SWITZERLANDEUR 1,200,000 CREDIT SUISSE GROUP AG FRN 17/07/2025 1,186,589 0.10SWITZERLANDEUR 1,500,000 CREDIT SUISSE GROUP FUNDING GUERNSEY LTD 1.25%
14/04/20221,528,022 0.13SWITZERLAND
EUR 400,000 ELM BV FOR SWISS LIFE INSURANCE & PENSION GROUPPERP FRN
428,692 0.04SWITZERLAND
EUR 2,100,000 GLENCORE FINANCE EUROPE SA 1.75% 17/03/2025 2,062,135 0.18SWITZERLANDEUR 635,000 GLENCORE FINANCE EUROPE SA 1.875% 13/09/2023 645,349 0.06SWITZERLANDEUR 3,650,000 HOLCIM FINANCE LUXEMBOURG SA 1.375% 26/05/2023 3,720,226 0.33SWITZERLANDEUR 1,500,000 NOVARTIS FINANCE SA 1.375% 14/08/2030 1,503,551 0.13SWITZERLANDEUR 550,000 RICHEMONT INTERNATIONAL HOLDING SA 1.00% 26/03/2026 554,073 0.05SWITZERLANDEUR 1,120,000 RICHEMONT INTERNATIONAL HOLDING SA 2.00% 26/03/2038 1,114,147 0.10SWITZERLANDEUR 400,000 SWISS REINSURANCE CO VIA ELM BV PERP FRN 407,686 0.04SWITZERLANDEUR 500,000 SYNGENTA FINANCE NV 1.250% 10/09/2027 438,678 0.04SWITZERLANDEUR 800,000 SYNGENTA FINANCE NV 1.875% 02/11/2021 824,482 0.07SWITZERLANDEUR 600,000 UBS AG/LONDON 0.625% 23/01/2023 602,702 0.05SWITZERLANDEUR 900,000 UBS AG/LONDON 1.25% 03/09/2021 930,166 0.08SWITZERLANDEUR 1,600,000 EMIRATES TELECOMMUNICATIONS CORP 2.75% 18/06/2026 1,761,727 0.15UNITED ARAB
EMIRATESEUR 1,300,000 ABBVIE INC 2.125% 17/11/2028 1,318,556 0.12UNITED STATESEUR 1,500,000 ALLERGAN FUNDING SCS 1.25% 01/06/2024 1,483,246 0.13UNITED STATESEUR 700,000 AMERICAN INTERNATIONAL GROUP INC 1.50% 08/06/2023 720,871 0.06UNITED STATESEUR 1,950,000 AMERICAN INTL GROUP 4.875% 15/03/2067 1,831,928 0.16UNITED STATESEUR 1,000,000 AMGEN INC 1.25% 25/02/2022 1,034,262 0.09UNITED STATESEUR 1,100,000 APPLE INC 1.625% 10/11/2026 1,166,806 0.10UNITED STATESEUR 1,500,000 AT&T INC 2.40% 15/03/2024 1,605,886 0.14UNITED STATESEUR 800,000 AT&T INC 2.45% 15/03/2035 740,140 0.06UNITED STATESEUR 1,200,000 AT&T INC 2.75% 19/05/2023 1,311,276 0.11UNITED STATESEUR 2,050,000 AT&T INC 3.15% 04/09/2036 2,052,441 0.18UNITED STATESEUR 1,500,000 AT&T INC 3.50% 17/12/2025 1,709,716 0.15UNITED STATESEUR 500,000 AT&T INC 3.550% 17/12/2032 548,628 0.05UNITED STATESEUR 1,587,000 AVERY DENNISON CORP 1.25% 03/03/2025 1,587,473 0.14UNITED STATESEUR 2,050,000 BANK OF AMERICA CORP FRN 04/05/2027 2,094,500 0.18UNITED STATESEUR 6,000,000 BANK OF AMERICA CORP FRN 06/05/2019 6,046,559 0.53UNITED STATESEUR 1,850,000 BANK OF AMERICA CORP 0.750% 26/07/2023 1,855,661 0.16UNITED STATESEUR 1,300,000 BANK OF AMERICA CORP 1.625% 14/09/2022 1,359,047 0.12UNITED STATESEUR 1,400,000 BANK OF AMERICA CORP 2.375% 19/06/2024 1,514,229 0.13UNITED STATES
Country
Statement of Investment Portfolio and Other Net Assets AUGUST 31, 2018
Notional or number of units / shares
ownedMarket Value
EUR% of Net
Assets
INTERFUND EURO CORPORATE BOND
(continued)
Similar issues with same maturities have not been combined when issuance date differs.The accompanying notes are an integral part of these financial statements.General note: differences in sums, if any, are due to rounding.
Currency
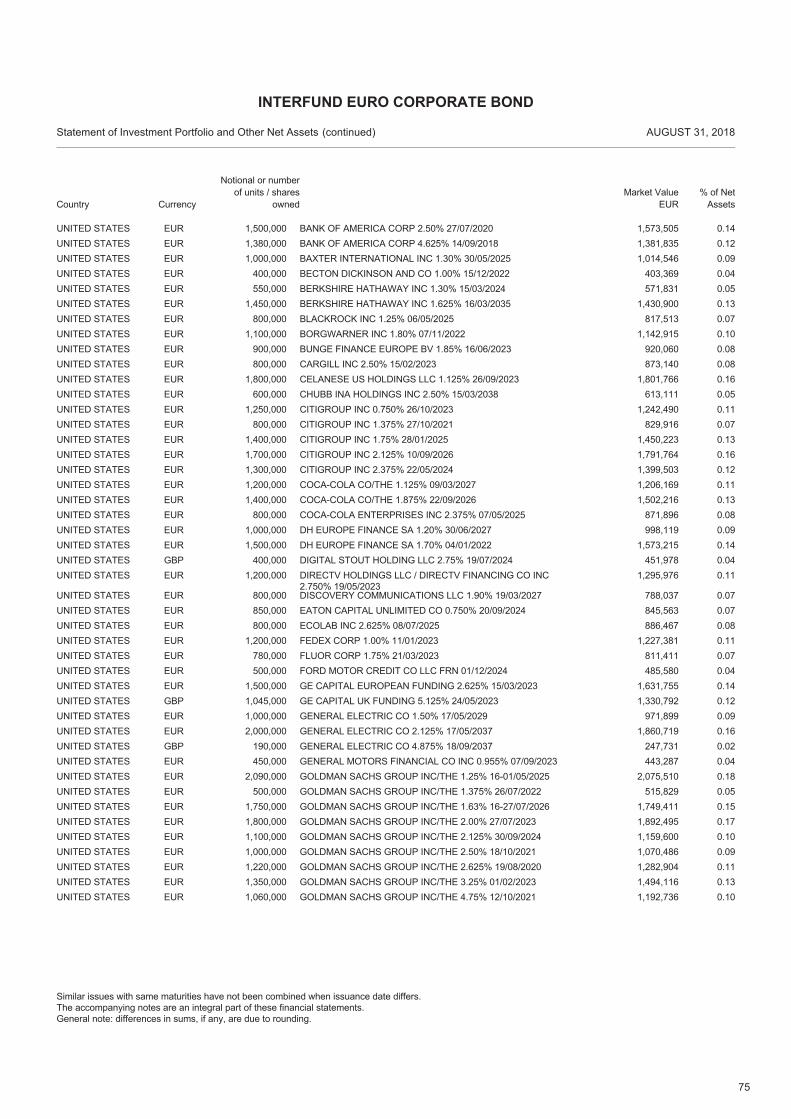
75
EUR 1,500,000 BANK OF AMERICA CORP 2.50% 27/07/2020 1,573,505 0.14UNITED STATESEUR 1,380,000 BANK OF AMERICA CORP 4.625% 14/09/2018 1,381,835 0.12UNITED STATESEUR 1,000,000 BAXTER INTERNATIONAL INC 1.30% 30/05/2025 1,014,546 0.09UNITED STATESEUR 400,000 BECTON DICKINSON AND CO 1.00% 15/12/2022 403,369 0.04UNITED STATESEUR 550,000 BERKSHIRE HATHAWAY INC 1.30% 15/03/2024 571,831 0.05UNITED STATESEUR 1,450,000 BERKSHIRE HATHAWAY INC 1.625% 16/03/2035 1,430,900 0.13UNITED STATESEUR 800,000 BLACKROCK INC 1.25% 06/05/2025 817,513 0.07UNITED STATESEUR 1,100,000 BORGWARNER INC 1.80% 07/11/2022 1,142,915 0.10UNITED STATESEUR 900,000 BUNGE FINANCE EUROPE BV 1.85% 16/06/2023 920,060 0.08UNITED STATESEUR 800,000 CARGILL INC 2.50% 15/02/2023 873,140 0.08UNITED STATESEUR 1,800,000 CELANESE US HOLDINGS LLC 1.125% 26/09/2023 1,801,766 0.16UNITED STATESEUR 600,000 CHUBB INA HOLDINGS INC 2.50% 15/03/2038 613,111 0.05UNITED STATESEUR 1,250,000 CITIGROUP INC 0.750% 26/10/2023 1,242,490 0.11UNITED STATESEUR 800,000 CITIGROUP INC 1.375% 27/10/2021 829,916 0.07UNITED STATESEUR 1,400,000 CITIGROUP INC 1.75% 28/01/2025 1,450,223 0.13UNITED STATESEUR 1,700,000 CITIGROUP INC 2.125% 10/09/2026 1,791,764 0.16UNITED STATESEUR 1,300,000 CITIGROUP INC 2.375% 22/05/2024 1,399,503 0.12UNITED STATESEUR 1,200,000 COCA-COLA CO/THE 1.125% 09/03/2027 1,206,169 0.11UNITED STATESEUR 1,400,000 COCA-COLA CO/THE 1.875% 22/09/2026 1,502,216 0.13UNITED STATESEUR 800,000 COCA-COLA ENTERPRISES INC 2.375% 07/05/2025 871,896 0.08UNITED STATESEUR 1,000,000 DH EUROPE FINANCE SA 1.20% 30/06/2027 998,119 0.09UNITED STATESEUR 1,500,000 DH EUROPE FINANCE SA 1.70% 04/01/2022 1,573,215 0.14UNITED STATESGBP 400,000 DIGITAL STOUT HOLDING LLC 2.75% 19/07/2024 451,978 0.04UNITED STATESEUR 1,200,000 DIRECTV HOLDINGS LLC / DIRECTV FINANCING CO INC
2.750% 19/05/20231,295,976 0.11UNITED STATES
EUR 800,000 DISCOVERY COMMUNICATIONS LLC 1.90% 19/03/2027 788,037 0.07UNITED STATESEUR 850,000 EATON CAPITAL UNLIMITED CO 0.750% 20/09/2024 845,563 0.07UNITED STATESEUR 800,000 ECOLAB INC 2.625% 08/07/2025 886,467 0.08UNITED STATESEUR 1,200,000 FEDEX CORP 1.00% 11/01/2023 1,227,381 0.11UNITED STATESEUR 780,000 FLUOR CORP 1.75% 21/03/2023 811,411 0.07UNITED STATESEUR 500,000 FORD MOTOR CREDIT CO LLC FRN 01/12/2024 485,580 0.04UNITED STATESEUR 1,500,000 GE CAPITAL EUROPEAN FUNDING 2.625% 15/03/2023 1,631,755 0.14UNITED STATESGBP 1,045,000 GE CAPITAL UK FUNDING 5.125% 24/05/2023 1,330,792 0.12UNITED STATESEUR 1,000,000 GENERAL ELECTRIC CO 1.50% 17/05/2029 971,899 0.09UNITED STATESEUR 2,000,000 GENERAL ELECTRIC CO 2.125% 17/05/2037 1,860,719 0.16UNITED STATESGBP 190,000 GENERAL ELECTRIC CO 4.875% 18/09/2037 247,731 0.02UNITED STATESEUR 450,000 GENERAL MOTORS FINANCIAL CO INC 0.955% 07/09/2023 443,287 0.04UNITED STATESEUR 2,090,000 GOLDMAN SACHS GROUP INC/THE 1.25% 16-01/05/2025 2,075,510 0.18UNITED STATESEUR 500,000 GOLDMAN SACHS GROUP INC/THE 1.375% 26/07/2022 515,829 0.05UNITED STATESEUR 1,750,000 GOLDMAN SACHS GROUP INC/THE 1.63% 16-27/07/2026 1,749,411 0.15UNITED STATESEUR 1,800,000 GOLDMAN SACHS GROUP INC/THE 2.00% 27/07/2023 1,892,495 0.17UNITED STATESEUR 1,100,000 GOLDMAN SACHS GROUP INC/THE 2.125% 30/09/2024 1,159,600 0.10UNITED STATESEUR 1,000,000 GOLDMAN SACHS GROUP INC/THE 2.50% 18/10/2021 1,070,486 0.09UNITED STATESEUR 1,220,000 GOLDMAN SACHS GROUP INC/THE 2.625% 19/08/2020 1,282,904 0.11UNITED STATESEUR 1,350,000 GOLDMAN SACHS GROUP INC/THE 3.25% 01/02/2023 1,494,116 0.13UNITED STATESEUR 1,060,000 GOLDMAN SACHS GROUP INC/THE 4.75% 12/10/2021 1,192,736 0.10UNITED STATES
Country
Statement of Investment Portfolio and Other Net Assets AUGUST 31, 2018
Notional or number of units / shares
ownedMarket Value
EUR% of Net
Assets
INTERFUND EURO CORPORATE BOND
(continued)
Similar issues with same maturities have not been combined when issuance date differs.The accompanying notes are an integral part of these financial statements.General note: differences in sums, if any, are due to rounding.
Currency
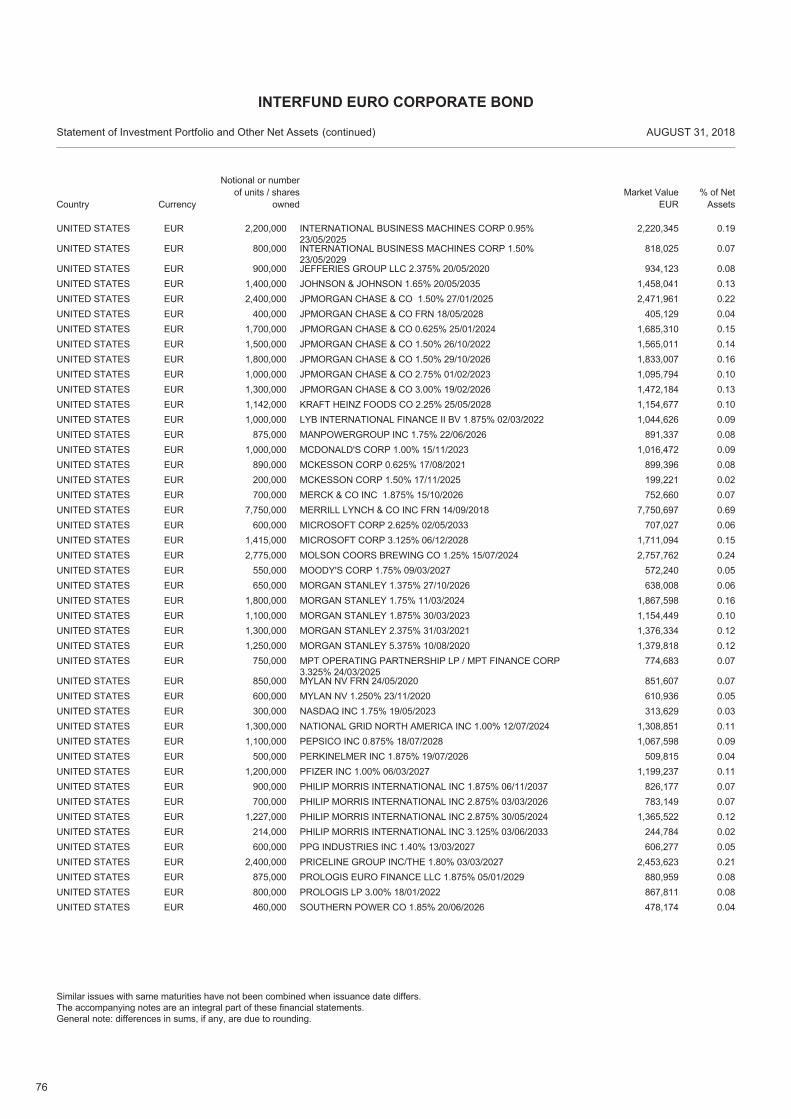
76
EUR 2,200,000 INTERNATIONAL BUSINESS MACHINES CORP 0.95%23/05/2025
2,220,345 0.19UNITED STATES
EUR 800,000 INTERNATIONAL BUSINESS MACHINES CORP 1.50%23/05/2029
818,025 0.07UNITED STATES
EUR 900,000 JEFFERIES GROUP LLC 2.375% 20/05/2020 934,123 0.08UNITED STATESEUR 1,400,000 JOHNSON & JOHNSON 1.65% 20/05/2035 1,458,041 0.13UNITED STATESEUR 2,400,000 JPMORGAN CHASE & CO 1.50% 27/01/2025 2,471,961 0.22UNITED STATESEUR 400,000 JPMORGAN CHASE & CO FRN 18/05/2028 405,129 0.04UNITED STATESEUR 1,700,000 JPMORGAN CHASE & CO 0.625% 25/01/2024 1,685,310 0.15UNITED STATESEUR 1,500,000 JPMORGAN CHASE & CO 1.50% 26/10/2022 1,565,011 0.14UNITED STATESEUR 1,800,000 JPMORGAN CHASE & CO 1.50% 29/10/2026 1,833,007 0.16UNITED STATESEUR 1,000,000 JPMORGAN CHASE & CO 2.75% 01/02/2023 1,095,794 0.10UNITED STATESEUR 1,300,000 JPMORGAN CHASE & CO 3.00% 19/02/2026 1,472,184 0.13UNITED STATESEUR 1,142,000 KRAFT HEINZ FOODS CO 2.25% 25/05/2028 1,154,677 0.10UNITED STATESEUR 1,000,000 LYB INTERNATIONAL FINANCE II BV 1.875% 02/03/2022 1,044,626 0.09UNITED STATESEUR 875,000 MANPOWERGROUP INC 1.75% 22/06/2026 891,337 0.08UNITED STATESEUR 1,000,000 MCDONALD'S CORP 1.00% 15/11/2023 1,016,472 0.09UNITED STATESEUR 890,000 MCKESSON CORP 0.625% 17/08/2021 899,396 0.08UNITED STATESEUR 200,000 MCKESSON CORP 1.50% 17/11/2025 199,221 0.02UNITED STATESEUR 700,000 MERCK & CO INC 1.875% 15/10/2026 752,660 0.07UNITED STATESEUR 7,750,000 MERRILL LYNCH & CO INC FRN 14/09/2018 7,750,697 0.69UNITED STATESEUR 600,000 MICROSOFT CORP 2.625% 02/05/2033 707,027 0.06UNITED STATESEUR 1,415,000 MICROSOFT CORP 3.125% 06/12/2028 1,711,094 0.15UNITED STATESEUR 2,775,000 MOLSON COORS BREWING CO 1.25% 15/07/2024 2,757,762 0.24UNITED STATESEUR 550,000 MOODY'S CORP 1.75% 09/03/2027 572,240 0.05UNITED STATESEUR 650,000 MORGAN STANLEY 1.375% 27/10/2026 638,008 0.06UNITED STATESEUR 1,800,000 MORGAN STANLEY 1.75% 11/03/2024 1,867,598 0.16UNITED STATESEUR 1,100,000 MORGAN STANLEY 1.875% 30/03/2023 1,154,449 0.10UNITED STATESEUR 1,300,000 MORGAN STANLEY 2.375% 31/03/2021 1,376,334 0.12UNITED STATESEUR 1,250,000 MORGAN STANLEY 5.375% 10/08/2020 1,379,818 0.12UNITED STATESEUR 750,000 MPT OPERATING PARTNERSHIP LP / MPT FINANCE CORP
3.325% 24/03/2025774,683 0.07UNITED STATES
EUR 850,000 MYLAN NV FRN 24/05/2020 851,607 0.07UNITED STATESEUR 600,000 MYLAN NV 1.250% 23/11/2020 610,936 0.05UNITED STATESEUR 300,000 NASDAQ INC 1.75% 19/05/2023 313,629 0.03UNITED STATESEUR 1,300,000 NATIONAL GRID NORTH AMERICA INC 1.00% 12/07/2024 1,308,851 0.11UNITED STATESEUR 1,100,000 PEPSICO INC 0.875% 18/07/2028 1,067,598 0.09UNITED STATESEUR 500,000 PERKINELMER INC 1.875% 19/07/2026 509,815 0.04UNITED STATESEUR 1,200,000 PFIZER INC 1.00% 06/03/2027 1,199,237 0.11UNITED STATESEUR 900,000 PHILIP MORRIS INTERNATIONAL INC 1.875% 06/11/2037 826,177 0.07UNITED STATESEUR 700,000 PHILIP MORRIS INTERNATIONAL INC 2.875% 03/03/2026 783,149 0.07UNITED STATESEUR 1,227,000 PHILIP MORRIS INTERNATIONAL INC 2.875% 30/05/2024 1,365,522 0.12UNITED STATESEUR 214,000 PHILIP MORRIS INTERNATIONAL INC 3.125% 03/06/2033 244,784 0.02UNITED STATESEUR 600,000 PPG INDUSTRIES INC 1.40% 13/03/2027 606,277 0.05UNITED STATESEUR 2,400,000 PRICELINE GROUP INC/THE 1.80% 03/03/2027 2,453,623 0.21UNITED STATESEUR 875,000 PROLOGIS EURO FINANCE LLC 1.875% 05/01/2029 880,959 0.08UNITED STATESEUR 800,000 PROLOGIS LP 3.00% 18/01/2022 867,811 0.08UNITED STATESEUR 460,000 SOUTHERN POWER CO 1.85% 20/06/2026 478,174 0.04UNITED STATES
Country
Statement of Investment Portfolio and Other Net Assets AUGUST 31, 2018
Notional or number of units / shares
ownedMarket Value
EUR% of Net
Assets
INTERFUND EURO CORPORATE BOND
(continued)
Similar issues with same maturities have not been combined when issuance date differs.The accompanying notes are an integral part of these financial statements.General note: differences in sums, if any, are due to rounding.
Currency
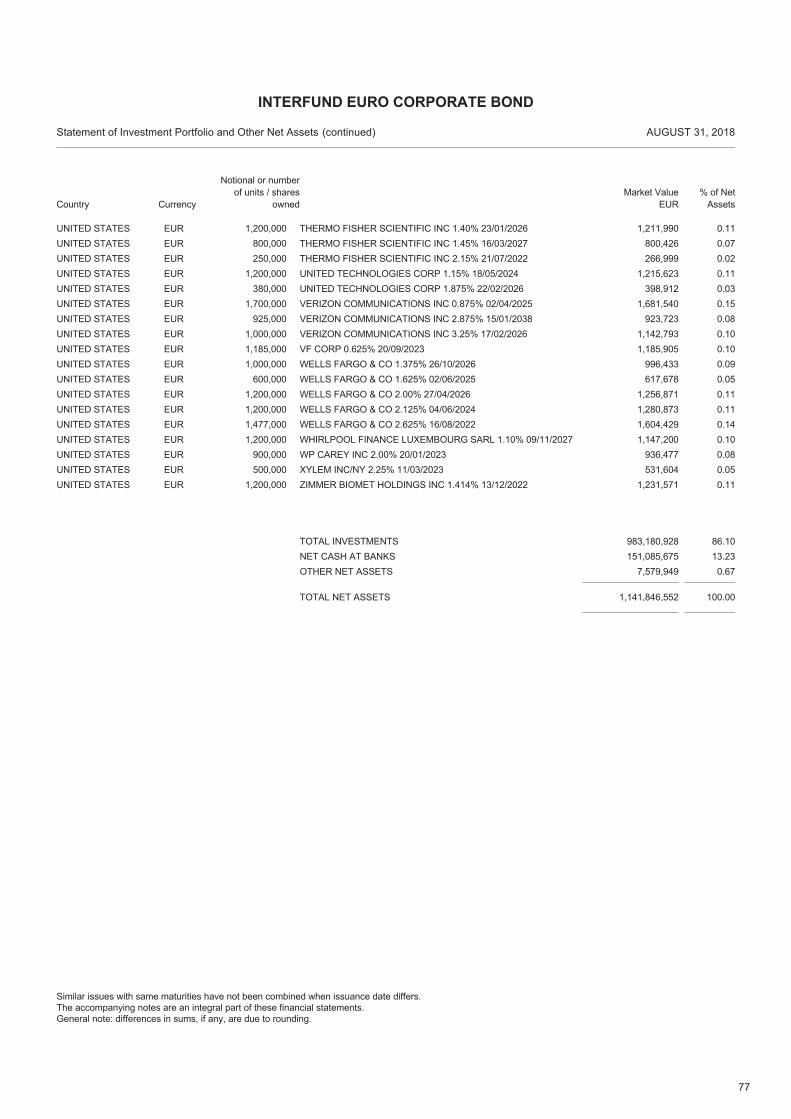
77
EUR 1,200,000 THERMO FISHER SCIENTIFIC INC 1.40% 23/01/2026 1,211,990 0.11UNITED STATESEUR 800,000 THERMO FISHER SCIENTIFIC INC 1.45% 16/03/2027 800,426 0.07UNITED STATESEUR 250,000 THERMO FISHER SCIENTIFIC INC 2.15% 21/07/2022 266,999 0.02UNITED STATESEUR 1,200,000 UNITED TECHNOLOGIES CORP 1.15% 18/05/2024 1,215,623 0.11UNITED STATESEUR 380,000 UNITED TECHNOLOGIES CORP 1.875% 22/02/2026 398,912 0.03UNITED STATESEUR 1,700,000 VERIZON COMMUNICATIONS INC 0.875% 02/04/2025 1,681,540 0.15UNITED STATESEUR 925,000 VERIZON COMMUNICATIONS INC 2.875% 15/01/2038 923,723 0.08UNITED STATESEUR 1,000,000 VERIZON COMMUNICATIONS INC 3.25% 17/02/2026 1,142,793 0.10UNITED STATESEUR 1,185,000 VF CORP 0.625% 20/09/2023 1,185,905 0.10UNITED STATESEUR 1,000,000 WELLS FARGO & CO 1.375% 26/10/2026 996,433 0.09UNITED STATESEUR 600,000 WELLS FARGO & CO 1.625% 02/06/2025 617,678 0.05UNITED STATESEUR 1,200,000 WELLS FARGO & CO 2.00% 27/04/2026 1,256,871 0.11UNITED STATESEUR 1,200,000 WELLS FARGO & CO 2.125% 04/06/2024 1,280,873 0.11UNITED STATESEUR 1,477,000 WELLS FARGO & CO 2.625% 16/08/2022 1,604,429 0.14UNITED STATESEUR 1,200,000 WHIRLPOOL FINANCE LUXEMBOURG SARL 1.10% 09/11/2027 1,147,200 0.10UNITED STATESEUR 900,000 WP CAREY INC 2.00% 20/01/2023 936,477 0.08UNITED STATESEUR 500,000 XYLEM INC/NY 2.25% 11/03/2023 531,604 0.05UNITED STATESEUR 1,200,000 ZIMMER BIOMET HOLDINGS INC 1.414% 13/12/2022 1,231,571 0.11UNITED STATES
TOTAL NET ASSETS 1,141,846,552 100.00
TOTAL INVESTMENTS 983,180,928 86.10NET CASH AT BANKS 151,085,675 13.23OTHER NET ASSETS 7,579,949 0.67
Country
Statement of Investment Portfolio and Other Net Assets AUGUST 31, 2018
Notional or number of units / shares
ownedMarket Value
EUR% of Net
Assets
INTERFUND EURO CORPORATE BOND
(continued)
Similar issues with same maturities have not been combined when issuance date differs.The accompanying notes are an integral part of these financial statements.General note: differences in sums, if any, are due to rounding.
Currency
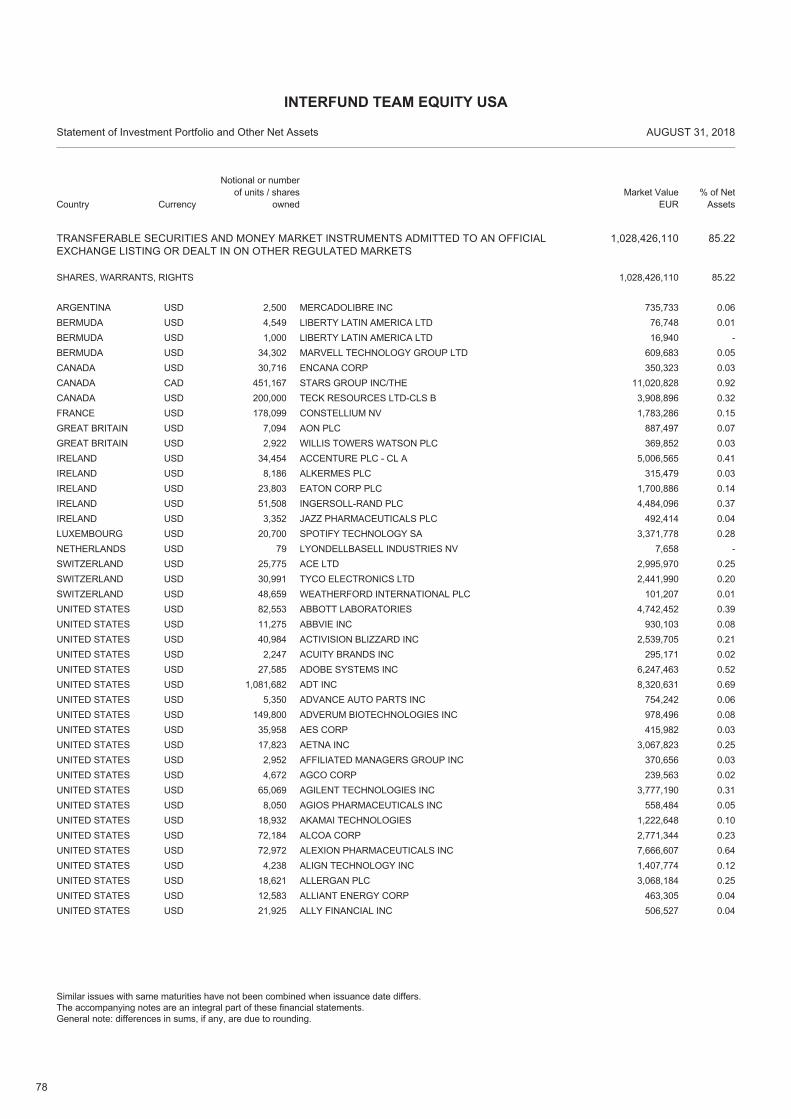
78
TRANSFERABLE SECURITIES AND MONEY MARKET INSTRUMENTS ADMITTED TO AN OFFICIALEXCHANGE LISTING OR DEALT IN ON OTHER REGULATED MARKETS
1,028,426,110 85.22
USD 2,500 MERCADOLIBRE INC 735,733 0.06ARGENTINA
SHARES, WARRANTS, RIGHTS 85.221,028,426,110
USD 4,549 LIBERTY LATIN AMERICA LTD 76,748 0.01BERMUDAUSD 1,000 LIBERTY LATIN AMERICA LTD 16,940 -BERMUDAUSD 34,302 MARVELL TECHNOLOGY GROUP LTD 609,683 0.05BERMUDAUSD 30,716 ENCANA CORP 350,323 0.03CANADACAD 451,167 STARS GROUP INC/THE 11,020,828 0.92CANADAUSD 200,000 TECK RESOURCES LTD-CLS B 3,908,896 0.32CANADAUSD 178,099 CONSTELLIUM NV 1,783,286 0.15FRANCEUSD 7,094 AON PLC 887,497 0.07GREAT BRITAINUSD 2,922 WILLIS TOWERS WATSON PLC 369,852 0.03GREAT BRITAINUSD 34,454 ACCENTURE PLC - CL A 5,006,565 0.41IRELANDUSD 8,186 ALKERMES PLC 315,479 0.03IRELANDUSD 23,803 EATON CORP PLC 1,700,886 0.14IRELANDUSD 51,508 INGERSOLL-RAND PLC 4,484,096 0.37IRELANDUSD 3,352 JAZZ PHARMACEUTICALS PLC 492,414 0.04IRELANDUSD 20,700 SPOTIFY TECHNOLOGY SA 3,371,778 0.28LUXEMBOURGUSD 79 LYONDELLBASELL INDUSTRIES NV 7,658 -NETHERLANDSUSD 25,775 ACE LTD 2,995,970 0.25SWITZERLANDUSD 30,991 TYCO ELECTRONICS LTD 2,441,990 0.20SWITZERLANDUSD 48,659 WEATHERFORD INTERNATIONAL PLC 101,207 0.01SWITZERLANDUSD 82,553 ABBOTT LABORATORIES 4,742,452 0.39UNITED STATESUSD 11,275 ABBVIE INC 930,103 0.08UNITED STATESUSD 40,984 ACTIVISION BLIZZARD INC 2,539,705 0.21UNITED STATESUSD 2,247 ACUITY BRANDS INC 295,171 0.02UNITED STATESUSD 27,585 ADOBE SYSTEMS INC 6,247,463 0.52UNITED STATESUSD 1,081,682 ADT INC 8,320,631 0.69UNITED STATESUSD 5,350 ADVANCE AUTO PARTS INC 754,242 0.06UNITED STATESUSD 149,800 ADVERUM BIOTECHNOLOGIES INC 978,496 0.08UNITED STATESUSD 35,958 AES CORP 415,982 0.03UNITED STATESUSD 17,823 AETNA INC 3,067,823 0.25UNITED STATESUSD 2,952 AFFILIATED MANAGERS GROUP INC 370,656 0.03UNITED STATESUSD 4,672 AGCO CORP 239,563 0.02UNITED STATESUSD 65,069 AGILENT TECHNOLOGIES INC 3,777,190 0.31UNITED STATESUSD 8,050 AGIOS PHARMACEUTICALS INC 558,484 0.05UNITED STATESUSD 18,932 AKAMAI TECHNOLOGIES 1,222,648 0.10UNITED STATESUSD 72,184 ALCOA CORP 2,771,344 0.23UNITED STATESUSD 72,972 ALEXION PHARMACEUTICALS INC 7,666,607 0.64UNITED STATESUSD 4,238 ALIGN TECHNOLOGY INC 1,407,774 0.12UNITED STATESUSD 18,621 ALLERGAN PLC 3,068,184 0.25UNITED STATESUSD 12,583 ALLIANT ENERGY CORP 463,305 0.04UNITED STATESUSD 21,925 ALLY FINANCIAL INC 506,527 0.04UNITED STATES
Country
Statement of Investment Portfolio and Other Net Assets AUGUST 31, 2018
Notional or number of units / shares
ownedMarket Value
EUR% of Net
Assets
INTERFUND TEAM EQUITY USA
Similar issues with same maturities have not been combined when issuance date differs.The accompanying notes are an integral part of these financial statements.General note: differences in sums, if any, are due to rounding.
Currency
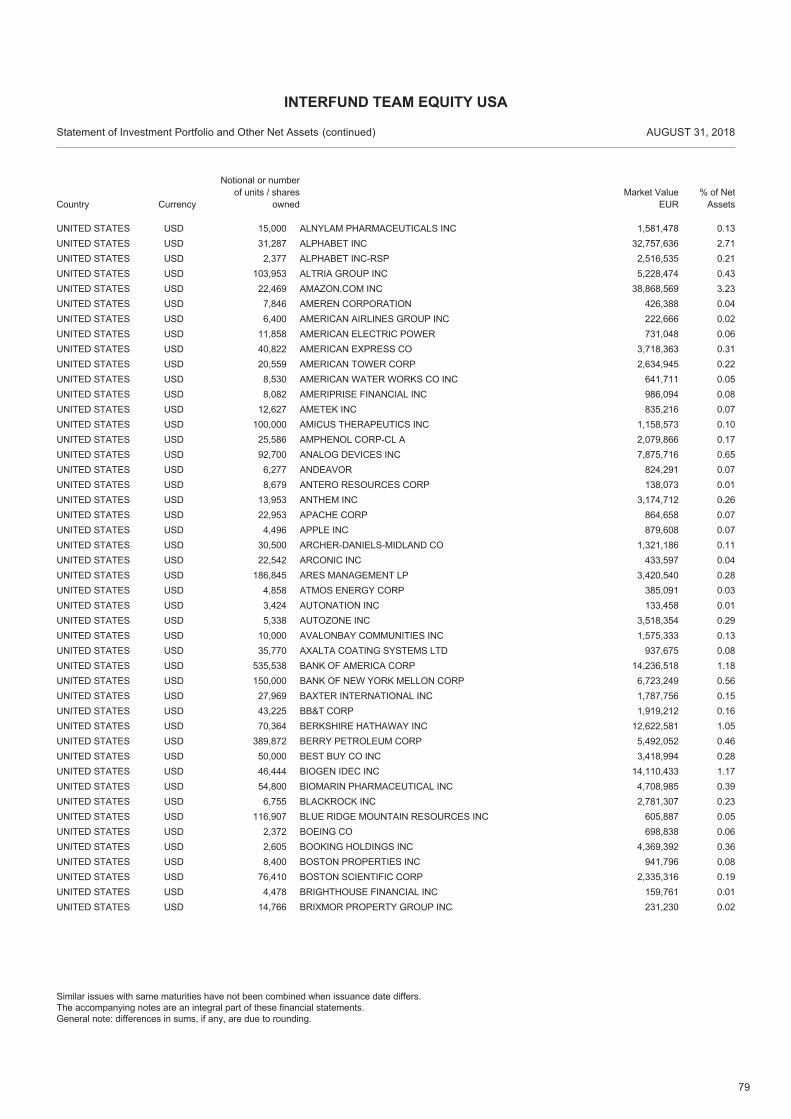
79
USD 15,000 ALNYLAM PHARMACEUTICALS INC 1,581,478 0.13UNITED STATESUSD 31,287 ALPHABET INC 32,757,636 2.71UNITED STATESUSD 2,377 ALPHABET INC-RSP 2,516,535 0.21UNITED STATESUSD 103,953 ALTRIA GROUP INC 5,228,474 0.43UNITED STATESUSD 22,469 AMAZON.COM INC 38,868,569 3.23UNITED STATESUSD 7,846 AMEREN CORPORATION 426,388 0.04UNITED STATESUSD 6,400 AMERICAN AIRLINES GROUP INC 222,666 0.02UNITED STATESUSD 11,858 AMERICAN ELECTRIC POWER 731,048 0.06UNITED STATESUSD 40,822 AMERICAN EXPRESS CO 3,718,363 0.31UNITED STATESUSD 20,559 AMERICAN TOWER CORP 2,634,945 0.22UNITED STATESUSD 8,530 AMERICAN WATER WORKS CO INC 641,711 0.05UNITED STATESUSD 8,082 AMERIPRISE FINANCIAL INC 986,094 0.08UNITED STATESUSD 12,627 AMETEK INC 835,216 0.07UNITED STATESUSD 100,000 AMICUS THERAPEUTICS INC 1,158,573 0.10UNITED STATESUSD 25,586 AMPHENOL CORP-CL A 2,079,866 0.17UNITED STATESUSD 92,700 ANALOG DEVICES INC 7,875,716 0.65UNITED STATESUSD 6,277 ANDEAVOR 824,291 0.07UNITED STATESUSD 8,679 ANTERO RESOURCES CORP 138,073 0.01UNITED STATESUSD 13,953 ANTHEM INC 3,174,712 0.26UNITED STATESUSD 22,953 APACHE CORP 864,658 0.07UNITED STATESUSD 4,496 APPLE INC 879,608 0.07UNITED STATESUSD 30,500 ARCHER-DANIELS-MIDLAND CO 1,321,186 0.11UNITED STATESUSD 22,542 ARCONIC INC 433,597 0.04UNITED STATESUSD 186,845 ARES MANAGEMENT LP 3,420,540 0.28UNITED STATESUSD 4,858 ATMOS ENERGY CORP 385,091 0.03UNITED STATESUSD 3,424 AUTONATION INC 133,458 0.01UNITED STATESUSD 5,338 AUTOZONE INC 3,518,354 0.29UNITED STATESUSD 10,000 AVALONBAY COMMUNITIES INC 1,575,333 0.13UNITED STATESUSD 35,770 AXALTA COATING SYSTEMS LTD 937,675 0.08UNITED STATESUSD 535,538 BANK OF AMERICA CORP 14,236,518 1.18UNITED STATESUSD 150,000 BANK OF NEW YORK MELLON CORP 6,723,249 0.56UNITED STATESUSD 27,969 BAXTER INTERNATIONAL INC 1,787,756 0.15UNITED STATESUSD 43,225 BB&T CORP 1,919,212 0.16UNITED STATESUSD 70,364 BERKSHIRE HATHAWAY INC 12,622,581 1.05UNITED STATESUSD 389,872 BERRY PETROLEUM CORP 5,492,052 0.46UNITED STATESUSD 50,000 BEST BUY CO INC 3,418,994 0.28UNITED STATESUSD 46,444 BIOGEN IDEC INC 14,110,433 1.17UNITED STATESUSD 54,800 BIOMARIN PHARMACEUTICAL INC 4,708,985 0.39UNITED STATESUSD 6,755 BLACKROCK INC 2,781,307 0.23UNITED STATESUSD 116,907 BLUE RIDGE MOUNTAIN RESOURCES INC 605,887 0.05UNITED STATESUSD 2,372 BOEING CO 698,838 0.06UNITED STATESUSD 2,605 BOOKING HOLDINGS INC 4,369,392 0.36UNITED STATESUSD 8,400 BOSTON PROPERTIES INC 941,796 0.08UNITED STATESUSD 76,410 BOSTON SCIENTIFIC CORP 2,335,316 0.19UNITED STATESUSD 4,478 BRIGHTHOUSE FINANCIAL INC 159,761 0.01UNITED STATESUSD 14,766 BRIXMOR PROPERTY GROUP INC 231,230 0.02UNITED STATES
Country
Statement of Investment Portfolio and Other Net Assets AUGUST 31, 2018
Notional or number of units / shares
ownedMarket Value
EUR% of Net
Assets
INTERFUND TEAM EQUITY USA
(continued)
Similar issues with same maturities have not been combined when issuance date differs.The accompanying notes are an integral part of these financial statements.General note: differences in sums, if any, are due to rounding.
Currency
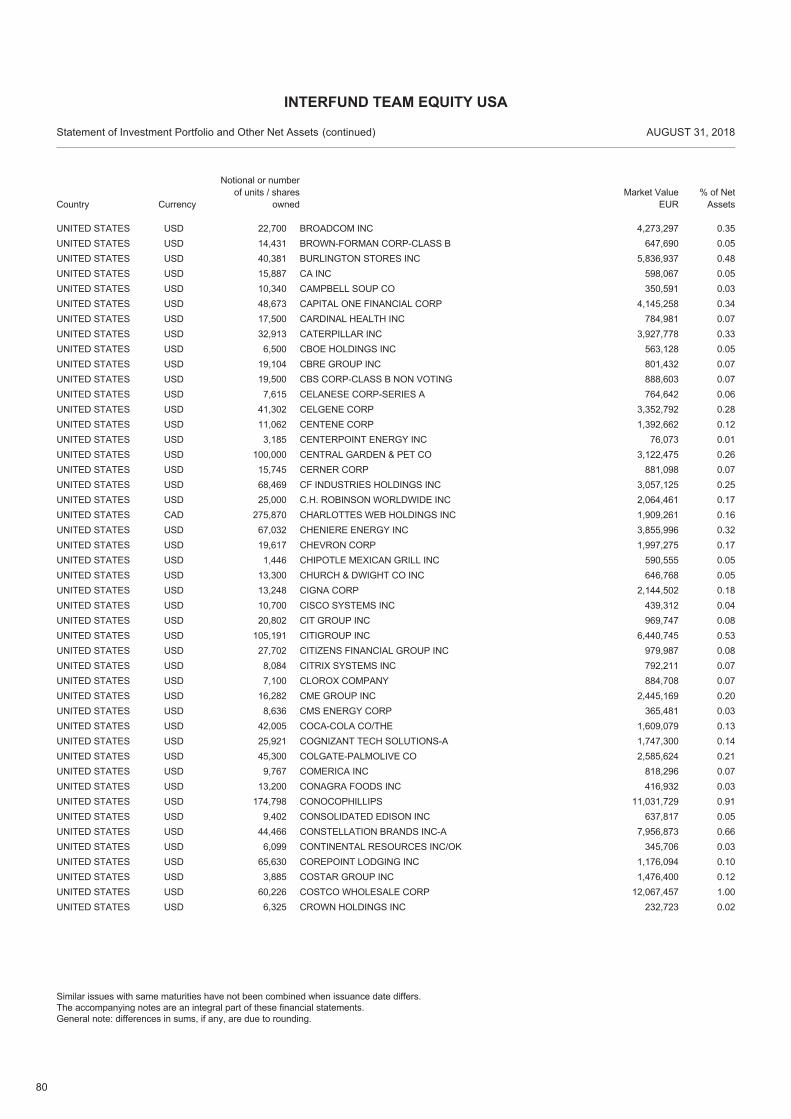
80
USD 22,700 BROADCOM INC 4,273,297 0.35UNITED STATESUSD 14,431 BROWN-FORMAN CORP-CLASS B 647,690 0.05UNITED STATESUSD 40,381 BURLINGTON STORES INC 5,836,937 0.48UNITED STATESUSD 15,887 CA INC 598,067 0.05UNITED STATESUSD 10,340 CAMPBELL SOUP CO 350,591 0.03UNITED STATESUSD 48,673 CAPITAL ONE FINANCIAL CORP 4,145,258 0.34UNITED STATESUSD 17,500 CARDINAL HEALTH INC 784,981 0.07UNITED STATESUSD 32,913 CATERPILLAR INC 3,927,778 0.33UNITED STATESUSD 6,500 CBOE HOLDINGS INC 563,128 0.05UNITED STATESUSD 19,104 CBRE GROUP INC 801,432 0.07UNITED STATESUSD 19,500 CBS CORP-CLASS B NON VOTING 888,603 0.07UNITED STATESUSD 7,615 CELANESE CORP-SERIES A 764,642 0.06UNITED STATESUSD 41,302 CELGENE CORP 3,352,792 0.28UNITED STATESUSD 11,062 CENTENE CORP 1,392,662 0.12UNITED STATESUSD 3,185 CENTERPOINT ENERGY INC 76,073 0.01UNITED STATESUSD 100,000 CENTRAL GARDEN & PET CO 3,122,475 0.26UNITED STATESUSD 15,745 CERNER CORP 881,098 0.07UNITED STATESUSD 68,469 CF INDUSTRIES HOLDINGS INC 3,057,125 0.25UNITED STATESUSD 25,000 C.H. ROBINSON WORLDWIDE INC 2,064,461 0.17UNITED STATESCAD 275,870 CHARLOTTES WEB HOLDINGS INC 1,909,261 0.16UNITED STATESUSD 67,032 CHENIERE ENERGY INC 3,855,996 0.32UNITED STATESUSD 19,617 CHEVRON CORP 1,997,275 0.17UNITED STATESUSD 1,446 CHIPOTLE MEXICAN GRILL INC 590,555 0.05UNITED STATESUSD 13,300 CHURCH & DWIGHT CO INC 646,768 0.05UNITED STATESUSD 13,248 CIGNA CORP 2,144,502 0.18UNITED STATESUSD 10,700 CISCO SYSTEMS INC 439,312 0.04UNITED STATESUSD 20,802 CIT GROUP INC 969,747 0.08UNITED STATESUSD 105,191 CITIGROUP INC 6,440,745 0.53UNITED STATESUSD 27,702 CITIZENS FINANCIAL GROUP INC 979,987 0.08UNITED STATESUSD 8,084 CITRIX SYSTEMS INC 792,211 0.07UNITED STATESUSD 7,100 CLOROX COMPANY 884,708 0.07UNITED STATESUSD 16,282 CME GROUP INC 2,445,169 0.20UNITED STATESUSD 8,636 CMS ENERGY CORP 365,481 0.03UNITED STATESUSD 42,005 COCA-COLA CO/THE 1,609,079 0.13UNITED STATESUSD 25,921 COGNIZANT TECH SOLUTIONS-A 1,747,300 0.14UNITED STATESUSD 45,300 COLGATE-PALMOLIVE CO 2,585,624 0.21UNITED STATESUSD 9,767 COMERICA INC 818,296 0.07UNITED STATESUSD 13,200 CONAGRA FOODS INC 416,932 0.03UNITED STATESUSD 174,798 CONOCOPHILLIPS 11,031,729 0.91UNITED STATESUSD 9,402 CONSOLIDATED EDISON INC 637,817 0.05UNITED STATESUSD 44,466 CONSTELLATION BRANDS INC-A 7,956,873 0.66UNITED STATESUSD 6,099 CONTINENTAL RESOURCES INC/OK 345,706 0.03UNITED STATESUSD 65,630 COREPOINT LODGING INC 1,176,094 0.10UNITED STATESUSD 3,885 COSTAR GROUP INC 1,476,400 0.12UNITED STATESUSD 60,226 COSTCO WHOLESALE CORP 12,067,457 1.00UNITED STATESUSD 6,325 CROWN HOLDINGS INC 232,723 0.02UNITED STATES
Country
Statement of Investment Portfolio and Other Net Assets AUGUST 31, 2018
Notional or number of units / shares
ownedMarket Value
EUR% of Net
Assets
INTERFUND TEAM EQUITY USA
(continued)
Similar issues with same maturities have not been combined when issuance date differs.The accompanying notes are an integral part of these financial statements.General note: differences in sums, if any, are due to rounding.
Currency
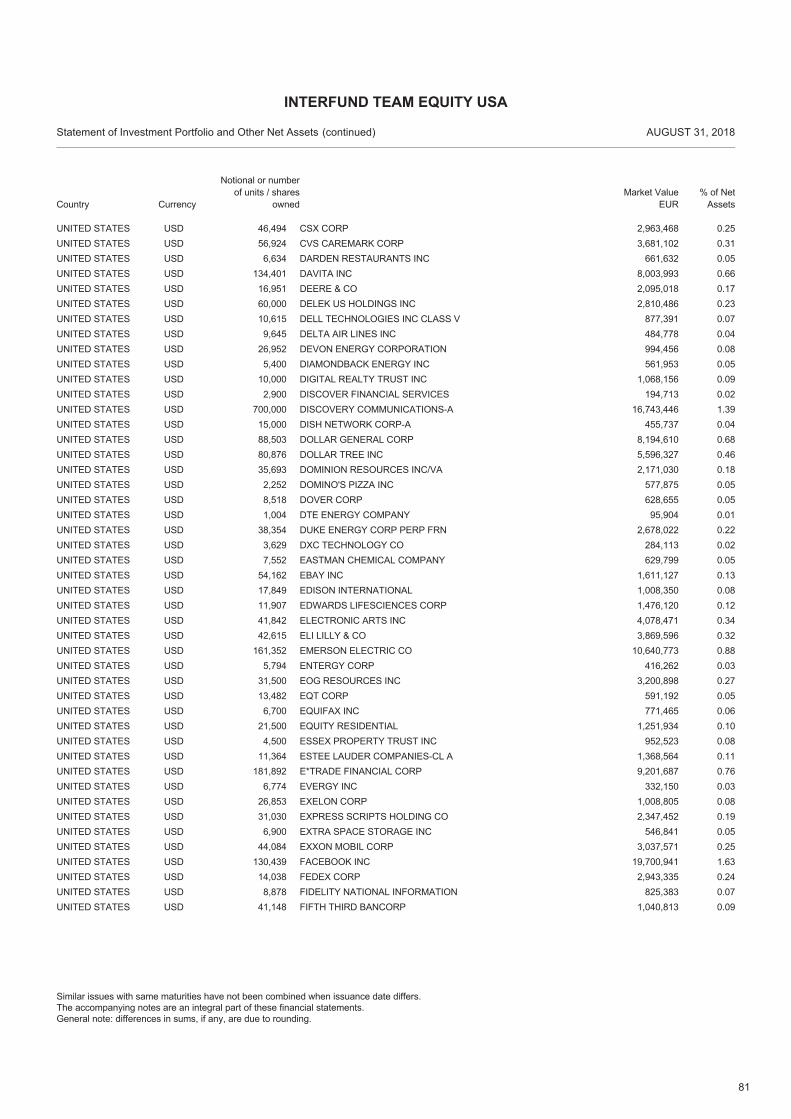
81
USD 46,494 CSX CORP 2,963,468 0.25UNITED STATESUSD 56,924 CVS CAREMARK CORP 3,681,102 0.31UNITED STATESUSD 6,634 DARDEN RESTAURANTS INC 661,632 0.05UNITED STATESUSD 134,401 DAVITA INC 8,003,993 0.66UNITED STATESUSD 16,951 DEERE & CO 2,095,018 0.17UNITED STATESUSD 60,000 DELEK US HOLDINGS INC 2,810,486 0.23UNITED STATESUSD 10,615 DELL TECHNOLOGIES INC CLASS V 877,391 0.07UNITED STATESUSD 9,645 DELTA AIR LINES INC 484,778 0.04UNITED STATESUSD 26,952 DEVON ENERGY CORPORATION 994,456 0.08UNITED STATESUSD 5,400 DIAMONDBACK ENERGY INC 561,953 0.05UNITED STATESUSD 10,000 DIGITAL REALTY TRUST INC 1,068,156 0.09UNITED STATESUSD 2,900 DISCOVER FINANCIAL SERVICES 194,713 0.02UNITED STATESUSD 700,000 DISCOVERY COMMUNICATIONS-A 16,743,446 1.39UNITED STATESUSD 15,000 DISH NETWORK CORP-A 455,737 0.04UNITED STATESUSD 88,503 DOLLAR GENERAL CORP 8,194,610 0.68UNITED STATESUSD 80,876 DOLLAR TREE INC 5,596,327 0.46UNITED STATESUSD 35,693 DOMINION RESOURCES INC/VA 2,171,030 0.18UNITED STATESUSD 2,252 DOMINO'S PIZZA INC 577,875 0.05UNITED STATESUSD 8,518 DOVER CORP 628,655 0.05UNITED STATESUSD 1,004 DTE ENERGY COMPANY 95,904 0.01UNITED STATESUSD 38,354 DUKE ENERGY CORP PERP FRN 2,678,022 0.22UNITED STATESUSD 3,629 DXC TECHNOLOGY CO 284,113 0.02UNITED STATESUSD 7,552 EASTMAN CHEMICAL COMPANY 629,799 0.05UNITED STATESUSD 54,162 EBAY INC 1,611,127 0.13UNITED STATESUSD 17,849 EDISON INTERNATIONAL 1,008,350 0.08UNITED STATESUSD 11,907 EDWARDS LIFESCIENCES CORP 1,476,120 0.12UNITED STATESUSD 41,842 ELECTRONIC ARTS INC 4,078,471 0.34UNITED STATESUSD 42,615 ELI LILLY & CO 3,869,596 0.32UNITED STATESUSD 161,352 EMERSON ELECTRIC CO 10,640,773 0.88UNITED STATESUSD 5,794 ENTERGY CORP 416,262 0.03UNITED STATESUSD 31,500 EOG RESOURCES INC 3,200,898 0.27UNITED STATESUSD 13,482 EQT CORP 591,192 0.05UNITED STATESUSD 6,700 EQUIFAX INC 771,465 0.06UNITED STATESUSD 21,500 EQUITY RESIDENTIAL 1,251,934 0.10UNITED STATESUSD 4,500 ESSEX PROPERTY TRUST INC 952,523 0.08UNITED STATESUSD 11,364 ESTEE LAUDER COMPANIES-CL A 1,368,564 0.11UNITED STATESUSD 181,892 E*TRADE FINANCIAL CORP 9,201,687 0.76UNITED STATESUSD 6,774 EVERGY INC 332,150 0.03UNITED STATESUSD 26,853 EXELON CORP 1,008,805 0.08UNITED STATESUSD 31,030 EXPRESS SCRIPTS HOLDING CO 2,347,452 0.19UNITED STATESUSD 6,900 EXTRA SPACE STORAGE INC 546,841 0.05UNITED STATESUSD 44,084 EXXON MOBIL CORP 3,037,571 0.25UNITED STATESUSD 130,439 FACEBOOK INC 19,700,941 1.63UNITED STATESUSD 14,038 FEDEX CORP 2,943,335 0.24UNITED STATESUSD 8,878 FIDELITY NATIONAL INFORMATION 825,383 0.07UNITED STATESUSD 41,148 FIFTH THIRD BANCORP 1,040,813 0.09UNITED STATES
Country
Statement of Investment Portfolio and Other Net Assets AUGUST 31, 2018
Notional or number of units / shares
ownedMarket Value
EUR% of Net
Assets
INTERFUND TEAM EQUITY USA
(continued)
Similar issues with same maturities have not been combined when issuance date differs.The accompanying notes are an integral part of these financial statements.General note: differences in sums, if any, are due to rounding.
Currency
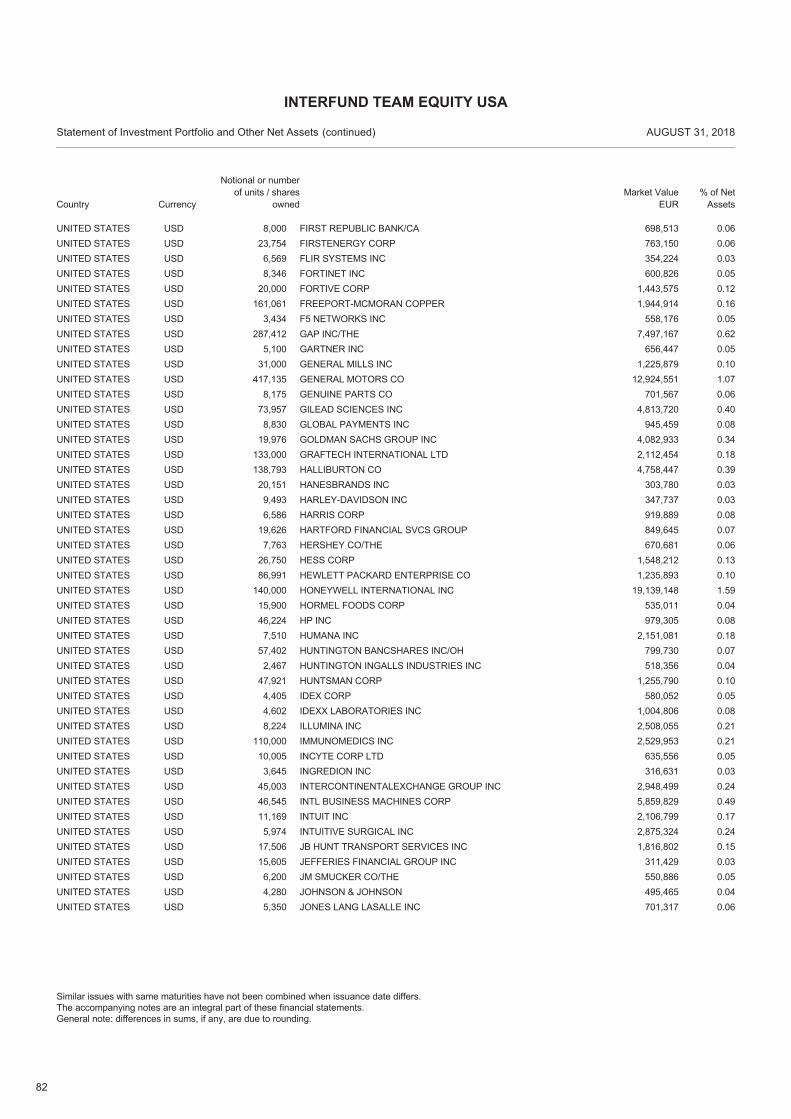
82
USD 8,000 FIRST REPUBLIC BANK/CA 698,513 0.06UNITED STATESUSD 23,754 FIRSTENERGY CORP 763,150 0.06UNITED STATESUSD 6,569 FLIR SYSTEMS INC 354,224 0.03UNITED STATESUSD 8,346 FORTINET INC 600,826 0.05UNITED STATESUSD 20,000 FORTIVE CORP 1,443,575 0.12UNITED STATESUSD 161,061 FREEPORT-MCMORAN COPPER 1,944,914 0.16UNITED STATESUSD 3,434 F5 NETWORKS INC 558,176 0.05UNITED STATESUSD 287,412 GAP INC/THE 7,497,167 0.62UNITED STATESUSD 5,100 GARTNER INC 656,447 0.05UNITED STATESUSD 31,000 GENERAL MILLS INC 1,225,879 0.10UNITED STATESUSD 417,135 GENERAL MOTORS CO 12,924,551 1.07UNITED STATESUSD 8,175 GENUINE PARTS CO 701,567 0.06UNITED STATESUSD 73,957 GILEAD SCIENCES INC 4,813,720 0.40UNITED STATESUSD 8,830 GLOBAL PAYMENTS INC 945,459 0.08UNITED STATESUSD 19,976 GOLDMAN SACHS GROUP INC 4,082,933 0.34UNITED STATESUSD 133,000 GRAFTECH INTERNATIONAL LTD 2,112,454 0.18UNITED STATESUSD 138,793 HALLIBURTON CO 4,758,447 0.39UNITED STATESUSD 20,151 HANESBRANDS INC 303,780 0.03UNITED STATESUSD 9,493 HARLEY-DAVIDSON INC 347,737 0.03UNITED STATESUSD 6,586 HARRIS CORP 919,889 0.08UNITED STATESUSD 19,626 HARTFORD FINANCIAL SVCS GROUP 849,645 0.07UNITED STATESUSD 7,763 HERSHEY CO/THE 670,681 0.06UNITED STATESUSD 26,750 HESS CORP 1,548,212 0.13UNITED STATESUSD 86,991 HEWLETT PACKARD ENTERPRISE CO 1,235,893 0.10UNITED STATESUSD 140,000 HONEYWELL INTERNATIONAL INC 19,139,148 1.59UNITED STATESUSD 15,900 HORMEL FOODS CORP 535,011 0.04UNITED STATESUSD 46,224 HP INC 979,305 0.08UNITED STATESUSD 7,510 HUMANA INC 2,151,081 0.18UNITED STATESUSD 57,402 HUNTINGTON BANCSHARES INC/OH 799,730 0.07UNITED STATESUSD 2,467 HUNTINGTON INGALLS INDUSTRIES INC 518,356 0.04UNITED STATESUSD 47,921 HUNTSMAN CORP 1,255,790 0.10UNITED STATESUSD 4,405 IDEX CORP 580,052 0.05UNITED STATESUSD 4,602 IDEXX LABORATORIES INC 1,004,806 0.08UNITED STATESUSD 8,224 ILLUMINA INC 2,508,055 0.21UNITED STATESUSD 110,000 IMMUNOMEDICS INC 2,529,953 0.21UNITED STATESUSD 10,005 INCYTE CORP LTD 635,556 0.05UNITED STATESUSD 3,645 INGREDION INC 316,631 0.03UNITED STATESUSD 45,003 INTERCONTINENTALEXCHANGE GROUP INC 2,948,499 0.24UNITED STATESUSD 46,545 INTL BUSINESS MACHINES CORP 5,859,829 0.49UNITED STATESUSD 11,169 INTUIT INC 2,106,799 0.17UNITED STATESUSD 5,974 INTUITIVE SURGICAL INC 2,875,324 0.24UNITED STATESUSD 17,506 JB HUNT TRANSPORT SERVICES INC 1,816,802 0.15UNITED STATESUSD 15,605 JEFFERIES FINANCIAL GROUP INC 311,429 0.03UNITED STATESUSD 6,200 JM SMUCKER CO/THE 550,886 0.05UNITED STATESUSD 4,280 JOHNSON & JOHNSON 495,465 0.04UNITED STATESUSD 5,350 JONES LANG LASALLE INC 701,317 0.06UNITED STATES
Country
Statement of Investment Portfolio and Other Net Assets AUGUST 31, 2018
Notional or number of units / shares
ownedMarket Value
EUR% of Net
Assets
INTERFUND TEAM EQUITY USA
(continued)
Similar issues with same maturities have not been combined when issuance date differs.The accompanying notes are an integral part of these financial statements.General note: differences in sums, if any, are due to rounding.
Currency
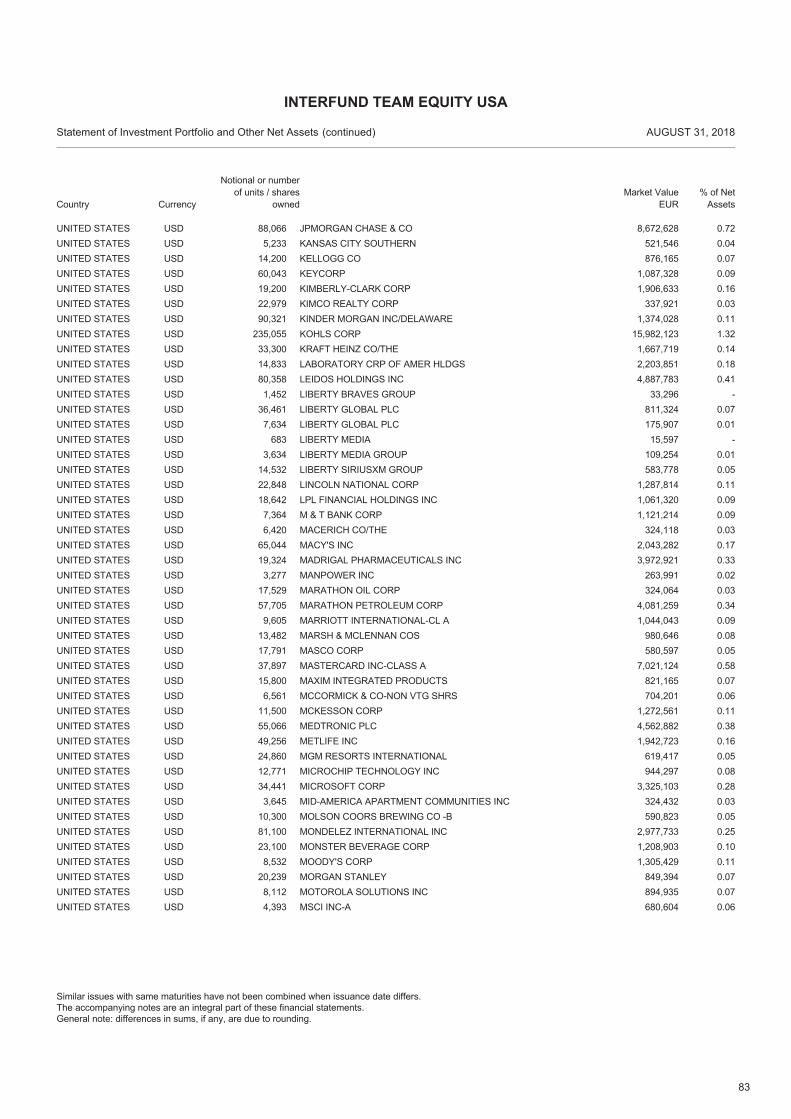
83
USD 88,066 JPMORGAN CHASE & CO 8,672,628 0.72UNITED STATESUSD 5,233 KANSAS CITY SOUTHERN 521,546 0.04UNITED STATESUSD 14,200 KELLOGG CO 876,165 0.07UNITED STATESUSD 60,043 KEYCORP 1,087,328 0.09UNITED STATESUSD 19,200 KIMBERLY-CLARK CORP 1,906,633 0.16UNITED STATESUSD 22,979 KIMCO REALTY CORP 337,921 0.03UNITED STATESUSD 90,321 KINDER MORGAN INC/DELAWARE 1,374,028 0.11UNITED STATESUSD 235,055 KOHLS CORP 15,982,123 1.32UNITED STATESUSD 33,300 KRAFT HEINZ CO/THE 1,667,719 0.14UNITED STATESUSD 14,833 LABORATORY CRP OF AMER HLDGS 2,203,851 0.18UNITED STATESUSD 80,358 LEIDOS HOLDINGS INC 4,887,783 0.41UNITED STATESUSD 1,452 LIBERTY BRAVES GROUP 33,296 -UNITED STATESUSD 36,461 LIBERTY GLOBAL PLC 811,324 0.07UNITED STATESUSD 7,634 LIBERTY GLOBAL PLC 175,907 0.01UNITED STATESUSD 683 LIBERTY MEDIA 15,597 -UNITED STATESUSD 3,634 LIBERTY MEDIA GROUP 109,254 0.01UNITED STATESUSD 14,532 LIBERTY SIRIUSXM GROUP 583,778 0.05UNITED STATESUSD 22,848 LINCOLN NATIONAL CORP 1,287,814 0.11UNITED STATESUSD 18,642 LPL FINANCIAL HOLDINGS INC 1,061,320 0.09UNITED STATESUSD 7,364 M & T BANK CORP 1,121,214 0.09UNITED STATESUSD 6,420 MACERICH CO/THE 324,118 0.03UNITED STATESUSD 65,044 MACY'S INC 2,043,282 0.17UNITED STATESUSD 19,324 MADRIGAL PHARMACEUTICALS INC 3,972,921 0.33UNITED STATESUSD 3,277 MANPOWER INC 263,991 0.02UNITED STATESUSD 17,529 MARATHON OIL CORP 324,064 0.03UNITED STATESUSD 57,705 MARATHON PETROLEUM CORP 4,081,259 0.34UNITED STATESUSD 9,605 MARRIOTT INTERNATIONAL-CL A 1,044,043 0.09UNITED STATESUSD 13,482 MARSH & MCLENNAN COS 980,646 0.08UNITED STATESUSD 17,791 MASCO CORP 580,597 0.05UNITED STATESUSD 37,897 MASTERCARD INC-CLASS A 7,021,124 0.58UNITED STATESUSD 15,800 MAXIM INTEGRATED PRODUCTS 821,165 0.07UNITED STATESUSD 6,561 MCCORMICK & CO-NON VTG SHRS 704,201 0.06UNITED STATESUSD 11,500 MCKESSON CORP 1,272,561 0.11UNITED STATESUSD 55,066 MEDTRONIC PLC 4,562,882 0.38UNITED STATESUSD 49,256 METLIFE INC 1,942,723 0.16UNITED STATESUSD 24,860 MGM RESORTS INTERNATIONAL 619,417 0.05UNITED STATESUSD 12,771 MICROCHIP TECHNOLOGY INC 944,297 0.08UNITED STATESUSD 34,441 MICROSOFT CORP 3,325,103 0.28UNITED STATESUSD 3,645 MID-AMERICA APARTMENT COMMUNITIES INC 324,432 0.03UNITED STATESUSD 10,300 MOLSON COORS BREWING CO -B 590,823 0.05UNITED STATESUSD 81,100 MONDELEZ INTERNATIONAL INC 2,977,733 0.25UNITED STATESUSD 23,100 MONSTER BEVERAGE CORP 1,208,903 0.10UNITED STATESUSD 8,532 MOODY'S CORP 1,305,429 0.11UNITED STATESUSD 20,239 MORGAN STANLEY 849,394 0.07UNITED STATESUSD 8,112 MOTOROLA SOLUTIONS INC 894,935 0.07UNITED STATESUSD 4,393 MSCI INC-A 680,604 0.06UNITED STATES
Country
Statement of Investment Portfolio and Other Net Assets AUGUST 31, 2018
Notional or number of units / shares
ownedMarket Value
EUR% of Net
Assets
INTERFUND TEAM EQUITY USA
(continued)
Similar issues with same maturities have not been combined when issuance date differs.The accompanying notes are an integral part of these financial statements.General note: differences in sums, if any, are due to rounding.
Currency
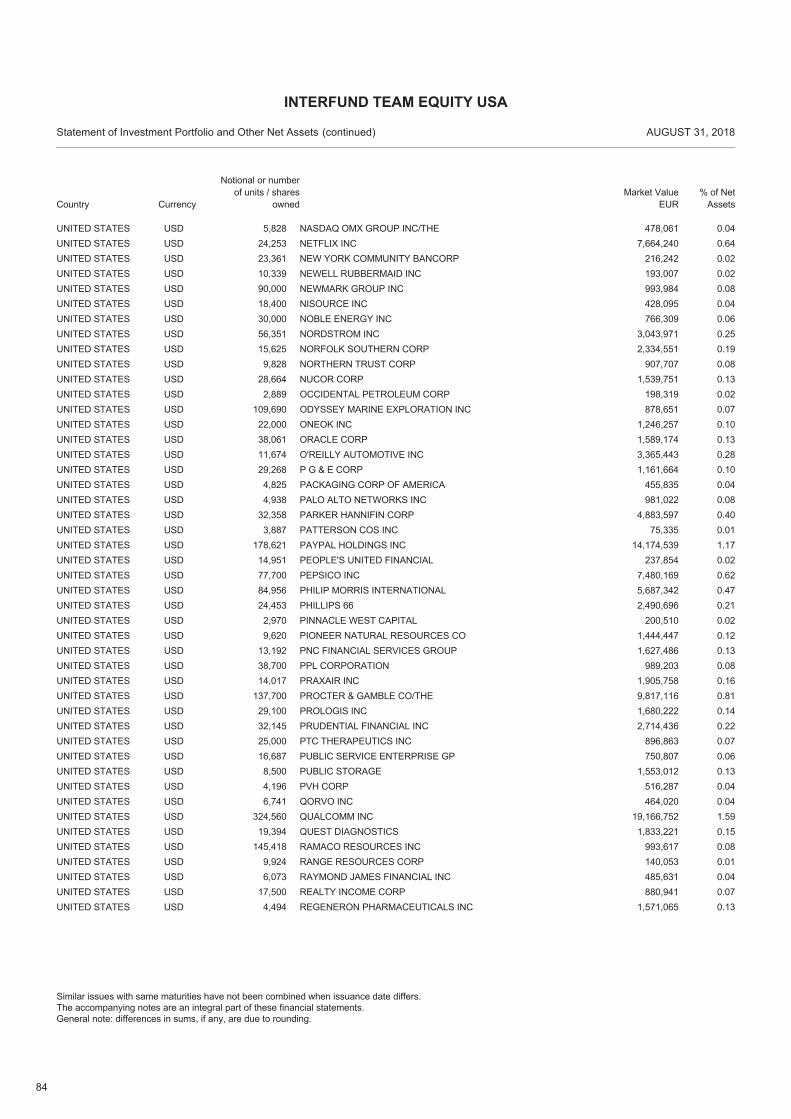
84
USD 5,828 NASDAQ OMX GROUP INC/THE 478,061 0.04UNITED STATESUSD 24,253 NETFLIX INC 7,664,240 0.64UNITED STATESUSD 23,361 NEW YORK COMMUNITY BANCORP 216,242 0.02UNITED STATESUSD 10,339 NEWELL RUBBERMAID INC 193,007 0.02UNITED STATESUSD 90,000 NEWMARK GROUP INC 993,984 0.08UNITED STATESUSD 18,400 NISOURCE INC 428,095 0.04UNITED STATESUSD 30,000 NOBLE ENERGY INC 766,309 0.06UNITED STATESUSD 56,351 NORDSTROM INC 3,043,971 0.25UNITED STATESUSD 15,625 NORFOLK SOUTHERN CORP 2,334,551 0.19UNITED STATESUSD 9,828 NORTHERN TRUST CORP 907,707 0.08UNITED STATESUSD 28,664 NUCOR CORP 1,539,751 0.13UNITED STATESUSD 2,889 OCCIDENTAL PETROLEUM CORP 198,319 0.02UNITED STATESUSD 109,690 ODYSSEY MARINE EXPLORATION INC 878,651 0.07UNITED STATESUSD 22,000 ONEOK INC 1,246,257 0.10UNITED STATESUSD 38,061 ORACLE CORP 1,589,174 0.13UNITED STATESUSD 11,674 O'REILLY AUTOMOTIVE INC 3,365,443 0.28UNITED STATESUSD 29,268 P G & E CORP 1,161,664 0.10UNITED STATESUSD 4,825 PACKAGING CORP OF AMERICA 455,835 0.04UNITED STATESUSD 4,938 PALO ALTO NETWORKS INC 981,022 0.08UNITED STATESUSD 32,358 PARKER HANNIFIN CORP 4,883,597 0.40UNITED STATESUSD 3,887 PATTERSON COS INC 75,335 0.01UNITED STATESUSD 178,621 PAYPAL HOLDINGS INC 14,174,539 1.17UNITED STATESUSD 14,951 PEOPLE'S UNITED FINANCIAL 237,854 0.02UNITED STATESUSD 77,700 PEPSICO INC 7,480,169 0.62UNITED STATESUSD 84,956 PHILIP MORRIS INTERNATIONAL 5,687,342 0.47UNITED STATESUSD 24,453 PHILLIPS 66 2,490,696 0.21UNITED STATESUSD 2,970 PINNACLE WEST CAPITAL 200,510 0.02UNITED STATESUSD 9,620 PIONEER NATURAL RESOURCES CO 1,444,447 0.12UNITED STATESUSD 13,192 PNC FINANCIAL SERVICES GROUP 1,627,486 0.13UNITED STATESUSD 38,700 PPL CORPORATION 989,203 0.08UNITED STATESUSD 14,017 PRAXAIR INC 1,905,758 0.16UNITED STATESUSD 137,700 PROCTER & GAMBLE CO/THE 9,817,116 0.81UNITED STATESUSD 29,100 PROLOGIS INC 1,680,222 0.14UNITED STATESUSD 32,145 PRUDENTIAL FINANCIAL INC 2,714,436 0.22UNITED STATESUSD 25,000 PTC THERAPEUTICS INC 896,863 0.07UNITED STATESUSD 16,687 PUBLIC SERVICE ENTERPRISE GP 750,807 0.06UNITED STATESUSD 8,500 PUBLIC STORAGE 1,553,012 0.13UNITED STATESUSD 4,196 PVH CORP 516,287 0.04UNITED STATESUSD 6,741 QORVO INC 464,020 0.04UNITED STATESUSD 324,560 QUALCOMM INC 19,166,752 1.59UNITED STATESUSD 19,394 QUEST DIAGNOSTICS 1,833,221 0.15UNITED STATESUSD 145,418 RAMACO RESOURCES INC 993,617 0.08UNITED STATESUSD 9,924 RANGE RESOURCES CORP 140,053 0.01UNITED STATESUSD 6,073 RAYMOND JAMES FINANCIAL INC 485,631 0.04UNITED STATESUSD 17,500 REALTY INCOME CORP 880,941 0.07UNITED STATESUSD 4,494 REGENERON PHARMACEUTICALS INC 1,571,065 0.13UNITED STATES
Country
Statement of Investment Portfolio and Other Net Assets AUGUST 31, 2018
Notional or number of units / shares
ownedMarket Value
EUR% of Net
Assets
INTERFUND TEAM EQUITY USA
(continued)
Similar issues with same maturities have not been combined when issuance date differs.The accompanying notes are an integral part of these financial statements.General note: differences in sums, if any, are due to rounding.
Currency
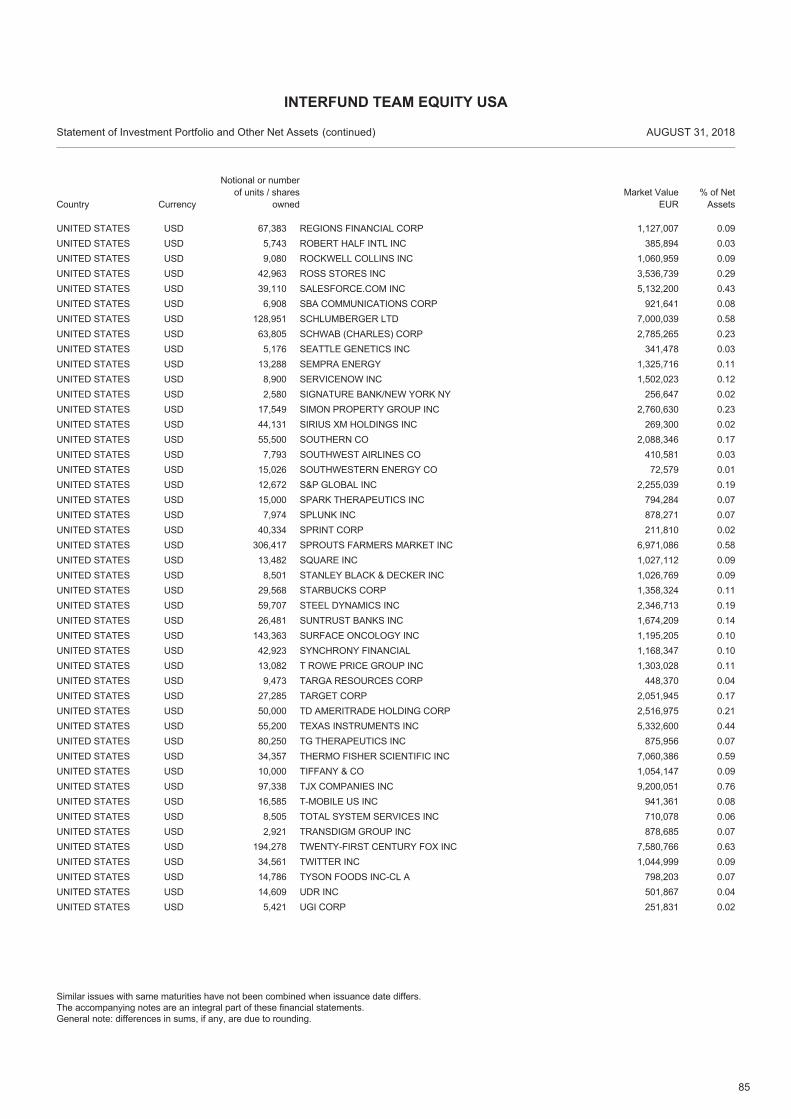
85
USD 67,383 REGIONS FINANCIAL CORP 1,127,007 0.09UNITED STATESUSD 5,743 ROBERT HALF INTL INC 385,894 0.03UNITED STATESUSD 9,080 ROCKWELL COLLINS INC 1,060,959 0.09UNITED STATESUSD 42,963 ROSS STORES INC 3,536,739 0.29UNITED STATESUSD 39,110 SALESFORCE.COM INC 5,132,200 0.43UNITED STATESUSD 6,908 SBA COMMUNICATIONS CORP 921,641 0.08UNITED STATESUSD 128,951 SCHLUMBERGER LTD 7,000,039 0.58UNITED STATESUSD 63,805 SCHWAB (CHARLES) CORP 2,785,265 0.23UNITED STATESUSD 5,176 SEATTLE GENETICS INC 341,478 0.03UNITED STATESUSD 13,288 SEMPRA ENERGY 1,325,716 0.11UNITED STATESUSD 8,900 SERVICENOW INC 1,502,023 0.12UNITED STATESUSD 2,580 SIGNATURE BANK/NEW YORK NY 256,647 0.02UNITED STATESUSD 17,549 SIMON PROPERTY GROUP INC 2,760,630 0.23UNITED STATESUSD 44,131 SIRIUS XM HOLDINGS INC 269,300 0.02UNITED STATESUSD 55,500 SOUTHERN CO 2,088,346 0.17UNITED STATESUSD 7,793 SOUTHWEST AIRLINES CO 410,581 0.03UNITED STATESUSD 15,026 SOUTHWESTERN ENERGY CO 72,579 0.01UNITED STATESUSD 12,672 S&P GLOBAL INC 2,255,039 0.19UNITED STATESUSD 15,000 SPARK THERAPEUTICS INC 794,284 0.07UNITED STATESUSD 7,974 SPLUNK INC 878,271 0.07UNITED STATESUSD 40,334 SPRINT CORP 211,810 0.02UNITED STATESUSD 306,417 SPROUTS FARMERS MARKET INC 6,971,086 0.58UNITED STATESUSD 13,482 SQUARE INC 1,027,112 0.09UNITED STATESUSD 8,501 STANLEY BLACK & DECKER INC 1,026,769 0.09UNITED STATESUSD 29,568 STARBUCKS CORP 1,358,324 0.11UNITED STATESUSD 59,707 STEEL DYNAMICS INC 2,346,713 0.19UNITED STATESUSD 26,481 SUNTRUST BANKS INC 1,674,209 0.14UNITED STATESUSD 143,363 SURFACE ONCOLOGY INC 1,195,205 0.10UNITED STATESUSD 42,923 SYNCHRONY FINANCIAL 1,168,347 0.10UNITED STATESUSD 13,082 T ROWE PRICE GROUP INC 1,303,028 0.11UNITED STATESUSD 9,473 TARGA RESOURCES CORP 448,370 0.04UNITED STATESUSD 27,285 TARGET CORP 2,051,945 0.17UNITED STATESUSD 50,000 TD AMERITRADE HOLDING CORP 2,516,975 0.21UNITED STATESUSD 55,200 TEXAS INSTRUMENTS INC 5,332,600 0.44UNITED STATESUSD 80,250 TG THERAPEUTICS INC 875,956 0.07UNITED STATESUSD 34,357 THERMO FISHER SCIENTIFIC INC 7,060,386 0.59UNITED STATESUSD 10,000 TIFFANY & CO 1,054,147 0.09UNITED STATESUSD 97,338 TJX COMPANIES INC 9,200,051 0.76UNITED STATESUSD 16,585 T-MOBILE US INC 941,361 0.08UNITED STATESUSD 8,505 TOTAL SYSTEM SERVICES INC 710,078 0.06UNITED STATESUSD 2,921 TRANSDIGM GROUP INC 878,685 0.07UNITED STATESUSD 194,278 TWENTY-FIRST CENTURY FOX INC 7,580,766 0.63UNITED STATESUSD 34,561 TWITTER INC 1,044,999 0.09UNITED STATESUSD 14,786 TYSON FOODS INC-CL A 798,203 0.07UNITED STATESUSD 14,609 UDR INC 501,867 0.04UNITED STATESUSD 5,421 UGI CORP 251,831 0.02UNITED STATES
Country
Statement of Investment Portfolio and Other Net Assets AUGUST 31, 2018
Notional or number of units / shares
ownedMarket Value
EUR% of Net
Assets
INTERFUND TEAM EQUITY USA
(continued)
Similar issues with same maturities have not been combined when issuance date differs.The accompanying notes are an integral part of these financial statements.General note: differences in sums, if any, are due to rounding.
Currency
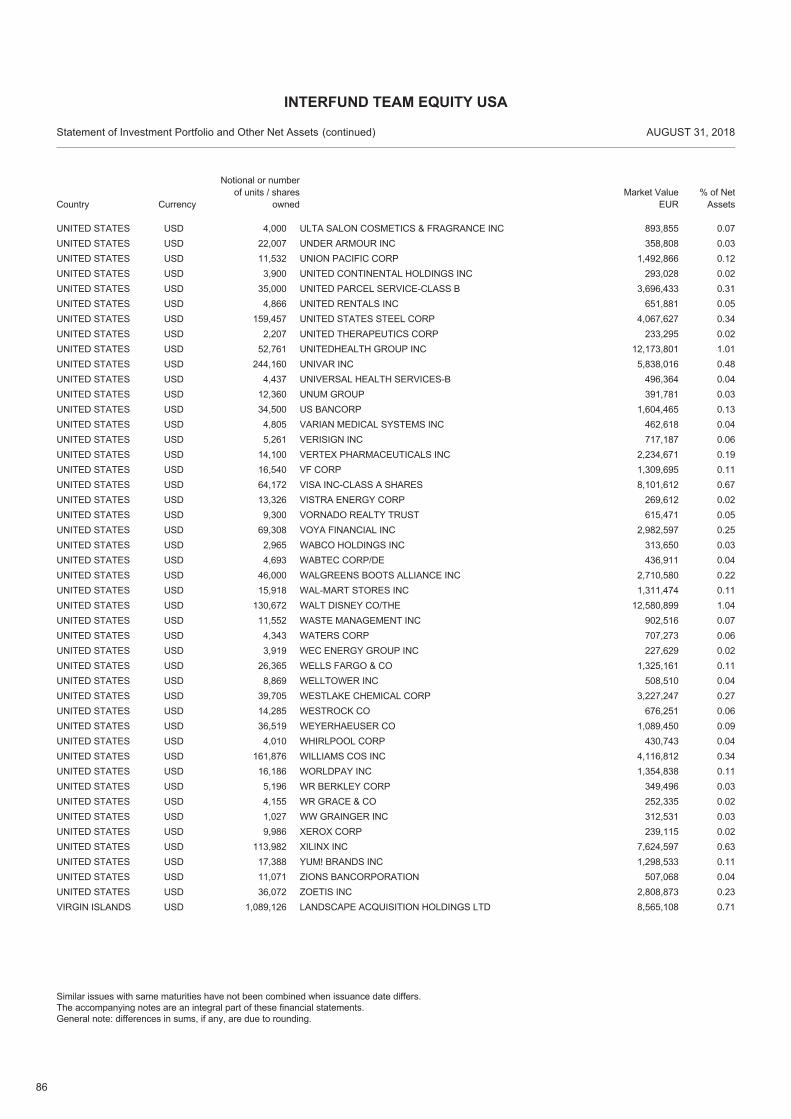
86
USD 4,000 ULTA SALON COSMETICS & FRAGRANCE INC 893,855 0.07UNITED STATESUSD 22,007 UNDER ARMOUR INC 358,808 0.03UNITED STATESUSD 11,532 UNION PACIFIC CORP 1,492,866 0.12UNITED STATESUSD 3,900 UNITED CONTINENTAL HOLDINGS INC 293,028 0.02UNITED STATESUSD 35,000 UNITED PARCEL SERVICE-CLASS B 3,696,433 0.31UNITED STATESUSD 4,866 UNITED RENTALS INC 651,881 0.05UNITED STATESUSD 159,457 UNITED STATES STEEL CORP 4,067,627 0.34UNITED STATESUSD 2,207 UNITED THERAPEUTICS CORP 233,295 0.02UNITED STATESUSD 52,761 UNITEDHEALTH GROUP INC 12,173,801 1.01UNITED STATESUSD 244,160 UNIVAR INC 5,838,016 0.48UNITED STATESUSD 4,437 UNIVERSAL HEALTH SERVICES-B 496,364 0.04UNITED STATESUSD 12,360 UNUM GROUP 391,781 0.03UNITED STATESUSD 34,500 US BANCORP 1,604,465 0.13UNITED STATESUSD 4,805 VARIAN MEDICAL SYSTEMS INC 462,618 0.04UNITED STATESUSD 5,261 VERISIGN INC 717,187 0.06UNITED STATESUSD 14,100 VERTEX PHARMACEUTICALS INC 2,234,671 0.19UNITED STATESUSD 16,540 VF CORP 1,309,695 0.11UNITED STATESUSD 64,172 VISA INC-CLASS A SHARES 8,101,612 0.67UNITED STATESUSD 13,326 VISTRA ENERGY CORP 269,612 0.02UNITED STATESUSD 9,300 VORNADO REALTY TRUST 615,471 0.05UNITED STATESUSD 69,308 VOYA FINANCIAL INC 2,982,597 0.25UNITED STATESUSD 2,965 WABCO HOLDINGS INC 313,650 0.03UNITED STATESUSD 4,693 WABTEC CORP/DE 436,911 0.04UNITED STATESUSD 46,000 WALGREENS BOOTS ALLIANCE INC 2,710,580 0.22UNITED STATESUSD 15,918 WAL-MART STORES INC 1,311,474 0.11UNITED STATESUSD 130,672 WALT DISNEY CO/THE 12,580,899 1.04UNITED STATESUSD 11,552 WASTE MANAGEMENT INC 902,516 0.07UNITED STATESUSD 4,343 WATERS CORP 707,273 0.06UNITED STATESUSD 3,919 WEC ENERGY GROUP INC 227,629 0.02UNITED STATESUSD 26,365 WELLS FARGO & CO 1,325,161 0.11UNITED STATESUSD 8,869 WELLTOWER INC 508,510 0.04UNITED STATESUSD 39,705 WESTLAKE CHEMICAL CORP 3,227,247 0.27UNITED STATESUSD 14,285 WESTROCK CO 676,251 0.06UNITED STATESUSD 36,519 WEYERHAEUSER CO 1,089,450 0.09UNITED STATESUSD 4,010 WHIRLPOOL CORP 430,743 0.04UNITED STATESUSD 161,876 WILLIAMS COS INC 4,116,812 0.34UNITED STATESUSD 16,186 WORLDPAY INC 1,354,838 0.11UNITED STATESUSD 5,196 WR BERKLEY CORP 349,496 0.03UNITED STATESUSD 4,155 WR GRACE & CO 252,335 0.02UNITED STATESUSD 1,027 WW GRAINGER INC 312,531 0.03UNITED STATESUSD 9,986 XEROX CORP 239,115 0.02UNITED STATESUSD 113,982 XILINX INC 7,624,597 0.63UNITED STATESUSD 17,388 YUM! BRANDS INC 1,298,533 0.11UNITED STATESUSD 11,071 ZIONS BANCORPORATION 507,068 0.04UNITED STATESUSD 36,072 ZOETIS INC 2,808,873 0.23UNITED STATESUSD 1,089,126 LANDSCAPE ACQUISITION HOLDINGS LTD 8,565,108 0.71VIRGIN ISLANDS
Country
Statement of Investment Portfolio and Other Net Assets AUGUST 31, 2018
Notional or number of units / shares
ownedMarket Value
EUR% of Net
Assets
INTERFUND TEAM EQUITY USA
(continued)
Similar issues with same maturities have not been combined when issuance date differs.The accompanying notes are an integral part of these financial statements.General note: differences in sums, if any, are due to rounding.
Currency
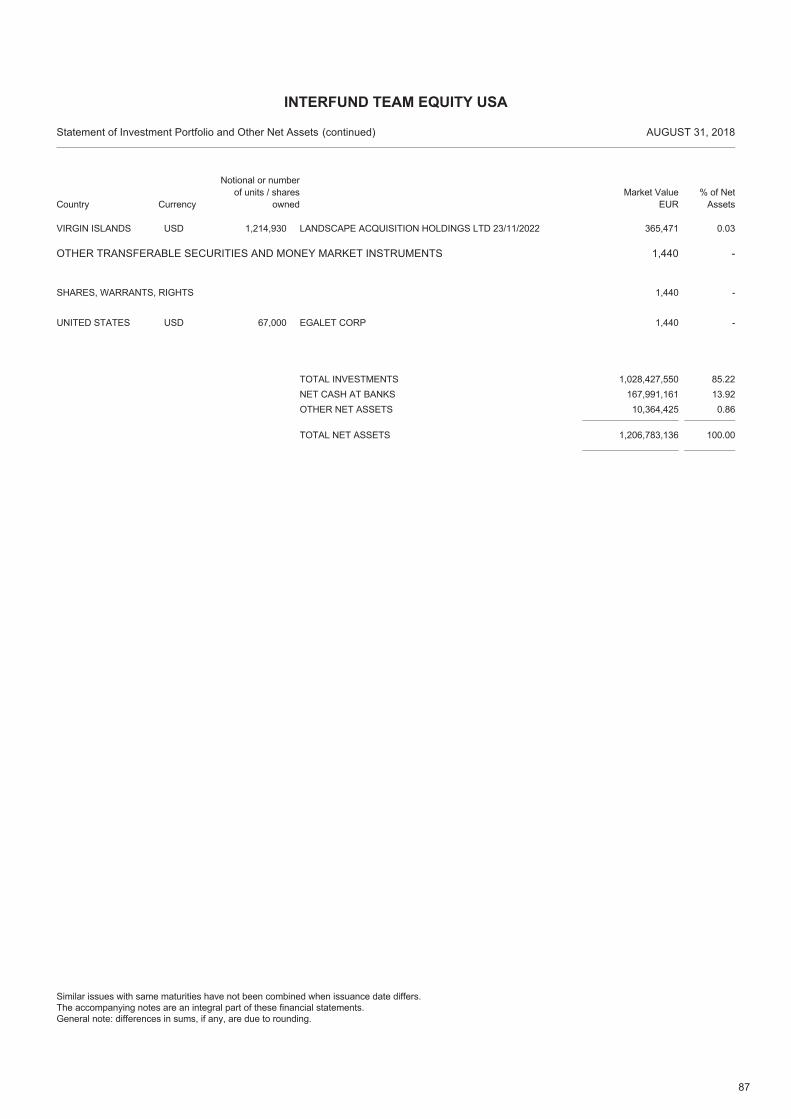
87
USD 1,214,930 LANDSCAPE ACQUISITION HOLDINGS LTD 23/11/2022 365,471 0.03VIRGIN ISLANDS
OTHER TRANSFERABLE SECURITIES AND MONEY MARKET INSTRUMENTS 1,440 -
USD 67,000 EGALET CORP 1,440 -UNITED STATES
SHARES, WARRANTS, RIGHTS -1,440
TOTAL NET ASSETS 1,206,783,136 100.00
TOTAL INVESTMENTS 1,028,427,550 85.22NET CASH AT BANKS 167,991,161 13.92OTHER NET ASSETS 10,364,425 0.86
Country
Statement of Investment Portfolio and Other Net Assets AUGUST 31, 2018
Notional or number of units / shares
ownedMarket Value
EUR% of Net
Assets
INTERFUND TEAM EQUITY USA
(continued)
Similar issues with same maturities have not been combined when issuance date differs.The accompanying notes are an integral part of these financial statements.General note: differences in sums, if any, are due to rounding.
Currency
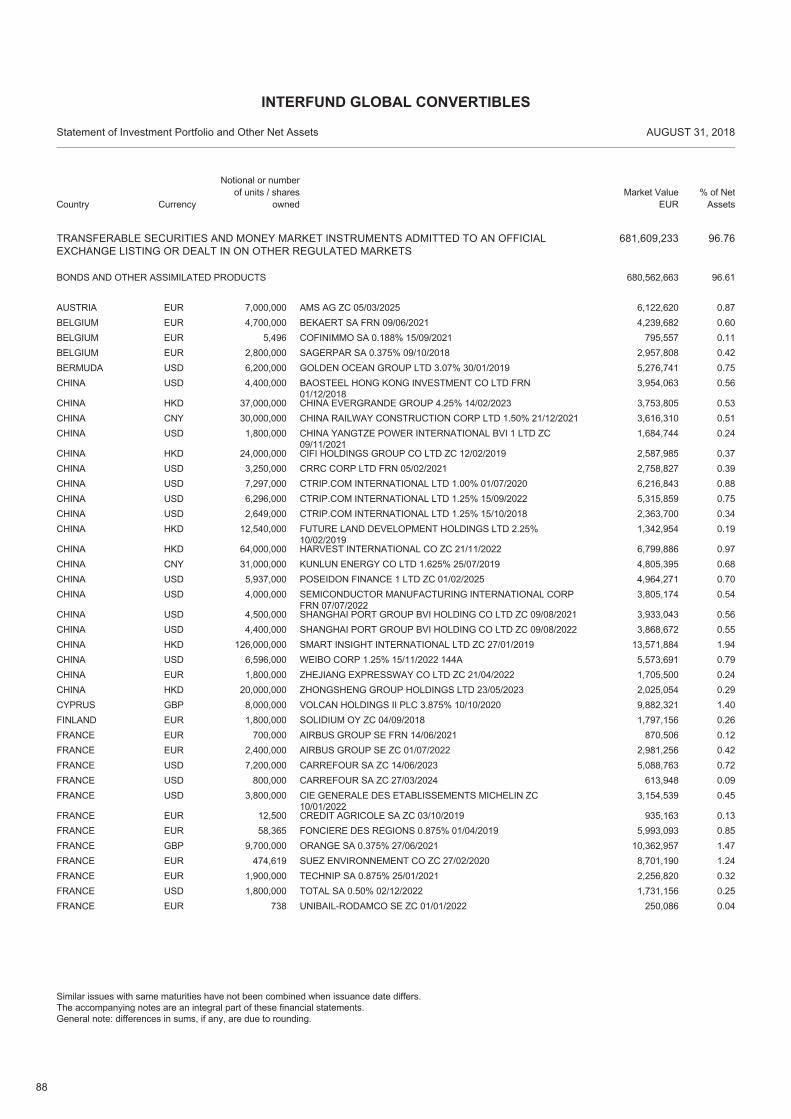
88
TRANSFERABLE SECURITIES AND MONEY MARKET INSTRUMENTS ADMITTED TO AN OFFICIALEXCHANGE LISTING OR DEALT IN ON OTHER REGULATED MARKETS
681,609,233 96.76
EUR 7,000,000 AMS AG ZC 05/03/2025 6,122,620 0.87AUSTRIA
BONDS AND OTHER ASSIMILATED PRODUCTS 96.61680,562,663
EUR 4,700,000 BEKAERT SA FRN 09/06/2021 4,239,682 0.60BELGIUMEUR 5,496 COFINIMMO SA 0.188% 15/09/2021 795,557 0.11BELGIUMEUR 2,800,000 SAGERPAR SA 0.375% 09/10/2018 2,957,808 0.42BELGIUMUSD 6,200,000 GOLDEN OCEAN GROUP LTD 3.07% 30/01/2019 5,276,741 0.75BERMUDAUSD 4,400,000 BAOSTEEL HONG KONG INVESTMENT CO LTD FRN
01/12/20183,954,063 0.56CHINA
HKD 37,000,000 CHINA EVERGRANDE GROUP 4.25% 14/02/2023 3,753,805 0.53CHINACNY 30,000,000 CHINA RAILWAY CONSTRUCTION CORP LTD 1.50% 21/12/2021 3,616,310 0.51CHINAUSD 1,800,000 CHINA YANGTZE POWER INTERNATIONAL BVI 1 LTD ZC
09/11/20211,684,744 0.24CHINA
HKD 24,000,000 CIFI HOLDINGS GROUP CO LTD ZC 12/02/2019 2,587,985 0.37CHINAUSD 3,250,000 CRRC CORP LTD FRN 05/02/2021 2,758,827 0.39CHINAUSD 7,297,000 CTRIP.COM INTERNATIONAL LTD 1.00% 01/07/2020 6,216,843 0.88CHINAUSD 6,296,000 CTRIP.COM INTERNATIONAL LTD 1.25% 15/09/2022 5,315,859 0.75CHINAUSD 2,649,000 CTRIP.COM INTERNATIONAL LTD 1.25% 15/10/2018 2,363,700 0.34CHINAHKD 12,540,000 FUTURE LAND DEVELOPMENT HOLDINGS LTD 2.25%
10/02/20191,342,954 0.19CHINA
HKD 64,000,000 HARVEST INTERNATIONAL CO ZC 21/11/2022 6,799,886 0.97CHINACNY 31,000,000 KUNLUN ENERGY CO LTD 1.625% 25/07/2019 4,805,395 0.68CHINAUSD 5,937,000 POSEIDON FINANCE 1 LTD ZC 01/02/2025 4,964,271 0.70CHINAUSD 4,000,000 SEMICONDUCTOR MANUFACTURING INTERNATIONAL CORP
FRN 07/07/20223,805,174 0.54CHINA
USD 4,500,000 SHANGHAI PORT GROUP BVI HOLDING CO LTD ZC 09/08/2021 3,933,043 0.56CHINAUSD 4,400,000 SHANGHAI PORT GROUP BVI HOLDING CO LTD ZC 09/08/2022 3,868,672 0.55CHINAHKD 126,000,000 SMART INSIGHT INTERNATIONAL LTD ZC 27/01/2019 13,571,884 1.94CHINAUSD 6,596,000 WEIBO CORP 1.25% 15/11/2022 144A 5,573,691 0.79CHINAEUR 1,800,000 ZHEJIANG EXPRESSWAY CO LTD ZC 21/04/2022 1,705,500 0.24CHINAHKD 20,000,000 ZHONGSHENG GROUP HOLDINGS LTD 23/05/2023 2,025,054 0.29CHINAGBP 8,000,000 VOLCAN HOLDINGS II PLC 3.875% 10/10/2020 9,882,321 1.40CYPRUSEUR 1,800,000 SOLIDIUM OY ZC 04/09/2018 1,797,156 0.26FINLANDEUR 700,000 AIRBUS GROUP SE FRN 14/06/2021 870,506 0.12FRANCEEUR 2,400,000 AIRBUS GROUP SE ZC 01/07/2022 2,981,256 0.42FRANCEUSD 7,200,000 CARREFOUR SA ZC 14/06/2023 5,088,763 0.72FRANCEUSD 800,000 CARREFOUR SA ZC 27/03/2024 613,948 0.09FRANCEUSD 3,800,000 CIE GENERALE DES ETABLISSEMENTS MICHELIN ZC
10/01/20223,154,539 0.45FRANCE
EUR 12,500 CREDIT AGRICOLE SA ZC 03/10/2019 935,163 0.13FRANCEEUR 58,365 FONCIERE DES REGIONS 0.875% 01/04/2019 5,993,093 0.85FRANCEGBP 9,700,000 ORANGE SA 0.375% 27/06/2021 10,362,957 1.47FRANCEEUR 474,619 SUEZ ENVIRONNEMENT CO ZC 27/02/2020 8,701,190 1.24FRANCEEUR 1,900,000 TECHNIP SA 0.875% 25/01/2021 2,256,820 0.32FRANCEUSD 1,800,000 TOTAL SA 0.50% 02/12/2022 1,731,156 0.25FRANCEEUR 738 UNIBAIL-RODAMCO SE ZC 01/01/2022 250,086 0.04FRANCE
Country
Statement of Investment Portfolio and Other Net Assets AUGUST 31, 2018
Notional or number of units / shares
ownedMarket Value
EUR% of Net
Assets
INTERFUND GLOBAL CONVERTIBLES
Similar issues with same maturities have not been combined when issuance date differs.The accompanying notes are an integral part of these financial statements.General note: differences in sums, if any, are due to rounding.
Currency
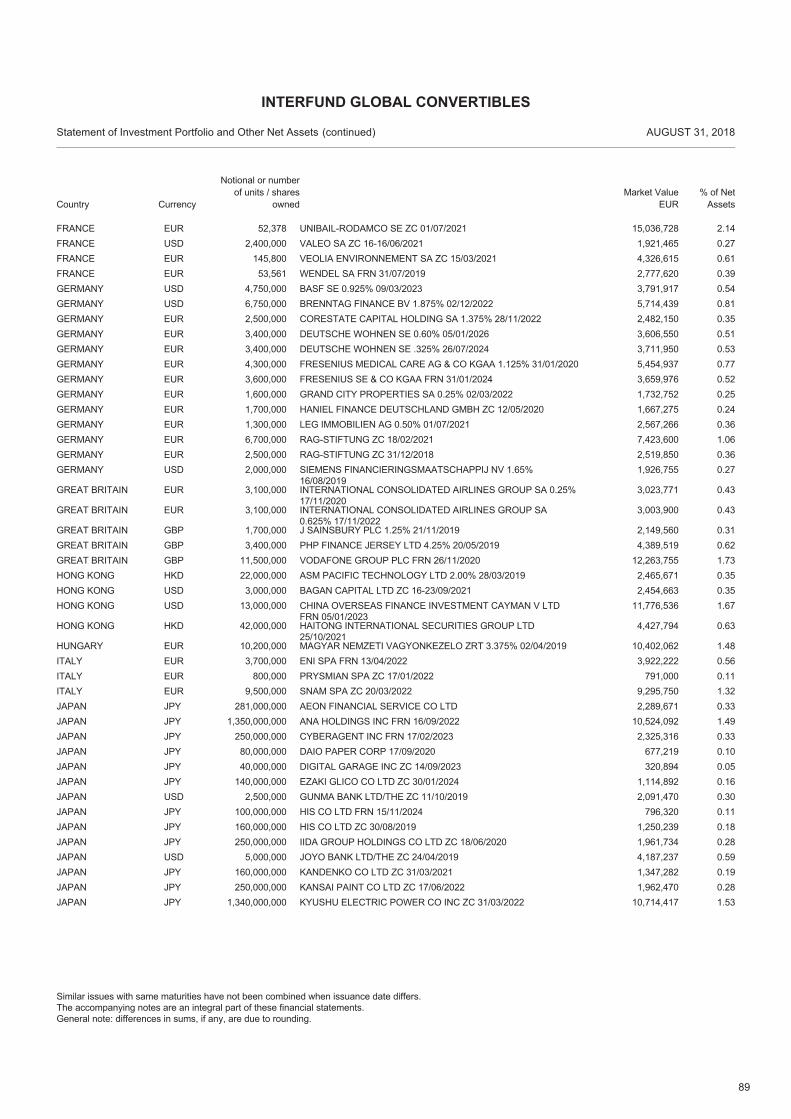
89
EUR 52,378 UNIBAIL-RODAMCO SE ZC 01/07/2021 15,036,728 2.14FRANCEUSD 2,400,000 VALEO SA ZC 16-16/06/2021 1,921,465 0.27FRANCEEUR 145,800 VEOLIA ENVIRONNEMENT SA ZC 15/03/2021 4,326,615 0.61FRANCEEUR 53,561 WENDEL SA FRN 31/07/2019 2,777,620 0.39FRANCEUSD 4,750,000 BASF SE 0.925% 09/03/2023 3,791,917 0.54GERMANYUSD 6,750,000 BRENNTAG FINANCE BV 1.875% 02/12/2022 5,714,439 0.81GERMANYEUR 2,500,000 CORESTATE CAPITAL HOLDING SA 1.375% 28/11/2022 2,482,150 0.35GERMANYEUR 3,400,000 DEUTSCHE WOHNEN SE 0.60% 05/01/2026 3,606,550 0.51GERMANYEUR 3,400,000 DEUTSCHE WOHNEN SE .325% 26/07/2024 3,711,950 0.53GERMANYEUR 4,300,000 FRESENIUS MEDICAL CARE AG & CO KGAA 1.125% 31/01/2020 5,454,937 0.77GERMANYEUR 3,600,000 FRESENIUS SE & CO KGAA FRN 31/01/2024 3,659,976 0.52GERMANYEUR 1,600,000 GRAND CITY PROPERTIES SA 0.25% 02/03/2022 1,732,752 0.25GERMANYEUR 1,700,000 HANIEL FINANCE DEUTSCHLAND GMBH ZC 12/05/2020 1,667,275 0.24GERMANYEUR 1,300,000 LEG IMMOBILIEN AG 0.50% 01/07/2021 2,567,266 0.36GERMANYEUR 6,700,000 RAG-STIFTUNG ZC 18/02/2021 7,423,600 1.06GERMANYEUR 2,500,000 RAG-STIFTUNG ZC 31/12/2018 2,519,850 0.36GERMANYUSD 2,000,000 SIEMENS FINANCIERINGSMAATSCHAPPIJ NV 1.65%
16/08/20191,926,755 0.27GERMANY
EUR 3,100,000 INTERNATIONAL CONSOLIDATED AIRLINES GROUP SA 0.25%17/11/2020
3,023,771 0.43GREAT BRITAIN
EUR 3,100,000 INTERNATIONAL CONSOLIDATED AIRLINES GROUP SA0.625% 17/11/2022
3,003,900 0.43GREAT BRITAIN
GBP 1,700,000 J SAINSBURY PLC 1.25% 21/11/2019 2,149,560 0.31GREAT BRITAINGBP 3,400,000 PHP FINANCE JERSEY LTD 4.25% 20/05/2019 4,389,519 0.62GREAT BRITAINGBP 11,500,000 VODAFONE GROUP PLC FRN 26/11/2020 12,263,755 1.73GREAT BRITAINHKD 22,000,000 ASM PACIFIC TECHNOLOGY LTD 2.00% 28/03/2019 2,465,671 0.35HONG KONGUSD 3,000,000 BAGAN CAPITAL LTD ZC 16-23/09/2021 2,454,663 0.35HONG KONGUSD 13,000,000 CHINA OVERSEAS FINANCE INVESTMENT CAYMAN V LTD
FRN 05/01/202311,776,536 1.67HONG KONG
HKD 42,000,000 HAITONG INTERNATIONAL SECURITIES GROUP LTD25/10/2021
4,427,794 0.63HONG KONG
EUR 10,200,000 MAGYAR NEMZETI VAGYONKEZELO ZRT 3.375% 02/04/2019 10,402,062 1.48HUNGARYEUR 3,700,000 ENI SPA FRN 13/04/2022 3,922,222 0.56ITALYEUR 800,000 PRYSMIAN SPA ZC 17/01/2022 791,000 0.11ITALYEUR 9,500,000 SNAM SPA ZC 20/03/2022 9,295,750 1.32ITALYJPY 281,000,000 AEON FINANCIAL SERVICE CO LTD 2,289,671 0.33JAPANJPY 1,350,000,000 ANA HOLDINGS INC FRN 16/09/2022 10,524,092 1.49JAPANJPY 250,000,000 CYBERAGENT INC FRN 17/02/2023 2,325,316 0.33JAPANJPY 80,000,000 DAIO PAPER CORP 17/09/2020 677,219 0.10JAPANJPY 40,000,000 DIGITAL GARAGE INC ZC 14/09/2023 320,894 0.05JAPANJPY 140,000,000 EZAKI GLICO CO LTD ZC 30/01/2024 1,114,892 0.16JAPANUSD 2,500,000 GUNMA BANK LTD/THE ZC 11/10/2019 2,091,470 0.30JAPANJPY 100,000,000 HIS CO LTD FRN 15/11/2024 796,320 0.11JAPANJPY 160,000,000 HIS CO LTD ZC 30/08/2019 1,250,239 0.18JAPANJPY 250,000,000 IIDA GROUP HOLDINGS CO LTD ZC 18/06/2020 1,961,734 0.28JAPANUSD 5,000,000 JOYO BANK LTD/THE ZC 24/04/2019 4,187,237 0.59JAPANJPY 160,000,000 KANDENKO CO LTD ZC 31/03/2021 1,347,282 0.19JAPANJPY 250,000,000 KANSAI PAINT CO LTD ZC 17/06/2022 1,962,470 0.28JAPANJPY 1,340,000,000 KYUSHU ELECTRIC POWER CO INC ZC 31/03/2022 10,714,417 1.53JAPAN
Country
Statement of Investment Portfolio and Other Net Assets AUGUST 31, 2018
Notional or number of units / shares
ownedMarket Value
EUR% of Net
Assets
INTERFUND GLOBAL CONVERTIBLES
(continued)
Similar issues with same maturities have not been combined when issuance date differs.The accompanying notes are an integral part of these financial statements.General note: differences in sums, if any, are due to rounding.
Currency
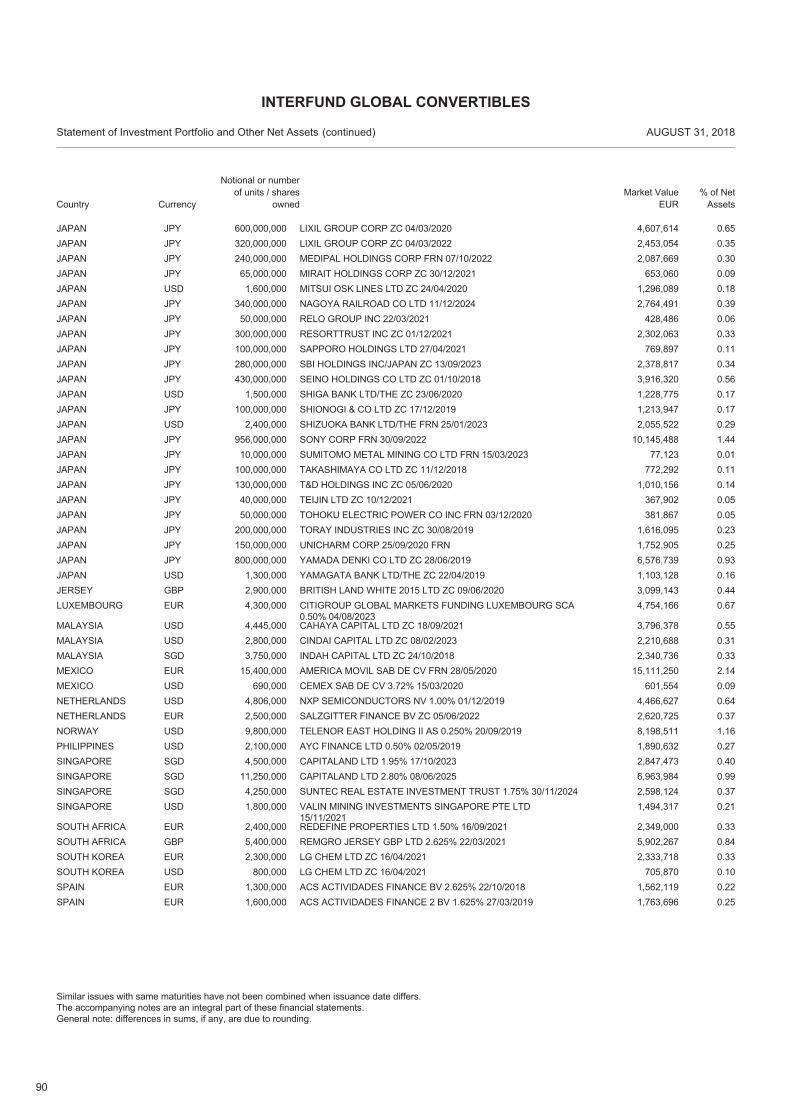
90
JPY 600,000,000 LIXIL GROUP CORP ZC 04/03/2020 4,607,614 0.65JAPANJPY 320,000,000 LIXIL GROUP CORP ZC 04/03/2022 2,453,054 0.35JAPANJPY 240,000,000 MEDIPAL HOLDINGS CORP FRN 07/10/2022 2,087,669 0.30JAPANJPY 65,000,000 MIRAIT HOLDINGS CORP ZC 30/12/2021 653,060 0.09JAPANUSD 1,600,000 MITSUI OSK LINES LTD ZC 24/04/2020 1,296,089 0.18JAPANJPY 340,000,000 NAGOYA RAILROAD CO LTD 11/12/2024 2,764,491 0.39JAPANJPY 50,000,000 RELO GROUP INC 22/03/2021 428,486 0.06JAPANJPY 300,000,000 RESORTTRUST INC ZC 01/12/2021 2,302,063 0.33JAPANJPY 100,000,000 SAPPORO HOLDINGS LTD 27/04/2021 769,897 0.11JAPANJPY 280,000,000 SBI HOLDINGS INC/JAPAN ZC 13/09/2023 2,378,817 0.34JAPANJPY 430,000,000 SEINO HOLDINGS CO LTD ZC 01/10/2018 3,916,320 0.56JAPANUSD 1,500,000 SHIGA BANK LTD/THE ZC 23/06/2020 1,228,775 0.17JAPANJPY 100,000,000 SHIONOGI & CO LTD ZC 17/12/2019 1,213,947 0.17JAPANUSD 2,400,000 SHIZUOKA BANK LTD/THE FRN 25/01/2023 2,055,522 0.29JAPANJPY 956,000,000 SONY CORP FRN 30/09/2022 10,145,488 1.44JAPANJPY 10,000,000 SUMITOMO METAL MINING CO LTD FRN 15/03/2023 77,123 0.01JAPANJPY 100,000,000 TAKASHIMAYA CO LTD ZC 11/12/2018 772,292 0.11JAPANJPY 130,000,000 T&D HOLDINGS INC ZC 05/06/2020 1,010,156 0.14JAPANJPY 40,000,000 TEIJIN LTD ZC 10/12/2021 367,902 0.05JAPANJPY 50,000,000 TOHOKU ELECTRIC POWER CO INC FRN 03/12/2020 381,867 0.05JAPANJPY 200,000,000 TORAY INDUSTRIES INC ZC 30/08/2019 1,616,095 0.23JAPANJPY 150,000,000 UNICHARM CORP 25/09/2020 FRN 1,752,905 0.25JAPANJPY 800,000,000 YAMADA DENKI CO LTD ZC 28/06/2019 6,576,739 0.93JAPANUSD 1,300,000 YAMAGATA BANK LTD/THE ZC 22/04/2019 1,103,128 0.16JAPANGBP 2,900,000 BRITISH LAND WHITE 2015 LTD ZC 09/06/2020 3,099,143 0.44JERSEYEUR 4,300,000 CITIGROUP GLOBAL MARKETS FUNDING LUXEMBOURG SCA
0.50% 04/08/20234,754,166 0.67LUXEMBOURG
USD 4,445,000 CAHAYA CAPITAL LTD ZC 18/09/2021 3,796,378 0.55MALAYSIAUSD 2,800,000 CINDAI CAPITAL LTD ZC 08/02/2023 2,210,688 0.31MALAYSIASGD 3,750,000 INDAH CAPITAL LTD ZC 24/10/2018 2,340,736 0.33MALAYSIAEUR 15,400,000 AMERICA MOVIL SAB DE CV FRN 28/05/2020 15,111,250 2.14MEXICOUSD 690,000 CEMEX SAB DE CV 3.72% 15/03/2020 601,554 0.09MEXICOUSD 4,806,000 NXP SEMICONDUCTORS NV 1.00% 01/12/2019 4,466,627 0.64NETHERLANDSEUR 2,500,000 SALZGITTER FINANCE BV ZC 05/06/2022 2,620,725 0.37NETHERLANDSUSD 9,800,000 TELENOR EAST HOLDING II AS 0.250% 20/09/2019 8,198,511 1.16NORWAYUSD 2,100,000 AYC FINANCE LTD 0.50% 02/05/2019 1,890,632 0.27PHILIPPINESSGD 4,500,000 CAPITALAND LTD 1.95% 17/10/2023 2,847,473 0.40SINGAPORESGD 11,250,000 CAPITALAND LTD 2.80% 08/06/2025 6,963,984 0.99SINGAPORESGD 4,250,000 SUNTEC REAL ESTATE INVESTMENT TRUST 1.75% 30/11/2024 2,598,124 0.37SINGAPOREUSD 1,800,000 VALIN MINING INVESTMENTS SINGAPORE PTE LTD
15/11/20211,494,317 0.21SINGAPORE
EUR 2,400,000 REDEFINE PROPERTIES LTD 1.50% 16/09/2021 2,349,000 0.33SOUTH AFRICAGBP 5,400,000 REMGRO JERSEY GBP LTD 2.625% 22/03/2021 5,902,267 0.84SOUTH AFRICAEUR 2,300,000 LG CHEM LTD ZC 16/04/2021 2,333,718 0.33SOUTH KOREAUSD 800,000 LG CHEM LTD ZC 16/04/2021 705,870 0.10SOUTH KOREAEUR 1,300,000 ACS ACTIVIDADES FINANCE BV 2.625% 22/10/2018 1,562,119 0.22SPAINEUR 1,600,000 ACS ACTIVIDADES FINANCE 2 BV 1.625% 27/03/2019 1,763,696 0.25SPAIN
Country
Statement of Investment Portfolio and Other Net Assets AUGUST 31, 2018
Notional or number of units / shares
ownedMarket Value
EUR% of Net
Assets
INTERFUND GLOBAL CONVERTIBLES
(continued)
Similar issues with same maturities have not been combined when issuance date differs.The accompanying notes are an integral part of these financial statements.General note: differences in sums, if any, are due to rounding.
Currency
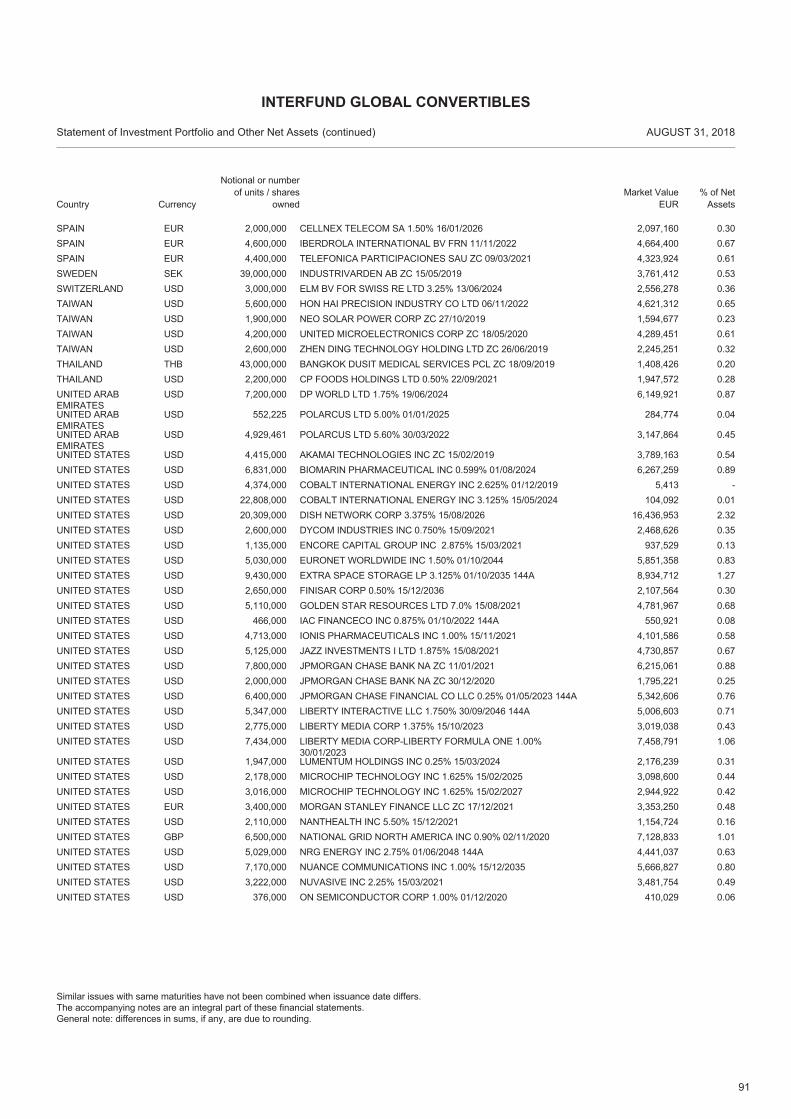
91
EUR 2,000,000 CELLNEX TELECOM SA 1.50% 16/01/2026 2,097,160 0.30SPAINEUR 4,600,000 IBERDROLA INTERNATIONAL BV FRN 11/11/2022 4,664,400 0.67SPAINEUR 4,400,000 TELEFONICA PARTICIPACIONES SAU ZC 09/03/2021 4,323,924 0.61SPAINSEK 39,000,000 INDUSTRIVARDEN AB ZC 15/05/2019 3,761,412 0.53SWEDENUSD 3,000,000 ELM BV FOR SWISS RE LTD 3.25% 13/06/2024 2,556,278 0.36SWITZERLANDUSD 5,600,000 HON HAI PRECISION INDUSTRY CO LTD 06/11/2022 4,621,312 0.65TAIWANUSD 1,900,000 NEO SOLAR POWER CORP ZC 27/10/2019 1,594,677 0.23TAIWANUSD 4,200,000 UNITED MICROELECTRONICS CORP ZC 18/05/2020 4,289,451 0.61TAIWANUSD 2,600,000 ZHEN DING TECHNOLOGY HOLDING LTD ZC 26/06/2019 2,245,251 0.32TAIWANTHB 43,000,000 BANGKOK DUSIT MEDICAL SERVICES PCL ZC 18/09/2019 1,408,426 0.20THAILANDUSD 2,200,000 CP FOODS HOLDINGS LTD 0.50% 22/09/2021 1,947,572 0.28THAILANDUSD 7,200,000 DP WORLD LTD 1.75% 19/06/2024 6,149,921 0.87UNITED ARAB
EMIRATESUSD 552,225 POLARCUS LTD 5.00% 01/01/2025 284,774 0.04UNITED ARAB
EMIRATESUSD 4,929,461 POLARCUS LTD 5.60% 30/03/2022 3,147,864 0.45UNITED ARAB
EMIRATESUSD 4,415,000 AKAMAI TECHNOLOGIES INC ZC 15/02/2019 3,789,163 0.54UNITED STATESUSD 6,831,000 BIOMARIN PHARMACEUTICAL INC 0.599% 01/08/2024 6,267,259 0.89UNITED STATESUSD 4,374,000 COBALT INTERNATIONAL ENERGY INC 2.625% 01/12/2019 5,413 -UNITED STATESUSD 22,808,000 COBALT INTERNATIONAL ENERGY INC 3.125% 15/05/2024 104,092 0.01UNITED STATESUSD 20,309,000 DISH NETWORK CORP 3.375% 15/08/2026 16,436,953 2.32UNITED STATESUSD 2,600,000 DYCOM INDUSTRIES INC 0.750% 15/09/2021 2,468,626 0.35UNITED STATESUSD 1,135,000 ENCORE CAPITAL GROUP INC 2.875% 15/03/2021 937,529 0.13UNITED STATESUSD 5,030,000 EURONET WORLDWIDE INC 1.50% 01/10/2044 5,851,358 0.83UNITED STATESUSD 9,430,000 EXTRA SPACE STORAGE LP 3.125% 01/10/2035 144A 8,934,712 1.27UNITED STATESUSD 2,650,000 FINISAR CORP 0.50% 15/12/2036 2,107,564 0.30UNITED STATESUSD 5,110,000 GOLDEN STAR RESOURCES LTD 7.0% 15/08/2021 4,781,967 0.68UNITED STATESUSD 466,000 IAC FINANCECO INC 0.875% 01/10/2022 144A 550,921 0.08UNITED STATESUSD 4,713,000 IONIS PHARMACEUTICALS INC 1.00% 15/11/2021 4,101,586 0.58UNITED STATESUSD 5,125,000 JAZZ INVESTMENTS I LTD 1.875% 15/08/2021 4,730,857 0.67UNITED STATESUSD 7,800,000 JPMORGAN CHASE BANK NA ZC 11/01/2021 6,215,061 0.88UNITED STATESUSD 2,000,000 JPMORGAN CHASE BANK NA ZC 30/12/2020 1,795,221 0.25UNITED STATESUSD 6,400,000 JPMORGAN CHASE FINANCIAL CO LLC 0.25% 01/05/2023 144A 5,342,606 0.76UNITED STATESUSD 5,347,000 LIBERTY INTERACTIVE LLC 1.750% 30/09/2046 144A 5,006,603 0.71UNITED STATESUSD 2,775,000 LIBERTY MEDIA CORP 1.375% 15/10/2023 3,019,038 0.43UNITED STATESUSD 7,434,000 LIBERTY MEDIA CORP-LIBERTY FORMULA ONE 1.00%
30/01/20237,458,791 1.06UNITED STATES
USD 1,947,000 LUMENTUM HOLDINGS INC 0.25% 15/03/2024 2,176,239 0.31UNITED STATESUSD 2,178,000 MICROCHIP TECHNOLOGY INC 1.625% 15/02/2025 3,098,600 0.44UNITED STATESUSD 3,016,000 MICROCHIP TECHNOLOGY INC 1.625% 15/02/2027 2,944,922 0.42UNITED STATESEUR 3,400,000 MORGAN STANLEY FINANCE LLC ZC 17/12/2021 3,353,250 0.48UNITED STATESUSD 2,110,000 NANTHEALTH INC 5.50% 15/12/2021 1,154,724 0.16UNITED STATESGBP 6,500,000 NATIONAL GRID NORTH AMERICA INC 0.90% 02/11/2020 7,128,833 1.01UNITED STATESUSD 5,029,000 NRG ENERGY INC 2.75% 01/06/2048 144A 4,441,037 0.63UNITED STATESUSD 7,170,000 NUANCE COMMUNICATIONS INC 1.00% 15/12/2035 5,666,827 0.80UNITED STATESUSD 3,222,000 NUVASIVE INC 2.25% 15/03/2021 3,481,754 0.49UNITED STATESUSD 376,000 ON SEMICONDUCTOR CORP 1.00% 01/12/2020 410,029 0.06UNITED STATES
Country
Statement of Investment Portfolio and Other Net Assets AUGUST 31, 2018
Notional or number of units / shares
ownedMarket Value
EUR% of Net
Assets
INTERFUND GLOBAL CONVERTIBLES
(continued)
Similar issues with same maturities have not been combined when issuance date differs.The accompanying notes are an integral part of these financial statements.General note: differences in sums, if any, are due to rounding.
Currency
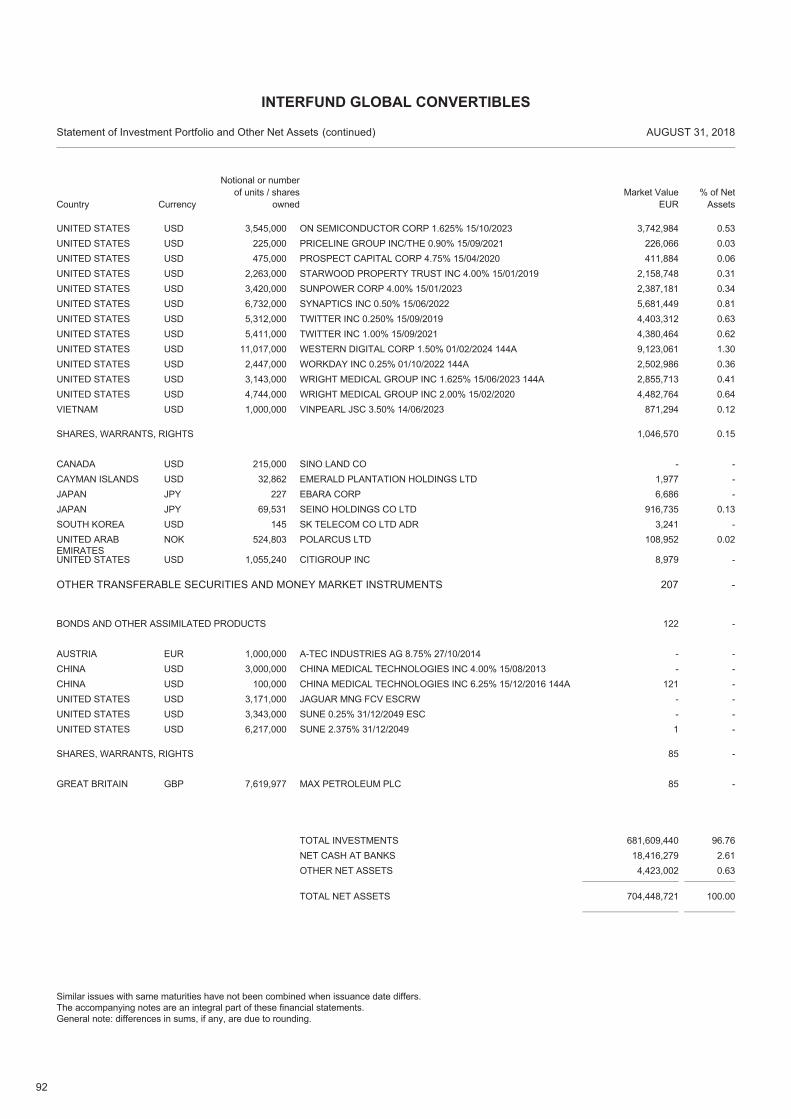
92
USD 3,545,000 ON SEMICONDUCTOR CORP 1.625% 15/10/2023 3,742,984 0.53UNITED STATESUSD 225,000 PRICELINE GROUP INC/THE 0.90% 15/09/2021 226,066 0.03UNITED STATESUSD 475,000 PROSPECT CAPITAL CORP 4.75% 15/04/2020 411,884 0.06UNITED STATESUSD 2,263,000 STARWOOD PROPERTY TRUST INC 4.00% 15/01/2019 2,158,748 0.31UNITED STATESUSD 3,420,000 SUNPOWER CORP 4.00% 15/01/2023 2,387,181 0.34UNITED STATESUSD 6,732,000 SYNAPTICS INC 0.50% 15/06/2022 5,681,449 0.81UNITED STATESUSD 5,312,000 TWITTER INC 0.250% 15/09/2019 4,403,312 0.63UNITED STATESUSD 5,411,000 TWITTER INC 1.00% 15/09/2021 4,380,464 0.62UNITED STATESUSD 11,017,000 WESTERN DIGITAL CORP 1.50% 01/02/2024 144A 9,123,061 1.30UNITED STATESUSD 2,447,000 WORKDAY INC 0.25% 01/10/2022 144A 2,502,986 0.36UNITED STATESUSD 3,143,000 WRIGHT MEDICAL GROUP INC 1.625% 15/06/2023 144A 2,855,713 0.41UNITED STATESUSD 4,744,000 WRIGHT MEDICAL GROUP INC 2.00% 15/02/2020 4,482,764 0.64UNITED STATESUSD 1,000,000 VINPEARL JSC 3.50% 14/06/2023 871,294 0.12VIETNAM
USD 215,000 SINO LAND CO - -CANADA
SHARES, WARRANTS, RIGHTS 0.151,046,570
USD 32,862 EMERALD PLANTATION HOLDINGS LTD 1,977 -CAYMAN ISLANDSJPY 227 EBARA CORP 6,686 -JAPANJPY 69,531 SEINO HOLDINGS CO LTD 916,735 0.13JAPANUSD 145 SK TELECOM CO LTD ADR 3,241 -SOUTH KOREANOK 524,803 POLARCUS LTD 108,952 0.02UNITED ARAB
EMIRATESUSD 1,055,240 CITIGROUP INC 8,979 -UNITED STATES
OTHER TRANSFERABLE SECURITIES AND MONEY MARKET INSTRUMENTS 207 -
EUR 1,000,000 A-TEC INDUSTRIES AG 8.75% 27/10/2014 - -AUSTRIA
BONDS AND OTHER ASSIMILATED PRODUCTS -122
USD 3,000,000 CHINA MEDICAL TECHNOLOGIES INC 4.00% 15/08/2013 - -CHINAUSD 100,000 CHINA MEDICAL TECHNOLOGIES INC 6.25% 15/12/2016 144A 121 -CHINAUSD 3,171,000 JAGUAR MNG FCV ESCRW - -UNITED STATESUSD 3,343,000 SUNE 0.25% 31/12/2049 ESC - -UNITED STATESUSD 6,217,000 SUNE 2.375% 31/12/2049 1 -UNITED STATES
GBP 7,619,977 MAX PETROLEUM PLC 85 -GREAT BRITAIN
SHARES, WARRANTS, RIGHTS -85
TOTAL NET ASSETS 704,448,721 100.00
TOTAL INVESTMENTS 681,609,440 96.76NET CASH AT BANKS 18,416,279 2.61OTHER NET ASSETS 4,423,002 0.63
Country
Statement of Investment Portfolio and Other Net Assets AUGUST 31, 2018
Notional or number of units / shares
ownedMarket Value
EUR% of Net
Assets
INTERFUND GLOBAL CONVERTIBLES
(continued)
Similar issues with same maturities have not been combined when issuance date differs.The accompanying notes are an integral part of these financial statements.General note: differences in sums, if any, are due to rounding.
Currency
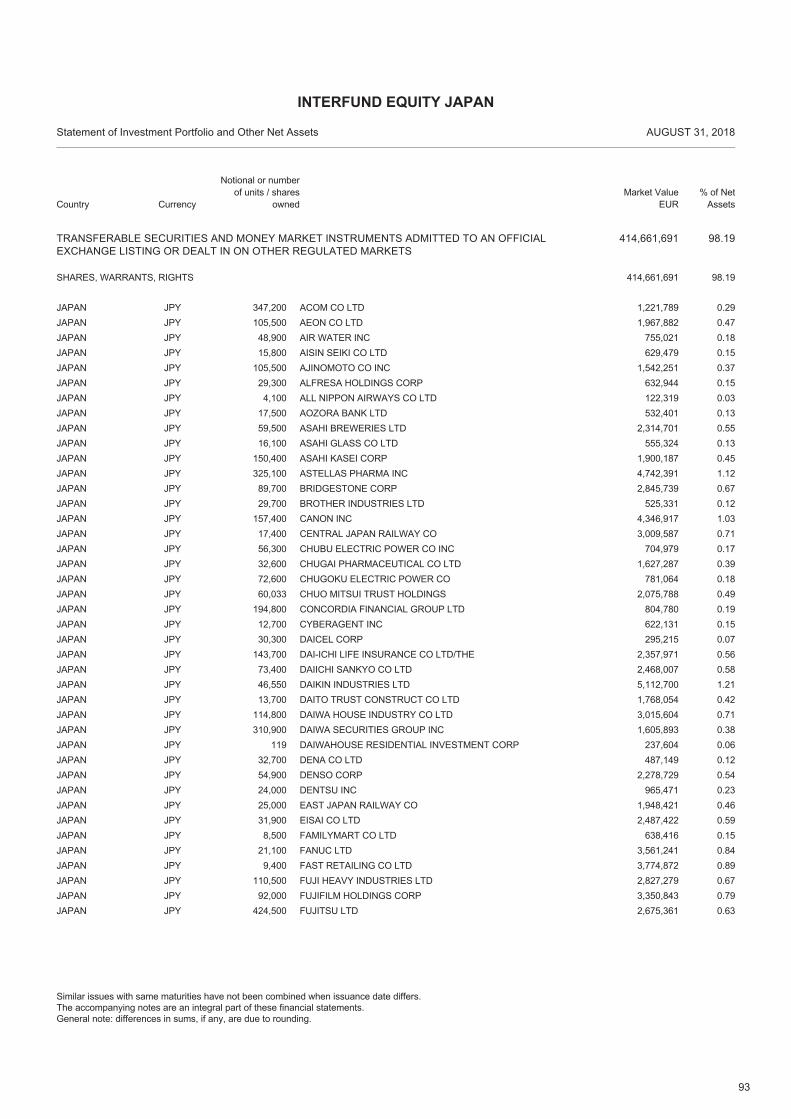
93
TRANSFERABLE SECURITIES AND MONEY MARKET INSTRUMENTS ADMITTED TO AN OFFICIALEXCHANGE LISTING OR DEALT IN ON OTHER REGULATED MARKETS
414,661,691 98.19
JPY 347,200 ACOM CO LTD 1,221,789 0.29JAPAN
SHARES, WARRANTS, RIGHTS 98.19414,661,691
JPY 105,500 AEON CO LTD 1,967,882 0.47JAPANJPY 48,900 AIR WATER INC 755,021 0.18JAPANJPY 15,800 AISIN SEIKI CO LTD 629,479 0.15JAPANJPY 105,500 AJINOMOTO CO INC 1,542,251 0.37JAPANJPY 29,300 ALFRESA HOLDINGS CORP 632,944 0.15JAPANJPY 4,100 ALL NIPPON AIRWAYS CO LTD 122,319 0.03JAPANJPY 17,500 AOZORA BANK LTD 532,401 0.13JAPANJPY 59,500 ASAHI BREWERIES LTD 2,314,701 0.55JAPANJPY 16,100 ASAHI GLASS CO LTD 555,324 0.13JAPANJPY 150,400 ASAHI KASEI CORP 1,900,187 0.45JAPANJPY 325,100 ASTELLAS PHARMA INC 4,742,391 1.12JAPANJPY 89,700 BRIDGESTONE CORP 2,845,739 0.67JAPANJPY 29,700 BROTHER INDUSTRIES LTD 525,331 0.12JAPANJPY 157,400 CANON INC 4,346,917 1.03JAPANJPY 17,400 CENTRAL JAPAN RAILWAY CO 3,009,587 0.71JAPANJPY 56,300 CHUBU ELECTRIC POWER CO INC 704,979 0.17JAPANJPY 32,600 CHUGAI PHARMACEUTICAL CO LTD 1,627,287 0.39JAPANJPY 72,600 CHUGOKU ELECTRIC POWER CO 781,064 0.18JAPANJPY 60,033 CHUO MITSUI TRUST HOLDINGS 2,075,788 0.49JAPANJPY 194,800 CONCORDIA FINANCIAL GROUP LTD 804,780 0.19JAPANJPY 12,700 CYBERAGENT INC 622,131 0.15JAPANJPY 30,300 DAICEL CORP 295,215 0.07JAPANJPY 143,700 DAI-ICHI LIFE INSURANCE CO LTD/THE 2,357,971 0.56JAPANJPY 73,400 DAIICHI SANKYO CO LTD 2,468,007 0.58JAPANJPY 46,550 DAIKIN INDUSTRIES LTD 5,112,700 1.21JAPANJPY 13,700 DAITO TRUST CONSTRUCT CO LTD 1,768,054 0.42JAPANJPY 114,800 DAIWA HOUSE INDUSTRY CO LTD 3,015,604 0.71JAPANJPY 310,900 DAIWA SECURITIES GROUP INC 1,605,893 0.38JAPANJPY 119 DAIWAHOUSE RESIDENTIAL INVESTMENT CORP 237,604 0.06JAPANJPY 32,700 DENA CO LTD 487,149 0.12JAPANJPY 54,900 DENSO CORP 2,278,729 0.54JAPANJPY 24,000 DENTSU INC 965,471 0.23JAPANJPY 25,000 EAST JAPAN RAILWAY CO 1,948,421 0.46JAPANJPY 31,900 EISAI CO LTD 2,487,422 0.59JAPANJPY 8,500 FAMILYMART CO LTD 638,416 0.15JAPANJPY 21,100 FANUC LTD 3,561,241 0.84JAPANJPY 9,400 FAST RETAILING CO LTD 3,774,872 0.89JAPANJPY 110,500 FUJI HEAVY INDUSTRIES LTD 2,827,279 0.67JAPANJPY 92,000 FUJIFILM HOLDINGS CORP 3,350,843 0.79JAPANJPY 424,500 FUJITSU LTD 2,675,361 0.63JAPAN
Country
Statement of Investment Portfolio and Other Net Assets AUGUST 31, 2018
Notional or number of units / shares
ownedMarket Value
EUR% of Net
Assets
INTERFUND EQUITY JAPAN
Similar issues with same maturities have not been combined when issuance date differs.The accompanying notes are an integral part of these financial statements.General note: differences in sums, if any, are due to rounding.
Currency
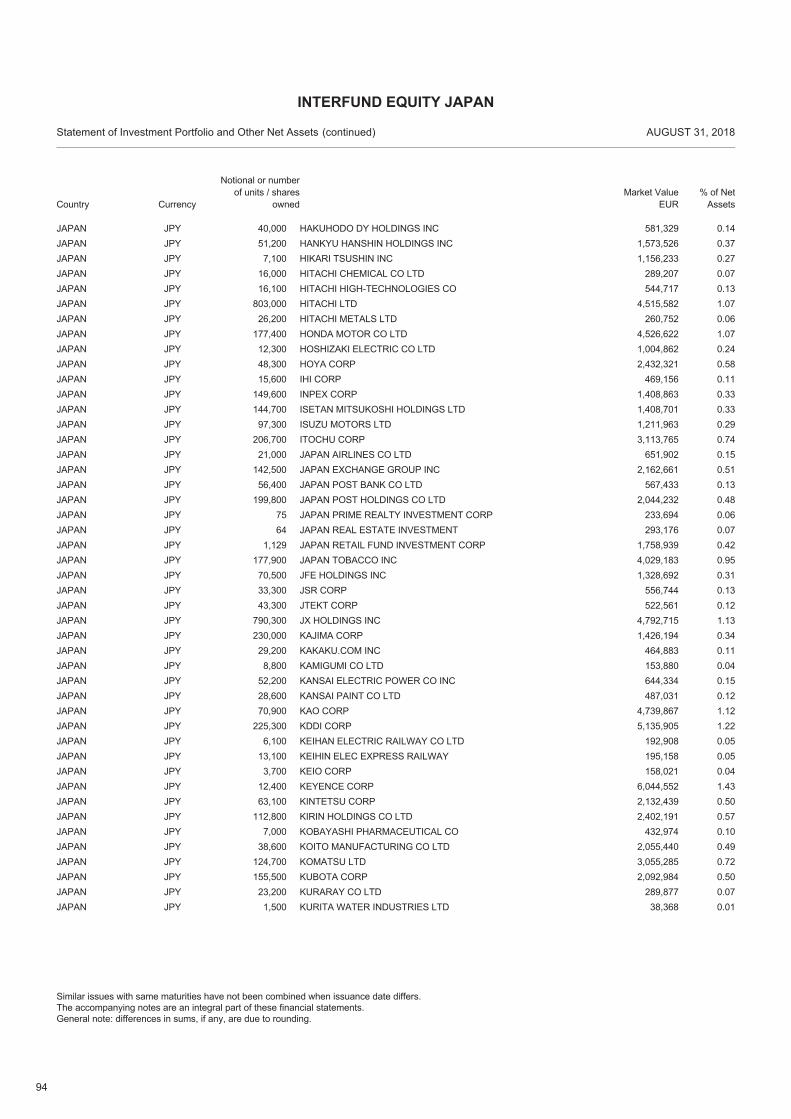
94
JPY 40,000 HAKUHODO DY HOLDINGS INC 581,329 0.14JAPANJPY 51,200 HANKYU HANSHIN HOLDINGS INC 1,573,526 0.37JAPANJPY 7,100 HIKARI TSUSHIN INC 1,156,233 0.27JAPANJPY 16,000 HITACHI CHEMICAL CO LTD 289,207 0.07JAPANJPY 16,100 HITACHI HIGH-TECHNOLOGIES CO 544,717 0.13JAPANJPY 803,000 HITACHI LTD 4,515,582 1.07JAPANJPY 26,200 HITACHI METALS LTD 260,752 0.06JAPANJPY 177,400 HONDA MOTOR CO LTD 4,526,622 1.07JAPANJPY 12,300 HOSHIZAKI ELECTRIC CO LTD 1,004,862 0.24JAPANJPY 48,300 HOYA CORP 2,432,321 0.58JAPANJPY 15,600 IHI CORP 469,156 0.11JAPANJPY 149,600 INPEX CORP 1,408,863 0.33JAPANJPY 144,700 ISETAN MITSUKOSHI HOLDINGS LTD 1,408,701 0.33JAPANJPY 97,300 ISUZU MOTORS LTD 1,211,963 0.29JAPANJPY 206,700 ITOCHU CORP 3,113,765 0.74JAPANJPY 21,000 JAPAN AIRLINES CO LTD 651,902 0.15JAPANJPY 142,500 JAPAN EXCHANGE GROUP INC 2,162,661 0.51JAPANJPY 56,400 JAPAN POST BANK CO LTD 567,433 0.13JAPANJPY 199,800 JAPAN POST HOLDINGS CO LTD 2,044,232 0.48JAPANJPY 75 JAPAN PRIME REALTY INVESTMENT CORP 233,694 0.06JAPANJPY 64 JAPAN REAL ESTATE INVESTMENT 293,176 0.07JAPANJPY 1,129 JAPAN RETAIL FUND INVESTMENT CORP 1,758,939 0.42JAPANJPY 177,900 JAPAN TOBACCO INC 4,029,183 0.95JAPANJPY 70,500 JFE HOLDINGS INC 1,328,692 0.31JAPANJPY 33,300 JSR CORP 556,744 0.13JAPANJPY 43,300 JTEKT CORP 522,561 0.12JAPANJPY 790,300 JX HOLDINGS INC 4,792,715 1.13JAPANJPY 230,000 KAJIMA CORP 1,426,194 0.34JAPANJPY 29,200 KAKAKU.COM INC 464,883 0.11JAPANJPY 8,800 KAMIGUMI CO LTD 153,880 0.04JAPANJPY 52,200 KANSAI ELECTRIC POWER CO INC 644,334 0.15JAPANJPY 28,600 KANSAI PAINT CO LTD 487,031 0.12JAPANJPY 70,900 KAO CORP 4,739,867 1.12JAPANJPY 225,300 KDDI CORP 5,135,905 1.22JAPANJPY 6,100 KEIHAN ELECTRIC RAILWAY CO LTD 192,908 0.05JAPANJPY 13,100 KEIHIN ELEC EXPRESS RAILWAY 195,158 0.05JAPANJPY 3,700 KEIO CORP 158,021 0.04JAPANJPY 12,400 KEYENCE CORP 6,044,552 1.43JAPANJPY 63,100 KINTETSU CORP 2,132,439 0.50JAPANJPY 112,800 KIRIN HOLDINGS CO LTD 2,402,191 0.57JAPANJPY 7,000 KOBAYASHI PHARMACEUTICAL CO 432,974 0.10JAPANJPY 38,600 KOITO MANUFACTURING CO LTD 2,055,440 0.49JAPANJPY 124,700 KOMATSU LTD 3,055,285 0.72JAPANJPY 155,500 KUBOTA CORP 2,092,984 0.50JAPANJPY 23,200 KURARAY CO LTD 289,877 0.07JAPANJPY 1,500 KURITA WATER INDUSTRIES LTD 38,368 0.01JAPAN
Country
Statement of Investment Portfolio and Other Net Assets AUGUST 31, 2018
Notional or number of units / shares
ownedMarket Value
EUR% of Net
Assets
INTERFUND EQUITY JAPAN
(continued)
Similar issues with same maturities have not been combined when issuance date differs.The accompanying notes are an integral part of these financial statements.General note: differences in sums, if any, are due to rounding.
Currency
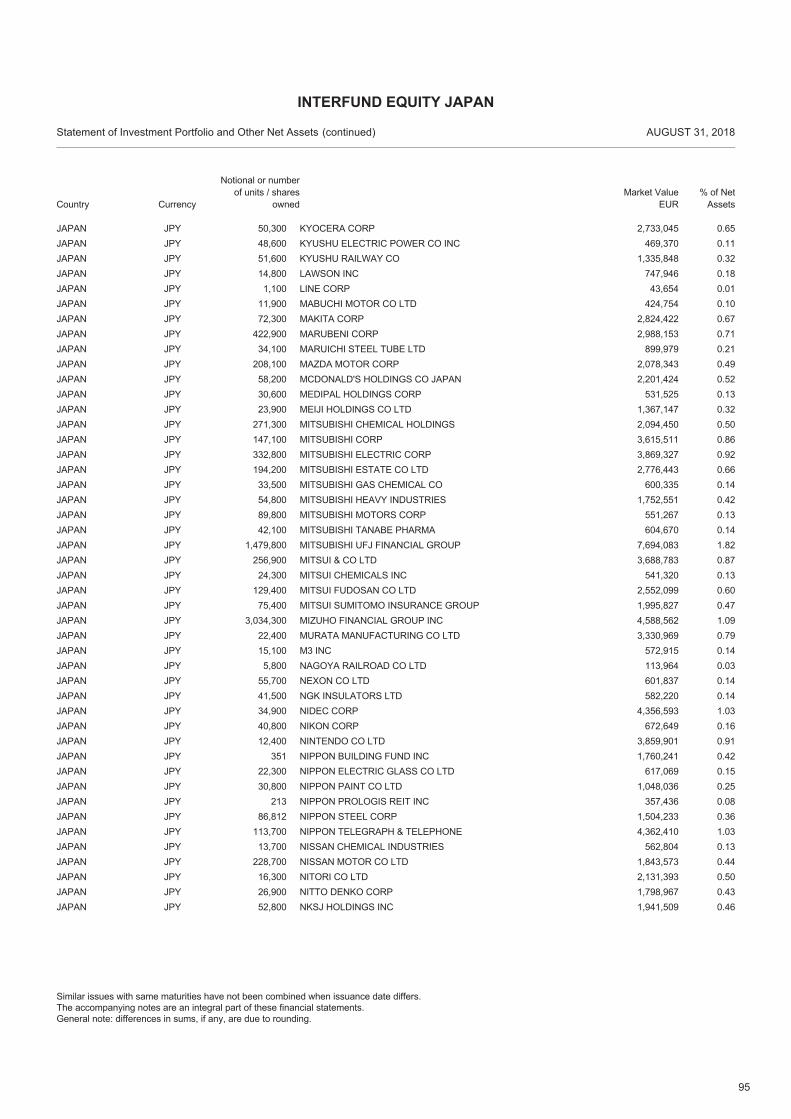
95
JPY 50,300 KYOCERA CORP 2,733,045 0.65JAPANJPY 48,600 KYUSHU ELECTRIC POWER CO INC 469,370 0.11JAPANJPY 51,600 KYUSHU RAILWAY CO 1,335,848 0.32JAPANJPY 14,800 LAWSON INC 747,946 0.18JAPANJPY 1,100 LINE CORP 43,654 0.01JAPANJPY 11,900 MABUCHI MOTOR CO LTD 424,754 0.10JAPANJPY 72,300 MAKITA CORP 2,824,422 0.67JAPANJPY 422,900 MARUBENI CORP 2,988,153 0.71JAPANJPY 34,100 MARUICHI STEEL TUBE LTD 899,979 0.21JAPANJPY 208,100 MAZDA MOTOR CORP 2,078,343 0.49JAPANJPY 58,200 MCDONALD'S HOLDINGS CO JAPAN 2,201,424 0.52JAPANJPY 30,600 MEDIPAL HOLDINGS CORP 531,525 0.13JAPANJPY 23,900 MEIJI HOLDINGS CO LTD 1,367,147 0.32JAPANJPY 271,300 MITSUBISHI CHEMICAL HOLDINGS 2,094,450 0.50JAPANJPY 147,100 MITSUBISHI CORP 3,615,511 0.86JAPANJPY 332,800 MITSUBISHI ELECTRIC CORP 3,869,327 0.92JAPANJPY 194,200 MITSUBISHI ESTATE CO LTD 2,776,443 0.66JAPANJPY 33,500 MITSUBISHI GAS CHEMICAL CO 600,335 0.14JAPANJPY 54,800 MITSUBISHI HEAVY INDUSTRIES 1,752,551 0.42JAPANJPY 89,800 MITSUBISHI MOTORS CORP 551,267 0.13JAPANJPY 42,100 MITSUBISHI TANABE PHARMA 604,670 0.14JAPANJPY 1,479,800 MITSUBISHI UFJ FINANCIAL GROUP 7,694,083 1.82JAPANJPY 256,900 MITSUI & CO LTD 3,688,783 0.87JAPANJPY 24,300 MITSUI CHEMICALS INC 541,320 0.13JAPANJPY 129,400 MITSUI FUDOSAN CO LTD 2,552,099 0.60JAPANJPY 75,400 MITSUI SUMITOMO INSURANCE GROUP 1,995,827 0.47JAPANJPY 3,034,300 MIZUHO FINANCIAL GROUP INC 4,588,562 1.09JAPANJPY 22,400 MURATA MANUFACTURING CO LTD 3,330,969 0.79JAPANJPY 15,100 M3 INC 572,915 0.14JAPANJPY 5,800 NAGOYA RAILROAD CO LTD 113,964 0.03JAPANJPY 55,700 NEXON CO LTD 601,837 0.14JAPANJPY 41,500 NGK INSULATORS LTD 582,220 0.14JAPANJPY 34,900 NIDEC CORP 4,356,593 1.03JAPANJPY 40,800 NIKON CORP 672,649 0.16JAPANJPY 12,400 NINTENDO CO LTD 3,859,901 0.91JAPANJPY 351 NIPPON BUILDING FUND INC 1,760,241 0.42JAPANJPY 22,300 NIPPON ELECTRIC GLASS CO LTD 617,069 0.15JAPANJPY 30,800 NIPPON PAINT CO LTD 1,048,036 0.25JAPANJPY 213 NIPPON PROLOGIS REIT INC 357,436 0.08JAPANJPY 86,812 NIPPON STEEL CORP 1,504,233 0.36JAPANJPY 113,700 NIPPON TELEGRAPH & TELEPHONE 4,362,410 1.03JAPANJPY 13,700 NISSAN CHEMICAL INDUSTRIES 562,804 0.13JAPANJPY 228,700 NISSAN MOTOR CO LTD 1,843,573 0.44JAPANJPY 16,300 NITORI CO LTD 2,131,393 0.50JAPANJPY 26,900 NITTO DENKO CORP 1,798,967 0.43JAPANJPY 52,800 NKSJ HOLDINGS INC 1,941,509 0.46JAPAN
Country
Statement of Investment Portfolio and Other Net Assets AUGUST 31, 2018
Notional or number of units / shares
ownedMarket Value
EUR% of Net
Assets
INTERFUND EQUITY JAPAN
(continued)
Similar issues with same maturities have not been combined when issuance date differs.The accompanying notes are an integral part of these financial statements.General note: differences in sums, if any, are due to rounding.
Currency
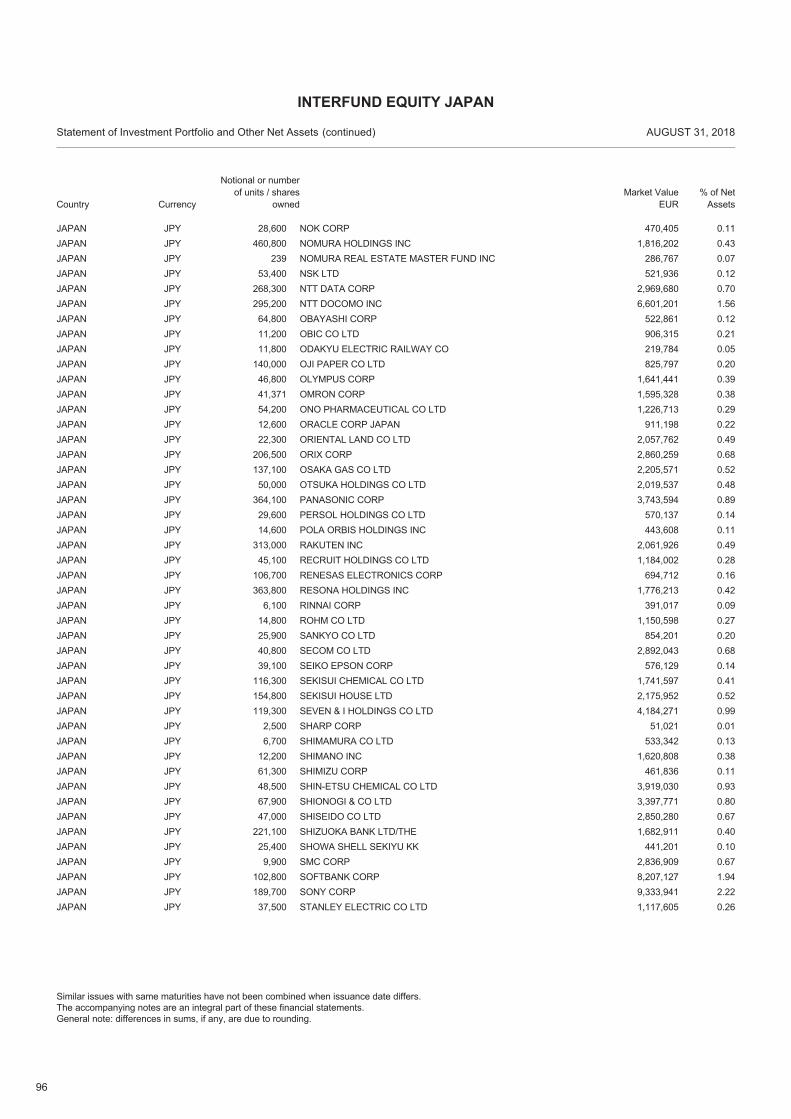
96
JPY 28,600 NOK CORP 470,405 0.11JAPANJPY 460,800 NOMURA HOLDINGS INC 1,816,202 0.43JAPANJPY 239 NOMURA REAL ESTATE MASTER FUND INC 286,767 0.07JAPANJPY 53,400 NSK LTD 521,936 0.12JAPANJPY 268,300 NTT DATA CORP 2,969,680 0.70JAPANJPY 295,200 NTT DOCOMO INC 6,601,201 1.56JAPANJPY 64,800 OBAYASHI CORP 522,861 0.12JAPANJPY 11,200 OBIC CO LTD 906,315 0.21JAPANJPY 11,800 ODAKYU ELECTRIC RAILWAY CO 219,784 0.05JAPANJPY 140,000 OJI PAPER CO LTD 825,797 0.20JAPANJPY 46,800 OLYMPUS CORP 1,641,441 0.39JAPANJPY 41,371 OMRON CORP 1,595,328 0.38JAPANJPY 54,200 ONO PHARMACEUTICAL CO LTD 1,226,713 0.29JAPANJPY 12,600 ORACLE CORP JAPAN 911,198 0.22JAPANJPY 22,300 ORIENTAL LAND CO LTD 2,057,762 0.49JAPANJPY 206,500 ORIX CORP 2,860,259 0.68JAPANJPY 137,100 OSAKA GAS CO LTD 2,205,571 0.52JAPANJPY 50,000 OTSUKA HOLDINGS CO LTD 2,019,537 0.48JAPANJPY 364,100 PANASONIC CORP 3,743,594 0.89JAPANJPY 29,600 PERSOL HOLDINGS CO LTD 570,137 0.14JAPANJPY 14,600 POLA ORBIS HOLDINGS INC 443,608 0.11JAPANJPY 313,000 RAKUTEN INC 2,061,926 0.49JAPANJPY 45,100 RECRUIT HOLDINGS CO LTD 1,184,002 0.28JAPANJPY 106,700 RENESAS ELECTRONICS CORP 694,712 0.16JAPANJPY 363,800 RESONA HOLDINGS INC 1,776,213 0.42JAPANJPY 6,100 RINNAI CORP 391,017 0.09JAPANJPY 14,800 ROHM CO LTD 1,150,598 0.27JAPANJPY 25,900 SANKYO CO LTD 854,201 0.20JAPANJPY 40,800 SECOM CO LTD 2,892,043 0.68JAPANJPY 39,100 SEIKO EPSON CORP 576,129 0.14JAPANJPY 116,300 SEKISUI CHEMICAL CO LTD 1,741,597 0.41JAPANJPY 154,800 SEKISUI HOUSE LTD 2,175,952 0.52JAPANJPY 119,300 SEVEN & I HOLDINGS CO LTD 4,184,271 0.99JAPANJPY 2,500 SHARP CORP 51,021 0.01JAPANJPY 6,700 SHIMAMURA CO LTD 533,342 0.13JAPANJPY 12,200 SHIMANO INC 1,620,808 0.38JAPANJPY 61,300 SHIMIZU CORP 461,836 0.11JAPANJPY 48,500 SHIN-ETSU CHEMICAL CO LTD 3,919,030 0.93JAPANJPY 67,900 SHIONOGI & CO LTD 3,397,771 0.80JAPANJPY 47,000 SHISEIDO CO LTD 2,850,280 0.67JAPANJPY 221,100 SHIZUOKA BANK LTD/THE 1,682,911 0.40JAPANJPY 25,400 SHOWA SHELL SEKIYU KK 441,201 0.10JAPANJPY 9,900 SMC CORP 2,836,909 0.67JAPANJPY 102,800 SOFTBANK CORP 8,207,127 1.94JAPANJPY 189,700 SONY CORP 9,333,941 2.22JAPANJPY 37,500 STANLEY ELECTRIC CO LTD 1,117,605 0.26JAPAN
Country
Statement of Investment Portfolio and Other Net Assets AUGUST 31, 2018
Notional or number of units / shares
ownedMarket Value
EUR% of Net
Assets
INTERFUND EQUITY JAPAN
(continued)
Similar issues with same maturities have not been combined when issuance date differs.The accompanying notes are an integral part of these financial statements.General note: differences in sums, if any, are due to rounding.
Currency
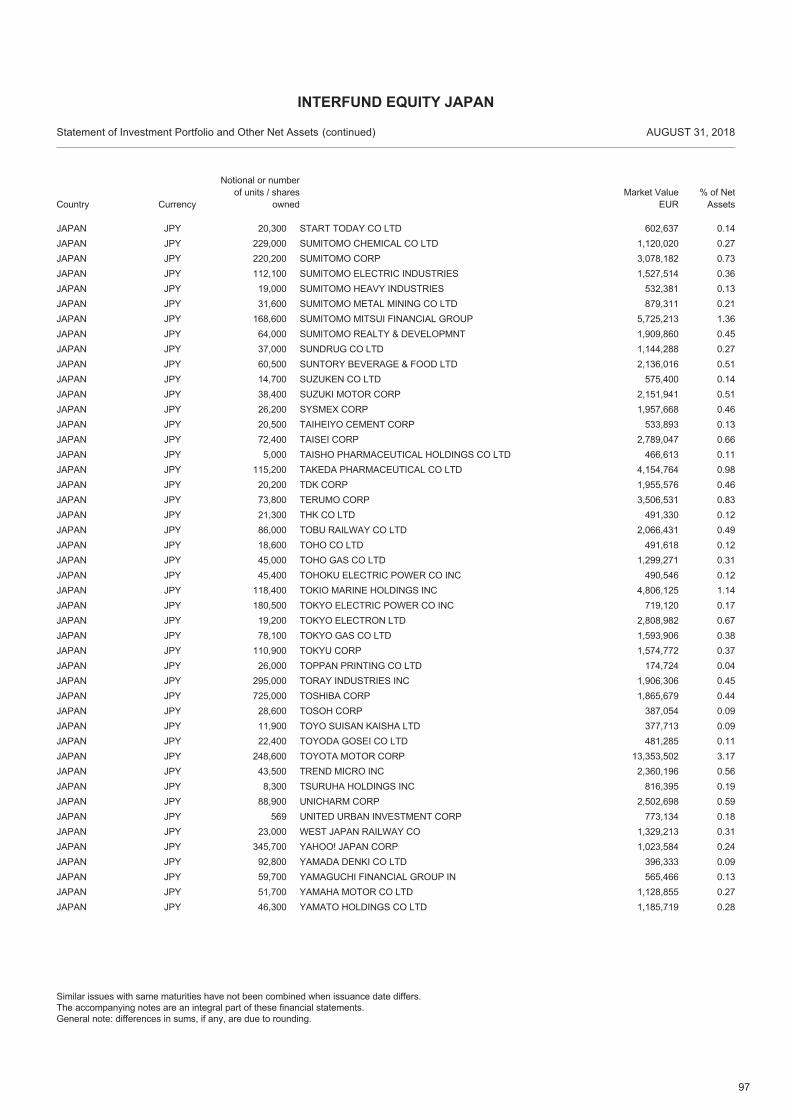
97
JPY 20,300 START TODAY CO LTD 602,637 0.14JAPANJPY 229,000 SUMITOMO CHEMICAL CO LTD 1,120,020 0.27JAPANJPY 220,200 SUMITOMO CORP 3,078,182 0.73JAPANJPY 112,100 SUMITOMO ELECTRIC INDUSTRIES 1,527,514 0.36JAPANJPY 19,000 SUMITOMO HEAVY INDUSTRIES 532,381 0.13JAPANJPY 31,600 SUMITOMO METAL MINING CO LTD 879,311 0.21JAPANJPY 168,600 SUMITOMO MITSUI FINANCIAL GROUP 5,725,213 1.36JAPANJPY 64,000 SUMITOMO REALTY & DEVELOPMNT 1,909,860 0.45JAPANJPY 37,000 SUNDRUG CO LTD 1,144,288 0.27JAPANJPY 60,500 SUNTORY BEVERAGE & FOOD LTD 2,136,016 0.51JAPANJPY 14,700 SUZUKEN CO LTD 575,400 0.14JAPANJPY 38,400 SUZUKI MOTOR CORP 2,151,941 0.51JAPANJPY 26,200 SYSMEX CORP 1,957,668 0.46JAPANJPY 20,500 TAIHEIYO CEMENT CORP 533,893 0.13JAPANJPY 72,400 TAISEI CORP 2,789,047 0.66JAPANJPY 5,000 TAISHO PHARMACEUTICAL HOLDINGS CO LTD 466,613 0.11JAPANJPY 115,200 TAKEDA PHARMACEUTICAL CO LTD 4,154,764 0.98JAPANJPY 20,200 TDK CORP 1,955,576 0.46JAPANJPY 73,800 TERUMO CORP 3,506,531 0.83JAPANJPY 21,300 THK CO LTD 491,330 0.12JAPANJPY 86,000 TOBU RAILWAY CO LTD 2,066,431 0.49JAPANJPY 18,600 TOHO CO LTD 491,618 0.12JAPANJPY 45,000 TOHO GAS CO LTD 1,299,271 0.31JAPANJPY 45,400 TOHOKU ELECTRIC POWER CO INC 490,546 0.12JAPANJPY 118,400 TOKIO MARINE HOLDINGS INC 4,806,125 1.14JAPANJPY 180,500 TOKYO ELECTRIC POWER CO INC 719,120 0.17JAPANJPY 19,200 TOKYO ELECTRON LTD 2,808,982 0.67JAPANJPY 78,100 TOKYO GAS CO LTD 1,593,906 0.38JAPANJPY 110,900 TOKYU CORP 1,574,772 0.37JAPANJPY 26,000 TOPPAN PRINTING CO LTD 174,724 0.04JAPANJPY 295,000 TORAY INDUSTRIES INC 1,906,306 0.45JAPANJPY 725,000 TOSHIBA CORP 1,865,679 0.44JAPANJPY 28,600 TOSOH CORP 387,054 0.09JAPANJPY 11,900 TOYO SUISAN KAISHA LTD 377,713 0.09JAPANJPY 22,400 TOYODA GOSEI CO LTD 481,285 0.11JAPANJPY 248,600 TOYOTA MOTOR CORP 13,353,502 3.17JAPANJPY 43,500 TREND MICRO INC 2,360,196 0.56JAPANJPY 8,300 TSURUHA HOLDINGS INC 816,395 0.19JAPANJPY 88,900 UNICHARM CORP 2,502,698 0.59JAPANJPY 569 UNITED URBAN INVESTMENT CORP 773,134 0.18JAPANJPY 23,000 WEST JAPAN RAILWAY CO 1,329,213 0.31JAPANJPY 345,700 YAHOO! JAPAN CORP 1,023,584 0.24JAPANJPY 92,800 YAMADA DENKI CO LTD 396,333 0.09JAPANJPY 59,700 YAMAGUCHI FINANCIAL GROUP IN 565,466 0.13JAPANJPY 51,700 YAMAHA MOTOR CO LTD 1,128,855 0.27JAPANJPY 46,300 YAMATO HOLDINGS CO LTD 1,185,719 0.28JAPAN
Country
Statement of Investment Portfolio and Other Net Assets AUGUST 31, 2018
Notional or number of units / shares
ownedMarket Value
EUR% of Net
Assets
INTERFUND EQUITY JAPAN
(continued)
Similar issues with same maturities have not been combined when issuance date differs.The accompanying notes are an integral part of these financial statements.General note: differences in sums, if any, are due to rounding.
Currency
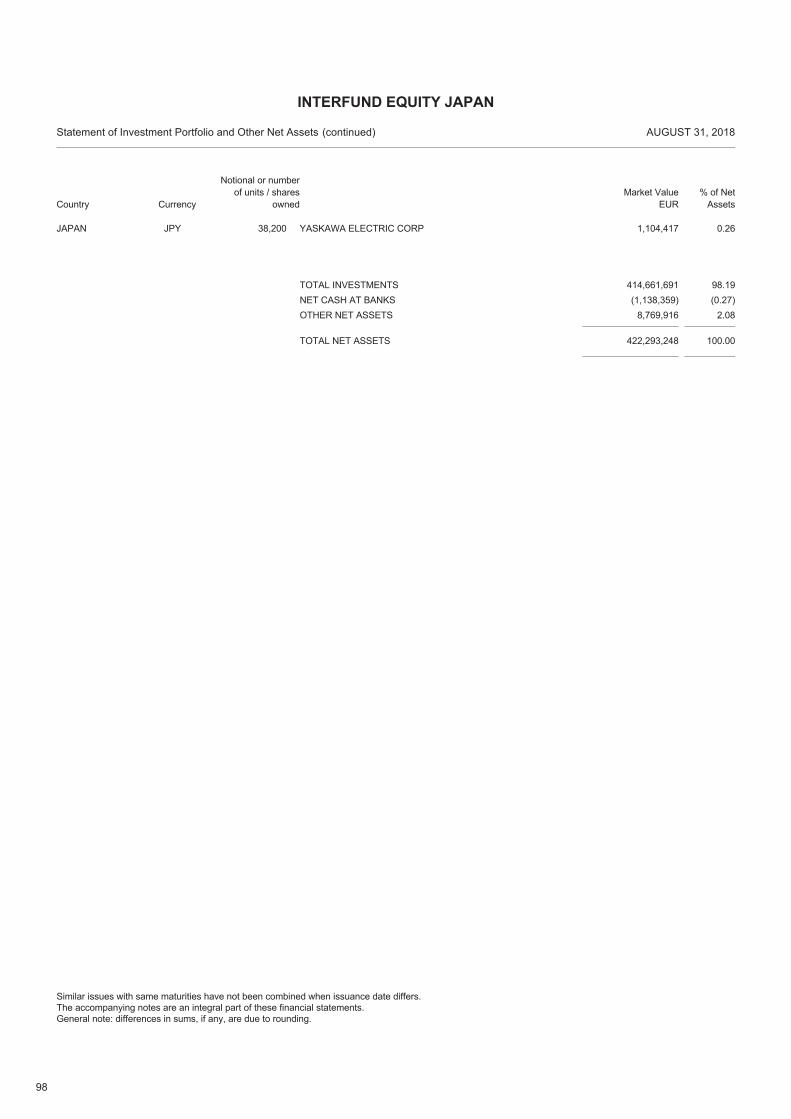
98
JPY 38,200 YASKAWA ELECTRIC CORP 1,104,417 0.26JAPAN
TOTAL NET ASSETS 422,293,248 100.00
TOTAL INVESTMENTS 414,661,691 98.19NET CASH AT BANKS (1,138,359) (0.27)OTHER NET ASSETS 8,769,916 2.08
Country
Statement of Investment Portfolio and Other Net Assets AUGUST 31, 2018
Notional or number of units / shares
ownedMarket Value
EUR% of Net
Assets
INTERFUND EQUITY JAPAN
(continued)
Similar issues with same maturities have not been combined when issuance date differs.The accompanying notes are an integral part of these financial statements.General note: differences in sums, if any, are due to rounding.
Currency
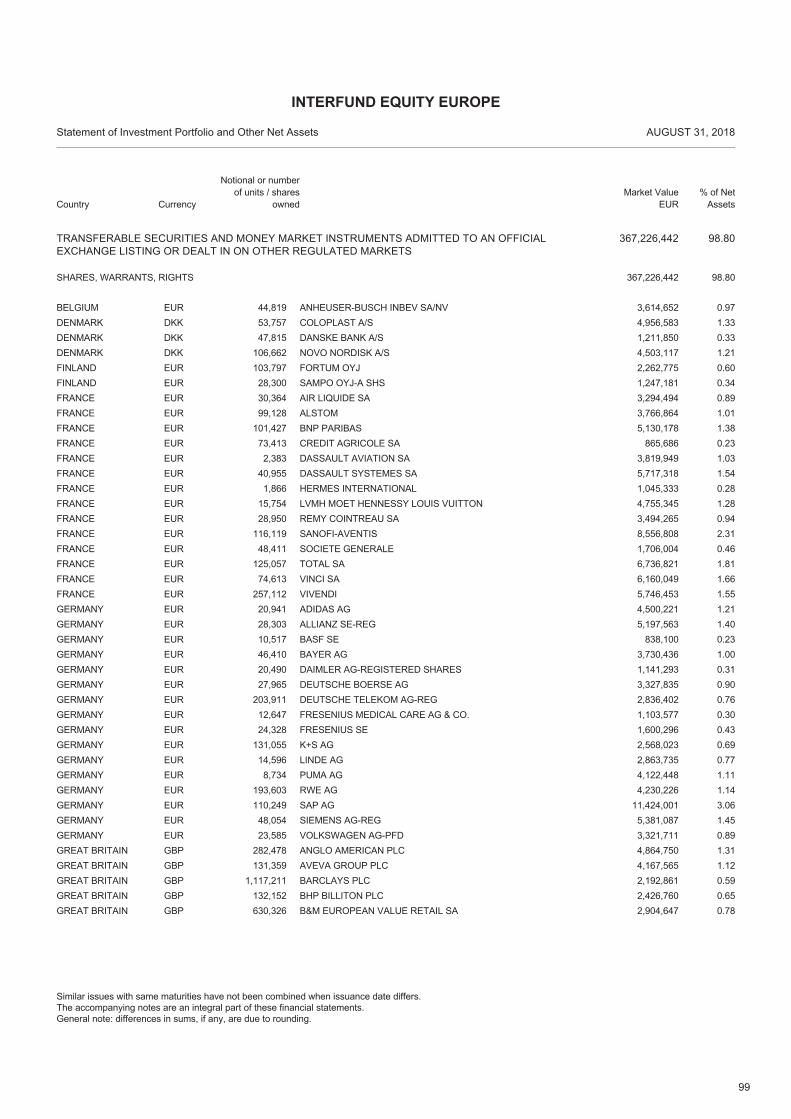
99
TRANSFERABLE SECURITIES AND MONEY MARKET INSTRUMENTS ADMITTED TO AN OFFICIALEXCHANGE LISTING OR DEALT IN ON OTHER REGULATED MARKETS
367,226,442 98.80
EUR 44,819 ANHEUSER-BUSCH INBEV SA/NV 3,614,652 0.97BELGIUM
SHARES, WARRANTS, RIGHTS 98.80367,226,442
DKK 53,757 COLOPLAST A/S 4,956,583 1.33DENMARKDKK 47,815 DANSKE BANK A/S 1,211,850 0.33DENMARKDKK 106,662 NOVO NORDISK A/S 4,503,117 1.21DENMARKEUR 103,797 FORTUM OYJ 2,262,775 0.60FINLANDEUR 28,300 SAMPO OYJ-A SHS 1,247,181 0.34FINLANDEUR 30,364 AIR LIQUIDE SA 3,294,494 0.89FRANCEEUR 99,128 ALSTOM 3,766,864 1.01FRANCEEUR 101,427 BNP PARIBAS 5,130,178 1.38FRANCEEUR 73,413 CREDIT AGRICOLE SA 865,686 0.23FRANCEEUR 2,383 DASSAULT AVIATION SA 3,819,949 1.03FRANCEEUR 40,955 DASSAULT SYSTEMES SA 5,717,318 1.54FRANCEEUR 1,866 HERMES INTERNATIONAL 1,045,333 0.28FRANCEEUR 15,754 LVMH MOET HENNESSY LOUIS VUITTON 4,755,345 1.28FRANCEEUR 28,950 REMY COINTREAU SA 3,494,265 0.94FRANCEEUR 116,119 SANOFI-AVENTIS 8,556,808 2.31FRANCEEUR 48,411 SOCIETE GENERALE 1,706,004 0.46FRANCEEUR 125,057 TOTAL SA 6,736,821 1.81FRANCEEUR 74,613 VINCI SA 6,160,049 1.66FRANCEEUR 257,112 VIVENDI 5,746,453 1.55FRANCEEUR 20,941 ADIDAS AG 4,500,221 1.21GERMANYEUR 28,303 ALLIANZ SE-REG 5,197,563 1.40GERMANYEUR 10,517 BASF SE 838,100 0.23GERMANYEUR 46,410 BAYER AG 3,730,436 1.00GERMANYEUR 20,490 DAIMLER AG-REGISTERED SHARES 1,141,293 0.31GERMANYEUR 27,965 DEUTSCHE BOERSE AG 3,327,835 0.90GERMANYEUR 203,911 DEUTSCHE TELEKOM AG-REG 2,836,402 0.76GERMANYEUR 12,647 FRESENIUS MEDICAL CARE AG & CO. 1,103,577 0.30GERMANYEUR 24,328 FRESENIUS SE 1,600,296 0.43GERMANYEUR 131,055 K+S AG 2,568,023 0.69GERMANYEUR 14,596 LINDE AG 2,863,735 0.77GERMANYEUR 8,734 PUMA AG 4,122,448 1.11GERMANYEUR 193,603 RWE AG 4,230,226 1.14GERMANYEUR 110,249 SAP AG 11,424,001 3.06GERMANYEUR 48,054 SIEMENS AG-REG 5,381,087 1.45GERMANYEUR 23,585 VOLKSWAGEN AG-PFD 3,321,711 0.89GERMANYGBP 282,478 ANGLO AMERICAN PLC 4,864,750 1.31GREAT BRITAINGBP 131,359 AVEVA GROUP PLC 4,167,565 1.12GREAT BRITAINGBP 1,117,211 BARCLAYS PLC 2,192,861 0.59GREAT BRITAINGBP 132,152 BHP BILLITON PLC 2,426,760 0.65GREAT BRITAINGBP 630,326 B&M EUROPEAN VALUE RETAIL SA 2,904,647 0.78GREAT BRITAIN
Country
Statement of Investment Portfolio and Other Net Assets AUGUST 31, 2018
Notional or number of units / shares
ownedMarket Value
EUR% of Net
Assets
INTERFUND EQUITY EUROPE
Similar issues with same maturities have not been combined when issuance date differs.The accompanying notes are an integral part of these financial statements.General note: differences in sums, if any, are due to rounding.
Currency
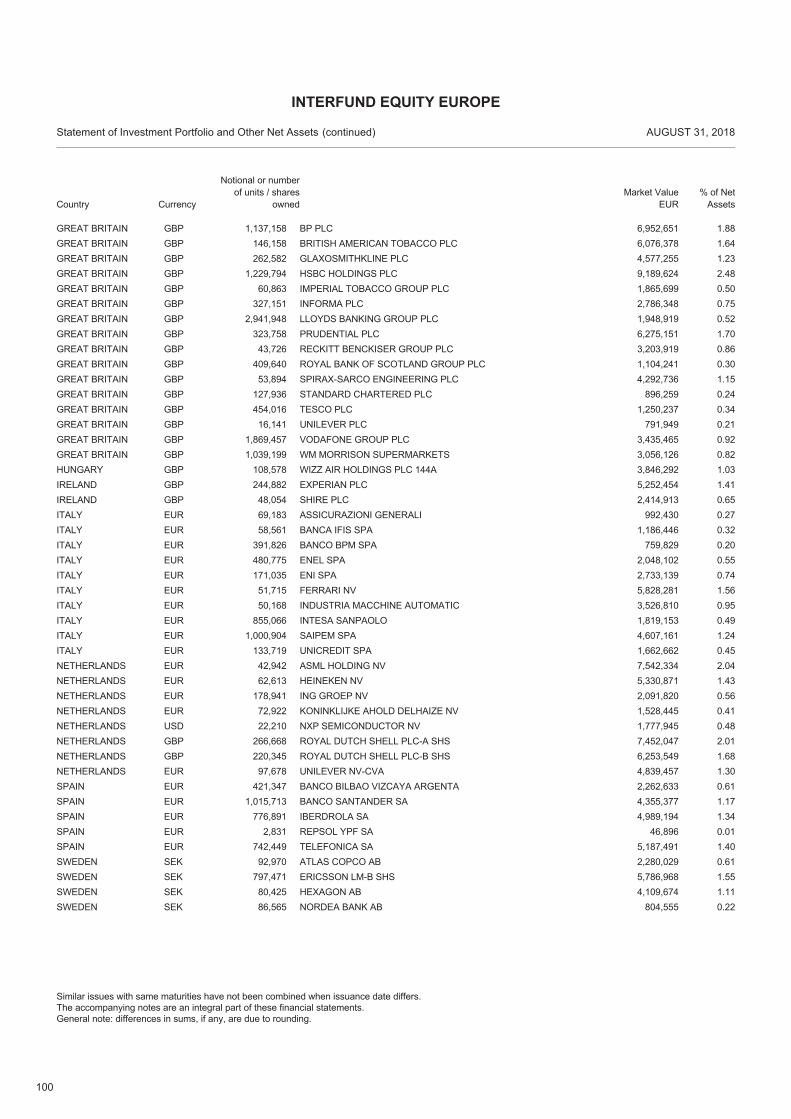
100
GBP 1,137,158 BP PLC 6,952,651 1.88GREAT BRITAINGBP 146,158 BRITISH AMERICAN TOBACCO PLC 6,076,378 1.64GREAT BRITAINGBP 262,582 GLAXOSMITHKLINE PLC 4,577,255 1.23GREAT BRITAINGBP 1,229,794 HSBC HOLDINGS PLC 9,189,624 2.48GREAT BRITAINGBP 60,863 IMPERIAL TOBACCO GROUP PLC 1,865,699 0.50GREAT BRITAINGBP 327,151 INFORMA PLC 2,786,348 0.75GREAT BRITAINGBP 2,941,948 LLOYDS BANKING GROUP PLC 1,948,919 0.52GREAT BRITAINGBP 323,758 PRUDENTIAL PLC 6,275,151 1.70GREAT BRITAINGBP 43,726 RECKITT BENCKISER GROUP PLC 3,203,919 0.86GREAT BRITAINGBP 409,640 ROYAL BANK OF SCOTLAND GROUP PLC 1,104,241 0.30GREAT BRITAINGBP 53,894 SPIRAX-SARCO ENGINEERING PLC 4,292,736 1.15GREAT BRITAINGBP 127,936 STANDARD CHARTERED PLC 896,259 0.24GREAT BRITAINGBP 454,016 TESCO PLC 1,250,237 0.34GREAT BRITAINGBP 16,141 UNILEVER PLC 791,949 0.21GREAT BRITAINGBP 1,869,457 VODAFONE GROUP PLC 3,435,465 0.92GREAT BRITAINGBP 1,039,199 WM MORRISON SUPERMARKETS 3,056,126 0.82GREAT BRITAINGBP 108,578 WIZZ AIR HOLDINGS PLC 144A 3,846,292 1.03HUNGARYGBP 244,882 EXPERIAN PLC 5,252,454 1.41IRELANDGBP 48,054 SHIRE PLC 2,414,913 0.65IRELANDEUR 69,183 ASSICURAZIONI GENERALI 992,430 0.27ITALYEUR 58,561 BANCA IFIS SPA 1,186,446 0.32ITALYEUR 391,826 BANCO BPM SPA 759,829 0.20ITALYEUR 480,775 ENEL SPA 2,048,102 0.55ITALYEUR 171,035 ENI SPA 2,733,139 0.74ITALYEUR 51,715 FERRARI NV 5,828,281 1.56ITALYEUR 50,168 INDUSTRIA MACCHINE AUTOMATIC 3,526,810 0.95ITALYEUR 855,066 INTESA SANPAOLO 1,819,153 0.49ITALYEUR 1,000,904 SAIPEM SPA 4,607,161 1.24ITALYEUR 133,719 UNICREDIT SPA 1,662,662 0.45ITALYEUR 42,942 ASML HOLDING NV 7,542,334 2.04NETHERLANDSEUR 62,613 HEINEKEN NV 5,330,871 1.43NETHERLANDSEUR 178,941 ING GROEP NV 2,091,820 0.56NETHERLANDSEUR 72,922 KONINKLIJKE AHOLD DELHAIZE NV 1,528,445 0.41NETHERLANDSUSD 22,210 NXP SEMICONDUCTOR NV 1,777,945 0.48NETHERLANDSGBP 266,668 ROYAL DUTCH SHELL PLC-A SHS 7,452,047 2.01NETHERLANDSGBP 220,345 ROYAL DUTCH SHELL PLC-B SHS 6,253,549 1.68NETHERLANDSEUR 97,678 UNILEVER NV-CVA 4,839,457 1.30NETHERLANDSEUR 421,347 BANCO BILBAO VIZCAYA ARGENTA 2,262,633 0.61SPAINEUR 1,015,713 BANCO SANTANDER SA 4,355,377 1.17SPAINEUR 776,891 IBERDROLA SA 4,989,194 1.34SPAINEUR 2,831 REPSOL YPF SA 46,896 0.01SPAINEUR 742,449 TELEFONICA SA 5,187,491 1.40SPAINSEK 92,970 ATLAS COPCO AB 2,280,029 0.61SWEDENSEK 797,471 ERICSSON LM-B SHS 5,786,968 1.55SWEDENSEK 80,425 HEXAGON AB 4,109,674 1.11SWEDENSEK 86,565 NORDEA BANK AB 804,555 0.22SWEDEN
Country
Statement of Investment Portfolio and Other Net Assets AUGUST 31, 2018
Notional or number of units / shares
ownedMarket Value
EUR% of Net
Assets
INTERFUND EQUITY EUROPE
(continued)
Similar issues with same maturities have not been combined when issuance date differs.The accompanying notes are an integral part of these financial statements.General note: differences in sums, if any, are due to rounding.
Currency
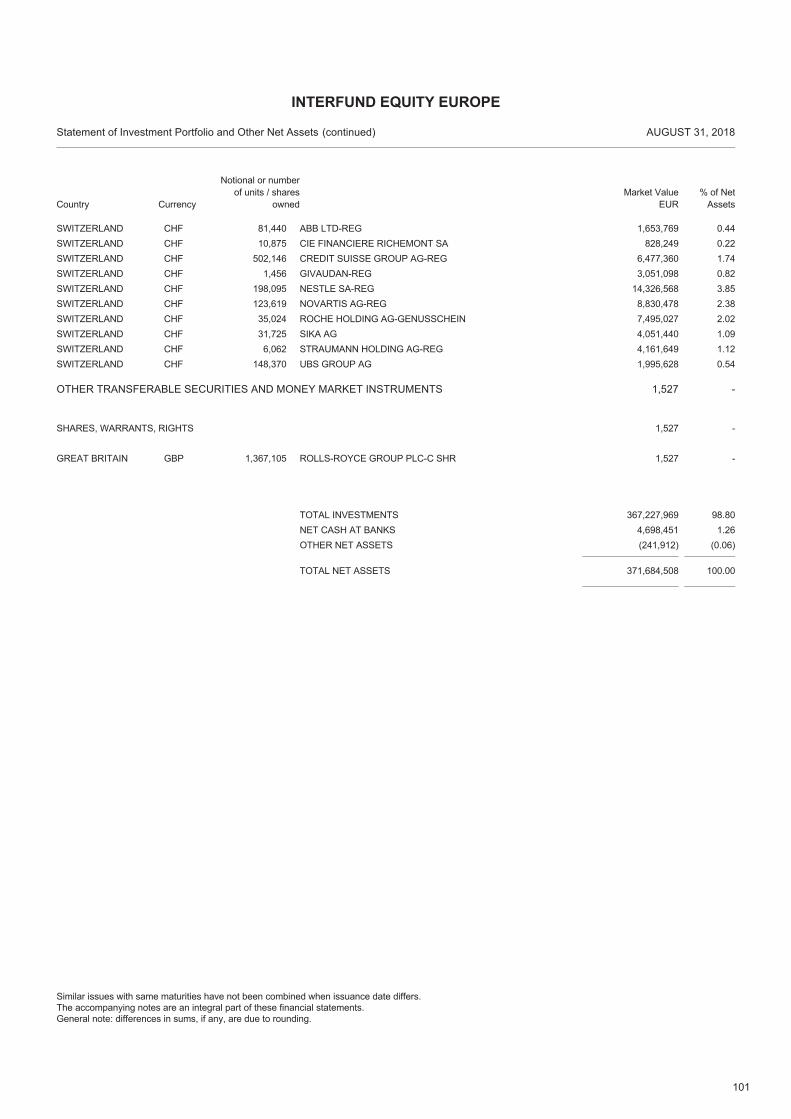
101
CHF 81,440 ABB LTD-REG 1,653,769 0.44SWITZERLANDCHF 10,875 CIE FINANCIERE RICHEMONT SA 828,249 0.22SWITZERLANDCHF 502,146 CREDIT SUISSE GROUP AG-REG 6,477,360 1.74SWITZERLANDCHF 1,456 GIVAUDAN-REG 3,051,098 0.82SWITZERLANDCHF 198,095 NESTLE SA-REG 14,326,568 3.85SWITZERLANDCHF 123,619 NOVARTIS AG-REG 8,830,478 2.38SWITZERLANDCHF 35,024 ROCHE HOLDING AG-GENUSSCHEIN 7,495,027 2.02SWITZERLANDCHF 31,725 SIKA AG 4,051,440 1.09SWITZERLANDCHF 6,062 STRAUMANN HOLDING AG-REG 4,161,649 1.12SWITZERLANDCHF 148,370 UBS GROUP AG 1,995,628 0.54SWITZERLAND
OTHER TRANSFERABLE SECURITIES AND MONEY MARKET INSTRUMENTS 1,527 -
GBP 1,367,105 ROLLS-ROYCE GROUP PLC-C SHR 1,527 -GREAT BRITAIN
SHARES, WARRANTS, RIGHTS -1,527
TOTAL NET ASSETS 371,684,508 100.00
TOTAL INVESTMENTS 367,227,969 98.80NET CASH AT BANKS 4,698,451 1.26OTHER NET ASSETS (241,912) (0.06)
Country
Statement of Investment Portfolio and Other Net Assets AUGUST 31, 2018
Notional or number of units / shares
ownedMarket Value
EUR% of Net
Assets
INTERFUND EQUITY EUROPE
(continued)
Similar issues with same maturities have not been combined when issuance date differs.The accompanying notes are an integral part of these financial statements.General note: differences in sums, if any, are due to rounding.
Currency
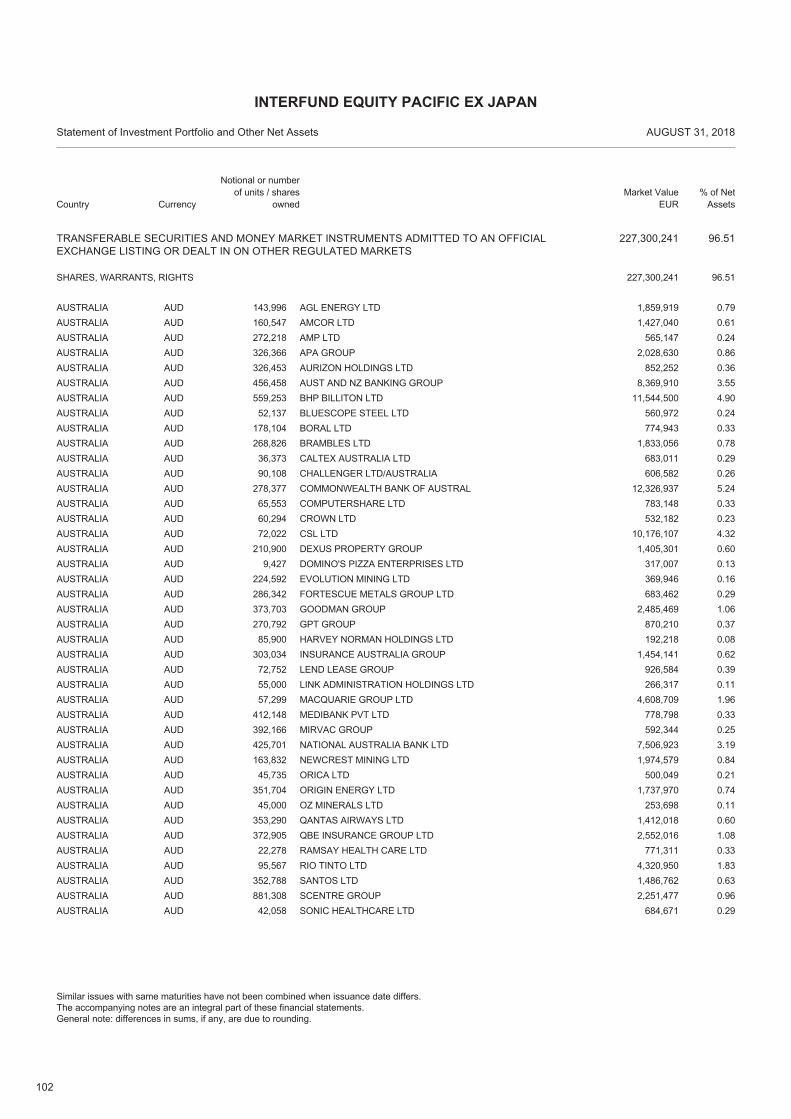
102
TRANSFERABLE SECURITIES AND MONEY MARKET INSTRUMENTS ADMITTED TO AN OFFICIALEXCHANGE LISTING OR DEALT IN ON OTHER REGULATED MARKETS
227,300,241 96.51
AUD 143,996 AGL ENERGY LTD 1,859,919 0.79AUSTRALIA
SHARES, WARRANTS, RIGHTS 96.51227,300,241
AUD 160,547 AMCOR LTD 1,427,040 0.61AUSTRALIAAUD 272,218 AMP LTD 565,147 0.24AUSTRALIAAUD 326,366 APA GROUP 2,028,630 0.86AUSTRALIAAUD 326,453 AURIZON HOLDINGS LTD 852,252 0.36AUSTRALIAAUD 456,458 AUST AND NZ BANKING GROUP 8,369,910 3.55AUSTRALIAAUD 559,253 BHP BILLITON LTD 11,544,500 4.90AUSTRALIAAUD 52,137 BLUESCOPE STEEL LTD 560,972 0.24AUSTRALIAAUD 178,104 BORAL LTD 774,943 0.33AUSTRALIAAUD 268,826 BRAMBLES LTD 1,833,056 0.78AUSTRALIAAUD 36,373 CALTEX AUSTRALIA LTD 683,011 0.29AUSTRALIAAUD 90,108 CHALLENGER LTD/AUSTRALIA 606,582 0.26AUSTRALIAAUD 278,377 COMMONWEALTH BANK OF AUSTRAL 12,326,937 5.24AUSTRALIAAUD 65,553 COMPUTERSHARE LTD 783,148 0.33AUSTRALIAAUD 60,294 CROWN LTD 532,182 0.23AUSTRALIAAUD 72,022 CSL LTD 10,176,107 4.32AUSTRALIAAUD 210,900 DEXUS PROPERTY GROUP 1,405,301 0.60AUSTRALIAAUD 9,427 DOMINO'S PIZZA ENTERPRISES LTD 317,007 0.13AUSTRALIAAUD 224,592 EVOLUTION MINING LTD 369,946 0.16AUSTRALIAAUD 286,342 FORTESCUE METALS GROUP LTD 683,462 0.29AUSTRALIAAUD 373,703 GOODMAN GROUP 2,485,469 1.06AUSTRALIAAUD 270,792 GPT GROUP 870,210 0.37AUSTRALIAAUD 85,900 HARVEY NORMAN HOLDINGS LTD 192,218 0.08AUSTRALIAAUD 303,034 INSURANCE AUSTRALIA GROUP 1,454,141 0.62AUSTRALIAAUD 72,752 LEND LEASE GROUP 926,584 0.39AUSTRALIAAUD 55,000 LINK ADMINISTRATION HOLDINGS LTD 266,317 0.11AUSTRALIAAUD 57,299 MACQUARIE GROUP LTD 4,608,709 1.96AUSTRALIAAUD 412,148 MEDIBANK PVT LTD 778,798 0.33AUSTRALIAAUD 392,166 MIRVAC GROUP 592,344 0.25AUSTRALIAAUD 425,701 NATIONAL AUSTRALIA BANK LTD 7,506,923 3.19AUSTRALIAAUD 163,832 NEWCREST MINING LTD 1,974,579 0.84AUSTRALIAAUD 45,735 ORICA LTD 500,049 0.21AUSTRALIAAUD 351,704 ORIGIN ENERGY LTD 1,737,970 0.74AUSTRALIAAUD 45,000 OZ MINERALS LTD 253,698 0.11AUSTRALIAAUD 353,290 QANTAS AIRWAYS LTD 1,412,018 0.60AUSTRALIAAUD 372,905 QBE INSURANCE GROUP LTD 2,552,016 1.08AUSTRALIAAUD 22,278 RAMSAY HEALTH CARE LTD 771,311 0.33AUSTRALIAAUD 95,567 RIO TINTO LTD 4,320,950 1.83AUSTRALIAAUD 352,788 SANTOS LTD 1,486,762 0.63AUSTRALIAAUD 881,308 SCENTRE GROUP 2,251,477 0.96AUSTRALIAAUD 42,058 SONIC HEALTHCARE LTD 684,671 0.29AUSTRALIA
Country
Statement of Investment Portfolio and Other Net Assets AUGUST 31, 2018
Notional or number of units / shares
ownedMarket Value
EUR% of Net
Assets
INTERFUND EQUITY PACIFIC EX JAPAN
Similar issues with same maturities have not been combined when issuance date differs.The accompanying notes are an integral part of these financial statements.General note: differences in sums, if any, are due to rounding.
Currency
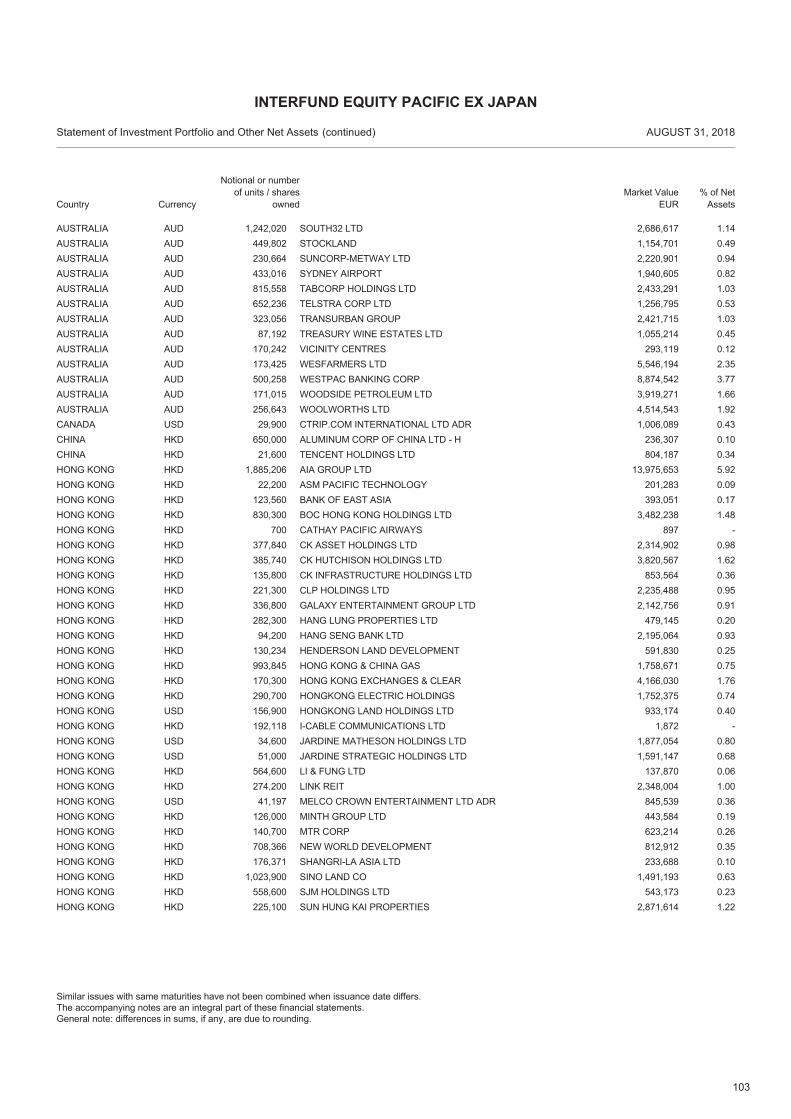
103
AUD 1,242,020 SOUTH32 LTD 2,686,617 1.14AUSTRALIAAUD 449,802 STOCKLAND 1,154,701 0.49AUSTRALIAAUD 230,664 SUNCORP-METWAY LTD 2,220,901 0.94AUSTRALIAAUD 433,016 SYDNEY AIRPORT 1,940,605 0.82AUSTRALIAAUD 815,558 TABCORP HOLDINGS LTD 2,433,291 1.03AUSTRALIAAUD 652,236 TELSTRA CORP LTD 1,256,795 0.53AUSTRALIAAUD 323,056 TRANSURBAN GROUP 2,421,715 1.03AUSTRALIAAUD 87,192 TREASURY WINE ESTATES LTD 1,055,214 0.45AUSTRALIAAUD 170,242 VICINITY CENTRES 293,119 0.12AUSTRALIAAUD 173,425 WESFARMERS LTD 5,546,194 2.35AUSTRALIAAUD 500,258 WESTPAC BANKING CORP 8,874,542 3.77AUSTRALIAAUD 171,015 WOODSIDE PETROLEUM LTD 3,919,271 1.66AUSTRALIAAUD 256,643 WOOLWORTHS LTD 4,514,543 1.92AUSTRALIAUSD 29,900 CTRIP.COM INTERNATIONAL LTD ADR 1,006,089 0.43CANADAHKD 650,000 ALUMINUM CORP OF CHINA LTD - H 236,307 0.10CHINAHKD 21,600 TENCENT HOLDINGS LTD 804,187 0.34CHINAHKD 1,885,206 AIA GROUP LTD 13,975,653 5.92HONG KONGHKD 22,200 ASM PACIFIC TECHNOLOGY 201,283 0.09HONG KONGHKD 123,560 BANK OF EAST ASIA 393,051 0.17HONG KONGHKD 830,300 BOC HONG KONG HOLDINGS LTD 3,482,238 1.48HONG KONGHKD 700 CATHAY PACIFIC AIRWAYS 897 -HONG KONGHKD 377,840 CK ASSET HOLDINGS LTD 2,314,902 0.98HONG KONGHKD 385,740 CK HUTCHISON HOLDINGS LTD 3,820,567 1.62HONG KONGHKD 135,800 CK INFRASTRUCTURE HOLDINGS LTD 853,564 0.36HONG KONGHKD 221,300 CLP HOLDINGS LTD 2,235,488 0.95HONG KONGHKD 336,800 GALAXY ENTERTAINMENT GROUP LTD 2,142,756 0.91HONG KONGHKD 282,300 HANG LUNG PROPERTIES LTD 479,145 0.20HONG KONGHKD 94,200 HANG SENG BANK LTD 2,195,064 0.93HONG KONGHKD 130,234 HENDERSON LAND DEVELOPMENT 591,830 0.25HONG KONGHKD 993,845 HONG KONG & CHINA GAS 1,758,671 0.75HONG KONGHKD 170,300 HONG KONG EXCHANGES & CLEAR 4,166,030 1.76HONG KONGHKD 290,700 HONGKONG ELECTRIC HOLDINGS 1,752,375 0.74HONG KONGUSD 156,900 HONGKONG LAND HOLDINGS LTD 933,174 0.40HONG KONGHKD 192,118 I-CABLE COMMUNICATIONS LTD 1,872 -HONG KONGUSD 34,600 JARDINE MATHESON HOLDINGS LTD 1,877,054 0.80HONG KONGUSD 51,000 JARDINE STRATEGIC HOLDINGS LTD 1,591,147 0.68HONG KONGHKD 564,600 LI & FUNG LTD 137,870 0.06HONG KONGHKD 274,200 LINK REIT 2,348,004 1.00HONG KONGUSD 41,197 MELCO CROWN ENTERTAINMENT LTD ADR 845,539 0.36HONG KONGHKD 126,000 MINTH GROUP LTD 443,584 0.19HONG KONGHKD 140,700 MTR CORP 623,214 0.26HONG KONGHKD 708,366 NEW WORLD DEVELOPMENT 812,912 0.35HONG KONGHKD 176,371 SHANGRI-LA ASIA LTD 233,688 0.10HONG KONGHKD 1,023,900 SINO LAND CO 1,491,193 0.63HONG KONGHKD 558,600 SJM HOLDINGS LTD 543,173 0.23HONG KONGHKD 225,100 SUN HUNG KAI PROPERTIES 2,871,614 1.22HONG KONG
Country
Statement of Investment Portfolio and Other Net Assets AUGUST 31, 2018
Notional or number of units / shares
ownedMarket Value
EUR% of Net
Assets
INTERFUND EQUITY PACIFIC EX JAPAN
(continued)
Similar issues with same maturities have not been combined when issuance date differs.The accompanying notes are an integral part of these financial statements.General note: differences in sums, if any, are due to rounding.
Currency
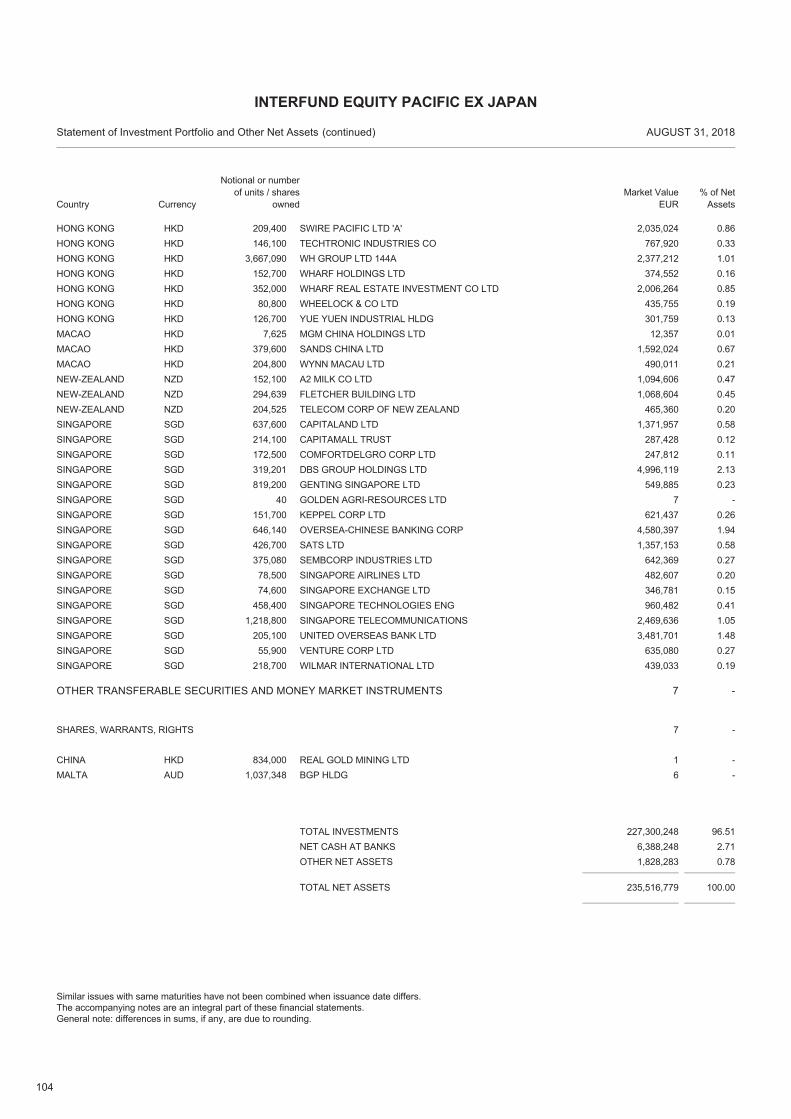
104
HKD 209,400 SWIRE PACIFIC LTD 'A' 2,035,024 0.86HONG KONGHKD 146,100 TECHTRONIC INDUSTRIES CO 767,920 0.33HONG KONGHKD 3,667,090 WH GROUP LTD 144A 2,377,212 1.01HONG KONGHKD 152,700 WHARF HOLDINGS LTD 374,552 0.16HONG KONGHKD 352,000 WHARF REAL ESTATE INVESTMENT CO LTD 2,006,264 0.85HONG KONGHKD 80,800 WHEELOCK & CO LTD 435,755 0.19HONG KONGHKD 126,700 YUE YUEN INDUSTRIAL HLDG 301,759 0.13HONG KONGHKD 7,625 MGM CHINA HOLDINGS LTD 12,357 0.01MACAOHKD 379,600 SANDS CHINA LTD 1,592,024 0.67MACAOHKD 204,800 WYNN MACAU LTD 490,011 0.21MACAONZD 152,100 A2 MILK CO LTD 1,094,606 0.47NEW-ZEALANDNZD 294,639 FLETCHER BUILDING LTD 1,068,604 0.45NEW-ZEALANDNZD 204,525 TELECOM CORP OF NEW ZEALAND 465,360 0.20NEW-ZEALANDSGD 637,600 CAPITALAND LTD 1,371,957 0.58SINGAPORESGD 214,100 CAPITAMALL TRUST 287,428 0.12SINGAPORESGD 172,500 COMFORTDELGRO CORP LTD 247,812 0.11SINGAPORESGD 319,201 DBS GROUP HOLDINGS LTD 4,996,119 2.13SINGAPORESGD 819,200 GENTING SINGAPORE LTD 549,885 0.23SINGAPORESGD 40 GOLDEN AGRI-RESOURCES LTD 7 -SINGAPORESGD 151,700 KEPPEL CORP LTD 621,437 0.26SINGAPORESGD 646,140 OVERSEA-CHINESE BANKING CORP 4,580,397 1.94SINGAPORESGD 426,700 SATS LTD 1,357,153 0.58SINGAPORESGD 375,080 SEMBCORP INDUSTRIES LTD 642,369 0.27SINGAPORESGD 78,500 SINGAPORE AIRLINES LTD 482,607 0.20SINGAPORESGD 74,600 SINGAPORE EXCHANGE LTD 346,781 0.15SINGAPORESGD 458,400 SINGAPORE TECHNOLOGIES ENG 960,482 0.41SINGAPORESGD 1,218,800 SINGAPORE TELECOMMUNICATIONS 2,469,636 1.05SINGAPORESGD 205,100 UNITED OVERSEAS BANK LTD 3,481,701 1.48SINGAPORESGD 55,900 VENTURE CORP LTD 635,080 0.27SINGAPORESGD 218,700 WILMAR INTERNATIONAL LTD 439,033 0.19SINGAPORE
OTHER TRANSFERABLE SECURITIES AND MONEY MARKET INSTRUMENTS 7 -
HKD 834,000 REAL GOLD MINING LTD 1 -CHINA
SHARES, WARRANTS, RIGHTS -7
AUD 1,037,348 BGP HLDG 6 -MALTA
TOTAL NET ASSETS 235,516,779 100.00
TOTAL INVESTMENTS 227,300,248 96.51NET CASH AT BANKS 6,388,248 2.71OTHER NET ASSETS 1,828,283 0.78
Country
Statement of Investment Portfolio and Other Net Assets AUGUST 31, 2018
Notional or number of units / shares
ownedMarket Value
EUR% of Net
Assets
INTERFUND EQUITY PACIFIC EX JAPAN
(continued)
Similar issues with same maturities have not been combined when issuance date differs.The accompanying notes are an integral part of these financial statements.General note: differences in sums, if any, are due to rounding.
Currency
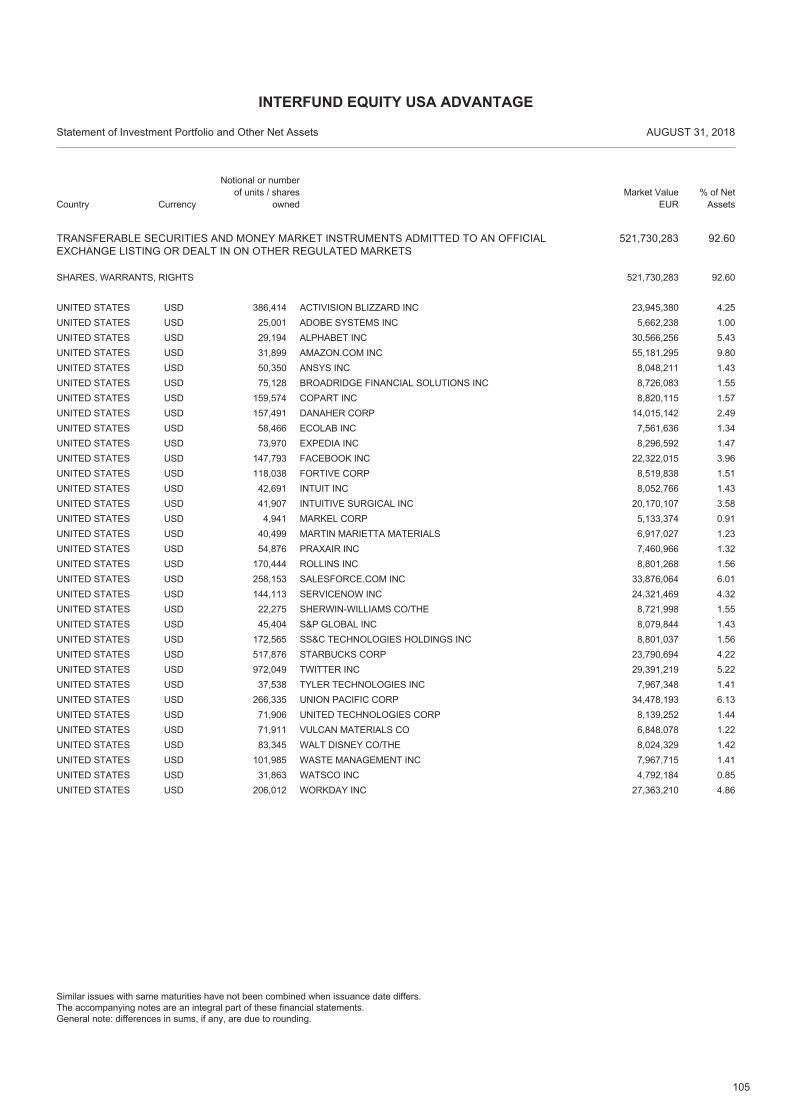
105
TRANSFERABLE SECURITIES AND MONEY MARKET INSTRUMENTS ADMITTED TO AN OFFICIALEXCHANGE LISTING OR DEALT IN ON OTHER REGULATED MARKETS
521,730,283 92.60
USD 386,414 ACTIVISION BLIZZARD INC 23,945,380 4.25UNITED STATES
SHARES, WARRANTS, RIGHTS 92.60521,730,283
USD 25,001 ADOBE SYSTEMS INC 5,662,238 1.00UNITED STATESUSD 29,194 ALPHABET INC 30,566,256 5.43UNITED STATESUSD 31,899 AMAZON.COM INC 55,181,295 9.80UNITED STATESUSD 50,350 ANSYS INC 8,048,211 1.43UNITED STATESUSD 75,128 BROADRIDGE FINANCIAL SOLUTIONS INC 8,726,083 1.55UNITED STATESUSD 159,574 COPART INC 8,820,115 1.57UNITED STATESUSD 157,491 DANAHER CORP 14,015,142 2.49UNITED STATESUSD 58,466 ECOLAB INC 7,561,636 1.34UNITED STATESUSD 73,970 EXPEDIA INC 8,296,592 1.47UNITED STATESUSD 147,793 FACEBOOK INC 22,322,015 3.96UNITED STATESUSD 118,038 FORTIVE CORP 8,519,838 1.51UNITED STATESUSD 42,691 INTUIT INC 8,052,766 1.43UNITED STATESUSD 41,907 INTUITIVE SURGICAL INC 20,170,107 3.58UNITED STATESUSD 4,941 MARKEL CORP 5,133,374 0.91UNITED STATESUSD 40,499 MARTIN MARIETTA MATERIALS 6,917,027 1.23UNITED STATESUSD 54,876 PRAXAIR INC 7,460,966 1.32UNITED STATESUSD 170,444 ROLLINS INC 8,801,268 1.56UNITED STATESUSD 258,153 SALESFORCE.COM INC 33,876,064 6.01UNITED STATESUSD 144,113 SERVICENOW INC 24,321,469 4.32UNITED STATESUSD 22,275 SHERWIN-WILLIAMS CO/THE 8,721,998 1.55UNITED STATESUSD 45,404 S&P GLOBAL INC 8,079,844 1.43UNITED STATESUSD 172,565 SS&C TECHNOLOGIES HOLDINGS INC 8,801,037 1.56UNITED STATESUSD 517,876 STARBUCKS CORP 23,790,694 4.22UNITED STATESUSD 972,049 TWITTER INC 29,391,219 5.22UNITED STATESUSD 37,538 TYLER TECHNOLOGIES INC 7,967,348 1.41UNITED STATESUSD 266,335 UNION PACIFIC CORP 34,478,193 6.13UNITED STATESUSD 71,906 UNITED TECHNOLOGIES CORP 8,139,252 1.44UNITED STATESUSD 71,911 VULCAN MATERIALS CO 6,848,078 1.22UNITED STATESUSD 83,345 WALT DISNEY CO/THE 8,024,329 1.42UNITED STATESUSD 101,985 WASTE MANAGEMENT INC 7,967,715 1.41UNITED STATESUSD 31,863 WATSCO INC 4,792,184 0.85UNITED STATESUSD 206,012 WORKDAY INC 27,363,210 4.86UNITED STATES
Country
Statement of Investment Portfolio and Other Net Assets AUGUST 31, 2018
Notional or number of units / shares
ownedMarket Value
EUR% of Net
Assets
INTERFUND EQUITY USA ADVANTAGE
Similar issues with same maturities have not been combined when issuance date differs.The accompanying notes are an integral part of these financial statements.General note: differences in sums, if any, are due to rounding.
Currency
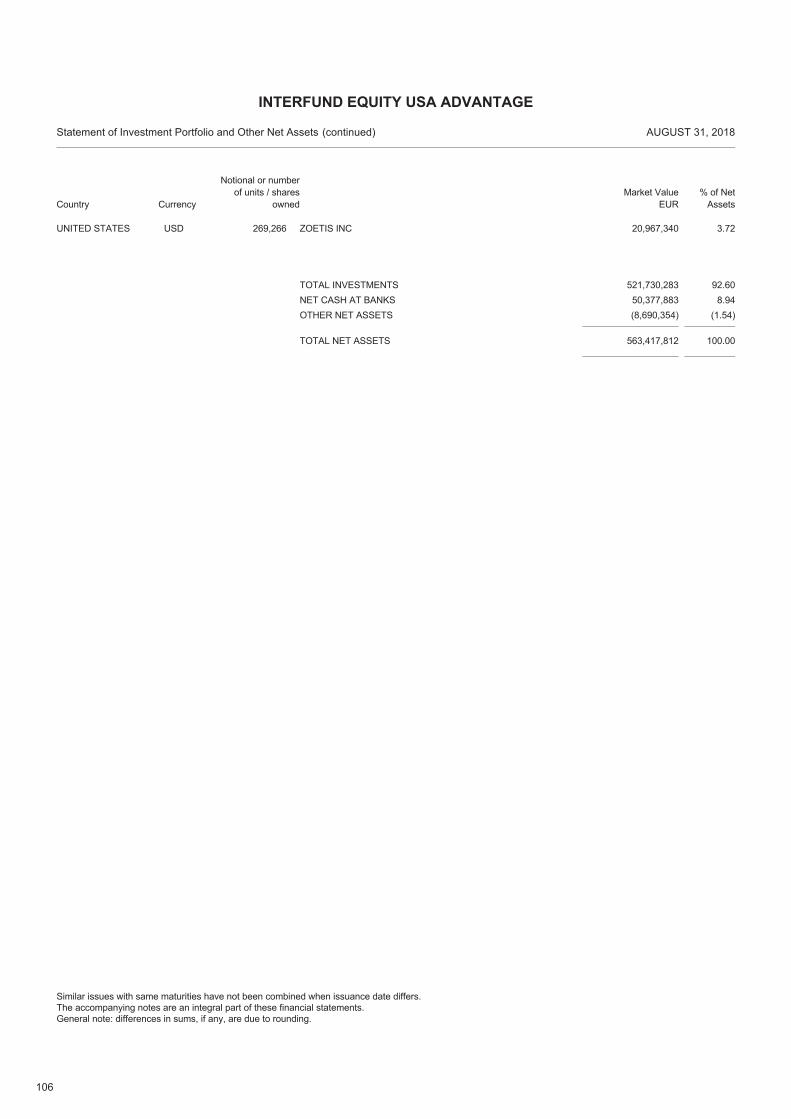
106
USD 269,266 ZOETIS INC 20,967,340 3.72UNITED STATES
TOTAL NET ASSETS 563,417,812 100.00
TOTAL INVESTMENTS 521,730,283 92.60NET CASH AT BANKS 50,377,883 8.94OTHER NET ASSETS (8,690,354) (1.54)
Country
Statement of Investment Portfolio and Other Net Assets AUGUST 31, 2018
Notional or number of units / shares
ownedMarket Value
EUR% of Net
Assets
INTERFUND EQUITY USA ADVANTAGE
(continued)
Similar issues with same maturities have not been combined when issuance date differs.The accompanying notes are an integral part of these financial statements.General note: differences in sums, if any, are due to rounding.
Currency
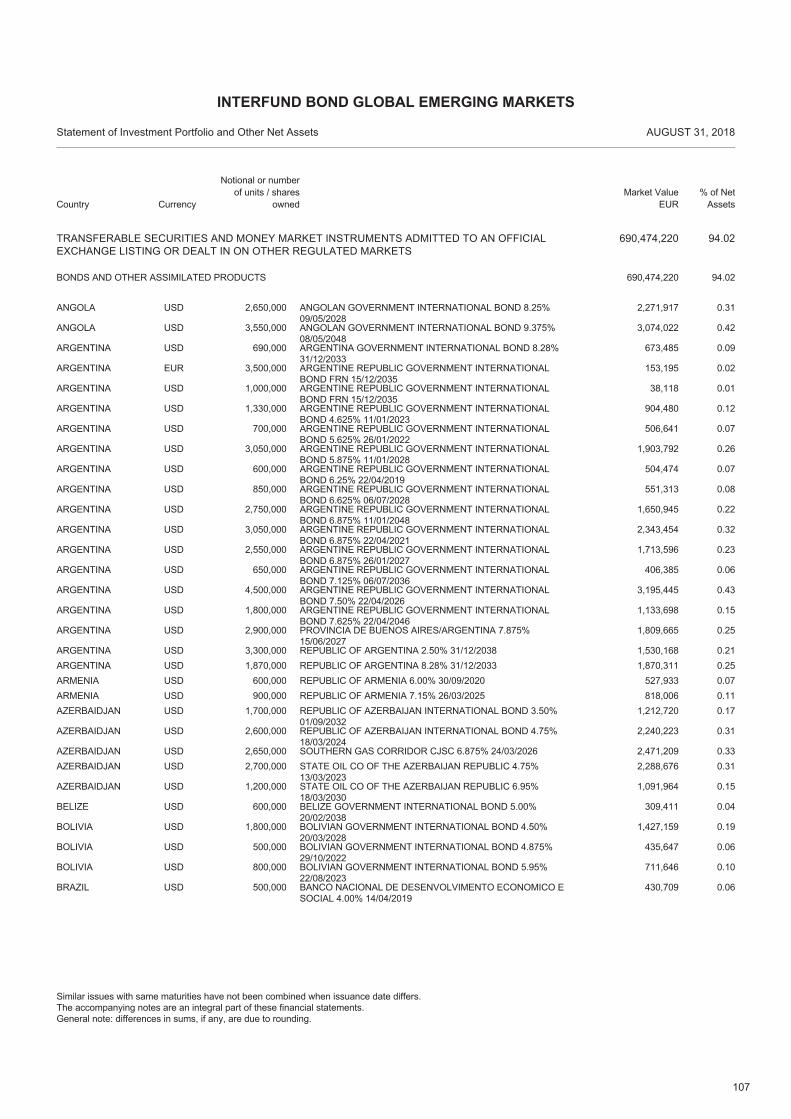
107
TRANSFERABLE SECURITIES AND MONEY MARKET INSTRUMENTS ADMITTED TO AN OFFICIALEXCHANGE LISTING OR DEALT IN ON OTHER REGULATED MARKETS
690,474,220 94.02
USD 2,650,000 ANGOLAN GOVERNMENT INTERNATIONAL BOND 8.25%09/05/2028
2,271,917 0.31ANGOLA
BONDS AND OTHER ASSIMILATED PRODUCTS 94.02690,474,220
USD 3,550,000 ANGOLAN GOVERNMENT INTERNATIONAL BOND 9.375%08/05/2048
3,074,022 0.42ANGOLA
USD 690,000 ARGENTINA GOVERNMENT INTERNATIONAL BOND 8.28%31/12/2033
673,485 0.09ARGENTINA
EUR 3,500,000 ARGENTINE REPUBLIC GOVERNMENT INTERNATIONALBOND FRN 15/12/2035
153,195 0.02ARGENTINA
USD 1,000,000 ARGENTINE REPUBLIC GOVERNMENT INTERNATIONALBOND FRN 15/12/2035
38,118 0.01ARGENTINA
USD 1,330,000 ARGENTINE REPUBLIC GOVERNMENT INTERNATIONALBOND 4.625% 11/01/2023
904,480 0.12ARGENTINA
USD 700,000 ARGENTINE REPUBLIC GOVERNMENT INTERNATIONALBOND 5.625% 26/01/2022
506,641 0.07ARGENTINA
USD 3,050,000 ARGENTINE REPUBLIC GOVERNMENT INTERNATIONALBOND 5.875% 11/01/2028
1,903,792 0.26ARGENTINA
USD 600,000 ARGENTINE REPUBLIC GOVERNMENT INTERNATIONALBOND 6.25% 22/04/2019
504,474 0.07ARGENTINA
USD 850,000 ARGENTINE REPUBLIC GOVERNMENT INTERNATIONALBOND 6.625% 06/07/2028
551,313 0.08ARGENTINA
USD 2,750,000 ARGENTINE REPUBLIC GOVERNMENT INTERNATIONALBOND 6.875% 11/01/2048
1,650,945 0.22ARGENTINA
USD 3,050,000 ARGENTINE REPUBLIC GOVERNMENT INTERNATIONALBOND 6.875% 22/04/2021
2,343,454 0.32ARGENTINA
USD 2,550,000 ARGENTINE REPUBLIC GOVERNMENT INTERNATIONALBOND 6.875% 26/01/2027
1,713,596 0.23ARGENTINA
USD 650,000 ARGENTINE REPUBLIC GOVERNMENT INTERNATIONALBOND 7.125% 06/07/2036
406,385 0.06ARGENTINA
USD 4,500,000 ARGENTINE REPUBLIC GOVERNMENT INTERNATIONALBOND 7.50% 22/04/2026
3,195,445 0.43ARGENTINA
USD 1,800,000 ARGENTINE REPUBLIC GOVERNMENT INTERNATIONALBOND 7.625% 22/04/2046
1,133,698 0.15ARGENTINA
USD 2,900,000 PROVINCIA DE BUENOS AIRES/ARGENTINA 7.875%15/06/2027
1,809,665 0.25ARGENTINA
USD 3,300,000 REPUBLIC OF ARGENTINA 2.50% 31/12/2038 1,530,168 0.21ARGENTINAUSD 1,870,000 REPUBLIC OF ARGENTINA 8.28% 31/12/2033 1,870,311 0.25ARGENTINAUSD 600,000 REPUBLIC OF ARMENIA 6.00% 30/09/2020 527,933 0.07ARMENIAUSD 900,000 REPUBLIC OF ARMENIA 7.15% 26/03/2025 818,006 0.11ARMENIAUSD 1,700,000 REPUBLIC OF AZERBAIJAN INTERNATIONAL BOND 3.50%
01/09/20321,212,720 0.17AZERBAIDJAN
USD 2,600,000 REPUBLIC OF AZERBAIJAN INTERNATIONAL BOND 4.75%18/03/2024
2,240,223 0.31AZERBAIDJAN
USD 2,650,000 SOUTHERN GAS CORRIDOR CJSC 6.875% 24/03/2026 2,471,209 0.33AZERBAIDJANUSD 2,700,000 STATE OIL CO OF THE AZERBAIJAN REPUBLIC 4.75%
13/03/20232,288,676 0.31AZERBAIDJAN
USD 1,200,000 STATE OIL CO OF THE AZERBAIJAN REPUBLIC 6.95%18/03/2030
1,091,964 0.15AZERBAIDJAN
USD 600,000 BELIZE GOVERNMENT INTERNATIONAL BOND 5.00%20/02/2038
309,411 0.04BELIZE
USD 1,800,000 BOLIVIAN GOVERNMENT INTERNATIONAL BOND 4.50%20/03/2028
1,427,159 0.19BOLIVIA
USD 500,000 BOLIVIAN GOVERNMENT INTERNATIONAL BOND 4.875%29/10/2022
435,647 0.06BOLIVIA
USD 800,000 BOLIVIAN GOVERNMENT INTERNATIONAL BOND 5.95%22/08/2023
711,646 0.10BOLIVIA
USD 500,000 BANCO NACIONAL DE DESENVOLVIMENTO ECONOMICO ESOCIAL 4.00% 14/04/2019
430,709 0.06BRAZIL
Country
Statement of Investment Portfolio and Other Net Assets AUGUST 31, 2018
Notional or number of units / shares
ownedMarket Value
EUR% of Net
Assets
INTERFUND BOND GLOBAL EMERGING MARKETS
Similar issues with same maturities have not been combined when issuance date differs.The accompanying notes are an integral part of these financial statements.General note: differences in sums, if any, are due to rounding.
Currency
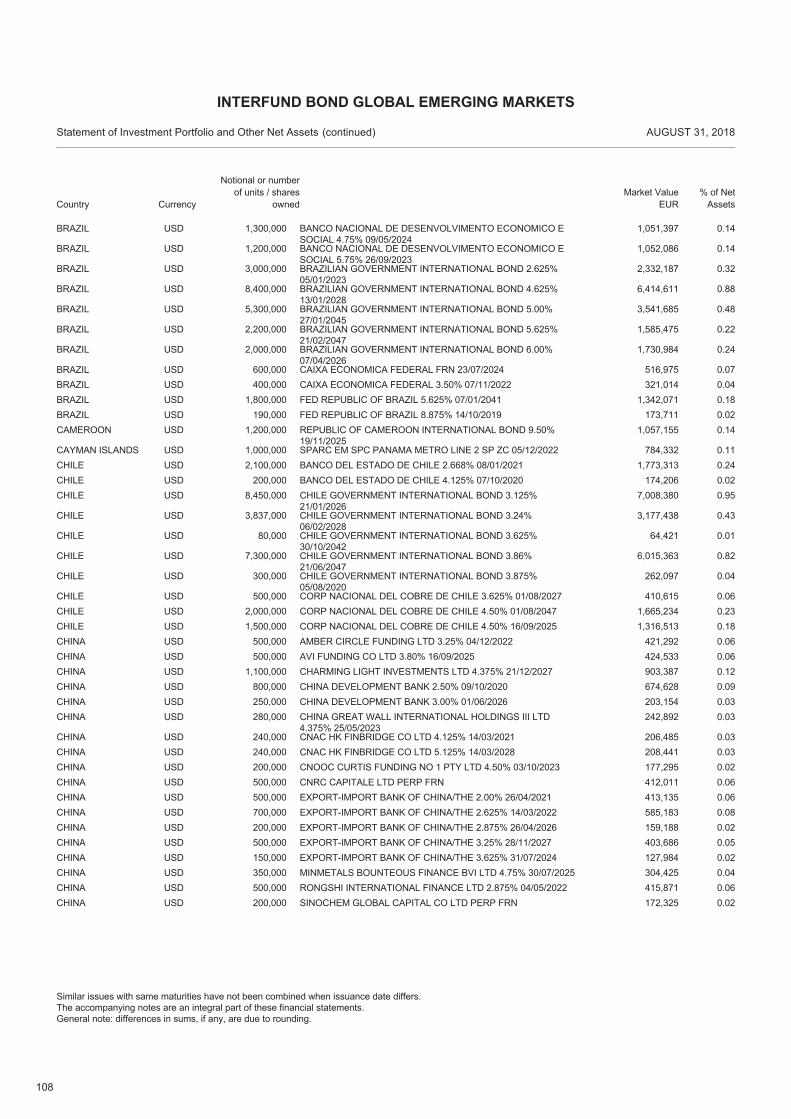
108
USD 1,300,000 BANCO NACIONAL DE DESENVOLVIMENTO ECONOMICO ESOCIAL 4.75% 09/05/2024
1,051,397 0.14BRAZIL
USD 1,200,000 BANCO NACIONAL DE DESENVOLVIMENTO ECONOMICO ESOCIAL 5.75% 26/09/2023
1,052,086 0.14BRAZIL
USD 3,000,000 BRAZILIAN GOVERNMENT INTERNATIONAL BOND 2.625%05/01/2023
2,332,187 0.32BRAZIL
USD 8,400,000 BRAZILIAN GOVERNMENT INTERNATIONAL BOND 4.625%13/01/2028
6,414,611 0.88BRAZIL
USD 5,300,000 BRAZILIAN GOVERNMENT INTERNATIONAL BOND 5.00%27/01/2045
3,541,685 0.48BRAZIL
USD 2,200,000 BRAZILIAN GOVERNMENT INTERNATIONAL BOND 5.625%21/02/2047
1,585,475 0.22BRAZIL
USD 2,000,000 BRAZILIAN GOVERNMENT INTERNATIONAL BOND 6.00%07/04/2026
1,730,984 0.24BRAZIL
USD 600,000 CAIXA ECONOMICA FEDERAL FRN 23/07/2024 516,975 0.07BRAZILUSD 400,000 CAIXA ECONOMICA FEDERAL 3.50% 07/11/2022 321,014 0.04BRAZILUSD 1,800,000 FED REPUBLIC OF BRAZIL 5.625% 07/01/2041 1,342,071 0.18BRAZILUSD 190,000 FED REPUBLIC OF BRAZIL 8.875% 14/10/2019 173,711 0.02BRAZILUSD 1,200,000 REPUBLIC OF CAMEROON INTERNATIONAL BOND 9.50%
19/11/20251,057,155 0.14CAMEROON
USD 1,000,000 SPARC EM SPC PANAMA METRO LINE 2 SP ZC 05/12/2022 784,332 0.11CAYMAN ISLANDSUSD 2,100,000 BANCO DEL ESTADO DE CHILE 2.668% 08/01/2021 1,773,313 0.24CHILEUSD 200,000 BANCO DEL ESTADO DE CHILE 4.125% 07/10/2020 174,206 0.02CHILEUSD 8,450,000 CHILE GOVERNMENT INTERNATIONAL BOND 3.125%
21/01/20267,008,380 0.95CHILE
USD 3,837,000 CHILE GOVERNMENT INTERNATIONAL BOND 3.24%06/02/2028
3,177,438 0.43CHILE
USD 80,000 CHILE GOVERNMENT INTERNATIONAL BOND 3.625%30/10/2042
64,421 0.01CHILE
USD 7,300,000 CHILE GOVERNMENT INTERNATIONAL BOND 3.86%21/06/2047
6,015,363 0.82CHILE
USD 300,000 CHILE GOVERNMENT INTERNATIONAL BOND 3.875%05/08/2020
262,097 0.04CHILE
USD 500,000 CORP NACIONAL DEL COBRE DE CHILE 3.625% 01/08/2027 410,615 0.06CHILEUSD 2,000,000 CORP NACIONAL DEL COBRE DE CHILE 4.50% 01/08/2047 1,665,234 0.23CHILEUSD 1,500,000 CORP NACIONAL DEL COBRE DE CHILE 4.50% 16/09/2025 1,316,513 0.18CHILEUSD 500,000 AMBER CIRCLE FUNDING LTD 3.25% 04/12/2022 421,292 0.06CHINAUSD 500,000 AVI FUNDING CO LTD 3.80% 16/09/2025 424,533 0.06CHINAUSD 1,100,000 CHARMING LIGHT INVESTMENTS LTD 4.375% 21/12/2027 903,387 0.12CHINAUSD 800,000 CHINA DEVELOPMENT BANK 2.50% 09/10/2020 674,628 0.09CHINAUSD 250,000 CHINA DEVELOPMENT BANK 3.00% 01/06/2026 203,154 0.03CHINAUSD 280,000 CHINA GREAT WALL INTERNATIONAL HOLDINGS III LTD
4.375% 25/05/2023242,892 0.03CHINA
USD 240,000 CNAC HK FINBRIDGE CO LTD 4.125% 14/03/2021 206,485 0.03CHINAUSD 240,000 CNAC HK FINBRIDGE CO LTD 5.125% 14/03/2028 208,441 0.03CHINAUSD 200,000 CNOOC CURTIS FUNDING NO 1 PTY LTD 4.50% 03/10/2023 177,295 0.02CHINAUSD 500,000 CNRC CAPITALE LTD PERP FRN 412,011 0.06CHINAUSD 500,000 EXPORT-IMPORT BANK OF CHINA/THE 2.00% 26/04/2021 413,135 0.06CHINAUSD 700,000 EXPORT-IMPORT BANK OF CHINA/THE 2.625% 14/03/2022 585,183 0.08CHINAUSD 200,000 EXPORT-IMPORT BANK OF CHINA/THE 2.875% 26/04/2026 159,188 0.02CHINAUSD 500,000 EXPORT-IMPORT BANK OF CHINA/THE 3.25% 28/11/2027 403,686 0.05CHINAUSD 150,000 EXPORT-IMPORT BANK OF CHINA/THE 3.625% 31/07/2024 127,984 0.02CHINAUSD 350,000 MINMETALS BOUNTEOUS FINANCE BVI LTD 4.75% 30/07/2025 304,425 0.04CHINAUSD 500,000 RONGSHI INTERNATIONAL FINANCE LTD 2.875% 04/05/2022 415,871 0.06CHINAUSD 200,000 SINOCHEM GLOBAL CAPITAL CO LTD PERP FRN 172,325 0.02CHINA
Country
Statement of Investment Portfolio and Other Net Assets AUGUST 31, 2018
Notional or number of units / shares
ownedMarket Value
EUR% of Net
Assets
INTERFUND BOND GLOBAL EMERGING MARKETS
(continued)
Similar issues with same maturities have not been combined when issuance date differs.The accompanying notes are an integral part of these financial statements.General note: differences in sums, if any, are due to rounding.
Currency
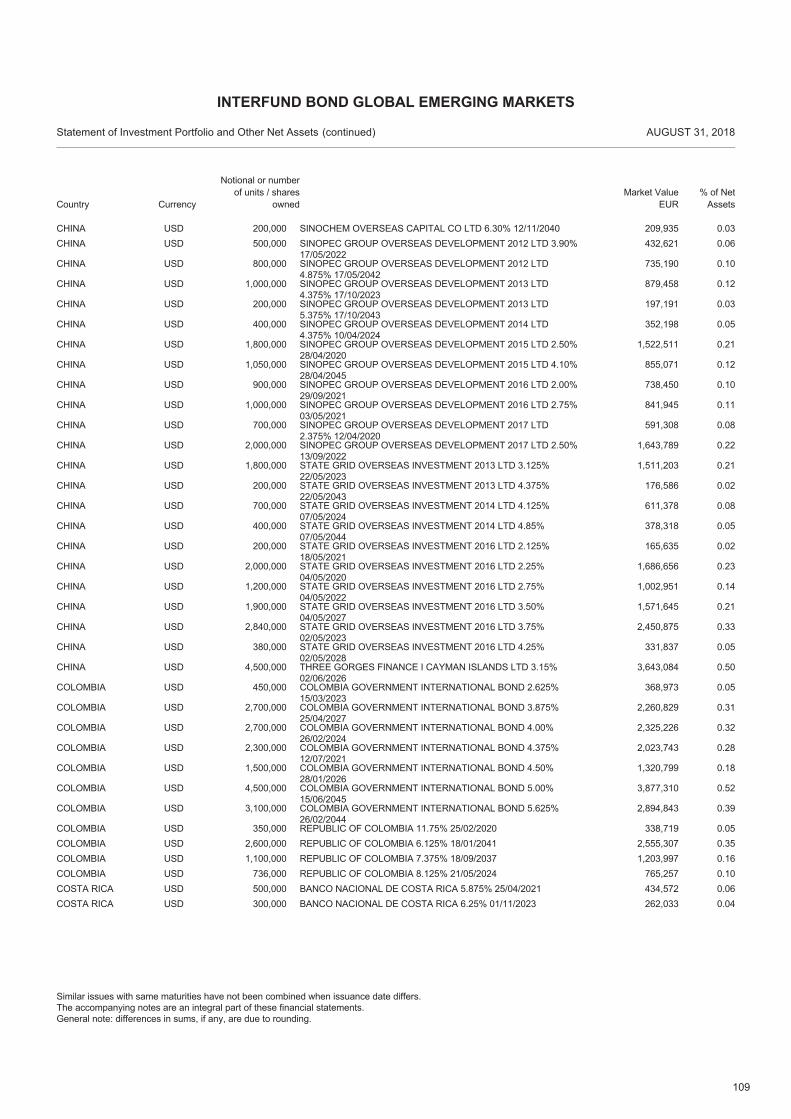
109
USD 200,000 SINOCHEM OVERSEAS CAPITAL CO LTD 6.30% 12/11/2040 209,935 0.03CHINAUSD 500,000 SINOPEC GROUP OVERSEAS DEVELOPMENT 2012 LTD 3.90%
17/05/2022432,621 0.06CHINA
USD 800,000 SINOPEC GROUP OVERSEAS DEVELOPMENT 2012 LTD4.875% 17/05/2042
735,190 0.10CHINA
USD 1,000,000 SINOPEC GROUP OVERSEAS DEVELOPMENT 2013 LTD4.375% 17/10/2023
879,458 0.12CHINA
USD 200,000 SINOPEC GROUP OVERSEAS DEVELOPMENT 2013 LTD5.375% 17/10/2043
197,191 0.03CHINA
USD 400,000 SINOPEC GROUP OVERSEAS DEVELOPMENT 2014 LTD4.375% 10/04/2024
352,198 0.05CHINA
USD 1,800,000 SINOPEC GROUP OVERSEAS DEVELOPMENT 2015 LTD 2.50%28/04/2020
1,522,511 0.21CHINA
USD 1,050,000 SINOPEC GROUP OVERSEAS DEVELOPMENT 2015 LTD 4.10%28/04/2045
855,071 0.12CHINA
USD 900,000 SINOPEC GROUP OVERSEAS DEVELOPMENT 2016 LTD 2.00%29/09/2021
738,450 0.10CHINA
USD 1,000,000 SINOPEC GROUP OVERSEAS DEVELOPMENT 2016 LTD 2.75%03/05/2021
841,945 0.11CHINA
USD 700,000 SINOPEC GROUP OVERSEAS DEVELOPMENT 2017 LTD2.375% 12/04/2020
591,308 0.08CHINA
USD 2,000,000 SINOPEC GROUP OVERSEAS DEVELOPMENT 2017 LTD 2.50%13/09/2022
1,643,789 0.22CHINA
USD 1,800,000 STATE GRID OVERSEAS INVESTMENT 2013 LTD 3.125%22/05/2023
1,511,203 0.21CHINA
USD 200,000 STATE GRID OVERSEAS INVESTMENT 2013 LTD 4.375%22/05/2043
176,586 0.02CHINA
USD 700,000 STATE GRID OVERSEAS INVESTMENT 2014 LTD 4.125%07/05/2024
611,378 0.08CHINA
USD 400,000 STATE GRID OVERSEAS INVESTMENT 2014 LTD 4.85%07/05/2044
378,318 0.05CHINA
USD 200,000 STATE GRID OVERSEAS INVESTMENT 2016 LTD 2.125%18/05/2021
165,635 0.02CHINA
USD 2,000,000 STATE GRID OVERSEAS INVESTMENT 2016 LTD 2.25%04/05/2020
1,686,656 0.23CHINA
USD 1,200,000 STATE GRID OVERSEAS INVESTMENT 2016 LTD 2.75%04/05/2022
1,002,951 0.14CHINA
USD 1,900,000 STATE GRID OVERSEAS INVESTMENT 2016 LTD 3.50%04/05/2027
1,571,645 0.21CHINA
USD 2,840,000 STATE GRID OVERSEAS INVESTMENT 2016 LTD 3.75%02/05/2023
2,450,875 0.33CHINA
USD 380,000 STATE GRID OVERSEAS INVESTMENT 2016 LTD 4.25%02/05/2028
331,837 0.05CHINA
USD 4,500,000 THREE GORGES FINANCE I CAYMAN ISLANDS LTD 3.15%02/06/2026
3,643,084 0.50CHINA
USD 450,000 COLOMBIA GOVERNMENT INTERNATIONAL BOND 2.625%15/03/2023
368,973 0.05COLOMBIA
USD 2,700,000 COLOMBIA GOVERNMENT INTERNATIONAL BOND 3.875%25/04/2027
2,260,829 0.31COLOMBIA
USD 2,700,000 COLOMBIA GOVERNMENT INTERNATIONAL BOND 4.00%26/02/2024
2,325,226 0.32COLOMBIA
USD 2,300,000 COLOMBIA GOVERNMENT INTERNATIONAL BOND 4.375%12/07/2021
2,023,743 0.28COLOMBIA
USD 1,500,000 COLOMBIA GOVERNMENT INTERNATIONAL BOND 4.50%28/01/2026
1,320,799 0.18COLOMBIA
USD 4,500,000 COLOMBIA GOVERNMENT INTERNATIONAL BOND 5.00%15/06/2045
3,877,310 0.52COLOMBIA
USD 3,100,000 COLOMBIA GOVERNMENT INTERNATIONAL BOND 5.625%26/02/2044
2,894,843 0.39COLOMBIA
USD 350,000 REPUBLIC OF COLOMBIA 11.75% 25/02/2020 338,719 0.05COLOMBIAUSD 2,600,000 REPUBLIC OF COLOMBIA 6.125% 18/01/2041 2,555,307 0.35COLOMBIAUSD 1,100,000 REPUBLIC OF COLOMBIA 7.375% 18/09/2037 1,203,997 0.16COLOMBIAUSD 736,000 REPUBLIC OF COLOMBIA 8.125% 21/05/2024 765,257 0.10COLOMBIAUSD 500,000 BANCO NACIONAL DE COSTA RICA 5.875% 25/04/2021 434,572 0.06COSTA RICAUSD 300,000 BANCO NACIONAL DE COSTA RICA 6.25% 01/11/2023 262,033 0.04COSTA RICA
Country
Statement of Investment Portfolio and Other Net Assets AUGUST 31, 2018
Notional or number of units / shares
ownedMarket Value
EUR% of Net
Assets
INTERFUND BOND GLOBAL EMERGING MARKETS
(continued)
Similar issues with same maturities have not been combined when issuance date differs.The accompanying notes are an integral part of these financial statements.General note: differences in sums, if any, are due to rounding.
Currency
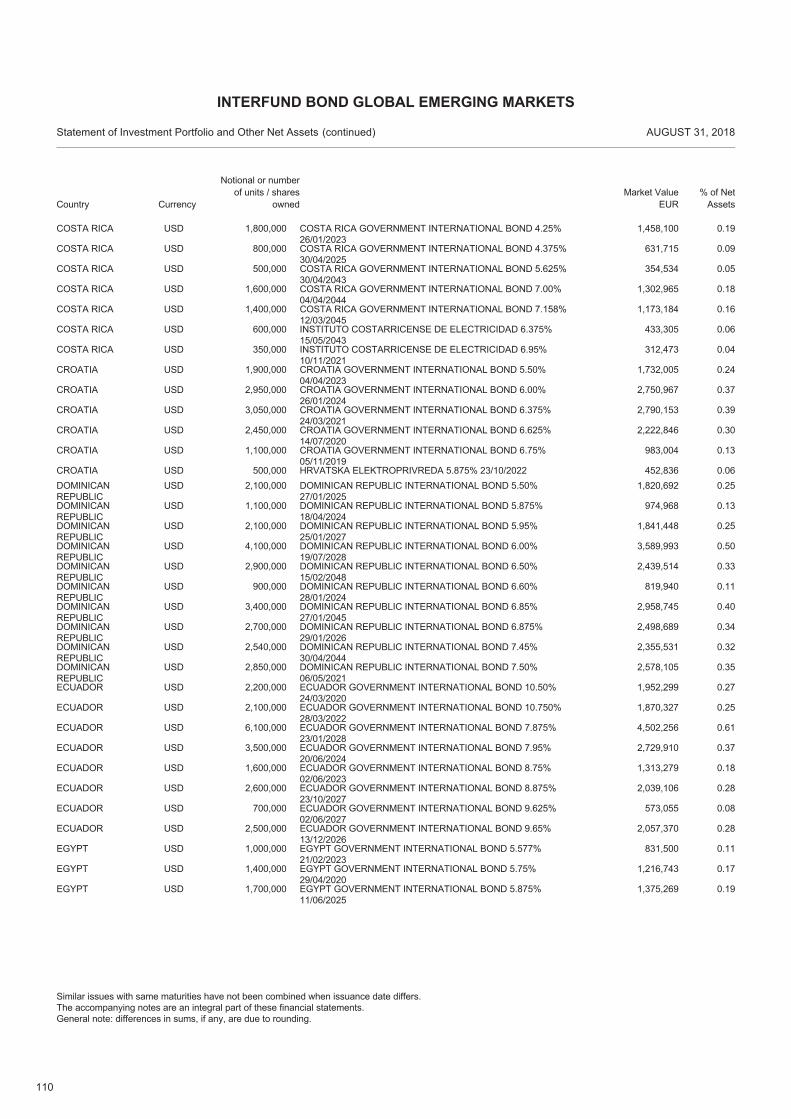
110
USD 1,800,000 COSTA RICA GOVERNMENT INTERNATIONAL BOND 4.25%26/01/2023
1,458,100 0.19COSTA RICA
USD 800,000 COSTA RICA GOVERNMENT INTERNATIONAL BOND 4.375%30/04/2025
631,715 0.09COSTA RICA
USD 500,000 COSTA RICA GOVERNMENT INTERNATIONAL BOND 5.625%30/04/2043
354,534 0.05COSTA RICA
USD 1,600,000 COSTA RICA GOVERNMENT INTERNATIONAL BOND 7.00%04/04/2044
1,302,965 0.18COSTA RICA
USD 1,400,000 COSTA RICA GOVERNMENT INTERNATIONAL BOND 7.158%12/03/2045
1,173,184 0.16COSTA RICA
USD 600,000 INSTITUTO COSTARRICENSE DE ELECTRICIDAD 6.375%15/05/2043
433,305 0.06COSTA RICA
USD 350,000 INSTITUTO COSTARRICENSE DE ELECTRICIDAD 6.95%10/11/2021
312,473 0.04COSTA RICA
USD 1,900,000 CROATIA GOVERNMENT INTERNATIONAL BOND 5.50%04/04/2023
1,732,005 0.24CROATIA
USD 2,950,000 CROATIA GOVERNMENT INTERNATIONAL BOND 6.00%26/01/2024
2,750,967 0.37CROATIA
USD 3,050,000 CROATIA GOVERNMENT INTERNATIONAL BOND 6.375%24/03/2021
2,790,153 0.39CROATIA
USD 2,450,000 CROATIA GOVERNMENT INTERNATIONAL BOND 6.625%14/07/2020
2,222,846 0.30CROATIA
USD 1,100,000 CROATIA GOVERNMENT INTERNATIONAL BOND 6.75%05/11/2019
983,004 0.13CROATIA
USD 500,000 HRVATSKA ELEKTROPRIVREDA 5.875% 23/10/2022 452,836 0.06CROATIAUSD 2,100,000 DOMINICAN REPUBLIC INTERNATIONAL BOND 5.50%
27/01/20251,820,692 0.25DOMINICAN
REPUBLICUSD 1,100,000 DOMINICAN REPUBLIC INTERNATIONAL BOND 5.875%
18/04/2024974,968 0.13DOMINICAN
REPUBLICUSD 2,100,000 DOMINICAN REPUBLIC INTERNATIONAL BOND 5.95%
25/01/20271,841,448 0.25DOMINICAN
REPUBLICUSD 4,100,000 DOMINICAN REPUBLIC INTERNATIONAL BOND 6.00%
19/07/20283,589,993 0.50DOMINICAN
REPUBLICUSD 2,900,000 DOMINICAN REPUBLIC INTERNATIONAL BOND 6.50%
15/02/20482,439,514 0.33DOMINICAN
REPUBLICUSD 900,000 DOMINICAN REPUBLIC INTERNATIONAL BOND 6.60%
28/01/2024819,940 0.11DOMINICAN
REPUBLICUSD 3,400,000 DOMINICAN REPUBLIC INTERNATIONAL BOND 6.85%
27/01/20452,958,745 0.40DOMINICAN
REPUBLICUSD 2,700,000 DOMINICAN REPUBLIC INTERNATIONAL BOND 6.875%
29/01/20262,498,689 0.34DOMINICAN
REPUBLICUSD 2,540,000 DOMINICAN REPUBLIC INTERNATIONAL BOND 7.45%
30/04/20442,355,531 0.32DOMINICAN
REPUBLICUSD 2,850,000 DOMINICAN REPUBLIC INTERNATIONAL BOND 7.50%
06/05/20212,578,105 0.35DOMINICAN
REPUBLICUSD 2,200,000 ECUADOR GOVERNMENT INTERNATIONAL BOND 10.50%
24/03/20201,952,299 0.27ECUADOR
USD 2,100,000 ECUADOR GOVERNMENT INTERNATIONAL BOND 10.750%28/03/2022
1,870,327 0.25ECUADOR
USD 6,100,000 ECUADOR GOVERNMENT INTERNATIONAL BOND 7.875%23/01/2028
4,502,256 0.61ECUADOR
USD 3,500,000 ECUADOR GOVERNMENT INTERNATIONAL BOND 7.95%20/06/2024
2,729,910 0.37ECUADOR
USD 1,600,000 ECUADOR GOVERNMENT INTERNATIONAL BOND 8.75%02/06/2023
1,313,279 0.18ECUADOR
USD 2,600,000 ECUADOR GOVERNMENT INTERNATIONAL BOND 8.875%23/10/2027
2,039,106 0.28ECUADOR
USD 700,000 ECUADOR GOVERNMENT INTERNATIONAL BOND 9.625%02/06/2027
573,055 0.08ECUADOR
USD 2,500,000 ECUADOR GOVERNMENT INTERNATIONAL BOND 9.65%13/12/2026
2,057,370 0.28ECUADOR
USD 1,000,000 EGYPT GOVERNMENT INTERNATIONAL BOND 5.577%21/02/2023
831,500 0.11EGYPT
USD 1,400,000 EGYPT GOVERNMENT INTERNATIONAL BOND 5.75%29/04/2020
1,216,743 0.17EGYPT
USD 1,700,000 EGYPT GOVERNMENT INTERNATIONAL BOND 5.875%11/06/2025
1,375,269 0.19EGYPT
Country
Statement of Investment Portfolio and Other Net Assets AUGUST 31, 2018
Notional or number of units / shares
ownedMarket Value
EUR% of Net
Assets
INTERFUND BOND GLOBAL EMERGING MARKETS
(continued)
Similar issues with same maturities have not been combined when issuance date differs.The accompanying notes are an integral part of these financial statements.General note: differences in sums, if any, are due to rounding.
Currency
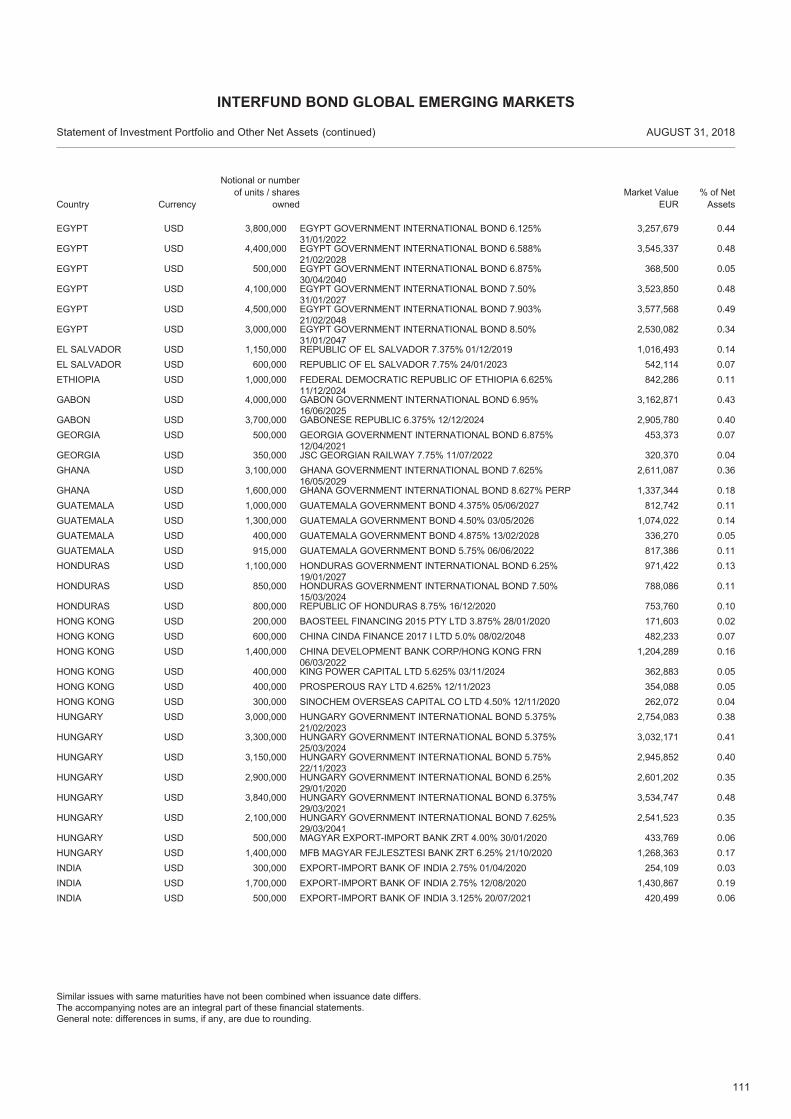
111
USD 3,800,000 EGYPT GOVERNMENT INTERNATIONAL BOND 6.125%31/01/2022
3,257,679 0.44EGYPT
USD 4,400,000 EGYPT GOVERNMENT INTERNATIONAL BOND 6.588%21/02/2028
3,545,337 0.48EGYPT
USD 500,000 EGYPT GOVERNMENT INTERNATIONAL BOND 6.875%30/04/2040
368,500 0.05EGYPT
USD 4,100,000 EGYPT GOVERNMENT INTERNATIONAL BOND 7.50%31/01/2027
3,523,850 0.48EGYPT
USD 4,500,000 EGYPT GOVERNMENT INTERNATIONAL BOND 7.903%21/02/2048
3,577,568 0.49EGYPT
USD 3,000,000 EGYPT GOVERNMENT INTERNATIONAL BOND 8.50%31/01/2047
2,530,082 0.34EGYPT
USD 1,150,000 REPUBLIC OF EL SALVADOR 7.375% 01/12/2019 1,016,493 0.14EL SALVADORUSD 600,000 REPUBLIC OF EL SALVADOR 7.75% 24/01/2023 542,114 0.07EL SALVADORUSD 1,000,000 FEDERAL DEMOCRATIC REPUBLIC OF ETHIOPIA 6.625%
11/12/2024842,286 0.11ETHIOPIA
USD 4,000,000 GABON GOVERNMENT INTERNATIONAL BOND 6.95%16/06/2025
3,162,871 0.43GABON
USD 3,700,000 GABONESE REPUBLIC 6.375% 12/12/2024 2,905,780 0.40GABONUSD 500,000 GEORGIA GOVERNMENT INTERNATIONAL BOND 6.875%
12/04/2021453,373 0.07GEORGIA
USD 350,000 JSC GEORGIAN RAILWAY 7.75% 11/07/2022 320,370 0.04GEORGIAUSD 3,100,000 GHANA GOVERNMENT INTERNATIONAL BOND 7.625%
16/05/20292,611,087 0.36GHANA
USD 1,600,000 GHANA GOVERNMENT INTERNATIONAL BOND 8.627% PERP 1,337,344 0.18GHANAUSD 1,000,000 GUATEMALA GOVERNMENT BOND 4.375% 05/06/2027 812,742 0.11GUATEMALAUSD 1,300,000 GUATEMALA GOVERNMENT BOND 4.50% 03/05/2026 1,074,022 0.14GUATEMALAUSD 400,000 GUATEMALA GOVERNMENT BOND 4.875% 13/02/2028 336,270 0.05GUATEMALAUSD 915,000 GUATEMALA GOVERNMENT BOND 5.75% 06/06/2022 817,386 0.11GUATEMALAUSD 1,100,000 HONDURAS GOVERNMENT INTERNATIONAL BOND 6.25%
19/01/2027971,422 0.13HONDURAS
USD 850,000 HONDURAS GOVERNMENT INTERNATIONAL BOND 7.50%15/03/2024
788,086 0.11HONDURAS
USD 800,000 REPUBLIC OF HONDURAS 8.75% 16/12/2020 753,760 0.10HONDURASUSD 200,000 BAOSTEEL FINANCING 2015 PTY LTD 3.875% 28/01/2020 171,603 0.02HONG KONGUSD 600,000 CHINA CINDA FINANCE 2017 I LTD 5.0% 08/02/2048 482,233 0.07HONG KONGUSD 1,400,000 CHINA DEVELOPMENT BANK CORP/HONG KONG FRN
06/03/20221,204,289 0.16HONG KONG
USD 400,000 KING POWER CAPITAL LTD 5.625% 03/11/2024 362,883 0.05HONG KONGUSD 400,000 PROSPEROUS RAY LTD 4.625% 12/11/2023 354,088 0.05HONG KONGUSD 300,000 SINOCHEM OVERSEAS CAPITAL CO LTD 4.50% 12/11/2020 262,072 0.04HONG KONGUSD 3,000,000 HUNGARY GOVERNMENT INTERNATIONAL BOND 5.375%
21/02/20232,754,083 0.38HUNGARY
USD 3,300,000 HUNGARY GOVERNMENT INTERNATIONAL BOND 5.375%25/03/2024
3,032,171 0.41HUNGARY
USD 3,150,000 HUNGARY GOVERNMENT INTERNATIONAL BOND 5.75%22/11/2023
2,945,852 0.40HUNGARY
USD 2,900,000 HUNGARY GOVERNMENT INTERNATIONAL BOND 6.25%29/01/2020
2,601,202 0.35HUNGARY
USD 3,840,000 HUNGARY GOVERNMENT INTERNATIONAL BOND 6.375%29/03/2021
3,534,747 0.48HUNGARY
USD 2,100,000 HUNGARY GOVERNMENT INTERNATIONAL BOND 7.625%29/03/2041
2,541,523 0.35HUNGARY
USD 500,000 MAGYAR EXPORT-IMPORT BANK ZRT 4.00% 30/01/2020 433,769 0.06HUNGARYUSD 1,400,000 MFB MAGYAR FEJLESZTESI BANK ZRT 6.25% 21/10/2020 1,268,363 0.17HUNGARYUSD 300,000 EXPORT-IMPORT BANK OF INDIA 2.75% 01/04/2020 254,109 0.03INDIAUSD 1,700,000 EXPORT-IMPORT BANK OF INDIA 2.75% 12/08/2020 1,430,867 0.19INDIAUSD 500,000 EXPORT-IMPORT BANK OF INDIA 3.125% 20/07/2021 420,499 0.06INDIA
Country
Statement of Investment Portfolio and Other Net Assets AUGUST 31, 2018
Notional or number of units / shares
ownedMarket Value
EUR% of Net
Assets
INTERFUND BOND GLOBAL EMERGING MARKETS
(continued)
Similar issues with same maturities have not been combined when issuance date differs.The accompanying notes are an integral part of these financial statements.General note: differences in sums, if any, are due to rounding.
Currency
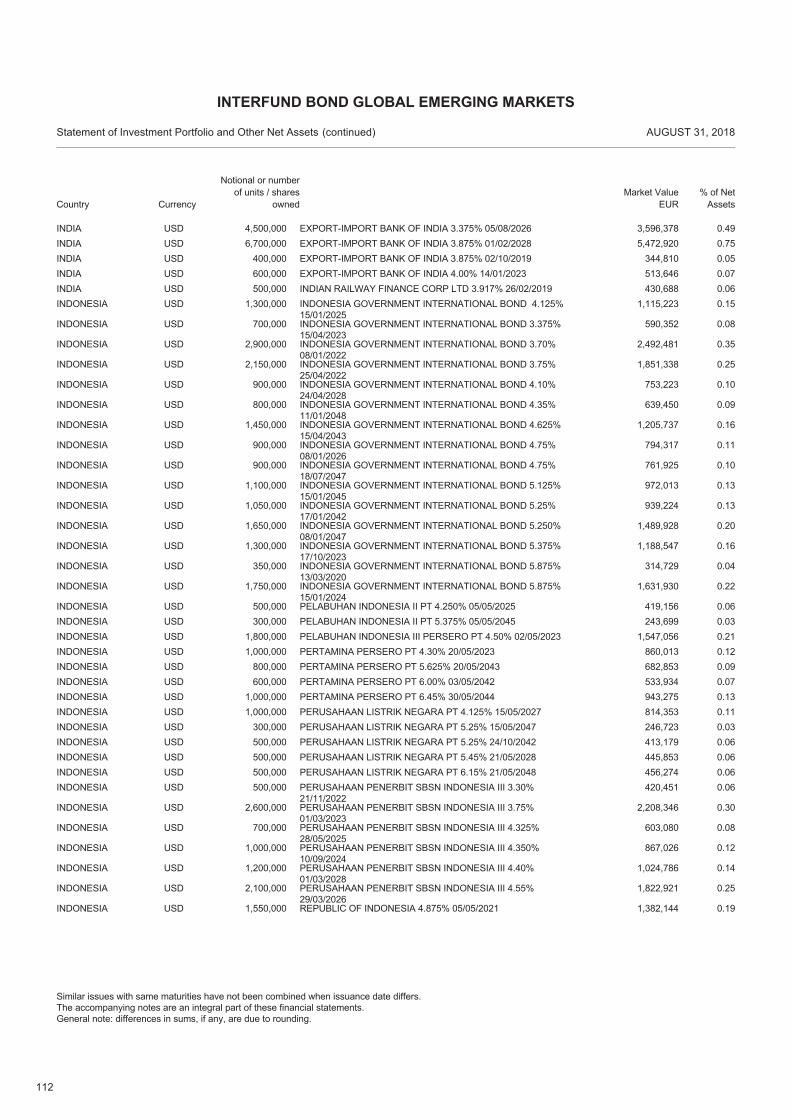
112
USD 4,500,000 EXPORT-IMPORT BANK OF INDIA 3.375% 05/08/2026 3,596,378 0.49INDIAUSD 6,700,000 EXPORT-IMPORT BANK OF INDIA 3.875% 01/02/2028 5,472,920 0.75INDIAUSD 400,000 EXPORT-IMPORT BANK OF INDIA 3.875% 02/10/2019 344,810 0.05INDIAUSD 600,000 EXPORT-IMPORT BANK OF INDIA 4.00% 14/01/2023 513,646 0.07INDIAUSD 500,000 INDIAN RAILWAY FINANCE CORP LTD 3.917% 26/02/2019 430,688 0.06INDIAUSD 1,300,000 INDONESIA GOVERNMENT INTERNATIONAL BOND 4.125%
15/01/20251,115,223 0.15INDONESIA
USD 700,000 INDONESIA GOVERNMENT INTERNATIONAL BOND 3.375%15/04/2023
590,352 0.08INDONESIA
USD 2,900,000 INDONESIA GOVERNMENT INTERNATIONAL BOND 3.70%08/01/2022
2,492,481 0.35INDONESIA
USD 2,150,000 INDONESIA GOVERNMENT INTERNATIONAL BOND 3.75%25/04/2022
1,851,338 0.25INDONESIA
USD 900,000 INDONESIA GOVERNMENT INTERNATIONAL BOND 4.10%24/04/2028
753,223 0.10INDONESIA
USD 800,000 INDONESIA GOVERNMENT INTERNATIONAL BOND 4.35%11/01/2048
639,450 0.09INDONESIA
USD 1,450,000 INDONESIA GOVERNMENT INTERNATIONAL BOND 4.625%15/04/2043
1,205,737 0.16INDONESIA
USD 900,000 INDONESIA GOVERNMENT INTERNATIONAL BOND 4.75%08/01/2026
794,317 0.11INDONESIA
USD 900,000 INDONESIA GOVERNMENT INTERNATIONAL BOND 4.75%18/07/2047
761,925 0.10INDONESIA
USD 1,100,000 INDONESIA GOVERNMENT INTERNATIONAL BOND 5.125%15/01/2045
972,013 0.13INDONESIA
USD 1,050,000 INDONESIA GOVERNMENT INTERNATIONAL BOND 5.25%17/01/2042
939,224 0.13INDONESIA
USD 1,650,000 INDONESIA GOVERNMENT INTERNATIONAL BOND 5.250%08/01/2047
1,489,928 0.20INDONESIA
USD 1,300,000 INDONESIA GOVERNMENT INTERNATIONAL BOND 5.375%17/10/2023
1,188,547 0.16INDONESIA
USD 350,000 INDONESIA GOVERNMENT INTERNATIONAL BOND 5.875%13/03/2020
314,729 0.04INDONESIA
USD 1,750,000 INDONESIA GOVERNMENT INTERNATIONAL BOND 5.875%15/01/2024
1,631,930 0.22INDONESIA
USD 500,000 PELABUHAN INDONESIA II PT 4.250% 05/05/2025 419,156 0.06INDONESIAUSD 300,000 PELABUHAN INDONESIA II PT 5.375% 05/05/2045 243,699 0.03INDONESIAUSD 1,800,000 PELABUHAN INDONESIA III PERSERO PT 4.50% 02/05/2023 1,547,056 0.21INDONESIAUSD 1,000,000 PERTAMINA PERSERO PT 4.30% 20/05/2023 860,013 0.12INDONESIAUSD 800,000 PERTAMINA PERSERO PT 5.625% 20/05/2043 682,853 0.09INDONESIAUSD 600,000 PERTAMINA PERSERO PT 6.00% 03/05/2042 533,934 0.07INDONESIAUSD 1,000,000 PERTAMINA PERSERO PT 6.45% 30/05/2044 943,275 0.13INDONESIAUSD 1,000,000 PERUSAHAAN LISTRIK NEGARA PT 4.125% 15/05/2027 814,353 0.11INDONESIAUSD 300,000 PERUSAHAAN LISTRIK NEGARA PT 5.25% 15/05/2047 246,723 0.03INDONESIAUSD 500,000 PERUSAHAAN LISTRIK NEGARA PT 5.25% 24/10/2042 413,179 0.06INDONESIAUSD 500,000 PERUSAHAAN LISTRIK NEGARA PT 5.45% 21/05/2028 445,853 0.06INDONESIAUSD 500,000 PERUSAHAAN LISTRIK NEGARA PT 6.15% 21/05/2048 456,274 0.06INDONESIAUSD 500,000 PERUSAHAAN PENERBIT SBSN INDONESIA III 3.30%
21/11/2022420,451 0.06INDONESIA
USD 2,600,000 PERUSAHAAN PENERBIT SBSN INDONESIA III 3.75%01/03/2023
2,208,346 0.30INDONESIA
USD 700,000 PERUSAHAAN PENERBIT SBSN INDONESIA III 4.325%28/05/2025
603,080 0.08INDONESIA
USD 1,000,000 PERUSAHAAN PENERBIT SBSN INDONESIA III 4.350%10/09/2024
867,026 0.12INDONESIA
USD 1,200,000 PERUSAHAAN PENERBIT SBSN INDONESIA III 4.40%01/03/2028
1,024,786 0.14INDONESIA
USD 2,100,000 PERUSAHAAN PENERBIT SBSN INDONESIA III 4.55%29/03/2026
1,822,921 0.25INDONESIA
USD 1,550,000 REPUBLIC OF INDONESIA 4.875% 05/05/2021 1,382,144 0.19INDONESIA
Country
Statement of Investment Portfolio and Other Net Assets AUGUST 31, 2018
Notional or number of units / shares
ownedMarket Value
EUR% of Net
Assets
INTERFUND BOND GLOBAL EMERGING MARKETS
(continued)
Similar issues with same maturities have not been combined when issuance date differs.The accompanying notes are an integral part of these financial statements.General note: differences in sums, if any, are due to rounding.
Currency
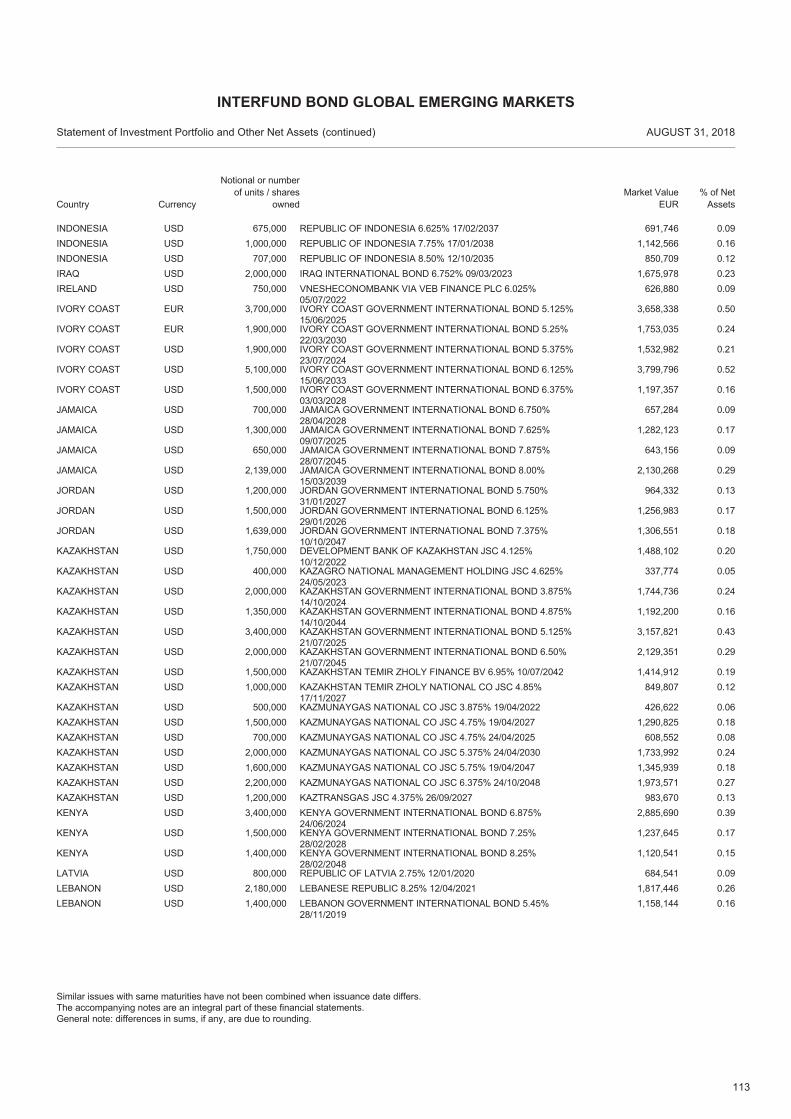
113
USD 675,000 REPUBLIC OF INDONESIA 6.625% 17/02/2037 691,746 0.09INDONESIAUSD 1,000,000 REPUBLIC OF INDONESIA 7.75% 17/01/2038 1,142,566 0.16INDONESIAUSD 707,000 REPUBLIC OF INDONESIA 8.50% 12/10/2035 850,709 0.12INDONESIAUSD 2,000,000 IRAQ INTERNATIONAL BOND 6.752% 09/03/2023 1,675,978 0.23IRAQUSD 750,000 VNESHECONOMBANK VIA VEB FINANCE PLC 6.025%
05/07/2022626,880 0.09IRELAND
EUR 3,700,000 IVORY COAST GOVERNMENT INTERNATIONAL BOND 5.125%15/06/2025
3,658,338 0.50IVORY COAST
EUR 1,900,000 IVORY COAST GOVERNMENT INTERNATIONAL BOND 5.25%22/03/2030
1,753,035 0.24IVORY COAST
USD 1,900,000 IVORY COAST GOVERNMENT INTERNATIONAL BOND 5.375%23/07/2024
1,532,982 0.21IVORY COAST
USD 5,100,000 IVORY COAST GOVERNMENT INTERNATIONAL BOND 6.125%15/06/2033
3,799,796 0.52IVORY COAST
USD 1,500,000 IVORY COAST GOVERNMENT INTERNATIONAL BOND 6.375%03/03/2028
1,197,357 0.16IVORY COAST
USD 700,000 JAMAICA GOVERNMENT INTERNATIONAL BOND 6.750%28/04/2028
657,284 0.09JAMAICA
USD 1,300,000 JAMAICA GOVERNMENT INTERNATIONAL BOND 7.625%09/07/2025
1,282,123 0.17JAMAICA
USD 650,000 JAMAICA GOVERNMENT INTERNATIONAL BOND 7.875%28/07/2045
643,156 0.09JAMAICA
USD 2,139,000 JAMAICA GOVERNMENT INTERNATIONAL BOND 8.00%15/03/2039
2,130,268 0.29JAMAICA
USD 1,200,000 JORDAN GOVERNMENT INTERNATIONAL BOND 5.750%31/01/2027
964,332 0.13JORDAN
USD 1,500,000 JORDAN GOVERNMENT INTERNATIONAL BOND 6.125%29/01/2026
1,256,983 0.17JORDAN
USD 1,639,000 JORDAN GOVERNMENT INTERNATIONAL BOND 7.375%10/10/2047
1,306,551 0.18JORDAN
USD 1,750,000 DEVELOPMENT BANK OF KAZAKHSTAN JSC 4.125%10/12/2022
1,488,102 0.20KAZAKHSTAN
USD 400,000 KAZAGRO NATIONAL MANAGEMENT HOLDING JSC 4.625%24/05/2023
337,774 0.05KAZAKHSTAN
USD 2,000,000 KAZAKHSTAN GOVERNMENT INTERNATIONAL BOND 3.875%14/10/2024
1,744,736 0.24KAZAKHSTAN
USD 1,350,000 KAZAKHSTAN GOVERNMENT INTERNATIONAL BOND 4.875%14/10/2044
1,192,200 0.16KAZAKHSTAN
USD 3,400,000 KAZAKHSTAN GOVERNMENT INTERNATIONAL BOND 5.125%21/07/2025
3,157,821 0.43KAZAKHSTAN
USD 2,000,000 KAZAKHSTAN GOVERNMENT INTERNATIONAL BOND 6.50%21/07/2045
2,129,351 0.29KAZAKHSTAN
USD 1,500,000 KAZAKHSTAN TEMIR ZHOLY FINANCE BV 6.95% 10/07/2042 1,414,912 0.19KAZAKHSTANUSD 1,000,000 KAZAKHSTAN TEMIR ZHOLY NATIONAL CO JSC 4.85%
17/11/2027849,807 0.12KAZAKHSTAN
USD 500,000 KAZMUNAYGAS NATIONAL CO JSC 3.875% 19/04/2022 426,622 0.06KAZAKHSTANUSD 1,500,000 KAZMUNAYGAS NATIONAL CO JSC 4.75% 19/04/2027 1,290,825 0.18KAZAKHSTANUSD 700,000 KAZMUNAYGAS NATIONAL CO JSC 4.75% 24/04/2025 608,552 0.08KAZAKHSTANUSD 2,000,000 KAZMUNAYGAS NATIONAL CO JSC 5.375% 24/04/2030 1,733,992 0.24KAZAKHSTANUSD 1,600,000 KAZMUNAYGAS NATIONAL CO JSC 5.75% 19/04/2047 1,345,939 0.18KAZAKHSTANUSD 2,200,000 KAZMUNAYGAS NATIONAL CO JSC 6.375% 24/10/2048 1,973,571 0.27KAZAKHSTANUSD 1,200,000 KAZTRANSGAS JSC 4.375% 26/09/2027 983,670 0.13KAZAKHSTANUSD 3,400,000 KENYA GOVERNMENT INTERNATIONAL BOND 6.875%
24/06/20242,885,690 0.39KENYA
USD 1,500,000 KENYA GOVERNMENT INTERNATIONAL BOND 7.25%28/02/2028
1,237,645 0.17KENYA
USD 1,400,000 KENYA GOVERNMENT INTERNATIONAL BOND 8.25%28/02/2048
1,120,541 0.15KENYA
USD 800,000 REPUBLIC OF LATVIA 2.75% 12/01/2020 684,541 0.09LATVIAUSD 2,180,000 LEBANESE REPUBLIC 8.25% 12/04/2021 1,817,446 0.26LEBANONUSD 1,400,000 LEBANON GOVERNMENT INTERNATIONAL BOND 5.45%
28/11/20191,158,144 0.16LEBANON
Country
Statement of Investment Portfolio and Other Net Assets AUGUST 31, 2018
Notional or number of units / shares
ownedMarket Value
EUR% of Net
Assets
INTERFUND BOND GLOBAL EMERGING MARKETS
(continued)
Similar issues with same maturities have not been combined when issuance date differs.The accompanying notes are an integral part of these financial statements.General note: differences in sums, if any, are due to rounding.
Currency
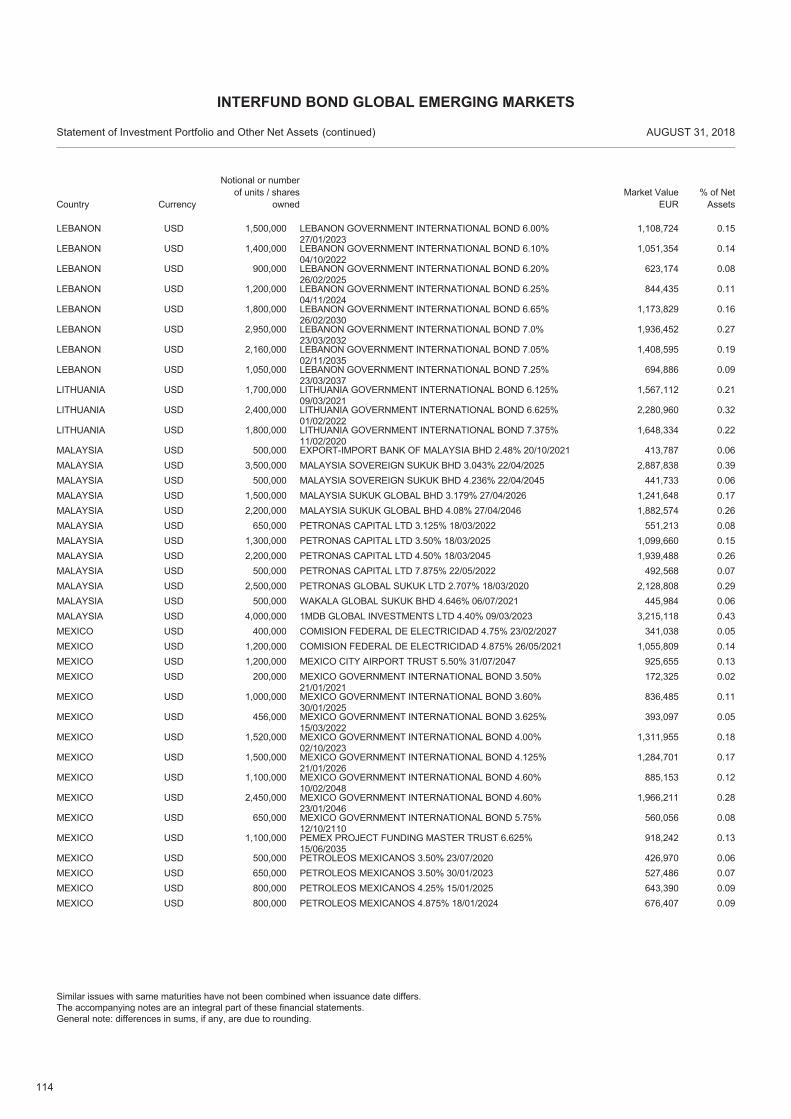
114
USD 1,500,000 LEBANON GOVERNMENT INTERNATIONAL BOND 6.00%27/01/2023
1,108,724 0.15LEBANON
USD 1,400,000 LEBANON GOVERNMENT INTERNATIONAL BOND 6.10%04/10/2022
1,051,354 0.14LEBANON
USD 900,000 LEBANON GOVERNMENT INTERNATIONAL BOND 6.20%26/02/2025
623,174 0.08LEBANON
USD 1,200,000 LEBANON GOVERNMENT INTERNATIONAL BOND 6.25%04/11/2024
844,435 0.11LEBANON
USD 1,800,000 LEBANON GOVERNMENT INTERNATIONAL BOND 6.65%26/02/2030
1,173,829 0.16LEBANON
USD 2,950,000 LEBANON GOVERNMENT INTERNATIONAL BOND 7.0%23/03/2032
1,936,452 0.27LEBANON
USD 2,160,000 LEBANON GOVERNMENT INTERNATIONAL BOND 7.05%02/11/2035
1,408,595 0.19LEBANON
USD 1,050,000 LEBANON GOVERNMENT INTERNATIONAL BOND 7.25%23/03/2037
694,886 0.09LEBANON
USD 1,700,000 LITHUANIA GOVERNMENT INTERNATIONAL BOND 6.125%09/03/2021
1,567,112 0.21LITHUANIA
USD 2,400,000 LITHUANIA GOVERNMENT INTERNATIONAL BOND 6.625%01/02/2022
2,280,960 0.32LITHUANIA
USD 1,800,000 LITHUANIA GOVERNMENT INTERNATIONAL BOND 7.375%11/02/2020
1,648,334 0.22LITHUANIA
USD 500,000 EXPORT-IMPORT BANK OF MALAYSIA BHD 2.48% 20/10/2021 413,787 0.06MALAYSIAUSD 3,500,000 MALAYSIA SOVEREIGN SUKUK BHD 3.043% 22/04/2025 2,887,838 0.39MALAYSIAUSD 500,000 MALAYSIA SOVEREIGN SUKUK BHD 4.236% 22/04/2045 441,733 0.06MALAYSIAUSD 1,500,000 MALAYSIA SUKUK GLOBAL BHD 3.179% 27/04/2026 1,241,648 0.17MALAYSIAUSD 2,200,000 MALAYSIA SUKUK GLOBAL BHD 4.08% 27/04/2046 1,882,574 0.26MALAYSIAUSD 650,000 PETRONAS CAPITAL LTD 3.125% 18/03/2022 551,213 0.08MALAYSIAUSD 1,300,000 PETRONAS CAPITAL LTD 3.50% 18/03/2025 1,099,660 0.15MALAYSIAUSD 2,200,000 PETRONAS CAPITAL LTD 4.50% 18/03/2045 1,939,488 0.26MALAYSIAUSD 500,000 PETRONAS CAPITAL LTD 7.875% 22/05/2022 492,568 0.07MALAYSIAUSD 2,500,000 PETRONAS GLOBAL SUKUK LTD 2.707% 18/03/2020 2,128,808 0.29MALAYSIAUSD 500,000 WAKALA GLOBAL SUKUK BHD 4.646% 06/07/2021 445,984 0.06MALAYSIAUSD 4,000,000 1MDB GLOBAL INVESTMENTS LTD 4.40% 09/03/2023 3,215,118 0.43MALAYSIAUSD 400,000 COMISION FEDERAL DE ELECTRICIDAD 4.75% 23/02/2027 341,038 0.05MEXICOUSD 1,200,000 COMISION FEDERAL DE ELECTRICIDAD 4.875% 26/05/2021 1,055,809 0.14MEXICOUSD 1,200,000 MEXICO CITY AIRPORT TRUST 5.50% 31/07/2047 925,655 0.13MEXICOUSD 200,000 MEXICO GOVERNMENT INTERNATIONAL BOND 3.50%
21/01/2021172,325 0.02MEXICO
USD 1,000,000 MEXICO GOVERNMENT INTERNATIONAL BOND 3.60%30/01/2025
836,485 0.11MEXICO
USD 456,000 MEXICO GOVERNMENT INTERNATIONAL BOND 3.625%15/03/2022
393,097 0.05MEXICO
USD 1,520,000 MEXICO GOVERNMENT INTERNATIONAL BOND 4.00%02/10/2023
1,311,955 0.18MEXICO
USD 1,500,000 MEXICO GOVERNMENT INTERNATIONAL BOND 4.125%21/01/2026
1,284,701 0.17MEXICO
USD 1,100,000 MEXICO GOVERNMENT INTERNATIONAL BOND 4.60%10/02/2048
885,153 0.12MEXICO
USD 2,450,000 MEXICO GOVERNMENT INTERNATIONAL BOND 4.60%23/01/2046
1,966,211 0.28MEXICO
USD 650,000 MEXICO GOVERNMENT INTERNATIONAL BOND 5.75%12/10/2110
560,056 0.08MEXICO
USD 1,100,000 PEMEX PROJECT FUNDING MASTER TRUST 6.625%15/06/2035
918,242 0.13MEXICO
USD 500,000 PETROLEOS MEXICANOS 3.50% 23/07/2020 426,970 0.06MEXICOUSD 650,000 PETROLEOS MEXICANOS 3.50% 30/01/2023 527,486 0.07MEXICOUSD 800,000 PETROLEOS MEXICANOS 4.25% 15/01/2025 643,390 0.09MEXICOUSD 800,000 PETROLEOS MEXICANOS 4.875% 18/01/2024 676,407 0.09MEXICO
Country
Statement of Investment Portfolio and Other Net Assets AUGUST 31, 2018
Notional or number of units / shares
ownedMarket Value
EUR% of Net
Assets
INTERFUND BOND GLOBAL EMERGING MARKETS
(continued)
Similar issues with same maturities have not been combined when issuance date differs.The accompanying notes are an integral part of these financial statements.General note: differences in sums, if any, are due to rounding.
Currency
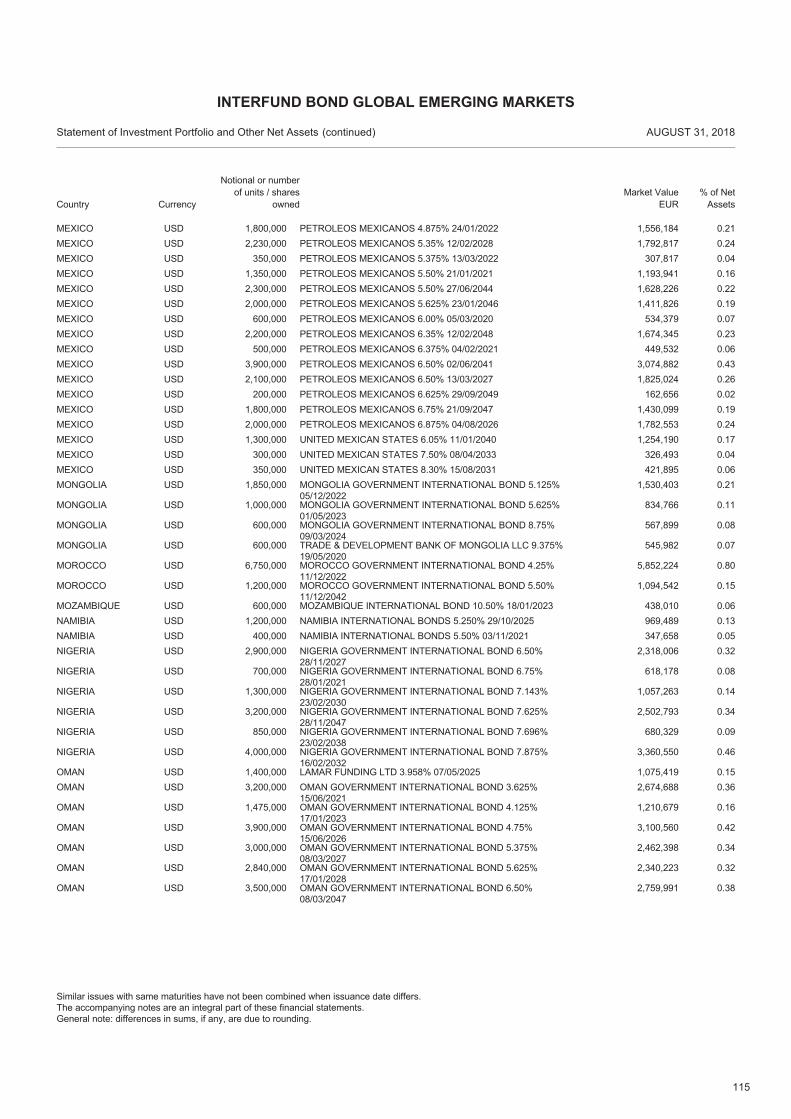
115
USD 1,800,000 PETROLEOS MEXICANOS 4.875% 24/01/2022 1,556,184 0.21MEXICOUSD 2,230,000 PETROLEOS MEXICANOS 5.35% 12/02/2028 1,792,817 0.24MEXICOUSD 350,000 PETROLEOS MEXICANOS 5.375% 13/03/2022 307,817 0.04MEXICOUSD 1,350,000 PETROLEOS MEXICANOS 5.50% 21/01/2021 1,193,941 0.16MEXICOUSD 2,300,000 PETROLEOS MEXICANOS 5.50% 27/06/2044 1,628,226 0.22MEXICOUSD 2,000,000 PETROLEOS MEXICANOS 5.625% 23/01/2046 1,411,826 0.19MEXICOUSD 600,000 PETROLEOS MEXICANOS 6.00% 05/03/2020 534,379 0.07MEXICOUSD 2,200,000 PETROLEOS MEXICANOS 6.35% 12/02/2048 1,674,345 0.23MEXICOUSD 500,000 PETROLEOS MEXICANOS 6.375% 04/02/2021 449,532 0.06MEXICOUSD 3,900,000 PETROLEOS MEXICANOS 6.50% 02/06/2041 3,074,882 0.43MEXICOUSD 2,100,000 PETROLEOS MEXICANOS 6.50% 13/03/2027 1,825,024 0.26MEXICOUSD 200,000 PETROLEOS MEXICANOS 6.625% 29/09/2049 162,656 0.02MEXICOUSD 1,800,000 PETROLEOS MEXICANOS 6.75% 21/09/2047 1,430,099 0.19MEXICOUSD 2,000,000 PETROLEOS MEXICANOS 6.875% 04/08/2026 1,782,553 0.24MEXICOUSD 1,300,000 UNITED MEXICAN STATES 6.05% 11/01/2040 1,254,190 0.17MEXICOUSD 300,000 UNITED MEXICAN STATES 7.50% 08/04/2033 326,493 0.04MEXICOUSD 350,000 UNITED MEXICAN STATES 8.30% 15/08/2031 421,895 0.06MEXICOUSD 1,850,000 MONGOLIA GOVERNMENT INTERNATIONAL BOND 5.125%
05/12/20221,530,403 0.21MONGOLIA
USD 1,000,000 MONGOLIA GOVERNMENT INTERNATIONAL BOND 5.625%01/05/2023
834,766 0.11MONGOLIA
USD 600,000 MONGOLIA GOVERNMENT INTERNATIONAL BOND 8.75%09/03/2024
567,899 0.08MONGOLIA
USD 600,000 TRADE & DEVELOPMENT BANK OF MONGOLIA LLC 9.375%19/05/2020
545,982 0.07MONGOLIA
USD 6,750,000 MOROCCO GOVERNMENT INTERNATIONAL BOND 4.25%11/12/2022
5,852,224 0.80MOROCCO
USD 1,200,000 MOROCCO GOVERNMENT INTERNATIONAL BOND 5.50%11/12/2042
1,094,542 0.15MOROCCO
USD 600,000 MOZAMBIQUE INTERNATIONAL BOND 10.50% 18/01/2023 438,010 0.06MOZAMBIQUEUSD 1,200,000 NAMIBIA INTERNATIONAL BONDS 5.250% 29/10/2025 969,489 0.13NAMIBIAUSD 400,000 NAMIBIA INTERNATIONAL BONDS 5.50% 03/11/2021 347,658 0.05NAMIBIAUSD 2,900,000 NIGERIA GOVERNMENT INTERNATIONAL BOND 6.50%
28/11/20272,318,006 0.32NIGERIA
USD 700,000 NIGERIA GOVERNMENT INTERNATIONAL BOND 6.75%28/01/2021
618,178 0.08NIGERIA
USD 1,300,000 NIGERIA GOVERNMENT INTERNATIONAL BOND 7.143%23/02/2030
1,057,263 0.14NIGERIA
USD 3,200,000 NIGERIA GOVERNMENT INTERNATIONAL BOND 7.625%28/11/2047
2,502,793 0.34NIGERIA
USD 850,000 NIGERIA GOVERNMENT INTERNATIONAL BOND 7.696%23/02/2038
680,329 0.09NIGERIA
USD 4,000,000 NIGERIA GOVERNMENT INTERNATIONAL BOND 7.875%16/02/2032
3,360,550 0.46NIGERIA
USD 1,400,000 LAMAR FUNDING LTD 3.958% 07/05/2025 1,075,419 0.15OMANUSD 3,200,000 OMAN GOVERNMENT INTERNATIONAL BOND 3.625%
15/06/20212,674,688 0.36OMAN
USD 1,475,000 OMAN GOVERNMENT INTERNATIONAL BOND 4.125%17/01/2023
1,210,679 0.16OMAN
USD 3,900,000 OMAN GOVERNMENT INTERNATIONAL BOND 4.75%15/06/2026
3,100,560 0.42OMAN
USD 3,000,000 OMAN GOVERNMENT INTERNATIONAL BOND 5.375%08/03/2027
2,462,398 0.34OMAN
USD 2,840,000 OMAN GOVERNMENT INTERNATIONAL BOND 5.625%17/01/2028
2,340,223 0.32OMAN
USD 3,500,000 OMAN GOVERNMENT INTERNATIONAL BOND 6.50%08/03/2047
2,759,991 0.38OMAN
Country
Statement of Investment Portfolio and Other Net Assets AUGUST 31, 2018
Notional or number of units / shares
ownedMarket Value
EUR% of Net
Assets
INTERFUND BOND GLOBAL EMERGING MARKETS
(continued)
Similar issues with same maturities have not been combined when issuance date differs.The accompanying notes are an integral part of these financial statements.General note: differences in sums, if any, are due to rounding.
Currency
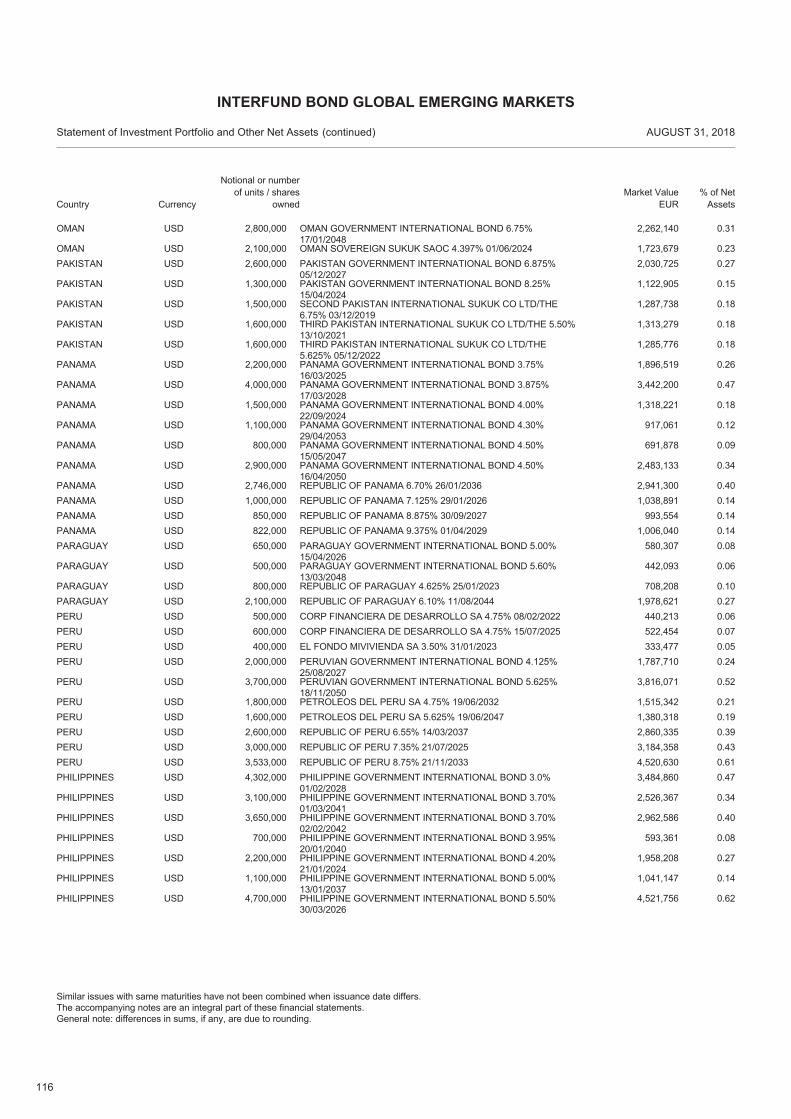
116
USD 2,800,000 OMAN GOVERNMENT INTERNATIONAL BOND 6.75%17/01/2048
2,262,140 0.31OMAN
USD 2,100,000 OMAN SOVEREIGN SUKUK SAOC 4.397% 01/06/2024 1,723,679 0.23OMANUSD 2,600,000 PAKISTAN GOVERNMENT INTERNATIONAL BOND 6.875%
05/12/20272,030,725 0.27PAKISTAN
USD 1,300,000 PAKISTAN GOVERNMENT INTERNATIONAL BOND 8.25%15/04/2024
1,122,905 0.15PAKISTAN
USD 1,500,000 SECOND PAKISTAN INTERNATIONAL SUKUK CO LTD/THE6.75% 03/12/2019
1,287,738 0.18PAKISTAN
USD 1,600,000 THIRD PAKISTAN INTERNATIONAL SUKUK CO LTD/THE 5.50%13/10/2021
1,313,279 0.18PAKISTAN
USD 1,600,000 THIRD PAKISTAN INTERNATIONAL SUKUK CO LTD/THE5.625% 05/12/2022
1,285,776 0.18PAKISTAN
USD 2,200,000 PANAMA GOVERNMENT INTERNATIONAL BOND 3.75%16/03/2025
1,896,519 0.26PANAMA
USD 4,000,000 PANAMA GOVERNMENT INTERNATIONAL BOND 3.875%17/03/2028
3,442,200 0.47PANAMA
USD 1,500,000 PANAMA GOVERNMENT INTERNATIONAL BOND 4.00%22/09/2024
1,318,221 0.18PANAMA
USD 1,100,000 PANAMA GOVERNMENT INTERNATIONAL BOND 4.30%29/04/2053
917,061 0.12PANAMA
USD 800,000 PANAMA GOVERNMENT INTERNATIONAL BOND 4.50%15/05/2047
691,878 0.09PANAMA
USD 2,900,000 PANAMA GOVERNMENT INTERNATIONAL BOND 4.50%16/04/2050
2,483,133 0.34PANAMA
USD 2,746,000 REPUBLIC OF PANAMA 6.70% 26/01/2036 2,941,300 0.40PANAMAUSD 1,000,000 REPUBLIC OF PANAMA 7.125% 29/01/2026 1,038,891 0.14PANAMAUSD 850,000 REPUBLIC OF PANAMA 8.875% 30/09/2027 993,554 0.14PANAMAUSD 822,000 REPUBLIC OF PANAMA 9.375% 01/04/2029 1,006,040 0.14PANAMAUSD 650,000 PARAGUAY GOVERNMENT INTERNATIONAL BOND 5.00%
15/04/2026580,307 0.08PARAGUAY
USD 500,000 PARAGUAY GOVERNMENT INTERNATIONAL BOND 5.60%13/03/2048
442,093 0.06PARAGUAY
USD 800,000 REPUBLIC OF PARAGUAY 4.625% 25/01/2023 708,208 0.10PARAGUAYUSD 2,100,000 REPUBLIC OF PARAGUAY 6.10% 11/08/2044 1,978,621 0.27PARAGUAYUSD 500,000 CORP FINANCIERA DE DESARROLLO SA 4.75% 08/02/2022 440,213 0.06PERUUSD 600,000 CORP FINANCIERA DE DESARROLLO SA 4.75% 15/07/2025 522,454 0.07PERUUSD 400,000 EL FONDO MIVIVIENDA SA 3.50% 31/01/2023 333,477 0.05PERUUSD 2,000,000 PERUVIAN GOVERNMENT INTERNATIONAL BOND 4.125%
25/08/20271,787,710 0.24PERU
USD 3,700,000 PERUVIAN GOVERNMENT INTERNATIONAL BOND 5.625%18/11/2050
3,816,071 0.52PERU
USD 1,800,000 PETROLEOS DEL PERU SA 4.75% 19/06/2032 1,515,342 0.21PERUUSD 1,600,000 PETROLEOS DEL PERU SA 5.625% 19/06/2047 1,380,318 0.19PERUUSD 2,600,000 REPUBLIC OF PERU 6.55% 14/03/2037 2,860,335 0.39PERUUSD 3,000,000 REPUBLIC OF PERU 7.35% 21/07/2025 3,184,358 0.43PERUUSD 3,533,000 REPUBLIC OF PERU 8.75% 21/11/2033 4,520,630 0.61PERUUSD 4,302,000 PHILIPPINE GOVERNMENT INTERNATIONAL BOND 3.0%
01/02/20283,484,860 0.47PHILIPPINES
USD 3,100,000 PHILIPPINE GOVERNMENT INTERNATIONAL BOND 3.70%01/03/2041
2,526,367 0.34PHILIPPINES
USD 3,650,000 PHILIPPINE GOVERNMENT INTERNATIONAL BOND 3.70%02/02/2042
2,962,586 0.40PHILIPPINES
USD 700,000 PHILIPPINE GOVERNMENT INTERNATIONAL BOND 3.95%20/01/2040
593,361 0.08PHILIPPINES
USD 2,200,000 PHILIPPINE GOVERNMENT INTERNATIONAL BOND 4.20%21/01/2024
1,958,208 0.27PHILIPPINES
USD 1,100,000 PHILIPPINE GOVERNMENT INTERNATIONAL BOND 5.00%13/01/2037
1,041,147 0.14PHILIPPINES
USD 4,700,000 PHILIPPINE GOVERNMENT INTERNATIONAL BOND 5.50%30/03/2026
4,521,756 0.62PHILIPPINES
Country
Statement of Investment Portfolio and Other Net Assets AUGUST 31, 2018
Notional or number of units / shares
ownedMarket Value
EUR% of Net
Assets
INTERFUND BOND GLOBAL EMERGING MARKETS
(continued)
Similar issues with same maturities have not been combined when issuance date differs.The accompanying notes are an integral part of these financial statements.General note: differences in sums, if any, are due to rounding.
Currency
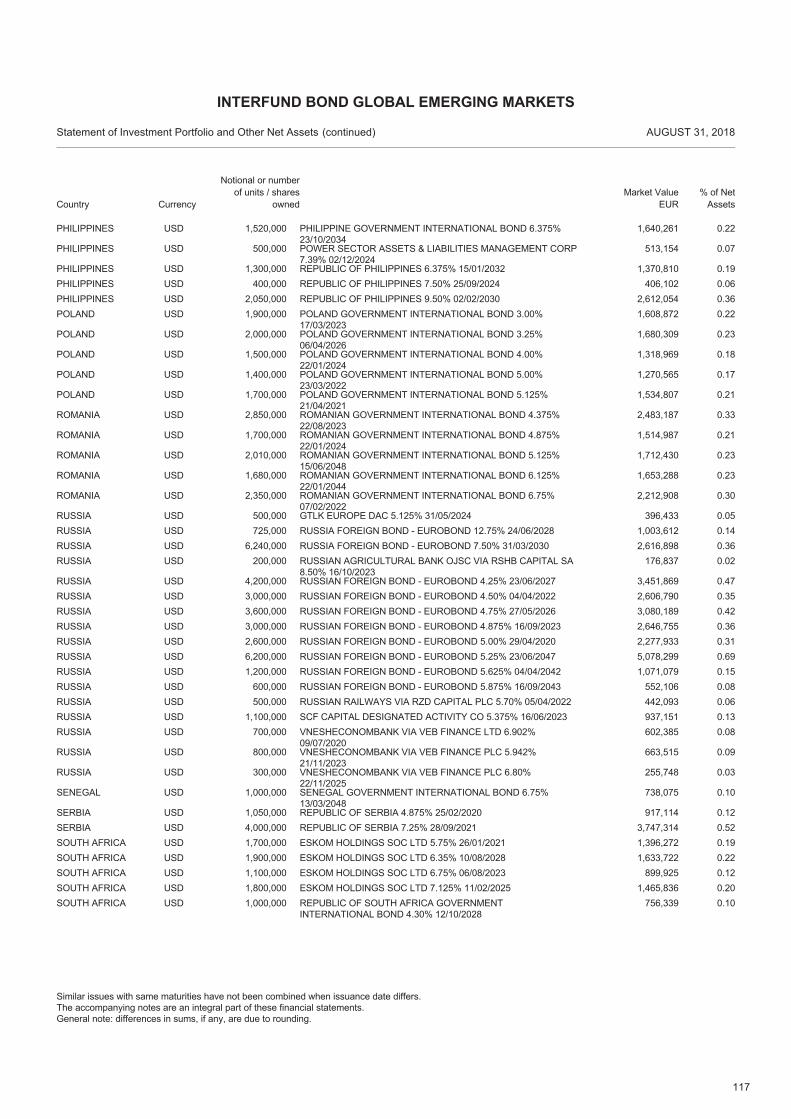
117
USD 1,520,000 PHILIPPINE GOVERNMENT INTERNATIONAL BOND 6.375%23/10/2034
1,640,261 0.22PHILIPPINES
USD 500,000 POWER SECTOR ASSETS & LIABILITIES MANAGEMENT CORP7.39% 02/12/2024
513,154 0.07PHILIPPINES
USD 1,300,000 REPUBLIC OF PHILIPPINES 6.375% 15/01/2032 1,370,810 0.19PHILIPPINESUSD 400,000 REPUBLIC OF PHILIPPINES 7.50% 25/09/2024 406,102 0.06PHILIPPINESUSD 2,050,000 REPUBLIC OF PHILIPPINES 9.50% 02/02/2030 2,612,054 0.36PHILIPPINESUSD 1,900,000 POLAND GOVERNMENT INTERNATIONAL BOND 3.00%
17/03/20231,608,872 0.22POLAND
USD 2,000,000 POLAND GOVERNMENT INTERNATIONAL BOND 3.25%06/04/2026
1,680,309 0.23POLAND
USD 1,500,000 POLAND GOVERNMENT INTERNATIONAL BOND 4.00%22/01/2024
1,318,969 0.18POLAND
USD 1,400,000 POLAND GOVERNMENT INTERNATIONAL BOND 5.00%23/03/2022
1,270,565 0.17POLAND
USD 1,700,000 POLAND GOVERNMENT INTERNATIONAL BOND 5.125%21/04/2021
1,534,807 0.21POLAND
USD 2,850,000 ROMANIAN GOVERNMENT INTERNATIONAL BOND 4.375%22/08/2023
2,483,187 0.33ROMANIA
USD 1,700,000 ROMANIAN GOVERNMENT INTERNATIONAL BOND 4.875%22/01/2024
1,514,987 0.21ROMANIA
USD 2,010,000 ROMANIAN GOVERNMENT INTERNATIONAL BOND 5.125%15/06/2048
1,712,430 0.23ROMANIA
USD 1,680,000 ROMANIAN GOVERNMENT INTERNATIONAL BOND 6.125%22/01/2044
1,653,288 0.23ROMANIA
USD 2,350,000 ROMANIAN GOVERNMENT INTERNATIONAL BOND 6.75%07/02/2022
2,212,908 0.30ROMANIA
USD 500,000 GTLK EUROPE DAC 5.125% 31/05/2024 396,433 0.05RUSSIAUSD 725,000 RUSSIA FOREIGN BOND - EUROBOND 12.75% 24/06/2028 1,003,612 0.14RUSSIAUSD 6,240,000 RUSSIA FOREIGN BOND - EUROBOND 7.50% 31/03/2030 2,616,898 0.36RUSSIAUSD 200,000 RUSSIAN AGRICULTURAL BANK OJSC VIA RSHB CAPITAL SA
8.50% 16/10/2023176,837 0.02RUSSIA
USD 4,200,000 RUSSIAN FOREIGN BOND - EUROBOND 4.25% 23/06/2027 3,451,869 0.47RUSSIAUSD 3,000,000 RUSSIAN FOREIGN BOND - EUROBOND 4.50% 04/04/2022 2,606,790 0.35RUSSIAUSD 3,600,000 RUSSIAN FOREIGN BOND - EUROBOND 4.75% 27/05/2026 3,080,189 0.42RUSSIAUSD 3,000,000 RUSSIAN FOREIGN BOND - EUROBOND 4.875% 16/09/2023 2,646,755 0.36RUSSIAUSD 2,600,000 RUSSIAN FOREIGN BOND - EUROBOND 5.00% 29/04/2020 2,277,933 0.31RUSSIAUSD 6,200,000 RUSSIAN FOREIGN BOND - EUROBOND 5.25% 23/06/2047 5,078,299 0.69RUSSIAUSD 1,200,000 RUSSIAN FOREIGN BOND - EUROBOND 5.625% 04/04/2042 1,071,079 0.15RUSSIAUSD 600,000 RUSSIAN FOREIGN BOND - EUROBOND 5.875% 16/09/2043 552,106 0.08RUSSIAUSD 500,000 RUSSIAN RAILWAYS VIA RZD CAPITAL PLC 5.70% 05/04/2022 442,093 0.06RUSSIAUSD 1,100,000 SCF CAPITAL DESIGNATED ACTIVITY CO 5.375% 16/06/2023 937,151 0.13RUSSIAUSD 700,000 VNESHECONOMBANK VIA VEB FINANCE LTD 6.902%
09/07/2020602,385 0.08RUSSIA
USD 800,000 VNESHECONOMBANK VIA VEB FINANCE PLC 5.942%21/11/2023
663,515 0.09RUSSIA
USD 300,000 VNESHECONOMBANK VIA VEB FINANCE PLC 6.80%22/11/2025
255,748 0.03RUSSIA
USD 1,000,000 SENEGAL GOVERNMENT INTERNATIONAL BOND 6.75%13/03/2048
738,075 0.10SENEGAL
USD 1,050,000 REPUBLIC OF SERBIA 4.875% 25/02/2020 917,114 0.12SERBIAUSD 4,000,000 REPUBLIC OF SERBIA 7.25% 28/09/2021 3,747,314 0.52SERBIAUSD 1,700,000 ESKOM HOLDINGS SOC LTD 5.75% 26/01/2021 1,396,272 0.19SOUTH AFRICAUSD 1,900,000 ESKOM HOLDINGS SOC LTD 6.35% 10/08/2028 1,633,722 0.22SOUTH AFRICAUSD 1,100,000 ESKOM HOLDINGS SOC LTD 6.75% 06/08/2023 899,925 0.12SOUTH AFRICAUSD 1,800,000 ESKOM HOLDINGS SOC LTD 7.125% 11/02/2025 1,465,836 0.20SOUTH AFRICAUSD 1,000,000 REPUBLIC OF SOUTH AFRICA GOVERNMENT
INTERNATIONAL BOND 4.30% 12/10/2028756,339 0.10SOUTH AFRICA
Country
Statement of Investment Portfolio and Other Net Assets AUGUST 31, 2018
Notional or number of units / shares
ownedMarket Value
EUR% of Net
Assets
INTERFUND BOND GLOBAL EMERGING MARKETS
(continued)
Similar issues with same maturities have not been combined when issuance date differs.The accompanying notes are an integral part of these financial statements.General note: differences in sums, if any, are due to rounding.
Currency
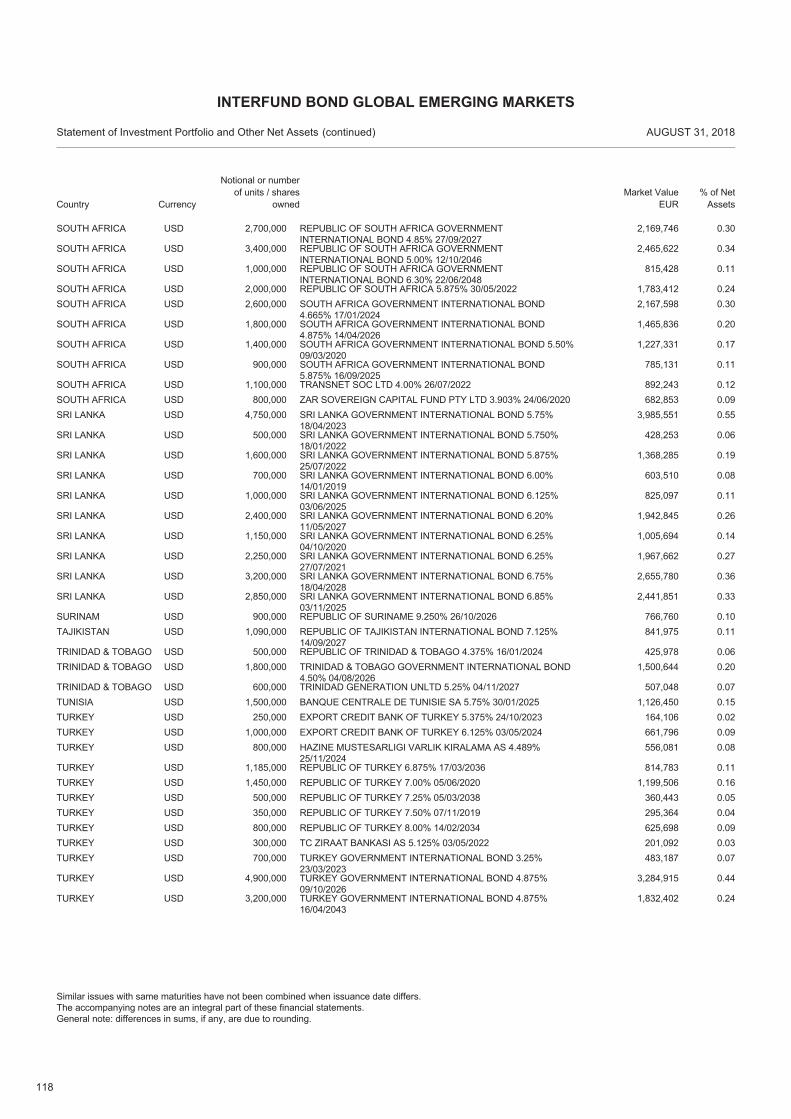
118
USD 2,700,000 REPUBLIC OF SOUTH AFRICA GOVERNMENTINTERNATIONAL BOND 4.85% 27/09/2027
2,169,746 0.30SOUTH AFRICA
USD 3,400,000 REPUBLIC OF SOUTH AFRICA GOVERNMENTINTERNATIONAL BOND 5.00% 12/10/2046
2,465,622 0.34SOUTH AFRICA
USD 1,000,000 REPUBLIC OF SOUTH AFRICA GOVERNMENTINTERNATIONAL BOND 6.30% 22/06/2048
815,428 0.11SOUTH AFRICA
USD 2,000,000 REPUBLIC OF SOUTH AFRICA 5.875% 30/05/2022 1,783,412 0.24SOUTH AFRICAUSD 2,600,000 SOUTH AFRICA GOVERNMENT INTERNATIONAL BOND
4.665% 17/01/20242,167,598 0.30SOUTH AFRICA
USD 1,800,000 SOUTH AFRICA GOVERNMENT INTERNATIONAL BOND4.875% 14/04/2026
1,465,836 0.20SOUTH AFRICA
USD 1,400,000 SOUTH AFRICA GOVERNMENT INTERNATIONAL BOND 5.50%09/03/2020
1,227,331 0.17SOUTH AFRICA
USD 900,000 SOUTH AFRICA GOVERNMENT INTERNATIONAL BOND5.875% 16/09/2025
785,131 0.11SOUTH AFRICA
USD 1,100,000 TRANSNET SOC LTD 4.00% 26/07/2022 892,243 0.12SOUTH AFRICAUSD 800,000 ZAR SOVEREIGN CAPITAL FUND PTY LTD 3.903% 24/06/2020 682,853 0.09SOUTH AFRICAUSD 4,750,000 SRI LANKA GOVERNMENT INTERNATIONAL BOND 5.75%
18/04/20233,985,551 0.55SRI LANKA
USD 500,000 SRI LANKA GOVERNMENT INTERNATIONAL BOND 5.750%18/01/2022
428,253 0.06SRI LANKA
USD 1,600,000 SRI LANKA GOVERNMENT INTERNATIONAL BOND 5.875%25/07/2022
1,368,285 0.19SRI LANKA
USD 700,000 SRI LANKA GOVERNMENT INTERNATIONAL BOND 6.00%14/01/2019
603,510 0.08SRI LANKA
USD 1,000,000 SRI LANKA GOVERNMENT INTERNATIONAL BOND 6.125%03/06/2025
825,097 0.11SRI LANKA
USD 2,400,000 SRI LANKA GOVERNMENT INTERNATIONAL BOND 6.20%11/05/2027
1,942,845 0.26SRI LANKA
USD 1,150,000 SRI LANKA GOVERNMENT INTERNATIONAL BOND 6.25%04/10/2020
1,005,694 0.14SRI LANKA
USD 2,250,000 SRI LANKA GOVERNMENT INTERNATIONAL BOND 6.25%27/07/2021
1,967,662 0.27SRI LANKA
USD 3,200,000 SRI LANKA GOVERNMENT INTERNATIONAL BOND 6.75%18/04/2028
2,655,780 0.36SRI LANKA
USD 2,850,000 SRI LANKA GOVERNMENT INTERNATIONAL BOND 6.85%03/11/2025
2,441,851 0.33SRI LANKA
USD 900,000 REPUBLIC OF SURINAME 9.250% 26/10/2026 766,760 0.10SURINAMUSD 1,090,000 REPUBLIC OF TAJIKISTAN INTERNATIONAL BOND 7.125%
14/09/2027841,975 0.11TAJIKISTAN
USD 500,000 REPUBLIC OF TRINIDAD & TOBAGO 4.375% 16/01/2024 425,978 0.06TRINIDAD & TOBAGOUSD 1,800,000 TRINIDAD & TOBAGO GOVERNMENT INTERNATIONAL BOND
4.50% 04/08/20261,500,644 0.20TRINIDAD & TOBAGO
USD 600,000 TRINIDAD GENERATION UNLTD 5.25% 04/11/2027 507,048 0.07TRINIDAD & TOBAGOUSD 1,500,000 BANQUE CENTRALE DE TUNISIE SA 5.75% 30/01/2025 1,126,450 0.15TUNISIAUSD 250,000 EXPORT CREDIT BANK OF TURKEY 5.375% 24/10/2023 164,106 0.02TURKEYUSD 1,000,000 EXPORT CREDIT BANK OF TURKEY 6.125% 03/05/2024 661,796 0.09TURKEYUSD 800,000 HAZINE MUSTESARLIGI VARLIK KIRALAMA AS 4.489%
25/11/2024556,081 0.08TURKEY
USD 1,185,000 REPUBLIC OF TURKEY 6.875% 17/03/2036 814,783 0.11TURKEYUSD 1,450,000 REPUBLIC OF TURKEY 7.00% 05/06/2020 1,199,506 0.16TURKEYUSD 500,000 REPUBLIC OF TURKEY 7.25% 05/03/2038 360,443 0.05TURKEYUSD 350,000 REPUBLIC OF TURKEY 7.50% 07/11/2019 295,364 0.04TURKEYUSD 800,000 REPUBLIC OF TURKEY 8.00% 14/02/2034 625,698 0.09TURKEYUSD 300,000 TC ZIRAAT BANKASI AS 5.125% 03/05/2022 201,092 0.03TURKEYUSD 700,000 TURKEY GOVERNMENT INTERNATIONAL BOND 3.25%
23/03/2023483,187 0.07TURKEY
USD 4,900,000 TURKEY GOVERNMENT INTERNATIONAL BOND 4.875%09/10/2026
3,284,915 0.44TURKEY
USD 3,200,000 TURKEY GOVERNMENT INTERNATIONAL BOND 4.875%16/04/2043
1,832,402 0.24TURKEY
Country
Statement of Investment Portfolio and Other Net Assets AUGUST 31, 2018
Notional or number of units / shares
ownedMarket Value
EUR% of Net
Assets
INTERFUND BOND GLOBAL EMERGING MARKETS
(continued)
Similar issues with same maturities have not been combined when issuance date differs.The accompanying notes are an integral part of these financial statements.General note: differences in sums, if any, are due to rounding.
Currency
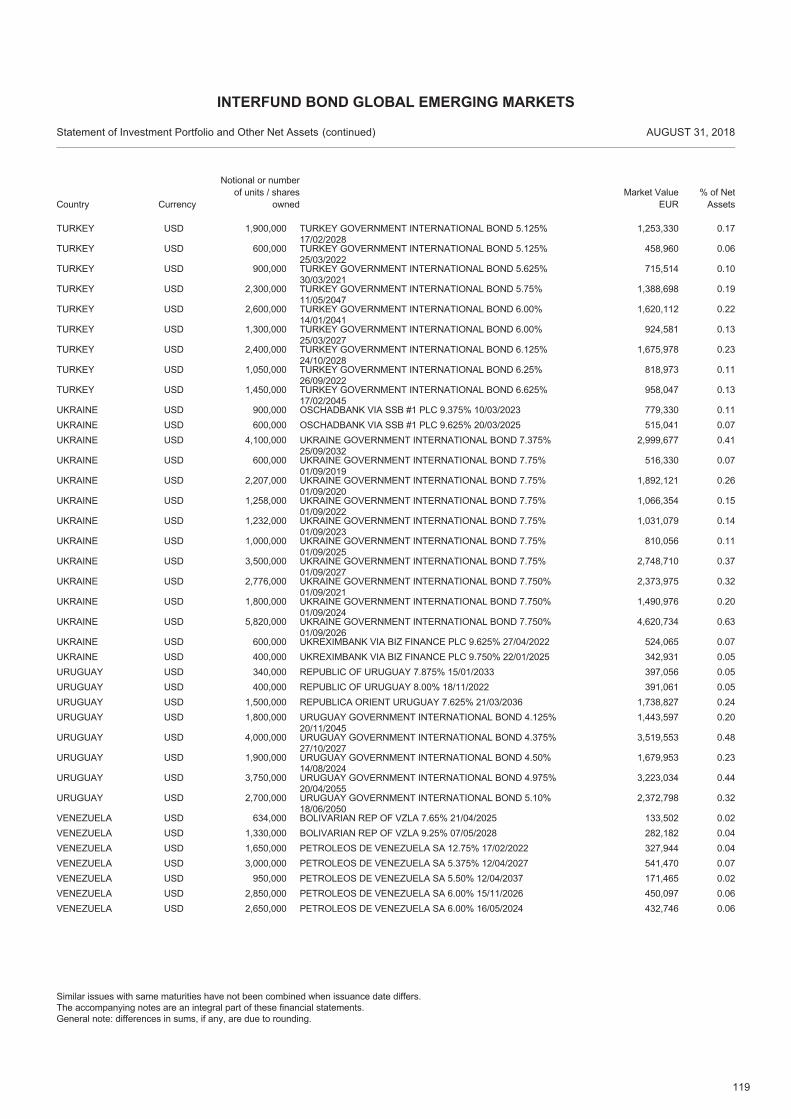
119
USD 1,900,000 TURKEY GOVERNMENT INTERNATIONAL BOND 5.125%17/02/2028
1,253,330 0.17TURKEY
USD 600,000 TURKEY GOVERNMENT INTERNATIONAL BOND 5.125%25/03/2022
458,960 0.06TURKEY
USD 900,000 TURKEY GOVERNMENT INTERNATIONAL BOND 5.625%30/03/2021
715,514 0.10TURKEY
USD 2,300,000 TURKEY GOVERNMENT INTERNATIONAL BOND 5.75%11/05/2047
1,388,698 0.19TURKEY
USD 2,600,000 TURKEY GOVERNMENT INTERNATIONAL BOND 6.00%14/01/2041
1,620,112 0.22TURKEY
USD 1,300,000 TURKEY GOVERNMENT INTERNATIONAL BOND 6.00%25/03/2027
924,581 0.13TURKEY
USD 2,400,000 TURKEY GOVERNMENT INTERNATIONAL BOND 6.125%24/10/2028
1,675,978 0.23TURKEY
USD 1,050,000 TURKEY GOVERNMENT INTERNATIONAL BOND 6.25%26/09/2022
818,973 0.11TURKEY
USD 1,450,000 TURKEY GOVERNMENT INTERNATIONAL BOND 6.625%17/02/2045
958,047 0.13TURKEY
USD 900,000 OSCHADBANK VIA SSB #1 PLC 9.375% 10/03/2023 779,330 0.11UKRAINEUSD 600,000 OSCHADBANK VIA SSB #1 PLC 9.625% 20/03/2025 515,041 0.07UKRAINEUSD 4,100,000 UKRAINE GOVERNMENT INTERNATIONAL BOND 7.375%
25/09/20322,999,677 0.41UKRAINE
USD 600,000 UKRAINE GOVERNMENT INTERNATIONAL BOND 7.75%01/09/2019
516,330 0.07UKRAINE
USD 2,207,000 UKRAINE GOVERNMENT INTERNATIONAL BOND 7.75%01/09/2020
1,892,121 0.26UKRAINE
USD 1,258,000 UKRAINE GOVERNMENT INTERNATIONAL BOND 7.75%01/09/2022
1,066,354 0.15UKRAINE
USD 1,232,000 UKRAINE GOVERNMENT INTERNATIONAL BOND 7.75%01/09/2023
1,031,079 0.14UKRAINE
USD 1,000,000 UKRAINE GOVERNMENT INTERNATIONAL BOND 7.75%01/09/2025
810,056 0.11UKRAINE
USD 3,500,000 UKRAINE GOVERNMENT INTERNATIONAL BOND 7.75%01/09/2027
2,748,710 0.37UKRAINE
USD 2,776,000 UKRAINE GOVERNMENT INTERNATIONAL BOND 7.750%01/09/2021
2,373,975 0.32UKRAINE
USD 1,800,000 UKRAINE GOVERNMENT INTERNATIONAL BOND 7.750%01/09/2024
1,490,976 0.20UKRAINE
USD 5,820,000 UKRAINE GOVERNMENT INTERNATIONAL BOND 7.750%01/09/2026
4,620,734 0.63UKRAINE
USD 600,000 UKREXIMBANK VIA BIZ FINANCE PLC 9.625% 27/04/2022 524,065 0.07UKRAINEUSD 400,000 UKREXIMBANK VIA BIZ FINANCE PLC 9.750% 22/01/2025 342,931 0.05UKRAINEUSD 340,000 REPUBLIC OF URUGUAY 7.875% 15/01/2033 397,056 0.05URUGUAYUSD 400,000 REPUBLIC OF URUGUAY 8.00% 18/11/2022 391,061 0.05URUGUAYUSD 1,500,000 REPUBLICA ORIENT URUGUAY 7.625% 21/03/2036 1,738,827 0.24URUGUAYUSD 1,800,000 URUGUAY GOVERNMENT INTERNATIONAL BOND 4.125%
20/11/20451,443,597 0.20URUGUAY
USD 4,000,000 URUGUAY GOVERNMENT INTERNATIONAL BOND 4.375%27/10/2027
3,519,553 0.48URUGUAY
USD 1,900,000 URUGUAY GOVERNMENT INTERNATIONAL BOND 4.50%14/08/2024
1,679,953 0.23URUGUAY
USD 3,750,000 URUGUAY GOVERNMENT INTERNATIONAL BOND 4.975%20/04/2055
3,223,034 0.44URUGUAY
USD 2,700,000 URUGUAY GOVERNMENT INTERNATIONAL BOND 5.10%18/06/2050
2,372,798 0.32URUGUAY
USD 634,000 BOLIVARIAN REP OF VZLA 7.65% 21/04/2025 133,502 0.02VENEZUELAUSD 1,330,000 BOLIVARIAN REP OF VZLA 9.25% 07/05/2028 282,182 0.04VENEZUELAUSD 1,650,000 PETROLEOS DE VENEZUELA SA 12.75% 17/02/2022 327,944 0.04VENEZUELAUSD 3,000,000 PETROLEOS DE VENEZUELA SA 5.375% 12/04/2027 541,470 0.07VENEZUELAUSD 950,000 PETROLEOS DE VENEZUELA SA 5.50% 12/04/2037 171,465 0.02VENEZUELAUSD 2,850,000 PETROLEOS DE VENEZUELA SA 6.00% 15/11/2026 450,097 0.06VENEZUELAUSD 2,650,000 PETROLEOS DE VENEZUELA SA 6.00% 16/05/2024 432,746 0.06VENEZUELA
Country
Statement of Investment Portfolio and Other Net Assets AUGUST 31, 2018
Notional or number of units / shares
ownedMarket Value
EUR% of Net
Assets
INTERFUND BOND GLOBAL EMERGING MARKETS
(continued)
Similar issues with same maturities have not been combined when issuance date differs.The accompanying notes are an integral part of these financial statements.General note: differences in sums, if any, are due to rounding.
Currency
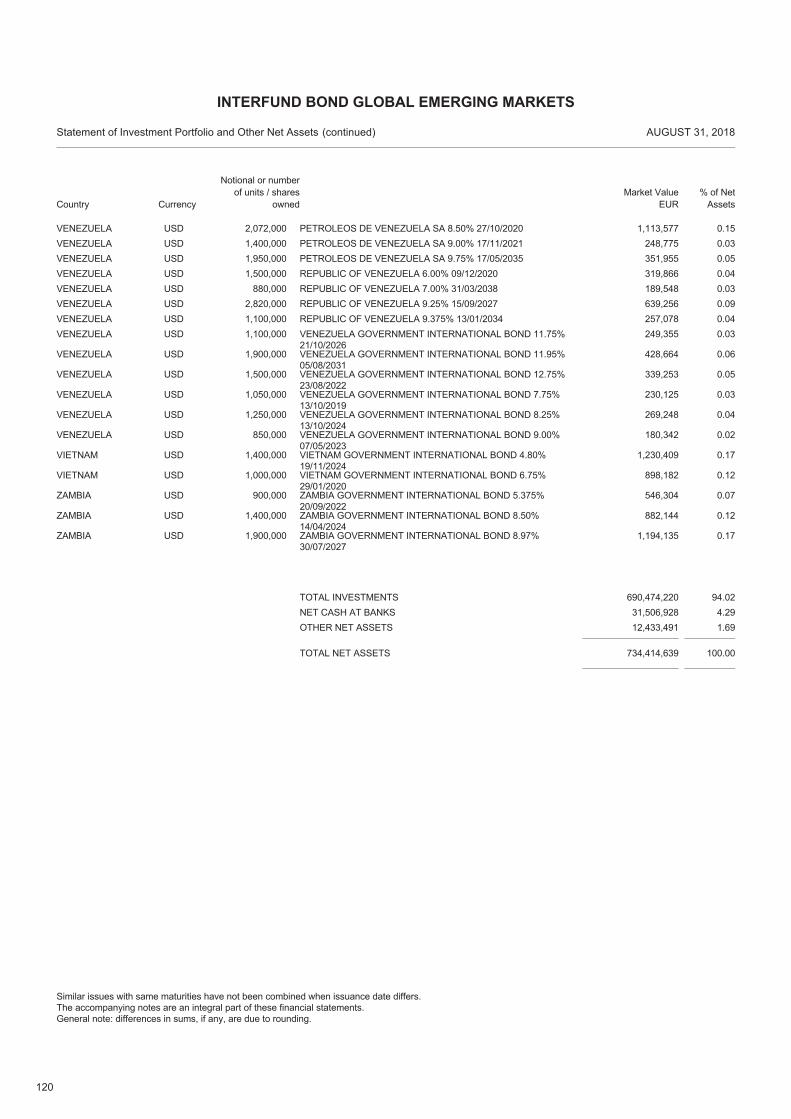
120
USD 2,072,000 PETROLEOS DE VENEZUELA SA 8.50% 27/10/2020 1,113,577 0.15VENEZUELAUSD 1,400,000 PETROLEOS DE VENEZUELA SA 9.00% 17/11/2021 248,775 0.03VENEZUELAUSD 1,950,000 PETROLEOS DE VENEZUELA SA 9.75% 17/05/2035 351,955 0.05VENEZUELAUSD 1,500,000 REPUBLIC OF VENEZUELA 6.00% 09/12/2020 319,866 0.04VENEZUELAUSD 880,000 REPUBLIC OF VENEZUELA 7.00% 31/03/2038 189,548 0.03VENEZUELAUSD 2,820,000 REPUBLIC OF VENEZUELA 9.25% 15/09/2027 639,256 0.09VENEZUELAUSD 1,100,000 REPUBLIC OF VENEZUELA 9.375% 13/01/2034 257,078 0.04VENEZUELAUSD 1,100,000 VENEZUELA GOVERNMENT INTERNATIONAL BOND 11.75%
21/10/2026249,355 0.03VENEZUELA
USD 1,900,000 VENEZUELA GOVERNMENT INTERNATIONAL BOND 11.95%05/08/2031
428,664 0.06VENEZUELA
USD 1,500,000 VENEZUELA GOVERNMENT INTERNATIONAL BOND 12.75%23/08/2022
339,253 0.05VENEZUELA
USD 1,050,000 VENEZUELA GOVERNMENT INTERNATIONAL BOND 7.75%13/10/2019
230,125 0.03VENEZUELA
USD 1,250,000 VENEZUELA GOVERNMENT INTERNATIONAL BOND 8.25%13/10/2024
269,248 0.04VENEZUELA
USD 850,000 VENEZUELA GOVERNMENT INTERNATIONAL BOND 9.00%07/05/2023
180,342 0.02VENEZUELA
USD 1,400,000 VIETNAM GOVERNMENT INTERNATIONAL BOND 4.80%19/11/2024
1,230,409 0.17VIETNAM
USD 1,000,000 VIETNAM GOVERNMENT INTERNATIONAL BOND 6.75%29/01/2020
898,182 0.12VIETNAM
USD 900,000 ZAMBIA GOVERNMENT INTERNATIONAL BOND 5.375%20/09/2022
546,304 0.07ZAMBIA
USD 1,400,000 ZAMBIA GOVERNMENT INTERNATIONAL BOND 8.50%14/04/2024
882,144 0.12ZAMBIA
USD 1,900,000 ZAMBIA GOVERNMENT INTERNATIONAL BOND 8.97%30/07/2027
1,194,135 0.17ZAMBIA
TOTAL NET ASSETS 734,414,639 100.00
TOTAL INVESTMENTS 690,474,220 94.02NET CASH AT BANKS 31,506,928 4.29OTHER NET ASSETS 12,433,491 1.69
Country
Statement of Investment Portfolio and Other Net Assets AUGUST 31, 2018
Notional or number of units / shares
ownedMarket Value
EUR% of Net
Assets
INTERFUND BOND GLOBAL EMERGING MARKETS
(continued)
Similar issues with same maturities have not been combined when issuance date differs.The accompanying notes are an integral part of these financial statements.General note: differences in sums, if any, are due to rounding.
Currency
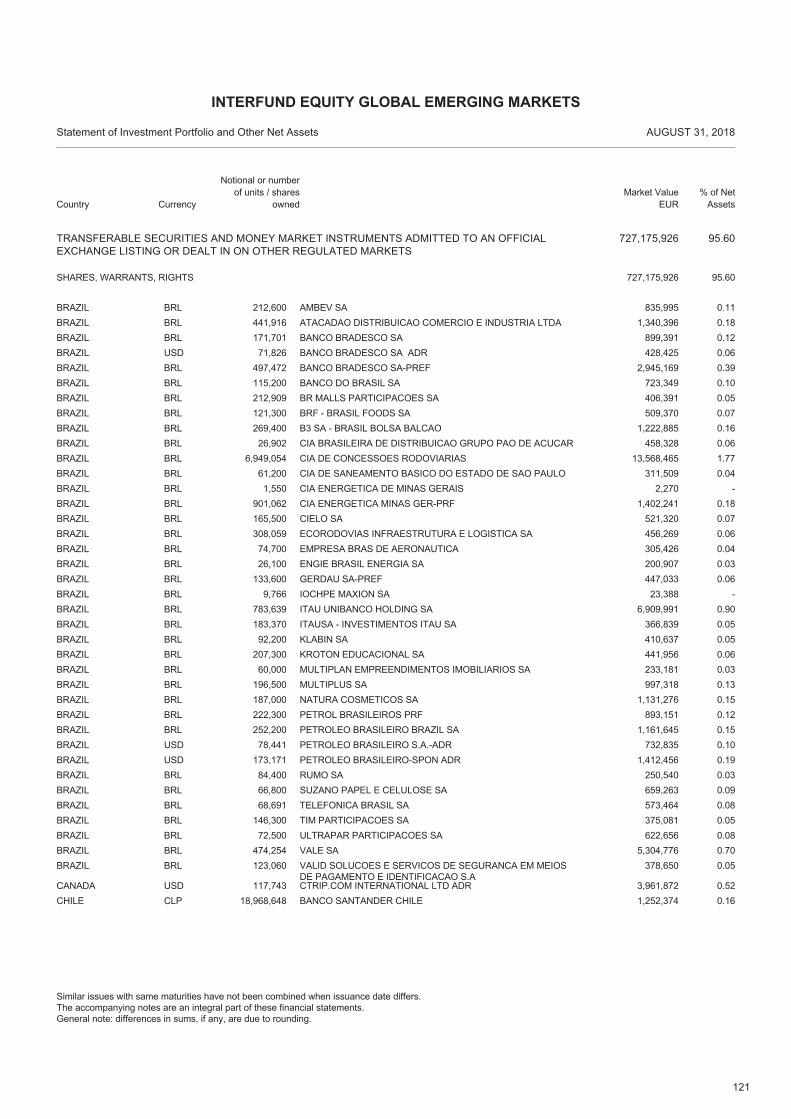
121
TRANSFERABLE SECURITIES AND MONEY MARKET INSTRUMENTS ADMITTED TO AN OFFICIALEXCHANGE LISTING OR DEALT IN ON OTHER REGULATED MARKETS
727,175,926 95.60
BRL 212,600 AMBEV SA 835,995 0.11BRAZIL
SHARES, WARRANTS, RIGHTS 95.60727,175,926
BRL 441,916 ATACADAO DISTRIBUICAO COMERCIO E INDUSTRIA LTDA 1,340,396 0.18BRAZILBRL 171,701 BANCO BRADESCO SA 899,391 0.12BRAZILUSD 71,826 BANCO BRADESCO SA ADR 428,425 0.06BRAZILBRL 497,472 BANCO BRADESCO SA-PREF 2,945,169 0.39BRAZILBRL 115,200 BANCO DO BRASIL SA 723,349 0.10BRAZILBRL 212,909 BR MALLS PARTICIPACOES SA 406,391 0.05BRAZILBRL 121,300 BRF - BRASIL FOODS SA 509,370 0.07BRAZILBRL 269,400 B3 SA - BRASIL BOLSA BALCAO 1,222,885 0.16BRAZILBRL 26,902 CIA BRASILEIRA DE DISTRIBUICAO GRUPO PAO DE ACUCAR 458,328 0.06BRAZILBRL 6,949,054 CIA DE CONCESSOES RODOVIARIAS 13,568,465 1.77BRAZILBRL 61,200 CIA DE SANEAMENTO BASICO DO ESTADO DE SAO PAULO 311,509 0.04BRAZILBRL 1,550 CIA ENERGETICA DE MINAS GERAIS 2,270 -BRAZILBRL 901,062 CIA ENERGETICA MINAS GER-PRF 1,402,241 0.18BRAZILBRL 165,500 CIELO SA 521,320 0.07BRAZILBRL 308,059 ECORODOVIAS INFRAESTRUTURA E LOGISTICA SA 456,269 0.06BRAZILBRL 74,700 EMPRESA BRAS DE AERONAUTICA 305,426 0.04BRAZILBRL 26,100 ENGIE BRASIL ENERGIA SA 200,907 0.03BRAZILBRL 133,600 GERDAU SA-PREF 447,033 0.06BRAZILBRL 9,766 IOCHPE MAXION SA 23,388 -BRAZILBRL 783,639 ITAU UNIBANCO HOLDING SA 6,909,991 0.90BRAZILBRL 183,370 ITAUSA - INVESTIMENTOS ITAU SA 366,839 0.05BRAZILBRL 92,200 KLABIN SA 410,637 0.05BRAZILBRL 207,300 KROTON EDUCACIONAL SA 441,956 0.06BRAZILBRL 60,000 MULTIPLAN EMPREENDIMENTOS IMOBILIARIOS SA 233,181 0.03BRAZILBRL 196,500 MULTIPLUS SA 997,318 0.13BRAZILBRL 187,000 NATURA COSMETICOS SA 1,131,276 0.15BRAZILBRL 222,300 PETROL BRASILEIROS PRF 893,151 0.12BRAZILBRL 252,200 PETROLEO BRASILEIRO BRAZIL SA 1,161,645 0.15BRAZILUSD 78,441 PETROLEO BRASILEIRO S.A.-ADR 732,835 0.10BRAZILUSD 173,171 PETROLEO BRASILEIRO-SPON ADR 1,412,456 0.19BRAZILBRL 84,400 RUMO SA 250,540 0.03BRAZILBRL 66,800 SUZANO PAPEL E CELULOSE SA 659,263 0.09BRAZILBRL 68,691 TELEFONICA BRASIL SA 573,464 0.08BRAZILBRL 146,300 TIM PARTICIPACOES SA 375,081 0.05BRAZILBRL 72,500 ULTRAPAR PARTICIPACOES SA 622,656 0.08BRAZILBRL 474,254 VALE SA 5,304,776 0.70BRAZILBRL 123,060 VALID SOLUCOES E SERVICOS DE SEGURANCA EM MEIOS
DE PAGAMENTO E IDENTIFICACAO S.A378,650 0.05BRAZIL
USD 117,743 CTRIP.COM INTERNATIONAL LTD ADR 3,961,872 0.52CANADACLP 18,968,648 BANCO SANTANDER CHILE 1,252,374 0.16CHILE
Country
Statement of Investment Portfolio and Other Net Assets AUGUST 31, 2018
Notional or number of units / shares
ownedMarket Value
EUR% of Net
Assets
INTERFUND EQUITY GLOBAL EMERGING MARKETS
Similar issues with same maturities have not been combined when issuance date differs.The accompanying notes are an integral part of these financial statements.General note: differences in sums, if any, are due to rounding.
Currency
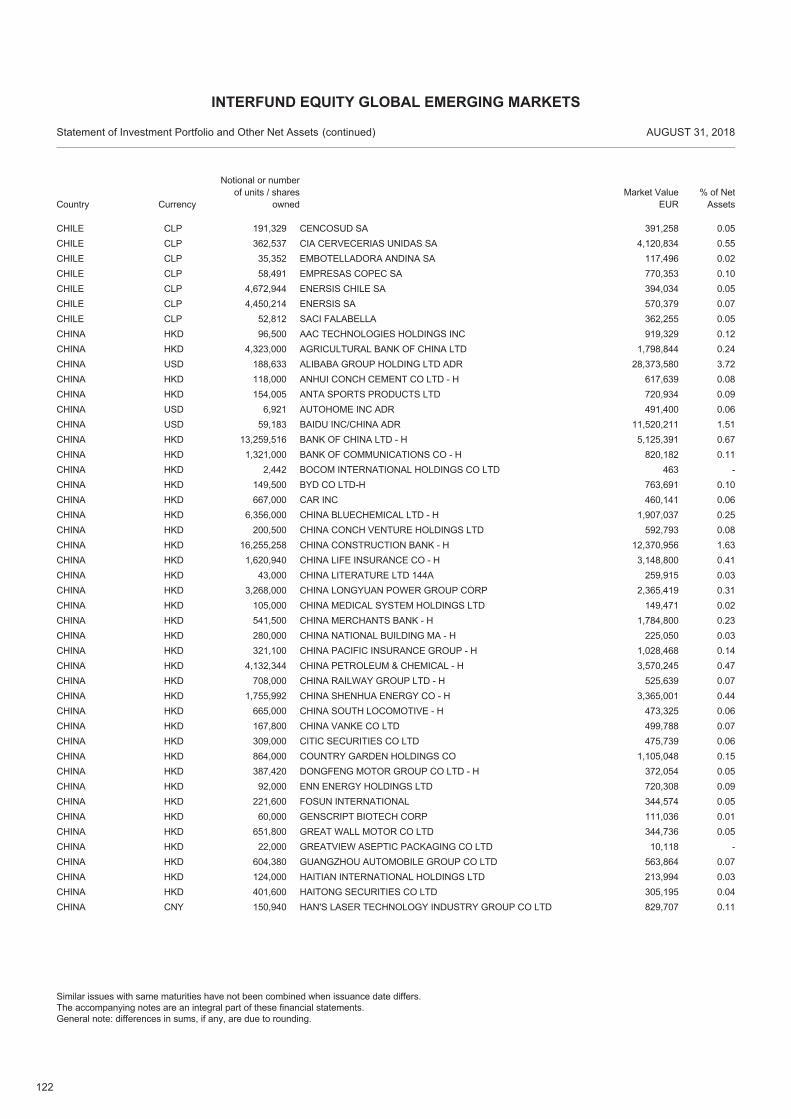
122
CLP 191,329 CENCOSUD SA 391,258 0.05CHILECLP 362,537 CIA CERVECERIAS UNIDAS SA 4,120,834 0.55CHILECLP 35,352 EMBOTELLADORA ANDINA SA 117,496 0.02CHILECLP 58,491 EMPRESAS COPEC SA 770,353 0.10CHILECLP 4,672,944 ENERSIS CHILE SA 394,034 0.05CHILECLP 4,450,214 ENERSIS SA 570,379 0.07CHILECLP 52,812 SACI FALABELLA 362,255 0.05CHILEHKD 96,500 AAC TECHNOLOGIES HOLDINGS INC 919,329 0.12CHINAHKD 4,323,000 AGRICULTURAL BANK OF CHINA LTD 1,798,844 0.24CHINAUSD 188,633 ALIBABA GROUP HOLDING LTD ADR 28,373,580 3.72CHINAHKD 118,000 ANHUI CONCH CEMENT CO LTD - H 617,639 0.08CHINAHKD 154,005 ANTA SPORTS PRODUCTS LTD 720,934 0.09CHINAUSD 6,921 AUTOHOME INC ADR 491,400 0.06CHINAUSD 59,183 BAIDU INC/CHINA ADR 11,520,211 1.51CHINAHKD 13,259,516 BANK OF CHINA LTD - H 5,125,391 0.67CHINAHKD 1,321,000 BANK OF COMMUNICATIONS CO - H 820,182 0.11CHINAHKD 2,442 BOCOM INTERNATIONAL HOLDINGS CO LTD 463 -CHINAHKD 149,500 BYD CO LTD-H 763,691 0.10CHINAHKD 667,000 CAR INC 460,141 0.06CHINAHKD 6,356,000 CHINA BLUECHEMICAL LTD - H 1,907,037 0.25CHINAHKD 200,500 CHINA CONCH VENTURE HOLDINGS LTD 592,793 0.08CHINAHKD 16,255,258 CHINA CONSTRUCTION BANK - H 12,370,956 1.63CHINAHKD 1,620,940 CHINA LIFE INSURANCE CO - H 3,148,800 0.41CHINAHKD 43,000 CHINA LITERATURE LTD 144A 259,915 0.03CHINAHKD 3,268,000 CHINA LONGYUAN POWER GROUP CORP 2,365,419 0.31CHINAHKD 105,000 CHINA MEDICAL SYSTEM HOLDINGS LTD 149,471 0.02CHINAHKD 541,500 CHINA MERCHANTS BANK - H 1,784,800 0.23CHINAHKD 280,000 CHINA NATIONAL BUILDING MA - H 225,050 0.03CHINAHKD 321,100 CHINA PACIFIC INSURANCE GROUP - H 1,028,468 0.14CHINAHKD 4,132,344 CHINA PETROLEUM & CHEMICAL - H 3,570,245 0.47CHINAHKD 708,000 CHINA RAILWAY GROUP LTD - H 525,639 0.07CHINAHKD 1,755,992 CHINA SHENHUA ENERGY CO - H 3,365,001 0.44CHINAHKD 665,000 CHINA SOUTH LOCOMOTIVE - H 473,325 0.06CHINAHKD 167,800 CHINA VANKE CO LTD 499,788 0.07CHINAHKD 309,000 CITIC SECURITIES CO LTD 475,739 0.06CHINAHKD 864,000 COUNTRY GARDEN HOLDINGS CO 1,105,048 0.15CHINAHKD 387,420 DONGFENG MOTOR GROUP CO LTD - H 372,054 0.05CHINAHKD 92,000 ENN ENERGY HOLDINGS LTD 720,308 0.09CHINAHKD 221,600 FOSUN INTERNATIONAL 344,574 0.05CHINAHKD 60,000 GENSCRIPT BIOTECH CORP 111,036 0.01CHINAHKD 651,800 GREAT WALL MOTOR CO LTD 344,736 0.05CHINAHKD 22,000 GREATVIEW ASEPTIC PACKAGING CO LTD 10,118 -CHINAHKD 604,380 GUANGZHOU AUTOMOBILE GROUP CO LTD 563,864 0.07CHINAHKD 124,000 HAITIAN INTERNATIONAL HOLDINGS LTD 213,994 0.03CHINAHKD 401,600 HAITONG SECURITIES CO LTD 305,195 0.04CHINACNY 150,940 HAN'S LASER TECHNOLOGY INDUSTRY GROUP CO LTD 829,707 0.11CHINA
Country
Statement of Investment Portfolio and Other Net Assets AUGUST 31, 2018
Notional or number of units / shares
ownedMarket Value
EUR% of Net
Assets
INTERFUND EQUITY GLOBAL EMERGING MARKETS
(continued)
Similar issues with same maturities have not been combined when issuance date differs.The accompanying notes are an integral part of these financial statements.General note: differences in sums, if any, are due to rounding.
Currency
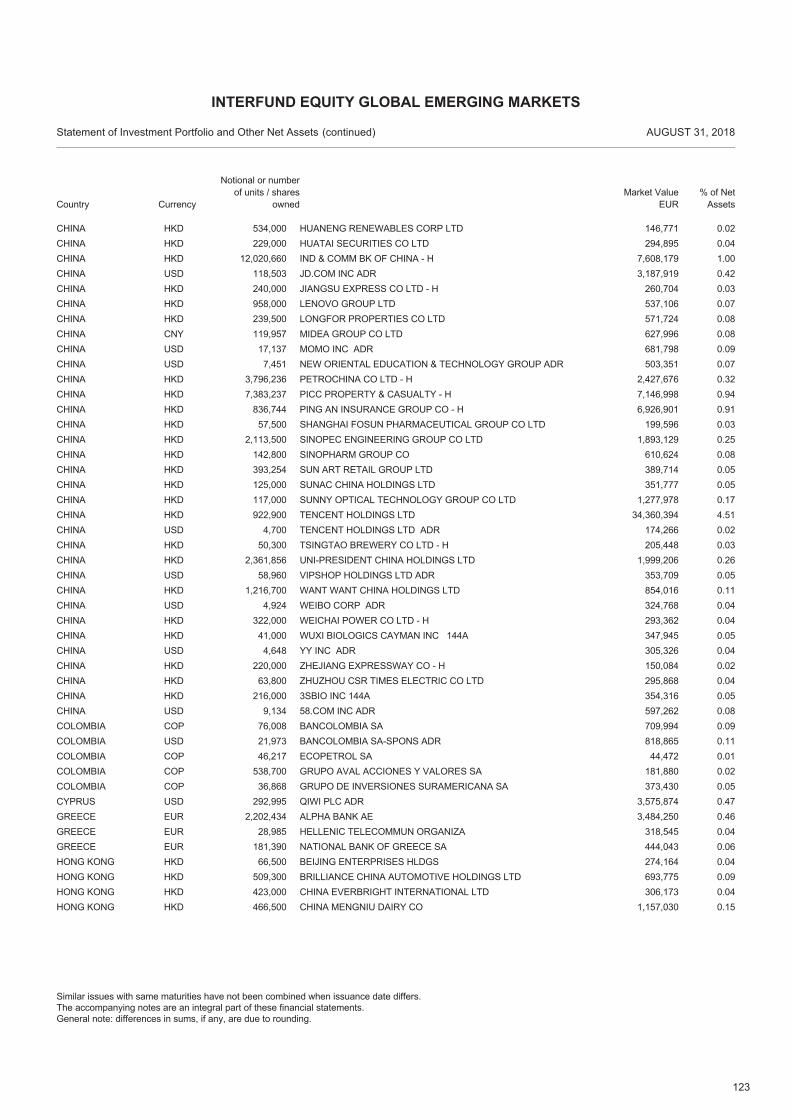
123
HKD 534,000 HUANENG RENEWABLES CORP LTD 146,771 0.02CHINAHKD 229,000 HUATAI SECURITIES CO LTD 294,895 0.04CHINAHKD 12,020,660 IND & COMM BK OF CHINA - H 7,608,179 1.00CHINAUSD 118,503 JD.COM INC ADR 3,187,919 0.42CHINAHKD 240,000 JIANGSU EXPRESS CO LTD - H 260,704 0.03CHINAHKD 958,000 LENOVO GROUP LTD 537,106 0.07CHINAHKD 239,500 LONGFOR PROPERTIES CO LTD 571,724 0.08CHINACNY 119,957 MIDEA GROUP CO LTD 627,996 0.08CHINAUSD 17,137 MOMO INC ADR 681,798 0.09CHINAUSD 7,451 NEW ORIENTAL EDUCATION & TECHNOLOGY GROUP ADR 503,351 0.07CHINAHKD 3,796,236 PETROCHINA CO LTD - H 2,427,676 0.32CHINAHKD 7,383,237 PICC PROPERTY & CASUALTY - H 7,146,998 0.94CHINAHKD 836,744 PING AN INSURANCE GROUP CO - H 6,926,901 0.91CHINAHKD 57,500 SHANGHAI FOSUN PHARMACEUTICAL GROUP CO LTD 199,596 0.03CHINAHKD 2,113,500 SINOPEC ENGINEERING GROUP CO LTD 1,893,129 0.25CHINAHKD 142,800 SINOPHARM GROUP CO 610,624 0.08CHINAHKD 393,254 SUN ART RETAIL GROUP LTD 389,714 0.05CHINAHKD 125,000 SUNAC CHINA HOLDINGS LTD 351,777 0.05CHINAHKD 117,000 SUNNY OPTICAL TECHNOLOGY GROUP CO LTD 1,277,978 0.17CHINAHKD 922,900 TENCENT HOLDINGS LTD 34,360,394 4.51CHINAUSD 4,700 TENCENT HOLDINGS LTD ADR 174,266 0.02CHINAHKD 50,300 TSINGTAO BREWERY CO LTD - H 205,448 0.03CHINAHKD 2,361,856 UNI-PRESIDENT CHINA HOLDINGS LTD 1,999,206 0.26CHINAUSD 58,960 VIPSHOP HOLDINGS LTD ADR 353,709 0.05CHINAHKD 1,216,700 WANT WANT CHINA HOLDINGS LTD 854,016 0.11CHINAUSD 4,924 WEIBO CORP ADR 324,768 0.04CHINAHKD 322,000 WEICHAI POWER CO LTD - H 293,362 0.04CHINAHKD 41,000 WUXI BIOLOGICS CAYMAN INC 144A 347,945 0.05CHINAUSD 4,648 YY INC ADR 305,326 0.04CHINAHKD 220,000 ZHEJIANG EXPRESSWAY CO - H 150,084 0.02CHINAHKD 63,800 ZHUZHOU CSR TIMES ELECTRIC CO LTD 295,868 0.04CHINAHKD 216,000 3SBIO INC 144A 354,316 0.05CHINAUSD 9,134 58.COM INC ADR 597,262 0.08CHINACOP 76,008 BANCOLOMBIA SA 709,994 0.09COLOMBIAUSD 21,973 BANCOLOMBIA SA-SPONS ADR 818,865 0.11COLOMBIACOP 46,217 ECOPETROL SA 44,472 0.01COLOMBIACOP 538,700 GRUPO AVAL ACCIONES Y VALORES SA 181,880 0.02COLOMBIACOP 36,868 GRUPO DE INVERSIONES SURAMERICANA SA 373,430 0.05COLOMBIAUSD 292,995 QIWI PLC ADR 3,575,874 0.47CYPRUSEUR 2,202,434 ALPHA BANK AE 3,484,250 0.46GREECEEUR 28,985 HELLENIC TELECOMMUN ORGANIZA 318,545 0.04GREECEEUR 181,390 NATIONAL BANK OF GREECE SA 444,043 0.06GREECEHKD 66,500 BEIJING ENTERPRISES HLDGS 274,164 0.04HONG KONGHKD 509,300 BRILLIANCE CHINA AUTOMOTIVE HOLDINGS LTD 693,775 0.09HONG KONGHKD 423,000 CHINA EVERBRIGHT INTERNATIONAL LTD 306,173 0.04HONG KONGHKD 466,500 CHINA MENGNIU DAIRY CO 1,157,030 0.15HONG KONG
Country
Statement of Investment Portfolio and Other Net Assets AUGUST 31, 2018
Notional or number of units / shares
ownedMarket Value
EUR% of Net
Assets
INTERFUND EQUITY GLOBAL EMERGING MARKETS
(continued)
Similar issues with same maturities have not been combined when issuance date differs.The accompanying notes are an integral part of these financial statements.General note: differences in sums, if any, are due to rounding.
Currency
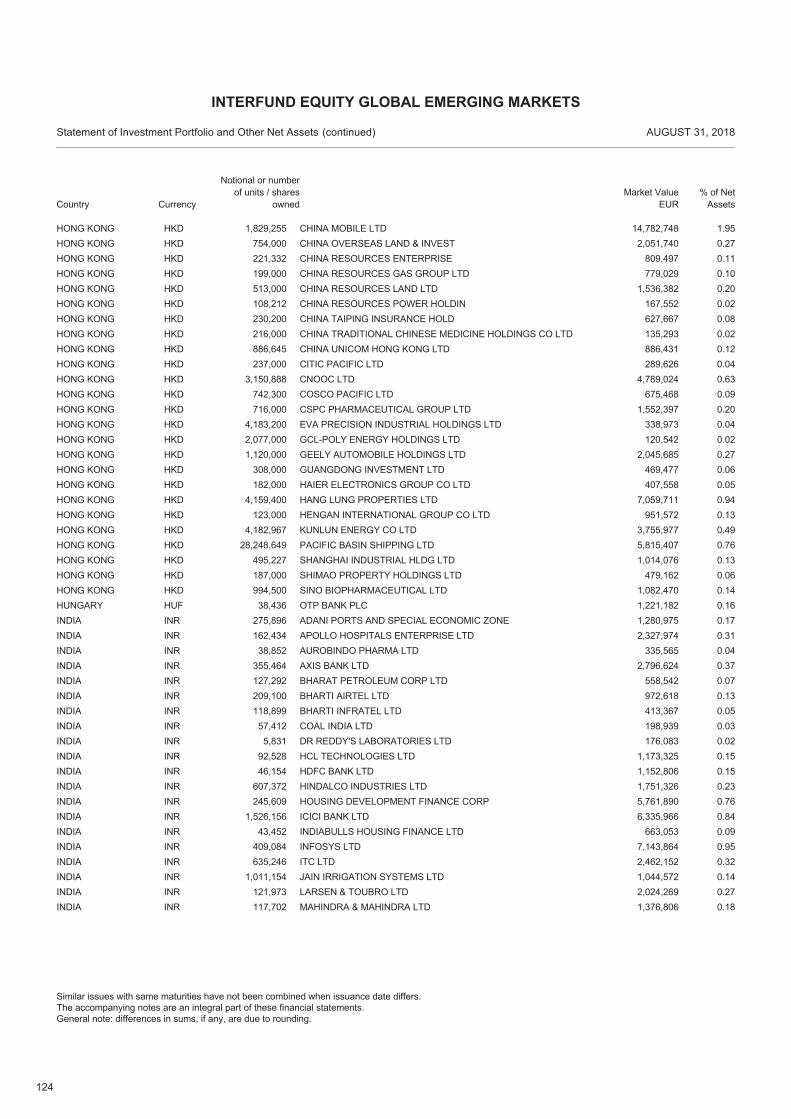
124
HKD 1,829,255 CHINA MOBILE LTD 14,782,748 1.95HONG KONGHKD 754,000 CHINA OVERSEAS LAND & INVEST 2,051,740 0.27HONG KONGHKD 221,332 CHINA RESOURCES ENTERPRISE 809,497 0.11HONG KONGHKD 199,000 CHINA RESOURCES GAS GROUP LTD 779,029 0.10HONG KONGHKD 513,000 CHINA RESOURCES LAND LTD 1,536,382 0.20HONG KONGHKD 108,212 CHINA RESOURCES POWER HOLDIN 167,552 0.02HONG KONGHKD 230,200 CHINA TAIPING INSURANCE HOLD 627,667 0.08HONG KONGHKD 216,000 CHINA TRADITIONAL CHINESE MEDICINE HOLDINGS CO LTD 135,293 0.02HONG KONGHKD 886,645 CHINA UNICOM HONG KONG LTD 886,431 0.12HONG KONGHKD 237,000 CITIC PACIFIC LTD 289,626 0.04HONG KONGHKD 3,150,888 CNOOC LTD 4,789,024 0.63HONG KONGHKD 742,300 COSCO PACIFIC LTD 675,468 0.09HONG KONGHKD 716,000 CSPC PHARMACEUTICAL GROUP LTD 1,552,397 0.20HONG KONGHKD 4,183,200 EVA PRECISION INDUSTRIAL HOLDINGS LTD 338,973 0.04HONG KONGHKD 2,077,000 GCL-POLY ENERGY HOLDINGS LTD 120,542 0.02HONG KONGHKD 1,120,000 GEELY AUTOMOBILE HOLDINGS LTD 2,045,685 0.27HONG KONGHKD 308,000 GUANGDONG INVESTMENT LTD 469,477 0.06HONG KONGHKD 182,000 HAIER ELECTRONICS GROUP CO LTD 407,558 0.05HONG KONGHKD 4,159,400 HANG LUNG PROPERTIES LTD 7,059,711 0.94HONG KONGHKD 123,000 HENGAN INTERNATIONAL GROUP CO LTD 951,572 0.13HONG KONGHKD 4,182,967 KUNLUN ENERGY CO LTD 3,755,977 0.49HONG KONGHKD 28,248,649 PACIFIC BASIN SHIPPING LTD 5,815,407 0.76HONG KONGHKD 495,227 SHANGHAI INDUSTRIAL HLDG LTD 1,014,076 0.13HONG KONGHKD 187,000 SHIMAO PROPERTY HOLDINGS LTD 479,162 0.06HONG KONGHKD 994,500 SINO BIOPHARMACEUTICAL LTD 1,082,470 0.14HONG KONGHUF 38,436 OTP BANK PLC 1,221,182 0.16HUNGARYINR 275,896 ADANI PORTS AND SPECIAL ECONOMIC ZONE 1,280,975 0.17INDIAINR 162,434 APOLLO HOSPITALS ENTERPRISE LTD 2,327,974 0.31INDIAINR 38,852 AUROBINDO PHARMA LTD 335,565 0.04INDIAINR 355,464 AXIS BANK LTD 2,796,624 0.37INDIAINR 127,292 BHARAT PETROLEUM CORP LTD 558,542 0.07INDIAINR 209,100 BHARTI AIRTEL LTD 972,618 0.13INDIAINR 118,899 BHARTI INFRATEL LTD 413,367 0.05INDIAINR 57,412 COAL INDIA LTD 198,939 0.03INDIAINR 5,831 DR REDDY'S LABORATORIES LTD 176,083 0.02INDIAINR 92,528 HCL TECHNOLOGIES LTD 1,173,325 0.15INDIAINR 46,154 HDFC BANK LTD 1,152,806 0.15INDIAINR 607,372 HINDALCO INDUSTRIES LTD 1,751,326 0.23INDIAINR 245,609 HOUSING DEVELOPMENT FINANCE CORP 5,761,890 0.76INDIAINR 1,526,156 ICICI BANK LTD 6,335,966 0.84INDIAINR 43,452 INDIABULLS HOUSING FINANCE LTD 663,053 0.09INDIAINR 409,084 INFOSYS LTD 7,143,864 0.95INDIAINR 635,246 ITC LTD 2,462,152 0.32INDIAINR 1,011,154 JAIN IRRIGATION SYSTEMS LTD 1,044,572 0.14INDIAINR 121,973 LARSEN & TOUBRO LTD 2,024,269 0.27INDIAINR 117,702 MAHINDRA & MAHINDRA LTD 1,376,806 0.18INDIA
Country
Statement of Investment Portfolio and Other Net Assets AUGUST 31, 2018
Notional or number of units / shares
ownedMarket Value
EUR% of Net
Assets
INTERFUND EQUITY GLOBAL EMERGING MARKETS
(continued)
Similar issues with same maturities have not been combined when issuance date differs.The accompanying notes are an integral part of these financial statements.General note: differences in sums, if any, are due to rounding.
Currency
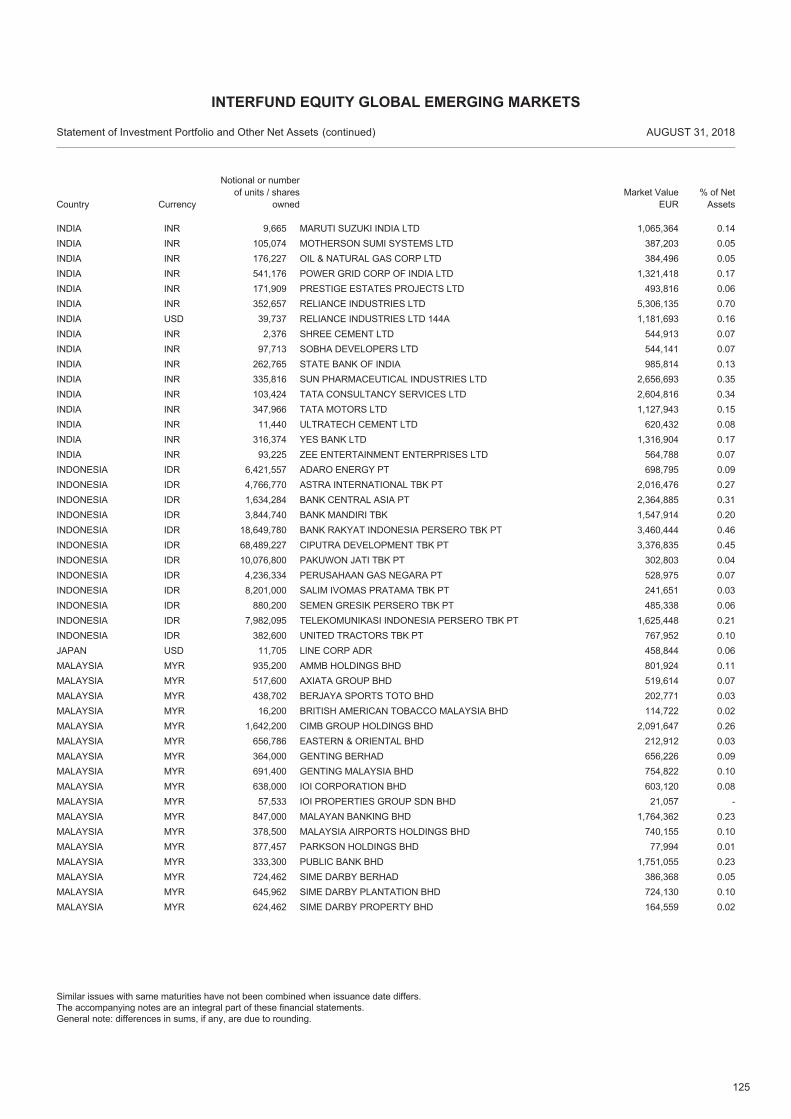
125
INR 9,665 MARUTI SUZUKI INDIA LTD 1,065,364 0.14INDIAINR 105,074 MOTHERSON SUMI SYSTEMS LTD 387,203 0.05INDIAINR 176,227 OIL & NATURAL GAS CORP LTD 384,496 0.05INDIAINR 541,176 POWER GRID CORP OF INDIA LTD 1,321,418 0.17INDIAINR 171,909 PRESTIGE ESTATES PROJECTS LTD 493,816 0.06INDIAINR 352,657 RELIANCE INDUSTRIES LTD 5,306,135 0.70INDIAUSD 39,737 RELIANCE INDUSTRIES LTD 144A 1,181,693 0.16INDIAINR 2,376 SHREE CEMENT LTD 544,913 0.07INDIAINR 97,713 SOBHA DEVELOPERS LTD 544,141 0.07INDIAINR 262,765 STATE BANK OF INDIA 985,814 0.13INDIAINR 335,816 SUN PHARMACEUTICAL INDUSTRIES LTD 2,656,693 0.35INDIAINR 103,424 TATA CONSULTANCY SERVICES LTD 2,604,816 0.34INDIAINR 347,966 TATA MOTORS LTD 1,127,943 0.15INDIAINR 11,440 ULTRATECH CEMENT LTD 620,432 0.08INDIAINR 316,374 YES BANK LTD 1,316,904 0.17INDIAINR 93,225 ZEE ENTERTAINMENT ENTERPRISES LTD 564,788 0.07INDIAIDR 6,421,557 ADARO ENERGY PT 698,795 0.09INDONESIAIDR 4,766,770 ASTRA INTERNATIONAL TBK PT 2,016,476 0.27INDONESIAIDR 1,634,284 BANK CENTRAL ASIA PT 2,364,885 0.31INDONESIAIDR 3,844,740 BANK MANDIRI TBK 1,547,914 0.20INDONESIAIDR 18,649,780 BANK RAKYAT INDONESIA PERSERO TBK PT 3,460,444 0.46INDONESIAIDR 68,489,227 CIPUTRA DEVELOPMENT TBK PT 3,376,835 0.45INDONESIAIDR 10,076,800 PAKUWON JATI TBK PT 302,803 0.04INDONESIAIDR 4,236,334 PERUSAHAAN GAS NEGARA PT 528,975 0.07INDONESIAIDR 8,201,000 SALIM IVOMAS PRATAMA TBK PT 241,651 0.03INDONESIAIDR 880,200 SEMEN GRESIK PERSERO TBK PT 485,338 0.06INDONESIAIDR 7,982,095 TELEKOMUNIKASI INDONESIA PERSERO TBK PT 1,625,448 0.21INDONESIAIDR 382,600 UNITED TRACTORS TBK PT 767,952 0.10INDONESIAUSD 11,705 LINE CORP ADR 458,844 0.06JAPANMYR 935,200 AMMB HOLDINGS BHD 801,924 0.11MALAYSIAMYR 517,600 AXIATA GROUP BHD 519,614 0.07MALAYSIAMYR 438,702 BERJAYA SPORTS TOTO BHD 202,771 0.03MALAYSIAMYR 16,200 BRITISH AMERICAN TOBACCO MALAYSIA BHD 114,722 0.02MALAYSIAMYR 1,642,200 CIMB GROUP HOLDINGS BHD 2,091,647 0.26MALAYSIAMYR 656,786 EASTERN & ORIENTAL BHD 212,912 0.03MALAYSIAMYR 364,000 GENTING BERHAD 656,226 0.09MALAYSIAMYR 691,400 GENTING MALAYSIA BHD 754,822 0.10MALAYSIAMYR 638,000 IOI CORPORATION BHD 603,120 0.08MALAYSIAMYR 57,533 IOI PROPERTIES GROUP SDN BHD 21,057 -MALAYSIAMYR 847,000 MALAYAN BANKING BHD 1,764,362 0.23MALAYSIAMYR 378,500 MALAYSIA AIRPORTS HOLDINGS BHD 740,155 0.10MALAYSIAMYR 877,457 PARKSON HOLDINGS BHD 77,994 0.01MALAYSIAMYR 333,300 PUBLIC BANK BHD 1,751,055 0.23MALAYSIAMYR 724,462 SIME DARBY BERHAD 386,368 0.05MALAYSIAMYR 645,962 SIME DARBY PLANTATION BHD 724,130 0.10MALAYSIAMYR 624,462 SIME DARBY PROPERTY BHD 164,559 0.02MALAYSIA
Country
Statement of Investment Portfolio and Other Net Assets AUGUST 31, 2018
Notional or number of units / shares
ownedMarket Value
EUR% of Net
Assets
INTERFUND EQUITY GLOBAL EMERGING MARKETS
(continued)
Similar issues with same maturities have not been combined when issuance date differs.The accompanying notes are an integral part of these financial statements.General note: differences in sums, if any, are due to rounding.
Currency
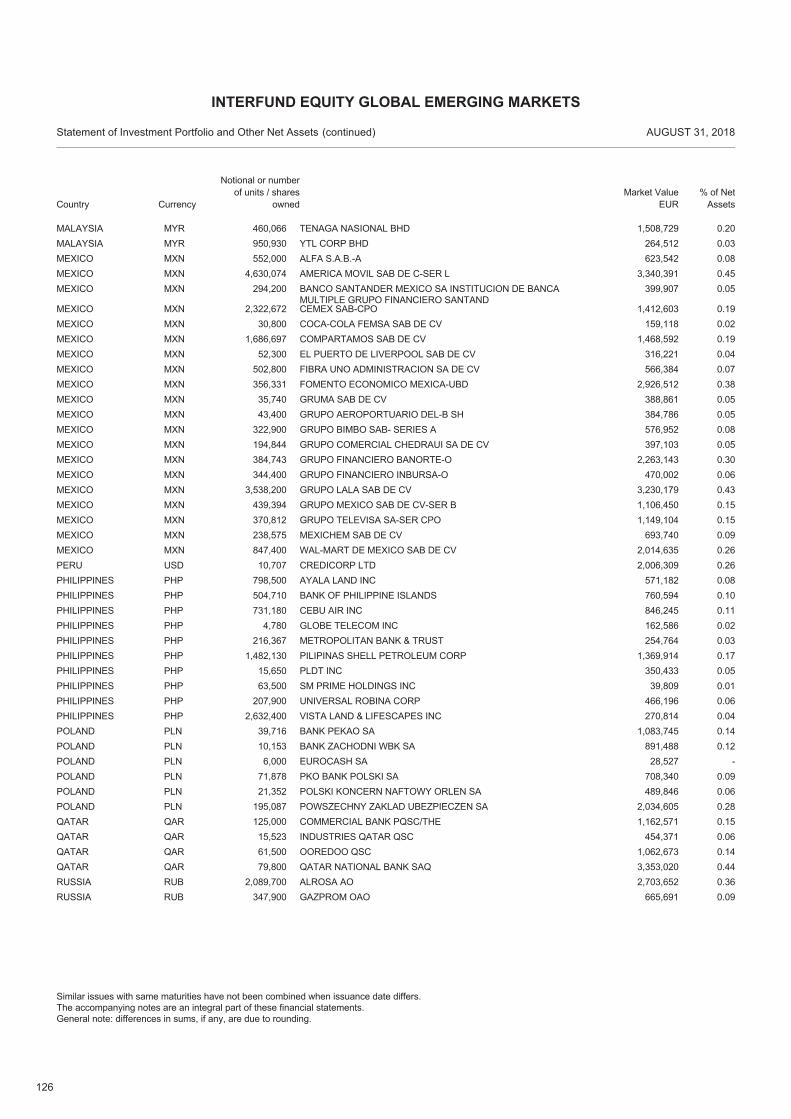
126
MYR 460,066 TENAGA NASIONAL BHD 1,508,729 0.20MALAYSIAMYR 950,930 YTL CORP BHD 264,512 0.03MALAYSIAMXN 552,000 ALFA S.A.B.-A 623,542 0.08MEXICOMXN 4,630,074 AMERICA MOVIL SAB DE C-SER L 3,340,391 0.45MEXICOMXN 294,200 BANCO SANTANDER MEXICO SA INSTITUCION DE BANCA
MULTIPLE GRUPO FINANCIERO SANTAND399,907 0.05MEXICO
MXN 2,322,672 CEMEX SAB-CPO 1,412,603 0.19MEXICOMXN 30,800 COCA-COLA FEMSA SAB DE CV 159,118 0.02MEXICOMXN 1,686,697 COMPARTAMOS SAB DE CV 1,468,592 0.19MEXICOMXN 52,300 EL PUERTO DE LIVERPOOL SAB DE CV 316,221 0.04MEXICOMXN 502,800 FIBRA UNO ADMINISTRACION SA DE CV 566,384 0.07MEXICOMXN 356,331 FOMENTO ECONOMICO MEXICA-UBD 2,926,512 0.38MEXICOMXN 35,740 GRUMA SAB DE CV 388,861 0.05MEXICOMXN 43,400 GRUPO AEROPORTUARIO DEL-B SH 384,786 0.05MEXICOMXN 322,900 GRUPO BIMBO SAB- SERIES A 576,952 0.08MEXICOMXN 194,844 GRUPO COMERCIAL CHEDRAUI SA DE CV 397,103 0.05MEXICOMXN 384,743 GRUPO FINANCIERO BANORTE-O 2,263,143 0.30MEXICOMXN 344,400 GRUPO FINANCIERO INBURSA-O 470,002 0.06MEXICOMXN 3,538,200 GRUPO LALA SAB DE CV 3,230,179 0.43MEXICOMXN 439,394 GRUPO MEXICO SAB DE CV-SER B 1,106,450 0.15MEXICOMXN 370,812 GRUPO TELEVISA SA-SER CPO 1,149,104 0.15MEXICOMXN 238,575 MEXICHEM SAB DE CV 693,740 0.09MEXICOMXN 847,400 WAL-MART DE MEXICO SAB DE CV 2,014,635 0.26MEXICOUSD 10,707 CREDICORP LTD 2,006,309 0.26PERUPHP 798,500 AYALA LAND INC 571,182 0.08PHILIPPINESPHP 504,710 BANK OF PHILIPPINE ISLANDS 760,594 0.10PHILIPPINESPHP 731,180 CEBU AIR INC 846,245 0.11PHILIPPINESPHP 4,780 GLOBE TELECOM INC 162,586 0.02PHILIPPINESPHP 216,367 METROPOLITAN BANK & TRUST 254,764 0.03PHILIPPINESPHP 1,482,130 PILIPINAS SHELL PETROLEUM CORP 1,369,914 0.17PHILIPPINESPHP 15,650 PLDT INC 350,433 0.05PHILIPPINESPHP 63,500 SM PRIME HOLDINGS INC 39,809 0.01PHILIPPINESPHP 207,900 UNIVERSAL ROBINA CORP 466,196 0.06PHILIPPINESPHP 2,632,400 VISTA LAND & LIFESCAPES INC 270,814 0.04PHILIPPINESPLN 39,716 BANK PEKAO SA 1,083,745 0.14POLANDPLN 10,153 BANK ZACHODNI WBK SA 891,488 0.12POLANDPLN 6,000 EUROCASH SA 28,527 -POLANDPLN 71,878 PKO BANK POLSKI SA 708,340 0.09POLANDPLN 21,352 POLSKI KONCERN NAFTOWY ORLEN SA 489,846 0.06POLANDPLN 195,087 POWSZECHNY ZAKLAD UBEZPIECZEN SA 2,034,605 0.28POLANDQAR 125,000 COMMERCIAL BANK PQSC/THE 1,162,571 0.15QATARQAR 15,523 INDUSTRIES QATAR QSC 454,371 0.06QATARQAR 61,500 OOREDOO QSC 1,062,673 0.14QATARQAR 79,800 QATAR NATIONAL BANK SAQ 3,353,020 0.44QATARRUB 2,089,700 ALROSA AO 2,703,652 0.36RUSSIARUB 347,900 GAZPROM OAO 665,691 0.09RUSSIA
Country
Statement of Investment Portfolio and Other Net Assets AUGUST 31, 2018
Notional or number of units / shares
ownedMarket Value
EUR% of Net
Assets
INTERFUND EQUITY GLOBAL EMERGING MARKETS
(continued)
Similar issues with same maturities have not been combined when issuance date differs.The accompanying notes are an integral part of these financial statements.General note: differences in sums, if any, are due to rounding.
Currency
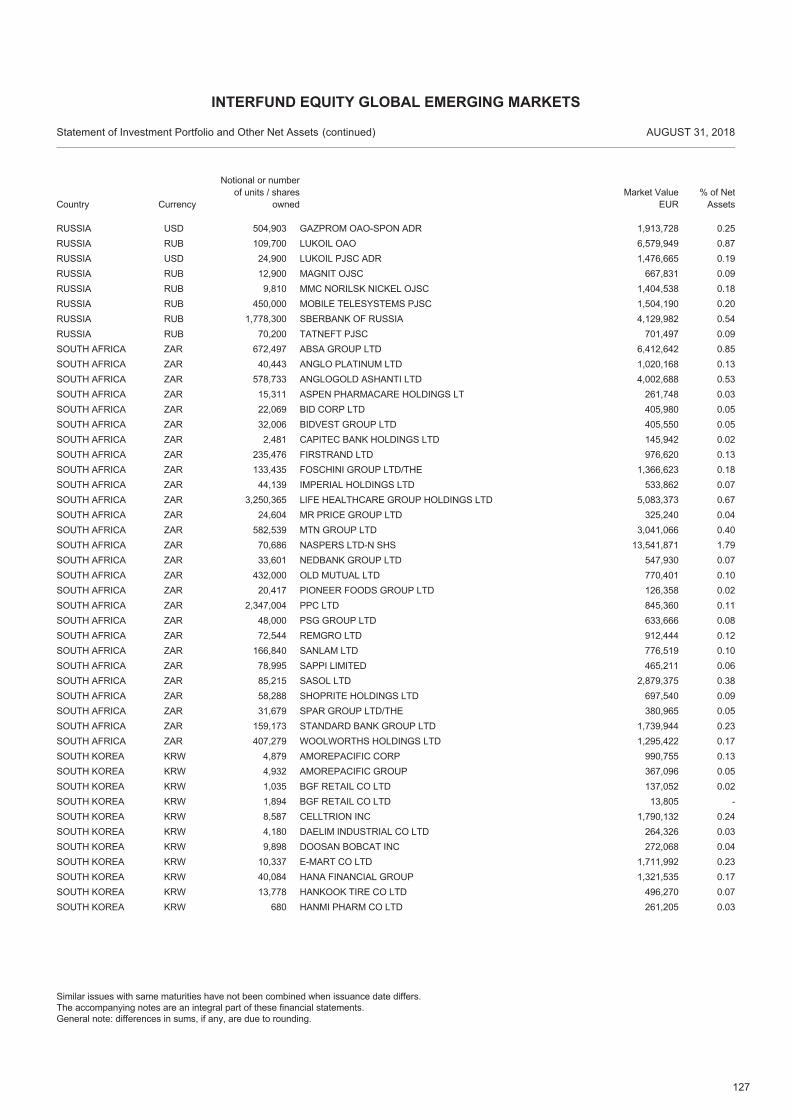
127
USD 504,903 GAZPROM OAO-SPON ADR 1,913,728 0.25RUSSIARUB 109,700 LUKOIL OAO 6,579,949 0.87RUSSIAUSD 24,900 LUKOIL PJSC ADR 1,476,665 0.19RUSSIARUB 12,900 MAGNIT OJSC 667,831 0.09RUSSIARUB 9,810 MMC NORILSK NICKEL OJSC 1,404,538 0.18RUSSIARUB 450,000 MOBILE TELESYSTEMS PJSC 1,504,190 0.20RUSSIARUB 1,778,300 SBERBANK OF RUSSIA 4,129,982 0.54RUSSIARUB 70,200 TATNEFT PJSC 701,497 0.09RUSSIAZAR 672,497 ABSA GROUP LTD 6,412,642 0.85SOUTH AFRICAZAR 40,443 ANGLO PLATINUM LTD 1,020,168 0.13SOUTH AFRICAZAR 578,733 ANGLOGOLD ASHANTI LTD 4,002,688 0.53SOUTH AFRICAZAR 15,311 ASPEN PHARMACARE HOLDINGS LT 261,748 0.03SOUTH AFRICAZAR 22,069 BID CORP LTD 405,980 0.05SOUTH AFRICAZAR 32,006 BIDVEST GROUP LTD 405,550 0.05SOUTH AFRICAZAR 2,481 CAPITEC BANK HOLDINGS LTD 145,942 0.02SOUTH AFRICAZAR 235,476 FIRSTRAND LTD 976,620 0.13SOUTH AFRICAZAR 133,435 FOSCHINI GROUP LTD/THE 1,366,623 0.18SOUTH AFRICAZAR 44,139 IMPERIAL HOLDINGS LTD 533,862 0.07SOUTH AFRICAZAR 3,250,365 LIFE HEALTHCARE GROUP HOLDINGS LTD 5,083,373 0.67SOUTH AFRICAZAR 24,604 MR PRICE GROUP LTD 325,240 0.04SOUTH AFRICAZAR 582,539 MTN GROUP LTD 3,041,066 0.40SOUTH AFRICAZAR 70,686 NASPERS LTD-N SHS 13,541,871 1.79SOUTH AFRICAZAR 33,601 NEDBANK GROUP LTD 547,930 0.07SOUTH AFRICAZAR 432,000 OLD MUTUAL LTD 770,401 0.10SOUTH AFRICAZAR 20,417 PIONEER FOODS GROUP LTD 126,358 0.02SOUTH AFRICAZAR 2,347,004 PPC LTD 845,360 0.11SOUTH AFRICAZAR 48,000 PSG GROUP LTD 633,666 0.08SOUTH AFRICAZAR 72,544 REMGRO LTD 912,444 0.12SOUTH AFRICAZAR 166,840 SANLAM LTD 776,519 0.10SOUTH AFRICAZAR 78,995 SAPPI LIMITED 465,211 0.06SOUTH AFRICAZAR 85,215 SASOL LTD 2,879,375 0.38SOUTH AFRICAZAR 58,288 SHOPRITE HOLDINGS LTD 697,540 0.09SOUTH AFRICAZAR 31,679 SPAR GROUP LTD/THE 380,965 0.05SOUTH AFRICAZAR 159,173 STANDARD BANK GROUP LTD 1,739,944 0.23SOUTH AFRICAZAR 407,279 WOOLWORTHS HOLDINGS LTD 1,295,422 0.17SOUTH AFRICAKRW 4,879 AMOREPACIFIC CORP 990,755 0.13SOUTH KOREAKRW 4,932 AMOREPACIFIC GROUP 367,096 0.05SOUTH KOREAKRW 1,035 BGF RETAIL CO LTD 137,052 0.02SOUTH KOREAKRW 1,894 BGF RETAIL CO LTD 13,805 -SOUTH KOREAKRW 8,587 CELLTRION INC 1,790,132 0.24SOUTH KOREAKRW 4,180 DAELIM INDUSTRIAL CO LTD 264,326 0.03SOUTH KOREAKRW 9,898 DOOSAN BOBCAT INC 272,068 0.04SOUTH KOREAKRW 10,337 E-MART CO LTD 1,711,992 0.23SOUTH KOREAKRW 40,084 HANA FINANCIAL GROUP 1,321,535 0.17SOUTH KOREAKRW 13,778 HANKOOK TIRE CO LTD 496,270 0.07SOUTH KOREAKRW 680 HANMI PHARM CO LTD 261,205 0.03SOUTH KOREA
Country
Statement of Investment Portfolio and Other Net Assets AUGUST 31, 2018
Notional or number of units / shares
ownedMarket Value
EUR% of Net
Assets
INTERFUND EQUITY GLOBAL EMERGING MARKETS
(continued)
Similar issues with same maturities have not been combined when issuance date differs.The accompanying notes are an integral part of these financial statements.General note: differences in sums, if any, are due to rounding.
Currency
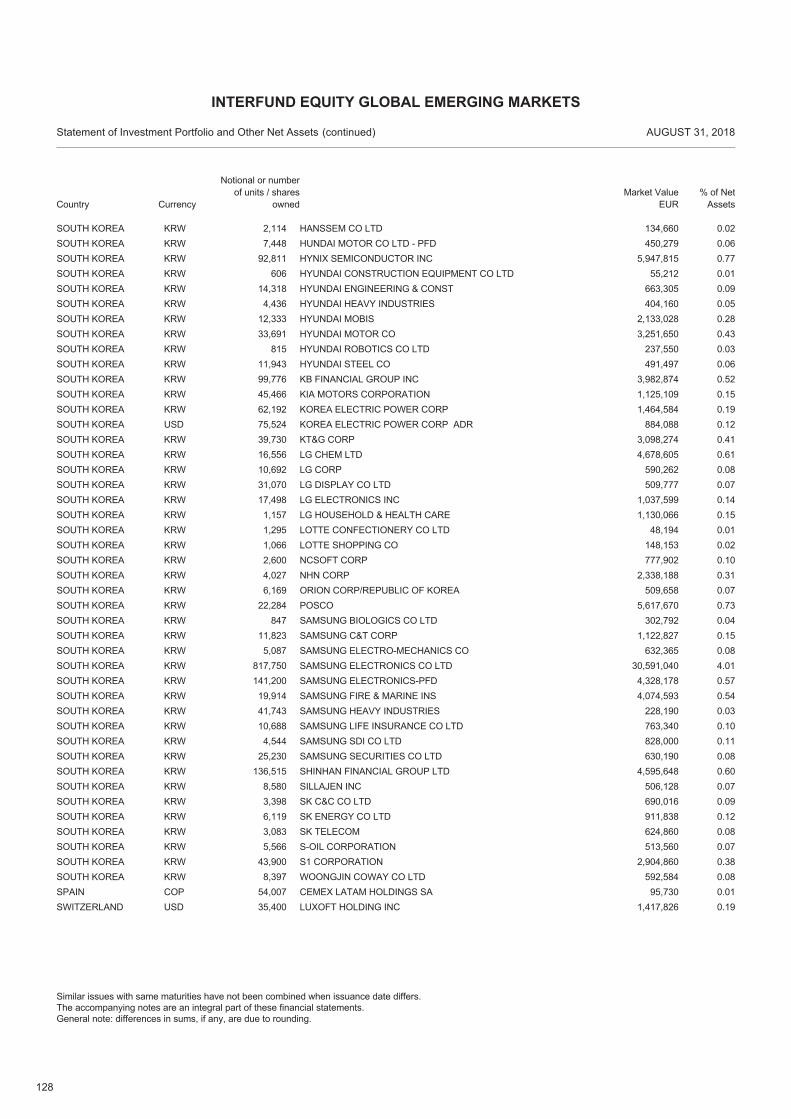
128
KRW 2,114 HANSSEM CO LTD 134,660 0.02SOUTH KOREAKRW 7,448 HUNDAI MOTOR CO LTD - PFD 450,279 0.06SOUTH KOREAKRW 92,811 HYNIX SEMICONDUCTOR INC 5,947,815 0.77SOUTH KOREAKRW 606 HYUNDAI CONSTRUCTION EQUIPMENT CO LTD 55,212 0.01SOUTH KOREAKRW 14,318 HYUNDAI ENGINEERING & CONST 663,305 0.09SOUTH KOREAKRW 4,436 HYUNDAI HEAVY INDUSTRIES 404,160 0.05SOUTH KOREAKRW 12,333 HYUNDAI MOBIS 2,133,028 0.28SOUTH KOREAKRW 33,691 HYUNDAI MOTOR CO 3,251,650 0.43SOUTH KOREAKRW 815 HYUNDAI ROBOTICS CO LTD 237,550 0.03SOUTH KOREAKRW 11,943 HYUNDAI STEEL CO 491,497 0.06SOUTH KOREAKRW 99,776 KB FINANCIAL GROUP INC 3,982,874 0.52SOUTH KOREAKRW 45,466 KIA MOTORS CORPORATION 1,125,109 0.15SOUTH KOREAKRW 62,192 KOREA ELECTRIC POWER CORP 1,464,584 0.19SOUTH KOREAUSD 75,524 KOREA ELECTRIC POWER CORP ADR 884,088 0.12SOUTH KOREAKRW 39,730 KT&G CORP 3,098,274 0.41SOUTH KOREAKRW 16,556 LG CHEM LTD 4,678,605 0.61SOUTH KOREAKRW 10,692 LG CORP 590,262 0.08SOUTH KOREAKRW 31,070 LG DISPLAY CO LTD 509,777 0.07SOUTH KOREAKRW 17,498 LG ELECTRONICS INC 1,037,599 0.14SOUTH KOREAKRW 1,157 LG HOUSEHOLD & HEALTH CARE 1,130,066 0.15SOUTH KOREAKRW 1,295 LOTTE CONFECTIONERY CO LTD 48,194 0.01SOUTH KOREAKRW 1,066 LOTTE SHOPPING CO 148,153 0.02SOUTH KOREAKRW 2,600 NCSOFT CORP 777,902 0.10SOUTH KOREAKRW 4,027 NHN CORP 2,338,188 0.31SOUTH KOREAKRW 6,169 ORION CORP/REPUBLIC OF KOREA 509,658 0.07SOUTH KOREAKRW 22,284 POSCO 5,617,670 0.73SOUTH KOREAKRW 847 SAMSUNG BIOLOGICS CO LTD 302,792 0.04SOUTH KOREAKRW 11,823 SAMSUNG C&T CORP 1,122,827 0.15SOUTH KOREAKRW 5,087 SAMSUNG ELECTRO-MECHANICS CO 632,365 0.08SOUTH KOREAKRW 817,750 SAMSUNG ELECTRONICS CO LTD 30,591,040 4.01SOUTH KOREAKRW 141,200 SAMSUNG ELECTRONICS-PFD 4,328,178 0.57SOUTH KOREAKRW 19,914 SAMSUNG FIRE & MARINE INS 4,074,593 0.54SOUTH KOREAKRW 41,743 SAMSUNG HEAVY INDUSTRIES 228,190 0.03SOUTH KOREAKRW 10,688 SAMSUNG LIFE INSURANCE CO LTD 763,340 0.10SOUTH KOREAKRW 4,544 SAMSUNG SDI CO LTD 828,000 0.11SOUTH KOREAKRW 25,230 SAMSUNG SECURITIES CO LTD 630,190 0.08SOUTH KOREAKRW 136,515 SHINHAN FINANCIAL GROUP LTD 4,595,648 0.60SOUTH KOREAKRW 8,580 SILLAJEN INC 506,128 0.07SOUTH KOREAKRW 3,398 SK C&C CO LTD 690,016 0.09SOUTH KOREAKRW 6,119 SK ENERGY CO LTD 911,838 0.12SOUTH KOREAKRW 3,083 SK TELECOM 624,860 0.08SOUTH KOREAKRW 5,566 S-OIL CORPORATION 513,560 0.07SOUTH KOREAKRW 43,900 S1 CORPORATION 2,904,860 0.38SOUTH KOREAKRW 8,397 WOONGJIN COWAY CO LTD 592,584 0.08SOUTH KOREACOP 54,007 CEMEX LATAM HOLDINGS SA 95,730 0.01SPAINUSD 35,400 LUXOFT HOLDING INC 1,417,826 0.19SWITZERLAND
Country
Statement of Investment Portfolio and Other Net Assets AUGUST 31, 2018
Notional or number of units / shares
ownedMarket Value
EUR% of Net
Assets
INTERFUND EQUITY GLOBAL EMERGING MARKETS
(continued)
Similar issues with same maturities have not been combined when issuance date differs.The accompanying notes are an integral part of these financial statements.General note: differences in sums, if any, are due to rounding.
Currency
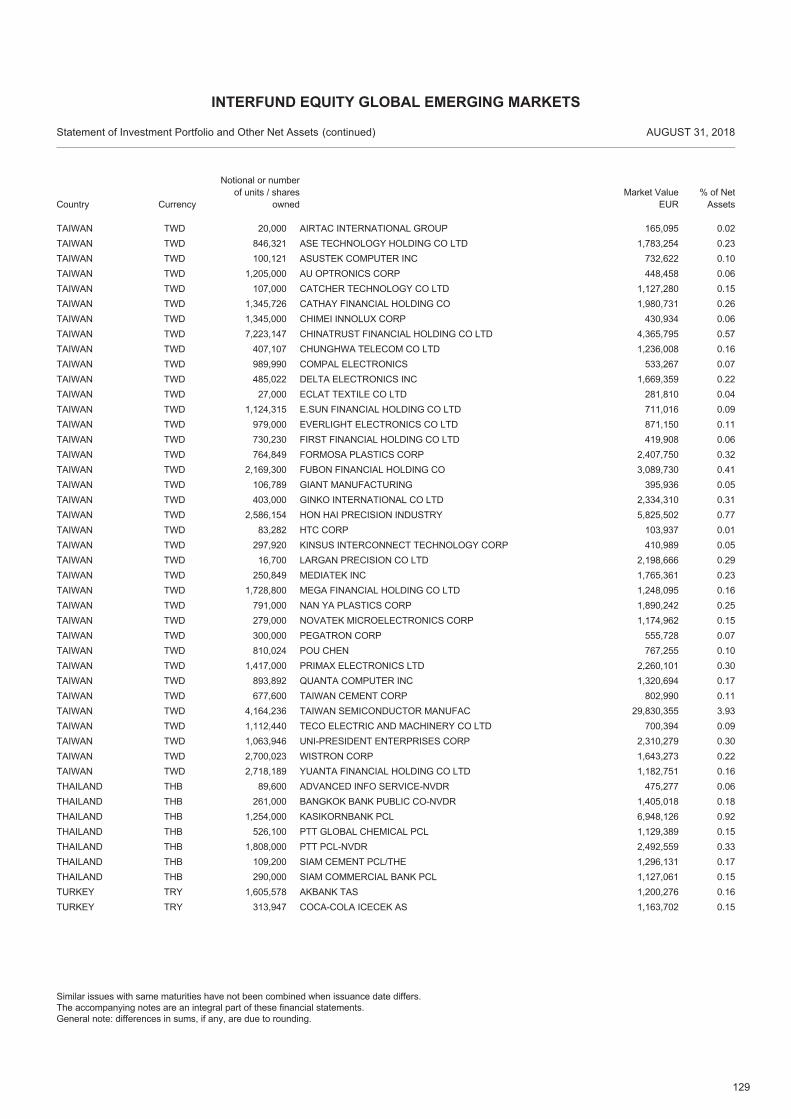
129
TWD 20,000 AIRTAC INTERNATIONAL GROUP 165,095 0.02TAIWANTWD 846,321 ASE TECHNOLOGY HOLDING CO LTD 1,783,254 0.23TAIWANTWD 100,121 ASUSTEK COMPUTER INC 732,622 0.10TAIWANTWD 1,205,000 AU OPTRONICS CORP 448,458 0.06TAIWANTWD 107,000 CATCHER TECHNOLOGY CO LTD 1,127,280 0.15TAIWANTWD 1,345,726 CATHAY FINANCIAL HOLDING CO 1,980,731 0.26TAIWANTWD 1,345,000 CHIMEI INNOLUX CORP 430,934 0.06TAIWANTWD 7,223,147 CHINATRUST FINANCIAL HOLDING CO LTD 4,365,795 0.57TAIWANTWD 407,107 CHUNGHWA TELECOM CO LTD 1,236,008 0.16TAIWANTWD 989,990 COMPAL ELECTRONICS 533,267 0.07TAIWANTWD 485,022 DELTA ELECTRONICS INC 1,669,359 0.22TAIWANTWD 27,000 ECLAT TEXTILE CO LTD 281,810 0.04TAIWANTWD 1,124,315 E.SUN FINANCIAL HOLDING CO LTD 711,016 0.09TAIWANTWD 979,000 EVERLIGHT ELECTRONICS CO LTD 871,150 0.11TAIWANTWD 730,230 FIRST FINANCIAL HOLDING CO LTD 419,908 0.06TAIWANTWD 764,849 FORMOSA PLASTICS CORP 2,407,750 0.32TAIWANTWD 2,169,300 FUBON FINANCIAL HOLDING CO 3,089,730 0.41TAIWANTWD 106,789 GIANT MANUFACTURING 395,936 0.05TAIWANTWD 403,000 GINKO INTERNATIONAL CO LTD 2,334,310 0.31TAIWANTWD 2,586,154 HON HAI PRECISION INDUSTRY 5,825,502 0.77TAIWANTWD 83,282 HTC CORP 103,937 0.01TAIWANTWD 297,920 KINSUS INTERCONNECT TECHNOLOGY CORP 410,989 0.05TAIWANTWD 16,700 LARGAN PRECISION CO LTD 2,198,666 0.29TAIWANTWD 250,849 MEDIATEK INC 1,765,361 0.23TAIWANTWD 1,728,800 MEGA FINANCIAL HOLDING CO LTD 1,248,095 0.16TAIWANTWD 791,000 NAN YA PLASTICS CORP 1,890,242 0.25TAIWANTWD 279,000 NOVATEK MICROELECTRONICS CORP 1,174,962 0.15TAIWANTWD 300,000 PEGATRON CORP 555,728 0.07TAIWANTWD 810,024 POU CHEN 767,255 0.10TAIWANTWD 1,417,000 PRIMAX ELECTRONICS LTD 2,260,101 0.30TAIWANTWD 893,892 QUANTA COMPUTER INC 1,320,694 0.17TAIWANTWD 677,600 TAIWAN CEMENT CORP 802,990 0.11TAIWANTWD 4,164,236 TAIWAN SEMICONDUCTOR MANUFAC 29,830,355 3.93TAIWANTWD 1,112,440 TECO ELECTRIC AND MACHINERY CO LTD 700,394 0.09TAIWANTWD 1,063,946 UNI-PRESIDENT ENTERPRISES CORP 2,310,279 0.30TAIWANTWD 2,700,023 WISTRON CORP 1,643,273 0.22TAIWANTWD 2,718,189 YUANTA FINANCIAL HOLDING CO LTD 1,182,751 0.16TAIWANTHB 89,600 ADVANCED INFO SERVICE-NVDR 475,277 0.06THAILANDTHB 261,000 BANGKOK BANK PUBLIC CO-NVDR 1,405,018 0.18THAILANDTHB 1,254,000 KASIKORNBANK PCL 6,948,126 0.92THAILANDTHB 526,100 PTT GLOBAL CHEMICAL PCL 1,129,389 0.15THAILANDTHB 1,808,000 PTT PCL-NVDR 2,492,559 0.33THAILANDTHB 109,200 SIAM CEMENT PCL/THE 1,296,131 0.17THAILANDTHB 290,000 SIAM COMMERCIAL BANK PCL 1,127,061 0.15THAILANDTRY 1,605,578 AKBANK TAS 1,200,276 0.16TURKEYTRY 313,947 COCA-COLA ICECEK AS 1,163,702 0.15TURKEY
Country
Statement of Investment Portfolio and Other Net Assets AUGUST 31, 2018
Notional or number of units / shares
ownedMarket Value
EUR% of Net
Assets
INTERFUND EQUITY GLOBAL EMERGING MARKETS
(continued)
Similar issues with same maturities have not been combined when issuance date differs.The accompanying notes are an integral part of these financial statements.General note: differences in sums, if any, are due to rounding.
Currency
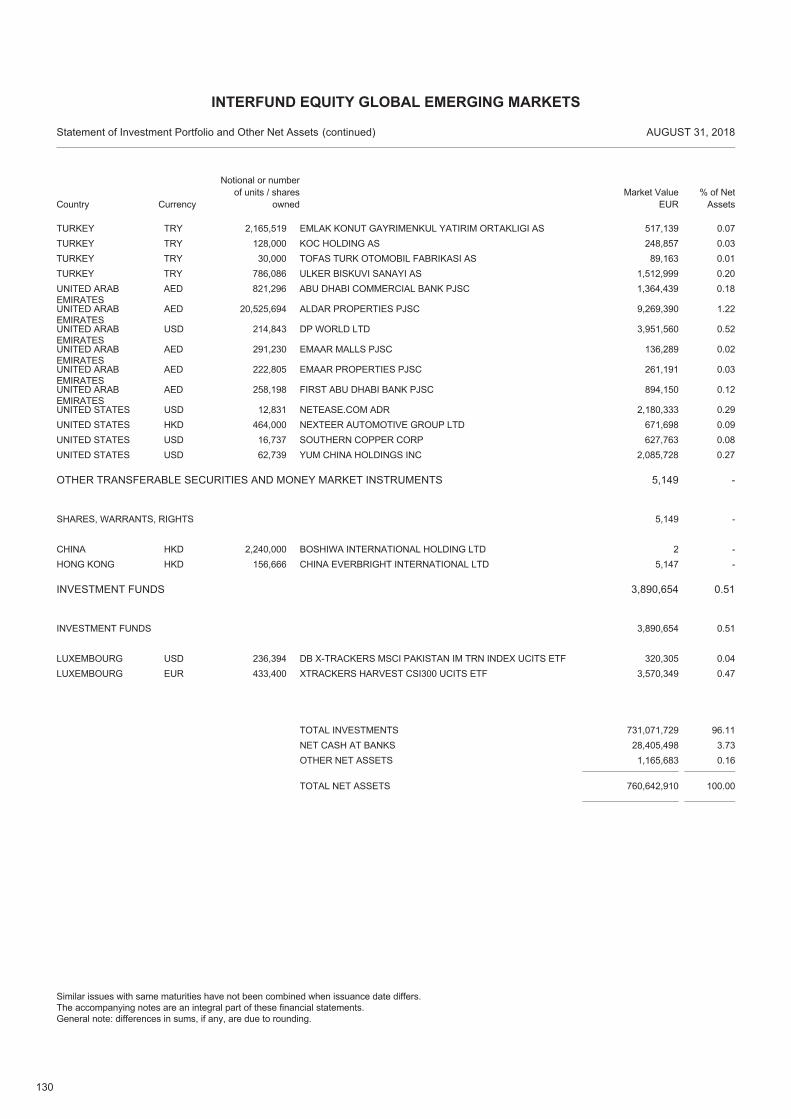
130
TRY 2,165,519 EMLAK KONUT GAYRIMENKUL YATIRIM ORTAKLIGI AS 517,139 0.07TURKEYTRY 128,000 KOC HOLDING AS 248,857 0.03TURKEYTRY 30,000 TOFAS TURK OTOMOBIL FABRIKASI AS 89,163 0.01TURKEYTRY 786,086 ULKER BISKUVI SANAYI AS 1,512,999 0.20TURKEYAED 821,296 ABU DHABI COMMERCIAL BANK PJSC 1,364,439 0.18UNITED ARAB
EMIRATESAED 20,525,694 ALDAR PROPERTIES PJSC 9,269,390 1.22UNITED ARAB
EMIRATESUSD 214,843 DP WORLD LTD 3,951,560 0.52UNITED ARAB
EMIRATESAED 291,230 EMAAR MALLS PJSC 136,289 0.02UNITED ARAB
EMIRATESAED 222,805 EMAAR PROPERTIES PJSC 261,191 0.03UNITED ARAB
EMIRATESAED 258,198 FIRST ABU DHABI BANK PJSC 894,150 0.12UNITED ARAB
EMIRATESUSD 12,831 NETEASE.COM ADR 2,180,333 0.29UNITED STATESHKD 464,000 NEXTEER AUTOMOTIVE GROUP LTD 671,698 0.09UNITED STATESUSD 16,737 SOUTHERN COPPER CORP 627,763 0.08UNITED STATESUSD 62,739 YUM CHINA HOLDINGS INC 2,085,728 0.27UNITED STATES
OTHER TRANSFERABLE SECURITIES AND MONEY MARKET INSTRUMENTS 5,149 -
HKD 2,240,000 BOSHIWA INTERNATIONAL HOLDING LTD 2 -CHINA
SHARES, WARRANTS, RIGHTS -5,149
HKD 156,666 CHINA EVERBRIGHT INTERNATIONAL LTD 5,147 -HONG KONG
INVESTMENT FUNDS 3,890,654 0.51
USD 236,394 DB X-TRACKERS MSCI PAKISTAN IM TRN INDEX UCITS ETF 320,305 0.04LUXEMBOURG
INVESTMENT FUNDS 0.513,890,654
EUR 433,400 XTRACKERS HARVEST CSI300 UCITS ETF 3,570,349 0.47LUXEMBOURG
TOTAL NET ASSETS 760,642,910 100.00
TOTAL INVESTMENTS 731,071,729 96.11NET CASH AT BANKS 28,405,498 3.73OTHER NET ASSETS 1,165,683 0.16
Country
Statement of Investment Portfolio and Other Net Assets AUGUST 31, 2018
Notional or number of units / shares
ownedMarket Value
EUR% of Net
Assets
INTERFUND EQUITY GLOBAL EMERGING MARKETS
(continued)
Similar issues with same maturities have not been combined when issuance date differs.The accompanying notes are an integral part of these financial statements.General note: differences in sums, if any, are due to rounding.
Currency
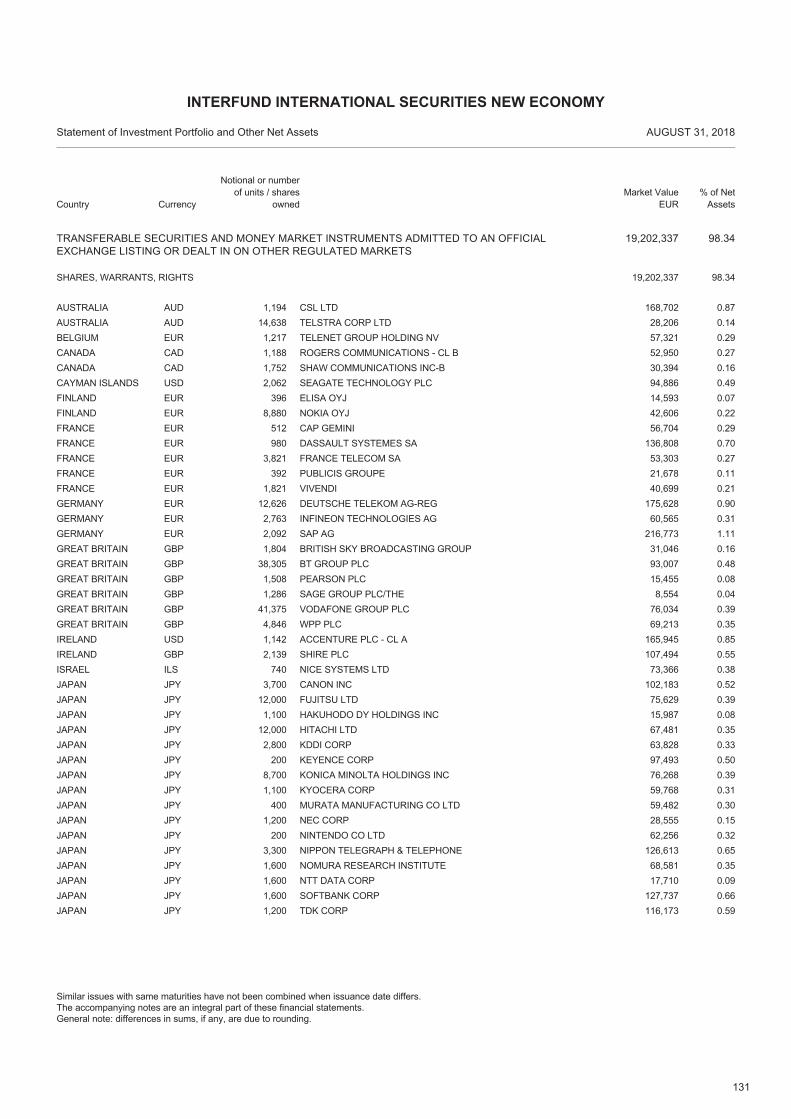
131
TRANSFERABLE SECURITIES AND MONEY MARKET INSTRUMENTS ADMITTED TO AN OFFICIALEXCHANGE LISTING OR DEALT IN ON OTHER REGULATED MARKETS
19,202,337 98.34
AUD 1,194 CSL LTD 168,702 0.87AUSTRALIA
SHARES, WARRANTS, RIGHTS 98.3419,202,337
AUD 14,638 TELSTRA CORP LTD 28,206 0.14AUSTRALIAEUR 1,217 TELENET GROUP HOLDING NV 57,321 0.29BELGIUMCAD 1,188 ROGERS COMMUNICATIONS - CL B 52,950 0.27CANADACAD 1,752 SHAW COMMUNICATIONS INC-B 30,394 0.16CANADAUSD 2,062 SEAGATE TECHNOLOGY PLC 94,886 0.49CAYMAN ISLANDSEUR 396 ELISA OYJ 14,593 0.07FINLANDEUR 8,880 NOKIA OYJ 42,606 0.22FINLANDEUR 512 CAP GEMINI 56,704 0.29FRANCEEUR 980 DASSAULT SYSTEMES SA 136,808 0.70FRANCEEUR 3,821 FRANCE TELECOM SA 53,303 0.27FRANCEEUR 392 PUBLICIS GROUPE 21,678 0.11FRANCEEUR 1,821 VIVENDI 40,699 0.21FRANCEEUR 12,626 DEUTSCHE TELEKOM AG-REG 175,628 0.90GERMANYEUR 2,763 INFINEON TECHNOLOGIES AG 60,565 0.31GERMANYEUR 2,092 SAP AG 216,773 1.11GERMANYGBP 1,804 BRITISH SKY BROADCASTING GROUP 31,046 0.16GREAT BRITAINGBP 38,305 BT GROUP PLC 93,007 0.48GREAT BRITAINGBP 1,508 PEARSON PLC 15,455 0.08GREAT BRITAINGBP 1,286 SAGE GROUP PLC/THE 8,554 0.04GREAT BRITAINGBP 41,375 VODAFONE GROUP PLC 76,034 0.39GREAT BRITAINGBP 4,846 WPP PLC 69,213 0.35GREAT BRITAINUSD 1,142 ACCENTURE PLC - CL A 165,945 0.85IRELANDGBP 2,139 SHIRE PLC 107,494 0.55IRELANDILS 740 NICE SYSTEMS LTD 73,366 0.38ISRAELJPY 3,700 CANON INC 102,183 0.52JAPANJPY 12,000 FUJITSU LTD 75,629 0.39JAPANJPY 1,100 HAKUHODO DY HOLDINGS INC 15,987 0.08JAPANJPY 12,000 HITACHI LTD 67,481 0.35JAPANJPY 2,800 KDDI CORP 63,828 0.33JAPANJPY 200 KEYENCE CORP 97,493 0.50JAPANJPY 8,700 KONICA MINOLTA HOLDINGS INC 76,268 0.39JAPANJPY 1,100 KYOCERA CORP 59,768 0.31JAPANJPY 400 MURATA MANUFACTURING CO LTD 59,482 0.30JAPANJPY 1,200 NEC CORP 28,555 0.15JAPANJPY 200 NINTENDO CO LTD 62,256 0.32JAPANJPY 3,300 NIPPON TELEGRAPH & TELEPHONE 126,613 0.65JAPANJPY 1,600 NOMURA RESEARCH INSTITUTE 68,581 0.35JAPANJPY 1,600 NTT DATA CORP 17,710 0.09JAPANJPY 1,600 SOFTBANK CORP 127,737 0.66JAPANJPY 1,200 TDK CORP 116,173 0.59JAPAN
Country
Statement of Investment Portfolio and Other Net Assets AUGUST 31, 2018
Notional or number of units / shares
ownedMarket Value
EUR% of Net
Assets
INTERFUND INTERNATIONAL SECURITIES NEW ECONOMY
Similar issues with same maturities have not been combined when issuance date differs.The accompanying notes are an integral part of these financial statements.General note: differences in sums, if any, are due to rounding.
Currency
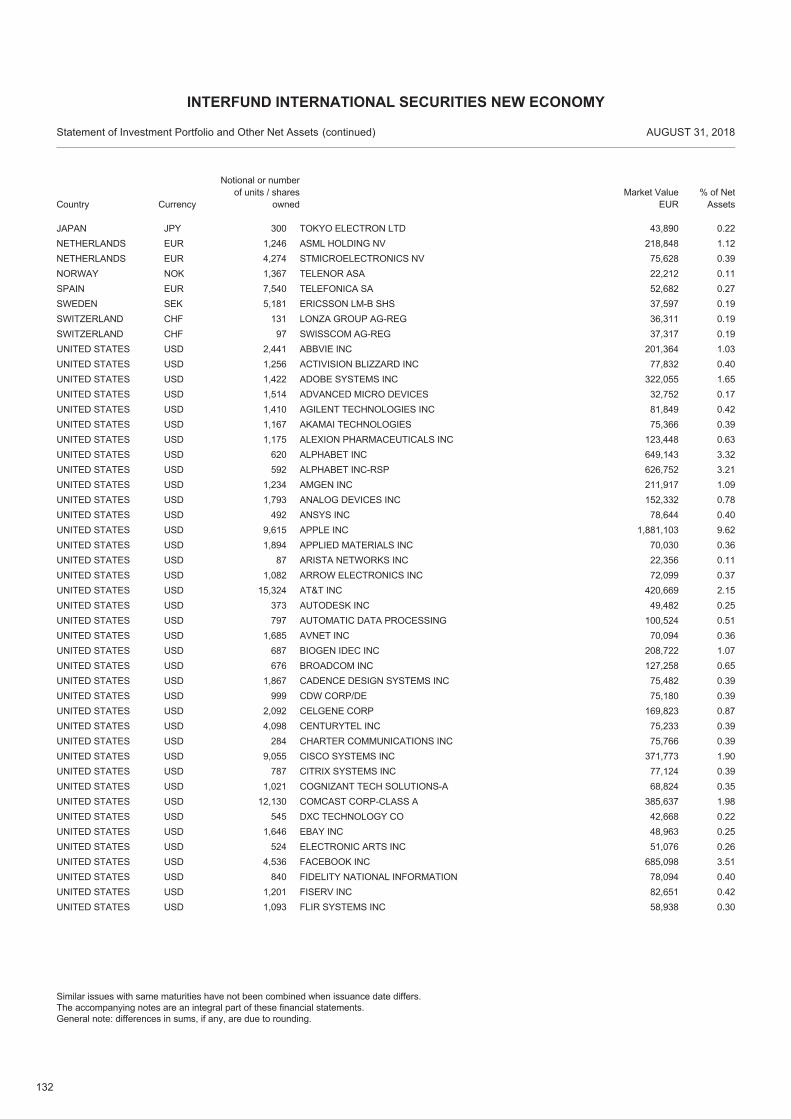
132
JPY 300 TOKYO ELECTRON LTD 43,890 0.22JAPANEUR 1,246 ASML HOLDING NV 218,848 1.12NETHERLANDSEUR 4,274 STMICROELECTRONICS NV 75,628 0.39NETHERLANDSNOK 1,367 TELENOR ASA 22,212 0.11NORWAYEUR 7,540 TELEFONICA SA 52,682 0.27SPAINSEK 5,181 ERICSSON LM-B SHS 37,597 0.19SWEDENCHF 131 LONZA GROUP AG-REG 36,311 0.19SWITZERLANDCHF 97 SWISSCOM AG-REG 37,317 0.19SWITZERLANDUSD 2,441 ABBVIE INC 201,364 1.03UNITED STATESUSD 1,256 ACTIVISION BLIZZARD INC 77,832 0.40UNITED STATESUSD 1,422 ADOBE SYSTEMS INC 322,055 1.65UNITED STATESUSD 1,514 ADVANCED MICRO DEVICES 32,752 0.17UNITED STATESUSD 1,410 AGILENT TECHNOLOGIES INC 81,849 0.42UNITED STATESUSD 1,167 AKAMAI TECHNOLOGIES 75,366 0.39UNITED STATESUSD 1,175 ALEXION PHARMACEUTICALS INC 123,448 0.63UNITED STATESUSD 620 ALPHABET INC 649,143 3.32UNITED STATESUSD 592 ALPHABET INC-RSP 626,752 3.21UNITED STATESUSD 1,234 AMGEN INC 211,917 1.09UNITED STATESUSD 1,793 ANALOG DEVICES INC 152,332 0.78UNITED STATESUSD 492 ANSYS INC 78,644 0.40UNITED STATESUSD 9,615 APPLE INC 1,881,103 9.62UNITED STATESUSD 1,894 APPLIED MATERIALS INC 70,030 0.36UNITED STATESUSD 87 ARISTA NETWORKS INC 22,356 0.11UNITED STATESUSD 1,082 ARROW ELECTRONICS INC 72,099 0.37UNITED STATESUSD 15,324 AT&T INC 420,669 2.15UNITED STATESUSD 373 AUTODESK INC 49,482 0.25UNITED STATESUSD 797 AUTOMATIC DATA PROCESSING 100,524 0.51UNITED STATESUSD 1,685 AVNET INC 70,094 0.36UNITED STATESUSD 687 BIOGEN IDEC INC 208,722 1.07UNITED STATESUSD 676 BROADCOM INC 127,258 0.65UNITED STATESUSD 1,867 CADENCE DESIGN SYSTEMS INC 75,482 0.39UNITED STATESUSD 999 CDW CORP/DE 75,180 0.39UNITED STATESUSD 2,092 CELGENE CORP 169,823 0.87UNITED STATESUSD 4,098 CENTURYTEL INC 75,233 0.39UNITED STATESUSD 284 CHARTER COMMUNICATIONS INC 75,766 0.39UNITED STATESUSD 9,055 CISCO SYSTEMS INC 371,773 1.90UNITED STATESUSD 787 CITRIX SYSTEMS INC 77,124 0.39UNITED STATESUSD 1,021 COGNIZANT TECH SOLUTIONS-A 68,824 0.35UNITED STATESUSD 12,130 COMCAST CORP-CLASS A 385,637 1.98UNITED STATESUSD 545 DXC TECHNOLOGY CO 42,668 0.22UNITED STATESUSD 1,646 EBAY INC 48,963 0.25UNITED STATESUSD 524 ELECTRONIC ARTS INC 51,076 0.26UNITED STATESUSD 4,536 FACEBOOK INC 685,098 3.51UNITED STATESUSD 840 FIDELITY NATIONAL INFORMATION 78,094 0.40UNITED STATESUSD 1,201 FISERV INC 82,651 0.42UNITED STATESUSD 1,093 FLIR SYSTEMS INC 58,938 0.30UNITED STATES
Country
Statement of Investment Portfolio and Other Net Assets AUGUST 31, 2018
Notional or number of units / shares
ownedMarket Value
EUR% of Net
Assets
INTERFUND INTERNATIONAL SECURITIES NEW ECONOMY
(continued)
Similar issues with same maturities have not been combined when issuance date differs.The accompanying notes are an integral part of these financial statements.General note: differences in sums, if any, are due to rounding.
Currency
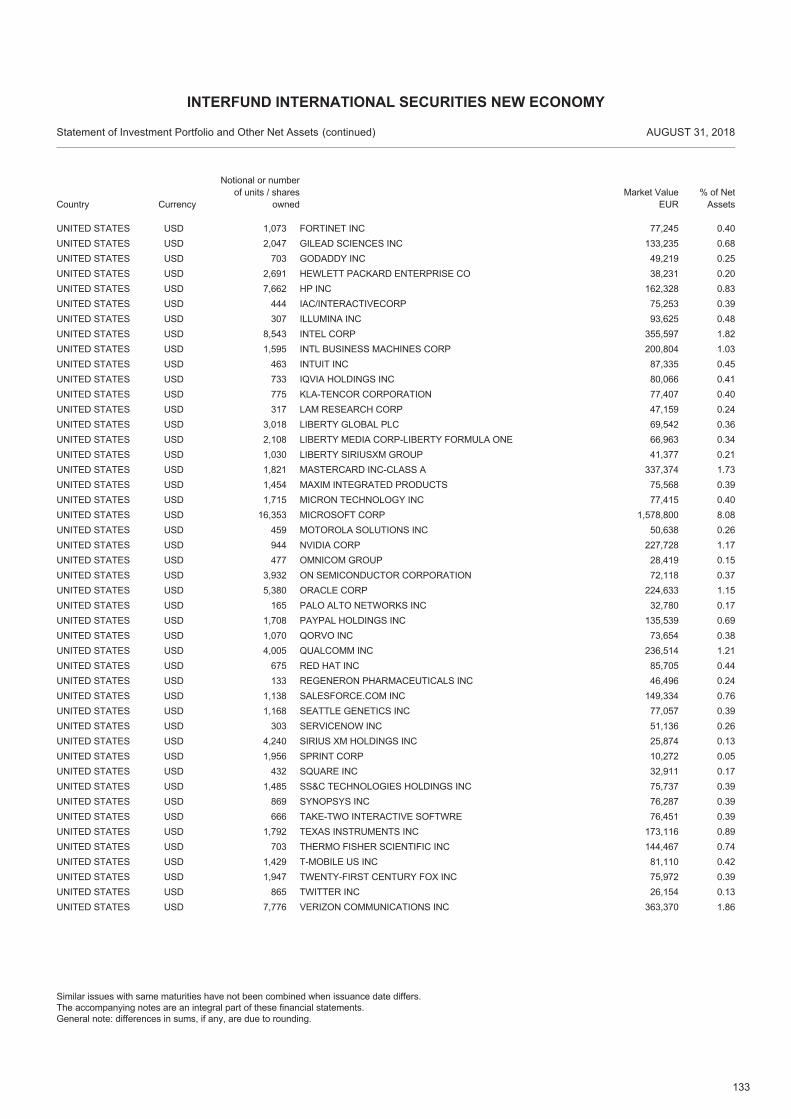
133
USD 1,073 FORTINET INC 77,245 0.40UNITED STATESUSD 2,047 GILEAD SCIENCES INC 133,235 0.68UNITED STATESUSD 703 GODADDY INC 49,219 0.25UNITED STATESUSD 2,691 HEWLETT PACKARD ENTERPRISE CO 38,231 0.20UNITED STATESUSD 7,662 HP INC 162,328 0.83UNITED STATESUSD 444 IAC/INTERACTIVECORP 75,253 0.39UNITED STATESUSD 307 ILLUMINA INC 93,625 0.48UNITED STATESUSD 8,543 INTEL CORP 355,597 1.82UNITED STATESUSD 1,595 INTL BUSINESS MACHINES CORP 200,804 1.03UNITED STATESUSD 463 INTUIT INC 87,335 0.45UNITED STATESUSD 733 IQVIA HOLDINGS INC 80,066 0.41UNITED STATESUSD 775 KLA-TENCOR CORPORATION 77,407 0.40UNITED STATESUSD 317 LAM RESEARCH CORP 47,159 0.24UNITED STATESUSD 3,018 LIBERTY GLOBAL PLC 69,542 0.36UNITED STATESUSD 2,108 LIBERTY MEDIA CORP-LIBERTY FORMULA ONE 66,963 0.34UNITED STATESUSD 1,030 LIBERTY SIRIUSXM GROUP 41,377 0.21UNITED STATESUSD 1,821 MASTERCARD INC-CLASS A 337,374 1.73UNITED STATESUSD 1,454 MAXIM INTEGRATED PRODUCTS 75,568 0.39UNITED STATESUSD 1,715 MICRON TECHNOLOGY INC 77,415 0.40UNITED STATESUSD 16,353 MICROSOFT CORP 1,578,800 8.08UNITED STATESUSD 459 MOTOROLA SOLUTIONS INC 50,638 0.26UNITED STATESUSD 944 NVIDIA CORP 227,728 1.17UNITED STATESUSD 477 OMNICOM GROUP 28,419 0.15UNITED STATESUSD 3,932 ON SEMICONDUCTOR CORPORATION 72,118 0.37UNITED STATESUSD 5,380 ORACLE CORP 224,633 1.15UNITED STATESUSD 165 PALO ALTO NETWORKS INC 32,780 0.17UNITED STATESUSD 1,708 PAYPAL HOLDINGS INC 135,539 0.69UNITED STATESUSD 1,070 QORVO INC 73,654 0.38UNITED STATESUSD 4,005 QUALCOMM INC 236,514 1.21UNITED STATESUSD 675 RED HAT INC 85,705 0.44UNITED STATESUSD 133 REGENERON PHARMACEUTICALS INC 46,496 0.24UNITED STATESUSD 1,138 SALESFORCE.COM INC 149,334 0.76UNITED STATESUSD 1,168 SEATTLE GENETICS INC 77,057 0.39UNITED STATESUSD 303 SERVICENOW INC 51,136 0.26UNITED STATESUSD 4,240 SIRIUS XM HOLDINGS INC 25,874 0.13UNITED STATESUSD 1,956 SPRINT CORP 10,272 0.05UNITED STATESUSD 432 SQUARE INC 32,911 0.17UNITED STATESUSD 1,485 SS&C TECHNOLOGIES HOLDINGS INC 75,737 0.39UNITED STATESUSD 869 SYNOPSYS INC 76,287 0.39UNITED STATESUSD 666 TAKE-TWO INTERACTIVE SOFTWRE 76,451 0.39UNITED STATESUSD 1,792 TEXAS INSTRUMENTS INC 173,116 0.89UNITED STATESUSD 703 THERMO FISHER SCIENTIFIC INC 144,467 0.74UNITED STATESUSD 1,429 T-MOBILE US INC 81,110 0.42UNITED STATESUSD 1,947 TWENTY-FIRST CENTURY FOX INC 75,972 0.39UNITED STATESUSD 865 TWITTER INC 26,154 0.13UNITED STATESUSD 7,776 VERIZON COMMUNICATIONS INC 363,370 1.86UNITED STATES
Country
Statement of Investment Portfolio and Other Net Assets AUGUST 31, 2018
Notional or number of units / shares
ownedMarket Value
EUR% of Net
Assets
INTERFUND INTERNATIONAL SECURITIES NEW ECONOMY
(continued)
Similar issues with same maturities have not been combined when issuance date differs.The accompanying notes are an integral part of these financial statements.General note: differences in sums, if any, are due to rounding.
Currency
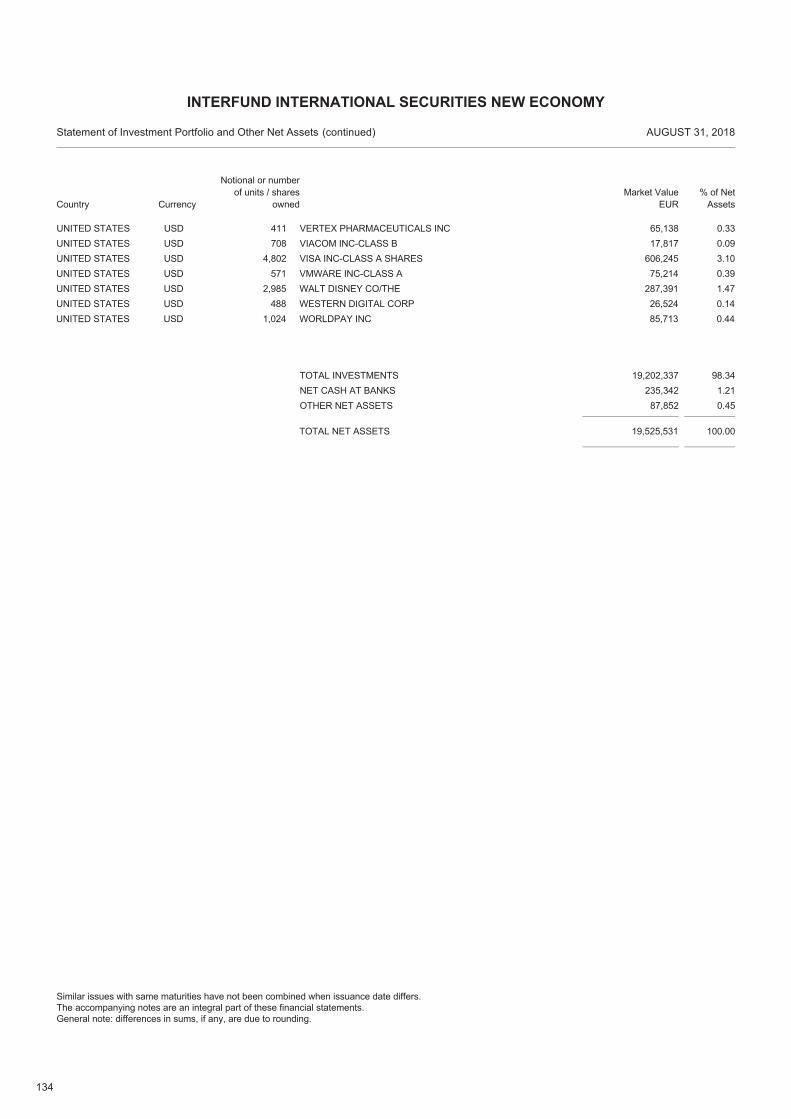
134
USD 411 VERTEX PHARMACEUTICALS INC 65,138 0.33UNITED STATESUSD 708 VIACOM INC-CLASS B 17,817 0.09UNITED STATESUSD 4,802 VISA INC-CLASS A SHARES 606,245 3.10UNITED STATESUSD 571 VMWARE INC-CLASS A 75,214 0.39UNITED STATESUSD 2,985 WALT DISNEY CO/THE 287,391 1.47UNITED STATESUSD 488 WESTERN DIGITAL CORP 26,524 0.14UNITED STATESUSD 1,024 WORLDPAY INC 85,713 0.44UNITED STATES
TOTAL NET ASSETS 19,525,531 100.00
TOTAL INVESTMENTS 19,202,337 98.34NET CASH AT BANKS 235,342 1.21OTHER NET ASSETS 87,852 0.45
Country
Statement of Investment Portfolio and Other Net Assets AUGUST 31, 2018
Notional or number of units / shares
ownedMarket Value
EUR% of Net
Assets
INTERFUND INTERNATIONAL SECURITIES NEW ECONOMY
(continued)
Similar issues with same maturities have not been combined when issuance date differs.The accompanying notes are an integral part of these financial statements.General note: differences in sums, if any, are due to rounding.
Currency
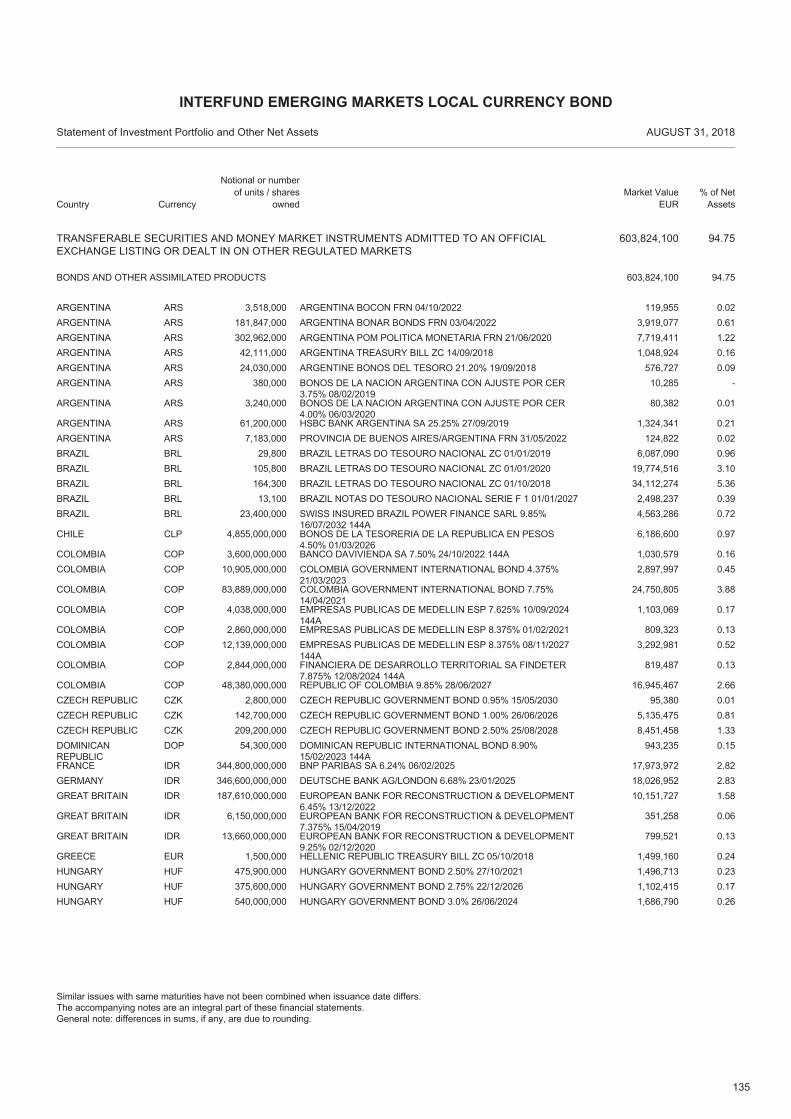
135
TRANSFERABLE SECURITIES AND MONEY MARKET INSTRUMENTS ADMITTED TO AN OFFICIALEXCHANGE LISTING OR DEALT IN ON OTHER REGULATED MARKETS
603,824,100 94.75
ARS 3,518,000 ARGENTINA BOCON FRN 04/10/2022 119,955 0.02ARGENTINA
BONDS AND OTHER ASSIMILATED PRODUCTS 94.75603,824,100
ARS 181,847,000 ARGENTINA BONAR BONDS FRN 03/04/2022 3,919,077 0.61ARGENTINAARS 302,962,000 ARGENTINA POM POLITICA MONETARIA FRN 21/06/2020 7,719,411 1.22ARGENTINAARS 42,111,000 ARGENTINA TREASURY BILL ZC 14/09/2018 1,048,924 0.16ARGENTINAARS 24,030,000 ARGENTINE BONOS DEL TESORO 21.20% 19/09/2018 576,727 0.09ARGENTINAARS 380,000 BONOS DE LA NACION ARGENTINA CON AJUSTE POR CER
3.75% 08/02/201910,285 -ARGENTINA
ARS 3,240,000 BONOS DE LA NACION ARGENTINA CON AJUSTE POR CER4.00% 06/03/2020
80,382 0.01ARGENTINA
ARS 61,200,000 HSBC BANK ARGENTINA SA 25.25% 27/09/2019 1,324,341 0.21ARGENTINAARS 7,183,000 PROVINCIA DE BUENOS AIRES/ARGENTINA FRN 31/05/2022 124,822 0.02ARGENTINABRL 29,800 BRAZIL LETRAS DO TESOURO NACIONAL ZC 01/01/2019 6,087,090 0.96BRAZILBRL 105,800 BRAZIL LETRAS DO TESOURO NACIONAL ZC 01/01/2020 19,774,516 3.10BRAZILBRL 164,300 BRAZIL LETRAS DO TESOURO NACIONAL ZC 01/10/2018 34,112,274 5.36BRAZILBRL 13,100 BRAZIL NOTAS DO TESOURO NACIONAL SERIE F 1 01/01/2027 2,498,237 0.39BRAZILBRL 23,400,000 SWISS INSURED BRAZIL POWER FINANCE SARL 9.85%
16/07/2032 144A4,563,286 0.72BRAZIL
CLP 4,855,000,000 BONOS DE LA TESORERIA DE LA REPUBLICA EN PESOS4.50% 01/03/2026
6,186,600 0.97CHILE
COP 3,600,000,000 BANCO DAVIVIENDA SA 7.50% 24/10/2022 144A 1,030,579 0.16COLOMBIACOP 10,905,000,000 COLOMBIA GOVERNMENT INTERNATIONAL BOND 4.375%
21/03/20232,897,997 0.45COLOMBIA
COP 83,889,000,000 COLOMBIA GOVERNMENT INTERNATIONAL BOND 7.75%14/04/2021
24,750,805 3.88COLOMBIA
COP 4,038,000,000 EMPRESAS PUBLICAS DE MEDELLIN ESP 7.625% 10/09/2024144A
1,103,069 0.17COLOMBIA
COP 2,860,000,000 EMPRESAS PUBLICAS DE MEDELLIN ESP 8.375% 01/02/2021 809,323 0.13COLOMBIACOP 12,139,000,000 EMPRESAS PUBLICAS DE MEDELLIN ESP 8.375% 08/11/2027
144A3,292,981 0.52COLOMBIA
COP 2,844,000,000 FINANCIERA DE DESARROLLO TERRITORIAL SA FINDETER7.875% 12/08/2024 144A
819,487 0.13COLOMBIA
COP 48,380,000,000 REPUBLIC OF COLOMBIA 9.85% 28/06/2027 16,945,467 2.66COLOMBIACZK 2,800,000 CZECH REPUBLIC GOVERNMENT BOND 0.95% 15/05/2030 95,380 0.01CZECH REPUBLICCZK 142,700,000 CZECH REPUBLIC GOVERNMENT BOND 1.00% 26/06/2026 5,135,475 0.81CZECH REPUBLICCZK 209,200,000 CZECH REPUBLIC GOVERNMENT BOND 2.50% 25/08/2028 8,451,458 1.33CZECH REPUBLICDOP 54,300,000 DOMINICAN REPUBLIC INTERNATIONAL BOND 8.90%
15/02/2023 144A943,235 0.15DOMINICAN
REPUBLICIDR 344,800,000,000 BNP PARIBAS SA 6.24% 06/02/2025 17,973,972 2.82FRANCEIDR 346,600,000,000 DEUTSCHE BANK AG/LONDON 6.68% 23/01/2025 18,026,952 2.83GERMANYIDR 187,610,000,000 EUROPEAN BANK FOR RECONSTRUCTION & DEVELOPMENT
6.45% 13/12/202210,151,727 1.58GREAT BRITAIN
IDR 6,150,000,000 EUROPEAN BANK FOR RECONSTRUCTION & DEVELOPMENT7.375% 15/04/2019
351,258 0.06GREAT BRITAIN
IDR 13,660,000,000 EUROPEAN BANK FOR RECONSTRUCTION & DEVELOPMENT9.25% 02/12/2020
799,521 0.13GREAT BRITAIN
EUR 1,500,000 HELLENIC REPUBLIC TREASURY BILL ZC 05/10/2018 1,499,160 0.24GREECEHUF 475,900,000 HUNGARY GOVERNMENT BOND 2.50% 27/10/2021 1,496,713 0.23HUNGARYHUF 375,600,000 HUNGARY GOVERNMENT BOND 2.75% 22/12/2026 1,102,415 0.17HUNGARYHUF 540,000,000 HUNGARY GOVERNMENT BOND 3.0% 26/06/2024 1,686,790 0.26HUNGARY
Country
Statement of Investment Portfolio and Other Net Assets AUGUST 31, 2018
Notional or number of units / shares
ownedMarket Value
EUR% of Net
Assets
INTERFUND EMERGING MARKETS LOCAL CURRENCY BOND
Similar issues with same maturities have not been combined when issuance date differs.The accompanying notes are an integral part of these financial statements.General note: differences in sums, if any, are due to rounding.
Currency
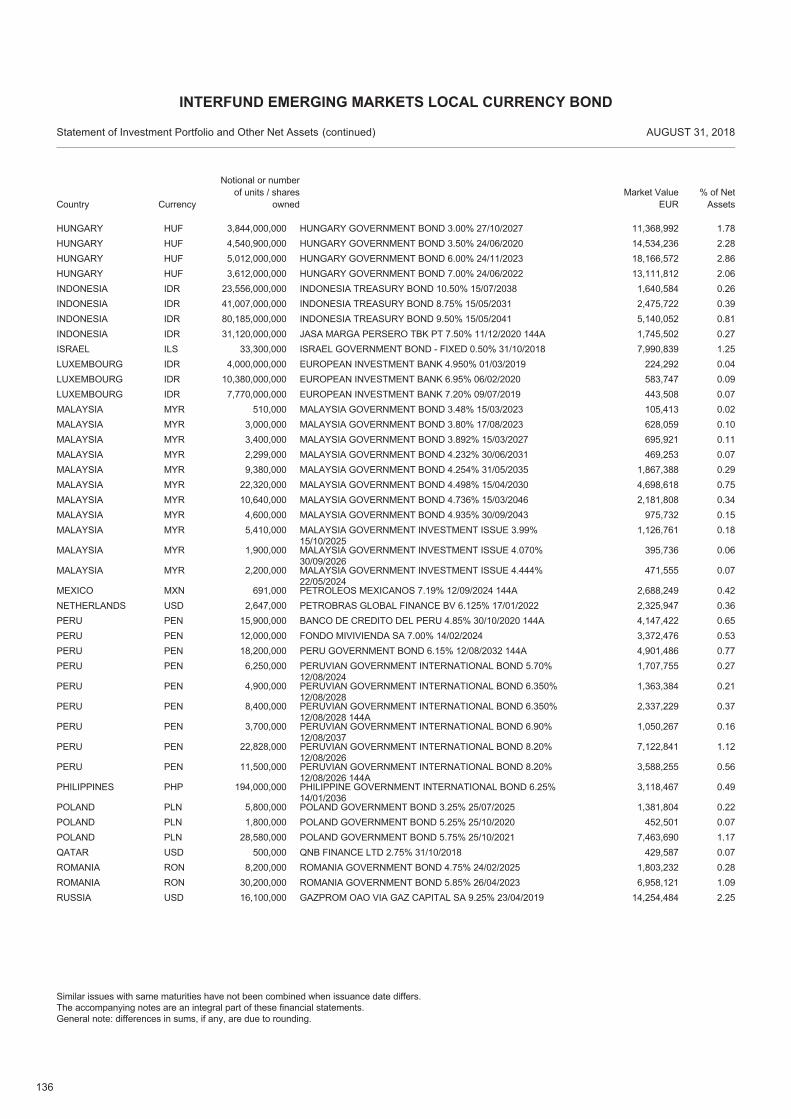
136
HUF 3,844,000,000 HUNGARY GOVERNMENT BOND 3.00% 27/10/2027 11,368,992 1.78HUNGARYHUF 4,540,900,000 HUNGARY GOVERNMENT BOND 3.50% 24/06/2020 14,534,236 2.28HUNGARYHUF 5,012,000,000 HUNGARY GOVERNMENT BOND 6.00% 24/11/2023 18,166,572 2.86HUNGARYHUF 3,612,000,000 HUNGARY GOVERNMENT BOND 7.00% 24/06/2022 13,111,812 2.06HUNGARYIDR 23,556,000,000 INDONESIA TREASURY BOND 10.50% 15/07/2038 1,640,584 0.26INDONESIAIDR 41,007,000,000 INDONESIA TREASURY BOND 8.75% 15/05/2031 2,475,722 0.39INDONESIAIDR 80,185,000,000 INDONESIA TREASURY BOND 9.50% 15/05/2041 5,140,052 0.81INDONESIAIDR 31,120,000,000 JASA MARGA PERSERO TBK PT 7.50% 11/12/2020 144A 1,745,502 0.27INDONESIAILS 33,300,000 ISRAEL GOVERNMENT BOND - FIXED 0.50% 31/10/2018 7,990,839 1.25ISRAELIDR 4,000,000,000 EUROPEAN INVESTMENT BANK 4.950% 01/03/2019 224,292 0.04LUXEMBOURGIDR 10,380,000,000 EUROPEAN INVESTMENT BANK 6.95% 06/02/2020 583,747 0.09LUXEMBOURGIDR 7,770,000,000 EUROPEAN INVESTMENT BANK 7.20% 09/07/2019 443,508 0.07LUXEMBOURGMYR 510,000 MALAYSIA GOVERNMENT BOND 3.48% 15/03/2023 105,413 0.02MALAYSIAMYR 3,000,000 MALAYSIA GOVERNMENT BOND 3.80% 17/08/2023 628,059 0.10MALAYSIAMYR 3,400,000 MALAYSIA GOVERNMENT BOND 3.892% 15/03/2027 695,921 0.11MALAYSIAMYR 2,299,000 MALAYSIA GOVERNMENT BOND 4.232% 30/06/2031 469,253 0.07MALAYSIAMYR 9,380,000 MALAYSIA GOVERNMENT BOND 4.254% 31/05/2035 1,867,388 0.29MALAYSIAMYR 22,320,000 MALAYSIA GOVERNMENT BOND 4.498% 15/04/2030 4,698,618 0.75MALAYSIAMYR 10,640,000 MALAYSIA GOVERNMENT BOND 4.736% 15/03/2046 2,181,808 0.34MALAYSIAMYR 4,600,000 MALAYSIA GOVERNMENT BOND 4.935% 30/09/2043 975,732 0.15MALAYSIAMYR 5,410,000 MALAYSIA GOVERNMENT INVESTMENT ISSUE 3.99%
15/10/20251,126,761 0.18MALAYSIA
MYR 1,900,000 MALAYSIA GOVERNMENT INVESTMENT ISSUE 4.070%30/09/2026
395,736 0.06MALAYSIA
MYR 2,200,000 MALAYSIA GOVERNMENT INVESTMENT ISSUE 4.444%22/05/2024
471,555 0.07MALAYSIA
MXN 691,000 PETROLEOS MEXICANOS 7.19% 12/09/2024 144A 2,688,249 0.42MEXICOUSD 2,647,000 PETROBRAS GLOBAL FINANCE BV 6.125% 17/01/2022 2,325,947 0.36NETHERLANDSPEN 15,900,000 BANCO DE CREDITO DEL PERU 4.85% 30/10/2020 144A 4,147,422 0.65PERUPEN 12,000,000 FONDO MIVIVIENDA SA 7.00% 14/02/2024 3,372,476 0.53PERUPEN 18,200,000 PERU GOVERNMENT BOND 6.15% 12/08/2032 144A 4,901,486 0.77PERUPEN 6,250,000 PERUVIAN GOVERNMENT INTERNATIONAL BOND 5.70%
12/08/20241,707,755 0.27PERU
PEN 4,900,000 PERUVIAN GOVERNMENT INTERNATIONAL BOND 6.350%12/08/2028
1,363,384 0.21PERU
PEN 8,400,000 PERUVIAN GOVERNMENT INTERNATIONAL BOND 6.350%12/08/2028 144A
2,337,229 0.37PERU
PEN 3,700,000 PERUVIAN GOVERNMENT INTERNATIONAL BOND 6.90%12/08/2037
1,050,267 0.16PERU
PEN 22,828,000 PERUVIAN GOVERNMENT INTERNATIONAL BOND 8.20%12/08/2026
7,122,841 1.12PERU
PEN 11,500,000 PERUVIAN GOVERNMENT INTERNATIONAL BOND 8.20%12/08/2026 144A
3,588,255 0.56PERU
PHP 194,000,000 PHILIPPINE GOVERNMENT INTERNATIONAL BOND 6.25%14/01/2036
3,118,467 0.49PHILIPPINES
PLN 5,800,000 POLAND GOVERNMENT BOND 3.25% 25/07/2025 1,381,804 0.22POLANDPLN 1,800,000 POLAND GOVERNMENT BOND 5.25% 25/10/2020 452,501 0.07POLANDPLN 28,580,000 POLAND GOVERNMENT BOND 5.75% 25/10/2021 7,463,690 1.17POLANDUSD 500,000 QNB FINANCE LTD 2.75% 31/10/2018 429,587 0.07QATARRON 8,200,000 ROMANIA GOVERNMENT BOND 4.75% 24/02/2025 1,803,232 0.28ROMANIARON 30,200,000 ROMANIA GOVERNMENT BOND 5.85% 26/04/2023 6,958,121 1.09ROMANIAUSD 16,100,000 GAZPROM OAO VIA GAZ CAPITAL SA 9.25% 23/04/2019 14,254,484 2.25RUSSIA
Country
Statement of Investment Portfolio and Other Net Assets AUGUST 31, 2018
Notional or number of units / shares
ownedMarket Value
EUR% of Net
Assets
INTERFUND EMERGING MARKETS LOCAL CURRENCY BOND
(continued)
Similar issues with same maturities have not been combined when issuance date differs.The accompanying notes are an integral part of these financial statements.General note: differences in sums, if any, are due to rounding.
Currency
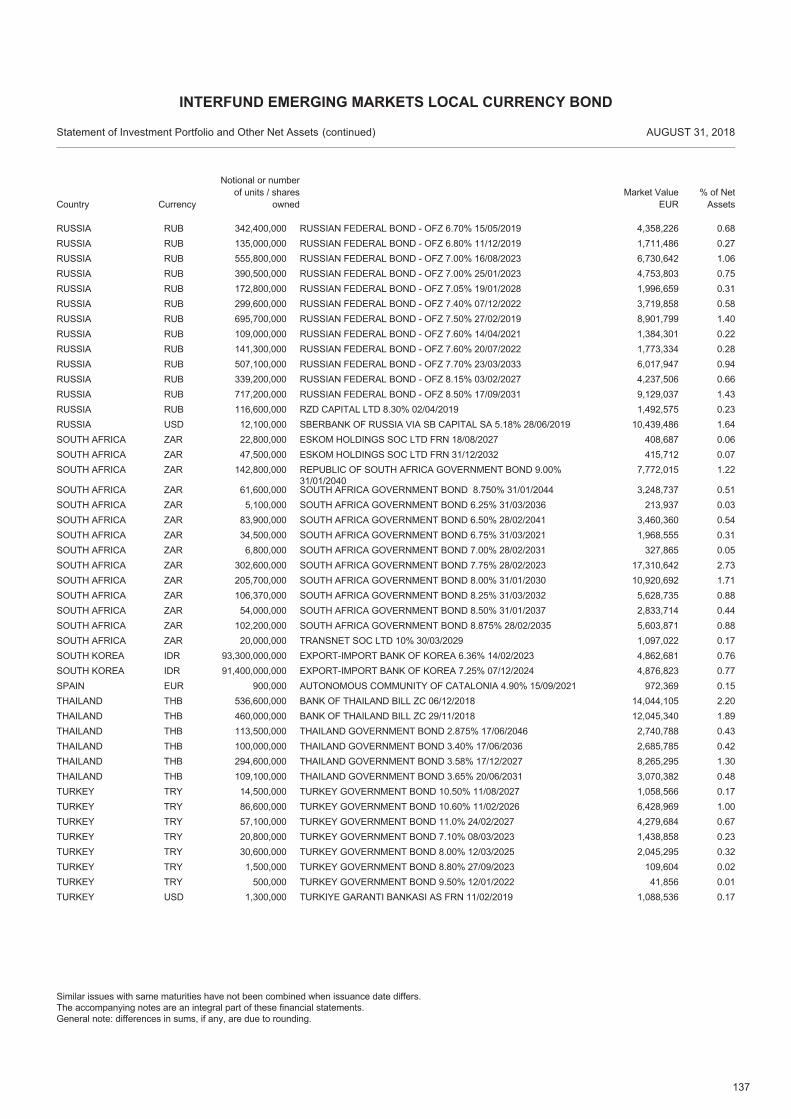
137
RUB 342,400,000 RUSSIAN FEDERAL BOND - OFZ 6.70% 15/05/2019 4,358,226 0.68RUSSIARUB 135,000,000 RUSSIAN FEDERAL BOND - OFZ 6.80% 11/12/2019 1,711,486 0.27RUSSIARUB 555,800,000 RUSSIAN FEDERAL BOND - OFZ 7.00% 16/08/2023 6,730,642 1.06RUSSIARUB 390,500,000 RUSSIAN FEDERAL BOND - OFZ 7.00% 25/01/2023 4,753,803 0.75RUSSIARUB 172,800,000 RUSSIAN FEDERAL BOND - OFZ 7.05% 19/01/2028 1,996,659 0.31RUSSIARUB 299,600,000 RUSSIAN FEDERAL BOND - OFZ 7.40% 07/12/2022 3,719,858 0.58RUSSIARUB 695,700,000 RUSSIAN FEDERAL BOND - OFZ 7.50% 27/02/2019 8,901,799 1.40RUSSIARUB 109,000,000 RUSSIAN FEDERAL BOND - OFZ 7.60% 14/04/2021 1,384,301 0.22RUSSIARUB 141,300,000 RUSSIAN FEDERAL BOND - OFZ 7.60% 20/07/2022 1,773,334 0.28RUSSIARUB 507,100,000 RUSSIAN FEDERAL BOND - OFZ 7.70% 23/03/2033 6,017,947 0.94RUSSIARUB 339,200,000 RUSSIAN FEDERAL BOND - OFZ 8.15% 03/02/2027 4,237,506 0.66RUSSIARUB 717,200,000 RUSSIAN FEDERAL BOND - OFZ 8.50% 17/09/2031 9,129,037 1.43RUSSIARUB 116,600,000 RZD CAPITAL LTD 8.30% 02/04/2019 1,492,575 0.23RUSSIAUSD 12,100,000 SBERBANK OF RUSSIA VIA SB CAPITAL SA 5.18% 28/06/2019 10,439,486 1.64RUSSIAZAR 22,800,000 ESKOM HOLDINGS SOC LTD FRN 18/08/2027 408,687 0.06SOUTH AFRICAZAR 47,500,000 ESKOM HOLDINGS SOC LTD FRN 31/12/2032 415,712 0.07SOUTH AFRICAZAR 142,800,000 REPUBLIC OF SOUTH AFRICA GOVERNMENT BOND 9.00%
31/01/20407,772,015 1.22SOUTH AFRICA
ZAR 61,600,000 SOUTH AFRICA GOVERNMENT BOND 8.750% 31/01/2044 3,248,737 0.51SOUTH AFRICAZAR 5,100,000 SOUTH AFRICA GOVERNMENT BOND 6.25% 31/03/2036 213,937 0.03SOUTH AFRICAZAR 83,900,000 SOUTH AFRICA GOVERNMENT BOND 6.50% 28/02/2041 3,460,360 0.54SOUTH AFRICAZAR 34,500,000 SOUTH AFRICA GOVERNMENT BOND 6.75% 31/03/2021 1,968,555 0.31SOUTH AFRICAZAR 6,800,000 SOUTH AFRICA GOVERNMENT BOND 7.00% 28/02/2031 327,865 0.05SOUTH AFRICAZAR 302,600,000 SOUTH AFRICA GOVERNMENT BOND 7.75% 28/02/2023 17,310,642 2.73SOUTH AFRICAZAR 205,700,000 SOUTH AFRICA GOVERNMENT BOND 8.00% 31/01/2030 10,920,692 1.71SOUTH AFRICAZAR 106,370,000 SOUTH AFRICA GOVERNMENT BOND 8.25% 31/03/2032 5,628,735 0.88SOUTH AFRICAZAR 54,000,000 SOUTH AFRICA GOVERNMENT BOND 8.50% 31/01/2037 2,833,714 0.44SOUTH AFRICAZAR 102,200,000 SOUTH AFRICA GOVERNMENT BOND 8.875% 28/02/2035 5,603,871 0.88SOUTH AFRICAZAR 20,000,000 TRANSNET SOC LTD 10% 30/03/2029 1,097,022 0.17SOUTH AFRICAIDR 93,300,000,000 EXPORT-IMPORT BANK OF KOREA 6.36% 14/02/2023 4,862,681 0.76SOUTH KOREAIDR 91,400,000,000 EXPORT-IMPORT BANK OF KOREA 7.25% 07/12/2024 4,876,823 0.77SOUTH KOREAEUR 900,000 AUTONOMOUS COMMUNITY OF CATALONIA 4.90% 15/09/2021 972,369 0.15SPAINTHB 536,600,000 BANK OF THAILAND BILL ZC 06/12/2018 14,044,105 2.20THAILANDTHB 460,000,000 BANK OF THAILAND BILL ZC 29/11/2018 12,045,340 1.89THAILANDTHB 113,500,000 THAILAND GOVERNMENT BOND 2.875% 17/06/2046 2,740,788 0.43THAILANDTHB 100,000,000 THAILAND GOVERNMENT BOND 3.40% 17/06/2036 2,685,785 0.42THAILANDTHB 294,600,000 THAILAND GOVERNMENT BOND 3.58% 17/12/2027 8,265,295 1.30THAILANDTHB 109,100,000 THAILAND GOVERNMENT BOND 3.65% 20/06/2031 3,070,382 0.48THAILANDTRY 14,500,000 TURKEY GOVERNMENT BOND 10.50% 11/08/2027 1,058,566 0.17TURKEYTRY 86,600,000 TURKEY GOVERNMENT BOND 10.60% 11/02/2026 6,428,969 1.00TURKEYTRY 57,100,000 TURKEY GOVERNMENT BOND 11.0% 24/02/2027 4,279,684 0.67TURKEYTRY 20,800,000 TURKEY GOVERNMENT BOND 7.10% 08/03/2023 1,438,858 0.23TURKEYTRY 30,600,000 TURKEY GOVERNMENT BOND 8.00% 12/03/2025 2,045,295 0.32TURKEYTRY 1,500,000 TURKEY GOVERNMENT BOND 8.80% 27/09/2023 109,604 0.02TURKEYTRY 500,000 TURKEY GOVERNMENT BOND 9.50% 12/01/2022 41,856 0.01TURKEYUSD 1,300,000 TURKIYE GARANTI BANKASI AS FRN 11/02/2019 1,088,536 0.17TURKEY
Country
Statement of Investment Portfolio and Other Net Assets AUGUST 31, 2018
Notional or number of units / shares
ownedMarket Value
EUR% of Net
Assets
INTERFUND EMERGING MARKETS LOCAL CURRENCY BOND
(continued)
Similar issues with same maturities have not been combined when issuance date differs.The accompanying notes are an integral part of these financial statements.General note: differences in sums, if any, are due to rounding.
Currency
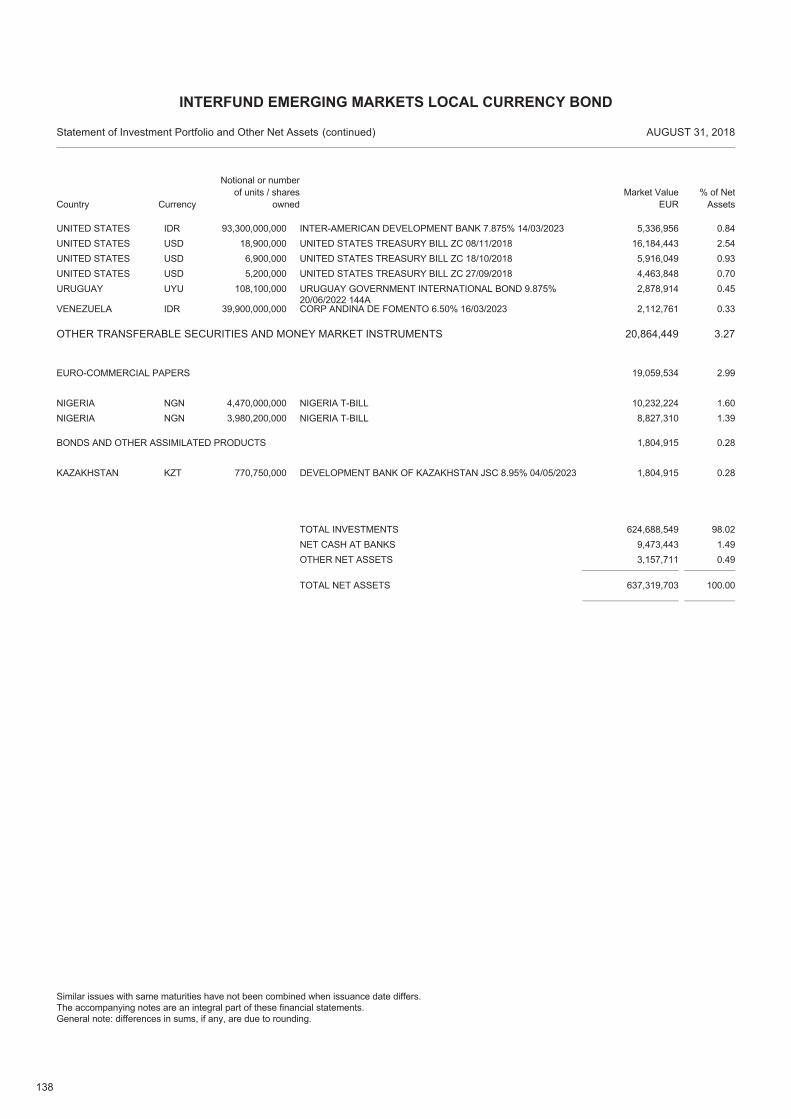
138
IDR 93,300,000,000 INTER-AMERICAN DEVELOPMENT BANK 7.875% 14/03/2023 5,336,956 0.84UNITED STATESUSD 18,900,000 UNITED STATES TREASURY BILL ZC 08/11/2018 16,184,443 2.54UNITED STATESUSD 6,900,000 UNITED STATES TREASURY BILL ZC 18/10/2018 5,916,049 0.93UNITED STATESUSD 5,200,000 UNITED STATES TREASURY BILL ZC 27/09/2018 4,463,848 0.70UNITED STATESUYU 108,100,000 URUGUAY GOVERNMENT INTERNATIONAL BOND 9.875%
20/06/2022 144A2,878,914 0.45URUGUAY
IDR 39,900,000,000 CORP ANDINA DE FOMENTO 6.50% 16/03/2023 2,112,761 0.33VENEZUELA
OTHER TRANSFERABLE SECURITIES AND MONEY MARKET INSTRUMENTS 20,864,449 3.27
NGN 4,470,000,000 NIGERIA T-BILL 10,232,224 1.60NIGERIA
EURO-COMMERCIAL PAPERS 2.9919,059,534
NGN 3,980,200,000 NIGERIA T-BILL 8,827,310 1.39NIGERIA
KZT 770,750,000 DEVELOPMENT BANK OF KAZAKHSTAN JSC 8.95% 04/05/2023 1,804,915 0.28KAZAKHSTAN
BONDS AND OTHER ASSIMILATED PRODUCTS 0.281,804,915
TOTAL NET ASSETS 637,319,703 100.00
TOTAL INVESTMENTS 624,688,549 98.02NET CASH AT BANKS 9,473,443 1.49OTHER NET ASSETS 3,157,711 0.49
Country
Statement of Investment Portfolio and Other Net Assets AUGUST 31, 2018
Notional or number of units / shares
ownedMarket Value
EUR% of Net
Assets
INTERFUND EMERGING MARKETS LOCAL CURRENCY BOND
(continued)
Similar issues with same maturities have not been combined when issuance date differs.The accompanying notes are an integral part of these financial statements.General note: differences in sums, if any, are due to rounding.
Currency
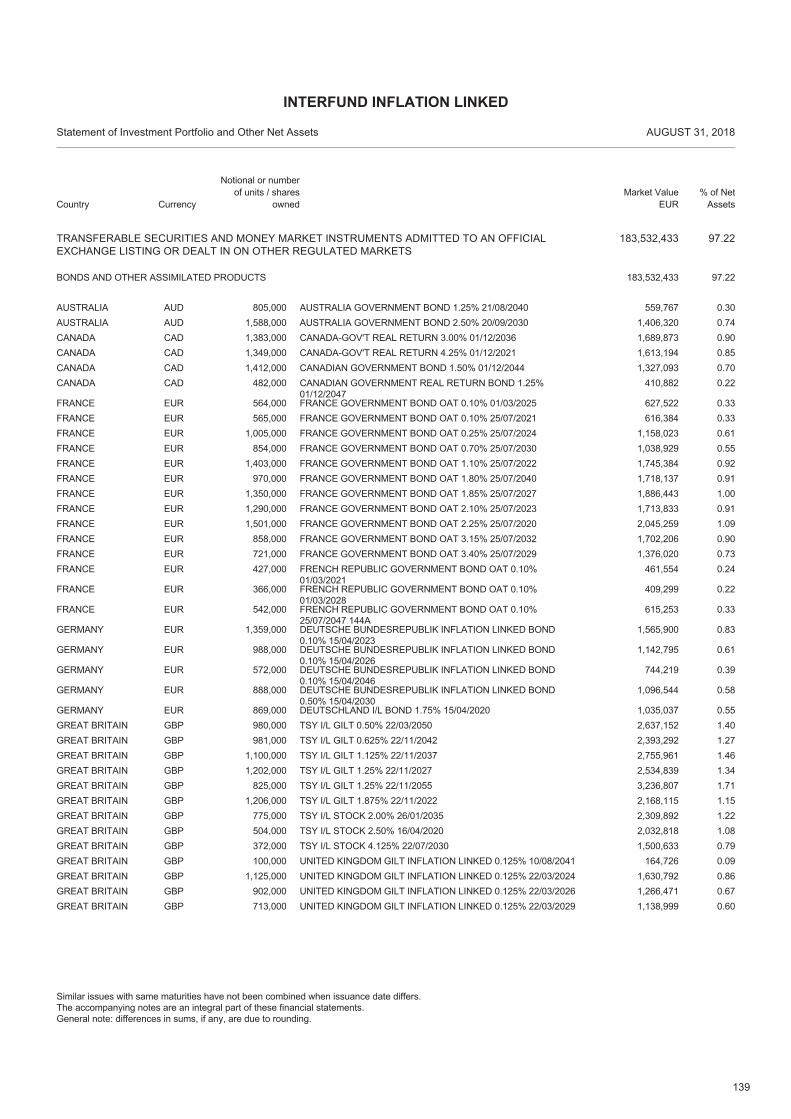
139
TRANSFERABLE SECURITIES AND MONEY MARKET INSTRUMENTS ADMITTED TO AN OFFICIALEXCHANGE LISTING OR DEALT IN ON OTHER REGULATED MARKETS
183,532,433 97.22
AUD 805,000 AUSTRALIA GOVERNMENT BOND 1.25% 21/08/2040 559,767 0.30AUSTRALIA
BONDS AND OTHER ASSIMILATED PRODUCTS 97.22183,532,433
AUD 1,588,000 AUSTRALIA GOVERNMENT BOND 2.50% 20/09/2030 1,406,320 0.74AUSTRALIACAD 1,383,000 CANADA-GOV'T REAL RETURN 3.00% 01/12/2036 1,689,873 0.90CANADACAD 1,349,000 CANADA-GOV'T REAL RETURN 4.25% 01/12/2021 1,613,194 0.85CANADACAD 1,412,000 CANADIAN GOVERNMENT BOND 1.50% 01/12/2044 1,327,093 0.70CANADACAD 482,000 CANADIAN GOVERNMENT REAL RETURN BOND 1.25%
01/12/2047410,882 0.22CANADA
EUR 564,000 FRANCE GOVERNMENT BOND OAT 0.10% 01/03/2025 627,522 0.33FRANCEEUR 565,000 FRANCE GOVERNMENT BOND OAT 0.10% 25/07/2021 616,384 0.33FRANCEEUR 1,005,000 FRANCE GOVERNMENT BOND OAT 0.25% 25/07/2024 1,158,023 0.61FRANCEEUR 854,000 FRANCE GOVERNMENT BOND OAT 0.70% 25/07/2030 1,038,929 0.55FRANCEEUR 1,403,000 FRANCE GOVERNMENT BOND OAT 1.10% 25/07/2022 1,745,384 0.92FRANCEEUR 970,000 FRANCE GOVERNMENT BOND OAT 1.80% 25/07/2040 1,718,137 0.91FRANCEEUR 1,350,000 FRANCE GOVERNMENT BOND OAT 1.85% 25/07/2027 1,886,443 1.00FRANCEEUR 1,290,000 FRANCE GOVERNMENT BOND OAT 2.10% 25/07/2023 1,713,833 0.91FRANCEEUR 1,501,000 FRANCE GOVERNMENT BOND OAT 2.25% 25/07/2020 2,045,259 1.09FRANCEEUR 858,000 FRANCE GOVERNMENT BOND OAT 3.15% 25/07/2032 1,702,206 0.90FRANCEEUR 721,000 FRANCE GOVERNMENT BOND OAT 3.40% 25/07/2029 1,376,020 0.73FRANCEEUR 427,000 FRENCH REPUBLIC GOVERNMENT BOND OAT 0.10%
01/03/2021461,554 0.24FRANCE
EUR 366,000 FRENCH REPUBLIC GOVERNMENT BOND OAT 0.10%01/03/2028
409,299 0.22FRANCE
EUR 542,000 FRENCH REPUBLIC GOVERNMENT BOND OAT 0.10%25/07/2047 144A
615,253 0.33FRANCE
EUR 1,359,000 DEUTSCHE BUNDESREPUBLIK INFLATION LINKED BOND0.10% 15/04/2023
1,565,900 0.83GERMANY
EUR 988,000 DEUTSCHE BUNDESREPUBLIK INFLATION LINKED BOND0.10% 15/04/2026
1,142,795 0.61GERMANY
EUR 572,000 DEUTSCHE BUNDESREPUBLIK INFLATION LINKED BOND0.10% 15/04/2046
744,219 0.39GERMANY
EUR 888,000 DEUTSCHE BUNDESREPUBLIK INFLATION LINKED BOND0.50% 15/04/2030
1,096,544 0.58GERMANY
EUR 869,000 DEUTSCHLAND I/L BOND 1.75% 15/04/2020 1,035,037 0.55GERMANYGBP 980,000 TSY I/L GILT 0.50% 22/03/2050 2,637,152 1.40GREAT BRITAINGBP 981,000 TSY I/L GILT 0.625% 22/11/2042 2,393,292 1.27GREAT BRITAINGBP 1,100,000 TSY I/L GILT 1.125% 22/11/2037 2,755,961 1.46GREAT BRITAINGBP 1,202,000 TSY I/L GILT 1.25% 22/11/2027 2,534,839 1.34GREAT BRITAINGBP 825,000 TSY I/L GILT 1.25% 22/11/2055 3,236,807 1.71GREAT BRITAINGBP 1,206,000 TSY I/L GILT 1.875% 22/11/2022 2,168,115 1.15GREAT BRITAINGBP 775,000 TSY I/L STOCK 2.00% 26/01/2035 2,309,892 1.22GREAT BRITAINGBP 504,000 TSY I/L STOCK 2.50% 16/04/2020 2,032,818 1.08GREAT BRITAINGBP 372,000 TSY I/L STOCK 4.125% 22/07/2030 1,500,633 0.79GREAT BRITAINGBP 100,000 UNITED KINGDOM GILT INFLATION LINKED 0.125% 10/08/2041 164,726 0.09GREAT BRITAINGBP 1,125,000 UNITED KINGDOM GILT INFLATION LINKED 0.125% 22/03/2024 1,630,792 0.86GREAT BRITAINGBP 902,000 UNITED KINGDOM GILT INFLATION LINKED 0.125% 22/03/2026 1,266,471 0.67GREAT BRITAINGBP 713,000 UNITED KINGDOM GILT INFLATION LINKED 0.125% 22/03/2029 1,138,999 0.60GREAT BRITAIN
Country
Statement of Investment Portfolio and Other Net Assets AUGUST 31, 2018
Notional or number of units / shares
ownedMarket Value
EUR% of Net
Assets
INTERFUND INFLATION LINKED
Similar issues with same maturities have not been combined when issuance date differs.The accompanying notes are an integral part of these financial statements.General note: differences in sums, if any, are due to rounding.
Currency
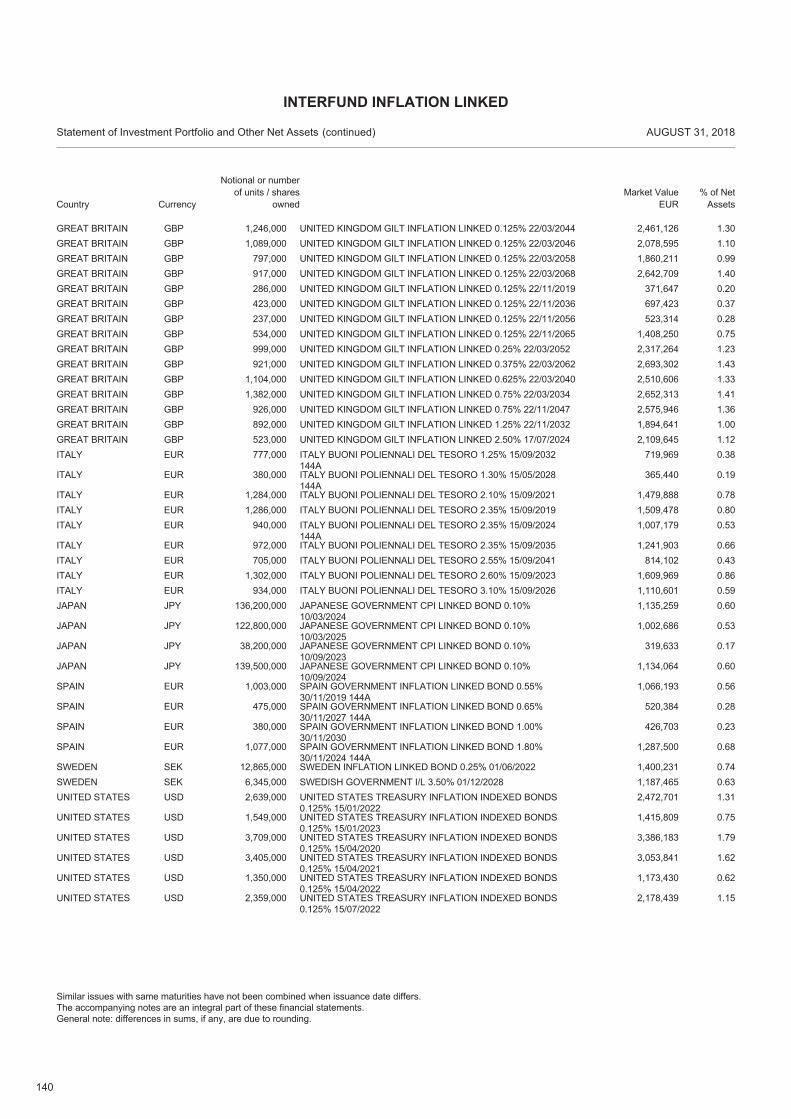
140
GBP 1,246,000 UNITED KINGDOM GILT INFLATION LINKED 0.125% 22/03/2044 2,461,126 1.30GREAT BRITAINGBP 1,089,000 UNITED KINGDOM GILT INFLATION LINKED 0.125% 22/03/2046 2,078,595 1.10GREAT BRITAINGBP 797,000 UNITED KINGDOM GILT INFLATION LINKED 0.125% 22/03/2058 1,860,211 0.99GREAT BRITAINGBP 917,000 UNITED KINGDOM GILT INFLATION LINKED 0.125% 22/03/2068 2,642,709 1.40GREAT BRITAINGBP 286,000 UNITED KINGDOM GILT INFLATION LINKED 0.125% 22/11/2019 371,647 0.20GREAT BRITAINGBP 423,000 UNITED KINGDOM GILT INFLATION LINKED 0.125% 22/11/2036 697,423 0.37GREAT BRITAINGBP 237,000 UNITED KINGDOM GILT INFLATION LINKED 0.125% 22/11/2056 523,314 0.28GREAT BRITAINGBP 534,000 UNITED KINGDOM GILT INFLATION LINKED 0.125% 22/11/2065 1,408,250 0.75GREAT BRITAINGBP 999,000 UNITED KINGDOM GILT INFLATION LINKED 0.25% 22/03/2052 2,317,264 1.23GREAT BRITAINGBP 921,000 UNITED KINGDOM GILT INFLATION LINKED 0.375% 22/03/2062 2,693,302 1.43GREAT BRITAINGBP 1,104,000 UNITED KINGDOM GILT INFLATION LINKED 0.625% 22/03/2040 2,510,606 1.33GREAT BRITAINGBP 1,382,000 UNITED KINGDOM GILT INFLATION LINKED 0.75% 22/03/2034 2,652,313 1.41GREAT BRITAINGBP 926,000 UNITED KINGDOM GILT INFLATION LINKED 0.75% 22/11/2047 2,575,946 1.36GREAT BRITAINGBP 892,000 UNITED KINGDOM GILT INFLATION LINKED 1.25% 22/11/2032 1,894,641 1.00GREAT BRITAINGBP 523,000 UNITED KINGDOM GILT INFLATION LINKED 2.50% 17/07/2024 2,109,645 1.12GREAT BRITAINEUR 777,000 ITALY BUONI POLIENNALI DEL TESORO 1.25% 15/09/2032
144A719,969 0.38ITALY
EUR 380,000 ITALY BUONI POLIENNALI DEL TESORO 1.30% 15/05/2028144A
365,440 0.19ITALY
EUR 1,284,000 ITALY BUONI POLIENNALI DEL TESORO 2.10% 15/09/2021 1,479,888 0.78ITALYEUR 1,286,000 ITALY BUONI POLIENNALI DEL TESORO 2.35% 15/09/2019 1,509,478 0.80ITALYEUR 940,000 ITALY BUONI POLIENNALI DEL TESORO 2.35% 15/09/2024
144A1,007,179 0.53ITALY
EUR 972,000 ITALY BUONI POLIENNALI DEL TESORO 2.35% 15/09/2035 1,241,903 0.66ITALYEUR 705,000 ITALY BUONI POLIENNALI DEL TESORO 2.55% 15/09/2041 814,102 0.43ITALYEUR 1,302,000 ITALY BUONI POLIENNALI DEL TESORO 2.60% 15/09/2023 1,609,969 0.86ITALYEUR 934,000 ITALY BUONI POLIENNALI DEL TESORO 3.10% 15/09/2026 1,110,601 0.59ITALYJPY 136,200,000 JAPANESE GOVERNMENT CPI LINKED BOND 0.10%
10/03/20241,135,259 0.60JAPAN
JPY 122,800,000 JAPANESE GOVERNMENT CPI LINKED BOND 0.10%10/03/2025
1,002,686 0.53JAPAN
JPY 38,200,000 JAPANESE GOVERNMENT CPI LINKED BOND 0.10%10/09/2023
319,633 0.17JAPAN
JPY 139,500,000 JAPANESE GOVERNMENT CPI LINKED BOND 0.10%10/09/2024
1,134,064 0.60JAPAN
EUR 1,003,000 SPAIN GOVERNMENT INFLATION LINKED BOND 0.55%30/11/2019 144A
1,066,193 0.56SPAIN
EUR 475,000 SPAIN GOVERNMENT INFLATION LINKED BOND 0.65%30/11/2027 144A
520,384 0.28SPAIN
EUR 380,000 SPAIN GOVERNMENT INFLATION LINKED BOND 1.00%30/11/2030
426,703 0.23SPAIN
EUR 1,077,000 SPAIN GOVERNMENT INFLATION LINKED BOND 1.80%30/11/2024 144A
1,287,500 0.68SPAIN
SEK 12,865,000 SWEDEN INFLATION LINKED BOND 0.25% 01/06/2022 1,400,231 0.74SWEDENSEK 6,345,000 SWEDISH GOVERNMENT I/L 3.50% 01/12/2028 1,187,465 0.63SWEDENUSD 2,639,000 UNITED STATES TREASURY INFLATION INDEXED BONDS
0.125% 15/01/20222,472,701 1.31UNITED STATES
USD 1,549,000 UNITED STATES TREASURY INFLATION INDEXED BONDS0.125% 15/01/2023
1,415,809 0.75UNITED STATES
USD 3,709,000 UNITED STATES TREASURY INFLATION INDEXED BONDS0.125% 15/04/2020
3,386,183 1.79UNITED STATES
USD 3,405,000 UNITED STATES TREASURY INFLATION INDEXED BONDS0.125% 15/04/2021
3,053,841 1.62UNITED STATES
USD 1,350,000 UNITED STATES TREASURY INFLATION INDEXED BONDS0.125% 15/04/2022
1,173,430 0.62UNITED STATES
USD 2,359,000 UNITED STATES TREASURY INFLATION INDEXED BONDS0.125% 15/07/2022
2,178,439 1.15UNITED STATES
Country
Statement of Investment Portfolio and Other Net Assets AUGUST 31, 2018
Notional or number of units / shares
ownedMarket Value
EUR% of Net
Assets
INTERFUND INFLATION LINKED
(continued)
Similar issues with same maturities have not been combined when issuance date differs.The accompanying notes are an integral part of these financial statements.General note: differences in sums, if any, are due to rounding.
Currency
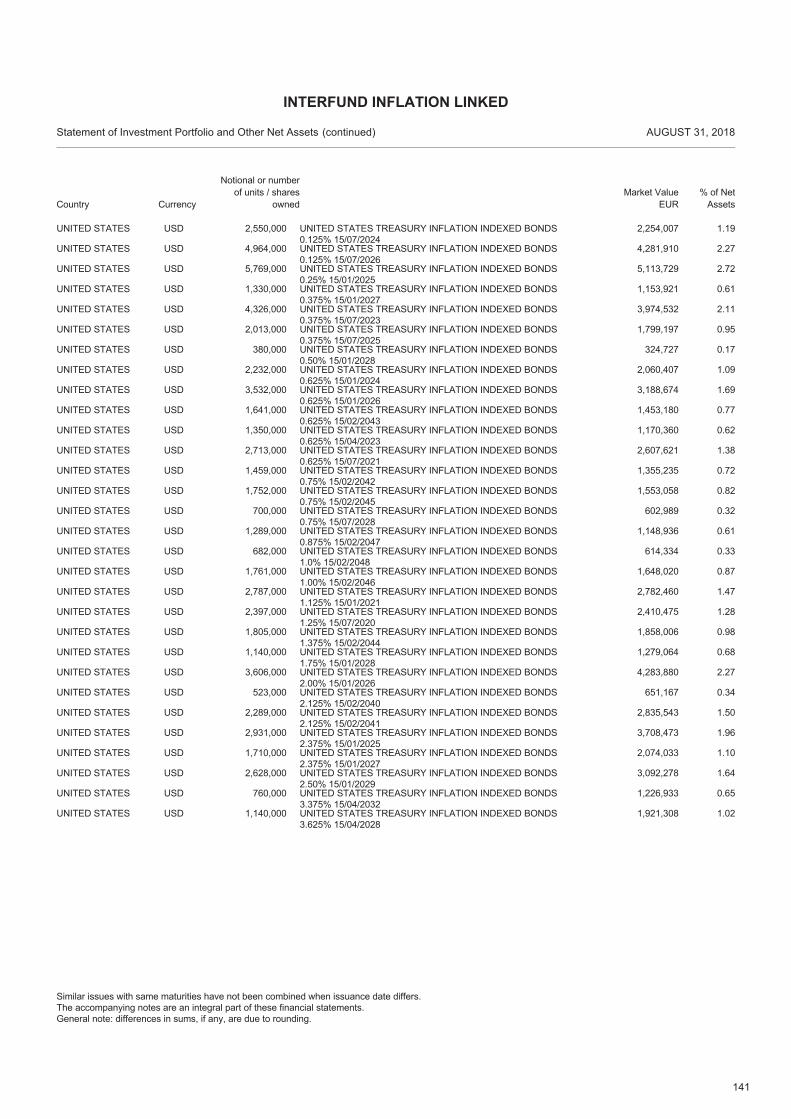
141
USD 2,550,000 UNITED STATES TREASURY INFLATION INDEXED BONDS0.125% 15/07/2024
2,254,007 1.19UNITED STATES
USD 4,964,000 UNITED STATES TREASURY INFLATION INDEXED BONDS0.125% 15/07/2026
4,281,910 2.27UNITED STATES
USD 5,769,000 UNITED STATES TREASURY INFLATION INDEXED BONDS0.25% 15/01/2025
5,113,729 2.72UNITED STATES
USD 1,330,000 UNITED STATES TREASURY INFLATION INDEXED BONDS0.375% 15/01/2027
1,153,921 0.61UNITED STATES
USD 4,326,000 UNITED STATES TREASURY INFLATION INDEXED BONDS0.375% 15/07/2023
3,974,532 2.11UNITED STATES
USD 2,013,000 UNITED STATES TREASURY INFLATION INDEXED BONDS0.375% 15/07/2025
1,799,197 0.95UNITED STATES
USD 380,000 UNITED STATES TREASURY INFLATION INDEXED BONDS0.50% 15/01/2028
324,727 0.17UNITED STATES
USD 2,232,000 UNITED STATES TREASURY INFLATION INDEXED BONDS0.625% 15/01/2024
2,060,407 1.09UNITED STATES
USD 3,532,000 UNITED STATES TREASURY INFLATION INDEXED BONDS0.625% 15/01/2026
3,188,674 1.69UNITED STATES
USD 1,641,000 UNITED STATES TREASURY INFLATION INDEXED BONDS0.625% 15/02/2043
1,453,180 0.77UNITED STATES
USD 1,350,000 UNITED STATES TREASURY INFLATION INDEXED BONDS0.625% 15/04/2023
1,170,360 0.62UNITED STATES
USD 2,713,000 UNITED STATES TREASURY INFLATION INDEXED BONDS0.625% 15/07/2021
2,607,621 1.38UNITED STATES
USD 1,459,000 UNITED STATES TREASURY INFLATION INDEXED BONDS0.75% 15/02/2042
1,355,235 0.72UNITED STATES
USD 1,752,000 UNITED STATES TREASURY INFLATION INDEXED BONDS0.75% 15/02/2045
1,553,058 0.82UNITED STATES
USD 700,000 UNITED STATES TREASURY INFLATION INDEXED BONDS0.75% 15/07/2028
602,989 0.32UNITED STATES
USD 1,289,000 UNITED STATES TREASURY INFLATION INDEXED BONDS0.875% 15/02/2047
1,148,936 0.61UNITED STATES
USD 682,000 UNITED STATES TREASURY INFLATION INDEXED BONDS1.0% 15/02/2048
614,334 0.33UNITED STATES
USD 1,761,000 UNITED STATES TREASURY INFLATION INDEXED BONDS1.00% 15/02/2046
1,648,020 0.87UNITED STATES
USD 2,787,000 UNITED STATES TREASURY INFLATION INDEXED BONDS1.125% 15/01/2021
2,782,460 1.47UNITED STATES
USD 2,397,000 UNITED STATES TREASURY INFLATION INDEXED BONDS1.25% 15/07/2020
2,410,475 1.28UNITED STATES
USD 1,805,000 UNITED STATES TREASURY INFLATION INDEXED BONDS1.375% 15/02/2044
1,858,006 0.98UNITED STATES
USD 1,140,000 UNITED STATES TREASURY INFLATION INDEXED BONDS1.75% 15/01/2028
1,279,064 0.68UNITED STATES
USD 3,606,000 UNITED STATES TREASURY INFLATION INDEXED BONDS2.00% 15/01/2026
4,283,880 2.27UNITED STATES
USD 523,000 UNITED STATES TREASURY INFLATION INDEXED BONDS2.125% 15/02/2040
651,167 0.34UNITED STATES
USD 2,289,000 UNITED STATES TREASURY INFLATION INDEXED BONDS2.125% 15/02/2041
2,835,543 1.50UNITED STATES
USD 2,931,000 UNITED STATES TREASURY INFLATION INDEXED BONDS2.375% 15/01/2025
3,708,473 1.96UNITED STATES
USD 1,710,000 UNITED STATES TREASURY INFLATION INDEXED BONDS2.375% 15/01/2027
2,074,033 1.10UNITED STATES
USD 2,628,000 UNITED STATES TREASURY INFLATION INDEXED BONDS2.50% 15/01/2029
3,092,278 1.64UNITED STATES
USD 760,000 UNITED STATES TREASURY INFLATION INDEXED BONDS3.375% 15/04/2032
1,226,933 0.65UNITED STATES
USD 1,140,000 UNITED STATES TREASURY INFLATION INDEXED BONDS3.625% 15/04/2028
1,921,308 1.02UNITED STATES
Country
Statement of Investment Portfolio and Other Net Assets AUGUST 31, 2018
Notional or number of units / shares
ownedMarket Value
EUR% of Net
Assets
INTERFUND INFLATION LINKED
(continued)
Similar issues with same maturities have not been combined when issuance date differs.The accompanying notes are an integral part of these financial statements.General note: differences in sums, if any, are due to rounding.
Currency
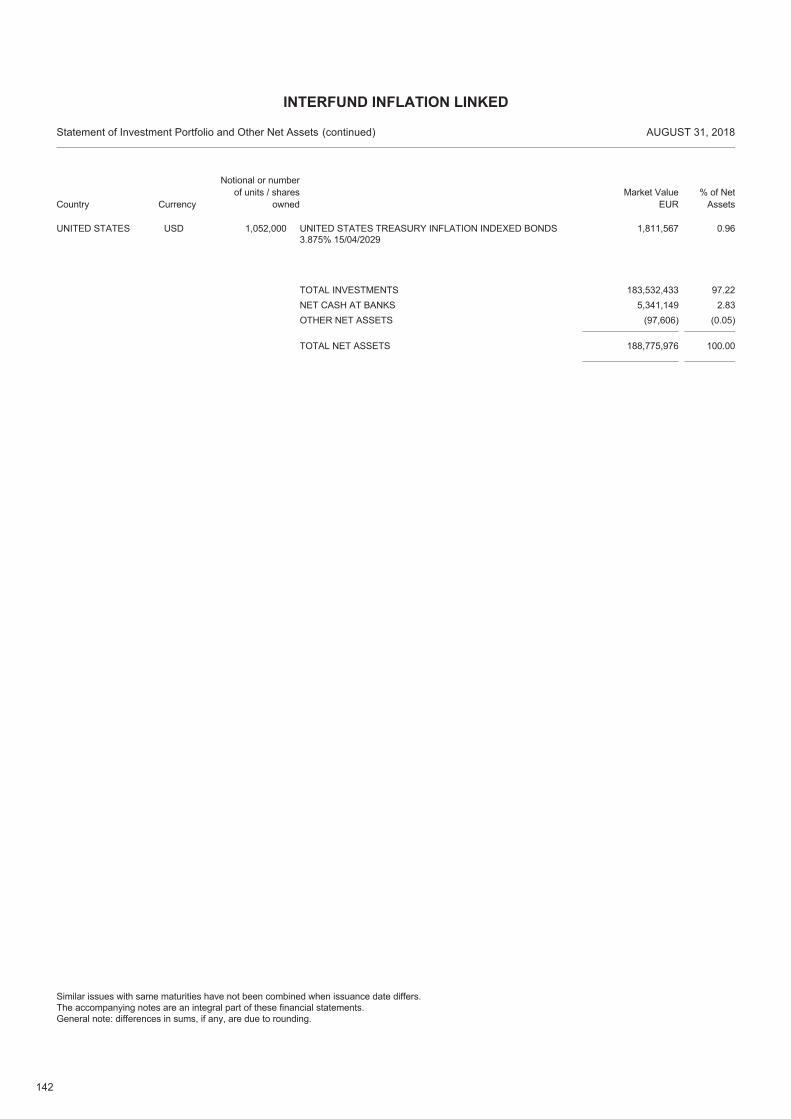
142
USD 1,052,000 UNITED STATES TREASURY INFLATION INDEXED BONDS3.875% 15/04/2029
1,811,567 0.96UNITED STATES
TOTAL NET ASSETS 188,775,976 100.00
TOTAL INVESTMENTS 183,532,433 97.22NET CASH AT BANKS 5,341,149 2.83OTHER NET ASSETS (97,606) (0.05)
Country
Statement of Investment Portfolio and Other Net Assets AUGUST 31, 2018
Notional or number of units / shares
ownedMarket Value
EUR% of Net
Assets
INTERFUND INFLATION LINKED
(continued)
Similar issues with same maturities have not been combined when issuance date differs.The accompanying notes are an integral part of these financial statements.General note: differences in sums, if any, are due to rounding.
Currency
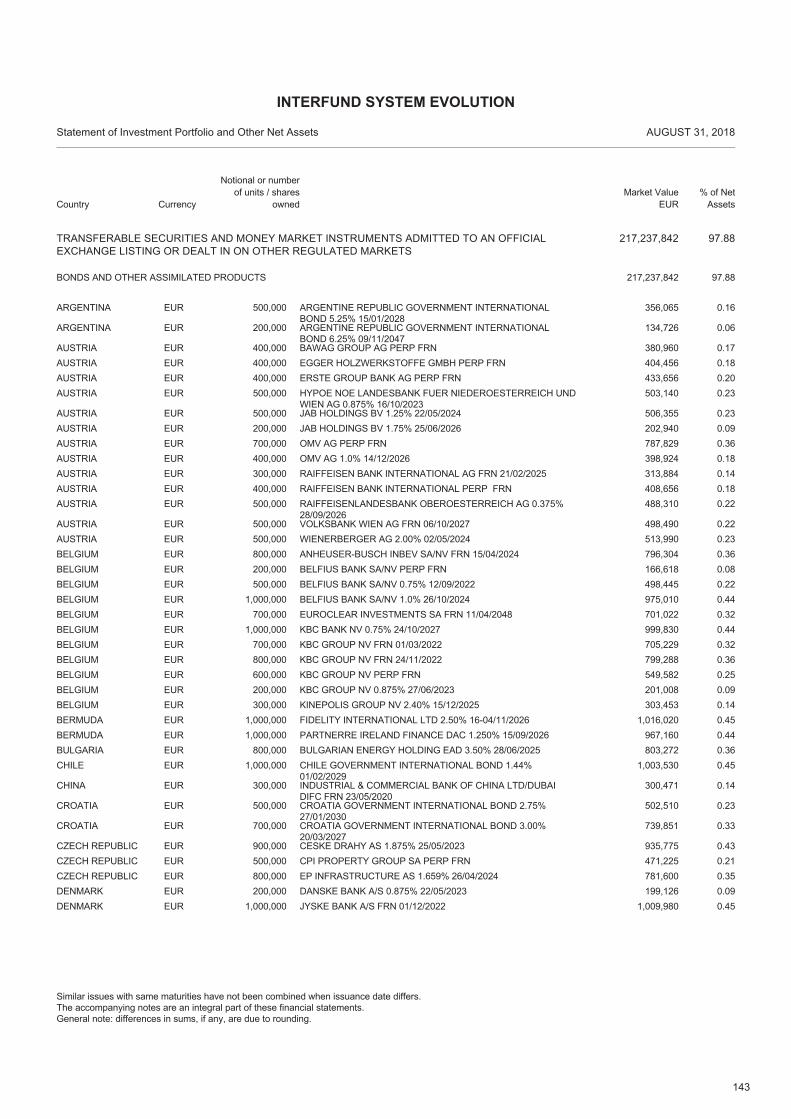
143
TRANSFERABLE SECURITIES AND MONEY MARKET INSTRUMENTS ADMITTED TO AN OFFICIALEXCHANGE LISTING OR DEALT IN ON OTHER REGULATED MARKETS
217,237,842 97.88
EUR 500,000 ARGENTINE REPUBLIC GOVERNMENT INTERNATIONALBOND 5.25% 15/01/2028
356,065 0.16ARGENTINA
BONDS AND OTHER ASSIMILATED PRODUCTS 97.88217,237,842
EUR 200,000 ARGENTINE REPUBLIC GOVERNMENT INTERNATIONALBOND 6.25% 09/11/2047
134,726 0.06ARGENTINA
EUR 400,000 BAWAG GROUP AG PERP FRN 380,960 0.17AUSTRIAEUR 400,000 EGGER HOLZWERKSTOFFE GMBH PERP FRN 404,456 0.18AUSTRIAEUR 400,000 ERSTE GROUP BANK AG PERP FRN 433,656 0.20AUSTRIAEUR 500,000 HYPOE NOE LANDESBANK FUER NIEDEROESTERREICH UND
WIEN AG 0.875% 16/10/2023503,140 0.23AUSTRIA
EUR 500,000 JAB HOLDINGS BV 1.25% 22/05/2024 506,355 0.23AUSTRIAEUR 200,000 JAB HOLDINGS BV 1.75% 25/06/2026 202,940 0.09AUSTRIAEUR 700,000 OMV AG PERP FRN 787,829 0.36AUSTRIAEUR 400,000 OMV AG 1.0% 14/12/2026 398,924 0.18AUSTRIAEUR 300,000 RAIFFEISEN BANK INTERNATIONAL AG FRN 21/02/2025 313,884 0.14AUSTRIAEUR 400,000 RAIFFEISEN BANK INTERNATIONAL PERP FRN 408,656 0.18AUSTRIAEUR 500,000 RAIFFEISENLANDESBANK OBEROESTERREICH AG 0.375%
28/09/2026488,310 0.22AUSTRIA
EUR 500,000 VOLKSBANK WIEN AG FRN 06/10/2027 498,490 0.22AUSTRIAEUR 500,000 WIENERBERGER AG 2.00% 02/05/2024 513,990 0.23AUSTRIAEUR 800,000 ANHEUSER-BUSCH INBEV SA/NV FRN 15/04/2024 796,304 0.36BELGIUMEUR 200,000 BELFIUS BANK SA/NV PERP FRN 166,618 0.08BELGIUMEUR 500,000 BELFIUS BANK SA/NV 0.75% 12/09/2022 498,445 0.22BELGIUMEUR 1,000,000 BELFIUS BANK SA/NV 1.0% 26/10/2024 975,010 0.44BELGIUMEUR 700,000 EUROCLEAR INVESTMENTS SA FRN 11/04/2048 701,022 0.32BELGIUMEUR 1,000,000 KBC BANK NV 0.75% 24/10/2027 999,830 0.44BELGIUMEUR 700,000 KBC GROUP NV FRN 01/03/2022 705,229 0.32BELGIUMEUR 800,000 KBC GROUP NV FRN 24/11/2022 799,288 0.36BELGIUMEUR 600,000 KBC GROUP NV PERP FRN 549,582 0.25BELGIUMEUR 200,000 KBC GROUP NV 0.875% 27/06/2023 201,008 0.09BELGIUMEUR 300,000 KINEPOLIS GROUP NV 2.40% 15/12/2025 303,453 0.14BELGIUMEUR 1,000,000 FIDELITY INTERNATIONAL LTD 2.50% 16-04/11/2026 1,016,020 0.45BERMUDAEUR 1,000,000 PARTNERRE IRELAND FINANCE DAC 1.250% 15/09/2026 967,160 0.44BERMUDAEUR 800,000 BULGARIAN ENERGY HOLDING EAD 3.50% 28/06/2025 803,272 0.36BULGARIAEUR 1,000,000 CHILE GOVERNMENT INTERNATIONAL BOND 1.44%
01/02/20291,003,530 0.45CHILE
EUR 300,000 INDUSTRIAL & COMMERCIAL BANK OF CHINA LTD/DUBAIDIFC FRN 23/05/2020
300,471 0.14CHINA
EUR 500,000 CROATIA GOVERNMENT INTERNATIONAL BOND 2.75%27/01/2030
502,510 0.23CROATIA
EUR 700,000 CROATIA GOVERNMENT INTERNATIONAL BOND 3.00%20/03/2027
739,851 0.33CROATIA
EUR 900,000 CESKE DRAHY AS 1.875% 25/05/2023 935,775 0.43CZECH REPUBLICEUR 500,000 CPI PROPERTY GROUP SA PERP FRN 471,225 0.21CZECH REPUBLICEUR 800,000 EP INFRASTRUCTURE AS 1.659% 26/04/2024 781,600 0.35CZECH REPUBLICEUR 200,000 DANSKE BANK A/S 0.875% 22/05/2023 199,126 0.09DENMARKEUR 1,000,000 JYSKE BANK A/S FRN 01/12/2022 1,009,980 0.45DENMARK
Country
Statement of Investment Portfolio and Other Net Assets AUGUST 31, 2018
Notional or number of units / shares
ownedMarket Value
EUR% of Net
Assets
INTERFUND SYSTEM EVOLUTION
Similar issues with same maturities have not been combined when issuance date differs.The accompanying notes are an integral part of these financial statements.General note: differences in sums, if any, are due to rounding.
Currency
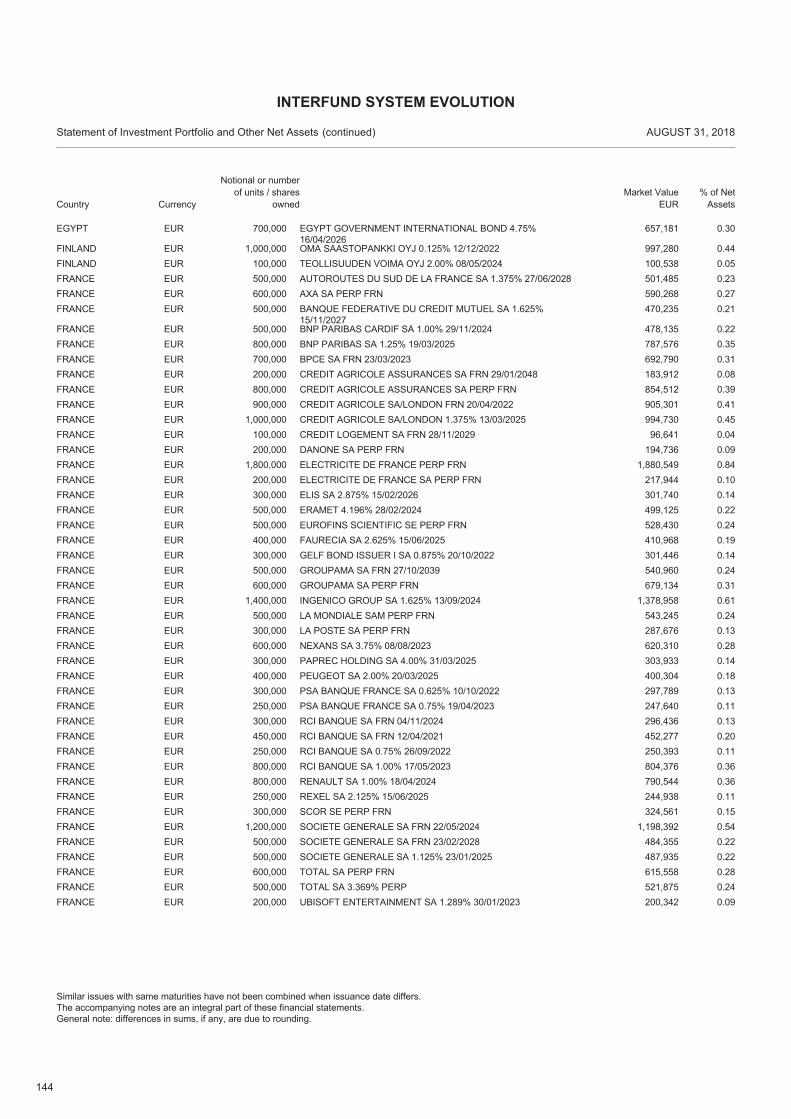
144
EUR 700,000 EGYPT GOVERNMENT INTERNATIONAL BOND 4.75%16/04/2026
657,181 0.30EGYPT
EUR 1,000,000 OMA SAASTOPANKKI OYJ 0.125% 12/12/2022 997,280 0.44FINLANDEUR 100,000 TEOLLISUUDEN VOIMA OYJ 2.00% 08/05/2024 100,538 0.05FINLANDEUR 500,000 AUTOROUTES DU SUD DE LA FRANCE SA 1.375% 27/06/2028 501,485 0.23FRANCEEUR 600,000 AXA SA PERP FRN 590,268 0.27FRANCEEUR 500,000 BANQUE FEDERATIVE DU CREDIT MUTUEL SA 1.625%
15/11/2027470,235 0.21FRANCE
EUR 500,000 BNP PARIBAS CARDIF SA 1.00% 29/11/2024 478,135 0.22FRANCEEUR 800,000 BNP PARIBAS SA 1.25% 19/03/2025 787,576 0.35FRANCEEUR 700,000 BPCE SA FRN 23/03/2023 692,790 0.31FRANCEEUR 200,000 CREDIT AGRICOLE ASSURANCES SA FRN 29/01/2048 183,912 0.08FRANCEEUR 800,000 CREDIT AGRICOLE ASSURANCES SA PERP FRN 854,512 0.39FRANCEEUR 900,000 CREDIT AGRICOLE SA/LONDON FRN 20/04/2022 905,301 0.41FRANCEEUR 1,000,000 CREDIT AGRICOLE SA/LONDON 1.375% 13/03/2025 994,730 0.45FRANCEEUR 100,000 CREDIT LOGEMENT SA FRN 28/11/2029 96,641 0.04FRANCEEUR 200,000 DANONE SA PERP FRN 194,736 0.09FRANCEEUR 1,800,000 ELECTRICITE DE FRANCE PERP FRN 1,880,549 0.84FRANCEEUR 200,000 ELECTRICITE DE FRANCE SA PERP FRN 217,944 0.10FRANCEEUR 300,000 ELIS SA 2.875% 15/02/2026 301,740 0.14FRANCEEUR 500,000 ERAMET 4.196% 28/02/2024 499,125 0.22FRANCEEUR 500,000 EUROFINS SCIENTIFIC SE PERP FRN 528,430 0.24FRANCEEUR 400,000 FAURECIA SA 2.625% 15/06/2025 410,968 0.19FRANCEEUR 300,000 GELF BOND ISSUER I SA 0.875% 20/10/2022 301,446 0.14FRANCEEUR 500,000 GROUPAMA SA FRN 27/10/2039 540,960 0.24FRANCEEUR 600,000 GROUPAMA SA PERP FRN 679,134 0.31FRANCEEUR 1,400,000 INGENICO GROUP SA 1.625% 13/09/2024 1,378,958 0.61FRANCEEUR 500,000 LA MONDIALE SAM PERP FRN 543,245 0.24FRANCEEUR 300,000 LA POSTE SA PERP FRN 287,676 0.13FRANCEEUR 600,000 NEXANS SA 3.75% 08/08/2023 620,310 0.28FRANCEEUR 300,000 PAPREC HOLDING SA 4.00% 31/03/2025 303,933 0.14FRANCEEUR 400,000 PEUGEOT SA 2.00% 20/03/2025 400,304 0.18FRANCEEUR 300,000 PSA BANQUE FRANCE SA 0.625% 10/10/2022 297,789 0.13FRANCEEUR 250,000 PSA BANQUE FRANCE SA 0.75% 19/04/2023 247,640 0.11FRANCEEUR 300,000 RCI BANQUE SA FRN 04/11/2024 296,436 0.13FRANCEEUR 450,000 RCI BANQUE SA FRN 12/04/2021 452,277 0.20FRANCEEUR 250,000 RCI BANQUE SA 0.75% 26/09/2022 250,393 0.11FRANCEEUR 800,000 RCI BANQUE SA 1.00% 17/05/2023 804,376 0.36FRANCEEUR 800,000 RENAULT SA 1.00% 18/04/2024 790,544 0.36FRANCEEUR 250,000 REXEL SA 2.125% 15/06/2025 244,938 0.11FRANCEEUR 300,000 SCOR SE PERP FRN 324,561 0.15FRANCEEUR 1,200,000 SOCIETE GENERALE SA FRN 22/05/2024 1,198,392 0.54FRANCEEUR 500,000 SOCIETE GENERALE SA FRN 23/02/2028 484,355 0.22FRANCEEUR 500,000 SOCIETE GENERALE SA 1.125% 23/01/2025 487,935 0.22FRANCEEUR 600,000 TOTAL SA PERP FRN 615,558 0.28FRANCEEUR 500,000 TOTAL SA 3.369% PERP 521,875 0.24FRANCEEUR 200,000 UBISOFT ENTERTAINMENT SA 1.289% 30/01/2023 200,342 0.09FRANCE
Country
Statement of Investment Portfolio and Other Net Assets AUGUST 31, 2018
Notional or number of units / shares
ownedMarket Value
EUR% of Net
Assets
INTERFUND SYSTEM EVOLUTION
(continued)
Similar issues with same maturities have not been combined when issuance date differs.The accompanying notes are an integral part of these financial statements.General note: differences in sums, if any, are due to rounding.
Currency
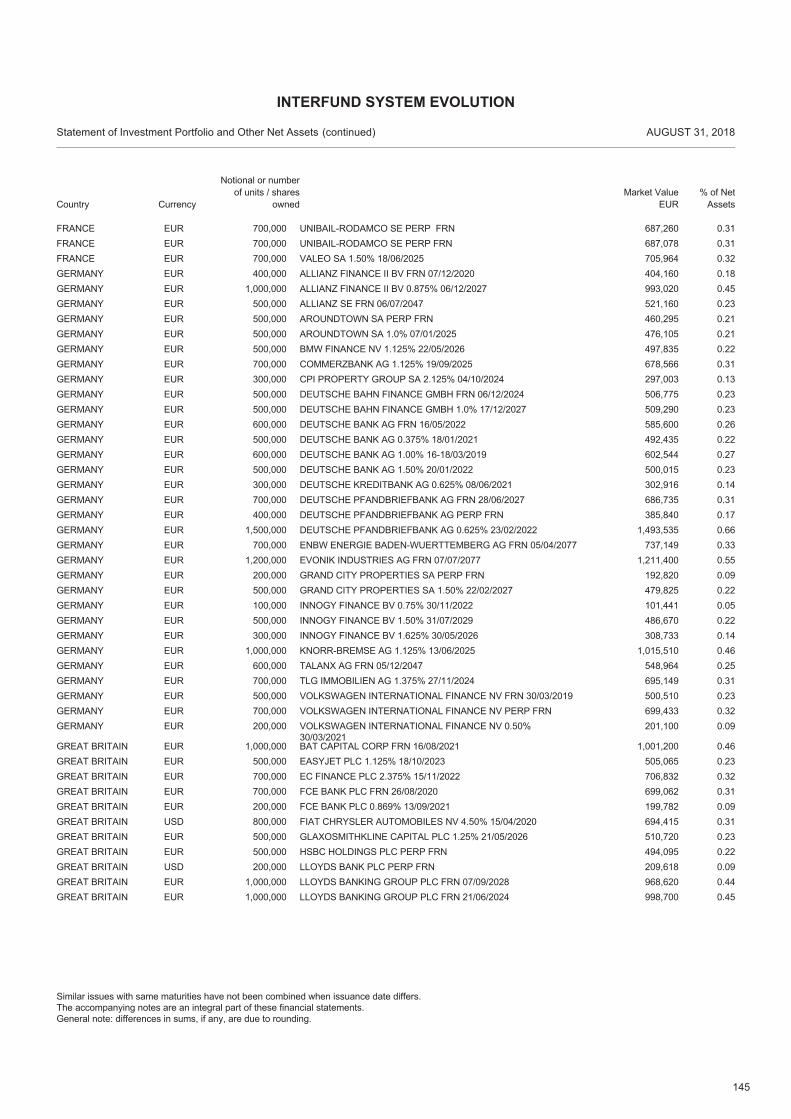
145
EUR 700,000 UNIBAIL-RODAMCO SE PERP FRN 687,260 0.31FRANCEEUR 700,000 UNIBAIL-RODAMCO SE PERP FRN 687,078 0.31FRANCEEUR 700,000 VALEO SA 1.50% 18/06/2025 705,964 0.32FRANCEEUR 400,000 ALLIANZ FINANCE II BV FRN 07/12/2020 404,160 0.18GERMANYEUR 1,000,000 ALLIANZ FINANCE II BV 0.875% 06/12/2027 993,020 0.45GERMANYEUR 500,000 ALLIANZ SE FRN 06/07/2047 521,160 0.23GERMANYEUR 500,000 AROUNDTOWN SA PERP FRN 460,295 0.21GERMANYEUR 500,000 AROUNDTOWN SA 1.0% 07/01/2025 476,105 0.21GERMANYEUR 500,000 BMW FINANCE NV 1.125% 22/05/2026 497,835 0.22GERMANYEUR 700,000 COMMERZBANK AG 1.125% 19/09/2025 678,566 0.31GERMANYEUR 300,000 CPI PROPERTY GROUP SA 2.125% 04/10/2024 297,003 0.13GERMANYEUR 500,000 DEUTSCHE BAHN FINANCE GMBH FRN 06/12/2024 506,775 0.23GERMANYEUR 500,000 DEUTSCHE BAHN FINANCE GMBH 1.0% 17/12/2027 509,290 0.23GERMANYEUR 600,000 DEUTSCHE BANK AG FRN 16/05/2022 585,600 0.26GERMANYEUR 500,000 DEUTSCHE BANK AG 0.375% 18/01/2021 492,435 0.22GERMANYEUR 600,000 DEUTSCHE BANK AG 1.00% 16-18/03/2019 602,544 0.27GERMANYEUR 500,000 DEUTSCHE BANK AG 1.50% 20/01/2022 500,015 0.23GERMANYEUR 300,000 DEUTSCHE KREDITBANK AG 0.625% 08/06/2021 302,916 0.14GERMANYEUR 700,000 DEUTSCHE PFANDBRIEFBANK AG FRN 28/06/2027 686,735 0.31GERMANYEUR 400,000 DEUTSCHE PFANDBRIEFBANK AG PERP FRN 385,840 0.17GERMANYEUR 1,500,000 DEUTSCHE PFANDBRIEFBANK AG 0.625% 23/02/2022 1,493,535 0.66GERMANYEUR 700,000 ENBW ENERGIE BADEN-WUERTTEMBERG AG FRN 05/04/2077 737,149 0.33GERMANYEUR 1,200,000 EVONIK INDUSTRIES AG FRN 07/07/2077 1,211,400 0.55GERMANYEUR 200,000 GRAND CITY PROPERTIES SA PERP FRN 192,820 0.09GERMANYEUR 500,000 GRAND CITY PROPERTIES SA 1.50% 22/02/2027 479,825 0.22GERMANYEUR 100,000 INNOGY FINANCE BV 0.75% 30/11/2022 101,441 0.05GERMANYEUR 500,000 INNOGY FINANCE BV 1.50% 31/07/2029 486,670 0.22GERMANYEUR 300,000 INNOGY FINANCE BV 1.625% 30/05/2026 308,733 0.14GERMANYEUR 1,000,000 KNORR-BREMSE AG 1.125% 13/06/2025 1,015,510 0.46GERMANYEUR 600,000 TALANX AG FRN 05/12/2047 548,964 0.25GERMANYEUR 700,000 TLG IMMOBILIEN AG 1.375% 27/11/2024 695,149 0.31GERMANYEUR 500,000 VOLKSWAGEN INTERNATIONAL FINANCE NV FRN 30/03/2019 500,510 0.23GERMANYEUR 700,000 VOLKSWAGEN INTERNATIONAL FINANCE NV PERP FRN 699,433 0.32GERMANYEUR 200,000 VOLKSWAGEN INTERNATIONAL FINANCE NV 0.50%
30/03/2021201,100 0.09GERMANY
EUR 1,000,000 BAT CAPITAL CORP FRN 16/08/2021 1,001,200 0.46GREAT BRITAINEUR 500,000 EASYJET PLC 1.125% 18/10/2023 505,065 0.23GREAT BRITAINEUR 700,000 EC FINANCE PLC 2.375% 15/11/2022 706,832 0.32GREAT BRITAINEUR 700,000 FCE BANK PLC FRN 26/08/2020 699,062 0.31GREAT BRITAINEUR 200,000 FCE BANK PLC 0.869% 13/09/2021 199,782 0.09GREAT BRITAINUSD 800,000 FIAT CHRYSLER AUTOMOBILES NV 4.50% 15/04/2020 694,415 0.31GREAT BRITAINEUR 500,000 GLAXOSMITHKLINE CAPITAL PLC 1.25% 21/05/2026 510,720 0.23GREAT BRITAINEUR 500,000 HSBC HOLDINGS PLC PERP FRN 494,095 0.22GREAT BRITAINUSD 200,000 LLOYDS BANK PLC PERP FRN 209,618 0.09GREAT BRITAINEUR 1,000,000 LLOYDS BANKING GROUP PLC FRN 07/09/2028 968,620 0.44GREAT BRITAINEUR 1,000,000 LLOYDS BANKING GROUP PLC FRN 21/06/2024 998,700 0.45GREAT BRITAIN
Country
Statement of Investment Portfolio and Other Net Assets AUGUST 31, 2018
Notional or number of units / shares
ownedMarket Value
EUR% of Net
Assets
INTERFUND SYSTEM EVOLUTION
(continued)
Similar issues with same maturities have not been combined when issuance date differs.The accompanying notes are an integral part of these financial statements.General note: differences in sums, if any, are due to rounding.
Currency
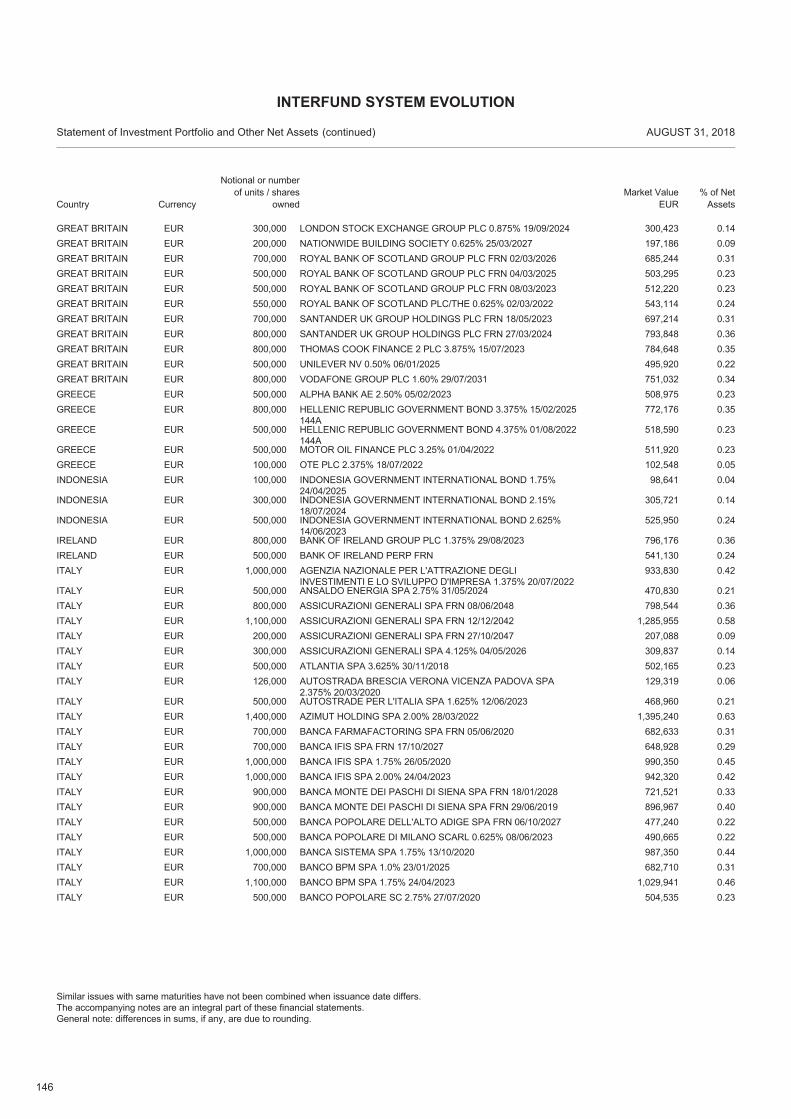
146
EUR 300,000 LONDON STOCK EXCHANGE GROUP PLC 0.875% 19/09/2024 300,423 0.14GREAT BRITAINEUR 200,000 NATIONWIDE BUILDING SOCIETY 0.625% 25/03/2027 197,186 0.09GREAT BRITAINEUR 700,000 ROYAL BANK OF SCOTLAND GROUP PLC FRN 02/03/2026 685,244 0.31GREAT BRITAINEUR 500,000 ROYAL BANK OF SCOTLAND GROUP PLC FRN 04/03/2025 503,295 0.23GREAT BRITAINEUR 500,000 ROYAL BANK OF SCOTLAND GROUP PLC FRN 08/03/2023 512,220 0.23GREAT BRITAINEUR 550,000 ROYAL BANK OF SCOTLAND PLC/THE 0.625% 02/03/2022 543,114 0.24GREAT BRITAINEUR 700,000 SANTANDER UK GROUP HOLDINGS PLC FRN 18/05/2023 697,214 0.31GREAT BRITAINEUR 800,000 SANTANDER UK GROUP HOLDINGS PLC FRN 27/03/2024 793,848 0.36GREAT BRITAINEUR 800,000 THOMAS COOK FINANCE 2 PLC 3.875% 15/07/2023 784,648 0.35GREAT BRITAINEUR 500,000 UNILEVER NV 0.50% 06/01/2025 495,920 0.22GREAT BRITAINEUR 800,000 VODAFONE GROUP PLC 1.60% 29/07/2031 751,032 0.34GREAT BRITAINEUR 500,000 ALPHA BANK AE 2.50% 05/02/2023 508,975 0.23GREECEEUR 800,000 HELLENIC REPUBLIC GOVERNMENT BOND 3.375% 15/02/2025
144A772,176 0.35GREECE
EUR 500,000 HELLENIC REPUBLIC GOVERNMENT BOND 4.375% 01/08/2022144A
518,590 0.23GREECE
EUR 500,000 MOTOR OIL FINANCE PLC 3.25% 01/04/2022 511,920 0.23GREECEEUR 100,000 OTE PLC 2.375% 18/07/2022 102,548 0.05GREECEEUR 100,000 INDONESIA GOVERNMENT INTERNATIONAL BOND 1.75%
24/04/202598,641 0.04INDONESIA
EUR 300,000 INDONESIA GOVERNMENT INTERNATIONAL BOND 2.15%18/07/2024
305,721 0.14INDONESIA
EUR 500,000 INDONESIA GOVERNMENT INTERNATIONAL BOND 2.625%14/06/2023
525,950 0.24INDONESIA
EUR 800,000 BANK OF IRELAND GROUP PLC 1.375% 29/08/2023 796,176 0.36IRELANDEUR 500,000 BANK OF IRELAND PERP FRN 541,130 0.24IRELANDEUR 1,000,000 AGENZIA NAZIONALE PER L'ATTRAZIONE DEGLI
INVESTIMENTI E LO SVILUPPO D'IMPRESA 1.375% 20/07/2022933,830 0.42ITALY
EUR 500,000 ANSALDO ENERGIA SPA 2.75% 31/05/2024 470,830 0.21ITALYEUR 800,000 ASSICURAZIONI GENERALI SPA FRN 08/06/2048 798,544 0.36ITALYEUR 1,100,000 ASSICURAZIONI GENERALI SPA FRN 12/12/2042 1,285,955 0.58ITALYEUR 200,000 ASSICURAZIONI GENERALI SPA FRN 27/10/2047 207,088 0.09ITALYEUR 300,000 ASSICURAZIONI GENERALI SPA 4.125% 04/05/2026 309,837 0.14ITALYEUR 500,000 ATLANTIA SPA 3.625% 30/11/2018 502,165 0.23ITALYEUR 126,000 AUTOSTRADA BRESCIA VERONA VICENZA PADOVA SPA
2.375% 20/03/2020129,319 0.06ITALY
EUR 500,000 AUTOSTRADE PER L'ITALIA SPA 1.625% 12/06/2023 468,960 0.21ITALYEUR 1,400,000 AZIMUT HOLDING SPA 2.00% 28/03/2022 1,395,240 0.63ITALYEUR 700,000 BANCA FARMAFACTORING SPA FRN 05/06/2020 682,633 0.31ITALYEUR 700,000 BANCA IFIS SPA FRN 17/10/2027 648,928 0.29ITALYEUR 1,000,000 BANCA IFIS SPA 1.75% 26/05/2020 990,350 0.45ITALYEUR 1,000,000 BANCA IFIS SPA 2.00% 24/04/2023 942,320 0.42ITALYEUR 900,000 BANCA MONTE DEI PASCHI DI SIENA SPA FRN 18/01/2028 721,521 0.33ITALYEUR 900,000 BANCA MONTE DEI PASCHI DI SIENA SPA FRN 29/06/2019 896,967 0.40ITALYEUR 500,000 BANCA POPOLARE DELL'ALTO ADIGE SPA FRN 06/10/2027 477,240 0.22ITALYEUR 500,000 BANCA POPOLARE DI MILANO SCARL 0.625% 08/06/2023 490,665 0.22ITALYEUR 1,000,000 BANCA SISTEMA SPA 1.75% 13/10/2020 987,350 0.44ITALYEUR 700,000 BANCO BPM SPA 1.0% 23/01/2025 682,710 0.31ITALYEUR 1,100,000 BANCO BPM SPA 1.75% 24/04/2023 1,029,941 0.46ITALYEUR 500,000 BANCO POPOLARE SC 2.75% 27/07/2020 504,535 0.23ITALY
Country
Statement of Investment Portfolio and Other Net Assets AUGUST 31, 2018
Notional or number of units / shares
ownedMarket Value
EUR% of Net
Assets
INTERFUND SYSTEM EVOLUTION
(continued)
Similar issues with same maturities have not been combined when issuance date differs.The accompanying notes are an integral part of these financial statements.General note: differences in sums, if any, are due to rounding.
Currency
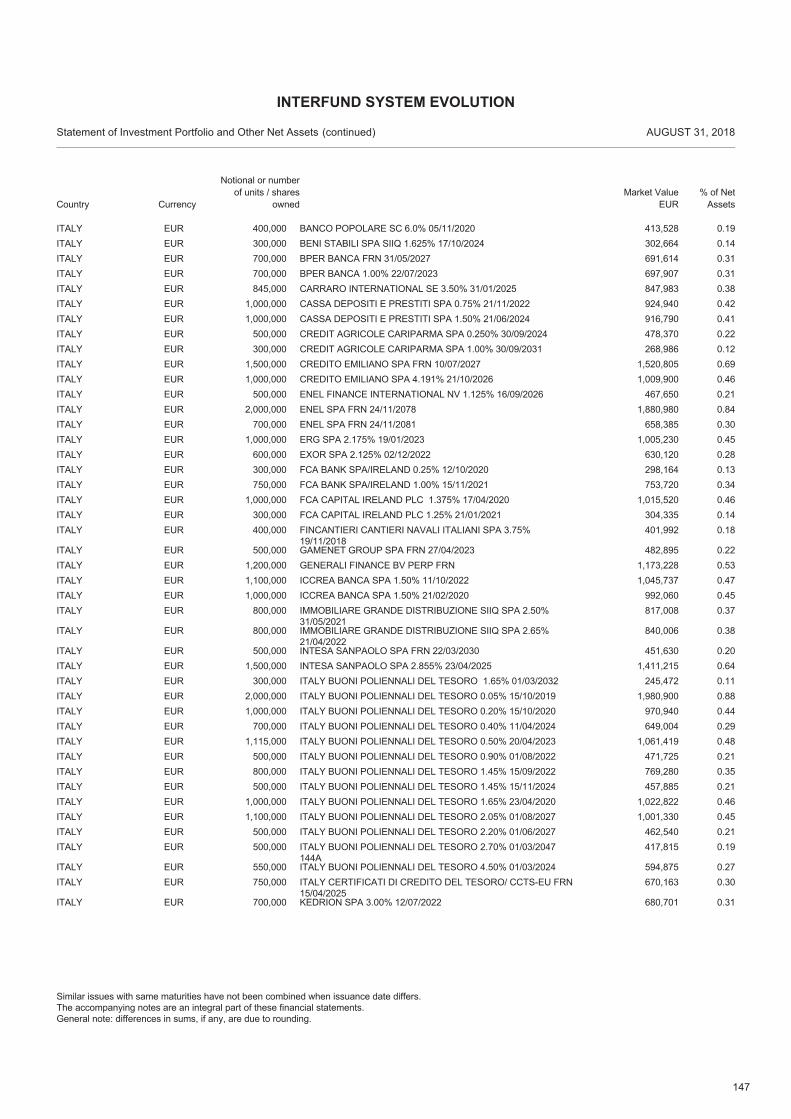
147
EUR 400,000 BANCO POPOLARE SC 6.0% 05/11/2020 413,528 0.19ITALYEUR 300,000 BENI STABILI SPA SIIQ 1.625% 17/10/2024 302,664 0.14ITALYEUR 700,000 BPER BANCA FRN 31/05/2027 691,614 0.31ITALYEUR 700,000 BPER BANCA 1.00% 22/07/2023 697,907 0.31ITALYEUR 845,000 CARRARO INTERNATIONAL SE 3.50% 31/01/2025 847,983 0.38ITALYEUR 1,000,000 CASSA DEPOSITI E PRESTITI SPA 0.75% 21/11/2022 924,940 0.42ITALYEUR 1,000,000 CASSA DEPOSITI E PRESTITI SPA 1.50% 21/06/2024 916,790 0.41ITALYEUR 500,000 CREDIT AGRICOLE CARIPARMA SPA 0.250% 30/09/2024 478,370 0.22ITALYEUR 300,000 CREDIT AGRICOLE CARIPARMA SPA 1.00% 30/09/2031 268,986 0.12ITALYEUR 1,500,000 CREDITO EMILIANO SPA FRN 10/07/2027 1,520,805 0.69ITALYEUR 1,000,000 CREDITO EMILIANO SPA 4.191% 21/10/2026 1,009,900 0.46ITALYEUR 500,000 ENEL FINANCE INTERNATIONAL NV 1.125% 16/09/2026 467,650 0.21ITALYEUR 2,000,000 ENEL SPA FRN 24/11/2078 1,880,980 0.84ITALYEUR 700,000 ENEL SPA FRN 24/11/2081 658,385 0.30ITALYEUR 1,000,000 ERG SPA 2.175% 19/01/2023 1,005,230 0.45ITALYEUR 600,000 EXOR SPA 2.125% 02/12/2022 630,120 0.28ITALYEUR 300,000 FCA BANK SPA/IRELAND 0.25% 12/10/2020 298,164 0.13ITALYEUR 750,000 FCA BANK SPA/IRELAND 1.00% 15/11/2021 753,720 0.34ITALYEUR 1,000,000 FCA CAPITAL IRELAND PLC 1.375% 17/04/2020 1,015,520 0.46ITALYEUR 300,000 FCA CAPITAL IRELAND PLC 1.25% 21/01/2021 304,335 0.14ITALYEUR 400,000 FINCANTIERI CANTIERI NAVALI ITALIANI SPA 3.75%
19/11/2018401,992 0.18ITALY
EUR 500,000 GAMENET GROUP SPA FRN 27/04/2023 482,895 0.22ITALYEUR 1,200,000 GENERALI FINANCE BV PERP FRN 1,173,228 0.53ITALYEUR 1,100,000 ICCREA BANCA SPA 1.50% 11/10/2022 1,045,737 0.47ITALYEUR 1,000,000 ICCREA BANCA SPA 1.50% 21/02/2020 992,060 0.45ITALYEUR 800,000 IMMOBILIARE GRANDE DISTRIBUZIONE SIIQ SPA 2.50%
31/05/2021817,008 0.37ITALY
EUR 800,000 IMMOBILIARE GRANDE DISTRIBUZIONE SIIQ SPA 2.65%21/04/2022
840,006 0.38ITALY
EUR 500,000 INTESA SANPAOLO SPA FRN 22/03/2030 451,630 0.20ITALYEUR 1,500,000 INTESA SANPAOLO SPA 2.855% 23/04/2025 1,411,215 0.64ITALYEUR 300,000 ITALY BUONI POLIENNALI DEL TESORO 1.65% 01/03/2032 245,472 0.11ITALYEUR 2,000,000 ITALY BUONI POLIENNALI DEL TESORO 0.05% 15/10/2019 1,980,900 0.88ITALYEUR 1,000,000 ITALY BUONI POLIENNALI DEL TESORO 0.20% 15/10/2020 970,940 0.44ITALYEUR 700,000 ITALY BUONI POLIENNALI DEL TESORO 0.40% 11/04/2024 649,004 0.29ITALYEUR 1,115,000 ITALY BUONI POLIENNALI DEL TESORO 0.50% 20/04/2023 1,061,419 0.48ITALYEUR 500,000 ITALY BUONI POLIENNALI DEL TESORO 0.90% 01/08/2022 471,725 0.21ITALYEUR 800,000 ITALY BUONI POLIENNALI DEL TESORO 1.45% 15/09/2022 769,280 0.35ITALYEUR 500,000 ITALY BUONI POLIENNALI DEL TESORO 1.45% 15/11/2024 457,885 0.21ITALYEUR 1,000,000 ITALY BUONI POLIENNALI DEL TESORO 1.65% 23/04/2020 1,022,822 0.46ITALYEUR 1,100,000 ITALY BUONI POLIENNALI DEL TESORO 2.05% 01/08/2027 1,001,330 0.45ITALYEUR 500,000 ITALY BUONI POLIENNALI DEL TESORO 2.20% 01/06/2027 462,540 0.21ITALYEUR 500,000 ITALY BUONI POLIENNALI DEL TESORO 2.70% 01/03/2047
144A417,815 0.19ITALY
EUR 550,000 ITALY BUONI POLIENNALI DEL TESORO 4.50% 01/03/2024 594,875 0.27ITALYEUR 750,000 ITALY CERTIFICATI DI CREDITO DEL TESORO/ CCTS-EU FRN
15/04/2025670,163 0.30ITALY
EUR 700,000 KEDRION SPA 3.00% 12/07/2022 680,701 0.31ITALY
Country
Statement of Investment Portfolio and Other Net Assets AUGUST 31, 2018
Notional or number of units / shares
ownedMarket Value
EUR% of Net
Assets
INTERFUND SYSTEM EVOLUTION
(continued)
Similar issues with same maturities have not been combined when issuance date differs.The accompanying notes are an integral part of these financial statements.General note: differences in sums, if any, are due to rounding.
Currency
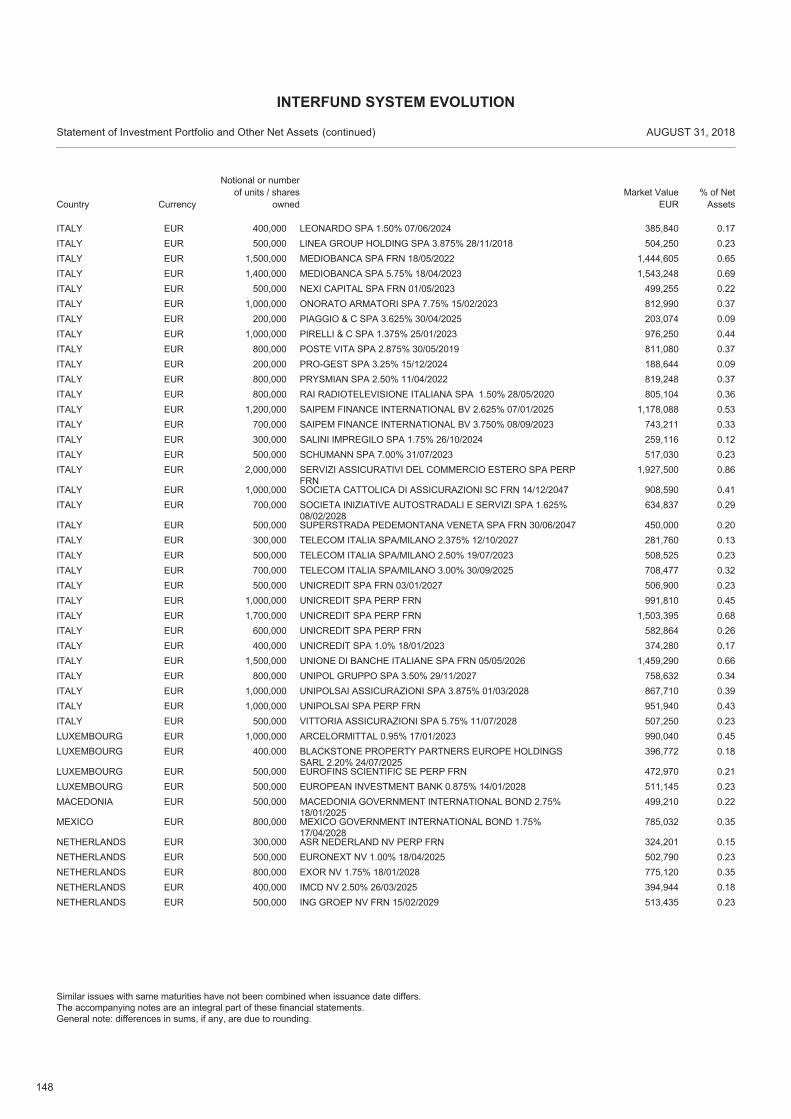
148
EUR 400,000 LEONARDO SPA 1.50% 07/06/2024 385,840 0.17ITALYEUR 500,000 LINEA GROUP HOLDING SPA 3.875% 28/11/2018 504,250 0.23ITALYEUR 1,500,000 MEDIOBANCA SPA FRN 18/05/2022 1,444,605 0.65ITALYEUR 1,400,000 MEDIOBANCA SPA 5.75% 18/04/2023 1,543,248 0.69ITALYEUR 500,000 NEXI CAPITAL SPA FRN 01/05/2023 499,255 0.22ITALYEUR 1,000,000 ONORATO ARMATORI SPA 7.75% 15/02/2023 812,990 0.37ITALYEUR 200,000 PIAGGIO & C SPA 3.625% 30/04/2025 203,074 0.09ITALYEUR 1,000,000 PIRELLI & C SPA 1.375% 25/01/2023 976,250 0.44ITALYEUR 800,000 POSTE VITA SPA 2.875% 30/05/2019 811,080 0.37ITALYEUR 200,000 PRO-GEST SPA 3.25% 15/12/2024 188,644 0.09ITALYEUR 800,000 PRYSMIAN SPA 2.50% 11/04/2022 819,248 0.37ITALYEUR 800,000 RAI RADIOTELEVISIONE ITALIANA SPA 1.50% 28/05/2020 805,104 0.36ITALYEUR 1,200,000 SAIPEM FINANCE INTERNATIONAL BV 2.625% 07/01/2025 1,178,088 0.53ITALYEUR 700,000 SAIPEM FINANCE INTERNATIONAL BV 3.750% 08/09/2023 743,211 0.33ITALYEUR 300,000 SALINI IMPREGILO SPA 1.75% 26/10/2024 259,116 0.12ITALYEUR 500,000 SCHUMANN SPA 7.00% 31/07/2023 517,030 0.23ITALYEUR 2,000,000 SERVIZI ASSICURATIVI DEL COMMERCIO ESTERO SPA PERP
FRN1,927,500 0.86ITALY
EUR 1,000,000 SOCIETA CATTOLICA DI ASSICURAZIONI SC FRN 14/12/2047 908,590 0.41ITALYEUR 700,000 SOCIETA INIZIATIVE AUTOSTRADALI E SERVIZI SPA 1.625%
08/02/2028634,837 0.29ITALY
EUR 500,000 SUPERSTRADA PEDEMONTANA VENETA SPA FRN 30/06/2047 450,000 0.20ITALYEUR 300,000 TELECOM ITALIA SPA/MILANO 2.375% 12/10/2027 281,760 0.13ITALYEUR 500,000 TELECOM ITALIA SPA/MILANO 2.50% 19/07/2023 508,525 0.23ITALYEUR 700,000 TELECOM ITALIA SPA/MILANO 3.00% 30/09/2025 708,477 0.32ITALYEUR 500,000 UNICREDIT SPA FRN 03/01/2027 506,900 0.23ITALYEUR 1,000,000 UNICREDIT SPA PERP FRN 991,810 0.45ITALYEUR 1,700,000 UNICREDIT SPA PERP FRN 1,503,395 0.68ITALYEUR 600,000 UNICREDIT SPA PERP FRN 582,864 0.26ITALYEUR 400,000 UNICREDIT SPA 1.0% 18/01/2023 374,280 0.17ITALYEUR 1,500,000 UNIONE DI BANCHE ITALIANE SPA FRN 05/05/2026 1,459,290 0.66ITALYEUR 800,000 UNIPOL GRUPPO SPA 3.50% 29/11/2027 758,632 0.34ITALYEUR 1,000,000 UNIPOLSAI ASSICURAZIONI SPA 3.875% 01/03/2028 867,710 0.39ITALYEUR 1,000,000 UNIPOLSAI SPA PERP FRN 951,940 0.43ITALYEUR 500,000 VITTORIA ASSICURAZIONI SPA 5.75% 11/07/2028 507,250 0.23ITALYEUR 1,000,000 ARCELORMITTAL 0.95% 17/01/2023 990,040 0.45LUXEMBOURGEUR 400,000 BLACKSTONE PROPERTY PARTNERS EUROPE HOLDINGS
SARL 2.20% 24/07/2025396,772 0.18LUXEMBOURG
EUR 500,000 EUROFINS SCIENTIFIC SE PERP FRN 472,970 0.21LUXEMBOURGEUR 500,000 EUROPEAN INVESTMENT BANK 0.875% 14/01/2028 511,145 0.23LUXEMBOURGEUR 500,000 MACEDONIA GOVERNMENT INTERNATIONAL BOND 2.75%
18/01/2025499,210 0.22MACEDONIA
EUR 800,000 MEXICO GOVERNMENT INTERNATIONAL BOND 1.75%17/04/2028
785,032 0.35MEXICO
EUR 300,000 ASR NEDERLAND NV PERP FRN 324,201 0.15NETHERLANDSEUR 500,000 EURONEXT NV 1.00% 18/04/2025 502,790 0.23NETHERLANDSEUR 800,000 EXOR NV 1.75% 18/01/2028 775,120 0.35NETHERLANDSEUR 400,000 IMCD NV 2.50% 26/03/2025 394,944 0.18NETHERLANDSEUR 500,000 ING GROEP NV FRN 15/02/2029 513,435 0.23NETHERLANDS
Country
Statement of Investment Portfolio and Other Net Assets AUGUST 31, 2018
Notional or number of units / shares
ownedMarket Value
EUR% of Net
Assets
INTERFUND SYSTEM EVOLUTION
(continued)
Similar issues with same maturities have not been combined when issuance date differs.The accompanying notes are an integral part of these financial statements.General note: differences in sums, if any, are due to rounding.
Currency
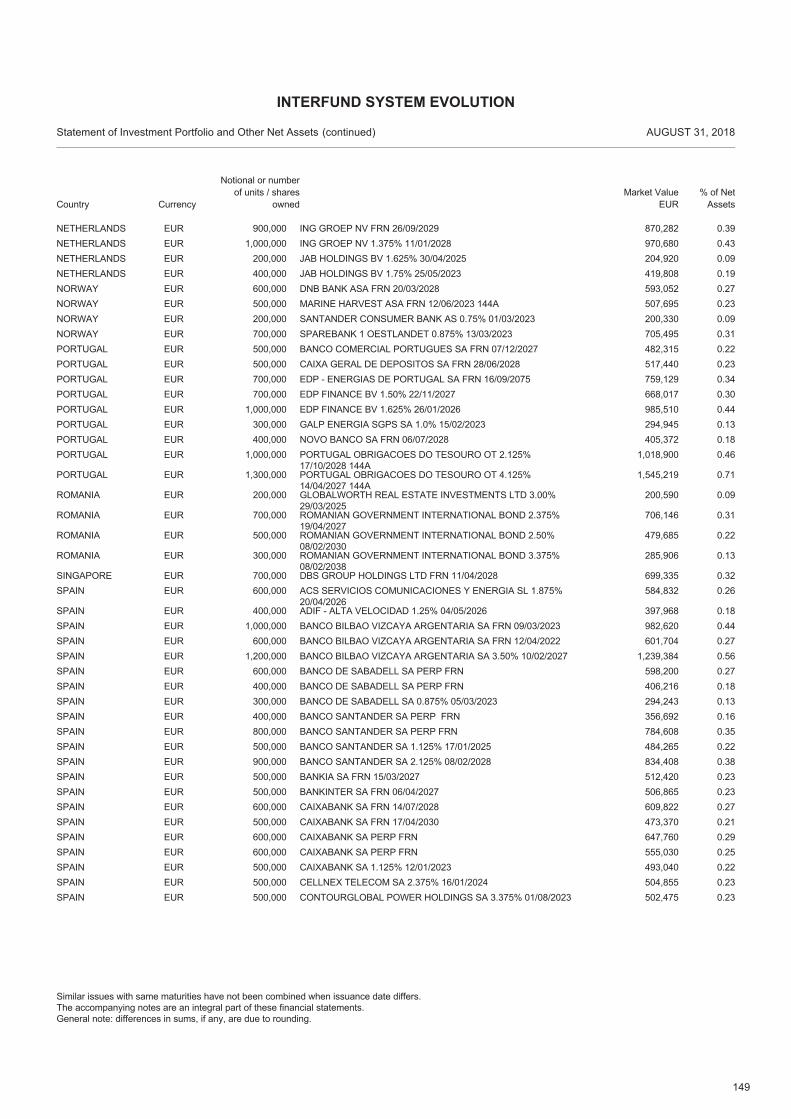
149
EUR 900,000 ING GROEP NV FRN 26/09/2029 870,282 0.39NETHERLANDSEUR 1,000,000 ING GROEP NV 1.375% 11/01/2028 970,680 0.43NETHERLANDSEUR 200,000 JAB HOLDINGS BV 1.625% 30/04/2025 204,920 0.09NETHERLANDSEUR 400,000 JAB HOLDINGS BV 1.75% 25/05/2023 419,808 0.19NETHERLANDSEUR 600,000 DNB BANK ASA FRN 20/03/2028 593,052 0.27NORWAYEUR 500,000 MARINE HARVEST ASA FRN 12/06/2023 144A 507,695 0.23NORWAYEUR 200,000 SANTANDER CONSUMER BANK AS 0.75% 01/03/2023 200,330 0.09NORWAYEUR 700,000 SPAREBANK 1 OESTLANDET 0.875% 13/03/2023 705,495 0.31NORWAYEUR 500,000 BANCO COMERCIAL PORTUGUES SA FRN 07/12/2027 482,315 0.22PORTUGALEUR 500,000 CAIXA GERAL DE DEPOSITOS SA FRN 28/06/2028 517,440 0.23PORTUGALEUR 700,000 EDP - ENERGIAS DE PORTUGAL SA FRN 16/09/2075 759,129 0.34PORTUGALEUR 700,000 EDP FINANCE BV 1.50% 22/11/2027 668,017 0.30PORTUGALEUR 1,000,000 EDP FINANCE BV 1.625% 26/01/2026 985,510 0.44PORTUGALEUR 300,000 GALP ENERGIA SGPS SA 1.0% 15/02/2023 294,945 0.13PORTUGALEUR 400,000 NOVO BANCO SA FRN 06/07/2028 405,372 0.18PORTUGALEUR 1,000,000 PORTUGAL OBRIGACOES DO TESOURO OT 2.125%
17/10/2028 144A1,018,900 0.46PORTUGAL
EUR 1,300,000 PORTUGAL OBRIGACOES DO TESOURO OT 4.125%14/04/2027 144A
1,545,219 0.71PORTUGAL
EUR 200,000 GLOBALWORTH REAL ESTATE INVESTMENTS LTD 3.00%29/03/2025
200,590 0.09ROMANIA
EUR 700,000 ROMANIAN GOVERNMENT INTERNATIONAL BOND 2.375%19/04/2027
706,146 0.31ROMANIA
EUR 500,000 ROMANIAN GOVERNMENT INTERNATIONAL BOND 2.50%08/02/2030
479,685 0.22ROMANIA
EUR 300,000 ROMANIAN GOVERNMENT INTERNATIONAL BOND 3.375%08/02/2038
285,906 0.13ROMANIA
EUR 700,000 DBS GROUP HOLDINGS LTD FRN 11/04/2028 699,335 0.32SINGAPOREEUR 600,000 ACS SERVICIOS COMUNICACIONES Y ENERGIA SL 1.875%
20/04/2026584,832 0.26SPAIN
EUR 400,000 ADIF - ALTA VELOCIDAD 1.25% 04/05/2026 397,968 0.18SPAINEUR 1,000,000 BANCO BILBAO VIZCAYA ARGENTARIA SA FRN 09/03/2023 982,620 0.44SPAINEUR 600,000 BANCO BILBAO VIZCAYA ARGENTARIA SA FRN 12/04/2022 601,704 0.27SPAINEUR 1,200,000 BANCO BILBAO VIZCAYA ARGENTARIA SA 3.50% 10/02/2027 1,239,384 0.56SPAINEUR 600,000 BANCO DE SABADELL SA PERP FRN 598,200 0.27SPAINEUR 400,000 BANCO DE SABADELL SA PERP FRN 406,216 0.18SPAINEUR 300,000 BANCO DE SABADELL SA 0.875% 05/03/2023 294,243 0.13SPAINEUR 400,000 BANCO SANTANDER SA PERP FRN 356,692 0.16SPAINEUR 800,000 BANCO SANTANDER SA PERP FRN 784,608 0.35SPAINEUR 500,000 BANCO SANTANDER SA 1.125% 17/01/2025 484,265 0.22SPAINEUR 900,000 BANCO SANTANDER SA 2.125% 08/02/2028 834,408 0.38SPAINEUR 500,000 BANKIA SA FRN 15/03/2027 512,420 0.23SPAINEUR 500,000 BANKINTER SA FRN 06/04/2027 506,865 0.23SPAINEUR 600,000 CAIXABANK SA FRN 14/07/2028 609,822 0.27SPAINEUR 500,000 CAIXABANK SA FRN 17/04/2030 473,370 0.21SPAINEUR 600,000 CAIXABANK SA PERP FRN 647,760 0.29SPAINEUR 600,000 CAIXABANK SA PERP FRN 555,030 0.25SPAINEUR 500,000 CAIXABANK SA 1.125% 12/01/2023 493,040 0.22SPAINEUR 500,000 CELLNEX TELECOM SA 2.375% 16/01/2024 504,855 0.23SPAINEUR 500,000 CONTOURGLOBAL POWER HOLDINGS SA 3.375% 01/08/2023 502,475 0.23SPAIN
Country
Statement of Investment Portfolio and Other Net Assets AUGUST 31, 2018
Notional or number of units / shares
ownedMarket Value
EUR% of Net
Assets
INTERFUND SYSTEM EVOLUTION
(continued)
Similar issues with same maturities have not been combined when issuance date differs.The accompanying notes are an integral part of these financial statements.General note: differences in sums, if any, are due to rounding.
Currency
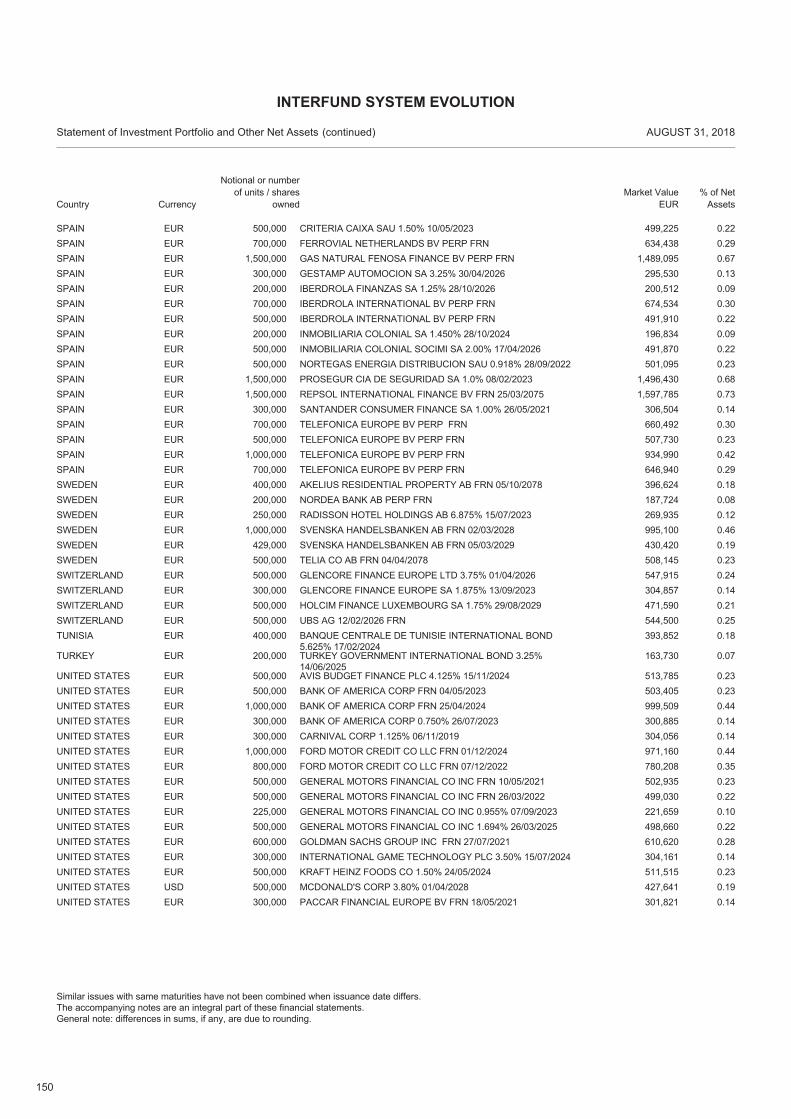
150
EUR 500,000 CRITERIA CAIXA SAU 1.50% 10/05/2023 499,225 0.22SPAINEUR 700,000 FERROVIAL NETHERLANDS BV PERP FRN 634,438 0.29SPAINEUR 1,500,000 GAS NATURAL FENOSA FINANCE BV PERP FRN 1,489,095 0.67SPAINEUR 300,000 GESTAMP AUTOMOCION SA 3.25% 30/04/2026 295,530 0.13SPAINEUR 200,000 IBERDROLA FINANZAS SA 1.25% 28/10/2026 200,512 0.09SPAINEUR 700,000 IBERDROLA INTERNATIONAL BV PERP FRN 674,534 0.30SPAINEUR 500,000 IBERDROLA INTERNATIONAL BV PERP FRN 491,910 0.22SPAINEUR 200,000 INMOBILIARIA COLONIAL SA 1.450% 28/10/2024 196,834 0.09SPAINEUR 500,000 INMOBILIARIA COLONIAL SOCIMI SA 2.00% 17/04/2026 491,870 0.22SPAINEUR 500,000 NORTEGAS ENERGIA DISTRIBUCION SAU 0.918% 28/09/2022 501,095 0.23SPAINEUR 1,500,000 PROSEGUR CIA DE SEGURIDAD SA 1.0% 08/02/2023 1,496,430 0.68SPAINEUR 1,500,000 REPSOL INTERNATIONAL FINANCE BV FRN 25/03/2075 1,597,785 0.73SPAINEUR 300,000 SANTANDER CONSUMER FINANCE SA 1.00% 26/05/2021 306,504 0.14SPAINEUR 700,000 TELEFONICA EUROPE BV PERP FRN 660,492 0.30SPAINEUR 500,000 TELEFONICA EUROPE BV PERP FRN 507,730 0.23SPAINEUR 1,000,000 TELEFONICA EUROPE BV PERP FRN 934,990 0.42SPAINEUR 700,000 TELEFONICA EUROPE BV PERP FRN 646,940 0.29SPAINEUR 400,000 AKELIUS RESIDENTIAL PROPERTY AB FRN 05/10/2078 396,624 0.18SWEDENEUR 200,000 NORDEA BANK AB PERP FRN 187,724 0.08SWEDENEUR 250,000 RADISSON HOTEL HOLDINGS AB 6.875% 15/07/2023 269,935 0.12SWEDENEUR 1,000,000 SVENSKA HANDELSBANKEN AB FRN 02/03/2028 995,100 0.46SWEDENEUR 429,000 SVENSKA HANDELSBANKEN AB FRN 05/03/2029 430,420 0.19SWEDENEUR 500,000 TELIA CO AB FRN 04/04/2078 508,145 0.23SWEDENEUR 500,000 GLENCORE FINANCE EUROPE LTD 3.75% 01/04/2026 547,915 0.24SWITZERLANDEUR 300,000 GLENCORE FINANCE EUROPE SA 1.875% 13/09/2023 304,857 0.14SWITZERLANDEUR 500,000 HOLCIM FINANCE LUXEMBOURG SA 1.75% 29/08/2029 471,590 0.21SWITZERLANDEUR 500,000 UBS AG 12/02/2026 FRN 544,500 0.25SWITZERLANDEUR 400,000 BANQUE CENTRALE DE TUNISIE INTERNATIONAL BOND
5.625% 17/02/2024393,852 0.18TUNISIA
EUR 200,000 TURKEY GOVERNMENT INTERNATIONAL BOND 3.25%14/06/2025
163,730 0.07TURKEY
EUR 500,000 AVIS BUDGET FINANCE PLC 4.125% 15/11/2024 513,785 0.23UNITED STATESEUR 500,000 BANK OF AMERICA CORP FRN 04/05/2023 503,405 0.23UNITED STATESEUR 1,000,000 BANK OF AMERICA CORP FRN 25/04/2024 999,509 0.44UNITED STATESEUR 300,000 BANK OF AMERICA CORP 0.750% 26/07/2023 300,885 0.14UNITED STATESEUR 300,000 CARNIVAL CORP 1.125% 06/11/2019 304,056 0.14UNITED STATESEUR 1,000,000 FORD MOTOR CREDIT CO LLC FRN 01/12/2024 971,160 0.44UNITED STATESEUR 800,000 FORD MOTOR CREDIT CO LLC FRN 07/12/2022 780,208 0.35UNITED STATESEUR 500,000 GENERAL MOTORS FINANCIAL CO INC FRN 10/05/2021 502,935 0.23UNITED STATESEUR 500,000 GENERAL MOTORS FINANCIAL CO INC FRN 26/03/2022 499,030 0.22UNITED STATESEUR 225,000 GENERAL MOTORS FINANCIAL CO INC 0.955% 07/09/2023 221,659 0.10UNITED STATESEUR 500,000 GENERAL MOTORS FINANCIAL CO INC 1.694% 26/03/2025 498,660 0.22UNITED STATESEUR 600,000 GOLDMAN SACHS GROUP INC FRN 27/07/2021 610,620 0.28UNITED STATESEUR 300,000 INTERNATIONAL GAME TECHNOLOGY PLC 3.50% 15/07/2024 304,161 0.14UNITED STATESEUR 500,000 KRAFT HEINZ FOODS CO 1.50% 24/05/2024 511,515 0.23UNITED STATESUSD 500,000 MCDONALD'S CORP 3.80% 01/04/2028 427,641 0.19UNITED STATESEUR 300,000 PACCAR FINANCIAL EUROPE BV FRN 18/05/2021 301,821 0.14UNITED STATES
Country
Statement of Investment Portfolio and Other Net Assets AUGUST 31, 2018
Notional or number of units / shares
ownedMarket Value
EUR% of Net
Assets
INTERFUND SYSTEM EVOLUTION
(continued)
Similar issues with same maturities have not been combined when issuance date differs.The accompanying notes are an integral part of these financial statements.General note: differences in sums, if any, are due to rounding.
Currency
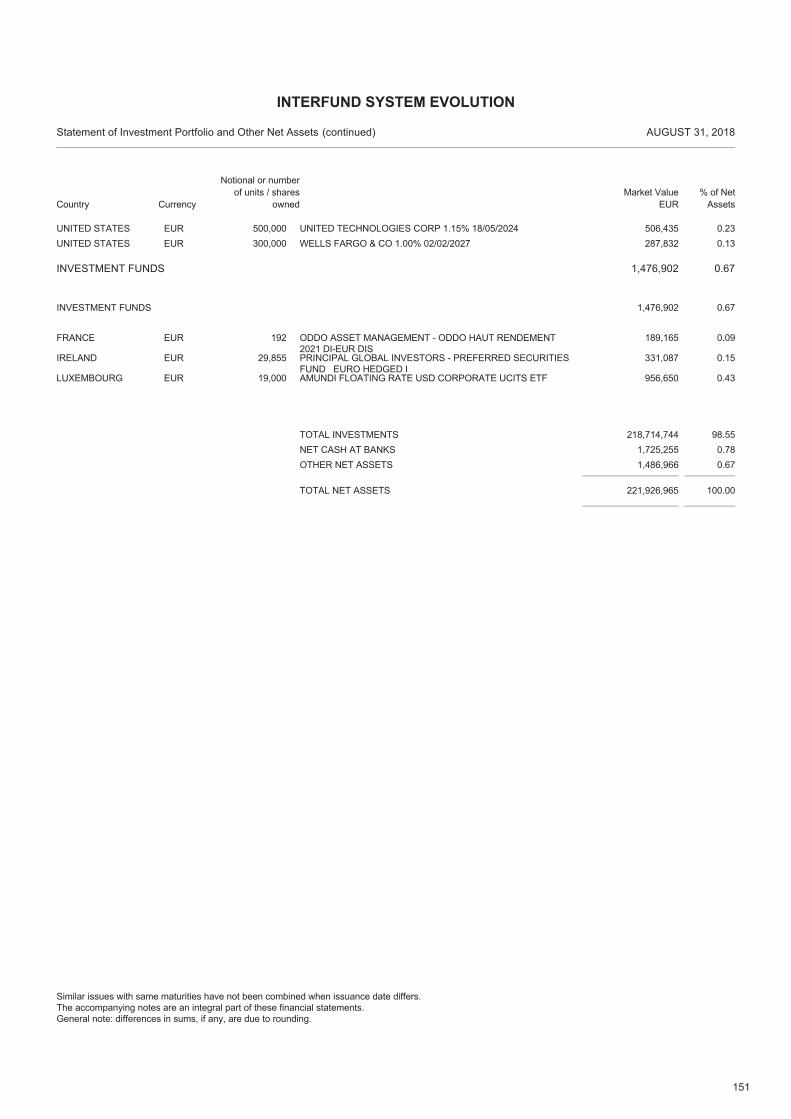
151
EUR 500,000 UNITED TECHNOLOGIES CORP 1.15% 18/05/2024 506,435 0.23UNITED STATESEUR 300,000 WELLS FARGO & CO 1.00% 02/02/2027 287,832 0.13UNITED STATES
INVESTMENT FUNDS 1,476,902 0.67
EUR 192 ODDO ASSET MANAGEMENT - ODDO HAUT RENDEMENT2021 DI-EUR DIS
189,165 0.09FRANCE
INVESTMENT FUNDS 0.671,476,902
EUR 29,855 PRINCIPAL GLOBAL INVESTORS - PREFERRED SECURITIESFUND EURO HEDGED I
331,087 0.15IRELAND
EUR 19,000 AMUNDI FLOATING RATE USD CORPORATE UCITS ETF 956,650 0.43LUXEMBOURG
TOTAL NET ASSETS 221,926,965 100.00
TOTAL INVESTMENTS 218,714,744 98.55NET CASH AT BANKS 1,725,255 0.78OTHER NET ASSETS 1,486,966 0.67
Country
Statement of Investment Portfolio and Other Net Assets AUGUST 31, 2018
Notional or number of units / shares
ownedMarket Value
EUR% of Net
Assets
INTERFUND SYSTEM EVOLUTION
(continued)
Similar issues with same maturities have not been combined when issuance date differs.The accompanying notes are an integral part of these financial statements.General note: differences in sums, if any, are due to rounding.
Currency
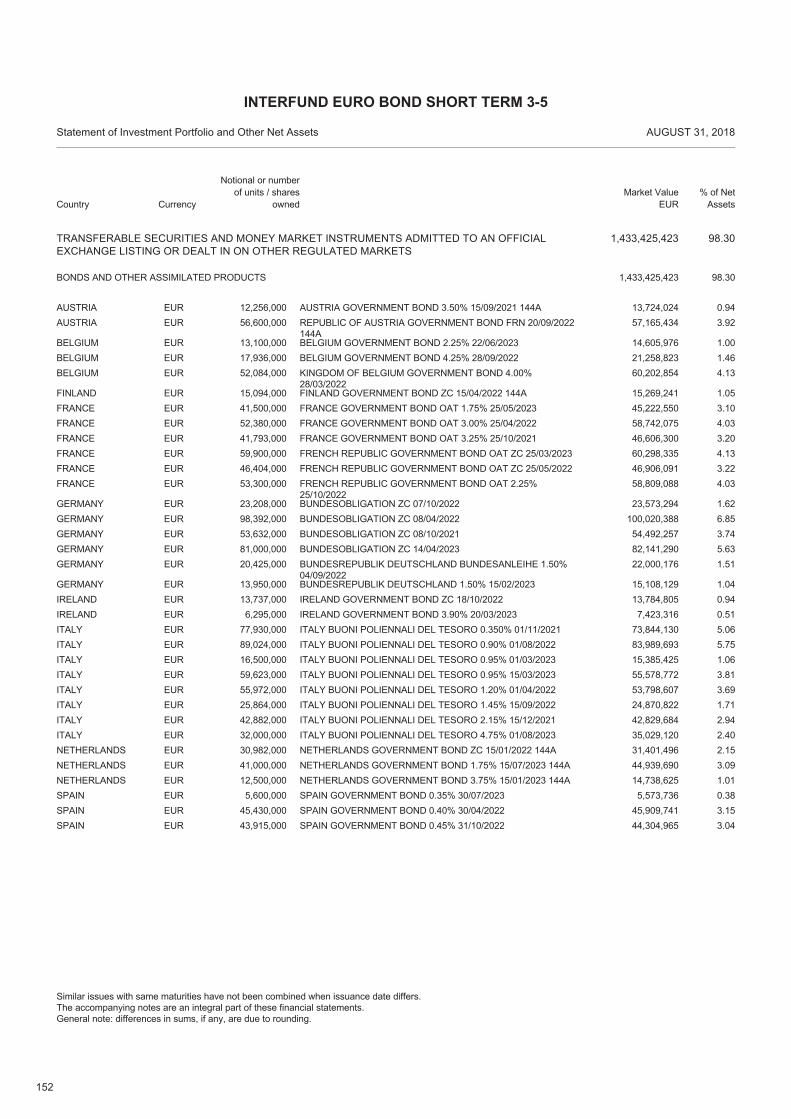
152
TRANSFERABLE SECURITIES AND MONEY MARKET INSTRUMENTS ADMITTED TO AN OFFICIALEXCHANGE LISTING OR DEALT IN ON OTHER REGULATED MARKETS
1,433,425,423 98.30
EUR 12,256,000 AUSTRIA GOVERNMENT BOND 3.50% 15/09/2021 144A 13,724,024 0.94AUSTRIA
BONDS AND OTHER ASSIMILATED PRODUCTS 98.301,433,425,423
EUR 56,600,000 REPUBLIC OF AUSTRIA GOVERNMENT BOND FRN 20/09/2022144A
57,165,434 3.92AUSTRIA
EUR 13,100,000 BELGIUM GOVERNMENT BOND 2.25% 22/06/2023 14,605,976 1.00BELGIUMEUR 17,936,000 BELGIUM GOVERNMENT BOND 4.25% 28/09/2022 21,258,823 1.46BELGIUMEUR 52,084,000 KINGDOM OF BELGIUM GOVERNMENT BOND 4.00%
28/03/202260,202,854 4.13BELGIUM
EUR 15,094,000 FINLAND GOVERNMENT BOND ZC 15/04/2022 144A 15,269,241 1.05FINLANDEUR 41,500,000 FRANCE GOVERNMENT BOND OAT 1.75% 25/05/2023 45,222,550 3.10FRANCEEUR 52,380,000 FRANCE GOVERNMENT BOND OAT 3.00% 25/04/2022 58,742,075 4.03FRANCEEUR 41,793,000 FRANCE GOVERNMENT BOND OAT 3.25% 25/10/2021 46,606,300 3.20FRANCEEUR 59,900,000 FRENCH REPUBLIC GOVERNMENT BOND OAT ZC 25/03/2023 60,298,335 4.13FRANCEEUR 46,404,000 FRENCH REPUBLIC GOVERNMENT BOND OAT ZC 25/05/2022 46,906,091 3.22FRANCEEUR 53,300,000 FRENCH REPUBLIC GOVERNMENT BOND OAT 2.25%
25/10/202258,809,088 4.03FRANCE
EUR 23,208,000 BUNDESOBLIGATION ZC 07/10/2022 23,573,294 1.62GERMANYEUR 98,392,000 BUNDESOBLIGATION ZC 08/04/2022 100,020,388 6.85GERMANYEUR 53,632,000 BUNDESOBLIGATION ZC 08/10/2021 54,492,257 3.74GERMANYEUR 81,000,000 BUNDESOBLIGATION ZC 14/04/2023 82,141,290 5.63GERMANYEUR 20,425,000 BUNDESREPUBLIK DEUTSCHLAND BUNDESANLEIHE 1.50%
04/09/202222,000,176 1.51GERMANY
EUR 13,950,000 BUNDESREPUBLIK DEUTSCHLAND 1.50% 15/02/2023 15,108,129 1.04GERMANYEUR 13,737,000 IRELAND GOVERNMENT BOND ZC 18/10/2022 13,784,805 0.94IRELANDEUR 6,295,000 IRELAND GOVERNMENT BOND 3.90% 20/03/2023 7,423,316 0.51IRELANDEUR 77,930,000 ITALY BUONI POLIENNALI DEL TESORO 0.350% 01/11/2021 73,844,130 5.06ITALYEUR 89,024,000 ITALY BUONI POLIENNALI DEL TESORO 0.90% 01/08/2022 83,989,693 5.75ITALYEUR 16,500,000 ITALY BUONI POLIENNALI DEL TESORO 0.95% 01/03/2023 15,385,425 1.06ITALYEUR 59,623,000 ITALY BUONI POLIENNALI DEL TESORO 0.95% 15/03/2023 55,578,772 3.81ITALYEUR 55,972,000 ITALY BUONI POLIENNALI DEL TESORO 1.20% 01/04/2022 53,798,607 3.69ITALYEUR 25,864,000 ITALY BUONI POLIENNALI DEL TESORO 1.45% 15/09/2022 24,870,822 1.71ITALYEUR 42,882,000 ITALY BUONI POLIENNALI DEL TESORO 2.15% 15/12/2021 42,829,684 2.94ITALYEUR 32,000,000 ITALY BUONI POLIENNALI DEL TESORO 4.75% 01/08/2023 35,029,120 2.40ITALYEUR 30,982,000 NETHERLANDS GOVERNMENT BOND ZC 15/01/2022 144A 31,401,496 2.15NETHERLANDSEUR 41,000,000 NETHERLANDS GOVERNMENT BOND 1.75% 15/07/2023 144A 44,939,690 3.09NETHERLANDSEUR 12,500,000 NETHERLANDS GOVERNMENT BOND 3.75% 15/01/2023 144A 14,738,625 1.01NETHERLANDSEUR 5,600,000 SPAIN GOVERNMENT BOND 0.35% 30/07/2023 5,573,736 0.38SPAINEUR 45,430,000 SPAIN GOVERNMENT BOND 0.40% 30/04/2022 45,909,741 3.15SPAINEUR 43,915,000 SPAIN GOVERNMENT BOND 0.45% 31/10/2022 44,304,965 3.04SPAIN
Country
Statement of Investment Portfolio and Other Net Assets AUGUST 31, 2018
Notional or number of units / shares
ownedMarket Value
EUR% of Net
Assets
INTERFUND EURO BOND SHORT TERM 3-5
Similar issues with same maturities have not been combined when issuance date differs.The accompanying notes are an integral part of these financial statements.General note: differences in sums, if any, are due to rounding.
Currency

153
EUR 36,637,000 SPAIN GOVERNMENT BOND 5.85% 31/01/2022 43,876,471 3.01SPAIN
TOTAL NET ASSETS 1,458,174,553 100.00
TOTAL INVESTMENTS 1,433,425,423 98.30NET CASH AT BANKS 13,828,041 0.95OTHER NET ASSETS 10,921,089 0.75
Country
Statement of Investment Portfolio and Other Net Assets AUGUST 31, 2018
Notional or number of units / shares
ownedMarket Value
EUR% of Net
Assets
INTERFUND EURO BOND SHORT TERM 3-5
(continued)
Similar issues with same maturities have not been combined when issuance date differs.The accompanying notes are an integral part of these financial statements.General note: differences in sums, if any, are due to rounding.
Currency
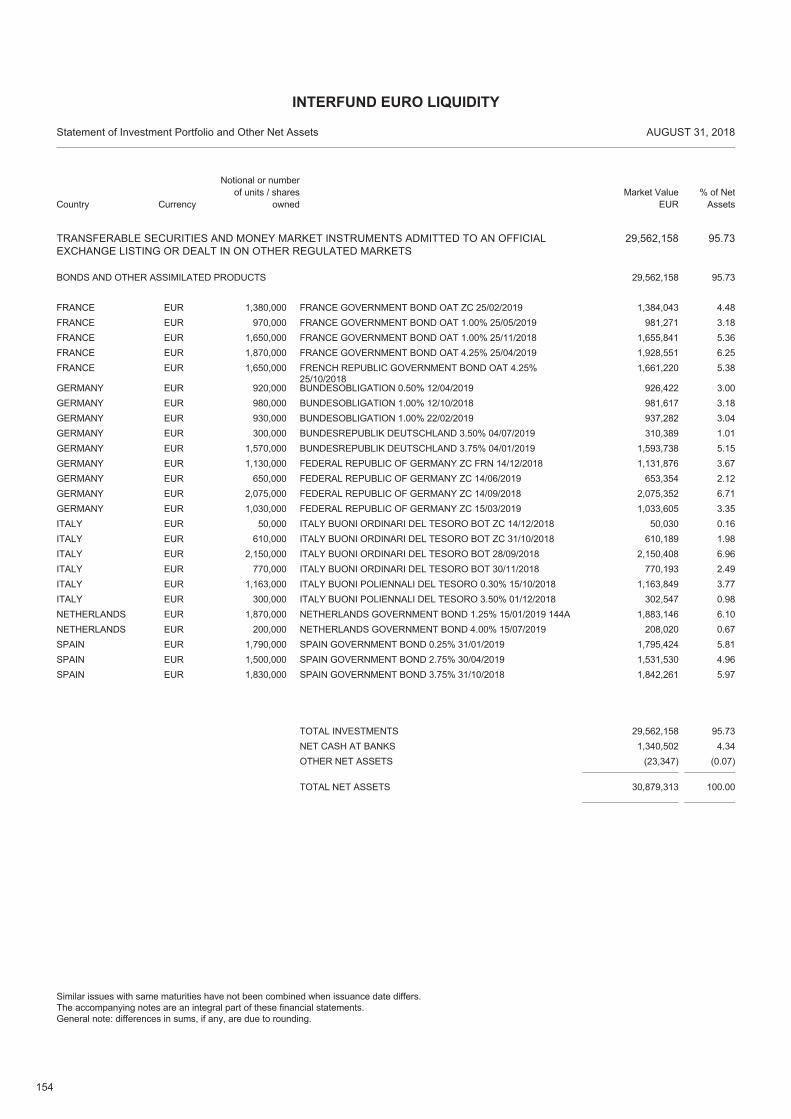
154
TRANSFERABLE SECURITIES AND MONEY MARKET INSTRUMENTS ADMITTED TO AN OFFICIALEXCHANGE LISTING OR DEALT IN ON OTHER REGULATED MARKETS
29,562,158 95.73
EUR 1,380,000 FRANCE GOVERNMENT BOND OAT ZC 25/02/2019 1,384,043 4.48FRANCE
BONDS AND OTHER ASSIMILATED PRODUCTS 95.7329,562,158
EUR 970,000 FRANCE GOVERNMENT BOND OAT 1.00% 25/05/2019 981,271 3.18FRANCEEUR 1,650,000 FRANCE GOVERNMENT BOND OAT 1.00% 25/11/2018 1,655,841 5.36FRANCEEUR 1,870,000 FRANCE GOVERNMENT BOND OAT 4.25% 25/04/2019 1,928,551 6.25FRANCEEUR 1,650,000 FRENCH REPUBLIC GOVERNMENT BOND OAT 4.25%
25/10/20181,661,220 5.38FRANCE
EUR 920,000 BUNDESOBLIGATION 0.50% 12/04/2019 926,422 3.00GERMANYEUR 980,000 BUNDESOBLIGATION 1.00% 12/10/2018 981,617 3.18GERMANYEUR 930,000 BUNDESOBLIGATION 1.00% 22/02/2019 937,282 3.04GERMANYEUR 300,000 BUNDESREPUBLIK DEUTSCHLAND 3.50% 04/07/2019 310,389 1.01GERMANYEUR 1,570,000 BUNDESREPUBLIK DEUTSCHLAND 3.75% 04/01/2019 1,593,738 5.15GERMANYEUR 1,130,000 FEDERAL REPUBLIC OF GERMANY ZC FRN 14/12/2018 1,131,876 3.67GERMANYEUR 650,000 FEDERAL REPUBLIC OF GERMANY ZC 14/06/2019 653,354 2.12GERMANYEUR 2,075,000 FEDERAL REPUBLIC OF GERMANY ZC 14/09/2018 2,075,352 6.71GERMANYEUR 1,030,000 FEDERAL REPUBLIC OF GERMANY ZC 15/03/2019 1,033,605 3.35GERMANYEUR 50,000 ITALY BUONI ORDINARI DEL TESORO BOT ZC 14/12/2018 50,030 0.16ITALYEUR 610,000 ITALY BUONI ORDINARI DEL TESORO BOT ZC 31/10/2018 610,189 1.98ITALYEUR 2,150,000 ITALY BUONI ORDINARI DEL TESORO BOT 28/09/2018 2,150,408 6.96ITALYEUR 770,000 ITALY BUONI ORDINARI DEL TESORO BOT 30/11/2018 770,193 2.49ITALYEUR 1,163,000 ITALY BUONI POLIENNALI DEL TESORO 0.30% 15/10/2018 1,163,849 3.77ITALYEUR 300,000 ITALY BUONI POLIENNALI DEL TESORO 3.50% 01/12/2018 302,547 0.98ITALYEUR 1,870,000 NETHERLANDS GOVERNMENT BOND 1.25% 15/01/2019 144A 1,883,146 6.10NETHERLANDSEUR 200,000 NETHERLANDS GOVERNMENT BOND 4.00% 15/07/2019 208,020 0.67NETHERLANDSEUR 1,790,000 SPAIN GOVERNMENT BOND 0.25% 31/01/2019 1,795,424 5.81SPAINEUR 1,500,000 SPAIN GOVERNMENT BOND 2.75% 30/04/2019 1,531,530 4.96SPAINEUR 1,830,000 SPAIN GOVERNMENT BOND 3.75% 31/10/2018 1,842,261 5.97SPAIN
TOTAL NET ASSETS 30,879,313 100.00
TOTAL INVESTMENTS 29,562,158 95.73NET CASH AT BANKS 1,340,502 4.34OTHER NET ASSETS (23,347) (0.07)
Country
Statement of Investment Portfolio and Other Net Assets AUGUST 31, 2018
Notional or number of units / shares
ownedMarket Value
EUR% of Net
Assets
INTERFUND EURO LIQUIDITY
Similar issues with same maturities have not been combined when issuance date differs.The accompanying notes are an integral part of these financial statements.General note: differences in sums, if any, are due to rounding.
Currency
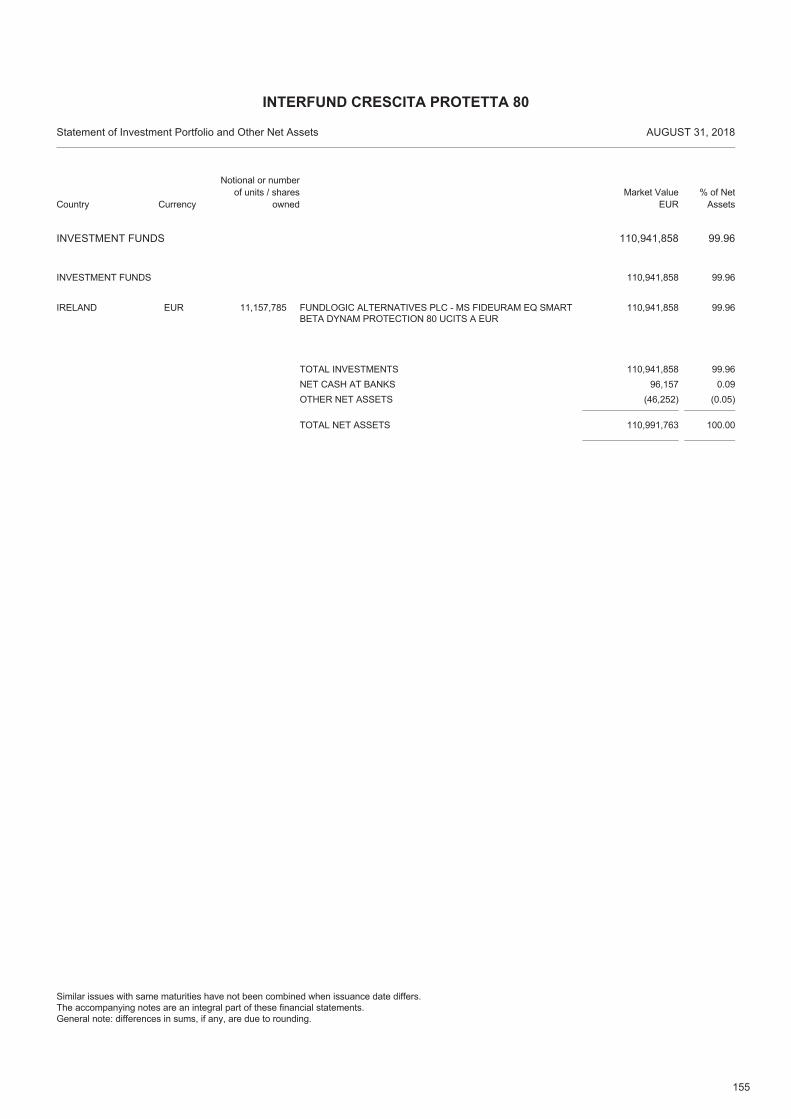
155
INVESTMENT FUNDS 110,941,858 99.96
EUR 11,157,785 FUNDLOGIC ALTERNATIVES PLC - MS FIDEURAM EQ SMARTBETA DYNAM PROTECTION 80 UCITS A EUR
110,941,858 99.96IRELAND
INVESTMENT FUNDS 99.96110,941,858
TOTAL NET ASSETS 110,991,763 100.00
TOTAL INVESTMENTS 110,941,858 99.96NET CASH AT BANKS 96,157 0.09OTHER NET ASSETS (46,252) (0.05)
Country
Statement of Investment Portfolio and Other Net Assets AUGUST 31, 2018
Notional or number of units / shares
ownedMarket Value
EUR% of Net
Assets
INTERFUND CRESCITA PROTETTA 80
Similar issues with same maturities have not been combined when issuance date differs.The accompanying notes are an integral part of these financial statements.General note: differences in sums, if any, are due to rounding.
Currency
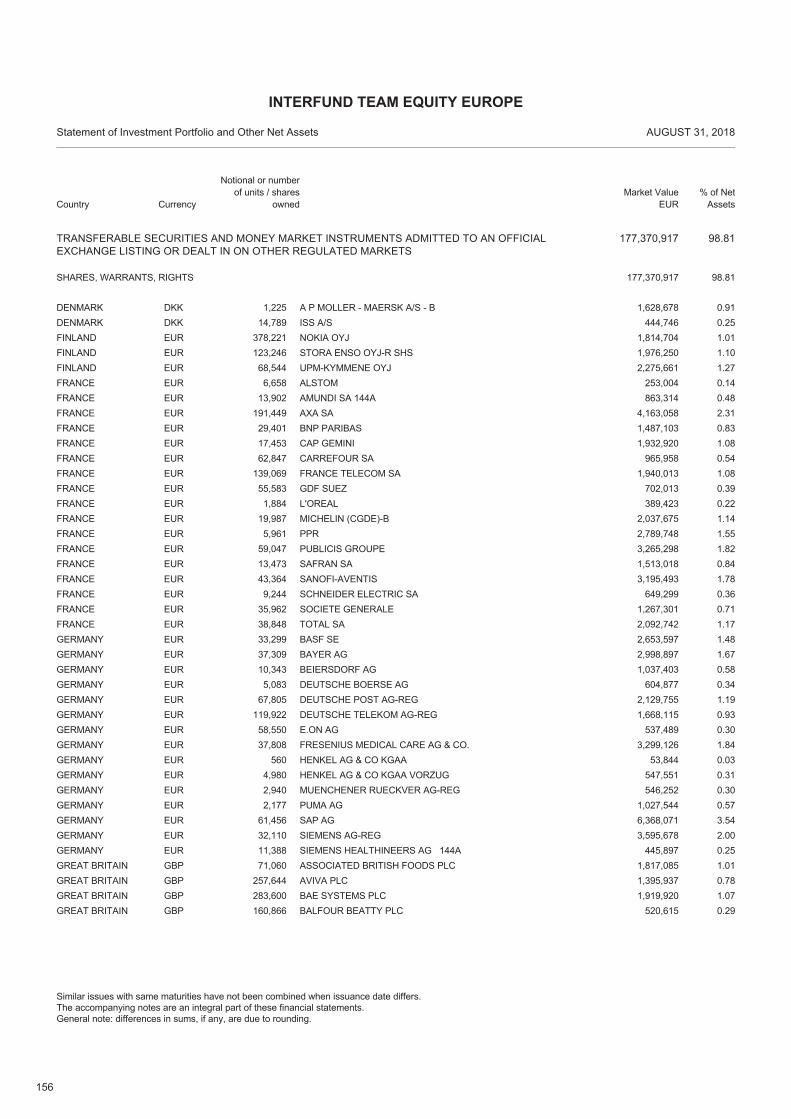
156
TRANSFERABLE SECURITIES AND MONEY MARKET INSTRUMENTS ADMITTED TO AN OFFICIALEXCHANGE LISTING OR DEALT IN ON OTHER REGULATED MARKETS
177,370,917 98.81
DKK 1,225 A P MOLLER - MAERSK A/S - B 1,628,678 0.91DENMARK
SHARES, WARRANTS, RIGHTS 98.81177,370,917
DKK 14,789 ISS A/S 444,746 0.25DENMARKEUR 378,221 NOKIA OYJ 1,814,704 1.01FINLANDEUR 123,246 STORA ENSO OYJ-R SHS 1,976,250 1.10FINLANDEUR 68,544 UPM-KYMMENE OYJ 2,275,661 1.27FINLANDEUR 6,658 ALSTOM 253,004 0.14FRANCEEUR 13,902 AMUNDI SA 144A 863,314 0.48FRANCEEUR 191,449 AXA SA 4,163,058 2.31FRANCEEUR 29,401 BNP PARIBAS 1,487,103 0.83FRANCEEUR 17,453 CAP GEMINI 1,932,920 1.08FRANCEEUR 62,847 CARREFOUR SA 965,958 0.54FRANCEEUR 139,069 FRANCE TELECOM SA 1,940,013 1.08FRANCEEUR 55,583 GDF SUEZ 702,013 0.39FRANCEEUR 1,884 L'OREAL 389,423 0.22FRANCEEUR 19,987 MICHELIN (CGDE)-B 2,037,675 1.14FRANCEEUR 5,961 PPR 2,789,748 1.55FRANCEEUR 59,047 PUBLICIS GROUPE 3,265,298 1.82FRANCEEUR 13,473 SAFRAN SA 1,513,018 0.84FRANCEEUR 43,364 SANOFI-AVENTIS 3,195,493 1.78FRANCEEUR 9,244 SCHNEIDER ELECTRIC SA 649,299 0.36FRANCEEUR 35,962 SOCIETE GENERALE 1,267,301 0.71FRANCEEUR 38,848 TOTAL SA 2,092,742 1.17FRANCEEUR 33,299 BASF SE 2,653,597 1.48GERMANYEUR 37,309 BAYER AG 2,998,897 1.67GERMANYEUR 10,343 BEIERSDORF AG 1,037,403 0.58GERMANYEUR 5,083 DEUTSCHE BOERSE AG 604,877 0.34GERMANYEUR 67,805 DEUTSCHE POST AG-REG 2,129,755 1.19GERMANYEUR 119,922 DEUTSCHE TELEKOM AG-REG 1,668,115 0.93GERMANYEUR 58,550 E.ON AG 537,489 0.30GERMANYEUR 37,808 FRESENIUS MEDICAL CARE AG & CO. 3,299,126 1.84GERMANYEUR 560 HENKEL AG & CO KGAA 53,844 0.03GERMANYEUR 4,980 HENKEL AG & CO KGAA VORZUG 547,551 0.31GERMANYEUR 2,940 MUENCHENER RUECKVER AG-REG 546,252 0.30GERMANYEUR 2,177 PUMA AG 1,027,544 0.57GERMANYEUR 61,456 SAP AG 6,368,071 3.54GERMANYEUR 32,110 SIEMENS AG-REG 3,595,678 2.00GERMANYEUR 11,388 SIEMENS HEALTHINEERS AG 144A 445,897 0.25GERMANYGBP 71,060 ASSOCIATED BRITISH FOODS PLC 1,817,085 1.01GREAT BRITAINGBP 257,644 AVIVA PLC 1,395,937 0.78GREAT BRITAINGBP 283,600 BAE SYSTEMS PLC 1,919,920 1.07GREAT BRITAINGBP 160,866 BALFOUR BEATTY PLC 520,615 0.29GREAT BRITAIN
Country
Statement of Investment Portfolio and Other Net Assets AUGUST 31, 2018
Notional or number of units / shares
ownedMarket Value
EUR% of Net
Assets
INTERFUND TEAM EQUITY EUROPE
Similar issues with same maturities have not been combined when issuance date differs.The accompanying notes are an integral part of these financial statements.General note: differences in sums, if any, are due to rounding.
Currency
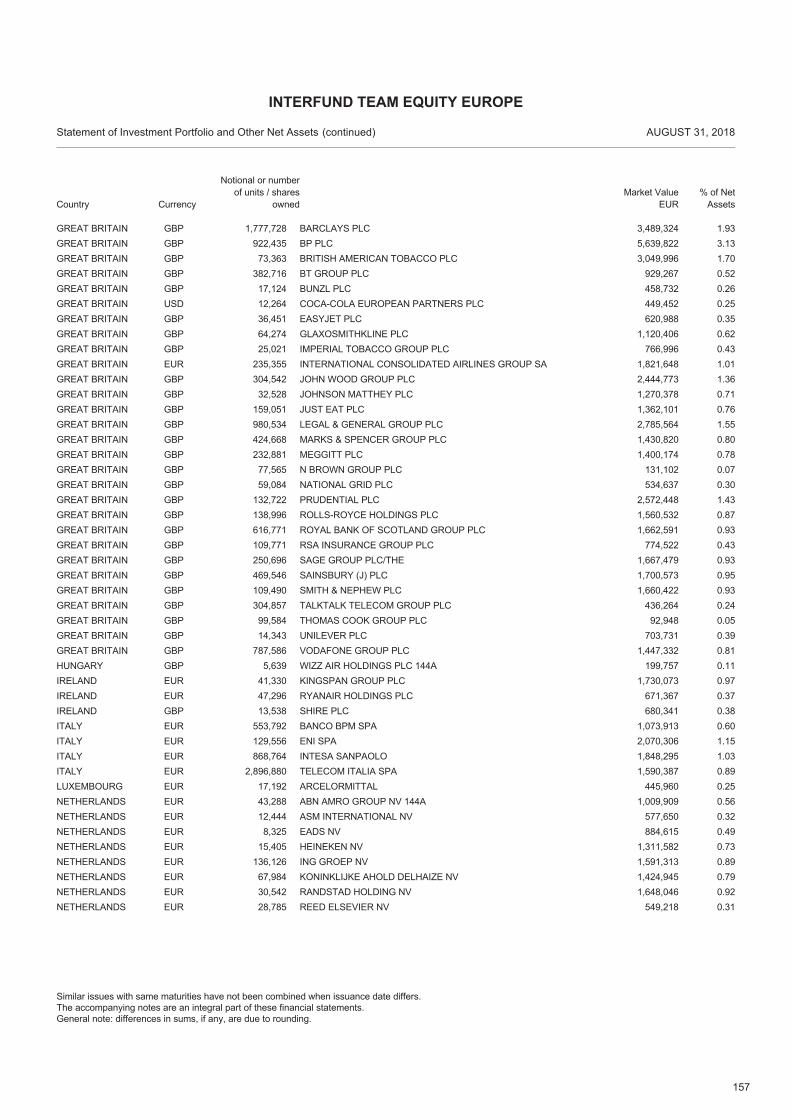
157
GBP 1,777,728 BARCLAYS PLC 3,489,324 1.93GREAT BRITAINGBP 922,435 BP PLC 5,639,822 3.13GREAT BRITAINGBP 73,363 BRITISH AMERICAN TOBACCO PLC 3,049,996 1.70GREAT BRITAINGBP 382,716 BT GROUP PLC 929,267 0.52GREAT BRITAINGBP 17,124 BUNZL PLC 458,732 0.26GREAT BRITAINUSD 12,264 COCA-COLA EUROPEAN PARTNERS PLC 449,452 0.25GREAT BRITAINGBP 36,451 EASYJET PLC 620,988 0.35GREAT BRITAINGBP 64,274 GLAXOSMITHKLINE PLC 1,120,406 0.62GREAT BRITAINGBP 25,021 IMPERIAL TOBACCO GROUP PLC 766,996 0.43GREAT BRITAINEUR 235,355 INTERNATIONAL CONSOLIDATED AIRLINES GROUP SA 1,821,648 1.01GREAT BRITAINGBP 304,542 JOHN WOOD GROUP PLC 2,444,773 1.36GREAT BRITAINGBP 32,528 JOHNSON MATTHEY PLC 1,270,378 0.71GREAT BRITAINGBP 159,051 JUST EAT PLC 1,362,101 0.76GREAT BRITAINGBP 980,534 LEGAL & GENERAL GROUP PLC 2,785,564 1.55GREAT BRITAINGBP 424,668 MARKS & SPENCER GROUP PLC 1,430,820 0.80GREAT BRITAINGBP 232,881 MEGGITT PLC 1,400,174 0.78GREAT BRITAINGBP 77,565 N BROWN GROUP PLC 131,102 0.07GREAT BRITAINGBP 59,084 NATIONAL GRID PLC 534,637 0.30GREAT BRITAINGBP 132,722 PRUDENTIAL PLC 2,572,448 1.43GREAT BRITAINGBP 138,996 ROLLS-ROYCE HOLDINGS PLC 1,560,532 0.87GREAT BRITAINGBP 616,771 ROYAL BANK OF SCOTLAND GROUP PLC 1,662,591 0.93GREAT BRITAINGBP 109,771 RSA INSURANCE GROUP PLC 774,522 0.43GREAT BRITAINGBP 250,696 SAGE GROUP PLC/THE 1,667,479 0.93GREAT BRITAINGBP 469,546 SAINSBURY (J) PLC 1,700,573 0.95GREAT BRITAINGBP 109,490 SMITH & NEPHEW PLC 1,660,422 0.93GREAT BRITAINGBP 304,857 TALKTALK TELECOM GROUP PLC 436,264 0.24GREAT BRITAINGBP 99,584 THOMAS COOK GROUP PLC 92,948 0.05GREAT BRITAINGBP 14,343 UNILEVER PLC 703,731 0.39GREAT BRITAINGBP 787,586 VODAFONE GROUP PLC 1,447,332 0.81GREAT BRITAINGBP 5,639 WIZZ AIR HOLDINGS PLC 144A 199,757 0.11HUNGARYEUR 41,330 KINGSPAN GROUP PLC 1,730,073 0.97IRELANDEUR 47,296 RYANAIR HOLDINGS PLC 671,367 0.37IRELANDGBP 13,538 SHIRE PLC 680,341 0.38IRELANDEUR 553,792 BANCO BPM SPA 1,073,913 0.60ITALYEUR 129,556 ENI SPA 2,070,306 1.15ITALYEUR 868,764 INTESA SANPAOLO 1,848,295 1.03ITALYEUR 2,896,880 TELECOM ITALIA SPA 1,590,387 0.89ITALYEUR 17,192 ARCELORMITTAL 445,960 0.25LUXEMBOURGEUR 43,288 ABN AMRO GROUP NV 144A 1,009,909 0.56NETHERLANDSEUR 12,444 ASM INTERNATIONAL NV 577,650 0.32NETHERLANDSEUR 8,325 EADS NV 884,615 0.49NETHERLANDSEUR 15,405 HEINEKEN NV 1,311,582 0.73NETHERLANDSEUR 136,126 ING GROEP NV 1,591,313 0.89NETHERLANDSEUR 67,984 KONINKLIJKE AHOLD DELHAIZE NV 1,424,945 0.79NETHERLANDSEUR 30,542 RANDSTAD HOLDING NV 1,648,046 0.92NETHERLANDSEUR 28,785 REED ELSEVIER NV 549,218 0.31NETHERLANDS
Country
Statement of Investment Portfolio and Other Net Assets AUGUST 31, 2018
Notional or number of units / shares
ownedMarket Value
EUR% of Net
Assets
INTERFUND TEAM EQUITY EUROPE
(continued)
Similar issues with same maturities have not been combined when issuance date differs.The accompanying notes are an integral part of these financial statements.General note: differences in sums, if any, are due to rounding.
Currency
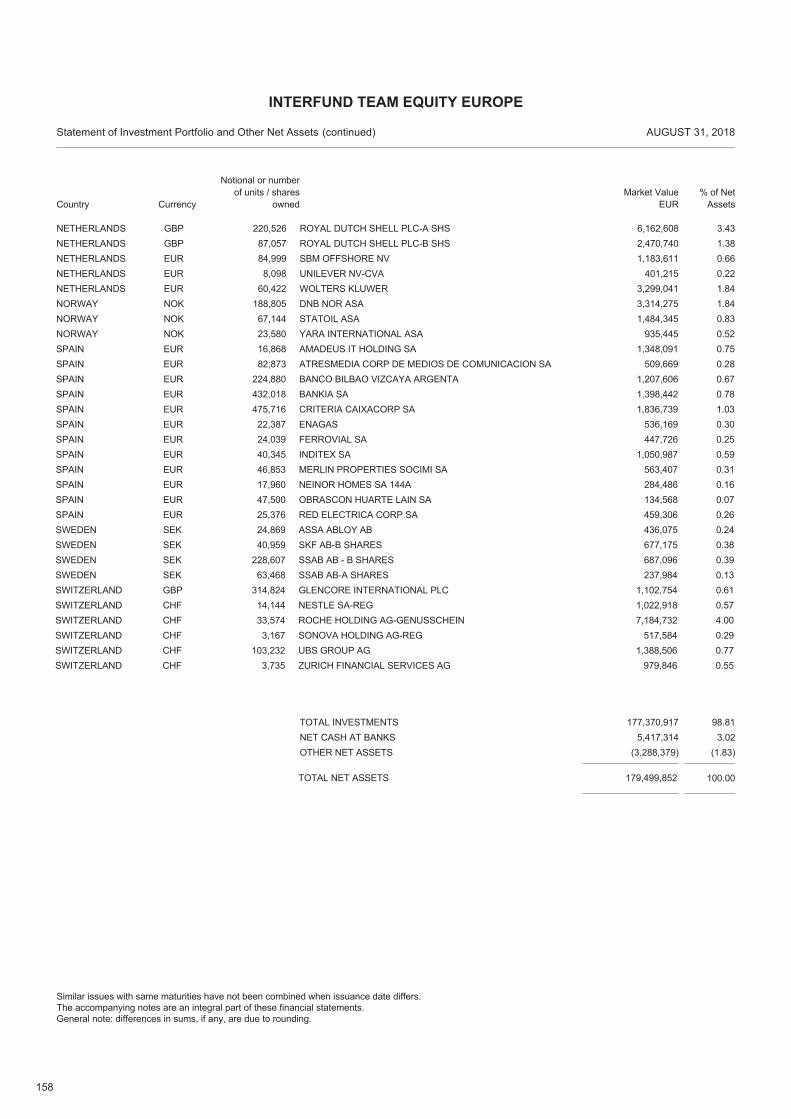
158
GBP 220,526 ROYAL DUTCH SHELL PLC-A SHS 6,162,608 3.43NETHERLANDSGBP 87,057 ROYAL DUTCH SHELL PLC-B SHS 2,470,740 1.38NETHERLANDSEUR 84,999 SBM OFFSHORE NV 1,183,611 0.66NETHERLANDSEUR 8,098 UNILEVER NV-CVA 401,215 0.22NETHERLANDSEUR 60,422 WOLTERS KLUWER 3,299,041 1.84NETHERLANDSNOK 188,805 DNB NOR ASA 3,314,275 1.84NORWAYNOK 67,144 STATOIL ASA 1,484,345 0.83NORWAYNOK 23,580 YARA INTERNATIONAL ASA 935,445 0.52NORWAYEUR 16,868 AMADEUS IT HOLDING SA 1,348,091 0.75SPAINEUR 82,873 ATRESMEDIA CORP DE MEDIOS DE COMUNICACION SA 509,669 0.28SPAINEUR 224,880 BANCO BILBAO VIZCAYA ARGENTA 1,207,606 0.67SPAINEUR 432,018 BANKIA SA 1,398,442 0.78SPAINEUR 475,716 CRITERIA CAIXACORP SA 1,836,739 1.03SPAINEUR 22,387 ENAGAS 536,169 0.30SPAINEUR 24,039 FERROVIAL SA 447,726 0.25SPAINEUR 40,345 INDITEX SA 1,050,987 0.59SPAINEUR 46,853 MERLIN PROPERTIES SOCIMI SA 563,407 0.31SPAINEUR 17,960 NEINOR HOMES SA 144A 284,486 0.16SPAINEUR 47,500 OBRASCON HUARTE LAIN SA 134,568 0.07SPAINEUR 25,376 RED ELECTRICA CORP SA 459,306 0.26SPAINSEK 24,869 ASSA ABLOY AB 436,075 0.24SWEDENSEK 40,959 SKF AB-B SHARES 677,175 0.38SWEDENSEK 228,607 SSAB AB - B SHARES 687,096 0.39SWEDENSEK 63,468 SSAB AB-A SHARES 237,984 0.13SWEDENGBP 314,824 GLENCORE INTERNATIONAL PLC 1,102,754 0.61SWITZERLANDCHF 14,144 NESTLE SA-REG 1,022,918 0.57SWITZERLANDCHF 33,574 ROCHE HOLDING AG-GENUSSCHEIN 7,184,732 4.00SWITZERLANDCHF 3,167 SONOVA HOLDING AG-REG 517,584 0.29SWITZERLANDCHF 103,232 UBS GROUP AG 1,388,506 0.77SWITZERLANDCHF 3,735 ZURICH FINANCIAL SERVICES AG 979,846 0.55SWITZERLAND
TOTAL NET ASSETS 179,499,852 100.00
TOTAL INVESTMENTS 177,370,917 98.81NET CASH AT BANKS 5,417,314 3.02OTHER NET ASSETS (3,288,379) (1.83)
Country
Statement of Investment Portfolio and Other Net Assets AUGUST 31, 2018
Notional or number of units / shares
ownedMarket Value
EUR% of Net
Assets
INTERFUND TEAM EQUITY EUROPE
(continued)
Similar issues with same maturities have not been combined when issuance date differs.The accompanying notes are an integral part of these financial statements.General note: differences in sums, if any, are due to rounding.
Currency
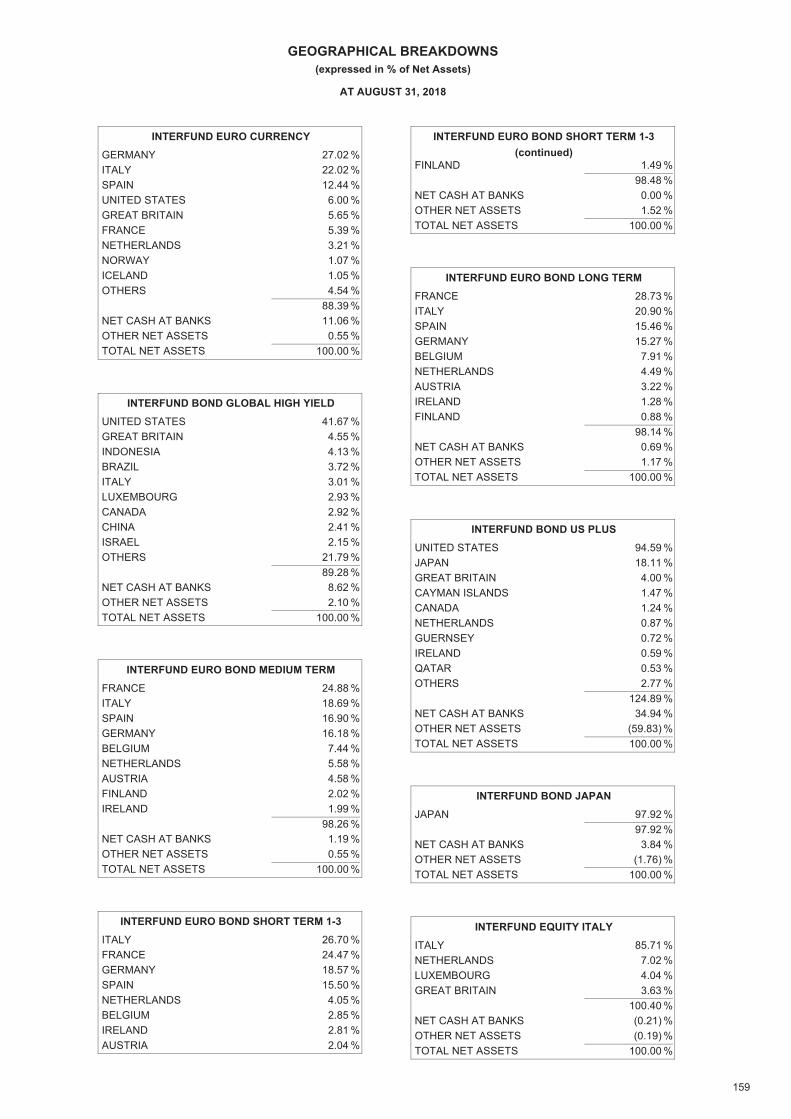
159
GEOGRAPHICAL BREAKDOWNS(expressed in % of Net Assets)
AT AUGUST 31, 2018
GERMANY 27.02 %
INTERFUND EURO CURRENCY
ITALY 22.02 %SPAIN 12.44 %UNITED STATES 6.00 %GREAT BRITAIN 5.65 %FRANCE 5.39 %NETHERLANDS 3.21 %NORWAY 1.07 %ICELAND 1.05 %OTHERS 4.54 %
TOTAL NET ASSETS 100.00 %
NET CASH AT BANKS 11.06 %88.39 %
OTHER NET ASSETS 0.55 %
UNITED STATES 41.67 %
INTERFUND BOND GLOBAL HIGH YIELD
GREAT BRITAIN 4.55 %INDONESIA 4.13 %BRAZIL 3.72 %ITALY 3.01 %LUXEMBOURG 2.93 %CANADA 2.92 %CHINA 2.41 %ISRAEL 2.15 %OTHERS 21.79 %
TOTAL NET ASSETS 100.00 %
NET CASH AT BANKS 8.62 %89.28 %
OTHER NET ASSETS 2.10 %
FRANCE 24.88 %
INTERFUND EURO BOND MEDIUM TERM
ITALY 18.69 %SPAIN 16.90 %GERMANY 16.18 %BELGIUM 7.44 %NETHERLANDS 5.58 %AUSTRIA 4.58 %FINLAND 2.02 %IRELAND 1.99 %
TOTAL NET ASSETS 100.00 %
NET CASH AT BANKS 1.19 %98.26 %
OTHER NET ASSETS 0.55 %
ITALY 26.70 %
INTERFUND EURO BOND SHORT TERM 1-3
FRANCE 24.47 %GERMANY 18.57 %SPAIN 15.50 %NETHERLANDS 4.05 %BELGIUM 2.85 %IRELAND 2.81 %AUSTRIA 2.04 %
FINLAND 1.49 %
INTERFUND EURO BOND SHORT TERM 1-3(continued)
TOTAL NET ASSETS 100.00 %
NET CASH AT BANKS 0.00 %98.48 %
OTHER NET ASSETS 1.52 %
FRANCE 28.73 %
INTERFUND EURO BOND LONG TERM
ITALY 20.90 %SPAIN 15.46 %GERMANY 15.27 %BELGIUM 7.91 %NETHERLANDS 4.49 %AUSTRIA 3.22 %IRELAND 1.28 %FINLAND 0.88 %
TOTAL NET ASSETS 100.00 %
NET CASH AT BANKS 0.69 %98.14 %
OTHER NET ASSETS 1.17 %
UNITED STATES 94.59 %
INTERFUND BOND US PLUS
JAPAN 18.11 %GREAT BRITAIN 4.00 %CAYMAN ISLANDS 1.47 %CANADA 1.24 %NETHERLANDS 0.87 %GUERNSEY 0.72 %IRELAND 0.59 %QATAR 0.53 %OTHERS 2.77 %
TOTAL NET ASSETS 100.00 %
NET CASH AT BANKS 34.94 %124.89 %
OTHER NET ASSETS (59.83) %
JAPAN 97.92 %
INTERFUND BOND JAPAN
TOTAL NET ASSETS 100.00 %
NET CASH AT BANKS 3.84 %97.92 %
OTHER NET ASSETS (1.76) %
ITALY 85.71 %
INTERFUND EQUITY ITALY
NETHERLANDS 7.02 %LUXEMBOURG 4.04 %GREAT BRITAIN 3.63 %
TOTAL NET ASSETS 100.00 %
NET CASH AT BANKS (0.21) %100.40 %
OTHER NET ASSETS (0.19) %
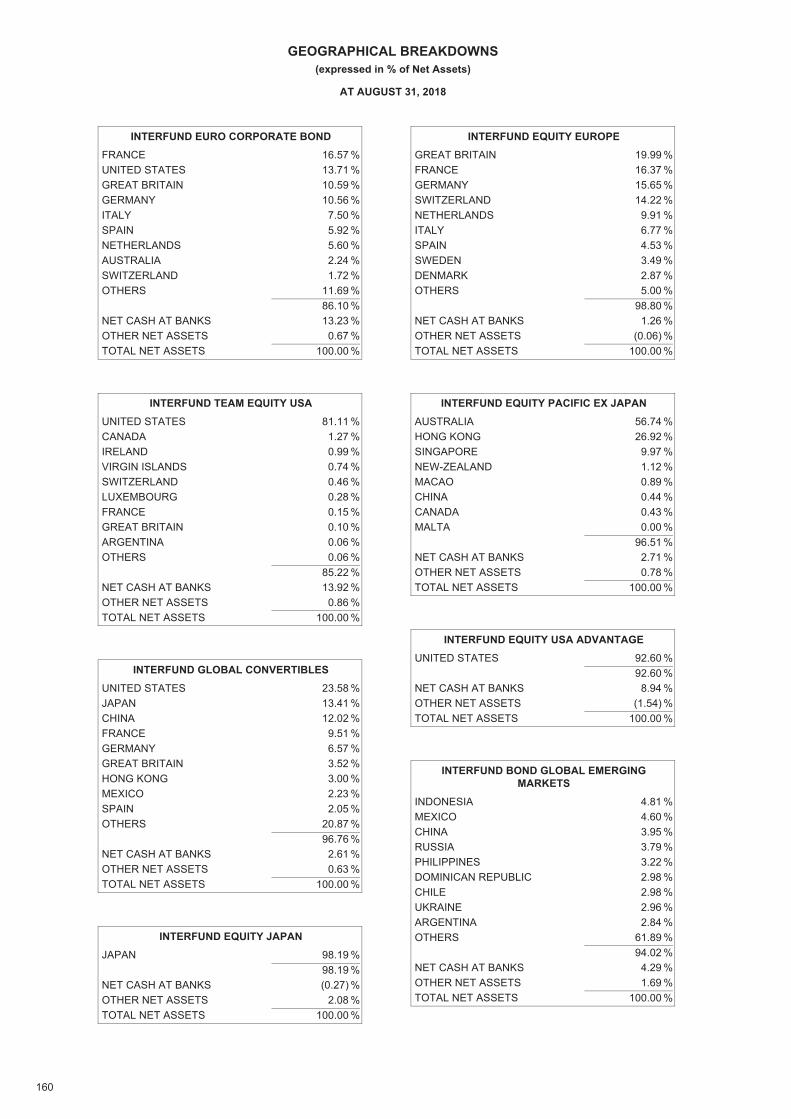
160
GEOGRAPHICAL BREAKDOWNS(expressed in % of Net Assets)
AT AUGUST 31, 2018
FRANCE 16.57 %
INTERFUND EURO CORPORATE BOND
UNITED STATES 13.71 %GREAT BRITAIN 10.59 %GERMANY 10.56 %ITALY 7.50 %SPAIN 5.92 %NETHERLANDS 5.60 %AUSTRALIA 2.24 %SWITZERLAND 1.72 %OTHERS 11.69 %
TOTAL NET ASSETS 100.00 %
NET CASH AT BANKS 13.23 %86.10 %
OTHER NET ASSETS 0.67 %
UNITED STATES 81.11 %
INTERFUND TEAM EQUITY USA
CANADA 1.27 %IRELAND 0.99 %VIRGIN ISLANDS 0.74 %SWITZERLAND 0.46 %LUXEMBOURG 0.28 %FRANCE 0.15 %GREAT BRITAIN 0.10 %ARGENTINA 0.06 %OTHERS 0.06 %
TOTAL NET ASSETS 100.00 %
NET CASH AT BANKS 13.92 %85.22 %
OTHER NET ASSETS 0.86 %
UNITED STATES 23.58 %
INTERFUND GLOBAL CONVERTIBLES
JAPAN 13.41 %CHINA 12.02 %FRANCE 9.51 %GERMANY 6.57 %GREAT BRITAIN 3.52 %HONG KONG 3.00 %MEXICO 2.23 %SPAIN 2.05 %OTHERS 20.87 %
TOTAL NET ASSETS 100.00 %
NET CASH AT BANKS 2.61 %96.76 %
OTHER NET ASSETS 0.63 %
JAPAN 98.19 %
INTERFUND EQUITY JAPAN
TOTAL NET ASSETS 100.00 %
NET CASH AT BANKS (0.27) %98.19 %
OTHER NET ASSETS 2.08 %
GREAT BRITAIN 19.99 %
INTERFUND EQUITY EUROPE
FRANCE 16.37 %GERMANY 15.65 %SWITZERLAND 14.22 %NETHERLANDS 9.91 %ITALY 6.77 %SPAIN 4.53 %SWEDEN 3.49 %DENMARK 2.87 %OTHERS 5.00 %
TOTAL NET ASSETS 100.00 %
NET CASH AT BANKS 1.26 %98.80 %
OTHER NET ASSETS (0.06) %
AUSTRALIA 56.74 %
INTERFUND EQUITY PACIFIC EX JAPAN
HONG KONG 26.92 %SINGAPORE 9.97 %NEW-ZEALAND 1.12 %MACAO 0.89 %CHINA 0.44 %CANADA 0.43 %MALTA 0.00 %
TOTAL NET ASSETS 100.00 %
NET CASH AT BANKS 2.71 %96.51 %
OTHER NET ASSETS 0.78 %
UNITED STATES 92.60 %
INTERFUND EQUITY USA ADVANTAGE
TOTAL NET ASSETS 100.00 %
NET CASH AT BANKS 8.94 %92.60 %
OTHER NET ASSETS (1.54) %
INDONESIA 4.81 %
INTERFUND BOND GLOBAL EMERGINGMARKETS
MEXICO 4.60 %CHINA 3.95 %RUSSIA 3.79 %PHILIPPINES 3.22 %DOMINICAN REPUBLIC 2.98 %CHILE 2.98 %UKRAINE 2.96 %ARGENTINA 2.84 %OTHERS 61.89 %
TOTAL NET ASSETS 100.00 %
NET CASH AT BANKS 4.29 %94.02 %
OTHER NET ASSETS 1.69 %
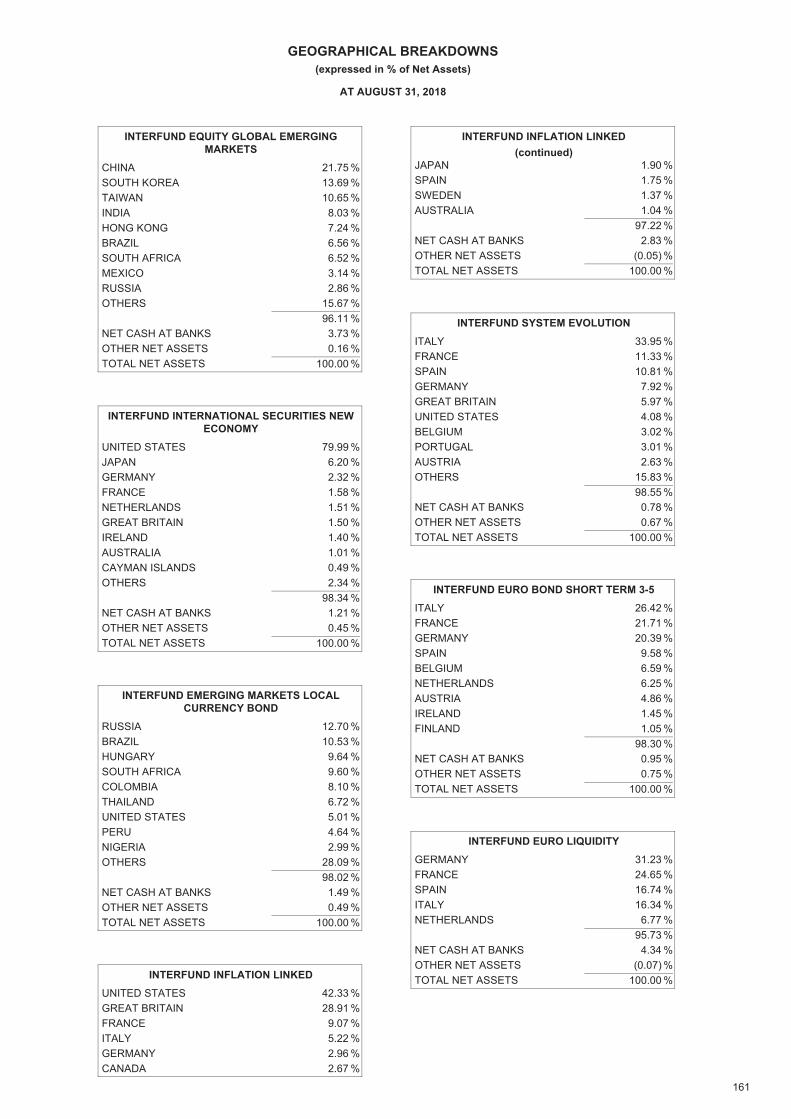
161
GEOGRAPHICAL BREAKDOWNS(expressed in % of Net Assets)
AT AUGUST 31, 2018
CHINA 21.75 %
INTERFUND EQUITY GLOBAL EMERGINGMARKETS
SOUTH KOREA 13.69 %TAIWAN 10.65 %INDIA 8.03 %HONG KONG 7.24 %BRAZIL 6.56 %SOUTH AFRICA 6.52 %MEXICO 3.14 %RUSSIA 2.86 %OTHERS 15.67 %
TOTAL NET ASSETS 100.00 %
NET CASH AT BANKS 3.73 %96.11 %
OTHER NET ASSETS 0.16 %
UNITED STATES 79.99 %
INTERFUND INTERNATIONAL SECURITIES NEWECONOMY
JAPAN 6.20 %GERMANY 2.32 %FRANCE 1.58 %NETHERLANDS 1.51 %GREAT BRITAIN 1.50 %IRELAND 1.40 %AUSTRALIA 1.01 %CAYMAN ISLANDS 0.49 %OTHERS 2.34 %
TOTAL NET ASSETS 100.00 %
NET CASH AT BANKS 1.21 %98.34 %
OTHER NET ASSETS 0.45 %
RUSSIA 12.70 %
INTERFUND EMERGING MARKETS LOCALCURRENCY BOND
BRAZIL 10.53 %HUNGARY 9.64 %SOUTH AFRICA 9.60 %COLOMBIA 8.10 %THAILAND 6.72 %UNITED STATES 5.01 %PERU 4.64 %NIGERIA 2.99 %OTHERS 28.09 %
TOTAL NET ASSETS 100.00 %
NET CASH AT BANKS 1.49 %98.02 %
OTHER NET ASSETS 0.49 %
UNITED STATES 42.33 %
INTERFUND INFLATION LINKED
GREAT BRITAIN 28.91 %FRANCE 9.07 %ITALY 5.22 %GERMANY 2.96 %CANADA 2.67 %
JAPAN 1.90 %
INTERFUND INFLATION LINKED(continued)
SPAIN 1.75 %SWEDEN 1.37 %AUSTRALIA 1.04 %
TOTAL NET ASSETS 100.00 %
NET CASH AT BANKS 2.83 %97.22 %
OTHER NET ASSETS (0.05) %
ITALY 33.95 %
INTERFUND SYSTEM EVOLUTION
FRANCE 11.33 %SPAIN 10.81 %GERMANY 7.92 %GREAT BRITAIN 5.97 %UNITED STATES 4.08 %BELGIUM 3.02 %PORTUGAL 3.01 %AUSTRIA 2.63 %OTHERS 15.83 %
TOTAL NET ASSETS 100.00 %
NET CASH AT BANKS 0.78 %98.55 %
OTHER NET ASSETS 0.67 %
ITALY 26.42 %
INTERFUND EURO BOND SHORT TERM 3-5
FRANCE 21.71 %GERMANY 20.39 %SPAIN 9.58 %BELGIUM 6.59 %NETHERLANDS 6.25 %AUSTRIA 4.86 %IRELAND 1.45 %FINLAND 1.05 %
TOTAL NET ASSETS 100.00 %
NET CASH AT BANKS 0.95 %98.30 %
OTHER NET ASSETS 0.75 %
GERMANY 31.23 %
INTERFUND EURO LIQUIDITY
FRANCE 24.65 %SPAIN 16.74 %ITALY 16.34 %NETHERLANDS 6.77 %
TOTAL NET ASSETS 100.00 %
NET CASH AT BANKS 4.34 %95.73 %
OTHER NET ASSETS (0.07) %
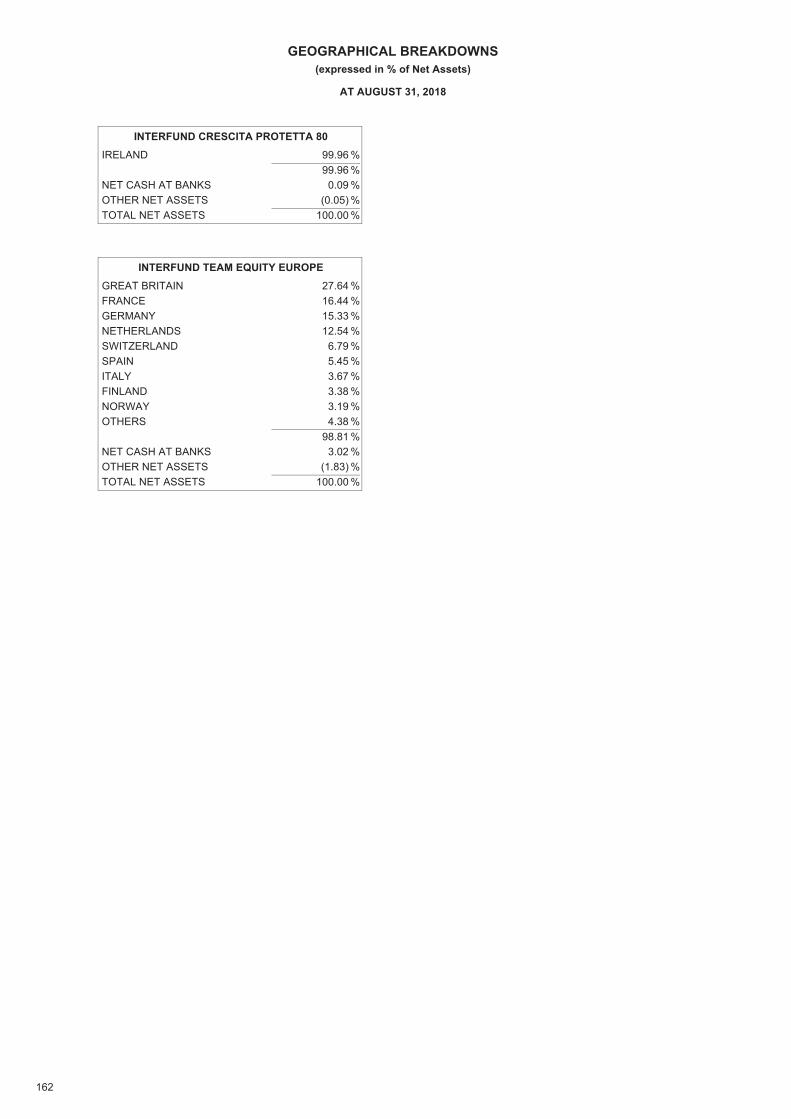
162
GEOGRAPHICAL BREAKDOWNS(expressed in % of Net Assets)
AT AUGUST 31, 2018
IRELAND 99.96 %
INTERFUND CRESCITA PROTETTA 80
TOTAL NET ASSETS 100.00 %
NET CASH AT BANKS 0.09 %99.96 %
OTHER NET ASSETS (0.05) %
GREAT BRITAIN 27.64 %
INTERFUND TEAM EQUITY EUROPE
FRANCE 16.44 %GERMANY 15.33 %NETHERLANDS 12.54 %SWITZERLAND 6.79 %SPAIN 5.45 %ITALY 3.67 %FINLAND 3.38 %NORWAY 3.19 %OTHERS 4.38 %
TOTAL NET ASSETS 100.00 %
NET CASH AT BANKS 3.02 %98.81 %
OTHER NET ASSETS (1.83) %
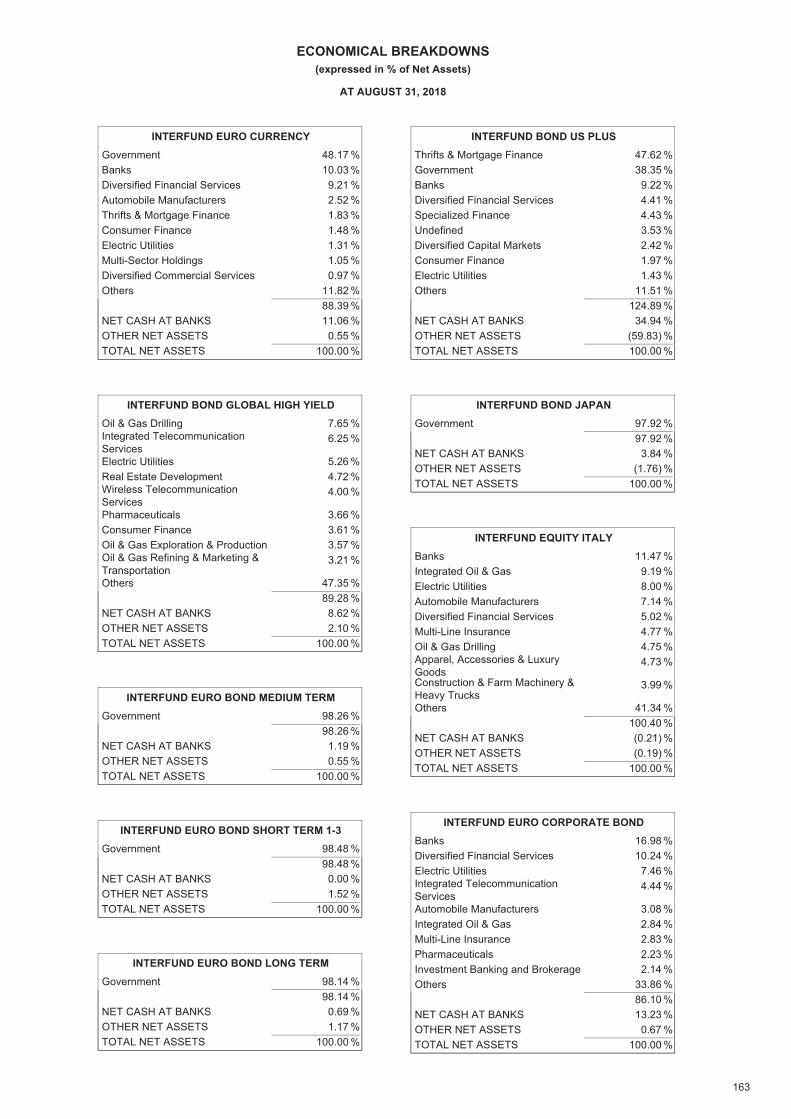
163
ECONOMICAL BREAKDOWNS(expressed in % of Net Assets)
AT AUGUST 31, 2018
Government 48.17 %
INTERFUND EURO CURRENCY
Banks 10.03 %Diversified Financial Services 9.21 %Automobile Manufacturers 2.52 %Thrifts & Mortgage Finance 1.83 %Consumer Finance 1.48 %Electric Utilities 1.31 %Multi-Sector Holdings 1.05 %Diversified Commercial Services 0.97 %Others 11.82 %
TOTAL NET ASSETS 100.00 %
NET CASH AT BANKS 11.06 %OTHER NET ASSETS 0.55 %
88.39 %
Oil & Gas Drilling 7.65 %
INTERFUND BOND GLOBAL HIGH YIELD
Integrated TelecommunicationServices
6.25 %
Electric Utilities 5.26 %Real Estate Development 4.72 %Wireless TelecommunicationServices
4.00 %
Pharmaceuticals 3.66 %Consumer Finance 3.61 %Oil & Gas Exploration & Production 3.57 %Oil & Gas Refining & Marketing &Transportation
3.21 %
Others 47.35 %
TOTAL NET ASSETS 100.00 %
NET CASH AT BANKS 8.62 %OTHER NET ASSETS 2.10 %
89.28 %
Government 98.26 %
INTERFUND EURO BOND MEDIUM TERM
TOTAL NET ASSETS 100.00 %
NET CASH AT BANKS 1.19 %OTHER NET ASSETS 0.55 %
98.26 %
Government 98.48 %
INTERFUND EURO BOND SHORT TERM 1-3
TOTAL NET ASSETS 100.00 %
NET CASH AT BANKS 0.00 %OTHER NET ASSETS 1.52 %
98.48 %
Government 98.14 %
INTERFUND EURO BOND LONG TERM
TOTAL NET ASSETS 100.00 %
NET CASH AT BANKS 0.69 %OTHER NET ASSETS 1.17 %
98.14 %
Thrifts & Mortgage Finance 47.62 %
INTERFUND BOND US PLUS
Government 38.35 %Banks 9.22 %Diversified Financial Services 4.41 %Specialized Finance 4.43 %Undefined 3.53 %Diversified Capital Markets 2.42 %Consumer Finance 1.97 %Electric Utilities 1.43 %Others 11.51 %
TOTAL NET ASSETS 100.00 %
NET CASH AT BANKS 34.94 %OTHER NET ASSETS (59.83) %
124.89 %
Government 97.92 %
INTERFUND BOND JAPAN
TOTAL NET ASSETS 100.00 %
NET CASH AT BANKS 3.84 %OTHER NET ASSETS (1.76) %
97.92 %
Banks 11.47 %
INTERFUND EQUITY ITALY
Integrated Oil & Gas 9.19 %Electric Utilities 8.00 %Automobile Manufacturers 7.14 %Diversified Financial Services 5.02 %Multi-Line Insurance 4.77 %Oil & Gas Drilling 4.75 %Apparel, Accessories & LuxuryGoods
4.73 %
Construction & Farm Machinery &Heavy Trucks
3.99 %
Others 41.34 %
TOTAL NET ASSETS 100.00 %
NET CASH AT BANKS (0.21) %OTHER NET ASSETS (0.19) %
100.40 %
Banks 16.98 %
INTERFUND EURO CORPORATE BOND
Diversified Financial Services 10.24 %Electric Utilities 7.46 %Integrated TelecommunicationServices
4.44 %
Automobile Manufacturers 3.08 %Integrated Oil & Gas 2.84 %Multi-Line Insurance 2.83 %Pharmaceuticals 2.23 %Investment Banking and Brokerage 2.14 %Others 33.86 %
TOTAL NET ASSETS 100.00 %
NET CASH AT BANKS 13.23 %OTHER NET ASSETS 0.67 %
86.10 %
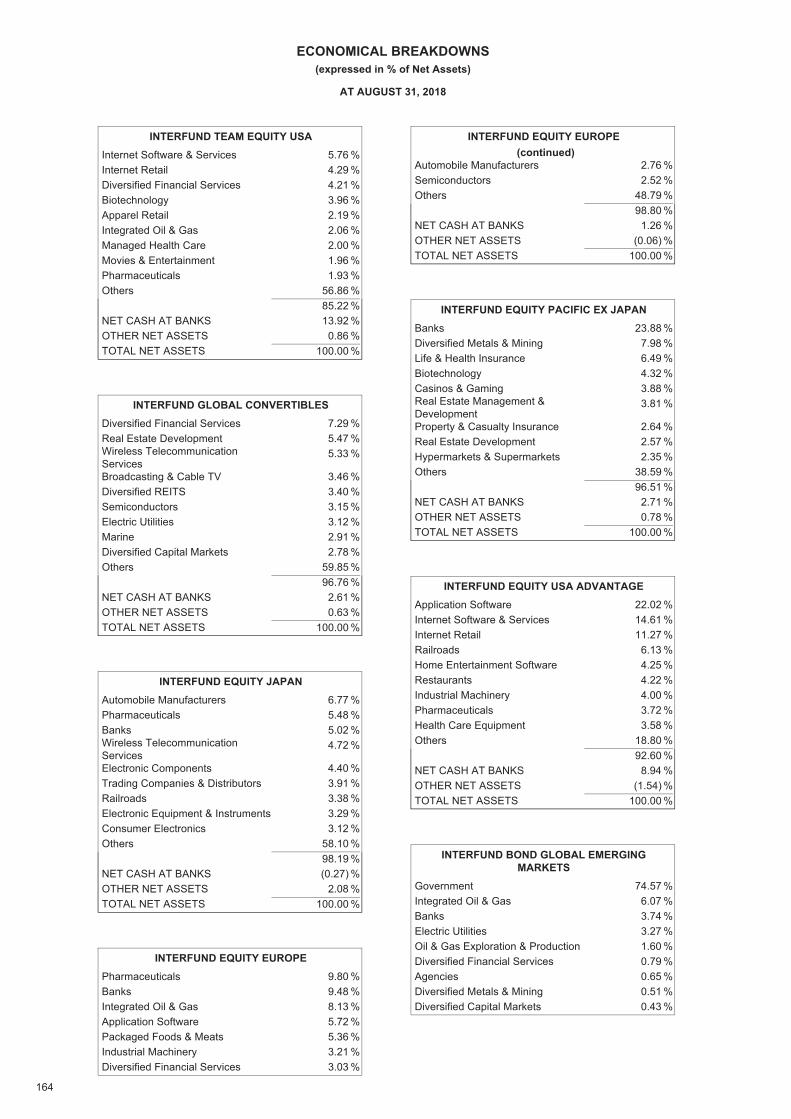
164
ECONOMICAL BREAKDOWNS(expressed in % of Net Assets)
AT AUGUST 31, 2018
Internet Software & Services 5.76 %
INTERFUND TEAM EQUITY USA
Internet Retail 4.29 %Diversified Financial Services 4.21 %Biotechnology 3.96 %Apparel Retail 2.19 %Integrated Oil & Gas 2.06 %Managed Health Care 2.00 %Movies & Entertainment 1.96 %Pharmaceuticals 1.93 %Others 56.86 %
TOTAL NET ASSETS 100.00 %
NET CASH AT BANKS 13.92 %OTHER NET ASSETS 0.86 %
85.22 %
Diversified Financial Services 7.29 %
INTERFUND GLOBAL CONVERTIBLES
Real Estate Development 5.47 %Wireless TelecommunicationServices
5.33 %
Broadcasting & Cable TV 3.46 %Diversified REITS 3.40 %Semiconductors 3.15 %Electric Utilities 3.12 %Marine 2.91 %Diversified Capital Markets 2.78 %Others 59.85 %
TOTAL NET ASSETS 100.00 %
NET CASH AT BANKS 2.61 %OTHER NET ASSETS 0.63 %
96.76 %
Automobile Manufacturers 6.77 %
INTERFUND EQUITY JAPAN
Pharmaceuticals 5.48 %Banks 5.02 %Wireless TelecommunicationServices
4.72 %
Electronic Components 4.40 %Trading Companies & Distributors 3.91 %Railroads 3.38 %Electronic Equipment & Instruments 3.29 %Consumer Electronics 3.12 %Others 58.10 %
TOTAL NET ASSETS 100.00 %
NET CASH AT BANKS (0.27) %OTHER NET ASSETS 2.08 %
98.19 %
Pharmaceuticals 9.80 %
INTERFUND EQUITY EUROPE
Banks 9.48 %Integrated Oil & Gas 8.13 %Application Software 5.72 %Packaged Foods & Meats 5.36 %Industrial Machinery 3.21 %Diversified Financial Services 3.03 %
Automobile Manufacturers 2.76 %
INTERFUND EQUITY EUROPE(continued)
Semiconductors 2.52 %Others 48.79 %
TOTAL NET ASSETS 100.00 %
NET CASH AT BANKS 1.26 %OTHER NET ASSETS (0.06) %
98.80 %
Banks 23.88 %
INTERFUND EQUITY PACIFIC EX JAPAN
Diversified Metals & Mining 7.98 %Life & Health Insurance 6.49 %Biotechnology 4.32 %Casinos & Gaming 3.88 %Real Estate Management &Development
3.81 %
Property & Casualty Insurance 2.64 %Real Estate Development 2.57 %Hypermarkets & Supermarkets 2.35 %Others 38.59 %
TOTAL NET ASSETS 100.00 %
NET CASH AT BANKS 2.71 %OTHER NET ASSETS 0.78 %
96.51 %
Application Software 22.02 %
INTERFUND EQUITY USA ADVANTAGE
Internet Software & Services 14.61 %Internet Retail 11.27 %Railroads 6.13 %Home Entertainment Software 4.25 %Restaurants 4.22 %Industrial Machinery 4.00 %Pharmaceuticals 3.72 %Health Care Equipment 3.58 %Others 18.80 %
TOTAL NET ASSETS 100.00 %
NET CASH AT BANKS 8.94 %OTHER NET ASSETS (1.54) %
92.60 %
Government 74.57 %
INTERFUND BOND GLOBAL EMERGINGMARKETS
Integrated Oil & Gas 6.07 %Banks 3.74 %Electric Utilities 3.27 %Oil & Gas Exploration & Production 1.60 %Diversified Financial Services 0.79 %Agencies 0.65 %Diversified Metals & Mining 0.51 %Diversified Capital Markets 0.43 %
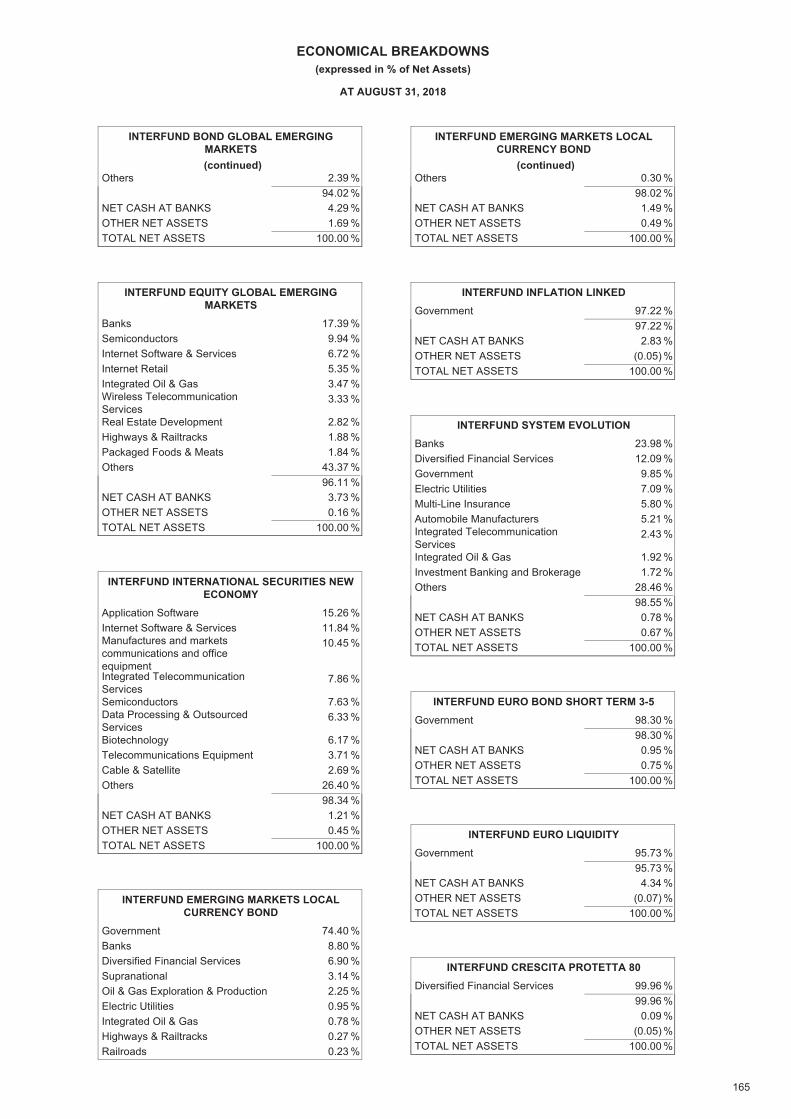
165
ECONOMICAL BREAKDOWNS(expressed in % of Net Assets)
AT AUGUST 31, 2018
Others 2.39 %
INTERFUND BOND GLOBAL EMERGINGMARKETS
TOTAL NET ASSETS 100.00 %
NET CASH AT BANKS 4.29 %OTHER NET ASSETS 1.69 %
94.02 %
(continued)
Banks 17.39 %
INTERFUND EQUITY GLOBAL EMERGINGMARKETS
Semiconductors 9.94 %Internet Software & Services 6.72 %Internet Retail 5.35 %Integrated Oil & Gas 3.47 %Wireless TelecommunicationServices
3.33 %
Real Estate Development 2.82 %Highways & Railtracks 1.88 %Packaged Foods & Meats 1.84 %Others 43.37 %
TOTAL NET ASSETS 100.00 %
NET CASH AT BANKS 3.73 %OTHER NET ASSETS 0.16 %
96.11 %
Application Software 15.26 %
INTERFUND INTERNATIONAL SECURITIES NEWECONOMY
Internet Software & Services 11.84 %Manufactures and marketscommunications and officeequipment
10.45 %
Integrated TelecommunicationServices
7.86 %
Semiconductors 7.63 %Data Processing & OutsourcedServices
6.33 %
Biotechnology 6.17 %Telecommunications Equipment 3.71 %Cable & Satellite 2.69 %Others 26.40 %
TOTAL NET ASSETS 100.00 %
NET CASH AT BANKS 1.21 %OTHER NET ASSETS 0.45 %
98.34 %
Government 74.40 %
INTERFUND EMERGING MARKETS LOCALCURRENCY BOND
Banks 8.80 %Diversified Financial Services 6.90 %Supranational 3.14 %Oil & Gas Exploration & Production 2.25 %Electric Utilities 0.95 %Integrated Oil & Gas 0.78 %Highways & Railtracks 0.27 %Railroads 0.23 %
Others 0.30 %
INTERFUND EMERGING MARKETS LOCALCURRENCY BOND
TOTAL NET ASSETS 100.00 %
NET CASH AT BANKS 1.49 %OTHER NET ASSETS 0.49 %
98.02 %
(continued)
Government 97.22 %
INTERFUND INFLATION LINKED
TOTAL NET ASSETS 100.00 %
NET CASH AT BANKS 2.83 %OTHER NET ASSETS (0.05) %
97.22 %
Banks 23.98 %
INTERFUND SYSTEM EVOLUTION
Diversified Financial Services 12.09 %Government 9.85 %Electric Utilities 7.09 %Multi-Line Insurance 5.80 %Automobile Manufacturers 5.21 %Integrated TelecommunicationServices
2.43 %
Integrated Oil & Gas 1.92 %Investment Banking and Brokerage 1.72 %Others 28.46 %
TOTAL NET ASSETS 100.00 %
NET CASH AT BANKS 0.78 %OTHER NET ASSETS 0.67 %
98.55 %
Government 98.30 %
INTERFUND EURO BOND SHORT TERM 3-5
TOTAL NET ASSETS 100.00 %
NET CASH AT BANKS 0.95 %OTHER NET ASSETS 0.75 %
98.30 %
Government 95.73 %
INTERFUND EURO LIQUIDITY
TOTAL NET ASSETS 100.00 %
NET CASH AT BANKS 4.34 %OTHER NET ASSETS (0.07) %
95.73 %
Diversified Financial Services 99.96 %
INTERFUND CRESCITA PROTETTA 80
TOTAL NET ASSETS 100.00 %
NET CASH AT BANKS 0.09 %OTHER NET ASSETS (0.05) %
99.96 %
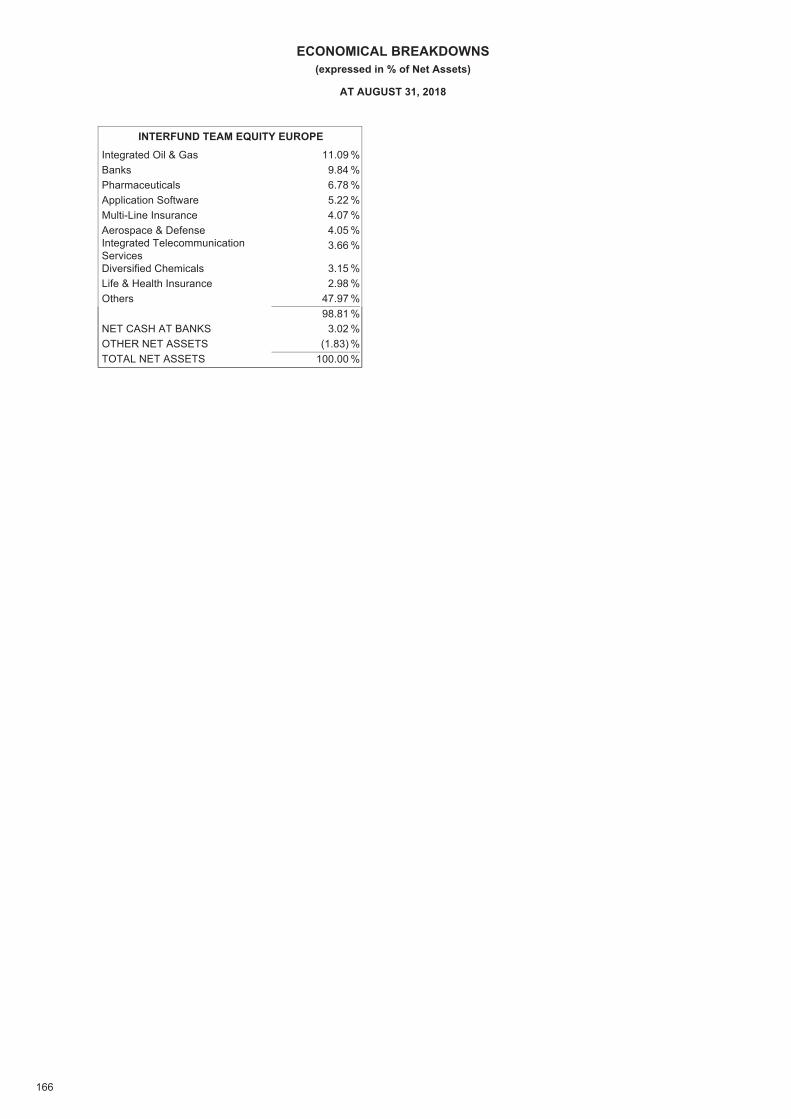
166
ECONOMICAL BREAKDOWNS(expressed in % of Net Assets)
AT AUGUST 31, 2018
Integrated Oil & Gas 11.09 %
INTERFUND TEAM EQUITY EUROPE
Banks 9.84 %Pharmaceuticals 6.78 %Application Software 5.22 %Multi-Line Insurance 4.07 %Aerospace & Defense 4.05 %Integrated TelecommunicationServices
3.66 %
Diversified Chemicals 3.15 %Life & Health Insurance 2.98 %Others 47.97 %
TOTAL NET ASSETS 100.00 %
NET CASH AT BANKS 3.02 %OTHER NET ASSETS (1.83) %
98.81 %
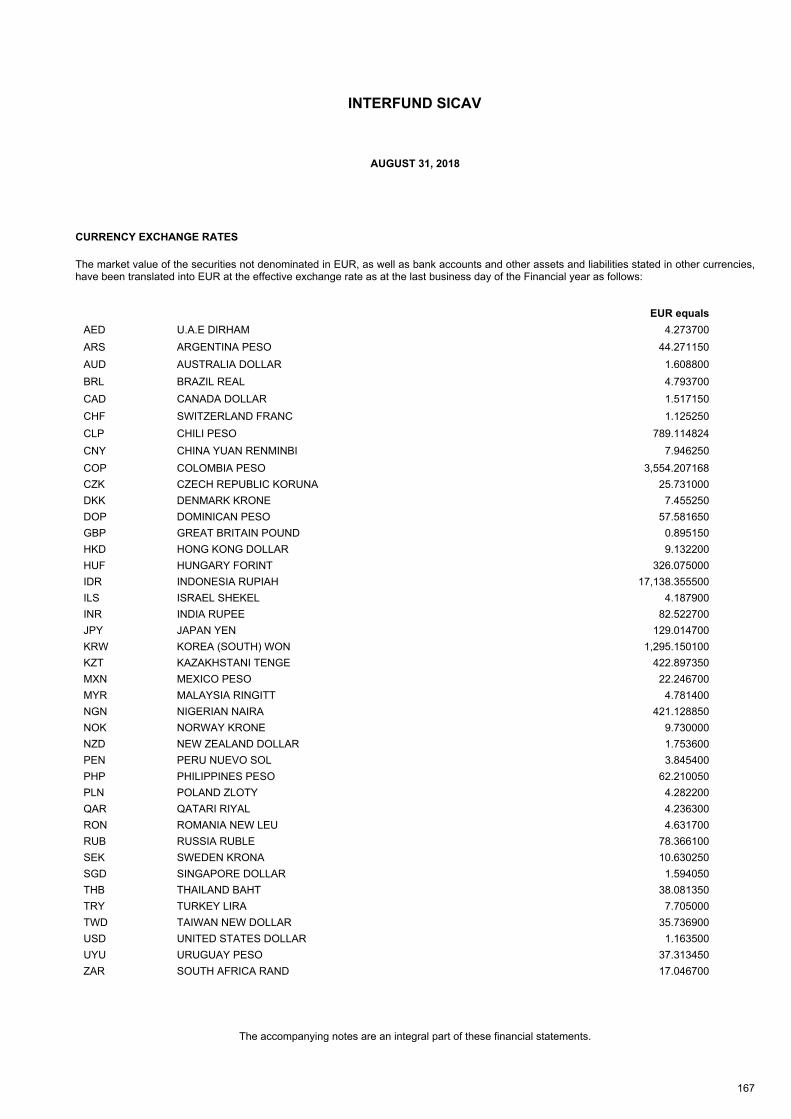
INTERFUND SICAV
AUGUST 31, 2018
167
CURRENCY EXCHANGE RATES
The market value of the securities not denominated in EUR, as well as bank accounts and other assets and liabilities stated in other currencies, have been translated into EUR at the effective exchange rate as at the last business day of the Financial year as follows:
EUR equals
AED U.A.E DIRHAM 4.273700
ARS ARGENTINA PESO 44.271150
AUD AUSTRALIA DOLLAR 1.608800
BRL BRAZIL REAL 4.793700
CAD CANADA DOLLAR 1.517150
CHF SWITZERLAND FRANC 1.125250
CLP CHILI PESO 789.114824
CNY CHINA YUAN RENMINBI 7.946250
COP COLOMBIA PESO 3,554.207168
CZK CZECH REPUBLIC KORUNA 25.731000
DKK DENMARK KRONE 7.455250
DOP DOMINICAN PESO 57.581650
GBP GREAT BRITAIN POUND 0.895150
HKD HONG KONG DOLLAR 9.132200
HUF HUNGARY FORINT 326.075000
IDR INDONESIA RUPIAH 17,138.355500
ILS ISRAEL SHEKEL 4.187900
INR INDIA RUPEE 82.522700
JPY JAPAN YEN 129.014700
KRW KOREA (SOUTH) WON 1,295.150100
KZT KAZAKHSTANI TENGE 422.897350
MXN MEXICO PESO 22.246700
MYR MALAYSIA RINGITT 4.781400
NGN NIGERIAN NAIRA 421.128850
NOK NORWAY KRONE 9.730000
NZD NEW ZEALAND DOLLAR 1.753600
PEN PERU NUEVO SOL 3.845400
PHP PHILIPPINES PESO 62.210050
PLN POLAND ZLOTY 4.282200
QAR QATARI RIYAL 4.236300
RON ROMANIA NEW LEU 4.631700
RUB RUSSIA RUBLE 78.366100
SEK SWEDEN KRONA 10.630250
SGD SINGAPORE DOLLAR 1.594050
THB THAILAND BAHT 38.081350
TRY TURKEY LIRA 7.705000
TWD TAIWAN NEW DOLLAR 35.736900
USD UNITED STATES DOLLAR 1.163500
UYU URUGUAY PESO 37.313450
ZAR SOUTH AFRICA RAND 17.046700
The accompanying notes are an integral part of these financial statements.
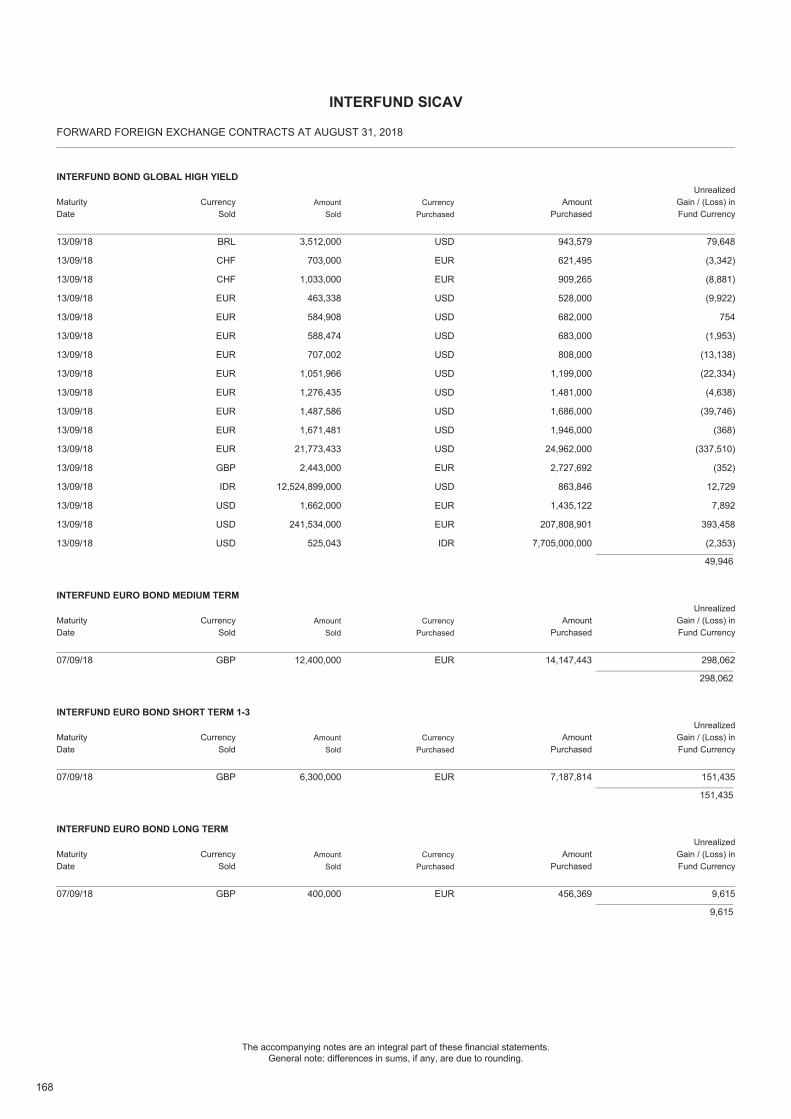
168
The accompanying notes are an integral part of these financial statements.General note: differences in sums, if any, are due to rounding.
FORWARD FOREIGN EXCHANGE CONTRACTS AT AUGUST 31, 2018
INTERFUND SICAV
13/09/18 BRL 3,512,000 USD 943,579 79,648
INTERFUND BOND GLOBAL HIGH YIELD
MaturityDate
CurrencySold
AmountSold
CurrencyPurchased
AmountPurchased
UnrealizedGain / (Loss) inFund Currency
13/09/18 CHF 703,000 EUR 621,495 (3,342)
13/09/18 CHF 1,033,000 EUR 909,265 (8,881)
13/09/18 EUR 463,338 USD 528,000 (9,922)
13/09/18 EUR 584,908 USD 682,000 754
13/09/18 EUR 588,474 USD 683,000 (1,953)
13/09/18 EUR 707,002 USD 808,000 (13,138)
13/09/18 EUR 1,051,966 USD 1,199,000 (22,334)
13/09/18 EUR 1,276,435 USD 1,481,000 (4,638)
13/09/18 EUR 1,487,586 USD 1,686,000 (39,746)
13/09/18 EUR 1,671,481 USD 1,946,000 (368)
13/09/18 EUR 21,773,433 USD 24,962,000 (337,510)
13/09/18 GBP 2,443,000 EUR 2,727,692 (352)
13/09/18 IDR 12,524,899,000 USD 863,846 12,729
13/09/18 USD 1,662,000 EUR 1,435,122 7,892
13/09/18 USD 241,534,000 EUR 207,808,901 393,458
13/09/18 USD 525,043 IDR 7,705,000,000 (2,353)
49,946
07/09/18 GBP 12,400,000 EUR 14,147,443 298,062
INTERFUND EURO BOND MEDIUM TERM
MaturityDate
CurrencySold
AmountSold
CurrencyPurchased
AmountPurchased
UnrealizedGain / (Loss) inFund Currency
298,062
07/09/18 GBP 6,300,000 EUR 7,187,814 151,435
INTERFUND EURO BOND SHORT TERM 1-3
MaturityDate
CurrencySold
AmountSold
CurrencyPurchased
AmountPurchased
UnrealizedGain / (Loss) inFund Currency
151,435
07/09/18 GBP 400,000 EUR 456,369 9,615
INTERFUND EURO BOND LONG TERM
MaturityDate
CurrencySold
AmountSold
CurrencyPurchased
AmountPurchased
UnrealizedGain / (Loss) inFund Currency
9,615
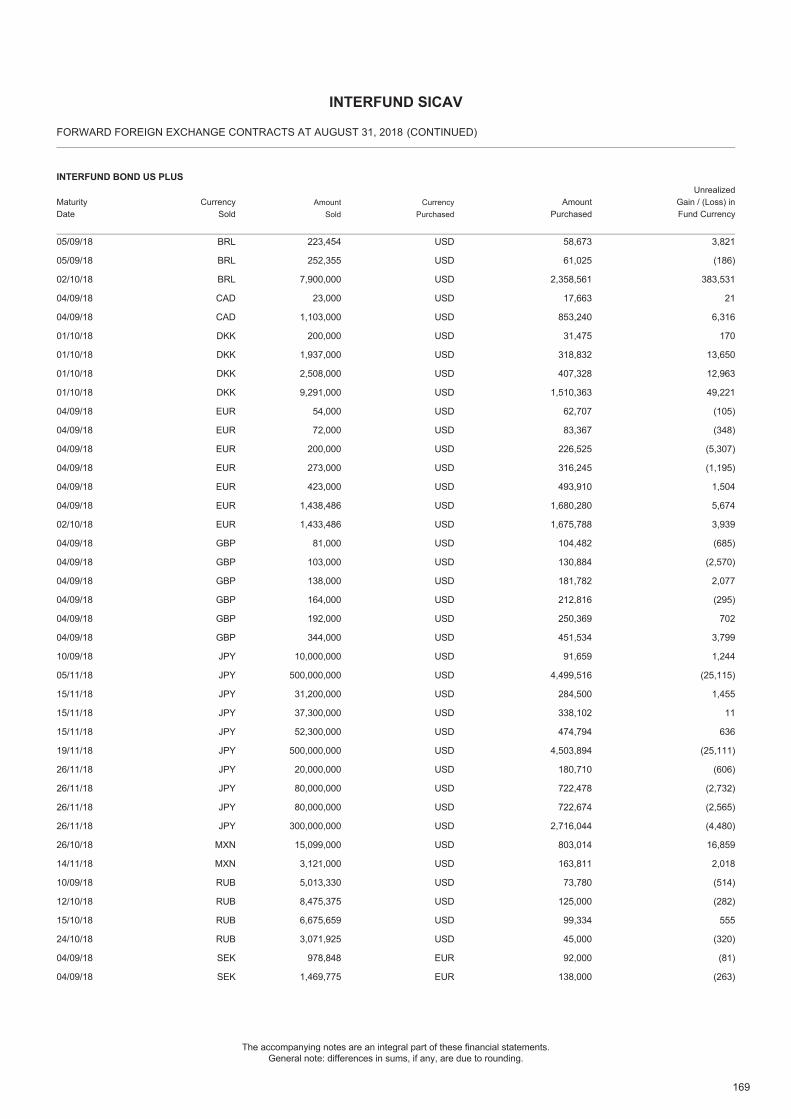
169
The accompanying notes are an integral part of these financial statements.General note: differences in sums, if any, are due to rounding.
FORWARD FOREIGN EXCHANGE CONTRACTS AT AUGUST 31, 2018
INTERFUND SICAV
05/09/18 BRL 223,454 USD 58,673 3,821
INTERFUND BOND US PLUS
MaturityDate
CurrencySold
AmountSold
CurrencyPurchased
AmountPurchased
UnrealizedGain / (Loss) inFund Currency
05/09/18 BRL 252,355 USD 61,025 (186)
02/10/18 BRL 7,900,000 USD 2,358,561 383,531
04/09/18 CAD 23,000 USD 17,663 21
04/09/18 CAD 1,103,000 USD 853,240 6,316
01/10/18 DKK 200,000 USD 31,475 170
01/10/18 DKK 1,937,000 USD 318,832 13,650
01/10/18 DKK 2,508,000 USD 407,328 12,963
01/10/18 DKK 9,291,000 USD 1,510,363 49,221
04/09/18 EUR 54,000 USD 62,707 (105)
04/09/18 EUR 72,000 USD 83,367 (348)
04/09/18 EUR 200,000 USD 226,525 (5,307)
04/09/18 EUR 273,000 USD 316,245 (1,195)
04/09/18 EUR 423,000 USD 493,910 1,504
04/09/18 EUR 1,438,486 USD 1,680,280 5,674
02/10/18 EUR 1,433,486 USD 1,675,788 3,939
04/09/18 GBP 81,000 USD 104,482 (685)
04/09/18 GBP 103,000 USD 130,884 (2,570)
04/09/18 GBP 138,000 USD 181,782 2,077
04/09/18 GBP 164,000 USD 212,816 (295)
04/09/18 GBP 192,000 USD 250,369 702
04/09/18 GBP 344,000 USD 451,534 3,799
10/09/18 JPY 10,000,000 USD 91,659 1,244
05/11/18 JPY 500,000,000 USD 4,499,516 (25,115)
15/11/18 JPY 31,200,000 USD 284,500 1,455
15/11/18 JPY 37,300,000 USD 338,102 11
15/11/18 JPY 52,300,000 USD 474,794 636
19/11/18 JPY 500,000,000 USD 4,503,894 (25,111)
26/11/18 JPY 20,000,000 USD 180,710 (606)
26/11/18 JPY 80,000,000 USD 722,478 (2,732)
26/11/18 JPY 80,000,000 USD 722,674 (2,565)
26/11/18 JPY 300,000,000 USD 2,716,044 (4,480)
26/10/18 MXN 15,099,000 USD 803,014 16,859
14/11/18 MXN 3,121,000 USD 163,811 2,018
10/09/18 RUB 5,013,330 USD 73,780 (514)
12/10/18 RUB 8,475,375 USD 125,000 (282)
15/10/18 RUB 6,675,659 USD 99,334 555
24/10/18 RUB 3,071,925 USD 45,000 (320)
04/09/18 SEK 978,848 EUR 92,000 (81)
04/09/18 SEK 1,469,775 EUR 138,000 (263)
(CONTINUED)
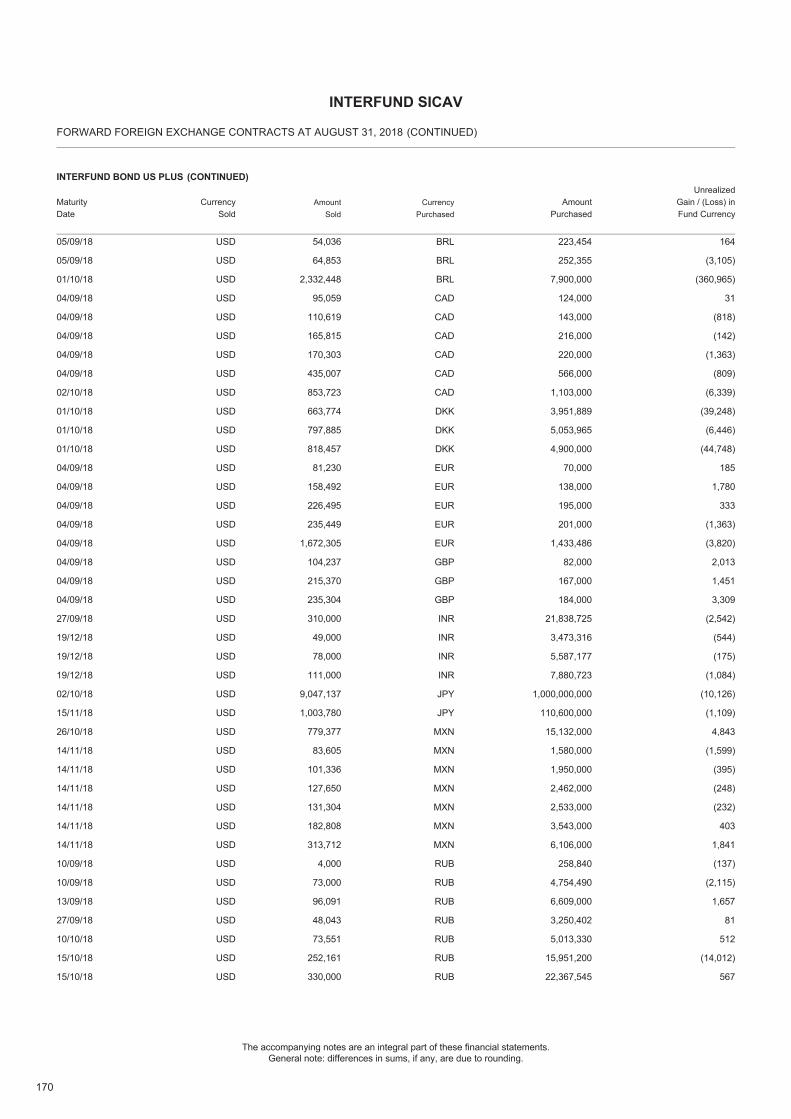
170
The accompanying notes are an integral part of these financial statements.General note: differences in sums, if any, are due to rounding.
FORWARD FOREIGN EXCHANGE CONTRACTS AT AUGUST 31, 2018
INTERFUND SICAV
05/09/18 USD 54,036 BRL 223,454 164
INTERFUND BOND US PLUS
MaturityDate
CurrencySold
AmountSold
CurrencyPurchased
AmountPurchased
UnrealizedGain / (Loss) inFund Currency
(CONTINUED)
05/09/18 USD 64,853 BRL 252,355 (3,105)
01/10/18 USD 2,332,448 BRL 7,900,000 (360,965)
04/09/18 USD 95,059 CAD 124,000 31
04/09/18 USD 110,619 CAD 143,000 (818)
04/09/18 USD 165,815 CAD 216,000 (142)
04/09/18 USD 170,303 CAD 220,000 (1,363)
04/09/18 USD 435,007 CAD 566,000 (809)
02/10/18 USD 853,723 CAD 1,103,000 (6,339)
01/10/18 USD 663,774 DKK 3,951,889 (39,248)
01/10/18 USD 797,885 DKK 5,053,965 (6,446)
01/10/18 USD 818,457 DKK 4,900,000 (44,748)
04/09/18 USD 81,230 EUR 70,000 185
04/09/18 USD 158,492 EUR 138,000 1,780
04/09/18 USD 226,495 EUR 195,000 333
04/09/18 USD 235,449 EUR 201,000 (1,363)
04/09/18 USD 1,672,305 EUR 1,433,486 (3,820)
04/09/18 USD 104,237 GBP 82,000 2,013
04/09/18 USD 215,370 GBP 167,000 1,451
04/09/18 USD 235,304 GBP 184,000 3,309
27/09/18 USD 310,000 INR 21,838,725 (2,542)
19/12/18 USD 49,000 INR 3,473,316 (544)
19/12/18 USD 78,000 INR 5,587,177 (175)
19/12/18 USD 111,000 INR 7,880,723 (1,084)
02/10/18 USD 9,047,137 JPY 1,000,000,000 (10,126)
15/11/18 USD 1,003,780 JPY 110,600,000 (1,109)
26/10/18 USD 779,377 MXN 15,132,000 4,843
14/11/18 USD 83,605 MXN 1,580,000 (1,599)
14/11/18 USD 101,336 MXN 1,950,000 (395)
14/11/18 USD 127,650 MXN 2,462,000 (248)
14/11/18 USD 131,304 MXN 2,533,000 (232)
14/11/18 USD 182,808 MXN 3,543,000 403
14/11/18 USD 313,712 MXN 6,106,000 1,841
10/09/18 USD 4,000 RUB 258,840 (137)
10/09/18 USD 73,000 RUB 4,754,490 (2,115)
13/09/18 USD 96,091 RUB 6,609,000 1,657
27/09/18 USD 48,043 RUB 3,250,402 81
10/10/18 USD 73,551 RUB 5,013,330 512
15/10/18 USD 252,161 RUB 15,951,200 (14,012)
15/10/18 USD 330,000 RUB 22,367,545 567
(CONTINUED)
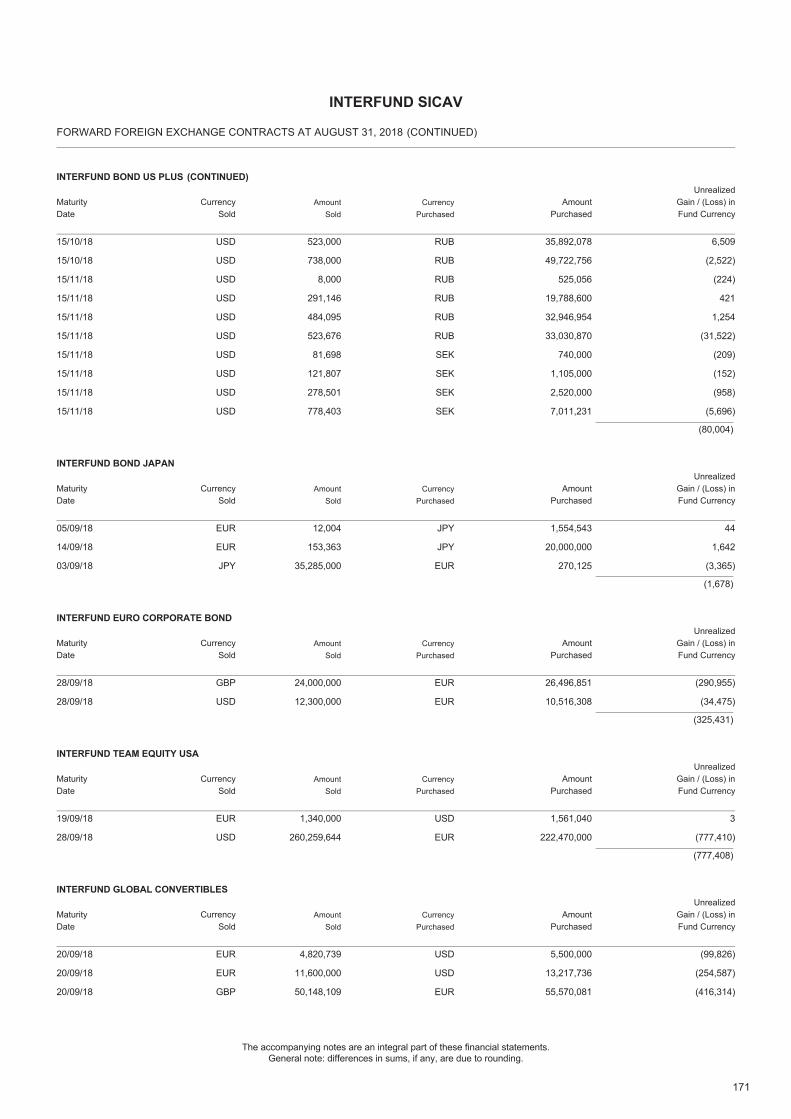
171
The accompanying notes are an integral part of these financial statements.General note: differences in sums, if any, are due to rounding.
FORWARD FOREIGN EXCHANGE CONTRACTS AT AUGUST 31, 2018
INTERFUND SICAV
15/10/18 USD 523,000 RUB 35,892,078 6,509
INTERFUND BOND US PLUS
MaturityDate
CurrencySold
AmountSold
CurrencyPurchased
AmountPurchased
UnrealizedGain / (Loss) inFund Currency
(CONTINUED)
15/10/18 USD 738,000 RUB 49,722,756 (2,522)
15/11/18 USD 8,000 RUB 525,056 (224)
15/11/18 USD 291,146 RUB 19,788,600 421
15/11/18 USD 484,095 RUB 32,946,954 1,254
15/11/18 USD 523,676 RUB 33,030,870 (31,522)
15/11/18 USD 81,698 SEK 740,000 (209)
15/11/18 USD 121,807 SEK 1,105,000 (152)
15/11/18 USD 278,501 SEK 2,520,000 (958)
15/11/18 USD 778,403 SEK 7,011,231 (5,696)
(80,004)
05/09/18 EUR 12,004 JPY 1,554,543 44
INTERFUND BOND JAPAN
MaturityDate
CurrencySold
AmountSold
CurrencyPurchased
AmountPurchased
UnrealizedGain / (Loss) inFund Currency
14/09/18 EUR 153,363 JPY 20,000,000 1,642
03/09/18 JPY 35,285,000 EUR 270,125 (3,365)
(1,678)
28/09/18 GBP 24,000,000 EUR 26,496,851 (290,955)
INTERFUND EURO CORPORATE BOND
MaturityDate
CurrencySold
AmountSold
CurrencyPurchased
AmountPurchased
UnrealizedGain / (Loss) inFund Currency
28/09/18 USD 12,300,000 EUR 10,516,308 (34,475)
(325,431)
19/09/18 EUR 1,340,000 USD 1,561,040 3
INTERFUND TEAM EQUITY USA
MaturityDate
CurrencySold
AmountSold
CurrencyPurchased
AmountPurchased
UnrealizedGain / (Loss) inFund Currency
28/09/18 USD 260,259,644 EUR 222,470,000 (777,410)
(777,408)
20/09/18 EUR 4,820,739 USD 5,500,000 (99,826)
INTERFUND GLOBAL CONVERTIBLES
MaturityDate
CurrencySold
AmountSold
CurrencyPurchased
AmountPurchased
UnrealizedGain / (Loss) inFund Currency
20/09/18 EUR 11,600,000 USD 13,217,736 (254,587)
20/09/18 GBP 50,148,109 EUR 55,570,081 (416,314)
(CONTINUED)
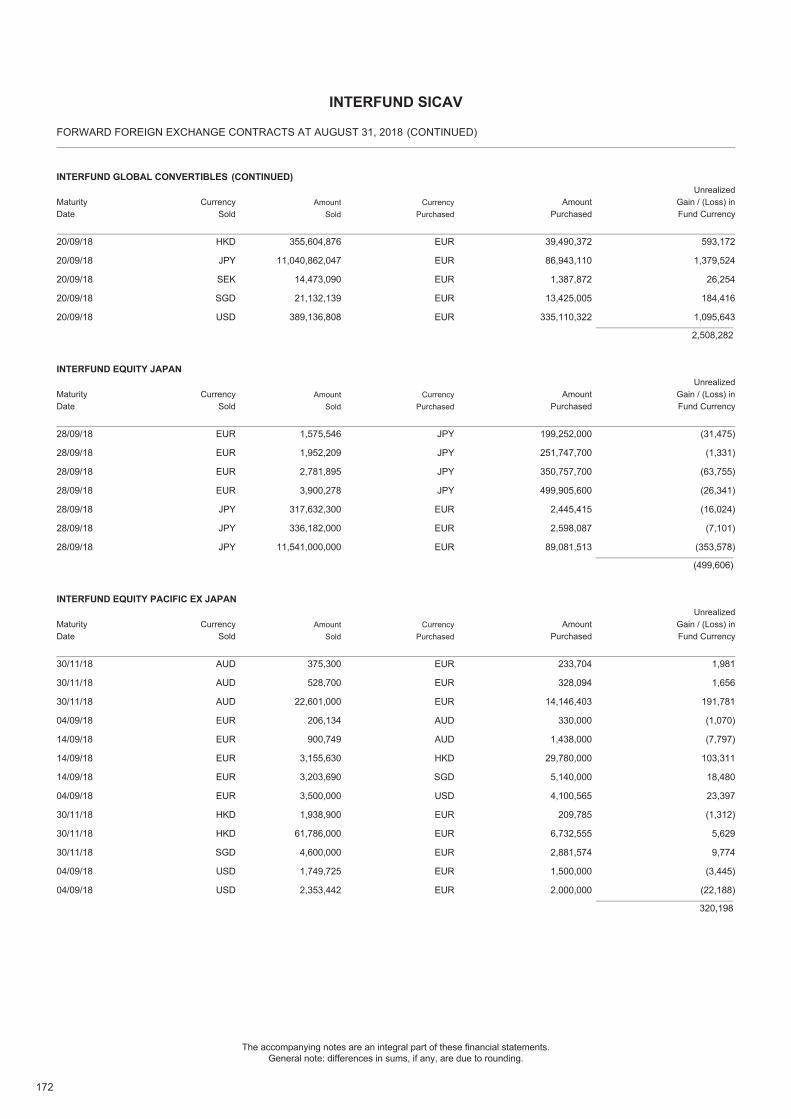
172
The accompanying notes are an integral part of these financial statements.General note: differences in sums, if any, are due to rounding.
FORWARD FOREIGN EXCHANGE CONTRACTS AT AUGUST 31, 2018
INTERFUND SICAV
20/09/18 HKD 355,604,876 EUR 39,490,372 593,172
INTERFUND GLOBAL CONVERTIBLES
MaturityDate
CurrencySold
AmountSold
CurrencyPurchased
AmountPurchased
UnrealizedGain / (Loss) inFund Currency
(CONTINUED)
20/09/18 JPY 11,040,862,047 EUR 86,943,110 1,379,524
20/09/18 SEK 14,473,090 EUR 1,387,872 26,254
20/09/18 SGD 21,132,139 EUR 13,425,005 184,416
20/09/18 USD 389,136,808 EUR 335,110,322 1,095,643
2,508,282
28/09/18 EUR 1,575,546 JPY 199,252,000 (31,475)
INTERFUND EQUITY JAPAN
MaturityDate
CurrencySold
AmountSold
CurrencyPurchased
AmountPurchased
UnrealizedGain / (Loss) inFund Currency
28/09/18 EUR 1,952,209 JPY 251,747,700 (1,331)
28/09/18 EUR 2,781,895 JPY 350,757,700 (63,755)
28/09/18 EUR 3,900,278 JPY 499,905,600 (26,341)
28/09/18 JPY 317,632,300 EUR 2,445,415 (16,024)
28/09/18 JPY 336,182,000 EUR 2,598,087 (7,101)
28/09/18 JPY 11,541,000,000 EUR 89,081,513 (353,578)
(499,606)
30/11/18 AUD 375,300 EUR 233,704 1,981
INTERFUND EQUITY PACIFIC EX JAPAN
MaturityDate
CurrencySold
AmountSold
CurrencyPurchased
AmountPurchased
UnrealizedGain / (Loss) inFund Currency
30/11/18 AUD 528,700 EUR 328,094 1,656
30/11/18 AUD 22,601,000 EUR 14,146,403 191,781
04/09/18 EUR 206,134 AUD 330,000 (1,070)
14/09/18 EUR 900,749 AUD 1,438,000 (7,797)
14/09/18 EUR 3,155,630 HKD 29,780,000 103,311
14/09/18 EUR 3,203,690 SGD 5,140,000 18,480
04/09/18 EUR 3,500,000 USD 4,100,565 23,397
30/11/18 HKD 1,938,900 EUR 209,785 (1,312)
30/11/18 HKD 61,786,000 EUR 6,732,555 5,629
30/11/18 SGD 4,600,000 EUR 2,881,574 9,774
04/09/18 USD 1,749,725 EUR 1,500,000 (3,445)
04/09/18 USD 2,353,442 EUR 2,000,000 (22,188)
320,198
(CONTINUED)
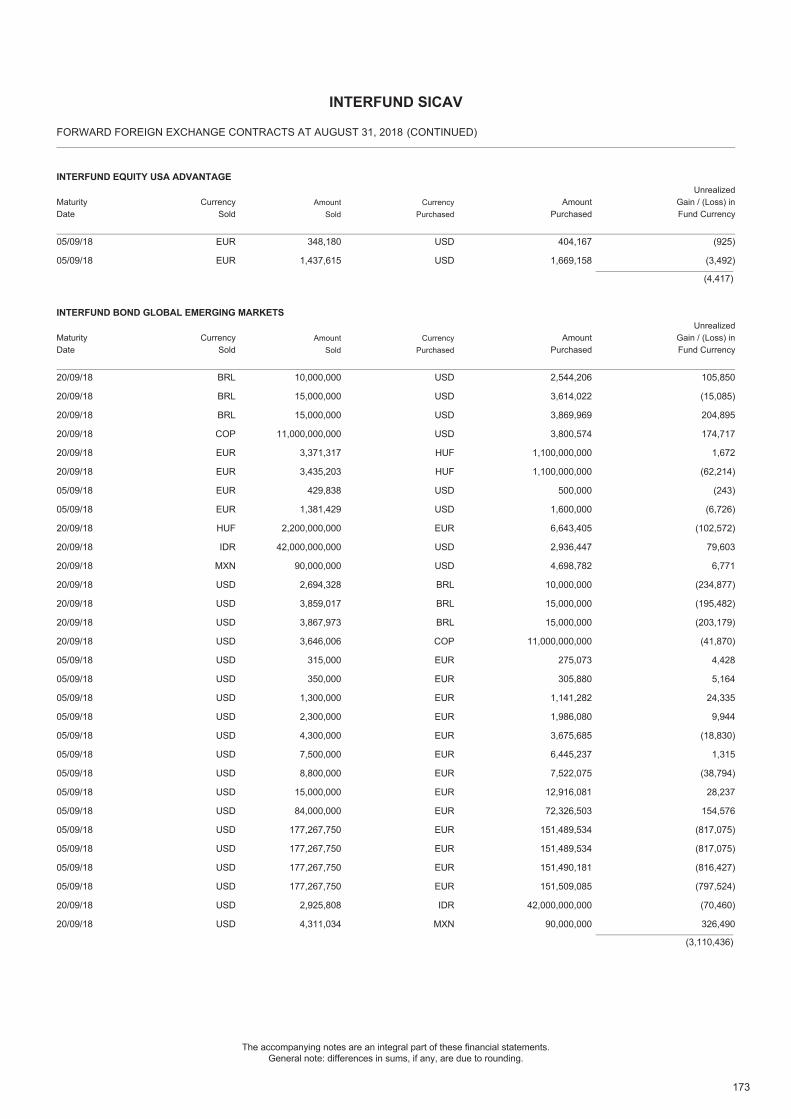
173
The accompanying notes are an integral part of these financial statements.General note: differences in sums, if any, are due to rounding.
FORWARD FOREIGN EXCHANGE CONTRACTS AT AUGUST 31, 2018
INTERFUND SICAV
05/09/18 EUR 348,180 USD 404,167 (925)
INTERFUND EQUITY USA ADVANTAGE
MaturityDate
CurrencySold
AmountSold
CurrencyPurchased
AmountPurchased
UnrealizedGain / (Loss) inFund Currency
05/09/18 EUR 1,437,615 USD 1,669,158 (3,492)
(4,417)
20/09/18 BRL 10,000,000 USD 2,544,206 105,850
INTERFUND BOND GLOBAL EMERGING MARKETS
MaturityDate
CurrencySold
AmountSold
CurrencyPurchased
AmountPurchased
UnrealizedGain / (Loss) inFund Currency
20/09/18 BRL 15,000,000 USD 3,614,022 (15,085)
20/09/18 BRL 15,000,000 USD 3,869,969 204,895
20/09/18 COP 11,000,000,000 USD 3,800,574 174,717
20/09/18 EUR 3,371,317 HUF 1,100,000,000 1,672
20/09/18 EUR 3,435,203 HUF 1,100,000,000 (62,214)
05/09/18 EUR 429,838 USD 500,000 (243)
05/09/18 EUR 1,381,429 USD 1,600,000 (6,726)
20/09/18 HUF 2,200,000,000 EUR 6,643,405 (102,572)
20/09/18 IDR 42,000,000,000 USD 2,936,447 79,603
20/09/18 MXN 90,000,000 USD 4,698,782 6,771
20/09/18 USD 2,694,328 BRL 10,000,000 (234,877)
20/09/18 USD 3,859,017 BRL 15,000,000 (195,482)
20/09/18 USD 3,867,973 BRL 15,000,000 (203,179)
20/09/18 USD 3,646,006 COP 11,000,000,000 (41,870)
05/09/18 USD 315,000 EUR 275,073 4,428
05/09/18 USD 350,000 EUR 305,880 5,164
05/09/18 USD 1,300,000 EUR 1,141,282 24,335
05/09/18 USD 2,300,000 EUR 1,986,080 9,944
05/09/18 USD 4,300,000 EUR 3,675,685 (18,830)
05/09/18 USD 7,500,000 EUR 6,445,237 1,315
05/09/18 USD 8,800,000 EUR 7,522,075 (38,794)
05/09/18 USD 15,000,000 EUR 12,916,081 28,237
05/09/18 USD 84,000,000 EUR 72,326,503 154,576
05/09/18 USD 177,267,750 EUR 151,489,534 (817,075)
05/09/18 USD 177,267,750 EUR 151,489,534 (817,075)
05/09/18 USD 177,267,750 EUR 151,490,181 (816,427)
05/09/18 USD 177,267,750 EUR 151,509,085 (797,524)
20/09/18 USD 2,925,808 IDR 42,000,000,000 (70,460)
20/09/18 USD 4,311,034 MXN 90,000,000 326,490
(3,110,436)
(CONTINUED)
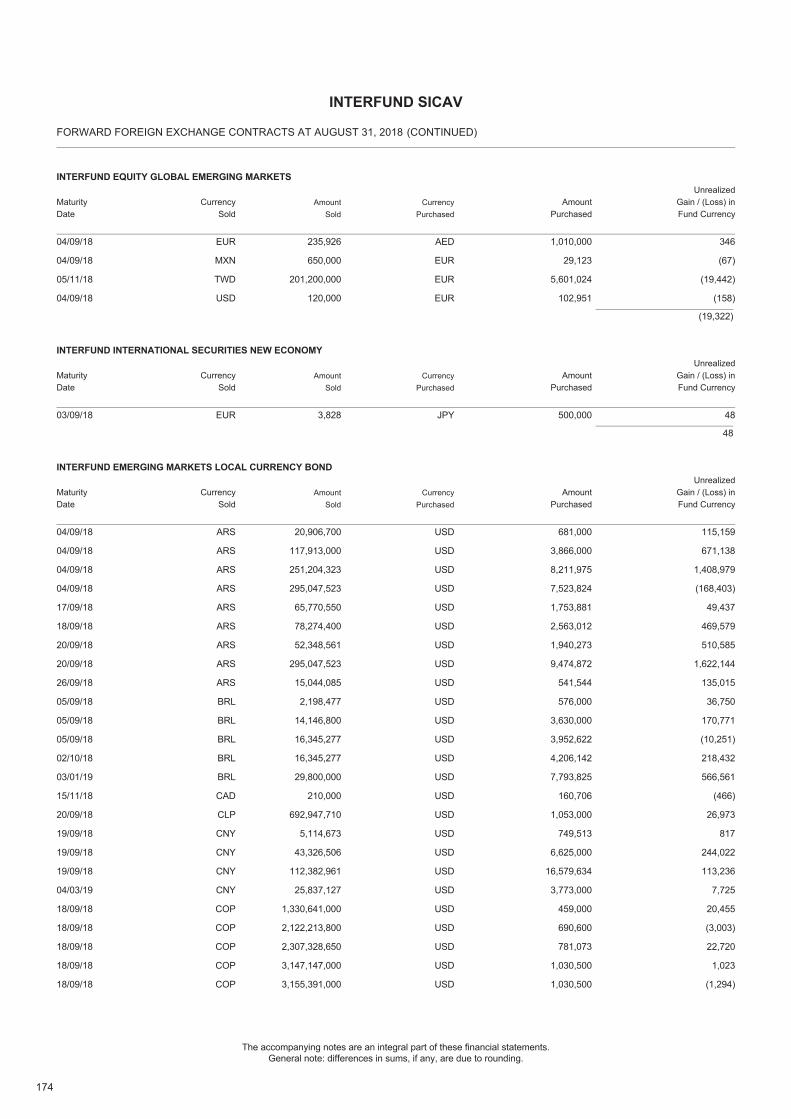
174
The accompanying notes are an integral part of these financial statements.General note: differences in sums, if any, are due to rounding.
FORWARD FOREIGN EXCHANGE CONTRACTS AT AUGUST 31, 2018
INTERFUND SICAV
04/09/18 EUR 235,926 AED 1,010,000 346
INTERFUND EQUITY GLOBAL EMERGING MARKETS
MaturityDate
CurrencySold
AmountSold
CurrencyPurchased
AmountPurchased
UnrealizedGain / (Loss) inFund Currency
04/09/18 MXN 650,000 EUR 29,123 (67)
05/11/18 TWD 201,200,000 EUR 5,601,024 (19,442)
04/09/18 USD 120,000 EUR 102,951 (158)
(19,322)
03/09/18 EUR 3,828 JPY 500,000 48
INTERFUND INTERNATIONAL SECURITIES NEW ECONOMY
MaturityDate
CurrencySold
AmountSold
CurrencyPurchased
AmountPurchased
UnrealizedGain / (Loss) inFund Currency
48
04/09/18 ARS 20,906,700 USD 681,000 115,159
INTERFUND EMERGING MARKETS LOCAL CURRENCY BOND
MaturityDate
CurrencySold
AmountSold
CurrencyPurchased
AmountPurchased
UnrealizedGain / (Loss) inFund Currency
04/09/18 ARS 117,913,000 USD 3,866,000 671,138
04/09/18 ARS 251,204,323 USD 8,211,975 1,408,979
04/09/18 ARS 295,047,523 USD 7,523,824 (168,403)
17/09/18 ARS 65,770,550 USD 1,753,881 49,437
18/09/18 ARS 78,274,400 USD 2,563,012 469,579
20/09/18 ARS 52,348,561 USD 1,940,273 510,585
20/09/18 ARS 295,047,523 USD 9,474,872 1,622,144
26/09/18 ARS 15,044,085 USD 541,544 135,015
05/09/18 BRL 2,198,477 USD 576,000 36,750
05/09/18 BRL 14,146,800 USD 3,630,000 170,771
05/09/18 BRL 16,345,277 USD 3,952,622 (10,251)
02/10/18 BRL 16,345,277 USD 4,206,142 218,432
03/01/19 BRL 29,800,000 USD 7,793,825 566,561
15/11/18 CAD 210,000 USD 160,706 (466)
20/09/18 CLP 692,947,710 USD 1,053,000 26,973
19/09/18 CNY 5,114,673 USD 749,513 817
19/09/18 CNY 43,326,506 USD 6,625,000 244,022
19/09/18 CNY 112,382,961 USD 16,579,634 113,236
04/03/19 CNY 25,837,127 USD 3,773,000 7,725
18/09/18 COP 1,330,641,000 USD 459,000 20,455
18/09/18 COP 2,122,213,800 USD 690,600 (3,003)
18/09/18 COP 2,307,328,650 USD 781,073 22,720
18/09/18 COP 3,147,147,000 USD 1,030,500 1,023
18/09/18 COP 3,155,391,000 USD 1,030,500 (1,294)
(CONTINUED)
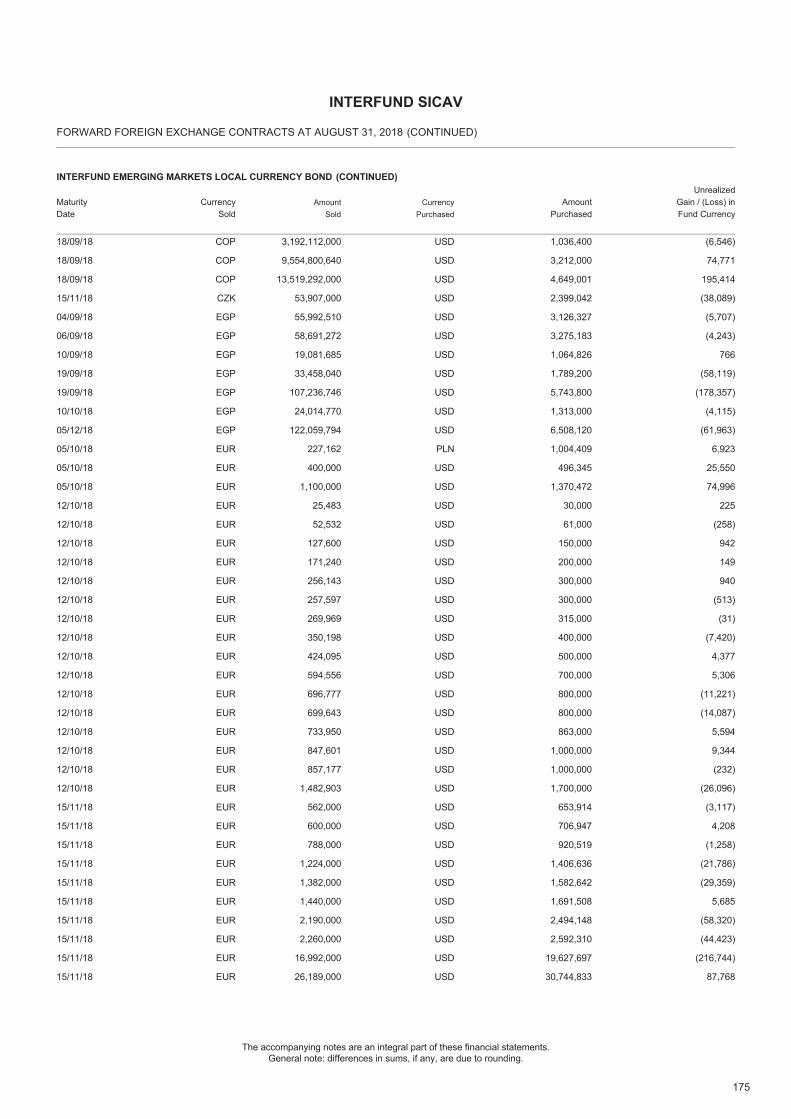
175
The accompanying notes are an integral part of these financial statements.General note: differences in sums, if any, are due to rounding.
FORWARD FOREIGN EXCHANGE CONTRACTS AT AUGUST 31, 2018
INTERFUND SICAV
18/09/18 COP 3,192,112,000 USD 1,036,400 (6,546)
INTERFUND EMERGING MARKETS LOCAL CURRENCY BOND
MaturityDate
CurrencySold
AmountSold
CurrencyPurchased
AmountPurchased
UnrealizedGain / (Loss) inFund Currency
(CONTINUED)
18/09/18 COP 9,554,800,640 USD 3,212,000 74,771
18/09/18 COP 13,519,292,000 USD 4,649,001 195,414
15/11/18 CZK 53,907,000 USD 2,399,042 (38,089)
04/09/18 EGP 55,992,510 USD 3,126,327 (5,707)
06/09/18 EGP 58,691,272 USD 3,275,183 (4,243)
10/09/18 EGP 19,081,685 USD 1,064,826 766
19/09/18 EGP 33,458,040 USD 1,789,200 (58,119)
19/09/18 EGP 107,236,746 USD 5,743,800 (178,357)
10/10/18 EGP 24,014,770 USD 1,313,000 (4,115)
05/12/18 EGP 122,059,794 USD 6,508,120 (61,963)
05/10/18 EUR 227,162 PLN 1,004,409 6,923
05/10/18 EUR 400,000 USD 496,345 25,550
05/10/18 EUR 1,100,000 USD 1,370,472 74,996
12/10/18 EUR 25,483 USD 30,000 225
12/10/18 EUR 52,532 USD 61,000 (258)
12/10/18 EUR 127,600 USD 150,000 942
12/10/18 EUR 171,240 USD 200,000 149
12/10/18 EUR 256,143 USD 300,000 940
12/10/18 EUR 257,597 USD 300,000 (513)
12/10/18 EUR 269,969 USD 315,000 (31)
12/10/18 EUR 350,198 USD 400,000 (7,420)
12/10/18 EUR 424,095 USD 500,000 4,377
12/10/18 EUR 594,556 USD 700,000 5,306
12/10/18 EUR 696,777 USD 800,000 (11,221)
12/10/18 EUR 699,643 USD 800,000 (14,087)
12/10/18 EUR 733,950 USD 863,000 5,594
12/10/18 EUR 847,601 USD 1,000,000 9,344
12/10/18 EUR 857,177 USD 1,000,000 (232)
12/10/18 EUR 1,482,903 USD 1,700,000 (26,096)
15/11/18 EUR 562,000 USD 653,914 (3,117)
15/11/18 EUR 600,000 USD 706,947 4,208
15/11/18 EUR 788,000 USD 920,519 (1,258)
15/11/18 EUR 1,224,000 USD 1,406,636 (21,786)
15/11/18 EUR 1,382,000 USD 1,582,642 (29,359)
15/11/18 EUR 1,440,000 USD 1,691,508 5,685
15/11/18 EUR 2,190,000 USD 2,494,148 (58,320)
15/11/18 EUR 2,260,000 USD 2,592,310 (44,423)
15/11/18 EUR 16,992,000 USD 19,627,697 (216,744)
15/11/18 EUR 26,189,000 USD 30,744,833 87,768
(CONTINUED)
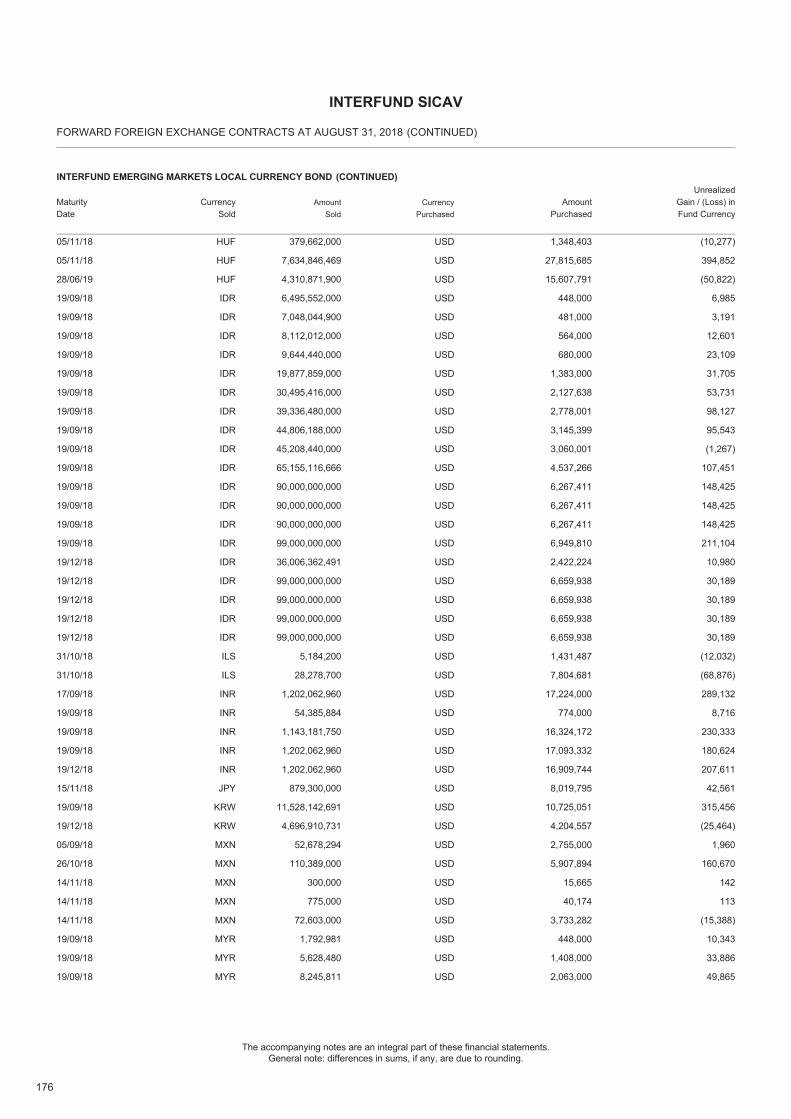
176
The accompanying notes are an integral part of these financial statements.General note: differences in sums, if any, are due to rounding.
FORWARD FOREIGN EXCHANGE CONTRACTS AT AUGUST 31, 2018
INTERFUND SICAV
05/11/18 HUF 379,662,000 USD 1,348,403 (10,277)
INTERFUND EMERGING MARKETS LOCAL CURRENCY BOND
MaturityDate
CurrencySold
AmountSold
CurrencyPurchased
AmountPurchased
UnrealizedGain / (Loss) inFund Currency
(CONTINUED)
05/11/18 HUF 7,634,846,469 USD 27,815,685 394,852
28/06/19 HUF 4,310,871,900 USD 15,607,791 (50,822)
19/09/18 IDR 6,495,552,000 USD 448,000 6,985
19/09/18 IDR 7,048,044,900 USD 481,000 3,191
19/09/18 IDR 8,112,012,000 USD 564,000 12,601
19/09/18 IDR 9,644,440,000 USD 680,000 23,109
19/09/18 IDR 19,877,859,000 USD 1,383,000 31,705
19/09/18 IDR 30,495,416,000 USD 2,127,638 53,731
19/09/18 IDR 39,336,480,000 USD 2,778,001 98,127
19/09/18 IDR 44,806,188,000 USD 3,145,399 95,543
19/09/18 IDR 45,208,440,000 USD 3,060,001 (1,267)
19/09/18 IDR 65,155,116,666 USD 4,537,266 107,451
19/09/18 IDR 90,000,000,000 USD 6,267,411 148,425
19/09/18 IDR 90,000,000,000 USD 6,267,411 148,425
19/09/18 IDR 90,000,000,000 USD 6,267,411 148,425
19/09/18 IDR 99,000,000,000 USD 6,949,810 211,104
19/12/18 IDR 36,006,362,491 USD 2,422,224 10,980
19/12/18 IDR 99,000,000,000 USD 6,659,938 30,189
19/12/18 IDR 99,000,000,000 USD 6,659,938 30,189
19/12/18 IDR 99,000,000,000 USD 6,659,938 30,189
19/12/18 IDR 99,000,000,000 USD 6,659,938 30,189
31/10/18 ILS 5,184,200 USD 1,431,487 (12,032)
31/10/18 ILS 28,278,700 USD 7,804,681 (68,876)
17/09/18 INR 1,202,062,960 USD 17,224,000 289,132
19/09/18 INR 54,385,884 USD 774,000 8,716
19/09/18 INR 1,143,181,750 USD 16,324,172 230,333
19/09/18 INR 1,202,062,960 USD 17,093,332 180,624
19/12/18 INR 1,202,062,960 USD 16,909,744 207,611
15/11/18 JPY 879,300,000 USD 8,019,795 42,561
19/09/18 KRW 11,528,142,691 USD 10,725,051 315,456
19/12/18 KRW 4,696,910,731 USD 4,204,557 (25,464)
05/09/18 MXN 52,678,294 USD 2,755,000 1,960
26/10/18 MXN 110,389,000 USD 5,907,894 160,670
14/11/18 MXN 300,000 USD 15,665 142
14/11/18 MXN 775,000 USD 40,174 113
14/11/18 MXN 72,603,000 USD 3,733,282 (15,388)
19/09/18 MYR 1,792,981 USD 448,000 10,343
19/09/18 MYR 5,628,480 USD 1,408,000 33,886
19/09/18 MYR 8,245,811 USD 2,063,000 49,865
(CONTINUED)
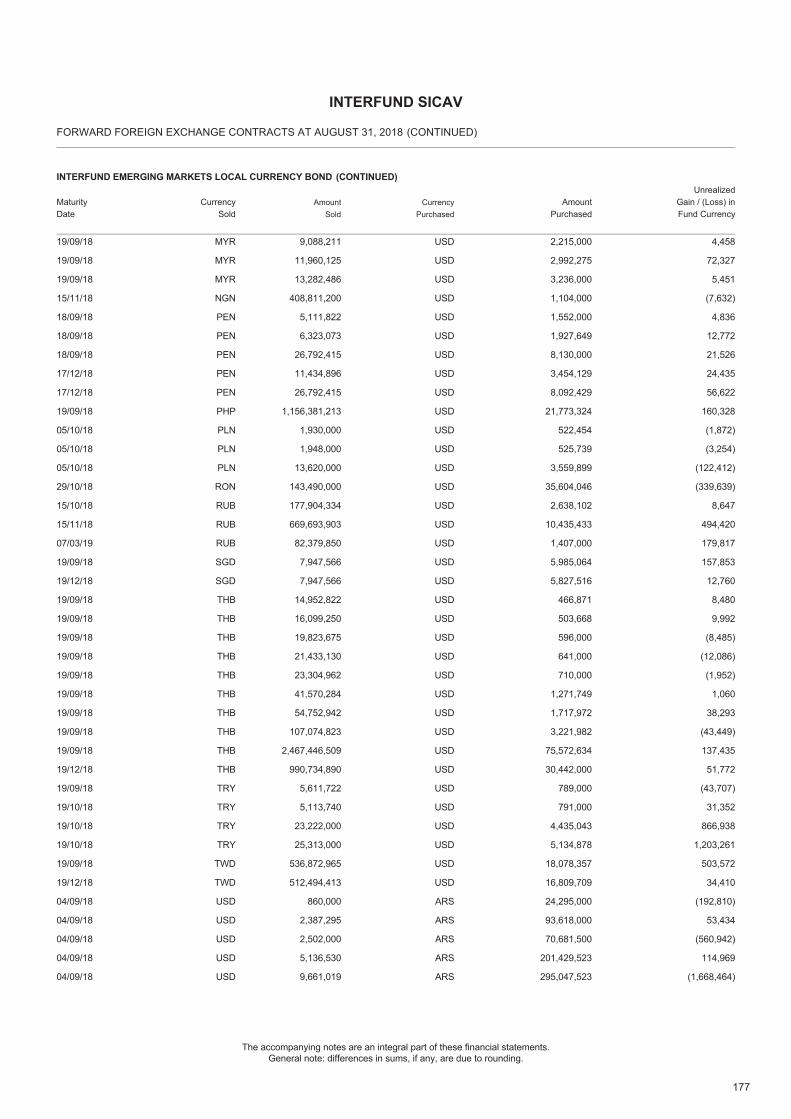
177
The accompanying notes are an integral part of these financial statements.General note: differences in sums, if any, are due to rounding.
FORWARD FOREIGN EXCHANGE CONTRACTS AT AUGUST 31, 2018
INTERFUND SICAV
19/09/18 MYR 9,088,211 USD 2,215,000 4,458
INTERFUND EMERGING MARKETS LOCAL CURRENCY BOND
MaturityDate
CurrencySold
AmountSold
CurrencyPurchased
AmountPurchased
UnrealizedGain / (Loss) inFund Currency
(CONTINUED)
19/09/18 MYR 11,960,125 USD 2,992,275 72,327
19/09/18 MYR 13,282,486 USD 3,236,000 5,451
15/11/18 NGN 408,811,200 USD 1,104,000 (7,632)
18/09/18 PEN 5,111,822 USD 1,552,000 4,836
18/09/18 PEN 6,323,073 USD 1,927,649 12,772
18/09/18 PEN 26,792,415 USD 8,130,000 21,526
17/12/18 PEN 11,434,896 USD 3,454,129 24,435
17/12/18 PEN 26,792,415 USD 8,092,429 56,622
19/09/18 PHP 1,156,381,213 USD 21,773,324 160,328
05/10/18 PLN 1,930,000 USD 522,454 (1,872)
05/10/18 PLN 1,948,000 USD 525,739 (3,254)
05/10/18 PLN 13,620,000 USD 3,559,899 (122,412)
29/10/18 RON 143,490,000 USD 35,604,046 (339,639)
15/10/18 RUB 177,904,334 USD 2,638,102 8,647
15/11/18 RUB 669,693,903 USD 10,435,433 494,420
07/03/19 RUB 82,379,850 USD 1,407,000 179,817
19/09/18 SGD 7,947,566 USD 5,985,064 157,853
19/12/18 SGD 7,947,566 USD 5,827,516 12,760
19/09/18 THB 14,952,822 USD 466,871 8,480
19/09/18 THB 16,099,250 USD 503,668 9,992
19/09/18 THB 19,823,675 USD 596,000 (8,485)
19/09/18 THB 21,433,130 USD 641,000 (12,086)
19/09/18 THB 23,304,962 USD 710,000 (1,952)
19/09/18 THB 41,570,284 USD 1,271,749 1,060
19/09/18 THB 54,752,942 USD 1,717,972 38,293
19/09/18 THB 107,074,823 USD 3,221,982 (43,449)
19/09/18 THB 2,467,446,509 USD 75,572,634 137,435
19/12/18 THB 990,734,890 USD 30,442,000 51,772
19/09/18 TRY 5,611,722 USD 789,000 (43,707)
19/10/18 TRY 5,113,740 USD 791,000 31,352
19/10/18 TRY 23,222,000 USD 4,435,043 866,938
19/10/18 TRY 25,313,000 USD 5,134,878 1,203,261
19/09/18 TWD 536,872,965 USD 18,078,357 503,572
19/12/18 TWD 512,494,413 USD 16,809,709 34,410
04/09/18 USD 860,000 ARS 24,295,000 (192,810)
04/09/18 USD 2,387,295 ARS 93,618,000 53,434
04/09/18 USD 2,502,000 ARS 70,681,500 (560,942)
04/09/18 USD 5,136,530 ARS 201,429,523 114,969
04/09/18 USD 9,661,019 ARS 295,047,523 (1,668,464)
(CONTINUED)
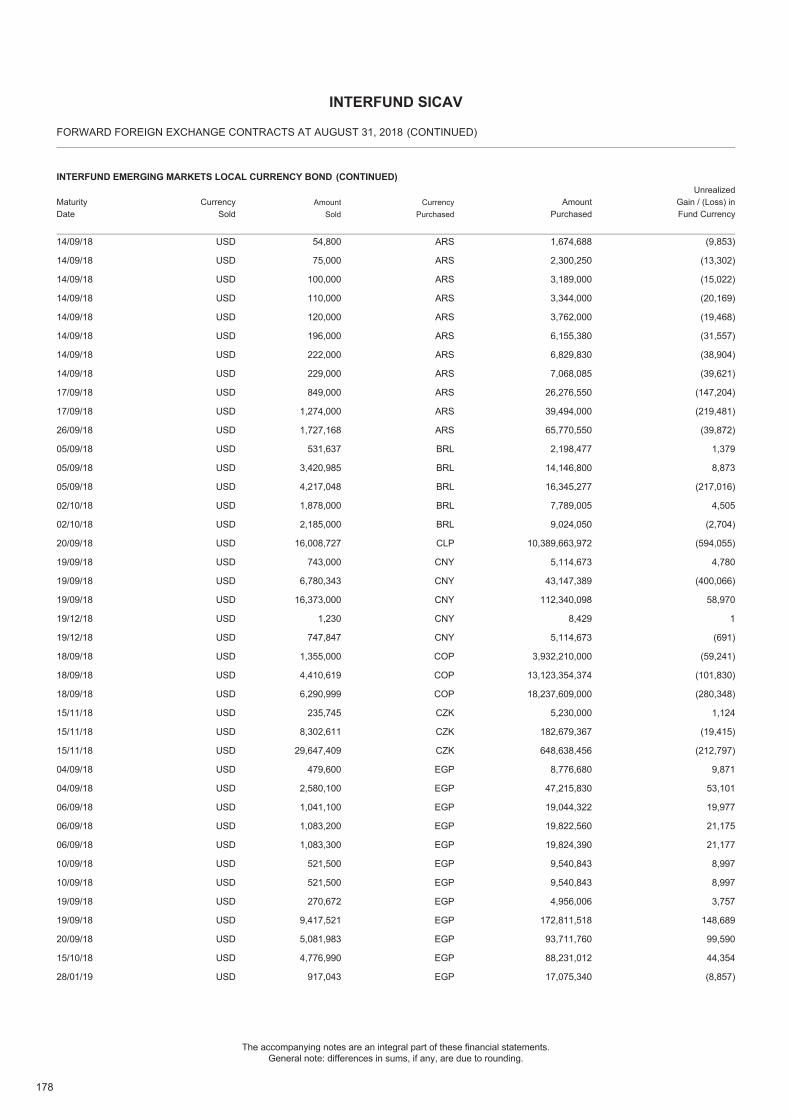
178
The accompanying notes are an integral part of these financial statements.General note: differences in sums, if any, are due to rounding.
FORWARD FOREIGN EXCHANGE CONTRACTS AT AUGUST 31, 2018
INTERFUND SICAV
14/09/18 USD 54,800 ARS 1,674,688 (9,853)
INTERFUND EMERGING MARKETS LOCAL CURRENCY BOND
MaturityDate
CurrencySold
AmountSold
CurrencyPurchased
AmountPurchased
UnrealizedGain / (Loss) inFund Currency
(CONTINUED)
14/09/18 USD 75,000 ARS 2,300,250 (13,302)
14/09/18 USD 100,000 ARS 3,189,000 (15,022)
14/09/18 USD 110,000 ARS 3,344,000 (20,169)
14/09/18 USD 120,000 ARS 3,762,000 (19,468)
14/09/18 USD 196,000 ARS 6,155,380 (31,557)
14/09/18 USD 222,000 ARS 6,829,830 (38,904)
14/09/18 USD 229,000 ARS 7,068,085 (39,621)
17/09/18 USD 849,000 ARS 26,276,550 (147,204)
17/09/18 USD 1,274,000 ARS 39,494,000 (219,481)
26/09/18 USD 1,727,168 ARS 65,770,550 (39,872)
05/09/18 USD 531,637 BRL 2,198,477 1,379
05/09/18 USD 3,420,985 BRL 14,146,800 8,873
05/09/18 USD 4,217,048 BRL 16,345,277 (217,016)
02/10/18 USD 1,878,000 BRL 7,789,005 4,505
02/10/18 USD 2,185,000 BRL 9,024,050 (2,704)
20/09/18 USD 16,008,727 CLP 10,389,663,972 (594,055)
19/09/18 USD 743,000 CNY 5,114,673 4,780
19/09/18 USD 6,780,343 CNY 43,147,389 (400,066)
19/09/18 USD 16,373,000 CNY 112,340,098 58,970
19/12/18 USD 1,230 CNY 8,429 1
19/12/18 USD 747,847 CNY 5,114,673 (691)
18/09/18 USD 1,355,000 COP 3,932,210,000 (59,241)
18/09/18 USD 4,410,619 COP 13,123,354,374 (101,830)
18/09/18 USD 6,290,999 COP 18,237,609,000 (280,348)
15/11/18 USD 235,745 CZK 5,230,000 1,124
15/11/18 USD 8,302,611 CZK 182,679,367 (19,415)
15/11/18 USD 29,647,409 CZK 648,638,456 (212,797)
04/09/18 USD 479,600 EGP 8,776,680 9,871
04/09/18 USD 2,580,100 EGP 47,215,830 53,101
06/09/18 USD 1,041,100 EGP 19,044,322 19,977
06/09/18 USD 1,083,200 EGP 19,822,560 21,175
06/09/18 USD 1,083,300 EGP 19,824,390 21,177
10/09/18 USD 521,500 EGP 9,540,843 8,997
10/09/18 USD 521,500 EGP 9,540,843 8,997
19/09/18 USD 270,672 EGP 4,956,006 3,757
19/09/18 USD 9,417,521 EGP 172,811,518 148,689
20/09/18 USD 5,081,983 EGP 93,711,760 99,590
15/10/18 USD 4,776,990 EGP 88,231,012 44,354
28/01/19 USD 917,043 EGP 17,075,340 (8,857)
(CONTINUED)
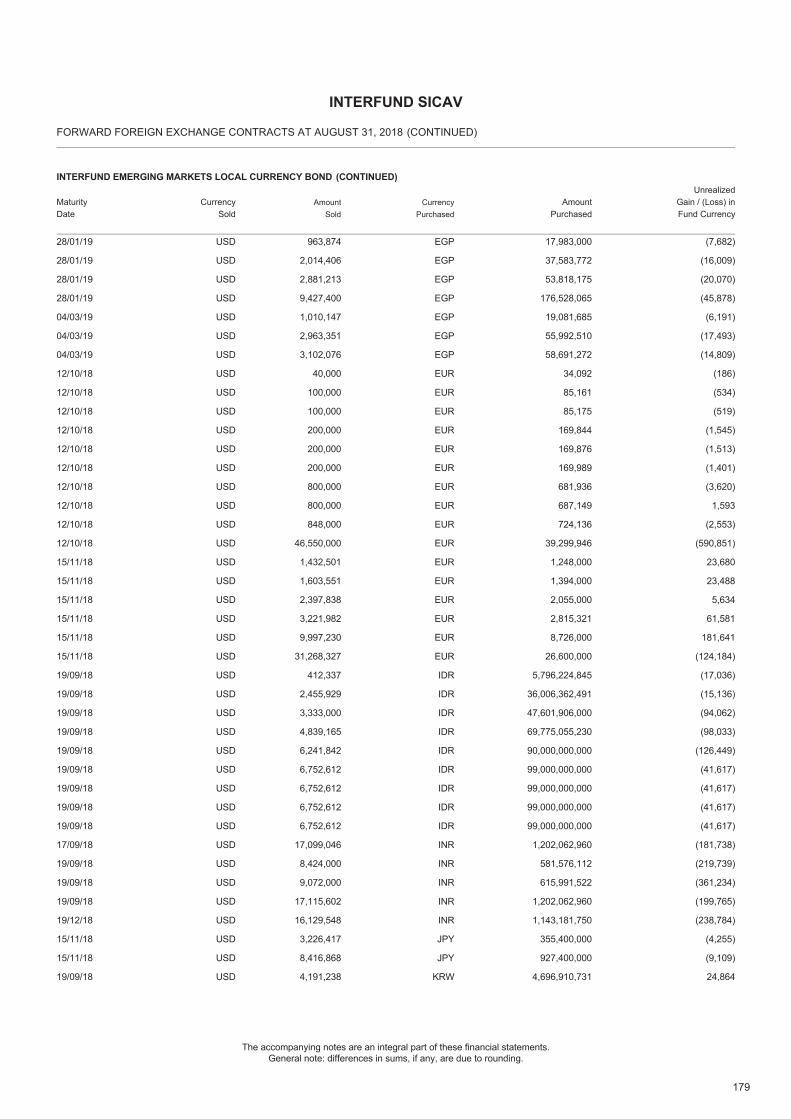
179
The accompanying notes are an integral part of these financial statements.General note: differences in sums, if any, are due to rounding.
FORWARD FOREIGN EXCHANGE CONTRACTS AT AUGUST 31, 2018
INTERFUND SICAV
28/01/19 USD 963,874 EGP 17,983,000 (7,682)
INTERFUND EMERGING MARKETS LOCAL CURRENCY BOND
MaturityDate
CurrencySold
AmountSold
CurrencyPurchased
AmountPurchased
UnrealizedGain / (Loss) inFund Currency
(CONTINUED)
28/01/19 USD 2,014,406 EGP 37,583,772 (16,009)
28/01/19 USD 2,881,213 EGP 53,818,175 (20,070)
28/01/19 USD 9,427,400 EGP 176,528,065 (45,878)
04/03/19 USD 1,010,147 EGP 19,081,685 (6,191)
04/03/19 USD 2,963,351 EGP 55,992,510 (17,493)
04/03/19 USD 3,102,076 EGP 58,691,272 (14,809)
12/10/18 USD 40,000 EUR 34,092 (186)
12/10/18 USD 100,000 EUR 85,161 (534)
12/10/18 USD 100,000 EUR 85,175 (519)
12/10/18 USD 200,000 EUR 169,844 (1,545)
12/10/18 USD 200,000 EUR 169,876 (1,513)
12/10/18 USD 200,000 EUR 169,989 (1,401)
12/10/18 USD 800,000 EUR 681,936 (3,620)
12/10/18 USD 800,000 EUR 687,149 1,593
12/10/18 USD 848,000 EUR 724,136 (2,553)
12/10/18 USD 46,550,000 EUR 39,299,946 (590,851)
15/11/18 USD 1,432,501 EUR 1,248,000 23,680
15/11/18 USD 1,603,551 EUR 1,394,000 23,488
15/11/18 USD 2,397,838 EUR 2,055,000 5,634
15/11/18 USD 3,221,982 EUR 2,815,321 61,581
15/11/18 USD 9,997,230 EUR 8,726,000 181,641
15/11/18 USD 31,268,327 EUR 26,600,000 (124,184)
19/09/18 USD 412,337 IDR 5,796,224,845 (17,036)
19/09/18 USD 2,455,929 IDR 36,006,362,491 (15,136)
19/09/18 USD 3,333,000 IDR 47,601,906,000 (94,062)
19/09/18 USD 4,839,165 IDR 69,775,055,230 (98,033)
19/09/18 USD 6,241,842 IDR 90,000,000,000 (126,449)
19/09/18 USD 6,752,612 IDR 99,000,000,000 (41,617)
19/09/18 USD 6,752,612 IDR 99,000,000,000 (41,617)
19/09/18 USD 6,752,612 IDR 99,000,000,000 (41,617)
19/09/18 USD 6,752,612 IDR 99,000,000,000 (41,617)
17/09/18 USD 17,099,046 INR 1,202,062,960 (181,738)
19/09/18 USD 8,424,000 INR 581,576,112 (219,739)
19/09/18 USD 9,072,000 INR 615,991,522 (361,234)
19/09/18 USD 17,115,602 INR 1,202,062,960 (199,765)
19/12/18 USD 16,129,548 INR 1,143,181,750 (238,784)
15/11/18 USD 3,226,417 JPY 355,400,000 (4,255)
15/11/18 USD 8,416,868 JPY 927,400,000 (9,109)
19/09/18 USD 4,191,238 KRW 4,696,910,731 24,864
(CONTINUED)
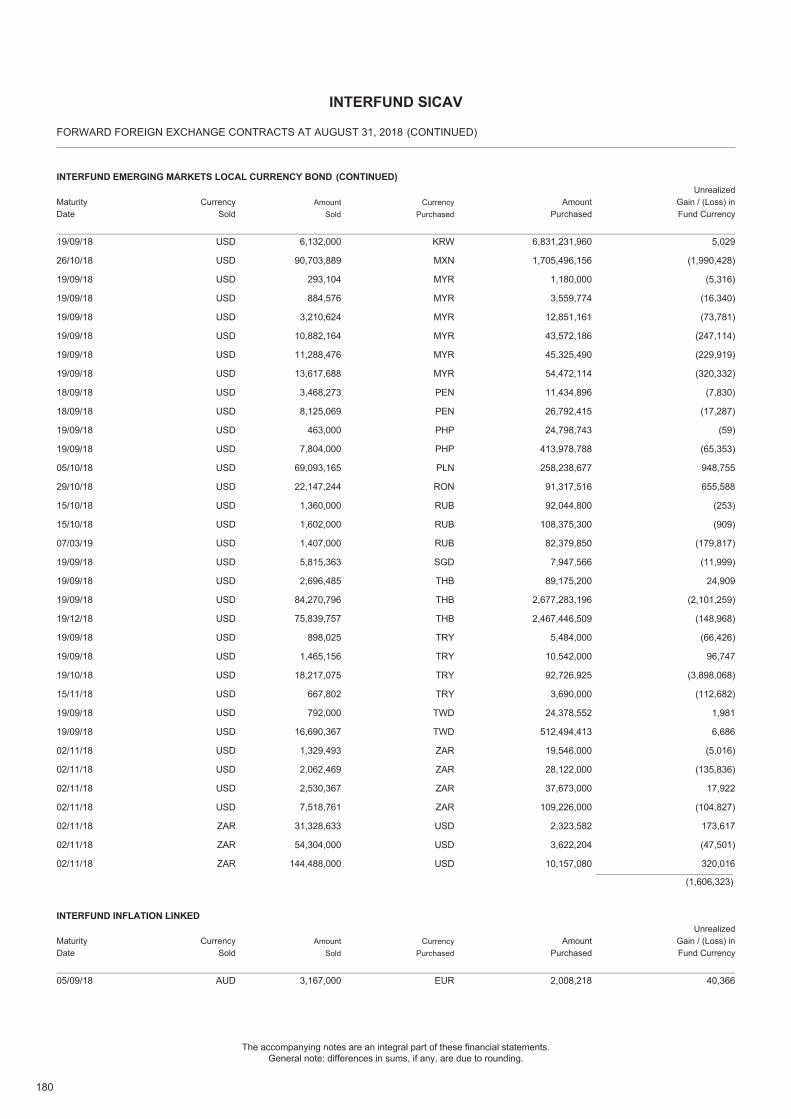
180
The accompanying notes are an integral part of these financial statements.General note: differences in sums, if any, are due to rounding.
FORWARD FOREIGN EXCHANGE CONTRACTS AT AUGUST 31, 2018
INTERFUND SICAV
19/09/18 USD 6,132,000 KRW 6,831,231,960 5,029
INTERFUND EMERGING MARKETS LOCAL CURRENCY BOND
MaturityDate
CurrencySold
AmountSold
CurrencyPurchased
AmountPurchased
UnrealizedGain / (Loss) inFund Currency
(CONTINUED)
26/10/18 USD 90,703,889 MXN 1,705,496,156 (1,990,428)
19/09/18 USD 293,104 MYR 1,180,000 (5,316)
19/09/18 USD 884,576 MYR 3,559,774 (16,340)
19/09/18 USD 3,210,624 MYR 12,851,161 (73,781)
19/09/18 USD 10,882,164 MYR 43,572,186 (247,114)
19/09/18 USD 11,288,476 MYR 45,325,490 (229,919)
19/09/18 USD 13,617,688 MYR 54,472,114 (320,332)
18/09/18 USD 3,468,273 PEN 11,434,896 (7,830)
18/09/18 USD 8,125,069 PEN 26,792,415 (17,287)
19/09/18 USD 463,000 PHP 24,798,743 (59)
19/09/18 USD 7,804,000 PHP 413,978,788 (65,353)
05/10/18 USD 69,093,165 PLN 258,238,677 948,755
29/10/18 USD 22,147,244 RON 91,317,516 655,588
15/10/18 USD 1,360,000 RUB 92,044,800 (253)
15/10/18 USD 1,602,000 RUB 108,375,300 (909)
07/03/19 USD 1,407,000 RUB 82,379,850 (179,817)
19/09/18 USD 5,815,363 SGD 7,947,566 (11,999)
19/09/18 USD 2,696,485 THB 89,175,200 24,909
19/09/18 USD 84,270,796 THB 2,677,283,196 (2,101,259)
19/12/18 USD 75,839,757 THB 2,467,446,509 (148,968)
19/09/18 USD 898,025 TRY 5,484,000 (66,426)
19/09/18 USD 1,465,156 TRY 10,542,000 96,747
19/10/18 USD 18,217,075 TRY 92,726,925 (3,898,068)
15/11/18 USD 667,802 TRY 3,690,000 (112,682)
19/09/18 USD 792,000 TWD 24,378,552 1,981
19/09/18 USD 16,690,367 TWD 512,494,413 6,686
02/11/18 USD 1,329,493 ZAR 19,546,000 (5,016)
02/11/18 USD 2,062,469 ZAR 28,122,000 (135,836)
02/11/18 USD 2,530,367 ZAR 37,673,000 17,922
02/11/18 USD 7,518,761 ZAR 109,226,000 (104,827)
02/11/18 ZAR 31,328,633 USD 2,323,582 173,617
02/11/18 ZAR 54,304,000 USD 3,622,204 (47,501)
02/11/18 ZAR 144,488,000 USD 10,157,080 320,016
(1,606,323)
05/09/18 AUD 3,167,000 EUR 2,008,218 40,366
INTERFUND INFLATION LINKED
MaturityDate
CurrencySold
AmountSold
CurrencyPurchased
AmountPurchased
UnrealizedGain / (Loss) inFund Currency
(CONTINUED)
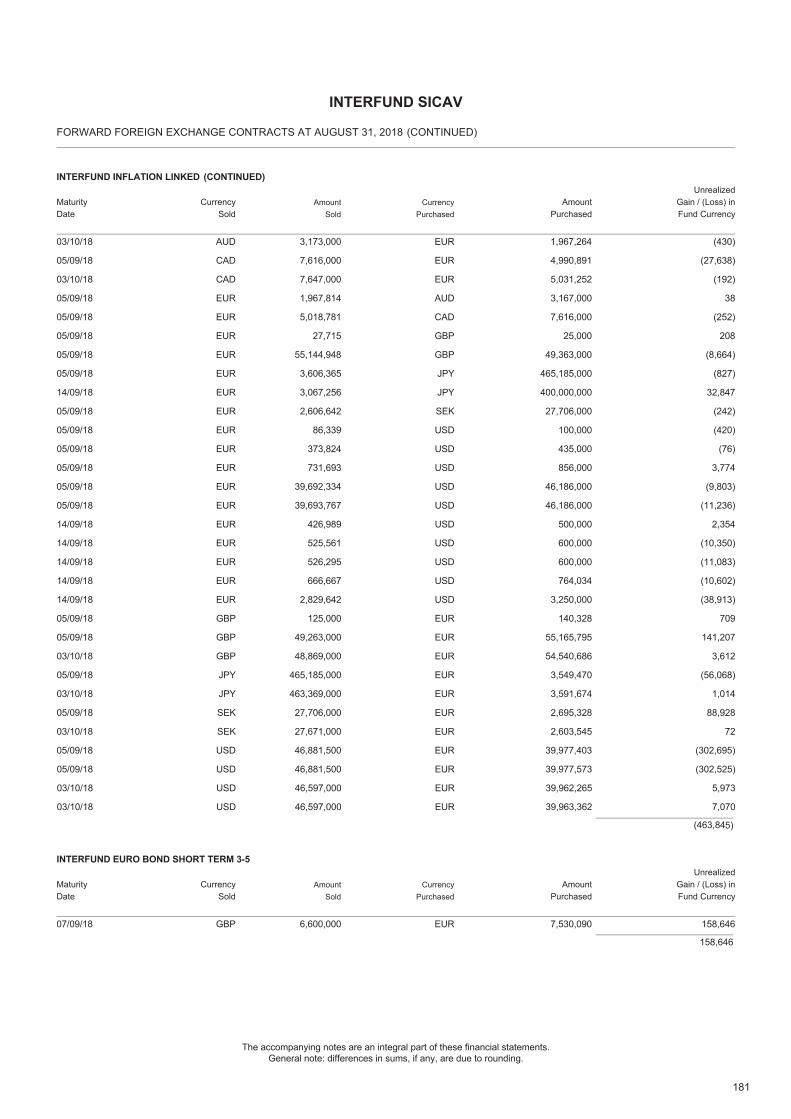
181
The accompanying notes are an integral part of these financial statements.General note: differences in sums, if any, are due to rounding.
FORWARD FOREIGN EXCHANGE CONTRACTS AT AUGUST 31, 2018
INTERFUND SICAV
03/10/18 AUD 3,173,000 EUR 1,967,264 (430)
INTERFUND INFLATION LINKED
MaturityDate
CurrencySold
AmountSold
CurrencyPurchased
AmountPurchased
UnrealizedGain / (Loss) inFund Currency
(CONTINUED)
05/09/18 CAD 7,616,000 EUR 4,990,891 (27,638)
03/10/18 CAD 7,647,000 EUR 5,031,252 (192)
05/09/18 EUR 1,967,814 AUD 3,167,000 38
05/09/18 EUR 5,018,781 CAD 7,616,000 (252)
05/09/18 EUR 27,715 GBP 25,000 208
05/09/18 EUR 55,144,948 GBP 49,363,000 (8,664)
05/09/18 EUR 3,606,365 JPY 465,185,000 (827)
14/09/18 EUR 3,067,256 JPY 400,000,000 32,847
05/09/18 EUR 2,606,642 SEK 27,706,000 (242)
05/09/18 EUR 86,339 USD 100,000 (420)
05/09/18 EUR 373,824 USD 435,000 (76)
05/09/18 EUR 731,693 USD 856,000 3,774
05/09/18 EUR 39,692,334 USD 46,186,000 (9,803)
05/09/18 EUR 39,693,767 USD 46,186,000 (11,236)
14/09/18 EUR 426,989 USD 500,000 2,354
14/09/18 EUR 525,561 USD 600,000 (10,350)
14/09/18 EUR 526,295 USD 600,000 (11,083)
14/09/18 EUR 666,667 USD 764,034 (10,602)
14/09/18 EUR 2,829,642 USD 3,250,000 (38,913)
05/09/18 GBP 125,000 EUR 140,328 709
05/09/18 GBP 49,263,000 EUR 55,165,795 141,207
03/10/18 GBP 48,869,000 EUR 54,540,686 3,612
05/09/18 JPY 465,185,000 EUR 3,549,470 (56,068)
03/10/18 JPY 463,369,000 EUR 3,591,674 1,014
05/09/18 SEK 27,706,000 EUR 2,695,328 88,928
03/10/18 SEK 27,671,000 EUR 2,603,545 72
05/09/18 USD 46,881,500 EUR 39,977,403 (302,695)
05/09/18 USD 46,881,500 EUR 39,977,573 (302,525)
03/10/18 USD 46,597,000 EUR 39,962,265 5,973
03/10/18 USD 46,597,000 EUR 39,963,362 7,070
(463,845)
07/09/18 GBP 6,600,000 EUR 7,530,090 158,646
INTERFUND EURO BOND SHORT TERM 3-5
MaturityDate
CurrencySold
AmountSold
CurrencyPurchased
AmountPurchased
UnrealizedGain / (Loss) inFund Currency
158,646
(CONTINUED)
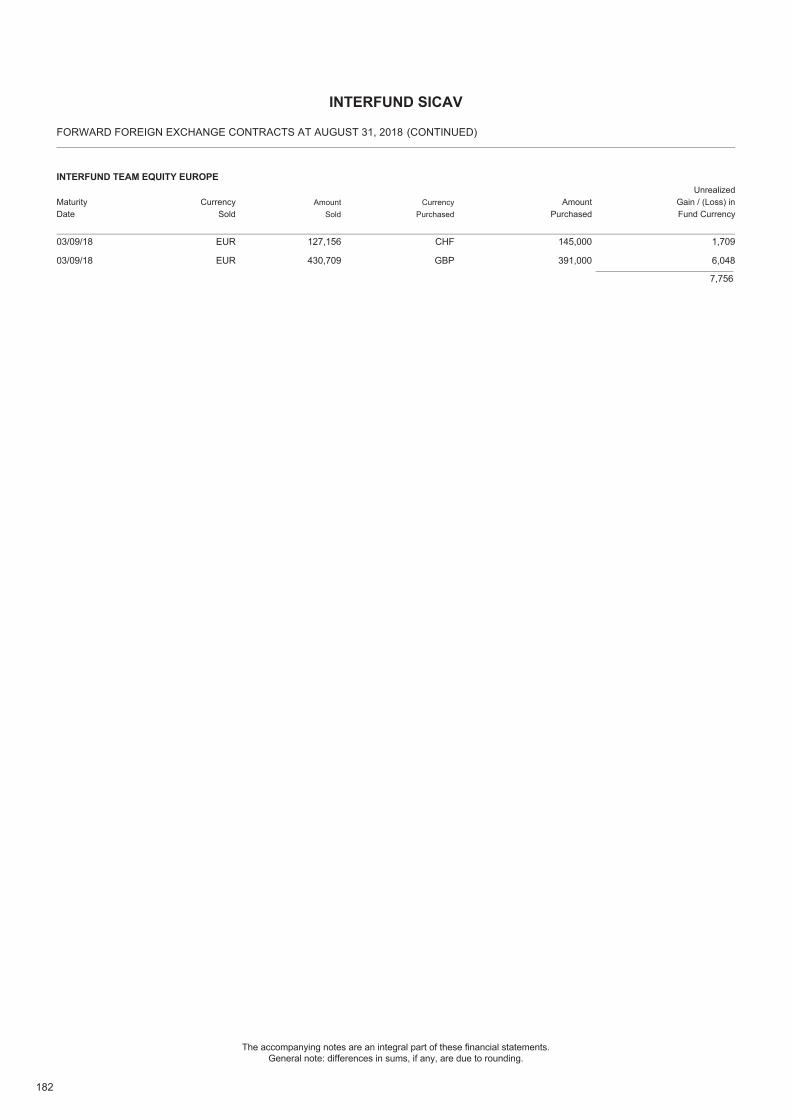
182
The accompanying notes are an integral part of these financial statements.General note: differences in sums, if any, are due to rounding.
FORWARD FOREIGN EXCHANGE CONTRACTS AT AUGUST 31, 2018
INTERFUND SICAV
03/09/18 EUR 127,156 CHF 145,000 1,709
INTERFUND TEAM EQUITY EUROPE
MaturityDate
CurrencySold
AmountSold
CurrencyPurchased
AmountPurchased
UnrealizedGain / (Loss) inFund Currency
03/09/18 EUR 430,709 GBP 391,000 6,048
7,756
(CONTINUED)
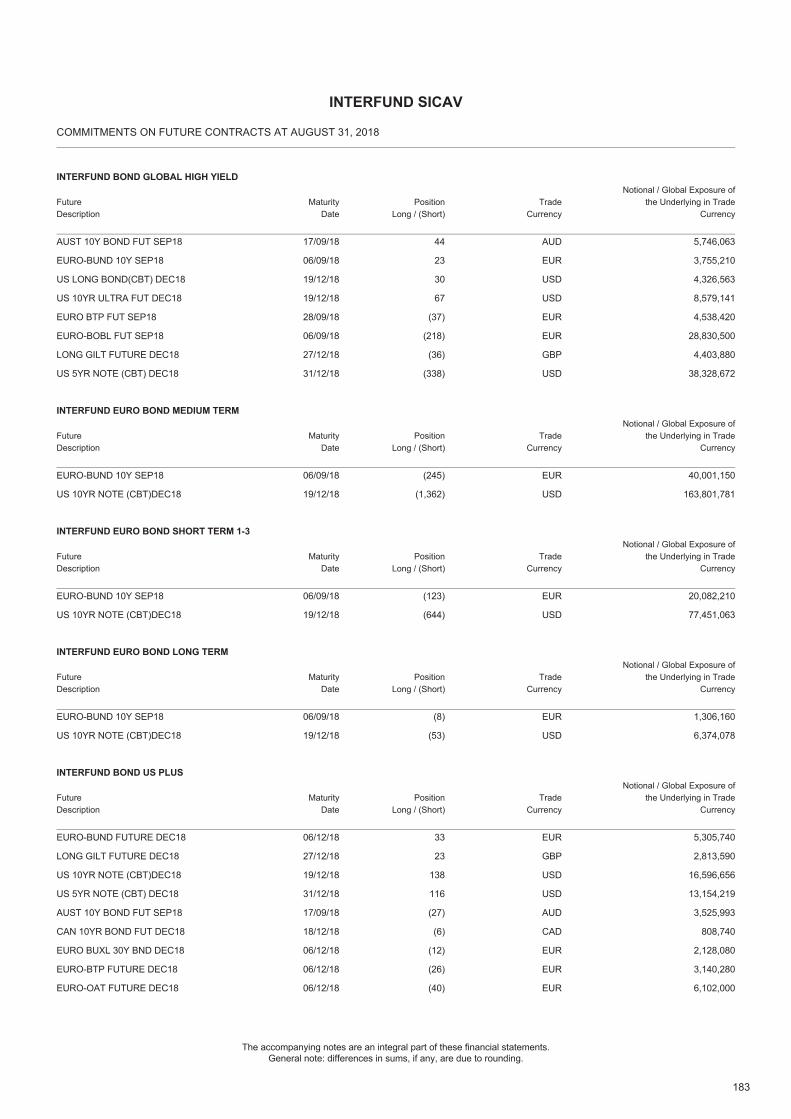
183
The accompanying notes are an integral part of these financial statements.General note: differences in sums, if any, are due to rounding.
COMMITMENTS ON FUTURE CONTRACTS AT AUGUST 31, 2018
INTERFUND SICAV
INTERFUND BOND GLOBAL HIGH YIELD
FutureDescription
MaturityDate
TradeCurrency
PositionLong / (Short)
Notional / Global Exposure ofthe Underlying in Trade
Currency
AUST 10Y BOND FUT SEP18 17/09/18 AUD 5,746,06344
EURO-BUND 10Y SEP18 06/09/18 EUR 3,755,21023
US LONG BOND(CBT) DEC18 19/12/18 USD 4,326,56330
US 10YR ULTRA FUT DEC18 19/12/18 USD 8,579,14167
EURO BTP FUT SEP18 28/09/18 EUR 4,538,420(37)
EURO-BOBL FUT SEP18 06/09/18 EUR 28,830,500(218)
LONG GILT FUTURE DEC18 27/12/18 GBP 4,403,880(36)
US 5YR NOTE (CBT) DEC18 31/12/18 USD 38,328,672(338)
INTERFUND EURO BOND MEDIUM TERM
FutureDescription
MaturityDate
TradeCurrency
PositionLong / (Short)
Notional / Global Exposure ofthe Underlying in Trade
Currency
EURO-BUND 10Y SEP18 06/09/18 EUR 40,001,150(245)
US 10YR NOTE (CBT)DEC18 19/12/18 USD 163,801,781(1,362)
INTERFUND EURO BOND SHORT TERM 1-3
FutureDescription
MaturityDate
TradeCurrency
PositionLong / (Short)
Notional / Global Exposure ofthe Underlying in Trade
Currency
EURO-BUND 10Y SEP18 06/09/18 EUR 20,082,210(123)
US 10YR NOTE (CBT)DEC18 19/12/18 USD 77,451,063(644)
INTERFUND EURO BOND LONG TERM
FutureDescription
MaturityDate
TradeCurrency
PositionLong / (Short)
Notional / Global Exposure ofthe Underlying in Trade
Currency
EURO-BUND 10Y SEP18 06/09/18 EUR 1,306,160(8)
US 10YR NOTE (CBT)DEC18 19/12/18 USD 6,374,078(53)
INTERFUND BOND US PLUS
FutureDescription
MaturityDate
TradeCurrency
PositionLong / (Short)
Notional / Global Exposure ofthe Underlying in Trade
Currency
EURO-BUND FUTURE DEC18 06/12/18 EUR 5,305,74033
LONG GILT FUTURE DEC18 27/12/18 GBP 2,813,59023
US 10YR NOTE (CBT)DEC18 19/12/18 USD 16,596,656138
US 5YR NOTE (CBT) DEC18 31/12/18 USD 13,154,219116
AUST 10Y BOND FUT SEP18 17/09/18 AUD 3,525,993(27)
CAN 10YR BOND FUT DEC18 18/12/18 CAD 808,740(6)
EURO BUXL 30Y BND DEC18 06/12/18 EUR 2,128,080(12)
EURO-BTP FUTURE DEC18 06/12/18 EUR 3,140,280(26)
EURO-OAT FUTURE DEC18 06/12/18 EUR 6,102,000(40)
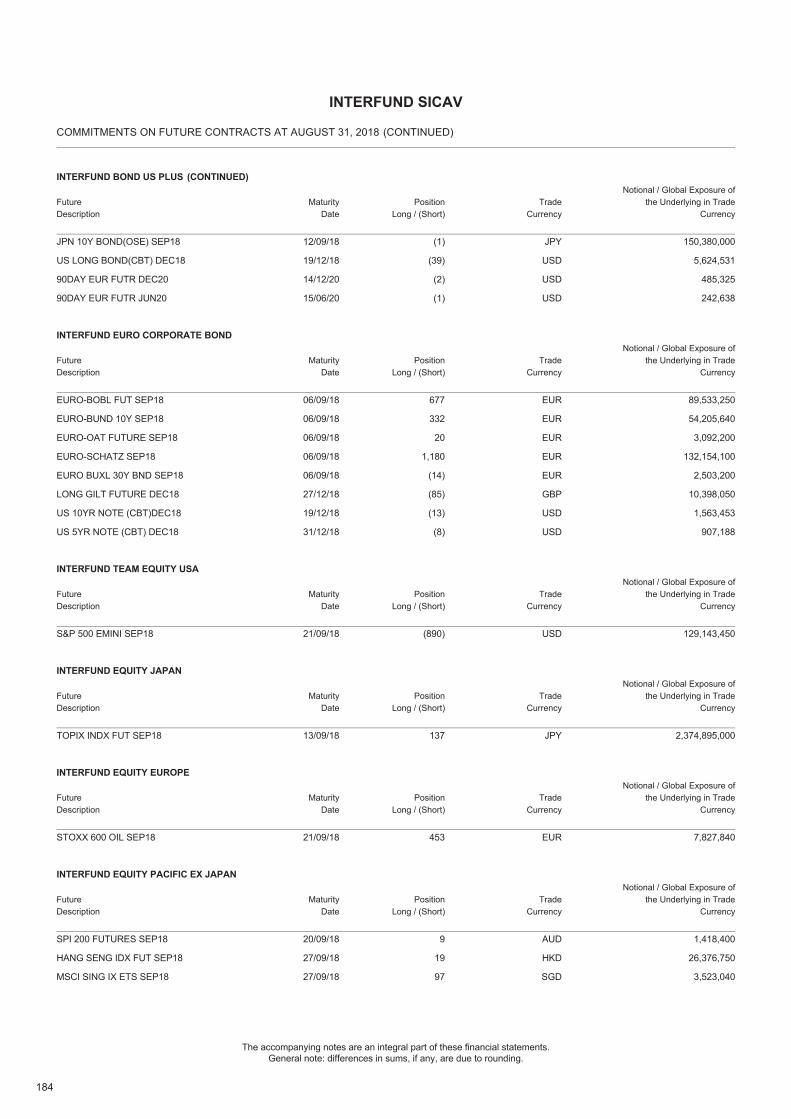
184
The accompanying notes are an integral part of these financial statements.General note: differences in sums, if any, are due to rounding.
COMMITMENTS ON FUTURE CONTRACTS AT AUGUST 31, 2018
INTERFUND SICAV
(CONTINUED)
INTERFUND BOND US PLUS
FutureDescription
MaturityDate
TradeCurrency
PositionLong / (Short)
Notional / Global Exposure ofthe Underlying in Trade
Currency
(CONTINUED)
JPN 10Y BOND(OSE) SEP18 12/09/18 JPY 150,380,000(1)
US LONG BOND(CBT) DEC18 19/12/18 USD 5,624,531(39)
90DAY EUR FUTR DEC20 14/12/20 USD 485,325(2)
90DAY EUR FUTR JUN20 15/06/20 USD 242,638(1)
INTERFUND EURO CORPORATE BOND
FutureDescription
MaturityDate
TradeCurrency
PositionLong / (Short)
Notional / Global Exposure ofthe Underlying in Trade
Currency
EURO-BOBL FUT SEP18 06/09/18 EUR 89,533,250677
EURO-BUND 10Y SEP18 06/09/18 EUR 54,205,640332
EURO-OAT FUTURE SEP18 06/09/18 EUR 3,092,20020
EURO-SCHATZ SEP18 06/09/18 EUR 132,154,1001,180
EURO BUXL 30Y BND SEP18 06/09/18 EUR 2,503,200(14)
LONG GILT FUTURE DEC18 27/12/18 GBP 10,398,050(85)
US 10YR NOTE (CBT)DEC18 19/12/18 USD 1,563,453(13)
US 5YR NOTE (CBT) DEC18 31/12/18 USD 907,188(8)
INTERFUND TEAM EQUITY USA
FutureDescription
MaturityDate
TradeCurrency
PositionLong / (Short)
Notional / Global Exposure ofthe Underlying in Trade
Currency
S&P 500 EMINI SEP18 21/09/18 USD 129,143,450(890)
INTERFUND EQUITY JAPAN
FutureDescription
MaturityDate
TradeCurrency
PositionLong / (Short)
Notional / Global Exposure ofthe Underlying in Trade
Currency
TOPIX INDX FUT SEP18 13/09/18 JPY 2,374,895,000137
INTERFUND EQUITY EUROPE
FutureDescription
MaturityDate
TradeCurrency
PositionLong / (Short)
Notional / Global Exposure ofthe Underlying in Trade
Currency
STOXX 600 OIL SEP18 21/09/18 EUR 7,827,840453
INTERFUND EQUITY PACIFIC EX JAPAN
FutureDescription
MaturityDate
TradeCurrency
PositionLong / (Short)
Notional / Global Exposure ofthe Underlying in Trade
Currency
SPI 200 FUTURES SEP18 20/09/18 AUD 1,418,4009
HANG SENG IDX FUT SEP18 27/09/18 HKD 26,376,75019
MSCI SING IX ETS SEP18 27/09/18 SGD 3,523,04097
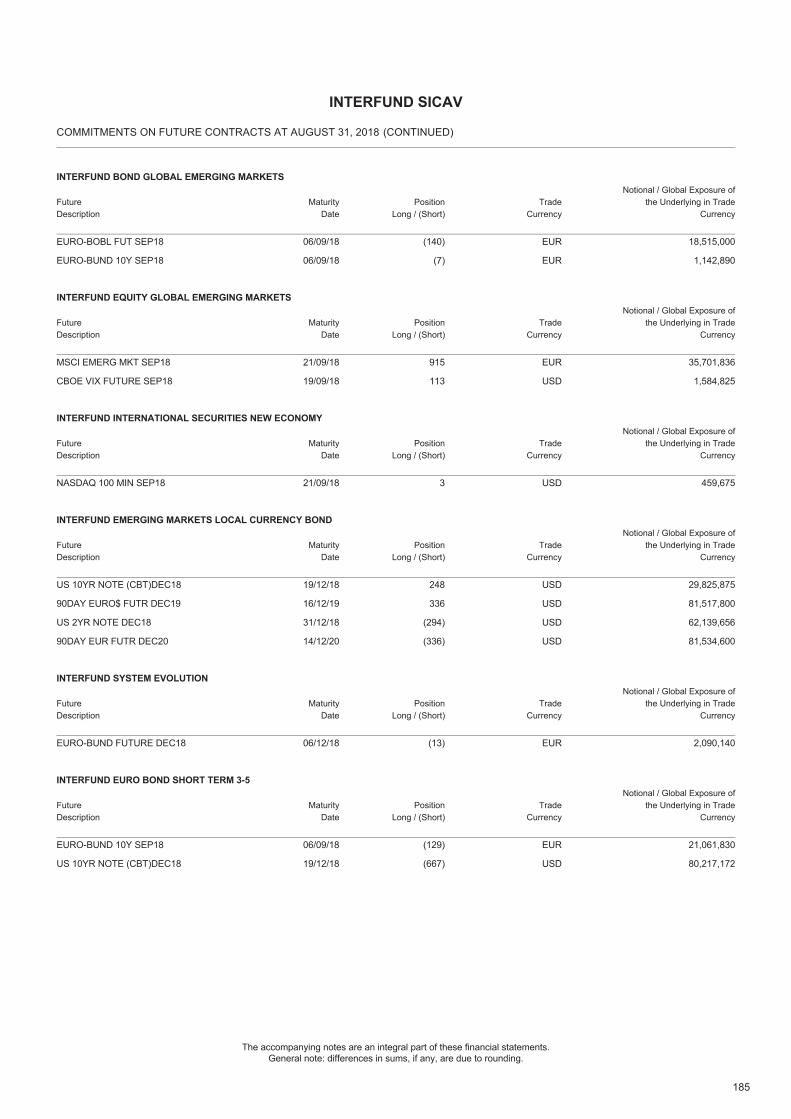
185
The accompanying notes are an integral part of these financial statements.General note: differences in sums, if any, are due to rounding.
COMMITMENTS ON FUTURE CONTRACTS AT AUGUST 31, 2018
INTERFUND SICAV
(CONTINUED)
INTERFUND BOND GLOBAL EMERGING MARKETS
FutureDescription
MaturityDate
TradeCurrency
PositionLong / (Short)
Notional / Global Exposure ofthe Underlying in Trade
Currency
EURO-BOBL FUT SEP18 06/09/18 EUR 18,515,000(140)
EURO-BUND 10Y SEP18 06/09/18 EUR 1,142,890(7)
INTERFUND EQUITY GLOBAL EMERGING MARKETS
FutureDescription
MaturityDate
TradeCurrency
PositionLong / (Short)
Notional / Global Exposure ofthe Underlying in Trade
Currency
MSCI EMERG MKT SEP18 21/09/18 EUR 35,701,836915
CBOE VIX FUTURE SEP18 19/09/18 USD 1,584,825113
INTERFUND INTERNATIONAL SECURITIES NEW ECONOMY
FutureDescription
MaturityDate
TradeCurrency
PositionLong / (Short)
Notional / Global Exposure ofthe Underlying in Trade
Currency
NASDAQ 100 MIN SEP18 21/09/18 USD 459,6753
INTERFUND EMERGING MARKETS LOCAL CURRENCY BOND
FutureDescription
MaturityDate
TradeCurrency
PositionLong / (Short)
Notional / Global Exposure ofthe Underlying in Trade
Currency
US 10YR NOTE (CBT)DEC18 19/12/18 USD 29,825,875248
90DAY EURO$ FUTR DEC19 16/12/19 USD 81,517,800336
US 2YR NOTE DEC18 31/12/18 USD 62,139,656(294)
90DAY EUR FUTR DEC20 14/12/20 USD 81,534,600(336)
INTERFUND SYSTEM EVOLUTION
FutureDescription
MaturityDate
TradeCurrency
PositionLong / (Short)
Notional / Global Exposure ofthe Underlying in Trade
Currency
EURO-BUND FUTURE DEC18 06/12/18 EUR 2,090,140(13)
INTERFUND EURO BOND SHORT TERM 3-5
FutureDescription
MaturityDate
TradeCurrency
PositionLong / (Short)
Notional / Global Exposure ofthe Underlying in Trade
Currency
EURO-BUND 10Y SEP18 06/09/18 EUR 21,061,830(129)
US 10YR NOTE (CBT)DEC18 19/12/18 USD 80,217,172(667)
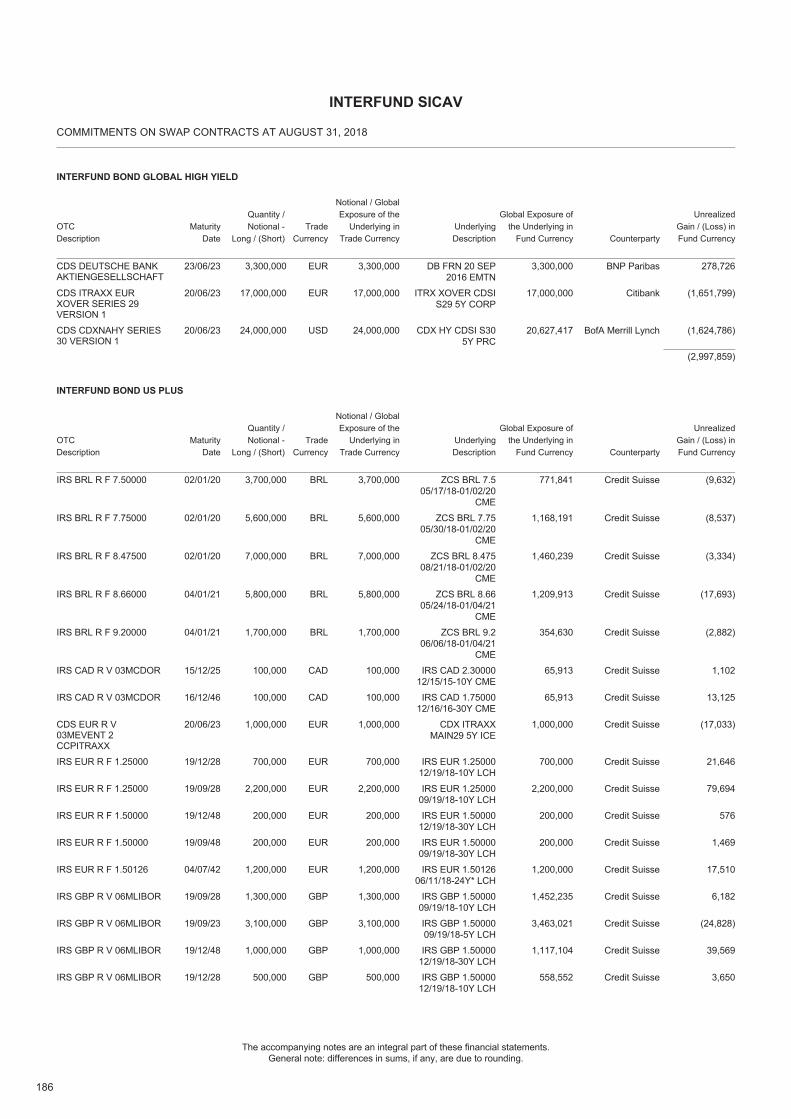
186
The accompanying notes are an integral part of these financial statements.General note: differences in sums, if any, are due to rounding.
COMMITMENTS ON SWAP CONTRACTS AT AUGUST 31, 2018
INTERFUND SICAV
INTERFUND BOND GLOBAL HIGH YIELD
OTCDescription
Quantity /Notional -
Long / (Short)Trade
Currency
Notional / GlobalExposure of the
Underlying inTrade Currency
Global Exposure ofthe Underlying in
Fund CurrencyMaturity
DateUnderlyingDescription Counterparty
UnrealizedGain / (Loss) inFund Currency
CDS DEUTSCHE BANKAKTIENGESELLSCHAFT
23/06/23 EUR3,300,000 3,300,000 DB FRN 20 SEP2016 EMTN
3,300,000 BNP Paribas 278,726
CDS ITRAXX EURXOVER SERIES 29VERSION 1
20/06/23 EUR17,000,000 17,000,000 ITRX XOVER CDSIS29 5Y CORP
17,000,000 Citibank (1,651,799)
CDS CDXNAHY SERIES30 VERSION 1
20/06/23 USD24,000,000 24,000,000 CDX HY CDSI S305Y PRC
20,627,417 BofA Merrill Lynch (1,624,786)
(2,997,859)
INTERFUND BOND US PLUS
OTCDescription
Quantity /Notional -
Long / (Short)Trade
Currency
Notional / GlobalExposure of the
Underlying inTrade Currency
Global Exposure ofthe Underlying in
Fund CurrencyMaturity
DateUnderlyingDescription Counterparty
UnrealizedGain / (Loss) inFund Currency
IRS BRL R F 7.50000 02/01/20 BRL3,700,000 3,700,000 ZCS BRL 7.505/17/18-01/02/20
CME
771,841 Credit Suisse (9,632)
IRS BRL R F 7.75000 02/01/20 BRL5,600,000 5,600,000 ZCS BRL 7.7505/30/18-01/02/20
CME
1,168,191 Credit Suisse (8,537)
IRS BRL R F 8.47500 02/01/20 BRL7,000,000 7,000,000 ZCS BRL 8.47508/21/18-01/02/20
CME
1,460,239 Credit Suisse (3,334)
IRS BRL R F 8.66000 04/01/21 BRL5,800,000 5,800,000 ZCS BRL 8.6605/24/18-01/04/21
CME
1,209,913 Credit Suisse (17,693)
IRS BRL R F 9.20000 04/01/21 BRL1,700,000 1,700,000 ZCS BRL 9.206/06/18-01/04/21
CME
354,630 Credit Suisse (2,882)
IRS CAD R V 03MCDOR 15/12/25 CAD100,000 100,000 IRS CAD 2.3000012/15/15-10Y CME
65,913 Credit Suisse 1,102
IRS CAD R V 03MCDOR 16/12/46 CAD100,000 100,000 IRS CAD 1.7500012/16/16-30Y CME
65,913 Credit Suisse 13,125
CDS EUR R V03MEVENT 2CCPITRAXX
20/06/23 EUR1,000,000 1,000,000 CDX ITRAXXMAIN29 5Y ICE
1,000,000 Credit Suisse (17,033)
IRS EUR R F 1.25000 19/12/28 EUR700,000 700,000 IRS EUR 1.2500012/19/18-10Y LCH
700,000 Credit Suisse 21,646
IRS EUR R F 1.25000 19/09/28 EUR2,200,000 2,200,000 IRS EUR 1.2500009/19/18-10Y LCH
2,200,000 Credit Suisse 79,694
IRS EUR R F 1.50000 19/12/48 EUR200,000 200,000 IRS EUR 1.5000012/19/18-30Y LCH
200,000 Credit Suisse 576
IRS EUR R F 1.50000 19/09/48 EUR200,000 200,000 IRS EUR 1.5000009/19/18-30Y LCH
200,000 Credit Suisse 1,469
IRS EUR R F 1.50126 04/07/42 EUR1,200,000 1,200,000 IRS EUR 1.5012606/11/18-24Y* LCH
1,200,000 Credit Suisse 17,510
IRS GBP R V 06MLIBOR 19/09/28 GBP1,300,000 1,300,000 IRS GBP 1.5000009/19/18-10Y LCH
1,452,235 Credit Suisse 6,182
IRS GBP R V 06MLIBOR 19/09/23 GBP3,100,000 3,100,000 IRS GBP 1.5000009/19/18-5Y LCH
3,463,021 Credit Suisse (24,828)
IRS GBP R V 06MLIBOR 19/12/48 GBP1,000,000 1,000,000 IRS GBP 1.5000012/19/18-30Y LCH
1,117,104 Credit Suisse 39,569
IRS GBP R V 06MLIBOR 19/12/28 GBP500,000 500,000 IRS GBP 1.5000012/19/18-10Y LCH
558,552 Credit Suisse 3,650
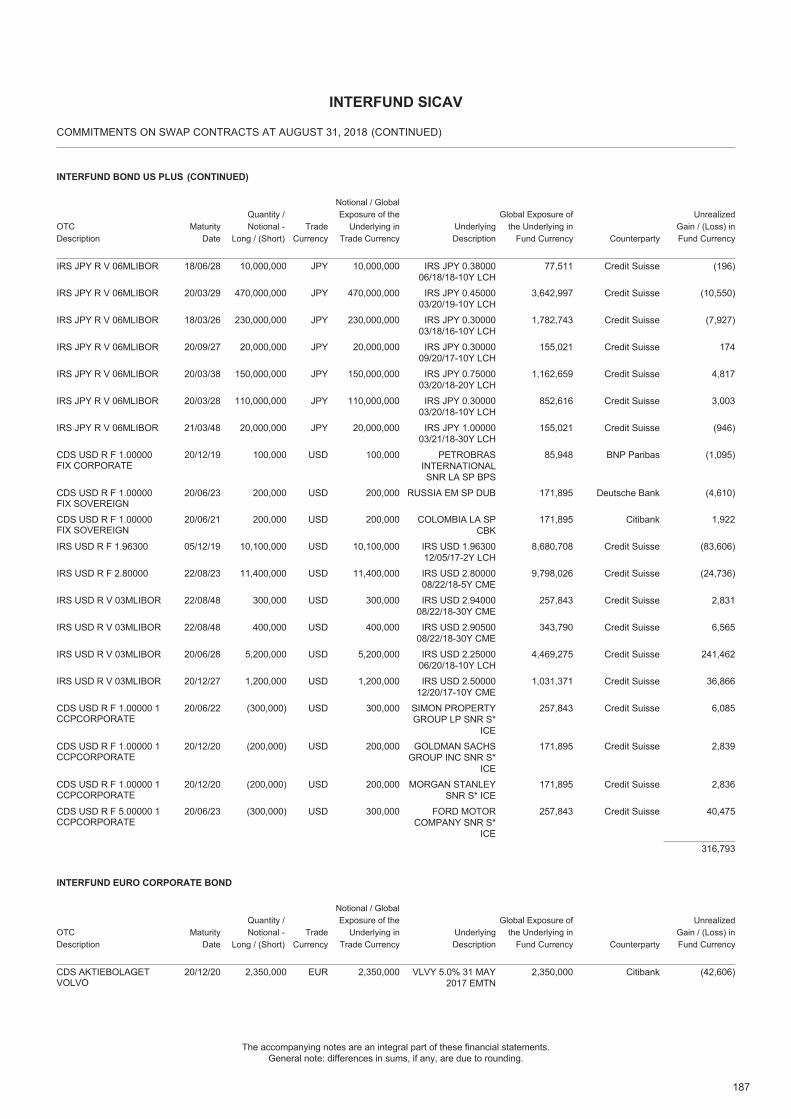
187
The accompanying notes are an integral part of these financial statements.General note: differences in sums, if any, are due to rounding.
COMMITMENTS ON SWAP CONTRACTS AT AUGUST 31, 2018
INTERFUND SICAV
(CONTINUED)
INTERFUND BOND US PLUS
OTCDescription
Quantity /Notional -
Long / (Short)Trade
Currency
Notional / GlobalExposure of the
Underlying inTrade Currency
Global Exposure ofthe Underlying in
Fund CurrencyMaturity
DateUnderlyingDescription Counterparty
UnrealizedGain / (Loss) inFund Currency
(CONTINUED)
IRS JPY R V 06MLIBOR 18/06/28 JPY10,000,000 10,000,000 IRS JPY 0.3800006/18/18-10Y LCH
77,511 Credit Suisse (196)
IRS JPY R V 06MLIBOR 20/03/29 JPY470,000,000 470,000,000 IRS JPY 0.4500003/20/19-10Y LCH
3,642,997 Credit Suisse (10,550)
IRS JPY R V 06MLIBOR 18/03/26 JPY230,000,000 230,000,000 IRS JPY 0.3000003/18/16-10Y LCH
1,782,743 Credit Suisse (7,927)
IRS JPY R V 06MLIBOR 20/09/27 JPY20,000,000 20,000,000 IRS JPY 0.3000009/20/17-10Y LCH
155,021 Credit Suisse 174
IRS JPY R V 06MLIBOR 20/03/38 JPY150,000,000 150,000,000 IRS JPY 0.7500003/20/18-20Y LCH
1,162,659 Credit Suisse 4,817
IRS JPY R V 06MLIBOR 20/03/28 JPY110,000,000 110,000,000 IRS JPY 0.3000003/20/18-10Y LCH
852,616 Credit Suisse 3,003
IRS JPY R V 06MLIBOR 21/03/48 JPY20,000,000 20,000,000 IRS JPY 1.0000003/21/18-30Y LCH
155,021 Credit Suisse (946)
CDS USD R F 1.00000FIX CORPORATE
20/12/19 USD100,000 100,000 PETROBRASINTERNATIONALSNR LA SP BPS
85,948 BNP Paribas (1,095)
CDS USD R F 1.00000FIX SOVEREIGN
20/06/23 USD200,000 200,000 RUSSIA EM SP DUB 171,895 Deutsche Bank (4,610)
CDS USD R F 1.00000FIX SOVEREIGN
20/06/21 USD200,000 200,000 COLOMBIA LA SPCBK
171,895 Citibank 1,922
IRS USD R F 1.96300 05/12/19 USD10,100,000 10,100,000 IRS USD 1.9630012/05/17-2Y LCH
8,680,708 Credit Suisse (83,606)
IRS USD R F 2.80000 22/08/23 USD11,400,000 11,400,000 IRS USD 2.8000008/22/18-5Y CME
9,798,026 Credit Suisse (24,736)
IRS USD R V 03MLIBOR 22/08/48 USD300,000 300,000 IRS USD 2.9400008/22/18-30Y CME
257,843 Credit Suisse 2,831
IRS USD R V 03MLIBOR 22/08/48 USD400,000 400,000 IRS USD 2.9050008/22/18-30Y CME
343,790 Credit Suisse 6,565
IRS USD R V 03MLIBOR 20/06/28 USD5,200,000 5,200,000 IRS USD 2.2500006/20/18-10Y LCH
4,469,275 Credit Suisse 241,462
IRS USD R V 03MLIBOR 20/12/27 USD1,200,000 1,200,000 IRS USD 2.5000012/20/17-10Y CME
1,031,371 Credit Suisse 36,866
CDS USD R F 1.00000 1CCPCORPORATE
20/06/22 USD(300,000) 300,000 SIMON PROPERTYGROUP LP SNR S*
ICE
257,843 Credit Suisse 6,085
CDS USD R F 1.00000 1CCPCORPORATE
20/12/20 USD(200,000) 200,000 GOLDMAN SACHSGROUP INC SNR S*
ICE
171,895 Credit Suisse 2,839
CDS USD R F 1.00000 1CCPCORPORATE
20/12/20 USD(200,000) 200,000 MORGAN STANLEYSNR S* ICE
171,895 Credit Suisse 2,836
CDS USD R F 5.00000 1CCPCORPORATE
20/06/23 USD(300,000) 300,000 FORD MOTORCOMPANY SNR S*
ICE
257,843 Credit Suisse 40,475
316,793
INTERFUND EURO CORPORATE BOND
OTCDescription
Quantity /Notional -
Long / (Short)Trade
Currency
Notional / GlobalExposure of the
Underlying inTrade Currency
Global Exposure ofthe Underlying in
Fund CurrencyMaturity
DateUnderlyingDescription Counterparty
UnrealizedGain / (Loss) inFund Currency
CDS AKTIEBOLAGETVOLVO
20/12/20 EUR2,350,000 2,350,000 VLVY 5.0% 31 MAY2017 EMTN
2,350,000 Citibank (42,606)
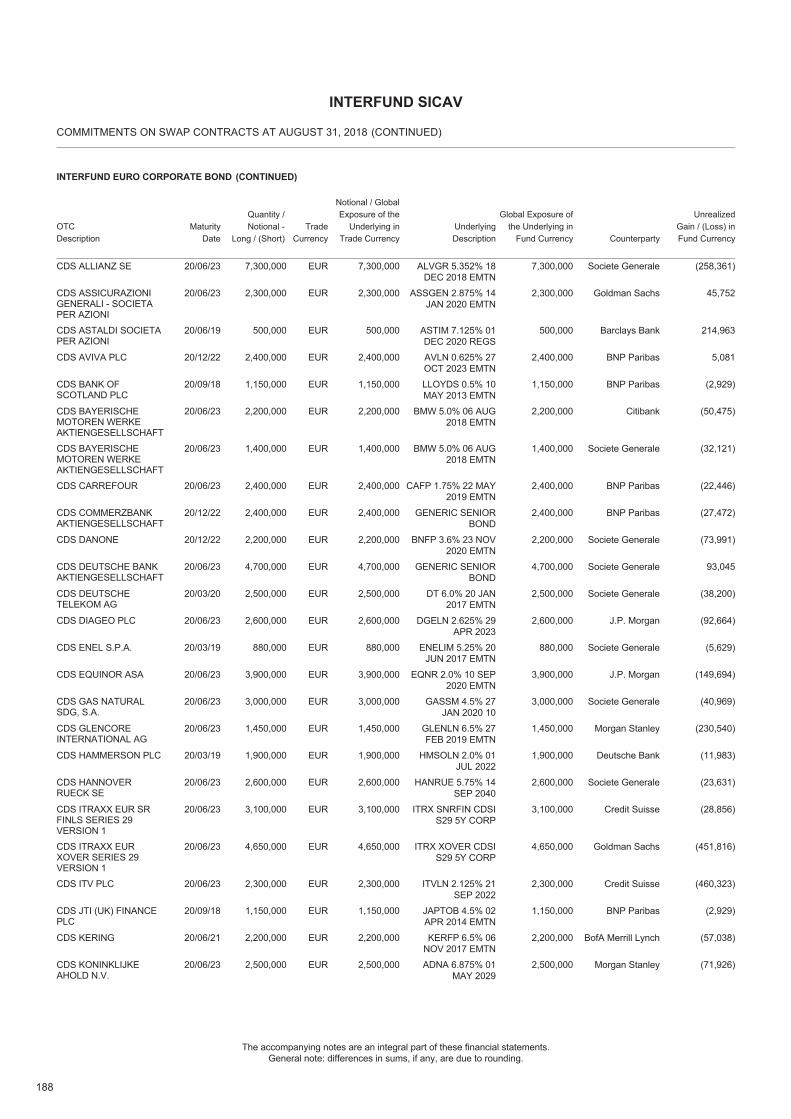
188
The accompanying notes are an integral part of these financial statements.General note: differences in sums, if any, are due to rounding.
COMMITMENTS ON SWAP CONTRACTS AT AUGUST 31, 2018
INTERFUND SICAV
(CONTINUED)
INTERFUND EURO CORPORATE BOND
OTCDescription
Quantity /Notional -
Long / (Short)Trade
Currency
Notional / GlobalExposure of the
Underlying inTrade Currency
Global Exposure ofthe Underlying in
Fund CurrencyMaturity
DateUnderlyingDescription Counterparty
UnrealizedGain / (Loss) inFund Currency
(CONTINUED)
CDS ALLIANZ SE 20/06/23 EUR7,300,000 7,300,000 ALVGR 5.352% 18DEC 2018 EMTN
7,300,000 Societe Generale (258,361)
CDS ASSICURAZIONIGENERALI - SOCIETAPER AZIONI
20/06/23 EUR2,300,000 2,300,000 ASSGEN 2.875% 14JAN 2020 EMTN
2,300,000 Goldman Sachs 45,752
CDS ASTALDI SOCIETAPER AZIONI
20/06/19 EUR500,000 500,000 ASTIM 7.125% 01DEC 2020 REGS
500,000 Barclays Bank 214,963
CDS AVIVA PLC 20/12/22 EUR2,400,000 2,400,000 AVLN 0.625% 27OCT 2023 EMTN
2,400,000 BNP Paribas 5,081
CDS BANK OFSCOTLAND PLC
20/09/18 EUR1,150,000 1,150,000 LLOYDS 0.5% 10MAY 2013 EMTN
1,150,000 BNP Paribas (2,929)
CDS BAYERISCHEMOTOREN WERKEAKTIENGESELLSCHAFT
20/06/23 EUR2,200,000 2,200,000 BMW 5.0% 06 AUG2018 EMTN
2,200,000 Citibank (50,475)
CDS BAYERISCHEMOTOREN WERKEAKTIENGESELLSCHAFT
20/06/23 EUR1,400,000 1,400,000 BMW 5.0% 06 AUG2018 EMTN
1,400,000 Societe Generale (32,121)
CDS CARREFOUR 20/06/23 EUR2,400,000 2,400,000 CAFP 1.75% 22 MAY2019 EMTN
2,400,000 BNP Paribas (22,446)
CDS COMMERZBANKAKTIENGESELLSCHAFT
20/12/22 EUR2,400,000 2,400,000 GENERIC SENIORBOND
2,400,000 BNP Paribas (27,472)
CDS DANONE 20/12/22 EUR2,200,000 2,200,000 BNFP 3.6% 23 NOV2020 EMTN
2,200,000 Societe Generale (73,991)
CDS DEUTSCHE BANKAKTIENGESELLSCHAFT
20/06/23 EUR4,700,000 4,700,000 GENERIC SENIORBOND
4,700,000 Societe Generale 93,045
CDS DEUTSCHETELEKOM AG
20/03/20 EUR2,500,000 2,500,000 DT 6.0% 20 JAN2017 EMTN
2,500,000 Societe Generale (38,200)
CDS DIAGEO PLC 20/06/23 EUR2,600,000 2,600,000 DGELN 2.625% 29APR 2023
2,600,000 J.P. Morgan (92,664)
CDS ENEL S.P.A. 20/03/19 EUR880,000 880,000 ENELIM 5.25% 20JUN 2017 EMTN
880,000 Societe Generale (5,629)
CDS EQUINOR ASA 20/06/23 EUR3,900,000 3,900,000 EQNR 2.0% 10 SEP2020 EMTN
3,900,000 J.P. Morgan (149,694)
CDS GAS NATURALSDG, S.A.
20/06/23 EUR3,000,000 3,000,000 GASSM 4.5% 27JAN 2020 10
3,000,000 Societe Generale (40,969)
CDS GLENCOREINTERNATIONAL AG
20/06/23 EUR1,450,000 1,450,000 GLENLN 6.5% 27FEB 2019 EMTN
1,450,000 Morgan Stanley (230,540)
CDS HAMMERSON PLC 20/03/19 EUR1,900,000 1,900,000 HMSOLN 2.0% 01JUL 2022
1,900,000 Deutsche Bank (11,983)
CDS HANNOVERRUECK SE
20/06/23 EUR2,600,000 2,600,000 HANRUE 5.75% 14SEP 2040
2,600,000 Societe Generale (23,631)
CDS ITRAXX EUR SRFINLS SERIES 29VERSION 1
20/06/23 EUR3,100,000 3,100,000 ITRX SNRFIN CDSIS29 5Y CORP
3,100,000 Credit Suisse (28,856)
CDS ITRAXX EURXOVER SERIES 29VERSION 1
20/06/23 EUR4,650,000 4,650,000 ITRX XOVER CDSIS29 5Y CORP
4,650,000 Goldman Sachs (451,816)
CDS ITV PLC 20/06/23 EUR2,300,000 2,300,000 ITVLN 2.125% 21SEP 2022
2,300,000 Credit Suisse (460,323)
CDS JTI (UK) FINANCEPLC
20/09/18 EUR1,150,000 1,150,000 JAPTOB 4.5% 02APR 2014 EMTN
1,150,000 BNP Paribas (2,929)
CDS KERING 20/06/21 EUR2,200,000 2,200,000 KERFP 6.5% 06NOV 2017 EMTN
2,200,000 BofA Merrill Lynch (57,038)
CDS KONINKLIJKEAHOLD N.V.
20/06/23 EUR2,500,000 2,500,000 ADNA 6.875% 01MAY 2029
2,500,000 Morgan Stanley (71,926)
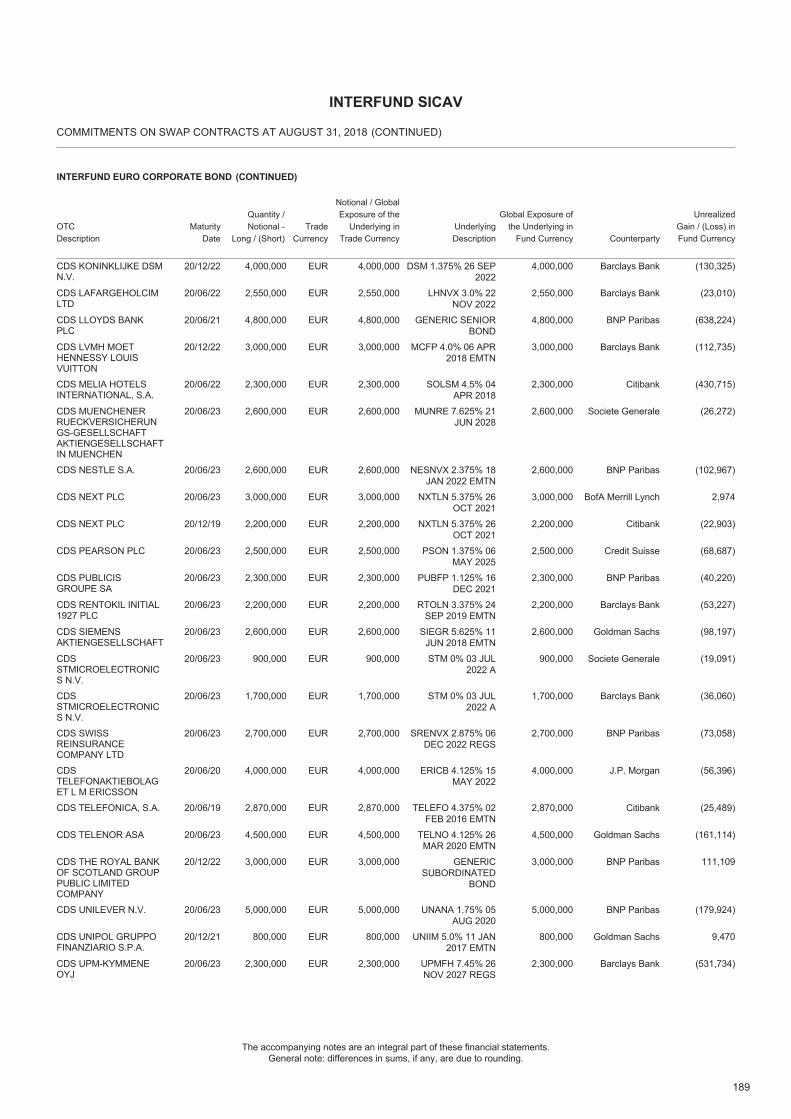
189
The accompanying notes are an integral part of these financial statements.General note: differences in sums, if any, are due to rounding.
COMMITMENTS ON SWAP CONTRACTS AT AUGUST 31, 2018
INTERFUND SICAV
(CONTINUED)
INTERFUND EURO CORPORATE BOND
OTCDescription
Quantity /Notional -
Long / (Short)Trade
Currency
Notional / GlobalExposure of the
Underlying inTrade Currency
Global Exposure ofthe Underlying in
Fund CurrencyMaturity
DateUnderlyingDescription Counterparty
UnrealizedGain / (Loss) inFund Currency
(CONTINUED)
CDS KONINKLIJKE DSMN.V.
20/12/22 EUR4,000,000 4,000,000 DSM 1.375% 26 SEP2022
4,000,000 Barclays Bank (130,325)
CDS LAFARGEHOLCIMLTD
20/06/22 EUR2,550,000 2,550,000 LHNVX 3.0% 22NOV 2022
2,550,000 Barclays Bank (23,010)
CDS LLOYDS BANKPLC
20/06/21 EUR4,800,000 4,800,000 GENERIC SENIORBOND
4,800,000 BNP Paribas (638,224)
CDS LVMH MOETHENNESSY LOUISVUITTON
20/12/22 EUR3,000,000 3,000,000 MCFP 4.0% 06 APR2018 EMTN
3,000,000 Barclays Bank (112,735)
CDS MELIA HOTELSINTERNATIONAL, S.A.
20/06/22 EUR2,300,000 2,300,000 SOLSM 4.5% 04APR 2018
2,300,000 Citibank (430,715)
CDS MUENCHENERRUECKVERSICHERUNGS-GESELLSCHAFTAKTIENGESELLSCHAFTIN MUENCHEN
20/06/23 EUR2,600,000 2,600,000 MUNRE 7.625% 21JUN 2028
2,600,000 Societe Generale (26,272)
CDS NESTLE S.A. 20/06/23 EUR2,600,000 2,600,000 NESNVX 2.375% 18JAN 2022 EMTN
2,600,000 BNP Paribas (102,967)
CDS NEXT PLC 20/06/23 EUR3,000,000 3,000,000 NXTLN 5.375% 26OCT 2021
3,000,000 BofA Merrill Lynch 2,974
CDS NEXT PLC 20/12/19 EUR2,200,000 2,200,000 NXTLN 5.375% 26OCT 2021
2,200,000 Citibank (22,903)
CDS PEARSON PLC 20/06/23 EUR2,500,000 2,500,000 PSON 1.375% 06MAY 2025
2,500,000 Credit Suisse (68,687)
CDS PUBLICISGROUPE SA
20/06/23 EUR2,300,000 2,300,000 PUBFP 1.125% 16DEC 2021
2,300,000 BNP Paribas (40,220)
CDS RENTOKIL INITIAL1927 PLC
20/06/23 EUR2,200,000 2,200,000 RTOLN 3.375% 24SEP 2019 EMTN
2,200,000 Barclays Bank (53,227)
CDS SIEMENSAKTIENGESELLSCHAFT
20/06/23 EUR2,600,000 2,600,000 SIEGR 5.625% 11JUN 2018 EMTN
2,600,000 Goldman Sachs (98,197)
CDSSTMICROELECTRONICS N.V.
20/06/23 EUR900,000 900,000 STM 0% 03 JUL2022 A
900,000 Societe Generale (19,091)
CDSSTMICROELECTRONICS N.V.
20/06/23 EUR1,700,000 1,700,000 STM 0% 03 JUL2022 A
1,700,000 Barclays Bank (36,060)
CDS SWISSREINSURANCECOMPANY LTD
20/06/23 EUR2,700,000 2,700,000 SRENVX 2.875% 06DEC 2022 REGS
2,700,000 BNP Paribas (73,058)
CDSTELEFONAKTIEBOLAGET L M ERICSSON
20/06/20 EUR4,000,000 4,000,000 ERICB 4.125% 15MAY 2022
4,000,000 J.P. Morgan (56,396)
CDS TELEFONICA, S.A. 20/06/19 EUR2,870,000 2,870,000 TELEFO 4.375% 02FEB 2016 EMTN
2,870,000 Citibank (25,489)
CDS TELENOR ASA 20/06/23 EUR4,500,000 4,500,000 TELNO 4.125% 26MAR 2020 EMTN
4,500,000 Goldman Sachs (161,114)
CDS THE ROYAL BANKOF SCOTLAND GROUPPUBLIC LIMITEDCOMPANY
20/12/22 EUR3,000,000 3,000,000 GENERICSUBORDINATED
BOND
3,000,000 BNP Paribas 111,109
CDS UNILEVER N.V. 20/06/23 EUR5,000,000 5,000,000 UNANA 1.75% 05AUG 2020
5,000,000 BNP Paribas (179,924)
CDS UNIPOL GRUPPOFINANZIARIO S.P.A.
20/12/21 EUR800,000 800,000 UNIIM 5.0% 11 JAN2017 EMTN
800,000 Goldman Sachs 9,470
CDS UPM-KYMMENEOYJ
20/06/23 EUR2,300,000 2,300,000 UPMFH 7.45% 26NOV 2027 REGS
2,300,000 Barclays Bank (531,734)
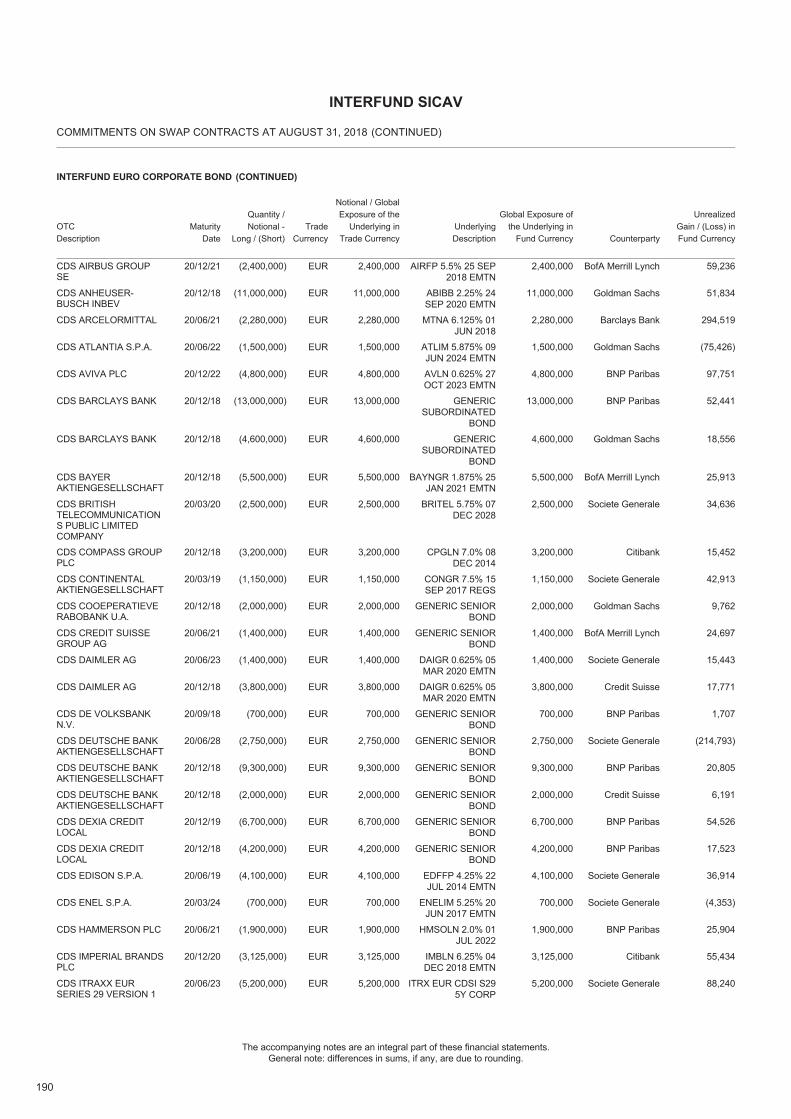
190
The accompanying notes are an integral part of these financial statements.General note: differences in sums, if any, are due to rounding.
COMMITMENTS ON SWAP CONTRACTS AT AUGUST 31, 2018
INTERFUND SICAV
(CONTINUED)
INTERFUND EURO CORPORATE BOND
OTCDescription
Quantity /Notional -
Long / (Short)Trade
Currency
Notional / GlobalExposure of the
Underlying inTrade Currency
Global Exposure ofthe Underlying in
Fund CurrencyMaturity
DateUnderlyingDescription Counterparty
UnrealizedGain / (Loss) inFund Currency
(CONTINUED)
CDS AIRBUS GROUPSE
20/12/21 EUR(2,400,000) 2,400,000 AIRFP 5.5% 25 SEP2018 EMTN
2,400,000 BofA Merrill Lynch 59,236
CDS ANHEUSER-BUSCH INBEV
20/12/18 EUR(11,000,000) 11,000,000 ABIBB 2.25% 24SEP 2020 EMTN
11,000,000 Goldman Sachs 51,834
CDS ARCELORMITTAL 20/06/21 EUR(2,280,000) 2,280,000 MTNA 6.125% 01JUN 2018
2,280,000 Barclays Bank 294,519
CDS ATLANTIA S.P.A. 20/06/22 EUR(1,500,000) 1,500,000 ATLIM 5.875% 09JUN 2024 EMTN
1,500,000 Goldman Sachs (75,426)
CDS AVIVA PLC 20/12/22 EUR(4,800,000) 4,800,000 AVLN 0.625% 27OCT 2023 EMTN
4,800,000 BNP Paribas 97,751
CDS BARCLAYS BANK 20/12/18 EUR(13,000,000) 13,000,000 GENERICSUBORDINATED
BOND
13,000,000 BNP Paribas 52,441
CDS BARCLAYS BANK 20/12/18 EUR(4,600,000) 4,600,000 GENERICSUBORDINATED
BOND
4,600,000 Goldman Sachs 18,556
CDS BAYERAKTIENGESELLSCHAFT
20/12/18 EUR(5,500,000) 5,500,000 BAYNGR 1.875% 25JAN 2021 EMTN
5,500,000 BofA Merrill Lynch 25,913
CDS BRITISHTELECOMMUNICATIONS PUBLIC LIMITEDCOMPANY
20/03/20 EUR(2,500,000) 2,500,000 BRITEL 5.75% 07DEC 2028
2,500,000 Societe Generale 34,636
CDS COMPASS GROUPPLC
20/12/18 EUR(3,200,000) 3,200,000 CPGLN 7.0% 08DEC 2014
3,200,000 Citibank 15,452
CDS CONTINENTALAKTIENGESELLSCHAFT
20/03/19 EUR(1,150,000) 1,150,000 CONGR 7.5% 15SEP 2017 REGS
1,150,000 Societe Generale 42,913
CDS COOEPERATIEVERABOBANK U.A.
20/12/18 EUR(2,000,000) 2,000,000 GENERIC SENIORBOND
2,000,000 Goldman Sachs 9,762
CDS CREDIT SUISSEGROUP AG
20/06/21 EUR(1,400,000) 1,400,000 GENERIC SENIORBOND
1,400,000 BofA Merrill Lynch 24,697
CDS DAIMLER AG 20/06/23 EUR(1,400,000) 1,400,000 DAIGR 0.625% 05MAR 2020 EMTN
1,400,000 Societe Generale 15,443
CDS DAIMLER AG 20/12/18 EUR(3,800,000) 3,800,000 DAIGR 0.625% 05MAR 2020 EMTN
3,800,000 Credit Suisse 17,771
CDS DE VOLKSBANKN.V.
20/09/18 EUR(700,000) 700,000 GENERIC SENIORBOND
700,000 BNP Paribas 1,707
CDS DEUTSCHE BANKAKTIENGESELLSCHAFT
20/06/28 EUR(2,750,000) 2,750,000 GENERIC SENIORBOND
2,750,000 Societe Generale (214,793)
CDS DEUTSCHE BANKAKTIENGESELLSCHAFT
20/12/18 EUR(9,300,000) 9,300,000 GENERIC SENIORBOND
9,300,000 BNP Paribas 20,805
CDS DEUTSCHE BANKAKTIENGESELLSCHAFT
20/12/18 EUR(2,000,000) 2,000,000 GENERIC SENIORBOND
2,000,000 Credit Suisse 6,191
CDS DEXIA CREDITLOCAL
20/12/19 EUR(6,700,000) 6,700,000 GENERIC SENIORBOND
6,700,000 BNP Paribas 54,526
CDS DEXIA CREDITLOCAL
20/12/18 EUR(4,200,000) 4,200,000 GENERIC SENIORBOND
4,200,000 BNP Paribas 17,523
CDS EDISON S.P.A. 20/06/19 EUR(4,100,000) 4,100,000 EDFFP 4.25% 22JUL 2014 EMTN
4,100,000 Societe Generale 36,914
CDS ENEL S.P.A. 20/03/24 EUR(700,000) 700,000 ENELIM 5.25% 20JUN 2017 EMTN
700,000 Societe Generale (4,353)
CDS HAMMERSON PLC 20/06/21 EUR(1,900,000) 1,900,000 HMSOLN 2.0% 01JUL 2022
1,900,000 BNP Paribas 25,904
CDS IMPERIAL BRANDSPLC
20/12/20 EUR(3,125,000) 3,125,000 IMBLN 6.25% 04DEC 2018 EMTN
3,125,000 Citibank 55,434
CDS ITRAXX EURSERIES 29 VERSION 1
20/06/23 EUR(5,200,000) 5,200,000 ITRX EUR CDSI S295Y CORP
5,200,000 Societe Generale 88,240
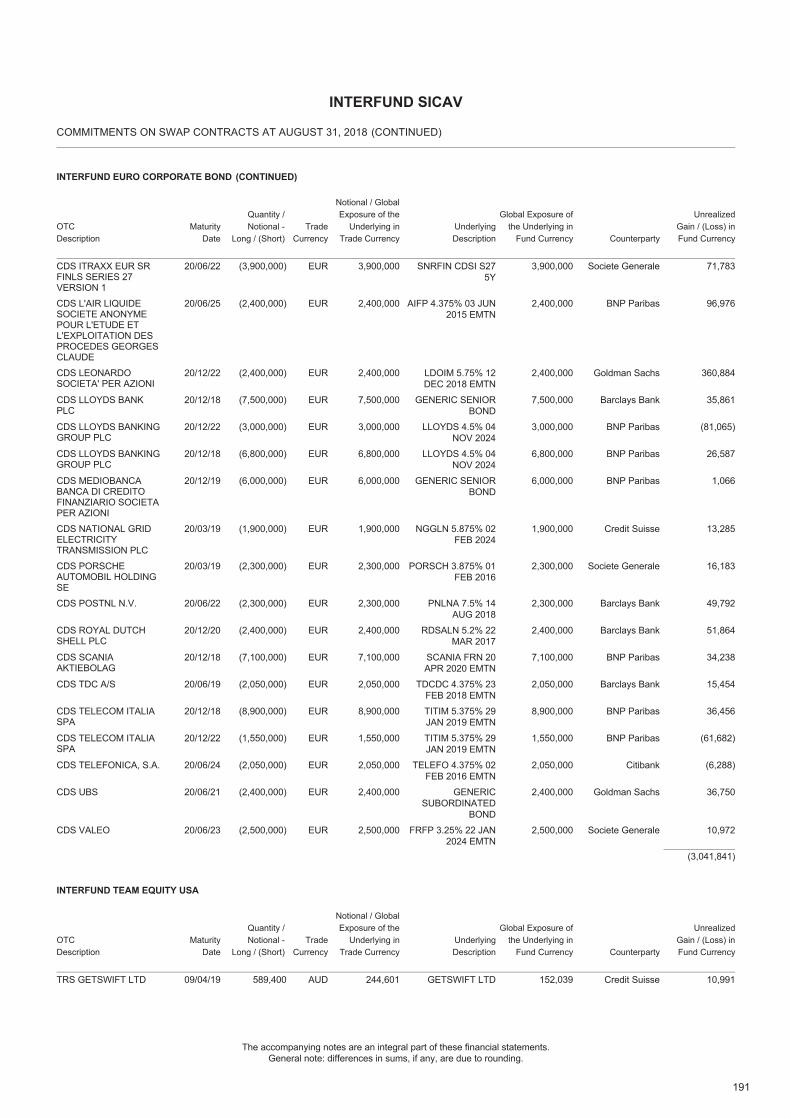
191
The accompanying notes are an integral part of these financial statements.General note: differences in sums, if any, are due to rounding.
COMMITMENTS ON SWAP CONTRACTS AT AUGUST 31, 2018
INTERFUND SICAV
(CONTINUED)
INTERFUND EURO CORPORATE BOND
OTCDescription
Quantity /Notional -
Long / (Short)Trade
Currency
Notional / GlobalExposure of the
Underlying inTrade Currency
Global Exposure ofthe Underlying in
Fund CurrencyMaturity
DateUnderlyingDescription Counterparty
UnrealizedGain / (Loss) inFund Currency
(CONTINUED)
CDS ITRAXX EUR SRFINLS SERIES 27VERSION 1
20/06/22 EUR(3,900,000) 3,900,000 SNRFIN CDSI S275Y
3,900,000 Societe Generale 71,783
CDS L'AIR LIQUIDESOCIETE ANONYMEPOUR L'ETUDE ETL'EXPLOITATION DESPROCEDES GEORGESCLAUDE
20/06/25 EUR(2,400,000) 2,400,000 AIFP 4.375% 03 JUN2015 EMTN
2,400,000 BNP Paribas 96,976
CDS LEONARDOSOCIETA' PER AZIONI
20/12/22 EUR(2,400,000) 2,400,000 LDOIM 5.75% 12DEC 2018 EMTN
2,400,000 Goldman Sachs 360,884
CDS LLOYDS BANKPLC
20/12/18 EUR(7,500,000) 7,500,000 GENERIC SENIORBOND
7,500,000 Barclays Bank 35,861
CDS LLOYDS BANKINGGROUP PLC
20/12/22 EUR(3,000,000) 3,000,000 LLOYDS 4.5% 04NOV 2024
3,000,000 BNP Paribas (81,065)
CDS LLOYDS BANKINGGROUP PLC
20/12/18 EUR(6,800,000) 6,800,000 LLOYDS 4.5% 04NOV 2024
6,800,000 BNP Paribas 26,587
CDS MEDIOBANCABANCA DI CREDITOFINANZIARIO SOCIETAPER AZIONI
20/12/19 EUR(6,000,000) 6,000,000 GENERIC SENIORBOND
6,000,000 BNP Paribas 1,066
CDS NATIONAL GRIDELECTRICITYTRANSMISSION PLC
20/03/19 EUR(1,900,000) 1,900,000 NGGLN 5.875% 02FEB 2024
1,900,000 Credit Suisse 13,285
CDS PORSCHEAUTOMOBIL HOLDINGSE
20/03/19 EUR(2,300,000) 2,300,000 PORSCH 3.875% 01FEB 2016
2,300,000 Societe Generale 16,183
CDS POSTNL N.V. 20/06/22 EUR(2,300,000) 2,300,000 PNLNA 7.5% 14AUG 2018
2,300,000 Barclays Bank 49,792
CDS ROYAL DUTCHSHELL PLC
20/12/20 EUR(2,400,000) 2,400,000 RDSALN 5.2% 22MAR 2017
2,400,000 Barclays Bank 51,864
CDS SCANIAAKTIEBOLAG
20/12/18 EUR(7,100,000) 7,100,000 SCANIA FRN 20APR 2020 EMTN
7,100,000 BNP Paribas 34,238
CDS TDC A/S 20/06/19 EUR(2,050,000) 2,050,000 TDCDC 4.375% 23FEB 2018 EMTN
2,050,000 Barclays Bank 15,454
CDS TELECOM ITALIASPA
20/12/18 EUR(8,900,000) 8,900,000 TITIM 5.375% 29JAN 2019 EMTN
8,900,000 BNP Paribas 36,456
CDS TELECOM ITALIASPA
20/12/22 EUR(1,550,000) 1,550,000 TITIM 5.375% 29JAN 2019 EMTN
1,550,000 BNP Paribas (61,682)
CDS TELEFONICA, S.A. 20/06/24 EUR(2,050,000) 2,050,000 TELEFO 4.375% 02FEB 2016 EMTN
2,050,000 Citibank (6,288)
CDS UBS 20/06/21 EUR(2,400,000) 2,400,000 GENERICSUBORDINATED
BOND
2,400,000 Goldman Sachs 36,750
CDS VALEO 20/06/23 EUR(2,500,000) 2,500,000 FRFP 3.25% 22 JAN2024 EMTN
2,500,000 Societe Generale 10,972
(3,041,841)
INTERFUND TEAM EQUITY USA
OTCDescription
Quantity /Notional -
Long / (Short)Trade
Currency
Notional / GlobalExposure of the
Underlying inTrade Currency
Global Exposure ofthe Underlying in
Fund CurrencyMaturity
DateUnderlyingDescription Counterparty
UnrealizedGain / (Loss) inFund Currency
TRS GETSWIFT LTD 09/04/19 AUD589,400 244,601 GETSWIFT LTD 152,039 Credit Suisse 10,991
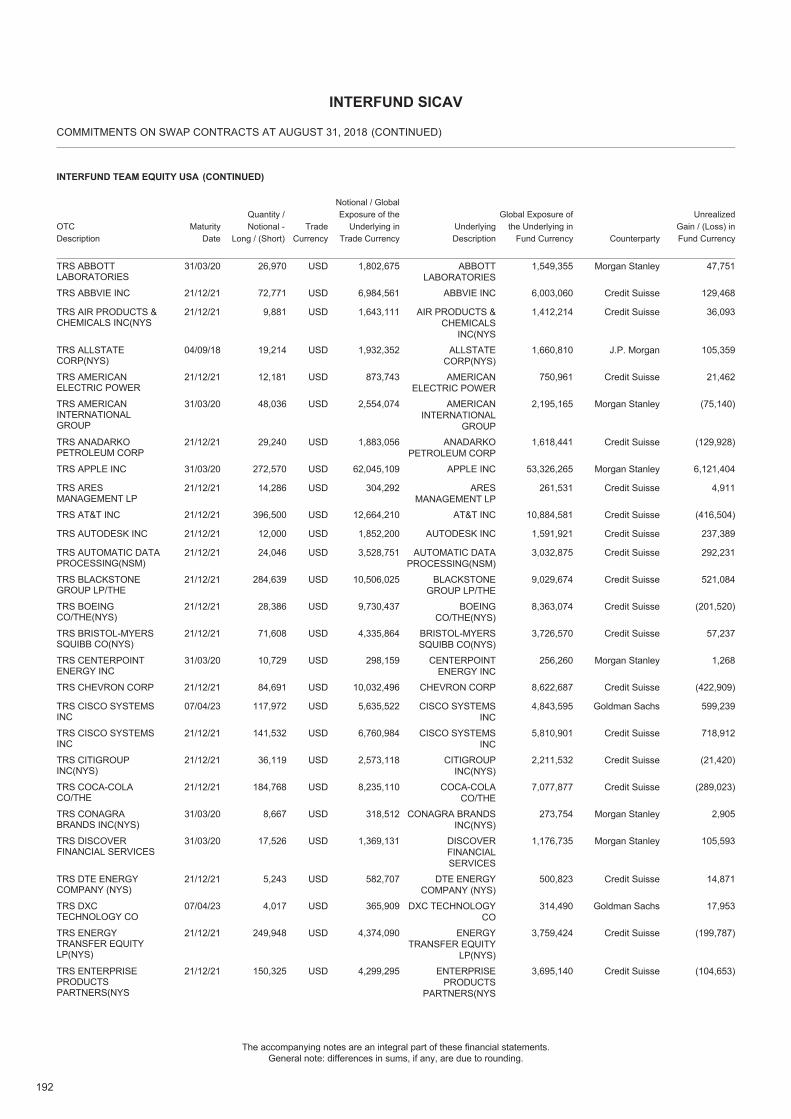
192
The accompanying notes are an integral part of these financial statements.General note: differences in sums, if any, are due to rounding.
COMMITMENTS ON SWAP CONTRACTS AT AUGUST 31, 2018
INTERFUND SICAV
(CONTINUED)
INTERFUND TEAM EQUITY USA
OTCDescription
Quantity /Notional -
Long / (Short)Trade
Currency
Notional / GlobalExposure of the
Underlying inTrade Currency
Global Exposure ofthe Underlying in
Fund CurrencyMaturity
DateUnderlyingDescription Counterparty
UnrealizedGain / (Loss) inFund Currency
(CONTINUED)
TRS ABBOTTLABORATORIES
31/03/20 USD26,970 1,802,675 ABBOTTLABORATORIES
1,549,355 Morgan Stanley 47,751
TRS ABBVIE INC 21/12/21 USD72,771 6,984,561 ABBVIE INC 6,003,060 Credit Suisse 129,468
TRS AIR PRODUCTS &CHEMICALS INC(NYS
21/12/21 USD9,881 1,643,111 AIR PRODUCTS &CHEMICALS
INC(NYS
1,412,214 Credit Suisse 36,093
TRS ALLSTATECORP(NYS)
04/09/18 USD19,214 1,932,352 ALLSTATECORP(NYS)
1,660,810 J.P. Morgan 105,359
TRS AMERICANELECTRIC POWER
21/12/21 USD12,181 873,743 AMERICANELECTRIC POWER
750,961 Credit Suisse 21,462
TRS AMERICANINTERNATIONALGROUP
31/03/20 USD48,036 2,554,074 AMERICANINTERNATIONAL
GROUP
2,195,165 Morgan Stanley (75,140)
TRS ANADARKOPETROLEUM CORP
21/12/21 USD29,240 1,883,056 ANADARKOPETROLEUM CORP
1,618,441 Credit Suisse (129,928)
TRS APPLE INC 31/03/20 USD272,570 62,045,109 APPLE INC 53,326,265 Morgan Stanley 6,121,404
TRS ARESMANAGEMENT LP
21/12/21 USD14,286 304,292 ARESMANAGEMENT LP
261,531 Credit Suisse 4,911
TRS AT&T INC 21/12/21 USD396,500 12,664,210 AT&T INC 10,884,581 Credit Suisse (416,504)
TRS AUTODESK INC 21/12/21 USD12,000 1,852,200 AUTODESK INC 1,591,921 Credit Suisse 237,389
TRS AUTOMATIC DATAPROCESSING(NSM)
21/12/21 USD24,046 3,528,751 AUTOMATIC DATAPROCESSING(NSM)
3,032,875 Credit Suisse 292,231
TRS BLACKSTONEGROUP LP/THE
21/12/21 USD284,639 10,506,025 BLACKSTONEGROUP LP/THE
9,029,674 Credit Suisse 521,084
TRS BOEINGCO/THE(NYS)
21/12/21 USD28,386 9,730,437 BOEINGCO/THE(NYS)
8,363,074 Credit Suisse (201,520)
TRS BRISTOL-MYERSSQUIBB CO(NYS)
21/12/21 USD71,608 4,335,864 BRISTOL-MYERSSQUIBB CO(NYS)
3,726,570 Credit Suisse 57,237
TRS CENTERPOINTENERGY INC
31/03/20 USD10,729 298,159 CENTERPOINTENERGY INC
256,260 Morgan Stanley 1,268
TRS CHEVRON CORP 21/12/21 USD84,691 10,032,496 CHEVRON CORP 8,622,687 Credit Suisse (422,909)
TRS CISCO SYSTEMSINC
07/04/23 USD117,972 5,635,522 CISCO SYSTEMSINC
4,843,595 Goldman Sachs 599,239
TRS CISCO SYSTEMSINC
21/12/21 USD141,532 6,760,984 CISCO SYSTEMSINC
5,810,901 Credit Suisse 718,912
TRS CITIGROUPINC(NYS)
21/12/21 USD36,119 2,573,118 CITIGROUPINC(NYS)
2,211,532 Credit Suisse (21,420)
TRS COCA-COLACO/THE
21/12/21 USD184,768 8,235,110 COCA-COLACO/THE
7,077,877 Credit Suisse (289,023)
TRS CONAGRABRANDS INC(NYS)
31/03/20 USD8,667 318,512 CONAGRA BRANDSINC(NYS)
273,754 Morgan Stanley 2,905
TRS DISCOVERFINANCIAL SERVICES
31/03/20 USD17,526 1,369,131 DISCOVERFINANCIALSERVICES
1,176,735 Morgan Stanley 105,593
TRS DTE ENERGYCOMPANY (NYS)
21/12/21 USD5,243 582,707 DTE ENERGYCOMPANY (NYS)
500,823 Credit Suisse 14,871
TRS DXCTECHNOLOGY CO
07/04/23 USD4,017 365,909 DXC TECHNOLOGYCO
314,490 Goldman Sachs 17,953
TRS ENERGYTRANSFER EQUITYLP(NYS)
21/12/21 USD249,948 4,374,090 ENERGYTRANSFER EQUITY
LP(NYS)
3,759,424 Credit Suisse (199,787)
TRS ENTERPRISEPRODUCTSPARTNERS(NYS
21/12/21 USD150,325 4,299,295 ENTERPRISEPRODUCTS
PARTNERS(NYS
3,695,140 Credit Suisse (104,653)
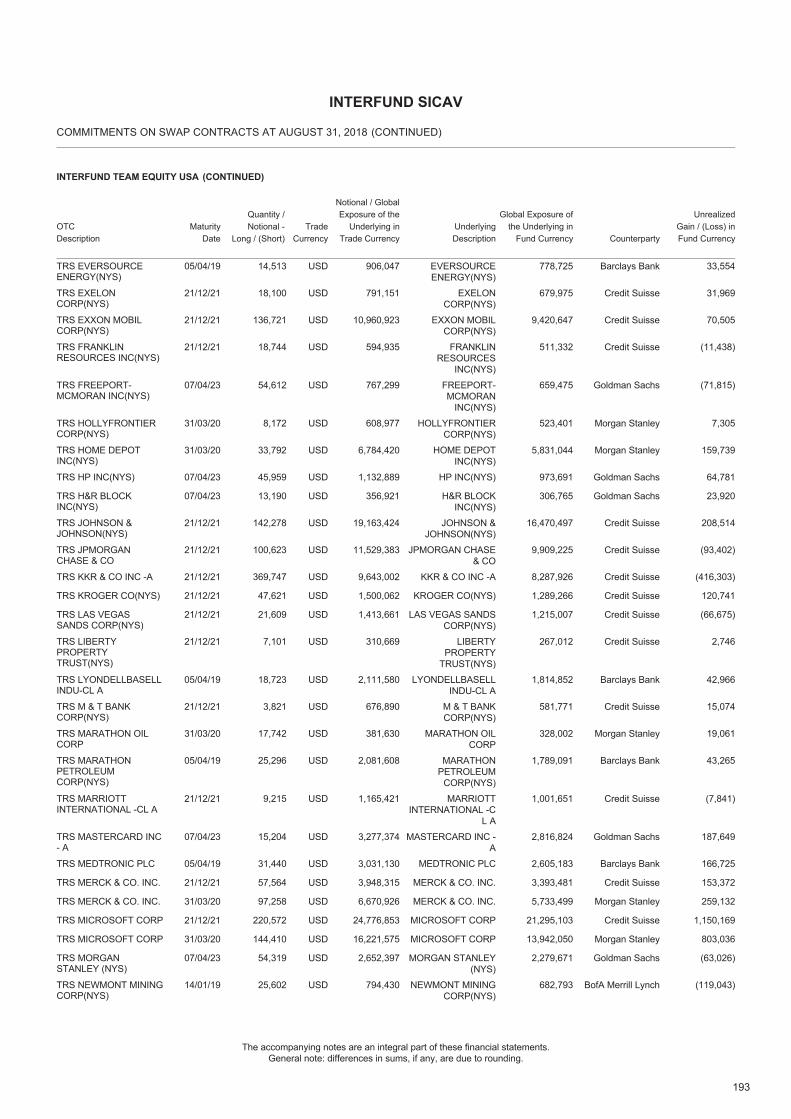
193
The accompanying notes are an integral part of these financial statements.General note: differences in sums, if any, are due to rounding.
COMMITMENTS ON SWAP CONTRACTS AT AUGUST 31, 2018
INTERFUND SICAV
(CONTINUED)
INTERFUND TEAM EQUITY USA
OTCDescription
Quantity /Notional -
Long / (Short)Trade
Currency
Notional / GlobalExposure of the
Underlying inTrade Currency
Global Exposure ofthe Underlying in
Fund CurrencyMaturity
DateUnderlyingDescription Counterparty
UnrealizedGain / (Loss) inFund Currency
(CONTINUED)
TRS EVERSOURCEENERGY(NYS)
05/04/19 USD14,513 906,047 EVERSOURCEENERGY(NYS)
778,725 Barclays Bank 33,554
TRS EXELONCORP(NYS)
21/12/21 USD18,100 791,151 EXELONCORP(NYS)
679,975 Credit Suisse 31,969
TRS EXXON MOBILCORP(NYS)
21/12/21 USD136,721 10,960,923 EXXON MOBILCORP(NYS)
9,420,647 Credit Suisse 70,505
TRS FRANKLINRESOURCES INC(NYS)
21/12/21 USD18,744 594,935 FRANKLINRESOURCES
INC(NYS)
511,332 Credit Suisse (11,438)
TRS FREEPORT-MCMORAN INC(NYS)
07/04/23 USD54,612 767,299 FREEPORT-MCMORAN
INC(NYS)
659,475 Goldman Sachs (71,815)
TRS HOLLYFRONTIERCORP(NYS)
31/03/20 USD8,172 608,977 HOLLYFRONTIERCORP(NYS)
523,401 Morgan Stanley 7,305
TRS HOME DEPOTINC(NYS)
31/03/20 USD33,792 6,784,420 HOME DEPOTINC(NYS)
5,831,044 Morgan Stanley 159,739
TRS HP INC(NYS) 07/04/23 USD45,959 1,132,889 HP INC(NYS) 973,691 Goldman Sachs 64,781
TRS H&R BLOCKINC(NYS)
07/04/23 USD13,190 356,921 H&R BLOCKINC(NYS)
306,765 Goldman Sachs 23,920
TRS JOHNSON &JOHNSON(NYS)
21/12/21 USD142,278 19,163,424 JOHNSON &JOHNSON(NYS)
16,470,497 Credit Suisse 208,514
TRS JPMORGANCHASE & CO
21/12/21 USD100,623 11,529,383 JPMORGAN CHASE& CO
9,909,225 Credit Suisse (93,402)
TRS KKR & CO INC -A 21/12/21 USD369,747 9,643,002 KKR & CO INC -A 8,287,926 Credit Suisse (416,303)
TRS KROGER CO(NYS) 21/12/21 USD47,621 1,500,062 KROGER CO(NYS) 1,289,266 Credit Suisse 120,741
TRS LAS VEGASSANDS CORP(NYS)
21/12/21 USD21,609 1,413,661 LAS VEGAS SANDSCORP(NYS)
1,215,007 Credit Suisse (66,675)
TRS LIBERTYPROPERTYTRUST(NYS)
21/12/21 USD7,101 310,669 LIBERTYPROPERTY
TRUST(NYS)
267,012 Credit Suisse 2,746
TRS LYONDELLBASELLINDU-CL A
05/04/19 USD18,723 2,111,580 LYONDELLBASELLINDU-CL A
1,814,852 Barclays Bank 42,966
TRS M & T BANKCORP(NYS)
21/12/21 USD3,821 676,890 M & T BANKCORP(NYS)
581,771 Credit Suisse 15,074
TRS MARATHON OILCORP
31/03/20 USD17,742 381,630 MARATHON OILCORP
328,002 Morgan Stanley 19,061
TRS MARATHONPETROLEUMCORP(NYS)
05/04/19 USD25,296 2,081,608 MARATHONPETROLEUM
CORP(NYS)
1,789,091 Barclays Bank 43,265
TRS MARRIOTTINTERNATIONAL -CL A
21/12/21 USD9,215 1,165,421 MARRIOTTINTERNATIONAL -C
L A
1,001,651 Credit Suisse (7,841)
TRS MASTERCARD INC- A
07/04/23 USD15,204 3,277,374 MASTERCARD INC -A
2,816,824 Goldman Sachs 187,649
TRS MEDTRONIC PLC 05/04/19 USD31,440 3,031,130 MEDTRONIC PLC 2,605,183 Barclays Bank 166,725
TRS MERCK & CO. INC. 21/12/21 USD57,564 3,948,315 MERCK & CO. INC. 3,393,481 Credit Suisse 153,372
TRS MERCK & CO. INC. 31/03/20 USD97,258 6,670,926 MERCK & CO. INC. 5,733,499 Morgan Stanley 259,132
TRS MICROSOFT CORP 21/12/21 USD220,572 24,776,853 MICROSOFT CORP 21,295,103 Credit Suisse 1,150,169
TRS MICROSOFT CORP 31/03/20 USD144,410 16,221,575 MICROSOFT CORP 13,942,050 Morgan Stanley 803,036
TRS MORGANSTANLEY (NYS)
07/04/23 USD54,319 2,652,397 MORGAN STANLEY(NYS)
2,279,671 Goldman Sachs (63,026)
TRS NEWMONT MININGCORP(NYS)
14/01/19 USD25,602 794,430 NEWMONT MININGCORP(NYS)
682,793 BofA Merrill Lynch (119,043)
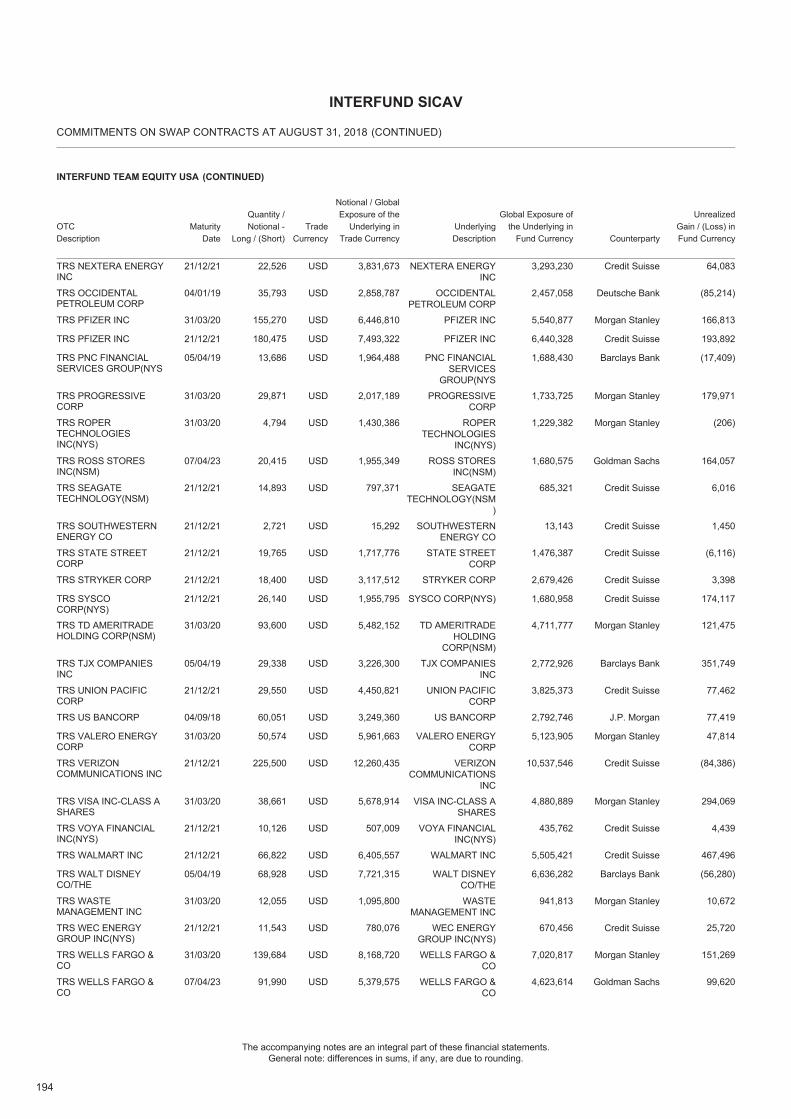
194
The accompanying notes are an integral part of these financial statements.General note: differences in sums, if any, are due to rounding.
COMMITMENTS ON SWAP CONTRACTS AT AUGUST 31, 2018
INTERFUND SICAV
(CONTINUED)
INTERFUND TEAM EQUITY USA
OTCDescription
Quantity /Notional -
Long / (Short)Trade
Currency
Notional / GlobalExposure of the
Underlying inTrade Currency
Global Exposure ofthe Underlying in
Fund CurrencyMaturity
DateUnderlyingDescription Counterparty
UnrealizedGain / (Loss) inFund Currency
(CONTINUED)
TRS NEXTERA ENERGYINC
21/12/21 USD22,526 3,831,673 NEXTERA ENERGYINC
3,293,230 Credit Suisse 64,083
TRS OCCIDENTALPETROLEUM CORP
04/01/19 USD35,793 2,858,787 OCCIDENTALPETROLEUM CORP
2,457,058 Deutsche Bank (85,214)
TRS PFIZER INC 31/03/20 USD155,270 6,446,810 PFIZER INC 5,540,877 Morgan Stanley 166,813
TRS PFIZER INC 21/12/21 USD180,475 7,493,322 PFIZER INC 6,440,328 Credit Suisse 193,892
TRS PNC FINANCIALSERVICES GROUP(NYS
05/04/19 USD13,686 1,964,488 PNC FINANCIALSERVICES
GROUP(NYS
1,688,430 Barclays Bank (17,409)
TRS PROGRESSIVECORP
31/03/20 USD29,871 2,017,189 PROGRESSIVECORP
1,733,725 Morgan Stanley 179,971
TRS ROPERTECHNOLOGIESINC(NYS)
31/03/20 USD4,794 1,430,386 ROPERTECHNOLOGIES
INC(NYS)
1,229,382 Morgan Stanley (206)
TRS ROSS STORESINC(NSM)
07/04/23 USD20,415 1,955,349 ROSS STORESINC(NSM)
1,680,575 Goldman Sachs 164,057
TRS SEAGATETECHNOLOGY(NSM)
21/12/21 USD14,893 797,371 SEAGATETECHNOLOGY(NSM
)
685,321 Credit Suisse 6,016
TRS SOUTHWESTERNENERGY CO
21/12/21 USD2,721 15,292 SOUTHWESTERNENERGY CO
13,143 Credit Suisse 1,450
TRS STATE STREETCORP
21/12/21 USD19,765 1,717,776 STATE STREETCORP
1,476,387 Credit Suisse (6,116)
TRS STRYKER CORP 21/12/21 USD18,400 3,117,512 STRYKER CORP 2,679,426 Credit Suisse 3,398
TRS SYSCOCORP(NYS)
21/12/21 USD26,140 1,955,795 SYSCO CORP(NYS) 1,680,958 Credit Suisse 174,117
TRS TD AMERITRADEHOLDING CORP(NSM)
31/03/20 USD93,600 5,482,152 TD AMERITRADEHOLDING
CORP(NSM)
4,711,777 Morgan Stanley 121,475
TRS TJX COMPANIESINC
05/04/19 USD29,338 3,226,300 TJX COMPANIESINC
2,772,926 Barclays Bank 351,749
TRS UNION PACIFICCORP
21/12/21 USD29,550 4,450,821 UNION PACIFICCORP
3,825,373 Credit Suisse 77,462
TRS US BANCORP 04/09/18 USD60,051 3,249,360 US BANCORP 2,792,746 J.P. Morgan 77,419
TRS VALERO ENERGYCORP
31/03/20 USD50,574 5,961,663 VALERO ENERGYCORP
5,123,905 Morgan Stanley 47,814
TRS VERIZONCOMMUNICATIONS INC
21/12/21 USD225,500 12,260,435 VERIZONCOMMUNICATIONS
INC
10,537,546 Credit Suisse (84,386)
TRS VISA INC-CLASS ASHARES
31/03/20 USD38,661 5,678,914 VISA INC-CLASS ASHARES
4,880,889 Morgan Stanley 294,069
TRS VOYA FINANCIALINC(NYS)
21/12/21 USD10,126 507,009 VOYA FINANCIALINC(NYS)
435,762 Credit Suisse 4,439
TRS WALMART INC 21/12/21 USD66,822 6,405,557 WALMART INC 5,505,421 Credit Suisse 467,496
TRS WALT DISNEYCO/THE
05/04/19 USD68,928 7,721,315 WALT DISNEYCO/THE
6,636,282 Barclays Bank (56,280)
TRS WASTEMANAGEMENT INC
31/03/20 USD12,055 1,095,800 WASTEMANAGEMENT INC
941,813 Morgan Stanley 10,672
TRS WEC ENERGYGROUP INC(NYS)
21/12/21 USD11,543 780,076 WEC ENERGYGROUP INC(NYS)
670,456 Credit Suisse 25,720
TRS WELLS FARGO &CO
31/03/20 USD139,684 8,168,720 WELLS FARGO &CO
7,020,817 Morgan Stanley 151,269
TRS WELLS FARGO &CO
07/04/23 USD91,990 5,379,575 WELLS FARGO &CO
4,623,614 Goldman Sachs 99,620
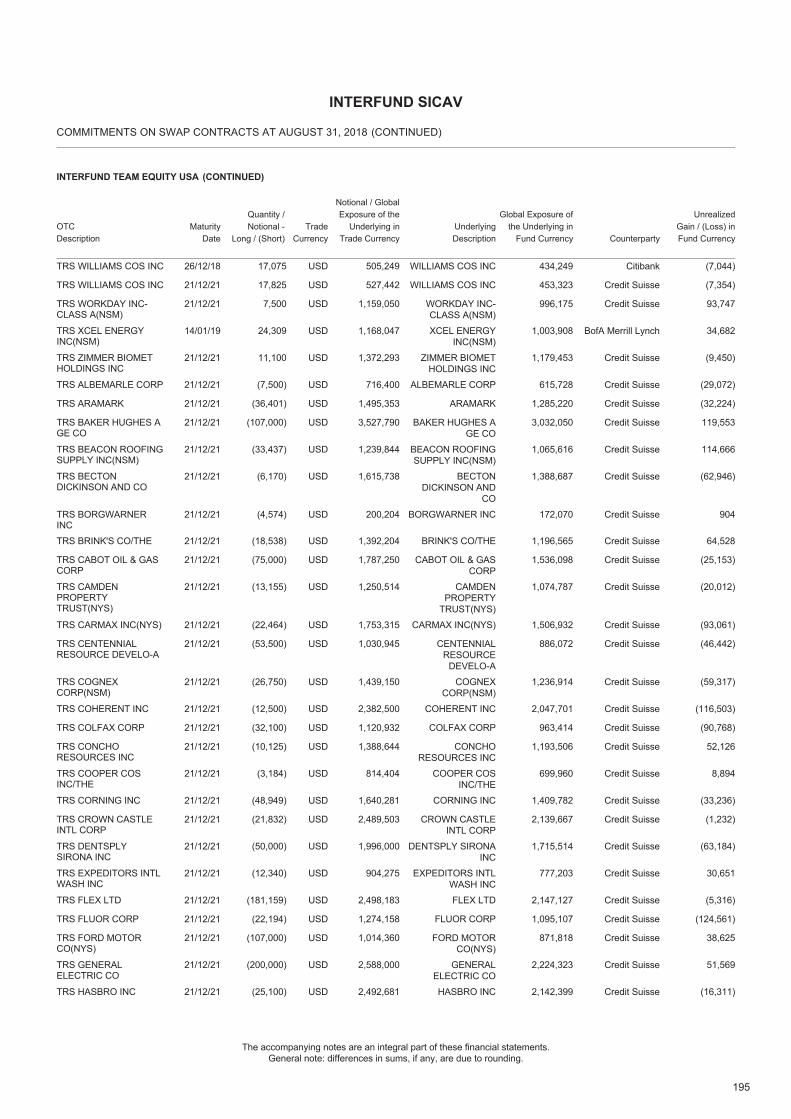
195
The accompanying notes are an integral part of these financial statements.General note: differences in sums, if any, are due to rounding.
COMMITMENTS ON SWAP CONTRACTS AT AUGUST 31, 2018
INTERFUND SICAV
(CONTINUED)
INTERFUND TEAM EQUITY USA
OTCDescription
Quantity /Notional -
Long / (Short)Trade
Currency
Notional / GlobalExposure of the
Underlying inTrade Currency
Global Exposure ofthe Underlying in
Fund CurrencyMaturity
DateUnderlyingDescription Counterparty
UnrealizedGain / (Loss) inFund Currency
(CONTINUED)
TRS WILLIAMS COS INC 26/12/18 USD17,075 505,249 WILLIAMS COS INC 434,249 Citibank (7,044)
TRS WILLIAMS COS INC 21/12/21 USD17,825 527,442 WILLIAMS COS INC 453,323 Credit Suisse (7,354)
TRS WORKDAY INC-CLASS A(NSM)
21/12/21 USD7,500 1,159,050 WORKDAY INC-CLASS A(NSM)
996,175 Credit Suisse 93,747
TRS XCEL ENERGYINC(NSM)
14/01/19 USD24,309 1,168,047 XCEL ENERGYINC(NSM)
1,003,908 BofA Merrill Lynch 34,682
TRS ZIMMER BIOMETHOLDINGS INC
21/12/21 USD11,100 1,372,293 ZIMMER BIOMETHOLDINGS INC
1,179,453 Credit Suisse (9,450)
TRS ALBEMARLE CORP 21/12/21 USD(7,500) 716,400 ALBEMARLE CORP 615,728 Credit Suisse (29,072)
TRS ARAMARK 21/12/21 USD(36,401) 1,495,353 ARAMARK 1,285,220 Credit Suisse (32,224)
TRS BAKER HUGHES AGE CO
21/12/21 USD(107,000) 3,527,790 BAKER HUGHES AGE CO
3,032,050 Credit Suisse 119,553
TRS BEACON ROOFINGSUPPLY INC(NSM)
21/12/21 USD(33,437) 1,239,844 BEACON ROOFINGSUPPLY INC(NSM)
1,065,616 Credit Suisse 114,666
TRS BECTONDICKINSON AND CO
21/12/21 USD(6,170) 1,615,738 BECTONDICKINSON AND
CO
1,388,687 Credit Suisse (62,946)
TRS BORGWARNERINC
21/12/21 USD(4,574) 200,204 BORGWARNER INC 172,070 Credit Suisse 904
TRS BRINK'S CO/THE 21/12/21 USD(18,538) 1,392,204 BRINK'S CO/THE 1,196,565 Credit Suisse 64,528
TRS CABOT OIL & GASCORP
21/12/21 USD(75,000) 1,787,250 CABOT OIL & GASCORP
1,536,098 Credit Suisse (25,153)
TRS CAMDENPROPERTYTRUST(NYS)
21/12/21 USD(13,155) 1,250,514 CAMDENPROPERTY
TRUST(NYS)
1,074,787 Credit Suisse (20,012)
TRS CARMAX INC(NYS) 21/12/21 USD(22,464) 1,753,315 CARMAX INC(NYS) 1,506,932 Credit Suisse (93,061)
TRS CENTENNIALRESOURCE DEVELO-A
21/12/21 USD(53,500) 1,030,945 CENTENNIALRESOURCE
DEVELO-A
886,072 Credit Suisse (46,442)
TRS COGNEXCORP(NSM)
21/12/21 USD(26,750) 1,439,150 COGNEXCORP(NSM)
1,236,914 Credit Suisse (59,317)
TRS COHERENT INC 21/12/21 USD(12,500) 2,382,500 COHERENT INC 2,047,701 Credit Suisse (116,503)
TRS COLFAX CORP 21/12/21 USD(32,100) 1,120,932 COLFAX CORP 963,414 Credit Suisse (90,768)
TRS CONCHORESOURCES INC
21/12/21 USD(10,125) 1,388,644 CONCHORESOURCES INC
1,193,506 Credit Suisse 52,126
TRS COOPER COSINC/THE
21/12/21 USD(3,184) 814,404 COOPER COSINC/THE
699,960 Credit Suisse 8,894
TRS CORNING INC 21/12/21 USD(48,949) 1,640,281 CORNING INC 1,409,782 Credit Suisse (33,236)
TRS CROWN CASTLEINTL CORP
21/12/21 USD(21,832) 2,489,503 CROWN CASTLEINTL CORP
2,139,667 Credit Suisse (1,232)
TRS DENTSPLYSIRONA INC
21/12/21 USD(50,000) 1,996,000 DENTSPLY SIRONAINC
1,715,514 Credit Suisse (63,184)
TRS EXPEDITORS INTLWASH INC
21/12/21 USD(12,340) 904,275 EXPEDITORS INTLWASH INC
777,203 Credit Suisse 30,651
TRS FLEX LTD 21/12/21 USD(181,159) 2,498,183 FLEX LTD 2,147,127 Credit Suisse (5,316)
TRS FLUOR CORP 21/12/21 USD(22,194) 1,274,158 FLUOR CORP 1,095,107 Credit Suisse (124,561)
TRS FORD MOTORCO(NYS)
21/12/21 USD(107,000) 1,014,360 FORD MOTORCO(NYS)
871,818 Credit Suisse 38,625
TRS GENERALELECTRIC CO
21/12/21 USD(200,000) 2,588,000 GENERALELECTRIC CO
2,224,323 Credit Suisse 51,569
TRS HASBRO INC 21/12/21 USD(25,100) 2,492,681 HASBRO INC 2,142,399 Credit Suisse (16,311)
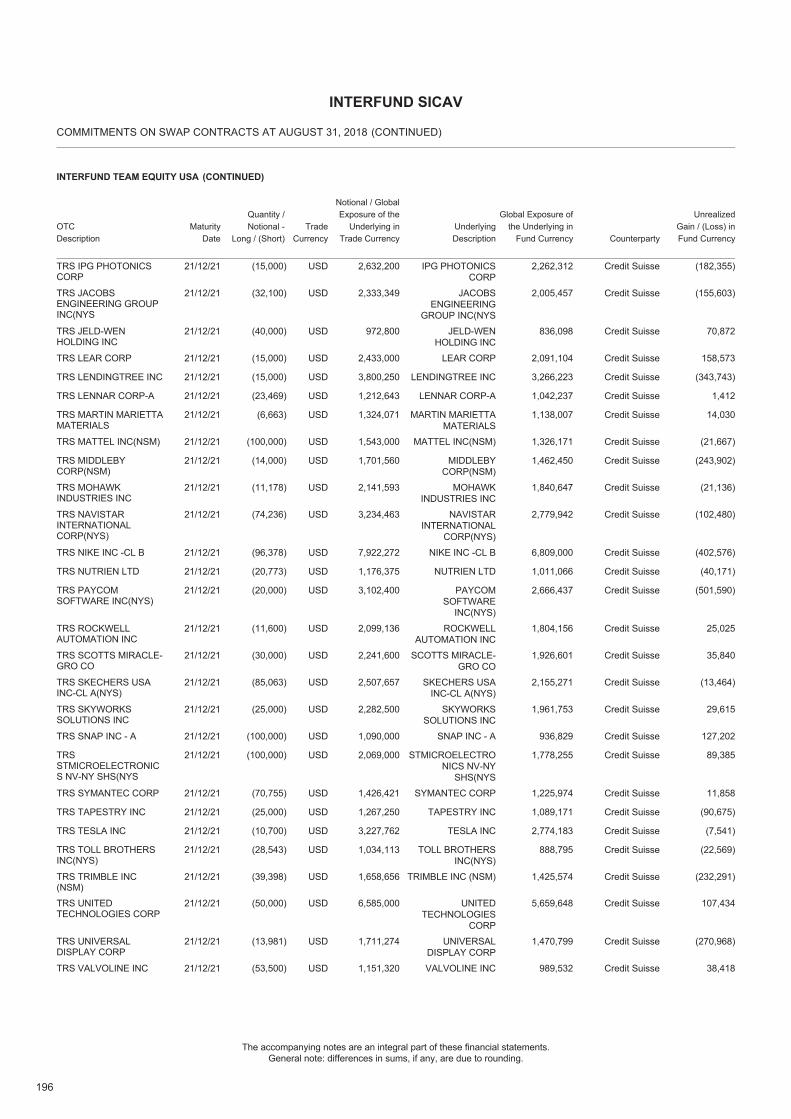
196
The accompanying notes are an integral part of these financial statements.General note: differences in sums, if any, are due to rounding.
COMMITMENTS ON SWAP CONTRACTS AT AUGUST 31, 2018
INTERFUND SICAV
(CONTINUED)
INTERFUND TEAM EQUITY USA
OTCDescription
Quantity /Notional -
Long / (Short)Trade
Currency
Notional / GlobalExposure of the
Underlying inTrade Currency
Global Exposure ofthe Underlying in
Fund CurrencyMaturity
DateUnderlyingDescription Counterparty
UnrealizedGain / (Loss) inFund Currency
(CONTINUED)
TRS IPG PHOTONICSCORP
21/12/21 USD(15,000) 2,632,200 IPG PHOTONICSCORP
2,262,312 Credit Suisse (182,355)
TRS JACOBSENGINEERING GROUPINC(NYS
21/12/21 USD(32,100) 2,333,349 JACOBSENGINEERING
GROUP INC(NYS
2,005,457 Credit Suisse (155,603)
TRS JELD-WENHOLDING INC
21/12/21 USD(40,000) 972,800 JELD-WENHOLDING INC
836,098 Credit Suisse 70,872
TRS LEAR CORP 21/12/21 USD(15,000) 2,433,000 LEAR CORP 2,091,104 Credit Suisse 158,573
TRS LENDINGTREE INC 21/12/21 USD(15,000) 3,800,250 LENDINGTREE INC 3,266,223 Credit Suisse (343,743)
TRS LENNAR CORP-A 21/12/21 USD(23,469) 1,212,643 LENNAR CORP-A 1,042,237 Credit Suisse 1,412
TRS MARTIN MARIETTAMATERIALS
21/12/21 USD(6,663) 1,324,071 MARTIN MARIETTAMATERIALS
1,138,007 Credit Suisse 14,030
TRS MATTEL INC(NSM) 21/12/21 USD(100,000) 1,543,000 MATTEL INC(NSM) 1,326,171 Credit Suisse (21,667)
TRS MIDDLEBYCORP(NSM)
21/12/21 USD(14,000) 1,701,560 MIDDLEBYCORP(NSM)
1,462,450 Credit Suisse (243,902)
TRS MOHAWKINDUSTRIES INC
21/12/21 USD(11,178) 2,141,593 MOHAWKINDUSTRIES INC
1,840,647 Credit Suisse (21,136)
TRS NAVISTARINTERNATIONALCORP(NYS)
21/12/21 USD(74,236) 3,234,463 NAVISTARINTERNATIONAL
CORP(NYS)
2,779,942 Credit Suisse (102,480)
TRS NIKE INC -CL B 21/12/21 USD(96,378) 7,922,272 NIKE INC -CL B 6,809,000 Credit Suisse (402,576)
TRS NUTRIEN LTD 21/12/21 USD(20,773) 1,176,375 NUTRIEN LTD 1,011,066 Credit Suisse (40,171)
TRS PAYCOMSOFTWARE INC(NYS)
21/12/21 USD(20,000) 3,102,400 PAYCOMSOFTWARE
INC(NYS)
2,666,437 Credit Suisse (501,590)
TRS ROCKWELLAUTOMATION INC
21/12/21 USD(11,600) 2,099,136 ROCKWELLAUTOMATION INC
1,804,156 Credit Suisse 25,025
TRS SCOTTS MIRACLE-GRO CO
21/12/21 USD(30,000) 2,241,600 SCOTTS MIRACLE-GRO CO
1,926,601 Credit Suisse 35,840
TRS SKECHERS USAINC-CL A(NYS)
21/12/21 USD(85,063) 2,507,657 SKECHERS USAINC-CL A(NYS)
2,155,271 Credit Suisse (13,464)
TRS SKYWORKSSOLUTIONS INC
21/12/21 USD(25,000) 2,282,500 SKYWORKSSOLUTIONS INC
1,961,753 Credit Suisse 29,615
TRS SNAP INC - A 21/12/21 USD(100,000) 1,090,000 SNAP INC - A 936,829 Credit Suisse 127,202
TRSSTMICROELECTRONICS NV-NY SHS(NYS
21/12/21 USD(100,000) 2,069,000 STMICROELECTRONICS NV-NY
SHS(NYS
1,778,255 Credit Suisse 89,385
TRS SYMANTEC CORP 21/12/21 USD(70,755) 1,426,421 SYMANTEC CORP 1,225,974 Credit Suisse 11,858
TRS TAPESTRY INC 21/12/21 USD(25,000) 1,267,250 TAPESTRY INC 1,089,171 Credit Suisse (90,675)
TRS TESLA INC 21/12/21 USD(10,700) 3,227,762 TESLA INC 2,774,183 Credit Suisse (7,541)
TRS TOLL BROTHERSINC(NYS)
21/12/21 USD(28,543) 1,034,113 TOLL BROTHERSINC(NYS)
888,795 Credit Suisse (22,569)
TRS TRIMBLE INC(NSM)
21/12/21 USD(39,398) 1,658,656 TRIMBLE INC (NSM) 1,425,574 Credit Suisse (232,291)
TRS UNITEDTECHNOLOGIES CORP
21/12/21 USD(50,000) 6,585,000 UNITEDTECHNOLOGIES
CORP
5,659,648 Credit Suisse 107,434
TRS UNIVERSALDISPLAY CORP
21/12/21 USD(13,981) 1,711,274 UNIVERSALDISPLAY CORP
1,470,799 Credit Suisse (270,968)
TRS VALVOLINE INC 21/12/21 USD(53,500) 1,151,320 VALVOLINE INC 989,532 Credit Suisse 38,418
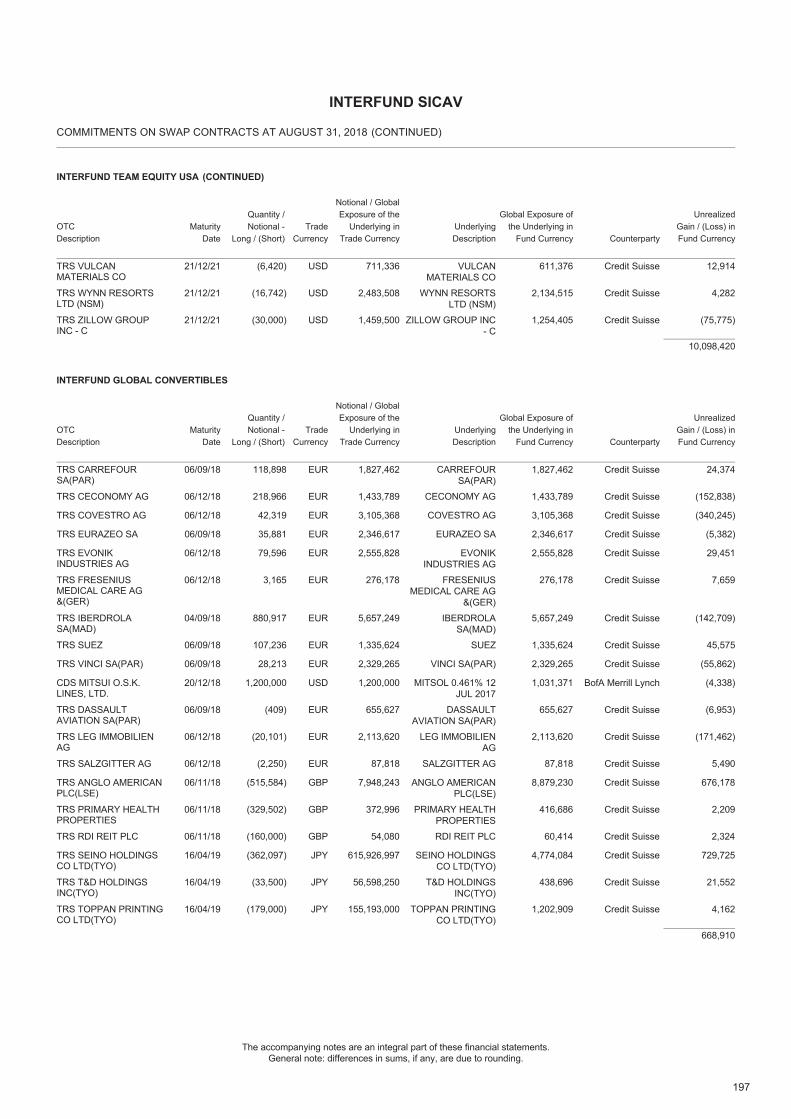
197
The accompanying notes are an integral part of these financial statements.General note: differences in sums, if any, are due to rounding.
COMMITMENTS ON SWAP CONTRACTS AT AUGUST 31, 2018
INTERFUND SICAV
(CONTINUED)
INTERFUND TEAM EQUITY USA
OTCDescription
Quantity /Notional -
Long / (Short)Trade
Currency
Notional / GlobalExposure of the
Underlying inTrade Currency
Global Exposure ofthe Underlying in
Fund CurrencyMaturity
DateUnderlyingDescription Counterparty
UnrealizedGain / (Loss) inFund Currency
(CONTINUED)
TRS VULCANMATERIALS CO
21/12/21 USD(6,420) 711,336 VULCANMATERIALS CO
611,376 Credit Suisse 12,914
TRS WYNN RESORTSLTD (NSM)
21/12/21 USD(16,742) 2,483,508 WYNN RESORTSLTD (NSM)
2,134,515 Credit Suisse 4,282
TRS ZILLOW GROUPINC - C
21/12/21 USD(30,000) 1,459,500 ZILLOW GROUP INC- C
1,254,405 Credit Suisse (75,775)
10,098,420
INTERFUND GLOBAL CONVERTIBLES
OTCDescription
Quantity /Notional -
Long / (Short)Trade
Currency
Notional / GlobalExposure of the
Underlying inTrade Currency
Global Exposure ofthe Underlying in
Fund CurrencyMaturity
DateUnderlyingDescription Counterparty
UnrealizedGain / (Loss) inFund Currency
TRS CARREFOURSA(PAR)
06/09/18 EUR118,898 1,827,462 CARREFOURSA(PAR)
1,827,462 Credit Suisse 24,374
TRS CECONOMY AG 06/12/18 EUR218,966 1,433,789 CECONOMY AG 1,433,789 Credit Suisse (152,838)
TRS COVESTRO AG 06/12/18 EUR42,319 3,105,368 COVESTRO AG 3,105,368 Credit Suisse (340,245)
TRS EURAZEO SA 06/09/18 EUR35,881 2,346,617 EURAZEO SA 2,346,617 Credit Suisse (5,382)
TRS EVONIKINDUSTRIES AG
06/12/18 EUR79,596 2,555,828 EVONIKINDUSTRIES AG
2,555,828 Credit Suisse 29,451
TRS FRESENIUSMEDICAL CARE AG&(GER)
06/12/18 EUR3,165 276,178 FRESENIUSMEDICAL CARE AG
&(GER)
276,178 Credit Suisse 7,659
TRS IBERDROLASA(MAD)
04/09/18 EUR880,917 5,657,249 IBERDROLASA(MAD)
5,657,249 Credit Suisse (142,709)
TRS SUEZ 06/09/18 EUR107,236 1,335,624 SUEZ 1,335,624 Credit Suisse 45,575
TRS VINCI SA(PAR) 06/09/18 EUR28,213 2,329,265 VINCI SA(PAR) 2,329,265 Credit Suisse (55,862)
CDS MITSUI O.S.K.LINES, LTD.
20/12/18 USD1,200,000 1,200,000 MITSOL 0.461% 12JUL 2017
1,031,371 BofA Merrill Lynch (4,338)
TRS DASSAULTAVIATION SA(PAR)
06/09/18 EUR(409) 655,627 DASSAULTAVIATION SA(PAR)
655,627 Credit Suisse (6,953)
TRS LEG IMMOBILIENAG
06/12/18 EUR(20,101) 2,113,620 LEG IMMOBILIENAG
2,113,620 Credit Suisse (171,462)
TRS SALZGITTER AG 06/12/18 EUR(2,250) 87,818 SALZGITTER AG 87,818 Credit Suisse 5,490
TRS ANGLO AMERICANPLC(LSE)
06/11/18 GBP(515,584) 7,948,243 ANGLO AMERICANPLC(LSE)
8,879,230 Credit Suisse 676,178
TRS PRIMARY HEALTHPROPERTIES
06/11/18 GBP(329,502) 372,996 PRIMARY HEALTHPROPERTIES
416,686 Credit Suisse 2,209
TRS RDI REIT PLC 06/11/18 GBP(160,000) 54,080 RDI REIT PLC 60,414 Credit Suisse 2,324
TRS SEINO HOLDINGSCO LTD(TYO)
16/04/19 JPY(362,097) 615,926,997 SEINO HOLDINGSCO LTD(TYO)
4,774,084 Credit Suisse 729,725
TRS T&D HOLDINGSINC(TYO)
16/04/19 JPY(33,500) 56,598,250 T&D HOLDINGSINC(TYO)
438,696 Credit Suisse 21,552
TRS TOPPAN PRINTINGCO LTD(TYO)
16/04/19 JPY(179,000) 155,193,000 TOPPAN PRINTINGCO LTD(TYO)
1,202,909 Credit Suisse 4,162
668,910
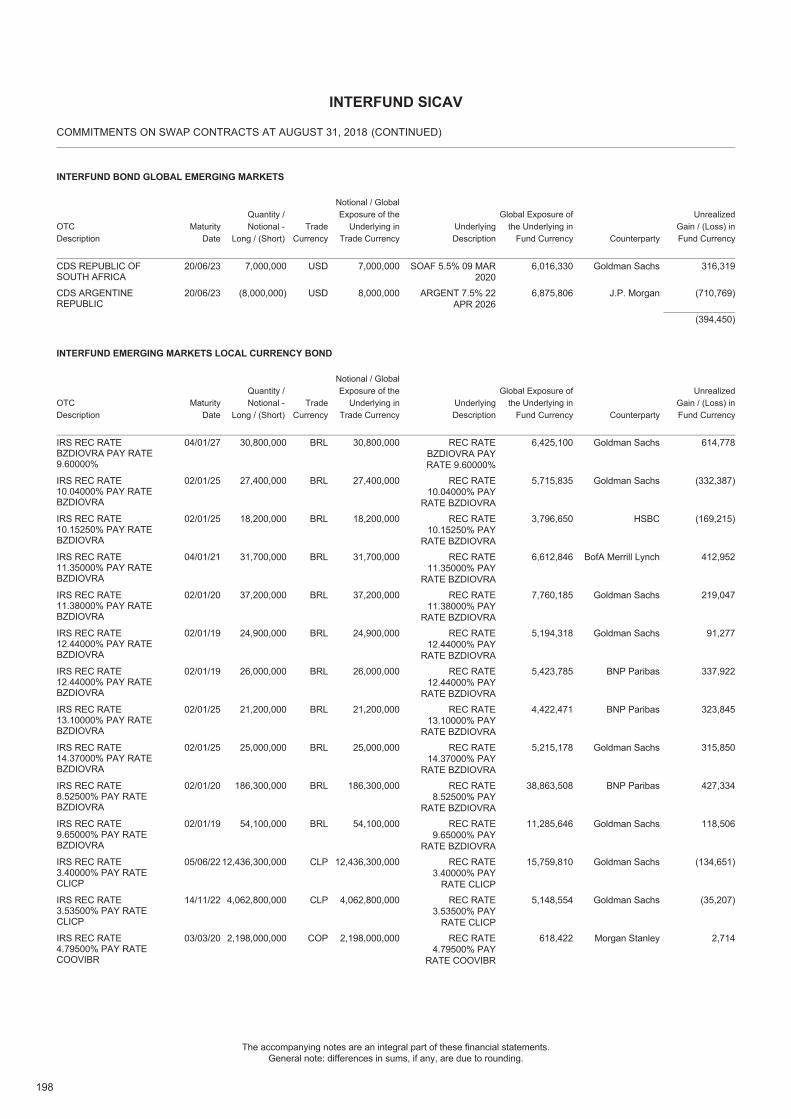
198
The accompanying notes are an integral part of these financial statements.General note: differences in sums, if any, are due to rounding.
COMMITMENTS ON SWAP CONTRACTS AT AUGUST 31, 2018
INTERFUND SICAV
(CONTINUED)
INTERFUND BOND GLOBAL EMERGING MARKETS
OTCDescription
Quantity /Notional -
Long / (Short)Trade
Currency
Notional / GlobalExposure of the
Underlying inTrade Currency
Global Exposure ofthe Underlying in
Fund CurrencyMaturity
DateUnderlyingDescription Counterparty
UnrealizedGain / (Loss) inFund Currency
CDS REPUBLIC OFSOUTH AFRICA
20/06/23 USD7,000,000 7,000,000 SOAF 5.5% 09 MAR2020
6,016,330 Goldman Sachs 316,319
CDS ARGENTINEREPUBLIC
20/06/23 USD(8,000,000) 8,000,000 ARGENT 7.5% 22APR 2026
6,875,806 J.P. Morgan (710,769)
(394,450)
INTERFUND EMERGING MARKETS LOCAL CURRENCY BOND
OTCDescription
Quantity /Notional -
Long / (Short)Trade
Currency
Notional / GlobalExposure of the
Underlying inTrade Currency
Global Exposure ofthe Underlying in
Fund CurrencyMaturity
DateUnderlyingDescription Counterparty
UnrealizedGain / (Loss) inFund Currency
IRS REC RATEBZDIOVRA PAY RATE9.60000%
04/01/27 BRL30,800,000 30,800,000 REC RATEBZDIOVRA PAYRATE 9.60000%
6,425,100 Goldman Sachs 614,778
IRS REC RATE10.04000% PAY RATEBZDIOVRA
02/01/25 BRL27,400,000 27,400,000 REC RATE10.04000% PAY
RATE BZDIOVRA
5,715,835 Goldman Sachs (332,387)
IRS REC RATE10.15250% PAY RATEBZDIOVRA
02/01/25 BRL18,200,000 18,200,000 REC RATE10.15250% PAY
RATE BZDIOVRA
3,796,650 HSBC (169,215)
IRS REC RATE11.35000% PAY RATEBZDIOVRA
04/01/21 BRL31,700,000 31,700,000 REC RATE11.35000% PAY
RATE BZDIOVRA
6,612,846 BofA Merrill Lynch 412,952
IRS REC RATE11.38000% PAY RATEBZDIOVRA
02/01/20 BRL37,200,000 37,200,000 REC RATE11.38000% PAY
RATE BZDIOVRA
7,760,185 Goldman Sachs 219,047
IRS REC RATE12.44000% PAY RATEBZDIOVRA
02/01/19 BRL24,900,000 24,900,000 REC RATE12.44000% PAY
RATE BZDIOVRA
5,194,318 Goldman Sachs 91,277
IRS REC RATE12.44000% PAY RATEBZDIOVRA
02/01/19 BRL26,000,000 26,000,000 REC RATE12.44000% PAY
RATE BZDIOVRA
5,423,785 BNP Paribas 337,922
IRS REC RATE13.10000% PAY RATEBZDIOVRA
02/01/25 BRL21,200,000 21,200,000 REC RATE13.10000% PAY
RATE BZDIOVRA
4,422,471 BNP Paribas 323,845
IRS REC RATE14.37000% PAY RATEBZDIOVRA
02/01/25 BRL25,000,000 25,000,000 REC RATE14.37000% PAY
RATE BZDIOVRA
5,215,178 Goldman Sachs 315,850
IRS REC RATE8.52500% PAY RATEBZDIOVRA
02/01/20 BRL186,300,000 186,300,000 REC RATE8.52500% PAY
RATE BZDIOVRA
38,863,508 BNP Paribas 427,334
IRS REC RATE9.65000% PAY RATEBZDIOVRA
02/01/19 BRL54,100,000 54,100,000 REC RATE9.65000% PAY
RATE BZDIOVRA
11,285,646 Goldman Sachs 118,506
IRS REC RATE3.40000% PAY RATECLICP
05/06/22 CLP12,436,300,000 12,436,300,000 REC RATE3.40000% PAY
RATE CLICP
15,759,810 Goldman Sachs (134,651)
IRS REC RATE3.53500% PAY RATECLICP
14/11/22 CLP4,062,800,000 4,062,800,000 REC RATE3.53500% PAY
RATE CLICP
5,148,554 Goldman Sachs (35,207)
IRS REC RATE4.79500% PAY RATECOOVIBR
03/03/20 COP2,198,000,000 2,198,000,000 REC RATE4.79500% PAY
RATE COOVIBR
618,422 Morgan Stanley 2,714
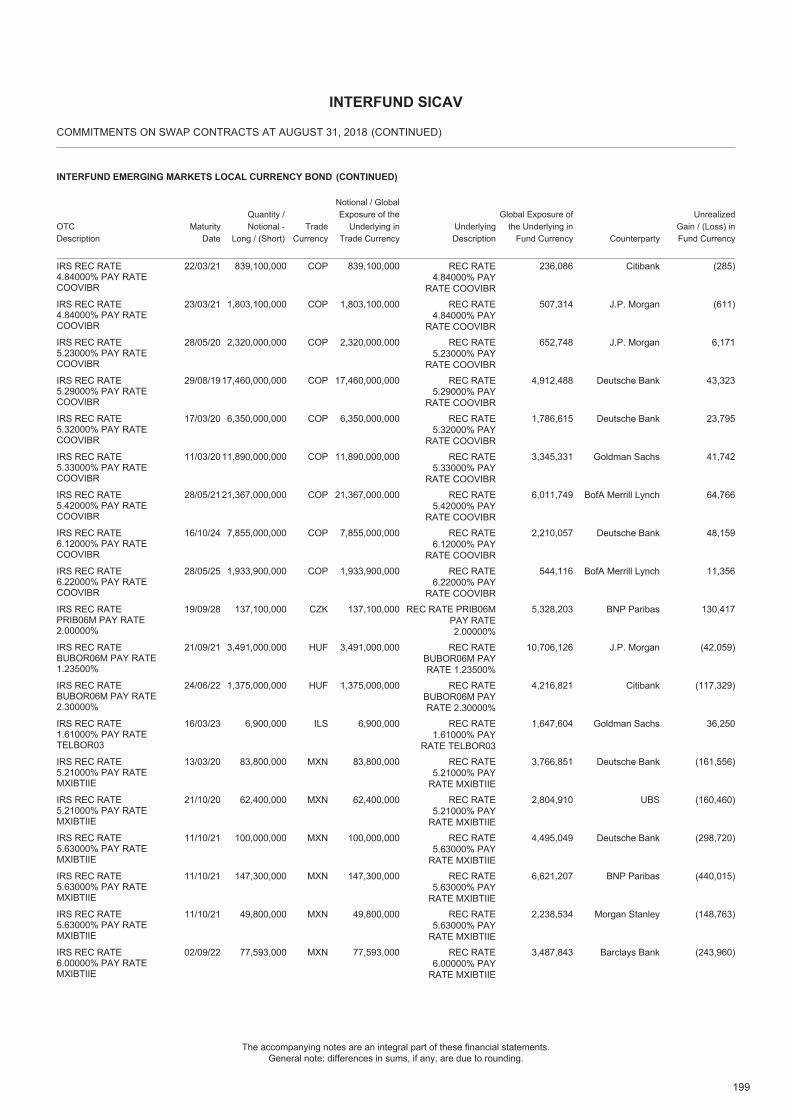
199
The accompanying notes are an integral part of these financial statements.General note: differences in sums, if any, are due to rounding.
COMMITMENTS ON SWAP CONTRACTS AT AUGUST 31, 2018
INTERFUND SICAV
(CONTINUED)
INTERFUND EMERGING MARKETS LOCAL CURRENCY BOND
OTCDescription
Quantity /Notional -
Long / (Short)Trade
Currency
Notional / GlobalExposure of the
Underlying inTrade Currency
Global Exposure ofthe Underlying in
Fund CurrencyMaturity
DateUnderlyingDescription Counterparty
UnrealizedGain / (Loss) inFund Currency
(CONTINUED)
IRS REC RATE4.84000% PAY RATECOOVIBR
22/03/21 COP839,100,000 839,100,000 REC RATE4.84000% PAY
RATE COOVIBR
236,086 Citibank (285)
IRS REC RATE4.84000% PAY RATECOOVIBR
23/03/21 COP1,803,100,000 1,803,100,000 REC RATE4.84000% PAY
RATE COOVIBR
507,314 J.P. Morgan (611)
IRS REC RATE5.23000% PAY RATECOOVIBR
28/05/20 COP2,320,000,000 2,320,000,000 REC RATE5.23000% PAY
RATE COOVIBR
652,748 J.P. Morgan 6,171
IRS REC RATE5.29000% PAY RATECOOVIBR
29/08/19 COP17,460,000,000 17,460,000,000 REC RATE5.29000% PAY
RATE COOVIBR
4,912,488 Deutsche Bank 43,323
IRS REC RATE5.32000% PAY RATECOOVIBR
17/03/20 COP6,350,000,000 6,350,000,000 REC RATE5.32000% PAY
RATE COOVIBR
1,786,615 Deutsche Bank 23,795
IRS REC RATE5.33000% PAY RATECOOVIBR
11/03/20 COP11,890,000,000 11,890,000,000 REC RATE5.33000% PAY
RATE COOVIBR
3,345,331 Goldman Sachs 41,742
IRS REC RATE5.42000% PAY RATECOOVIBR
28/05/21 COP21,367,000,000 21,367,000,000 REC RATE5.42000% PAY
RATE COOVIBR
6,011,749 BofA Merrill Lynch 64,766
IRS REC RATE6.12000% PAY RATECOOVIBR
16/10/24 COP7,855,000,000 7,855,000,000 REC RATE6.12000% PAY
RATE COOVIBR
2,210,057 Deutsche Bank 48,159
IRS REC RATE6.22000% PAY RATECOOVIBR
28/05/25 COP1,933,900,000 1,933,900,000 REC RATE6.22000% PAY
RATE COOVIBR
544,116 BofA Merrill Lynch 11,356
IRS REC RATEPRIB06M PAY RATE2.00000%
19/09/28 CZK137,100,000 137,100,000 REC RATE PRIB06MPAY RATE2.00000%
5,328,203 BNP Paribas 130,417
IRS REC RATEBUBOR06M PAY RATE1.23500%
21/09/21 HUF3,491,000,000 3,491,000,000 REC RATEBUBOR06M PAYRATE 1.23500%
10,706,126 J.P. Morgan (42,059)
IRS REC RATEBUBOR06M PAY RATE2.30000%
24/06/22 HUF1,375,000,000 1,375,000,000 REC RATEBUBOR06M PAYRATE 2.30000%
4,216,821 Citibank (117,329)
IRS REC RATE1.61000% PAY RATETELBOR03
16/03/23 ILS6,900,000 6,900,000 REC RATE1.61000% PAY
RATE TELBOR03
1,647,604 Goldman Sachs 36,250
IRS REC RATE5.21000% PAY RATEMXIBTIIE
13/03/20 MXN83,800,000 83,800,000 REC RATE5.21000% PAY
RATE MXIBTIIE
3,766,851 Deutsche Bank (161,556)
IRS REC RATE5.21000% PAY RATEMXIBTIIE
21/10/20 MXN62,400,000 62,400,000 REC RATE5.21000% PAY
RATE MXIBTIIE
2,804,910 UBS (160,460)
IRS REC RATE5.63000% PAY RATEMXIBTIIE
11/10/21 MXN100,000,000 100,000,000 REC RATE5.63000% PAY
RATE MXIBTIIE
4,495,049 Deutsche Bank (298,720)
IRS REC RATE5.63000% PAY RATEMXIBTIIE
11/10/21 MXN147,300,000 147,300,000 REC RATE5.63000% PAY
RATE MXIBTIIE
6,621,207 BNP Paribas (440,015)
IRS REC RATE5.63000% PAY RATEMXIBTIIE
11/10/21 MXN49,800,000 49,800,000 REC RATE5.63000% PAY
RATE MXIBTIIE
2,238,534 Morgan Stanley (148,763)
IRS REC RATE6.00000% PAY RATEMXIBTIIE
02/09/22 MXN77,593,000 77,593,000 REC RATE6.00000% PAY
RATE MXIBTIIE
3,487,843 Barclays Bank (243,960)
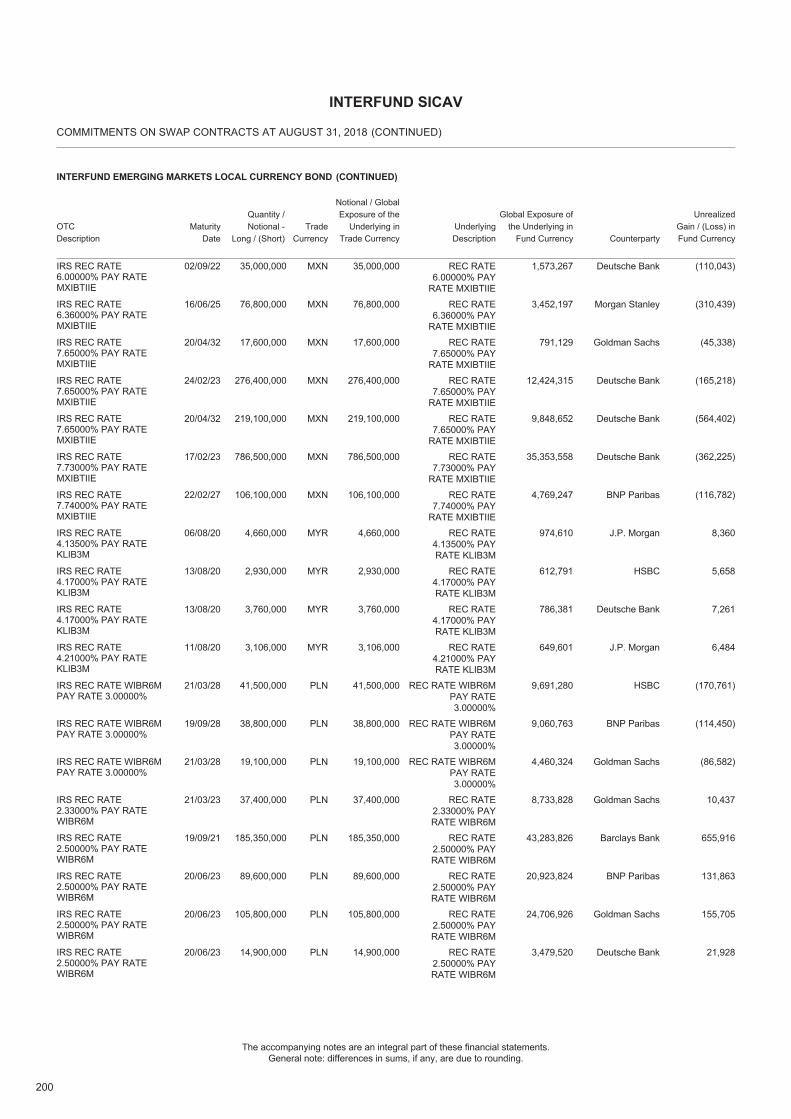
200
The accompanying notes are an integral part of these financial statements.General note: differences in sums, if any, are due to rounding.
COMMITMENTS ON SWAP CONTRACTS AT AUGUST 31, 2018
INTERFUND SICAV
(CONTINUED)
INTERFUND EMERGING MARKETS LOCAL CURRENCY BOND
OTCDescription
Quantity /Notional -
Long / (Short)Trade
Currency
Notional / GlobalExposure of the
Underlying inTrade Currency
Global Exposure ofthe Underlying in
Fund CurrencyMaturity
DateUnderlyingDescription Counterparty
UnrealizedGain / (Loss) inFund Currency
(CONTINUED)
IRS REC RATE6.00000% PAY RATEMXIBTIIE
02/09/22 MXN35,000,000 35,000,000 REC RATE6.00000% PAY
RATE MXIBTIIE
1,573,267 Deutsche Bank (110,043)
IRS REC RATE6.36000% PAY RATEMXIBTIIE
16/06/25 MXN76,800,000 76,800,000 REC RATE6.36000% PAY
RATE MXIBTIIE
3,452,197 Morgan Stanley (310,439)
IRS REC RATE7.65000% PAY RATEMXIBTIIE
20/04/32 MXN17,600,000 17,600,000 REC RATE7.65000% PAY
RATE MXIBTIIE
791,129 Goldman Sachs (45,338)
IRS REC RATE7.65000% PAY RATEMXIBTIIE
24/02/23 MXN276,400,000 276,400,000 REC RATE7.65000% PAY
RATE MXIBTIIE
12,424,315 Deutsche Bank (165,218)
IRS REC RATE7.65000% PAY RATEMXIBTIIE
20/04/32 MXN219,100,000 219,100,000 REC RATE7.65000% PAY
RATE MXIBTIIE
9,848,652 Deutsche Bank (564,402)
IRS REC RATE7.73000% PAY RATEMXIBTIIE
17/02/23 MXN786,500,000 786,500,000 REC RATE7.73000% PAY
RATE MXIBTIIE
35,353,558 Deutsche Bank (362,225)
IRS REC RATE7.74000% PAY RATEMXIBTIIE
22/02/27 MXN106,100,000 106,100,000 REC RATE7.74000% PAY
RATE MXIBTIIE
4,769,247 BNP Paribas (116,782)
IRS REC RATE4.13500% PAY RATEKLIB3M
06/08/20 MYR4,660,000 4,660,000 REC RATE4.13500% PAYRATE KLIB3M
974,610 J.P. Morgan 8,360
IRS REC RATE4.17000% PAY RATEKLIB3M
13/08/20 MYR2,930,000 2,930,000 REC RATE4.17000% PAYRATE KLIB3M
612,791 HSBC 5,658
IRS REC RATE4.17000% PAY RATEKLIB3M
13/08/20 MYR3,760,000 3,760,000 REC RATE4.17000% PAYRATE KLIB3M
786,381 Deutsche Bank 7,261
IRS REC RATE4.21000% PAY RATEKLIB3M
11/08/20 MYR3,106,000 3,106,000 REC RATE4.21000% PAYRATE KLIB3M
649,601 J.P. Morgan 6,484
IRS REC RATE WIBR6MPAY RATE 3.00000%
21/03/28 PLN41,500,000 41,500,000 REC RATE WIBR6MPAY RATE3.00000%
9,691,280 HSBC (170,761)
IRS REC RATE WIBR6MPAY RATE 3.00000%
19/09/28 PLN38,800,000 38,800,000 REC RATE WIBR6MPAY RATE3.00000%
9,060,763 BNP Paribas (114,450)
IRS REC RATE WIBR6MPAY RATE 3.00000%
21/03/28 PLN19,100,000 19,100,000 REC RATE WIBR6MPAY RATE3.00000%
4,460,324 Goldman Sachs (86,582)
IRS REC RATE2.33000% PAY RATEWIBR6M
21/03/23 PLN37,400,000 37,400,000 REC RATE2.33000% PAYRATE WIBR6M
8,733,828 Goldman Sachs 10,437
IRS REC RATE2.50000% PAY RATEWIBR6M
19/09/21 PLN185,350,000 185,350,000 REC RATE2.50000% PAYRATE WIBR6M
43,283,826 Barclays Bank 655,916
IRS REC RATE2.50000% PAY RATEWIBR6M
20/06/23 PLN89,600,000 89,600,000 REC RATE2.50000% PAYRATE WIBR6M
20,923,824 BNP Paribas 131,863
IRS REC RATE2.50000% PAY RATEWIBR6M
20/06/23 PLN105,800,000 105,800,000 REC RATE2.50000% PAYRATE WIBR6M
24,706,926 Goldman Sachs 155,705
IRS REC RATE2.50000% PAY RATEWIBR6M
20/06/23 PLN14,900,000 14,900,000 REC RATE2.50000% PAYRATE WIBR6M
3,479,520 Deutsche Bank 21,928
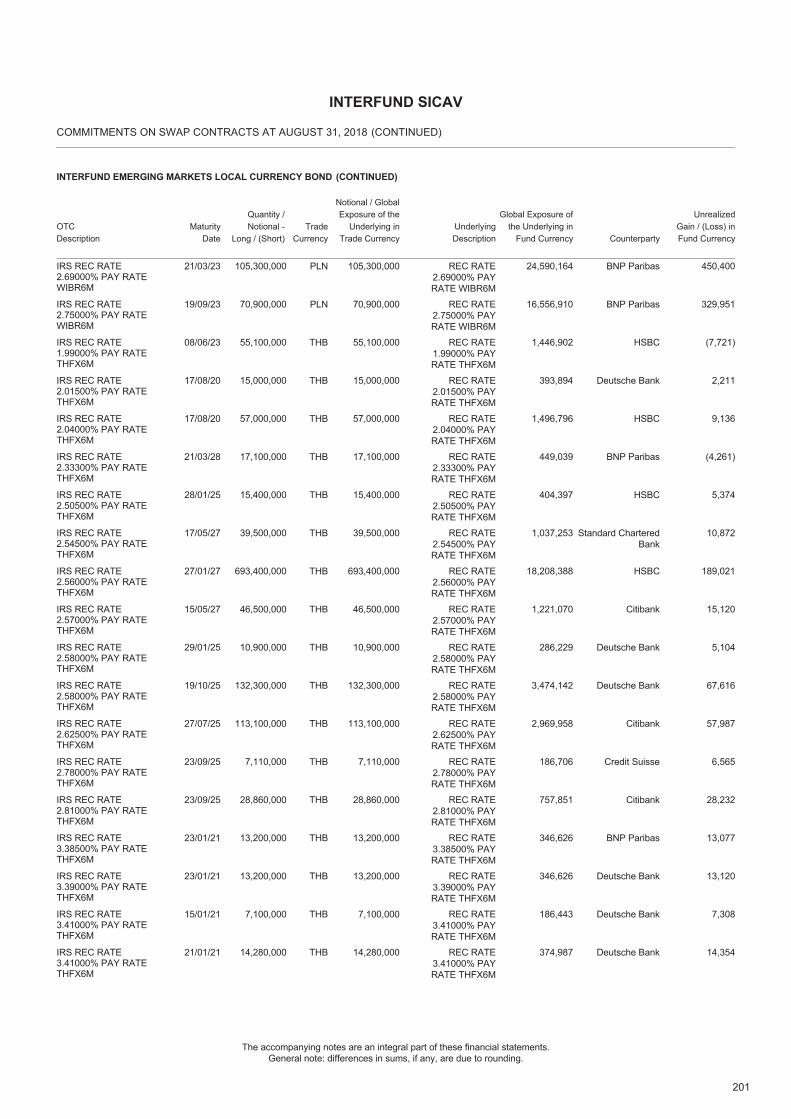
201
The accompanying notes are an integral part of these financial statements.General note: differences in sums, if any, are due to rounding.
COMMITMENTS ON SWAP CONTRACTS AT AUGUST 31, 2018
INTERFUND SICAV
(CONTINUED)
INTERFUND EMERGING MARKETS LOCAL CURRENCY BOND
OTCDescription
Quantity /Notional -
Long / (Short)Trade
Currency
Notional / GlobalExposure of the
Underlying inTrade Currency
Global Exposure ofthe Underlying in
Fund CurrencyMaturity
DateUnderlyingDescription Counterparty
UnrealizedGain / (Loss) inFund Currency
(CONTINUED)
IRS REC RATE2.69000% PAY RATEWIBR6M
21/03/23 PLN105,300,000 105,300,000 REC RATE2.69000% PAYRATE WIBR6M
24,590,164 BNP Paribas 450,400
IRS REC RATE2.75000% PAY RATEWIBR6M
19/09/23 PLN70,900,000 70,900,000 REC RATE2.75000% PAYRATE WIBR6M
16,556,910 BNP Paribas 329,951
IRS REC RATE1.99000% PAY RATETHFX6M
08/06/23 THB55,100,000 55,100,000 REC RATE1.99000% PAYRATE THFX6M
1,446,902 HSBC (7,721)
IRS REC RATE2.01500% PAY RATETHFX6M
17/08/20 THB15,000,000 15,000,000 REC RATE2.01500% PAYRATE THFX6M
393,894 Deutsche Bank 2,211
IRS REC RATE2.04000% PAY RATETHFX6M
17/08/20 THB57,000,000 57,000,000 REC RATE2.04000% PAYRATE THFX6M
1,496,796 HSBC 9,136
IRS REC RATE2.33300% PAY RATETHFX6M
21/03/28 THB17,100,000 17,100,000 REC RATE2.33300% PAYRATE THFX6M
449,039 BNP Paribas (4,261)
IRS REC RATE2.50500% PAY RATETHFX6M
28/01/25 THB15,400,000 15,400,000 REC RATE2.50500% PAYRATE THFX6M
404,397 HSBC 5,374
IRS REC RATE2.54500% PAY RATETHFX6M
17/05/27 THB39,500,000 39,500,000 REC RATE2.54500% PAYRATE THFX6M
1,037,253 Standard CharteredBank
10,872
IRS REC RATE2.56000% PAY RATETHFX6M
27/01/27 THB693,400,000 693,400,000 REC RATE2.56000% PAYRATE THFX6M
18,208,388 HSBC 189,021
IRS REC RATE2.57000% PAY RATETHFX6M
15/05/27 THB46,500,000 46,500,000 REC RATE2.57000% PAYRATE THFX6M
1,221,070 Citibank 15,120
IRS REC RATE2.58000% PAY RATETHFX6M
29/01/25 THB10,900,000 10,900,000 REC RATE2.58000% PAYRATE THFX6M
286,229 Deutsche Bank 5,104
IRS REC RATE2.58000% PAY RATETHFX6M
19/10/25 THB132,300,000 132,300,000 REC RATE2.58000% PAYRATE THFX6M
3,474,142 Deutsche Bank 67,616
IRS REC RATE2.62500% PAY RATETHFX6M
27/07/25 THB113,100,000 113,100,000 REC RATE2.62500% PAYRATE THFX6M
2,969,958 Citibank 57,987
IRS REC RATE2.78000% PAY RATETHFX6M
23/09/25 THB7,110,000 7,110,000 REC RATE2.78000% PAYRATE THFX6M
186,706 Credit Suisse 6,565
IRS REC RATE2.81000% PAY RATETHFX6M
23/09/25 THB28,860,000 28,860,000 REC RATE2.81000% PAYRATE THFX6M
757,851 Citibank 28,232
IRS REC RATE3.38500% PAY RATETHFX6M
23/01/21 THB13,200,000 13,200,000 REC RATE3.38500% PAYRATE THFX6M
346,626 BNP Paribas 13,077
IRS REC RATE3.39000% PAY RATETHFX6M
23/01/21 THB13,200,000 13,200,000 REC RATE3.39000% PAYRATE THFX6M
346,626 Deutsche Bank 13,120
IRS REC RATE3.41000% PAY RATETHFX6M
15/01/21 THB7,100,000 7,100,000 REC RATE3.41000% PAYRATE THFX6M
186,443 Deutsche Bank 7,308
IRS REC RATE3.41000% PAY RATETHFX6M
21/01/21 THB14,280,000 14,280,000 REC RATE3.41000% PAYRATE THFX6M
374,987 Deutsche Bank 14,354
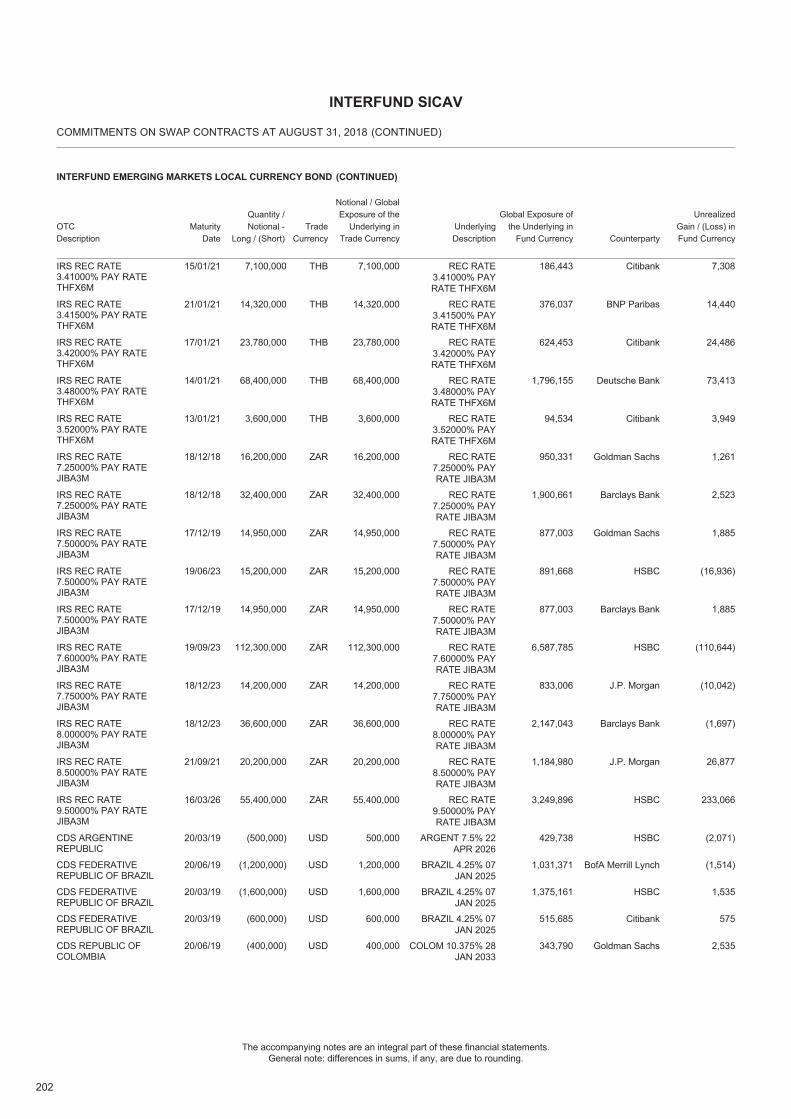
202
The accompanying notes are an integral part of these financial statements.General note: differences in sums, if any, are due to rounding.
COMMITMENTS ON SWAP CONTRACTS AT AUGUST 31, 2018
INTERFUND SICAV
(CONTINUED)
INTERFUND EMERGING MARKETS LOCAL CURRENCY BOND
OTCDescription
Quantity /Notional -
Long / (Short)Trade
Currency
Notional / GlobalExposure of the
Underlying inTrade Currency
Global Exposure ofthe Underlying in
Fund CurrencyMaturity
DateUnderlyingDescription Counterparty
UnrealizedGain / (Loss) inFund Currency
(CONTINUED)
IRS REC RATE3.41000% PAY RATETHFX6M
15/01/21 THB7,100,000 7,100,000 REC RATE3.41000% PAYRATE THFX6M
186,443 Citibank 7,308
IRS REC RATE3.41500% PAY RATETHFX6M
21/01/21 THB14,320,000 14,320,000 REC RATE3.41500% PAYRATE THFX6M
376,037 BNP Paribas 14,440
IRS REC RATE3.42000% PAY RATETHFX6M
17/01/21 THB23,780,000 23,780,000 REC RATE3.42000% PAYRATE THFX6M
624,453 Citibank 24,486
IRS REC RATE3.48000% PAY RATETHFX6M
14/01/21 THB68,400,000 68,400,000 REC RATE3.48000% PAYRATE THFX6M
1,796,155 Deutsche Bank 73,413
IRS REC RATE3.52000% PAY RATETHFX6M
13/01/21 THB3,600,000 3,600,000 REC RATE3.52000% PAYRATE THFX6M
94,534 Citibank 3,949
IRS REC RATE7.25000% PAY RATEJIBA3M
18/12/18 ZAR16,200,000 16,200,000 REC RATE7.25000% PAYRATE JIBA3M
950,331 Goldman Sachs 1,261
IRS REC RATE7.25000% PAY RATEJIBA3M
18/12/18 ZAR32,400,000 32,400,000 REC RATE7.25000% PAYRATE JIBA3M
1,900,661 Barclays Bank 2,523
IRS REC RATE7.50000% PAY RATEJIBA3M
17/12/19 ZAR14,950,000 14,950,000 REC RATE7.50000% PAYRATE JIBA3M
877,003 Goldman Sachs 1,885
IRS REC RATE7.50000% PAY RATEJIBA3M
19/06/23 ZAR15,200,000 15,200,000 REC RATE7.50000% PAYRATE JIBA3M
891,668 HSBC (16,936)
IRS REC RATE7.50000% PAY RATEJIBA3M
17/12/19 ZAR14,950,000 14,950,000 REC RATE7.50000% PAYRATE JIBA3M
877,003 Barclays Bank 1,885
IRS REC RATE7.60000% PAY RATEJIBA3M
19/09/23 ZAR112,300,000 112,300,000 REC RATE7.60000% PAYRATE JIBA3M
6,587,785 HSBC (110,644)
IRS REC RATE7.75000% PAY RATEJIBA3M
18/12/23 ZAR14,200,000 14,200,000 REC RATE7.75000% PAYRATE JIBA3M
833,006 J.P. Morgan (10,042)
IRS REC RATE8.00000% PAY RATEJIBA3M
18/12/23 ZAR36,600,000 36,600,000 REC RATE8.00000% PAYRATE JIBA3M
2,147,043 Barclays Bank (1,697)
IRS REC RATE8.50000% PAY RATEJIBA3M
21/09/21 ZAR20,200,000 20,200,000 REC RATE8.50000% PAYRATE JIBA3M
1,184,980 J.P. Morgan 26,877
IRS REC RATE9.50000% PAY RATEJIBA3M
16/03/26 ZAR55,400,000 55,400,000 REC RATE9.50000% PAYRATE JIBA3M
3,249,896 HSBC 233,066
CDS ARGENTINEREPUBLIC
20/03/19 USD(500,000) 500,000 ARGENT 7.5% 22APR 2026
429,738 HSBC (2,071)
CDS FEDERATIVEREPUBLIC OF BRAZIL
20/06/19 USD(1,200,000) 1,200,000 BRAZIL 4.25% 07JAN 2025
1,031,371 BofA Merrill Lynch (1,514)
CDS FEDERATIVEREPUBLIC OF BRAZIL
20/03/19 USD(1,600,000) 1,600,000 BRAZIL 4.25% 07JAN 2025
1,375,161 HSBC 1,535
CDS FEDERATIVEREPUBLIC OF BRAZIL
20/03/19 USD(600,000) 600,000 BRAZIL 4.25% 07JAN 2025
515,685 Citibank 575
CDS REPUBLIC OFCOLOMBIA
20/06/19 USD(400,000) 400,000 COLOM 10.375% 28JAN 2033
343,790 Goldman Sachs 2,535
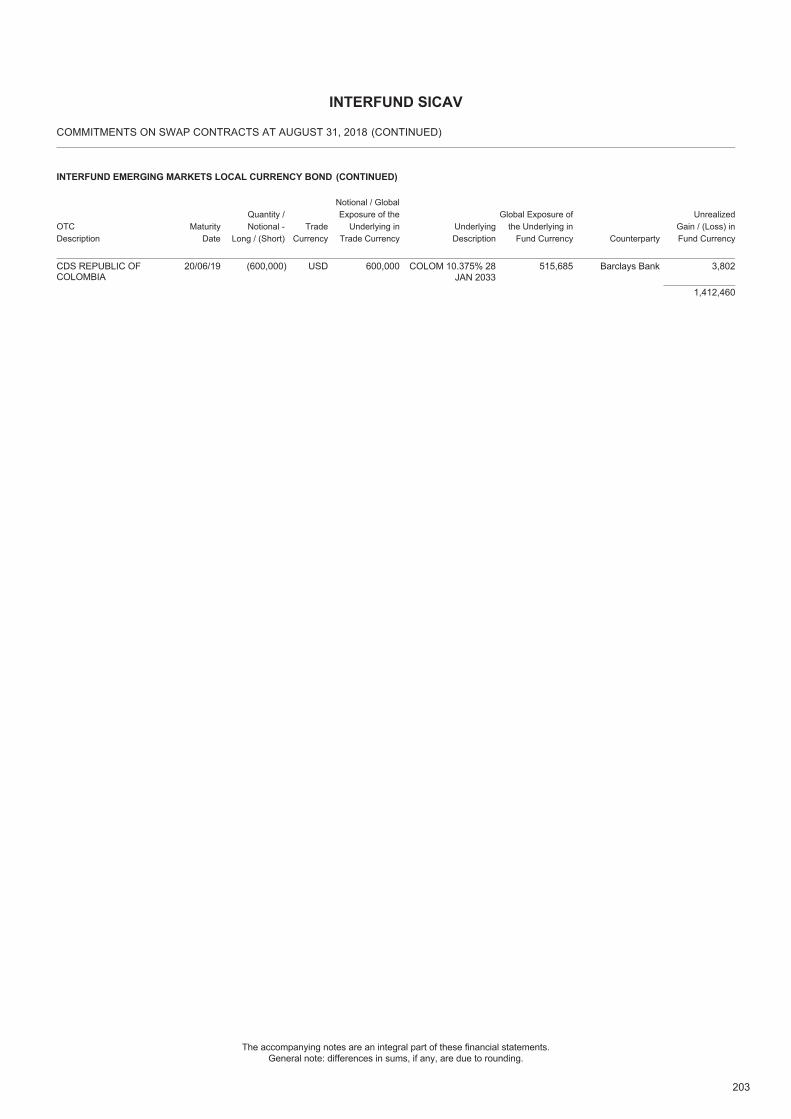
203
The accompanying notes are an integral part of these financial statements.General note: differences in sums, if any, are due to rounding.
COMMITMENTS ON SWAP CONTRACTS AT AUGUST 31, 2018
INTERFUND SICAV
(CONTINUED)
INTERFUND EMERGING MARKETS LOCAL CURRENCY BOND
OTCDescription
Quantity /Notional -
Long / (Short)Trade
Currency
Notional / GlobalExposure of the
Underlying inTrade Currency
Global Exposure ofthe Underlying in
Fund CurrencyMaturity
DateUnderlyingDescription Counterparty
UnrealizedGain / (Loss) inFund Currency
(CONTINUED)
CDS REPUBLIC OFCOLOMBIA
20/06/19 USD(600,000) 600,000 COLOM 10.375% 28JAN 2033
515,685 Barclays Bank 3,802
1,412,460
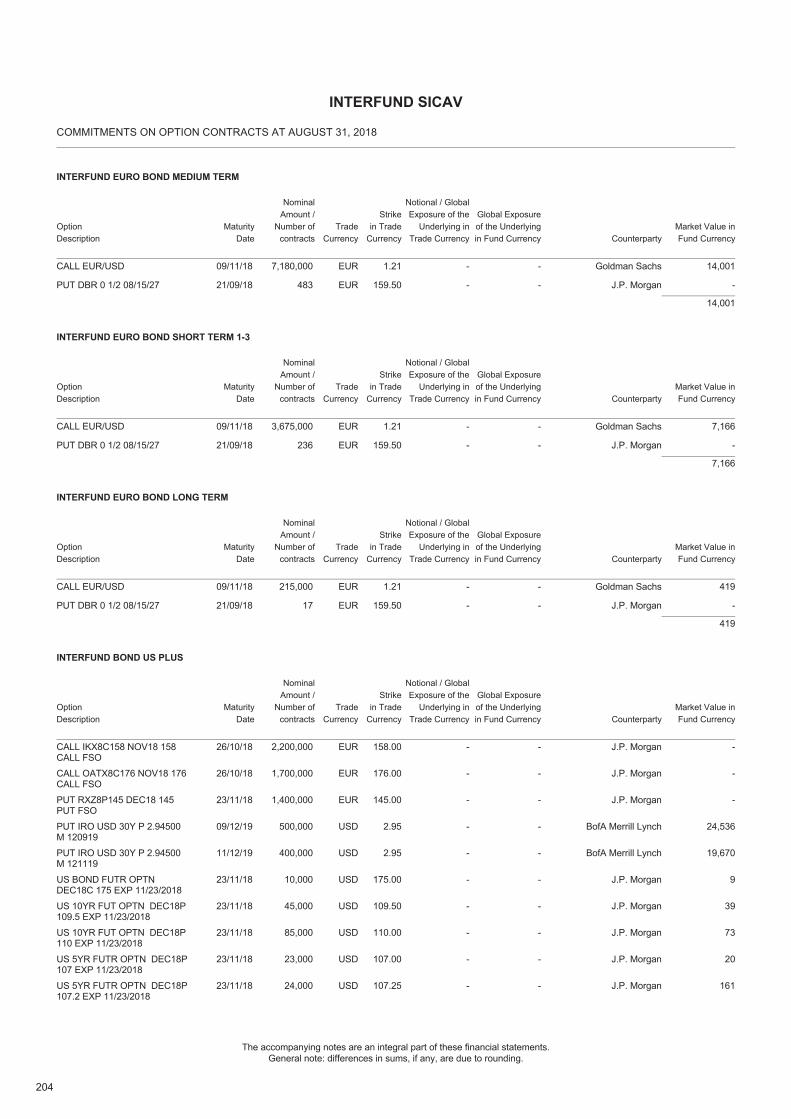
204
The accompanying notes are an integral part of these financial statements.General note: differences in sums, if any, are due to rounding.
COMMITMENTS ON OPTION CONTRACTS AT AUGUST 31, 2018
INTERFUND SICAV
INTERFUND EURO BOND MEDIUM TERM
OptionDescription
NominalAmount /
Number ofcontracts
Strikein Trade
CurrencyTrade
CurrencyMaturity
Date
Notional / GlobalExposure of the
Underlying inTrade Currency
Global Exposureof the Underlyingin Fund Currency Counterparty
Market Value inFund Currency
CALL EUR/USD 7,180,000 1.21EUR09/11/18 - - Goldman Sachs 14,001
PUT DBR 0 1/2 08/15/27 483 159.50EUR21/09/18 - - J.P. Morgan -
14,001
INTERFUND EURO BOND SHORT TERM 1-3
OptionDescription
NominalAmount /
Number ofcontracts
Strikein Trade
CurrencyTrade
CurrencyMaturity
Date
Notional / GlobalExposure of the
Underlying inTrade Currency
Global Exposureof the Underlyingin Fund Currency Counterparty
Market Value inFund Currency
CALL EUR/USD 3,675,000 1.21EUR09/11/18 - - Goldman Sachs 7,166
PUT DBR 0 1/2 08/15/27 236 159.50EUR21/09/18 - - J.P. Morgan -
7,166
INTERFUND EURO BOND LONG TERM
OptionDescription
NominalAmount /
Number ofcontracts
Strikein Trade
CurrencyTrade
CurrencyMaturity
Date
Notional / GlobalExposure of the
Underlying inTrade Currency
Global Exposureof the Underlyingin Fund Currency Counterparty
Market Value inFund Currency
CALL EUR/USD 215,000 1.21EUR09/11/18 - - Goldman Sachs 419
PUT DBR 0 1/2 08/15/27 17 159.50EUR21/09/18 - - J.P. Morgan -
419
INTERFUND BOND US PLUS
OptionDescription
NominalAmount /
Number ofcontracts
Strikein Trade
CurrencyTrade
CurrencyMaturity
Date
Notional / GlobalExposure of the
Underlying inTrade Currency
Global Exposureof the Underlyingin Fund Currency Counterparty
Market Value inFund Currency
CALL IKX8C158 NOV18 158CALL FSO
2,200,000 158.00EUR26/10/18 - - J.P. Morgan -
CALL OATX8C176 NOV18 176CALL FSO
1,700,000 176.00EUR26/10/18 - - J.P. Morgan -
PUT RXZ8P145 DEC18 145PUT FSO
1,400,000 145.00EUR23/11/18 - - J.P. Morgan -
PUT IRO USD 30Y P 2.94500M 120919
500,000 2.95USD09/12/19 - - BofA Merrill Lynch 24,536
PUT IRO USD 30Y P 2.94500M 121119
400,000 2.95USD11/12/19 - - BofA Merrill Lynch 19,670
US BOND FUTR OPTNDEC18C 175 EXP 11/23/2018
10,000 175.00USD23/11/18 - - J.P. Morgan 9
US 10YR FUT OPTN DEC18P109.5 EXP 11/23/2018
45,000 109.50USD23/11/18 - - J.P. Morgan 39
US 10YR FUT OPTN DEC18P110 EXP 11/23/2018
85,000 110.00USD23/11/18 - - J.P. Morgan 73
US 5YR FUTR OPTN DEC18P107 EXP 11/23/2018
23,000 107.00USD23/11/18 - - J.P. Morgan 20
US 5YR FUTR OPTN DEC18P107.2 EXP 11/23/2018
24,000 107.25USD23/11/18 - - J.P. Morgan 161
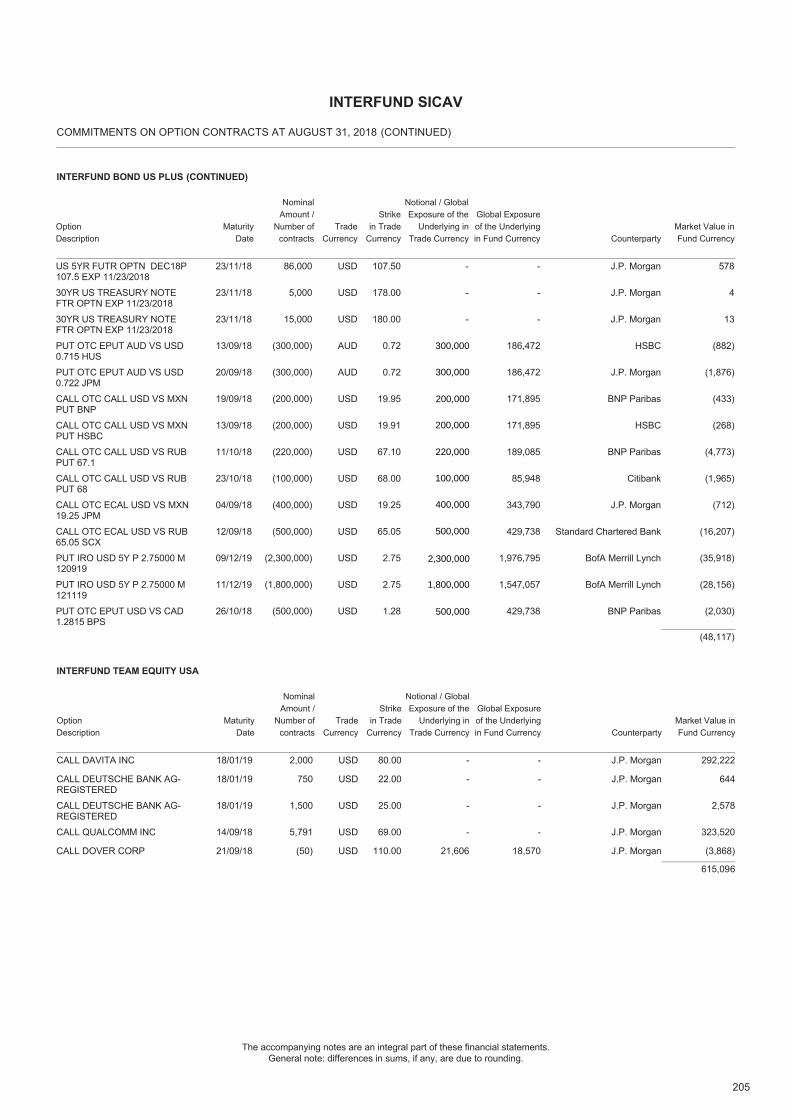
205
The accompanying notes are an integral part of these financial statements.General note: differences in sums, if any, are due to rounding.
COMMITMENTS ON OPTION CONTRACTS AT AUGUST 31, 2018
INTERFUND SICAV
(CONTINUED)
INTERFUND BOND US PLUS
OptionDescription
NominalAmount /
Number ofcontracts
Strikein Trade
CurrencyTrade
CurrencyMaturity
Date
Notional / GlobalExposure of the
Underlying inTrade Currency
Global Exposureof the Underlyingin Fund Currency Counterparty
Market Value inFund Currency
(CONTINUED)
US 5YR FUTR OPTN DEC18P107.5 EXP 11/23/2018
86,000 107.50USD23/11/18 - - J.P. Morgan 578
30YR US TREASURY NOTEFTR OPTN EXP 11/23/2018
5,000 178.00USD23/11/18 - - J.P. Morgan 4
30YR US TREASURY NOTEFTR OPTN EXP 11/23/2018
15,000 180.00USD23/11/18 - - J.P. Morgan 13
PUT OTC EPUT AUD VS USD0.715 HUS
(300,000) 0.72AUD13/09/18 186,472 HSBC (882)
PUT OTC EPUT AUD VS USD0.722 JPM
(300,000) 0.72AUD20/09/18 186,472 J.P. Morgan (1,876)
CALL OTC CALL USD VS MXNPUT BNP
(200,000) 19.95USD19/09/18 171,895 BNP Paribas (433)
CALL OTC CALL USD VS MXNPUT HSBC
(200,000) 19.91USD13/09/18 171,895 HSBC (268)
CALL OTC CALL USD VS RUBPUT 67.1
(220,000) 67.10USD11/10/18 189,085 BNP Paribas (4,773)
CALL OTC CALL USD VS RUBPUT 68
(100,000) 68.00USD23/10/18 85,948 Citibank (1,965)
CALL OTC ECAL USD VS MXN19.25 JPM
(400,000) 19.25USD04/09/18 343,790 J.P. Morgan (712)
CALL OTC ECAL USD VS RUB65.05 SCX
(500,000) 65.05USD12/09/18 429,738 Standard Chartered Bank (16,207)
PUT IRO USD 5Y P 2.75000 M120919
(2,300,000) 2.75USD09/12/19 1,976,795 BofA Merrill Lynch (35,918)
PUT IRO USD 5Y P 2.75000 M121119
(1,800,000) 2.75USD11/12/19 1,547,057 BofA Merrill Lynch (28,156)
PUT OTC EPUT USD VS CAD1.2815 BPS
(500,000) 1.28USD26/10/18 429,738 BNP Paribas (2,030)
(48,117)
INTERFUND TEAM EQUITY USA
OptionDescription
NominalAmount /
Number ofcontracts
Strikein Trade
CurrencyTrade
CurrencyMaturity
Date
Notional / GlobalExposure of the
Underlying inTrade Currency
Global Exposureof the Underlyingin Fund Currency Counterparty
Market Value inFund Currency
CALL DAVITA INC 2,000 80.00USD18/01/19 - - J.P. Morgan 292,222
CALL DEUTSCHE BANK AG-REGISTERED
750 22.00USD18/01/19 - - J.P. Morgan 644
CALL DEUTSCHE BANK AG-REGISTERED
1,500 25.00USD18/01/19 - - J.P. Morgan 2,578
CALL QUALCOMM INC 5,791 69.00USD14/09/18 - - J.P. Morgan 323,520
CALL DOVER CORP (50) 110.00USD21/09/18 21,606 18,570 J.P. Morgan (3,868)
615,096
300,000
300,000
200,000
200,000
220,000
100,000
400,000
500,000
2,300,000
1,800,000
500,000
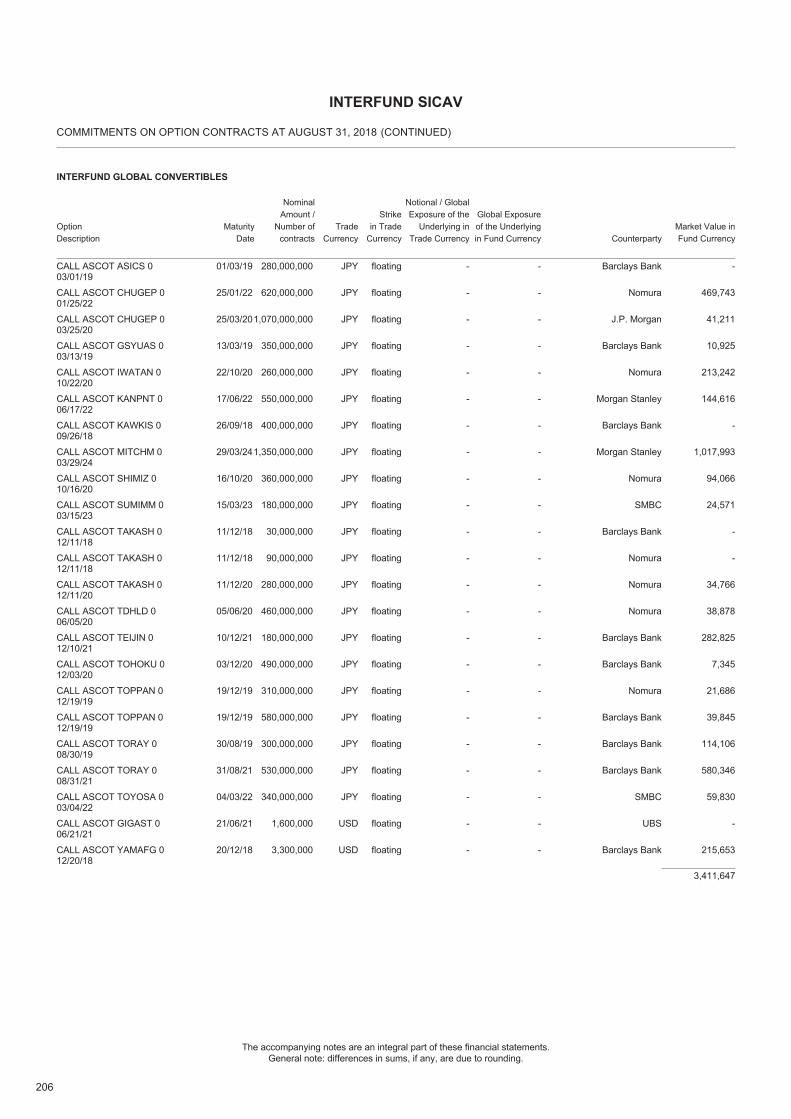
206
The accompanying notes are an integral part of these financial statements.General note: differences in sums, if any, are due to rounding.
COMMITMENTS ON OPTION CONTRACTS AT AUGUST 31, 2018
INTERFUND SICAV
(CONTINUED)
INTERFUND GLOBAL CONVERTIBLES
OptionDescription
NominalAmount /
Number ofcontracts
Strikein Trade
CurrencyTrade
CurrencyMaturity
Date
Notional / GlobalExposure of the
Underlying inTrade Currency
Global Exposureof the Underlyingin Fund Currency Counterparty
Market Value inFund Currency
CALL ASCOT ASICS 003/01/19
280,000,000 floatingJPY01/03/19 - - Barclays Bank -
CALL ASCOT CHUGEP 001/25/22
620,000,000 floatingJPY25/01/22 - - Nomura 469,743
CALL ASCOT CHUGEP 003/25/20
1,070,000,000 floatingJPY25/03/20 - - J.P. Morgan 41,211
CALL ASCOT GSYUAS 003/13/19
350,000,000 floatingJPY13/03/19 - - Barclays Bank 10,925
CALL ASCOT IWATAN 010/22/20
260,000,000 floatingJPY22/10/20 - - Nomura 213,242
CALL ASCOT KANPNT 006/17/22
550,000,000 floatingJPY17/06/22 - - Morgan Stanley 144,616
CALL ASCOT KAWKIS 009/26/18
400,000,000 floatingJPY26/09/18 - - Barclays Bank -
CALL ASCOT MITCHM 003/29/24
1,350,000,000 floatingJPY29/03/24 - - Morgan Stanley 1,017,993
CALL ASCOT SHIMIZ 010/16/20
360,000,000 floatingJPY16/10/20 - - Nomura 94,066
CALL ASCOT SUMIMM 003/15/23
180,000,000 floatingJPY15/03/23 - - SMBC 24,571
CALL ASCOT TAKASH 012/11/18
30,000,000 floatingJPY11/12/18 - - Barclays Bank -
CALL ASCOT TAKASH 012/11/18
90,000,000 floatingJPY11/12/18 - - Nomura -
CALL ASCOT TAKASH 012/11/20
280,000,000 floatingJPY11/12/20 - - Nomura 34,766
CALL ASCOT TDHLD 006/05/20
460,000,000 floatingJPY05/06/20 - - Nomura 38,878
CALL ASCOT TEIJIN 012/10/21
180,000,000 floatingJPY10/12/21 - - Barclays Bank 282,825
CALL ASCOT TOHOKU 012/03/20
490,000,000 floatingJPY03/12/20 - - Barclays Bank 7,345
CALL ASCOT TOPPAN 012/19/19
310,000,000 floatingJPY19/12/19 - - Nomura 21,686
CALL ASCOT TOPPAN 012/19/19
580,000,000 floatingJPY19/12/19 - - Barclays Bank 39,845
CALL ASCOT TORAY 008/30/19
300,000,000 floatingJPY30/08/19 - - Barclays Bank 114,106
CALL ASCOT TORAY 008/31/21
530,000,000 floatingJPY31/08/21 - - Barclays Bank 580,346
CALL ASCOT TOYOSA 003/04/22
340,000,000 floatingJPY04/03/22 - - SMBC 59,830
CALL ASCOT GIGAST 006/21/21
1,600,000 floatingUSD21/06/21 - - UBS -
CALL ASCOT YAMAFG 012/20/18
3,300,000 floatingUSD20/12/18 - - Barclays Bank 215,653
3,411,647
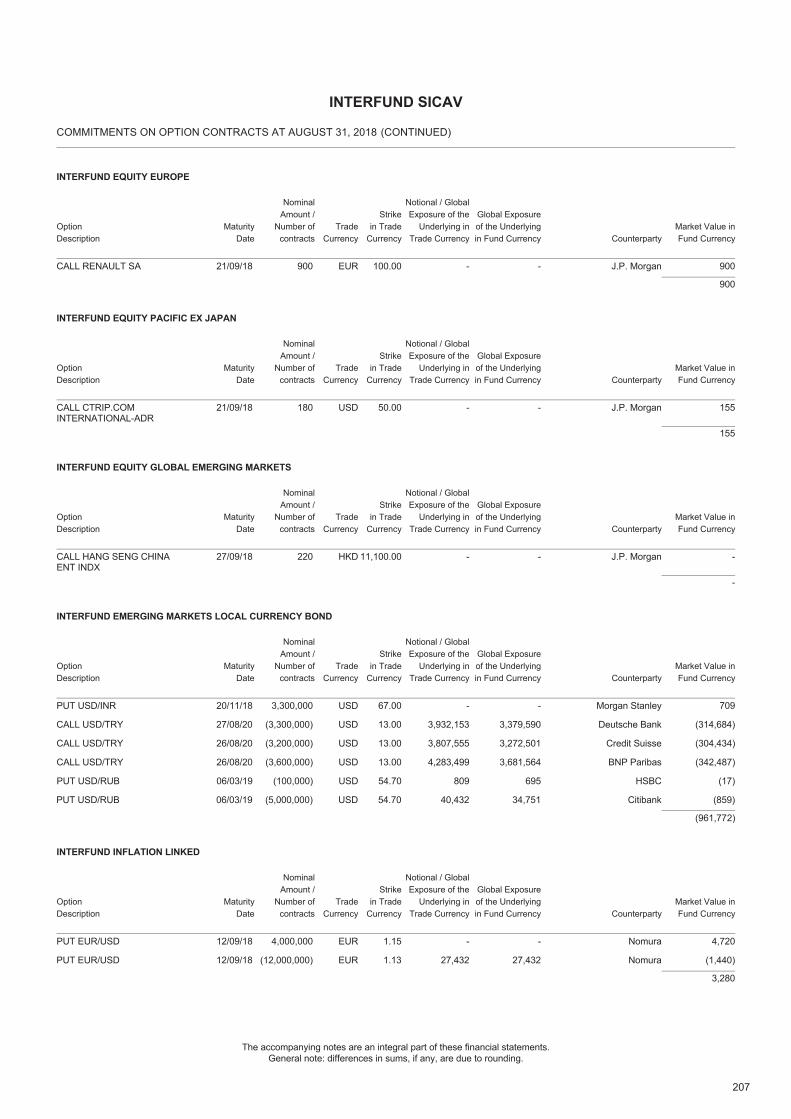
207
The accompanying notes are an integral part of these financial statements.General note: differences in sums, if any, are due to rounding.
COMMITMENTS ON OPTION CONTRACTS AT AUGUST 31, 2018
INTERFUND SICAV
(CONTINUED)
INTERFUND EQUITY EUROPE
OptionDescription
NominalAmount /
Number ofcontracts
Strikein Trade
CurrencyTrade
CurrencyMaturity
Date
Notional / GlobalExposure of the
Underlying inTrade Currency
Global Exposureof the Underlyingin Fund Currency Counterparty
Market Value inFund Currency
CALL RENAULT SA 900 100.00EUR21/09/18 - - J.P. Morgan 900
900
INTERFUND EQUITY PACIFIC EX JAPAN
OptionDescription
NominalAmount /
Number ofcontracts
Strikein Trade
CurrencyTrade
CurrencyMaturity
Date
Notional / GlobalExposure of the
Underlying inTrade Currency
Global Exposureof the Underlyingin Fund Currency Counterparty
Market Value inFund Currency
CALL CTRIP.COMINTERNATIONAL-ADR
180 50.00USD21/09/18 - - J.P. Morgan 155
155
INTERFUND EQUITY GLOBAL EMERGING MARKETS
OptionDescription
NominalAmount /
Number ofcontracts
Strikein Trade
CurrencyTrade
CurrencyMaturity
Date
Notional / GlobalExposure of the
Underlying inTrade Currency
Global Exposureof the Underlyingin Fund Currency Counterparty
Market Value inFund Currency
CALL HANG SENG CHINAENT INDX
220 11,100.00HKD27/09/18 - - J.P. Morgan -
-
INTERFUND EMERGING MARKETS LOCAL CURRENCY BOND
OptionDescription
NominalAmount /
Number ofcontracts
Strikein Trade
CurrencyTrade
CurrencyMaturity
Date
Notional / GlobalExposure of the
Underlying inTrade Currency
Global Exposureof the Underlyingin Fund Currency Counterparty
Market Value inFund Currency
PUT USD/INR 3,300,000 67.00USD20/11/18 - - Morgan Stanley 709
CALL USD/TRY (3,300,000) 13.00USD27/08/20 3,932,153 3,379,590 Deutsche Bank (314,684)
CALL USD/TRY (3,200,000) 13.00USD26/08/20 3,807,555 3,272,501 Credit Suisse (304,434)
CALL USD/TRY (3,600,000) 13.00USD26/08/20 4,283,499 3,681,564 BNP Paribas (342,487)
PUT USD/RUB (100,000) 54.70USD06/03/19 809 695 HSBC (17)
PUT USD/RUB (5,000,000) 54.70USD06/03/19 40,432 34,751 Citibank (859)
(961,772)
INTERFUND INFLATION LINKED
OptionDescription
NominalAmount /
Number ofcontracts
Strikein Trade
CurrencyTrade
CurrencyMaturity
Date
Notional / GlobalExposure of the
Underlying inTrade Currency
Global Exposureof the Underlyingin Fund Currency Counterparty
Market Value inFund Currency
PUT EUR/USD 4,000,000 1.15EUR12/09/18 - - Nomura 4,720
PUT EUR/USD (12,000,000) 1.13EUR12/09/18 27,432 27,432 Nomura (1,440)
3,280
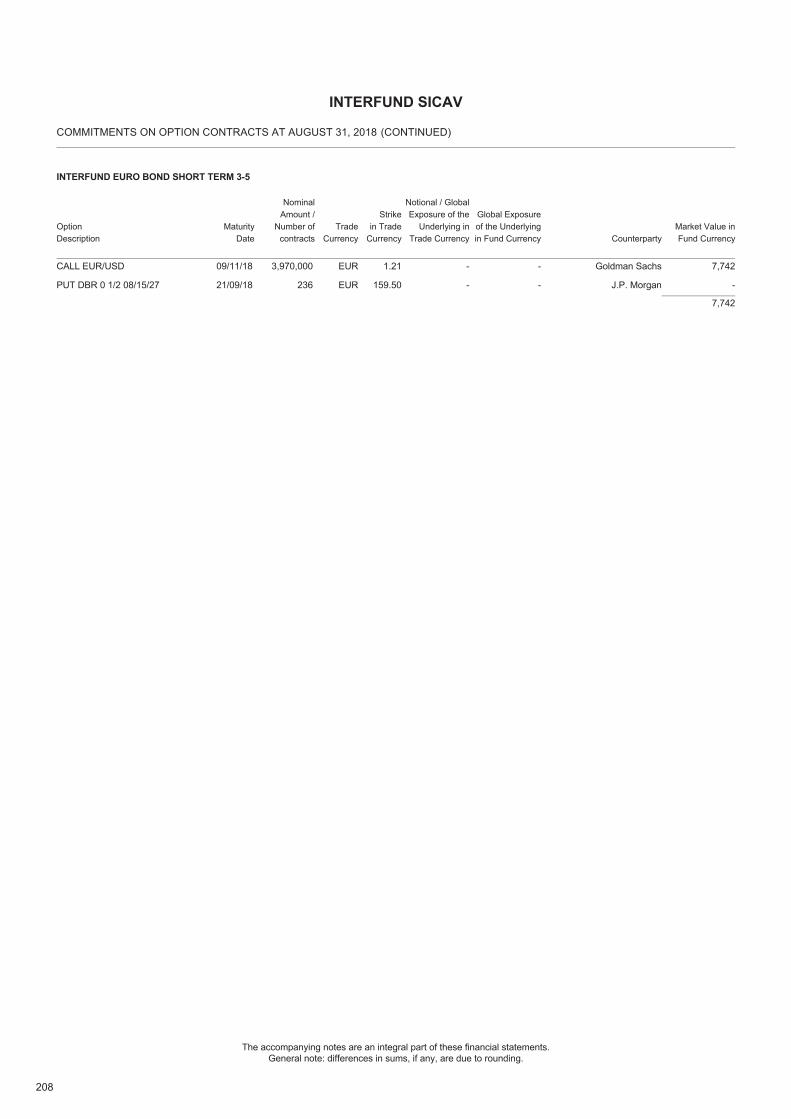
208
The accompanying notes are an integral part of these financial statements.General note: differences in sums, if any, are due to rounding.
COMMITMENTS ON OPTION CONTRACTS AT AUGUST 31, 2018
INTERFUND SICAV
(CONTINUED)
INTERFUND EURO BOND SHORT TERM 3-5
OptionDescription
NominalAmount /
Number ofcontracts
Strikein Trade
CurrencyTrade
CurrencyMaturity
Date
Notional / GlobalExposure of the
Underlying inTrade Currency
Global Exposureof the Underlyingin Fund Currency Counterparty
Market Value inFund Currency
CALL EUR/USD 3,970,000 1.21EUR09/11/18 - - Goldman Sachs 7,742
PUT DBR 0 1/2 08/15/27 236 159.50EUR21/09/18 - - J.P. Morgan -
7,742
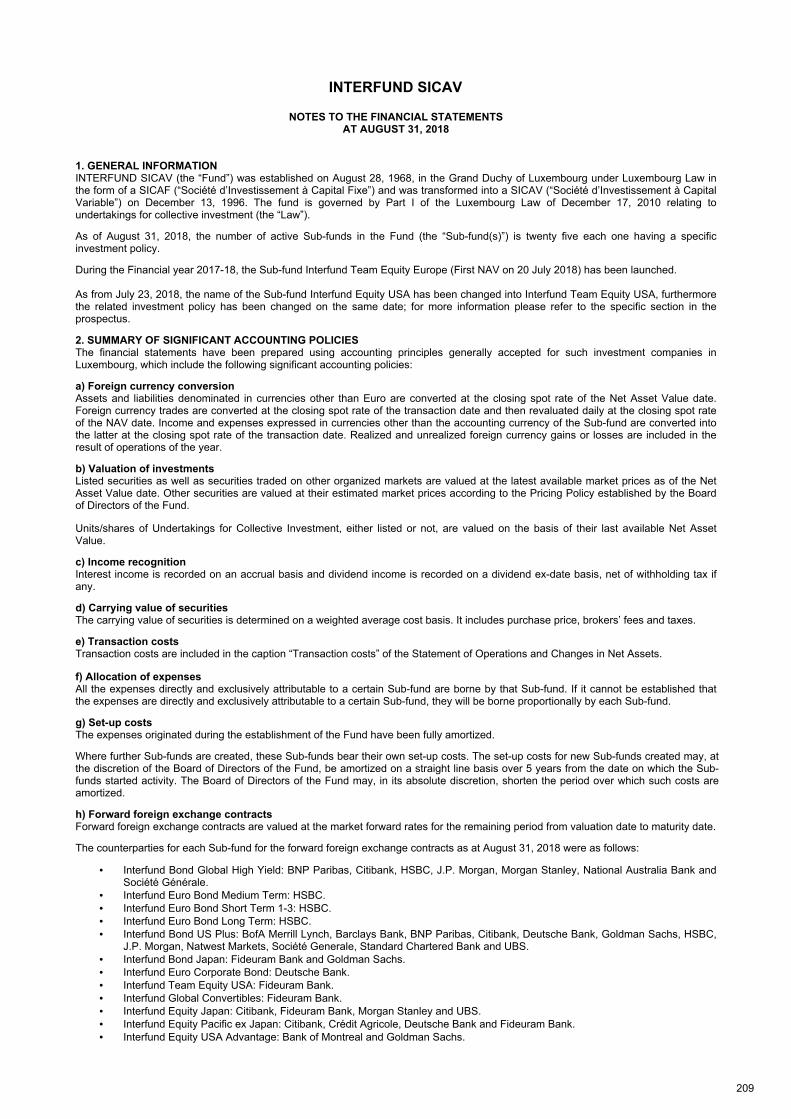
INTERFUND SICAV
NOTES TO THE FINANCIAL STATEMENTS AT AUGUST 31, 2018
209
1. GENERAL INFORMATION INTERFUND SICAV (the “Fund”) was established on August 28, 1968, in the Grand Duchy of Luxembourg under Luxembourg Law in the form of a SICAF (“Société d’Investissement à Capital Fixe”) and was transformed into a SICAV (“Société d’Investissement à Capital Variable”) on December 13, 1996. The fund is governed by Part I of the Luxembourg Law of December 17, 2010 relating to undertakings for collective investment (the “Law”).
As of August 31, 2018, the number of active Sub-funds in the Fund (the “Sub-fund(s)”) is twenty five each one having a specific investment policy.
During the Financial year 2017-18, the Sub-fund Interfund Team Equity Europe (First NAV on 20 July 2018) has been launched. As from July 23, 2018, the name of the Sub-fund Interfund Equity USA has been changed into Interfund Team Equity USA, furthermore the related investment policy has been changed on the same date; for more information please refer to the specific section in the prospectus.
2. SUMMARY OF SIGNIFICANT ACCOUNTING POLICIES The financial statements have been prepared using accounting principles generally accepted for such investment companies in Luxembourg, which include the following significant accounting policies:
a) Foreign currency conversion Assets and liabilities denominated in currencies other than Euro are converted at the closing spot rate of the Net Asset Value date. Foreign currency trades are converted at the closing spot rate of the transaction date and then revaluated daily at the closing spot rate of the NAV date. Income and expenses expressed in currencies other than the accounting currency of the Sub-fund are converted into the latter at the closing spot rate of the transaction date. Realized and unrealized foreign currency gains or losses are included in the result of operations of the year.
b) Valuation of investments Listed securities as well as securities traded on other organized markets are valued at the latest available market prices as of the Net Asset Value date. Other securities are valued at their estimated market prices according to the Pricing Policy established by the Board of Directors of the Fund.
Units/shares of Undertakings for Collective Investment, either listed or not, are valued on the basis of their last available Net Asset Value.
c) Income recognition Interest income is recorded on an accrual basis and dividend income is recorded on a dividend ex-date basis, net of withholding tax if any.
d) Carrying value of securities The carrying value of securities is determined on a weighted average cost basis. It includes purchase price, brokers’ fees and taxes.
e) Transaction costs Transaction costs are included in the caption “Transaction costs” of the Statement of Operations and Changes in Net Assets.
f) Allocation of expenses All the expenses directly and exclusively attributable to a certain Sub-fund are borne by that Sub-fund. If it cannot be established that the expenses are directly and exclusively attributable to a certain Sub-fund, they will be borne proportionally by each Sub-fund.
g) Set-up costs The expenses originated during the establishment of the Fund have been fully amortized.
Where further Sub-funds are created, these Sub-funds bear their own set-up costs. The set-up costs for new Sub-funds created may, at the discretion of the Board of Directors of the Fund, be amortized on a straight line basis over 5 years from the date on which the Sub-funds started activity. The Board of Directors of the Fund may, in its absolute discretion, shorten the period over which such costs are amortized.
h) Forward foreign exchange contracts Forward foreign exchange contracts are valued at the market forward rates for the remaining period from valuation date to maturity date.
The counterparties for each Sub-fund for the forward foreign exchange contracts as at August 31, 2018 were as follows:
• Interfund Bond Global High Yield: BNP Paribas, Citibank, HSBC, J.P. Morgan, Morgan Stanley, National Australia Bank and Société Générale.
• Interfund Euro Bond Medium Term: HSBC.
• Interfund Euro Bond Short Term 1-3: HSBC.
• Interfund Euro Bond Long Term: HSBC.
• Interfund Bond US Plus: BofA Merrill Lynch, Barclays Bank, BNP Paribas, Citibank, Deutsche Bank, Goldman Sachs, HSBC, J.P. Morgan, Natwest Markets, Société Generale, Standard Chartered Bank and UBS.
• Interfund Bond Japan: Fideuram Bank and Goldman Sachs.
• Interfund Euro Corporate Bond: Deutsche Bank.
• Interfund Team Equity USA: Fideuram Bank.
• Interfund Global Convertibles: Fideuram Bank.
• Interfund Equity Japan: Citibank, Fideuram Bank, Morgan Stanley and UBS.
• Interfund Equity Pacific ex Japan: Citibank, Crédit Agricole, Deutsche Bank and Fideuram Bank.
• Interfund Equity USA Advantage: Bank of Montreal and Goldman Sachs.
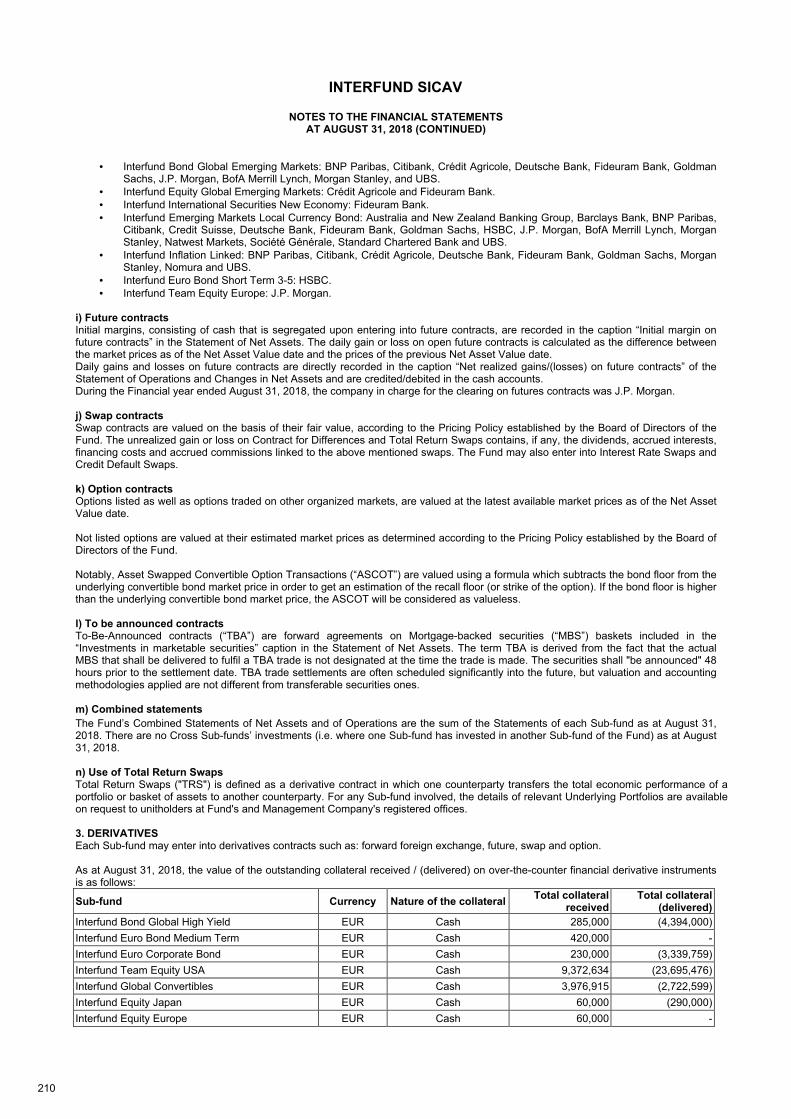
INTERFUND SICAV
NOTES TO THE FINANCIAL STATEMENTS AT AUGUST 31, 2018 (CONTINUED)
210
• Interfund Bond Global Emerging Markets: BNP Paribas, Citibank, Crédit Agricole, Deutsche Bank, Fideuram Bank, Goldman Sachs, J.P. Morgan, BofA Merrill Lynch, Morgan Stanley, and UBS.
• Interfund Equity Global Emerging Markets: Crédit Agricole and Fideuram Bank.
• Interfund International Securities New Economy: Fideuram Bank.
• Interfund Emerging Markets Local Currency Bond: Australia and New Zealand Banking Group, Barclays Bank, BNP Paribas, Citibank, Credit Suisse, Deutsche Bank, Fideuram Bank, Goldman Sachs, HSBC, J.P. Morgan, BofA Merrill Lynch, Morgan Stanley, Natwest Markets, Société Générale, Standard Chartered Bank and UBS.
• Interfund Inflation Linked: BNP Paribas, Citibank, Crédit Agricole, Deutsche Bank, Fideuram Bank, Goldman Sachs, Morgan Stanley, Nomura and UBS.
• Interfund Euro Bond Short Term 3-5: HSBC.
• Interfund Team Equity Europe: J.P. Morgan. i) Future contracts Initial margins, consisting of cash that is segregated upon entering into future contracts, are recorded in the caption “Initial margin on future contracts” in the Statement of Net Assets. The daily gain or loss on open future contracts is calculated as the difference between the market prices as of the Net Asset Value date and the prices of the previous Net Asset Value date. Daily gains and losses on future contracts are directly recorded in the caption “Net realized gains/(losses) on future contracts” of the Statement of Operations and Changes in Net Assets and are credited/debited in the cash accounts. During the Financial year ended August 31, 2018, the company in charge for the clearing on futures contracts was J.P. Morgan. j) Swap contracts Swap contracts are valued on the basis of their fair value, according to the Pricing Policy established by the Board of Directors of the Fund. The unrealized gain or loss on Contract for Differences and Total Return Swaps contains, if any, the dividends, accrued interests, financing costs and accrued commissions linked to the above mentioned swaps. The Fund may also enter into Interest Rate Swaps and Credit Default Swaps. k) Option contracts Options listed as well as options traded on other organized markets, are valued at the latest available market prices as of the Net Asset Value date. Not listed options are valued at their estimated market prices as determined according to the Pricing Policy established by the Board of Directors of the Fund. Notably, Asset Swapped Convertible Option Transactions (“ASCOT”) are valued using a formula which subtracts the bond floor from the underlying convertible bond market price in order to get an estimation of the recall floor (or strike of the option). If the bond floor is higher than the underlying convertible bond market price, the ASCOT will be considered as valueless. l) To be announced contracts To-Be-Announced contracts (“TBA”) are forward agreements on Mortgage-backed securities (“MBS”) baskets included in the “Investments in marketable securities” caption in the Statement of Net Assets. The term TBA is derived from the fact that the actual MBS that shall be delivered to fulfil a TBA trade is not designated at the time the trade is made. The securities shall "be announced" 48 hours prior to the settlement date. TBA trade settlements are often scheduled significantly into the future, but valuation and accounting methodologies applied are not different from transferable securities ones. m) Combined statements
The Fund’s Combined Statements of Net Assets and of Operations are the sum of the Statements of each Sub-fund as at August 31, 2018. There are no Cross Sub-funds’ investments (i.e. where one Sub-fund has invested in another Sub-fund of the Fund) as at August 31, 2018. n) Use of Total Return Swaps Total Return Swaps ("TRS") is defined as a derivative contract in which one counterparty transfers the total economic performance of a portfolio or basket of assets to another counterparty. For any Sub-fund involved, the details of relevant Underlying Portfolios are available on request to unitholders at Fund's and Management Company's registered offices. 3. DERIVATIVES Each Sub-fund may enter into derivatives contracts such as: forward foreign exchange, future, swap and option. As at August 31, 2018, the value of the outstanding collateral received / (delivered) on over-the-counter financial derivative instruments is as follows:
Sub-fund Currency Nature of the collateral Total collateral
received Total collateral
(delivered)
Interfund Bond Global High Yield EUR Cash 285,000 (4,394,000)
Interfund Euro Bond Medium Term EUR Cash 420,000 -
Interfund Euro Corporate Bond EUR Cash 230,000 (3,339,759)
Interfund Team Equity USA EUR Cash 9,372,634 (23,695,476)
Interfund Global Convertibles EUR Cash 3,976,915 (2,722,599)
Interfund Equity Japan EUR Cash 60,000 (290,000)
Interfund Equity Europe EUR Cash 60,000 -
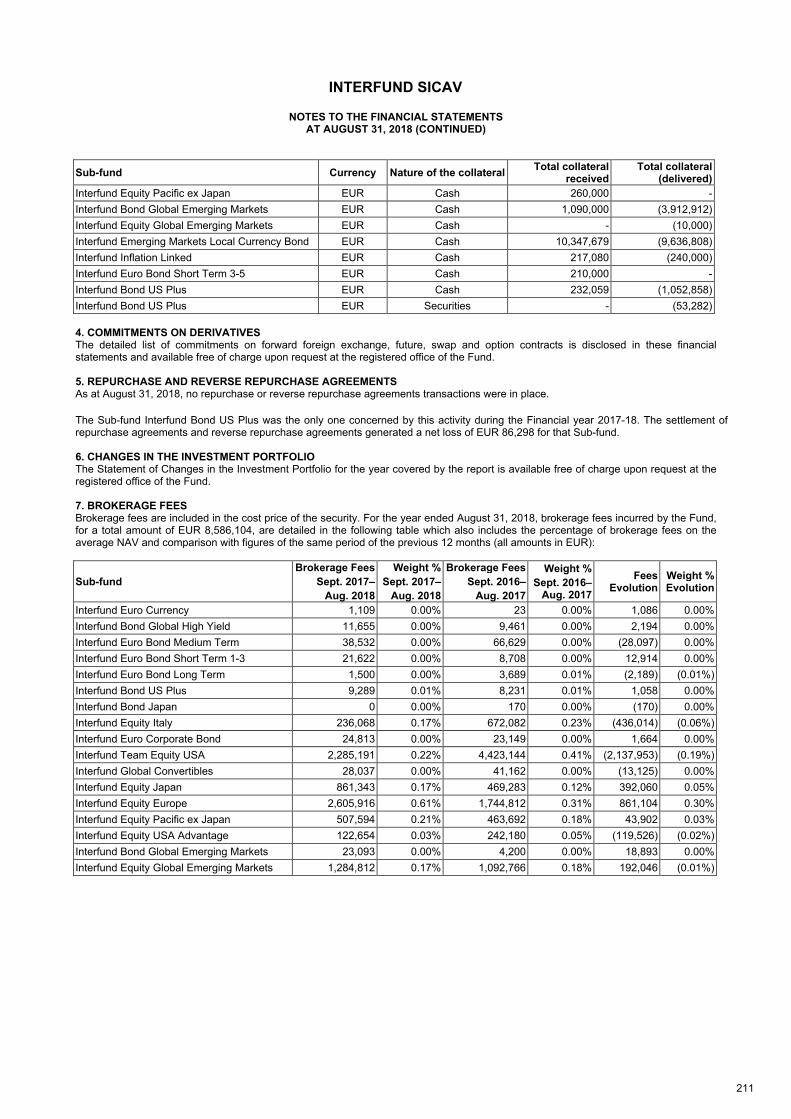
INTERFUND SICAV
NOTES TO THE FINANCIAL STATEMENTS AT AUGUST 31, 2018 (CONTINUED)
211
Sub-fund Currency Nature of the collateral Total collateral
received Total collateral
(delivered)
Interfund Equity Pacific ex Japan EUR Cash 260,000 -
Interfund Bond Global Emerging Markets EUR Cash 1,090,000 (3,912,912)
Interfund Equity Global Emerging Markets EUR Cash - (10,000)
Interfund Emerging Markets Local Currency Bond EUR Cash 10,347,679 (9,636,808)
Interfund Inflation Linked EUR Cash 217,080 (240,000)
Interfund Euro Bond Short Term 3-5 EUR Cash 210,000 -
Interfund Bond US Plus EUR Cash 232,059 (1,052,858)
Interfund Bond US Plus EUR Securities - (53,282)
4. COMMITMENTS ON DERIVATIVES The detailed list of commitments on forward foreign exchange, future, swap and option contracts is disclosed in these financial statements and available free of charge upon request at the registered office of the Fund. 5. REPURCHASE AND REVERSE REPURCHASE AGREEMENTS As at August 31, 2018, no repurchase or reverse repurchase agreements transactions were in place.
The Sub-fund Interfund Bond US Plus was the only one concerned by this activity during the Financial year 2017-18. The settlement of repurchase agreements and reverse repurchase agreements generated a net loss of EUR 86,298 for that Sub-fund. 6. CHANGES IN THE INVESTMENT PORTFOLIO The Statement of Changes in the Investment Portfolio for the year covered by the report is available free of charge upon request at the registered office of the Fund. 7. BROKERAGE FEES Brokerage fees are included in the cost price of the security. For the year ended August 31, 2018, brokerage fees incurred by the Fund, for a total amount of EUR 8,586,104, are detailed in the following table which also includes the percentage of brokerage fees on the average NAV and comparison with figures of the same period of the previous 12 months (all amounts in EUR):
Sub-fund
Brokerage Fees
Sept. 2017–
Aug. 2018
Weight %
Sept. 2017–
Aug. 2018
Brokerage Fees
Sept. 2016–
Aug. 2017
Weight %
Sept. 2016–Aug. 2017
Fees Evolution
Weight % Evolution
Interfund Euro Currency 1,109 0.00% 23 0.00% 1,086 0.00%
Interfund Bond Global High Yield 11,655 0.00% 9,461 0.00% 2,194 0.00%
Interfund Euro Bond Medium Term 38,532 0.00% 66,629 0.00% (28,097) 0.00%
Interfund Euro Bond Short Term 1-3 21,622 0.00% 8,708 0.00% 12,914 0.00%
Interfund Euro Bond Long Term 1,500 0.00% 3,689 0.01% (2,189) (0.01%)
Interfund Bond US Plus 9,289 0.01% 8,231 0.01% 1,058 0.00%
Interfund Bond Japan 0 0.00% 170 0.00% (170) 0.00%
Interfund Equity Italy 236,068 0.17% 672,082 0.23% (436,014) (0.06%)
Interfund Euro Corporate Bond 24,813 0.00% 23,149 0.00% 1,664 0.00%
Interfund Team Equity USA 2,285,191 0.22% 4,423,144 0.41% (2,137,953) (0.19%)
Interfund Global Convertibles 28,037 0.00% 41,162 0.00% (13,125) 0.00%
Interfund Equity Japan 861,343 0.17% 469,283 0.12% 392,060 0.05%
Interfund Equity Europe 2,605,916 0.61% 1,744,812 0.31% 861,104 0.30%
Interfund Equity Pacific ex Japan 507,594 0.21% 463,692 0.18% 43,902 0.03%
Interfund Equity USA Advantage 122,654 0.03% 242,180 0.05% (119,526) (0.02%)
Interfund Bond Global Emerging Markets 23,093 0.00% 4,200 0.00% 18,893 0.00%
Interfund Equity Global Emerging Markets 1,284,812 0.17% 1,092,766 0.18% 192,046 (0.01%)
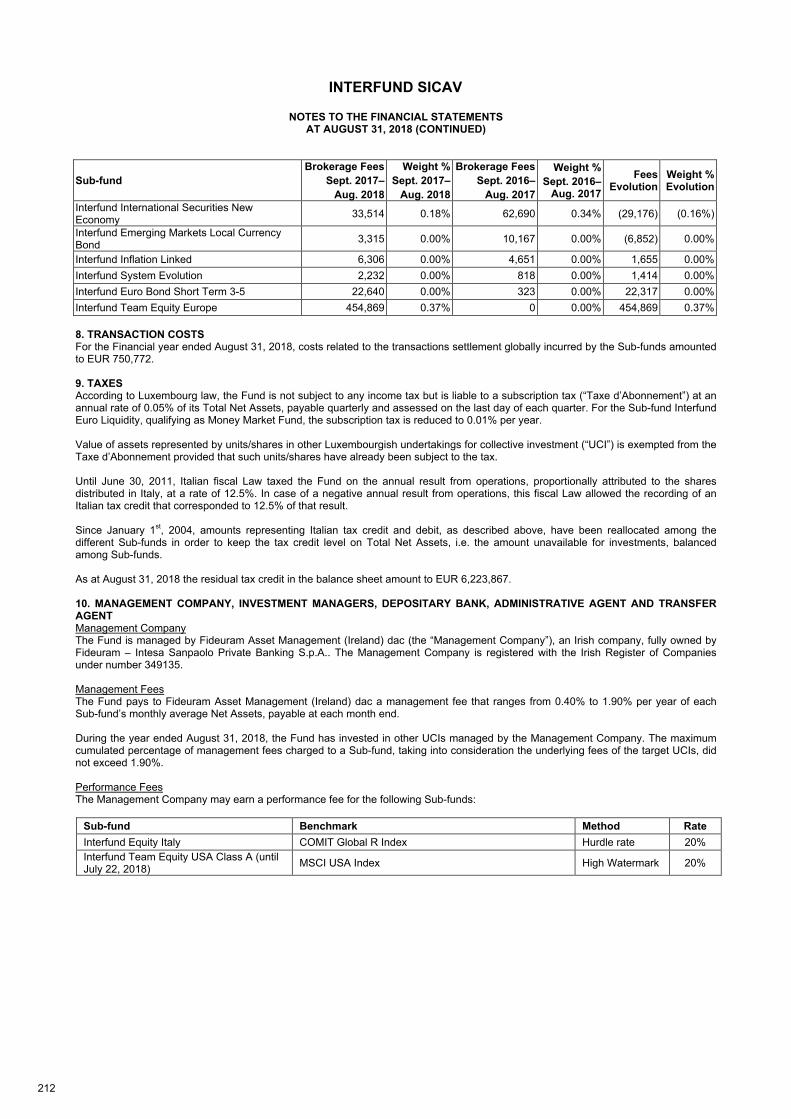
INTERFUND SICAV
NOTES TO THE FINANCIAL STATEMENTS AT AUGUST 31, 2018 (CONTINUED)
212
Sub-fund
Brokerage Fees
Sept. 2017–
Aug. 2018
Weight %
Sept. 2017–
Aug. 2018
Brokerage Fees
Sept. 2016–
Aug. 2017
Weight %
Sept. 2016–
Aug. 2017
Fees Evolution
Weight % Evolution
Interfund International Securities New Economy
33,514 0.18% 62,690 0.34% (29,176) (0.16%)
Interfund Emerging Markets Local Currency Bond
3,315 0.00% 10,167 0.00% (6,852) 0.00%
Interfund Inflation Linked 6,306 0.00% 4,651 0.00% 1,655 0.00%
Interfund System Evolution 2,232 0.00% 818 0.00% 1,414 0.00%
Interfund Euro Bond Short Term 3-5 22,640 0.00% 323 0.00% 22,317 0.00%
Interfund Team Equity Europe 454,869 0.37% 0 0.00% 454,869 0.37%
8. TRANSACTION COSTS For the Financial year ended August 31, 2018, costs related to the transactions settlement globally incurred by the Sub-funds amounted to EUR 750,772. 9. TAXES According to Luxembourg law, the Fund is not subject to any income tax but is liable to a subscription tax (“Taxe d’Abonnement”) at an annual rate of 0.05% of its Total Net Assets, payable quarterly and assessed on the last day of each quarter. For the Sub-fund Interfund Euro Liquidity, qualifying as Money Market Fund, the subscription tax is reduced to 0.01% per year. Value of assets represented by units/shares in other Luxembourgish undertakings for collective investment (“UCI”) is exempted from the Taxe d’Abonnement provided that such units/shares have already been subject to the tax. Until June 30, 2011, Italian fiscal Law taxed the Fund on the annual result from operations, proportionally attributed to the shares distributed in Italy, at a rate of 12.5%. In case of a negative annual result from operations, this fiscal Law allowed the recording of an Italian tax credit that corresponded to 12.5% of that result. Since January 1
st, 2004, amounts representing Italian tax credit and debit, as described above, have been reallocated among the
different Sub-funds in order to keep the tax credit level on Total Net Assets, i.e. the amount unavailable for investments, balanced among Sub-funds. As at August 31, 2018 the residual tax credit in the balance sheet amount to EUR 6,223,867. 10. MANAGEMENT COMPANY, INVESTMENT MANAGERS, DEPOSITARY BANK, ADMINISTRATIVE AGENT AND TRANSFER AGENT Management Company The Fund is managed by Fideuram Asset Management (Ireland) dac (the “Management Company”), an Irish company, fully owned by Fideuram – Intesa Sanpaolo Private Banking S.p.A.. The Management Company is registered with the Irish Register of Companies under number 349135. Management Fees The Fund pays to Fideuram Asset Management (Ireland) dac a management fee that ranges from 0.40% to 1.90% per year of each Sub-fund’s monthly average Net Assets, payable at each month end. During the year ended August 31, 2018, the Fund has invested in other UCIs managed by the Management Company. The maximum cumulated percentage of management fees charged to a Sub-fund, taking into consideration the underlying fees of the target UCIs, did not exceed 1.90%. Performance Fees The Management Company may earn a performance fee for the following Sub-funds:
Sub-fund Benchmark Method Rate
Interfund Equity Italy COMIT Global R Index Hurdle rate 20%
Interfund Team Equity USA Class A (until July 22, 2018)
MSCI USA Index High Watermark 20%
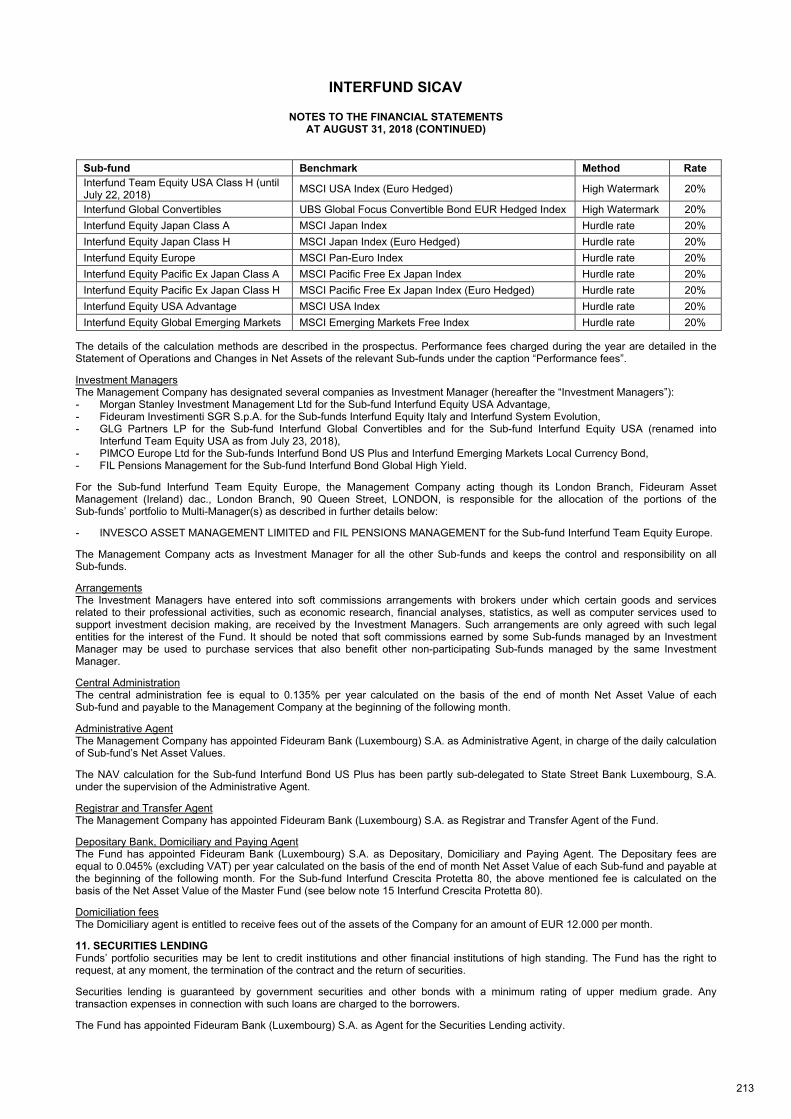
INTERFUND SICAV
NOTES TO THE FINANCIAL STATEMENTS AT AUGUST 31, 2018 (CONTINUED)
213
Sub-fund Benchmark Method Rate
Interfund Team Equity USA Class H (until July 22, 2018)
MSCI USA Index (Euro Hedged) High Watermark 20%
Interfund Global Convertibles UBS Global Focus Convertible Bond EUR Hedged Index High Watermark 20%
Interfund Equity Japan Class A MSCI Japan Index Hurdle rate 20%
Interfund Equity Japan Class H MSCI Japan Index (Euro Hedged) Hurdle rate 20%
Interfund Equity Europe MSCI Pan-Euro Index Hurdle rate 20%
Interfund Equity Pacific Ex Japan Class A MSCI Pacific Free Ex Japan Index Hurdle rate 20%
Interfund Equity Pacific Ex Japan Class H MSCI Pacific Free Ex Japan Index (Euro Hedged) Hurdle rate 20%
Interfund Equity USA Advantage MSCI USA Index Hurdle rate 20%
Interfund Equity Global Emerging Markets MSCI Emerging Markets Free Index Hurdle rate 20%
The details of the calculation methods are described in the prospectus. Performance fees charged during the year are detailed in the Statement of Operations and Changes in Net Assets of the relevant Sub-funds under the caption “Performance fees”.
Investment Managers The Management Company has designated several companies as Investment Manager (hereafter the “Investment Managers”): - Morgan Stanley Investment Management Ltd for the Sub-fund Interfund Equity USA Advantage, - Fideuram Investimenti SGR S.p.A. for the Sub-funds Interfund Equity Italy and Interfund System Evolution, - GLG Partners LP for the Sub-fund Interfund Global Convertibles and for the Sub-fund Interfund Equity USA (renamed into
Interfund Team Equity USA as from July 23, 2018), - PIMCO Europe Ltd for the Sub-funds Interfund Bond US Plus and Interfund Emerging Markets Local Currency Bond, - FIL Pensions Management for the Sub-fund Interfund Bond Global High Yield.
For the Sub-fund Interfund Team Equity Europe, the Management Company acting though its London Branch, Fideuram Asset Management (Ireland) dac., London Branch, 90 Queen Street, LONDON, is responsible for the allocation of the portions of the Sub-funds’ portfolio to Multi-Manager(s) as described in further details below:
- INVESCO ASSET MANAGEMENT LIMITED and FIL PENSIONS MANAGEMENT for the Sub-fund Interfund Team Equity Europe.
The Management Company acts as Investment Manager for all the other Sub-funds and keeps the control and responsibility on all Sub-funds.
Arrangements The Investment Managers have entered into soft commissions arrangements with brokers under which certain goods and services related to their professional activities, such as economic research, financial analyses, statistics, as well as computer services used to support investment decision making, are received by the Investment Managers. Such arrangements are only agreed with such legal entities for the interest of the Fund. It should be noted that soft commissions earned by some Sub-funds managed by an Investment Manager may be used to purchase services that also benefit other non-participating Sub-funds managed by the same Investment Manager.
Central Administration The central administration fee is equal to 0.135% per year calculated on the basis of the end of month Net Asset Value of each Sub-fund and payable to the Management Company at the beginning of the following month.
Administrative Agent The Management Company has appointed Fideuram Bank (Luxembourg) S.A. as Administrative Agent, in charge of the daily calculation of Sub-fund’s Net Asset Values.
The NAV calculation for the Sub-fund Interfund Bond US Plus has been partly sub-delegated to State Street Bank Luxembourg, S.A. under the supervision of the Administrative Agent.
Registrar and Transfer Agent The Management Company has appointed Fideuram Bank (Luxembourg) S.A. as Registrar and Transfer Agent of the Fund.
Depositary Bank, Domiciliary and Paying Agent The Fund has appointed Fideuram Bank (Luxembourg) S.A. as Depositary, Domiciliary and Paying Agent. The Depositary fees are equal to 0.045% (excluding VAT) per year calculated on the basis of the end of month Net Asset Value of each Sub-fund and payable at the beginning of the following month. For the Sub-fund Interfund Crescita Protetta 80, the above mentioned fee is calculated on the basis of the Net Asset Value of the Master Fund (see below note 15 Interfund Crescita Protetta 80).
Domiciliation fees The Domiciliary agent is entitled to receive fees out of the assets of the Company for an amount of EUR 12.000 per month.
11. SECURITIES LENDING Funds’ portfolio securities may be lent to credit institutions and other financial institutions of high standing. The Fund has the right to request, at any moment, the termination of the contract and the return of securities.
Securities lending is guaranteed by government securities and other bonds with a minimum rating of upper medium grade. Any transaction expenses in connection with such loans are charged to the borrowers.
The Fund has appointed Fideuram Bank (Luxembourg) S.A. as Agent for the Securities Lending activity.
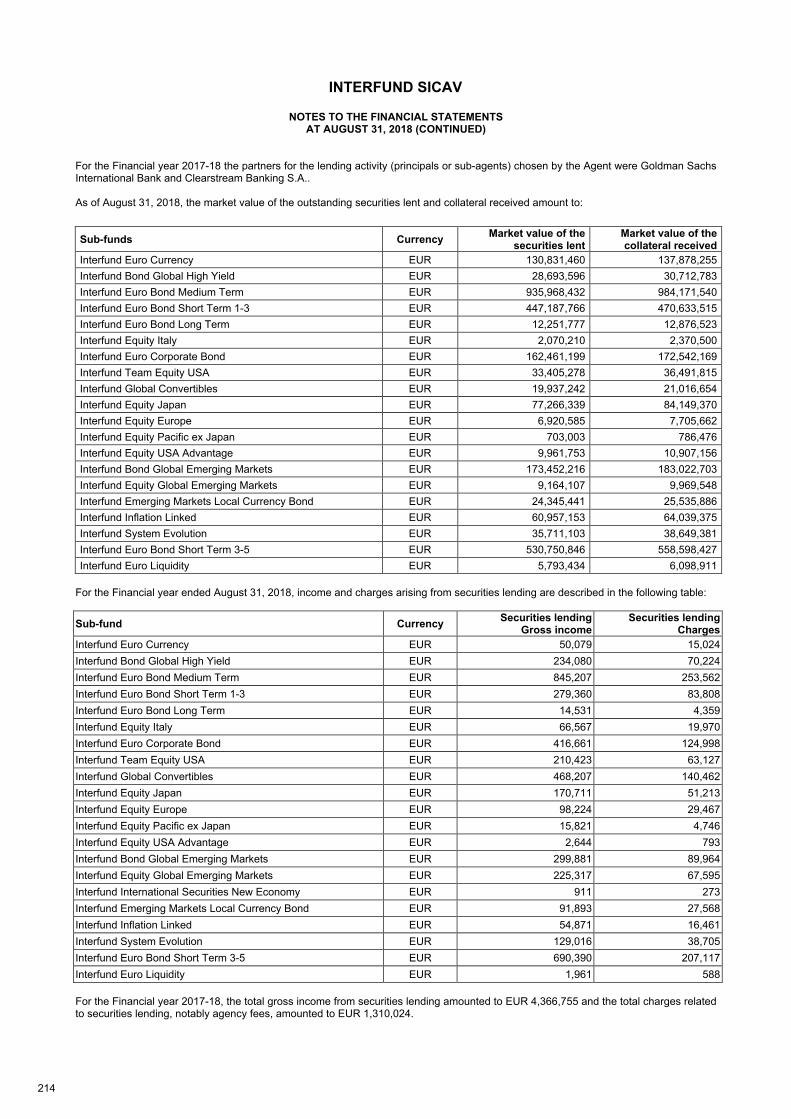
INTERFUND SICAV
NOTES TO THE FINANCIAL STATEMENTS AT AUGUST 31, 2018 (CONTINUED)
214
For the Financial year 2017-18 the partners for the lending activity (principals or sub-agents) chosen by the Agent were Goldman Sachs International Bank and Clearstream Banking S.A.. As of August 31, 2018, the market value of the outstanding securities lent and collateral received amount to:
For the Financial year ended August 31, 2018, income and charges arising from securities lending are described in the following table:
Sub-fund Currency Securities lending
Gross income Securities lending
Charges
Interfund Euro Currency EUR 50,079 15,024
Interfund Bond Global High Yield EUR 234,080 70,224
Interfund Euro Bond Medium Term EUR 845,207 253,562
Interfund Euro Bond Short Term 1-3 EUR 279,360 83,808
Interfund Euro Bond Long Term EUR 14,531 4,359
Interfund Equity Italy EUR 66,567 19,970
Interfund Euro Corporate Bond EUR 416,661 124,998
Interfund Team Equity USA EUR 210,423 63,127
Interfund Global Convertibles EUR 468,207 140,462
Interfund Equity Japan EUR 170,711 51,213
Interfund Equity Europe EUR 98,224 29,467
Interfund Equity Pacific ex Japan EUR 15,821 4,746
Interfund Equity USA Advantage EUR 2,644 793
Interfund Bond Global Emerging Markets EUR 299,881 89,964
Interfund Equity Global Emerging Markets EUR 225,317 67,595
Interfund International Securities New Economy EUR 911 273
Interfund Emerging Markets Local Currency Bond EUR 91,893 27,568
Interfund Inflation Linked EUR 54,871 16,461
Interfund System Evolution EUR 129,016 38,705
Interfund Euro Bond Short Term 3-5 EUR 690,390 207,117
Interfund Euro Liquidity EUR 1,961 588
For the Financial year 2017-18, the total gross income from securities lending amounted to EUR 4,366,755 and the total charges related to securities lending, notably agency fees, amounted to EUR 1,310,024.
Sub-funds Currency Market value of the
securities lent Market value of the collateral received
Interfund Euro Currency EUR 130,831,460 137,878,255
Interfund Bond Global High Yield EUR 28,693,596 30,712,783
Interfund Euro Bond Medium Term EUR 935,968,432 984,171,540
Interfund Euro Bond Short Term 1-3 EUR 447,187,766 470,633,515
Interfund Euro Bond Long Term EUR 12,251,777 12,876,523
Interfund Equity Italy EUR 2,070,210 2,370,500
Interfund Euro Corporate Bond EUR 162,461,199 172,542,169
Interfund Team Equity USA EUR 33,405,278 36,491,815
Interfund Global Convertibles EUR 19,937,242 21,016,654
Interfund Equity Japan EUR 77,266,339 84,149,370
Interfund Equity Europe EUR 6,920,585 7,705,662
Interfund Equity Pacific ex Japan EUR 703,003 786,476
Interfund Equity USA Advantage EUR 9,961,753 10,907,156
Interfund Bond Global Emerging Markets EUR 173,452,216 183,022,703
Interfund Equity Global Emerging Markets EUR 9,164,107 9,969,548
Interfund Emerging Markets Local Currency Bond EUR 24,345,441 25,535,886
Interfund Inflation Linked EUR 60,957,153 64,039,375
Interfund System Evolution EUR 35,711,103 38,649,381
Interfund Euro Bond Short Term 3-5 EUR 530,750,846 558,598,427
Interfund Euro Liquidity EUR 5,793,434 6,098,911
INTERFUND SICAV
NOTES TO THE FINANCIAL STATEMENTS AT AUGUST 31, 2018 (CONTINUED)
215
12. NET ASSET VALUE PER SHARE For each Sub-fund the Net Asset Value per share is computed daily by dividing the Net Assets by the number of shares outstanding. 13. DISTRIBUTION OF PROFITS In accordance with the Fund’s prospectus, Sub-funds’ profits are not distributed but reinvested. 14. REDEMPTIONS OF SHARES The Fund's shares are redeemable daily at the current Net Asset Value per share. According to the Fund’s prospectus, the redemption of shares can be temporarily suspended. During the year ended August 31, 2018, no suspension was recorded. 15. INTERFUND CRESCITA PROTETTA 80 Interfund Crescita Protetta 80 (“the Feeder Fund”) is a feeder fund of MS Fideuram Equity Smart Beta Dynamic Protection 80 Fund (“the Master Fund”), a Sub-fund of FundLogic Alternatives PLC, an Irish UCITS managed by Fundlogic SAS. At all times the Feeder Fund invests at least 85% of its assets in shares of the Master Fund whilst it may hold up to 15% of its assets in ancillary liquid assets, cash, cash equivalents and short term bank deposits. Interfund Crescita Protetta 80 financial statements should be read in conjunction with the financial statements of the Master Fund. The last annual and unaudited semi-annual reports of the Master Fund are available to the Shareholders free of charge upon request at the registered office of the Fund. The Master Fund’s financial year begins on 1 August and ends on 31 July of each year. As of August 31, 2018, the Feeder Fund holds 100% of the Net Asset Value of the Master Fund. For the Financial year 2017-18, the aggregated total expenses of the Feeder Fund and the Master Fund were EUR 2,433,153. The total expense ratio of the Feeder Fund, aggregated with the total expense ratio of the Master Fund, is 1.65%. Master Fund’s Investment Objective and Investment Policy The Master Fund’s investment objective is to provide its shareholders with long term exposure to the performance of the portfolio strategy with 80% of the highest NAV (from the launch of the Master Fund onwards) being protected as a minimum exit Net Asset Value (the "Minimum Target Payoff");
The portfolio strategy (the "Portfolio Strategy") of the Master Fund consists of long and short positions in a portfolio of securities and other assets whose composition is determined from time to time by the sub-investment manager (the "Reference Strategy") coupled with an exposure to an effective overnight interest rate for the Euro (the "Cash Component") allocated in accordance with a volatility target strategy with 80% of the highest NAV (from the launch of the Sub-fund onwards) being protected as a minimum exit Net Asset Value. The overnight interest rate used for the Cash Component will be the Effective Overnight Index Average (Eonia) minus a fixed spread. The Master Fund will gain exposure to the Reference Strategy and the Cash Component through an unfunded Total Return Swap with an approved counterparty (The “Portfolio Total Return Swap”).
The Reference Strategy consists of a portfolio with exposure to the long and short positions in equities and equity related securities (such as common and preferred stock and American Depositary Receipts (“ADRs”)) that are listed or traded on the markets in North America and Europe.
The Reference Strategy will obtain exposure to such asset classes in the following manner: a. Direct investment in equities and equity related securities which are issued by corporate issuers, which are listed or traded on the
markets referred to in Appendix II of the prospectus of the Master Fund; b. Total return swaps, futures, options and forwards currency exchange contracts which reference equities set out in (a) or eligible
indices which are composed of equity investments set out in (a) above.
In addition to direct investment in securities, the Master Fund is expected to enter into financial derivative instruments (“FDI”) transactions to gain exposure to the securities referred above. The Master Fund may take long or short positions synthetically through the use of FDIs. The Master Fund will not take physical short positions. All short positions will be taken through the use of an FDI. The Master Fund may utilise swaps, options, futures and forward currency exchange contracts. The Master Fund may invest in FDI transactions both for investment and efficient portfolio management purposes. FDIs may be exchange traded or over-the-counter.
The Reference Strategy will have no more than 10% exposure to equities and equity related securities of issuers located in emerging markets. In accordance with the requirements of the Central Bank of Ireland, the absolute VaR of the Master Fund may not exceed 20% of the Net Asset Value of the Master Fund using a one-tailed confidence interval of 99% and a holding period of one month and a historical observation period of 4 years. The ratio of long and short investments may vary through time. The maximum net short exposure of the Master Fund will be -50% and the maximum net long exposure will be 100%. The Master Fund can be leveraged through the use of FDI. The Master Fund’s gross leverage calculated using the sum of the notional exposure of its derivatives positions (including leverage inherent in the Portfolio Strategy) is expected to be between 300% and 350% of the Net Asset Value of the Master Fund and will never exceed 400% of the Net Asset Value of the Master Fund.
The Master Fund may enter into financing swaps and repurchase / reverse repurchase arrangements.
INTERFUND SICAV
NOTES TO THE FINANCIAL STATEMENTS AT AUGUST 31, 2018 (CONTINUED)
216
The Master Fund will buy a put option linked to the Portfolio Strategy and Net Asset Value of the Master Fund either separately or as part of the Portfolio Total Return Swap (the “Put Option”) from an approved counterparty. The purpose of the Put Option is to offer an element of capital protection equals to 80% of the highest Net Asset Value per Share achieved from the launch of the Master Fund onwards (i.e., commencing with the initial offer price). The Master Fund will pay a premium for the Put Option at normal commercial rates. If the Portfolio Total Return Swap is used for the purpose, it will replicate the economic characteristic of a put option. The Master Fund and the portfolio will only utilise those derivatives that are listed in the Master Fund’s risk management process.
16. SUBSEQUENT EVENTS The Money Market Fund Regulation (the “Regulation”) has been implemented by EU Member States by 21st July 2018 and existing UCITS must comply with the new rules by 21st January 2019. The Management Company undertook a detailed analysis of all sub-funds under management to identify any qualifying funds, and the implications for them. The result of the analysis was that none of the sub-funds will fall within the scope of the Regulation. Where necessary, investment policy amendments are currently underway, in order to clarify that each sub-fund is not a Money Market Fund.
INTERFUND SICAV
217
To the Shareholders of
INTERFUND SICAV
9-11, Rue Goethe
Luxembourg
REPORT OF THE REVISEUR D’ENTREPRISES AGREE
Opinion
We have audited the accompanying financial statements of Interfund SICAV and each of its sub-funds (“the Fund”), which comprise the statements of net assets and the statements of investment portfolio and other net assets as at August 31, 2018 and the statements of operations and changes in net assets for the year ended, and notes to the financial statements, including a summary of significant accounting policies.
In our opinion, the accompanying financial statements give a true and fair view of the financial position of Interfund SICAV and each of its sub-funds as at August 31, 2018, and of the results of their operations and changes in their net assets for the year ended in accordance with Luxembourg legal and regulatory requirements relating to the preparation and presentation of the financial statements.
Basis for opinion
We conducted our audit in accordance with the Law of 23 July 2016 on the audit profession (“Law of 23 July 2016”) and with International Standards on Auditing (“ISAs”) as adopted for Luxembourg by the Commission de Surveillance du Secteur Financier (“CSSF”). Our responsibilities under the law of 21 July 2016 and ISAs are further described in the « Responsibilities of “Réviseur d’Entreprises agréé” for the Audit of the Financial Statements » section of our report. We are also independent of the Fund in accordance with the International Ethics Standards Board for Accountants’ Code of Ethics for Professional Accountants (“IESBA Code”) as adopted for Luxembourg by the CSSF together with the ethical requirements that are relevant to our audit of the financial statements, and have fulfilled our other ethical responsibilities under those ethical requirements. We believe that the audit evidence we have obtained is sufficient and appropriate to provide a basis for our opinion.
Other information
The Board of Directors of the Fund is responsible for the other information. The other information comprises the information included in
the annual report but does not include the financial statements and our report of Réviseur d’Entreprises agréé thereon.
Our opinion on the financial statements does not cover the other information and we do not express any form of assurance conclusion
thereon.
In connection with our audit of the financial statements, our responsibility is to read the other information and, in doing so, consider
whether the other information is materially inconsistent with the financial statements or our knowledge obtained in the audit or otherwise
appears to be materially misstated. If, based on the work we have performed, we conclude that there is a material misstatement of this
other information, we are required to report this fact. We have nothing to report in this regard.
Responsibilities of Board of Directors of the Fund for the financial statements
The Board of Directors of the Fund is responsible for the preparation and fair presentation of these financial statements in accordance
with Luxembourg legal and regulatory requirements relating to the preparation and presentation of the financial statements, and for such
internal control as the Board of Directors of the Fund determines is necessary to enable the preparation of financial statements that are
free from material misstatement, whether due to fraud or error.
In preparing the financial statements, the Board of Directors of the Fund is responsible for assessing the Fund's ability to continue as a
going concern, disclosing, as applicable, matters related to going concern and using the going concern basis of accounting unless the
Board of Directors of the Fund either intends to liquidate the Fund or to cease operations, or has no realistic alternative but to do so.
Responsibilities of the Réviseur d’Entreprises agréé for the audit of the financial statements
The objectives of our audit are to obtain reasonable assurance about whether the financial statements as a whole are free from material
misstatement, whether due to fraud or error, and to issue a report of “Réviseur d’Entreprises agréé” that includes our opinion.
Reasonable assurance is a high level of assurance, but is not a guarantee that an audit conducted in accordance with the Law of 23
July 2016 and with ISAs as adopted for Luxembourg by the CSSF will always detect a material misstatement when it exists.
Misstatements can arise from fraud or error and are considered material if, individually or in the aggregate, they could reasonably be
expected to influence the economic decisions of users taken on the basis of these financial statements.
218
INTERFUND SICAV
REPORT OF THE REVISEUR D'ENTREPRISES AGREE (CONTINUED)
As part of an audit m accordance with the Law of 23 July 2016 and with ISAs as adopted for Luxembourg by the CSSF. we exercise professional Judgment and maintain professional skepticism throughout the audit. We also.
Identify and assess the risks of material misstatement of the financial statements, whether due to fraud or error. design and perform audit procedures responsive to those risks. and obtain audi t evidence that 1s sufficient and appropriate to provide a basis for our opinion. The nsk of not detecting a matenal misstatement resulting from fraud 1s higher than for one resulting from error, as fraud may involve collusion, forgery, 1ntent1onal omissions. misrepresentations, or the override of internal control.
Obtain an understanding of internal control relevant to the audit m order to design audit procedures that are appropnate m the circumstances. but not for the purpose of expressing an op1n1on on the effectiveness of the Fund's internal control.
Evaluate the appropriateness of accounting policies used and the reasonableness of accounting estimates and related disclosures made by the Board of Directors of the Fund.
Conclude on the appropriateness of the Board of Directors of the Fund's use of the going concern basis of accounting and. based on the audit evidence obtained, whether a matenal uncertainty exists related to events or conditions that may cast significant doubt on the Fund's ability to continue as a going concern. If we conclude that a matenal uncertainty exists, we are required to draw attention m our report of "Rev1seur d'Entrepnses agree· to the related disclosures 1n the financial statements or, if such disclosures are inadequate. to modify our opinion. Our conclusions are based on the audit evidence obtained up to the date of our report of "Rev1seur d'Entrepnses ag,ee' . However, future events or cond1t1ons may cause the Fund to cease to continue as a going concern.
Evaluate the overall presentation, structure and content of the financial statements. 1nclud1ng the disclosures, and whether the financial statements represent the underlying transactions and events in a manner that achieves fair presentation.
We communicate with those charged with governance regarding, among other matters, the planned scope and timing o f the audit and signi ficant audi t findings. including any significant deficiencies in internal control that we 1denbfy during our audit.
Luxembourg, December 20. 2018 KPMG Luxembourg Societe cooperative
Cabinet de revision agree 39. avenue John F. Kennedy
L-1855 Lu mbourg
Only the English version of 11,e present Annual Report has been reviewed by the independent auditor. Consequently, the independent auditor's report only refers lo the English version of the Annual Repo11; other versions result from a conscientious translation made under the respons1b1lity of the Board of Directors of the Fund. In case of differences between the English version and the translation. the English version should be retained.
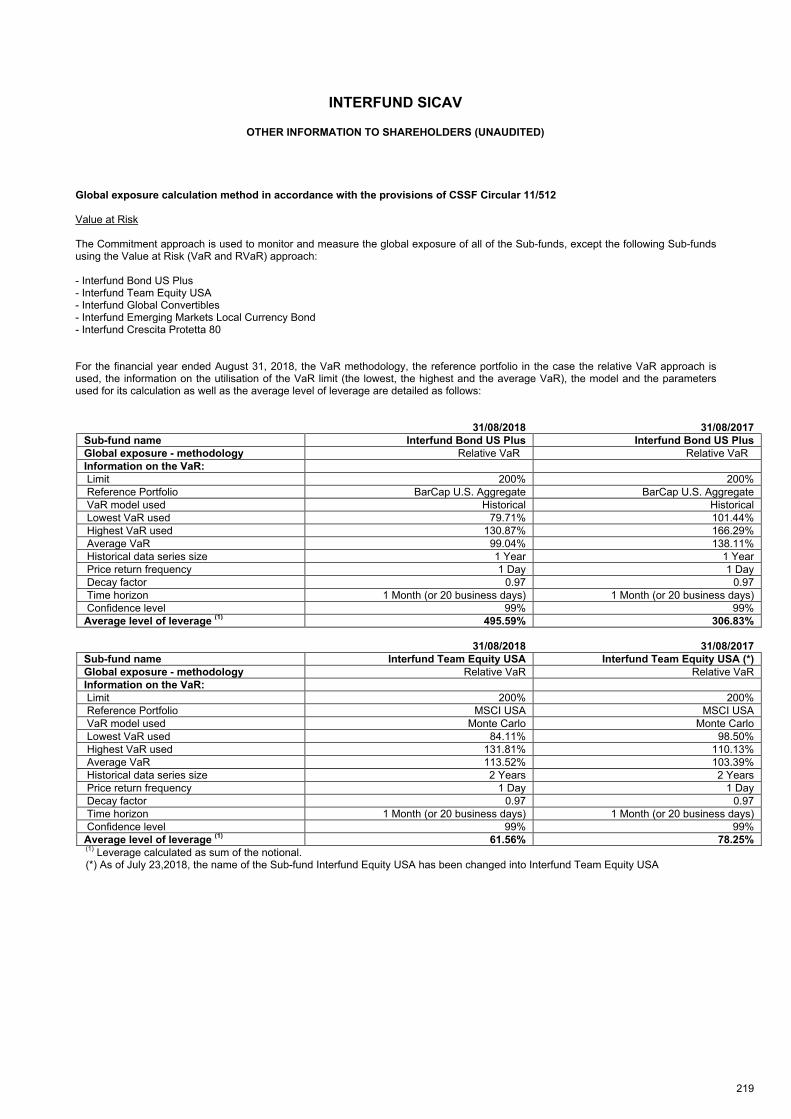
INTERFUND SICAV
OTHER INFORMATION TO SHAREHOLDERS (UNAUDITED)
219
Global exposure calculation method in accordance with the provisions of CSSF Circular 11/512 Value at Risk The Commitment approach is used to monitor and measure the global exposure of all of the Sub-funds, except the following Sub-funds using the Value at Risk (VaR and RVaR) approach: - Interfund Bond US Plus - Interfund Team Equity USA - Interfund Global Convertibles - Interfund Emerging Markets Local Currency Bond - Interfund Crescita Protetta 80 For the financial year ended August 31, 2018, the VaR methodology, the reference portfolio in the case the relative VaR approach is used, the information on the utilisation of the VaR limit (the lowest, the highest and the average VaR), the model and the parameters used for its calculation as well as the average level of leverage are detailed as follows:
31/08/2018 31/08/2017
Sub-fund name Interfund Bond US Plus Interfund Bond US Plus
Global exposure - methodology Relative VaR Relative VaR
Information on the VaR:
Limit 200% 200%
Reference Portfolio BarCap U.S. Aggregate BarCap U.S. Aggregate
VaR model used Historical Historical
Lowest VaR used 79.71% 101.44%
Highest VaR used 130.87% 166.29%
Average VaR 99.04% 138.11%
Historical data series size 1 Year 1 Year
Price return frequency 1 Day 1 Day
Decay factor 0.97 0.97
Time horizon 1 Month (or 20 business days) 1 Month (or 20 business days)
Confidence level 99% 99%
Average level of leverage (1)
495.59% 306.83%
31/08/2018 31/08/2017
Sub-fund name Interfund Team Equity USA Interfund Team Equity USA (*)
Global exposure - methodology Relative VaR Relative VaR
Information on the VaR:
Limit 200% 200%
Reference Portfolio MSCI USA MSCI USA
VaR model used Monte Carlo Monte Carlo
Lowest VaR used 84.11% 98.50%
Highest VaR used 131.81% 110.13%
Average VaR 113.52% 103.39%
Historical data series size 2 Years 2 Years
Price return frequency 1 Day 1 Day
Decay factor 0.97 0.97
Time horizon 1 Month (or 20 business days) 1 Month (or 20 business days)
Confidence level 99% 99%
Average level of leverage (1)
61.56% 78.25%
(1)
Leverage calculated as sum of the notional. (*) As of July 23,2018, the name of the Sub-fund Interfund Equity USA has been changed into Interfund Team Equity USA
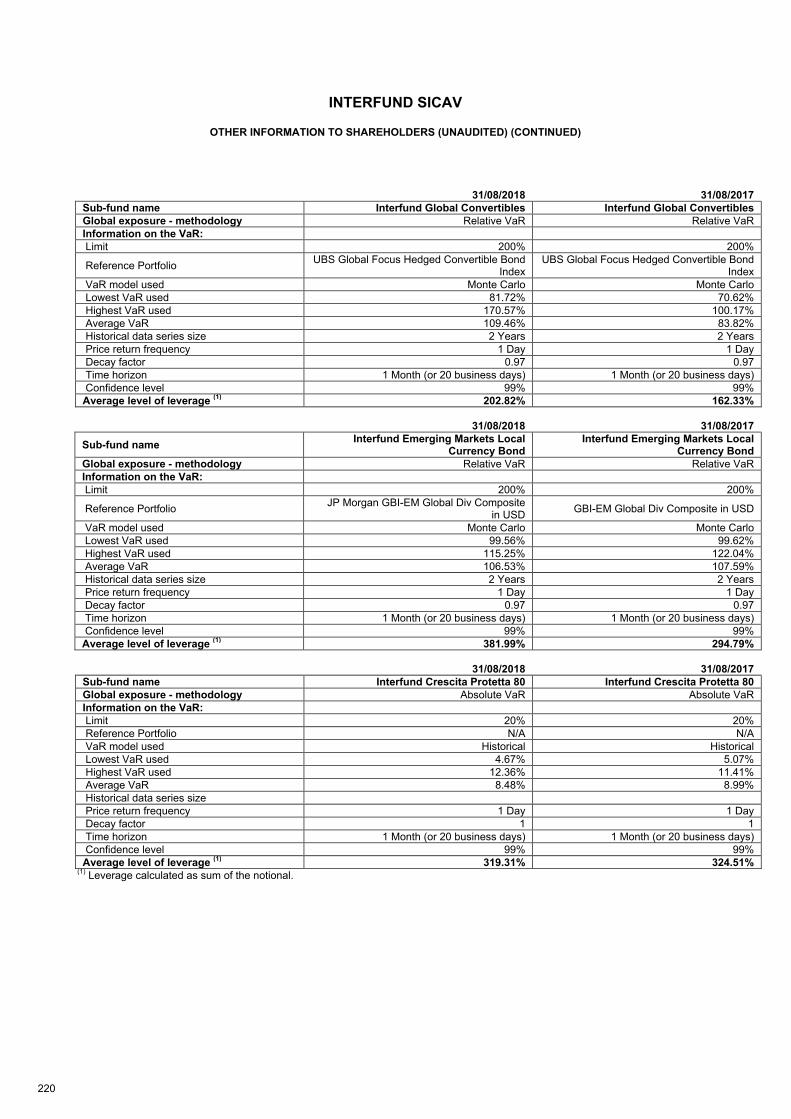
INTERFUND SICAV
OTHER INFORMATION TO SHAREHOLDERS (UNAUDITED) (CONTINUED)
220
31/08/2018 31/08/2017
Sub-fund name Interfund Global Convertibles Interfund Global Convertibles
Global exposure - methodology Relative VaR Relative VaR
Information on the VaR:
Limit 200% 200%
Reference Portfolio UBS Global Focus Hedged Convertible Bond
Index UBS Global Focus Hedged Convertible Bond
Index
VaR model used Monte Carlo Monte Carlo
Lowest VaR used 81.72% 70.62%
Highest VaR used 170.57% 100.17%
Average VaR 109.46% 83.82%
Historical data series size 2 Years 2 Years
Price return frequency 1 Day 1 Day
Decay factor 0.97 0.97
Time horizon 1 Month (or 20 business days) 1 Month (or 20 business days)
Confidence level 99% 99%
Average level of leverage (1)
202.82% 162.33%
31/08/2018 31/08/2017
Sub-fund name Interfund Emerging Markets Local
Currency Bond Interfund Emerging Markets Local
Currency Bond
Global exposure - methodology Relative VaR Relative VaR
Information on the VaR:
Limit 200% 200%
Reference Portfolio JP Morgan GBI-EM Global Div Composite
in USD GBI-EM Global Div Composite in USD
VaR model used Monte Carlo Monte Carlo
Lowest VaR used 99.56% 99.62%
Highest VaR used 115.25% 122.04%
Average VaR 106.53% 107.59%
Historical data series size 2 Years 2 Years
Price return frequency 1 Day 1 Day
Decay factor 0.97 0.97
Time horizon 1 Month (or 20 business days) 1 Month (or 20 business days)
Confidence level 99% 99%
Average level of leverage (1)
381.99% 294.79%
31/08/2018 31/08/2017
Sub-fund name Interfund Crescita Protetta 80 Interfund Crescita Protetta 80
Global exposure - methodology Absolute VaR Absolute VaR
Information on the VaR:
Limit 20% 20%
Reference Portfolio N/A N/A
VaR model used Historical Historical
Lowest VaR used 4.67% 5.07%
Highest VaR used 12.36% 11.41%
Average VaR 8.48% 8.99%
Historical data series size
Price return frequency 1 Day 1 Day
Decay factor 1 1
Time horizon 1 Month (or 20 business days) 1 Month (or 20 business days)
Confidence level 99% 99%
Average level of leverage (1)
319.31% 324.51% (1)
Leverage calculated as sum of the notional.
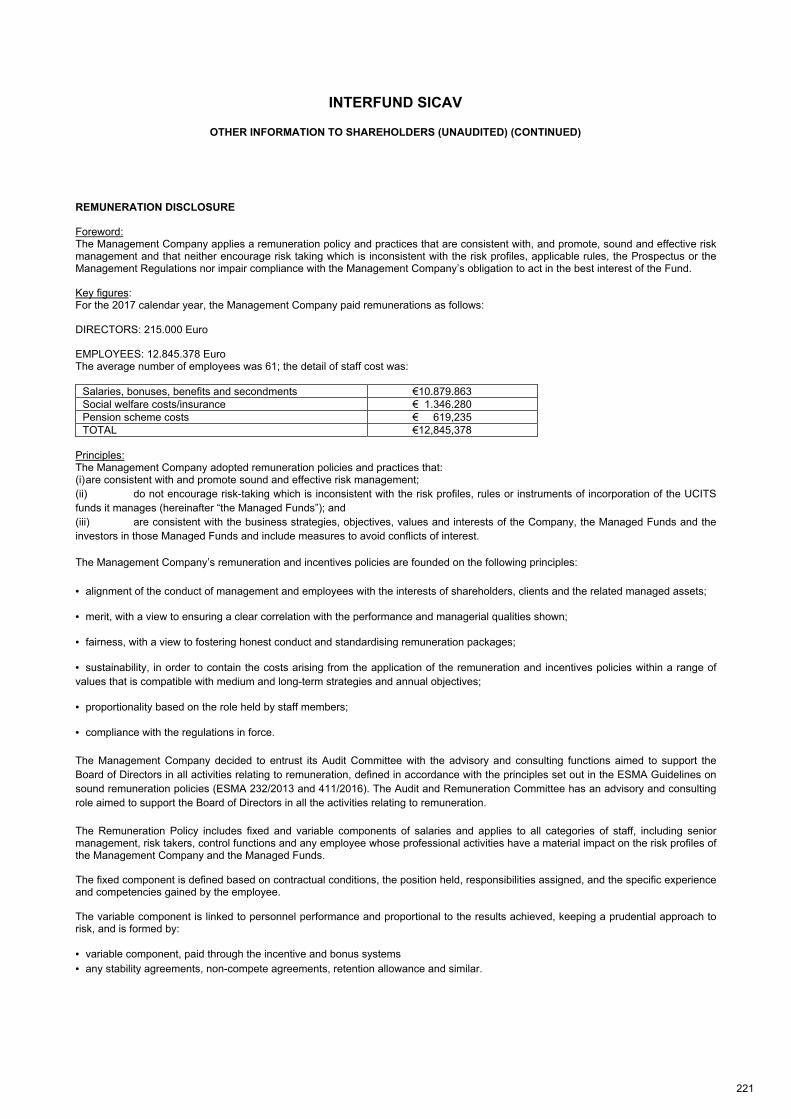
INTERFUND SICAV
OTHER INFORMATION TO SHAREHOLDERS (UNAUDITED) (CONTINUED)
221
REMUNERATION DISCLOSURE Foreword: The Management Company applies a remuneration policy and practices that are consistent with, and promote, sound and effective risk management and that neither encourage risk taking which is inconsistent with the risk profiles, applicable rules, the Prospectus or the Management Regulations nor impair compliance with the Management Company’s obligation to act in the best interest of the Fund. Key figures: For the 2017 calendar year, the Management Company paid remunerations as follows: DIRECTORS: 215.000 Euro EMPLOYEES: 12.845.378 Euro The average number of employees was 61; the detail of staff cost was:
Salaries, bonuses, benefits and secondments €10.879.863
Social welfare costs/insurance € 1.346.280
Pension scheme costs € 619,235
TOTAL €12,845,378
Principles: The Management Company adopted remuneration policies and practices that: (i) are consistent with and promote sound and effective risk management;
(ii) do not encourage risk-taking which is inconsistent with the risk profiles, rules or instruments of incorporation of the UCITS
funds it manages (hereinafter “the Managed Funds”); and
(iii) are consistent with the business strategies, objectives, values and interests of the Company, the Managed Funds and the
investors in those Managed Funds and include measures to avoid conflicts of interest.
The Management Company’s remuneration and incentives policies are founded on the following principles:
• alignment of the conduct of management and employees with the interests of shareholders, clients and the related managed assets;
• merit, with a view to ensuring a clear correlation with the performance and managerial qualities shown;
• fairness, with a view to fostering honest conduct and standardising remuneration packages;
• sustainability, in order to contain the costs arising from the application of the remuneration and incentives policies within a range of
values that is compatible with medium and long-term strategies and annual objectives;
• proportionality based on the role held by staff members;
• compliance with the regulations in force.
The Management Company decided to entrust its Audit Committee with the advisory and consulting functions aimed to support the
Board of Directors in all activities relating to remuneration, defined in accordance with the principles set out in the ESMA Guidelines on
sound remuneration policies (ESMA 232/2013 and 411/2016). The Audit and Remuneration Committee has an advisory and consulting
role aimed to support the Board of Directors in all the activities relating to remuneration.
The Remuneration Policy includes fixed and variable components of salaries and applies to all categories of staff, including senior management, risk takers, control functions and any employee whose professional activities have a material impact on the risk profiles of the Management Company and the Managed Funds. The fixed component is defined based on contractual conditions, the position held, responsibilities assigned, and the specific experience and competencies gained by the employee. The variable component is linked to personnel performance and proportional to the results achieved, keeping a prudential approach to risk, and is formed by:
• variable component, paid through the incentive and bonus systems
• any stability agreements, non-compete agreements, retention allowance and similar.
INTERFUND SICAV
OTHER INFORMATION TO SHAREHOLDERS (UNAUDITED) (CONTINUED)
222
The remuneration policy is subject to an annual central and independent internal review, to ensure that:
• the overall remuneration system operates as intended;
• the remuneration pay-outs are appropriate;
• the risk profile, long term objectives and goals of the Managed Funds are adequately reflected; and
• the policy reflects best practice guidelines and regulatory requirements
The Group internal audit function conducts yearly missions on the rewarding and incentive system at the Management Company level.
The audit conducted during the Financial year 2017 revealed a positive picture, characterised by an appropriate implementation of the
organisational model. Lastly, no irregularities have been detected in terms of individual compliance breaches among employees.
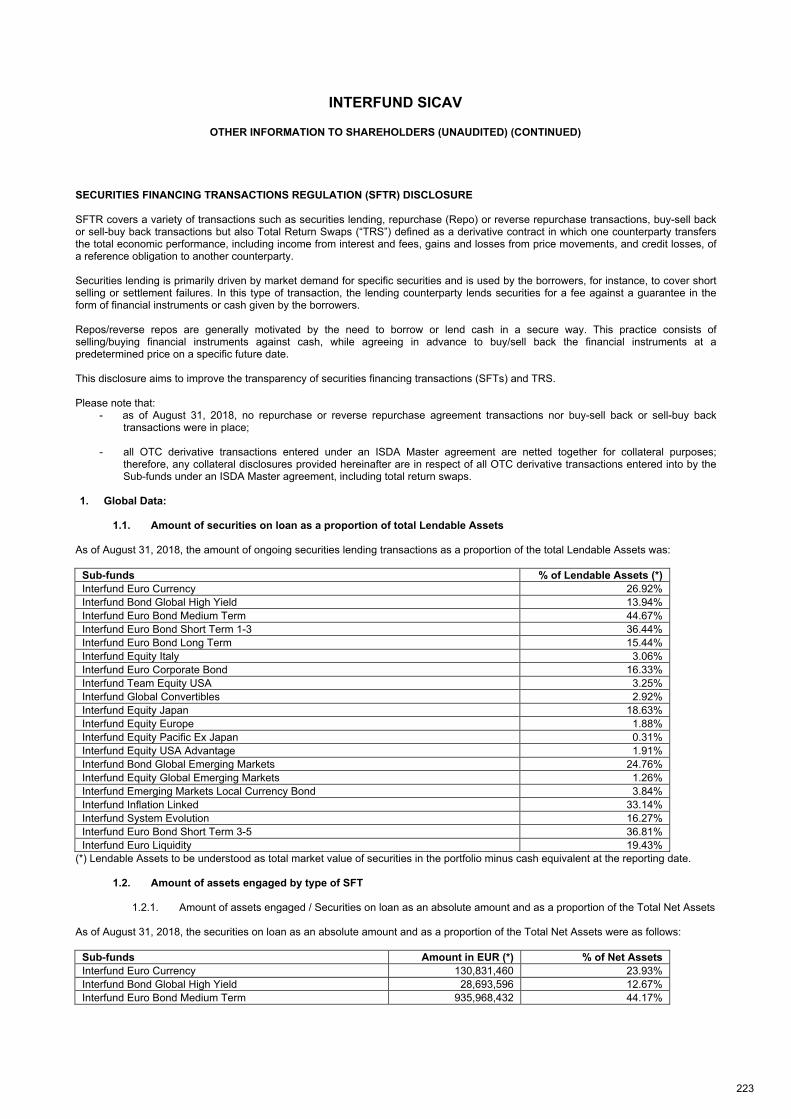
INTERFUND SICAV
OTHER INFORMATION TO SHAREHOLDERS (UNAUDITED) (CONTINUED)
223
SECURITIES FINANCING TRANSACTIONS REGULATION (SFTR) DISCLOSURE SFTR covers a variety of transactions such as securities lending, repurchase (Repo) or reverse repurchase transactions, buy-sell back or sell-buy back transactions but also Total Return Swaps (“TRS”) defined as a derivative contract in which one counterparty transfers the total economic performance, including income from interest and fees, gains and losses from price movements, and credit losses, of a reference obligation to another counterparty. Securities lending is primarily driven by market demand for specific securities and is used by the borrowers, for instance, to cover short selling or settlement failures. In this type of transaction, the lending counterparty lends securities for a fee against a guarantee in the form of financial instruments or cash given by the borrowers. Repos/reverse repos are generally motivated by the need to borrow or lend cash in a secure way. This practice consists of selling/buying financial instruments against cash, while agreeing in advance to buy/sell back the financial instruments at a predetermined price on a specific future date. This disclosure aims to improve the transparency of securities financing transactions (SFTs) and TRS. Please note that:
- as of August 31, 2018, no repurchase or reverse repurchase agreement transactions nor buy-sell back or sell-buy back transactions were in place;
- all OTC derivative transactions entered under an ISDA Master agreement are netted together for collateral purposes; therefore, any collateral disclosures provided hereinafter are in respect of all OTC derivative transactions entered into by the Sub-funds under an ISDA Master agreement, including total return swaps.
1. Global Data:
1.1. Amount of securities on loan as a proportion of total Lendable Assets
As of August 31, 2018, the amount of ongoing securities lending transactions as a proportion of the total Lendable Assets was:
Sub-funds % of Lendable Assets (*)
Interfund Euro Currency 26.92%
Interfund Bond Global High Yield 13.94%
Interfund Euro Bond Medium Term 44.67%
Interfund Euro Bond Short Term 1-3 36.44%
Interfund Euro Bond Long Term 15.44%
Interfund Equity Italy 3.06%
Interfund Euro Corporate Bond 16.33%
Interfund Team Equity USA 3.25%
Interfund Global Convertibles 2.92%
Interfund Equity Japan 18.63%
Interfund Equity Europe 1.88%
Interfund Equity Pacific Ex Japan 0.31%
Interfund Equity USA Advantage 1.91%
Interfund Bond Global Emerging Markets 24.76%
Interfund Equity Global Emerging Markets 1.26%
Interfund Emerging Markets Local Currency Bond 3.84%
Interfund Inflation Linked 33.14%
Interfund System Evolution 16.27%
Interfund Euro Bond Short Term 3-5 36.81%
Interfund Euro Liquidity 19.43%
(*) Lendable Assets to be understood as total market value of securities in the portfolio minus cash equivalent at the reporting date.
1.2. Amount of assets engaged by type of SFT
1.2.1. Amount of assets engaged / Securities on loan as an absolute amount and as a proportion of the Total Net Assets As of August 31, 2018, the securities on loan as an absolute amount and as a proportion of the Total Net Assets were as follows:
Sub-funds Amount in EUR (*) % of Net Assets
Interfund Euro Currency 130,831,460 23.93%
Interfund Bond Global High Yield 28,693,596 12.67%
Interfund Euro Bond Medium Term 935,968,432 44.17%
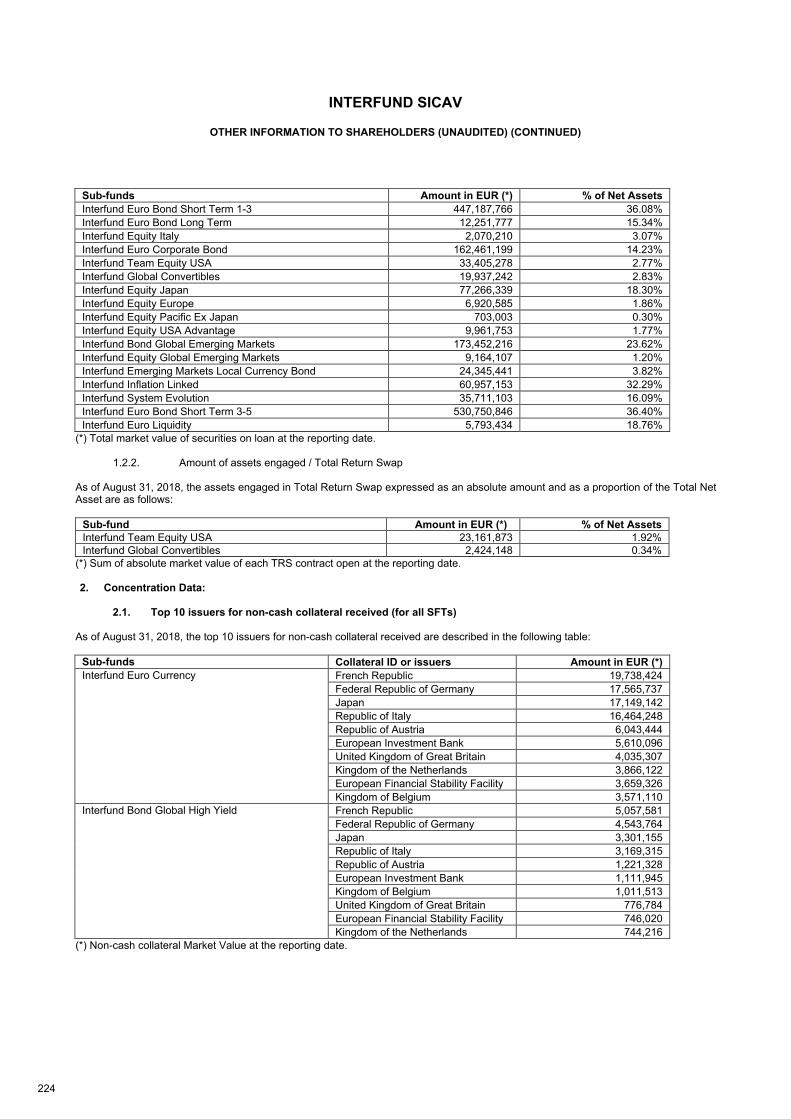
INTERFUND SICAV
OTHER INFORMATION TO SHAREHOLDERS (UNAUDITED) (CONTINUED)
224
Sub-funds Amount in EUR (*) % of Net Assets
Interfund Euro Bond Short Term 1-3 447,187,766 36.08%
Interfund Euro Bond Long Term 12,251,777 15.34%
Interfund Equity Italy 2,070,210 3.07%
Interfund Euro Corporate Bond 162,461,199 14.23%
Interfund Team Equity USA 33,405,278 2.77%
Interfund Global Convertibles 19,937,242 2.83%
Interfund Equity Japan 77,266,339 18.30%
Interfund Equity Europe 6,920,585 1.86%
Interfund Equity Pacific Ex Japan 703,003 0.30%
Interfund Equity USA Advantage 9,961,753 1.77%
Interfund Bond Global Emerging Markets 173,452,216 23.62%
Interfund Equity Global Emerging Markets 9,164,107 1.20%
Interfund Emerging Markets Local Currency Bond 24,345,441 3.82%
Interfund Inflation Linked 60,957,153 32.29%
Interfund System Evolution 35,711,103 16.09%
Interfund Euro Bond Short Term 3-5 530,750,846 36.40%
Interfund Euro Liquidity 5,793,434 18.76%
(*) Total market value of securities on loan at the reporting date.
1.2.2. Amount of assets engaged / Total Return Swap As of August 31, 2018, the assets engaged in Total Return Swap expressed as an absolute amount and as a proportion of the Total Net Asset are as follows:
Sub-fund Amount in EUR (*) % of Net Assets
Interfund Team Equity USA 23,161,873 1.92%
Interfund Global Convertibles 2,424,148 0.34%
(*) Sum of absolute market value of each TRS contract open at the reporting date. 2. Concentration Data:
2.1. Top 10 issuers for non-cash collateral received (for all SFTs)
As of August 31, 2018, the top 10 issuers for non-cash collateral received are described in the following table:
Sub-funds Collateral ID or issuers Amount in EUR (*)
Interfund Euro Currency French Republic 19,738,424
Federal Republic of Germany 17,565,737
Japan 17,149,142
Republic of Italy 16,464,248
Republic of Austria 6,043,444
European Investment Bank 5,610,096
United Kingdom of Great Britain 4,035,307
Kingdom of the Netherlands 3,866,122
European Financial Stability Facility 3,659,326
Kingdom of Belgium 3,571,110
Interfund Bond Global High Yield French Republic 5,057,581
Federal Republic of Germany 4,543,764
Japan 3,301,155
Republic of Italy 3,169,315
Republic of Austria 1,221,328
European Investment Bank 1,111,945
Kingdom of Belgium 1,011,513
United Kingdom of Great Britain 776,784
European Financial Stability Facility 746,020
Kingdom of the Netherlands 744,216
(*) Non-cash collateral Market Value at the reporting date.
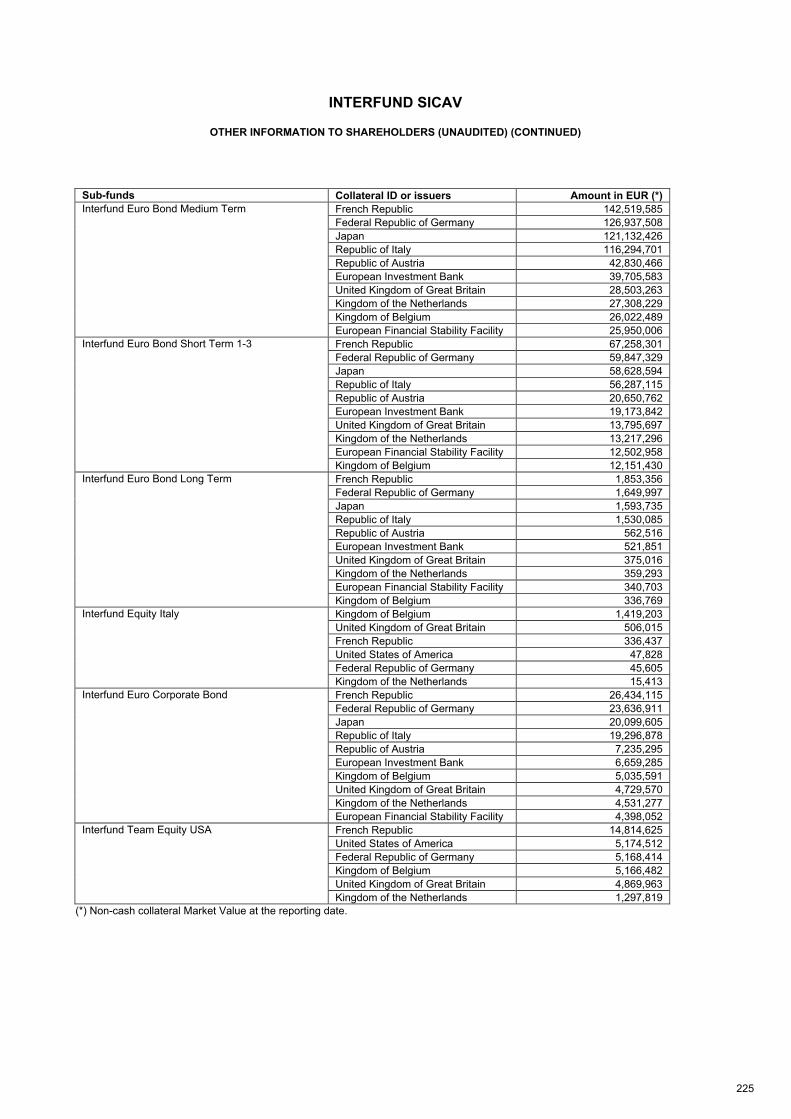
INTERFUND SICAV
OTHER INFORMATION TO SHAREHOLDERS (UNAUDITED) (CONTINUED)
225
Sub-funds Collateral ID or issuers Amount in EUR (*)
Interfund Euro Bond Medium Term French Republic 142,519,585
Federal Republic of Germany 126,937,508
Japan 121,132,426
Republic of Italy 116,294,701
Republic of Austria 42,830,466
European Investment Bank 39,705,583
United Kingdom of Great Britain 28,503,263
Kingdom of the Netherlands 27,308,229
Kingdom of Belgium 26,022,489
European Financial Stability Facility 25,950,006
Interfund Euro Bond Short Term 1-3 French Republic 67,258,301
Federal Republic of Germany 59,847,329
Japan 58,628,594
Republic of Italy 56,287,115
Republic of Austria 20,650,762
European Investment Bank 19,173,842
United Kingdom of Great Britain 13,795,697
Kingdom of the Netherlands 13,217,296
European Financial Stability Facility 12,502,958
Kingdom of Belgium 12,151,430
Interfund Euro Bond Long Term French Republic 1,853,356
Federal Republic of Germany 1,649,997
Japan 1,593,735
Republic of Italy 1,530,085
Republic of Austria 562,516
European Investment Bank 521,851
United Kingdom of Great Britain 375,016
Kingdom of the Netherlands 359,293
European Financial Stability Facility 340,703
Kingdom of Belgium 336,769
Interfund Equity Italy Kingdom of Belgium 1,419,203
United Kingdom of Great Britain 506,015
French Republic 336,437
United States of America 47,828
Federal Republic of Germany 45,605
Kingdom of the Netherlands 15,413
Interfund Euro Corporate Bond French Republic 26,434,115
Federal Republic of Germany 23,636,911
Japan 20,099,605
Republic of Italy 19,296,878
Republic of Austria 7,235,295
European Investment Bank 6,659,285
Kingdom of Belgium 5,035,591
United Kingdom of Great Britain 4,729,570
Kingdom of the Netherlands 4,531,277
European Financial Stability Facility 4,398,052
Interfund Team Equity USA French Republic 14,814,625
United States of America 5,174,512
Federal Republic of Germany 5,168,414
Kingdom of Belgium 5,166,482
United Kingdom of Great Britain 4,869,963
Kingdom of the Netherlands 1,297,819
(*) Non-cash collateral Market Value at the reporting date.
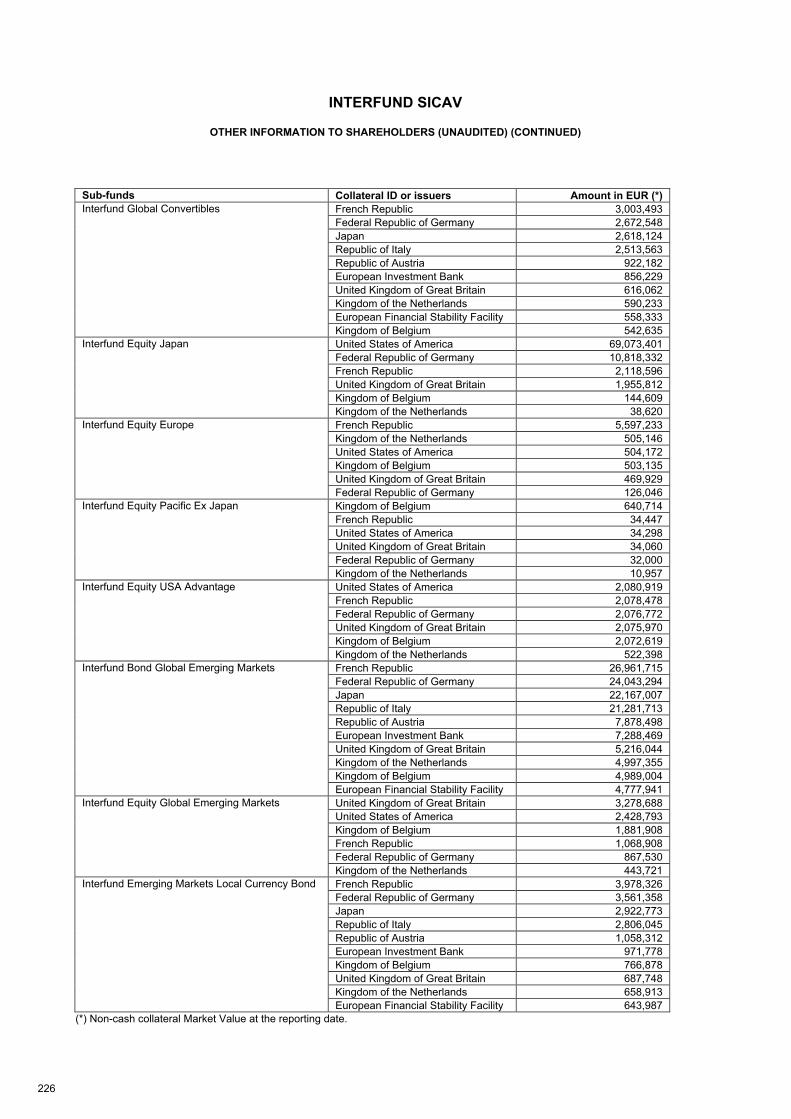
INTERFUND SICAV
OTHER INFORMATION TO SHAREHOLDERS (UNAUDITED) (CONTINUED)
226
Sub-funds Collateral ID or issuers Amount in EUR (*)
Interfund Global Convertibles French Republic 3,003,493
Federal Republic of Germany 2,672,548
Japan 2,618,124
Republic of Italy 2,513,563
Republic of Austria 922,182
European Investment Bank 856,229
United Kingdom of Great Britain 616,062
Kingdom of the Netherlands 590,233
European Financial Stability Facility 558,333
Kingdom of Belgium 542,635
Interfund Equity Japan United States of America 69,073,401
Federal Republic of Germany 10,818,332
French Republic 2,118,596
United Kingdom of Great Britain 1,955,812
Kingdom of Belgium 144,609
Kingdom of the Netherlands 38,620
Interfund Equity Europe French Republic 5,597,233
Kingdom of the Netherlands 505,146
United States of America 504,172
Kingdom of Belgium 503,135
United Kingdom of Great Britain 469,929
Federal Republic of Germany 126,046
Interfund Equity Pacific Ex Japan Kingdom of Belgium 640,714
French Republic 34,447
United States of America 34,298
United Kingdom of Great Britain 34,060
Federal Republic of Germany 32,000
Kingdom of the Netherlands 10,957
Interfund Equity USA Advantage United States of America 2,080,919
French Republic 2,078,478
Federal Republic of Germany 2,076,772
United Kingdom of Great Britain 2,075,970
Kingdom of Belgium 2,072,619
Kingdom of the Netherlands 522,398
Interfund Bond Global Emerging Markets French Republic 26,961,715
Federal Republic of Germany 24,043,294
Japan 22,167,007
Republic of Italy 21,281,713
Republic of Austria 7,878,498
European Investment Bank 7,288,469
United Kingdom of Great Britain 5,216,044
Kingdom of the Netherlands 4,997,355
Kingdom of Belgium 4,989,004
European Financial Stability Facility 4,777,941
Interfund Equity Global Emerging Markets United Kingdom of Great Britain 3,278,688
United States of America 2,428,793
Kingdom of Belgium 1,881,908
French Republic 1,068,908
Federal Republic of Germany 867,530
Kingdom of the Netherlands 443,721
Interfund Emerging Markets Local Currency Bond French Republic 3,978,326
Federal Republic of Germany 3,561,358
Japan 2,922,773
Republic of Italy 2,806,045
Republic of Austria 1,058,312
European Investment Bank 971,778
Kingdom of Belgium 766,878
United Kingdom of Great Britain 687,748
Kingdom of the Netherlands 658,913
European Financial Stability Facility 643,987
(*) Non-cash collateral Market Value at the reporting date.
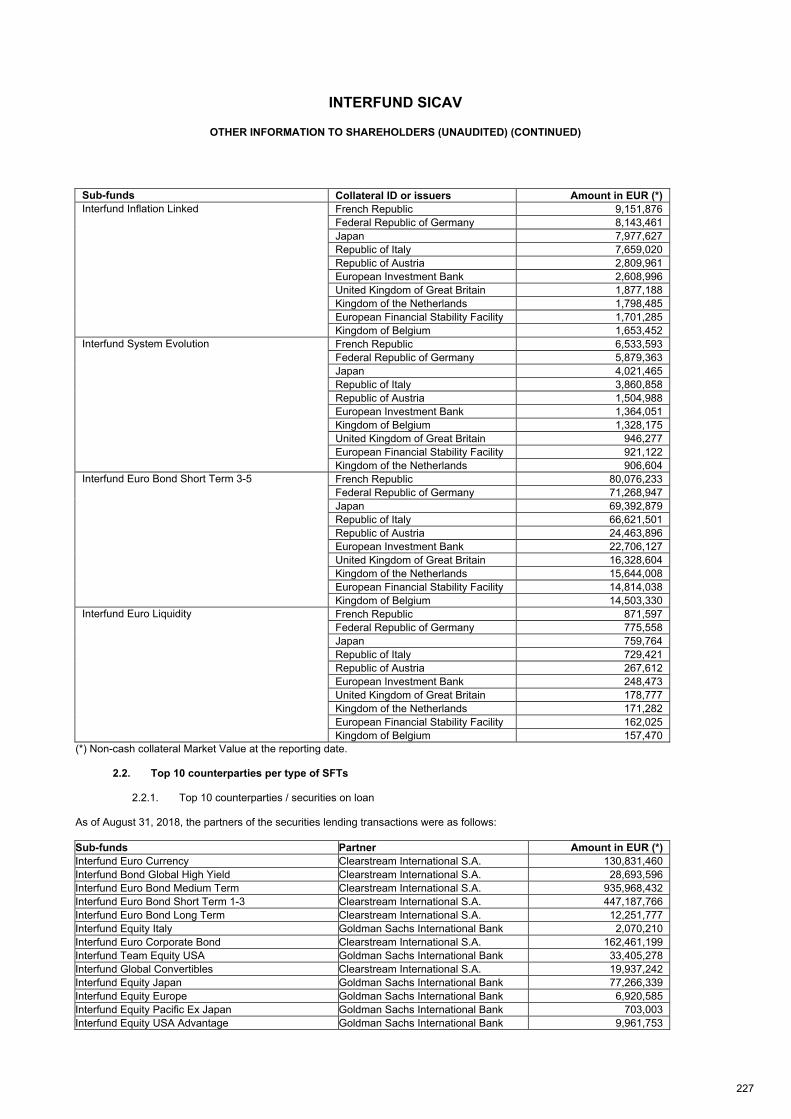
INTERFUND SICAV
OTHER INFORMATION TO SHAREHOLDERS (UNAUDITED) (CONTINUED)
227
Sub-funds Collateral ID or issuers Amount in EUR (*)
Interfund Inflation Linked French Republic 9,151,876
Federal Republic of Germany 8,143,461
Japan 7,977,627
Republic of Italy 7,659,020
Republic of Austria 2,809,961
European Investment Bank 2,608,996
United Kingdom of Great Britain 1,877,188
Kingdom of the Netherlands 1,798,485
European Financial Stability Facility 1,701,285
Kingdom of Belgium 1,653,452
Interfund System Evolution French Republic 6,533,593
Federal Republic of Germany 5,879,363
Japan 4,021,465
Republic of Italy 3,860,858
Republic of Austria 1,504,988
European Investment Bank 1,364,051
Kingdom of Belgium 1,328,175
United Kingdom of Great Britain 946,277
European Financial Stability Facility 921,122
Kingdom of the Netherlands 906,604
Interfund Euro Bond Short Term 3-5 French Republic 80,076,233
Federal Republic of Germany 71,268,947
Japan 69,392,879
Republic of Italy 66,621,501
Republic of Austria 24,463,896
European Investment Bank 22,706,127
United Kingdom of Great Britain 16,328,604
Kingdom of the Netherlands 15,644,008
European Financial Stability Facility 14,814,038
Kingdom of Belgium 14,503,330
Interfund Euro Liquidity French Republic 871,597
Federal Republic of Germany 775,558
Japan 759,764
Republic of Italy 729,421
Republic of Austria 267,612
European Investment Bank 248,473
United Kingdom of Great Britain 178,777
Kingdom of the Netherlands 171,282
European Financial Stability Facility 162,025
Kingdom of Belgium 157,470
(*) Non-cash collateral Market Value at the reporting date.
2.2. Top 10 counterparties per type of SFTs
2.2.1. Top 10 counterparties / securities on loan As of August 31, 2018, the partners of the securities lending transactions were as follows:
Sub-funds Partner Amount in EUR (*)
Interfund Euro Currency Clearstream International S.A. 130,831,460
Interfund Bond Global High Yield Clearstream International S.A. 28,693,596
Interfund Euro Bond Medium Term Clearstream International S.A. 935,968,432
Interfund Euro Bond Short Term 1-3 Clearstream International S.A. 447,187,766
Interfund Euro Bond Long Term Clearstream International S.A. 12,251,777
Interfund Equity Italy Goldman Sachs International Bank 2,070,210
Interfund Euro Corporate Bond Clearstream International S.A. 162,461,199
Interfund Team Equity USA Goldman Sachs International Bank 33,405,278
Interfund Global Convertibles Clearstream International S.A. 19,937,242
Interfund Equity Japan Goldman Sachs International Bank 77,266,339
Interfund Equity Europe Goldman Sachs International Bank 6,920,585
Interfund Equity Pacific Ex Japan Goldman Sachs International Bank 703,003
Interfund Equity USA Advantage Goldman Sachs International Bank 9,961,753
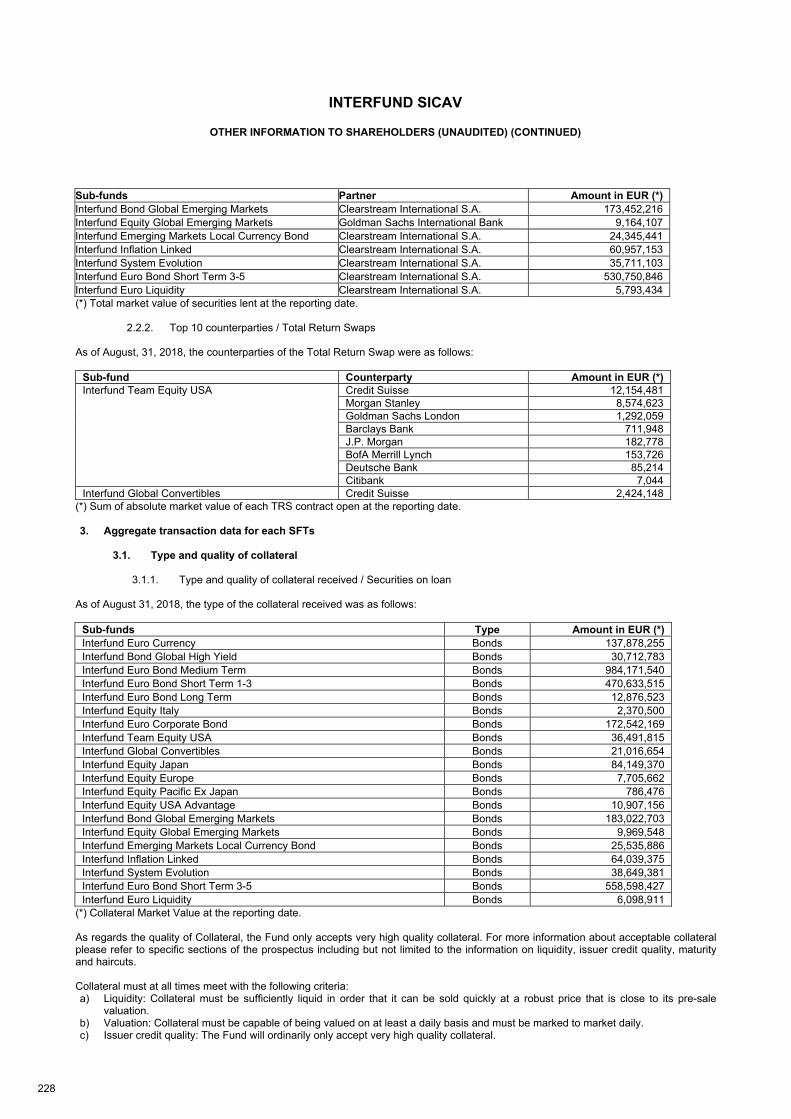
INTERFUND SICAV
OTHER INFORMATION TO SHAREHOLDERS (UNAUDITED) (CONTINUED)
228
Sub-funds Partner Amount in EUR (*)
Interfund Bond Global Emerging Markets Clearstream International S.A. 173,452,216
Interfund Equity Global Emerging Markets Goldman Sachs International Bank 9,164,107
Interfund Emerging Markets Local Currency Bond Clearstream International S.A. 24,345,441
Interfund Inflation Linked Clearstream International S.A. 60,957,153
Interfund System Evolution Clearstream International S.A. 35,711,103
Interfund Euro Bond Short Term 3-5 Clearstream International S.A. 530,750,846
Interfund Euro Liquidity Clearstream International S.A. 5,793,434
(*) Total market value of securities lent at the reporting date.
2.2.2. Top 10 counterparties / Total Return Swaps As of August, 31, 2018, the counterparties of the Total Return Swap were as follows:
Sub-fund Counterparty Amount in EUR (*)
Interfund Team Equity USA Credit Suisse 12,154,481
Morgan Stanley 8,574,623
Goldman Sachs London 1,292,059
Barclays Bank 711,948
J.P. Morgan 182,778
BofA Merrill Lynch 153,726
Deutsche Bank 85,214
Citibank 7,044
Interfund Global Convertibles Credit Suisse 2,424,148
(*) Sum of absolute market value of each TRS contract open at the reporting date. 3. Aggregate transaction data for each SFTs
3.1. Type and quality of collateral
3.1.1. Type and quality of collateral received / Securities on loan
As of August 31, 2018, the type of the collateral received was as follows:
Sub-funds Type Amount in EUR (*)
Interfund Euro Currency Bonds 137,878,255
Interfund Bond Global High Yield Bonds 30,712,783
Interfund Euro Bond Medium Term Bonds 984,171,540
Interfund Euro Bond Short Term 1-3 Bonds 470,633,515
Interfund Euro Bond Long Term Bonds 12,876,523
Interfund Equity Italy Bonds 2,370,500
Interfund Euro Corporate Bond Bonds 172,542,169
Interfund Team Equity USA Bonds 36,491,815
Interfund Global Convertibles Bonds 21,016,654
Interfund Equity Japan Bonds 84,149,370
Interfund Equity Europe Bonds 7,705,662
Interfund Equity Pacific Ex Japan Bonds 786,476
Interfund Equity USA Advantage Bonds 10,907,156
Interfund Bond Global Emerging Markets Bonds 183,022,703
Interfund Equity Global Emerging Markets Bonds 9,969,548
Interfund Emerging Markets Local Currency Bond Bonds 25,535,886
Interfund Inflation Linked Bonds 64,039,375
Interfund System Evolution Bonds 38,649,381
Interfund Euro Bond Short Term 3-5 Bonds 558,598,427
Interfund Euro Liquidity Bonds 6,098,911
(*) Collateral Market Value at the reporting date. As regards the quality of Collateral, the Fund only accepts very high quality collateral. For more information about acceptable collateral please refer to specific sections of the prospectus including but not limited to the information on liquidity, issuer credit quality, maturity and haircuts. Collateral must at all times meet with the following criteria: a) Liquidity: Collateral must be sufficiently liquid in order that it can be sold quickly at a robust price that is close to its pre-sale
valuation. b) Valuation: Collateral must be capable of being valued on at least a daily basis and must be marked to market daily. c) Issuer credit quality: The Fund will ordinarily only accept very high quality collateral.
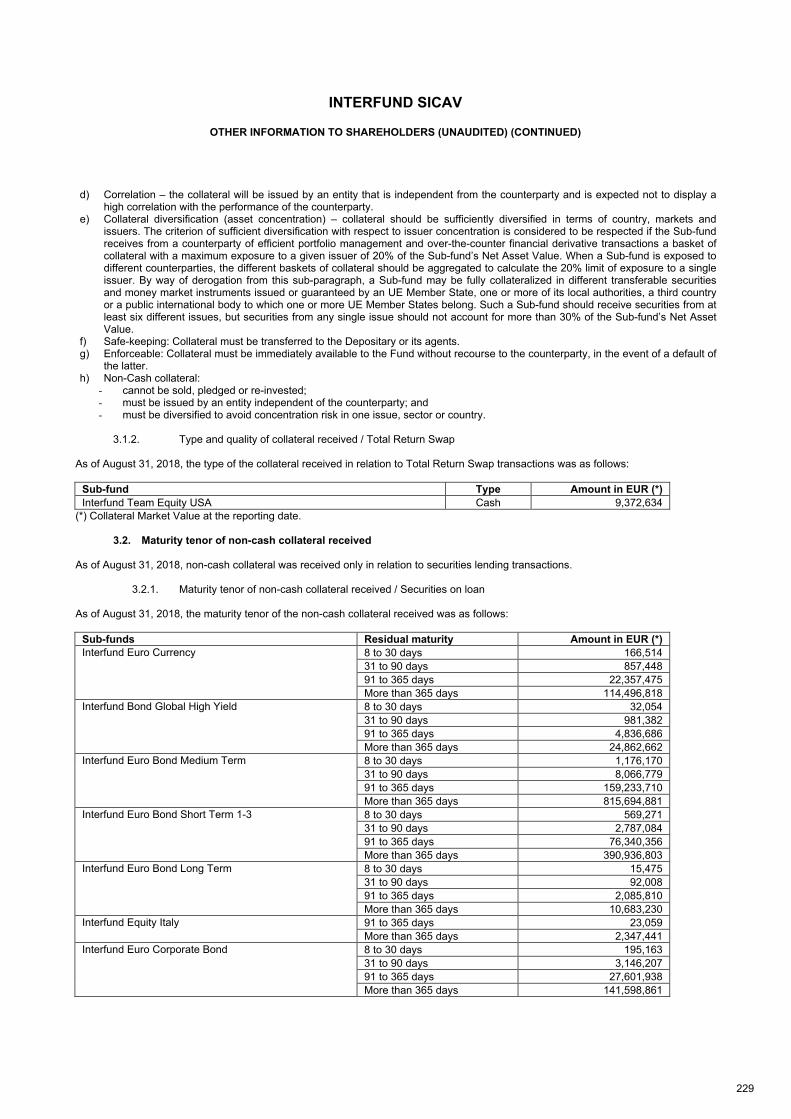
INTERFUND SICAV
OTHER INFORMATION TO SHAREHOLDERS (UNAUDITED) (CONTINUED)
229
d) Correlation – the collateral will be issued by an entity that is independent from the counterparty and is expected not to display a high correlation with the performance of the counterparty.
e) Collateral diversification (asset concentration) – collateral should be sufficiently diversified in terms of country, markets and issuers. The criterion of sufficient diversification with respect to issuer concentration is considered to be respected if the Sub-fund receives from a counterparty of efficient portfolio management and over-the-counter financial derivative transactions a basket of collateral with a maximum exposure to a given issuer of 20% of the Sub-fund’s Net Asset Value. When a Sub-fund is exposed to different counterparties, the different baskets of collateral should be aggregated to calculate the 20% limit of exposure to a single issuer. By way of derogation from this sub-paragraph, a Sub-fund may be fully collateralized in different transferable securities and money market instruments issued or guaranteed by an UE Member State, one or more of its local authorities, a third country or a public international body to which one or more UE Member States belong. Such a Sub-fund should receive securities from at least six different issues, but securities from any single issue should not account for more than 30% of the Sub-fund’s Net Asset Value.
f) Safe-keeping: Collateral must be transferred to the Depositary or its agents. g) Enforceable: Collateral must be immediately available to the Fund without recourse to the counterparty, in the event of a default of
the latter. h) Non-Cash collateral:
- cannot be sold, pledged or re-invested; - must be issued by an entity independent of the counterparty; and - must be diversified to avoid concentration risk in one issue, sector or country.
3.1.2. Type and quality of collateral received / Total Return Swap
As of August 31, 2018, the type of the collateral received in relation to Total Return Swap transactions was as follows:
Sub-fund Type Amount in EUR (*)
Interfund Team Equity USA Cash 9,372,634
(*) Collateral Market Value at the reporting date.
3.2. Maturity tenor of non-cash collateral received As of August 31, 2018, non-cash collateral was received only in relation to securities lending transactions.
3.2.1. Maturity tenor of non-cash collateral received / Securities on loan As of August 31, 2018, the maturity tenor of the non-cash collateral received was as follows:
Sub-funds Residual maturity Amount in EUR (*)
Interfund Euro Currency 8 to 30 days 166,514
31 to 90 days 857,448
91 to 365 days 22,357,475
More than 365 days 114,496,818
Interfund Bond Global High Yield 8 to 30 days 32,054
31 to 90 days 981,382
91 to 365 days 4,836,686
More than 365 days 24,862,662
Interfund Euro Bond Medium Term 8 to 30 days 1,176,170
31 to 90 days 8,066,779
91 to 365 days 159,233,710
More than 365 days 815,694,881
Interfund Euro Bond Short Term 1-3 8 to 30 days 569,271
31 to 90 days 2,787,084
91 to 365 days 76,340,356
More than 365 days 390,936,803
Interfund Euro Bond Long Term 8 to 30 days 15,475
31 to 90 days 92,008
91 to 365 days 2,085,810
More than 365 days 10,683,230
Interfund Equity Italy 91 to 365 days 23,059
More than 365 days 2,347,441
Interfund Euro Corporate Bond 8 to 30 days 195,163
31 to 90 days 3,146,207
91 to 365 days 27,601,938
More than 365 days 141,598,861
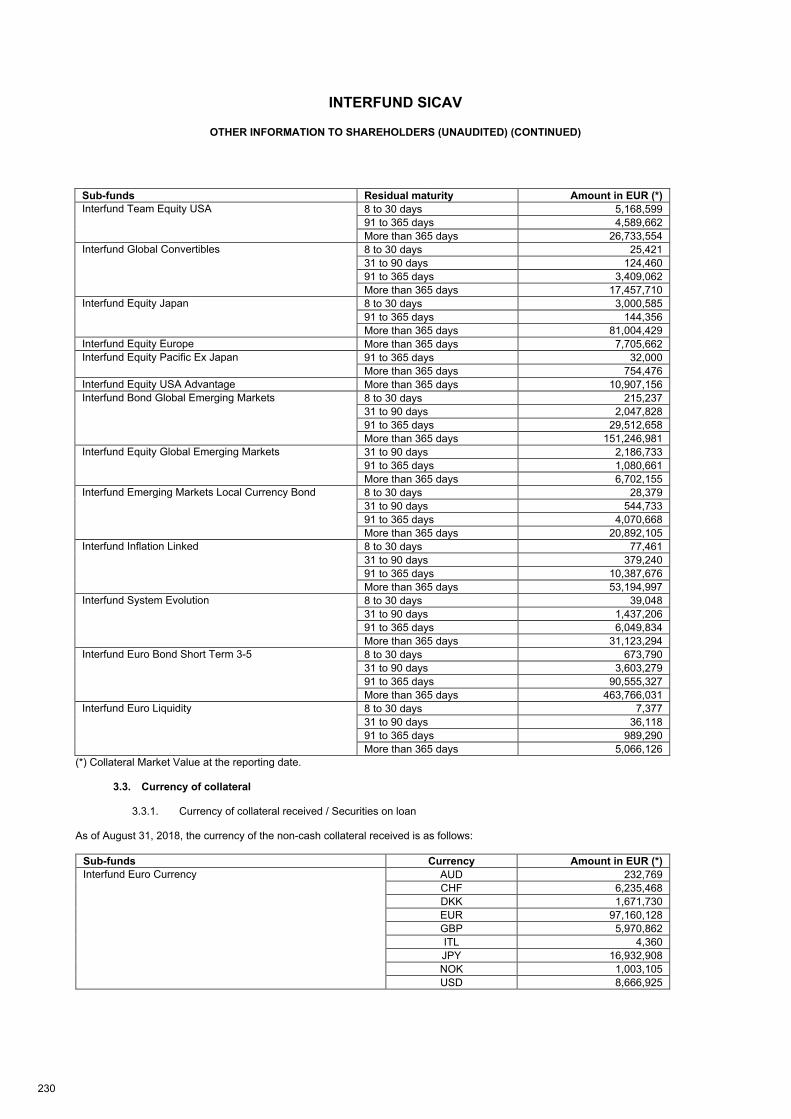
INTERFUND SICAV
OTHER INFORMATION TO SHAREHOLDERS (UNAUDITED) (CONTINUED)
230
Sub-funds Residual maturity Amount in EUR (*)
Interfund Team Equity USA 8 to 30 days 5,168,599
91 to 365 days 4,589,662
More than 365 days 26,733,554
Interfund Global Convertibles 8 to 30 days 25,421
31 to 90 days 124,460
91 to 365 days 3,409,062
More than 365 days 17,457,710
Interfund Equity Japan 8 to 30 days 3,000,585
91 to 365 days 144,356
More than 365 days 81,004,429
Interfund Equity Europe More than 365 days 7,705,662
Interfund Equity Pacific Ex Japan 91 to 365 days 32,000
More than 365 days 754,476
Interfund Equity USA Advantage More than 365 days 10,907,156
Interfund Bond Global Emerging Markets 8 to 30 days 215,237
31 to 90 days 2,047,828
91 to 365 days 29,512,658
More than 365 days 151,246,981
Interfund Equity Global Emerging Markets 31 to 90 days 2,186,733
91 to 365 days 1,080,661
More than 365 days 6,702,155
Interfund Emerging Markets Local Currency Bond 8 to 30 days 28,379
31 to 90 days 544,733
91 to 365 days 4,070,668
More than 365 days 20,892,105
Interfund Inflation Linked 8 to 30 days 77,461
31 to 90 days 379,240
91 to 365 days 10,387,676
More than 365 days 53,194,997
Interfund System Evolution 8 to 30 days 39,048
31 to 90 days 1,437,206
91 to 365 days 6,049,834
More than 365 days 31,123,294
Interfund Euro Bond Short Term 3-5 8 to 30 days 673,790
31 to 90 days 3,603,279
91 to 365 days 90,555,327
More than 365 days 463,766,031
Interfund Euro Liquidity 8 to 30 days 7,377
31 to 90 days 36,118
91 to 365 days 989,290
More than 365 days 5,066,126
(*) Collateral Market Value at the reporting date.
3.3. Currency of collateral
3.3.1. Currency of collateral received / Securities on loan As of August 31, 2018, the currency of the non-cash collateral received is as follows:
Sub-funds Currency Amount in EUR (*)
Interfund Euro Currency AUD 232,769
CHF 6,235,468
DKK 1,671,730
EUR 97,160,128
GBP 5,970,862
ITL 4,360
JPY 16,932,908
NOK 1,003,105
USD 8,666,925
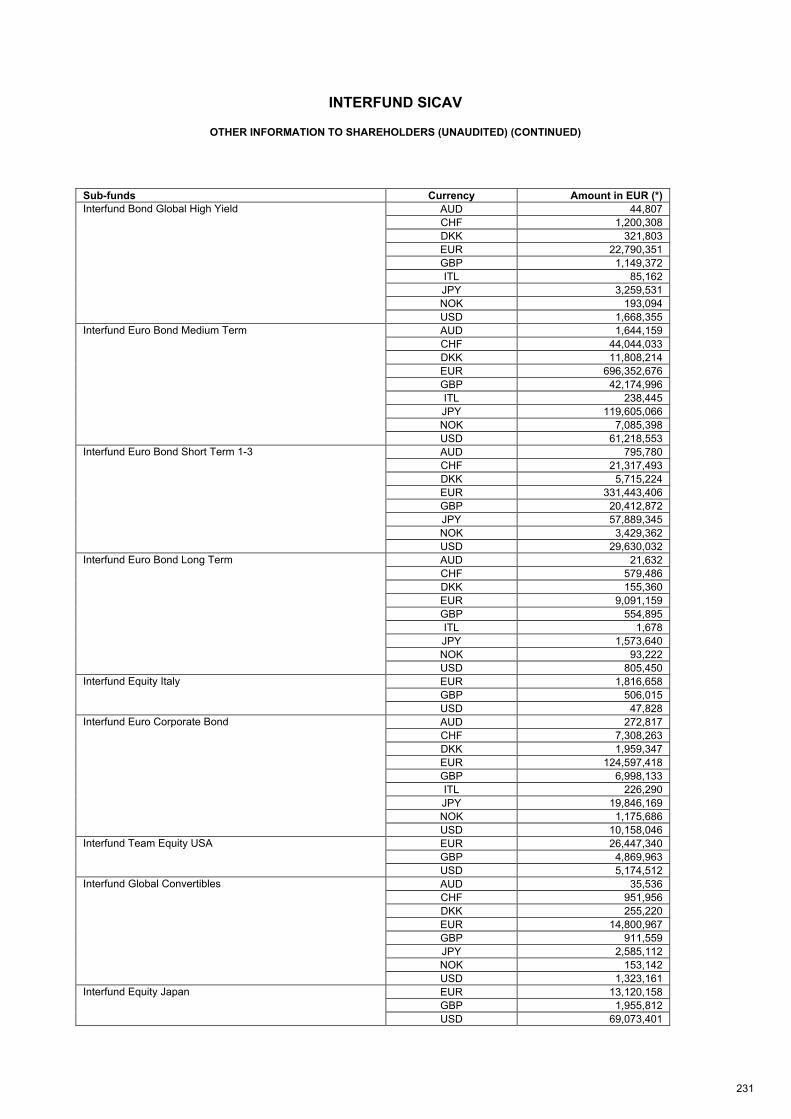
INTERFUND SICAV
OTHER INFORMATION TO SHAREHOLDERS (UNAUDITED) (CONTINUED)
231
Sub-funds Currency Amount in EUR (*)
Interfund Bond Global High Yield AUD 44,807
CHF 1,200,308
DKK 321,803
EUR 22,790,351
GBP 1,149,372
ITL 85,162
JPY 3,259,531
NOK 193,094
USD 1,668,355
Interfund Euro Bond Medium Term AUD 1,644,159
CHF 44,044,033
DKK 11,808,214
EUR 696,352,676
GBP 42,174,996
ITL 238,445
JPY 119,605,066
NOK 7,085,398
USD 61,218,553
Interfund Euro Bond Short Term 1-3 AUD 795,780
CHF 21,317,493
DKK 5,715,224
EUR 331,443,406
GBP 20,412,872
JPY 57,889,345
NOK 3,429,362
USD 29,630,032
Interfund Euro Bond Long Term AUD 21,632
CHF 579,486
DKK 155,360
EUR 9,091,159
GBP 554,895
ITL 1,678
JPY 1,573,640
NOK 93,222
USD 805,450
Interfund Equity Italy EUR 1,816,658
GBP 506,015
USD 47,828
Interfund Euro Corporate Bond AUD 272,817
CHF 7,308,263
DKK 1,959,347
EUR 124,597,418
GBP 6,998,133
ITL 226,290
JPY 19,846,169
NOK 1,175,686
USD 10,158,046
Interfund Team Equity USA EUR 26,447,340
GBP 4,869,963
USD 5,174,512
Interfund Global Convertibles AUD 35,536
CHF 951,956
DKK 255,220
EUR 14,800,967
GBP 911,559
JPY 2,585,112
NOK 153,142
USD 1,323,161
Interfund Equity Japan EUR 13,120,158
GBP 1,955,812
USD 69,073,401
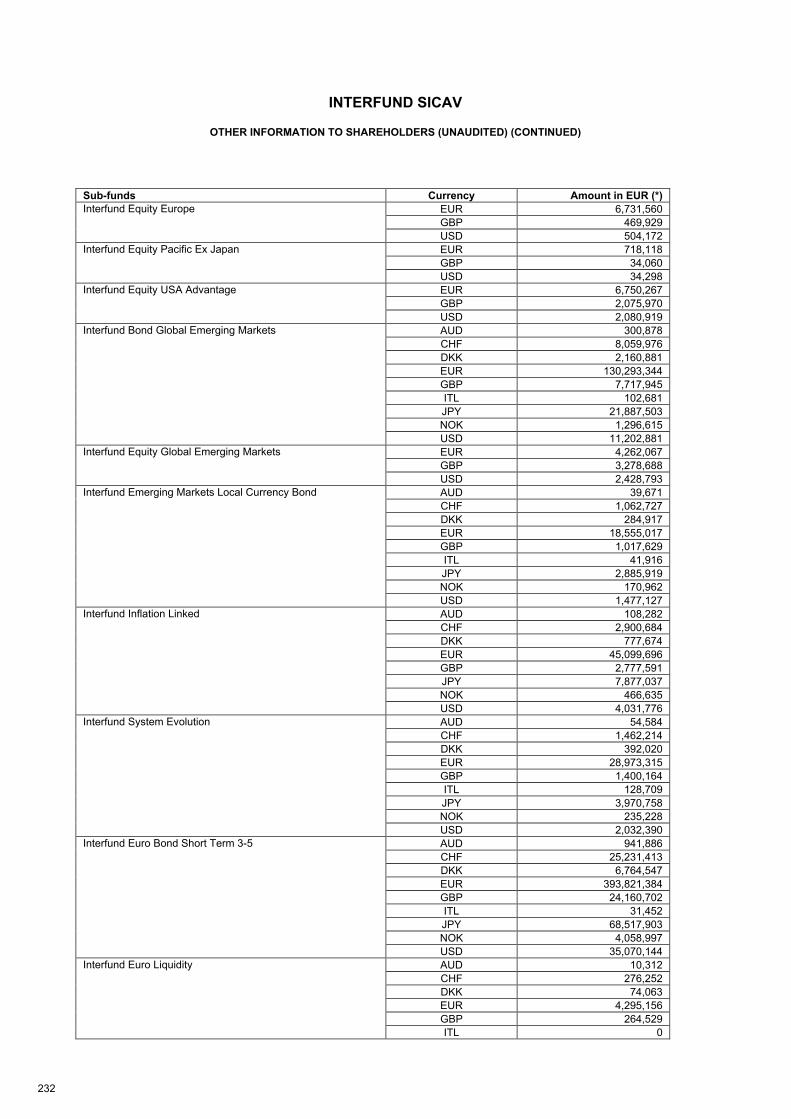
INTERFUND SICAV
OTHER INFORMATION TO SHAREHOLDERS (UNAUDITED) (CONTINUED)
232
Sub-funds Currency Amount in EUR (*)
Interfund Equity Europe EUR 6,731,560
GBP 469,929
USD 504,172
Interfund Equity Pacific Ex Japan EUR 718,118
GBP 34,060
USD 34,298
Interfund Equity USA Advantage EUR 6,750,267
GBP 2,075,970
USD 2,080,919
Interfund Bond Global Emerging Markets AUD 300,878
CHF 8,059,976
DKK 2,160,881
EUR 130,293,344
GBP 7,717,945
ITL 102,681
JPY 21,887,503
NOK 1,296,615
USD 11,202,881
Interfund Equity Global Emerging Markets EUR 4,262,067
GBP 3,278,688
USD 2,428,793
Interfund Emerging Markets Local Currency Bond AUD 39,671
CHF 1,062,727
DKK 284,917
EUR 18,555,017
GBP 1,017,629
ITL 41,916
JPY 2,885,919
NOK 170,962
USD 1,477,127
Interfund Inflation Linked AUD 108,282
CHF 2,900,684
DKK 777,674
EUR 45,099,696
GBP 2,777,591
JPY 7,877,037
NOK 466,635
USD 4,031,776
Interfund System Evolution AUD 54,584
CHF 1,462,214
DKK 392,020
EUR 28,973,315
GBP 1,400,164
ITL 128,709
JPY 3,970,758
NOK 235,228
USD 2,032,390
Interfund Euro Bond Short Term 3-5 AUD 941,886
CHF 25,231,413
DKK 6,764,547
EUR 393,821,384
GBP 24,160,702
ITL 31,452
JPY 68,517,903
NOK 4,058,997
USD 35,070,144
Interfund Euro Liquidity AUD 10,312
CHF 276,252
DKK 74,063
EUR 4,295,156
GBP 264,529
ITL 0
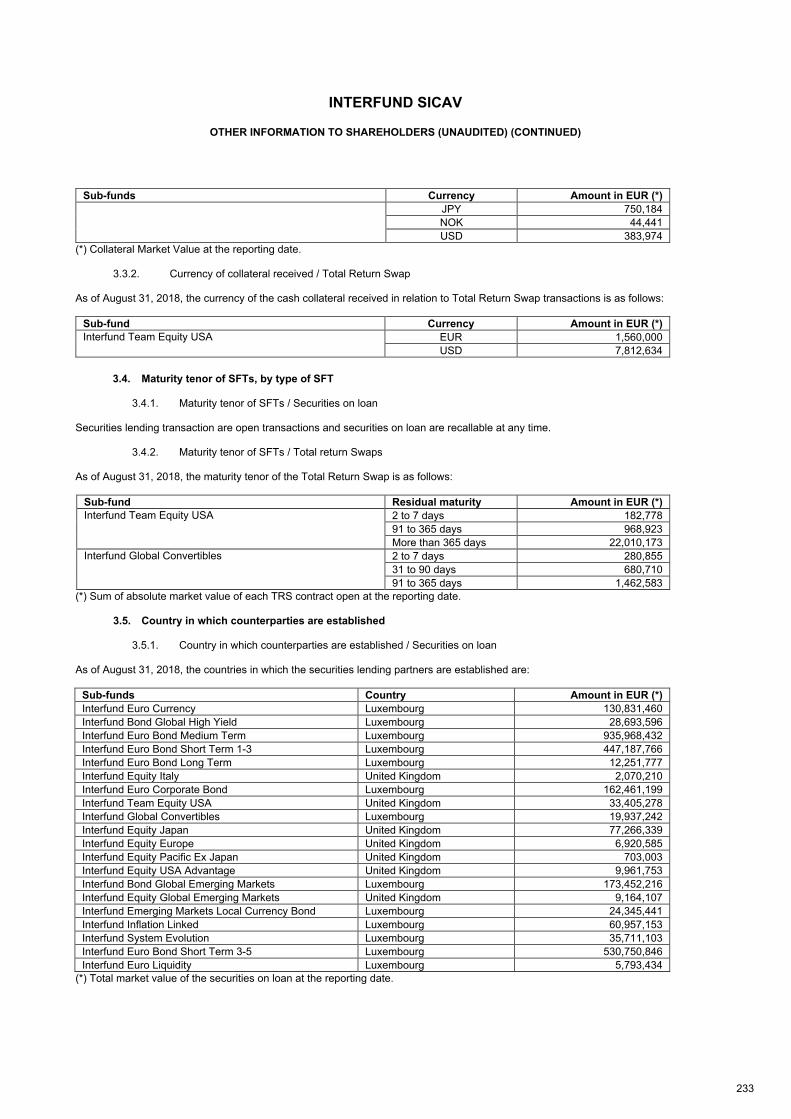
INTERFUND SICAV
OTHER INFORMATION TO SHAREHOLDERS (UNAUDITED) (CONTINUED)
233
Sub-funds Currency Amount in EUR (*)
JPY 750,184
NOK 44,441
USD 383,974
(*) Collateral Market Value at the reporting date.
3.3.2. Currency of collateral received / Total Return Swap As of August 31, 2018, the currency of the cash collateral received in relation to Total Return Swap transactions is as follows:
Sub-fund Currency Amount in EUR (*)
Interfund Team Equity USA EUR 1,560,000
USD 7,812,634
3.4. Maturity tenor of SFTs, by type of SFT
3.4.1. Maturity tenor of SFTs / Securities on loan Securities lending transaction are open transactions and securities on loan are recallable at any time.
3.4.2. Maturity tenor of SFTs / Total return Swaps As of August 31, 2018, the maturity tenor of the Total Return Swap is as follows:
Sub-fund Residual maturity Amount in EUR (*)
Interfund Team Equity USA 2 to 7 days 182,778
91 to 365 days 968,923
More than 365 days 22,010,173
Interfund Global Convertibles 2 to 7 days 280,855
31 to 90 days 680,710
91 to 365 days 1,462,583
(*) Sum of absolute market value of each TRS contract open at the reporting date.
3.5. Country in which counterparties are established
3.5.1. Country in which counterparties are established / Securities on loan As of August 31, 2018, the countries in which the securities lending partners are established are:
Sub-funds Country Amount in EUR (*)
Interfund Euro Currency Luxembourg 130,831,460
Interfund Bond Global High Yield Luxembourg 28,693,596
Interfund Euro Bond Medium Term Luxembourg 935,968,432
Interfund Euro Bond Short Term 1-3 Luxembourg 447,187,766
Interfund Euro Bond Long Term Luxembourg 12,251,777
Interfund Equity Italy United Kingdom 2,070,210
Interfund Euro Corporate Bond Luxembourg 162,461,199
Interfund Team Equity USA United Kingdom 33,405,278
Interfund Global Convertibles Luxembourg 19,937,242
Interfund Equity Japan United Kingdom 77,266,339
Interfund Equity Europe United Kingdom 6,920,585
Interfund Equity Pacific Ex Japan United Kingdom 703,003
Interfund Equity USA Advantage United Kingdom 9,961,753
Interfund Bond Global Emerging Markets Luxembourg 173,452,216
Interfund Equity Global Emerging Markets United Kingdom 9,164,107
Interfund Emerging Markets Local Currency Bond Luxembourg 24,345,441
Interfund Inflation Linked Luxembourg 60,957,153
Interfund System Evolution Luxembourg 35,711,103
Interfund Euro Bond Short Term 3-5 Luxembourg 530,750,846
Interfund Euro Liquidity Luxembourg 5,793,434
(*) Total market value of the securities on loan at the reporting date.
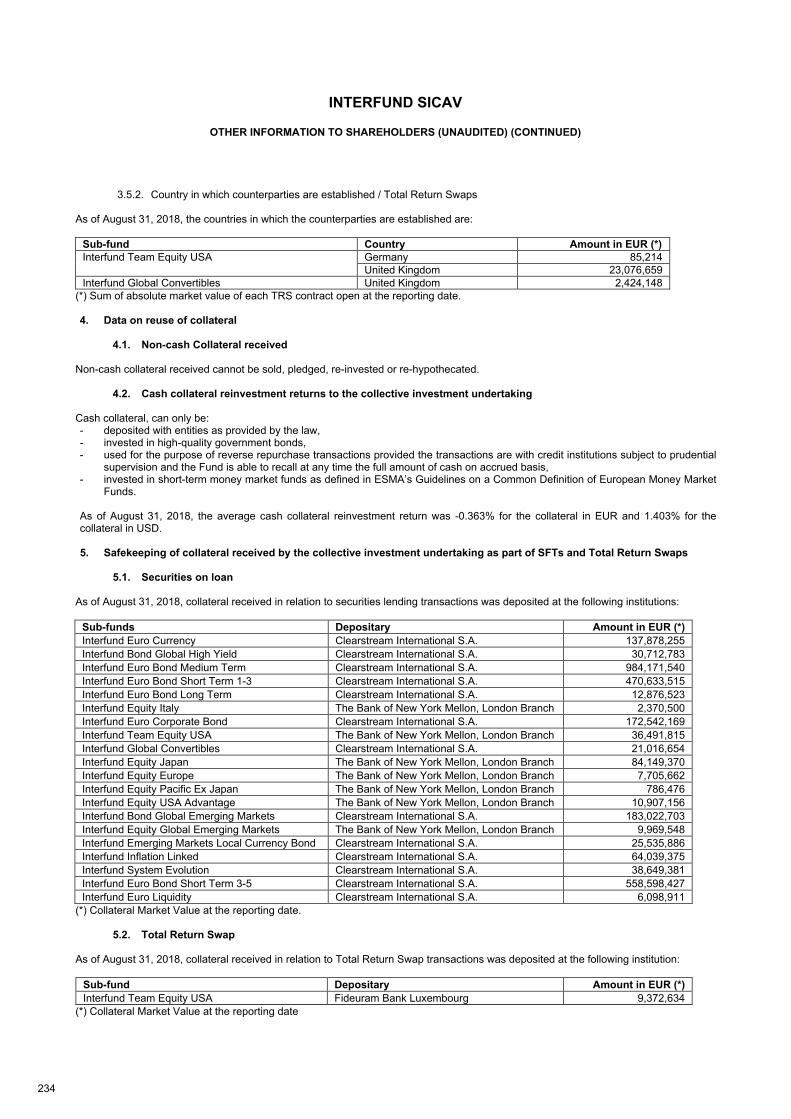
INTERFUND SICAV
OTHER INFORMATION TO SHAREHOLDERS (UNAUDITED) (CONTINUED)
234
3.5.2. Country in which counterparties are established / Total Return Swaps As of August 31, 2018, the countries in which the counterparties are established are:
Sub-fund Country Amount in EUR (*)
Interfund Team Equity USA Germany 85,214
United Kingdom 23,076,659
Interfund Global Convertibles United Kingdom 2,424,148
(*) Sum of absolute market value of each TRS contract open at the reporting date. 4. Data on reuse of collateral
4.1. Non-cash Collateral received
Non-cash collateral received cannot be sold, pledged, re-invested or re-hypothecated.
4.2. Cash collateral reinvestment returns to the collective investment undertaking Cash collateral, can only be: - deposited with entities as provided by the law, - invested in high-quality government bonds, - used for the purpose of reverse repurchase transactions provided the transactions are with credit institutions subject to prudential
supervision and the Fund is able to recall at any time the full amount of cash on accrued basis, - invested in short-term money market funds as defined in ESMA’s Guidelines on a Common Definition of European Money Market
Funds. As of August 31, 2018, the average cash collateral reinvestment return was -0.363% for the collateral in EUR and 1.403% for the collateral in USD. 5. Safekeeping of collateral received by the collective investment undertaking as part of SFTs and Total Return Swaps
5.1. Securities on loan
As of August 31, 2018, collateral received in relation to securities lending transactions was deposited at the following institutions:
Sub-funds Depositary Amount in EUR (*)
Interfund Euro Currency Clearstream International S.A. 137,878,255
Interfund Bond Global High Yield Clearstream International S.A. 30,712,783
Interfund Euro Bond Medium Term Clearstream International S.A. 984,171,540
Interfund Euro Bond Short Term 1-3 Clearstream International S.A. 470,633,515
Interfund Euro Bond Long Term Clearstream International S.A. 12,876,523
Interfund Equity Italy The Bank of New York Mellon, London Branch 2,370,500
Interfund Euro Corporate Bond Clearstream International S.A. 172,542,169
Interfund Team Equity USA The Bank of New York Mellon, London Branch 36,491,815
Interfund Global Convertibles Clearstream International S.A. 21,016,654
Interfund Equity Japan The Bank of New York Mellon, London Branch 84,149,370
Interfund Equity Europe The Bank of New York Mellon, London Branch 7,705,662
Interfund Equity Pacific Ex Japan The Bank of New York Mellon, London Branch 786,476
Interfund Equity USA Advantage The Bank of New York Mellon, London Branch 10,907,156
Interfund Bond Global Emerging Markets Clearstream International S.A. 183,022,703
Interfund Equity Global Emerging Markets The Bank of New York Mellon, London Branch 9,969,548
Interfund Emerging Markets Local Currency Bond Clearstream International S.A. 25,535,886
Interfund Inflation Linked Clearstream International S.A. 64,039,375
Interfund System Evolution Clearstream International S.A. 38,649,381
Interfund Euro Bond Short Term 3-5 Clearstream International S.A. 558,598,427
Interfund Euro Liquidity Clearstream International S.A. 6,098,911
(*) Collateral Market Value at the reporting date.
5.2. Total Return Swap As of August 31, 2018, collateral received in relation to Total Return Swap transactions was deposited at the following institution:
Sub-fund Depositary Amount in EUR (*)
Interfund Team Equity USA Fideuram Bank Luxembourg 9,372,634
(*) Collateral Market Value at the reporting date
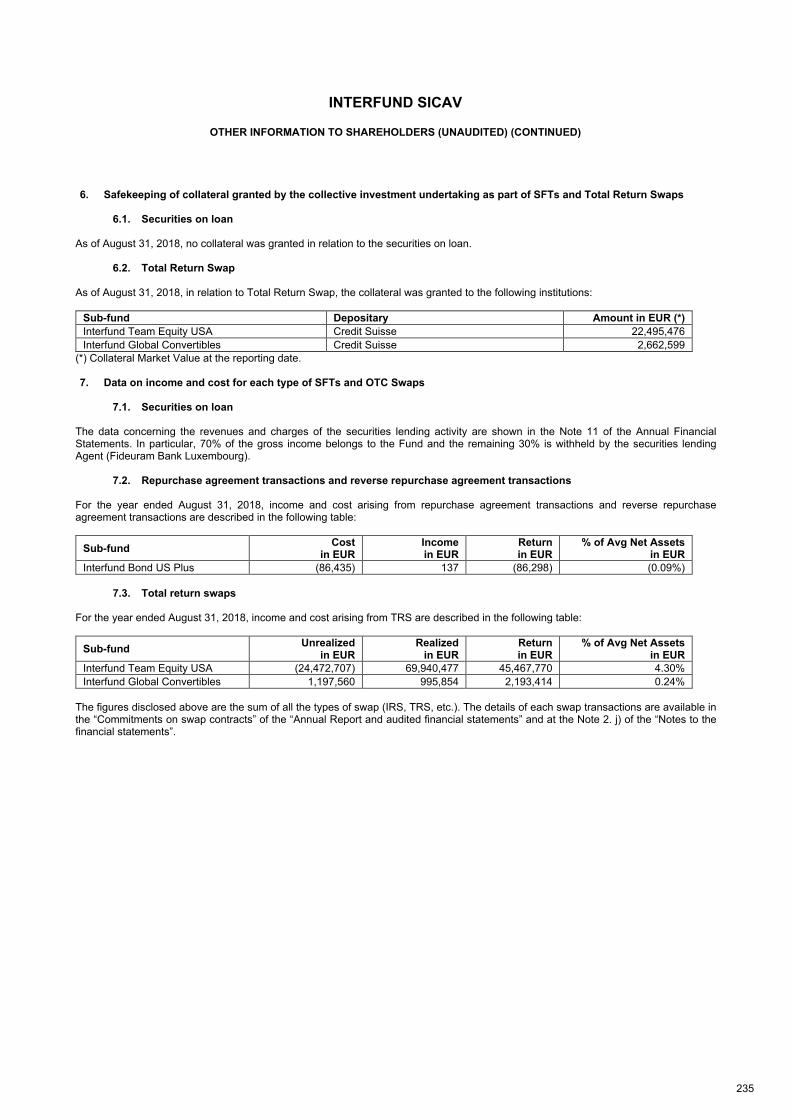
INTERFUND SICAV
OTHER INFORMATION TO SHAREHOLDERS (UNAUDITED) (CONTINUED)
235
6. Safekeeping of collateral granted by the collective investment undertaking as part of SFTs and Total Return Swaps
6.1. Securities on loan As of August 31, 2018, no collateral was granted in relation to the securities on loan.
6.2. Total Return Swap As of August 31, 2018, in relation to Total Return Swap, the collateral was granted to the following institutions:
Sub-fund Depositary Amount in EUR (*)
Interfund Team Equity USA Credit Suisse 22,495,476
Interfund Global Convertibles Credit Suisse 2,662,599
(*) Collateral Market Value at the reporting date. 7. Data on income and cost for each type of SFTs and OTC Swaps
7.1. Securities on loan
The data concerning the revenues and charges of the securities lending activity are shown in the Note 11 of the Annual Financial Statements. In particular, 70% of the gross income belongs to the Fund and the remaining 30% is withheld by the securities lending Agent (Fideuram Bank Luxembourg).
7.2. Repurchase agreement transactions and reverse repurchase agreement transactions For the year ended August 31, 2018, income and cost arising from repurchase agreement transactions and reverse repurchase agreement transactions are described in the following table:
Sub-fund Cost
in EUR Income in EUR
Return in EUR
% of Avg Net Assets in EUR
Interfund Bond US Plus (86,435) 137 (86,298) (0.09%)
7.3. Total return swaps
For the year ended August 31, 2018, income and cost arising from TRS are described in the following table:
Sub-fund Unrealized
in EUR Realized
in EUR Return in EUR
% of Avg Net Assets in EUR
Interfund Team Equity USA (24,472,707) 69,940,477 45,467,770 4.30%
Interfund Global Convertibles 1,197,560 995,854 2,193,414 0.24%
The figures disclosed above are the sum of all the types of swap (IRS, TRS, etc.). The details of each swap transactions are available in the “Commitments on swap contracts” of the “Annual Report and audited financial statements” and at the Note 2. j) of the “Notes to the financial statements”.

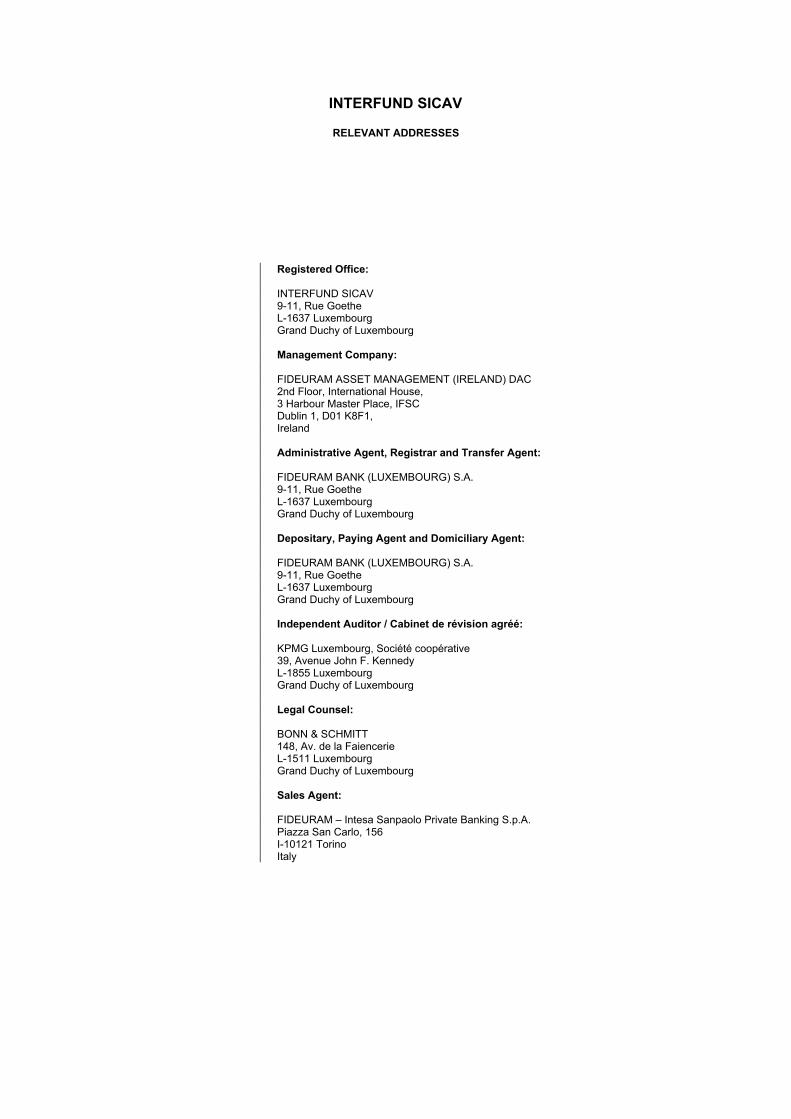
INTERFUND SICAV
RELEVANT ADDRESSES
Registered Office: INTERFUND SICAV 9-11, Rue Goethe L-1637 Luxembourg Grand Duchy of Luxembourg Management Company: FIDEURAM ASSET MANAGEMENT (IRELAND) DAC 2nd Floor, International House, 3 Harbour Master Place, IFSC Dublin 1, D01 K8F1, Ireland Administrative Agent, Registrar and Transfer Agent: FIDEURAM BANK (LUXEMBOURG) S.A. 9-11, Rue Goethe L-1637 Luxembourg Grand Duchy of Luxembourg Depositary, Paying Agent and Domiciliary Agent: FIDEURAM BANK (LUXEMBOURG) S.A. 9-11, Rue Goethe L-1637 Luxembourg Grand Duchy of Luxembourg Independent Auditor / Cabinet de révision agréé: KPMG Luxembourg, Société coopérative 39, Avenue John F. Kennedy L-1855 Luxembourg Grand Duchy of Luxembourg Legal Counsel: BONN & SCHMITT 148, Av. de la Faiencerie L-1511 Luxembourg Grand Duchy of Luxembourg Sales Agent: FIDEURAM – Intesa Sanpaolo Private Banking S.p.A. Piazza San Carlo, 156 I-10121 Torino Italy

Prod
uctio
n: K
NEI
P (w
ww
.kne
ip.c
om)
Related Documents