INTERFACIAL FRICTION IN FABRIC MECHANICS. by Farshad Motamedi A dissertation submitted to the University of London for the degree of Doctor of Philosophy. Department of Chemical Engineering and Chemical Technology Imperial College of Science, Technology and Medicine London SW7 2BY. April 1989.

Welcome message from author
This document is posted to help you gain knowledge. Please leave a comment to let me know what you think about it! Share it to your friends and learn new things together.
Transcript

INTERFACIAL FRICTION IN
FABRIC MECHANICS.
by
Farshad M otam ed i
A dissertation submitted to the University of London for the degree
of Doctor of Philosophy.
Department of Chemical Engineering and Chemical Technology
Imperial College of Science, Technology and Medicine
London SW7 2BY.
April 1989.
P R E F A C E
This dissertation is a description of the work carried out in the department of
Chemical Enginnering and Chemical Technology, Imperial College, London
between October 1985 and October 1988. Except where acknowleged, the material is
the original work of the author and includes nothing which is the outcome of work in
collaboration, and no part of it has been submitted for a degree at any other
University.
I would like to convey my gratitude to the following people;
First and foremost I would like to sincerely thank Dr. B.J.Briscoe for his enormous
help and guidance throughout the past 4 years (both MSc and PhD). I believe that
without his supervision and support this work may never have seen the light of day.
I am also deeply indepted to Professor A.I.Bailey for her generous moral and
financial support and to Professor D.Tabor for his useful and stimulating comments
throughout this work.
My thanks are also due to the members of the technical staff at the department
of chemical engineering particularly those at the student services and the electronic
workshop namely M. Dix, D. Wood.
I would also like to thank all my fellow members of the Particle Technology
and the Interface Science groups in particular D.Liatsis, P.Tweedale, B.Chaudhary,
S.Zakaria, M.B.Khan, D.Williams, I.Blazquez, M.Kamyab and K.Galvin. Without
their pleasant company and help the work would have been less enjoyable.
I am also grateful to Mrs. J.E.Burberry for her care and dedication in the
typing of this dissertation.

Finally my thanks and love go to my darling wife, Banafsheh, who has
always been there for me. Her unfailing belief and support through some rough
times is dearly cherished.
Farshad Motamedi
April 1989.

To my late father,
my wife Banafsheh and my son Ashkan.
A B S T R A C T
This thesis describes the results of an experimental and theoretical study of the
in plane and the out of plane deformation of two simple fabrics constructed from a
cotton staple yam and a continuous filament aramid yam. The theme has been to
account for the deformation characteristics observed in a number of special geometries.
Three particular deformation cases have been analysed namely the fabric
indentation experiments, the ballistic experiments and the yam pull-out experiments.
The observed microscopic behaviour in the latter case has been used to predict the
macroscopic response of the system. This has involved separately investigating the
friction and extension properties of isolated yams and the visual examination and
quantification of the local deformation fields. The major conclusion of this particular
study has been that it is possible to use simple models and assumptions to generate
realistic models for the deformation of fabrics on the basis of the operation of tensile
forces only. Amongst the range of variables adopted have been the introduction of
lubricants which are believed to modify the tensile properties of the yams by
interfilament lubrication and the behaviour of the cross-overs by cross-over contact
lubrication.
The deformation characteristics of the fabrics (semi-pyramidal) during the
indentation experiments were found to resemble those in the pull-out process. The
force-displacement profile of this system was predicted using a standard constrained
coherent plate deformation model. The conclusion of this work was that the behaviour
of this system may be reasonably interpreted using an effective modulus which arises
largely through the propagation and the interaction of mostly tensile forces and hence
the operation of a tensile rather than a bending modulus.
Finally the plate deformation theory was used to interpret the ballistic capture

performance of aramid fabrics possessing various surface characteristics. The
influence of surface modifications in the ballistic experiments was in keeping with
those observed in the indentation experiments.
The main overall conclusion is that the transmission of tensile forces dominates
the out of plane deformation of these fabrics and that lubrication affects both the stress
fields in the yams by modifying fibre-fibre interactions and also the manner in which
force transmission occurs between the yams into the fabric as a whole.
d
C O N T E N T S
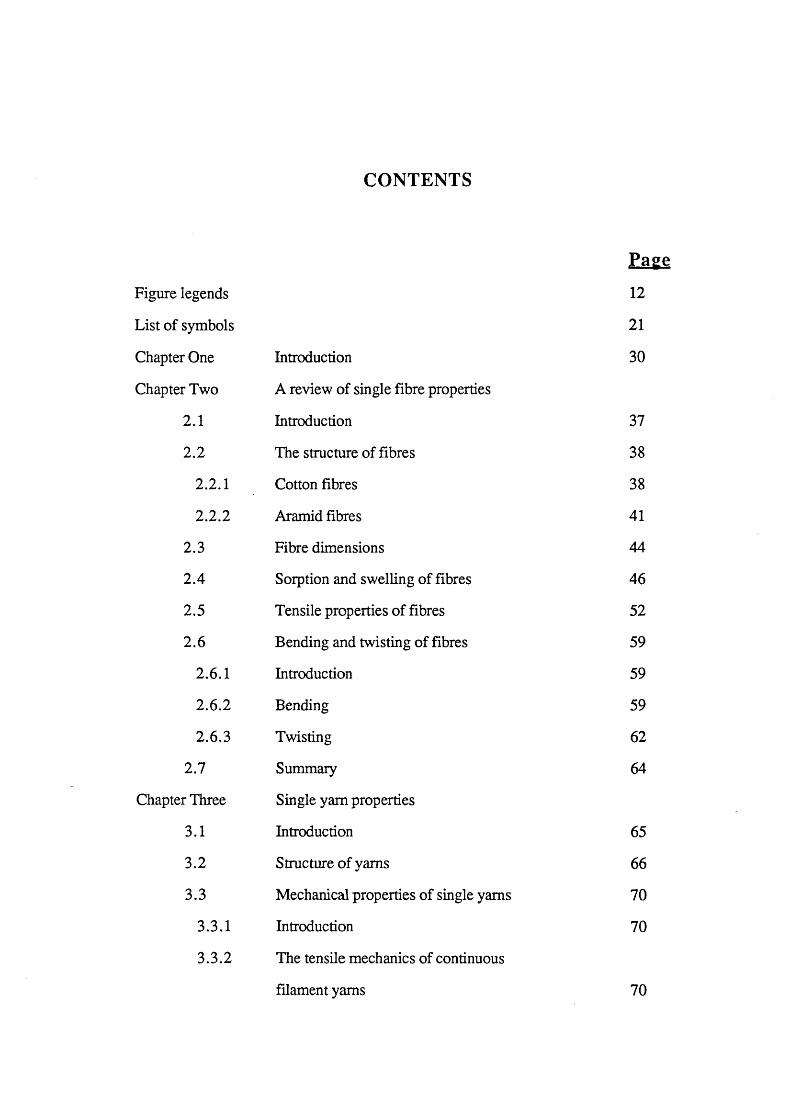
PaeeFigure legends 12
List of symbols 21
Chapter One Introduction 30
Chapter Two A review of single fibre properties
2.1 Introduction 37
2.2 The structure of fibres 38
2.2.1 Cotton fibres 38
2.2.2 Aramid fibres 41
2.3 Fibre dimensions 44
2.4 Sorption and swelling of fibres 46
2.5 Tensile properties of fibres 52
2.6 Bending and twisting of fibres 59
2.6.1 Introduction 59
2.6.2 Bending 59
2.6.3 Twisting 62
2.7 Summary 64
Chapter Three Single yam properties
3.1 Introduction 65
3.2 Structure of yams 66
3.3 Mechanical properties of single yams 70
3.3.1 Introduction 70
3.3.2 The tensile mechanics of continuous
filament yams 70
3.3.3 The classical analysis of tensile behaviour 72
3.3.4 The analysis of the load-extension curve
using the energy method 76
3.3.5 Summary 80
3.3.6 The mechanics of staple fibre yams 80
3.3.7 Extension and breakage of yams 81
3.4 Interface phenomena 83
3.4.1 Introduction 83
3.4.2 Friction, historical note 84
3.4.3 Generally accepted mechanism of friction
at the present time 85
3.4.4 Friction of fibres 89
3.4.4.1 General features of fibre friction 89
3.4.4.2 Discontinuous motion 95
3.4.4.3 The differential friction effect (DFE) 96
3.4.4.4 Auto adhesion and contact geometry of fibres 98
3.4.4.5 Summary 98
3.4.5 Lubrication 99
Chapter Four A review of some properties of fabrics
4.1 Introduction 103
4.2 The geometric properties of woven fabrics 104
4.2.1 A model for the woven fabric structure 104
4.2.2 Summary 106
4.3 Woven fabric tensile mechanics 106
4.3.1 Summary 112
4.4 The bending of woven fabrics 112
4.5 Summary 114

4.6 Chemical modification processes
4.6.1 Introduction 115
4.6.2 Chemical finishing 115
4.6.3 "Handle" as a measurable parameter 121
4.6.4 Conclusion 124
4.7 Ballistic impact processes
4.7.1 Introduction 126
4.7.2 Theoretical aspects of ballistic impact of yams 126
4.7.3 The effect of cross-overs on the stress
wave propagation 129
4.7.4 The ballistic performance of textile structures 132
Chapter Five Materials and experimental techniques
5.1 Introduction 134
5.2 Selected test materials 134
5.3 The frictional characteristics of the yams 136
5.3.1 Introduction 136
5.3.2 Point contact friction measurements 136
5.3.3 The hanging fibre friction configuration 137
5.3.3.1 Experimental apparatus and procedure 137
5.3.3.2 The frictional character of yams 143
5.4 The yam tensile experiments 145
5.4.1 Experimental set up and procedure 148
5.4.2 The force-strain character of yams 149
5.5 The "hardness" experiments 158
5.6 The ballistic impact experiments 162
5.6.1 The measurement of projectile velocity 162
5.6.2 The high speed photography of the impact process 167
5.7 The yam pull-out device 167
5.7.1 Testing of untreated fabrics 167
5.7.2 The pull-out test on treated fabrics 171
5.7.2.1 The submerged fabric technique 173
5.7.2.2 The dry treated fabric technique 174
5.8 The vertical micro-displacement measurements 175
Chapter Six Indentation of textile structures
6.1 Introduction 177
6.2 Indentation of untreated fabrics 179
6.2.1 Introduction 179
6.2.2 The response characteristics of the cotton fabrics 179
6.2.2.1 The effect of weft yam tension 179
6.2.2.2 The effect of indentor shape and angle 181
6.2.2.3 The effect of fabric holder size 184
6.2.2.4 Calculation of a "hardness" value 188
6.2.3 The effect of cone angle on the indentation
behaviour of untreated aramid 1 fabric 190
6.2.4 Bending against stretching in fabric indentation 192
6.2.5 Conclusion 195
6.3 Indentation of modified fabrics 196
6.3.1 Introduction 196
6.3.2 The response of modified cotton fabrics 196
6.3.3 The response of modified aramid 1 fabrics 198
6.3.4 Conclusion 198
6.4 The thin plate model 200
6.5 The response of fabrics to small indentors 203
6.5.1 Introduction 203

6.5.2 The effect of the shape of indentor tip
on fabric response 203
6.6 Conclusion 205
Chapter Seven The transverse ballistic impact of fabrics
7.1 Introduction 208
7.2 The deformation character of fabrics
impacted transversely 209
7.3 Transverse wave propagation through fabrics 212
7.4 The energy dissipation character of fabrics
during impulse loading 213
7.5 Conclusion 216
Chapter Eight The yam pull-out process
8.1 Introduction 219
8.2 Yam pull-out of cotton fabrics 220
8.2.1 General force-displacement behaviour 220
8.2.2 Micro-displacement response in the
plane of deformation 227
8.3 Micro-displacements of the weave 232
8.3.1 Yam displacement above the weave plane 232
8.3.2 The concept of ’’hardness" applied to
the pull-out process 238
8.3.3 Yam migration in the weave plane 239
8.4 Yam pull-out test on untreated aramid fabrics 239
8.4.1 The observed general response 239
8.4.2 The effect of weft yam tension 242
8.5 Conclusion 245
Chapter Nine The pull-out experiments on treated fabrics
9.1 Introduction 246
9.2 Deformation and pull-out experiments carried
out on submerged fabrics 247
9.3 Pull-out studies on dry treated fabrics 251
9.4 Summary 257
Chapter Ten Analysis and discussion
10^ Introduction 258
10.2 Matrix shear during the pull-out experiment 259
10.2.1 Introduction 259
10.2.2 Theoretical representation of the model 261
10.2.3 The application of the model 266
10.2.4 Variation of JRF and kinetic fiction with side load 272
10.2.5 Summary 278
10.3 Indentation of textile structures 280
10.3.1 Introduction 280
10.3.2 Diaphragm strains (thin plate model) 281
10.3.3 The effect of friction on the indentation of fabrics 285
10.4 A quasi-static model of the transverse ballistic
impact of aramid weaves 285
10.4.1 Introduction 285
10.4.2 A quasi-static model of the ballistic capture
efficiencies of aramid fabrics 288
10.4.3 The effect of friction on the ballistic
performance of fabrics 293
10.5 Conclusions 293
Chapter Eleven Conclusions 295
Appendix One SEM photographs of the cotton and the
aramid yams 299
Appendix Two A geometric model for the analysis of friction
in the pull-out experiments 300
References 302
F IG U R E LE G EN D S
Chapter 1
1.1 A schematic representation of the deformation geometries; a) the pull-out experiment, b) die ‘'hardness experiment and c) the ballistic experiment.
1.2 A block diagram representing a summary of the various elements in the thesis.
Chapter 2
2.1 Glucose rings linked together.
2.2 A schematic drawing of a cotton fibre illustrating the layered structure. Reproduced from Duckett (1979).
2.3 The morphology of Kevlar 49 fibre. Reproduced from Pruneda e t a l (1981).
2.4 Comparison of Hailwood & Horrobin's equation with experimental results for cotton and wool.
2.5 The effect of relative humidity on the equilibrium moisture regain and regain rate of 380 denier yam of Kevlar 49. Reproduced from Kevlar 49 Data Manual, E.I. du Pont & Co.
2.6 A four element model representing the extension, primary and secondary creep and stress relaxation of a fibre.
2.7 Eyring's three element model.
Chapter 3
3.1 The idealised helical geometry of a yam, due to Hearle (1965).
3.2 Comparison of typical stress-strain curves of a staple and a continuous filament yam.
3.3 A schematic representation of an extended yam based on the ideal helical geometry.
3.4 Contact between a rough solid and smooth rigid plane showing only a few asperities touching the surface.
3.5 Schematic diagram of deformation friction due to viscoelastic hysteresis
12

losses within the bulk of the specimen either during rolling or well lubricated sliding.
3.6 A force diagram for the capstan theory of friction.
3.7 Schematic representation of the stick-slip phenomenon showing the effect of imposed sliding velocity.
3.8 Schematic diagram of the geometric theory of the differential friction effect The scales on the fibre interlock or catch against asperities on another surface.
3.9 General behaviour of liquid-lubricated textile yams showing the three regimes of lubrication and the regions at which they become operative.
Chapter 4
4.1 Schematic diagram of Pierce's model of a simple plain weave.
4.2 An alternative "race-track" shape for the yarn cross section. Here the race-track geometry has been extended by the straight portion z. In this way the problem of non-plain fabric geometry can be converted into plain fabric geometry.
4.3 The load extension curve for a fabric showing three distinct sections representing initial high modulus, a relatively lower modulus and ultimately a rise in modulus.
4.4 Schematic diagram of a cross-over point in a fabric showing the bent character of the yam within the weave.
4.5 Equilibrium absorption from CTAB solutions by purified cotton at room temperature. Reproduced from Sexsmith & White (1959).
4.6 Kim and Vaughn's (1979) graphical representation of fabric hand; fabric C, 50/50 polyester/cotton batsice; fabric Q, 50/50 polyester/cotton denim; fabric S, 50/50 polyester/cotton gabardine.
4.7 A schematic representation of the configuration of a yam impacted transversely.
4.8 The effect of fibre modulus on the proportion of the transverse wave being either transmitted along the original fibre or be diverted to the second fibre at a cross-over point.
4.9 The effect of friction at a cross-over on the coefficient of reflection of the transverse wave front.
4.10 The effect of friction on the coefficient of wave diversion.
4.11 The influence of friction at the cross-over on the transmission of the
13
transverse wave front.
4.12 Factors which may influence the ballistic performance of aramid fabrics.
Chapter 5
5.1 A microscopic photograph of the cotton weave.
5.2 Schematic drawing (plan) of the upper part of the force measuring device.
5.3 Point contact frictional character of two orthogonal cotton yams. The yams were untreated and dry (RH « 40%).
5.4 Photograph of the hanging fibre-friction apparatus.
5.5 Schematic diagram of the hanging fibre arrangement showing the directions of motion and the yams in contact.
5.6 Variation of friction force with load in the hanging fibre experiment. The dead load W d was 10 g. The normal load on the contact was a component
ofW d through angle 0 which changed during the course of the experiment. The gradient is the mean coefficient of friction.
5.7 Variation of friction force with angle 0 in the hanging fibre experiments. Increasing the angle has the same effect as decreasing the load, hence the force decreases. Wd = 10 g.
5.8 Variation of coefficient of friction with normal load for untreated cotton yams in the hanging fibre experiments, j1 was calculated for each point as , = F/W. The values for Wd = 5 and 10 g are included.
5.9 Variation of |i with W for untreated Aramid 1 (Kevlar 49) yams in the hanging fibre experiments. Wd = 5,10 and 20 g.
5.10 Force-extension profiles for untreated cotton yams of varying gauge lengths. The yarns were taken to the point of rupture in the tensile experiment. Instron cross-head speed = 2 mm/min.
5.11 Force-strain character of untreated cotton yams of different lengths. The extension data in Figure 5.10 was divided by the corresponding yam length to obtain the strain. However, the position of the profiles have reversed here from that of Figure 5.10.
5.12 Variation of the point to point tensile modulus (force/strain) of untreated cotton yams with strain and the rate of strain.
5.13 Comparison of the force-strain character of treated cotton yams. The water and tetradecane treated yams were wet during the experiment while the rest were dry. Average yam length = 20± 2mm. Rate of strain = 10% per minute.
14
5.14 Force-strain character of as received Aramid (Kevlar 29 and 49) yams. The experiment was taken beyond the point of failure. Yam length = 20 ± 2mm, strain rate =10% per minute.
5.15 Photograph of the ’’hardness" experiment apparatus.5.16 Photograph of the high speed gas gun.
5.17 Schematic diagram of the high speed impact arrangement showing the gas gun and the steel protective chamber together with the associated velocity measuring and photography equipment.
5.18 Projectile velocity in the ballistic experiments as a function of gas pressure in the gas gun.
5.19 Photograph of the apparatus used in the pull-out experiments including the enclosed chamber containing the force measuring device, and the video recording measurement facilities.
5.20 Photograph of the force measuring device showing the clamped fabric, in the movable stage, the hook, the phosphur bronze springs and the linear displacement transducer.
5.21 Schematic diagram of the set-up used to measure the force (stage 1) and video record of the deformation of the fabric matrix (stage 2) during the pull-out experiment.
Chapter 6
6.1 Typical force-vertical displacement profiles for untreated cotton fabrics during the "hardness" experiment. The effect of weft yam tension is seen to be negligible; (120° conical indentor, 100 mm holder diameter).
6.2 Variation of force with area of indentation for untreated cotton fabrics. The values for different weft yam tensions fall on the same line.
6.3 Schematic diagram of the deformations produced during fabric indentation. For cotton the deformation zone was asymmetric about the warp and weft directions, while for the Aramid fabrics the deformation zone was symmetrical.
6.4 Comparison of the response of untreated cotton fabrics to indentors of differing angles in the "hardness" experiments (100 mm holder).
6.5 Force and area of deformation of untreated cotton fabrics as a function of the angle of the indentor.
6.6 The response of untreated cotton fabrics of different diameters to indentation by 60° and 120° conical indentors. The fabric with the larger diameter is seen to be more compliant.
6.7
6.8
6.9
6.10
6.11
6.12
6.13
6.14
6.15
6.16
6.17
6.18
6.19
The effect of fabric holder diameter on the deformation zone area of untreated cotton fabrics using 60° conical indentors.
Force and area of deformation of untreated cotton fabrics as a function of fabric holder size using 120° conical indentor.
A plot of the hardness value again tan (3 where
e=(^),
0 being the indentor angle.
Indentation of an elastic-plastic half space by spheres and cones. Small dashed line - elastic: A cone, B sphere. Solid line - finite elements. Chain li^e - cavity model: F cone, G sphere. Large dashed line - rigid-plastic. Reproduced from Johnson (1985).
The response of as received Aramid (Kevlar 49) fabric to indentation by indentors possessing different angles. Holder size =100 mm.
Variation of the ratio h/y with vertical displacement for different cone angles and fabric holder sizes.
The comparison of the experimental data and the ideal response of a very stiff system during fabric indentation processes.
Comparison of the "hardness” experimental data and the response of a very compliant (in bending) system to indentation for various cone angles and fabric holder sizes. The figure represents the extent to which the cotton fabric under study was bent or stretched during the indentation process.
Comparison of the response of untreated and 5% PDMS treated cotton fabrics to the indentation process. (60° conical indentor, 100 mm holder).
Comparison of the responses of untreated and 5% PDMS treated cotton fabrics in the "hardness" experiment using 120° indentor and 100 mm holder.
Comparison of the response of untreated cotton fabric to that treated with different concentrations of CTAB solution using 120° indentor and 100 mir holder.
Comparison of the response of Aramid (Kevlar 49) fabrics possessing different surface characteristics (clean [soxlet extracted], as received and 5% PDMS treated) to the indentation process. (120° indentor, 100 mm holder).
The response of untreated cotton fabrics to small diameter indentors as a function of the indentor angle. (100 mm holder).
1 6

Chapter 7
7.1 High speed photograph of the impact process. Projectile velocity=l 13 m/s, as received aramid 1 fabric, time interval between frames=40 jis.
7.2 Same as figure 7.1 for the 5% PDMS treated aramid 1 fabric.
7.3 Same as figure 7.1 for the soxlet extracted aramid 1 fabric.
7.4 The effect of impact velocity and surface treatment of Aramid (kevlar 49) fabrics as the projectile residual velocity.
7.5 The effect of surface treatment on the energy absorbing efficiency of aramid (Kevlar 49) fabrics at different impact velocities.
Chapter 8
8.1 General form of the force-displacement profile obtained in the yam pull-out process showing the four regions of response.
8.2 Variation of the pull-out profile and the associated parameters of untreated cotton fabric with imposed side tension.
8.3 The gradient of elastic part of the pull-out profile (Region II) G, as a function of side tension for untreated cotton fabrics.
8.4 Junction rupture force (JRF) as a function of imposed side tension for untreated cotton.
8.5 Sliding friction force per cross-over (Region IV) as a function of side tension for untreated cotton fabrics.
8.6 Measured pull-out force (Region IV) as a function of the number of cross-overs remaining for untreated cotton fabric under zero side tension.
8.7 Ratio G/JRF as a function of side tension showing JRF to be a stronger function of tension.
8.8 Extension of the pull-out yam against plate displacement at particular values of the pull-out force. The diagram compares each portion of the extension profiles to a particular region in the pull-out profile.
8.9 Measured force before JRF (Region II), as a function of the extension of the portion of the pull-out yam between cross-overs 1-20.
8.10 Tensile extension of discrete elements of the pulled yam between cross-overs corrected for the out of plane displacements as a function of cross-over number. The averaged increasing trend is depicted by the solid line.
8.11 Displacement of cross-overs 1 and 20 with side tension. The solid lines
represent the least square fits to the data.
8.12 Schematic representation of the out of plane vertical displacement of the weave during the pull-out process, the displacements increasing towards the hook.
8.13 Out of plane micro displacements for the weave as a function of cross-over number for three different force levels on the pulled yam.
8.14 The effect of the number of cross-over points at the same force level (0.1 N) on the vertical displacements of the weave.
8.15 Schematic diagram of the vertical micro displacement of a section of the weave, used to correct the displacement of the cross-overs and the extension of the elements of the pulled yam.
8.16 Experimental values of the cross-over displacements for untreated cotton fabric at zero side tension as a function of cross-over number. Both the corrected and the uncorrected data are shown, the correction becoming more significant at higher cross-over numbers.
8.17 Experimental values of the distance between the top of the cross-over or pulled yam and the surface of the weave with increasing junction number. The yams orthogonal and crossing over the pulled yam were displaced upward more than the adjacent portions of the pulled yam and this is depicted in the line named "difference”.
8.18 The "difference" line in Figure 8.17 depicted for two different force levels. The figure shows the influence of the force on the pulled yam on the level of yam migrations.
8.19 The pull-out profiles for two untreated Aramid (kevlar 29 and 49) fabrics. Side tension = 0.
8.20 Variation of JRF with side tension for the Aramid 1 (kevlar 49) fabric.
8.21 Variation of the sliding friction force per junction (Region IV) with imposed side tension for untreated aramid 1 fabrics.
Chapter 9
9.1 Comparison of the pull-out profiles of dry untreated cotton fabric with that of a cotton fabric submerged under water for 30 minutes prior to pull-out. Side tension = 0.
9.2 The effect of the time of submergence on the value of the gradient G of the linear portion of the pull-out profile (Region II).
9.3 Values of junction rupture force (JRF) for submerged cotton fabrics as a function of the time submerged.

9.4 The effect of increasing submerged times on the dynamic friction force per junction of cotton fabrics during pull-out (Region IV).
9.5 The effect of PDMS solution concentration on the gradient G of the linear region of the pull-out profile. The fabric (cotton) was submerged under the PDMS solution for 2 hours and subsequently dried prior to the experiment.
9.6 Variation of JRF with increased concentration of PDMS in the treatment solution.
9.7 The effect of PDMS treatment solution concentration on the dynamic friction force per junction of cotton fabrics.
Chapter 10
10.1 A schematic representation of the model adopted to predict the form of the elastic part of the force-displacement profile.
10.2 A schematic representation of a single cross-over region.
10.3 The effect of side tension on the cross-over yam spring constant, Em.
10.4 Variation of the forces and the tensile yam moduli Ey associated with discrete elements of the pulled yam.
10.5 Values of the moduli of discrete elements of the pulled yam as a function of cross-over number for cotton fabrics submerged under water for various lengths of time.
10.6 The common force-strain profile associated with different parts of the distorted cotton weave. The shaded areas represent the boundaries within which the force-strain profiles of the tensile yam and the cross-over yams would fall. The single yam characteristics is also seen to fall within these boundaries. The profiles were calculated using the spring model, figure 10.1.
10.7 Comparison of the experimental force-displacement profile (elastic region II) with data obtained using the spring model.
10.8 Schematic representation of the tensile and the cross-over yams inside the cotton weave showing the associated angles.
10.9 A diagram of the forces acting at a cross-over junction.
10.10 Experimental values of the angles a and 0 inside the cotton weave at various cross-over numbers.
10.11 Coefficient of friction as a function of the weave angle 0 for the three friction models examined.
10.12 Comparison of the experimental fabric indentation force-displacement profile with that produced using the plate model. The data are for cotton fabric with 120° conical indentor and 100 mm fabric holder.
10.13 Experimental against plate model data for the indentation of cotton fabrics with a 120° conical indentor, fabric holder size= 180mm.
10.14 Experimental vs. plate model profiles for the indentation of untreated (as received) aramid 1 fabric using 120° cone and 100 mm fabric holder.
10.15 Same as figure 10.14 for 5% PDMS treated aramid 1 fabric.
10.16 A schematic representation of the indentation and the ballistic processes showing their respective deformation patterns. In the quasi-static case, the hinge is at the clamp while for the ballistic case it is variable.
10.17 A block diagram showing the path taken to calculate the integral work done Wj in the ballistic process from information produced in the quasi-static analyses.
10.18 Quasi-statically based values of integral work done for the ballistic impact process at increasing transverse fabric displacements (depths).
10.19 Normalised absorbed energy as a function of the fabric surface characteristics. Energies were calculated at 15% nominal strain.
20

L IS T OF S YM B O LS
Chapter 2
A area, fibre cross-sectional area
E Young's modulus
E' fibre tensile modulus
Ef tensile modulus of crystalline fibre
H relative humidity
k,kj & k^ constants
ks capillary water transport constant
K bulk modulus
1 length
L distance
m,n constants
M molecular weight of polymer unit
N number of twists
r regain
re effective radius of capillary
rb radius of curvature
s horizontal distance travelled by liquid
S fibre length
t time
21
Tb fibre linear density
u constant
V volume
a constant
8 strain
e' modulus of rigidity
r liquid surface tension
T| liquid viscosity
shape factor
5 fibre density
a stress
V Poisson's ratio
0 helix angle
V apparent advancing contact angle
6C convolution angle
ChaDter 3
a',b,Cj constants
A real area of contact
22
c crimp ratio = h/L
D cylinder diameter
E Young's modulus
Ef,Ey fibre and yam modulus
F yam tension, yam strength or friction force
Fd the grooving force
F 1>F2 yam strengths
g transverse stress distribution
G transverse compressive stress
h length of yam
H indentation hardness
K friction factor
1 length of filament at distance r from axis
L length of filament at the yam surface
n load index
P ploughing component of friction
P nominal pressure
r radial position in yam
R,R0 radius of yam or sphere
s shear strength
h &X2 times
T linear density or fibre tension
V velocity
23

yam specific volume
normal load
work done in extension
total elastic energy stored
tensile stress
specific stress
twist angle or material parameter
constant
filament and yam extensions
coefficient of friction
Poisson's ratio
elastic work done per unit length
materials flow stress
lubricant viscosity
work done in extension
axial Poisson's ratio
lateral contraction ratio of yam
interfacial shear strength
e subtended angle in a capstan geometry
Chanter 4
c crimp ratio, sonic velocity
D sum of diameters of yams in warp and weft directions
E Young's modulus
f lead on a single yam
F 0 total load on fabric
h crimp height
k constant
1 yam length
m mass per unit length of unstrained filament
n number of yams
P thread spacing
t time
TP maximum tension
u transverse wave velocity
vo projectile impact velocity
e strain
£pmaximum strain
P material density
a stress
25
0 weave angle
subscripts l & 2 warp and weft directions respectively
ChaDter 5F forcen load indexw normal load
w d dead load
P coefficient of friction
ChaDter 6a&b distances in pyramidal deformation zoneA , B , C constantsA \ B \ C' constantsE Young's modulusF forceh height to which fabric contacts the indentor
kj & k2 constants
P concentrated centre load
q unit loadr plate radius
radius of conical indentor
R h radius of fabric holder
26

t plate thickness
y vertical displacement
x> Poisson's ratio
0 angle of conical indentor
Chapter 7
Ed dissipated energy
m mass of projectile
vi impact velocity
vr residual velocity
ChaDter 8a number of digitised position / mm
d cross-over displacement
do initial cross-over displacement
dc corrected cross-over displacement
D displacement of stage
G gradient of elastic region of pull-out profile
JRF junction adhesive force
L correction length or distance
X digitised position of cross-over
27

Chapter 10
a & b constants
dG half width of fabric
dN cross-over displacement
E plate Young’s modulus
Ejjj global cross-over spring constant
f ,F
fc
fy
JRF
N
P
r
t
v
Wj
y
tensile yam spring constant
force
force along cross-over yams
force along tensile yams
tension on a single cross-over yam.
friction force at zero load
total side tension
junction adhesive force
number of cross-overs
vertical component of side tension on one cross-over yam
plate radius
plate thickness
sonic velocity
integral work done in deformation
vertical displacement
a & <}) angles
28

extension of cross-over yams
tensile yam extensions
coefficient of friction
material density
a + <|)
propagation angle at penetration
weave angle
stress wave propagation angle

C H A P T E R O N E
INTRODUCTION
Treloar (1964) in his Mather lecture almost a quarter of a century ago outlined a
general strategy for the analysis of the mechanics of complex structures. He said " In a
typical engineering problem, it is required to calculate the response of a structure when
a given set of stresses is applied to it. For the solution of such a problem, the engineer
must have first a complete specification of the description of the components, ie. of the
geometry of the structure. Secondly he must have a knowledge of the mechanical
properties of the materials used in these components, and finally, he must have at his
disposal a method of analysis that will enable him, on the basis of these pieces of
information, to arrive at a mathematical solution to his problem". This is very much
applicable to textile structures.
This thesis describes a number of experiments which have been designed to
probe the behaviour of fabrics when they are deformed in a particular configuration.
The deformation geometry is sketched in figure 1.1. It corresponds to the generation
of an out of plane deformation produced by a force which has a component normal to
the plane of a constrained fabric. In practice three geometries of deformation have been
studied. Figure 1.1 shows these geometries in a schematic way.
Figure 1.1(a) is a yam pull-out experiment where a single yam is withdrawn
from a fabric. The configuration in figure 1.1(b) represents a quasi-static indentation
experiment and 1.1(c) a transverse ballistic experiment. The three configurations
produce a pyramidal (or partially pyramidal) distortion. Each experimental
configuration was designed to facilitate the study of a particular facet of fabric
30

vement
Conical indentor
(b)
mv
(c)Figure 1.1 A schematic representation of the deformation geometries; a) the
pull-out experiment, b) the ’’hardness experiment and c) the ballistic experiment.
31

mechanics. However, it will be shown that in each case, at low strains at least, the
major governing factor controlling the response of the system was dictated by the
tensile characteristics of the constituent yams and to a lesser extent by the bending
character and the properties of the yam-yam junctions. At higher strains the yam-yam
interactions become important but at this level of stress the tensile properties of the
yams themselves are also of consequence.
A major theme in the present thesis is the way in which the tensile
characteristics of the yams and also the frictional properties of the yam-yam junctions
influence the behaviour of fabrics in this mode of deformation. The study has sought
to alter these two properties by the use of lubricants. It will be shown that the
lubricants change the yam-yam frictional forces required to both to initiate and to
maintain steady motion. The same lubricants also appear to modify the tensile
properties of yams by reducing the filament-filament frictional forces in the yam. The
thesis describes a number of aspects of the influence of lubricants on the yam tensile
and inter yam frictional properties.
This study was undertaken for two rather separate and distinct technical reasons
both of which are related to the influence of yam mechanics on the performance of
fabrics. The choice of fabrics studied, a cotton fabric and an aramid fabric reflects
these technical bases. The cotton systems are of commercial interest because of the
common belief that fabric mechanics is a key aspect of the group of attributes which
convey sensual or tactile appreciation of fabrics. It is of course common practice to
modify this property by the use of fabric conditioners. The way in which these species
act is still unclear and the thesis addresses this problem. The thesis does not however
attempt to correlate mechanical or deformation properties with subjective handle
assessment of the fabrics. The latter type of characterisation was considered
inappropriate since it enters the realms of psychophysics. In the context of tactile
appraisal the thesis addresses a number of the main features of the mechanical
32

properties of fabrics and provides a basis for data analysis. A major conclusion is that
the influence of fabric conditioners may be interpreted in terms of their influence on the
tensile properties of their constituent yams and the monofilaments.
The adoption of aramid fibres focuses upon a different area of fabric mechanics;
and that is the energy dissipation characteristics of fibres in ballistic impacts. Here the
mechanical property of these fabrics is a critical factor in defining the energy
dissipation characteristics and again it is argued that a prime mechanism for energy
dissipation involves the tensile extension of the constituent yams. Quasi-static
simulations of the ballistic process were also performed. The energy was found to be
dissipated through mainly a tensile extension mechanism and to a lesser extent through
bending of the fabric. The trends of the response of the system to surface
modifications were in keeping with those found for the ballistics experiments where
they were seen to reduce the energy absorption characteristics at low strains and also
the work done at high strains.
It should be pointed out that the deformations in the three systems outlined
above are similar in shape, figure 1.1 and that the elasticity of the matrix in the
hardness and the ballistic experiments are seen to originate from the microscopic
processes responsible for the elasticity of the weave observed in the pull-out process.
The general layout of the thesis is as follows; chapters 2, 3 and 4 are review
chapters dealing with various properties of fibres, yams and fabrics respectively that
are relevant to the current study. It was seen to be appropriate to divide the reviews
into these three chapters because each system has it’s own particular characteristics.
Although the single filament conveys certain properties to the assembly system
through the influence on yarn characteristics, the assembly possesses it's own
characteristics, mainly due to the geometric arrangement of the yams.
Chapter 2 is a detailed review of single filament properties. It begins by
outlining the structure of cotton and aramid fibres. It then describes the dimensional
33

and water absorption (swelling) properties of these fibres. The tensile properties of
single filaments are described in more detail and included are references to previous
work by other researchers. Bending and twisting of fibres are briefly reviewed at the
end of the chapter.
Chapter 3 contains a detailed survey of the properties of single yams made of
staple fibre and continuous filaments. The structure of the yams and, in particular the
so called ’’fibre migration” process, is described. The tensile behaviour of both types
of yams, continuous and staple forms, and the related theories based on single
filament properties are outlined. Chapter 3 also includes a fairly comprehensive section
on the relevant theories of the origins of the frictional processes for both general cases
and those specific to fibres and yams. This section also includes brief reviews of the
stick-slip process, the differential friction effect and the influence of lubrication.ed
Chapter 4 presents a detail^review of some of the properties of fabrics and the
studies undertaken previously that are most relevant to the current study. It begins by
describing the geometrical properties of woven fabrics. The tensile and bending
properties are also briefly outlined. The way in which chemicals may modify the
surface characteristics of fabrics in relation to a fabrics’ tactile and frictional properties
are also included. The final major section of this chapter deals with the subject of the
ballistic impact of yams and fabrics and presents some of the theories that will be
utilised in later chapters of this thesis.
Chapter 5 provides details of all the materials and experimental techniques used
in this study. In addition there are sections dealing with the experimental procedures
and the results of various friction and tensile experiments carried out on the chosen
cotton and aramid yams.
Chapter 6 presents the results of the so called ’’hardness” experiments, dealing
with the influence of the side force, the fabric holder size, the indentor shape and size
and the influence of various surface modification procedures. The chapter also
34

discusses the observations and the results in relation to some of the properties
described in chapters 2, 3 and 4.
Chapter 7 describes the data obtained in the ballistic impact experiments. It
includes mainly a description of the high speed photographic data obtained during the
impact process together with the observed projectile velocity data.
In chapter 8 the results of the pull-out experiment on untreated dry fabrics are
introduced. This chapter includes the described micro-displacements of the weave both
in the plane and out of plane of the fabric and the influence of weft yam tension on
parameters specific to these experiments. Chapter 9 deals with the influence of
chemical treatments on the specific fabric properties as measured in the pull-out
experiments. The influence of the "treating" agents such as water, tetradecane, stearic
acid, CTAB (Cetyl trimethyl ammonium bromide), and PDMS (Poly dimethyl
siloxane) are described. The changes in fabric properties brought about by these
treatments are discussed in terms of the mechanical properties of the constituent yams
and filaments.
Chapter 10 is occupied with the analysis and discussion of all the separate
experiments. It begins by presenting two models which have been found useful to
describe the fabric matrix shear processes and the effect of side force in the pull-out
experiments. Inherent in these analyses is the attempt to quantify the effect of the
surface treatments adopted. The chapter then discusses some of the results of the
indentation experiments in terms of a continuum plate model. The last section deals
with the results of the ballistic experiments and in particular the way in which a
quasi-static model derived from the "hardness" experiments may be satisfactorily used
to explain some of the observations of the ballistic impact process; in particular the
influence of surface treatments.
The main features of these chapters are summarised and restated in chapter 11
as general conclusions. A diagramatic summary of the various elements of the thesis
35
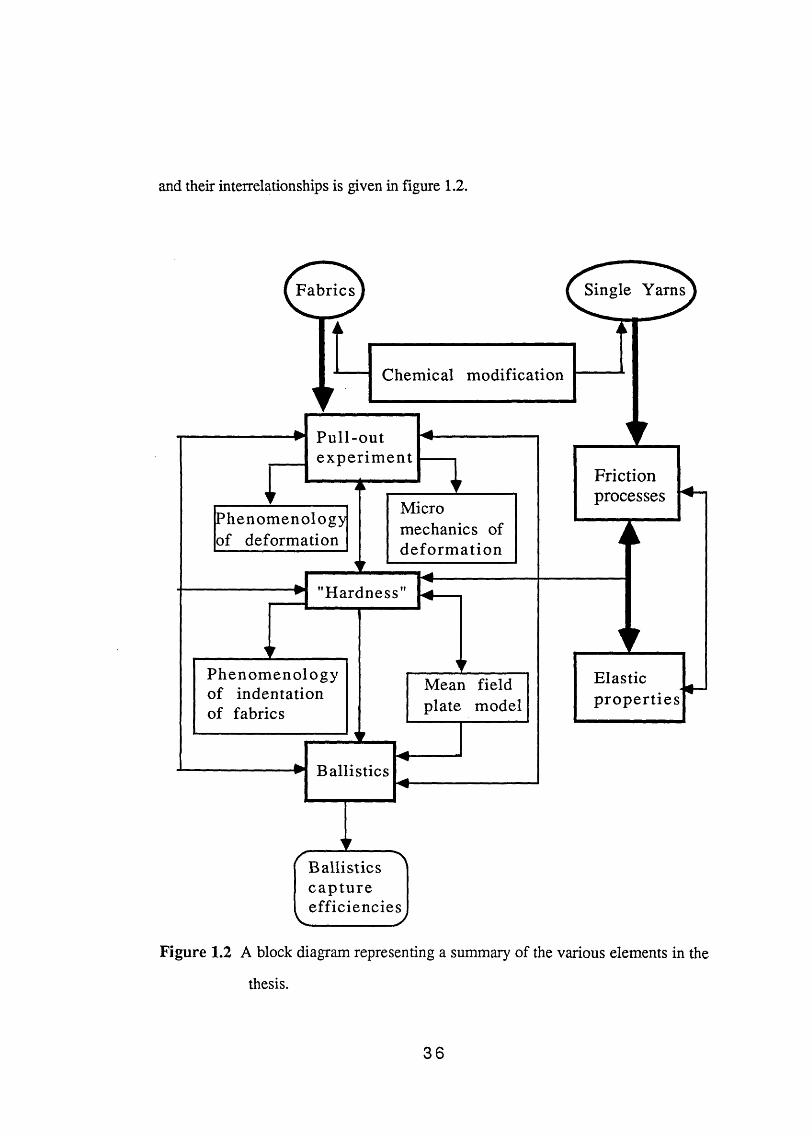
and their interrelationships is given in figure 1.2.
Figure 1.2 A block diagram representing a summary of the various elements in the
thesis.
36
C H A P T E R TWO
A REVIEW OF SINGLE FIBRE PROPERTIES
2.1 Introduction
In later chapters, the tensile, frictional and deformation properties of yams and
fabrics are reviewed and examined in different experimental environments. Yams and
subsequently fabrics are assemblies of fibres. Fibres in spun yams are arranged in a
special geometry which is discussed later. The mechanical properties of yams and
hence fabrics are controlled by the properties of the constituent fibres and the
geometrical arrangement mentioned above. Although this thesis is not concerned with
single fibres or filaments in a direct way, it is appropriate to review some of the fibre
characteristics that affect assembly properties. The main purpose of the chapter is to
introduce in a general way what are regarded as the main areas of established wisdom
and indicate the very complex nature of fibre systems.
The chapter is divided into several sections. It begins by outlining the structure
of the cotton and the aramid fibres investigated in this thesis. Then, the dimensional
properties of these fibres will be reviewed. The subject of the absorption of moisture
by these fibres, in particular cotton, is described briefly. The tensile, bending and
twisting of fibres are discussed and some of the available theoretical treatments which
have been developed are presented. Since the availability of aramid fibres is a fairly
recent development, the literature on their properties is not as widespread as that for
cotton. Thus, most of the qualitative information in this chapter relates to cotton,
although the theoretical parts are applicable to both cotton (staple fibre) and aramid
(continuous filament) yams (see Section 3.1).
37

2.2 The Structure of Fibres
2.2.1 Cotton fibres
Cotton is a natural cellulose fibre. A fairly comprehensive review has been
produced describing the structure and surface properties of cotton by Duckett (1975).
Table 2.1, reproduced from that review, illustrates the chemical composition of a
typical cotton fibre and the so called "primary" wall.
Table 2.1 Chemical composition of typical Cotton Fibre and Primary Wall.Constituent Percent of drv weieht
Fibre Primary wallCellulose 94.0 54Protein 1.3 14Pectic substance 1.2 9Wax (alcoholic solubles) 0.6 8Ash 1.2 3Other ___ 4
The cellulose molecule consists of a series of linked glucose rings, Figure 2.1.
They may also bond to other chains by hydrogen bonds at the protruding hydroxyl
groups. The complete chain is about 5|im long and 8x10"^ pm wide. The ratio of
length to width is about the same as that of a typical cotton fibre.
O H H
H
\ / \O H H <
C O
O H
Figure 2.1 Glucose rings linked together.
38

As far as the fine structure of cotton is concerned, X-ray diffraction patterns have
shown that the structure is a mixture of large crystalline regions and large amorphous
regions in the ratio of ca. 2:1. The cotton fibre is a long irregular, twisted and flattened
tube, possessing convolutions along its length. Figure 2.2 shows a schematic
representation of the various layers of which the fibre is composed.
The fibre morphology can be summarised as follows. There are six distinct
regions. The cuticle exists as a separate outer boundary and consists of a layer of wax
and pectin materials that appear to be structureless. The primary wall consists mainly
of a network of cellulose fibrils which are long, thin crystalline structures of cellulose
molecules. The diameters of the crystallites is approximately 10 nm.
Beneath the primary wall is the thin layer of the secondary wall (less than
0.1 \im thick) which is built up of closely packed parallel-ordered fibrils with a spiral
winding angle of 25-35° to the longitudinal fibre axis. Below this thin layer is a
thicker secondary wall (several micrometers thick) which contains the majority of the
cellulose in the fibre. The fibrils spiral the axis at angles up to 25° and the spiral
direction periodically reverses itself in this layer. A thin third layer of the secondary
wall is distinguished, impregnated with non-cellulose substances. The lumen, the
inner most region, contains the remains of the cell contents.
Among other important structural features of the cotton fibre are the surface
waxes which act as interfibre lubricants. These materials comprise of a system of
roughly parallel ridges and grooves on raw cotton fibre, spiralling about the fibre axis
at angles varying between 20-30°. Also important are the fibre crimp and
convolutions, the latter being a corkscrew-like twist in the structure of the fibre.
Convolutions frequently alternate in the directions of their rotation and also vary in
their pitch. They are not present during the initial growth, but are formed as a result of
39

Lumen
»S3layer(-<0*1^"') “
S2 layer(severa|/im)
^Secondary wall
^ I ty e r f - c O - lpm) J
Primary wallUo-l/1*1)
Pores
Figure 2.2 A schematic drawing of a cotton fibre illustrating the layered structure, (reproduced from Duckett)
40
fibre dessication after boll opening. Convolution generation is ultimately related to the
spiral arrangement of the micro fibrils, which reverses in the direction of rotation
periodically along the length of the fibre. The convolutions correlate negatively with
such physical measurements as bundle tenacity, and their role may be extremely
important in determining such mechanical properties as strength, extension and
modulus of elasticity (Meredith, 1975).
Berkley and Woodward (19M8) have attempted to correlate the strength of
bundles of cotton fibres with the average angle of the molecular orientation. Meredith
sought to correlate single fibre strength measurements with optical measurements of
the convolution angle. It was found that the spiral angle of the crystallites in all
cottons in the original unconvoluted fibre is the same and approximately 21°. The
following equation has been produced to relate the convolution angle to fibre strength:
, • 2.-k sin 0„
S„ = Sk e (2.1)
where S = fibre strength and 0C = convolution angle.
In summary, the cotton fibres are extremely complex in their chemistry,
morphology and gross structure. Their surfaces are also chemically and
topographically very complex.
2.2.2 Aramid Fibres
The aramid fibre investigated was a commercial material called "Kevlar”,
developed by E.I. du Pont Co., and was a high strength, high stiffness organic fibre.
It has become very popular for a variety of applications ranging from body armour to
41
aircraft structural parts. Aramids are often selected as fabrics or composite matrices
because of their attractive properties such as chemical stability, light weight and high
strength. Aramids have been identified by chemical analysis, X-ray crystallography
and infrared spectroscopy as a poly (p-phenylene terephthalamide) (PPTA). The
polymer, aramid fibre, is made by polymerising the acid chloride of terephthalic acid
with p-phenylene diamine in a suitable solvent. The polymer is dissolved in sulphuric
acid, and is formed into fibre filaments with a dry-jet wet spinning process. The
filaments are subsequently washed with a solution of sodium carbonate to neutralise
the excess sulphuric acid, Penn and Larson (1979). This process yields an extended
chain polymer which is highly crystalline. The molecular and supa molecular structure
of aramids have been investigated by many workers, Dobb e t a l (1979), Mogat (1980),
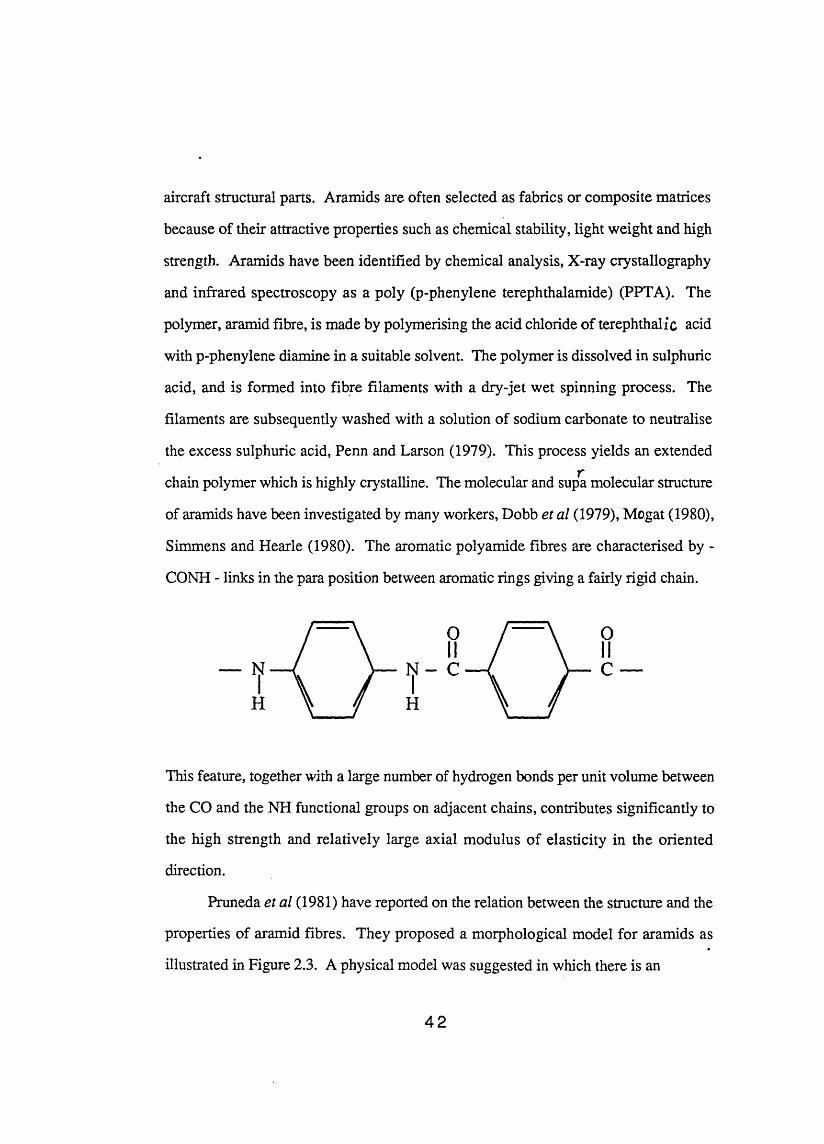
Simmens and Hearle (1980). The aromatic polyamide fibres are characterised by -
CONH - links in the para position between aromatic rings giving a fairly rigid chain.
This feature, together with a large number of hydrogen bonds per unit volume between
the CO and the NH functional groups on adjacent chains, contributes significantly to
the high strength and relatively large axial modulus of elasticity in the oriented
direction.
Pruneda e t a l (1981) have reported on the relation between the structure and the
properties of aramid fibres. They proposed a morphological model for aramids as
illustrated in Figure 2.3. A physical model was suggested in which there is an
42
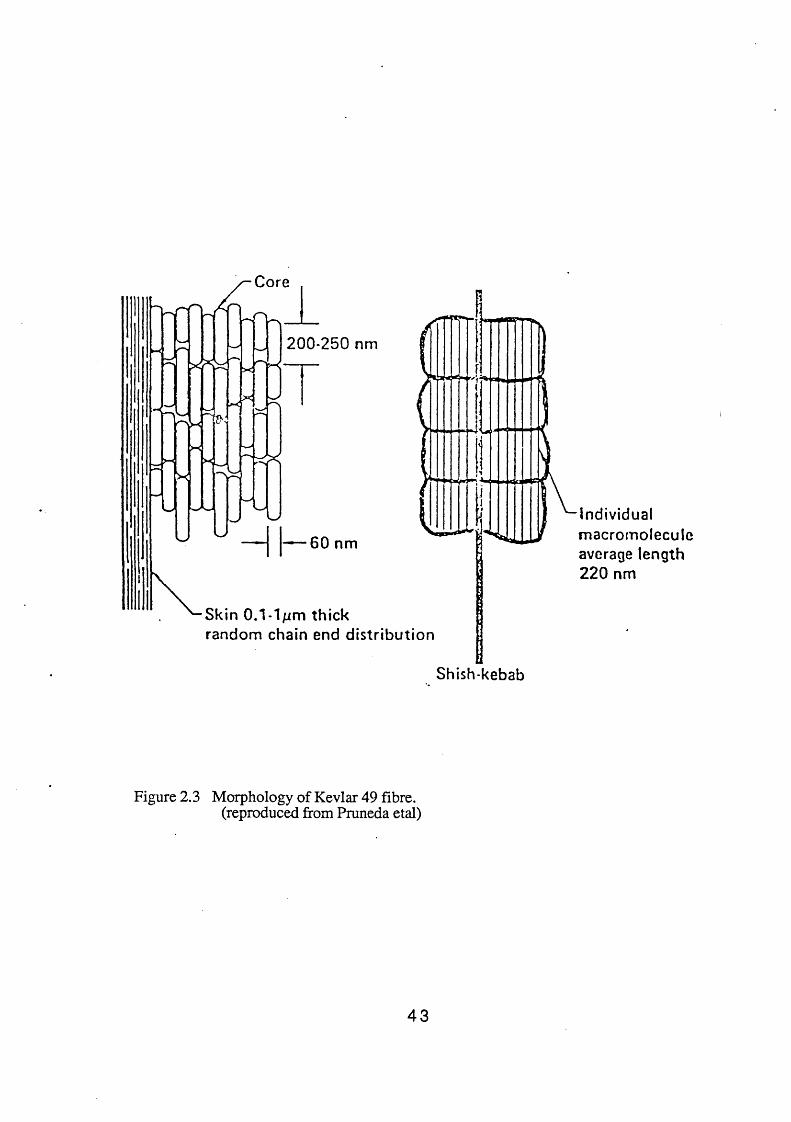
individual macromoleculc average length 220 nm
Figure 2.3 Morphology of Kevlar 49 fibre.(reproduced from Pruneda etal)
43

amorphous skin and a crystalline core. The core was reported to consist of periodic
transverse defect planes spaced about 200nm along the fibre. Chain ends were
assumed to cluster within the vicinity of these planes. The non-crystalline skin, in
which chain ends are arranged essentially randomly relative to one another, was not
thought to contain such transverse weak planes. They argued that one of the most
critical physical structural parameters that controls the deformation and failure
processes is the chain end distribution within the fibre.
Northolt (1980) has investigated the tensile deformation of PPTA fibres. He
derived functional relationships between stress, crystalline orientation distribution,
dynamic modulus and strain from an analysis of the deformational behaviour of a
simple mechanical series model consisting of a linear arrangement of crystallites. He
showed that the deformation of these fibres is probably largely due to the elastic strain
and irreversible rotation of the crystallites.
2.3 Fibre Dimensions
The fibre length is an important parameter, both with regards to the physical
characterisations of the resulting fibre and the characteristics of the fibre processing
operations. The fibre length, for natural textile raw materials, like most of their
physical properties, varies greatly and the coefficient of length variation from sample
to sample for cotton is about 40%. For wool it is 50-60%, while for man-made staple
fibres the coefficient is approximately 10%. The range of length of cotton fibres,
produced around the world, is approximately 12.5-44.5 mm. The I ength is important
in fibre processing operations since the machines are designed to operate efficiently
only on a comparatively narrow range of staple lengths and it is desirable to maintain
44

optimum processing conditions and avoid repeated and costly alterations. Fibre length
measurement can be performed in one of two ways, either individually or in a group.
The individual fibre methods are rather laborious and at best semi-automatic, involving
measurement of a single fibre on a scale. For group measurements there are several
methods available. These include the Comb sorter method, the Balls sledge sorter, the
scanning methods and cutting and weighing methods.
The characteristic transverse dimensions of a fibre includes the parameters;
diameter, width, perimeter, area of cross-section, specific surface, linear density, wall
thickness and, for natural fibres, maturity. It is these parameters that affect the
physical properties such as fibre fineness, stiffness, handle, torsional rigidity,
absorption of liquids and vapours and many other yam properties. Amongst the
aforementioned properties, only fibre fineness and its' relation to other properties will
be discussed here and the remainder are discussed later. Fineness which is related to
the transverse dimensions of fibres can be measured using various methods;
micrometric measurements, gravimetric measurements, air-flow methods and the
vibroscope method.
Fibre fineness is an extremely critical parameter in determining the quality and
commercial value of fibres. Length and fineness are strongly correlated. The
correlation is negative with wools and positive with cottons. In cotton fibres fineness
is also associated with variety and maturity. Also, all other conditions being equal, the
finer the fibre the stronger and more uniform is the resulting yam (Rusca and Sands
1968). Fineness is also seen as the dominating factor in determining the limiting count
to which a raw material can be spun. Fineness also affects the flexural and torsional
rigidities of the fibre, with the finer fibres possessing lower values. This is an
important property in controlling the handle and the draping quality of fabrics.
45
The mean linear density (mass per unit length) is the most convenient way of
comparing different samples. In natural fibres, there are significant variations in the
mean linear density between samples and even along the length of the stapled material.
This variation is less pronounced in man-made fibres. For example, Turner (1929)
working on cotton found the mean linear density to change from 215 to 318 mtex in
adjacent 6.4mm lengths.
Crimp is an important characteristic. It is generally defined as the waviness of a
fibre and may be measured in terms of either the number of crimps or waves per unit
length or percentage increase in length of fibre on removal of the crimp.
Brown and Onions (1961) have investigated the bilateral structure of wool and
its crimp and used the classical treatment for the bimetallic strip to predict the
crimp-forming tendency of wool fibres. Holdaway (1956) proposed a helical spring
model to represent the load-extension behaviour of a wool fibre in uncrimping and
found the model to be in good agreement with experiments at low and high decrimping
loads. Shiloh and Litav (1965) studied the recovery of crimp for cotton fibres after
successive loadings. They concluded that cotton crimp includes three components; a
component which recovers immediately after initial extension; a component which
recovers after a relaxation period and is responsible for the reversible deformation of
crimp; and a third component which does not recover at all.
2.4 Sorption and Swelling of Fibres
When fibres absorb water, their dimensions increase both transversely and
axially. The extent of swelling can be expressed in terms of diameter, area, length or
volume. This effect has technical consequences as it results in a shrinkage of twisted
46

or interlaced structures. It also means that in closely woven fabrics, the pores will be
completely blocked and the fabric becomes impermeable to water. Between dryness
and saturation cotton fibres typically swell from 0-2% axially and 0-40% in area.
In cotton, although the glucose and cellulose groups are chemically similar,
glucose dissolves in water while cellulose swells only to a limited extent. Water can
penetrate into the non-crystalline regions of cellulose or between fibrils and dissolve
these regions but it cannot penetrate the crystalline regions where the active groups are
cross-linked. For aramid fibre "Kevlar 49" it is reported (Kevlar 49 data manual,
E.I.du Pont CO.) that the moisture regain of the yams at 55% RH is 3.5-4% after
extended periods of time (typically over 10 hours).
Several theories exist to account for the moisture absorption of fibres. These
include the early theories where molecules are directly and indirectly attached, the
multilayer adsorption theory (the BET equation), Langmuir (1918) and solution
theories. Perhaps the most interesting model is the treatment proposed by Hailwood
and Horrobin (1946). They considered that some of the water is present as hydrates
formed with definite units of the polymer molecule and that the rest form an ideal solid
solution in the polymer. They derived a general equation which relates the amount of
water absorbed to the relative humidity and allows for a variety of different hydrates to
be formed. The equation is:-
Mr kH k ki H1800 “ 1- kH + 1+k kjH (22)
where M t= molecular weight of polymer unit, k i and k are constants and H = relative
humidity. Figure 2.4 reproduced from Morton and Hearle (1975) gives a comparison
of observed and calculated results for cotton and wool at 25°C and shows how water
47
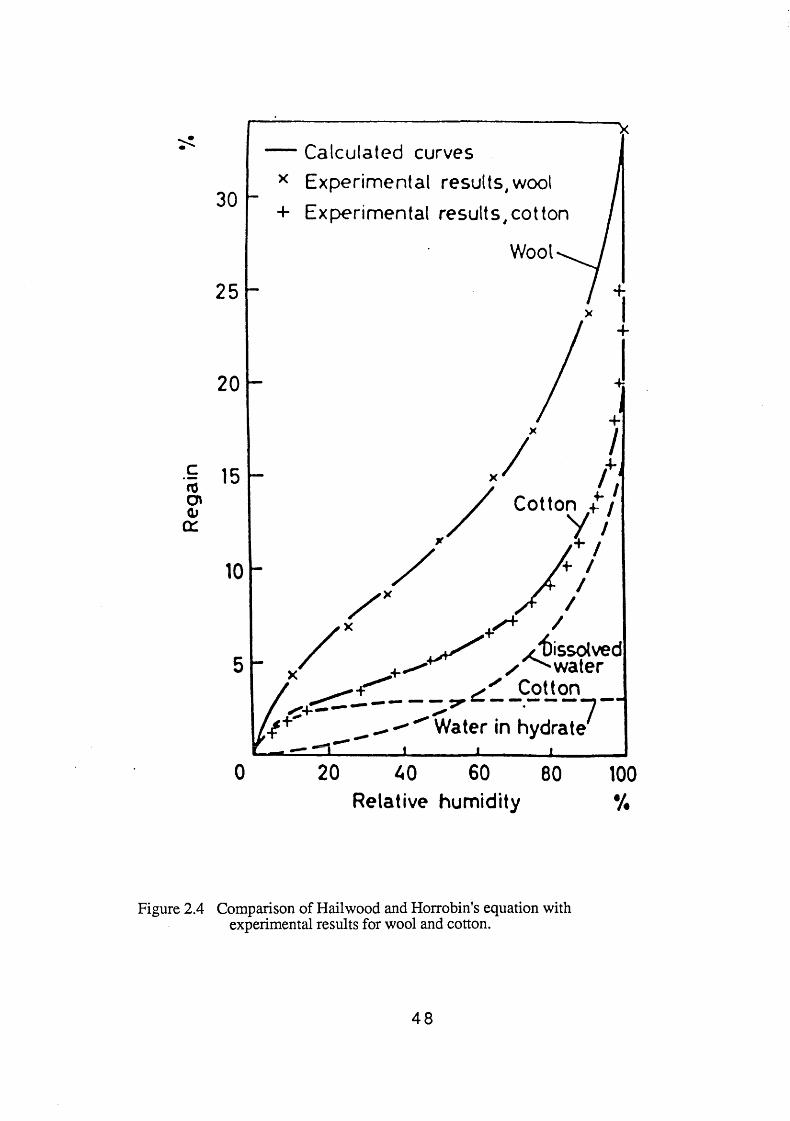
Figure 2.4 Comparison of Hailwood and Horrobin’s equation with experimental results for wool and cotton.
48

4
55% R.H.
Figure 2.5 The effect of relative humidity on the equilibrium moisture regain and regain rate of 380 denier aramid 1 yam.
49
in cotton is taken up between the hydrate and the solution. Figure 2.5 shows the effect
of time and relative humidity on the moisture regain of Aramid fibre 1 yam.
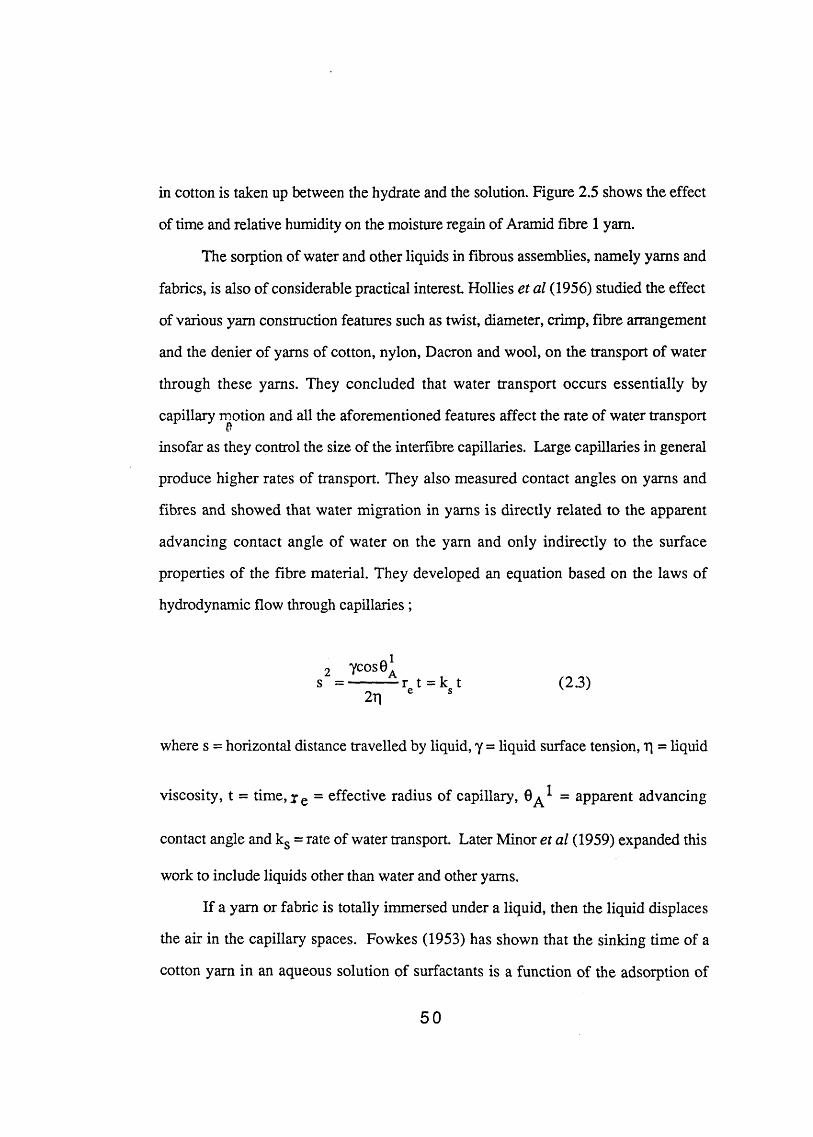
The sorption of water and other liquids in fibrous assemblies, namely yams and
fabrics, is also of considerable practical interest. Hollies e t a l (1956) studied the effect
of various yam construction features such as twist, diameter, crimp, fibre arrangement
and the denier of yams of cotton, nylon, Dacron and wool, on the transport of water
through these yams. They concluded that water transport occurs essentially by
capillary motion and all the aforementioned features affect the rate of water transport$insofar as they control the size of the interfibre capillaries. Large capillaries in general
produce higher rates of transport. They also measured contact angles on yams and
fibres and showed that water migration in yams is directly related to the apparent
advancing contact angle of water on the yam and only indirectly to the surface
properties of the fibre material. They developed an equation based on the laws of
hydrodynamic flow through capillaries ;
2 ycos0*s = ------- “ r t = k t (2.3)
2r| e s
where s = horizontal distance travelled by liquid, y = liquid surface tension, rj = liquid
viscosity, t = tim e,ye = effective radius of capillary, 0^* = apparent advancing
contact angle and ks = rate of water transport. Later Minor e t a l (1959) expanded this
work to include liquids other than water and other yams.
If a yam or fabric is totally immersed under a liquid, then the liquid displaces
the air in the capillary spaces. Fowkes (1953) has shown that the sinking time of a
cotton yam in an aqueous solution of surfactants is a function of the adsorption of
50
surfactant and the cosine of the advancing contact angle of the solution on the fibres.
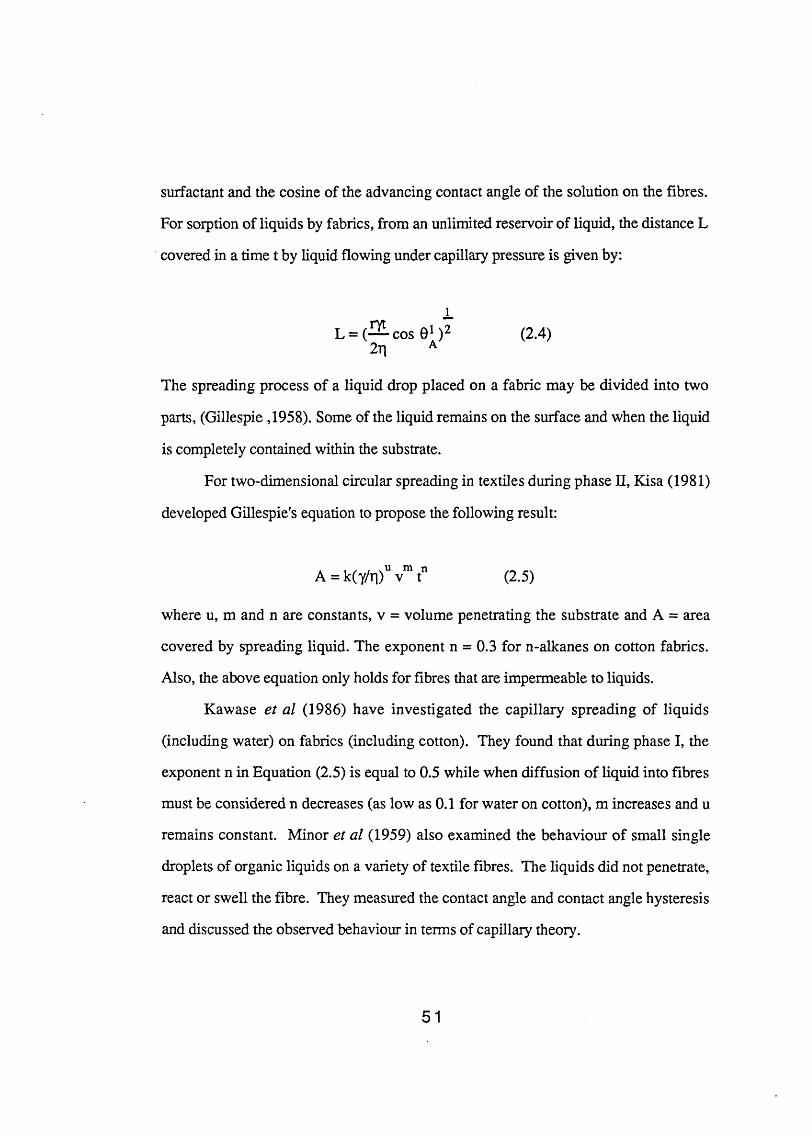
For soiption of liquids by fabrics, from an unlimited reservoir of liquid, the distance L
covered in a time t by liquid flowing under capillary pressure is given by:
lL = (— cos 01 )2On A2n
(2.4)
The spreading process of a liquid drop placed on a fabric may be divided into two
parts, (Gillespie ,1958). Some of the liquid remains on the surface and when the liquid
is completely contained within the substrate.
For two-dimensional circular spreading in textiles during phase n, Kisa (1981)
developed Gillespie’s equation to propose the following result:
where u, m and n are constants, v = volume penetrating the substrate and A = area
covered by spreading liquid. The exponent n = 0.3 for n-alkanes on cotton fabrics.
Also, the above equation only holds for fibres that are impermeable to liquids.
Kawase e t a l (1986) have investigated the capillary spreading of liquids
(including water) on fabrics (including cotton). They found that during phase I, the
exponent n in Equation (2.5) is equal to 0.5 while when diffusion of liquid into fibres
must be considered n decreases (as low as 0.1 for water on cotton), m increases and u
remains constant. Minor e t a l (1959) also examined the behaviour of small single
droplets of organic liquids on a variety of textile fibres. The liquids did not penetrate,
react or swell the fibre. They measured the contact angle and contact angle hysteresis
and discussed the observed behaviour in terms of capillary theory.
(2.5)
51
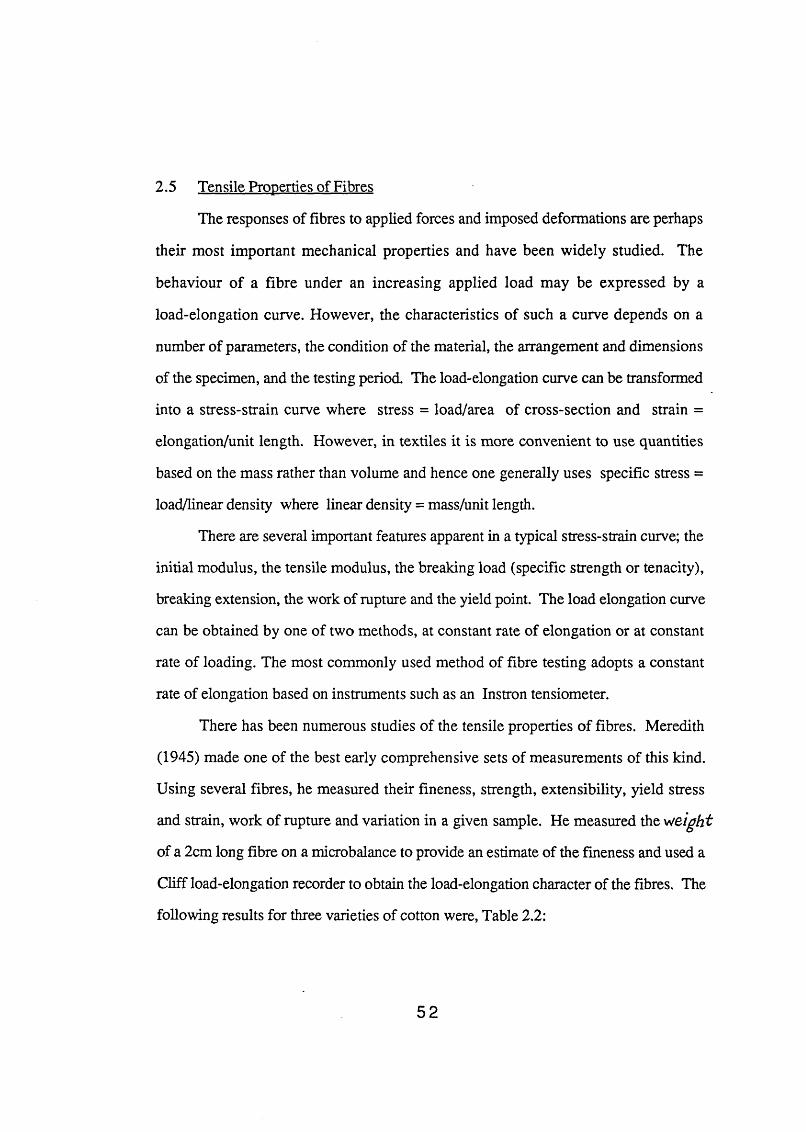
2.5 Tensile Properties of Fibres
The responses of fibres to applied forces and imposed deformations are perhaps
their most important mechanical properties and have been widely studied. The
behaviour of a fibre under an increasing applied load may be expressed by a
load-elongation curve. However, the characteristics of such a curve depends on a
number of parameters, the condition of the material, the arrangement and dimensions
of the specimen, and the testing period. The load-elongation curve can be transformed
into a stress-strain curve where stress = load/area of cross-section and strain =
elongation/unit length. However, in textiles it is more convenient to use quantities
based on the mass rather than volume and hence one generally uses specific stress =
load/linear density where linear density = mass/unit length.
There are several important features apparent in a typical stress-strain curve; the
initial modulus, the tensile modulus, the breaking load (specific strength or tenacity),
breaking extension, the work of rupture and the yield point. The load elongation curve
can be obtained by one of two methods, at constant rate of elongation or at constant
rate of loading. The most commonly used method of fibre testing adopts a constant
rate of elongation based on instruments such as an Instron tensiometer.
There has been numerous studies of the tensile properties of fibres. Meredith
(1945) made one of the best early comprehensive sets of measurements of this kind.
Using several fibres, he measured their fineness, strength, extensibility, yield stress
and strain, work of rupture and variation in a given sample. He measured the v /e ig h t
of a 2cm long fibre on a microbalance to provide an estimate of the fineness and used a
Cliff load-elongation recorder to obtain the load-elongation character of the fibres. The
following results for three varieties of cotton were, Table 2.2:
52
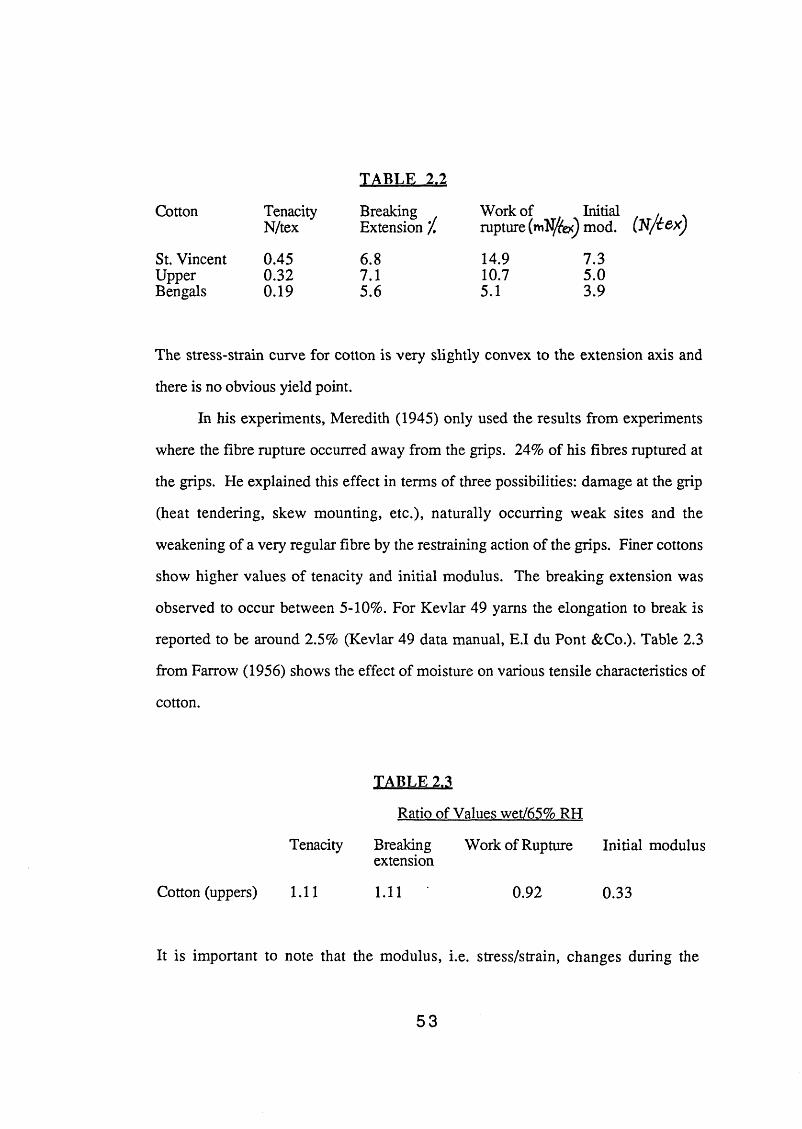
TA B LE 2.2
Cotton TenacityN/tex
Breaking Extension /,
Work of Initial , . rupture (mlJJfex) mod. (N/£ex)
St. Vincent 0.45 6.8 14.9 7.3Upper 0.32 7.1 10.7 5.0Bengals 0.19 5.6 5.1 3.9
The stress-strain curve for cotton is very slightly convex to the extension axis and
there is no obvious yield point.
In his experiments, Meredith (1945) only used the results from experiments
where the fibre rupture occurred away from the grips. 24% of his fibres ruptured at
the grips. He explained this effect in terms of three possibilities: damage at the grip
(heat tendering, skew mounting, etc.), naturally occurring weak sites and the
weakening of a very regular fibre by the restraining action of the grips. Finer cottons
show higher values of tenacity and initial modulus. The breaking extension was
observed to occur between 5-10%. For Kevlar 49 yams the elongation to break is
reported to be around 2.5% (Kevlar 49 data manual, E.I du Pont &Co.). Table 2.3
from Farrow (1956) shows the effect of moisture on various tensile characteristics of
cotton.
TABLE 2.3
Ratio of Values wet/65% RH
Tenacity Breaking Work of Rupture Initial modulus extension
Cotton (uppers) 1.11 1.11 0.92 0.33
It is important to note that the modulus, i.e. stress/strain, changes during the
53

load-elongation test. This is because when fibres are extended, their diameters
contract and hence the true stress increases more rapidly than the apparent value.
Various mechanically based models have been proposed. The elasticity theory
assumes that for small stresses and strains, the effect of each stress is independent
and that the total effect of a complex stress situation is the product of the sum of all
the stresses. For instance, the initial modulus of a fibre would be unaffected by slight
twisting. However, this is not the case for larger strains. Dent and Hearle (1960)
have studied the tensile properties of twisted single fibres. Their experiments were
performed with a constant length during twisting and constant low tension during
twisting. They measured the variation with twist in the tenacity, the breaking
extension, the modulus and the contraction or contractive stress. With constant
length twisting, for an increase in twist, the start of the stress-strain curve was shifted
up the stress axis. The initial modulus was traversed and the breaking load and
extension were decreased.
Meredith (1951), in an investigation of the tensile strength of cotton fibres in
relation to their X-ray orientation, found a correlation between initial modulus and
orientation. Meredith also found that the coarse fibres had a higher breaking load but
not in proportion to their area of cross-section. Morlier e t a l (1951) noted that the
tenacity and the breaking extension increased with the increasing length of their cotton
fibres. Meredith (1951) correlated tensile strength of single raw cotton fibres with the
orientation of the crystallites and found correlation coefficients ranging from
0.77-0.84. Molecular orientation is closely related to the spiral angle in cotton fibres,
but since the spiral angle is found to be rather constant in cotton fibres (20-23°), the
difference seems to be due to the effect of the convolutions. Also, wet cotton was
found to be stronger than dry cotton and the probable reason suggested was that in
54
the wet cotton the shear stresses that can occur by the untwisting and the unbending
of the fibre, which can lead to rupture, have been relieved. Hearle and Sparrow
(1971) investigated the fracture of dry, wet and mercerised cotton fibres using
scanning electron microscopy. They found that the tensile fracture occurred adjacent
to a reversal zone and not through it. Splitting between fibres occurs due to the
untwisting effect. Fibres broken in the dry or cross-linked state result in the fracture
running across the fibre with little splitting. In wet cotton, due to the weaker attraction
between fibrils, they give a long break.
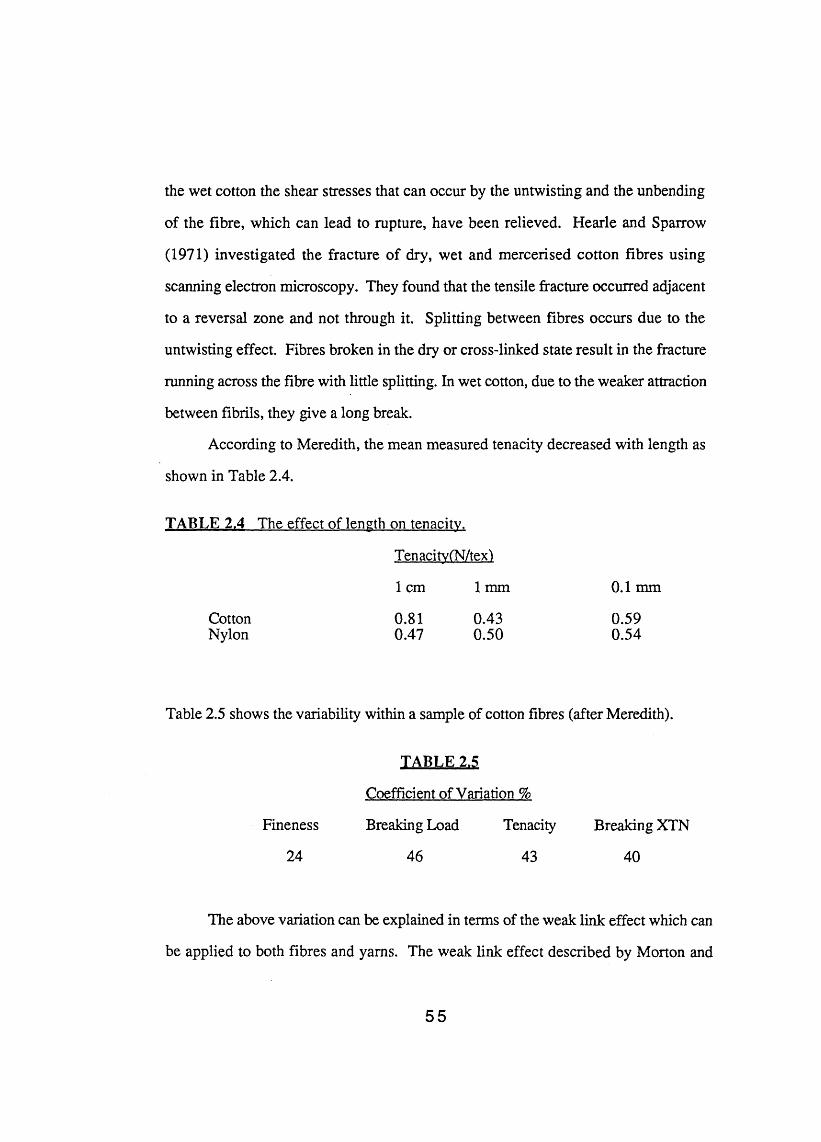
According to Meredith, the mean measured tenacity decreased with length as
shown in Table 2.4.
TABLE 2.4 The effect of length on tenacity.
TenacitvfN/tex)
1 cm 1 mm 0.1 mm
Cotton 0.81 0.43 0.59Nylon 0.47 0.50 0.54
Table 2.5 shows the variability within a sample of cotton fibres (after Meredith).
TABLE 2,5
Coefficient of Variation %
Fineness Breaking Load Tenacity Breaking XTN
24 46 43 40
The above variation can be explained in terms of the weak link effect which can
be applied to both fibres and yams. The weak link effect described by Morton and
55
Hearle (1975) has the following results:
(a) the mean measured strength of a specimen decreases as the test length
increases;
(b) for more irregular fibres, this decrease is more rapid;
(c) the order of ranking of specimen strengths may alter if the test length is
changed.
Attempts have been made to produce a mathematical analysis to estimate the strength
that would be obtained at some greater test length than that actually used. The analyses
of Pierce (1926) and Spencer-Smith (1947) are such examples but neither method
gives satisfactory results. The weak link effect also influences the stress and strain
characteristics in a tensile test, as well as breaking extension. The latter decreases as
the specimen length increases. The effect of the variability on the shape of the
stress-strain curve of dry and wet wool fibres has been investigated by Collins and
Chaikin (1969). The elastic recovery of a fibre is of great technical importance. It will
not be discussed in detail here, since it is not directly related to this work. Elastic
recovery is the ratio of elastic extension to total extension.
On a molecular level, elastic deformation is due to the stretching of
inter-molecular or inter-atomic bonds, while plastic deformation occurs when bonds
break. There are many parameters that can affect recovery, including, time, rate of
extension, humidity, temperature, etc. Compared to other fibres, the elastic recovery
of cotton is only moderate. For a given strain, recovery is independent of variety, but
the recovery is less in coarse cottons since they possess lower moduli. Table 2.6
indicates the extent of the recovery in cotton and nylon fibres, after Beste and Hoffman
(1950).
56

TA B LE 2.6
CottonNylon
Elastic Recovery
1% extension 60% RH 90% RH
91 8390 92
5% extension 60% RH 90% RH
52 5989 90
The analysis of the mechanics of cotton and other plant fibres is somewhat
similar to that of the twisted yam mechanics (due to their fibrillar structure), Hearle et
a l (1969). Hearle (1967) has analysed the mechanics of fibres using a minimum
energy method and considered both the extension of the crystalline fibrils and the
possible reduction in volume. For an assembly with a constant helix angle at all radii,
he obtained the following result:
E = % (cos20-usin20)2 + K(l-2\j)2 (2.6)
« = (Ej cos20sin20+2K)/(Ef sin46+4K) (2.7)
twhere E =fibre tensile modulus, 0=helix angle, Extensile modulus of crystalline
fibre, v = Poisson’s ratio and K=bulk modulus. In ordinary cotton fibres, there are
other features such as variation in the helix angle, the collapsed shape of the fibre,
helix reversals and convolutions that can lead to further extensions.
It is important to recognise that the mechanical properties of fibres a VC
viscoelastic and this is why most fibres exhibit characteristics of yield point and creep.
Cotton is somewhat different in that it does not possess a yield point and it's
57
stress-strain behaviour is rather Hookian, i.e. stress a = E e for relatively small strains
where e = strain.
One way of analysing viscoelastic properties of any material is to use models
based on ideal elastic springs and viscous dashpots. However, in the case of fibres,
this would require a very complex arrangement of elements to represent all the
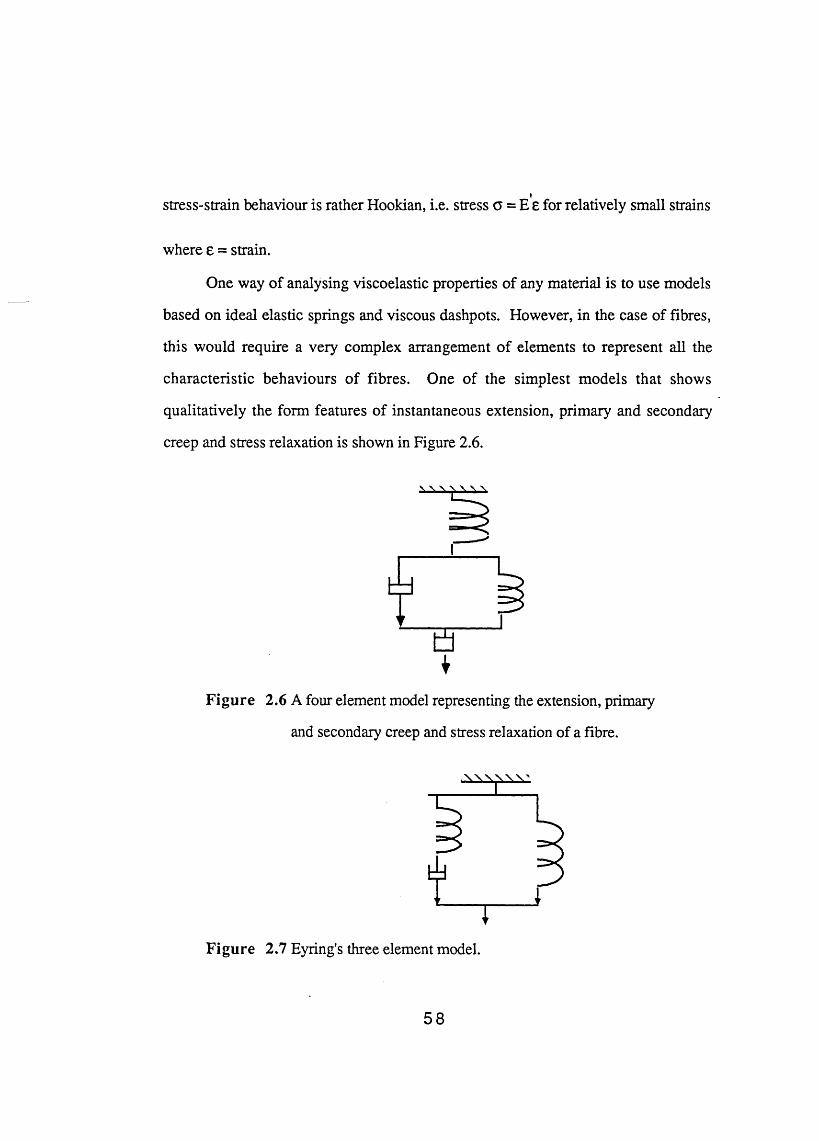
characteristic behaviours of fibres. One of the simplest models that shows
qualitatively the form features of instantaneous extension, primary and secondary
creep and stress relaxation is shown in Figure 2.6.
I
Figure 2.6 A four element model representing the extension, primary
and secondary creep and stress relaxation of a fibre.
Figure 2.7 Eyring's three element model.
58

However, the most successful model, proposed by Eyring e t a l (1941) is the three
element system, Figure 2.7 and its behaviour is represented by equation 2.8:
d£—- = k s i n h a a (2.8)dt
where k and a are constants.
The material discussed so far on the tensile properties of fibres refers to these
properties at low speeds of testing (rates of strain). At higher speeds (ballistic rates)
other methods and analyses must be adopted.
2.6 Bending and Twisting of Fibres
2.6.1 Introduction
The bending and twisting characteristics of fibres are of great practical
significance. They affect the behaviour of bulked-yam filaments and the handle and
drape of fabrics and play an important role in the arrangement of fibres in yams. The
bending properties also influence fabric properties such as flexibility, crease retention
and wrinkle-recovery. Bending strength and shear strength may be important in wear.
In this section, the bending and torsional properties of fibres are briefly discussed in
relation to some of the theories developed in the literature
2.6.2. Bending
Compared to the tensile properties of fibres, bending properties have received
little attention, although Guthrie (1954) has emphasised that bending properties
59
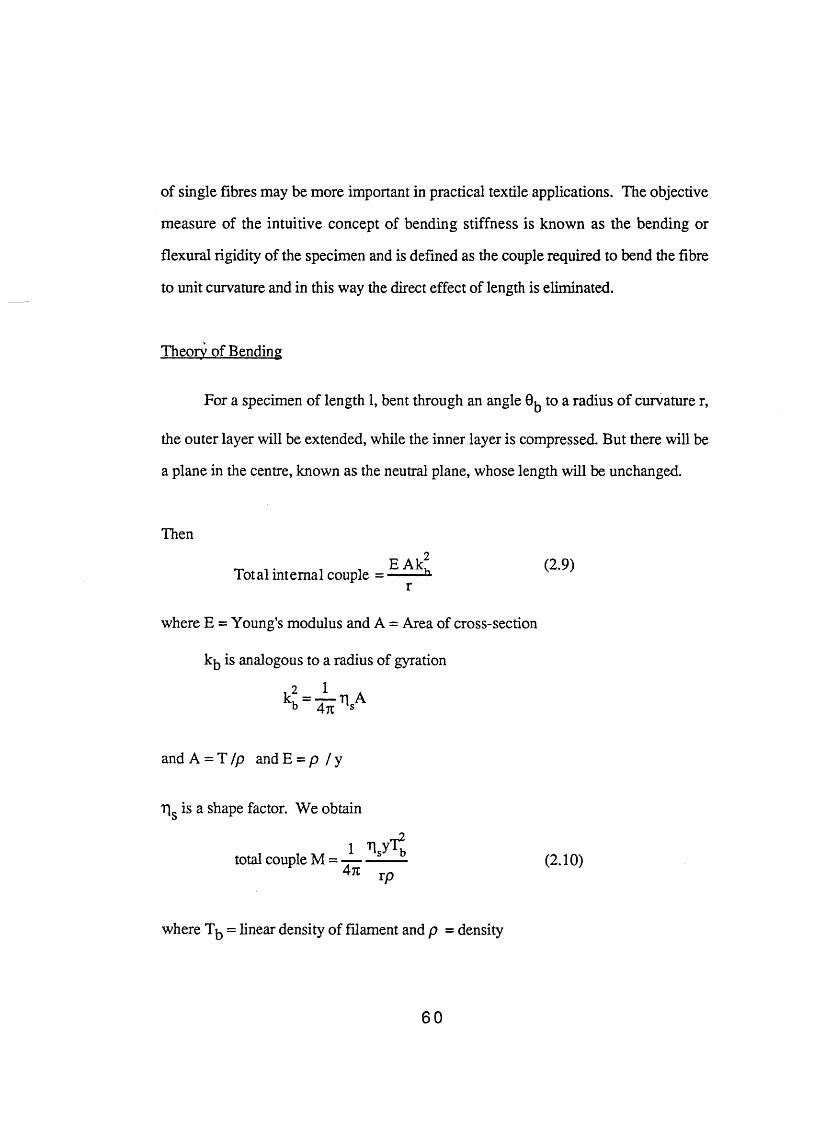
of single fibres may be more important in practical textile applications. The objective
measure of the intuitive concept of bending stiffness is known as the bending or
flexural rigidity of the specimen and is defined as the couple required to bend the fibre
to unit curvature and in this way the direct effect of length is eliminated.
Theory of Bending
For a specimen of length 1, bent through an angle 0^ to a radius of curvature r,
the outer layer will be extended, while the inner layer is compressed. But there will be
a plane in the centre, known as the neutral plane, whose length will be unchanged.
Then
^ , EAkfTotal internal couple = -------ix
(2.9)
where E = Young’s modulus and A = Area of cross-section
k^ is analogous to a radius of gyration
. 2 1 . k, = — ri A b 4 k ‘s
and A = T /p and E = p / y
rj is a shape factor. We obtain
total couple M = i nX4n rp
(2. 10)
where T^ = linear density of filament and p = density
60

and flexural rigidity =4n p
(2.11)
Flexural rigidity may be measured statically or dynamically. Four main types of
methods have been used in the study of single fibre bending.
1. Cantilever loaded at one end
2. Loaded loop
3. Searle's double pendulum
4. Vibrating rod.
Owen (1965) used Searle's single and double pendulum methods to measure
the flexural and the torsional rigidity of single fibres. According to the author, both
these properties are closely related to the fibre linear density within a sample and hence
he also measured the length of his specimens. He tested a large variety of fibres. For
cotton he obtained a value of 0.53 mN mm2/tex2 for the specific flexural rigidity, this
being the flexural rigidity over square of linear density.
Guthrie (1954) used static and dynamic methods to measure bending rigidities
and their relation to tensile measurements and found that at similar rates of loading for
acrylic, polyamide and polyester fibres, the dynamic bending modulus was higher than
the static bending moduli. In most cases, the measured tensile modulus lay between
the dynamic and static bending moduli.
The above analysis and investigations have been performed at bending strains
<0.5% where the bending and tensile stress-strain curves are virtually coincidental.
Chapman (1971, 1973) studied the viscoelastic properties of single fibre in pure
bending up to strains as high as 20%. He presented his results as bending
stress-strain curves; defining the bending strain as b/n where b is half the thickness in
the plane of bending, provided the neutral plane is in the middle. He found that in all
61
the man-made fibres, the bending stress-strain curve lay below the tensile curve
indicating that yield in bending (on the compressive side) occurred more readily than
yield in tension. However, in horsehair (and wool) the situation was reversed.
Chapman also investigated the influence of temperature and relative humidity on
bending modulus and found the modulus to decrease with increasing temperature and
humidity.
Buckley (1979) performed a theoretical study of the effect of environmental
conditions on the mechanical properties of fibres including bending and twisting and
presented equations relating the changes to variations in fibre properties.
2.6.3. Twisting
The torsional rigidity or resistance to twisting of a fibre is defined as the couple
required to introduce a unit twist, i.e. unit angular deflection between the ends of a
specimen of unit length. The torsional rigidity can be obtained in terms of the shear
modulus, defined as the ratio of shear stress to shear strain, the shear strain being in
radians. When torsional rigidity is defined as torque necessary to produce unit twist in
radians it will equal enT2/27tp . The expression shows the effect of the modulus of
rigidity, fineness, shape and density.
Pierce (1923) has investigated the torsional rigidity of cotton fibres and found a
mean value for the modulus of rigidity to be 2.3xl09 Pa. He also found the torsional
rigidity to halve for every 10% increase in moisture regain and the modulus of rigidity
to halve for every 7.2% increase in moisture. Later Clayton & Peirce (1929) found
that in the range 20-40°C, the torsional rigidity decreased by 1.2% of its value at 20°«
for each degree increase in temperature at 7% moisture regain.
62

Meredith (1954) studied the initial torsional rigidity of single fibres using the
torsion pendulum method for twists less than half a turn per cm. For cotton he
obtained a value of 522±92xl0"5 Pa for the torsional rigidity and 2.51xl09 Pa for the
modulus of rigidity. He also produced relationships to estimate the shape factor of
various shaped fibres. Studying the effect of tension on torsional rigidity he
concluded that if tension is kept below 0.2 g/tex, the positive correlation will be
negligible.
Guthrie et al (1954) have also used the torsion pendulum method to study the
torsional rigidity of fibres and found that for various diameters of fibres, the torsional
rigidity was proportional to (tex)1-9 (cf. theoretically (tex)2) and accounted for this by
the difference of shape in fibres of different fineness.
Owen (1965) has studied the torsional rigidities of fibres dynamically. He
found values for the specific torsional rigidity and shear modulus of fibres [specific
torsional modulus is torsional rigidity of a specimen of unit linear density = en /p, the
value for cotton being 0.16 mN mm2/tex2.
In torsion, one is concerned with forces at right angles to the fibre axis, in other
words, they act between the molecules and not along their length as is the case when a
fibre is stretched. Deformation through twist is easier and hence one expects the shear
modulus to be less than the tensile modulus. This is indeed the case, the difference
being greatest for the most highly oriented fibres such as aramids. The ratio of the
tensile to shear moduli gives a rough measure of the anisotropy of the fibre as far as its
cohesion lengthwise and laterally is concerned. The value for cotton is found to be ca.
3.7 while the value for a typical nylon is 5.8.
63
2.7 Summary
This review has ranged through a number of physical characteristics of fibres. It
has focused mainly upon structure, dimension, mechanical properties and
environmental sensitivity. Cotton fibres are seen to be of a complex chemistry,
morphology and dimension whilst the aramid fibres are comparatively simple species.
Both fibres show a pronounced sensitivity to water although these effects for cotton
are more pronounced. The mechanical properties have been reviewed under three
headings; tension, torsion and bending and while the intrinsic behaviour in each mode
is different the deformation characteristics exhibited in the three modes show some
similarity at a first order level. This is particularly so with respect to the environmental
changes discussed.
6 4

C H A P T E R T H R E E
SINGLE YARN PROPERTIES
3.1 Introduction
A major part of this thesis is concerned with the tensile and frictional properties
of staple and continuous filament yams and this chapter reviews these properties and
the models which have been developed to account for these characteristics. The
extensile behaviour of yams arises from a complicated interaction of the intrinsic
deformation behaviour of the single filaments or fibres, the interfilament friction and
the relative geometry of the filaments in the yam. The tensile and bending behaviour
of the single filaments were discussed in Chapter 2. In this chapter, the manner in
which the yam structure influences the tensile extension of yams is introduced. The
chapter reviews the various analyses that have been developed to account for the
behaviour of yams using filament and interfilament characteristics. The chapter also
reviews a number of aspects of the friction and lubrication of fibres and yams and the
way in which these processes affect the bundle strength and tensile behaviour of
yams.
Because of the important role which filament friction plays in affecting the
mechanical properties of yams and also fabrics, the subjects of friction and lubrication,
both generally and in the context of fibres and yams and to some extent fabrics, are
reviewed in this chapter.
Yams are complex structures. They comprise a rather isotropic or oriented
collection of filaments. If the filaments (sometimes called fibres or monofilaments) are
long, say one hundred times the diameter of the yam, the yam is called a continuous
spun yam. Where the filaments are only a few times the yam diameter in length, the
65

yams are called staple or discontinuous yams. This chapter will describe the behaviour
of both of these classes. Natural yams are usually discontinuous and comprise short
filaments. Cotton yams are an example. Many synthetic yams are constructed from
continuous filaments. The aramid yams investigated in this thesis fall into this
category.
The yams produced by both routes usually have characteristically similar
structures in order to produce particular properties. These properties are discussed
later. The main similarity is that the yams are invariably spun and hence they compose
of more or less extended helically wound filaments. This structure is responsible for
many of the observed properties and most importantly the yam coherence. The cotton
yams studied in this thesis possessed such a spun structure. The structure of the
aramid yams were rather different to those of the cottons. The aramid yams were
composed of filaments lying adjacent to each other with relatively little spin or
migration. Thus, the properties of the yam and in particular the extensile properties of
the yams are affected to a lesser extent by the geometry of the yam than in the case of
the cotton yams.
3.2 Structure of Yams
Many of the early studies of yam mechanical properties often adopted unrealistic
models of the yam structure to facilitate the modelling of their properties. Figure 3.1
depicts an ideal helical geometry due to Hearle e t a l (1965), often adopted in theoretical
studies of the structural mechanics of yams. It is assumed that the yam is circular in
cross-section and that the fibres are following helical paths around concentric cylinders
of a constant radius. At a distance r from the axis, Figure 3.1, the fibre length is 1; at
the surface of the yam with radius R, the fibre length is L. h denotes the filament
length associated with one complete rotation of the filament about the yam axis. This
66
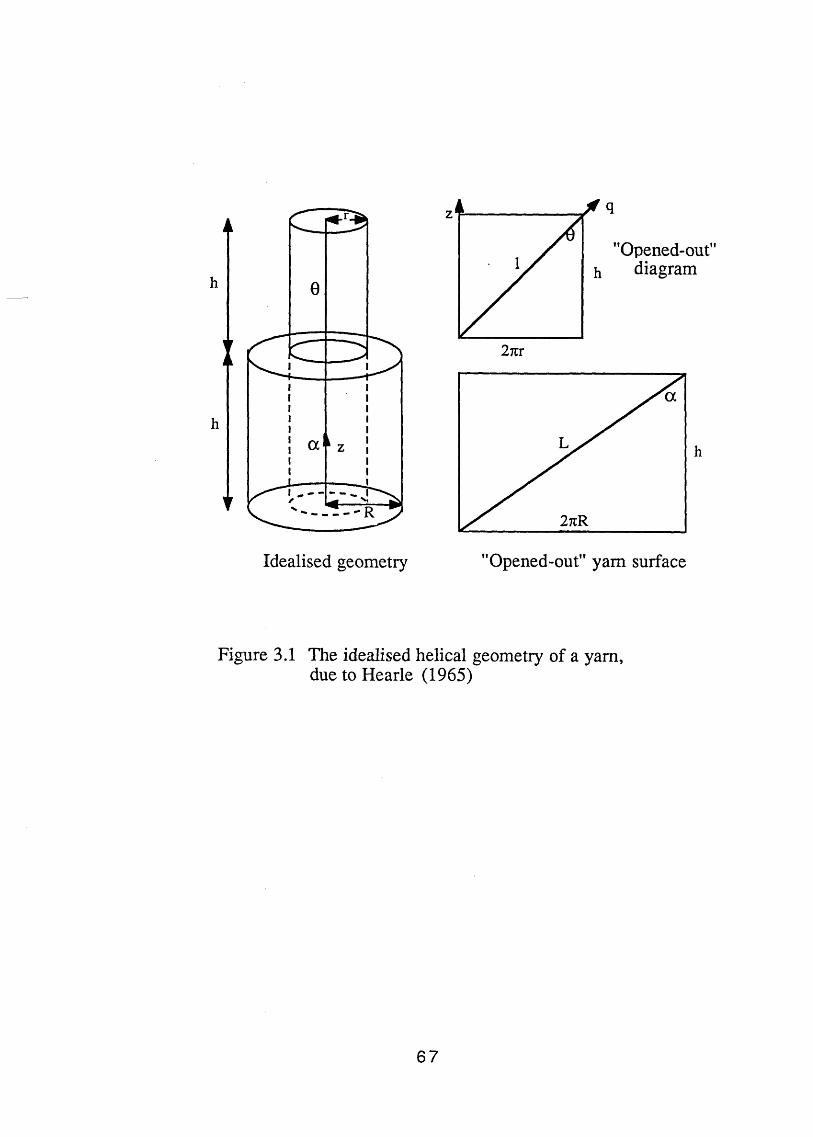
Figure 3.1 The idealised helical geometry of a yam, due to Hearle (1965)
67
structure is however quite unrealistic. The actual position of a fibre in a yam can be
traced for example by the colour contrast fibre trace method of Morton and Yen
(1952). It will then be seen that the fibres traverse back and forth across the imaginary
cylindrical zones of the yarn body. Sometimes it is at or near the surface and
sometimes at or near the core. This interchange of position produces a tangle of
interconnected fibres. This type of behaviour was initially observed by Morton
(1956). He termed the process "fibre migration" and the usage is still retained.
There are various factors that affect fibre position in the yam, and these can be
considered to belong to three groups: fibre factors, yam factors and process factors.
Fibre factors include properties such as length, fineness, shape, coefficient of friction,
tensile modulus, flexural and torsional rigidities, extensibility and recovery. Among
the yam factors we can find properties such as yam count and amount of twist, and
process factors would include the tension during processing, the drafting system and
the amount of draft, the position of fibre when delivered and the machine geometry
and setting.
The theories or mechanisms proposed to account for fibre migration up to 1968
have been reviewed by El-behery (1968). Migration processes occur as a result of two
different mechanisms described as the tension variation mechanism and the geometric
mechanism. Morton (1956) postulated the tension variation mechanism of migration
in the following way. Because the length of the fibre path as proposed by the simple
helical model above, increases from the core to the surface, so also must the tension in
the fibres. The fibres near the surface of the yam are at a higher tension than those
near the core. When the spinning tension is removed, the most likely nett result of the
stress relaxation would be that the fibres at the surface would remain under a reduced
tension and the fibres in the core will be buckled. Thus, in continuous spinning it is
supposed that the taught filaments will attempt to release their strains by gradually
migrating towards the centre, while the buckled ones will migrate to the surface. The
68
ultimate result of this process would be a yam with component filaments all of the
same length in a unit length of yam.
Onions e t a l (1960) suggested that migration mechanisms are different for fibres
of different lengths and diameter. The coarser and stiffer fibres tend to drift to the
outside of the yam as they store more elastic energy which can be dissipated by this
process. In contrast, Hickie and Chaiken (1960) suggested that any migration is
mainly a result of fibres moving towards the yam axis. The twist insertion at the twist
zone plus inter-fibre friction will cause the fibres to extend longitudinally and they will
tend to move to the interior under forces acting radially. They also suggested that
fibres under higher tension will migrate to the interior more rapidly than those with
lower tensions.
Hearle and Merchant (1962) have introduced yet another migration theory based
on a study of a seven-ply structure and argued that migration will only take place when
the tension in the "central" ply has fallen to zero.
The geometric mechanism was first described by Hearle and Bose (1965) and
they claimed that it may either combine with or replace the tension mechanisms. It is
based on the fact that in practical twisting operations, it is probably more common for
the yam to be processed as a ribbon rather than a cylinder. In this mechanism, fibres
on the outside would show a very marked migration while those originally near the
centre would show little or no migration. Later Hearle et al (1965) concluded that the
two migration mechanisms were not mutually exclusive.
There are basically two methods of investigating fibre migration in yams. The
tracer fibre technique first adopted by Morton and Yen (1952) and mentioned earlier
and adopted by several other investigators such as Wray and Truong (1965), Riding
(1964) and Hickie and Chaikin (1960) is simple in principle. The basic idea here is
that the coloured tracer fibre can be mapped against the background of the body of the
yam to produce a trace line representing the projection in one plane of a helix. The
69
second technique involves the cross-sectioning of yams. Several workers, Coplan &
Bloch (1955), Hamilton (1958), Onions et a l (1960) and Rudolph (1955) have used
this technique. The basic principle is that cross-sections are cut from the yam and are
divided into a series of zones concentric with the axis and the fibres or blend
composition is studied in each zone. In both cases the experiments are difficult and
tedious to perform and only rather qualitative empirical data are obtained.
3.3 Mechanical Properties of Single Yams
3.3.1 Introduction
The mechanical properties of yams have been studied extensively by many
workers. These properties, like those of fibres, can be divided into three groups; the
extensile properties, the torsional properties and the bending properties. The thesis is
primarily concerned with the tensile properties of yams and hence this review of
literature will only deal with the theories and the observations which relate to the
tensile properties of yams. Figure 3.2 shows the tensile characteristics of a staple
fibre and a continuous filament yam. Certain differences in the behaviour of the two
types of yam necessitates the adoption of rather different theoretical and analytical
treatments. The first part of this section deals with experimental studies and the
influence of a number of variables. The theoretical treatment of the mechanics of yams
has been approached from two directions, the classical treatment and the energy
method of analysis. These techniques are briefly reviewed here.
3.3.2 The Tensile Mechanics of Continuous Filament Yams
A general strategy for the analysis of the mechanics of yams was outlined by
Treloar (1964) in his Mather lecture almost a quarter of a century ago. The essence of
70
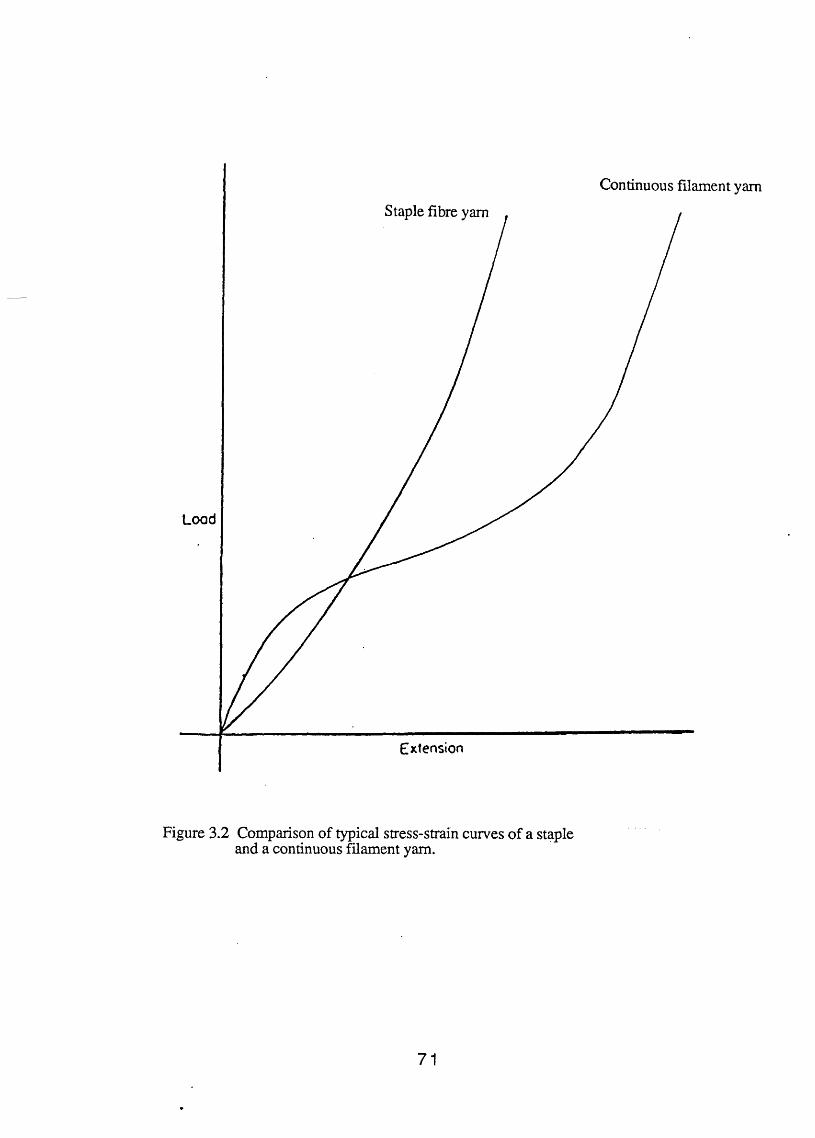
Continuous filament yam
Figure 3.2 Comparison of typical stress-strain curves of a staple and a continuous filament yam.
71
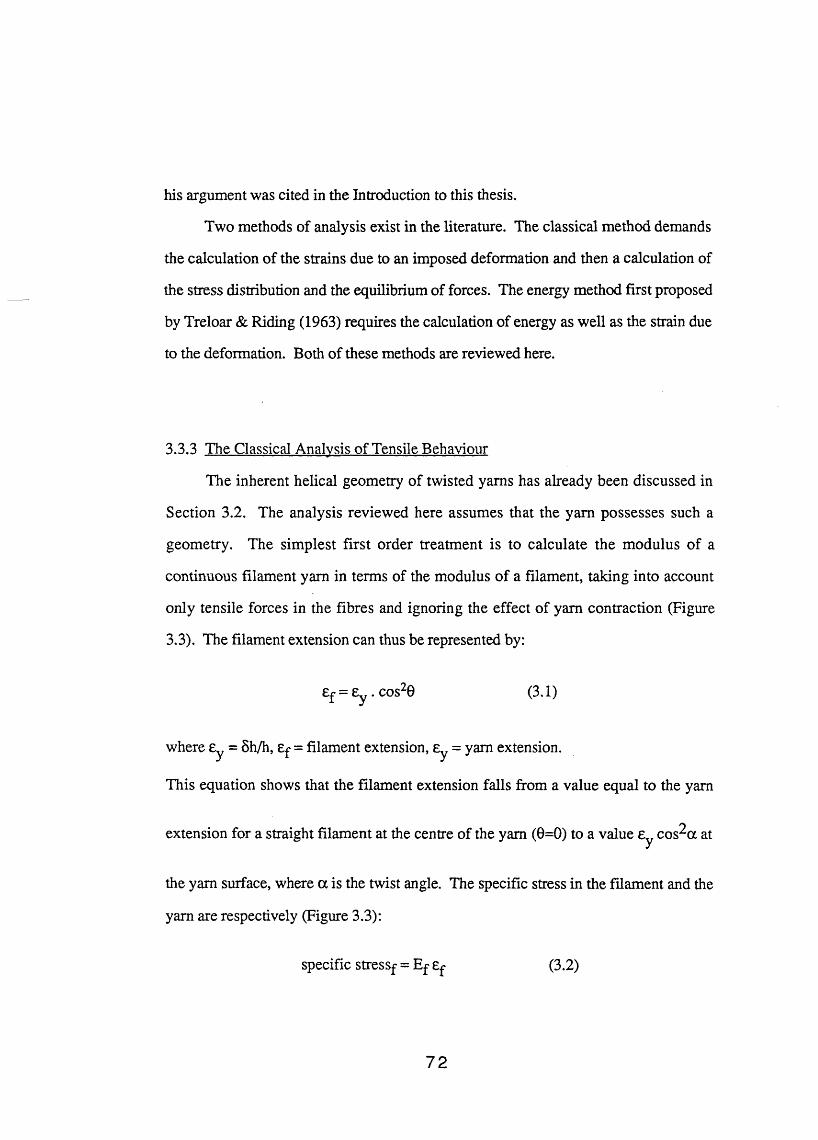
his argument was cited in the Introduction to this thesis.
Two methods of analysis exist in the literature. The classical method demands
the calculation of the strains due to an imposed deformation and then a calculation of
the stress distribution and the equilibrium of forces. The energy method first proposed
by Treloar & Riding (1963) requires the calculation of energy as well as the strain due
to the deformation. Both of these methods are reviewed here.
3.3.3 The Classical Analysis of Tensile Behaviour
The inherent helical geometry of twisted yams has already been discussed in
Section 3.2. The analysis reviewed here assumes that the yam possesses such a
geometry. The simplest first order treatment is to calculate the modulus of a
continuous filament yam in terms of the modulus of a filament, taking into account
only tensile forces in the fibres and ignoring the effect of yam contraction (Figure
3.3). The filament extension can thus be represented by:
£f=£y.COS20 (3.1)
where £y = 5h/h, Ef = filament extension, Ey = yam extension.
This equation shows that the filament extension falls from a value equal to the yam
extension for a straight filament at the centre of the yam (0=0) to a value Ey cos^a at
the yam surface, where a is the twist angle. The specific stress in the filament and the
yam are respectively (Figure 3.3):
specific stressf = Ef £ (3.2)
72
d h
Figure 3.3 A schematic representation of an extended yam based on the ideal helical geometry.
73

(3.3)specific stresSy = Ef 6y cos2a
and hence Ey = Ef cos2a (3.4)
where Ey and Ef are yam modulus and fibre modulus respectively. This simple
treatment has two major deficiencies. It ignores the effect of the diametric yam
contraction and also the contributions of any transverse forces at right angles to the
fibre axis are neglected.$Hearle, El-behery & Takur (1961) have presented a more comprehensive
analysis which includes these factors. It was based on the following assumptions:
1. The yam is a continuous filament yam of circular cross-section, uniform along
its length and having a constant specific volume.
2. All the filaments possess identical properties, are uniform along their length,
perfectly elastic and possess a Hookian response.
3. The ratio of yam to fibre diameter is large.
4. The fibres are assumed to lie on perfect helices, of constant radius and angle,
possessing the same number of turns per unit length parallel to the axis of the helix.
5. The strains involved are small.
6. The transverse yam contraction is assumed to be uniformly distributed across
the yam.
7. The stress distribution is uniform across that part of each face of a yam element
occupied by fibre material.
8. The stresses orthogonal to the fibre axis are assumed to be isotropic.
9. The shear forces and couples of the yam are neglected.
The yam geometry is defined by the following relations, see Figure 3.3.
74

l2 - + 4tiV (3.5)
cos0 = h /1 = c / u (3.6)
sin9 = 27tr /1 = (1 - c /u )1/2 (3.7)
where u =1 / L and c = cosa = h / L.
The variation of strain through the yam is defined by the differential equation:
dl _ h2 dh 4rc2r2 dhL-71: 7 °y~ (3.8)
where Gy = lateral contraction ratio of yams. This equation is only valid for small
strains. The relation between the tensile stress X and compressive transverse stress G
in a filament is defined by the equation:
X = Efey[c2/u2 - CTy (l-c2/u2)] - 20j G (3.9)
where Gj=axial Poisson's ratio. The term Ef £y represents the stress in a single
filament Xf when it is extended by the same amount as the yam. Normalising
equation 3.9 by Xf yields:
x = c2/u2 - Gy (l-c2/u2) - 2Gfg (3.10)
The transverse and tensile stress distributions in the yam are defined by the two
following equations respectively.
1+g 2y cd+2Oj) u2
1+0,(1 - u ) - a
2a ,-1 1-u(2 o r 1)
(3.11)
75

X = (3.12)( l+ a ) c i+2oj
------------- 2— - ( 1 + 2 0 ^ ) -(l+2o )u
2a -11-2(1 1
y (2or l)
Using the above assumptions and equations, and for small strain, the equation for the
mean normalised yam stress can be obtained:
mean normalis ed yam stress
2c
(1+2CTJK1-C2)
2(1+0.) 2a,+l((l+o Line + -----------(1-c )
y l+20j
o 3(l+2o.) 4 ( l+ o ) 2or i i- - £ [ ----------!-------------c - - ] ) ) (3.13)
2 2 o ,-1 2 0 j - 1 c2
For large yam strains two complications arise. First, equation 3.8 is no longer
valid and second, filament deformation usually deviates from Hooke’s law. Hearle e t
al (1969) have tabulated a series of equations derived for the load-extension behaviour
of twisted yarns. This book also includes detailed derivations of the equations
presented here.
The equations presented are an expression of the load-extension behaviour of
twisted filament yams. They can be used to predict the stresses in a yam in terms of
the parameters: yam contraction ratio, twist angle and Poisson's ratio of the fibres.
3.3.4 The Analysis of Load-Extension Curve Using the Energy Method
The classical method of analysis is rather inadequate in cases where the
stress-strain curve of the fibres is non-linear or where it is necessary to consider both
large extensions and transverse forces. Treloar & Riding (1963) first devised the
energy method as an alternative method of analysis. They analysed the mechanics of
76

an extended yam by calculating the energy of deformation, and related the elastic
energy stored in the deformed filament to the work done in extending the yam. The
energy method is much simpler than the micro strain model but it produces less
information. It provides only the total yam tension and not the distribution of stresses
in the yam. Treloar & Riding (1963) also point out that the effects of transverse forces
are automatically taken into account. Treloar (1965) and Treloar & Riding (1965)
extended this theory to take account of the migration of filaments in a yam and the
apparent variation of twist with radial position. They made the following assumptions:
1. The unstrained yam takes the idealised helical geometry with uniform density of
packing.
2. The filaments deform without change of volume, i.e. it is assumed that they are
compressible under hydrostatic pressure. This means that the energy stored is a
function only of the axial strain and not the axial and lateral strains.
3. The yarn also deforms without change of volume. For small strains this is
equivalent to the yam lateral contraction ratio Oy = 0.5.
4. The stress-strain properties of the filaments in the yam are taken to be the same
as the individual isolated filaments.
5. The fibres are perfectly elastic, i.e. all the work done is converted into stored
elastic energy.
Regarding the third assumption, Hearle e t a l (1960) investigated the relative changes of
yam diameter during extension using a photographic technique. Their results show
that there is a decrease in yam volume with increasing extension. However, this
decrease becomes smaller as the breaking point is approached.
The stress-strain relation of a filament of unit length can be given as:
X = 4>(ef) (3.14)
77

The work done in straining a filament of unit mass and length up to strain is:
wf = J <|>(ef) def (3.15)o
The elastic energy stored in an element of yam of unit length, mass of 27tr0dr0/vy,
specific volume Vy, lying between radii rQ and r0+ dr0 is thus:
dW = (27t/Vy) [J <t)(ef) det]r0 dro (3.16)O
By integrating Equation (3.16) over the whole yam cross-section, the total elastic
energy stored, Wy can be obtained as:
Ro Ef
Wy = (2rc/vy) J [J (Kef) def] rodro (3.17)O O
where R0 = yam radius in unstrained state. By differentiation of Wy with respect to
£y, the yam tension F can be obtained. The specific stress Y in the yam is thus:
Y =F
(v / tR (3.18)
However, in order to evaluate Y, it is necessary to know, first, the form of the fibre
stress-strain relation and second, the way the filament strain £f varies with yam strain
Ey and yarn radi al position rQ. <j>(£f) can be represented by an appropriate
78

mathematical formula, de^dey can be shown to be represented by the formula:
aEf v- I = ----------------------5------r j i (3.19)9S { [ l+ ¥ l[ l+ (+ e y) ' V l)
where \|/= Y7C r0^T^. The exact derivation of this formula is given in the book by
Hearle e t a l (1969). Treloar (1965) has used this theory to derive the stress-strain
properties of multiply cords.
More recently, Hearle & Sakai (1978) proposed a new extended theory of the
tensile properties of continuous filament yarns. They introduced the idea of a
distribution function for fibre angles and derived a general equation that enables the
prediction of the stress-strain relations of twisted filament yams from those of the
constituent single fibres.
Komori, Makishima and Itoh (1980) have outlined an extended theory on the
mechanics of twisted homogeneous-filament yams at large deformations. They used a
different description of the distribution of fibre orientation and included an estimate of
the change in fibre orientation due to the deformation. By estimating the actual
orientation distribution of yams of different twist and using the tensile properties of
constituent fibres, they calculated the load-strain relations of the yams. They found
the results to agree quite well with experiments although there was a certain amount of
discrepancy for large strain and/or high twist.
79
3.3.5 Summary
The geometrical character of yams known as migration has a pronounced effect
on the properties of yams. The mathematical treatment of the tensile behaviour of
yams has been analysed using two different models known as the microscopic velocity
vector model (classical method) and the continuum model (energy method). Equations
have been presented using these methods that enable the prediction of the tensile
behaviour of yams using filament parameters. In the proceeding chapters the principle
of these analyses will be used to explain some of the phenomena observed in this
thesis. It is notable however that in spite of the complexity and apparent successes,
these models are still rather crude descriptions of the microscopic processes involved.
For example the models donot specifically include realistic interfilament force
contributions such as friction and adhesion. The models do however have the virtue
that they address, all beit in a first order way, the micro-structural aspects of yam
mechanics.
3.3.6 The Mechanics of Staple Fibre Yams
The analysis of the mechanics of staple fibre yams is naturally less tractable than
for the case of twisted continuous filament yarns. The constituent fibres are
discontinuous and the short filaments may readily slip over each other. Twist and
fibre migration are also more important in staple fibre yams since these phenomena
largely hold the assembly of short fibres together as a yam. However, the approach
is similar to that analysed for continuous filament yams.
The analysis outlined here follows the work of Hearle e t a l (1965) on the
mechanics of continuous filament yams discussed in Section 3.3.3. The full analysis
will not be discussed here. A brief review of how the analysis is approached is given.
The analysis is based on the classical method and contains many assumptions. Some
80
of the assumptions are that the idealised staple fibre yam is assumed to consist of a
very large number of fibres of limited length packed in a uniform circular yam. The
fibres follow an idealised migration pattern, i.e. a helical path. The fibres are perfectly
elastic, possess identical dimensions and properties and follow Hooke’s and
Amonton's laws. The strains experienced are small and transverse stresses between
fibres are isotropic.
The steps needed to analyse the mechanics of such an assembly are outlined by
Hearle (1969) and will not be included here. However, the steps are similar to those
taken in Equations (3.5) through (3.13) inclusive. The modulus of staple fibre yams
can be obtained directly using an alternative method which makes gross
approximations. It is rather a crude method which considers the yams as a continuous
filament yam, taking the simplest relation between modulus with twist, Equation
(3.4). Again, the procedure for this approximate treatment and the basic assumptions
made are outlined in detail by Hearle e t a l (1969).
3.3.7 Extension and Breakage of Yams
The mechanical properties and strength of staple fibre spun yams vary greatly
because there are invariably fluctuations in the linear density, the twist and the
composition along their length. The variation is particularly severe in the case of the
strength because the breakage condition is determined by the "weakest link" in the
specimen.
Numerous studies have been carried out on the effect of twist on the extension
and strength of staple fibre yams including cotton. Amongst the earlier workers were
Balls (1928) and Oxley (1922). For example, Platt (1950) undertook a theoretical
investigation of the influence of yam twist on the modulus of elasticity. He concluded
that the modulus decreases with increasing twist and that this decrease was related to
81
the stress distribution arising as a result of the yam geometry. Gregory ( 1953)
conducted a series of studies on cotton yam structures. He found that the breaking
length increased to a plateau and then decreased as yam twist was increased. He also
investigated the effect of the yam structure on the maximum breaking length of
different varieties of cotton.
Iyengar and Gupta (1974) have investigated the proportion of the cotton fibre
strength "utilised" in a single yam spun by different systems. They found that greater
length and fineness increases the proportion of fibre strength utilised. Nachane and
Iyer (1980) developed a theory to predict the strength of a bundle consisting of a large
number of filaments if the average breaking load and the breaking elongation of the
elements were known. They used data for cotton fibres to demonstrate the usefulness
of their theory.
The rate of strain in a tensile test affects the yam tenacity. Higher breaking loads
are observed at higher rates of strain. Meredith (1950) studied the variation of cotton
yam strength with time to break and established the following empirical equation:
*2F 2 = 0.09 F 1 log 1Q (320)ri
where F2 and Fj are yam strengths and tj and ^ are the corresponding times to
rupture.
Balasubramanian and Salhotra (1985) studied the effect of strain rate on cotton
yam tenacity. They found yam tenacity to increase to a maximum at about 0.005 m/s
and then decrease slowly. This trend was found to hold regardless of the cotton type,
the yam type and the twist factor. They explained the trend by the fact that the main
factors that contribute to yam tenacity are the realignment of fibres which results in a
higher contribution to the yam breaking load and the percentage of fibre rupture. At
82

very high strain rates (0.017 m/s) there may not be sufficient time for the fibres to
realign causing a drop in tenacity that could not be offset by an increase in tenacity due
to a higher percentage of fibre rupture. At lower strain rates (0.003 m/s) the time for
realignment is sufficient causing an increase in yam tenacity.
3.4 Interface Phenomena
3.4.1 Introduction
In the previous section the tensile properties of yams were discussed in terms of
the constituent tensile characteristics of single filaments. The filaments are of course in
contact with each other and hence substantial adhesive forces operate. These forces
contribute to the cohesion of the yam and indeed without these forces the yam would
probably disintegrate under gravitational forces. The migration will also naturally
require the sliding of the filaments over one another and the basic constraint or lack of
constraint will involve interfacial friction processes. Friction and adhesion are
therefore major factors which control the structure of yams (and indeed fabrics).
Similarly, these processes will invariably affect the deformation properties of the yams
and fabrics constructed from these yams.
There is no systematic work recorded in the literature on the influence of
adhesion and friction between filaments on the mechanical properties or indeed the
structure of yams. One can see in principle how these phenomena would influence the
mechanical, say extensile, properties by constraining filament migration during
deformation. The earlier models (section 3.3) which considered tensile deformation
without radial contraction may correspond to high friction cases whilst low friction
would favour diametric reduction. Alternatively, the radial stresses may be modified
to account for the frictional restraint on migration. However, the real problem is that
the extremely complex structure of the yam and the individual filament cannot be
83

described with any realism. Hence, the role of the friction at the contacts cannot be
quantified with any confidence. It will be shown later in this thesis that lubrication of
the filaments in the yams significantly reduces the modulus of the yam and hence the
effect is real. Thus while the effects of lubrication cannot be precisely specified in a
yam or indeed in a fabric the overall trends may be rationalised as will be demonstrated
in later chapters.
By way of introduction, therefore, a brief account of friction and lubrication is
therefore appropriate and the remainder of this chapter deals with these processes,
particularly in the context of fibres and yams. The general features are introduced
first. General descriptions are then given of the associated stick-slip phenomena, the
differential friction effect (DFE), the laws of friction and some of the models that have
been developed to quantify the phenomenon of friction.
3.4.2 Friction. Historical Note
If two bodies are placed in contact under a normal load, W, a finite force is
required to initiate or maintain sliding: this is the force of friction. Although Leonardo
de Vinci and Newton had indicated the nature of the ’’laws of friction”, it was not until
sometime later in 1699 that Amonton rediscovered the two forgotten laws of friction
and it is his name they now bear. These laws are entirely empirical and although valid
for most situations, exceptions exist. The first law was that friction is independent of
the area of contact and the second was that friction force is directly proportional to the
normal load. Amonton recognised that the surfaces he worked with were not smooth.
He thought friction arose from the work done in lifting one surface over the roughness
on the other or from bending the roughnesses down or breaking off the roughnesses.
There is also a third law of friction, due to Coulomb, which is of much more limited
validity than the first two laws and can be stated as either, that dynamic friction is
84
independent of sliding velocity (Hailing, 1976), or that dynamic friction is about
one-third of the normal load (Tabor, 1972).
Coulomb, in his classical studies on friction, also recognised that most of the
surfaces he worked with were not smooth. He favoured a mechanism for the contact
of two surfaces resembling the interlocking of asperities. He appreciated that natural
adhesion between solids may also contribute to the frictional work, but rejected it as
the main cause. He felt friction was due to the surface roughnesses and frictional
work was done by the dissipation of potential energy against the applied load as the
asperities were 'lifted' over each other. This mechanism as a means of energy
dissipation was largely discounted by his successors, due to the absence of apparent
nett vertical motion. However the picture drawn by Coulomb and his mechanism
describe*quite well the kind of process that may occur in fibre contacts.
3.4.3 Generally Accepted Mechanism of Friction at the Present Time
Friction is an energy dissipation mechanism and this dissipation is thought of as
occurring through two separate mechanisms involving adhesion between surfaces and
subsurface deformation. Bowden and Tabor (1964) have contributed immensely to
our present understanding of frictional processes, especially those between metallic
systems. They postulated that friction between unlubricated surfaces arises from two
main factors: the adhesion and rupture of adhesive junctions and ploughing or
deformation which occurred between the two bodies. The adhesion model of friction
arises from the fact that all surfaces are rough at the microscopic level with undulating
asperities of varying heights, Archard (1951). Figure 3.4 is a diagram of a rough
solid in contact with a smooth rigid plane. When two clean bodies are brought
together, the attraction component of surface forces produces adhesive junctions. As
the normal load is increased, the proportion of asperities in contact, yielding the real
85
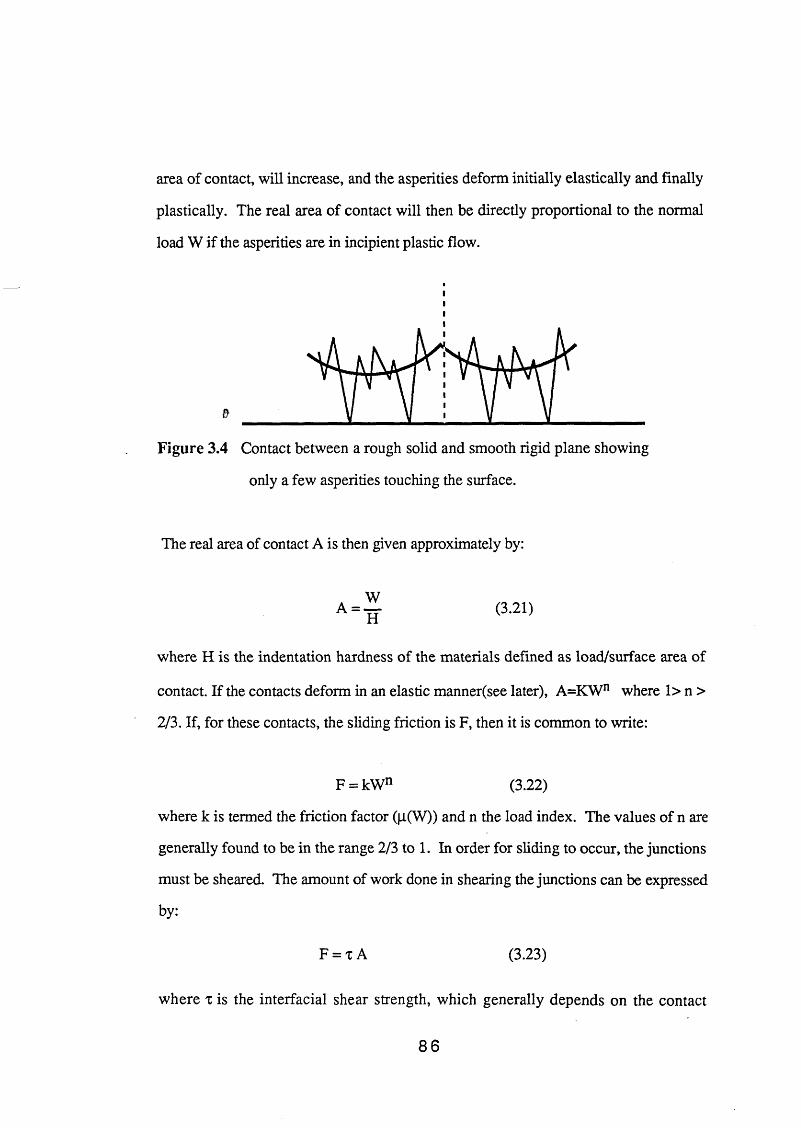
area of contact, will increase, and the asperities deform initially elastically and finally
plastically. The real area of contact will then be directly proportional to the normal
load W if the asperities are in incipient plastic flow.
Figure 3.4 Contact between a rough solid and smooth rigid plane showing
only a few asperities touching the surface.
The real area of contact A is then given approximately by:
WA = — (3.21)
where H is the indentation hardness of the materials defined as load/surface area of
contact. If the contacts deform in an elastic manner(see later), A=KWn where 1> n >
2/3. If, for these contacts, the sliding friction is F, then it is common to write:
F = kWn (3.22)
where k is termed the friction factor (p(W)) and n the load index. The values of n are
generally found to be in the range 2/3 to 1. In order for sliding to occur, the junctions
must be sheared. The amount of work done in shearing the junctions can be expressed
by:
F = x A (3.23)
where x is the interfacial shear strength, which generally depends on the contact
86
pressure (W/A) in the following way:
x = t o+ aP 0 (3.24)
where tq and a are material parameters. The quantity z may be regarded as the work
done per unit sliding distance per unit of real contact area A. It therefore describes the
energy dissipation characteristics of the sliding contact. The calculation of A which
was introduced earlier is rather problematic. For most solid bodies, the surfaces are
sufficiently rough to ensure that the real area of contact is significantly less than the
apparent values. It is therefore possible to distinguish from general cases which arise
from permutations of elastic or plastic contact deformation on a rough or smooth
substrate. If the pressure at the contacting asperities exceeds the elastic limit, plastic
flow occurs in which case the contact area is proportional to a flow stress P0 as:
A = W/PQ (3.25)
However, for a smooth sphere on a smooth flat surface where the deformation is
elastic, the contact area can be obtained from the Hertz solution. Thus:
1 1
A = tc(E'R)3 W 3 (326) :E ’ = | [ 1 - 'o2)/Ei + ( l-u 3)/E2J
where R is the radius of the sphere and E and t) are the Young's modulus and
Poisson's ratio respectively for substrates 1 and 2.
By the combination of Equations (3*3) to (3 j6) inclusive, we get:
1 1
F = x 7t (E' R)3 W3 + a w (3.27)O
which may be written in the form:
87

F = cW 3 (l+aW 3) (328) : a = cx/c : c = To7t (EH)
2 1 23
Dividing Equation (3.28) by the normal load gives the coefficient of friction as:
Alternatively p, = x / P + a and if P=P0 then p = xQ / P0 + a. The latter equation
follows the classical law that p is not a function of load.
The above analysis deals mainly with the adhesion component of friction
through real areas of contact. Equation (3.29) will be used in subsequent chapters to
model some of the phenomena observed.
For contacting bodies with different hardness, description of the sliding friction
force requires the inclusion of an additional term to account for the asperities of the
harder material ploughing through the softer material. This is called the ploughing
component of friction, denoted as P and involves a significantly larger volume of
material during sliding than the adhesion induced dissipation processes. In the simple
two term model, where there is negligible interaction between these two processes, we
may add them as:
The ploughing component of friction is usually dominant in rolling contacts and
sliding friction where there is efficient lubrication. If adhesion between the two
surfaces is negligible, then the ploughing force may be easily calculated. These forces
can arise from plastic flow and/or elastic or viscoelastic displacement. As the hard
indentor traverses the surface of the softer substrate, energy is fed into the substrate
ahead of the indentor and some of it is restored to the rear of the indentor because of
-lp = cW 3 + a (3.29)
F = xA + p (3.30)
88

elastic recovery and urges it forward, Figure 3.5. The available analyses consider the
work done on the system per unit distance traversed. Many studies of this process
have been reported by workers such as Bowden and Tabor (1950), Briscoe (1981)
and Dowson (1979). If the elastic work done on the contact per unit length is <j), the
energy dissipated will be some fraction of this, i.e. = b<f>. Using a contact
mechanical approach for a sphere of radius R on an elastic body, Greenwood and
Tabor (1958) arrived at the expression:
— - — 1 _ 1(j> = 0.17 W 3 R 3 (1-u2)3 E 3 (3.31)
This enables the grooving force F^ to be calculated. For the case of a conical
indentor, a relationship can be obtained to calculate the deformation losses. It is found
that, for this case, if the semi-apical angle is 0, then <j) is written as:
W(j) = — cot0 (3.32)%
3.4.4 Friction of Fibres
3.4.4.1 General features of fibre friction
The models described in the last section have been developed to interpret the
frictional behaviour of gross contacts. This section will consider the special
characteristics of fibres which arise from their particular geometric and surface
features. A major consideration in studying friction of fibrous systems is their
obvious importance in the textile industry. Here we shall review briefly the theory and
89
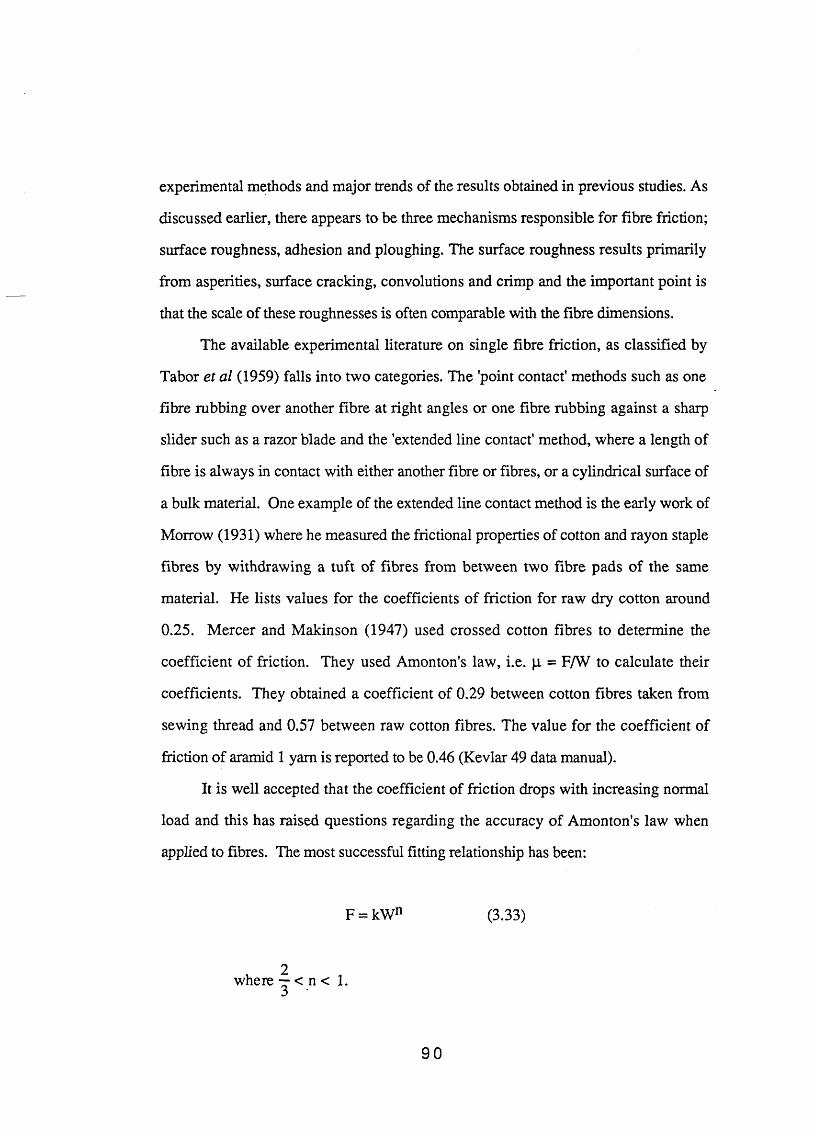
experimental methods and major trends of the results obtained in previous studies. As
discussed earlier, there appears to be three mechanisms responsible for fibre friction;
surface roughness, adhesion and ploughing. The surface roughness results primarily
from asperities, surface cracking, convolutions and crimp and the important point is
that the scale of these roughnesses is often comparable with the fibre dimensions.
The available experimental literature on single fibre friction, as classified by
Tabor e t a l (1959) falls into two categories. The 'point contact' methods such as one
fibre rubbing over another fibre at right angles or one fibre rubbing against a sharp
slider such as a razor blade and the 'extended line contact' method, where a length of
fibre is always in contact with either another fibre or fibres, or a cylindrical surface of
a bulk material. One example of the extended line contact method is the early work of
Morrow (1931) where he measured the frictional properties of cotton and rayon staple
fibres by withdrawing a tuft of fibres from between two fibre pads of the same
material. He lists values for the coefficients of friction for raw dry cotton around
0.25. Mercer and Makinson (1947) used crossed cotton fibres to determine the
coefficient of friction. They used Amonton's law, i.e. \i = F/W to calculate their
coefficients. They obtained a coefficient of 0.29 between cotton fibres taken from
sewing thread and 0.57 between raw cotton fibres. The value for the coefficient of
friction of aramid 1 yam is reported to be 0.46 (Kevlar 49 data manual).
It is well accepted that the coefficient of friction drops with increasing normal
load and this has raised questions regarding the accuracy of Amonton's law when
applied to fibres. The most successful fitting relationship has been:
F = kWn (3.33)
where — < n < 1.
90

The magnitude of n, is determined by the degree of elasticity or plasticity of the contact
and the microscopic features of the contact geometry (see earlier).
If we combine Equations (3.23) and (3.25) from Section 3.4.2., the Amonton's
law is given by:
(3.34)
It can be seen that Amonton’s law is a special case of the more general Equation
(3.22 or 3.33) holding when n = 1 and K = xQ / P0 = constant.
The coefficient K is generally negatively correlated with n and both are
dependent on the molecular cohesion of the fibrous material as well as possibly on the
mechanical properties of the material and the nature of the deformation.
There are various mathematical relationships between F and W that have been
proposed. Olofsson (1950) offered the equation:
F = |i0W + a'A (3.35)
where A = area of contact and a ' = constant as a means of fitting a number of
experimental results on fibre friction.
Gralen (1952) devised a method for measuring fibre friction in which he
measured the friction in a twist of two fibres. His method was valuable for solving
two experimental problems, (1) how to hold the fibres so that they can be rubbed
together parallel to their axes, and (2) how to vary the area of apparent contact between
them without changing the total load. He proposed the equation:
F = a'W + bWc (3.36)
91

where 0 < a’ < 1 to fit his experimental data.
Many sliding systems show irregular motion and this behaviour has been termed
'stick-slip’ (this is discussed in detail later). Belser & Taylor (1969) using the
stick-slip process, studied the frictional properties of cotton fibres. They determined
the static coefficient of friction by using the ten highest peaks from an analog plot and
the kinetic coefficient by averaging the data plot over a selected length.
It was found that increases in temperature, in the case of cotton, results in only a
slight increase in the coefficient of friction. Increasing the traversing velocity
markedly increased the static friction but did not affect kinetic friction significantly.
The coefficients of friction were highly sensitive to relative humidity, especially above
60%. The ratio however, remained reasonably constant. The next section
discusses the stick-slip motion in more detail.
Intrinsic fibre characteristics also influence friction measurements. For example,
the linear density and coefficient of friction are positively correlated. Pascoe & Tabor
(1955), using crossed nylon cylinders, obtained the following relation:
|A = CjS W '°-26 D 052 (3.37)
where D= diameter of cylinder.
Basu e t al (1978) studied the friction of cotton fibres using a device based on an
earlier model, (Hepworth & Sikorski, 1976) which consisted of two brass cantilevers
with a common axis, but oriented mutually at 90°. They concluded that in the context
of friction, four distinct features of cotton fibres must be considered, (a) the
ribbon-like shape, with nearly elliptical transverse section, (b) convolutions, (c) the
existence of folds on the surface of the fibres, and (d) the presence of reversals of
fibullar texture on the fibre surface. They found a negative correlation between the
coefficient of friction and the repeat distance between the convolutions.
Viswanathan (1973) has analysed the frictional interaction between fibre fringes,
92

with respect to raw cotton processing. He examined the friction of raw cotton, fibre
blends, chemically treated fibres and friction during twisting. His measurements
showed that the fibre characteristics of length, fineness and maturity have a decreasing
influence on the frictional behaviour as the applied normal load increases. Also that
interfibre friction increases significantly on wetting, bleaching or mercerisation. For a
number of varieties of cotton, at 30g normal load, he obtained coefficients of friction
ranging between 0.58-0.68.
The twisted fibres method of Gralen is an extended line contact method.
Another method involves tension measurements over cylindrical surfaces (mainly
capstans), Figure 3.6. When a fibre passes round a pulley, its tension must be
increased by an amount to overcome the frictional resistance. Assuming the coefficient
of friction is independent of load yields the classical capstan formula:
T = To e^0' (3.38)
This experimental configuration has been used by many workers, and is considered to
be a more rapid technique for evaluating frictional resistance than the point contact
method, although it is generally agreed that Equation (3.38) is inadequate. A more
complex equation was derived by Howell (1954):
a9(R/T0)''”T = To e (3.39)
He used the above equation in his study of the friction of nylon fibres against perspex
and glass cylinders and the effect of radius of cylinder, R, Figure 3.6
Koza (1975) has studied the yarn to yam friction of polyester, nylon and nylon
6.6 yams removed from plain weave fabrics using a modified Instron tensile tester.
He concluded that the frictional properties of polymer fibres vary with their elastic or
plastic deformation properties.
93

Figure 3.5 Schematic diagram of deformation friction due to viscoelastic hysteresis losses within the bulk of the specimen either during rolling or well lubricated sliding.
Figure 3.6 A force diagram for the capstan theory of friction.
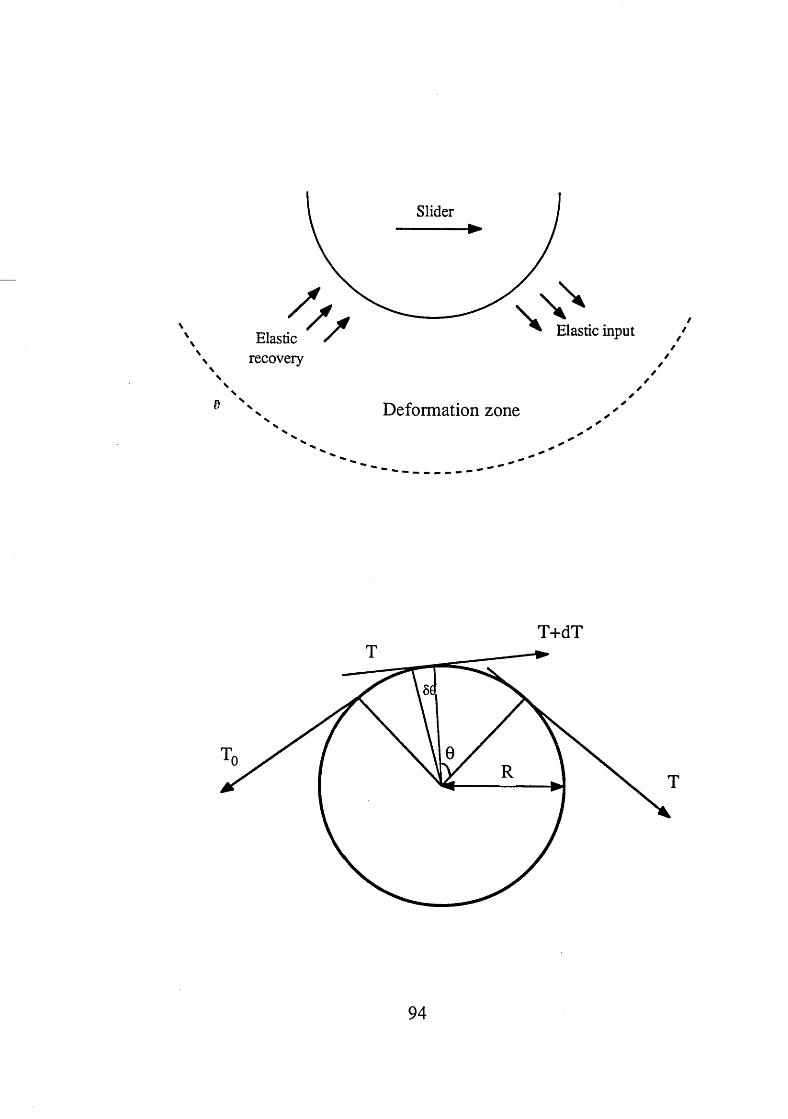
Slider
\ Elastic\ recovery
Elastic input
Deformation zone
94
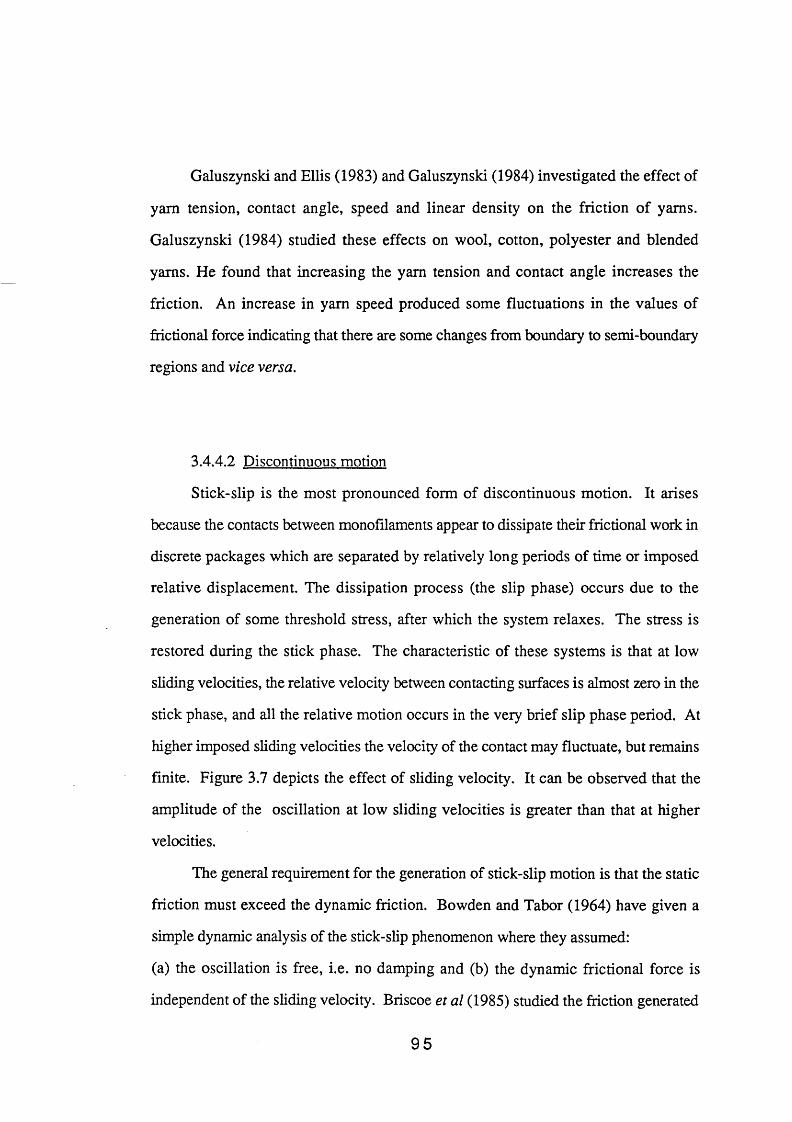
Galuszynski and Ellis (1983) and Galuszynski (1984) investigated the effect of
yam tension, contact angle, speed and linear density on the friction of yams.
Galuszynski (1984) studied these effects on wool, cotton, polyester and blended
yams. He found that increasing the yam tension and contact angle increases the
friction. An increase in yam speed produced some fluctuations in the values of
frictional force indicating that there are some changes from boundary to semi-boundary
regions and vice versa.
3.4.4.2 Discontinuous motion
Stick-slip is the most pronounced form of discontinuous motion. It arises
because the contacts between monofilaments appear to dissipate their frictional work in
discrete packages which are separated by relatively long periods of time or imposed
relative displacement. The dissipation process (the slip phase) occurs due to the
generation of some threshold stress, after which the system relaxes. The stress is
restored during the stick phase. The characteristic of these systems is that at low
sliding velocities, the relative velocity between contacting surfaces is almost zero in the
stick phase, and all the relative motion occurs in the very brief slip phase period. At
higher imposed sliding velocities the velocity of the contact may fluctuate, but remains
finite. Figure 3.7 depicts the effect of sliding velocity. It can be observed that the
amplitude of the oscillation at low sliding velocities is greater than that at higher
velocities.
The general requirement for the generation of stick-slip motion is that the static
friction must exceed the dynamic friction. Bowden and Tabor (1964) have given a
simple dynamic analysis of the stick-slip phenomenon where they assumed:
(a) the oscillation is free, i.e. no damping and (b) the dynamic frictional force is
independent of the sliding velocity. Briscoe e t a l (1985) studied the friction generated
9 5

during intermittent sliding of polyethyleneterephthalate (PET) monofilaments. Winkler
(1983) studied the stick phase of the stick-slip phenomenon at low sliding velocities
using PET, glass and human hair monofilaments.
3.4.4.3 The Differential Friction Effect (DFE)
The friction generated by sliding synthetic fibres against one another is
independent of the direction of sliding. However, the frictional characteristic of certain
natural fibres such as wool and human hair depends on the direction in which it is
pulled. In wool, the friction is greater if the fibre rubs against another surface in the
direction from root to tip than when the direction is reversed. This anomalous
behaviour is known as the differential friction effect (DFE). The occurrence of DFE
has almost invariably been ascribed to the geometric form of the scales on the surface
of wool or human hair. The simplest geometric theory is that the fibre acts as a
ratchet, Figure 3.8, with the scales interlocking with one another or catching against
asperities on another surface. Motion against the scales would be strongly resisted
since it would involve rupture or deformation of the scales.
Seshan (1978) studied the frictional behaviour of root-tip aligned cotton fibre
fringes under varying amounts of normal load. He observed that the coefficient of
friction between the root points was higher than that between the tip points and called
this the differential friction of cotton. He concluded that the surface area per unit
length of the fibre increases gently from the root to the middle and decreases rapidly
towards the tip of the fibres. He also found the convolution angle and absorptive
capacity of the fibres to decrease from the root to the tip.
9 6
Fric
tiona
l For
ce
Figure 3.7 Schematic representation of the stick-slip phenomenon showing the effect of imposed sliding velocity.
Figure 3.8 Schematic diagram of the geometric theory of the differential friction effect. The scales on the fibre interlock or catch against asperities on another surface.
97

3A 4.4 Auto Adhesion and Contact Geometry of Fibres
Fibres possess surface geometric irregularities where size is comparable with
their radii. This has two consequences in the context of friction modelling which are
briefly reviewed. In many cases it appears the the contact area generated at the contact
between two fibres may comprise of one, or only a few, asperity contacts. This
condition, if it truely exists, greatly facilitates the modelling of the contact area (section
3.4.3). Briscoe e t a l (1982) have adopted this argument and their supposition that a
point contact may occur between monofilaments is consistent with their experimental
data. Their study also showed that the auto adhesion between fibres could produce a
comparatively large normal force which could in some circumstances be comparable in
magnitude to the applied loads. Thus some questions then arose as to whether the
applied normal load should be used in say the adhesion model of friction. In their
analysis they considered it sufficient to add the adhesive force to the normal applied
load. These adhesive loads will be of consequence in fibre migration processes but
probably not significant when large forces are introduced into yams and fabrics.
3.4.4.5. Summary
The general models of friction, namely the adhesion model, the point contact
and the extended line contact models are found to be applicable to friction in fibres and
yams. A knowledge of the force and normal load enables the calculation of the
coefficient of friction \i and the load index n, representing the type of contact. On the
whole the magnitude of ji for the yam on yam friction of cotton has been found to lie
between 0.5-0.7 and for aramid fibre 1 to be 0.46 (Kevlar 49 data manual, E.I.duPont
Co.). In the proceeding chapters the observations and results of friction experiments
will be explained in the light of the information presented here. The mathematical
treatments described here will be used to model some of the data obtained.
98
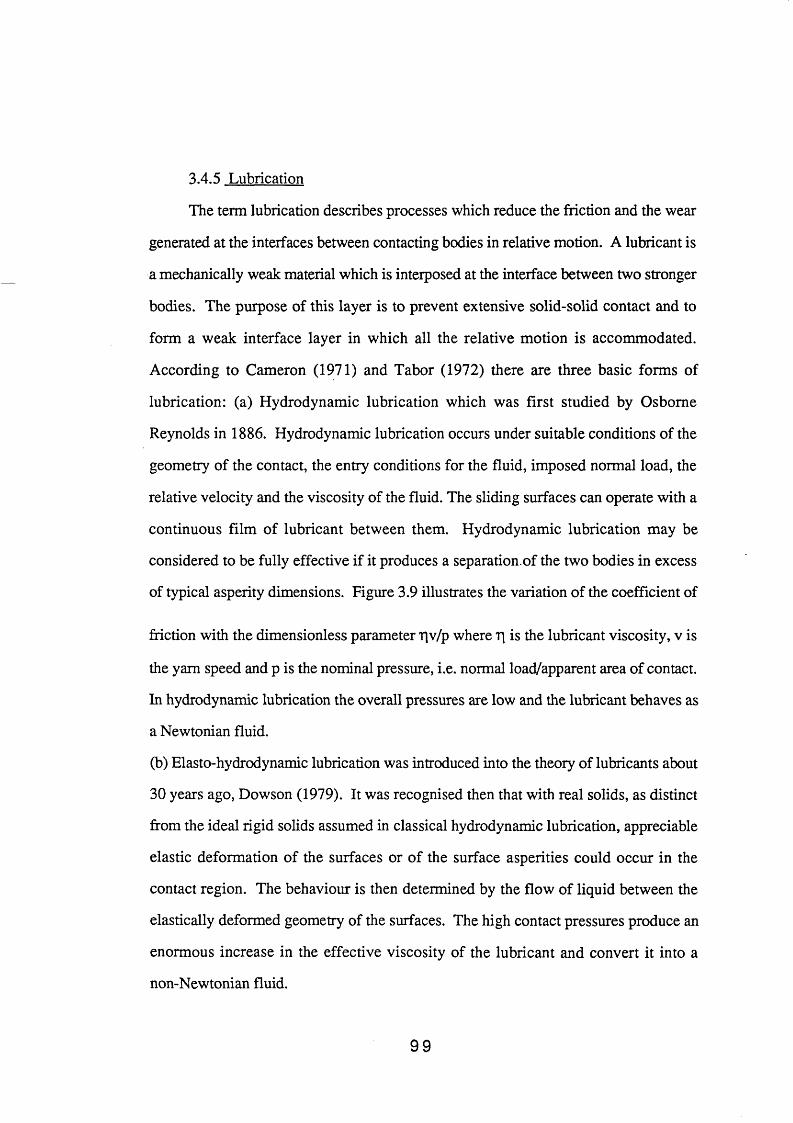
3.4.5 Lubrication
The term lubrication describes processes which reduce the friction and the wear
generated at the interfaces between contacting bodies in relative motion. A lubricant is
a mechanically weak material which is interposed at the interface between two stronger
bodies. The purpose of this layer is to prevent extensive solid-solid contact and to
form a weak interface layer in which all the relative motion is accommodated.
According to Cameron (1971) and Tabor (1972) there are three basic forms of
lubrication: (a) Hydrodynamic lubrication which was first studied by Osborne
Reynolds in 1886. Hydrodynamic lubrication occurs under suitable conditions of the
geometry of the contact, the entry conditions for the fluid, imposed normal load, the
relative velocity and the viscosity of the fluid. The sliding surfaces can operate with a
continuous film of lubricant between them. Hydrodynamic lubrication may be
considered to be fully effective if it produces a separation.of the two bodies in excess
of typical asperity dimensions. Figure 3.9 illustrates the variation of the coefficient of
friction with the dimensionless parameter Tlv/p where rj is the lubricant viscosity, v is
the yam speed and p is the nominal pressure, i.e. normal load/apparent area of contact.
In hydrodynamic lubrication the overall pressures are low and the lubricant behaves as
a Newtonian fluid.
(b) Elasto-hydrodynamic lubrication was introduced into the theory of lubricants about
30 years ago, Dowson (1979). It was recognised then that with real solids, as distinct
from the ideal rigid solids assumed in classical hydrodynamic lubrication, appreciable
elastic deformation of the surfaces or of the surface asperities could occur in the
contact region. The behaviour is then determined by the flow of liquid between the
elastically deformed geometry of the surfaces. The high contact pressures produce an
enormous increase in the effective viscosity of the lubricant and convert it into a
non-Newtonian fluid.
99

Coeff
icient
of fric
tion,
( T h r e a d l i n e s p e e d ) ( L u b r i c a n t v i s c o s i t y ) / ( P r e s s u r e )
Figure 3.9 General behaviour of liquid-lubricated textile yams showing the three regimes of lubrication and the regions at which they become operative.
100

(c) There are ambiguities in the definition of the regime of boundary lubrication.
Sir William Hardy (1936) coined the phrase to describe what is considered to be
lubrication by a mono-molecular layer. Boundary lubrication is provided by weak
solid layers whose thickness is perhaps lOOnm or less. The lubricant initially in the
solid form responds to contact pressure in a manner resembling an
elasto-hydrodynamic film.
An early study by Roder (1953) showed that the coefficient of friction increased
with speed and interpreted this as being caused by a breakdown of the lubricant film
and an increase in the amount of fibre-fibre contact. Lyne (1955), working with
yams, made similar observations and suggested that the friction may arise as a result
of hydrodynamic lubrication. Hansen and Tabor (195?) followed up this suggestion
and showed that the behaviour of a fibre passing over a cylindrical guide could be
considered analogous to that of a journal bearing. For the case of monofilaments, the
behaviour was not markedly dependent on lubricant viscosity, but when yams were
used, hydrodynamic factors were found to dominate. The frictional behaviour of
liquid-lubricated yams can thus be represented by a graph of the same form as in
Figure 3.9.
Tabor (1959) stated that with yams, the viscous factors are of great importance
and that under hydrodynamic conditions the wetting angles of the yam by the lubricant
play some part He pointed out that over a wide range of experimental conditions, the
behaviour is dominated by hydrodynamic factors.
Olsen (1969) investigated the frictional properties of yams under hydrodynamic
and elasto-hydrodynamic conditions. He noted that where stick-slip behaviour was
present, an increase in yam speed produced a transition point where this behaviour
disappeared. This point reflected the change from elasto-hydrodynamic to
hydrodynamic lubrication.
Schick (1975), in a review of the friction and lubrication of synthetic fibres,
101
points to the same conclusions as Tabor. From lubrication studies on nylon 6.6, he
concludes that lower friction reflects smaller contact angles and better wetting of the
yarn.
Fort and Olsen (1961) studied the boundary friction of textile yams. They found
that stearic acid and n-octadecylamine reduced the boundary friction compared to that
of the clean fibres. Hayes (1972) dealt with the subject of fibre and yam lubrication
from a textile processing viewpoint. He reviewed different types of yams, suitable
lubricants and the frictional effects produced.
In later chapters, the lubrication models described will be used to explain some
of the experimental results. It will be proposed that the mechanical properties of yams
are influenced extensively by the filament friction behaviour and thus any
modifications to the frictional behaviour modifies the yam mechanics. Similarly
interyam friction influences the mechanical properties of fabrics.
102

C H A P T E R F O U R
A REVIEW OF SOME PROPERTIES OF FABRICS
4.1 Introduction
This chapter is a review of some of the properties of fabrics that are relevant to
the current work. It begins by outlining the basic features of the microgeometry of
plain woven fabrics and presents equations that define this geometry. The major
published studies of the tensile behaviour of woven fabrics, extended along the warp
or weft directions but not at intermediate angles, will be reviewed. Empirical
relationships derived by several investigators for the calculation of the fabric Poisson's
ratio and tensile modulus in terms of structural parameters, such as crimp ratio and
thread spacing, are presented. The bending behaviour of fabrics and the major
published studies on this subject will also be reviewed. It should be pointed out that
most of the studies on the above properties are rather dated and recent work on these
subjects is surprisingly scarce and hence, much of the referenced material cited is over
thirty years old. The material is no worse for its age but this situation reflects the level
of interest in fabric mechanics in recent times.
The next section introduces the subject of the chemical modification of fabrics.
It will discuss the effects of "surface" as against "bulk" modifiers with particular
attention to cationic surface active agents. The problem of interrelationship between
subjective and objective "hand" assessments will be introduced. A short description of
the transverse ballistic behaviour of fabrics is included at the end of this chapter.
103

4.2 The Geometrical Properties of Woven Fabrics
4.2.1 A Model for The Woven Fabric Structure
This section is mainly concerned with the descriptive curvilinear shape of the
yam in the warp or weft normal cross-section of the fabric and the relationship
between various structural or geometric parameters. In principle, a knowledge of this
shape and it's development in chosen strain fields enables the calculation of the fabric
mechanical deformations such as extension, bending or shear in terms of the intrinsic
mechanical and surface properties of the fibres. The most elaborate early work was
carried out by Pierce (1937). He showed that if one assumes the yams to be circular
in diametric section and that they possess negligible bending resistance, then a first
order geometrical model of this type may be generated. Figure 4.1 shows Pierce's
model of a simple plain weave. The basic geometric parameters consist of two values
of yam length lj, two crimp heights hj, two thread spacings p , and the sum of the
diameter of the two yams D. The suffixes 1 and 2 refer to the warp and weft yams
respectively. A knowledge of the form of these parameters allows the other three to be
calculated. However, Pierce's analysis also uses additional parameters in the analysis
such as c, the crimp ratio and 0, the weave angle, so that there are nine unknowns and
actually five equations; 4.1 to 4.5 inclusive. The main equations are however 4.1 to
4.3 inclusive:
p = (1-D0) cos 0 + D sin 0 (4.1)
h = (1-D0) sin 0 + D (1-cos 0) (4.2)
D = hj + h2 (4.3)
The difficulties involved in solving these three simultaneous equations necessitated the
104

use of two approximate relationships, equations 4.4 and 4.5:
hP 3 p
(4.4)
9 = 106,/c (4.5)
A basic difficulty in using Pierce's approach is the fact that the yam
cross-section, particularly during deformation, is often far from circular. Many
attempts have been made to correct Pierce's original relationships by assuming various
shapes for the yam cross-section, such as elliptical and "race-track" shapes, Figure
4.2. Olofsson (1964) proposed that the yam takes up the shape of an elastica. This
assumes that the original yam cross-section is so easily distorted that it can be ignored
in determining the deformed shape. This approach gives similar values for some of
the geometric parameters when they are compared with those obtained by Pierce. The
Olofsson model actually gives a much closer fit for the value of the observed weave
angle, 0. Nevertheless, the approximate relationships, Equations 4.4 and 4.5 (after
Pierce) may still be used with considerable confidence. More recently, Leaf and
Anandjiwala (1985) have used a more realistic approximation of yam bending
behaviour to develop a generalised model of plain woven fabrics. They proposed the
following approximate formulae for calculating h/p and 0:-
P 2=1341 Cj (4.6)
e i0.446
~ 91.44 cx (4.7)
105
For more complex weaves, the race track (see Figure 4.2) or other simple
geometries have been extended, using the principle of adding certain straight lengths to
the plain geometry to allow for the "float". Figure 4.2 is the shape of a standard race
track to which has been added the straight portion z. In this way, the problems of
non-plain fabric geometry may be converted into plain fabric geometry.
4.2.^. Summary
The simple model originated by Pierce contains most of the essential geometric
features of the simple microscopic weave structure. Its limitations have been explored
and corrections suggested at the expense of more parameters, in particular those
associated with non circular and stiff fibre bundles. Almost all of the published
analysis of the tensile, bending, etc. behaviour of plain woven fabric uses Pierce's
geometrical model as the microscopic weave structure. Some of these analyses and the
subsequent results are presented in the later sections of this chapter.
4.3 Woven Fabric Tensile Mechanics
The tensile properties of woven fabrics, together with other mechanical
properties, such as their behaviour in bending and shear, are of considerable
importance in determining how the fabric will perform in use. It will be seen in chapter
six that the tensile and to some extent the bending properties of fabrics play a
substantial role in the deformation characteristics of the fabrics under study in this
thesis. According to Grosberg (Hearle, Grosberg & Backer, 1969) the load-extension
curve of a typical fabric shows three distinct sections, Figure 4.3. The initial high
106

Figure 4.1 Schematic diagram of Pierce's model of a simple plain weave.
z *-
Figure 4.2 An alternative "race-track" shape for the yam cross section.Here the race-track geometry has been extended by the straight portion z. In this way the problem of non-plain fabric geometry can be converted into plain fabric geometry.
107
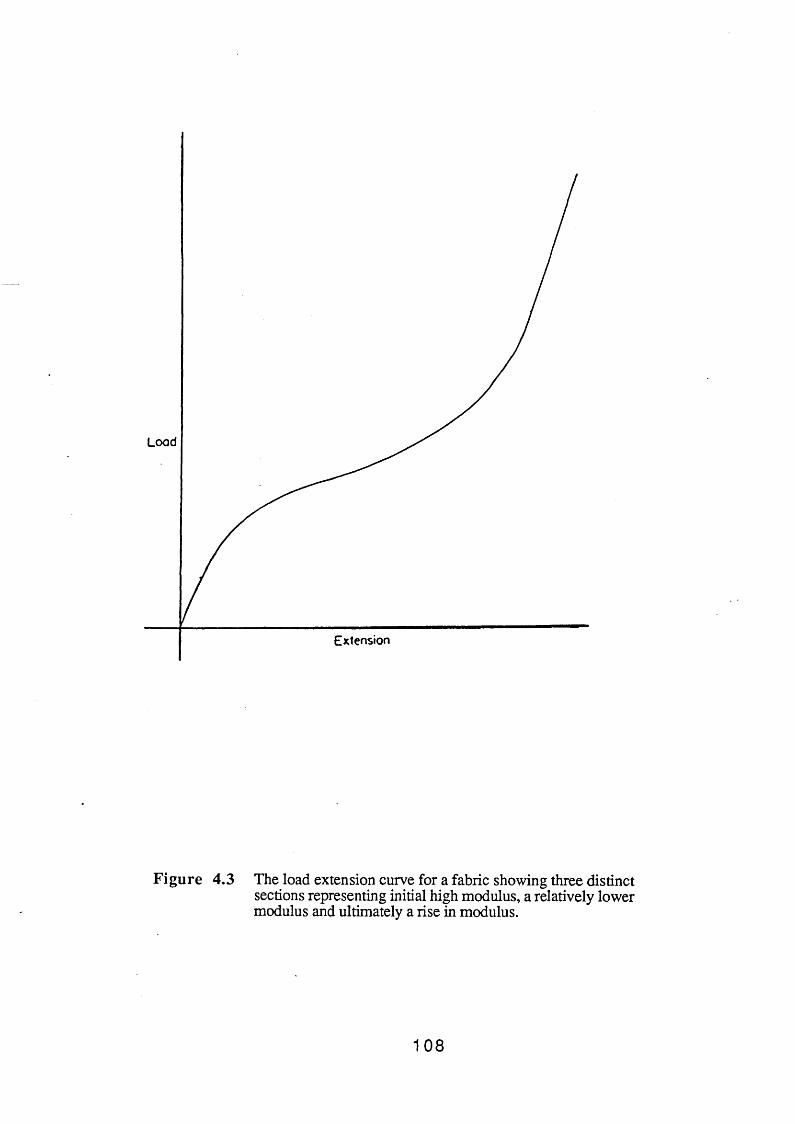
Figure 4.3 The load extension curve for a fabric showing three distinct sections representing initial high modulus, a relatively lower modulus and ultimately a rise in modulus.
108
modulus is probably due to a frictional resistance involved in the bending of the
threads or fibres. The second region of relatively low modulus is mainly governed by
the force needed to unbend the yams in the direction of the force and bend those at
right angles to the direction of the force. As the crimp is decreased, the fibres
themselves begin to be extended, hence the ultimate rise in modulus. In the final region
the load-extension properties of the fabric is almost totally governed by the
load-extension properties of the yarns themselves. The above observations by
Grosberg and also the information presented in this section on the tensile behaviour of
woven fabrics only deal with extension along the warp or weft directions and not at
any other intermediate angles which constitutes a shear of the fabric.
There are certain gross geometric changes that accompany the extension of
fabrics. Under the restricted condition that the compression of the yams and their
extension are negligible the principles given in Section 4.2 may be applied. It is then
possible to calculate the Poisson's ratio of the cloth. The basic relationships are given
in Equations 4.4 and 4.8.
1 = (lH-c)p (4.8)
Assuming 1, hj and h2 are constants we have:
P2- p ^ d c 2 (4.9)V C 2
since
dc = - (1+c) — (4.10)P
0 = d(hj+h2) = dpi +2 Pi
109

dp2 ^ 1 - c ^
dPl U c2}F i
(4.11)
This gives the Poisson's ratio of the fabric. If Fj and F2 and n l and n2 are loads and
number of yams in the warp and weft directions respectively, then we have:
F1n2dp1 = -F2n1dp2 (4.12)
Since the extensions in the warp and weft directions are n2dpj and nxdp2 we have:
V s tan02
*2 1_ C2 tan0j
F.where f. = —
1 n.i
a . fiAssuming — = JL=
^ V Ci(4.14)
the modulus for the increase in f l at constant f2 is:
(4.13)
2=% 4 (c,c2)2 dc2 4 (c' • ci3) dci] (4-15)
Defining the modulus as:
Pi <tfimodulus = — . ( -—) (4.16)
p2 dPi
gives:
110
1modulus = 2< (4.17)
This equation expresses the modulus of the fabric in terms of the load, the crimp ratio,
and the thread spacings in the warp and weft yams. Equations such as these can be
obtained for other cases where the extensions and/or bending behaviour of yams are
taken into account. They provide a value for the modulus of the fabric extended along
the warp or weft directions. Applied extensions at any other angle involve a
consideration of the shear behaviour of the fabric. Grosberg and Kedia (1966) showed
that the initial load extension modulus of woven fabrics (first 1% extension) is
dependent upon the bending modulus of the yam, the geometry it takes up in the fabric
and the fabric history. They predicted the initial modulus of grey relaxed and finished
cotton fabrics from the bending rigidity of their constituent yams and found good
agreement between the theoretical and the experimental values.
Grosberg (1977) sensibly attributed the energy loss which occurs during the
cyclic deformation of fabrics to two separate causes. The first is the non-Hookian
behaviour of the fibres themselves resulting from viscoelasticity, plasticity and creep
effects. The second cause of hysteresis is the frictional restraint to interfibre and
interyam movements in the fabric during deformation. He also points out that the
addition of lubricants or softening agents reduces the interfacial frictional hysteresis
losses. The effect is, however, relatively small compared with such stress-relaxation
techniques as heat or chemical setting treatments.
Leaf (1979) analysed the tensile behaviour of woven fabrics using three
different approaches. He used a simple method based on Castigliano’s theorem to
analyse small strains. For larger strains he used a force equilibrium and an energy
1 1 1

approach.
4.3.1 Summary
In this section, the geometric principles discussed in Section 4.2 were used to
arrive at an expression for the tensile modulus of a woven fabric extended in the warp
direction in terms of the crimp ratio of warp and weft yams, the ratio of the thread
spacings ? id the load on the weft yams. The bending modulus of the yams, the
geometry and the history of the fabric are seen to affect the tensile character of the
fabric. It was also reported that interfibre and interyarn frictional restraint may
contribute to the energy losses which occur during the cyclic deformation of fabrics.
4.4 The Bending of Woven Fabrics
The bending properties of woven fabrics, compared to their tensile properties,
play a minor role in the deformation characteristics of the systems that were studied
here (see chapters six and eight). The observed non-linear bending behaviour of a
fabric can be separated into two components. A non-linear component due to friction
and a linear component due to the bending resistance of the fibres or yams lying in the
direction of bending. The fibres in a woven fabric pass through two distinct regions.
One region is the cross-over location between warp and weft and the other is between
adjacent cross-overs, Figure 4.4. The bending of the fabric and hence the yam will
normally imply that the fibres on the "outside" will be in tension while those on the
"inside" will be under a relatively lower tension. When the difference in tension
between adjacent fibres exceeds the frictional resistance produced at cross-over regions
112
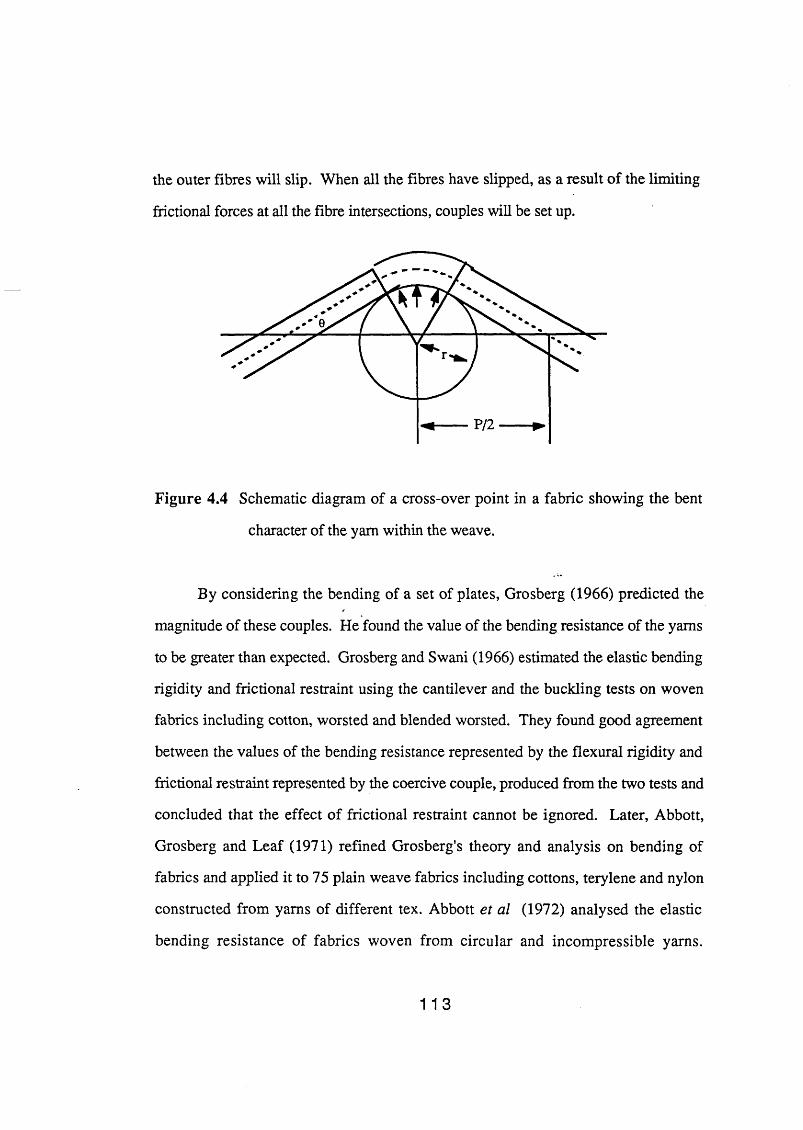
the outer fibres will slip. When all the fibres have slipped, as a result of the limiting
frictional forces at all the fibre intersections, couples will be set up.
Figure 4.4 Schematic diagram of a cross-over point in a fabric showing the bent
character of the yam within the weave.
By considering the bending of a set of plates, Grosberg (1966) predicted the
magnitude of these couples. He found the value of the bending resistance of the yams
to be greater than expected. Grosberg and Swani (1966) estimated the elastic bending
rigidity and frictional restraint using the cantilever and the buckling tests on woven
fabrics including cotton, worsted and blended worsted. They found good agreement
between the values of the bending resistance represented by the flexural rigidity and
frictional restraint represented by the coercive couple, produced from the two tests and
concluded that the effect of frictional restraint cannot be ignored. Later, Abbott,
Grosberg and Leaf (1971) refined Grosberg's theory and analysis on bending of
fabrics and applied it to 75 plain weave fabrics including cottons, terylene and nylon
constructed from yams of different tex. Abbott e t a l (1972) analysed the elastic
bending resistance of fabrics woven from circular and incompressible yarns.
113
However, their analysis did not compare favourably with the behaviour of normal
fibres. They attributed this to the non-linear nature of the yams.
Gibson and Postle (1978) studied the bending and shear properties of
commercially-produced woven and knitted wool and wool-synthetic blended fabrics.
They found that finishing has an enormous effect on the bending characteristics of
fabrics. The influence of "finishing in this context is uncertain but fibre surface
modification will undoubtedly modify the frictional characteristics.
4.5 Summary
The tensile and bending characteristics of woven fabrics were discussed in
relation to the properties of the constituent yams. The shear properties of the fabrics
were not discussed because it is less relevant to this thesis. The available analyses of
the shear behaviour are less well refined and not readily applicable to experimental
data. The bending and extension of fabrics and yams are not naturally exclusive since
a significant proportion of these processes are controlled by interfibre and/or interyam
friction. The migration phenomenon and the way the yam "holds together" is
dependent upon interfibre friction. The energy losses both in tension and bending and
represented by hysteresis effects are greatly affected by the friction. As will be seen in
later chapters (chapters 6, 8 and 9) the observed tensile and bending behaviour of the
fabrics under investigation will be discussed in terms of the inter fibre and inter yam
frictional processes.
114

4.6 Chemical Modification Processes
4.6.1 Introduction
In recent years, numerous fabric chemical treatments and finishing products
such as softeners, lubricants, conditioners and crease resistant agents have been
developed to provide specific functional properties. Improving the handle of fabrics
remains one of the major requirements. Extensive efforts have been made to measure
the handle of finished fabrics as perceived by the finisher or consumer. This research
has established the fact that the "hand" of fabrics is influenced by or even correlatable
to several physical and mechanical properties of the filaments, yams and the fabric
such as tensile properties, bending and shear properties, friction, compression, etc. It
is the purpose of this section to discuss the relation between the "hand" of fabrics and
the above properties and to consider how these properties are modified by the addition
of the so-called softeners. The modifications of the "hand" of fabrics are brought
about as a result of a complex interaction of surface and bulk effects. Both these
effects will be discussed here in the context of fabric finishes. The modification of
fabric "hand" is particularly relevant to the cotton fabrics while chemical modification
processes with for example PDMS (poly dimethyl siloxane) will be seen to be
important in the case of the aramid fabrics (chapters 7 and 10).
4.6.2 Chemical Finishing
Application of oils and fats for lubrication and softening of textiles began
probably in prehistoric times and has continued until today. Advances in fat chemistry
resulted in the use of fatty acids, fatty esters, sulphonated and sulphated fatty
derivatives and, since the early thirties, cationic surface active agents have been used
1 1 5

extensively for this purpose.
Most chemical finishes are thought to mainly produce their effect by modifying
the surface of the fibres. Such surface finishes may be called external finishes. When
fabrics are treated with such agents as starches, resins or waxes, the peripheries of the
fabric bond so well that the finish acts almost like an integral part of the fabric.
Internal finishes also exist where the constituent molecules and perhaps small colloidal
entities find their way into the internal structure of the filaments and may become
affixed or cross-linked within the fibres. Even when chemical fixation does not occur,
resins and metallic colloids can often be entrapped within the fibre walls. Speel and
Schwartz (1957) have classified chemical finishes according to their location on or in a
fibre as follows:-
1. Surface finishes
(a) Softening agents
(b) Film forming finishes
(c) Corrective finishes
2. Internal finishes
(a) Dimensional stabilisers
(b) Crush inhibitors
Here we will only deal with softening agents. They not only improve the
softness and handle of materials, but they also facilitate mechanical finishing.
Mallinson (1974) defined softeners as "an auxiliary that when applied to textile
materials, brings about an alteration in handle, resulting in the goods being more
pleasing to the touch". However, softeners can perform other functions. They may
contribute to the lubrication, abrasion resistance, antistatic properties and water
absorbency of fabrics. The method of application of the softener can also greatly
116

affect softener efficiency. Modem fabric drying techniques have influenced the
selection of softeners significantly. Valko e t a l (1966) studied the influence of the
application conditions on the penetration, the ion-exchange and the oriented
absorption. Hughes and Koch (1965) studied the adsorption and desorption of
cationic softeners on cotton. Mallinson (1974) and Mooney (1980) classify softeners
into the following categories:-
1. Cationics
(a) Quaternary ammonium salts
(b) Amino acids
(c) Cyclic cationics
2. Anionics
(a) Sulphates
(b) Sulphonates
(c) Sulpho-succinates
(d) Sulphated fatty alcohols
3. Non-ionics
(a) Ethoxylates
(b) Esters
(c) Polyethylene glycols
(d) Silicones
The cationic surfactants dominate the field of commercial fabric softeners. Two
of the most commonly used compounds in commercial formulations are:-
117

CH
C 18H 37 ~ N - 0
CH3
Cl'
Octadecyldimethylbenzylammonium chloride
Dihardenedtallowdimethylammonium chloride
Evans (1969) has offered the following correlations between softening
efficiency of cationics and their molecular structure:-
(a) softening depends markedly on the alkyl chain length with C16-C18
chains providing the best softening.
(b) two alkyl chains are preferred to one in a formulated finish.
(c) straight chain surfactants are better than branched ones.
(d) desaturation in the alkyl chain reduces the softening efficiency.
Many early workers have discussed the cause of the softness imparted to fabrics
by softeners, including Sollenberger (1957) and DuBrow and Linfield (1957). The
mechanism of softening appears to be largely a surface lubrication phenomenon.
Although in the case of cellulosic fibres such as cotton, it is believed that, in addition
to lubrication, there is a certain amount of plasticisation of the cellulose fibres by the
softener molecules.
Since lubrication is believed to be the major cause of the imparted softness, only
118

those molecules which remain on the fibre surface are effective. In fact, the efficiency
of a softener is therefore governed by its ability to be adsorbed and orientate in such a
way as to project its long hydrophobic tail away from the cellulose substrate. This is
the idea of classical lubrication. It is also considered to be important that the softener
molecule is attached to the surface by strong chemical and physical bonds. The greater
effectiveness of cationics in this respect is explained by their ability to interact
chemically with cellulose by a cation exchange mechanism in addition to ion-pair
adsorption. Sexsmith and White (1959) have studied the absorption of Cetyl trimethyl
ammonium bromide (CTAB) by cotton fibres. They proposed that the absorption
occurs by two major processes. Below the critical micelle concentration CMC (CMC
for CTAB is 10'3M) cation exchange is appreciable while in the vicinity of CMC,
ion-pair absorption becomes important. Figure 4.5 reproduced from Sexsmith's paper
shows the uptake of both cation and anion by a purified cotton at various equilibrium
concentrations. The uptake increases with increasing ion concentration. The molarities
of the CTAB solutions chosen in the current experiments fall both below and above the
CMC of CTAB (see chapter 5). According to Sexsmith and White, the site of cation
exchange is a carboxyl group. However, since pure cellulose does not possess any
carboxyl groups, their presence in cellulose based fabrics indicates that textile
processing and finishing treatments are responsible for their existence. This explains
the difference in the level of softness imparted to nominally similar cellulose based
textiles by the same cationic surfactant. The lubricating properties of CTAB were
examined for the particular systems described in chapters six and nine, that is the
"hardness" and the pull-out experiments.
The intrinsic lubricating property of commercial softeners is confirmed by the
observations (Evans, 1969) that fabrics made of glass fibre are also softened by
119
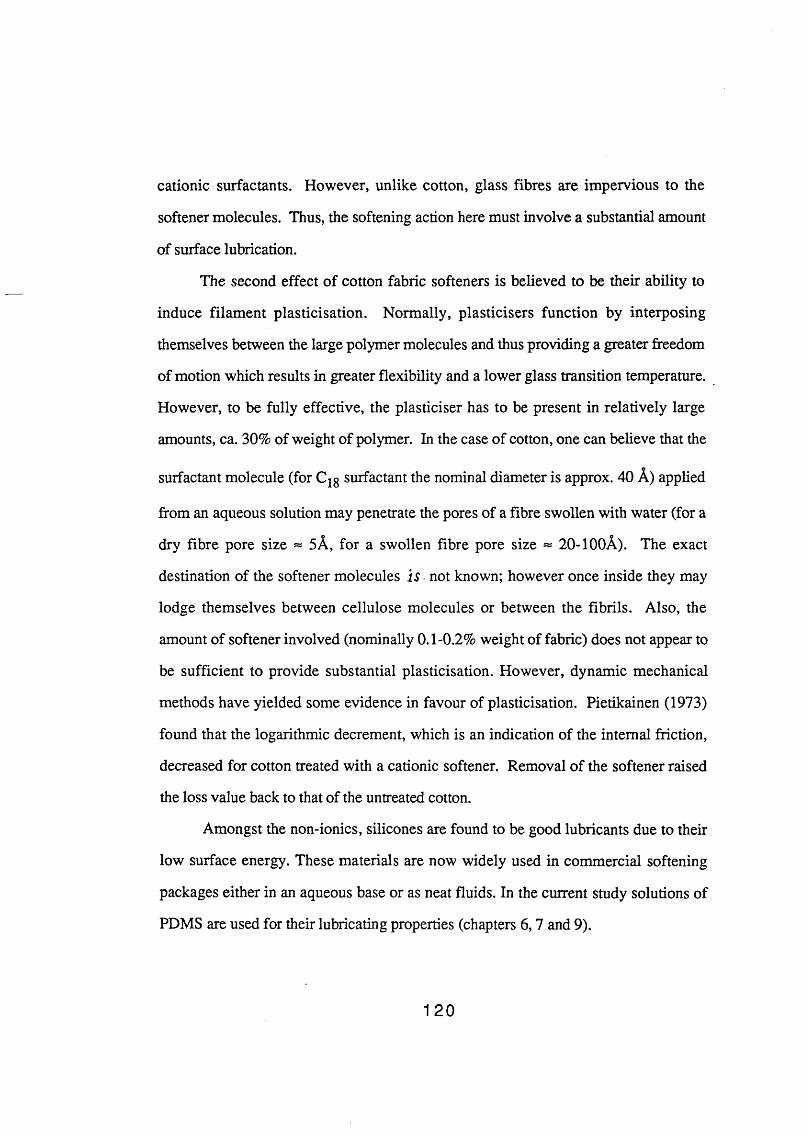
cationic surfactants. However, unlike cotton, glass fibres are impervious to the
softener molecules. Thus, the softening action here must involve a substantial amount
of surface lubrication.
The second effect of cotton fabric softeners is believed to be their ability to
induce filament plasticisation. Normally, plasticisers function by interposing
themselves between the large polymer molecules and thus providing a greater freedom
of motion which results in greater flexibility and a lower glass transition temperature.
However, to be fully effective, the plasticiser has to be present in relatively large
amounts, ca. 30% of weight of polymer. In the case of cotton, one can believe that the
surfactant molecule (for C18 surfactant the nominal diameter is approx. 40 A) applied
from an aqueous solution may penetrate the pores of a fibre swollen with water (for a
dry fibre pore size * 5A, for a swollen fibre pore size ~ 20-100A). The exact
destination of the softener molecules i s not known; however once inside they may
lodge themselves between cellulose molecules or between the fibrils. Also, the
amount of softener involved (nominally 0.1-0.2% weight of fabric) does not appear to
be sufficient to provide substantial plasticisation. However, dynamic mechanical
methods have yielded some evidence in favour of plasticisation. Pietikainen (1973)
found that the logarithmic decrement, which is an indication of the internal friction,
decreased for cotton treated with a cationic softener. Removal of the softener raised
the loss value back to that of the untreated cotton.
Amongst the non-ionics, silicones are found to be good lubricants due to their
low surface energy. These materials are now widely used in commercial softening
packages either in an aqueous base or as neat fluids. In the current study solutions of
PDMS are used for their lubricating properties (chapters 6,7 and 9).
120

4.6.3. "Handle" as a Measurable Parameter
The definition of the term "handle" has been a subject for discussion for many
years. Pierce (1930) described "hand" as being a judgment of the buyer which
depends on time, place, season and personal preferences. In a series of technical
investigations of textile finishing treatments, Schwarz (1939) defined fabric hand to be
a property judged as a function of the feel of a material and states that sensations of
stiffness or limpness, hardness or softeners, and roughness or smoothness constitute
hand. He comments on the desirability of physical tests which would analyse and
reflect the sensations felt and which would assign numerical values to these
measurements.
The term handle has also been defined as "the subjective assessment of textile
materials obtained from the sense of touch". Handle is thus a psychological
phenomenon in that it is the ability of the fingers (or other parts of the human body) to
make a sensitive and discriminating assessment, and of the mind to integrate and
express the results in a single valued judgment. The psychology of handle has been
reviewed extensively by Syed (1982).
In an attempt to relate the hand of a fabric to its physical properties, workers
have defined hand in various ways. Elder (1978) has given references to lists of
words which have been used to describe handle, and they ran into hundreds.
Despite the confusion in the definition of handle, the need to quantify this
sensation in terms of some measurable properties has always been recognised. The
measurement of handle is carried out through two different approaches:
(a) Purely subjective approach
(b) Purely objective approach
(a) The concept of the purely subjective approach is that "hand" is genuinely a
121

subjective phenomenon evaluated by the hands of skilled finishers or consumers.
There have been extensive studies on the subjective assessment of hand. Vaughn and
Kim (1973) have summarised the techniques commonly used in early studies. These
techniques can be put into two broad categories; the absolute method and the relative
ranking method. These methods have been studied or used by various workers,
including Binns (1934), Ginn e t a l (1965), Hoffman (1965), Lundgren (1969), Dawes
and Owen (1971) and Kramer e t al (1974).
(b) The purely objective approach to assess fabric handle is based on the idea that
what ultimately contributes to differences in feel when handling fabrics originates from
differences in the physical properties of the fabric. In this case, it is necessary to
differentiate the physical parameters that influence hand from all other physical
characteristics and to evaluate these "hand" physical parameters in numerical terms by
instrumented measurements. In this context, four direct softness measuring machines
have been patented by: Schwartz et al (1955), Plummer (1964), Flesher (1970) and
Taylor (1972).
Pierce (1930) suggested that measurement of eight physical properties of fabrics
related to their stiffness and friction would yield a direct evaluation of fabric hand.
Skau e t a l (1958) and Honold and Grant (1961) studied the softness of cotton yams by
measuring the percent increase in yam width when the yam was subjected to lateral
pressure between two parallel plane surfaces. Kakiage (1958), using a specially
designed thickness gauge, expressed the hand of fabrics in terms of their compression
and recovery under load. Dawes and Owen (1971) investigated the correlation
between the results of the cloth-bending-hysteresis test, the shear hysteresis test and
the cantilever stiffness test with subjective assessment of cloth stiffness and liveliness.
They found the correlations to be highly significant.
122

Kim and Vaughn (1979) introduced a physical method to predict the hand of
woven fabrics. Fourteen objectively measurable physical parameters were combined
to calculate a hand value for a fabric in conjunction with a graph of logarithmic values
of the hand parameters. Figure 4.6 is reproduced from Kim and Vaughn’s paper. The
objective hand parameters are:
G0=Elastic flexural rigidity, CQ=Coercive couple, C=Single curvature bending
rigidity, Ls=Multicurvature bending rigidity, <{)=Drape coefficient, T=Shearing stress,
Gj=Initial shearing modulus, Ext=Extensibility, Ej=Initial Young's modulus,
Rt=Tensile recovery, T=Thickness, H=Hardness, Rc=Compressional recovery, and
lik^Coefficient of kinetic friction
Elder e t a l (1981) investigated the relationship between the subjective
assessment of the stiffness and the objective measurement of flexural rigidity and the
subjective assessment of fabric "liveliness” and the objective measurement of coercive
couple believed to represent the frictional characteristics of a fabric. They found
strong linear relationships between them. More recently, Elder a t a l (1984) reported
the results of subjective finger pressure assessment of fabric softness compared with
objective measurements of compression. Good correlation was reported for a set of
non-woven and a set of woven fabrics. They also reported on the relationship
between touch, compressibility, weight, thickness, density and specific volume of
these fabrics.
The most comprehensive and well known examination of the effect of basic
mechanical properties of fabrics on fabric hand has been reported by Kawabata (1979,
1983). He uses the following objective hand judgement process:
123

Measurement of fabric mechanical properties and related properties.
Hand values of primary hands
( Tbtal ^l hand value )
Conversion Conversionequation 1 equation 2
By using regression analysis and appropriate conversion equations, he has related
the hand values of fabrics (actually only one fabric in a comprehensive way) based
on the subjective sensations of stiffness (KOSHI), smoothness (NUMERI) and
fullness and softness (FUKURAMI) to various mechanical properties of fabrics
such as tensile, bending, shearing, compression, surface friction, weight and
thickness.
4.6.4 Conclusion
Textile materials are invariably treated with certain chemicals during the
finishing process to acquire the desired properties. Softeners and, in particular,
cationic surfactants, are by far the most extensively used type of finishing treatment.
They not only give a more pleasant feel to the fabrics but also ease their processing.
Their effectiveness is thought to originate primarily from a lubricating process. They
also affect other mechanical properties of fibres, yams and fabrics. It had long been
recognised that to correlate the objective measurement of the physical properties of
fabrics to the subjective hand judgement would be a useful exercise. Much progress
has been achieved in this objective, although there is still much work to be done.
124
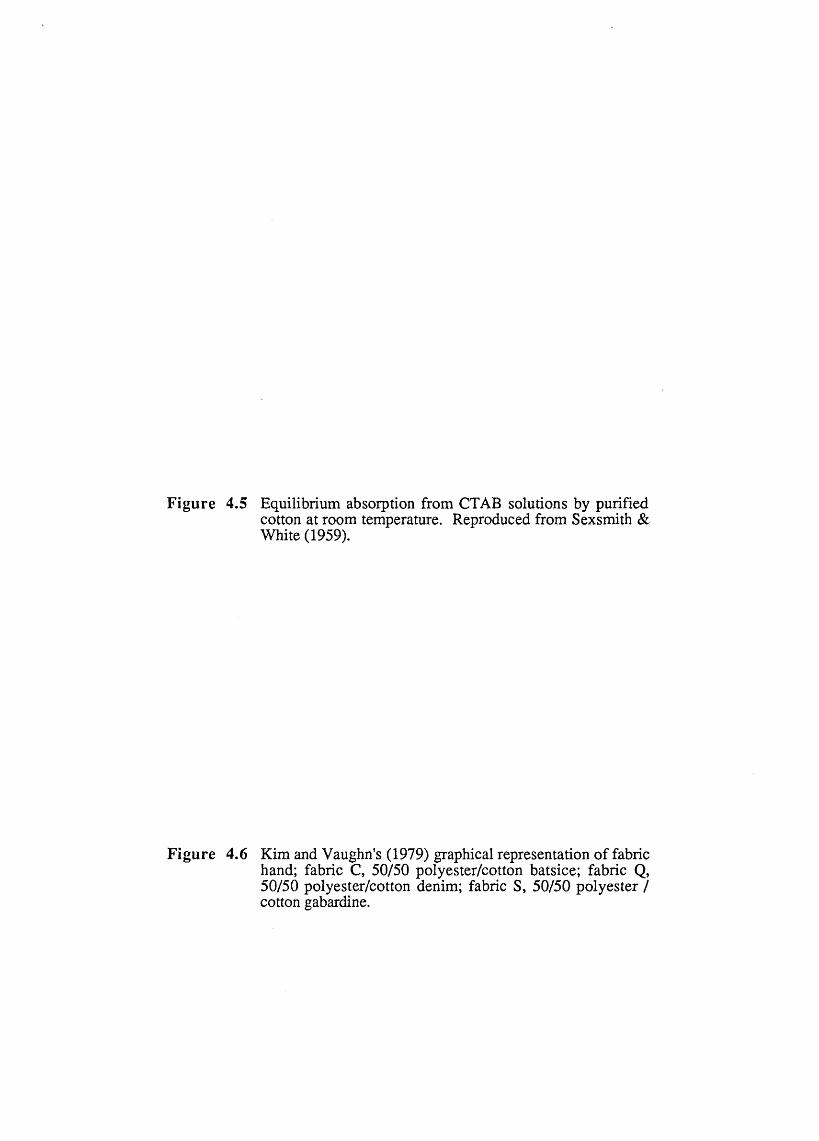
Figure 4.5 Equilibrium absorption from CTAB solutions by purified cotton at room temperature. Reproduced from Sexsmith & White (1959).
Figure 4.6 Kim and Vaughn's (1979) graphical representation of fabric hand; fabric C, 50/50 polyester/cotton batsice; fabric Q, 50/50 polyester/cotton denim; fabric S, 50/50 polyester / cotton gabardine.

125

4.7 Ballistic Impact of Fabrics
4.7.1 Introduction
This section is a review of some of the theoretical and practical aspects of the
ballistic impact process. The review will include a brief description of the basic
theory of longitudinal and transverse impact of fibres and yams and the effect of
cross-overs. It will also described some of the work of selected research groups on
the transverse ballistic impact of fabrics.
4.7.2 Theoretical Aspects of Ballistic Impact of Yams
An initial understanding of the tensile and transverse ballistic impact of yams
is essential before a theory can be developed for the ballistic impact of textile fabrics.
Lyons (1963) has discussed the longitudinal impact of a rod in the context of textiles
and has concluded that the familiar relationship for the propagation of a stress wave
in an elastic medium, Equation 4.19, applies:
where c = sonic velocity, E = Young's modulus and p = material density. Equation
(4.19) will be used in the analyses in chapter 10. This equation can be rewritten in
conventional textile units as:
(4.19)
(4.20)
For non-linear materials, Equation 4.19 may be written as:
126
(4.21)/lisV P3e
where a = stress and e = strain. If the stress-strain curve of a non-Hookean material
is concave to the stress axis, then in an impact situation the strain increments
generated will overtake the original strain front and produce a shock wave, i.e. a
sudden increase in the strain front velocity.
When the strain wave arrives at the boundary, it is reflected back along the
yam. Upon each reflection the strain is doubled and the direction of the wave front
propagation is reversed. On subsequent arrival at the point of impact, the strain
wave is again reflected. This process will continue until the breaking strain is
exceeded, or a lower value of limiting strain is reached.
Roylance (1972, 1977) has studied the transverse ballistic impact of fibres
and fabrics for many years. He suggested that for an infinite yam or fibre at impact
velocity v0 and at a time t0, assuming vQ to be below the critical velocity, at some
time t after impact, the yam configuration will be as shown in Figure 4.7.
A longitudinal strain wave propagation away from the impact point is
assumed to have reached point A in Figure 4.7. Following this wave and moving at
a lower velocity is a transverse wave front. The longitudinal wave velocity is given
by Equation 4.19. Smith e t a l (1958) derived an equation for the transverse wave
velocity u in a Lagrangian co-ordinate system (co-ordinate system fixed to the yam
as opposed to the laboratory frame).
(4.22)
127
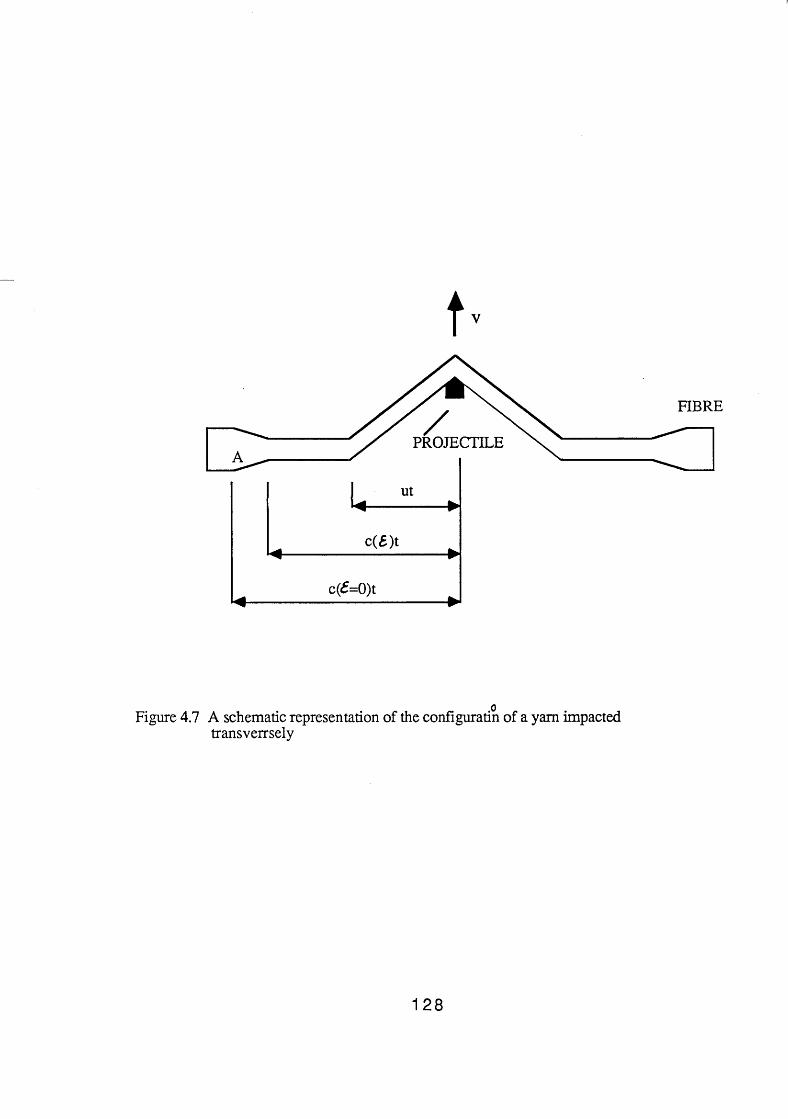
t -
.0Figure 4.7 A schematic representation of the configuratin of a yam impacted
transverrsely
128

where u = transverse wave velocity, Tp = maximum tension, m = mass per unit
length of unstrained filament and £p = maximum strain due to impact. Smith’s
analysis has shown that if the stress-strain relationship is linear then Bp can be found
from:
where v = impact velocity, E = tensile modulus and k = constant.
The important points of the above discussion are that the transverse and
longitudinal wave velocities are both increased with increased material modulus and
decreased linear density. Transverse waves absorb energy from the projectile in the
form of kinetic energy. Therefore materials where the wave front propagates faster
will have better energy absorbing characteristics.
4.7.3 The Effect of Cross-overs on the Stress Wave Propagation
When a yam is woven into a fabric, the propagation of strain is modified by
the presence of the cross-overs. Roylance (1980) has studied the effect of
cross-overs using models that he developed to include the influence of fibre materials
properties and fibre-fibre slip. At the cross-over some of the stress wave is
transmitted along the primary fibre, some reflected and some diverted along the
secondary fibre. The proportion of each of the above depends on the modulus of the
fibre as well as the extent of fibre-fibre contact and slip. Figures 4.8 to 4.11
(4.23)
129

Figure 4.8 The effect of fibre modulus on the proportion of thetransverse wave being either transmitted along the original fibre or be diverted to the second fibre at a cross-over point.
Figure 4.9 The effect of friction at a cross-over on the coefficient of reflection of the transverse wave front.

REFL
ECTI
ON
COEF
FICI
ENT
OO
O o o cnO o o
o ro
03 Ocn o m -n > o H O X
Modulus * 550 gpd
Modulus, gpd
«o
p tran
smitte
d
f=> vO OO diverted
a 99

Figure 4.10 The effect of friction on the coefficient of wave diversion.
Figure 4.11 The influence of friction at the cross-over on the transmission of the transverse wave front.

0 .2 0.4 0.6SLIDE FACTOR
TRA
NSM
ISSI
ON
C
OEF
FIC
IEN
T
O <0 o o toO
Modulus ■ 350 gpd
DIVE
RSIO
N C
OEF
FIC
IEN
T
Modulus * 550 gpd
reproduced from Roylance's paper show the effect of the fibre modulus and slide
factor on the proportion of the wave that may be transmitted, diverted or reflected.
Cork (1983) has confirmed the above results.
4.7.4 The Ballistic Performance of Textile Structures
The most common approach that has been adopted for the testing of the
ballistic resistance of textile structures is the "V50 limit" for a given area density of
multi-layer fabric. The V50 limit is defined as the impact velocity at which 50% of
the samples fail and 50% remain unpenetrated. Under real test conditions, however,
for any chosen impact velocity, only a certain proportion of projectiles will penetrate
the sample. This occurs partly due to differences between specimens, but mainly
due to the exact location of the impact zone in relation to the cross-over points.
An alternative way of quantifying ballistic resistance is the ballistic
performance indicator (BPI) developed by Figucia (1980). BPI is defined as the
energy absorbed per unit increase in area density and corresponds to the slope of the
energy vs. area density plot (the area density corresponds to the number of fabric
layers). Figucia (1980) found that the energy absorbed and the area density were
linearly related for Kevlar.
There are numerous parameters that influence the ballistic resistance of
fabrics. Amongst workers such as Montgomery et a l (1982) and Prosser (1988),
Kruger (1987) has studied the ballistic performance of aramid fabrics. Figure 4.12
reproduced from that paper depicts the factors that may influence the ballistic
efficiency of a textile structure. On the question of fabric finishing, which has a
direct relevance to the current study, he found that non-finished wet aramid fabrics
132

lose up to 40% of their ballistic strength. Hence, he recommends careful fabric
scouring followed by a suitable water repellent finish.
b a llis t ic test
Figure 4.12 Factors that may influence the ballistic performance of aramid
fabrics.
133
C H A P T E R F I V EMATERIALS AND EXPERIMENTAL TECHNIQUES
5.1 Introduction
This chapter provides details of all the materials and experimental techniques
used in the current study. Included are descriptions of the preparation and
characteristics of the materials investigated, the properties of the treating agents used,
and the apparatus designed, developed or used in the evaluation of the properties of
these materials. The chapter begins by describing the materials used. The next section
describes the experimental methods followed and the results of the various friction and
tensile experiments carried out on the cotton and the aramid yams. Then the so called
"hardness" experiments are described followed by an outline of the procedure adopted
in the ballistic impact experiments. Next, the pull out experiments on untreated and
treated fabrics are described and finally the micro-displacement measurements are
outlined.
5.2 Selected Test Materials
Two kinds of fabrics were used in these studies, a 100% cotton fabric,
commercially known as Sanfurised mull supplied by Proctor & Gamble Co., and two
poly aramid fibre fabrics constructed from commercial yams ( Kevlar 49 and 29
denoted as aramid 1 and 2 respectively in this thesis) manufactured by E.I.duPont Co.
The cotton fabric possessed a plain weave structure and the average yam
diameter was 0.28 ± 0.04mm. The average yam centre to centre spacing was 0.58 ±
0.09mm and the linear density was 22.4 ± 2mg/m. Figure 5.1 shows a typical
microscopic photograph of this fabric. An SEM photograph of a single cotton yam is
134
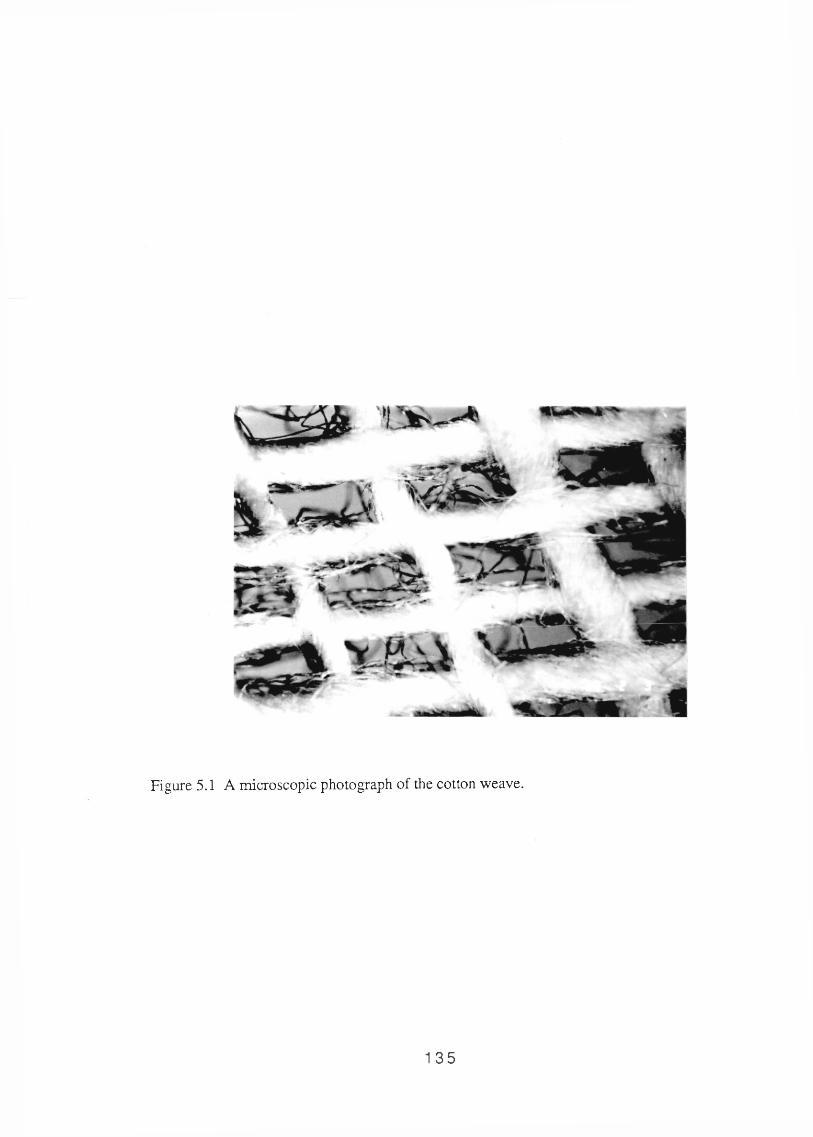
Figure 5.1 A microscopic photograph of the cotton weave.
135
shown in the Appendix 1.
Before each experiment or treatment, the cotton fabric was washed once with
water only in a top loading washing machine (Hotpoint model 15790) and tumble
dried (Indesit T2590 drier) at medium heat for about 40 minutes (hence totally dry).
The aramid fabrics studied were a plain weave aramid 2 and a twill weave aramid 1.
The aramid 2 fabric was several years old. The average yam width for the warp yams
was 1.51mm and for the weft yams was 1.26mm. The mean yam thickness was
0.2mm and yam spacing was virtually zero. The linear density was 0.164 mg/m. The
aramid 1 fabric had an average yam width of 1.42mm for the warp and 1.39mm for
the weft yams, an average yam thickness of 0.15mm and a yam spacing ranging from
0 to 0.25mm. The linear yam density was 0.13 mg/m.
5.3 The frictional characteristics of the yarns
5.3.1 Introduction
This section describes the experimental apparatus and techniques used to
measure the frictional character of single cotton and aramid yams together with the
results obtained. Two configurations were used, the point contact and the hanging
fibre friction configurations. The point contact technique was only used with untreated
cotton, aramid 1 and aramid 2 yams, while the hanging fibre method was used with
both untreated and treated cotton and aramid 1 yams. The results are mostly presented
as the calculated values of the coefficient of friction p. The analysis described in
section 3.4.3 has been applied to the results and found to describe the frictional
character of yams quite well.
5.3.2 Point contact friction measurements
The principle of this experiment was very similar to that of the Scruton point
136

contact friction machine described by Briscoe e t a l (1973). The force measuring
device of the yarn pull-out machine to be described later was used as a force
transducer. A single yam of length ca.30mm was attached to a flat and horizontal
piece of metal (A) which was directly connected to this transducer. Another yam of
similar length was attached to the movable stage directly underneath and at right angles
to the first yam. Figure 5.2 shows a schematic diagram of the force measuring
device. The stage was set in motion and the dynamic frictional force associated with
varying normal loads (0.01-0.IN) was measured.
Figure 5.3 shows a typical set of data obtained using the point contact method.
The gradient of the line is a measure of the coefficient of friction |i. Table 5.1 presents
the values of ji and the load index n (see section 3.4.3) for the three yams tested.
Table 5.1Tvne of vam Coefft. of friction (i Load index nCotton 0.65 0.93Aramid 1 0.25 0.92Aramid 2 0.28 0.88
Aramids possess a much lower value of Ji than cotton fibres. The load index n is
an indication of the type of deformation the contact experienced during the frictional
process. The numerical values obtained indicate that a multiple asperity elastic
deformation is probably formed in each contact case.
5.3.3 The hanging fibre friction configuration
5.3.3.1 Experimental apparatus and procedure
The principle features of this apparatus were described by Howell (1954) and
used later by Kremnitzer (1978) to measure the friction of PET fibres. The apparatus,
137
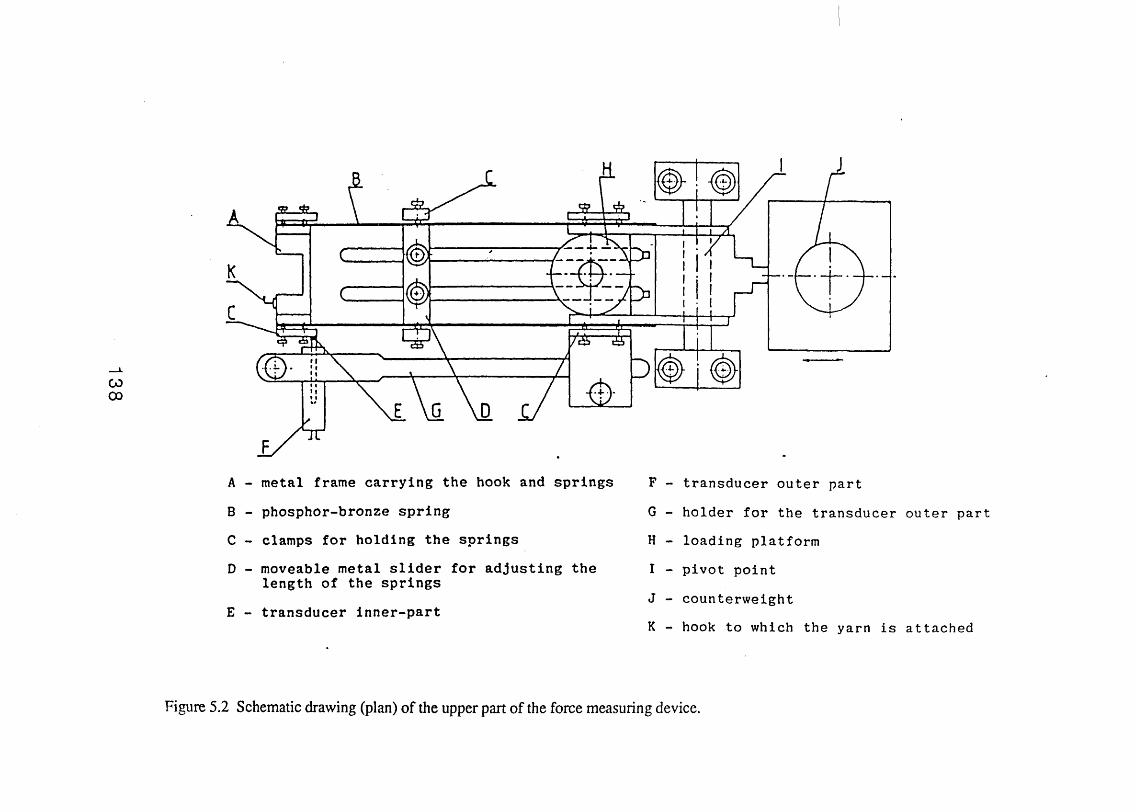
CO00
A - metal frame carrying the hook and springsB - phosphor-bronze springC - clamps for holding the springsD - moveable metal slider for adjusting the
length of the springsE - transducer inner-part
F - transducer outer part G - holder for the transducer outer part H - loading platform I - pivot point J - counterweightK - hook to which the yarn is attached
Figure 5.2 Schematic drawing (plan) of the upper part of the force measuring device.

N o rm a l load (N )
Figure 5.3 Point contact frictional character of two orthogonal cotton yams The yams were untreated and dry (RH=40%)
139

depicted in Figure 5.4, consisted of a vertically suspended fibre, connected at the
upper end to the hook of the force measuring device and at the lower end to a specified
dead weight, W j. A taut horizontal fibre was held in a holder under a specified
pretension. The force measuring device was that used in the pull-out test, described in
detail later, except that the measuring arm was tilted through 90° to enable it to
measure the force in the vertical direction. The signals from the linear displacement
transducer were fed into a amplifier (Sangamo) and then into an A to D convertor. The
digital signals were then recorded on a microcomputer (Apple Macintosh).
Precalib ration enabled the signals to be converted into values of force.
The holder for the horizontal fibre was that used to hold the fabric in the pull-out
apparatus and described in detail later. One end of the yam was clamped, the other
hung over a PTFE roller and connected to a weight, creating a specified tension in the
yam. The second end was then clamped. The measuring device and the suspended
yam were connected to the movable plate of an Instron tensile tester enabling the
controlled vertical movements of the suspended yam. The horizontal yam holder was
attached to the static bottom plate of the Instron. The hanging yam was placed over the
horizontal yam. The distances d and h and hence the angle 0 were measured, figure
5.5. The suspended fibre was moved up for a predetermined distance and then
returned to its original position. In this way a dynamically varying normal load was
produced as the upward and downward friction were being recorded. The compliance
of the springs was 5 mm/N which was corrected for in the calculations.
The hanging fibre configuration was used to measure the friction between the
following single yams: untreated cotton, untreated aramid 1, 5% PDMS treated cotton,
CTAB treated cotton, cleaned (soxlet extracted) aramid 1 and 5% PDMS treated aramid
1. The dead load was varied and values of 0.05, 0.10 and 0.20N were adopted
140
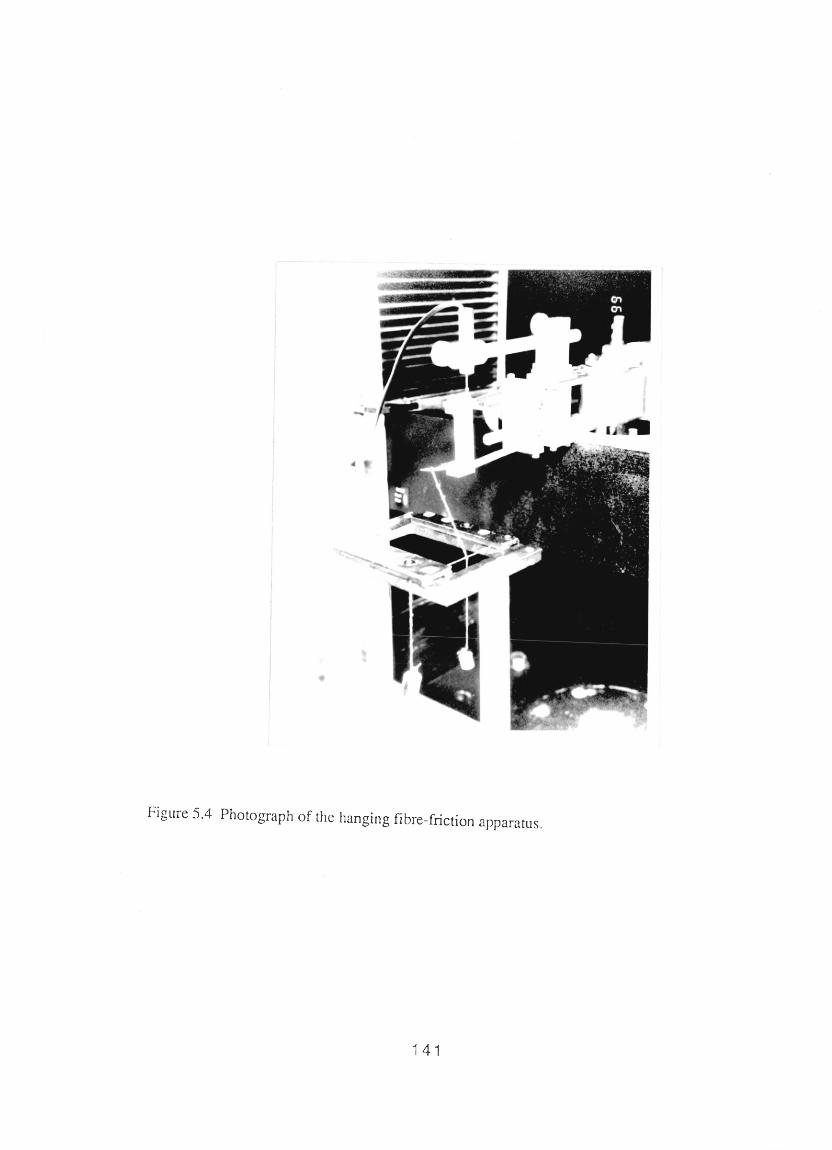
Figure 5.4 Photograph of the hanging fibre-friction apparatus,
141

SIDE VIEW
Figure 5.5 Schematic diagram of the hanging fibre arrangement showing the directions of motion and the yams in contact
142

for systematic studies. The horizontal yam pretension was 0.20 N.
5.3.3.2 The frictional character of yarns
Figure 5.6 shows a typical set of results obtained from the hanging fibre
experiments. The force is calculated using the recorded data and the appropriate
calibration curve (not included here) while the load was calculated as:
W = Wd * cos0
where Wd is the dead load on the vertical yam and 0 the angle shown in figure 5.5.
The effect of Wd on the measured values of force is eliminated by measuring the force
both in the upward and downward directions of motion, subtracting the downward
force from the upward and dividing by two. Typical data are shown in figure 5.6,
table 5.2 presents the values of |i calculated as above for the cotton and aramid 1
yams. The dead load Wd on the yam for the results below was 0.10 N.
Table 5.2Yam Tvpe Ratio FAVCotton (untreated) 0.61Cotton (5% PDMS) 0.39
Cotton (1.4*10'3M CTAB) 0.52Aramid 1 (as received) 0.27Aramid 1 (5% PDMS) 0.16Aramid 1 (soxlet extracted) 0.35
Figure 5.7 depicts the relation between the measured frictional force and the angle
(figure 5.5) for cotton. It can be seen that as 0 increases ie. decreasing load, the force
143
Figure 5.6 Variation of friction force with load in the hanging fibre experiment. The dead load W ^ was 10 g. The normal load
on the contact was a component of through angle 0which changed during the course of the experiment. The gradient is the mean coefficient of friction.
Figure 5.7 Variation of friction force with angle 0 in the hanging fibre experiments. Increasing the angle has the same effect as decreasing the load, hence the force decreases. = 10 g.

Fric
tion
forc
e (N
)
0.06
g ,ous.o
c
fa
144
decreases accordingly.
On closer inspection of the values of 1i, if one attempts to calculate |i, using the
equation F=p.W, for each and every point in figure 5.6, and plot |i against W, figure
5.8 is obtained. This figure is for untreated cotton at ^^=0.05, 0.10 and 0.20 N,
while figure 5.9 is for untreated aramid 1 yams at similar dead loads. It can be seen
that the coefficient decreases with increasing load. This observation has been reported
previously, for example Kremnitzer (1978) obtained similar trends for friction between
PET fibres. The results of figures 5.8 and 5.9 are found to fit the analysis described in
section 3.4.3, equation 3.29 quite well. The lines drawn through the data points in the
two figures are represented by equations \i = 0.15 * W-1 + 0.1 for untreated cotton
and p. = 0.06 * W"1 + 0.08 for as received aramid 1 yams.
The fact that equation 3.29 describes the results of the hanging fibre experiments
so well suggests that the geometry of contact in these experiments may be a point
contact rather than an extended line contact geometry.
5.4 The Yam Tensile Experiments
This section deals with the tensile characterisation experiments performed on
both treated and untreated single yarns of cotton and aramid fibres. Both the
experimental aspects and the results obtained will be presented. It is appropriate to do
this here, because these studies were carried out so as to gain an insight into the
characteristics of the yams that went into constructing the fabric assemblies.
145
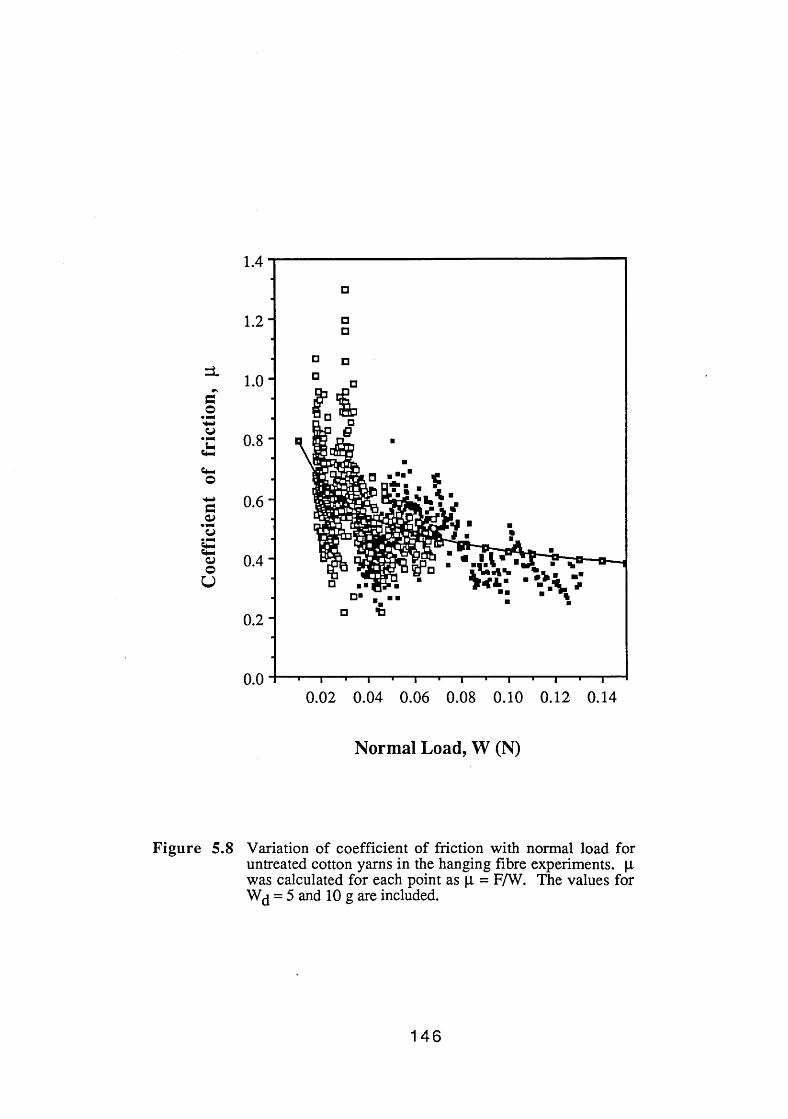
1.4
0.0 H— 1— i— 1— i— '— i— 1— i— 1— i— 1— i— ■— i—0.02 0.04 0.06 0.08 0.10 0.12 0.14
N o rm a l Load, W (N)
Figure 5.8 Variation of coefficient of friction with normal load for untreated cotton yams in the hanging fibre experiments, p was calculated for each point as p = F/W. The values for Wjj = 5 and 10 g are included.
146

0.4
U
0.10.00 0.05 0.10 0.15 0.20
N o rm a l load (N)
Figure 5.9 Variation of \i with W for untreated Aramid 1 (Kevlar 49) yams in the hanging fibre experiments. = 5, 10 and 20g-
147

5.4.1 Experimental Set-up and Procedure
An Instron tensiometer (Model 1122) was used in these studies. The force
measuring system comprised a Piezo-electric transducer (Kistler 9311 A) of max.
capacity 5 KN connected to a charge amplifier (Kistler, type 5007). The amplified
signal went to an A to D convertor (3D Digital Design and Development Ltd.). The
digital signal was then received by a micro computer (Apple Macintosh, 512K) where
the force and corresponding times were recorded. The yams were securely mounted
between grips but not so tight as to excessively damage the yam. The contacting faces
of the grips were rubber and hence the yam damage was minimised. The length of the
yam was measured and the upper grip was set in motion. With untreated cotton yams,
the variables investigated were lengths of yam i.e. between 2 and 25mm, and
cross-head speeds of 1, 2, 5 and 20mm/min. However, all other experiments on
treated cotton and aramid yams were performed at a yam length of 20-25mm and a
cross-head speed of 2mm/min.
Yams with the following treatments were tested: cotton yams (warp yams only
taken from untreated fabric randomly) were immersed in distilled water and pure
tetradecane for 2 hours at 22 ± 2°C. They were then taken out of solution and tested
wet before an appreciable amount of the liquid could drain away. Cotton yams were
also immersed in solutions o f 1% w/w and 5% w/w PDMS (Poly dimethyl siloxane of
viscosity lOOcp) in petroleum spirit and 1.4x1 O'4 M and 1.4x1 O'3 M solutions of Cetyl
trimethyl ammonium bromide (CTAB, mol.wt. 364.46, [CHjtCHj)^] (CH3) NBr,
min. assay 98%) in distilled water for 2 hours at 22 ± 2°C. They were then dried
completely and tested in the tensiometer at approx. 20°C and 40% RH. Each
experiment was repeated 3-5 times.
148
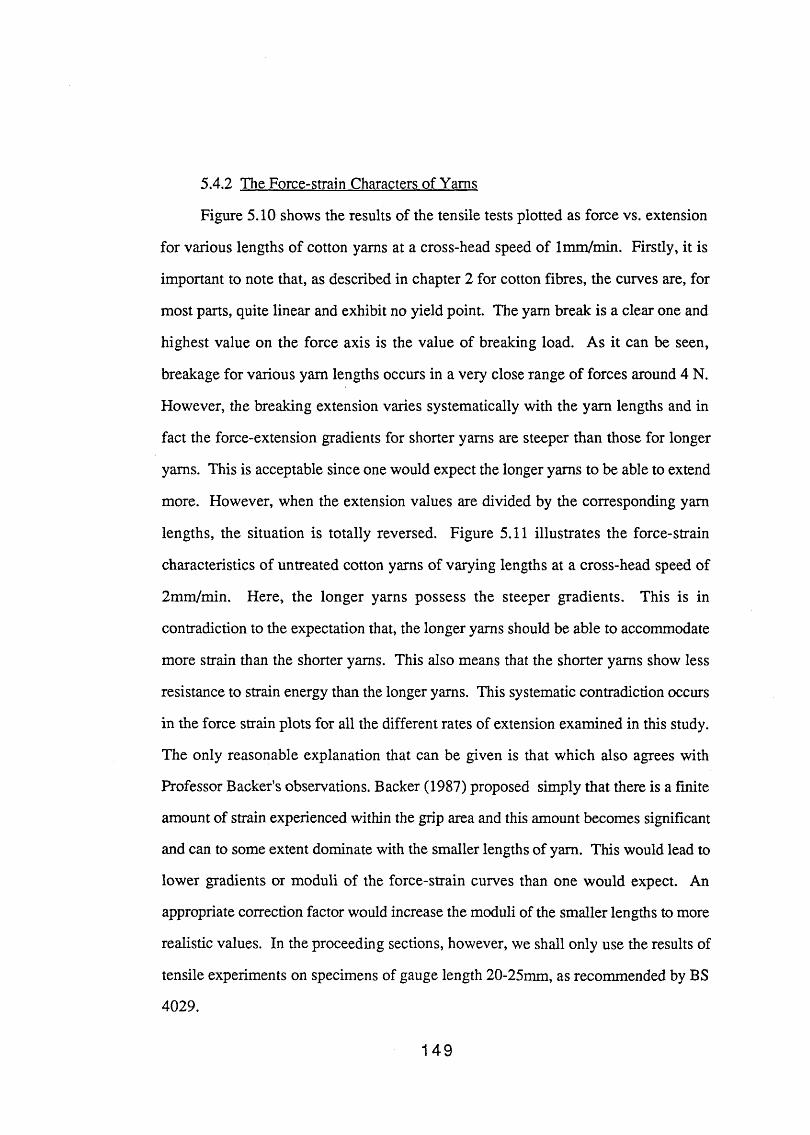
5.4.2 The Force-strain Characters of Yams
Figure 5.10 shows the results of the tensile tests plotted as force vs. extension
for various lengths of cotton yams at a cross-head speed of lmm/min. Firstly, it is
important to note that, as described in chapter 2 for cotton fibres, the curves are, for
most parts, quite linear and exhibit no yield point. The yam break is a clear one and
highest value on the force axis is the value of breaking load. As it can be seen,
breakage for various yam lengths occurs in a very close range of forces around 4 N.
However, the breaking extension varies systematically with the yam lengths and in
fact the force-extension gradients for shorter yams are steeper than those for longer
yams. This is acceptable since one would expect the longer yams to be able to extend
more. However, when the extension values are divided by the corresponding yam
lengths, the situation is totally reversed. Figure 5.11 illustrates the force-strain
characteristics of untreated cotton yams of varying lengths at a cross-head speed of
2mm/min. Here, the longer yarns possess the steeper gradients. This is in
contradiction to the expectation that, the longer yams should be able to accommodate
more strain than the shorter yams. This also means that the shorter yams show less
resistance to strain energy than the longer yams. This systematic contradiction occurs
in the force strain plots for all the different rates of extension examined in this study.
The only reasonable explanation that can be given is that which also agrees with
Professor Backer’s observations. Backer (1987) proposed simply that there is a finite
amount of strain experienced within the grip area and this amount becomes significant
and can to some extent dominate with the smaller lengths of yam. This would lead to
lower gradients or moduli of the force-strain curves than one would expect. An
appropriate correction factor would increase the moduli of the smaller lengths to more
realistic values. In the proceeding sections, however, we shall only use the results of
tensile experiments on specimens of gauge length 20-25mm, as recommended by BS
4029.
149

5
□ 2.15 MM
♦ 4.95 MM□ 6.14 MMo 12.1 MM
■ 17.4 MM□ 20.6 MM
2.0
Y a rn extension (m m )
Figure 5.10 Force-extension profiles for untreated cotton yarns of varying gauge lengths. The yams were taken to the point of rupture in the tensile experiment. Instron cross-head speed = 2 mm/min.
150

Forc
e (N
)
□ 2.15 MM
♦ 2.7 MM
D 3.8 MM
0 6.14 MM
■ 12.1 MM
A 17.4 MM
□ 20.6 MM
S tra in (-)
Figure 5.11 Force-strain character of untreated cotton yams of different lengths. The extension data in Figure 5.10 was divided by the corresponding yam length to obtain the strain.However, the position of the profiles have reversed here from that of Figure 5.10. Strain = 10% per minute.
151

No obvious correlation was found between breaking force and yam length at
any rate of strain. However this could be due to the relatively small numbers of
samples tested. Also, with the rates of strain used, for specimens of gauge lengths
20-25 no clear trends were observed in moduli, the breaking force and the breaking
extension although the literature (section 3.3.7) suggests that the breaking strength
increases at higher rates of strain. The actual values obtained are given in Table 5.3
below.
TABLE 5.3 Force-strain Parameters at Different Strain Rates
Cross-head speed mm/min
1
25
20
Gradient (N)
60
43.3
48
48.2
Break force (N)
3.99
2.653
3.381
3.96
Break strain (-)
0.076
0.083
0.092
0.088
Figure 5.12 is a plot of the gradient of the force-strain curves (modulus) against the
corresponding value of strain for different rates of strain. Although again there is no
obvious trend between different rates of strain, the increasing trend of gradient or
modulus with strain can be seen. The common feature of all the profiles is the
increasing values of moduli with increasing strain towards an asymptotic value. The
curves for the slower rates of strain provide similar limiting forces but these occur at
lower imposed strains. These features were observed for all values of initial length
and rate of strain. Another feature which can clearly be seen in Figure 5.12, for strain
rates of 1 and 2 mm/min, is that values of gradient seem to decrease slightly up to
strains of 0.01 and then begin to increase. The same effect also exists to a lesser
extent in the curve for 5mm/min but is absent for the highest rate of extension.
152
1 mm/min
2 mm/min
5 mm/min
20 mm/min
S tra in (-)
Figure 5.12 Variation of the point to point tensile modulus (force/strain) of untreated cotton yams with strain and the rate of strain.
153
Figure 5.13 shows the force-strain profile of the cotton yams treated by the methods
described earlier. These profiles correspond to the averages of 3-5 experiments in
each case and with gauge lengths of 20-25 mm. From these figures, the effect of the
various treatments may be identified. The three most obvious variable features that
may be identified are the breaking force, the breaking strain and the modulus. The
averaged values of these three parameters for the different treatments are given in Table
5.4. As far as the breaking strength is concerned, all the treatments, except the wet
(water) yam, have caused the modified yam to be weaker than the untreated yam. The
increased strength of the wet (water) cotton yam over the untreated one is expected and
was discussed in chapter 2. The constituents of the yam, i.e. cotton fibres, exhibit
increased strength when wet and this translates itself to the assembly making the yam
stronger, in this case by around 10%. The wet (water) cotton yam has also sustained a
greater strain than the untreated yam; approx. 40%. This may be explained simply in
view of the fact that the water penetrates between the fibres and lubricates the contacts.
Hence the fibres can slide over each other more readily and thus the yam is able to
accommodate more strain prior to rupture. Also for the wet (water) yam, the force
required to produce a given strain, i.e. the modulus, is lower. This again can be
explained in terms of the lubricating action of the water. In this case less force is
required to straighten and slide fibres passed each other.
The PDMS and tetradecane treatments seemed to have had no significant effect
on breaking strain, while treatment with CTAB solution has had the effect of
decreasing the breaking strain by as much as 30%. Treatment with the surfactant
however has decreased the breaking strength by approx. 35%, which is less than the
reduction by the 1% PDMS, 5% PDMS and tetradecane treatment which have reduced
the strength by 73%, 68% and 63% respectively.
154
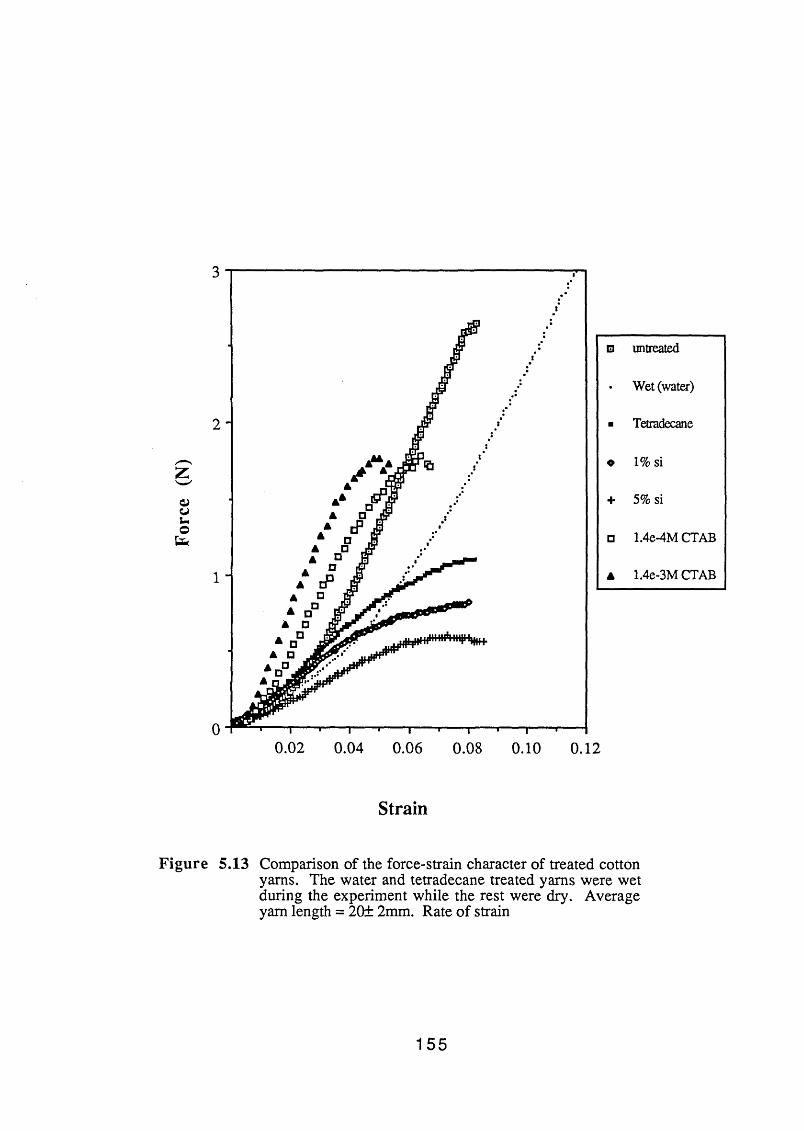
3
a<yuofc
0.02 0.04 0.06 0.08— i—
0.10
□ untreated
• Wet (water)
■ Tetradecane
o 1% si
+ 5% si
□ 1.4e-4M CTAB
a 1.4e-3M CTAB
0.12
S tra in
Figure 5.13 Comparison of the force-strain character of treated cotton yams. The water and tetradecane treated yams were wet during the experiment while the rest were dry. Average yam length = 20± 2mm. Rate of strain
155
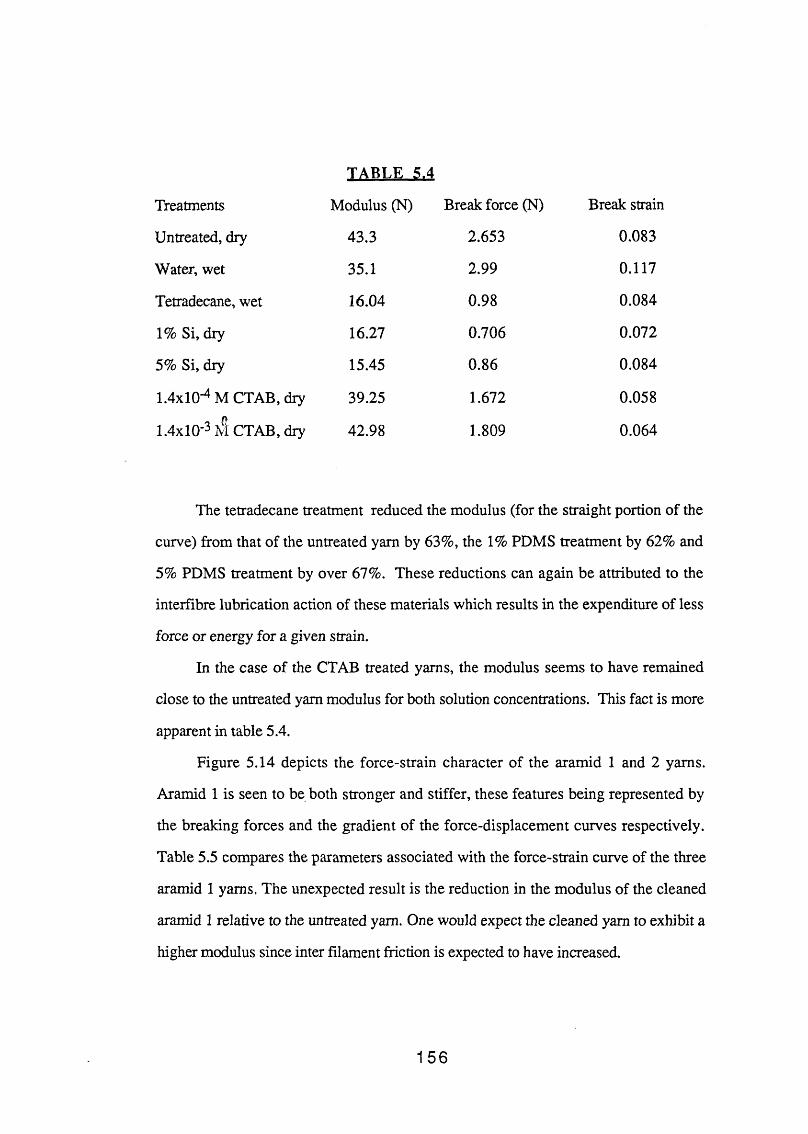
TA B LE 5.4
Treatments Modulus (N) Break force (N) Break strain
Untreated, dry 43.3 2.653 0.083
Water, wet 35.1 2.99 0.117
Tetradecane, wet 16.04 0.98 0.084
1% Si, dry 16.27 0.706 0.072
5% Si, dry 15.45 0.86 0.084
1.4x1 O'4 M CTAB, dry 39.25 1.672 0.058
1.4xl0'3 1$ CTAB, diy 42.98 1.809 0.064
The tetradecane treatment reduced the modulus (for the straight portion of the
curve) from that of the untreated yam by 63%, the 1% PDMS treatment by 62% and
5% PDMS treatment by over 67%. These reductions can again be attributed to the
interfibre lubrication action of these materials which results in the expenditure of less
force or energy for a given strain.
In the case of the CTAB treated yams, the modulus seems to have remained
close to the untreated yam modulus for both solution concentrations. This fact is more
apparent in table 5.4.
Figure 5.14 depicts the force-strain character of the aramid 1 and 2 yams.
Aramid 1 is seen to be both stronger and stiffer, these features being represented by
the breaking forces and the gradient of the force-displacement curves respectively.
Table 5.5 compares the parameters associated with the force-strain curve of the three
aramid 1 yams. The unexpected result is the reduction in the modulus of the cleaned
aramid 1 relative to the untreated yam. One would expect the cleaned yam to exhibit a
higher modulus since inter filament friction is expected to have increased.
156
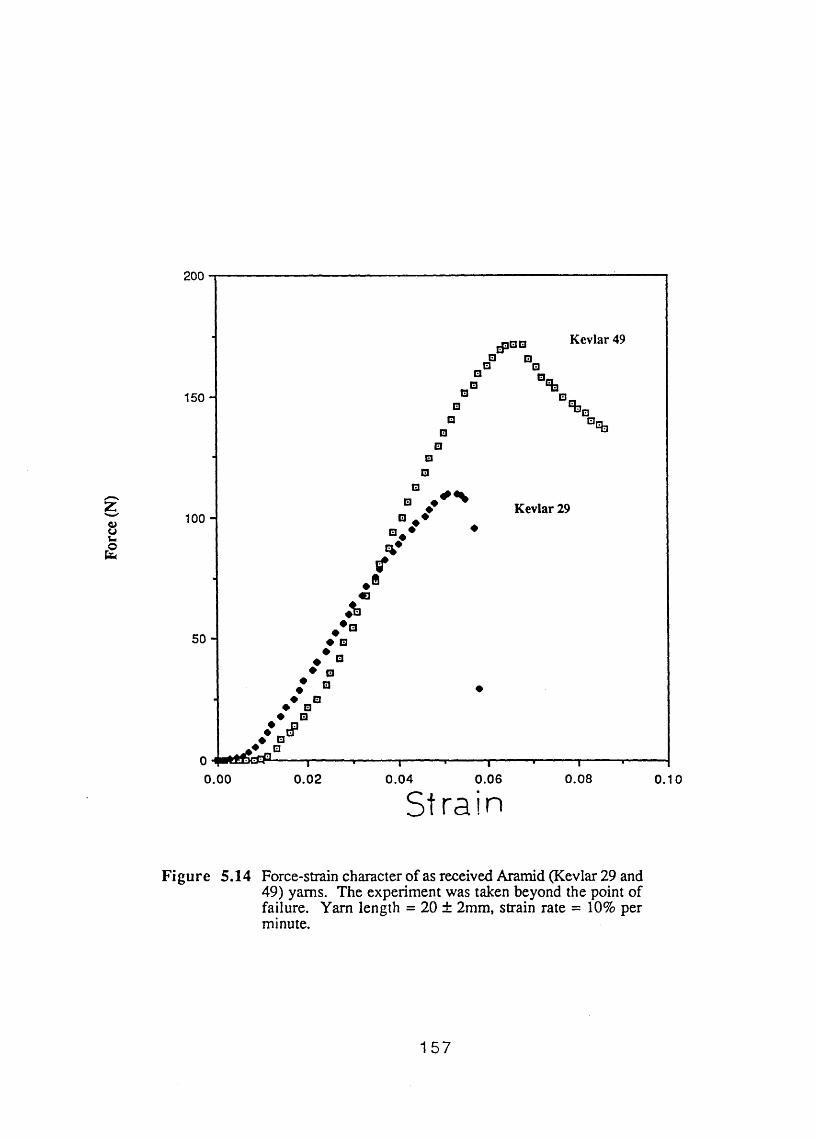
Forc
e (N
)
200
150 -
100 -
50 -
□□
nPQB □ □ □ □Kevlar 49
%
□□
□□
□P / Kevlar 29
&
♦*m
*♦ * ♦ □ ♦ _
♦ □ ♦ □♦ □• V
*♦* oH^4l5dEP-
♦ BP
0.00— f— 0.02 0.04 0.06 0.08 0.10Strain
Figure 5.14 Force-strain character of as received Aramid (Kevlar 29 and 49) yams. The experiment was taken beyond the point of failure. Yam length = 20 ± 2mm, strain rate = 10% per minute.
157

TA B LE 5 .5
Aramid 1 yarns Modulus (N) Break force (} j) Break strain
As received 3112 178.8 0.07
Soxlet extracted 2329
5% PDMS 1929
The influence of interfilament friction on yam tensile properties will be used
more extensively in later chapters to explain some of the experimental observations.
5.5 The "hardness" Experiments
This series of experiments involved pushing an indentor into a supported fabric.
The principle of this type of experiment is somewhat similar to the indentation
hardness of metals and polymers, extensively investigated by many workers including
Atkins & Tabor (1965) and Johnson (1985). The system of fibre
assemblies investigated here are somewhat different in that it is difficult, to investigate
the hardness of fabrics (hardness defined as load/area of deformation) because firstly
on removal of the load, the deformation is almost totally recovered. Secondly, the
deformation is almost never confined to one side of the fabric due to the very thin
structure of the assembly. The whole assembly is seen to deform in the fashion of a
point loaded membrane or plate.
A satisfactory means of characterising the load-deformation behaviour of fabrics
is to use the stress-strain characteristics of thin plates. This is discussed in chapter 6.
Here is outlined a series of experiments that were performed on woven
cotton and aramid 1 fabrics (same fabrics as in the pull-out test, see later). Figure 5.15
shows a photograph of the experimental arrangement used to perform these
experiments. The fabrics were held horizontally between two circular mild steel
158

Figure 5.15 Photograph of the "hardness" experimental apparatus.
1 5 9

\
holders. The bottom holder was screwed to two metal pillars which were attached to
the static bottom platen of an Instron tensiometer (Instron 1122). The tension in the
weft yams of the fabric was controlled by applying loads to one side of the fabric
passing over a PTFE roller, while the other side was securely clamped. The
indentors, of various sizes and shapes, were connected directly or through a special
holder to the grip that was attached to the upper movable plate of the Instron. The
small conical indentors used were made of stainless steel, diameter 3.2 mm and
possessing the following angles, conical tips (60°, 90°, 120°, 150°included angle)
and also spherical and flat tips. The large conical indentors were constructed from
perspex, diameter 25.4 mm and angles 60°, 120°; spherical indentors were also used.
The experimental procedure was as follows. The indentor was brought down so
that its tip just touched the surface of the fabric. The cross head speed was then set
and the indentor was caused to move vertically downwards into the tightly held fabric.
The force exerted and the time of travel corresponding to the vertical distance traversed
were recorded by a micro computer. The force measuring and recording systems were
those used in the tensile experiments described previously.
In the case of large indentors, the deformation foot print could clearly be seen on
the under side of the fabric. Observations showed that the deformation zone was not
circular, as one might have expected, but was similar to the type of plastic deformation
that would be produced by a Knoop indentor, Tabor (1970). For the cotton fabrics the
deformation was assymetric with the longer axis along the warp yams, Figure 6.3.
This meant that the contact zone (zone of contact between indentor and fabric) was not
circular but took on a distorted prismatic shape. The deformation was however
symmetrical for the aramid 1 fabrics. The contact cross-sectional area, necessary to
calculate hardness, was measured at known indentor vertical displacements by
estimating the path of contact by counting the number of cross-overs in contact in the
X and Y directions. The projected areas in the plane of the weave at corresponding
160

vertical heights were then calculated assuming the distorted shape to be a
parallelogram. The effect of cone angle on the force displacement characteristics and
contact area was investigated. The effect of size of the fabric holder was also
investigated using holders of internal diameters 100 and 180 mm.
Using the 100 mm ID holder, force-displacement curves were obtained for
cotton fabrics treated with the following: 5% w/w solution of PDMS in petroleum
spirit, solution of 1.4X10⁻⁴, 1.4xl0'3 and 2.7xl0'3 M CTAB in distilled water. The
experiments were performed on dry fabrics after they had been treated for 2 hours in
the solutions at 22 ± 2°C. Again, cones of 60° and 120° were used.
The effect of side tension on the force-displacement profile and contact area of
cotton fabrics was also investigated. Using the 100 mm ID holder and the 120° cone,
loads of 0.5,1.76, 4.12 and 6.5 N were applied to the weft yarns and the
force-displacement profile and the contact areas were measured.
Small indentors were only used with cotton fabrics due to the relative sizes of
the indentor and the fabric's thread spacing. In this case force-displacement profiles
were recorded as well as the force required to penetrate the fabric. Also after
penetration had occurred, the friction between the cylindrical body of the indentor and
that of the contacting yams was measured as a function of vertical distance or time.
The cross-head speed during all the above experiments was fixed at 5mm/min.
Also all the experiments except those at various side tensions, were performed at a
controlled side tension of 4.12 N and a holder of 0.1m diameter. A summary of the
variables studied is given in Table 5.6.
161

TABLE 5.6 Operating Variables in the "hardness" Experiments
(i)Large Cones
Angle
(2)Small Cones
Angle
(3)Side Tension
(N)
(4)Holder dia.
(ID m)
MIN value 60° 45° 0.5 0.1
MAX value 150° 180° 6.5 0.18
Standard value 60° & 120° 4.12 0.1
FABRICS^ Variables Studied
cotton (untreated)Cotton (5% PDMS)Cotton (CTAB)Aramid 1 (as received) Aramid 1 (Soxlet extracted) Aramid 1 (5% PDMS)
1,2, 3 ,4 1 1 1 1 1
5.6 The Ballistic impact experiments
The high speed impact experiments consisted of two separate parts; high speed
photographic studies of the deformed fabric were undertaken and also measurement
were made of the impact and residual velocities. These studies will be described under
separate headings. The fabrics used were as received aramid 1, soxlet extracted
aramid 1 and aramid 1 treated with 5% PDMS. Single layers of fabric were used.
Cotton fabrics could not be used due to their relatively low ballistic strength.
5.6.1 The Measurement of Projectile Velocity
Figure 5.16 shows a photograph of the high speed impact apparatus and Figure
5.17 is a schematic representation of the experimental arrangement. The apparatus
mainly consisted of two parts: a section which drove the projectile, a ball bearing, at
162
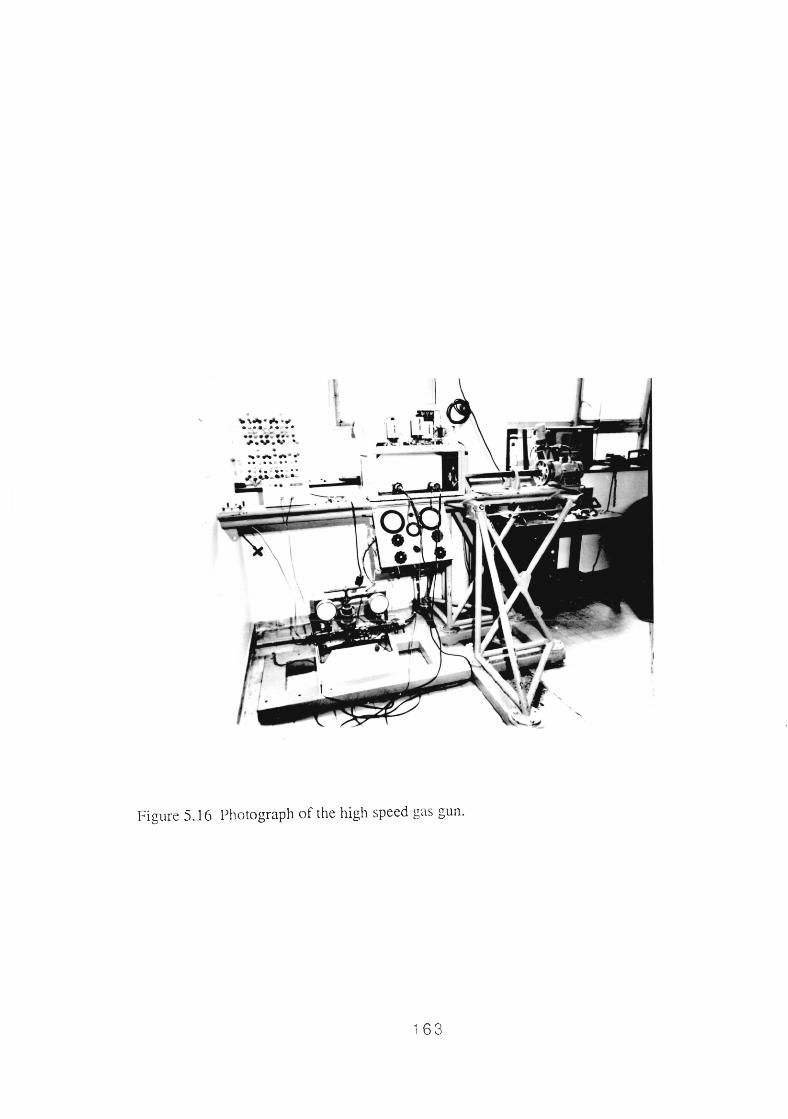
Figure 5.16 Photograph of the high speed gas gun.
163

Figure 5.17 Schematic diagram of the high speed impact arrangement showing the gas gun and the steel protective chamber together with the associated velocity measuring and photography equipment.
FLASH UNIT
G\4
the required speed and another section which contained the fabric and the velocity
measuring devices. The first part included a gas pressure chamber, a 25.4mm
diameter barrel and a stopper at the end of the barrel containing a hole just under
25.4mm diameter. Figure 5.18 shows the relationship between the projectile velocity
and the gas pressure in the chamber. The projectile velocities were found to be quite
consistent at a particular pressure.
The second part, which was enclosed within a protective steel box with two
polycarbonate windows for the purpose of photography, contained the fabric, the
fabric holder and two pairs of infra red emitters and sensors. The sensors were
connected to a digital storage oscilloscope (Gould OS 4000) for projectile velocity
measurement. In these experiments the high speed camera and the associated flash
unit and electronics were not used. The projectiles, stainless steel ball bearings
(6.35mm diameter) which were cleaned with dichloroethane to remove surface grease,
were placed inside a hole at one end of a 25.4mm diameter HDPE (high density
polyethylene) sabot and positioned at the right hand end (figure 5.17) of the barrel
nearest to the pressure chamber.
The fabric was clamped in a circular fabric holder (100mm diameter) and
positioned in the middle of the two sets of sensors. The chamber was then pressurised
to the desired pressure from a nitrogen cylinder (150 to 800 psi). The pressure was
released remotely. The sabot travelled down the barrel where on impact with the
stopper the sabot was arrested and the projectile travelled towards the fabric crossing
over the circuits which triggered the CRO. The impact and exit velocities, if in fact
the projectile penetrated the fabric, were then recorded. A series of experiments were
conducted in this way using impact velocities ranging from 100-250 m/s.
165

300
250 -
<Z3
5 200 -
o- 150 H
o
u0)of-l
Clh
100 -
50 -
T T T200 400 600 800 1000
Gas pressure (psi)
Figure 5.18 Projectile velocity in the ballistic experiments as a function of gas pressure in the gas gun.
166
5.6.2 The High Speed Photography of the Impact Process
Figure 5.17 shows the schematic arrangement of the camera and the associated
electronics. The high speed photography was carried out using an Imecon camera
(Hadland Photonics 790) in conjunction with an electronic delay and a flash unit. The
camera was set at 2.5x10⁴ frames per second of which about 10 frames appeared on
the "Polaroid" film capturing the action at 40}is intervals. As the projectile passed over
the first sensor in the first pair, the electronic delay was activated to trigger the flash
and the camera. The settings on the delay were adjusted according to the projectile
speed which depended on the pressure in the chamber. In this way a series of
photographs of the ballistic impact of the fabrics and the deformation zone as a
function of time were taken. These experiments were performed for both treated and
untreated aramid fabrics and the results are presented in chapter 7.
5.7 The Yam Pull-Out device
5.7.1 Testing the Untreated Fabrics
The yarn pull-out machine has been described previously, Sebastian e t a l
(1986,1987). The machine consisted of two parts: the force measuring device (FMD)
and the optical weave deformation/displacement monitoring system. Figure 5.19
depicts a photograph of the whole arrangement and Figure 5.20 shows a photograph
of the force measuring device. The FMD and the optics were enclosed in a perspex
chamber where the temperature and humidity could be controlled. The temperature of
the chamber during all the pull-out tests was maintained constant at 22 ± 2°C using a
mercury bulb contact thermometer. The relative humidity of the chamber was also
controlled at 45 ± 5% using a saturated solution of potassium carbonate
167

Figure 5.19 Photograph of the apparatus used in the pull-outexperiments including the enclosed chamber containing the force measuring device, and the video recording measurement facilities.
Figure 5.20 Photograph of the force measuring device showing the clamped fabric, in the movable stage, the hook, the phosphur bronze springs and the linear displacement transducer.
168
\%v

(K2CO3.2H2O) which yielded a relative humidity of 43% for temperatures between
20-25°C in a closed chamber.
The force measuring device consisted of a lower and an upper part. The lower
part was a movable stage attached to a stepper motor (manufactured by Aerotech Inc.,
USA) which drove the stage horizontally. The speed of the stepper motor was
adjustable. A piece of fabric was clamped horizontally onto the stage using four stiff
rubber clamps.
Connected to the lower part was a simple system by which the tension of the
cross-over yam was controlled and varied. It consisted of a PTFE roller connected to
the side of the stage. A fabric of size 15 x 10 cm was clamped at one end and hung
over the roller at the other end. To this end was connected another clamp that extended
the length of the fabric using selected weights which were attached to this clamp. The
weight was applied to the cross-over yams (weft yams) for about 5 minutes and then
the other sides of the fabric were clamped. The pull-out experiment was then
performed immediately to minimise stress relaxation in the fabric. The weights or side
tensions applied were varied from 0-6.5 N. The stage velocity was kept constant
throughout all the experiments at 2.9 mm/min.
Figure 5.2 is a line drawing of the upper part of the force measuring device. It
consisted of two thin phosphor-bronze springs (B) of equal size and thickness. The
effective length and hence the flexibility or sensitivity of the springs to the applied
force could be varied by positioning the slider D as required. Also, larger forces could
be sensed by using thicker springs possessing smaller compliances. A typical value
for the compliance of the springs, obtained by measuring the displacement of the hook
(k) with a known applied force, was 5x 10 " m/N. The two springs were firmly fixed
to a metal frame using the clamps (C). The ends of the springs which were free to
move were attached to a metal frame (A), to which the hook (k) was connected. The
169

horizontal movement of the spring system was monitored by a linear displacement
transducer (Sangamo Transducers) which was calibrated previously using known
forces. The signal from the transducer was amplified by a signal amplifier (Sangamo,
Gemini) and fed to a chart recorder.
The experimental procedure for a typical experiment was as follows. After the
fabric was clamped in position, a single warp yam from the fabric was chosen such
that it was positioned directly below and in line with the hook (k). It should be noted
that in all tests on cotton the warp yam was chosen as the pull-out yam and side
tensions were applied to the weft yams. One end of the chosen yam was then cut and
tied to the hook. The other end was also cut so as to leave a yam of such a length that
it crossed an arbitrary 20 weft yams. 20 cross-over or junctions were arbitrarily
chosen because this number produced satisfactory and easily measurable forces and
deformation characteristics. The stage was then set into motion and the yam pulled out
of the weave.
Directly above the stage was placed a high resolution black and white television
camera (National Panasonic WV-1800/B) fitted with a Cannon zoom lens, in such a
way that the entire pull-out process could be recorded. Illumination of the fabric was
achieved using a 40 W circular fluorescent tube. The output from the camera was fed
to a video timer (For-A co., VIG-33F) where the lapsed time (1/10 sec increments)
was superimposed onto each frame. The output from the timer was recorded on
magnetic tape using a professional video recorder (Sony U-matic VO-5630).
Recording the experiment enabled the subsequent freezing of the pictures for the
analysis of the deformation patterns. The hardware involved for this purpose
comprised of an Apple lie computer and paddles, a TV monitor, a time base corrector
and synchroniser (CEL Electronics Model P147), and an electronic programmer
(Viscount 1107, Canada). The use of the timer enabled the recorded pictures to be
related in real time to the force measurements on the chart recorder. Figure 5.21 shows
170

the schematic arrangement of this apparatus.
By employing the appropriate software it was possible to digitise the location of
a cross wire onto the TV screen into X and Y coordinates. The signal from the
computer and that from the video recorder were synchronised and stabilised in the time
base corrector. These signals were then electronically mixed in the electronic
programmer and appeared on the TV monitor.
The accuracy of the location of the cross-wire depended on the magnification of
the image. However, in the case of experiments with dry cotton, the effective
resolution was approximately 0.05mm. The two paddles enable the movement of the
cross wire across the screen to this level of spatial precision.
The procedure described above was used on dry untreated cotton fabric and the
effect of side tension was examined. The same procedure was used for dry, untreated
aramid and the effect of the number of contact junctions on frictional force as well as
the effect of varying the side tension were examined. Two types of weaves for the
untreated aramid were examined, a simple weave of aramid 2 which was several years
old and a "new” twill fabric of aramid 1. The effect of side tension was only examined
on the aramid 1 fabric and the simple weave aramid 2 was only studied at nominally
zero lateral or side tension.
5.7.2 The Pull-out Test on Treated Fabrics
Two different kinds of experiments are now described. Experiments were
performed with the fabric totally submerged under the treating liquid. In addition,
experiments were also performed on fabrics of cotton or aramid 1 that had undergone
treatment and were subsequently dried. The former was only performed on cotton
fabrics.
171

Figure 5.21 Schematic diagram of the set up used to measure the force and video record the deformation of the fabric matrix during the pull-out experiment.
172
5.7.2.1 The submerged fabric technique
The experimental arrangement was exactly the same as that used for the
untreated dry fabrics, except the movable stage was adapted so that the pull-out test
could be performed on submerged fabrics. This was achieved by using 3 slim
rectangular pieces of transparent plastic (perspex) which fitted on top of each other.
Two out of three had large rectangular holes in the centre. The piece without the hole
(~ 3mm thick) was screwed to the movable stage. A cotton fabric of size about 10x7
cm was sandwiched between the two pieces with the holes (about 6mm and 3mm
respectively) and screwed down to the first piece. In this way, a small pool was
created with the fabric hanging 6mm above the bottom and 3mm below the top of the
chamber. The liquid was then poured into the cavity, covering the fabric totally.
Leaks were prevented by introducing thin deformable plastic sheets between the
perspex pieces.
The intrinsic design of the above prevented the control of side tension as
previously described. This was achieved by using a stainless steel rod of dia. 5mm
and weight 56 g formed into a rectangle that fitted inside the rectangular hole of the top
perspex piece and rested on the outer edges of the fabric. In this way, the same
amount of constant tension was put on all yams making them taut. The temperature in
these systems were again controlled to 22 + 2°C.
Cotton fabrics were submerged under four different liquids or solutions under
varying conditions and the results were compared with both the untreated case and
each other. It should be pointed out that the experiments on the untreated fabric in the
adapted system were also carried out, as standards for comparison.
Cotton fabrics were immersed under water for 0.5, 2, 5 and 23 hours prior to
the pull-out experiment. The alkane n-tetradecane (CH3.(CH2) i2-CH3, mol. wt.
198.39, min. assay 99%), was also used for 0.5 and 2 hours. The cotton fabrics were
173
also submerged under a solution of stearic acid in n-tetradecane at concentrations of
0.1 and 0.2% w/w. In this case the solution temperature had to be raised to dissolve
all the stearic acid in the tetradecane. The fabrics were equilibrated in the solutions for
0.5 hour prior to experimentation. Also, a 4.5xl0"4 M solution of CTAB was used
for 2 hours prior to the pull-out experiment.
In this series of experiments the velocity of the stage was again 2.9mm/min. At
this low velocity there was no sign of the liquid being disturbed by the movement of
the stage. Also, the effect of the liquid surface tension on the hook and the transducer
were minimal.
5.7.2.2. The dry treated fabric technique
This series of experiments were performed both on the cotton and the aramid
fabrics. The cotton fabrics were studied in the adapted form of the yam pull-out
machine and the influence of tension was not studied. The influence of PDMS and
CTAB at various solution concentrations were also studied. The cotton fabric was
immersed in a solution of PDMS of viscosity 100 cp in petroleum spirit at varying
concentrations of 2, 3, 5, 7, 10% w/w, for 2 hours. More information on the
properties of these fluids are given by Panesar (1986). The fabric was then taken out
of solution and drip-dried in air for 30 min. during which time all of the solvent
evaporated. A similar procedure was adopted for the CTAB where solutions of CTAB
in distilled water of molarities 1.37xl0'4, 1.37xl0'3 and 2.74xl0‘3 M were used.
These treatments were performed in a closed dish and the dish was kept in a closed
chamber at a temperature of 22 ± 2°C for the entire period of the treatment. The fabric
was then drip-dried overnight in the closed chamber where temperature and humidity
were controlled throughout the drying process. The unwashed aramid 1 was treated
174
with 5% w/w PDMS. The aramid 1 was also washed (Soxlet extracted with acetone)
in order to remove the surface finishes. The washed aramid 1 was then treated with a
solution of 5% PDMS in petroleum spirit and also tested.
5.8 The Vertical Micro-Discplacement Measurements
In the pull-out experiment described in the previous section, the position of the
hook to wljich one end of the chosen yam was tied was set approximately 4mm above
the undistorted plane of the fabric. This produced a distortion in the weave that was
very similar to that obtained in the "hardness" and the ballistic experiments. It was also
an experimental requirement to avoid the distortion of the weave ahead of the pulled
yam fixture point. This meant that during the experiment, the yam tied to the hook
entered the weave at approx. 22° at the start of the experiment and 10° at the end when
the yam was almost totally pulled out of the matrix. A range of experiments were
performed to investigate the effect of this angle on the measured force. Angles of 10,
20 and 30° were chosen and the corresponding forces measured. No significant
difference in the magnitude of the force was observed. Also, the change in pull-out
angle did not affect the linear displacement transducer since the transducer only sensed
displacements in the horizontal direction; that is in the plane of the fabric.
As mentioned earlier, an important effect of the pull-out angle was to lift the
assembly in the vicinity of the pulled yam, i.e. the cross-over yams, above the plane
of the fabric. This displacement increased in magnitude towards the position of the
hook. The phenomenon is depicted schematically in Figure 8.12. This
microdiscplacement was shown to have an important bearing on the interpretation of
the measured values of yam and cross-over displacements/extensions and also on yam
migration within the assembly. A powerful microscope (Zeiss) with a movable stage
175

was used to study these microdisplacements. The cotton fabric (only cotton was used
in these experiments) was fixed onto the stage of the microscope with tape. A chosen
yam was cut at both ends and one end was passed over a pulley and connected to an
appropriate weight, i.e. 0.05, 0.10 or 0.20 N weights. The pulley was positioned
such that the yam pull-out angle was approx. 20° to the fabric plane. The microscope
stage was then moved, without affecting the vertical displacement of the assembly, and
the microscope was focussed onto individual tensile and cross-over yams. The points
onto which the microscope was focussed were the tops of the yams. These points
alternated from the tensile to a cross-over yam respectively. This alternation has an
important bearing on the migration phenomenon discussed later. The vertical distance
required to focus was measured and the heights of yams above the unstressed plane of
the fabric were measured. These experiments were performed for a constant number
of cross-overs. 20, 16 and 15 cross-overs at 0.1 N and 20 cross-overs at 0.05, 0.1
and 0.2 N loads. These experiments were performed on untreated cotton fabrics at
20°C and 40% RH.
176
C H A P T E R S I X
INDENTATION OF TEXTILE STRUCTURES
6.1 Introduction
In this chapter the data obtained by what has been described earlier as the
"hardness experiment" are presented and discussed. The experimental details are
described in Chapter 5. The data in this chapter are intended to serve several
purposes. First, these results provide a means of probing fibre and inter-fibre
properties at relatively low strains. The pull-out test is most satisfactory for sensing
high inter-fibre strains, and is described in Chapter 8. The low strain data analysis
(elastic response) is complicated in the pull-out experiments by the out of plane
deformations. It will be seen that this deformation produces a nearly pyramidal out of
plane deformation at high forces on the pulled yam. In this chapter similar out of
plane deformations are created with an indentor. Thus, we have two reasons to pursue
this type of deformation. First, the data may be compared with pull-out data and also
the study offers an alternative means of obtaining these data. The latter is the second
reason for the study. Finally, chapter 7 describes ballistic studies of fabrics using
spherical projectiles. In that chapter the main emphasis will be upon computing the
energy dissipated on impact. The hardness studies described in this chapter provide
data on the quasi-static analogue and in particular a direct means of investigating the
influence of fabric treatments.
The chapter is divided into several parts. The earlier parts deal with the
reversible or elastic response of cotton and aramid systems. The major emphasis is
upon the description of the main system variables such as fabric pretension, indentor
shape and supported fabric area and the contributions of the bending and the stretching
177

processes to the total deformation. The general form of the force-displacement and
force-geometry of deformation characteristics are described. The effects of certain
fabric treatments are also presented. These data are treated in the first instance as
hardness data, although it is recognised that the analogy with a hardness deformation
may be potentially misleading. Also experimentally the concept is not totally applicable
to fabrics since it is usually recommended that the depths of penetration should not
exceed 1/10 the thickness of the specimen and similarly the diameter of the
deformation should not exceed 1/10 of the diameter of the specimen. In the case of this
thesis, because of the compliance of the fabrics, the penetration extended a
considerable distance beyond the thickness of the fabric. Typically, the cotton fabrics
were 0.06mm thick and the penetration distance were 20mm. Also, the diameter of the
indentor was typically 25.4mm and that of the specimen was 100mm. However, it
was considered to be interesting to see if a fabric behaved in a similar way to a solid
under normal planar loading. It should be pointed out that the behaviour of the fabrics
under planar loadings are treated in a different and a more realistic manner later.
This approach does however have the advantage that terminology adopted in
hardness studies may be used. Also, there are apparent similarities between the current
data and bulk hardness data which are subsequently explored. A later section of this
chapter develops a plate deformation model which provides a remarkably good
description of certain facets of the data to be presented.
The material introduced so far deals primarily with the elastic or reversible
response of the chosen system. A short section also considers more extreme levels of
penetration similar to those produced in the high force regimes of the pull-out
experiment and also during projectile transit in the ballistic experiments.
In summary, this chapter provides a range of data which have implications in
the interpretation of the pull-out data and the ballistic data to be described in later
chapters.
178

6.2 Indentation of Untreated Fabrics
6.2.1 Introduction
This section presents the results of the indentation experiments performed on
untreated cotton and aramid 1 fabrics. A range of variables have been studied including
the effect of side tension, indentor shape or angle and the fabric holder size. The
"hardness" values computed are described for the various parameters investigated.
6.2.2 The Response Characteristics of the Cotton Fabrics
6.2.2.1 The effect of weft vam tension
These experiments were performed to examine whether varying the weft yam
tension had any influence on the force vs vertical displacement distance or
force-contact area profile of the fabric. Here, the holder size was 100mm in diameter
and the indentor was a perspex cone of angle 120°. Figures 6.1 and 6.2 illustrate the
results. Figure 6.1 also shows a typical force-displacement response of a fabric in an
indentation experiment. The measured force increases very slowly initially as the
penetration is increased. This region is probably associated with the conical indentor
penetrating into a small area in the fabric and the uncrimping of the yams themselves.
Observations show that the deformation is in fact elastic since on removal of the force
the fabric returns to its original flat shape. As the displacement increases the force
suddenly increases rapidly at a particular imposed displacement At this point the area
immediately adjacent to the cone is deformed more extensively. The area of contact is
however not at the maximum value. The force-apparent contact area curve has a
similar form.
It is observed that the shape of the deformation zone resembles that of a Knoop
indentation. The deformation is highly anisotropic along the warp and weft directions
with the longer axis along the warp yams. However, the zone of actual contact
179
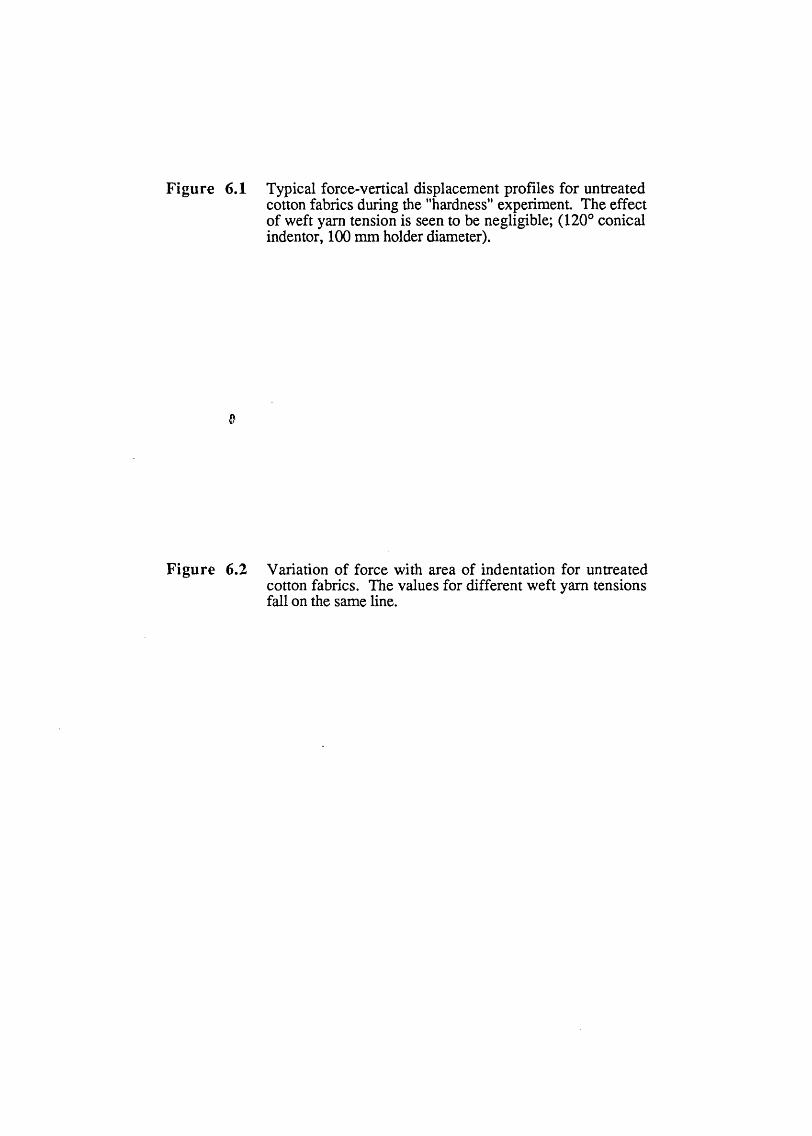
Figure 6.1 Typical force-vertical displacement profiles for untreated cotton fabrics during the "hardness” experiment The effect of weft yam tension is seen to be negligible; (120° conical indentor, 100 mm holder diameter).
0
Figure 6.2 Variation of force with area of indentation for untreated cotton fabrics. The values for different weft yam tensions fall on the same line.
15.0
+ T=51« T=180■ T=420« T=663
180
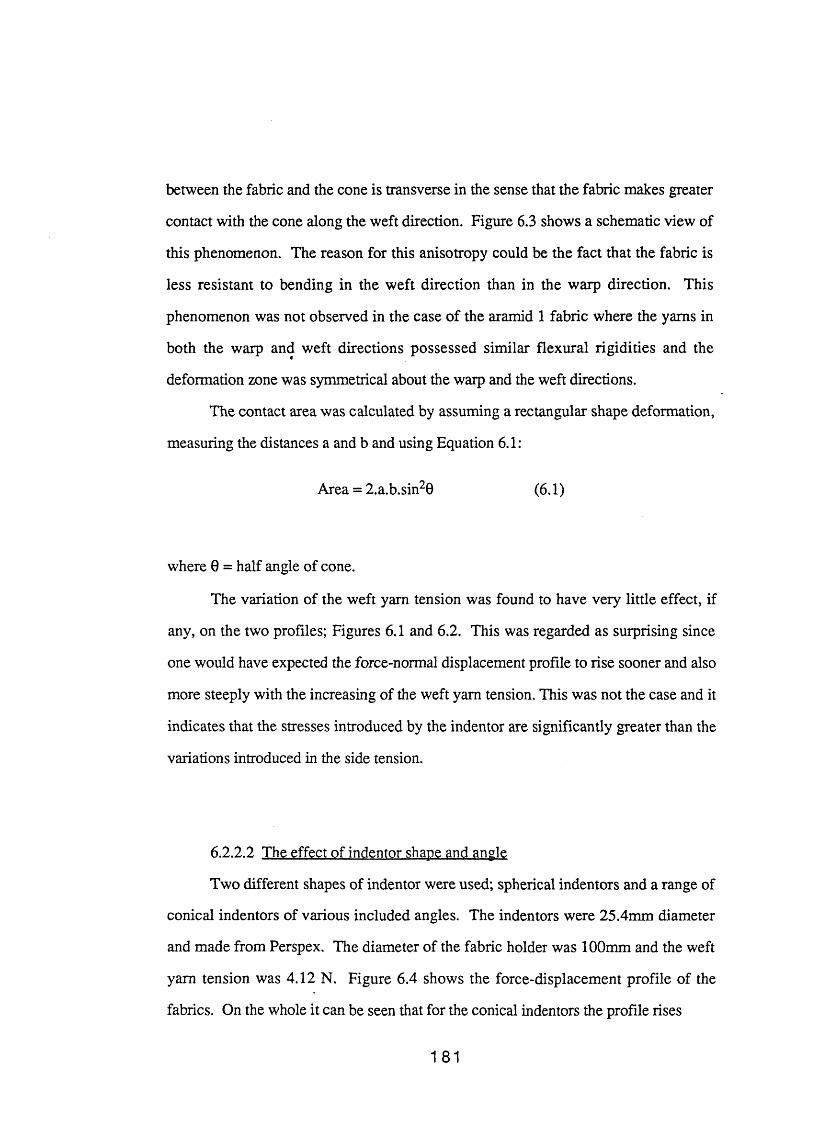
between the fabric and the cone is transverse in the sense that the fabric makes greater
contact with the cone along the weft direction. Figure 6.3 shows a schematic view of
this phenomenon. The reason for this anisotropy could be the fact that the fabric is
less resistant to bending in the weft direction than in the warp direction. This
phenomenon was not observed in the case of the aramid 1 fabric where the yams in
both the warp and weft directions possessed similar flexural rigidities and the
deformation zone was symmetrical about the warp and the weft directions.
The contact area was calculated by assuming a rectangular shape deformation,
measuring the distances a and b and using Equation 6.1:
Area = 2.a.b.sin20 (6.1)
where 0 = half angle of cone.
The variation of the weft yam tension was found to have very little effect, if
any, on the two profiles; Figures 6.1 and 6.2. This was regarded as surprising since
one would have expected the force-normal displacement profile to rise sooner and also
more steeply with the increasing of the weft yam tension. This was not the case and it
indicates that the stresses introduced by the indentor are significantly greater than the
variations introduced in the side tension.
6.2.2.2 The effect of indentor shape and angle
Two different shapes of indentor were used; spherical indentors and a range of
conical indentors of various included angles. The indentors were 25.4mm diameter
and made from Perspex. The diameter of the fabric holder was 100mm and the weft
yam tension was 4.12 N. Figure 6.4 shows the force-displacement profile of the
fabrics. On the whole it can be seen that for the conical indentors the profile rises
181

Weftdirection
Figure 6.3 Schematic diagram of the deformations produced during fabric indentation. For cotton the deformation zone was asymmetric about the warp and weft directions, while for the Aramid fabrics the deformation zone was symmetrical.
182

V e rtic a l d isp lacement (m m )
Figure 6.4 Comparison of the response of untreated cotton fabrics toindentors of differing angles in the "hardness" experiments (100 mm holder).
183

more steeply with the increase with cone angle. The behaviour of the fabric under a
spherical indentor is also shown.
The trend in Figure 6.4 may be explained using the results presented in Figure
6.5. In this figure, force is plotted against area at the same vertical displacements.
The contact area increases very rapidly with increasing cone angle for comparable
applied loads. Hence, the cones with the greatest included angles produce the stiffest
response. The gradient of the force against area graphs is a measure of the "hardness"
of the material. This aspect of the data is discussed later.
6.2.23 The effect of fabric holder size
Two sizes of fabric holder were used, 100mm and 180mm in diameter. The
untreated cotton fabrics were tightly clamped around the edges. The weft yam tension
in the case of the 100mm holder was 4.12 N. However, in the case of the 180mm
holder, the number of yams in the weft direction was 1.8 times that of the 100mm
fabric, ca. 270 yams. Thus, in order to maintain a similar tension in the weft yams,
the total load on the weft yams was increased by 1.8 times to 7.35 N.
Figure 6.6 shows the force-displacement profiles of cotton fabrics using 60°
and 120° cones and the 100 and 180mm holders. As before, the resisting force for the
120° cones are higher than those for the 60° cones at a similar displacement value.
Also, the curves for the 100mm holder are steeper than those for the 180mm holder.
The apparent contact area is much greater for the larger holder at similar force levels,
as shown in Figures 6.7 and 6.8. The force-displacement and the force-area profiles
are at first sight contradictory since one would expect a greater resistance to penetration
of the cone as the contact area increases. This contradiction indicates that the
compliance of the whole weave to normal penetration is very sensitive to the total size
184
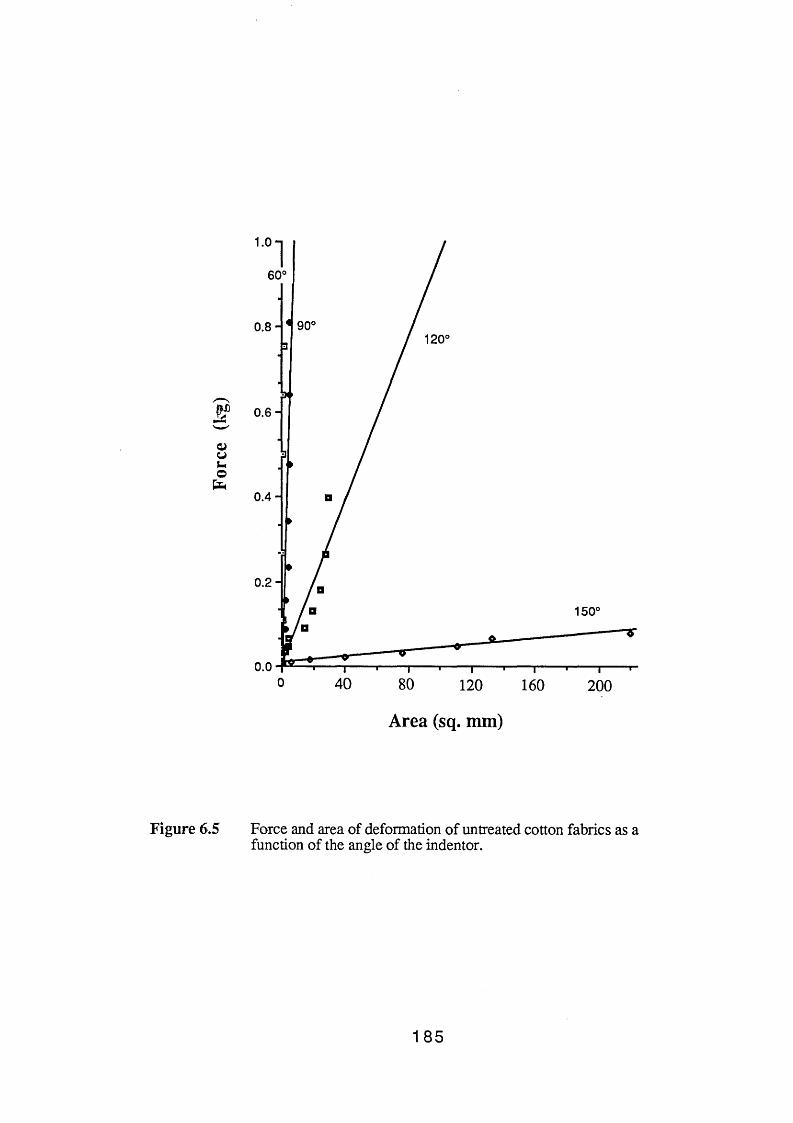
A rea (sq. m m )
Figure 6.5 Force and area of deformation of untreated cotton fabrics as a function of the angle of the indentor.
185
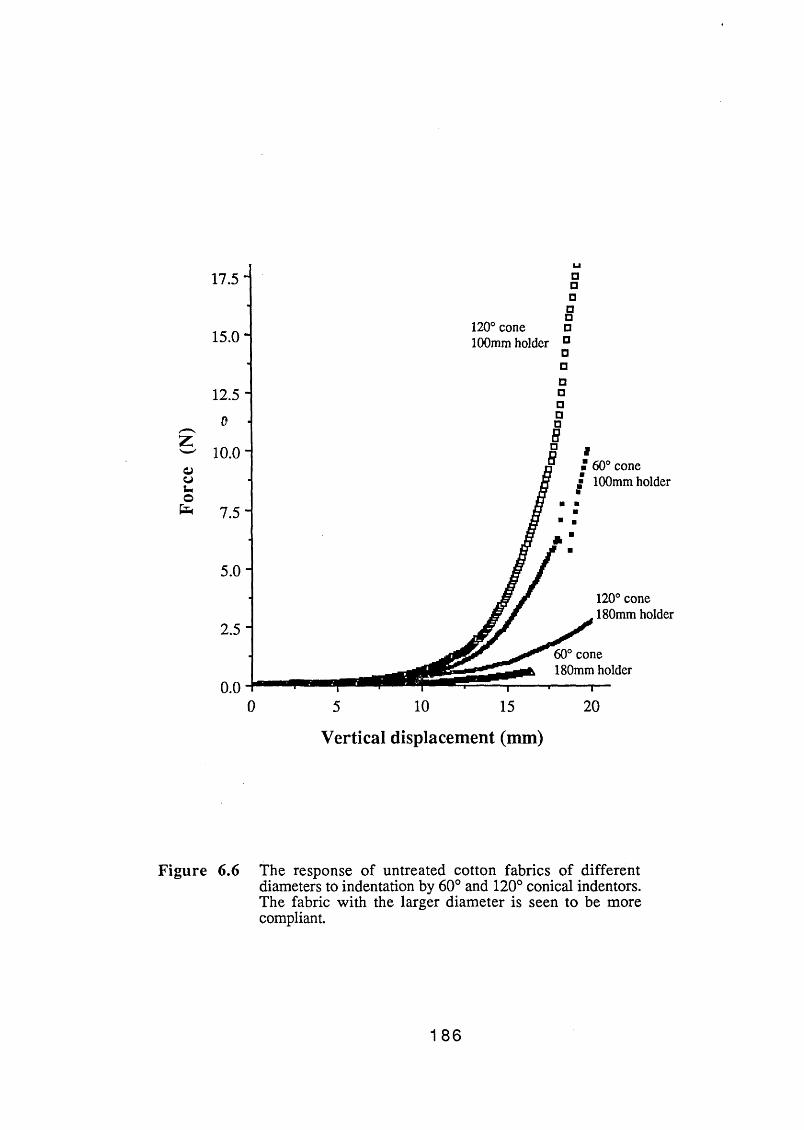
Forc
e (N
)
V e r t ic a l d isp lacement (m m )
Figure 6.6 The response of untreated cotton fabrics of different diameters to indentation by 60° and 120° conical indentors. The fabric with the larger diameter is seen to be more compliant.
186

Figure 6.7 The effect of fabric holder diameter on the deformation zone area of untreated cotton fabrics using 60° conical indentors.
Figure 6.8 Force and area of deformation of untreated cotton fabrics as a function of fabric holder size using 120° conical indentor.
Forc
e kg
0.4 0.8 1.2 1.6
Area sq.mm
Area sq.mm
187

of the supported weave. The weave becomes extremely compliant with increasing size
despite the fact that the fabric makes a larger contact area with the cone.
6 .2 .2A Calculation of a "hardness*1 value
Hardness is defined as the ratio of the load applied to the projected area of
deformation. This quantity is actually equal to the gradient of the force-area plot.
Table 6.1 presents values of the gradients of such plots. It can be seen that the
gradient decreases with increasing of both the cone angle and the supported fabric
diameter.
TABLE 6.1: Hardness Values fKg/mm2! as a Function of Cone Angle and Fabric
SizeHolder dia. (mm)
Cone angle 0 (deg.) 100 18060° 2.13 0.12890° 0.204 -
120° 0.01 0.003150° 0.0003 -
It is common to plot the hardness number as a function of tan (3 where p = (tt-0) / 2
and 0 is the cone angle, Figure 6.3. Figure 6.9 is such a plot. The shape of Figure
6.9 is very similar to the elastic region of the normalised mean pressure vs. strain plot
of Figure 6.10 for the hardness of a homogeneous body, Johnson (1985).
188

Figure 6.9 A plot of the hardness value again tan p where
p = (¥> ■0 being the indentor angle.
Figure 6.10 Indentation of an elastic-plastic half space by spheres and cones. Small dashed line - elastic: A cone, B sphere. Solid line - finite elements. Chain line - cavity model: F cone, G sphere. Large dashed line - rigid-plastic. Reproduced from Johnson (1985). The fabric with the larger diameter is seen to be more compliant.
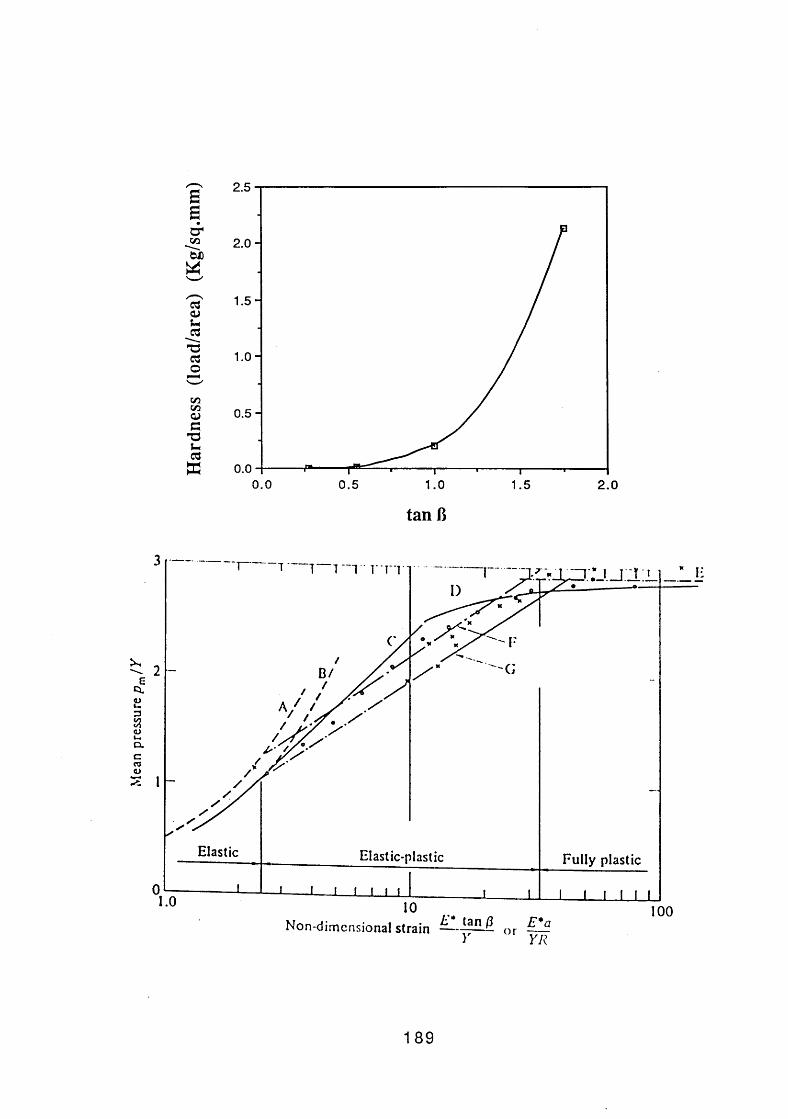
Har
dnes
s (l
oad/
area
) (K
g/sq
.mm
)
189
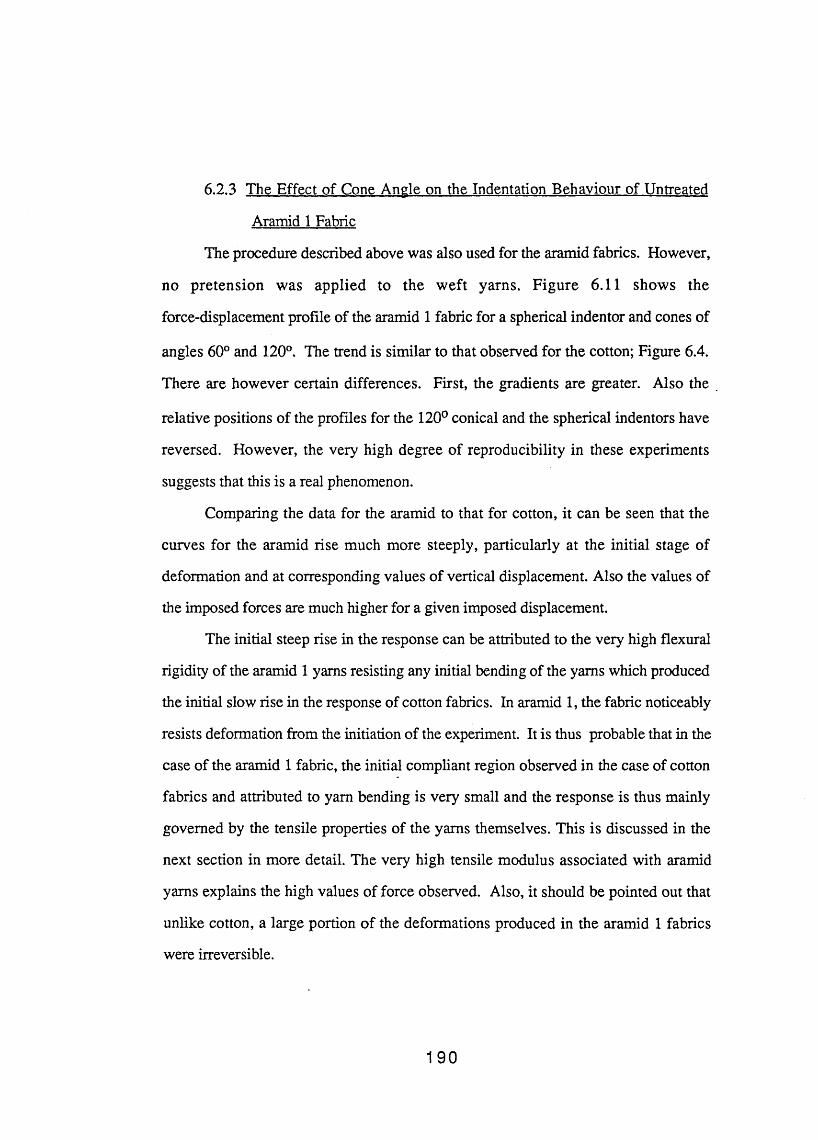
6.2.3 The Effect of Cone Angle on the Indentation Behaviour of Untreated
Aramid 1 Fabric
The procedure described above was also used for the aramid fabrics. However,
no pretension was applied to the weft yarns. Figure 6.11 shows the
force-displacement profile of the aramid 1 fabric for a spherical indentor and cones of
angles 60° and 120°. The trend is similar to that observed for the cotton; Figure 6.4.
There are however certain differences. First, the gradients are greater. Also the
relative positions of the profiles for the 120° conical and the spherical indentors have
reversed. However, the very high degree of reproducibility in these experiments
suggests that this is a real phenomenon.
Comparing the data for the aramid to that for cotton, it can be seen that the
curves for the aramid rise much more steeply, particularly at the initial stage of
deformation and at corresponding values of vertical displacement. Also the values of
the imposed forces are much higher for a given imposed displacement.
The initial steep rise in the response can be attributed to the very high flexural
rigidity of the aramid 1 yams resisting any initial bending of the yams which produced
the initial slow rise in the response of cotton fabrics. In aramid 1, the fabric noticeably
resists deformation from the initiation of the experiment. It is thus probable that in the
case of the aramid 1 fabric, the initial compliant region observed in the case of cotton
fabrics and attributed to yam bending is very small and the response is thus mainly
governed by the tensile properties of the yams themselves. This is discussed in the
next section in more detail. The very high tensile modulus associated with aramid
yams explains the high values of force observed. Also, it should be pointed out that
unlike cotton, a large portion of the deformations produced in the aramid 1 fabrics
were irreversible.
190
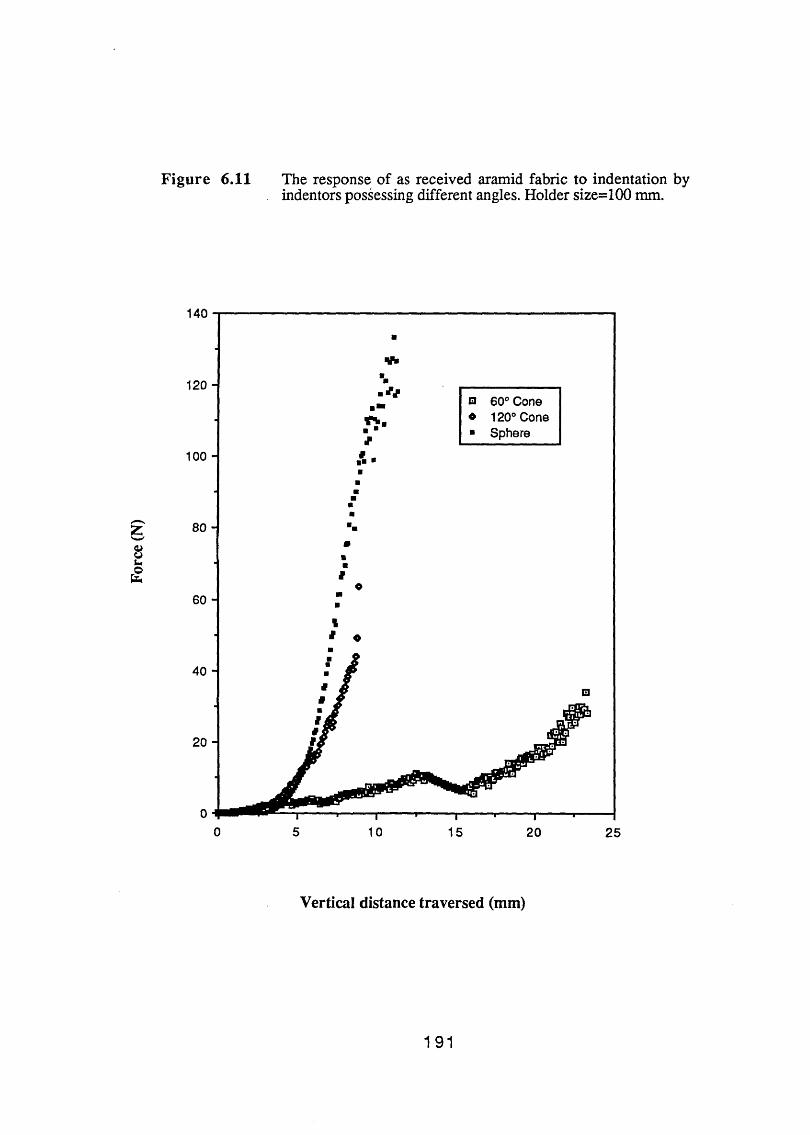
Forc
e (N
)
F igure 6.11 The response of as received aramid fabric to indentation by indentors possessing different angles. Holder size=100 mm.
Vertical distance traversed (mm)
191
6.2.4 Bending Against Stretching in Fabric Indentation
Figure 6.3 shows schematically the shape of the deformation plate both from
the side and from above. The asymmetric nature of the deformation for the cotton
fabrics has been noted earlier; the longer contact axis was in the warp direction. What
is also evident from figure 6.3 is that the indentation deformation produced involves
elements of bending and stretching to different extents. As was discussed in the
previous section observations show that initially the deformation is produced through
bending of the fabric and then stretching takes over, perhaps for the majority of the'
vertical deformation distance. Using the measured values of the parameters a and b
(figure 6.3) an attempt has been made to quantify in a fairly simple manner the relative
contributions of the processes of bending and stretching involved. Because there was
no clear, distinctive and measurable length which could be uniquely attributed to either
the bending or the stretching phenomena, it was decided to make the assumption that
large bending contributions would yield a higher value for the ratio h/y; figure 6.3.
That is a larger part of the weave would be in contact with the indentor if bending
contributions were significant. Figures 6.12 shows the variation of the ratio h/y with
vertical displacement y. It can be seen that, on this basis, greater bending occurs with
larger angle conical indentors both for the 100 and 180mm fabric holders. Also greater
bending can be observed with smaller holder sizes.
The asymmetry of the deformation zone, figure 6.3, is an indication of the
differences in the extents of the bending and hence the stretching in the warp and the
weft directions. There is less bending and more stretching in the warp direction and
vice versa in the weft direction. Infact, the yams along the waip direction may be said
to be more stiff in bending than those in the weft direction. It is of interest to examine
where the fabrics under study lie between the extremes of the bending of very stiff and
stretching of very compliant fabrics. Figures 6.13 and 6.14 show theoretical cases of
very stiff and very compliant fabrics respectively together with the experimental data
192

Ratio
h /
y
V e rtic a l d isp lacement o f in den to r
Figure 6.12 Variation of the ratio h/y with vertical displacement for different cone angles and fabric holder siz e s.
193
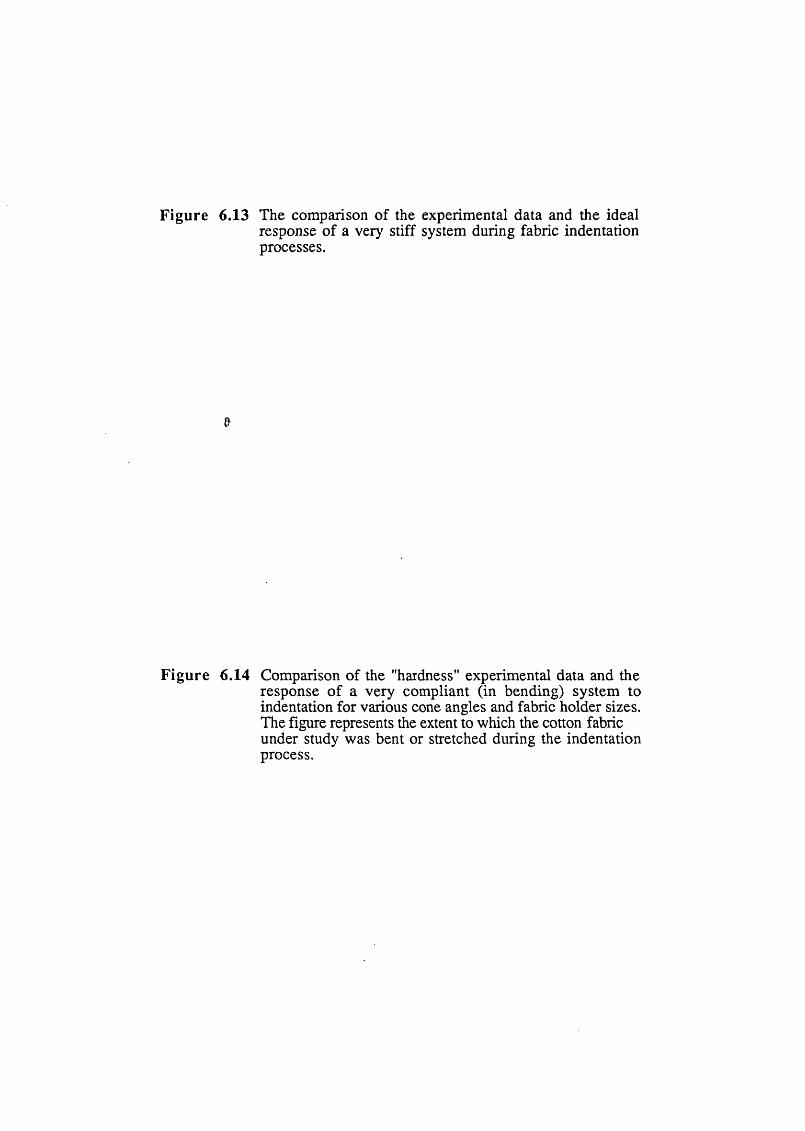
Figure 6.13 The comparison of the experimental data and the ideal response of a very stiff system during fabric indentation processes.
0
Figure 6.14 Comparison of the "hardness" experimental data and the response of a very compliant (in bending) system to indentation for various cone angles and fabric holder sizes. The figure represents the extent to which the cotton fabric under study was bent or stretched during the indentation process.

1.o - i
a
0.8 -
0.6 -
0.4-
0.2 -
0.0
♦♦♦ ♦
♦ ♦
□ ♦
oo ■
. . | 1 i i 1,1 p r i | i r |" i0.0 0.2 0.4 0.6 0.8
y / R tan 0 J h
Stiff system response
— i— r
1.0
□ 60°cone, 100
♦ 120°cone,100■ 150°cone,100
o 60°cone,180■ 150°cone,180
1.2
1.2-
i.o - -------------------- v compliant system response
□ 60°cone, 1000.8" ■ ♦ 120°cone,100
■ ■ ■ ■ 150°cone,100jz 0.6 - ■ ♦ + o 60°cone,180♦ ♦
■ ■ ♦ ■ 150°cone,180
o
o
o
o
k>
4j _
•_i_i_
i_._i_ ♦ ♦
♦ ♦n ♦ ♦
■ ■ ■ ■H n g B Dogg . .
o ■----------1----------1----------i---------- 1----------1----------1
0.0 1.0 2.0 3.0y / R ctan 0
194
for the current system. The geometric parameter (y/R)tan0 is chosen in each case such
that it represents the response of the two extreme cases. The significance of the
parameter is different in each case since h/y starts to be operative at a different value of
the above parameter. In the case of the stiff system h/y is zero until the parameter
(y/Rh)tan0 reaches unity and then it increases to an unknown value of h/y before
decreasing slowly. For the compliant system, h/y starts and remains at a value of one
until the parameter (y/Rc)tan0 reaches unity at which point h/y decreases slowly. What
these figures show is that the current system lies somewhere between a totally stiff and
a totally compliant behaviour.
6.2.5 Conclusion
The response of cotton and aramid 1 fabrics to planar loading has been
examined. The variations in weft yam tension seem to have little effect on the
response. However, the shape and angle of indentors have a pronounced effect on the
fabric deformation; the larger the cone angle the larger the hardness values. The size
of the fabric is also seen to affect its response. The smaller the size of the supported
fabric the greater the ’'hardness". The deformations produced were also discussed in
terms of the contributions of the bending and the stretching processes. Aramid 1 fabric
is seen to have a much greater hardness than the cotton both in its initial response and
resistance to deformation. Also, aramid 1 exhibits a reversal in the relative positions
of the profiles of the 120° cone and the spherical indentor. The reason for this reversal
could be that the cotton fabric could accommodate the deformation due to the 120°
conical indentor and that this was reversed in the case of the aramid 1 fabric. These
differences may be explained in terms of differences in bending and tensile
195

characteristics of the constituent yams of the two fabrics (Section 5.4).
6.3 Indentation of Modified Fabrics
6.3.1 Introduction
The response of untreated cotton and aramid 1 fabrics to indentation and the
effect of several variables were described and discussed in Section 6.2. This section
will deal with the response of modified fabrics to the same indentation processes. The
modification was brought about by treating the fabrics with controlled amounts of
PDMS and CTAB. These treatments were the same as those applied to the fabrics in
other experiments and discussed elsewhere in the thesis. This section discusses the
response of modified cotton fabrics first and then that of the modified aramid 1 fabrics.
6.3.2 The Response of Modified Cotton Fabrics
Figures 6.15 and 6.16 show the deformation response of untreated and PDMS
treated cotton fabrics to 60° and 120° conical indentors. In both cases, the curve for
the silicone treated fabric lies below the untreated fabric curve. A similar trend can be
seen with cotton fabrics treated with various concentrations of a solution of CTAB
shown in Figure 6.17. The difference between the untreated fabric and that treated
with the highest concentration of CTAB is the most pronounced. The trend is
explicable in terms of the changes that the PDMS and the CTAB treatments produce in
the properties of the constituent yams of the fabrics. The experimental results
discussed in Section 5.4 show that these treatments reduce the tensile modulus of the
individual yams. It is possible that these treatments will also reduce the flexural
rigidity or bending resistance of individual yams. These two factors, and in particular
the tensile properties of yams, are believed to be the major contributors to the response
196

Figure 6.15 Comparison of the response of untreated and 5% PDMS treated cotton fabrics to the indentation process. (60° conical indentor, 100 mm holder).
Figure 6.16 Comparison of the responses of untreated and 5% PDMS treated cotton fabrics in the "hardness" experiment using 120° indentor and 100 mm holder.

12
£aouofa
8 -
■ Untreated
o Treated(5%si)
6 -
4 -
A
■
/
$2 -
0 — i i t !0 5
n r 1 51 0 2 0
V e rtic a l distance traversed (m m )
197

of the fabrics in indentation.
The area under each curve is a measure of the work of deformation up to a
particular deformation or to penetration. Table 6.2 presents the values of the work
done in deformation for the treated cotton fabrics and compares them with the
untreated case.
TABLE 6.2 : Work Done in Deformation up to 17mm Vertical Displacement
Cone Angle Treatment Work done (60 Untreated 14.560 5% PDMS 7.15
120 Untreated 21.7120 5% PDMS 17.8120 1.4xl04 M CTAB 22.9120 1.4x10‘3 M CTAB 22.2120 2.7xl0'3 M CTAB 12.4
In the case of the 60° indentor, PDMS has reduced the work done by over 50%
and for the 120° indentor by 32%. Low concentrations of CTAB have actually
increased the work done very slightly. This is because at low displacements the curves
for these two cases lie above the untreated curve while it is v ice versa at higher
displacements. On the whole, it can be said that at these low concentrations of CTAB
the treatment has not affected the response significantly and in fact this is reflected in
the results of the tensile tests where low concentrations of CTAB did not affect the
modulus of the yam. However, at fairly high concentrations, 2.7xl0‘3 M, the work
done is reduced by 73%.
198

6.3.3 The Response of Modified Aramid 1 Fabrics
The aramid 1 fabric was Soxlet extracted in acetone to remove the unknown
finishes that had been applied to it during processing. Some of the clean fabric was
then treated in a solution of 5% silicone fluid (poly dimethyl siloxane, viscosity lOOcp)
in petroleum spirit The indentation experiments were carried out using a 120° conical
indentor and a 100mm diameter fabric holder. Figure 6.18 depicts the results of the
"hardness" experiments on the treated aramid fabrics. The results show a very clear
trend in the response of the three systems. The cleaned fabric shows the stiffest
response. Table 6.3 compares the values of the work done (represented by the area
under the curves) to produce a deformation 9mm deep for the three cases. Again, the
trend is obvious with the least work done in the case of the PDMS treated fabrics and
the most work being dissipated for the cleaned fabrics. The value differ by almost a
factor of three.
TABLE 6.3 : Work Done in Deformation u p to 9mm Vertical DisplacementAramid 1 Fabrics Work done (Nmol')Untreated 118.2Soxlet extracted 194.8Treated (5% PDMS) 46.4
6.3.4 Conclusion
The response of treated cotton and aramid 1 fabrics has been examined. In the
case of the cotton, both the PDMS and the CTAB treatments have decreased the
hardness or stiffness of the assembly. Also, the work done in deforming the structure
has been reduced in the treated cases with the 5% silicone treatment requiring a similar
deformation work done to that of the 2.7xl0'3 M CTAB.
199

Figure 6.17 Comparison of the response of untreated cotton fabric to that treated with different concentrations of CTAB solution using 120° indentor and 100 mm holder.
Figure 6.18 Comparison of the response of Aramid (Kevlar 49) fabrics possessing different surface characteristics (clean [soxlet extracted], as received and 5% PDMS treated) to the indentation process. (120° indentor, 100 mm holder).

CJuuoto
■ Untreatedo 1.4E-4M CTAB• 1.4E-3M CTAB♦ 2.7E-3M CTAB
5 1 0
V e rtica l d istance traversed (m m )
u©to
0 5 10 15
V e rtic a l d isplacement (m m )20
200
In the case of the aramid 1 fabric, removal of the process aids increased the
stiffness of the assembly through increasing the inter-fibre friction, while treatment
with PDMS had the reverse effect.
These changes can be attributed to the lubricating effect o f the treatments
whereby the extensile and bending moduli of the yams and the assembly has been
reduced through reductions in inter-fibre and inter-yam friction.
6.4 The Thin Plate Model
In this section a "hardness" model based on the deformation of thin plates will
be presented. In this model, it is assumed that the fabric is in fact a thin coherent
homogeneous solid plate. Standard formulae exist for the deformation of thin plates in
various configurations. These relationships are included and summarised in text
books by Griffel (1968) and Roark and Young (1986). For a circular
plate of uniform thickness, of homogeneous isotropic material and nowhere stressed
beyond the elastic limit where the outer edges are fixed and a uniform load is applied
over a concentric area of radius r0, the maximum deflection at the centre is given by:
3q(l-t)2) 2 .2 , rMax y ---------- t- (4r - 4rQ log — - 3rQ) (6.2)16jiEt ro
where y = vertical deflection of plate from original position, q = unit applied load
(lb/in2), v = Poisson's ratio, E = modulus of elasticity, t = plate thickness and r =
radius of plate. However equation 6.2 only applies if the maximum deflection is not
more than about one-half the thickness of the plate. In this case, the load is mostly
carried through bending stresses at the surface of the plate while the middle surface
remains unstressed. Clearly this is a different situation to the one under study here,
since the deflection of the fabric or the plate is much greater than one-half of the plate
thickness. This situation is dealt with by the thin plate theory where the middle surface
becomes appreciably strained (as is the case here) and the stress in it cannot be
ignored. This stress, called the diaphragm stress, enables the plate to carry part of the
load as a diaphragm in direct tension. If the edges are held, this tension is balanced by
radial tension at the edges. At large deflections, the plate is stiffer than indicated by the
ordinary theory of stress-strain and the load-deflection and load-stress relations are
non-linear^ Roark and Young (1986) propose the following equation for a circularV
plate under a uniform load where the edges are fixed and held:
V V 3 Etq = [k1| + k — * 4.44
wherek, = and = -3l£.
.(6.3)
l1-0)" 1 -V
The factor 4.44 enters the equation when converting lb/in2 to N/m2. Taking the
Poisson ratio \) of the fabric as zero and F= q^Ttr2, the force-maximum deflection
profile of such a plate is thus:
F = [5.33 ^ + 2.6 ( I )3] 13.98 — .....................(6.4)t t 4 v *r
However equations 6.3 and 6.4 are for a uniform load distributed over the
whole of the surface area of the plate. Roark (1965) proposed equation 6.5 for a
square plate with a concentrated centre load when the edges are fixed;
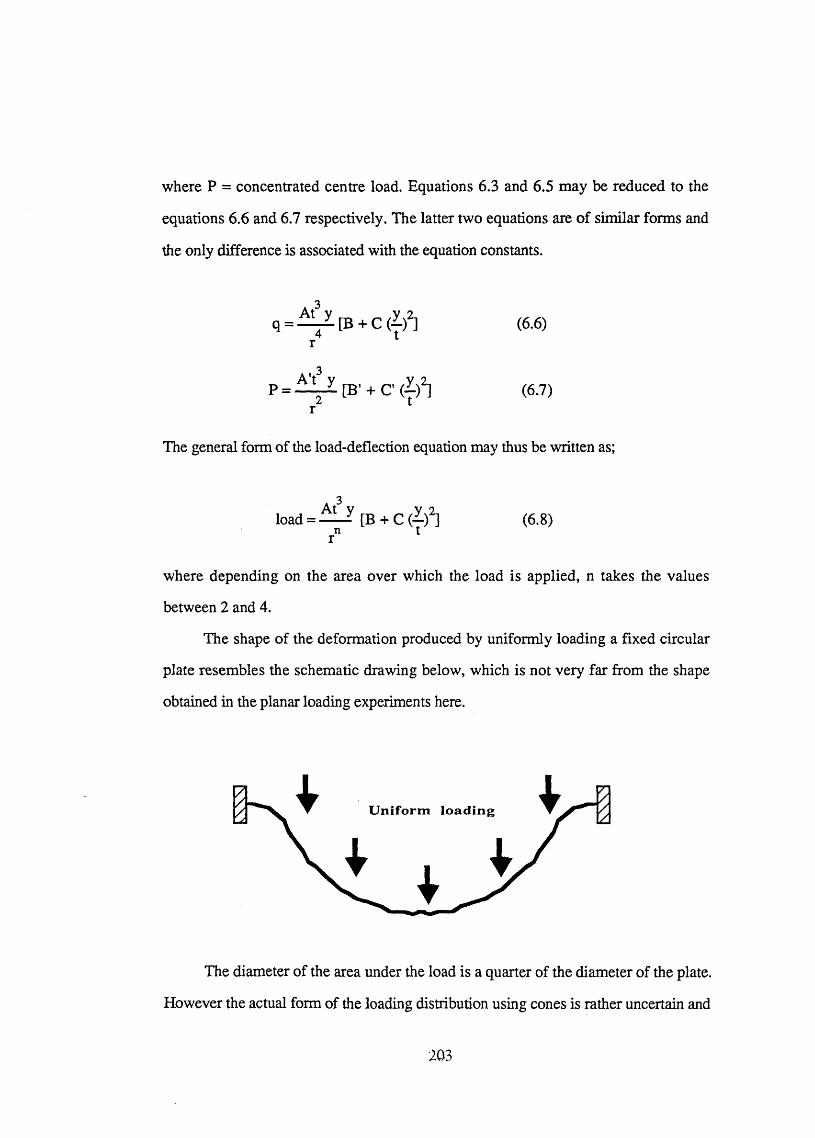
where P = concentrated centre load. Equations 6.3 and 6.5 may be reduced to the
equations 6.6 and 6.7 respectively. The latter two equations are of similar forms and
the only difference is associated with the equation constants.
(6.6)
(6.7)
The general form of the load-deflection equation may thus be written as;
load = [B + C (~)2]n t (6.8)
where depending on the area over which the load is applied, n takes the values
between 2 and 4.
The shape of the deformation produced by uniformly loading a fixed circular
plate resembles the schematic drawing below, which is not very far from the shape
obtained in the planar loading experiments here.
The diameter of the area under the load is a quarter of the diameter of the plate.
However the actual form of the loading distribution using cones is rather uncertain and

probably non-uniform. An exact solution for a fixed circular plate with a concentrated
load is not available in the literature. Equation 6.4 is used in later analyses. This
formula will be used in chapter 10 to model the force-displacement response of the
fabrics under planar loading. It will be recognised that this relationship contains three
disposable material parameters, E, v and t. The excercise of setting t) = 0 is a
convenience and the values of E and t which result will be apparent or effective values
computed on this basis. More is said on this later.
6.5 The Response of Fabrics to Small Indentors
6.5.1 Introduction
Sections 6.2 to 6.4 discussed the results and observations of indentation
experiments using 25.4mm diameter, i.e. relatively large indentors. This section will
present observations and results on experiments performed using 3.2mm diameter
indentors, i.e. small indentors. The purpose of these experiments was to simulate
ballistic penetration of smaller diameter objects into fabrics more closely than that
discussed in Sections 6.2 to 6.4. The diameter of the indentors were such that it was
not possible to perform any experiments on the aramid fabrics. Untreated cotton
fabrics were used in conjunction with the 100mm diameter fabric holder.
6.5.2 The Effect of the Shape of the Indentor tip on Fabric Response
Unlike Sections 6.2 to 6.4 where the important features were the shape of the
response profile and its gradient, here we were more concerned with the penetration
force or energy. The shape or angle of the tip of the indentors are not as strong a
determining factor in the gradient of the profile as in the case of the large indentors

which occupied a relatively large area on the surface of the fabric. The small indentors
only occupy a space of about 10 yam diameters. Table 6.4 presents data obtained
from the above experiments.
TABLE 6.4 The effect of indentor shape on "hardness” character of fabricsIndentor Gradient (N/mm) Penetration Force (N) Energy (Nmm)45° Conical 0.8 4.7 11.390° Conical 1.7 8.6 30.1120° Conical 1.6 9.7 32.7Spherical 1.64 6.5 17.1Flat 1.9 10.2 46.5
On the whole one may say that the gradient increases as the angle of the conical
indentor increases if the flat tip indentor is regarded as a 180° conical indentor. This
can be explained in a similar manner to the large indentors. With larger angles a larger
number of yams are initially involved in the deformation process and their tensile
resistances become effective earlier and to a greater degree than for smaller included
angle indentors. Figure 6.19 shows typical data obtained. The penetration force can
be seen to increase with increasing cone angle with the exception of the spherical
indentor value which falls between 45° and 90° values. This is as expected since
sharper indentors penetrate objects more easily because the load is concentrated onto a
relatively small area producing large pressures.
During penetration two processes occurred simultaneously; one was that some
of the yams were tom under the pressure while the rest were "pushed aside" to make
way for the indentor. It was observed that on the whole the number of tom yarns
increased with increasing cone angle in a similar way to the penetration force. For the
flat indentor the number of tom yams was about 7. The area under each curve in
Figure 6.19 represents the work done in penetrating the fabric. These values also
205

V e rtic a l distance traversed (m m )
Figure 6.19 The response of untreated cotton fabrics to small diameter indentors as a function of the indntor angle (100mm holder).
206
appear in Table 6.4. Again these values increase with cone angle, the exception being
the spherical indentor. The difference between the values for the spherical indentor
and the rest cannot be solely due to experimental error since the values presented in
Table 6.4 are averages of at least 5 tests. It is more probable that the inherent shape of
the spherical indentor acts in a manner similar to a cone of some angle between 45°
and 90°.
6.6 Conclusion
The indentation characteristics of cotton and aramid 1 fabrics have been
discussed in terms of the bending and tensile properties of the constituent yams. The
effect of weft yam tension on fabric response was surprisingly found to be negligible.
However, in the case of large indentors, the size of the fabric and the shape and angle
of the cone affected the indentation response of fabrics greatly. Treating the fabrics
with lubricants such as PDMS and CTAB reduced the penetration resistance of the
fabrics. This was argued to be due to a reduction in the tensile and bending moduli of
the yams brought about by a reduction in interyam and interfibre friction.
Using small indentors, the penetration character of different indentors were
examined. It was found that the work done in penetration was reduced for sharper
indentors.
These results will be used in a later chapter to facilitate the modelling of some of
the observations and the results of the ballistic experiments of fabrics involving very
high rates of strain in the yams.
207

C H A P T E R S E V E N
THE TRANSVERSE BALLISTIC IMPACT OF FABRICS
7.1 Introduction
This chapter presents the data obtained from the ballistic impact experiments on
single layers of aramid 1 fabrics. The experimental details were described in Section
5.6. In Chapter 6 the data for the "hardness experiments" were presented which
represented deformation at relatively low strains, the deformations being nearly
pyramidal. In this chapter, similar out of plane deformations are created but at much
higher rates of strain. The "hardness experiments" can be thought of as a simulation
of the ballistic impact experiments in the sense that the conical distortion by the ballistic
shock waves may be produced statically in a "hardness experiment". Similar
distortions are also obtained in the pull-out experiments to be described later. The aim
of the ballistic impact experiments was to investigate the deformation of fabrics in
transverse impact, using steel balls as the projectiles. The experiments also evaluate
the energy absorption and penetration characteristics of the fabrics. The influence of
surface treatments on the above characteristics are also examined and will be described
in this chapter.
The chapter is divided into three parts. The first part presents the information
obtained in the form of high speed photographic images. The main emphasis here will
be on the nature or evolving shape of the deformation produced. The second section
describes the wave propagation velocities of the aramid fabrics measured using the
high speed photographic images. The third part of the chapter deals with the projectile
velocity measurements both before and after penetration and the computation of the
energy dissipated which occurs during the impact.
208

7.2 The Deformation Character of Fabrics Impacted Transversely
The main emphasis in this section will be on the examination of the qualitative
nature of the deformation produced on impact. Figures 7.1, 7.2 and 7.3 present high
speed photographs representing cleaned, untreated and treated (5% PDMS) aramid 1
fabrics. Each photograph contains 10 frames at 40|is intervals, tracing the process
from just before impact, on the right, to total penetration, on the left. The impact
velocity in the three cases was ca. 113 m/s. The conical shape of the deformation zone
is apparent and resembles that obtained in the "hardness experiments" described in the
previous chapter. It also closely resembles the out of plane deformation obtained
during the pull-out experiments to be described in the next chapter. The shock waves
progressively develops in the early stages of the impulse and it can be seen that the
diameter of the deformation zone in the viewing plane increases with increasing depth
of penetration. In fact, when the two dimensions are measured on the photograph, it
was found that there was a direct relationship between the two measurements. There
was a nearly constant propagation angle 0, figure 10.16. Separate studies also
indicated that the deformation was to a good approximation axially symmetrical about
the impact axis. The photographs also show a considerable amount of fibre pull-out
during the penetration process. This may or may not be accompanied by fibre rupture.
The extent of both the deformation and the fibre pull-out are related to the surface
treatments and will be discussed later. After penetration the cone and the adjacent
distortion collapses and the fabric largely recovers its original planar shape.
Finally, using these photographs, it was possible to evaluate the residual
velocity of the projectile after impact and compare it with the values obtained using the
infrared detectors. They were found to agree well.
Comparing the three different treated aramid fabrics, it can be seen that in the
case of the PDMS treated fabric the transverse deformation before appreciable
deformation has occurred is less than the other two cases. This has an important
209

Figure 7.1 High speed photograph of the impact process. Projectile velocity=113 m/s, as received aramid 1 fabric, time interval between frames=40 |is.
Figure 7.2 Same as figure 7.1 for the 5% PDMS treated aramid 1 fabric.
210

Figure 7.3 Same as figure 7.1 for the soxlet extracted aramid 1 fabric.
21 1
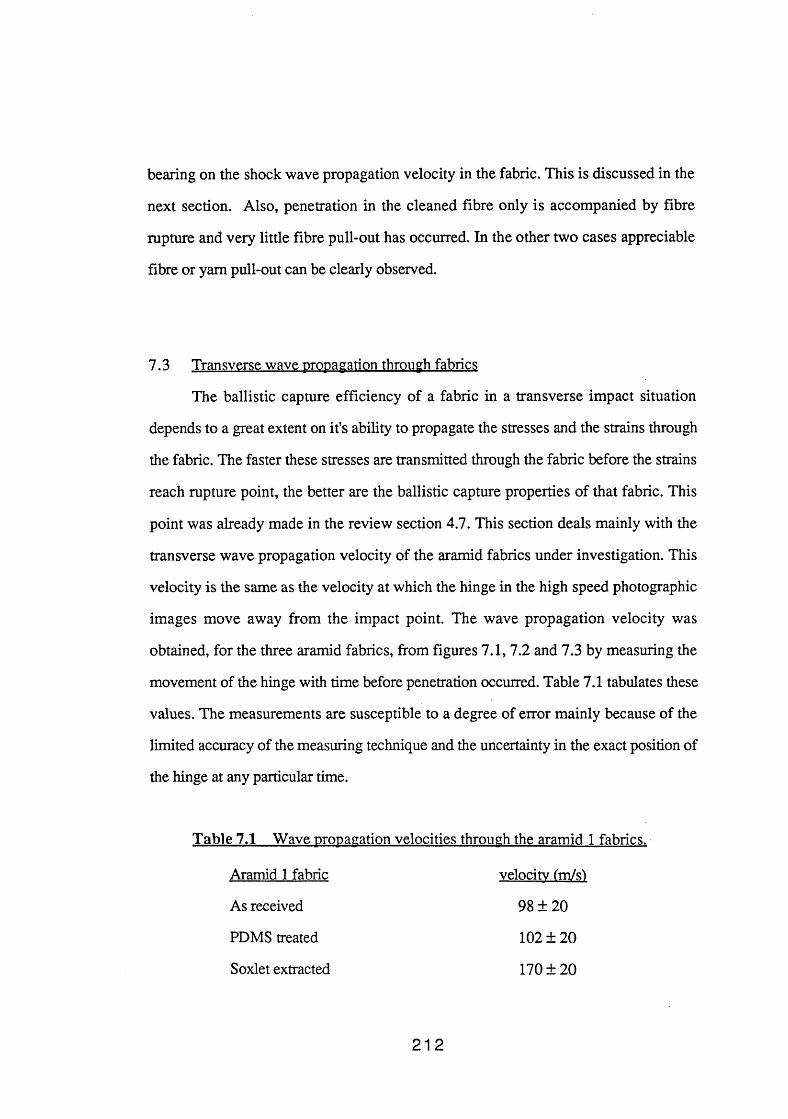
bearing on the shock wave propagation velocity in the fabric. This is discussed in the
next section. Also, penetration in the cleaned fibre only is accompanied by fibre
rupture and very little fibre pull-out has occurred. In the other two cases appreciable
fibre or yam pull-out can be clearly observed.
7.3 Transverse wave propagation through fabrics
The ballistic capture efficiency of a fabric in a transverse impact situation
depends to a great extent on it's ability to propagate the stresses and the strains through
the fabric. The faster these stresses are transmitted through the fabric before the strains
reach rupture point, the better are the ballistic capture properties of that fabric. This
point was already made in the review section 4.7. This section deals mainly with the
transverse wave propagation velocity of the aramid fabrics under investigation. This
velocity is the same as the velocity at which the hinge in the high speed photographic
images move away from the impact point. The wave propagation velocity was
obtained, for the three aramid fabrics, from figures 7.1, 7.2 and 7.3 by measuring the
movement of the hinge with time before penetration occurred. Table 7.1 tabulates these
values. The measurements are susceptible to a degree of error mainly because of the
limited accuracy of the measuring technique and the uncertainty in the exact position of
the hinge at any particular time.
Table 7.1 Wave propagation velocities through the aramid 1 fabrics.
Aramid 1 fabric
As received
PDMS treated
Soxlet extracted
velocity (m/sl
98 ±20
102 ±20
170 ± 20
212

It can be seen that the values for the PDMS treated and the as received fabrics are very
similar and significantly less than that of the cleaned fabric. The results of the tensile
experiments, section 5.4.2, and the values of the residual velocities (see later) and the
energy dissipation characteristics of the aramid fabrics indicates that the as received
fabric should probably possess a higher wave propagation velocity than the treated
fabric. The as received fabric contained an unknown proprietory lubricant. The soxlet
extracted fabric clearly possesses a high value in line with it's superior ballistic
properties, as outlined in the next section.
7.4 The Energy Dissipation Character of Fabrics during impulse loading.
This section deals with the energy absorption characteristics of the fabrics,
particularly in relation to the surface treatments used. This was carried out by
monitoring the impact and exit or residual velocities of the projectile as described in
Section 5.6. Figure 5.18 shows the projectile velocities increasing with gas pressure.
The velocities were found to be quite consistent at a particular pressure.
Table 7.2, in conjunction with Figure 7.4, presents the values of residual
velocities obtained at various impact velocities for the fabrics as a function of different
surface treatments. It can be seen that for all the impact velocities there is an increasing
trend in the magnitude of the residual velocity from cleaned to untreated to PDMS
treated fabrics, as well as the more obvious trend of increasing residual velocity with
impact velocity.
213

Resid
ual
velo
city
(m/s)
250
200 -
a
150 -
+ Cleaned
o Untreated
■ 5% PDMS
100 -
?
*+
50 -
0 -f---------- j---------- ,---------- 1---------- 1----------0 50 100 150 200 250
Im pac t ve loc ity (m/s)
Figure 7.4 The effect of impact velocity and surface treatment of Aramid (kevlar 49) fabrics as the projectile residual velocity.
214
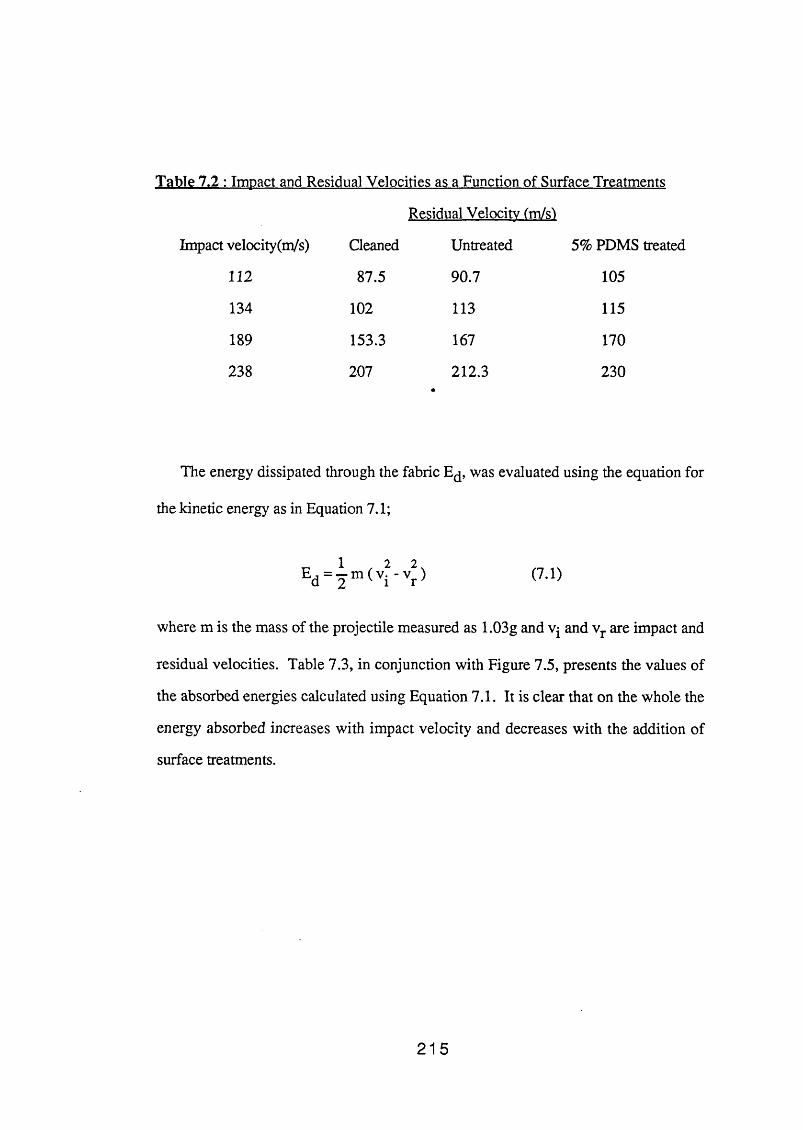
Table 7.2 : Impact and Residual Velocities as a Function of Surface Treatments
Residual Velocitv (m/sl
Impact velocity(m/s) Cleaned Untreated 5% PDMS treated
112 87.5 90.7 105
134 102 113 115
189 153.3 167 170
238 207 212.3 230
The energy dissipated through the fabric E^, was evaluated using the equation for
the kinetic energy as in Equation 7.1;
Ed = I m ( V vr) (7-1)
where m is the mass of the projectile measured as 1.03g and and vr are impact and
residual velocities. Table 7.3, in conjunction with Figure 7.5, presents the values of
the absorbed energies calculated using Equation 7.1. It is clear that on the whole the
energy absorbed increases with impact velocity and decreases with the addition of
surface treatments.
215
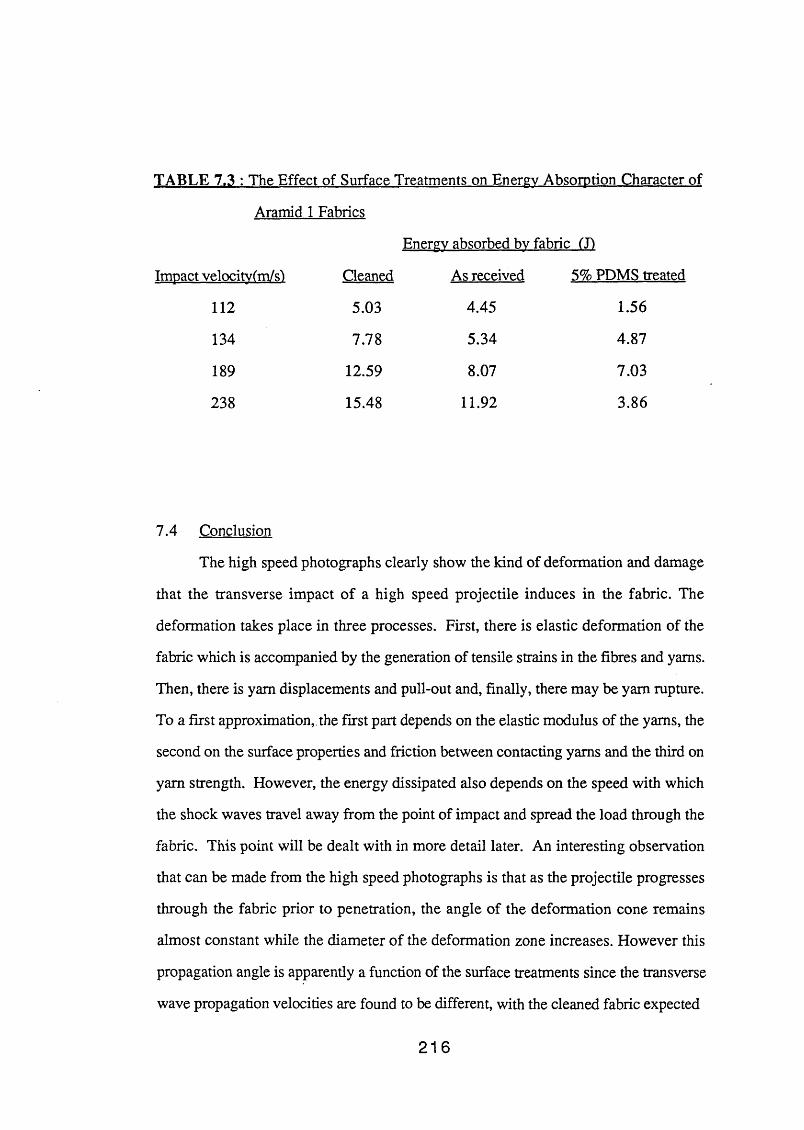
TABLE 7.3 : The Effect of Surface Treatments on Energy Absorption Character of
Aramid 1 Fabrics
Energy absorbed bv fabric (T)
Impact velocitv(m/s1 Cleaned As received 5% PDMS treated
112 5.03 4.45 1.56
134 7.78 5.34 4.87
189 12.59 8.07 7.03
238 15.48 11.92 3.86
7.4 Conclusion
The high speed photographs clearly show the kind of deformation and damage
that the transverse impact of a high speed projectile induces in the fabric. The
deformation takes place in three processes. First, there is elastic deformation of the
fabric which is accompanied by the generation of tensile strains in the fibres and yams.
Then, there is yam displacements and pull-out and, finally, there may be yam rupture.
To a first approximation, the first part depends on the elastic modulus of the yams, the
second on the surface properties and friction between contacting yams and the third on
yam strength. However, the energy dissipated also depends on the speed with which
the shock waves travel away from the point of impact and spread the load through the
fabric. This point will be dealt with in more detail later. An interesting observation
that can be made from the high speed photographs is that as the projectile progresses
through the fabric prior to penetration, the angle of the deformation cone remains
almost constant while the diameter of the deformation zone increases. However this
propagation angle is apparently a function of the surface treatments since the transverse
wave propagation velocities are found to be different, with the cleaned fabric expected
216
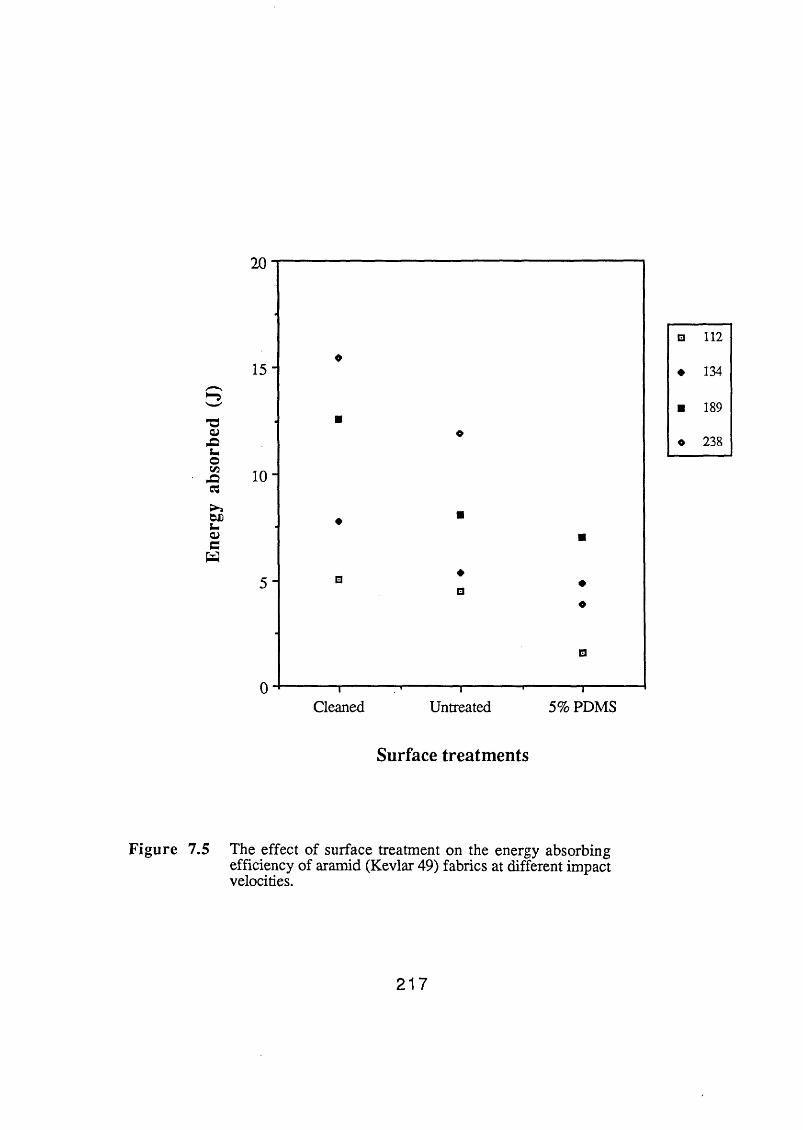
20
♦
*■5TJaA
1 10 -
as
&£s-a>c
□
o
♦□
o
□ 112
♦ 134
■ 189
o 238
0Cleaned Untreated 5% PDMS
Surface trea tm ents
Figure 7.5 The effect of surface treatment on the energy absorbing efficiency of aramid (Kevlar 49) fabrics at different impact velocities.
217
to possess the largest angle.
Also, the photographs show differences in the extent of deformation prior to
penetration for different surface treatments. These differences were more obvious in
the measured impact and residual velocities and the calculated values of the energies
dissipated. The values show that the most energy was dissipated by the cleaned fabric
and least by the fabric treated with 5% PDMS. The reasons for such variations
brought about by the surface treatments will be discussed in terms of changes in the
yam modulus or density in a later chapter.
218
C H A P T E R E I G H T
THE YARN PULL-OUT PROCESS
8.1 Introduction
This chapter presents the results of the experimental methods described in
Sections 5.7.1 and 5.8. The yam pull-out process possesses several features which
are important. First, the pull-out involves yam-yam friction accompanied by the
making and the breaking of the inter yam junctions. Hence, it provides a way of
studying the frictional interaction of yams within a weave. It is also an alternative
method of quantifying the friction when used in conjunction with appropriate
geometric models (see later). These data are compared with the classical methods of
investigating friction phenomena (described in Chapter 3) in a later section. Intrinsic
in the pull-out process are the local deformations of the pulled yam and the adjacent
weave which can be useful in the study of the mechanics of fabrics and the effect of
fabric modifiers on these properties. Another important feature of the pull-out process
and associated deformations is their similar geometric character to those observed in
the "hardness" and the ballistic experiments described in the previous chapters. Both
the latter processes also involve yam pull-out and, as will be seen in this chapter, the
shapes of the deformation in the pull-out experiments are similar to those obtained in
the "hardness" and the ballistic experiments.
This chapter is divided into three main sections. The first deals with the general
features of the pull-out experiment on untreated cotton fabrics and the effect of variable
parameters upon these features. The second part deals with the geometry of the
deformation and, in particular, the vertical deformation of the cotton weave referred to
as vertical microdisplacements. The third section presents the results of the pull-out
219

experiments on aramid 1 and 2 fabrics. The results provided in this chapter are mostly
presented in graphical form and the major portion of the analysis are reserved for a
subsequent chapter.
8.2 Yam Pull-Out of Cotton Fabrics
8.2.1 General Force-Displacement Behaviour
The general force-displacement profile of the chosen pulled yam is shown ind
Figure 8.1. It has four basic features or regions of response: 1/ uncrimping of the
loose yam, II/ the elastic deformation of the tensile or pulled yam and the adjacent
weave, III/ a critical junction rupture force when all the junctions break (the junction
rupture point), and IV/ a progressive withdrawal of the pulled yam which is controlled
by the dynamic frictional force. The uncrimping part of the profile has a variable and
relatively small slope. Also, because the extent of the crimp in different yams varies,
data obtained in this region is not very reproducible. These type of data are not
considered further.
The second region prior to junction or yam-yam rupture, is characterised by the
nearly elastic extension of the yam and the deformation of the cross-over yams parallel
and in contact with the pulled yam. After this point, there is a substantial reduction in
the magnitude of the restraining force. The yam and matrix then undergo fluctuating
deformations where the pulled yam clears a few cross-over yams in a single "slip"
phase. The fourth and final region is characterised by a fairly uniform stick-slip
motion where the pulled yam undergoes small microslips before clearing each
cross-over in a single slip.
Figure 8.2 shows typical force-imposed displacement profiles obtained at three
lateral tensions of 0, 1.4 and 3.8 N. The experimental details were described in section
5.7. The measurable parameters that are of interest in the force-displacement profiles
220
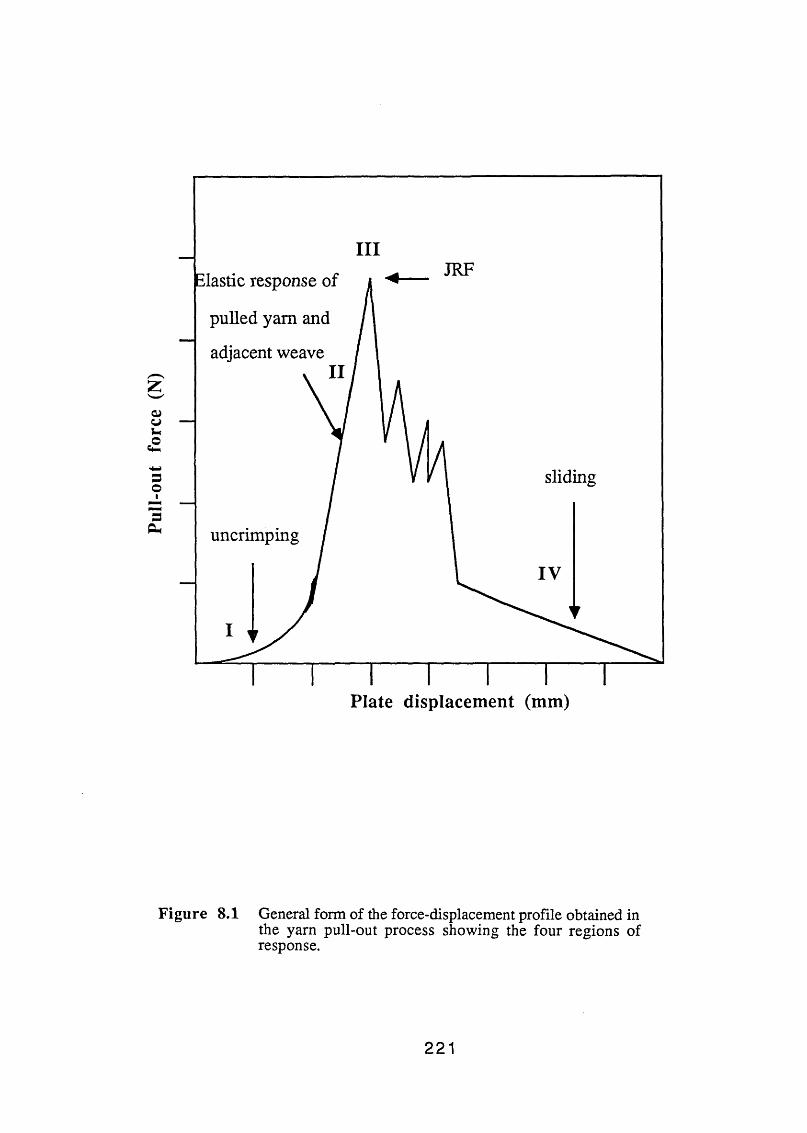
Pull-
out
forc
e (N
)
III
Figure 8.1 General form of the force-displacement profile obtained in the yarn pull-out process showing the four regions of response.
221

0.8-1■n-- Tension=0
0 5 10 15 20
Plate d isplacement (m m )
Figure 8.2 Variation of the pull-out profile and the associatedparameters of untreated cotton fabric with imposed side tension.
222

are: (a) the gradient of the elastic part of the profile, (b) the maximum value of junction
rupture force (JRF), and (c) the gradient of the kinetic friction portion of the profile.
The mean gradient of the elastic region II may be calculated simply by dividing the
force by the distance traversed by the supporting frame after accounting for the
compliance of the transducer. This quantity is denoted as G(N/mm). Figure 8.3 is a
plot of the quantity G as a function of the imposed side tension. The correlation
between the two quantities is a positive one. G increases with the increasing of the
side tension, although the rate of increase is very slow. The gradient and the intercept
of the least squares fits for various data are presented in Table 8.1. The quantity G is
in part controlled by the shear compliance of the weave, that is the resistance of the
cross-over yams to the applied load. This point is discussed in relation to the moduli
of the cross-over yams later. However, it seems that with the increasing of the side
tension on the cross-over yams the compliance of the system has decreased.
Figure 8.4 shows the variation of the maximum static frictional force (JRF)
with side tension. Again, with the increasing of the side tension the JRF increases in
magnitude. The figure also indicates the variability in the measured force at nominally
the same values of the side tension. This variability is intrinsic to the system and is not
due to experimental error. It is attributable mainly to the heterogeneous nature of the
yams and the weave. The pulled yam is chosen randomly from the weave. The yams
within the weave vary significantly in diameter and spacing and the diametric variation
may be as high as 30% (see Section 5.2).
Figure 8.5 shows the dynamic friction force per cross-over against the imposed
lateral tension. The ordinate is calculated from a plot of dynamic friction force against
the number of cleared cross-overs, Figure 8.6. As can be seen from this figure, the
dynamic frictional force is an increasing function of the number of cross-overs or
contacts, each contact contributing to the total friction. However, this relationship
only becomes reasonably linear after the pulled yam has cleared approximately six
223
F ig u re 8.3 The gradient of elastic part of the pull-out profile (Region II)G, as a function of side tension for untreated cotton fabrics.
Figure 8.4 Junction rupture force (JRF) as a function of imposed side tension for untreated cotton.

Junc
tion
rupt
ure
forc
e (N
)O
pp
pp
H-
O
to
4>
b\
bo
o
Stat
ic gr
adie
nt ,
G, (
N/m
m)
po
o
o
o
oCT\
OO
O o
0.12
F igure 8.5 Sliding friction force per cross-over (Region IV) as afunction of side tension for untreated cotton fabrics.
&
Figure 8.6 Measured pull-out force (Region IV) as a function of the number of cross-overs remaining for untreated cotton fabric under zero side tension.
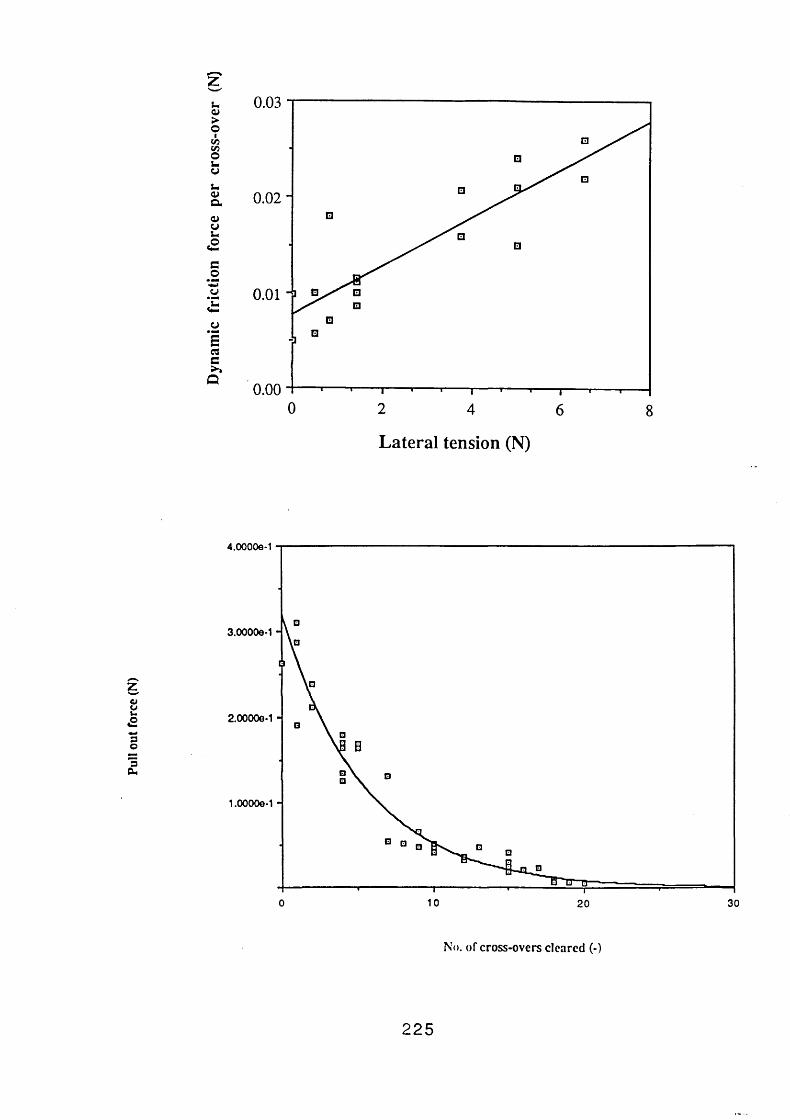
2 2 5
Pull ou
t force (N
)
7! o *1 o 8 o < n 3 rt o" u ■n Q.
'8ro 8
03 8 o 8
4.0000e-1
Dyn
amic
fri
ctio
n fo
rce
per
cros
s-ov
er
po
o
0.03

The variation of the JRF and the kinetic frictional force per junction with side
tension is most simply explained by assuming that both quantities are a function of the
normal load at the cross-overs and that the side tension provides a component of this
load. A geometric model developed to relate the side tension to the orthogonal
resolved component of the normal load, to the friction experienced at the junctions is
described later. Table 8.1 lists the parameters obtained from a linear regression in
terms of the units employed.
cross-overs. The ordinate of Figure 8.5 is the gradient of the linear part of Figure 8.6.
TABLE 8.1
Plot Gradient Intercept Corr. Coefft.
G vs. side tension 0.002 mm*1 0.086 N/mm
JRF vs. side tension 0.062 0.344 N 0.78
Kinetic friction vs. 0.003 0.008 N 0.87side tension
It is clear that the variation of the parameters with the side tension is quite
different. The data presented in Table 8.1 will be used in chapter 10 in conjunction
with a number of simple geometric models to evaluate the overall coefficient of friction
in the pull-out process. Figure 8.7 shows that the ratio of G/JRF is a decreasing
function of side tension. These data provide a series of relationships between the
pull-out force and the imposed displacement which are utilised in a later chapter. The
modelling of these forces in terms of single fibre properties requires an identification
of the micro strains developed in the fabric. This aspect of the study is dealt with in the
next section.
226

8.2.2 Micro-displacement Response in the Plane of Deformation
Figure 8.8 shows a set of typical data for the pull-out force and the extension of
the pulled yam against the distance traversed by the plate, that is the imposed
displacement. The extension shown is that of the whole yam from the hook to the
loose end (20 cross-over elements). Using this plot, it is possible to relate the
measured extensions to the force- displacement profile. The extension noted in the
region from A to B, figure 8.8 relates to the portion of the force profile which is
produced at relatively small forces and is the part where the free yam (that part
between the hook and the entry point into the weave) undergoes decrimping. The
elastic extension of the pulled yam is probably very small in the region A-B. In
contrast, region B-C is almost wholly dominated by the elastic extension of the yam
relating to the elastic response part of the force profile up to JRF. The region B-C
comprises the extension of the part of the yam that is inside the weave, as well as that
outside it in the adjacent weave. The JRF represents the maximum extension
sustainable by the system. After junction rupture, as the force decreases, so does the
total yam extension and it then oscillates with the stick-slip motion of the yam. At
zero imposed force, the yam contracts significantly and is close to its original length.
Figure 8.9 depicts the measured force as a function of the extension of those portions
of the yarn which are within the weave, i.e. the pulled yam between cross-over
numbers 1 and 20. Both Figures 8.8 and 8.9 refer to an experiment carried out at
initially zero side tension. Figure 8.9 is similar to the force-extension curve obtained
from a tensile experiment (see Chapter 3). It can be seen that the contribution of the
part of the yam inside the weave to the total pulled yam extension of 3.7 mm from it’s
initial position was approximately 0.55 mm and this part is mostly recovered as the
tensile force is slowly reduced.
The extension of the yam at the maximum force (JRF) within the weave was
calculated by subtracting the measured displacement of cross-over 20 from that of
227

Figure 8.7 Ratio G/JRF as a function of side tension showing JRF to be a stronger function of tension.
Figure 8.8 Extension of the pull-out yam against plate displacement at particular values of the pull-out force. The diagram compares each portion of the extension profiles to a particular region in the pull-out profile.

Pull-
out
forc
e (N
) Pa
ram
eter
G/J
RF (
-)
0.4
0.0 H-----■---- 1-----1-----<-----*---- 1-----«-----■-----1----->-----•-----0 200 400 600 800
Side Tension (g)
228
Tota
l ya
rn e
xtens
ion (
mm
)
cross-over 1. The displacement of cross-overs were measured on the TV monitor
using a crosswire (chapter 5). A cross-over displacement d was calculated as:
d = D - [—-—-] (8.1)a
D = - * time (t) (mm) (82)60
where D = displacement of stage
X2 = digitised position of cross-over at time = t
Xj = digitised position of cross-over at time = 0
a = number of digitised positions/mm
The parameter a was related to the magnification used on the zoom lens. For most
experiments this was kept constant at approximately 11.2 units/mm.
A typical trend observed in the measured cross-over displacements with
cross-over number is shown later, Figure 8.16. Subtracting consecutive cross-over
displacements produces values for the incremental extensions of the pulled yam itself
inside the weave at the point just before gross slip occurs. An example is given in
Figure 8.10. These data were obtained from the corrected curve given in Figure 8.16.
The correction and its importance is discussed later in conjunction with
micro-displacements of the yam and the matrix.
In summary, what has been observed is that the extension of the pulled yam
within the weave does not vary with side tension, although the measured values of
cross-over displacements increases with increasing side tension. This is shown in
Figure 8.11 where the displacements of cross-over numbers 1 and 20 are plotted
against lateral tension. The least square fit for the two are also drawn showing how
they increase with lateral tension. However, the distance between the two least square
229
Figure 8.9 Measured force before JRF (Region II), as a function of the extension of the portion of the pull-out yarn between cross-overs 1-20.
Figure 8.10 Tensile extension of discrete elements of the pulled yam between cross-overs corrected for the out of plane displacements as a function of cross-over number. The averaged increasing trend is depicted by the solid line.

230
Tens
ile y
arn
exte
nsion
(m
m)
po
op
o
o
•—*
I—»
O
U\
o
Ui
Effe
ctive
lin
ear
stra
in
oro
Tensile ya rn extension (cross-over 1-20) (m m )
Forc
e on
ten
sile
yarn
(N)
o oo >—l o
o to oo

7
Side Tension (g)
Figure 8.11 Displacement of cross-overs 1 and 20 with side tension.The solid lines represent the least square fits to the data.
231
fits, representing the total extension of the yarn between cross-overs 1-20 remains
surprisingly constant. Careful investigation shows that this effect is due to the
out-of-plane displacement of the yarn and matrix. It is not a real matrix property and
the origin of the effect is discussed in the next section.
8.3 Micro-Displacements of the Weave
8.3.1 Yam Displacement above the weave plane
This section presents the results of the experiments described in Section 5.8.
The form of the micro-displacements are depicted pictorially in Figure 8.12. The kind
of deformation produced can clearly be seen with the vertical displacements increasing
as the cross-overs approach the hook. This effect is illustrated in Figure 8.13. The
pull-out arrangement adopted introduces the vertical displacements since the yams
were pulled in such a way that they made an angle of approximately 20° with the plane
of the fabric. In fact, this was found to be the correct procedure for the pull-out
experiment. This facet of the experiment is discussed later. Also, these experiments
showed that slight variations of ±10° in the pull-out angle had an insignificant effect
the measured parameters discussed earlier (Table 8.1).
The displacements depicted in Figure 8.12 and in particular that in the side view
resemble those obtained in the "hardness" and the ballistic experiments described in the
previous chapters. The "tent" or cone shaped deformation obtained in the pull-out test
also occurs in both of the latter experiments mentioned except that in the case of the
ballistics experiments the imposed rates of strain are much higher. The rate of strain in
the pull-out experiments was not greater than 3*10-3 s '1.
Returning to Figure 8.13, it can be seen that the results accurately fit an
exponential relationship and are positively correlated with the force on the pulled yam.
2 3 2
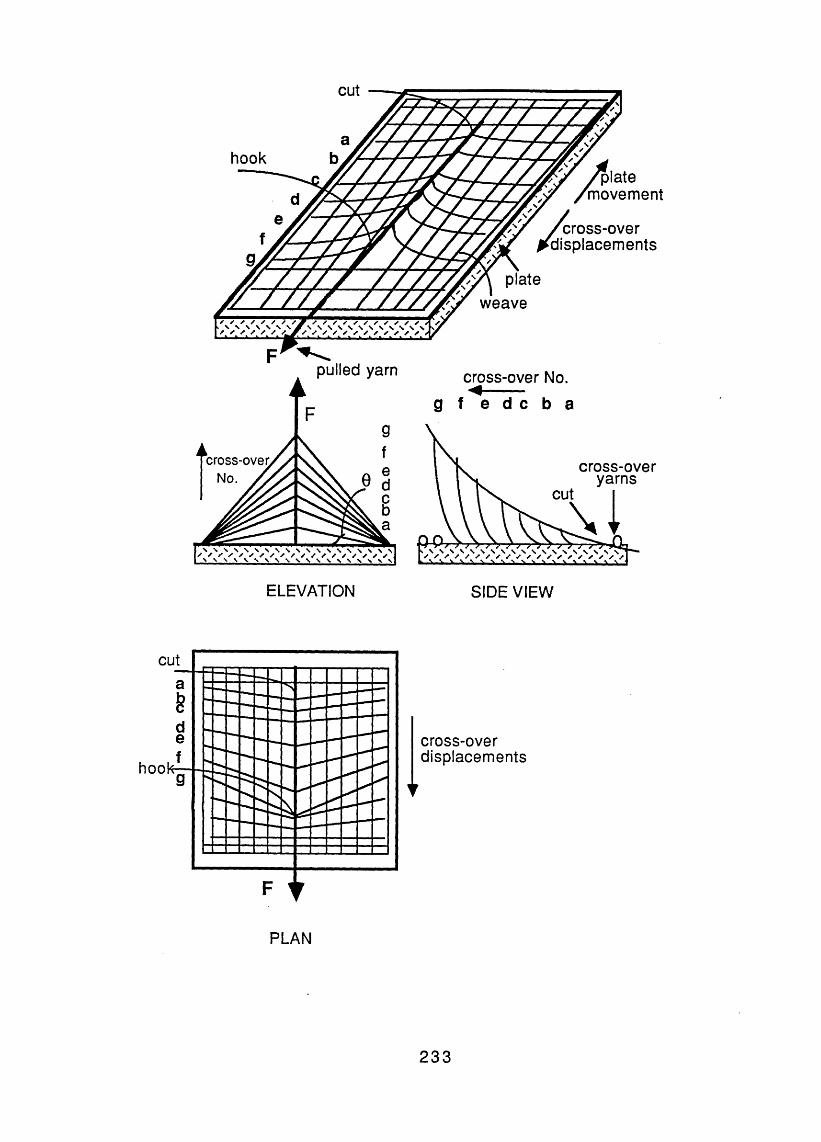
(DQ.
OCT
D)
cut
plate movement
cross-over displacements
pulled yarn
plate weave
cross-over No.g f e d c b a
ELEVATION SIDE VIEW
F t
cross-overdisplacements
PLAN
233
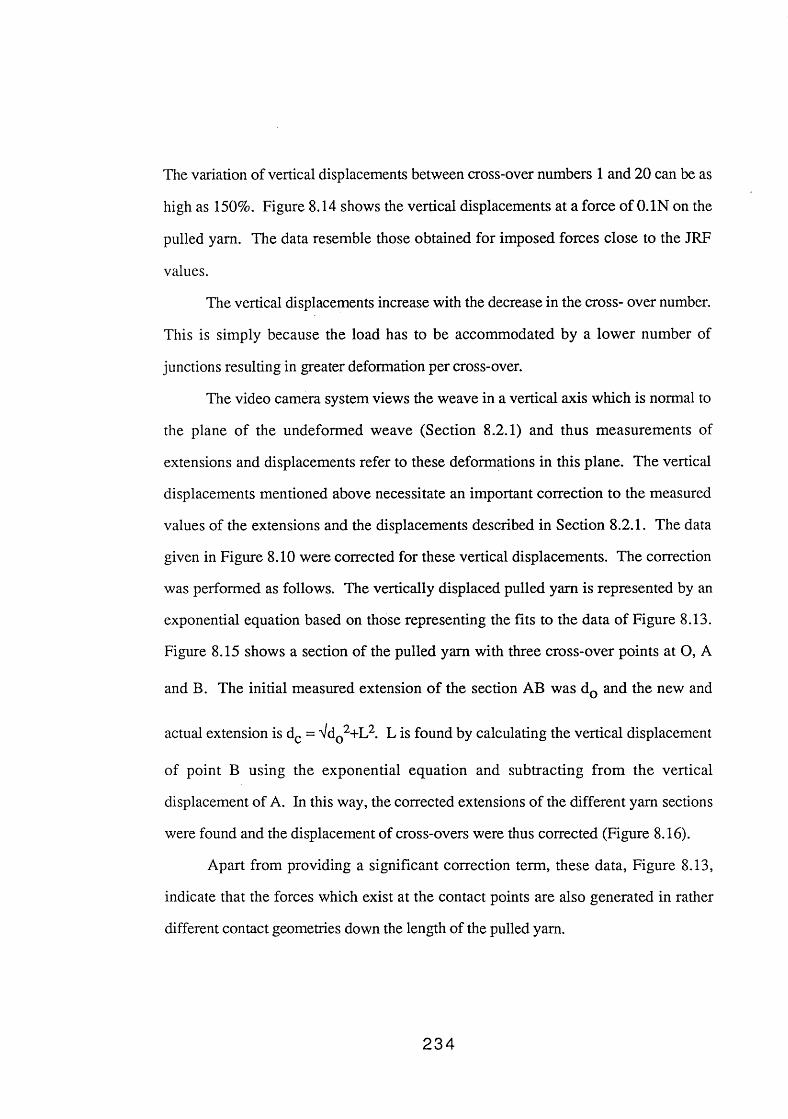
The variation of vertical displacements between cross-over numbers 1 and 20 can be as
high as 150%. Figure 8.14 shows the vertical displacements at a force of 0.1N on the
pulled yam. The data resemble those obtained for imposed forces close to the JRF
values.
The vertical displacements increase with the decrease in the cross- over number.
This is simply because the load has to be accommodated by a lower number of
junctions resulting in greater deformation per cross-over.
The video camera system views the weave in a vertical axis which is normal to
the plane of the undeformed weave (Section 8.2.1) and thus measurements of
extensions and displacements refer to these deformations in this plane. The vertical
displacements mentioned above necessitate an important correction to the measured
values of the extensions and the displacements described in Section 8.2.1. The data
given in Figure 8.10 were corrected for these vertical displacements. The correction
was performed as follows. The vertically displaced pulled yam is represented by an
exponential equation based on those representing the fits to the data of Figure 8.13.
Figure 8.15 shows a section of the pulled yam with three cross-over points at O, A
and B. The initial measured extension of the section AB was dQ and the new and
actual extension is dc = Vd02+L2. L is found by calculating the vertical displacement
of point B using the exponential equation and subtracting from the vertical
displacement of A. In this way, the corrected extensions of the different yam sections
were found and the displacement of cross-overs were thus corrected (Figure 8.16).
Apart from providing a significant correction term, these data, Figure 8.13,
indicate that the forces which exist at the contact points are also generated in rather
different contact geometries down the length of the pulled yam.
2 3 4

Figure 8.13 Out of plane micro displacements for the weave as a function of cross-over number for three different force levels on the pulled yam.
Figure 8.14 The effect of the number of cross-over points at the same force level (0.1 N) on the vertical displacements of the weave.

235
Ver
tical
dis
plac
emen
t ab
ove
plan
e of
wea
ve (
mm
)
a♦
□
»—*►—* O
Nto o
2 o p t—‘ 2
Cross-over N um be r
Ver
tical
dis
plac
emen
t fr
om
wea
ve p
lane
(m
m)
op
^
ND
l\3
COb
In o
cn b
cn b
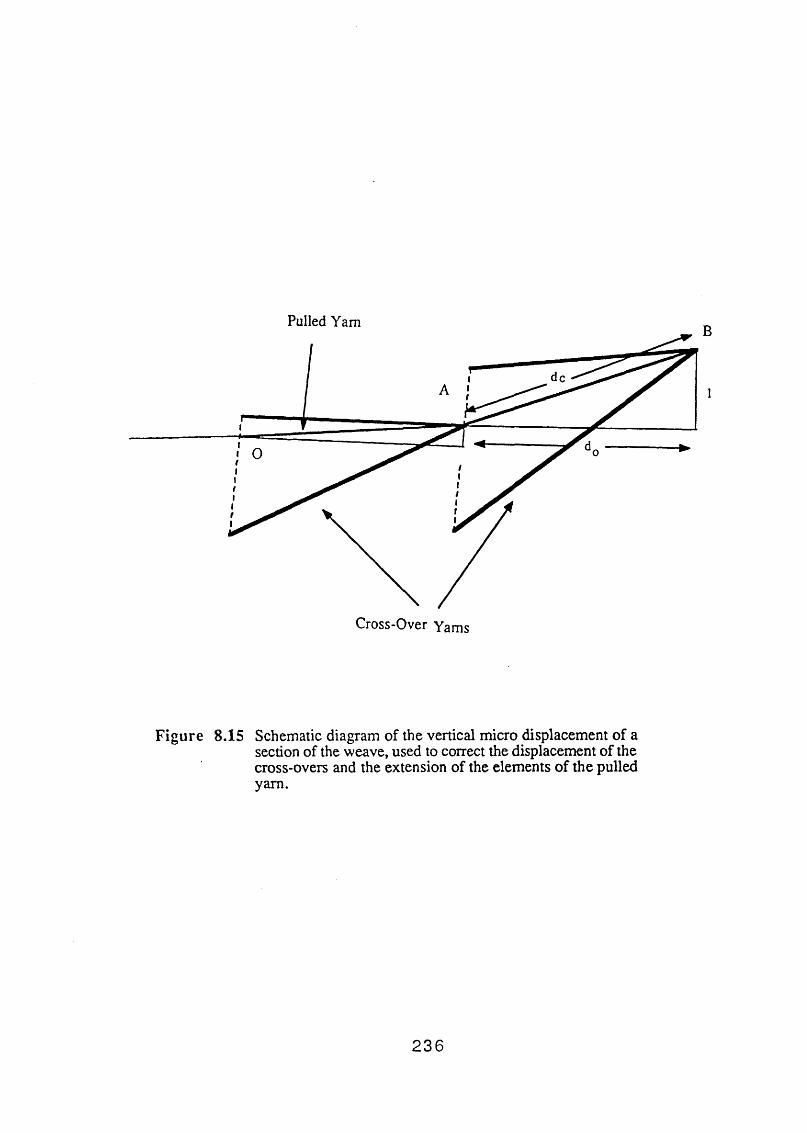
Pulled Yam
Figure 8.15 Schematic diagram of the vertical micro displacement of a section of the weave, used to correct the displacement of the cross-overs and the extension of the elements of the pulled yam.
2 3 6

2.0□
££
1.5-
Corrected data
\c<a>oo.Vi
UCJ>©ViVi©uU
1.0-
_ El • ♦ ♦□□ ♦ ♦♦
9 S
0.5-
Uncorrected
0.0 —r-10
“ i150 20
Cross-over No.
Figure 8.16 Experimental values of the cross-over displacements for untreated cotton fabric at zero side tension as a function of cross-over number. Both the corrected and the uncorrected data are shown, the correction becoming more significant at higher cross-over numbers.
237
8.3.2 The concept of hardness applied to the pull-out process
As mentioned in the introduction to this chapter, the micro-displacements of the
yam above the plane of the fabric (described in the previous section) are very similar in
shape to the pyramidal deformations observed in the hardness experiments. There
(chapter 6), the deformation was quantified in terms of a hardness value Hv (section
6.2.2.4) where Hv = applied normal load / area of deformation. This concept can also
be applied to the pull-out experiments using appropriate simplifying assumptions. The
deformation is depicted in figure 8.12. If it is assumed that the projected deformation
area is a rectangle of width equal to two yam diameters (since the deformation is fairly
localised in the cross-over directions) and a length equivalent to the distance between
the centres of 20 yams (see section 5.2), then the projected area would be:
(20 * 0.58) * 0.6 = 6.96 mm2
The force or normal load on the deformation zone (taken as being a component of
JRF) was seen to vary for different values of imposed side tension, figure 8.4. The
actual normal load on the fabric is:
normal load = JRF * sin 20°
since the yam was pulled at an angle equivalent to the weave angle of approximately
20°. Taking the extreme JRF values of 0.3 and 0.9 N produce hardness values of
0.004 and 0.013 Kg/mm2* Inspection of table 6.1 reveals that these values lie between
the Hv values for the 100 mm holder and included cone angles of 90° and 150°. It is
worth noting however that the shape of the actual area of contact was linear in the case
of the hardness experiments while for the pull-out experiments the shape was
exponential.
238
8.3.3 Yam Migration in the Weave Plane
It will be plain that the deformations produced in this apparently simple
experiment are most complex. So far the investigation has dealt with the in and the out
of plane deformations assuming that the fabric is a rigid sheet. This is not the case and
important relative yam migrations were found to occur within the section of the fabric.
For example, Figure 8.17 describes the vertical distance between the tops of the pulled
yam and cross-over yams as measured by microscopy, chapter 5. The curve marked
"difference" represents the difference in vertical distance between consecutive
cross-over and tensile yam positions in the deformed weave. This indicates that with
increasing cross-over number (which corresponds with the increase in the force acting
at the cross-over) the yams have migrated such that the yarns crossing over the pulled
yam have been "pushed up". Those crossing under the pulled yam have been "pushed
down". Figure 8.18 also quantities this phenomenon for the two forces of 0.05 and
0.2N. The observed migration is greater for the higher forces as indicated by the fits
to the points.
8.4 Yam Pull-out Test on Untreated Aramid Fabrics
8.4.1 The Observed General Response
Two kinds of aramid fabrics were investigated: a simple weave of a aramid 2
fabric and a twill aramid 1 fabric. The response of the two to the pull-out test were
significantly different. It should be noted that in both cases the number of cross-overs
investigated was 20. The force-displacement profiles for aramid 1 and aramid 2
fabrics at zero side tension are given in Figure 8.19. The general shape of the profiles
are similar to that of the cotton, see Figure 8.1. There are however certain differences.
In the profile for the aramids, the region representing the uncrimping of the yam is not
present. This is to be expected since the aramid yams possessed very little crimp. The
2 3 9
Figure 8.17 Experimental values of the distance between the top of the cross-over or pulled yam and the surface of the weave with increasing junction number. The yarns orthogonal and crossing over the pulled yam were displaced upward more than the adjacent portions of the pulled yam and this is depicted in the line named "difference".
Figure 8.18 The "difference" line in Figure 8.17 depicted for two different force levels. The figure shows the influence of the force on the pulled yam on the level of yam migrations.

Cross-over No.
240
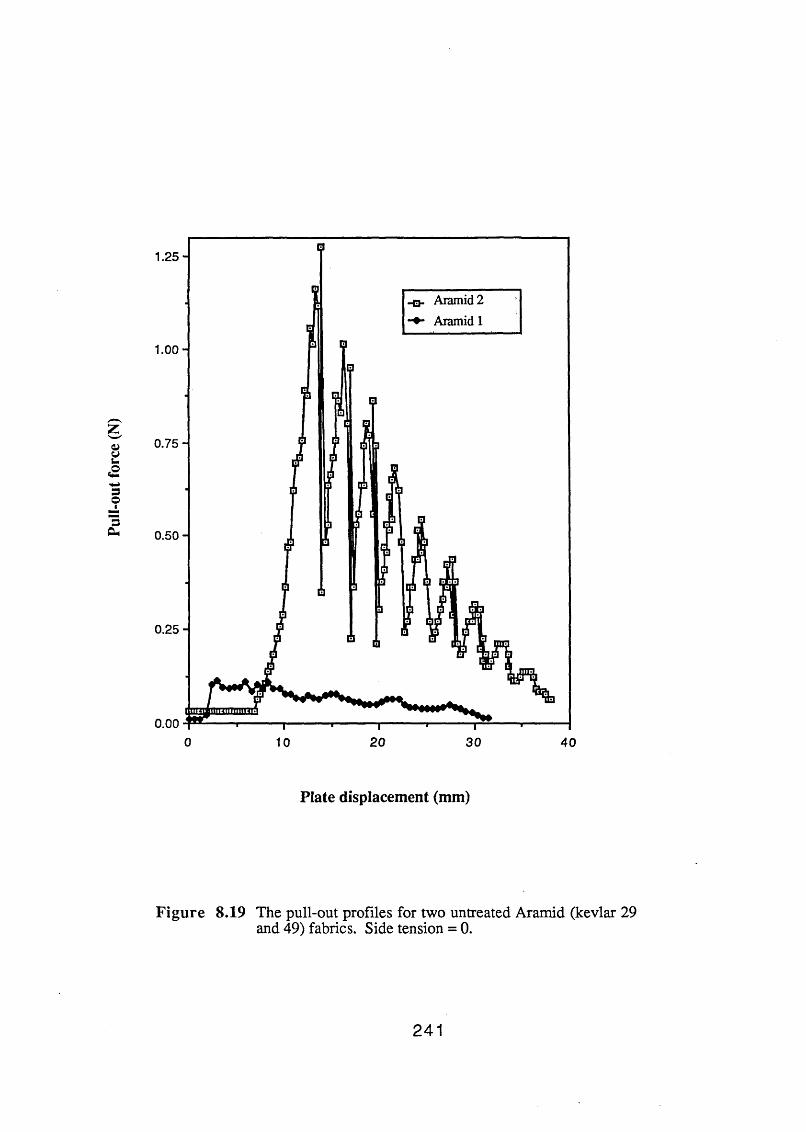
Pull-
out f
orce
(N)
1.25-□
Plate displacement (mm)
Figure 8.19 The pull-out profiles for two untreated Aramid (kevlar 29 and 49) fabrics. Side tension = 0.
241

amount of crimp was, however, greater in the aramid 2 fabric. This fabric exhibited
sharp stick-slip peaks and troughs. Another difference which is most pronounced in
aramid 1 is that immediately after JRF, the frictional forces are not reduced to a
fraction of JRF and, what is more, the weave does not produce a pronounced unsteady
state region of stick-slip. Also, unlike cotton, immediately after JRF the pulled yam
does not clear several cross-overs in one slip. Rather, it clears the cross-overs one by
one until all have been cleared. The stick-slip and the dynamic friction regions are
similar to cotton except that the aramid fibre pulled yam undergoes a much greater
number of slippages to clear a cross-over than the cotton.
8.4.2 The Effect of Weft Yam Tension
The differences between aramid 1 and 2 fabrics are clearly seen from figure
8.19. Table 8.2 lists the characteristic values of the parameters of the force-
displacement profiles for the two fabrics. First of all, the reduction of the number of
cross-overs in the aramid 2 fabric has the expected result of reducing all the parameters
accordingly. Also, increasing the side tension on the aramid 1 fabric has the same
effect as that observed with cotton, i.e. increasing the measurable parameters of the
profile. Figures 8.20 and 8.21 depicts the variation of average values of the JRF and
the dynamic gradient with lateral tension in the same way as Figure 8.4 and 8.5 for
cotton.
2 4 2
Figure 8.20 Variation of JRF with side tension for the Aramid 1 (kevlar 49) fabric.
Figure 8.21 Variation of the sliding friction force per junction (Region IV) with imposed side tension for untreated aramid 1 fabrics.

Dyna
mic
grad
ient
0.4
0 . 0 ... I I -------- J-------- I ------ I----------I 1 r - — I —■ t— .t ~ . -j .m- I ' I
0 2 4 6 8 10Side tension (N )
243
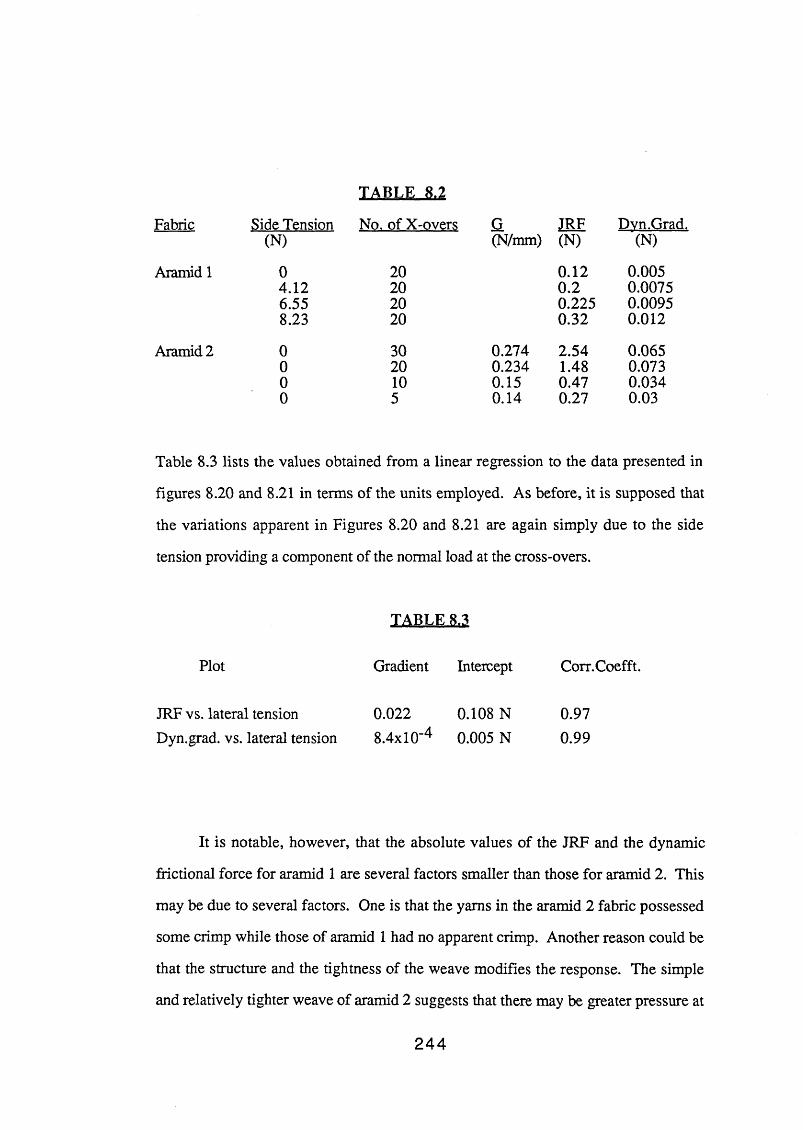
TABLE 8.2Fabric Side Tension No. of X-overs G JRF Dvn.Grad.
(N) (N/mm) (N) (N)
Aramid 1 0 20 0.12 0.0054.12 20 0.2 0.00756.55 20 0.225 0.00958.23 20 0.32 0.012
Aramid 2 0 30 0.274 2.54 0.0650 20 0.234 1.48 0.0730 10 0.15 0.47 0.0340 5 0.14 0.27 0.03
Table 8.3 lists the values obtained from a linear regression to the data presented in
figures 8.20 and 8.21 in terms of the units employed. As before, it is supposed that
the variations apparent in Figures 8.20 and 8.21 are again simply due to the side
tension providing a component of the normal load at the cross-overs.
TABLE 8.3
Plot Gradient Intercept Corr.Coefft.
JRF vs. lateral tension 0.022 0.108 N 0.97Dyn.grad. vs. lateral tension 8.4xl0'4 0.005 N 0.99
It is notable, however, that the absolute values of the JRF and the dynamic
frictional force for aramid 1 are several factors smaller than those for aramid 2. This
may be due to several factors. One is that the yams in the aramid 2 fabric possessed
some crimp while those of aramid 1 had no apparent crimp. Another reason could be
that the structure and the tightness of the weave modifies the response. The simple
and relatively tighter weave of aramid 2 suggests that there may be greater pressure at
244
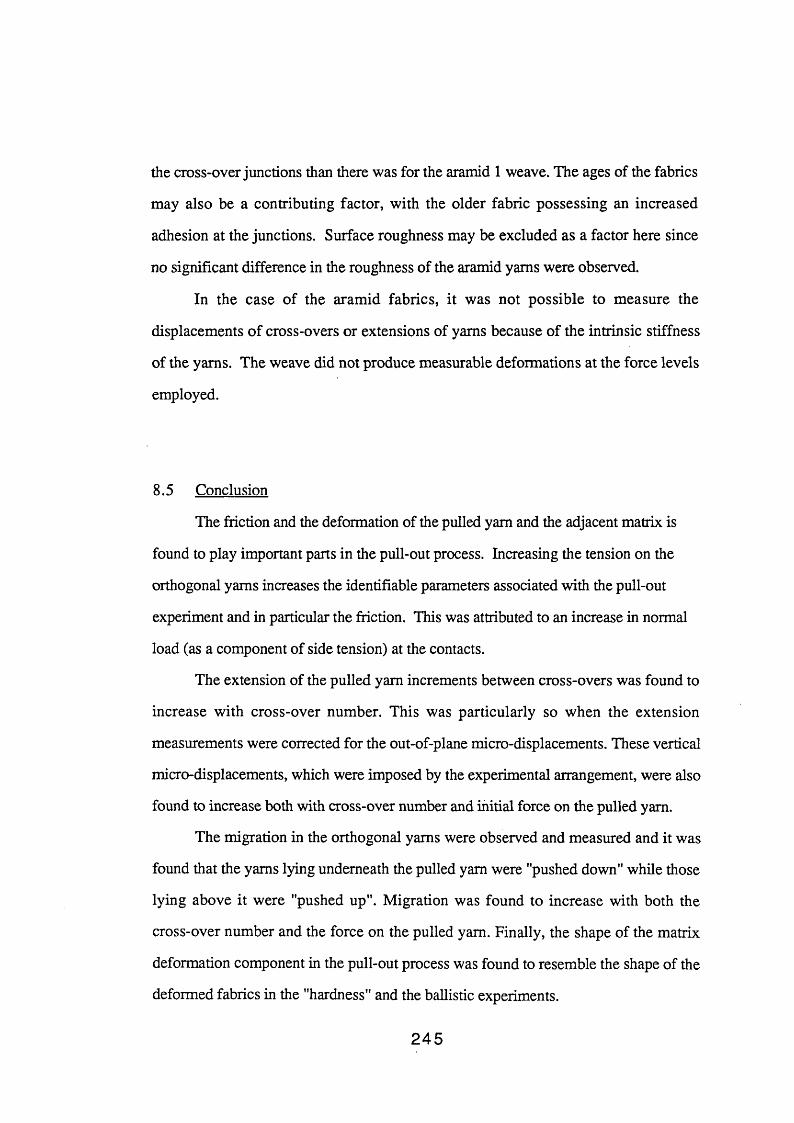
the cross-over junctions than there was for the aramid 1 weave. The ages of the fabrics
may also be a contributing factor, with the older fabric possessing an increased
adhesion at the junctions. Surface roughness may be excluded as a factor here since
no significant difference in the roughness of the aramid yams were observed.
In the case of the aramid fabrics, it was not possible to measure the
displacements of cross-overs or extensions of yams because of the intrinsic stiffness
of the yams. The weave did not produce measurable deformations at the force levels
employed.
8.5 Conclusion
The friction and the deformation of the pulled yam and the adjacent matrix is
found to play important parts in the pull-out process. Increasing the tension on the
orthogonal yams increases the identifiable parameters associated with the pull-out
experiment and in particular the friction. This was attributed to an increase in normal
load (as a component of side tension) at the contacts.
The extension of the pulled yam increments between cross-overs was found to
increase with cross-over number. This was particularly so when the extension
measurements were corrected for the out-of-plane micro-displacements. These vertical
micro-displacements, which were imposed by the experimental arrangement, were also
found to increase both with cross-over number and initial force on the pulled yam.
The migration in the orthogonal yams were observed and measured and it was
found that the yams lying underneath the pulled yam were "pushed down" while those
lying above it were "pushed up". Migration was found to increase with both the
cross-over number and the force on the pulled yam. Finally, the shape of the matrix
deformation component in the pull-out process was found to resemble the shape of the
deformed fabrics in the "hardness" and the ballistic experiments.
245

C H A P T E R N I N E
THE PULL-OUT EXPERIMENTS ON TREATED FABRICS
9.1 Introduction
The finishing of textiles involves the deposition or the reaction of various
chemical substances with a particular fabric to yield a material with the "desired"
characteristics. These substances may be lubricants, cross-linking agents such as
dimethyl silicones, cationic, anionic or non-ionic surfactants such as fabric softeners.
These treatments may produce modifications to both the surface and/or the bulk. In
the case of a yam, for example, the treating agent, depending on its molecular size and
charge, may either deposit itself on the surface of the yam or penetrate the yam and
deposit on the surface of the fibres. In the case of cotton, it may also modify the fibril
surface. Finally, of course, the substance may sorb into the fibril or monofilament
itself. The identification of the level of surface modification and the specification of
the extent of bulk sorption are generally not resolved in practice. This study has rather
assumed that the fabric treatments introduced have been surface specific, although no
evidence is available to confirm this belief.
The results of the yam pull-out experiment on treated cotton and aramid 1
(Kevlar 49) fabrics (described in Section 5.7.2) are presented in this chapter. The
results are divided into two sections: (1) the studies on submerged treated fabrics and
(2) the investigations carried out on dry treated fabrics. As well as discussing the
parameters associated with the pull-out profile, the values of cross-over moduli (as
denoted by Em) which are calculated using the spring model (described later in Chapter
10) are also presented.
2 4 6

9.2 Deformation and Pull-out Experiments Carried out on Submerged Fabrics
In these experiments, the cotton fabric was totally submerged in the solution of
the treating agent. Only cotton fabrics were used in this study. The procedure for
these experiments was described in Section 5.7.2.1. The treating agents used were
distilled water (various immersion times), pure tetradecane (0.5 and 2 hours
immersion), solutions of 1% and 2% w/w stearic acid in tetradecane and a solution of
1% w/w CTAB in distilled water. Untreated and dry cotton fabrics were also
examined in this configuration as a standard for comparison purposes. These solutions
were chosen as typical of the two generic classes of solution based fabric treatments.
The aqueous systems represent a simple common fabric treatment system. The
surfactant introduces a charge surface layer which may be considered as a very
effective electrical double layer lubricant. The apolar system was chosen to explore the
role of classical boundary lubricant action in these systems.
The parameters associated with the force-displacement profiles were introduced
in Chapter 8. Figure 9.1 shows a typical force-displacement profile for an untreated
cotton fabric and also for one submerged under water for 30 minutes. The shapes of
the profiles are similar in that they both exhibit the four response regions described
previously (Chapter 8). The profile for the submerged fabric is consistent with lower
values of G, JRF and the dynamic friction (see Chapter 8). Table 9.1 lists the values
of these parameters and values for the cross-over moduli of the treated fabrics. The
table also provides data for various immersion times in water as well as the data
produced for the CTAB solution (2 hours immersion) and the various apolar solutions.
2 4 7
pull-
out
forc
e (N
)
0.3 l
■a— Untreated
0 5 10 15 20
Plate displacement (mm )
Figure 9.1 Comparison of the pull-out profiles of dry untreated cotton fabric with that of a cotton fabric submerged under water for 30 minutes prior to pull-out. Side tension = 0.
2 4 8

TA BLE 9.1
Treatment G(N/mm) JRF(N) Dyn.grad.(xlO'U(N)
Modulus(N/m)
Untreated (dry) 0.063 0.2414 6.26 94
Water (1/2 hr) 0.038 0.125 5.1 78
Water (2 hr) 0.035 0.095 2.6 67
Water (5 hr) 0.015 0.08 1.7 42
Water (23 hr) 0.022 0.075 2.88 37
Tetradecane (1/2 hr) 0.064 0.186 6.96 127
Tetradecane (2 hrs) 0.088 0.2437 6.18 140
0.1% w/w stearic 0.064 0.25 8 54in C14 (1/2 hr)
0.2% w/w stearic 0.07 0.3 8 65in C14 (1/2 hr)
CTAB (4.5x10"4M 0.039 0.104 3 113soln.) (2 hrs)
Figures 9.2, 9.3 and 9.4 summarise the parameters G, JRF and dynamic
gradient as a function of immersion time for cotton fabrics submerged under water.
All the parameters decrease quite significantly with time. These results indicate that the
interyam friction at the junctions has decreased both relative to the friction at the dry
contacts and also with increasing immersion time. It is well known that the friction of
cotton fibres increases with increased relative humidity or "wetness"
(Viswanathan,1973). These data apparently contradict these findings. However, the
trend obtained here can be explained in the light of the fact that water penetrates
between the contacts, lubricating them and reducing the friction and this lubrication
increases with increased submerged time. However, after about five hours, the trends
seem to have ceased and in fact increased submerged times of up to 23 hours produced
higher values of G and the dynamic gradient. This may result from the swelling of the
cotton after long immersion times which in some way undermines the lubricating
2 4 9
Figure 9.2 The effect of the time of submergence on the value of the gradient G of the linear portion of the pull-out profile (Region II).
Figure 9.3 Values of junction rupture force (JRF) for submerged cotton fabrics as a function of the time submerged.

Stat
ic
0.08
Oi0.06-
s"3uWD
' □0.04-
□
0.02□
0.00-■ 0
□- I -------------1------------ 1------------ 1-------------1-------------1------------ 1-------------1------------
5 1 0 15 20 25
T im e submerged unde r w a te r (h r)
0.30-
]
0.20-
04 □0.10- □
13 □
0.00- ------- 1------- 1--------1------- 1------- 1--------1------- 1------- 1------- 1-------0 5 1 0 15 20 25
T im e submerged unde r w a te r (h r)
250

action of the water.
In the case of pure tetradecane, the parameters directly associated with the
interyarn friction processes, i.e. the JRF and the dynamic gradient, have not been
affected significantly. However, the parameters that control the compliance or
stiffness of the weave or pulled yam, i.e. G and cross-over modulus, have increased
indicating a decrease in the weave compliance. Stearic acid solution in tetradecane has
decreased this effect to some extent but the friction parameters have still scarcely been
affected. Stearic acid is known to be a fairly efficient boundary lubricant However, it
must be present at the interface before it can impart any lubricity to the fibre system.
Apparently both the amount and the application method used here were such that this
condition was not satisfied. For the cotton fabric submerged in a solution of CTAB in
water (below the CMC) the data may be compared with the results for the cotton
submerged in pure water for 2 hours. The parameters G, JRF and dynamic gradient
are hardly altered. The cross-over modulus has, however, increased by ca. 40%.
Although the absolute values of these parameters are subject to some error, the trends
are quite obvious. It is anticipated that the positively charged CTAB molecules will
attach themselves to the negatively charged cotton and produce reductions both to the
friction and the modulus through their lubrication and plasticisation properties. The
absence of these changes may be due to the low concentration of the CTAB in
solution.
9.3 Pull-out Studies on Dry Treated Fabrics
These data divide into two categories, treated cotton and treated aramid 1
fabrics. The procedures for these experiments were described in detail in Section
5.7.2.2. For the cotton, experiments were performed on fabrics treated with solutions
of PDMS (poly dimethyl siloxane) at concentrations of 2, 3, 5,7, 10% w/w and three
251
different concentrations of CTAB solution in water. The CTAB concentrations were
chosen to fall on both sides of the CMC, which for CTAB is ca. 10'3 M. These
lubricant systems are fairly typical of those used in practice but it is ofcourse not
practical to lubricate aramid fibre systems for ballistic purposes. The PDMS systems
are, however, obvious fluid lubricants and the CTAB material is an effective fabric
conditioner. The Aramid fabric was washed with acetone (soxlet extracted). The clean
fabric was then treated with a solution of 5% PDMS in petroleum spirit.
The results for the cotton fabrics are presented first. Figures 9.5, 9.6 and 9.7
depict the way in which the main parameters of a force-displacement profile, i.e. G.
JRF and dynamic gradient change with the increasing solution concentrations of
PDMS for the cotton fabrics. All three parameters are seen to decrease with the
increasing of the silicone fluid concentration. Table 9.2 presents computed values for
these parameters. The calculated moduli of the cross-over yams does not follow the
same trend. The decrease in the friction parameters may be interpreted as arising from
the lubricating properties of silicone fluids. Apparently, the effectiveness of the
PDMS has also increased with the increase in bulk concentration of the treating
solution. However, the fact that the weave compliance parameters and especially the
modulus have not decreased is perhaps because the silicone did not penetrate into the
yam structures in order to reduce the inter-fibre friction.
2 5 2

Figure 9.4 The effect of increasing submerged times on the dynamic friction force per junction of cotton fabrics during pull-out (Region IV).
Figure 9.5 The effect of PDMS solution concentration on the gradient G of the linear region of the pull-out profile. The fabric (cotton) was submerged under the PDMS solution for 2 hours and subsequently dried prior to the experiment.
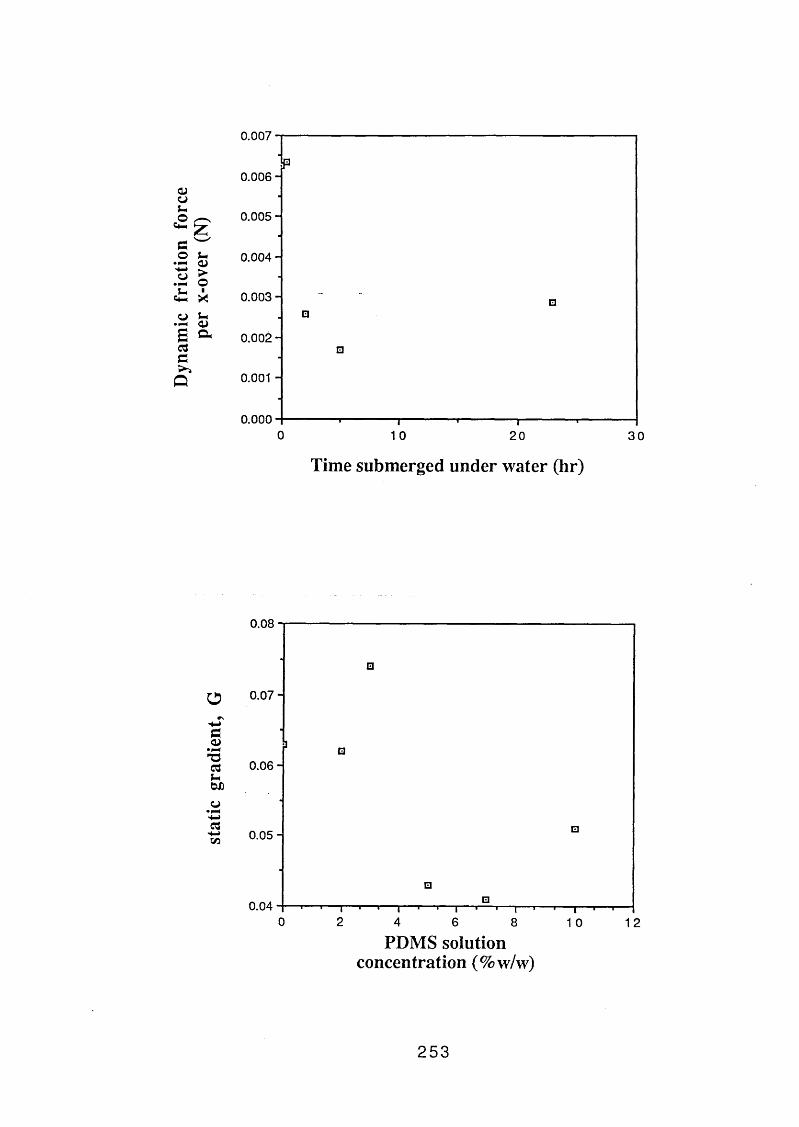
Dyna
mic
frict
ion
forc
e
0.007
£$-<u>01Xua>cu
0.006
0.005
0.004
0.003
0.002
0.001
0.0000 10 20 30
T im e submerged unde r w a te r (h r)
P
“T—1 0
—T“20
0.08 -
• □
o 0.07-
ea> ] □aauOS)
0.06-
Os-> C3 s—> Kft 0.05- □
*□
0.04- T —i— i— i— i— — i— i— □— i— i— i— t -r™ i i -i1 —0 2 4 6 8 1 0 1 2
PDM S so lu tion concen tra tion (% w /w )
2 5 3

Figure 9.6 Variation of JRF with increased concentration of PDMS in the treatment solution.
Figure 9.7 The effect of PDMS treatment solution concentration on the dynamic friction force per junction of cotton fabrics.

Dyna
mic
frict
ion
forc
e
0.25-t-
0.20 -j
0.15-
0 .10 -
0.05-
o.oo H— i—*— i— i— i— i— i i i— i— i— r—i— i i" i "■ i0 2 4 6 8 10 12
PDM S so lu tion concen tra tion (% w /w )
u>o
■
Xuo>A
0.008
0.007
0.006 -
0.005
PDM S so lu tion concen tra tion (%wlw)
254
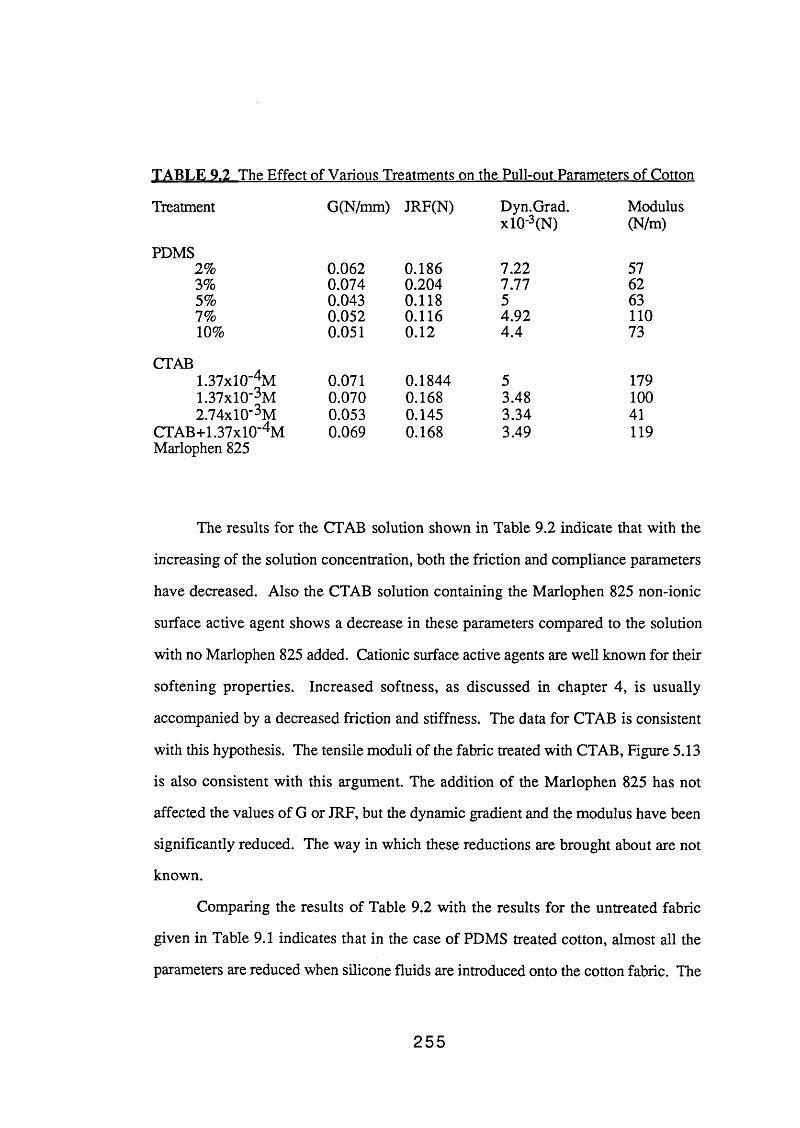
TABLE 9.2 The Effect of Various Treatments on the Pull-out Parameters of Cotton
Treatment G(N/mm) JRF(N) Dyn.Grad.x10‘3(N)
Modulus(N/m)
PDMS2% 0.062 0.186 7.22 573% 0.074 0.204 7.77 625% 0.043 0.118 5 637% 0.052 0.116 4.92 11010% 0.051 0.12 4.4 73
CTAB1.37x10'% 0.071 0.1844 5 1791.37x10'% 0.070 0.168 3.48 1002.74x10'% 0.053 0.145 3.34 41
CTAB+1.37x10'4M 0.069 0.168 3.49 119Marlophen 825
The results for the CTAB solution shown in Table 9.2 indicate that with the
increasing of the solution concentration, both the friction and compliance parameters
have decreased. Also the CTAB solution containing the Marlophen 825 non-ionic
surface active agent shows a decrease in these parameters compared to the solution
with no Marlophen 825 added. Cationic surface active agents are well known for their
softening properties. Increased softness, as discussed in chapter 4, is usually
accompanied by a decreased friction and stiffness. The data for CTAB is consistent
with this hypothesis. The tensile moduli of the fabric treated with CTAB, Figure 5.13
is also consistent with this argument. The addition of the Marlophen 825 has not
affected the values of G or JRF, but the dynamic gradient and the modulus have been
significantly reduced. The way in which these reductions are brought about are not
known.
Comparing the results of Table 9.2 with the results for the untreated fabric
given in Table 9.1 indicates that in the case of PDMS treated cotton, almost all the
parameters are reduced when silicone fluids are introduced onto the cotton fabric. The
255
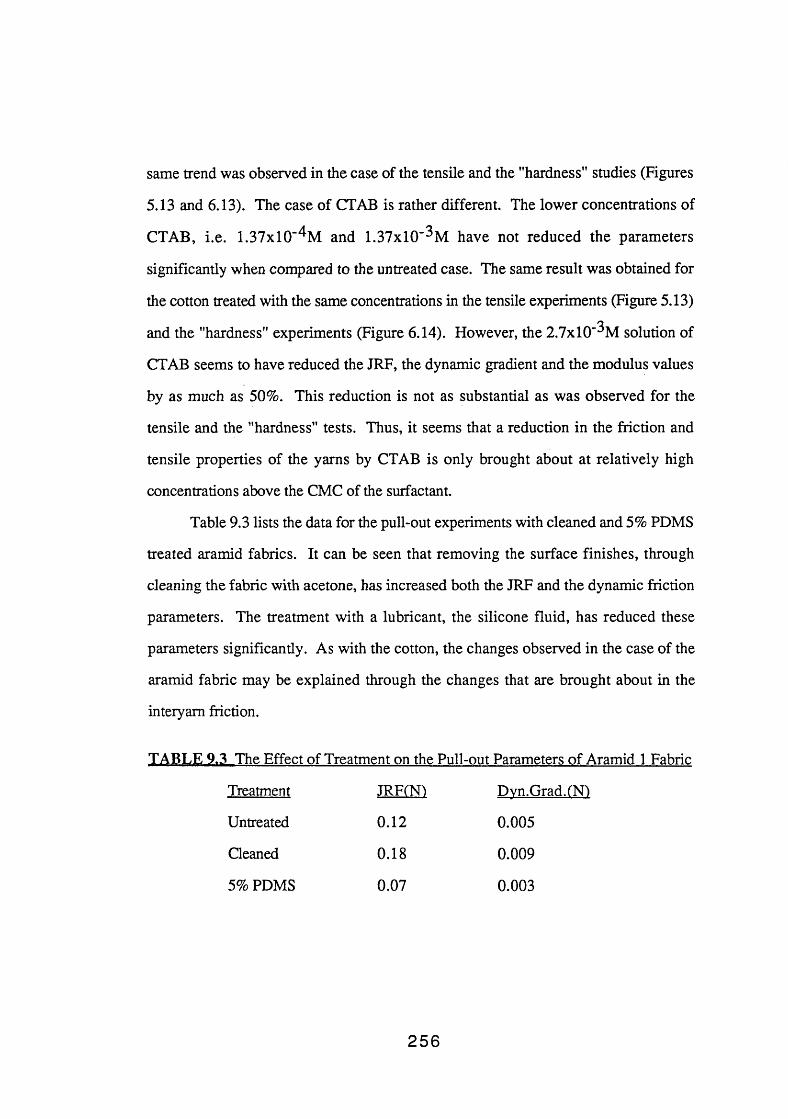
same trend was observed in the case of the tensile and the "hardness" studies (Figures
5.13 and 6.13). The case of CTAB is rather different. The lower concentrations of
CTAB, i.e. 1.37xlO‘^M and 1.37xlO"^M have not reduced the parameters
significantly when compared to the untreated case. The same result was obtained for
the cotton treated with the same concentrations in the tensile experiments (Figure 5.13)
and the "hardness" experiments (Figure 6.14). However, the 2.7xlO"^M solution of
CTAB seems to have reduced the JRF, the dynamic gradient and the modulus values
by as much as 50%. This reduction is not as substantial as was observed for the
tensile and the "hardness" tests. Thus, it seems that a reduction in the friction and
tensile properties of the yarns by CTAB is only brought about at relatively high
concentrations above the CMC of the surfactant.
Table 9.3 lists the data for the pull-out experiments with cleaned and 5% PDMS
treated aramid fabrics. It can be seen that removing the surface finishes, through
cleaning the fabric with acetone, has increased both the JRF and the dynamic friction
parameters. The treatment with a lubricant, the silicone fluid, has reduced these
parameters significantly. As with the cotton, the changes observed in the case of the
aramid fabric may be explained through the changes that are brought about in the
interyam friction.
TABLE 9.3 The Effect of Treatment on the Pull-out Parameters of Aramid 1 Fabric
Treatment JRFfFTi Dvn.Grad.fNl
Untreated 0.12 0.005
Cleaned 0.18 0.009
5% PDMS 0.07 0.003
256
9.4 Summary
The response of treated cotton and aramid 1 fabrics to the pull out of a single
yam from the fabric matrix has been described. These responses were quantified in
terms of two processes, the interyam friction, being represented by JRF and the
dynamic gradient, and the weave compliance represented by the parameter G and the
modulus. In most cases treatment with the chosen surface agents was seen to be
accompanied by a reduction in these parameters and in particular in the friction. This
was seen to be more pronounced when the lubricant or the surface active agent was
deposited at the interface as in the dry treated studies rather than when it was present in
solution as in the submerged experiments. In the case of PDMS and CTAB treatments,
increased concentration of the treating agents were found to have a positive effect on
the extent of the lubrication.
257

C H A P T E R T E N
ANALYSIS AND DISCUSSION
10.1 Introduction
In previous chapters the various experimental data obtained in this study were
presented without substantial comment or analysis. This chapter will seek to explain
and evaluate these data in more detail and also in the light of some of the information
described in Chapters 2, 3 and 4.
The chapter is loosely divided into several sections each dealing with the
analysis and discussion of a particular set of experiments. However, the important
notion which should be pointed out is that the "hardness", the ballistics and the
pull-out processes all involve similar fabric distortions. That is a pyramidal or a
partially pyramidal deformation the shape of which may be represented fairly well by
an exponential relationship, figure 8.13. Both the "hardness" and the ballistic
experiments involve yam pull-out, matrix shear and yam extension processes of
varying degrees. This was particularly so in the case of the ballistic impact of
lubricated aramid fabrics. Thus the three experiments are closely related, except that
the microscopic deformation and migration processes which occur during the
quasi-static indentation and the ballistic processes are more amenable to investigation
in the pull-out experiments.
A local displacement model is presented first which describes the matrix shear
during the pull-out experiment. The variation of JRF and kinetic friction with load on
the weft yams is then discussed in conjunction with a fairly simple geometric
representation of the matrix. Next, the result of applying the diaphragm model (thin
plate model) to the "hardness" experiments is discussed. Finally, the application of the
258

thin plate model to the ballistic deformation experiments is described and the results
discussed.
10.2 Matrix Shear during the "Pull-out" Experiment
10.2.1. Introduction
The results and observations relating to the pull-out experiments were mostly
discussed jp chapter 8 under separate headings. These included the general results and
observations of the pull-out experiments and their relation to side force and the in plane
and out of plane micro-displacement of the weave. This section outlines a model that
will attempt to predict the form of the elastic part of the force-displacement profiles, of
which Figure 8.1 is a typical example. The model is based upon the behaviour of a
series of springs depicted in Figure 10.1. Several cases are examined. The way in
which the imposed force, F, produces the localised extensions which propagate along
the length of the tensile yam has been dealt with by Sebastian e t a l (1986). In that
model, Figure 10.1(b), two assumptions were made. First, the tensile (pulled) yam
modulus, Ey, was taken as a constant. Second, the force experienced by the weave
which acts at the individual cross-overs was also assumed to be constant and thus
independent of the local displacements. This model is effective in so far as it fits the
form of the experimental data but it has many obvious weaknesses. A model is
offered here which is based on the previous model but allows the tensile yam
modulus, Ey, to be a function of strain, e. It also, in contrast, considers that the
elasticity of the matrix arises from the resolved tensile forces, fc, in the adjacent
weave. Hence the cross-over restraining forces vary with the local strain developed in
the cross-overs.
259
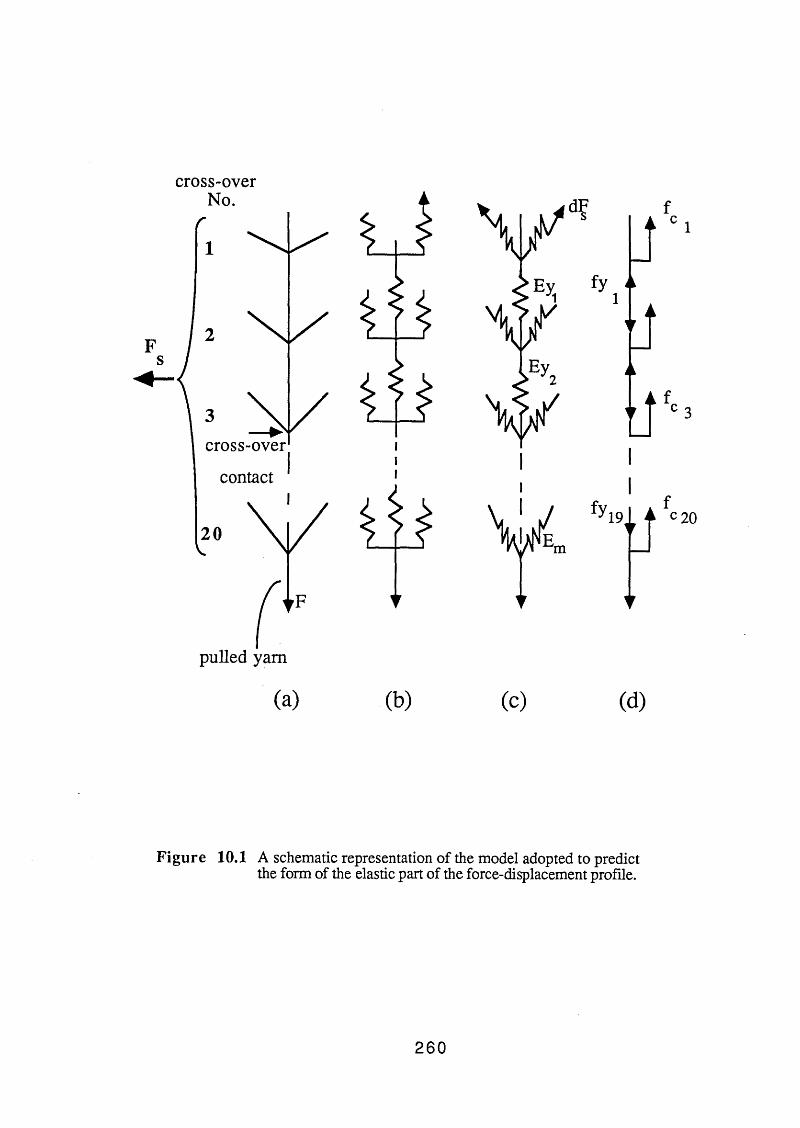
cross-overNo.
iii
(a) .(b)
f1
fyi
3
fc 20
t
(c) (d)
Figure 10.1 A schematic representation of the model adopted to predict the form of the elastic part of the force-displacement profile.
260
10.2.2 Theoretical Representation of the Model
Figure 10.1(b) depicts the original model adopted by Sebastian e t a l (1986). As
was mentioned earlier, it assumed the tensile yam modulus to be independent of strain
and took the forces in the cross-over yams to act in the same direction as the tensile
yam. Although this model effectively described a number of trends in their data, it is
clear that the simplified assumptions mentioned undermine its credibility. Figures
10.1(c) and 10.1(d) depict the model to be described in this section. This model,
whilst still first order, does avoid some of the major weaknesses of the original
approach. It, for example, considers the forces on the cross-over yams to act, not
along the direction of the tensile yam, but at an angle to it; Figure 10.1(d) illustrates
the action of these forces. Another facet of the current model is that it assumes a
common stress-strain curve for all the tensile elements, that is for both the pulled yam
and the cross-over yams. It actually turns out that it is sufficient in the system to be
described to assume that the cross-over yam modulus, Em, is independent of the strain
and is thus constant.
The basic elements of the model are now described. Reference to Figure 8.10
shows that the extensions of the tensile yam elements between adjacent cross-overs
increased with increasing cross-over number. (N=20 at the hook where the force is
applied). These individual extensions, eN, can be adequately related to the cross- over
number, N, by the equation:
eN = a.exp (b.N) (10.1)
where a and b are constants. The experimental values of e as a function of N were
shown in Figure 8.10. The values were calculated by subtracting the displacements of
adjacent cross-over positions. The relation between the cross-over displacements, dN,
261
and eN may be written as:
(10.2)
dN as defined in Figure 10.2.
In order to calculate the magnitude of dN, one can either use the experimental values of
e or those incorporated in Equation (10.1) with appropriate fitting parameters. In the
subsequent analysis, the actual experimental values of eN were used.
Figure 10.2 shows the definitions of geometrical parameters associated with a
single cross-over region, do is the half width of the fabric transverse to the pulled yam;
fen is the force on an element of the tensile yam acting in the cross-over direction. 0N
is the weave angle. In the model it is assumed that during the pull-out, the cross-over
displacements, dN, are solely brought about by the tensile extension of the cross-over
yams. The yams are therefore assumed to be perfectly flexible. There will also be a
contribution from the extension of the local element of the tensile pulled yam. In
addition, these extensions are regarded as acting through the weave to the edge of the
fabric where it was clamped. If the half extension of the cross-over yams is
represented by ^ (Figure 10.1(c)) then:
The model assumes that a global spring modulus, Em, operates on the
cross-over yams which is independent of strain and is thus a constant. It also assumes
(10.3)
262

clamp
Figure 10.2 A schematic representation of a single cross-over region.
263

that the extension of the cross-over yams, both singly and as a whole (i.e. the addition
of all cross-over extensions) is proportional to the forces acting on them. That is, fcN
in the case of a single cross-over and the JRF in the case of the whole matrix. Thus
one can write the appropriate relationships for Em and fcN as:
NEm = JRF/X 2 8 cos 0N (10.4)
1
and fcN = Em . 5n (10.5)
The factor 2 in Equation (10.4) arises from the fact that there are two force
components generated by the cross-over yams. Hence, a knowledge of the values of £
and JRF yields a value for Em ( Equations (10.1) to (10.4) inclusive) and this enables
fcN to be calculated.
The force fyN on a particular element of the tensile yam can be thought of as
being made up of the combination of the force on the element before it, fy^-i, and a
component of the force on the adjoining cross-over yam, fcN. The relationship can be
written as:
fyN = fyN-i + 2 fcN cos 0 (10.6)
This argument is then applied throughout the weave back to the first cross-over where
the yam is cut (furthest from the hook) where:
fyi = fcj since fy0 = 0
Hence one appreciates that the forces on the tensile yam elements are expended
through extending the cross-over yarns and the tensile yam elements only act as
springs to transmit the force down the line of the pulled yam. Thus:
264
fyN = X 2 fcN cos 0 (10.7)
The important experimental variable, as mentioned in Chapter 8, Figure 8.2,
was the imposed side tension. fcN can also be thought of as arising from the
combination of a component of fyN in the direction of the cross-over yam and the
initial tension imposed on the cross-over yam, fs. Equation (10.8) represents this
relationship and provides a means of examining the effect of fs on fcN.
0fcN = fyN sin 0 + fs (10.8)
Finally, a tensile yam element spring constant, EyN, can be calculated using the
calculated values of fyN and the experimental values of eN, since by definition:
fyn = e yn • eN 00.9)
In summary, the experimental observations, together with the model and
Equations (10.1) to (10.9) inclusive, have enabled the calculation of (a) a global
cross-over modulus, Em, (b) the forces acting on individual cross-over and tensile
yam elements and (c) spring moduli for discrete elements of the tensile (pulled) yam.
The calculation of these values provides useful information when comparing the effect
of different mechanical and chemical modifications on the deformation behaviour of
weaves.
265
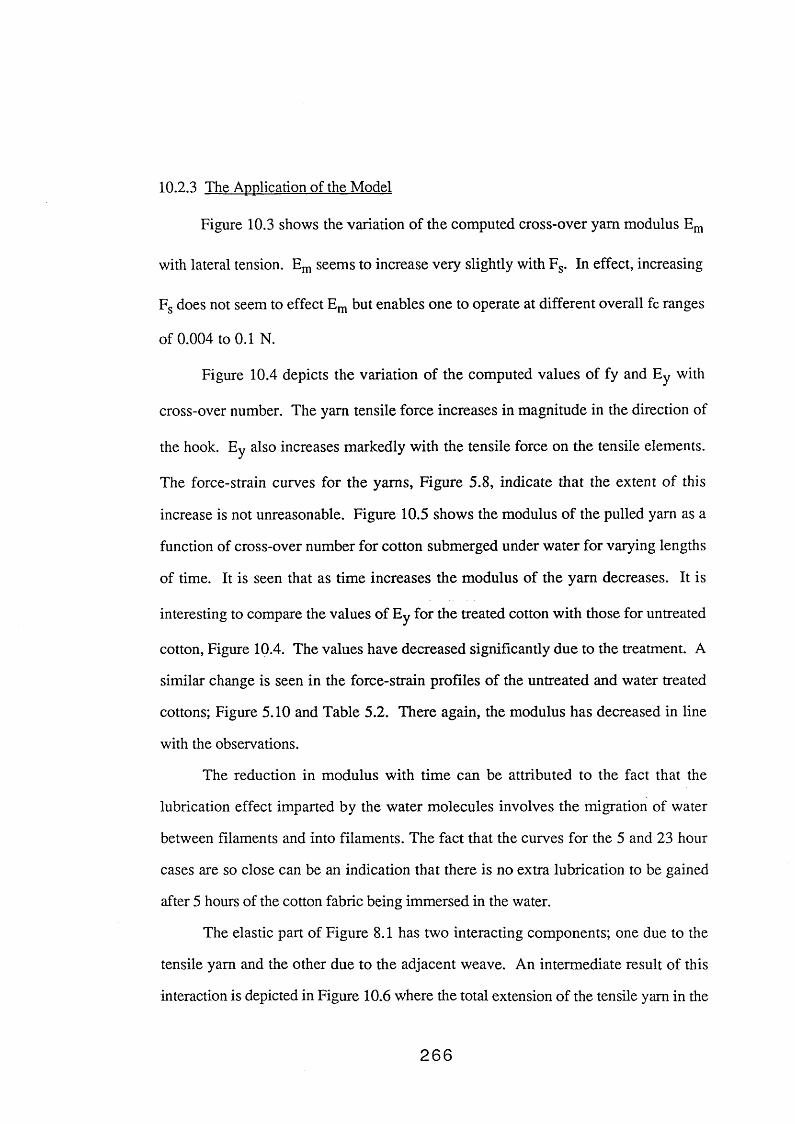
10.2.3 The Application of the Model
Figure 10.3 shows the variation of the computed cross-over yam modulus Em
with lateral tension. Em seems to increase very slightly with Fs. In effect, increasing
Fs does not seem to effect Em but enables one to operate at different overall fc ranges
of 0.004 to 0.1 N.
Figure 10.4 depicts the variation of the computed values of fy and Ey with
cross-over number. The yam tensile force increases in magnitude in the direction of
the hook. Ey also increases markedly with the tensile force on the tensile elements.
The force-strain curves for the yams, Figure 5.8, indicate that the extent of this
increase is not unreasonable. Figure 10.5 shows the modulus of the pulled yam as a
function of cross-over number for cotton submerged under water for varying lengths
of time. It is seen that as time increases the modulus of the yam decreases. It is
interesting to compare the values of Ey for the treated cotton with those for untreated
cotton, Figure 10.4. The values have decreased significantly due to the treatment. A
similar change is seen in the force-strain profiles of the untreated and water treated
cottons; Figure 5.10 and Table 5.2. There again, the modulus has decreased in line
with the observations.
The reduction in modulus with time can be attributed to the fact that the
lubrication effect imparted by the water molecules involves the migration of water
between filaments and into filaments. The fact that the curves for the 5 and 23 hour
cases are so close can be an indication that there is no extra lubrication to be gained
after 5 hours of the cotton fabric being immersed in the water.
The elastic part of Figure 8.1 has two interacting components; one due to the
tensile yam and the other due to the adjacent weave. An intermediate result of this
interaction is depicted in Figure 10.6 where the total extension of the tensile yam in the
2 6 6

Figure 10.3 The effect of side tension on the cross-over yarn spring constant, Em.
Figure 10.4 Variation of the forces and the tensile yam moduli Ey associated with discrete elements of the pulled yam.
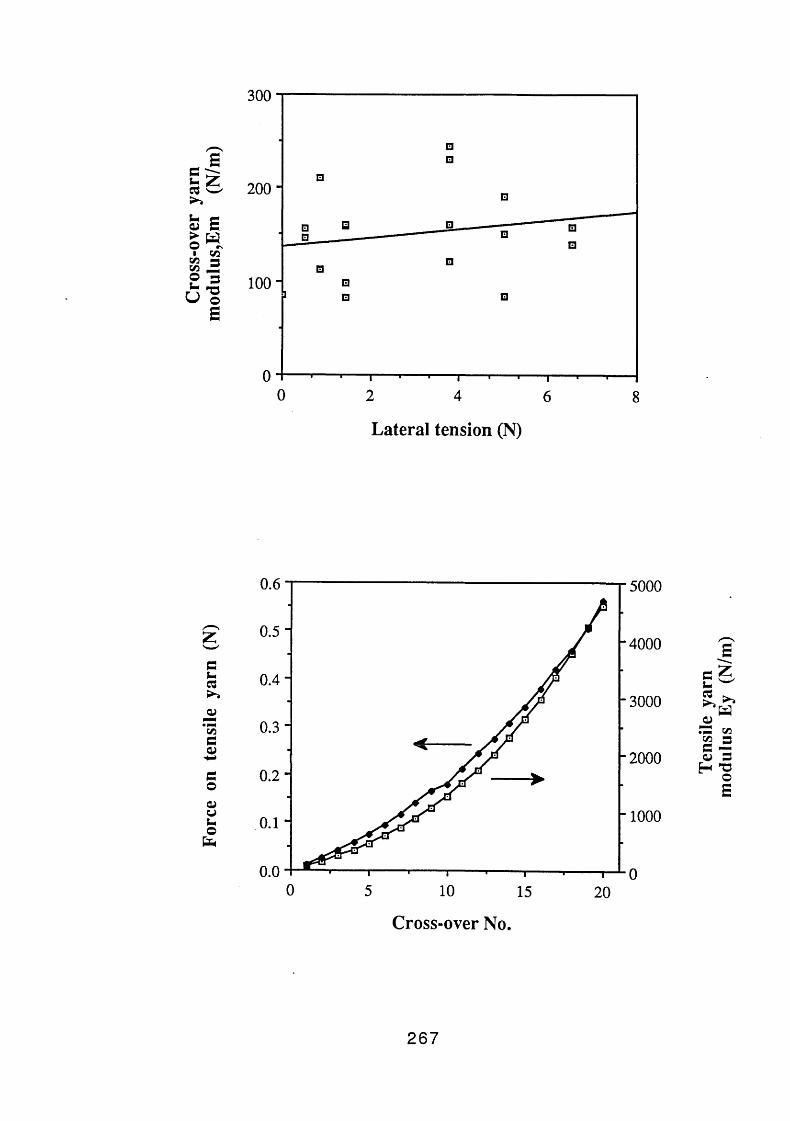
2 6 7
Forc
e on
ten
sile
yarn
(N)
Tens
ile y
arn
mod
ulus
Ey
(N/m
)
5000
o
o -
-
Cros
s-ov
er y
arn
mod
ulus
,Em
(N
/m)
□
□ □
□
□
□ □
N> O o I □
□ □
□
o o
00

1200
1000-
'S s= 3 *CMO "O o8 B3 C XJ ** O C5
800
6 0 0 -
400"
200 - □ ♦ qB ♦ * B 5
D • ♦ . 0 B
□ ♦♦ a
• n♦ o
♦ B♦ 0
9
0 8 * S b b » *0
~T~10
_T _
15
Time under water(hr)
□ 0.5
♦ 2
b 5
o 23
20
Cross-over num be r
Figure 10.5 Values of the moduli of discrete elements of the pulled yam as a function of cross-over number for cotton fabrics submerged under water for variouslengths of time.
268
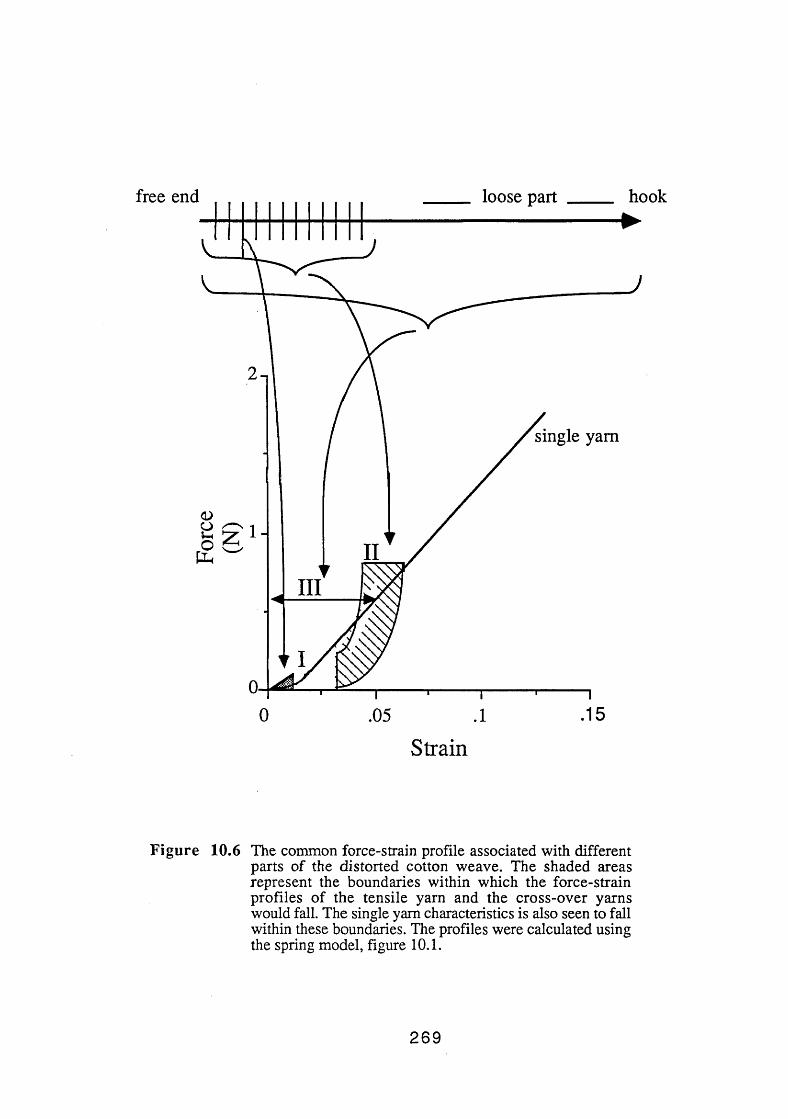
Figure 10.6 The common force-strain profile associated with different parts of the distorted cotton weave. The shaded areas represent the boundaries within which the force-strain profiles of the tensile yarn and the cross-over yarns would fall. The single yam characteristics is also seen to fall within these boundaries. The profiles were calculated using the spring model, figure 10.1.
269

weave is described as a force-strain relation (a common force-strain profile). The
curve is highly non-linear. Also shown in Figure 10.6 is the corresponding
experimental curve for a free yam, Figure 5.8. The force-strain profile is obtained
using the model described. The significance of the common force-strain curves of
Figure 10.6 is that the pulled yam tensile part is associated with high forces, while the
adjacent weave characteristics are associated with relatively low forces. Part (I)
represents the cross-over (matrix) only characteristics; Part (II) the combined
characteristics of the cross-overs and the yams between them and Part (HI) the matrix
and the yam between cross-overs as well as the loose part of the tensile yam. The free
yam tensile characteristics is seen to represent the interaction between matrix and
pulled yam responses fairly well.
The ultimate requirement of the model is the prediction of the form of the elastic
part of the force-displacement profile, Figure 8.1. This is done by using the Equations
10.2 to 10.9 and the reverse procedure to that used in the model. Here, experimental
tensile moduli of single yams together with chosen values of force are used in
Equations 10.4 to 10.9 to calculate 6. Then using this value of 5 and do, a value for
djq and hence e is calculated. By increasing the value for the force from a small
number up to the experimental JRF, the force-displacement characteristics of
cross-over number 20 is calculated. Figure 10.7 shows the experimental
force-displacement profile (also see Figure 8.2), together with the calculated curve.
The forces generated in the model ranged from 0.01 to 0.4 N and the values of the
tensile moduli adopted ranged from 100 to 400 N/m. At the relatively low force levels
that the pull-out test operates at, the moduli are realistic; Figure 5.7. It is seen that at
comparative values of force, the model predicts the displacements to be approximately
half the experimental value. This indicates that the tensile moduli used are about
270

Forc
e (N
)
F igure 10.7 Comparison of the experimental force-displacement profile (elastic region II) with data obtained using the spring model.
Displacement (mm)
271

double the values of the modulus operating in the system. In fact, when comparing
the moduli obtained from the model, Figure 10.3, and those obtained from single yam
experiments, it can be seen that the values for the matrix ranged from 100 to 200 N/m,
while those for a free yam ranged from 100 to 400. If a value of 100 to 200 is used in
the latter calculations, the "model" curve of Figure 10.7 would lie much closer to the
experimental curve. Thus the model provides a satisfactory description of these data.
10.2.4 Variation of JRF and Kinetic Friction with Side Load
The variation of side tension in a fibre pull-out experiment produces significant
and systematic changes in the force-imposed displacement profile and the associated
migration of cross-over points in the weave. Figure 10.8 illustrates the confined
environment of the yams in the weave as well as the displacements of the pulled yam
and the cross-over yams in contact with it and the direction of cross-over yam
migration. Figure 10.9 is a force diagram showing the resolved components of the
forces acting upon the cross-overs. The experimentally determined angles a and <}) of
this figure are plotted in Figure 10.10. It can be seen that towards the hook, a
decreases significantly while ({) increases to a lesser extent. Also evident is that if no
tension is applied to the pulled yam, a = (}) = 20 and this is the weave angle 0 since the
fabric weave is orthogonally symmetrical.
A rather complicated analysis of the force components acting at the cross-overs
has been carried out which will be presented later. The derivation of the formulae are
given in Appendix 2. First, a simplified treatment will be followed, which brings out
the main points in a more direct way. It is assumed that the side force Fs acts
uniformly throughout the fabric. There are approximately 150 cross-over yams in the
2 7 2
Figure 10.8 Schematic representation of the tensile and the cross-over yarns inside the cotton weave showing the associated angles.
Figure 10.9 A diagram of the forces acting at a cross-over junction.

(b)
273
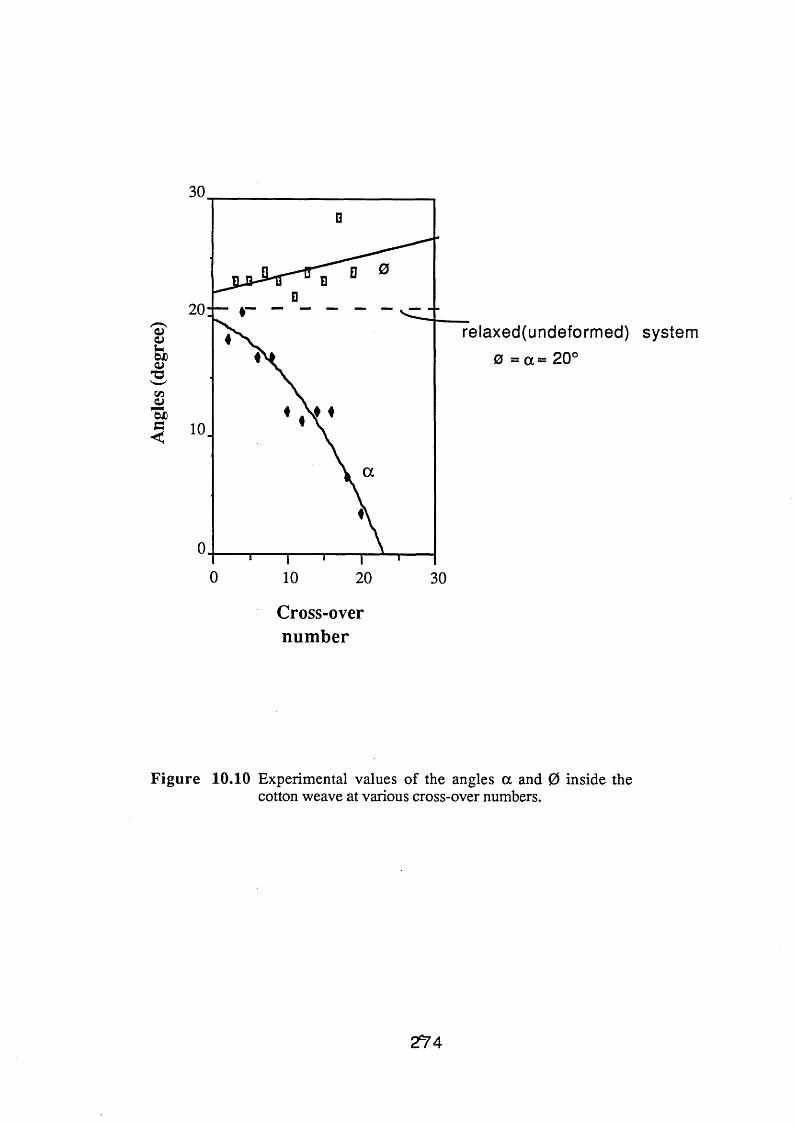
30
Cross-overn u m b e r
Figure 10.10 Experimental values of the angles a and 0 inside the cotton weave at various cross-over numbers.
2*74

cotton fabric specimen studied so that the side force fs in each cross-over yam is ca.
Fs/150. For the fabric as shown in Figure 10.8, if all other distortions are neglected,
the vertical component p of fs is:
p = 2 fs sin0 (10.10)
If we assume that this contributes a frictional resistance of jxp (assuming a constant
coefficient of friction), the additional friction force at each cross-over will be:
jip = |i 2 fs sin 0 (10.11)
= |i fs x 0.7 since 0 * 20°
= h - ^ - ° - 7 = ^ 4 -7 1 0 ' 3 f s
From frictional measurements of single yams, Figure 5.4, it would be reasonable to
take p.« 0.65.
Hence |ip = 3x10'3 Fs.
In this simple analysis the influence of angles a and <j) on the measured force are not
considered. The more complex analysis is given in Appendix 2. Then the observed
dynamic friction force per cross-over will be:
f = f0 +3xl0-3 Fs (10.12)
where fQ is the intrinsic frictional force when Fs is zero. The observed results of
Figure 8.5 for orthogonal free pairs gave:
f = 0.008 + 3xlO-3 Fs
suggesting that the fabric weave itself produces a normal force between yams of the
order of 0.012N since 0.012 x 0.65 = 0.008. The simple model thus agrees very well
with the observed influence of Fs on the dynamic friction. A detailed analysis
275
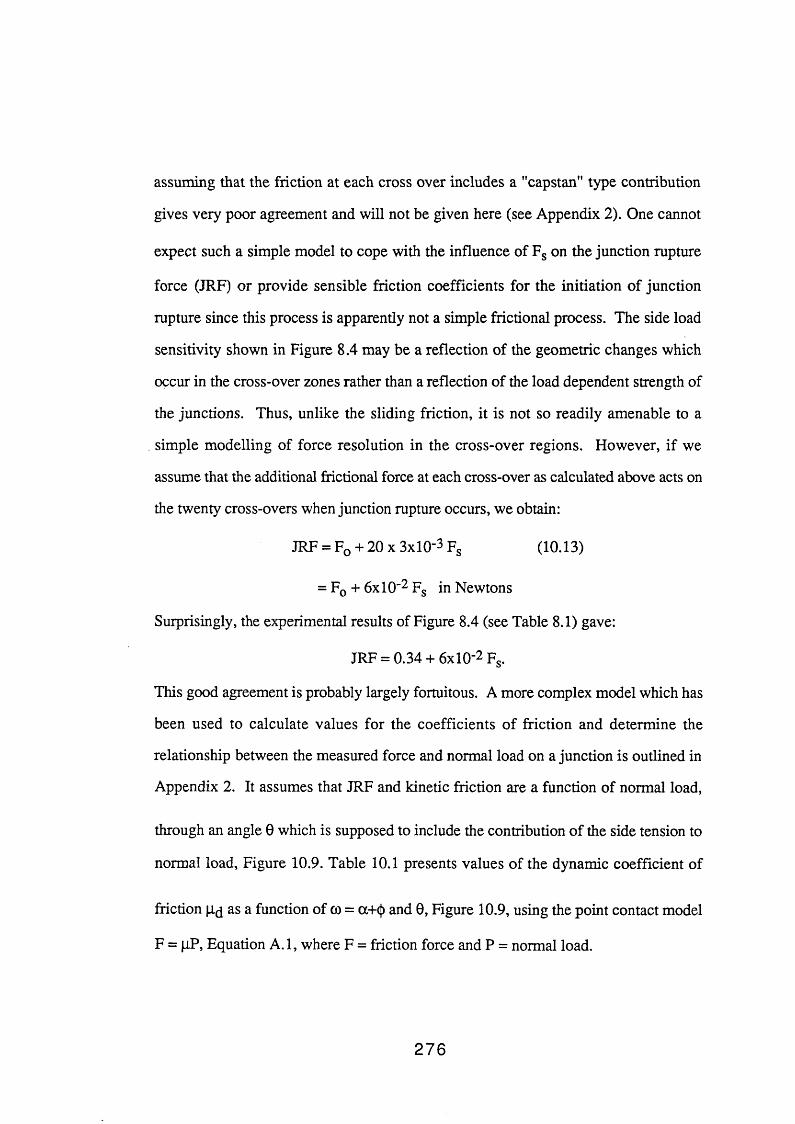
assuming that the friction at each cross over includes a "capstan” type contribution
gives very poor agreement and will not be given here (see Appendix 2). One cannot
expect such a simple model to cope with the influence of Fs on the junction rupture
force (JRF) or provide sensible friction coefficients for the initiation of junction
rupture since this process is apparently not a simple frictional process. The side load
sensitivity shown in Figure 8.4 may be a reflection of the geometric changes which
occur in the cross-over zones rather than a reflection of the load dependent strength of
the junctions. Thus, unlike the sliding friction, it is not so readily amenable to a
simple modelling of force resolution in the cross-over regions. However, if we
assume that the additional frictional force at each cross-over as calculated above acts on
the twenty cross-overs when junction rupture occurs, we obtain:
JRF = F0 + 20 x 3xlO-3 Fs (10.13)
= F0 + 6xl0"2 Fs in Newtons
Surprisingly, the experimental results of Figure 8.4 (see Table 8.1) gave:
JRF = 0.34+ 6xl0-2 Fs.
This good agreement is probably largely fortuitous. A more complex model which has
been used to calculate values for the coefficients of friction and determine the
relationship between the measured force and normal load on a junction is outlined in
Appendix 2. It assumes that JRF and kinetic friction are a function of normal load,
through an angle 0 which is supposed to include the contribution of the side tension to
normal load, Figure 10.9. Table 10.1 presents values of the dynamic coefficient of
friction p^ as a function of co = oc+<}) and 0, Figure 10.9, using the point contact model
F = pP, Equation A. 1, where F = friction force and P = normal load.
276

Table 10.1 (F=|iP)
f t0) 30 32 34 36 38 40
D12 0.113 0.15 0.1514 0.22 0.18 0.15 0.115 0.3 0.25 0.21 0.17 0.116 0.37 0.33 0.28 0.23 0.18 0.1317 0.45 0.4 0.35 0.3 0.27 0.2218 0.5 0.45 0.43 0.4 0.35 0.319 0.55 0.53 0.5 0.45 0.43 0.3820 0 .6 0.57 0.55 0.52 0.5 0.4521 0 .65 0 .63 0 .6 0.57 0.55 0.5322 0.7 0 .66 0.65 0.63 0.6 0.5823 0.73 0.7 0 .68 0 .66 0 .65 0.63t4 0.75 0.74 0.73 0.7 0.7 0 .6725 0.77 0.76 0.75 0.74 0.73 0.72
Table 10.2 presents a similar set of results to Table 10.1 using an alternative
point contact model; F = F0 + (iP.
Table 10.2 (F=F0 + jiP)
A0) 30 32 34 36 38 40
013 0.15 0.15 0.114 0.3 0.27 0.18 0.13 0.115 0.35 0.33 0.3 0.27 0.2 0.1516 0.45 0.4 0.37 0.35 0.33 0.317 0.48 0.45 0.45 0.43 0.43 0.418 0.53 0.51 0.5 0.5 0.5 0.4719 0.57 0.55 0.55 0.54 0.54 0.5320 0.6 0.6 0.57 0.58 0.58 0.5721 0 .63 0.63 0.63 0.62 0.62 0.6222 0.65 0.65 0.65 0.65 0 .65 0 .6523 0 .67 0 .67 0.67 0 .67 0 .67 0 .6724 0.7 0.7 0.7 0.7 0.7 0 .6925 0.73 0.73 0.73 0.73 0.73 0.73
Finally, Table 10.3 presents the results of applying a capstan model of contact;
F = F0 exp (fico).
277
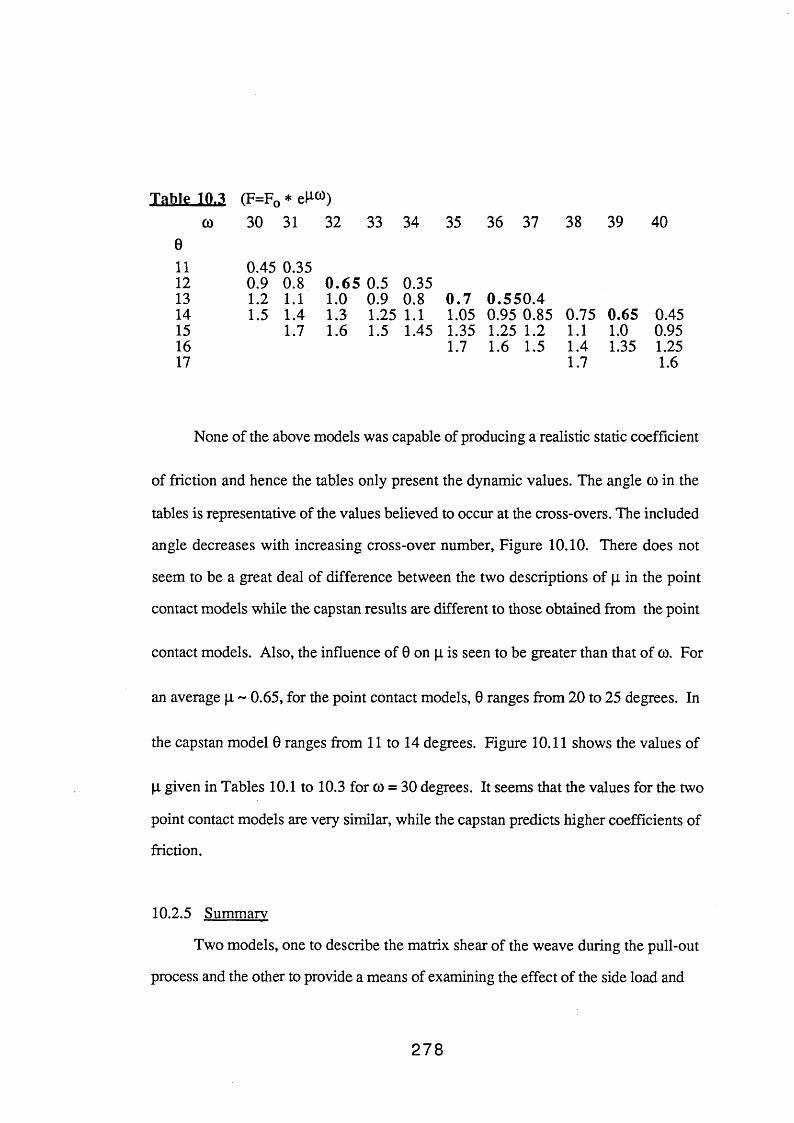
35 36 37 38 39 40Table 10.3 (F=F0 * e ^ )
co 30 31 3201 112
33 34
0.45 0.35 0.9 0.8 0 .65 0.5 0.35
13 1.2 1.1 1.0 0.9 0.8 0 .7 0.550.414 1.5 1.4 1.3 1.25 1.1 1.05 0.95 0.85 0.75 0.65 0.4515 1.7 1.6 1.5 1.45 1.35 1.25 1.2 1.1 1.0 0.9516 1.7 1.6 1.5 1.4 1.35 1.2517 1.7 1.6
None of the above models was capable of producing a realistic static coefficient
of friction and hence the tables only present the dynamic values. The angle co in the
tables is representative of the values believed to occur at the cross-overs. The included
angle decreases with increasing cross-over number, Figure 10.10. There does not
seem to be a great deal of difference between the two descriptions of |x in the point
contact models while the capstan results are different to those obtained from the point
contact models. Also, the influence of 0 on p. is seen to be greater than that of co. For
an average p. ~ 0.65, for the point contact models, 0 ranges from 20 to 25 degrees. In
the capstan model 0 ranges from 11 to 14 degrees. Figure 10.11 shows the values of
p. given in Tables 10.1 to 10.3 for co = 30 degrees. It seems that the values for the two
point contact models are very similar, while the capstan predicts higher coefficients of
friction.
10.2.5 Summary
Two models, one to describe the matrix shear of the weave during the pull-out
process and the other to provide a means of examining the effect of the side load and
278

Coe
ffic
ient
of f
rict
ion,
2
zL
1 -
0 U
10
Figure
0
o
Q
0T T
20
Angles (degree)
bcapstan
0F=|iW
QF=Fo + [lW
30
10.11 Coefficient of friction as a function of the weave angle 0 for the three friction models examined.
r “» AC f 3

the weave angles on the measurable force values, JRF and kinetic friction, were
presented. The models were found to describe the data, presented mainly in chapter 8
satisfactorily. By virtue of the pull-out process, a out of plane deformation was
obtained and studied in detail (see section 8.3) which was very similar to the
deformations observed in the so called "hardness" and the ballistic experiments. It is
believed that similar processes, that is yam pull-out and weave distortions occur in the
latter two experiments (discussed in the later sections of this chapter). However it was
possible to examine these effects more closely in the pull-out experiments.
10.3 Indentation of Textile Structures
10.3.1 Introduction
The general features of the "hardness" or the indentation experiments were
described in chapter 6. It was observed that regardless of the size or shape of the
indentors, the deformation was a pyramidal one, resembling that obtained in the
pull-out experiments. It was also found that lubrication caused the fabrics to be less
stiff and more amenable to deformation, in a similar manner to the deformation and
force values obtained in the pull-out process.
Although the deformation of the fabrics in the "hardness" experiments are
modelled using plate deformation equations ( presented in the next section), the
deformations actually arises from the tensile extension and distortions of the yams and
the cross-over points similar to that in the pull-out experiments. In fact the origins of
the elasticity of the indentation plate deformation may be considered to come from the
elasticity of the pull-out process. In this respect the moduli calculated for the pull-out
process may be assumed to be operating in the "hardness" experiments as well, since
the rates of deformation are of similar orders of magnitude.
280

10.3.2 Diaphragm Strains (Thin Plate Model)
The general description of the model adopted for membrane strains was outlined
in Section 6.4, where an equation for the force-max deflection profile of a thin plate,
held at the edges and loaded uniformly, was presented, Figure 10.16. That equation
was:
F = [5.33(^) + (^)3]13.98 E t4
2r(10.14)
Using this equation and appropriate values for Young's modulus, B, and membrane
thickness, t, the forces, F, were calculated for increasing vertical displacements. It was
noted earlier that the Poisson’s ratio u was set to zero and indeed the selection of E and
t values is quite arbitrary. Figures 10.12 and 10.13 for cotton, are replicates of Figure
6.6 for the 120° cone with the 100mm and 180mm holders respectively. Figures
10.12 and 10.13 also show the calculated curves using Equation (10.14). In both
cases t was chosen as 0.3mm, the same as a yam diameter. Figures 10.14 and 10.15
for aramid 1 are the same as the untreated and 5% PDMS treated curves in Figure
6.16. In both cases t was taken as 0.15mm, and equal to the yam thickness. Table
10.4 presents the values of the Young's modulus E, that were incorporated into
Equation (10.14) in order to fit the experimental curves. (Recall X) = 0 and t was set at
a nominal thickness of the plate equal to the fibre diameter)
281
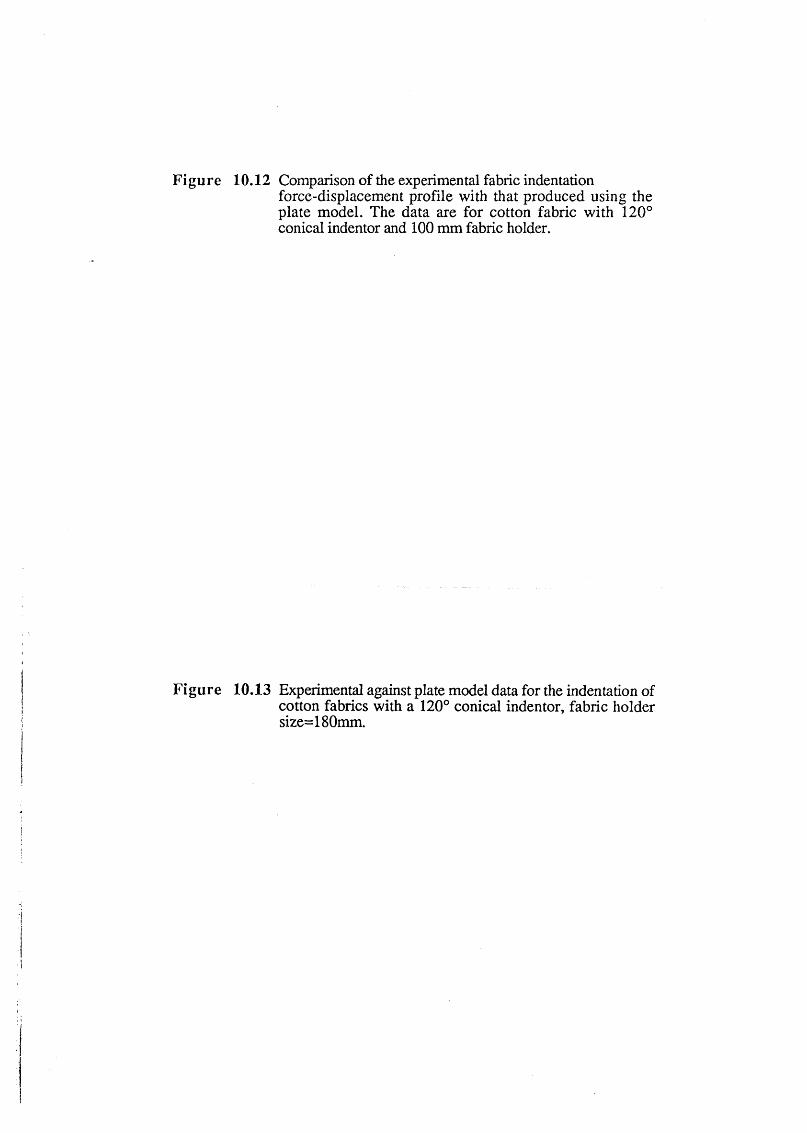
Figure 10.12 Comparison of the experimental fabric indentationforce-displacement profile with that produced using the plate model. The data are for cotton fabric with 120° conical indentor and 100 mm fabric holder.
Figure 10.13 Experimental against plate model data for the indentation of cotton fabrics with a 120° conical indentor, fabric holder size=180mm.

Forc
e (N
) Fo
rce
(N)
20
15-
■ Experiment
□ Plate model * □ ■■■
Vertical displacement (mm)
2 8 2
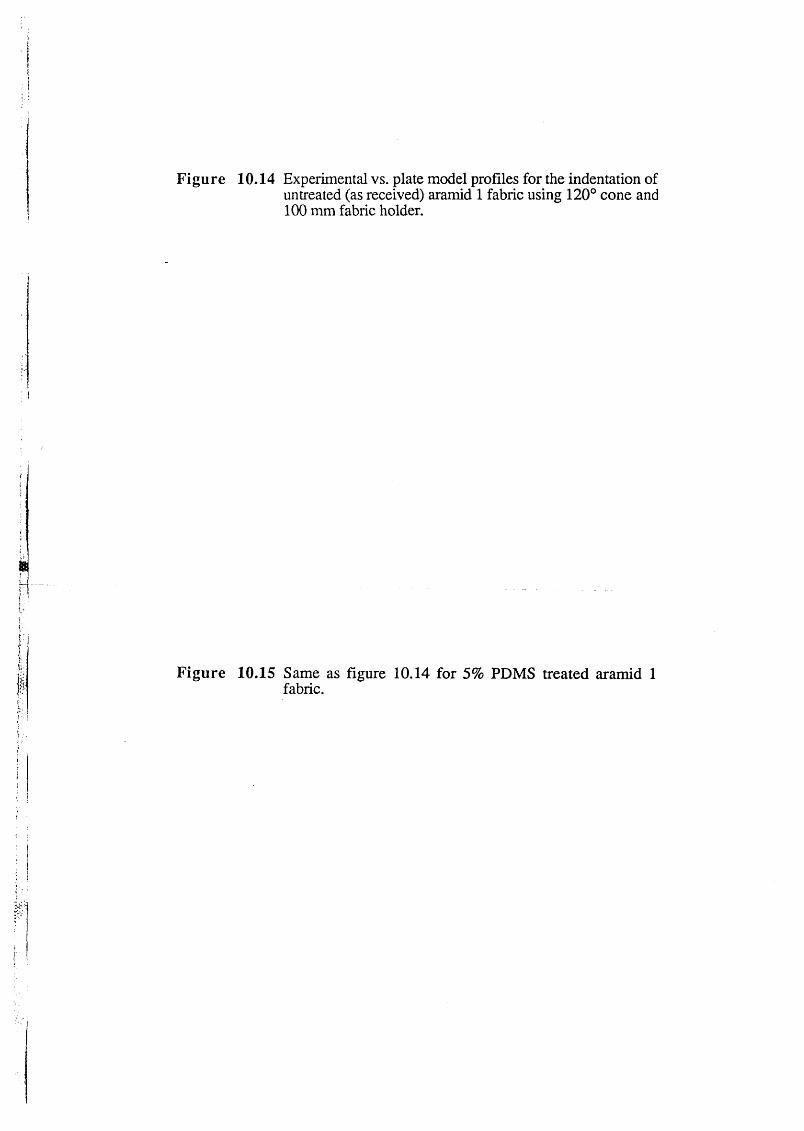
Figure 10.14 Experimental vs. plate model profiles for the indentation of untreated (as received) aramid 1 fabric using 120° cone and 100 mm fabric holder.
Figure 10.15 Same as figure 10.14 for 5% PDMS treated aramid 1 fabric.

Forc
e (N
) Fo
rce
(N)
30
■ Experiment
n Plate model
20
10-
0 IfTH" ""T f
□.1 ■ "
0 10
V e rtic a l d isp lacement (m m )
283
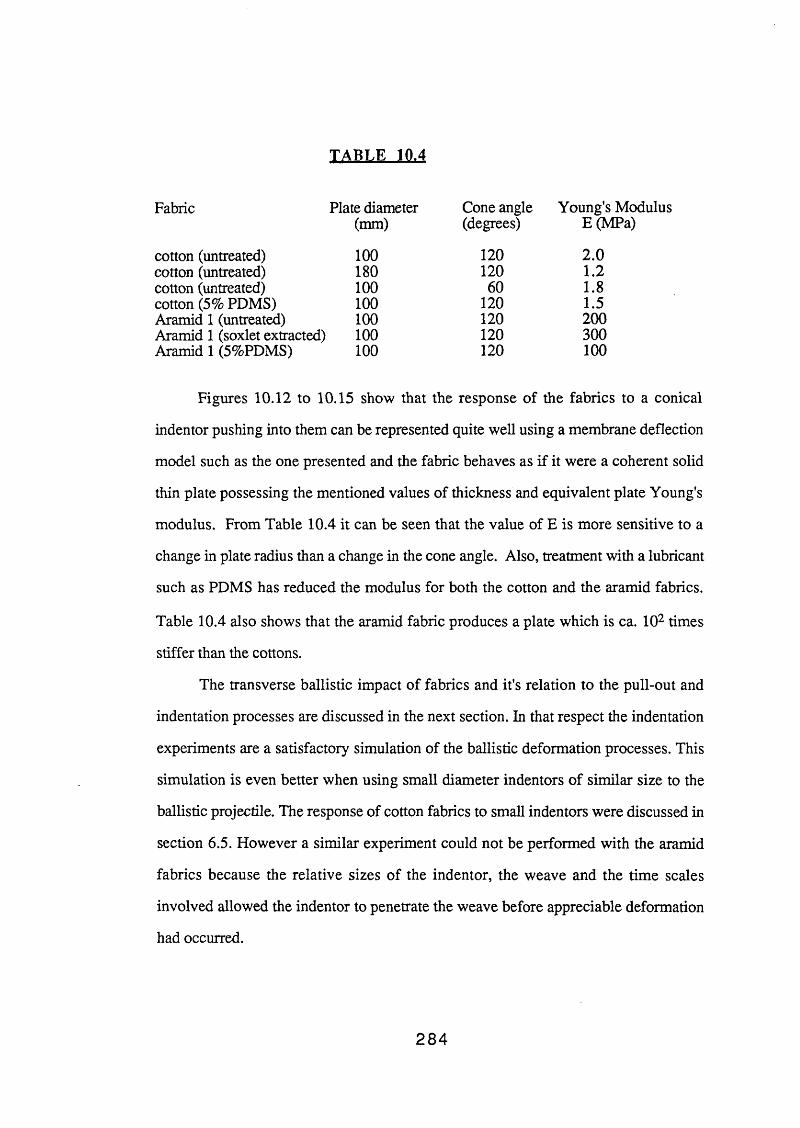
TABLE 10.4
Fabric Plate diameter (mm)
Cone angle (degrees)
Young's Mo E (MPa)
cotton (untreated) 100 120 2.0cotton (untreated) 180 120 1.2cotton (untreated) 100 60 1.8cotton (5% PDMS) 100 120 1.5Aramid 1 (untreated) 100 120 200Aramid 1 (soxlet extracted) 100 120 300Aramid 1 (5%PDMS) 100 120 100
Figures 10.12 to 10.15 show that the response of the fabrics to a conical
indentor pushing into them can be represented quite well using a membrane deflection
model such as the one presented and the fabric behaves as if it were a coherent solid
thin plate possessing the mentioned values of thickness and equivalent plate Young's
modulus. From Table 10.4 it can be seen that the value of E is more sensitive to a
change in plate radius than a change in the cone angle. Also, treatment with a lubricant
such as PDMS has reduced the modulus for both the cotton and the aramid fabrics.
Table 10.4 also shows that the aramid fabric produces a plate which is ca. 102 times
stiffer than the cottons.
The transverse ballistic impact of fabrics and it's relation to the pull-out and
indentation processes are discussed in the next section. In that respect the indentation
experiments are a satisfactory simulation of the ballistic deformation processes. This
simulation is even better when using small diameter indentors of similar size to the
ballistic projectile. The response of cotton fabrics to small indentors were discussed in
section 6.5. However a similar experiment could not be performed with the aramid
fabrics because the relative sizes of the indentor, the weave and the time scales
involved allowed the indentor to penetrate the weave before appreciable deformation
had occurred.
284
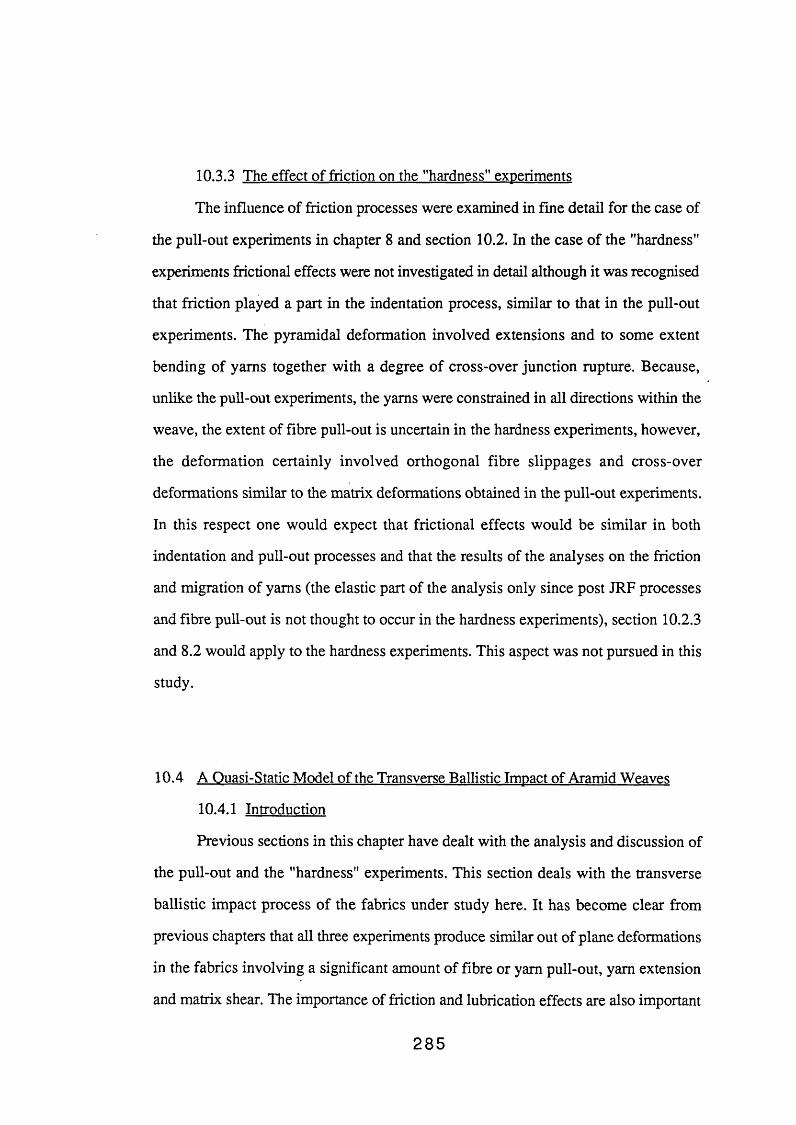
10.3.3 The effect of friction on the "hardness" experiments
The influence of friction processes were examined in fine detail for the case of
the pull-out experiments in chapter 8 and section 10.2. In the case of the "hardness"
experiments frictional effects were not investigated in detail although it was recognised
that friction played a part in the indentation process, similar to that in the pull-out
experiments. The pyramidal deformation involved extensions and to some extent
bending of yams together with a degree of cross-over junction rupture. Because,
unlike the pull-out experiments, the yams were constrained in all directions within the
weave, the extent of fibre pull-out is uncertain in the hardness experiments, however,
the deformation certainly involved orthogonal fibre slippages and cross-over
deformations similar to the matrix deformations obtained in the pull-out experiments.
In this respect one would expect that frictional effects would be similar in both
indentation and pull-out processes and that the results of the analyses on the friction
and migration of yams (the elastic part of the analysis only since post JRF processes
and fibre pull-out is not thought to occur in the hardness experiments), section 10.2.3
and 8.2 would apply to the hardness experiments. This aspect was not pursued in this
study.
10.4 A Quasi-Static Model of the Transverse Ballistic Impact of Aramid Weaves
10.4.1 Introduction
Previous sections in this chapter have dealt with the analysis and discussion of
the pull-out and the "hardness" experiments. This section deals with the transverse
ballistic impact process of the fabrics under study here. It has become clear from
previous chapters that all three experiments produce similar out of plane deformations
in the fabrics involving a significant amount of fibre or yam pull-out, yam extension
and matrix shear. The importance of friction and lubrication effects are also important
285
in the ballistic experiments. Admittedly the rates of deformation are similar in the
pull-out and the "hardness” experiments, but very different to the ballistic case.
However it is believed that despite differences in the rate of deformation, the ballistic
processes may still be simulated, explored and analysed using quasi-static
experimentation and modelling.
In Sections 6.4 and 10.3 a model was presented which assumed an elastic
energy dissipation involving a loaded membrane analysis. The model effectively
described the experimental data. This section describes a first attempt to interpret the
transverse energy absorbing characteristics of three aramid fabrics (see earlier) using
that static model. In this way the relative energy absorbing characteristics of the three
fabrics may be predicted.
The general appearance of a fabric during progressive deformation in a
transverse ballistic impact was shown in Figures 7.1 to 7.3. The main points of note
have been frequently reported but one feature is important in the context of the current
section. That is to a first order the stress wave propagation angle 0W, Figure 10.16
remains relatively constant throughout the history of the impact. This is a consequence
of an essentially constant longitudinal shock wave velocity in the assembly.
The photographic evidence is thus for a strain energy absorbing process
incorporating extension and bending in a relatively simple deformation geometry
which is geometrically similar throughout the impact. The scale of the deformation is
controlled by the wave velocity in the fabric. In this section, the value of a first order
model of the impact process based upon a static model where the geometry of
deformation is controlled not by the wave velocity but by the geometry of the support
is explored.
286

Quasi-Static deformation Ballistic deformation
;F
Wave propagation angle is constant.
Clamp
----------------# -----------------
* ' P ro jectile
Figure 10.16 A schematic representation of the indentation and the ballistic processes showing their respective deformation patterns. In the quasi-static case, the hinge is at the clamp while for the ballistic case it is variable.
287

10.4.2 A Quasi-Static Model of the Ballistic Capture Efficiencies of Aramid
Fabrics
From Figures 7.1 to 7.3 the wave propagation velocities in the fabrics were
measured and table 7.1 presented the values. These values were obtained by
measuring the increase in the diameter of the deformation at each time interval. Using
the sonic velocity equation (section 4.7.2):
(10.15)
and taking the fibre density p= 1440 kgnr3 (Kevlar 49 Data Manual, E.I.du Pont
Co.), the values of E are thus calculated as 1.4*107 Pa for the as received fabric,
1.5* 107 Pa for the PDMS treated and 4.16*107 Pa for the soxlet extracted aramid
fabric. Roylance (1977) suggests a sonic velocity for Kevlar 29 yams of 570 m/s. (E
is then of the order of 5xl08 Pa). The modulus for the Kevlar 29 yam is quite close to
effective values computed for the static plate deformation obtained using the plate
model for the aramid fabrics, table 10.4. Recall however that for the plate u was set to
zero and the plate thickness was equivalent to the yarn thickness. Inspection of
equation 10.14 shows that the force F scales, for a given displacement, with Et4. In
the static experiments one might suppose that t ought to be less than the yam diameter.
Hence a suitable value of E to obtain a good fit of these data would require a
significantly greater value of E for the effective plate in the ballistic experiments.
The target images shown in Figures 7.1 to 7.3 show subtle differences between
the various fabric treatments. The geometries of the deformation are noticeably
different and indeed this leads to different shock wave velocities, as discussed in
2 8 8
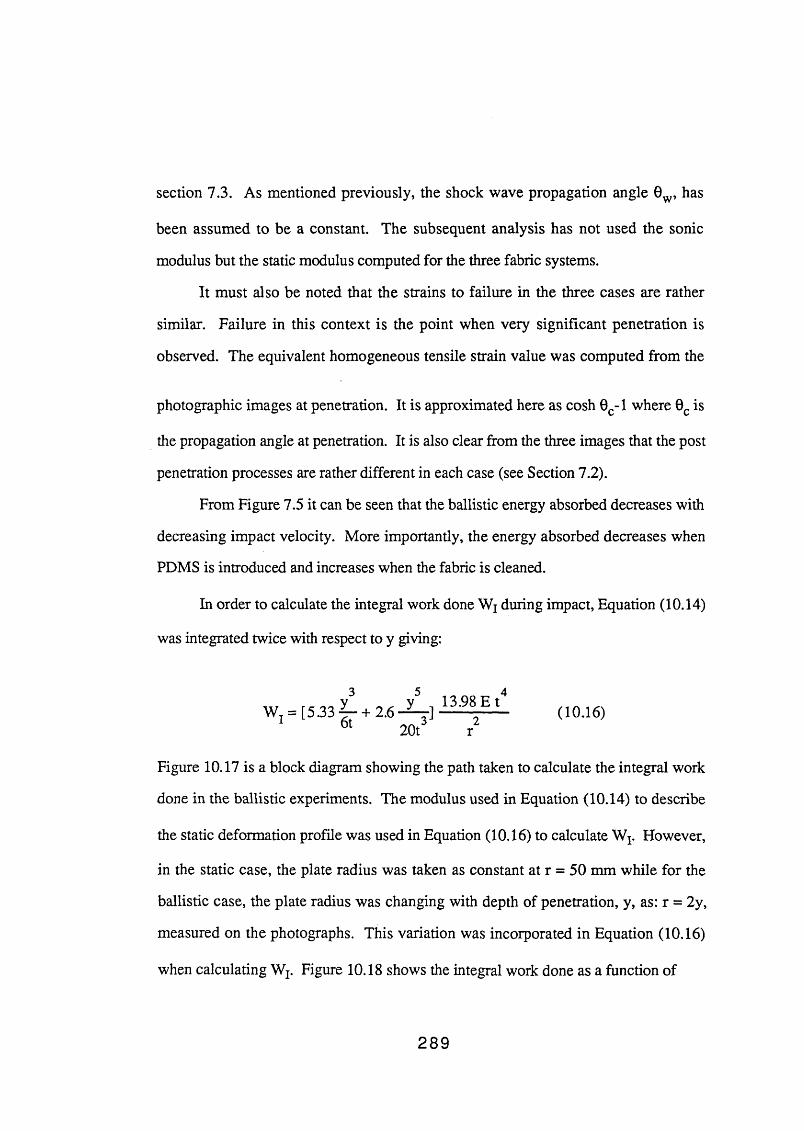
section 7.3. As mentioned previously, the shock wave propagation angle 0W, has
been assumed to be a constant. The subsequent analysis has not used the sonic
modulus but the static modulus computed for the three fabric systems.
It must also be noted that the strains to failure in the three cases are rather
similar. Failure in this context is the point when very significant penetration is
observed. The equivalent homogeneous tensile strain value was computed from the
photographic images at penetration. It is approximated here as cosh 0C-1 where 0C is
the propagation angle at penetration. It is also clear from the three images that the post
penetration processes are rather different in each case (see Section 7.2).
From Figure 7.5 it can be seen that the ballistic energy absorbed decreases with
decreasing impact velocity. More importantly, the energy absorbed decreases when
PDMS is introduced and increases when the fabric is cleaned.
In order to calculate the integral work done Wj during impact, Equation (10.14)
was integrated twice with respect to y giving:
6t 20t3 r2(10.16)
Figure 10.17 is a block diagram showing the path taken to calculate the integral work
done in the ballistic experiments. The modulus used in Equation (10.14) to describe
the static deformation profile was used in Equation (10.16) to calculate Wj. However,
in the static case, the plate radius was taken as constant at r = 50 mm while for the
ballistic case, the plate radius was changing with depth of penetration, y, as: r = 2y,
measured on the photographs. This variation was incorporated in Equation (10.16)
when calculating Wj. Figure 10.18 shows the integral work done as a function of
289
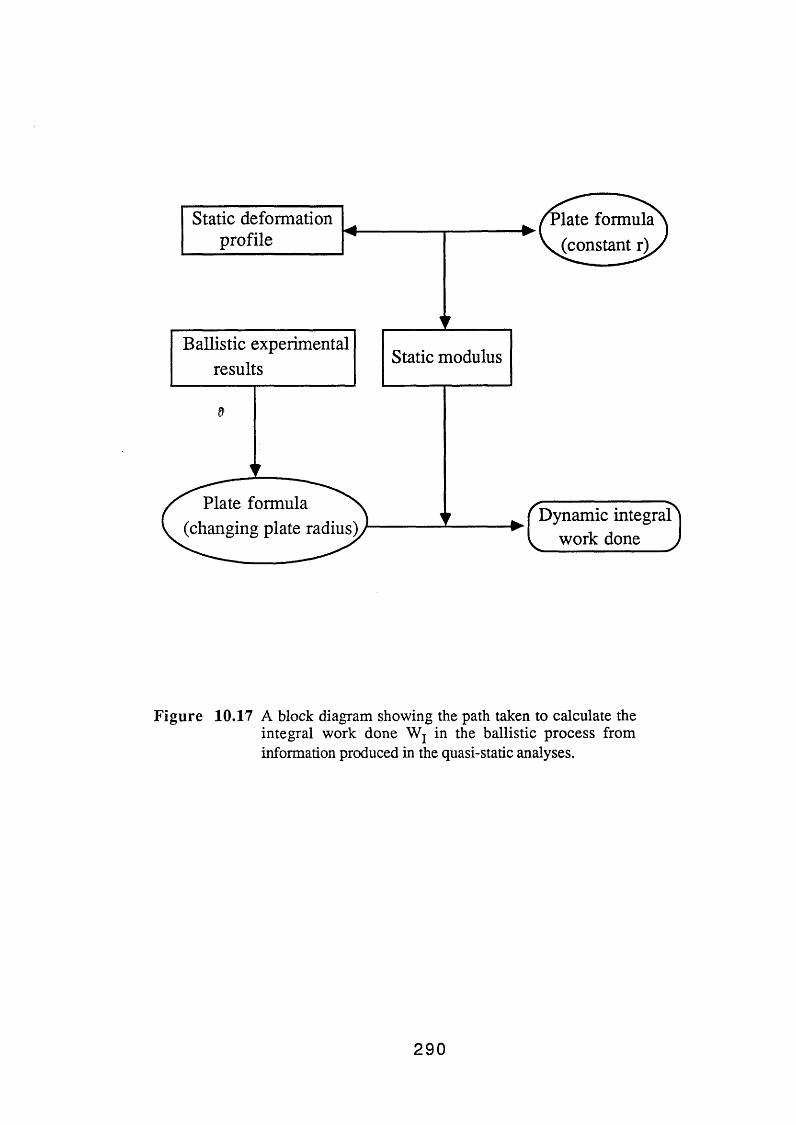
Figure 10.17 A block diagram showing the path taken to calculate the integral work done Wj in the ballistic process from information produced in the quasi-static analyses.
290

displacement for the three fabrics. The trends observed with surface treatment are
similar to those in the ballistic case. Figure 10.19 quantifies these comparisons. The
data have been normalised to the energy adsorbing characteristics of the PDMS
modified system. The static prediction of the elastic energy dissipated has been taken
from Figure 10.18 assuming a ballistic failure strain of 15%. Recall that this figure
was computed using a static modulus and assumed a fixed propagation angle. The
computed static based energy adsorbing capacities scale was 3:2:1 (cleaned: untreated:
PDMS). The ballistic capture performance as measured by the kinetic energy lost in
translation through the fabric is a function of the input kinetic energy. Figure 10.19
shows clearly that the trends are correct but in no case amongst the three input
velocities do we reproduce the same scaling as was predicted in the static model. The
static model does not contain a basis to explain this variation with impulse velocity.
The reasons for the lack of quantitative correlation may be extremely various.
We have neglected the kinetic energy imported to the fabric for example. In the
immediate context of the static model, effective plate moduli were used for a relaxed
state with an homogeneous strain. In addition, a fixed propagation angle and a
constant apparent failure strain were assumed. At this time it has not been possible to
precisely define the importance of these factors on the static model as applied to the
ballistic case. However, these considerations apart, one can deduce that, to a first
order, the ballistic behaviour of weaves is controlled to some extent by the processes
which are responsible for the same weave's static stiffness. Pragmatically this may
simply provide a means of assessing the likely effects of surface finishes on ballistic
performance. At a more fundamental level these studies indicate that appreciable
interfibre and interyam slip or migration occurs in ballistic impact. These processes
are more amenable to experimental investigation in static experiments and the present
work suggests that such studies may provide a qualitative means of interpreting the
influence of surface treatments on the ballistic characteristics of fabrics.
2 9 1

Figure 10.18 Quasi-statically based values of integral work done for the ballistic impact process at increasing transverse fabric displacements (depths).
Figure 10.19 Normalised absorbed energy as a function of the fabric surface characteristics. Energies were calculated at 15% nominal strain.
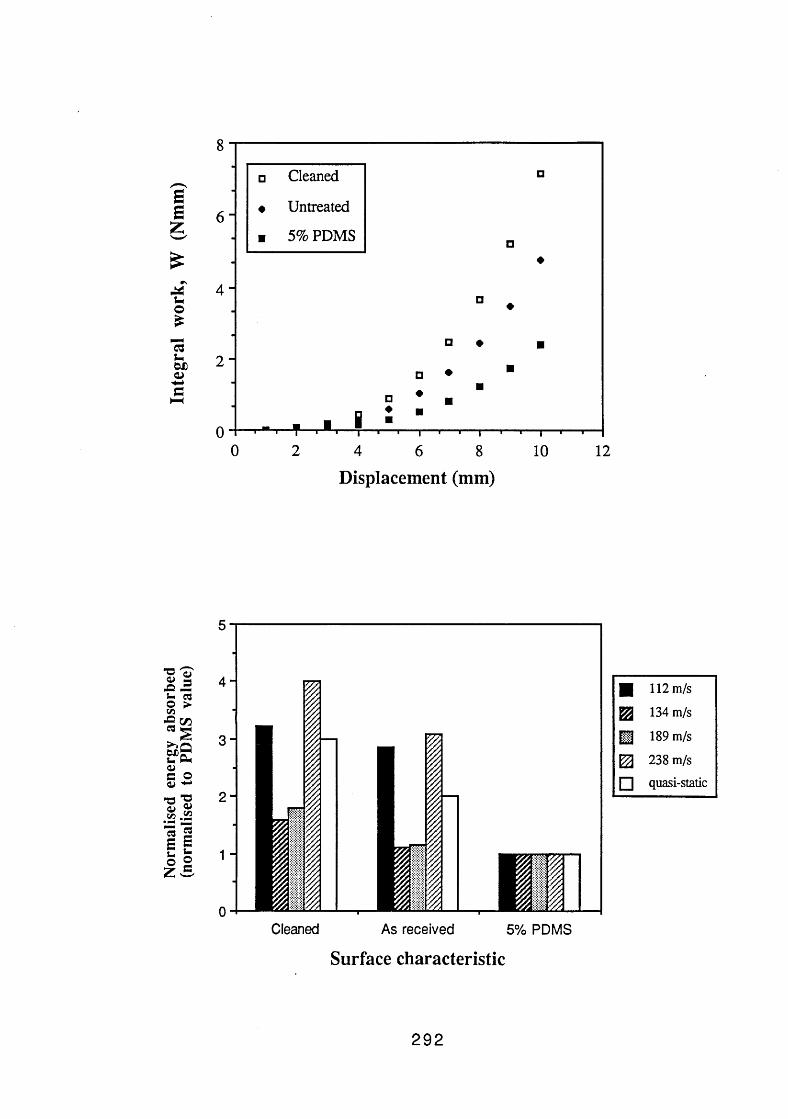
8
ssg
£
□ Cleaned
« Untreated
. ■ 5% PDMS
□
□♦
0 2 4 6 8 10 12D isp lacement (m m )
*© oT0> 5 A — *- a © >C/i• 2 C OCB m
“i<wB Oo» ^•O "Ocu ©§5
Cleaned As received 5% PDMS
■ 112 m/s
m 134 m/s
■ 189 m/s
238 m/s
□ quasi-static
Surface charac te ris tic
292

10.4.3 The Effect of Friction on the Ballistic Performance of Fabrics
As already mentioned in the introduction to this chapter, the three main
experiments undertaken in this study were intrinsically similar in their deformation
processes and the origins of the elasticity of their respective matrices. Frictional
processes also operate in a similar manner in these experiments although friction was
not studied in detail in the "hardness" and the ballistic experiments. The ballistic
deformation involves a significant amount of fibre slip and pull-out. The studies by
Roylance (1980) described in section 7.4.3 elude to the fact that increased friction at
cross-over junctions would result in a better "spreading" of the propagation wave and
hence a higher ballistic capture efficiency. The current study (figures 7.1 to 7.3) also
showed that increased lubrication leads to increased fibre pull-out accompanied by a
decrease in the ballistic capture performance of the fabric.
It was not possible to study in detail (as was done for the pull-out experiments)
the effect of friction in the ballistic experiments simply because of the experimental
time scales involved. However, it is envisaged that due to the intrinsic similarities of
the deformations and the trends in energies with lubrication, the analyses used in the
pull-out experiments, both for the elastic part of the deformation (figure 8.1) and after
junction rupture and the onset of steady fibre pull-out, will probably apply in the
ballistic case.
10.5 Conclusion
The deformation characteristics of the fabric weaves during fibre pull-out and
indentation were described accurately using two different models producing nominal
values for the elasticity of the weave. A quasi-static model was also used for the
ballistic impact experiments and was found to satisfactorily describe the trends of the
capture efficiency of the three aramid fabrics with respect to their surface
293
modifications. However during the course of this study, there were certain anomolies
which should be pointed out. Although it was recognised that the elasticity of the
matrix in the "hardness" experiments originated from the elasticity of the weave in the
pull-out process, side tension was seen to influence the two processes in rather
different ways. Side tension was observed to affect almost all the parameters
associated with the pull-out of a yam from the weave, but not the parameters of the
"hardness" experiments. The applicability of a uniformly loaded plate model to the
indentation experiments can also be questioned since obviously the system was loaded
in a central area using a cone with an uncertain loading pattern. The analysis used in
modelling the ballistic capture rankings using quasi-static equations also contained
several anomalies. The first and the most obvious is the large difference in the
respective rates of deformation in the "hardness" and the ballistic experiments. Also
important is the fact that the assumptions regarding constant propagation angle 0W and
constant apparent failure strain for the three aramid fabrics may not be fully justified.
The other anomaly which may not be so obvious is the assumption of homogeneous
strain. It is envisaged that due to the reflections that occur at the cross-over junctions
as the strain wave propagates (see section 4.7.2), the strain along any particular fibre
or yam would infact not be homogeneous.
Despite these anomalies in both the analyses and the experimental techniques, it
may be concluded that friction and migration of yams do play a major part in the
ballistic and indentation processes, but more importantly, the response of these
systems is seen to be controlled to a small extent by bending and to a much greater
extent by the extensile properties of the constituent fibres and yams.
294

CHAPTER ELEVENCONCLUSIONS
This thesis has considered various aspects of the out of plane deformation of
constrained fabrics. The experimental parts have been divided into three sections. A
major section has dealt with what is called the pull-out experiment where essentially a
semi-pyramidal displacement has been produced by withdrawing one yam from a
constrained weave. This experiment has sought to elucidate in fine detail the origin of
the elastic response of simple fabric systems. The major work has been carried out on
cotton fabrics with complimentary work using aramid fabrics. In these studies the
main occupation has been to obtain correlations and interrelationships between
micro-displacements and the force balances created within the system. By this means it
has been possible to develop a reasonably good predictive model to describe the
behaviour of a fabric system in this type of deformation. The data has been largely
analysed assuming that the major response of the system arises almost entirely from
extensile and not bending deformations. This experiment has three features. The
important part has dealt with the origin of the apparent elasticity of the fabric during
this type of deformation. The two subsidiary parts have dealt with the way in which a
pulled yam may be progressively withdrawn from the system. These studies have
been complemented by separate investigations of the friction and the tensile properties
of single yams. A major feature of this particular part of the study has been the role
played by lubricants or fabric conditioners in defining the behaviour of the system in
it's three important modes of response. The major conclusion of this particular study is
that it is possible using simple models and the assumptions described above and
detailed elsewhere in the thesis to generate realistic models for the deformation of
295
fabrics on the basis of the operation of tensile forces only. Surface modifications by
the use of various fluids and agents is believed to modify the tensile properties of the
yams by interfilament lubrication and the behaviour of cross-overs by cross-over
contact lubrication. The friction data have been quantified for effects of lubrication for
yam systems but not for filament systems. These studies produce a self consistent
picture of the origins of the plate deformation or semi-plate deformation of yam
systems.
Thc^e studies have then been taken forward in a less precise microscopic way to
investigate the behaviour of a fabric during apparent plate deformation. Again the data
strongly indicate that the major mode of force transmission is extension rather than
bending and an attempt has been made to quantify this effect. The use of a standard,
but arguably not totally appropriate, constrained plate deformation model which
incorporates substantial membrane forces allows a very good prediction of the
force-displacement characteristics of this system and hence a measure of the hardness
or the out of plane deformation of the fabric. This type of deformation closely
resembles that observed in part in the fibre pull-out experiments. The hardness
experiments have been extended to look at the nominal hardness, that is the area of
contact produced by cones of various diameters and included angles. The overall
conclusion of this work is that the behaviour of the system can be reasonably
interpreted in terms of an effective Young's modulus and by inference a modulus
which arises largely through the propagation and the interaction of mostly tensile
forces and hence the operation of a tensile rather than a bending modulus. In these
studies the effects of lubricants and surface modifications are in keeping with those
observed in the fibre pull-out experiments and we can therefore conclude that
lubrication influences the effective modulus of the plate in certain ways as were
speculated in the fibre pull-out experiments. The "hardness" work has been extended
to compute, in a first order way, the work done rather than the deformation introduced
296
The third experimental part of the thesis has sought to use the plate deformation
theory to interpret the ballistic capture performance of aramid weaves. As a matter of
experiment it was not possible to pursue these types of investigations with cotton
systems because they were not sufficiently durable to withstand the impact
phenomenon. It turns out that the ballistic experiments actually show the three key
features that were described in the pull-out experiments and also eluded into the
"hardness" experiments above. There is an elastic deformation, a junction rupture of
cross-overs and finally the pulling out of the yams from the constrained weaves. The
elastic parts of the system are very adequately described by an extension of the
"hardness" model based upon the work done argument with a modification to the
geometry of the deformation system assuming a relatively constant wave propagation
angle. The influence of surface modifications is in keeping with that observed in the
hardness experiments and largely predicted from the behaviour of the system in the
pull-out experiments. The agreement here is quite satisfactory in view of the fact that
the ballistic experiment is not quasi-static in a way which is the case for the two
previous experiments, that is the pull-out and the "hardness" experiments. It was not
possible to examine in detail in a quantitative way the pull-out phenomena associated
with the ballistic experiments (and indeed in the hardness experiments described
previously) simply because it was not possible to identify in an explicit way the extent
of the pull-out in these systems. However it was very apparent that when lubricants
were introduced into the ballistic system then the extent of fibre pull-out was
significantly greater. The more effective the lubricant as quantified in the fibre pull-out
experiments and inferred from the hardness experiments confirmed the general trends
of the ballistic experiments.
into the fabric as displacements imposed on the system and data have been produced
for a variety of surface treatments not only for cotton fabrics but also for aramid
systems.
297
The main overall conclusion of this study is that the out of plane deformation of
these fabrics is well described by models which suppose that the forces are mainly
transmitted by tensile forces in the yams. Lubrication influences the stress fields in the
yams by modifying filament-filament interactions and also the way in which forces are
transmitted between yams into the fabric as a whole. These intra and inter yam friction
effects are manifest in the whole spectrum of the force-extension behaviour of the
system. For small stress and extension lubricants reduce the elastic effective modulus
of the systems. The lubricants also reduce the effective pull stress of the system (they
reduce the JRF in the pull-out experiment for example) and also promote yam "flow"
or yam pull-out processes. In the broader definition of the term, the lubricant action is
one of plasticisation al beit at a macroscopic level at filament-filament and yam-yam
interfaces. We cannot however exclude "true" plasticisation of microscopic interactions
with the filaments themselves although there is no experimental evidence that this
occurs for the present systems.
298

APPENDIX 1
SEM Photographs of the Cotton and the Aramid 1 Yarns
Cotton yam
Magnification=lOO
Aramidl yam
Magnification= 1 00
299
\
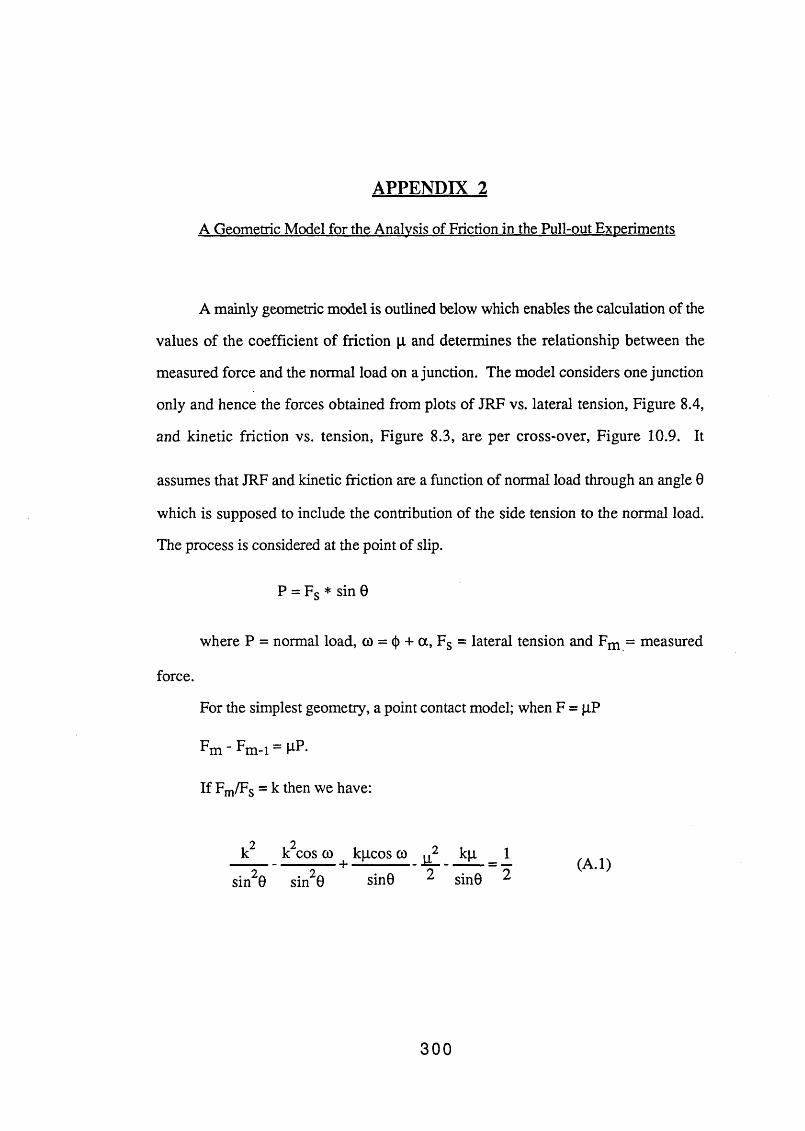
A P P E N D IX 2
A Geometric Model for the Analysis of Friction in the Pull-out Experiments
A mainly geometric model is outlined below which enables the calculation of the
values of the coefficient of friction \x and determines the relationship between the
measured force and the normal load on a junction. The model considers one junction
only and hence the forces obtained from plots of JRF vs. lateral tension, Figure 8.4,
and kinetic friction vs. tension, Figure 8.3, are per cross-over, Figure 10.9. It
assumes that JRF and kinetic friction are a function of normal load through an angle 0
which is supposed to include the contribution of the side tension to the normal load.
The process is considered at the point of slip.
where P = normal load, co = <}) + oc, Fs = lateral tension and Fm = measured
force.
For the simplest geometry, a point contact model; when F = pP
P = Fs * sin 0
F m “ F m _i - M-P-
If Fm/Fs = k then we have:
sin20 sin20 sin0 2 sin0 2 (A.l)
300
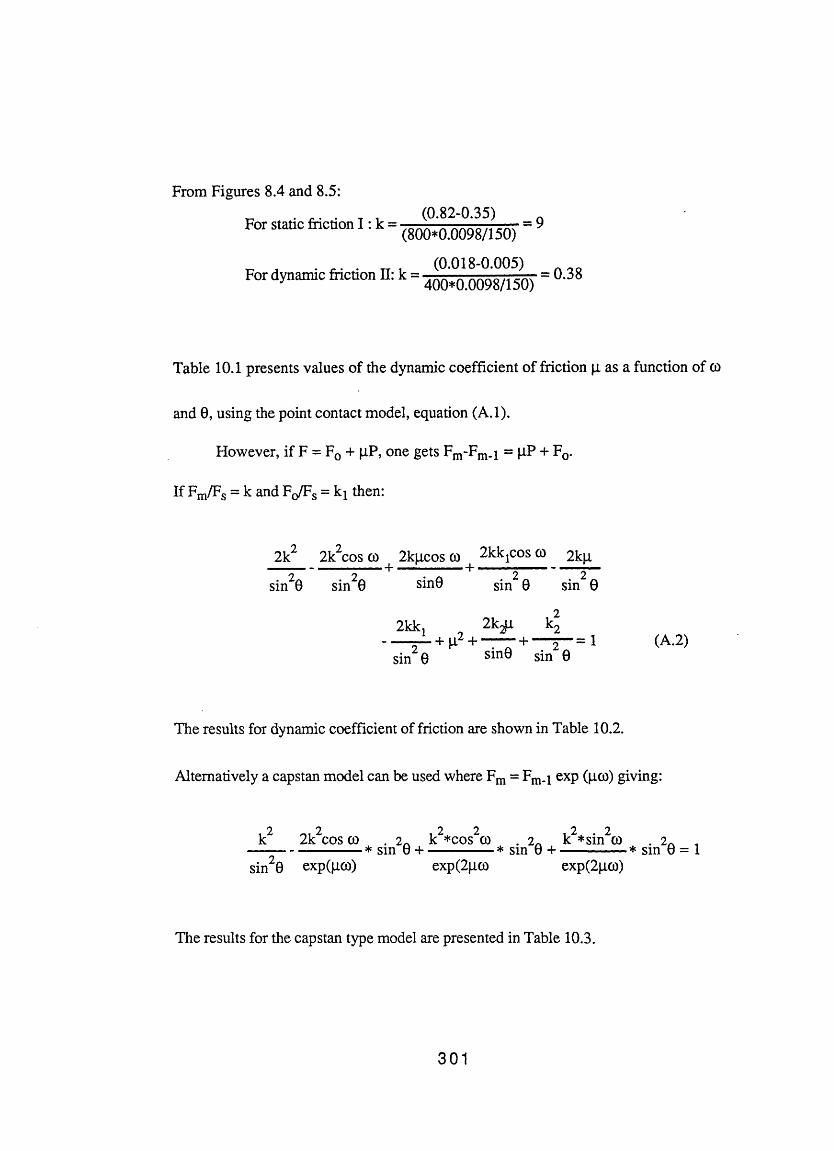
From Figures 8.4 and 8.5:
For static friction I(0.82-0.35) _ n
(800*0.0098/150)
. ^ , (0.018-0.005)For dynamic faction H: k = 0.38
Table 10.1 presents values of the dynamic coefficient of friction p as a function of co
and 0, using the point contact model, equation (A.l).
However, if F = F0 + pP, one gets Fm-Fm_i = pP + F0.
If Fm/Fs = k and Fq/Fs = then:
2k2 2k2cos co 2kpcos co 2kkjCos co 2kp
sin20 sin20 sin0 sin2 0 sin2 0
2kk, „ 2k k2---------— + p 2 + ---------- + — — = 1
sin 0 sin0 sin 0(A.2)
The results for dynamic coefficient of friction are shown in Table 10.2.
Alternatively a capstan model can be used where Fm — Fm-1 exp (pco) giving:
2 2 2 2 2 2k cos co . 2~ k *cos co . 2^ k *sin co . 2^ ,------------* sm 0 + -------------* sm 0 + -------------* sm 0 = 1sin 0 exp(pco) exp(2pco exp(2pco)
The results for the capstan type model are presented in Table 10.3.
301

R E F E R E N C E S
Atkins, A.G. and Tabor, D.; J. M ech. Phys. so lids , 13, 149 (1965)
Abbott, C.M., Grosberg, P., Leaf, G.A.V., Text. Res. J., 41, 4, 345 (1971).
Abbott, C.M., Grosberg, P., Leaf, G.A.V., J. Text. Inst., 42A 346 (1972).
Archard, J.F., N ature , 172, 918 (1951).
Backer, S., Private Communication (1987).
Balasubramanian, P. and Salhotra, K.R., Text. Tes. J., 55, 1, 74 (1985).
Balls, W.L., "Studies of Quality in Cotton", Macmillan, London (1928).
Basu, S.N., Hamza & Sikorski, J., J. Text. Inst., 2/3, 68 (1978).
Besler & Taylor, 1st Symp. Int. de la Recherde, Paris (1969).
Beste, L.F. and Hoffman, R.M., Text. R es. J., 20, 441 (1950).
Berkeley, E.E. and Woodward, I.; Text. Res. J., 18, 71 (1948)
Binns, H.A., Text. Res. J., 25, 157 (1934).
Bowden F.P. & Tabor, D., "Friction and Lubrication of Solids", Parts I and II, Clarendon Press, Oxford (1950).
Briscoe, B J., Scruton, B. and Willies, F.R., P roc. R oy. Soc., A333, 99 (1973).
Briscoe, B.J. in "Adhesion 5", Ed. K.W. Allen, Elsevier, London (1981).
Briscoe, B.J., Adams, M J. and Kremnitzer, S.L., Proc. 34th Inti. Conf. Societe de Chemie Physique, Microscopic aspects of adhesion and lubrication, ed. J.M.Georges, 405-419 (1982)
Briscoe, B.J., Winkler, A. and Adams, M.J., J. Phys. D : A ppl. Phys., 18, 2143(1985).
Brown, T.D. and Onions, W.J., J. Text. Inst., 52, T101 (1961).
Buckley, G.H., "Mechanics of Flexible Fibre Assemblies" , Sijthoff & Noordhoff publishers, Netherlands (1979).
Cameron, A., "Basic Lubrication Theory", Longmans (1971).
Chapman, B.M., Text. Res. J., (1971).
Chapman, B.M., J. Text. Inst., (1973).
Clayton, F.H. and Peirce F.T., J. Text. Inst., 20, T315 (1929).
Collins J.D. and Chaikin, M., Text. Res. J., 39, 121 (1969).
Coplan, M J. and Bloch, M.G., Text. Res. J., 25, 902 (1955).
302
Cork, C.R., "Aspects of ballistic impact onto woven textile fabrics", Ph.D. thesis, UMIST (1983)
Dawes, V. and Owen, J.D., J. Text. Inst., 62, 233 (1971).
Dent, R.W. and Hearle, J.W.S., Text. Res. J ., 30, 805 (1960).
Dobb, M.G., Johnson, D.J. and Saville, B., Phil. Trans. R. Soc. L ondon , A294, 483 (1979).
Dowson, D., "History of Tribology", Longmans (1979).
Dubrow, P.L. and Linfield, W.M., Soap and Sanitary Rep., 46, 2, 41 (1957).
Duckett, K.E., in "Surface Characteristics of Fibres & Textiles", Ed. M J. Schick, Marcel Dekker, NY (1975).
El-behery, H.M., Text. Res. J., 38, 321 (1968).
Elder, H.M.,'Textile Finishing, Textile Inst., U.K. (1978).
Elder, H.M., Fisher, S. and Armstrong K., 'Book of Papers', Index 81 Congress (EDNA), Amsterdam (1981).
Elder, H.M., Fisher, S., Armstrong, K. and Hutchinson, G., J. Text. Inst., 1, 37 (1984).
Evans, W.P., Chem istry & Industry, July, 893 (1969)
Eyring, H., Glassstone, S., and Laider, K.J., "The theory of rate processes", McGraw Hill, NY (1941)
Farrow, B., / . Text. Inst., 47, T58 (1956)
Figucia, F., "Energy absorption of Kevlar fabrics under ballistic impact", US Army Natick Research and Development Command, Natick, MA (1980)
Flesher, D.J., US Patent 3,541,843 (1970).
Fort, T. and Olsen, J.S., Text. Res. J., 52, 12, 1007 (1961)
Fowkes, F.M., J. Phys. Chem ., 57, 98 (1953)
Galuszynski, S. and Ellis, S., Text. Res. J ., 53, 7, 462 (1983)
Galuszynski, S., SAWTRI Texchnical Report No. 554 (1984)
Gibson, V.L. and Postle, R., Text. Res. /., 48, 1, 14 (1978)
Gillespie, / . Coll. S ci., 13, 32, 50 (1958)
Ginn, M.E., Schemach, T.A. and Jungerman, E., J. Am. Oil. Chem. Soc., 42, 1084 (1965)
3 0 3

Gralen, N., P roc. R oy. S oc ., A212, 491 (1952)
Greenwood, J.A. and Tabor, D., Proc. Phys. Soc., 71, 989 (1958)
Gregory, J., J. Text. Inst., 44, T515 (1953)
Griffel, W., “Plate Formulas”, Frederick Ungar Publishing Co., NY (1968)
Grosberg, P., Text. Res. J., 36, 3, 205 (1966)
Grosberg, P. and Kedia S., Text. R es. J ., 36, 71 (1966)
Grosberg, P. and Swani, N.M., Text. Res. J., 36, 4, 332 (1966)
Grosberg, P., “Surface Characteristics of Fibres and Textiles”, Ch. 15 (1977)
Guthrie, J.C., J. Text. Inst. (1954)
Hailwood, AJ. and Horrobin, S., Trans. F araday Soc., 42B, 84 (1946)
Hailing J., “Introduction to Tribology", Wykeham (1976)
Hamilton, J.B., J. Text. Inst., 49, T411 (1958)
Hansen, W.W. and Tabor, D., Text. Res. J., 27, 300 (1957).
Hardy, W.B., “Collected Works", Cambridge Univ. Press (1936).
Hayes, D., Textile Month, July, 38 (1972).
Hearle, J.W.S., El-behery, H.M.A.E. and Thakur, V.M., J. Text. Inst., 51, T299(1960) .
Hearle, J.W.S., El-behery, H.M.A.E. and Thakur, V.M., J. Text. Inst., 52, 5, T197(1961) .
Hearle, J.W.S. and Merchant, V.B., J. Test. Inst., 53, T537 (1962).
Hearle, J.W.S. and Peters, R.H., "Fibre Structure", Butterworths (1963).
Hearle, J.W.S. and Bose, O.N., Text. Res. J., 35, 693 (1965).
Hearle, J.W.S., Gupta, B.S. and Merchant, V.B., Text. Res. J., 35, 329 (1965).
Hearle, J.W.S., J. P olym er Sci., 20, 215 (1967).
Hearle, J.W.S., Grosberg, P. and Backer, S., “Structural Mechanics of Fibres, Yams and Fabrics" (1969).
Hearle, J.W.S. and Green, R., J. Text. Inst., 61, 415 (1970).
Hearle, J.W.S. and Sparrow, Text. R es. J ., 41, 9, 736 (1971).
Hearle, J.W.S. and Sakai, T., J. Text. M ach. Soc. Jap., 31, T136 (1978).
3 0 4
Hepworth, I. and Sikorski, J., Proc. 3rd Leeds-Lyon Symp. on Tribology (1976).
Hickie, T.S. and Chaikin, M.J., /. Text. Inst., 51, T1120 (1960).
Hoffman, R.M., Text. R es. J., 35, 428 (1965).
Holdaway, H.W., J. Text. Inst., 47, T586 (1956).
Hollies, N., Kaessinger, M. and Bogaty, H., Text. Res. J., 26, 829 (1956).
Honold, E. and Grant, J.N., Text. Res. J., 31, 7, 643 (1961).
Howell, H.G., J. Text. Inst., 45, T575 (1954).
Howell, H.G., Tabor, D. and Mieszkis, K.W., "Friction in Textiles" (1959).
Hughes, C.K. and Koch, S.D., Soap & Chem. Specialities, Dec., 109 (1965).
Iyengar, R.L.N. and Gupta, A.K., Text. Res. J., 49, 489 (1974).
Johnson, K.L.; "Contact Mechanics", Cambridge publishers (1985)
Kakiaga, S., J. Text. M ach. Soc. Jap., 4, 49 (1958).
Kawabata, S., "Mechanics of Flexible Fibre Assemblies", Ed. Hearle, Thwaites, J.J. and Amirbayat, J., Proc. NATO Adv. Study Int., Greece (1979).
Kawabata, S., "Objective Evaluation of Apparel Fabrics", Ed. Postle, R., Kawabata,S. and Niwa, N., Text. M ach. Soc. Jap., Osaka (1983).
Kawase, T., Sekoghuchi, S., Fujii, T. and Minngowa, M., Text. R es. J., 5 6 ,1, 409(1986).
Kilby, W.F., J. Text. Inst., 54, T9 (1963).
Kim, CJ. and Vaughn, E.V., J. Text. M ach. Soc. Jap., 32, 6, T47 (1979).
Kis a, E., J. Coll. Int. Sci., 83, 265 (1981).
Komori, T., Makishima, K. and Itoh, M., Text. Res. J., 50, 548 (1980).
Koza, W.M., Text. R es. J., 66 , 9, 639 (1975).
Kramer, A., Kaban, G., Cooper, D., and Papavasiliou, A., Chem . Senses and F lavour , 1, 1, 121 (1974).
Kremnitzer, S.L., "The Adhesion, Friction and Lubrication of PET Fibres", PhD Thesis, University of Cambridge (1978).
Kruger, R., Polymers in Defence, International Conf., Bristol, 20/1 (1987)
Langmuir, E., J. Amer. Soc., 40, 1361 (1918).
Leaf, G.A.V., in "Mechanics of Flexible Fibre Assemblies" Ed. Hearle, Thwaites and Amirbayat, (1979).
Leaf, G.A.V. and Anandjiwala, R.D.; Text. Res. J., 55, 2 (1985)
305
Lyne, D.G., / . Text. Inst., 46, 112 (1955).
Lyons, W.J., "Impact phenomena in textiles", M.I.T. press, Cambridge, MA, 72-75 (1963)
Mallinson, P., J. Soc. D yers & C o l . , ., 90, 67 (1974).
Mercer, E.H. and Makinson, K.R., J. Text. Inst., 38, T227 (1947).
Meredith R., J. Text. Inst., 41, T199 (1950).
Meredith R., J. Text. Inst., 42, T291 (1951).
Meredith R., in "Fibre Science", Ed. J.M. Preston, The Text. Inst. (1953).
Meredith R., J. Text. Inst., 45, T489 (1954).
Meredith, R., J. Text. Inst., 36, T107 (19^5).
Minor, F.W., Schwartz, A.M., Wulkow, E.A. and Buckler, L.C., Text. Res. J., 29, 931 (1959).
Mogat, E.E., Phil. Trans. Roy. Soc. Lond., A294, 763 (1980).
Montgomery, T.G., Grady, P.L. and Tomasino, C., Text. Res. /., 7, 442 (1982)
Mooney, W., Textile Month, Oct. 32 (1980).
Morlier, O.W., Orr, R.S. and Grant, J.N., Text. Res. J., 21, 6 (1951).
Morrow, J.A., J. Text. Inst., 22, T425 (1931).
Morton, W.E. and Yen, K.C., J. Text. Inst., 22, 60 (1952).
Morton, W.E., Text. R es. J., 26, 325 (1956).
Morton, W.E. and Hearle, J.W.S., "Physical Properties of Textile Fibres", Published in conjunction with the textile institute (1975).
Nachane, R.P. and Iyer, K.R., Text. Res. J., 50, 639 (1980).
Northolt, M..G., P olym er, 21, Oct. 1199 (1980).
Olofsson, B., Text. Res. J., 20, 6, 476 (1950).
Olofsson, B., J. Text. Inst., 55, T541 (1964).
Olsen, J.S., Text. Res. J., 39, 31 (1969).
Onions, W.J., Toshniwal, R.L. and Townend, A.A., J. Text. Inst., 51, T73 (1960).
Owen, J.D., J. Text. Inst., 56, (1965).
Lundgren, H.P., T ex t. C h em . C o ll ., 1, 35 (1969).
3 0 6
Oxley, A.E., J. Text. Inst., 13, 54 (1922).
Panesar, S.S., "Mould Release Layers for Poly-urethanes", PhD Thesis, Imperial College (1986).
Pascoe, M.W. and Tabor, D., R esearch , 8, S15 (1955).
Peirce, F.T., J. Text. Inst., 14, T1 (1923).
Peirce, F.T., J. Text. Inst., 17, T342 (1926).
Peirce, F.T., J. Text. Inst., 21, T377 (1930).
Peirce, F.T., J. Text. Inst., 28, T45 (1937).
Peirce, F.T., Text. Res. J., 17, 123 (1947).
Penn, L. and Larson, F., J. A ppl. Polym . Sci., 23, 59 (1979).
Pietikainen, I., "Effect of some treatments on the properties of cotton and rayon fibres", PhD Thesis (1973).
Platt, M.M., Text. Res. J., 20, 10, 665 (1950).
Plummer, C.H., US Patent 3, 151,483 (1964).
Prosser, R.A., Text. R es. J., 58, 2, 61 (1988)
Pruneda, C.O., Steele, W.J., Kershaw, R.P. and Morgon, R.J., 182nd National Meeting of the Amer. Chem. Soc. Polym. Chem. Div., N.Y., Aug. (1981).
Riding, G.J., J. Text. Inst., 55 , T9 (1964).
Roark, R.J. and Young, W.C., "Formulas for Stress and Strain", McGraw Hill (1986).
Roder, H.L., J. Text. Inst., 44, T247 (1953).
Roylance, D. and Wilde, A., Army symp. on solid mechanics, Ocean city, Maryland, 232-240 (1972)
Roylance, D., Text. Res. J., 679 (1977)
Roylance, D., F ibre Science and Technology, 13, 385 (1980)
Rudolph, Textil-u-Faserstojftech., 5, 293 (1955).
Rusca and Sands (1968).
Schick, M.J., "Surface Characteristics of Fibres and Textiles", Fibre Science Series, Chapter 1 (1975).
Owen, J.D., J. T ex t. In s t., 5 9 , 313 (1968).
3 0 7

Schwartz, E.R., Am. J. Phys. D ., 20, 130 (1987).
Schwartz, M.A., US Patent 2,718,142 (1955).
Sebastian, S.A.R.D., Bailey, A.I., Briscoe, B.J. and Tabor, D., Text. Res. J., 56, 10 (1986).
Sebastian, S.A.R.D., Bailey, A.I., Briscoe, B.J. & Tabor, D. ; J. Phys. D : Appl. P h ys., 20, 130 (1987)
Seshan, K.N., J. Text. Inst., 69, 214 (1978).
Sexsmith, F.H. and White, H.J., J. Coll. Sci., 14, 598 (1959).
Shiloh. M. and Litav, Text. Res. J., 35, 159 (1965).
Simmens, S.C., and Hearle, J.W.S., J. Polym . Sci., Polym . P hys. Ed,., 18, 871 (1980).
Skau, E.L., Honold, E. and Bondreau, W.A., Text. Res. J ., 28, 3, 206 (1958).
Smith, J.C., McCrackin, F.L. and Schiefer, H.F., Text. R es. J., 28, 4, 288 (1958)
Sollenberger, W.S., Am. D yestu ff R ep ., 46, 2, 41 (1957).
Speel, H.C. and Schwartz, E.W.K., "Textile Chemicals and Auxiliaries" Rainhold Publishing Co., N.Y., 2nd Ed. (1957).
Spencer-Smith, J.L., J. Text. Inst., 36, T35 (1947).
Syed, I.A., "Chemical Modification of Fabric Handle", PhD Thesis, University of Strathclyde (1982).
Tabor, D., Ch. 3 of "Friction in Textiles" by Howell, H.G., Tabor, D. and Mieszkis, K.W., 54 (1959).
Tabor, D., "Friction, Lubrication and Wear", Surface and Coll. Sci., 5, 245 (1972).
Taylor, E., US Patent 3,683,681 (1972).
Treloar, L.R.G. and Riding, G., J. Text. Inst., 54, 4, T156 (1963).
Treloar, L.R.G., J. Text. Inst., 56, 7, T359 (1965).
Treloar, L.R.G. and Riding, G., J. Text. Inst., 56, 7, T381 (1965).
Turner, A.J., J. Text. Inst., 20, T233 (1929).
Valko, I.E., Am. D yestu ff R ep., Jan., 33 (1966).
Vaughn, E.A. and Kim, C.J., International Non-wovens and Disposables Assocn. Technical Symp., Washington (1973).
Viswanathan, A., J. Text. Inst.., 64, 553 (1973).
Schwartz, E.R., A m . D y e s tu f f R e p ., 28, 138 (1939).
308
Related Documents