Interfaces of Supercrical Fluid Chromatography with Mass Spectrometry and Supercrical Fluid Extracon – Applicaons in Medicinal Chemistry and Bioanalysis INAUGURALDISSERTATION zur Erlangung des akademischen Grades eines Doktors der Naturwissenschaſten (Dr. rer. nat.) der Mathemasch‐Naturwissenschaſtlichen Fakultät der Universität Greifswald vorgelegt von Robert Klaus Hofsteer Greifswald, 30. November 2019

Welcome message from author
This document is posted to help you gain knowledge. Please leave a comment to let me know what you think about it! Share it to your friends and learn new things together.
Transcript
Interfaces of Supercritical Fluid Chromatography with
Mass Spectrometry and Supercritical Fluid Extraction –
Applications in Medicinal Chemistry and Bioanalysis
I N A U G U R A L D I S S E R TAT I O N
zur
Erlangung des akademischen Grades eines
Doktors der Naturwissenschaften (Dr. rer. nat.)
der
Mathematisch‐Naturwissenschaftlichen Fakultät
der
Universität Greifswald
vorgelegt von
Robert Klaus Hofstetter
Greifswald, 30. November 2019

Dekan: Prof. Dr. Gerald Kerth
1. Gutachter: Prof. Dr. Andreas Link
2. Gutachter: Prof. Dr. Maria Kristina Parr
3. Gutachter: Prof. Dr. Gerhard Scriba
Tag der Disputation: 30. September 2020
Contents
List of Tables V
List of Figures V
1 Introduction 11.1 What is supercritical fluid chromatography . . . . . . . . . . . . . . . . . . . . . . . . 1
1.1.1 Means of separation – separation by any means . . . . . . . . . . . . . . . . . . 11.1.2 Physical background . . . . . . . . . . . . . . . . . . . . . . . . . . . . . . . 11.1.3 Up‐ and downstream compatibility . . . . . . . . . . . . . . . . . . . . . . . . . 3
1.2 Aims . . . . . . . . . . . . . . . . . . . . . . . . . . . . . . . . . . . . . . . . . . 41.3 Methods . . . . . . . . . . . . . . . . . . . . . . . . . . . . . . . . . . . . . . . . 5
2 Results 72.1 SFC in university‐level education . . . . . . . . . . . . . . . . . . . . . . . . . . . . . 72.2 SFC in routine medicinal chemistry . . . . . . . . . . . . . . . . . . . . . . . . . . . . 82.3 Bioanalysis I ‐ Chiral analysis of ketamine . . . . . . . . . . . . . . . . . . . . . . . . . 9
2.3.1 Background . . . . . . . . . . . . . . . . . . . . . . . . . . . . . . . . . . . 92.3.2 Aim . . . . . . . . . . . . . . . . . . . . . . . . . . . . . . . . . . . . . . . 102.3.3 Results of paper V . . . . . . . . . . . . . . . . . . . . . . . . . . . . . . . . 102.3.4 Results of paper VI . . . . . . . . . . . . . . . . . . . . . . . . . . . . . . . . 132.3.5 Results of paper VII and VIII . . . . . . . . . . . . . . . . . . . . . . . . . . . . 142.3.6 Results of paper IX . . . . . . . . . . . . . . . . . . . . . . . . . . . . . . . . 17
2.4 Bioanalysis II – Acidic and basic metabolites of flupirtine . . . . . . . . . . . . . . . . . . 222.4.1 Background . . . . . . . . . . . . . . . . . . . . . . . . . . . . . . . . . . . 222.4.2 Aim . . . . . . . . . . . . . . . . . . . . . . . . . . . . . . . . . . . . . . . 242.4.3 Results of paper X . . . . . . . . . . . . . . . . . . . . . . . . . . . . . . . . 24
3 Conclusion and outlook 29
Literature references 31
4 Publications 414.1 Peer‐reviewed articles . . . . . . . . . . . . . . . . . . . . . . . . . . . . . . . . . . 414.2 Book chapters and applications . . . . . . . . . . . . . . . . . . . . . . . . . . . . . . 157
III

This page has been intentionally left blank.
List of Tables
1.1 Peer‐reviewed publications included in this thesis . . . . . . . . . . . . . . . . . . . . . 4
2.1 Urinary excretion of flupirtine and its metabolites . . . . . . . . . . . . . . . . . . . . . 25
List of Figures
1.1 Physical and emergent properties of supercritical fluids . . . . . . . . . . . . . . . . . . 21.2 Detection methods frequently used in combination with SFC . . . . . . . . . . . . . . . . 3
2.1 SFC in routine medicinal chemistry . . . . . . . . . . . . . . . . . . . . . . . . . . . . 82.2 Structure and pharmacodynamics of ketamine . . . . . . . . . . . . . . . . . . . . . . . 92.3 Major pathways of phase‐I‐metabolism of ketamine in humans . . . . . . . . . . . . . . . 112.4 RPLC‐MS/MS chromatograms of ketamine and its metabolites . . . . . . . . . . . . . . . 122.5 Sample treatment protocols for ketamine . . . . . . . . . . . . . . . . . . . . . . . . . 142.6 SFE‐SFC‐MS chromatograms of ketamine and its metabolites extracted from urine . . . . . 162.7 Retention and enantioselectivity as a function of modifier ratio and other parameters . . . . 182.8 Chiral recognition mechanisms . . . . . . . . . . . . . . . . . . . . . . . . . . . . . . 192.9 General temperature effects on efficiency, retention and enantioseparation . . . . . . . . . 212.10 Temperature effects on the separation of ketamine . . . . . . . . . . . . . . . . . . . . 222.11 Evolution of chromatographic methods for ketamine addressed in this thesis. . . . . . . . . 222.12 Metabolites of flupirtine . . . . . . . . . . . . . . . . . . . . . . . . . . . . . . . . . 232.13 Stationary and mobile phase screening for the separation of flupirtine metabolites . . . . . . 262.14 Optimization and application of the final SFC‐MS method for flupirtine metabolites . . . . . 27
V

This page has been intentionally left blank.
Abstract
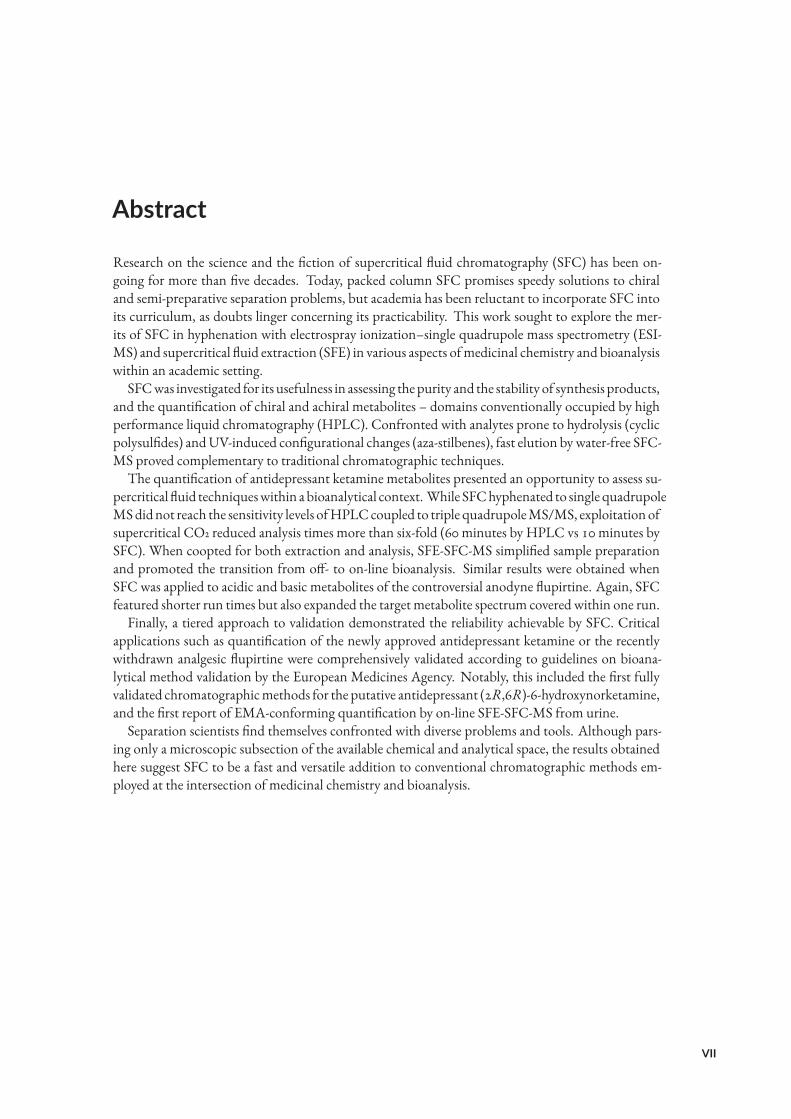
Research on the science and the fiction of supercritical fluid chromatography (SFC) has been on-going for more than five decades. Today, packed column SFC promises speedy solutions to chiraland semi-preparative separation problems, but academia has been reluctant to incorporate SFC intoits curriculum, as doubts linger concerning its practicability. This work sought to explore the mer-its of SFC in hyphenation with electrospray ionization–single quadrupole mass spectrometry (ESI-MS) and supercritical fluid extraction (SFE) in various aspects ofmedicinal chemistry and bioanalysiswithin an academic setting.
SFCwas investigated for its usefulness in assessing thepurity and the stability of synthesis products,and the quantification of chiral and achiral metabolites – domains conventionally occupied by highperformance liquid chromatography (HPLC). Confronted with analytes prone to hydrolysis (cyclicpolysulfides) andUV-induced configurational changes (aza-stilbenes), fast elution bywater-free SFC-MS proved complementary to traditional chromatographic techniques.The quantification of antidepressant ketamine metabolites presented an opportunity to assess su-
percritical fluid techniqueswithin abioanalytical context. While SFChyphenated to single quadrupoleMSdidnot reach the sensitivity levels ofHPLCcoupled to triple quadrupoleMS/MS, exploitationofsupercritical CO2 reduced analysis times more than six-fold (60 minutes by HPLC vs 10 minutes bySFC). When coopted for both extraction and analysis, SFE-SFC-MS simplified sample preparationand promoted the transition from off- to on-line bioanalysis. Similar results were obtained whenSFC was applied to acidic and basic metabolites of the controversial anodyne flupirtine. Again, SFCfeatured shorter run times but also expanded the target metabolite spectrum covered within one run.Finally, a tiered approach to validation demonstrated the reliability achievable by SFC. Critical
applications such as quantification of the newly approved antidepressant ketamine or the recentlywithdrawn analgesic flupirtine were comprehensively validated according to guidelines on bioana-lytical method validation by the European Medicines Agency. Notably, this included the first fullyvalidated chromatographicmethods for the putative antidepressant (2R,6R)-6-hydroxynorketamine,and the first report of EMA-conforming quantification by on-line SFE-SFC-MS from urine.Separation scientists find themselves confronted with diverse problems and tools. Although pars-
ing only a microscopic subsection of the available chemical and analytical space, the results obtainedhere suggest SFC to be a fast and versatile addition to conventional chromatographic methods em-ployed at the intersection of medicinal chemistry and bioanalysis.
VII

This page has been intentionally left blank.
Part 1Introduction
1.1 What is supercritical fluid chromatography
1.1.1 Means of separation – separation by any means
Industrial separation of chemical mixtures accounts for 10–15% of the world’s energy needs.¹ Thechemical-pharmaceutical industry alone takes up more than one fifth of the manufacturing sector’stotal energy costs² due to solvent consuming and waste producing separation techniques such as liq-uid chromatography (LC).³ Indeed, most industrial chemists spend their days on separation.¹ Conse-quently, the time- and cost-saving potential of fast yet frugal separation techniques is enormous.Upon discovery, gas chromatography (GC) was the most effective analytical technique available
and an instant commercial success[¹] for the study of volatiles,⁴ yet far from ideal when confrontedwith thermolabile analytes and preparative applications.⁸ High-pressure variations of LC and GCwere devised to include non-volatile analytes. Applied to LC, reports of high performance liquidchromatography (HPLC) for the separationof biomolecules surfaced in the 1960s.⁹AlthoughHPLCwould require another decade to mature,[²] HPLC has since subsumed all but low-boiling analytesfrom the former magistrate of GC, especially in the pharmaceutical industry.¹⁰ What has becomeof the complementary “high pressure” approach to GC? Here, supercritical fluid chromatography(SFC) enters the scene.
1.1.2 Physical background
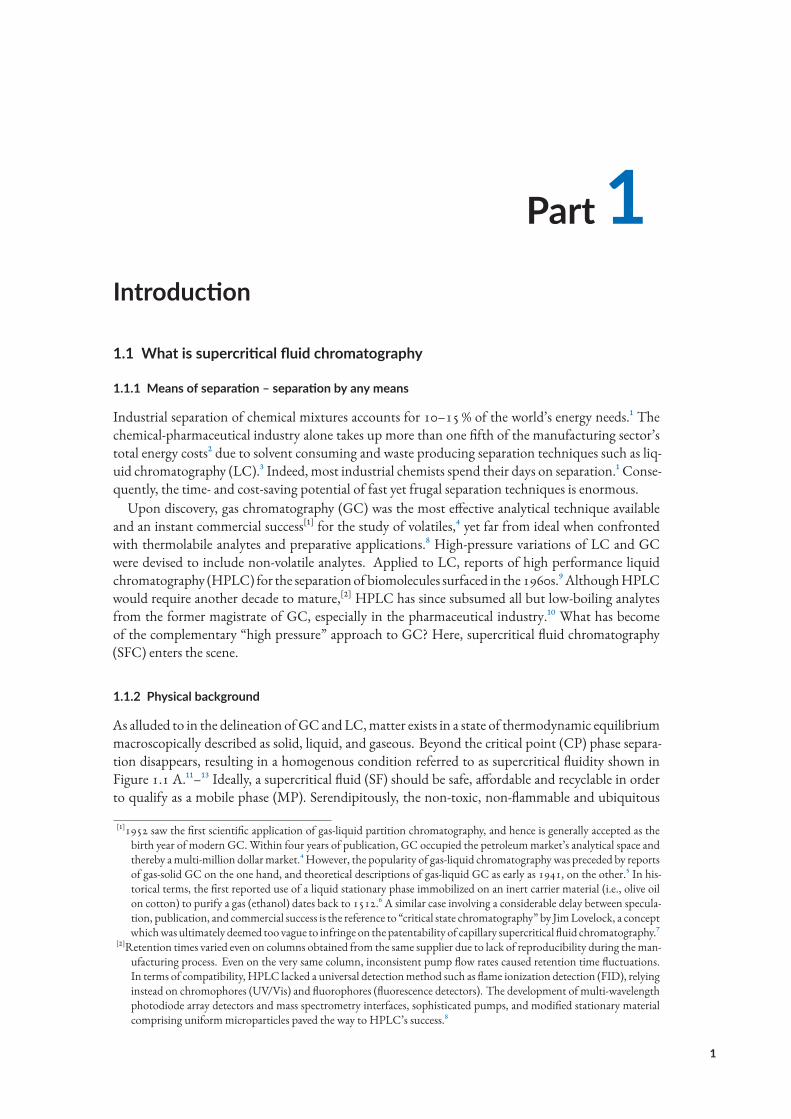
As alluded to in the delineation ofGC andLC,matter exists in a state of thermodynamic equilibriummacroscopically described as solid, liquid, and gaseous. Beyond the critical point (CP) phase separa-tion disappears, resulting in a homogenous condition referred to as supercritical fluidity shown inFigure 1.1 A.¹¹–¹³ Ideally, a supercritical fluid (SF) should be safe, affordable and recyclable in orderto qualify as a mobile phase (MP). Serendipitously, the non-toxic, non-flammable and ubiquitous
[¹]1952 saw the first scientific application of gas-liquid partition chromatography, and hence is generally accepted as thebirth year of modern GC.Within four years of publication, GC occupied the petroleummarket’s analytical space andthereby amulti-million dollarmarket.⁴However, the popularity of gas-liquid chromatographywas preceded by reportsof gas-solid GC on the one hand, and theoretical descriptions of gas-liquid GC as early as 1941, on the other.⁵ In his-torical terms, the first reported use of a liquid stationary phase immobilized on an inert carrier material (i.e., olive oilon cotton) to purify a gas (ethanol) dates back to 1512.⁶ A similar case involving a considerable delay between specula-tion, publication, and commercial success is the reference to “critical state chromatography” by JimLovelock, a conceptwhichwas ultimately deemed too vague to infringe on the patentability of capillary supercritical fluid chromatography.⁷
[²]Retention times varied even on columns obtained from the same supplier due to lack of reproducibility during theman-ufacturing process. Even on the very same column, inconsistent pump flow rates caused retention time fluctuations.In terms of compatibility, HPLC lacked a universal detectionmethod such as flame ionization detection (FID), relyinginstead on chromophores (UV/Vis) and fluorophores (fluorescence detectors). The development of multi-wavelengthphotodiode array detectors and mass spectrometry interfaces, sophisticated pumps, and modified stationary materialcomprising uniformmicroparticles paved the way to HPLC’s success.⁸
1
Part 1 Introduction
F Mobile phase interactions
C
Liquid
Supercritical fluid
Gas
Density
10- 4 10- 2 100 102
g cm-3
D
Diffusivity
10- 6 10- 4 10- 2 100
cm2 s-1
10
Viscosity
- 4 10- 3 10- 2 10- 1
g cm-1 s-1
Low backpressure High mass transferHigh solvation power
Crit
ical
pre
ssur
e p
c (
bar
)
Critical temperature Tc (°C)
Ammonia
Hexane
Pentane
Chlorotrifluoro-methane
PropaneBenzene
Xenon
Nitrous oxide
Carbondioxide
Water
0
25
50
75
200
225
0 100 200 300 400
B
Temperature T
Pre
ssu
re p
Solid Liqu
id
Gas
Supercritical fluid
A
CP
TP
u(rij )
�
rij�
E
Liquid
Supercritical fluid
Gas
Intermolecular potential
MP
Analyte SP
Figure 1.1: Physical and emergent properties of SFs. A) Phase diagram illustrating the differences in molecular order anddensity for each state. Data from references¹¹–¹³. B) Critical temperatureTc and pressure pc of CO₂ (green) and otherMPcandidates. Hydrocarbons and ammonia turn supercritical at low pc but entail flammability (red). Most non‐flammablealternatives (blue) require higher pc or Tc, suffer from ozone‐depleting potential (chlorofluorocarbons), form explosivemixtures with organic co‐solvents (nitrous oxide), or are too expensive for routine application (although xenon and othermonoatomic gases remain viable in combination with infrared detection). Data from references¹⁴–¹⁷. C) Comparison ofphysical parameters depending on state/condition. Data from reference¹⁸. D) Emergent properties of SFs. Liquid‐likedensity, the ability to form clusters, as well as intermolecular interactions improve the solvation power of SFs. Gas‐likeviscosity reduces backpressure buildup, thus allowing for higher flow rates. Among other factors, intermediate diffusivityimproves mass transfer and retains performance at elevated flow rates. Data from references¹⁹,²⁰. E) Lennard‐Jonespotential u as a function of intermolecular distance rij. Whereas the average kinetic energy exceeds molecular attractionand thus allows (ideal) gas molecules to move freely and at little resistance (i.e., viscosity), molecules in liquids are trappedbelow the distance r at which the intermolecular potential between two particles is zero, i.e., within the well depth ε ofintermolecular attraction. In SFs, some molecules’ average kinetic energy is smaller than the attractive energy, resultingin molecular interactions that restrict movement and facilitate cluster formation. Data from references²⁰,²¹. F) Selectivityresults from discriminatory interactions between all chromatographic elements. Variation of MP density offers controlover interactions and, hence, retention in SFC. Data from reference²². CP, critical point; GC, gas chromatography; LC,liquid chromatography; MP, mobile phase; SF, supercritical fluid; SFC, supercritical fluid chromatography; SP, stationaryphase; TP, triple point. Ubiquitous abbreviations such as SFC, HPLC and GC will not be made explicit in the followingFigures but can be found collectively in the abbreviations section. Similarly, the interested reader is referred to the citedliterature for details on chromatographic or MS conditions.
2
1.1What is supercritical fluid chromatography
industrial byproduct carbon dioxide (CO2) easily turns supercritical (31 °C and 74 bar) and thus hasbecome the eluent of choice in modern SFC (Figure 1.1 B).¹⁵–¹⁷
Physical parameters such as liquid-like density, gas-like viscosity, and intermediate diffusivity (Fig-ure 1.1 C) translate into high solvation power, low backpressure buildup, and high mass transfer(Figure 1.1 D). Hence, SFs are capable of dissolving non-volatile analyte mixtures and retaining highefficiency at elevated linear velocity.¹⁶ MP solvation power further benefits from SF molecular inter-action potential and cluster formation (Figure 1.1 E).²¹ While GC relies on theMP as transportationvector with selectivity arising from interactions between analytes and the stationary phase (SP), SFCand LC selectivity profits from additional interactions with the MP (Figure 1.1 F).²³,²⁴ A surplus ofvariables during SFCmethod development and the extent to which they shapeMP interactions withanalytes and the SPmake SFC an orthogonal albeit challenging technique within the analytical spacedominated by LC and GC.²²
1.1.3 Up‐ and downstream compatibility
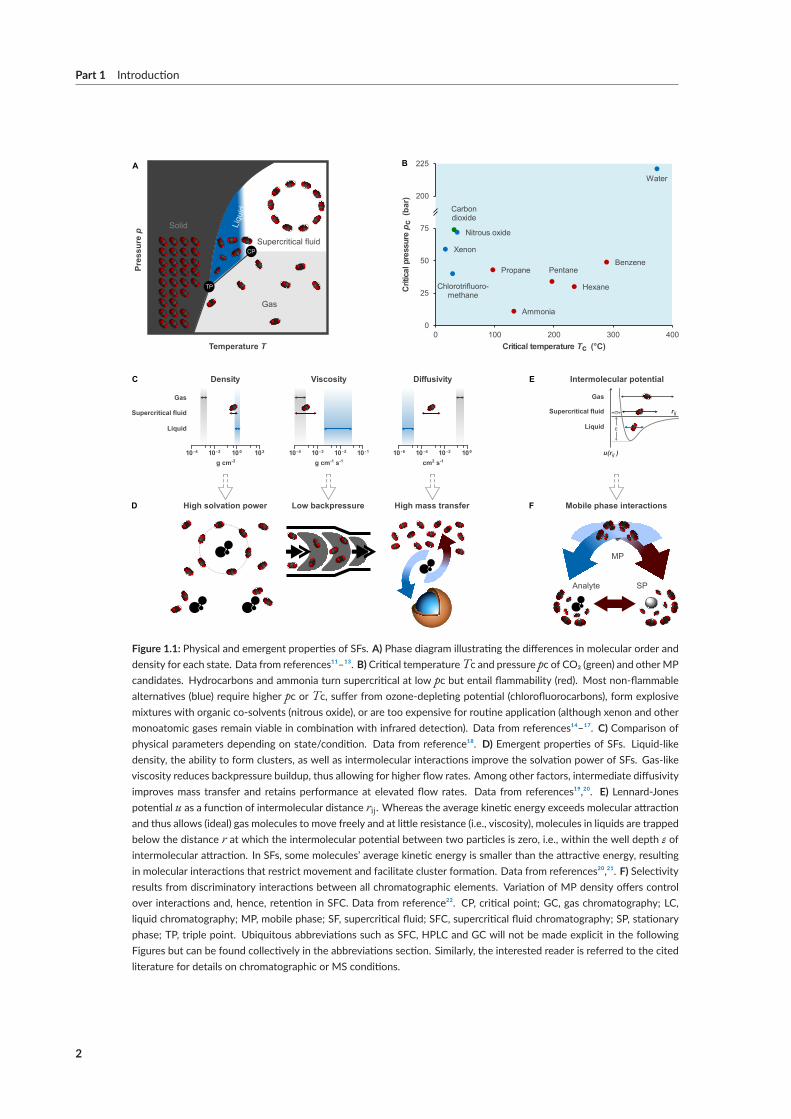
Hyphenation tomass spectrometry has renewed interest in SFCwithin themedicinal chemistry com-munity.¹⁹ CO2 decompression mandates the use of an interface in order to prevent sample precipita-tion, yet sensitivity levels comparable toLC-MShavebeen achieved (Figure 1.2).²⁵Withinbioanalysis,electrospray ionization (ESI) with tandem (MS/MS; 57 %) and single quadrupolemass spectrometry(MS; 23 %) has surpassed classical LC-type (photo diode arrays, PDA; 16%) and GC-type detectors(flame ionization detector, FID;<3%) as the detection method of choice.²⁶ Upstream to separation,unique interfacing opportunities with CO2-based sample preparation techniques such as supercriti-cal fluid extraction (SFE) offer to further reduce the environmental burden and simplify sample treat-ment but remain underrepresented within medicinal chemistry.²⁷
PreviewPreview
A
Inte
nsi
tyIn
ten
sity
baseline drift
identification
Time
Time
co-elution
C
sen
siti
vity
selectivity
Inte
nsi
tyIn
ten
sity
Time
Time
m/z222224238240
DB
?
?? ?
gradient??
E
PDA
CO2 Modifier
Makeup
BPR
MSESI
Figure 1.2:Detection methods frequently used in combination with SFC. A) Illustration of disadvantages associated withSFC‐UV. B) SFC‐UV chromatogram of a ketamine metabolite mixture containing four enantiomer pairs but yielding onlytwo signals identifiable by retention time. C) SFC‐MS entails higher sensitivity and selectivity. D) SFC‐MS chromatogramof the same mixture yielding signals for all analytes (black marks) but also isobaric interference. E) SFC‐ESI‐MS interfaceused in this study. An organic co‐solvent (makeup)was added between photodiode array detector (PDA) and backpressureregulator (BPR) in order to compensate for CO₂ decompression, which otherwise could lead to sample precipitation duringelectrospray ionization (ESI). Note that preparative SFC exploits CO₂ decompression to reduce energy expenditure.
3
Part 1 Introduction
1.2 Aims
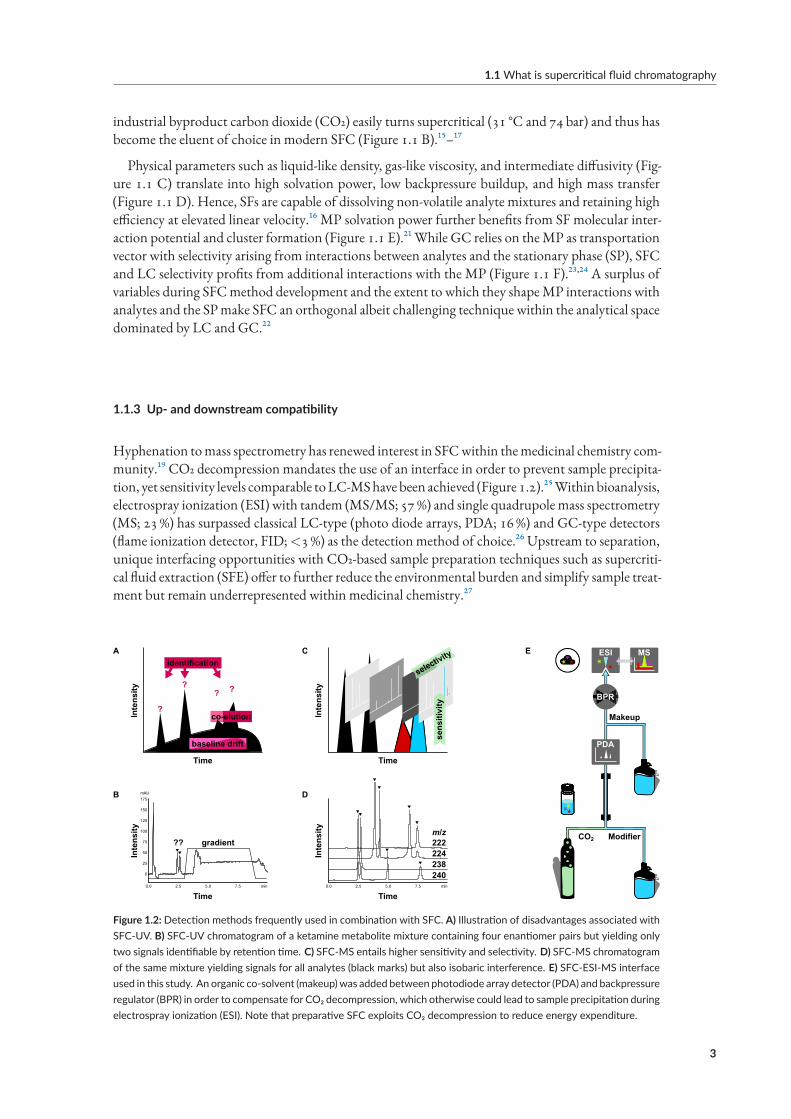
Since milestones in SFC coincided with – or even precluded – the development of competing tech-niques (e.g, the discovery of SFs predating GC, the birth of SFC coinciding with the breakthroughsin HPLC), one would expect SFC to have become the workhorse of medicinal chemistry.[³] Instead,GCand especiallyHPLChave become the go-to solutions.⁹,³²Misconceived notions surrounding theeluting power of pure CO2, a painstakingly slow hardware maturation process,[⁴] and the challengesassociated with method development left scientists disappointed and disillusioned. More than fivedecades after its conception, modern SFC has revised its focus: away from usurping all of chromatog-raphy to instead supplementing LC andGCwith orthogonal selectivity and dominating the – admit-tedly substantial – niche of chiral and semi-preparative separations within the pharmaceutical indus-try.³³ Within bioanalysis, SFC-MS/MS has become a promising contender for superseding HPLC,albeit an expensive one due to 1.5- to 2-fold higher acquisition costs of SFC equipment combinedwith the high procurement costs of sophisticated MS/MS hardware.³⁴ Recently, the developmentof 4th-generation SFC instruments and sophisticated MS interfacing warranted a re-investigation ofSFC coupled with single quadrupole MS, as it pertains to medicinal chemistry. Therefore, SFC-MSwas explored for its usefulness in academia for routine and specialized applications, including bio-analysis (humanmetabolism and gastric emptying studies) and stability testing of in-house synthesisproducts. Critical applications were subjected to comprehensive performance testing according tointernational guidelines on bioanalytical validation.³⁵ The discrepancy between academic and indus-trial use brought about the inclusionof SFC intopharmacists’ training in formof a lecture text. Apartfrom the peer reviewed contributions listed in Table 1.1, topical interest in the elucidation of antide-pressant effects of ketamine (KET) also prompted a book chapter and two application notes on thesubject.
Table 1.1: Publications included in this thesis. FLU, flupirtine; KET, ketamine.
Paper First/last author Year Type Analytical objective
I Hofstetter/Link 2019 Lecture text Integration of SFC into the academic curriculumII Grathwol/Link 2019 Research paper Stability/purity testing of photo‐switching aza‐stilbenesIII Hofstetter/Schulzke 2019 Research paper Stability/purity testing of hydrolysis‐labile polysulfidesIV Hofstetter/Link 2019 Manuscript On‐line sample preparation of salivary samples for the determina‐
tion of gastric emptyingV Hasan/Oswald 2017 Research paper Development of a chiral quantification method for KET and its an‐
tidepressant metabolitesVI Fassauer/Link 2017 Research paper Improvement of analysis speed for KET metabolitesVII Hofstetter/Link 2018 Research paper Improvement of sample preparation for KET metabolitesVIII Hofstetter/Link 2018 Editorial Outlook onto the potential of SFE‐SFC for bioanalysisIX Hofstetter/Link 2019 Research paper Investigation into enantioseparation of KET metabolitesX Hofstetter/Link 2019 Research paper Development of a quantification method for FLU metabolites
[³]The CP was discovered by Charles Cagniard de la Tour in 1822,²⁸ named by Dmitri Mendeleev in 1860,²⁹ and furthercharacterized by Thomas Andrews in the following decades.⁷ Although initially greeted with disbelief, Hannay andHogarth reported on fluids’ ability to dissolve chlorophyll and even inorganic salts as early as 1879.³⁰ “Critical statechromatography” was described by Jim Lovelock as early as 1956 but it was Ernst Klesper’s 1962 report of “high pres-sure GC above critical temperatures” that is commonly credited as the birth of SFC.³¹
[⁴]Both HPLC and SFC stations derived from GC hardware, but whereas the modifications necessary to deliver viscousliquids were technically challenging, accommodating SFs required courage. Early SFC stations were homemade, pro-ducing SFs by heating hydrocarbons or chlorofluorocarbons in a closed reservoir connected to a downstream restrictor‒a practice illegal by today’s safety standards and which sometimes led to explosive outcomes.¹⁴,³¹
4
1.3Methods
1.3 Methods
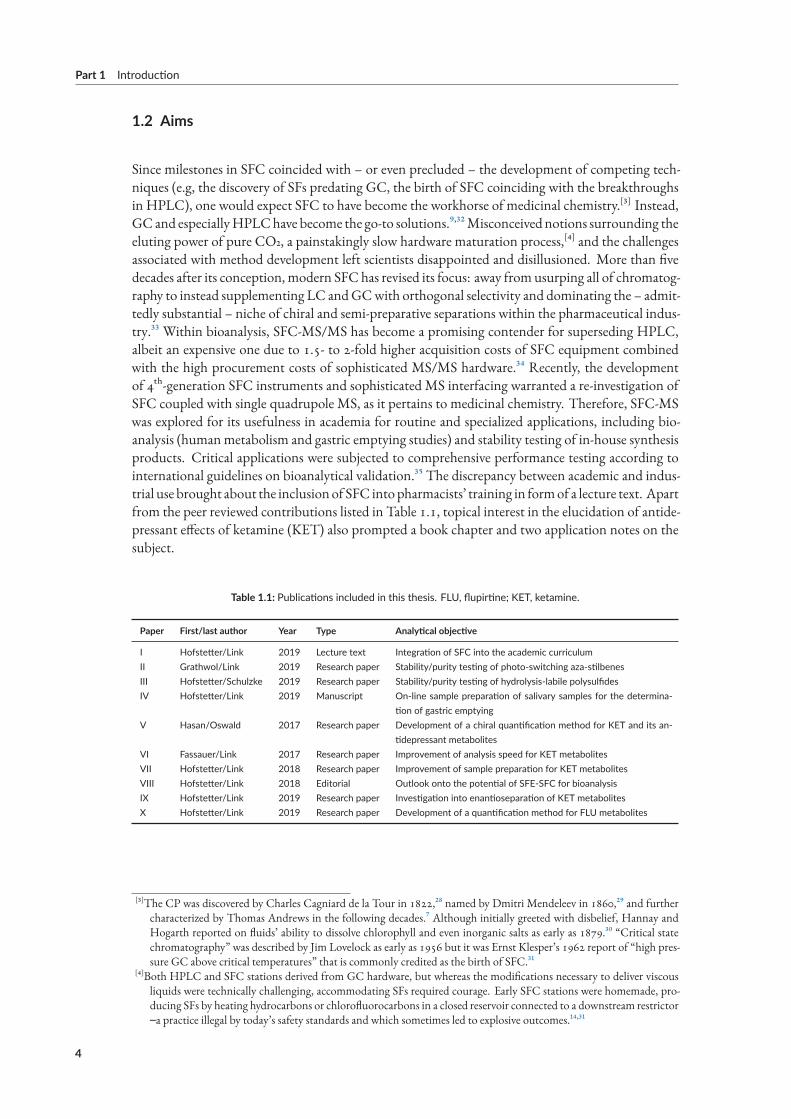
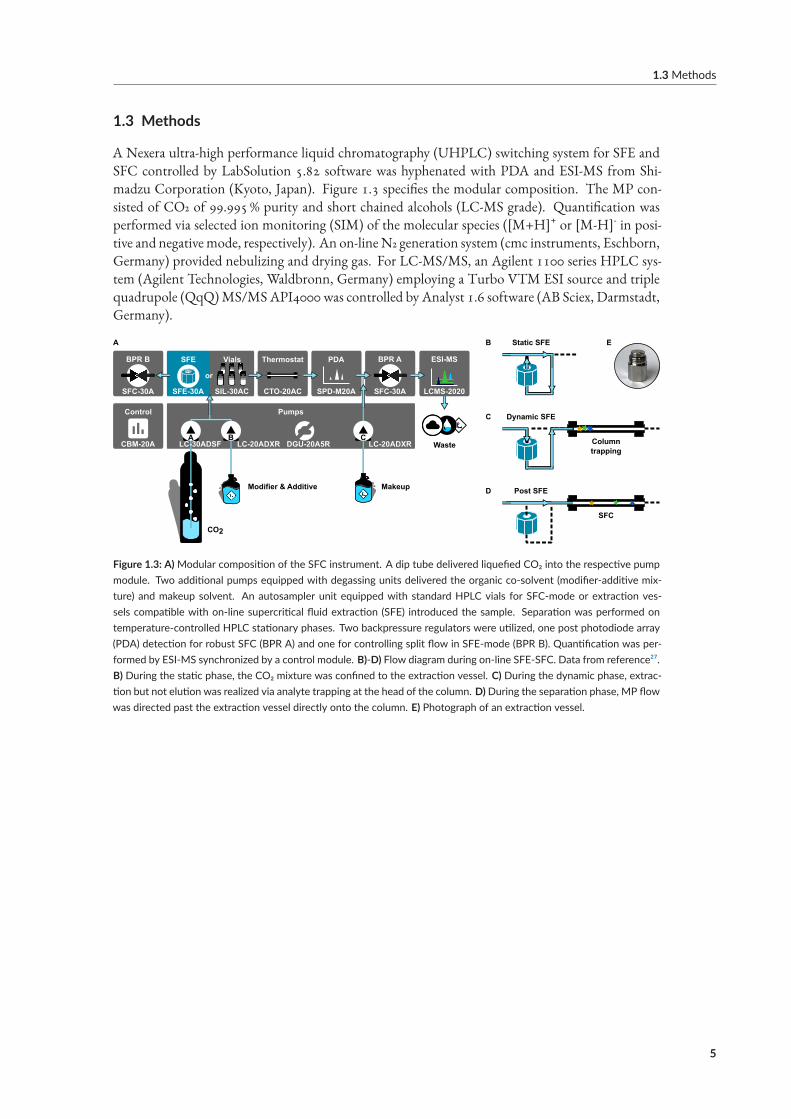
A Nexera ultra-high performance liquid chromatography (UHPLC) switching system for SFE andSFC controlled by LabSolution 5.82 software was hyphenated with PDA and ESI-MS from Shi-madzu Corporation (Kyoto, Japan). Figure 1.3 specifies the modular composition. The MP con-sisted of CO2 of 99.995 % purity and short chained alcohols (LC-MS grade). Quantification wasperformed via selected ion monitoring (SIM) of the molecular species ([M+H]+ or [M-H]- in posi-tive and negativemode, respectively). An on-lineN2 generation system (cmc instruments, Eschborn,Germany) provided nebulizing and drying gas. For LC-MS/MS, an Agilent 1100 series HPLC sys-tem (Agilent Technologies, Waldbronn, Germany) employing a Turbo VTM ESI source and triplequadrupole (QqQ)MS/MSAPI4000 was controlled by Analyst 1.6 software (AB Sciex, Darmstadt,Germany).
Pumps
Makeup
Waste
CO2
Modifier & Additive
CBM-20A LC-20ADXR LC-20ADXR
Thermostat
CTO-20AC
PDA
SPD-M20A
DGU-20A5R
Control
BPR B
SFC-30A
SFE
SFE-30A SIL-30AC
Vials
A
or
E
C
ESI-MS
LCMS-2020
BPR A
SFC-30A
A BLC-30ADSF
B Static SFE
C Dynamic SFE
D Post SFE
Columntrapping
SFC
Figure 1.3: A)Modular composition of the SFC instrument. A dip tube delivered liquefied CO₂ into the respective pumpmodule. Two additional pumps equipped with degassing units delivered the organic co‐solvent (modifier‐additive mix‐ture) and makeup solvent. An autosampler unit equipped with standard HPLC vials for SFC‐mode or extraction ves‐sels compatible with on‐line supercritical fluid extraction (SFE) introduced the sample. Separation was performed ontemperature‐controlled HPLC stationary phases. Two backpressure regulators were utilized, one post photodiode array(PDA) detection for robust SFC (BPR A) and one for controlling split flow in SFE‐mode (BPR B). Quantification was per‐formed by ESI‐MS synchronized by a control module. B)‐D) Flow diagram during on‐line SFE‐SFC. Data from reference²⁷.B) During the static phase, the CO₂ mixture was confined to the extraction vessel. C) During the dynamic phase, extrac‐tion but not elution was realized via analyte trapping at the head of the column. D)During the separation phase, MP flowwas directed past the extraction vessel directly onto the column. E) Photograph of an extraction vessel.
5

This page has been intentionally left blank.
Part 2Results
2.1 SFC in university‐level education
SFC has flourished mostly outside academia.³⁶ Until the 1980s, scientific output was dominated byacademic institutions but stagnated during the 1990s and early 2000s, when disillusionment regard-ing the eluting power of pure CO2 and lack of reproducibility on home-made instruments set in.²⁰Even after the introduction of organic co-solvent use had conferred control over eluting power and1st- and 2nd-generation commercial platforms had improved reproducibility, academia was reluctantto abandon the familiar LC and GC, which had proved sufficient for dealing with comparably smallbatch sizes, in favor of reincarnations of SFC. For industrial purposes, however, sufficient was notenough. Competing to separate thousands of samples – increasingly containing chiral mixtures³⁷ –and sans the luxury of affordable PhD-candidate-driven labor, the promise of up to fivefold increasesin sample throughput was enticing: By 2008, the top ten pharmaceutical companies (in revenue)operated approximately 50 SFC units, each.³⁶[¹] Naturally, academic sources continued to dominatethe scientific output, but during the first decade of the 21st century, the private sector contributedas much as 35 % of the peer-reviewed literature on SFC. Since then, literary output is once againdominated by academic institutions, although privately employed scientists (18 %) and joint ventures(11 %) continue to contribute a significant portion of the peer-reviewed literature.³³
Today, the savings potential in time, energy, and ultimately money required for the removal of liq-uid eluents from the eluate has made SFC the go-to solution for the semi-preparative purification ofdrug candidates in the pharmaceutical industry up to batch sizes of 100 kg, beyondwhich continuousLC coupled to solvent recycling outperforms SFC.³⁶ Scientific output notwithstanding, SFC contin-ues to suffer from underrepresentation in terms of academic curricula and training opportunities.Taking German pharmacy school as an example of nationally standardized testing, SFC-related con-tent was introduced as late as 2018.³⁹ Moreover, existing lecture texts of analytical chemistry adhereto the bottom-up approach of starting with physics before providing the justification for any mentalinvestment to beginwith. The aim of paper I was to apply a solution-based approach to introductorylectures on SFC that offered the commensurate incentive for engaging with supercritical fluids (i.e.,what does SFC bring to the table?) prior to asking for mental down payment in form of physicaldetails and instrumental requirements.⁴⁰
[¹]Apart from the aforementioned differences in labor availability and batch sizes, financial differences may have con-tributed to academics’ inertia towards adopting SFC, since waste disposal costs often came from a pot ofmoney sharedby the entirety of the academic institution. The entailing diffusion of responsibility rendered waste-reducing tech-niques less attractive. Today, on the other hand, RP-UHPLC on sub-2-µm SPs comes close to outperforming SFC interms of greenness by reducing flow rates and relying on water-richMPs.³⁸
7
Part 2 Results
HPLC
GC
SF
C
Ort
ho
go
na
lity
Sp
eed
Res
olu
tio
n
Analyticalspace
Chemicalspace
Polarity Reactivity
Functionality
HILIC
NPC
RPC
IEC
scCO2
+ modifier
+ additives
SFC
HPLC
Increasing polarity
AlkanesAlkenesAlkynes
EstersEthers
AlcoholsAmides
ProteinsDNARNA
AcidsAmines
AmphotericsPeptides
Analyte polarity range
native
+ derivatization
GC
DA
u (cm/s)
HE
TP
(µ
m)
Optimal velocity
HPLC SFC
GC(capillary)
B
0 0.2 0.4 0.6 0.8 1.00
10
20
30
∞
∞
So
lvat
ion
str
eng
th
SFCEFLCPOLC
CO2 (%) in methanol or acetonitrile
Water
C
0
Acetonitrile
n-Hexane
Methanol
Diethyl ether
Tetrahydrofuran
99% CO2
0% CO2
100
60% CO2
40% CO2
20% CO2
80% CO2
Photo-switches
N
NNH2N
O
N
NNH2N
O
R
R
(Z)-Aza-stilbenes
(E)-Aza-stilbenes
E
λ
λ
Alkylated polysulfides
S S
SSS
S S
SS
S S
S
S S
SSS
S S
SS
S S
S
S S
S
S S
SSS
CH3CH3
H3CH3C
S S
SS
CH3
CH3
H3C
H3C
S S
S
Trithiolanes
Tetrathianes Pentathiepanes
H2S
F Methylxanthines
N
N N
N
O
O
H3C
CH3
CH3
N
NH
N
N
O
O
H3CCH3
N
N N
HN
O
O
H3C
CH3
HN
N N
N
O
O
CH3
CH3
Theophylline
Caffeine Paraxanthine
Theobromine
G
H2O
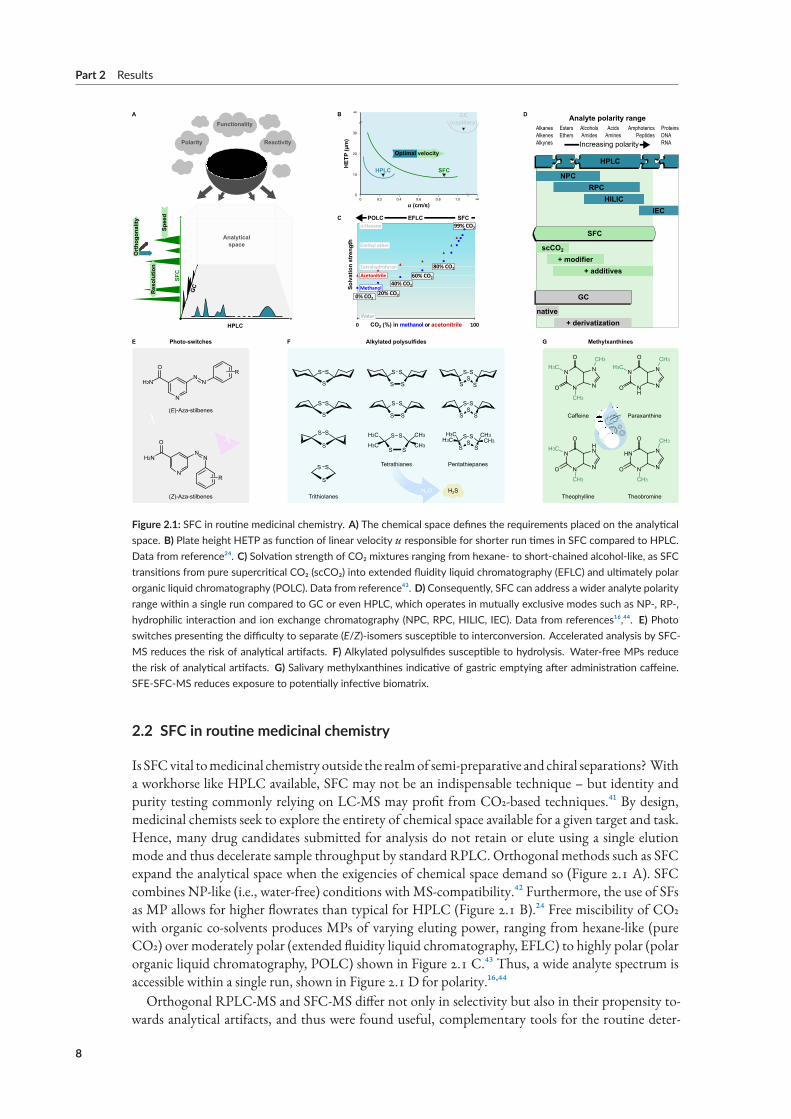
Figure 2.1: SFC in routine medicinal chemistry. A) The chemical space defines the requirements placed on the analyticalspace. B) Plate height HETP as function of linear velocity u responsible for shorter run times in SFC compared to HPLC.Data from reference²⁴. C) Solvation strength of CO₂ mixtures ranging from hexane‐ to short‐chained alcohol‐like, as SFCtransitions from pure supercritical CO₂ (scCO₂) into extended fluidity liquid chromatography (EFLC) and ultimately polarorganic liquid chromatography (POLC). Data from reference⁴³. D) Consequently, SFC can address a wider analyte polarityrange within a single run compared to GC or even HPLC, which operates in mutually exclusive modes such as NP‐, RP‐,hydrophilic interaction and ion exchange chromatography (NPC, RPC, HILIC, IEC). Data from references¹⁶,⁴⁴. E) Photoswitches presenting the difficulty to separate (E/Z)‐isomers susceptible to interconversion. Accelerated analysis by SFC‐MS reduces the risk of analytical artifacts. F) Alkylated polysulfides susceptible to hydrolysis. Water‐free MPs reducethe risk of analytical artifacts. G) Salivary methylxanthines indicative of gastric emptying after administration caffeine.SFE‐SFC‐MS reduces exposure to potentially infective biomatrix.
2.2 SFC in routine medicinal chemistry
Is SFCvital tomedicinal chemistry outside the realmof semi-preparative and chiral separations? Witha workhorse like HPLC available, SFC may not be an indispensable technique – but identity andpurity testing commonly relying on LC-MS may profit from CO2-based techniques.⁴¹ By design,medicinal chemists seek to explore the entirety of chemical space available for a given target and task.Hence, many drug candidates submitted for analysis do not retain or elute using a single elutionmode and thus decelerate sample throughput by standard RPLC. Orthogonal methods such as SFCexpand the analytical space when the exigencies of chemical space demand so (Figure 2.1 A). SFCcombines NP-like (i.e., water-free) conditions withMS-compatibility.⁴² Furthermore, the use of SFsas MP allows for higher flowrates than typical for HPLC (Figure 2.1 B).²⁴ Free miscibility of CO2with organic co-solvents produces MPs of varying eluting power, ranging from hexane-like (pureCO2) over moderately polar (extended fluidity liquid chromatography, EFLC) to highly polar (polarorganic liquid chromatography, POLC) shown in Figure 2.1 C.⁴³ Thus, a wide analyte spectrum isaccessible within a single run, shown in Figure 2.1 D for polarity.¹⁶,⁴⁴
Orthogonal RPLC-MS and SFC-MS differ not only in selectivity but also in their propensity to-wards analytical artifacts, and thus were found useful, complementary tools for the routine deter-
8
2.3 Bioanalysis I ‐ Chiral analysis of ketamine
mination of reactive analytes.⁴⁵ In paper II, orthogonal chromatographic tools (RPLC and SFC) tomonitor photo-induced E/Z-isomerization of reactive aza-stilbenes corroborated the successful de-velopment of photo-switchable sirtuin inhibitors by providing consistent findings with either tech-nique (Figure 2.1 E).⁴⁶ Similarly, impurity testing of a class of hydrolysis-prone cyclic polysulfidesbenefited from water-free eluting conditions achieved by switching from RPLC to SFC and was ex-ploited in paper III (Figure 2.1 F).⁴⁷ Finally, CO2-based techniques also thrived at the intersection ofmedicinal chemistry and biopharmacy: In paper IV (draft), the well-documented utility of SFE forthe extraction of caffeine prepared the ground for the first on-line SFE-SFC-MS determination ofsaliva for a gastric emptying study, alleviating manual handling of potentially infectious biosamples(Figure 2.1 G).⁴⁸
2.3 Bioanalysis I ‐ Chiral analysis of ketamine
2.3.1 Background
In 2010, point prevalence ofmajor depressive disorder (MDD) ranged from as low as 0.05 % inmalesfrom Japan aged 65 years or older to an astonishing 73% in females from Afghanistan, aged 15 yearsor older.⁴⁹ Expressed as years lived with disability (YLD), depressive disorders were responsible for aglobal total of 50 million YLD in 2015 alone, rendering mood disorders the single largest contribu-tor to non-fatal health loss, as well as a major contributor to suicide.⁵⁰,⁵¹ Given the personal natureofMDD, hard data may fall short of describing the improvements brought about by the articulationof the monoamine hypothesis that gave birth to modern psychopharmacology. However, even aftermore than 50 years of continual improvements, today’s pharmacological treatment options forMDDare limited.⁵² Current first-line treatment options such as selective serotonin-reuptake inhibitors (SS-RIs) suffer from severe flaws such as initial symptom aggravation,most notably an increase in suicidalbehavior; delayed antidepressant onset, often taking weeks to months to take effect; and non-robustremission rates with up to 30% of patients non-responding even after increasing dosage, lithium aug-mentation or change ofmedication.⁵³ Thus, prevalence of clinical depression continues to rise despitea substantial increase in medication prescription rates.⁵⁴ Indeed, electroconvulsive therapy (ECT) re-mains one of the most effective treatment options,⁵⁵ emphasizing the urgent need for rapid-acting,sustained, and robust antidepressants.⁵⁶
(S)-KetaminePhencyclidine (PCP)
(R)-Ketamine
O
Cl
HN
H3C
N
O
Cl
NH
H3C
NMDA receptor
Mg2+ block
agonistco-agonists
mGlu2 receptor
S-S
PP
G
N
C
AMPA receptor
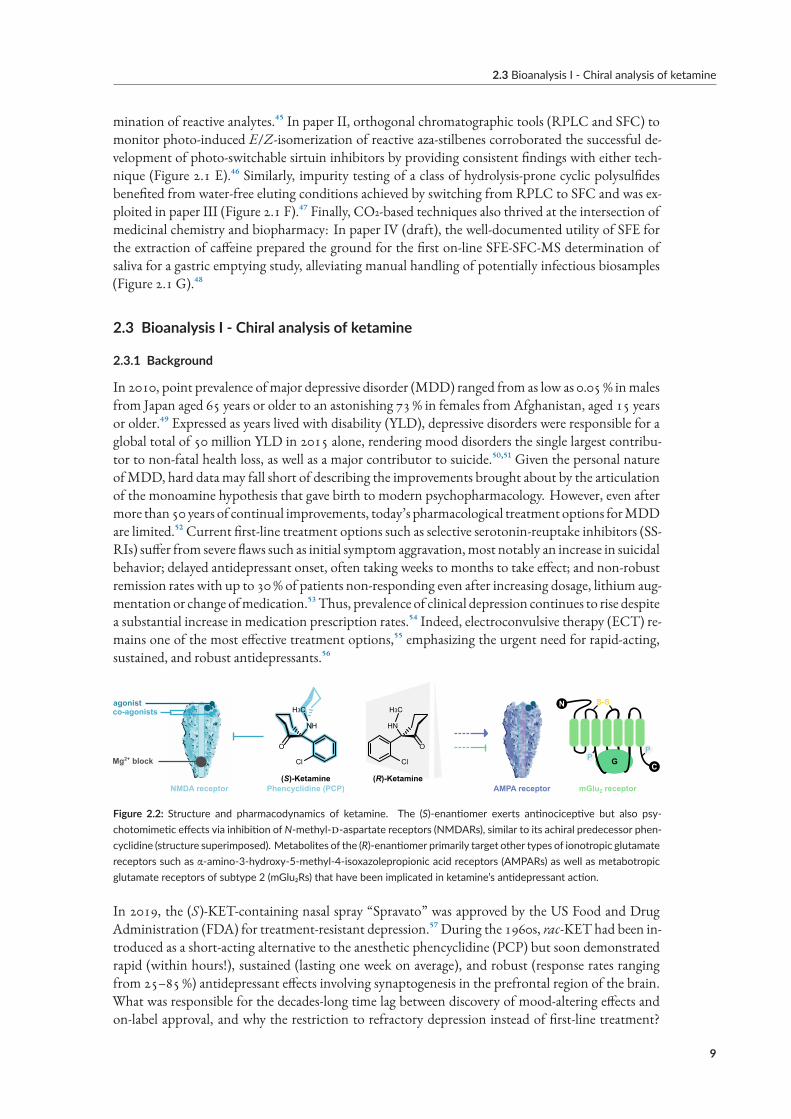
Figure 2.2: Structure and pharmacodynamics of ketamine. The (S)‐enantiomer exerts antinociceptive but also psy‐chotomimetic effects via inhibition of N‐methyl‐d‐aspartate receptors (NMDARs), similar to its achiral predecessor phen‐cyclidine (structure superimposed). Metabolites of the (R)‐enantiomer primarily target other types of ionotropic glutamatereceptors such as α‐amino‐3‐hydroxy‐5‐methyl‐4‐isoxazolepropionic acid receptors (AMPARs) as well as metabotropicglutamate receptors of subtype 2 (mGlu₂Rs) that have been implicated in ketamine’s antidepressant action.
In 2019, the (S)-KET-containing nasal spray “Spravato” was approved by the US Food and DrugAdministration (FDA) for treatment-resistant depression.⁵⁷ During the 1960s, rac-KET had been in-troduced as a short-acting alternative to the anesthetic phencyclidine (PCP) but soon demonstratedrapid (within hours!), sustained (lasting one week on average), and robust (response rates rangingfrom 25–85%) antidepressant effects involving synaptogenesis in the prefrontal region of the brain.What was responsible for the decades-long time lag between discovery of mood-altering effects andon-label approval, and why the restriction to refractory depression instead of first-line treatment?
9
Part 2 Results
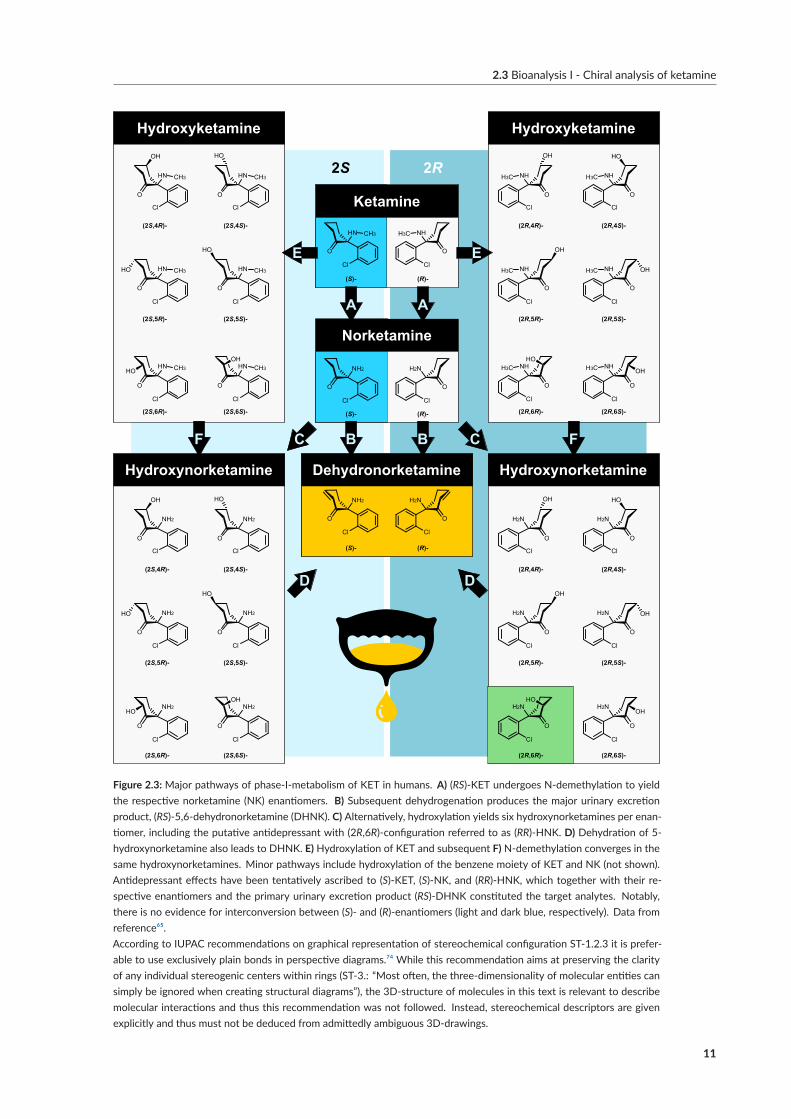
Inhibition of N -methyl-d-aspartate receptors (NMDARs) by KET and its active metabolite norke-tamine (NK) accounts for antinociceptive but also psychotomimetic effects, contributing to abuseliability[²] and limiting anesthetic utility[³].⁶⁰,⁶¹ (S)-KET and (S)-NK represent the eutomers regard-ing NMDAR; however, the extent to which NMDAR inhibition contributes to the antidepressanteffects – and hence, whether (S)-KET should be considered the antidepressant eutomer – has beencontested.⁶²–⁶⁴Alternative glutamatergic transductionmechanisms have been proposed, including α-amino-3-hydroxy-5-methyl-4-isoxazolepropionic acid receptor (AMPAR)activation andmetabotropicglutamate receptor subtype 2 and 3 (mGlu2R) inhibition by secondary metabolites (Figure 2.2).However, the therapeutic and commercial success of Spravato hinges on the active agent’s affiliationto the 2S-series of KET metabolites, as metabolic inversion seems unlikely.⁶⁵[⁴] A promising candi-date in the form of (2R,6R)-6-hydroxynorketamine, (RR)-HNK, has since emerged.⁷⁰–⁷³Now, thereis a need for metabolism studies in humans equipped with chemo- and enantio-selective tools for(RR)-HNK determination among the constitutional, diastereomeric, and optical isomers producedby phase-I-metabolism of KET (Figure 2.3).⁶³
2.3.2 Aim
The aim of papers V–IX was to develop chemo- and stereoselective tools for the quantification ofpromising metabolites of KET from biological matrices. This included (RR/SS)-HNK (mGlu2Rhypothesis); (RS)-KET and (RS)-NK (NMDAR/AMPAR hypothesis); and (RS)-5,6-dehydronor-ketamine (DHNK) as the main urinary excretion product. However, chemical similarity betweenthemultitude of hydroxylated, dehydrogenated, and/or demethylated isomers impeded this task thusfar.¹⁷WhileRPLC-UV,⁶⁷,⁷⁵–⁸⁰GC-MS,⁸¹–⁸⁵ andRPLC-MS/MS⁸⁶–⁸⁹ havebeen reported for rac-KETand rac-NK in the past, only few studies included additional metabolites or attempted chiral quan-tification. Moaddel et al. succeeded in achiral separation of a series of hydroxylated diastereomers byRPLC-MS/MSbut failed to resolve the specificpair ofHNKs implicated in antidepressant action.⁸⁸[⁵]Thormann et al. optimized capillary electrophoresis (CE) in combination with highly sulfated γ-cyclodextrin selectors and UV-detection to overcome the chiral limitations of RPLC.⁹⁰–⁹⁴ Prior tothe publication of paper V, chromatographic quantification ofRR-HNK had not been reported.⁸⁸
2.3.3 Results of paper V
Initial attempts at enantioselective metabolite quantification focused on RPLC-MS/MS. Paper Vdescribes the development, validation, and application of three RPLC-MS/MS methods to plasma,urine, and fecal samples. These methods featured shorter run times and higher analytical sensitivitythan previous chromatographic methods, translating to higher sample throughput and lower bioma-trix volume requirements. Most importantly, the application of these methods provided the firstpharmacokinetic data on stereoselective (RR)-HNK formation in humans.
Sample preparationwas performed by liquid-liquid extraction (LLE). Briefly, 200 µL of biomatrixwere alkalized to liberate the lipophilic bases of each analyte and extracted with 4mL of methyl tert-butyl ether. Here, inter-analyte similarity in terms of basicity (6.89 ≤ pKa ≤ 7.27) and polarity
[²]Side/desired effects (depending on medical/recreational use) include visual hallucinations, de-realization, out-of-bodyexperiences, and a sense of unity with the environment. In terms of non-psychotomimetic effects, chronic use is asso-ciated with ulcerative cystitis.⁵⁸
[³]Ketamine remains an effective analgesic option in veterinary and emergencymedicine for patientswith extreme agitation,and in children due to its ability to preserve respiratory and cardiovascular stability as well as laryngeal reflexes.⁵⁹
[⁴]The available data on metabolic inversion is inconsistent, the majority of findings suggesting inversion to be unlikely,insubstantial, or impossible,⁶⁵–⁶⁷ with only two reports (one primary⁶⁸ and one secondary⁶⁹) suggesting otherwise.
[⁵]The RPLC-MS/MS method reported by Moaddel et al. was extremely powerful in terms of achiral separation, includ-ing KET, NK, DHNK, and diastereomeric isomers of 4-,5-, and 6-HNK, 5- and 6-hydroxyketamine, and even glu-curonic acid conjugates of hydroxynorketamine. However, only KET, NK, and DHNK could be quantified enantios-electively.⁸⁸Recent publications by the sameworking groupon the effects of (2R,6R)-6-hydroxynorketamine employedthe same (achiral) determination method.⁷³
10
2.3 Bioanalysis I ‐ Chiral analysis of ketamine
E
BF
A
C
D
E
F
A
C B
D
HN
O
Cl
CH3
HO
HN
O
Cl
CH3
HO
HN
O
Cl
CH3OH
(2S,4S)-
(2S,5S)-
(2S,6S)-
(2S,4R)-
(2S,5R)-
(2S,6R)-
HN
O
Cl
CH3
OH
HN
O
Cl
CH3HO
HN
O
Cl
CH3HO
NH
O
Cl
H3C
HO
NH
O
Cl
H3C OH
NH
O
Cl
H3C OH
NH
O
Cl
H3C
OH
NH
O
Cl
H3C
OH
NH
O
Cl
H3CHO
(2R,4S)-
(2R,5S)-
(2R,6S)-
(2R,4R)-
(2R,5R)-
(2R,6R)-
NH2
O
Cl
HO
NH2
O
Cl
HO
NH2
O
Cl
HO
NH2
O
Cl
OH
NH2
O
Cl
HO
(2S,4S)-
(2S,5S)-
(2S,4R)-
(2S,5R)-
(2S,6R)-
H2N
O
Cl
OH
H2N
O
Cl
HO
H2N
O
Cl
OH
H2N
O
Cl
OH
H2N
O
Cl
OH
(2R,4S)-
(2R,5S)-
(2R,6S)-
(2R,4R)-
(2R,5R)-
2S 2R
(S)- (R)-
HN
O
Cl
CH3 NH
O
Cl
H3C
NH2
O
Cl
OH
(2S,6S)-
NH2
O
Cl
H2N
O
Cl
(S)- (R)-
H2N
O
Cl
HO
(2R,6R)-
H2N
O
Cl
NH2
O
Cl
(S)- (R)-
Hydroxyketamine Hydroxyketamine
Hydroxynorketamine Dehydronorketamine Hydroxynorketamine
Ketamine
Norketamine
A A
B BC C
D D
E E
F F
Figure 2.3:Major pathways of phase‐I‐metabolism of KET in humans. A) (RS)‐KET undergoes N‐demethylation to yieldthe respective norketamine (NK) enantiomers. B) Subsequent dehydrogenation produces the major urinary excretionproduct, (RS)‐5,6‐dehydronorketamine (DHNK). C) Alternatively, hydroxylation yields six hydroxynorketamines per enan‐tiomer, including the putative antidepressant with (2R,6R)‐configuration referred to as (RR)‐HNK. D) Dehydration of 5‐hydroxynorketamine also leads to DHNK. E) Hydroxylation of KET and subsequent F) N‐demethylation converges in thesame hydroxynorketamines. Minor pathways include hydroxylation of the benzene moiety of KET and NK (not shown).Antidepressant effects have been tentatively ascribed to (S)‐KET, (S)‐NK, and (RR)‐HNK, which together with their re‐spective enantiomers and the primary urinary excretion product (RS)‐DHNK constituted the target analytes. Notably,there is no evidence for interconversion between (S)‐ and (R)‐enantiomers (light and dark blue, respectively). Data fromreference⁶⁵.According to IUPAC recommendations on graphical representation of stereochemical configuration ST‐1.2.3 it is prefer‐able to use exclusively plain bonds in perspective diagrams.⁷⁴ While this recommendation aims at preserving the clarityof any individual stereogenic centers within rings (ST‐3.: “Most often, the three‐dimensionality of molecular entities cansimply be ignored when creating structural diagrams”), the 3D‐structure of molecules in this text is relevant to describemolecular interactions and thus this recommendation was not followed. Instead, stereochemical descriptors are givenexplicitly and thus must not be deduced from admittedly ambiguous 3D‐drawings.
11
Part 2 Results
0 5 10 15 20 25
MS
(%
)
Chiral-AGP
HNK
DHNK
NKKET
KETNK
DHNK
A
MS
(%
)
Time (min)
XTerra MS
HNK
DHNKNKKET
0 1 2 3 4 5
B
Time (min) Time (min)
0 50 100 150
KET
NK
DHNK
HNK
AUC (ng × h × mL-1 )
RS
Plasma
Ae (mg)
0.0 0.1 0.2 0.3 0.4
KET
NK
DHNK
HNK
Urine
0 5 10 15 20 25
Lux Amylose-2
HNK
HNK
MS
(%
)
Ae (µg)
0.0 0.5 1.0 1.5 2.0 2.5
KET
NK
DHNK
HNK
<LLOQ
<LODrac
Feces
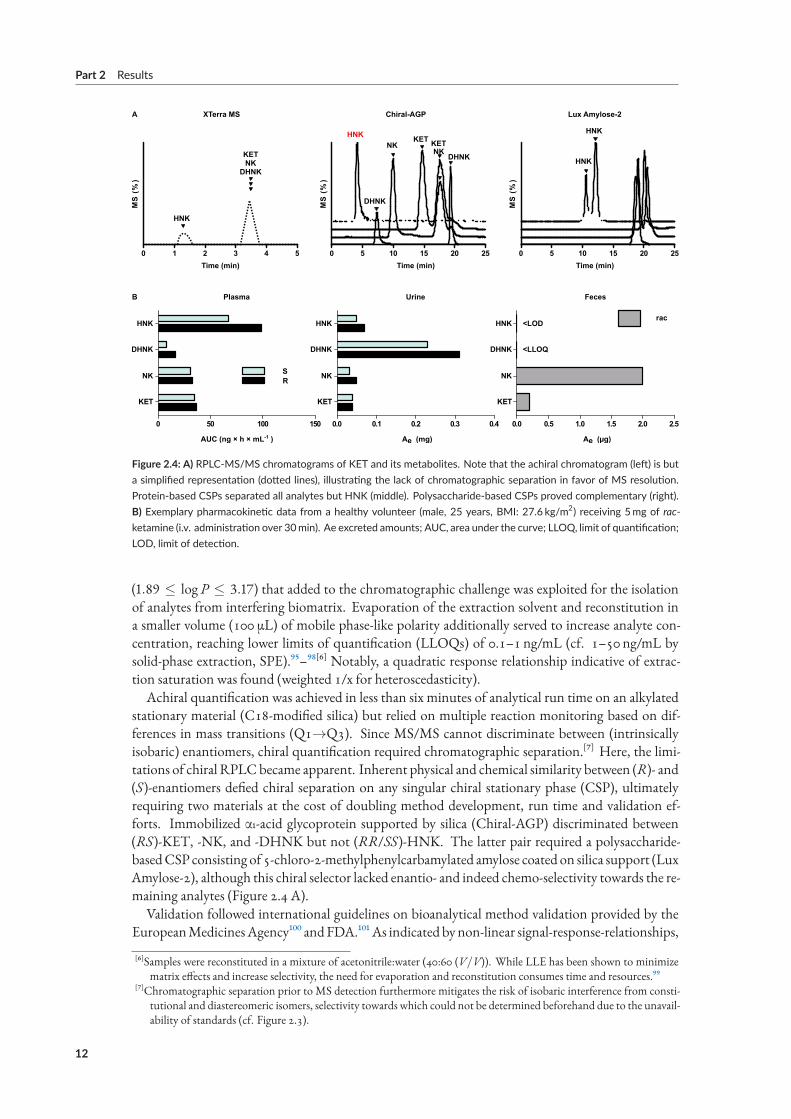
Figure 2.4: A) RPLC‐MS/MS chromatograms of KET and its metabolites. Note that the achiral chromatogram (left) is buta simplified representation (dotted lines), illustrating the lack of chromatographic separation in favor of MS resolution.Protein‐based CSPs separated all analytes but HNK (middle). Polysaccharide‐based CSPs proved complementary (right).B) Exemplary pharmacokinetic data from a healthy volunteer (male, 25 years, BMI: 27.6 kg/m2) receiving 5mg of rac‐ketamine (i.v. administration over 30min). Ae excreted amounts; AUC, area under the curve; LLOQ, limit of quantification;LOD, limit of detection.
(1.89 ≤ logP ≤ 3.17) that added to the chromatographic challenge was exploited for the isolationof analytes from interfering biomatrix. Evaporation of the extraction solvent and reconstitution ina smaller volume (100 µL) of mobile phase-like polarity additionally served to increase analyte con-centration, reaching lower limits of quantification (LLOQs) of 0.1–1 ng/mL (cf. 1–50 ng/mL bysolid-phase extraction, SPE).⁹⁵–⁹⁸[⁶] Notably, a quadratic response relationship indicative of extrac-tion saturation was found (weighted 1/x for heteroscedasticity).Achiral quantification was achieved in less than six minutes of analytical run time on an alkylated
stationary material (C18-modified silica) but relied on multiple reaction monitoring based on dif-ferences in mass transitions (Q1→Q3). Since MS/MS cannot discriminate between (intrinsicallyisobaric) enantiomers, chiral quantification required chromatographic separation.[⁷] Here, the limi-tations of chiral RPLCbecame apparent. Inherent physical and chemical similarity between (R)- and(S)-enantiomers defied chiral separation on any singular chiral stationary phase (CSP), ultimatelyrequiring two materials at the cost of doubling method development, run time and validation ef-forts. Immobilized α1-acid glycoprotein supported by silica (Chiral-AGP) discriminated between(RS)-KET, -NK, and -DHNK but not (RR/SS)-HNK. The latter pair required a polysaccharide-basedCSP consisting of 5-chloro-2-methylphenylcarbamylated amylose coated on silica support (LuxAmylose-2), although this chiral selector lacked enantio- and indeed chemo-selectivity towards the re-maining analytes (Figure 2.4 A).
Validation followed international guidelines on bioanalytical method validation provided by theEuropeanMedicinesAgency¹⁰⁰ and FDA.¹⁰¹ As indicated by non-linear signal-response-relationships,
[⁶]Samples were reconstituted in a mixture of acetonitrile:water (40:60 (V/V)). While LLE has been shown to minimizematrix effects and increase selectivity, the need for evaporation and reconstitution consumes time and resources.⁹⁹
[⁷]Chromatographic separation prior to MS detection furthermore mitigates the risk of isobaric interference from consti-tutional and diastereomeric isomers, selectivity towards which could not be determined beforehand due to the unavail-ability of standards (cf. Figure 2.3).
12
2.3 Bioanalysis I ‐ Chiral analysis of ketamine
recovery rates were below 100%. Inter- and intra-run accuracy and precision, however, were withinguideline recommendations (≤15% difference of nominal to determined concentrations; ≤20% atLLOQ). In accordance with previous investigations by LLE, comparison of signals in presence andabsence of matrix revealed no significant matrix effects.⁹⁹Applied to a pilot study approved by the local ethics Committee and the German Federal Insti-
tute forDrugs andMedicalDevices (BfArM), theRPLC-MS/MSmethodprovidedpharmacokineticdata in agreement with previous (achiral) reports of serum exposure[⁸] (Figure 2.4 B). After an initialKET spike during infusion of the racemate, exposure was highest for HNK, followed by NK andDHNK (70.3, 167.1, 63.7 and 23.5 ng h/mL, respectively). Chiral quantification provided evidenceof stereoselective formation of the putative antidepressant (RR)-HNK (98.1 ngh/mL) compared toits enantiomer (67.0 ngh/mL). While phase-I-metabolite content of feces was insignificant,[⁹] pos-sibly due to phase-II-metabolites dominating fecal elimination (glucuronidation), urinary excretionconsisted predominantly of (RS)-DHNK (0.31mg and 0.23mg, respectively), followed by (RR/SS)-HNK (0.07mg and 0.05mg), (RS)-NK (0.05mg and 0.03mg) and (RS)-KET (0.04mg per enan-tiomer).
2.3.4 Results of paper VI
The novel RPLC-ESI-MS/MS method had identified urine as a suitable biomatrix for the putativeantidepressant agent (RR)-HNK, now amenable to chromatographic quantification. However, thenovel procedure was not without drawbacks: exposure to organic solvents during sample prepara-tion (methyl tert-butyl ether) and chromatographic analysis (acetonitrile, 2-propanol) produced toxicwaste and entailed health risks. The need for consecutive analysis by two chiral methods with a com-bined run time of 60min – system equilibration time not included – limited sample throughput andincreased costs per sample. Detection by ESI-MS/MS provided excellent sensitivity, but the phar-macokinetic data from urine suggested analyte concentrations within the range of more affordabledetectors. The aim of paper VI was therefore to develop a more economical and eco-friendly meansfor the analysis of KET and its main urinary metabolites. Hence, SFC-ESI-MS was evaluated as analternative to RPLC-ESI-MS/MS.While RPLC on 5-chloro-2-methylphenylcarbamoylated amylose was unable to discriminate be-
tween all enantiomers butHNK, operation in SFC-mode revealed a significant improvement of enan-tioselectivity accompanied by NP-like elution patterns. The favorable change in MP viscosity anddiffusivity facilitated flow rates of up to 3mL/min without impairing resolution. Hence, a singleSFC-run of less than 15min achieved chiral separation of NK, DHNK, and HNK – compared toHNKwithin 60min in RPLC-mode.⁹⁸In accordancewithprevious reports of cellulose-based chiralCSPs, theuse of basic additives proved
essential for separating KET, the most challenging enantiomer pair to resolve.¹⁰³ While difficulty ofseparation coincided with lowest retention for this analyte, retention and chiral resolution are notnecessarily correlated, as corroborated byhigher enantioselectivity towardsNKcompared toDHNK.Furthermore, parameters affecting mobile phase eluting power (e.g., choice of modifier) did not af-fect chiral resolution in a linear matter: Although retention times were shortest with methanol andlongest with acetonitrile, intermediate eluting 2-propanol provided the highest resolution. Differingcontributions of chemo- and enantioselective sites to retention, as well as modifiers’ involvement inthe stabilization of specific conformations has been proposed to explain this phenomenon.¹⁰⁴On the downside, the transition from triple to single quadrupole detection entailed an approxi-
mately 50-fold decrease in sensitivity and impaired isobaric selectivity: While MS/MS yielded mini-
[⁸]CYP enzymes’ susceptibility to genetic variation, inhibition and induction, as well as general inter- and intraindividualvariability has been credited for accounting for differences in pharmacokinetic data within in the literature, includingstudies from the same working group.⁸⁸,¹⁰²
[⁹]Within feces, only KET (0.004% of the original dose) and NK (0.04 %) were quantifiable. The content of DHNKwasbelow LLOQ, and HNKwas not detected.
13
Part 2 Results
D
Chargevessel
AddIS
Addsample
Dry Extractionand analysis
E
AddIS
AnalysisTransferto vial
Vortex
Addextractant
Transferextractant
AddIS
ReconstituteTransfersample
A
Stir Centrifuge Dry Vortex AnalysisTransferto vial
AddIS
ReconstituteTransfersample
C
Dry Vortex AnalysisCollecteluate
Transferto vial
Transfersupernatant
Add IS inprecipitant
ReconstituteTransfersample
B
Centrifuge Dry AnalysisVortexStir Transferto vial
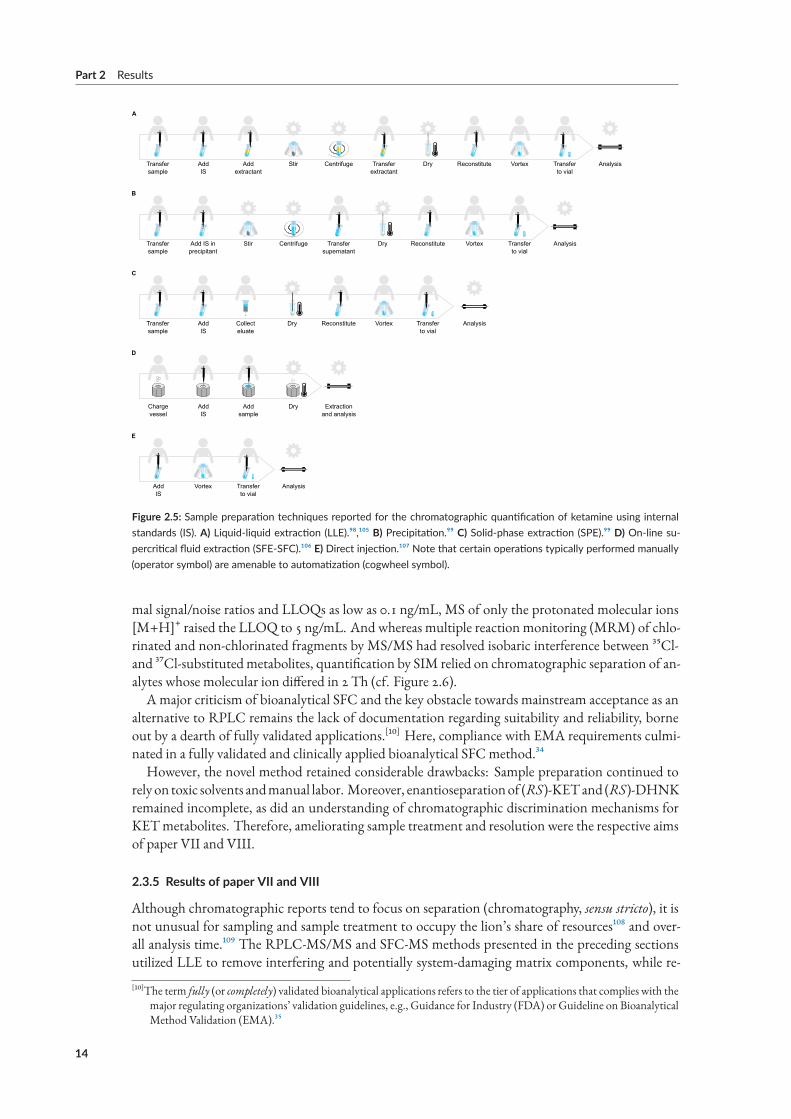
Figure 2.5: Sample preparation techniques reported for the chromatographic quantification of ketamine using internalstandards (IS). A) Liquid‐liquid extraction (LLE).⁹⁸,¹⁰⁵ B) Precipitation.⁹⁹ C) Solid‐phase extraction (SPE).⁹⁹ D) On‐line su‐percritical fluid extraction (SFE‐SFC).¹⁰⁶ E) Direct injection.¹⁰⁷ Note that certain operations typically performed manually(operator symbol) are amenable to automatization (cogwheel symbol).
mal signal/noise ratios and LLOQs as low as 0.1 ng/mL, MS of only the protonated molecular ions[M+H]+ raised the LLOQ to 5 ng/mL. And whereas multiple reaction monitoring (MRM) of chlo-rinated and non-chlorinated fragments by MS/MS had resolved isobaric interference between ³⁵Cl-and ³⁷Cl-substitutedmetabolites, quantification by SIM relied on chromatographic separation of an-alytes whose molecular ion differed in 2Th (cf. Figure 2.6).A major criticism of bioanalytical SFC and the key obstacle towards mainstream acceptance as an
alternative to RPLC remains the lack of documentation regarding suitability and reliability, borneout by a dearth of fully validated applications.[¹⁰] Here, compliance with EMA requirements culmi-nated in a fully validated and clinically applied bioanalytical SFCmethod.³⁴
However, the novel method retained considerable drawbacks: Sample preparation continued torely on toxic solvents andmanual labor. Moreover, enantioseparationof (RS)-KETand (RS)-DHNKremained incomplete, as did an understanding of chromatographic discrimination mechanisms forKETmetabolites. Therefore, ameliorating sample treatment and resolution were the respective aimsof paper VII and VIII.
2.3.5 Results of paper VII and VIII
Although chromatographic reports tend to focus on separation (chromatography, sensu stricto), it isnot unusual for sampling and sample treatment to occupy the lion’s share of resources¹⁰⁸ and over-all analysis time.¹⁰⁹ The RPLC-MS/MS and SFC-MS methods presented in the preceding sectionsutilized LLE to remove interfering and potentially system-damaging matrix components, while re-
[¹⁰]The term fully (or completely) validated bioanalytical applications refers to the tier of applications that complies with themajor regulating organizations’ validation guidelines, e.g., Guidance for Industry (FDA) or Guideline on BioanalyticalMethod Validation (EMA).³⁵
14
2.3 Bioanalysis I ‐ Chiral analysis of ketamine
constitution in a smaller volume than the original sample volume improved sensitivity through up-concentration. On the downside, LLE is time-intensive and entails a series of additional – notablymanual – handling steps that expose operators to potentially infective samples and toxic solvents(Figure 2.5). Quadratic signal response curves further indicated the possibility of extractant satura-tion. Utilizing CO2 for both extraction and separation has been the subject of recent efforts towardsgreen(er) chromatography.²⁷,¹⁰⁸–¹¹⁰ The prospects and the feasibility of guideline-conforming valida-tion of on-line SFE-SFC-MS were the subject of discussion in paper VII and demonstrated in paperVIII.
KET and its metabolites were amenable to static-dynamic extraction by CO2 and on-line analysishyphenated by column head trapping. Extension of static extraction times up to 3min improvedrecovery without loss of resolution. Extension of dynamic extraction time, on the other hand, nega-tively affected resolution, and was therefore limited to half a minute.Initial extractions from native urine were erratic due to the confounding effects of residual mois-
ture on analyte distribution between liquidmatrix and super/subcritical extractant, uniformity beingachieved only after standardizing drying conditions.¹¹¹ Nevertheless, noise within relevant sections ofthe chromatogram precluded quantification when using cellulose-based adsorbents. Although onlyfew SFE-SFC reports dwell on the nature of the adsorbent, experimentation revealed said noise to bethe result of extractable impurities from all tested brands of filter paper. A possible explanation wasfound in the scarcity of single MS methods for SFE-SFC¹¹² known to be more susceptible to inter-ference than MS/MS applications.¹¹³–¹¹⁸ Inorganic adsorbents such as calcined diatomaceous earth(silicon dioxide and quartz)¹¹² yielded the lowest noise and highest recovery.¹¹⁹
Failure to demonstrate the desired level of reproducibility – i.e., extensive validation – remains amajor criticism of modern SFC¹²⁰,¹²¹ that is especially fitting for the subset of applications relying onon-line SFE for sample preparation.¹²² Due to the criticality of the application (therapy of depres-sion; anticipation of psychotomimetic side effects at higher doses), guideline-conforming validationaccording to EMA requirements was striven for and achieved. Notably,Mandel’s fitting test revealeda linear signal-response-relationship, albeit of slightly higher response variability (R2
SFE ≤ 0.988;R2LLE ≤ 0.999)[¹¹] than the previous LLE methods’ quadratic relationship.⁹⁸,¹⁰⁵ SFE-SFC-MS was
slightly less susceptible to ionization suppression compared to LLE-SFC-MS, arguably the result oflower biomatrix requirements at the expense of a five-fold loss in selectivity.[¹²] Figure 2.6 shows arepresentative chromatogram at LLOQ.The novel method constituted the first bioanalytical application of SFE-SFC-MS to urine – and,
in fact, the first fully validated application of this technique – sacrificing increments of accuracy,precision, and sensitivity for time- and labor-economization. Do these benefits warrant the analyticalcosts?
[¹¹]Widely used as an indicator of the proportion of variability in the response, the determination coefficientR2 is popularfor its seemingly straightforward concept: higher values (up to 1) are superior to lower values. However, R2 does notpenalize model complexity, thereby encouraging overfitting not indicative of the error of individual measurements.¹²³As noted by Hunter,R2 values close to 1 provide an “aura of respectability, but not much else”.¹²⁴ In the case at hand,however, accuracy andprecisionwere indeed slightly inferior for SFE than forLLE as judgedbyquality control samples’nominal and measured concentrations – although well within guideline requirements for both techniques.
[¹²]Range comparisons between on- and off-line methods are not straightforward due to conflicting effects of volume intro-duction vs up-concentration: For the given chromatographic system, SFE extraction vessels could accommodate up to5mL of sample, whereas the SFC injection loop delivered only up to 5 µL. Hence, volume introduction favored SFEover SFC in terms of on-column sample. Conversely, LLE benefitted from up-concentration, with LLOQs generallyreferring to pre-treated samples. Given the easy availability of urine, the injection loop volume (5 µL) limited the LLE-SFC-MSmethod’s on-column analyte amount. Should the need for lower LLOQs have arisen, introducing one entiremL of sample into the system via SFE-SFC-MS may have lowered LLOQs, albeit at the expense of additional methoddevelopment to maintain exhaustive extraction without incurring additional matrix effects.
15
Part 2 Results
A B
Inte
nsity
(%
)
m/z
100
100
100
100
0
0
0
0
200 260 300180 240 280220
240.1
243.1
238.1
240.0
239.0
224.1
226.1
222.1
224.1
223.1
(RR/SS)-HNK
(RS)-KET
(RS)-NK
(RS)-DHNK
225.1
6.0 6.5 7.0 7.5 8.0 8.5 9.0 9.5
(R)-DHNK (S)-DHNK
(R)-NK (S)-NK
(R)-KET(S)-KET
150000
150000
150000
150000
0
0
0
0
(SS)-HNK (RR)-HNK
240,00(+)
238,00(+)
224,00(+)
222,00(+)
Inte
nsity
(cp
s)
Time (min)
10.0
37Cl-(RS)-KET
37Cl-(RS)-DHNK
isobars
enantiomersenantiomers
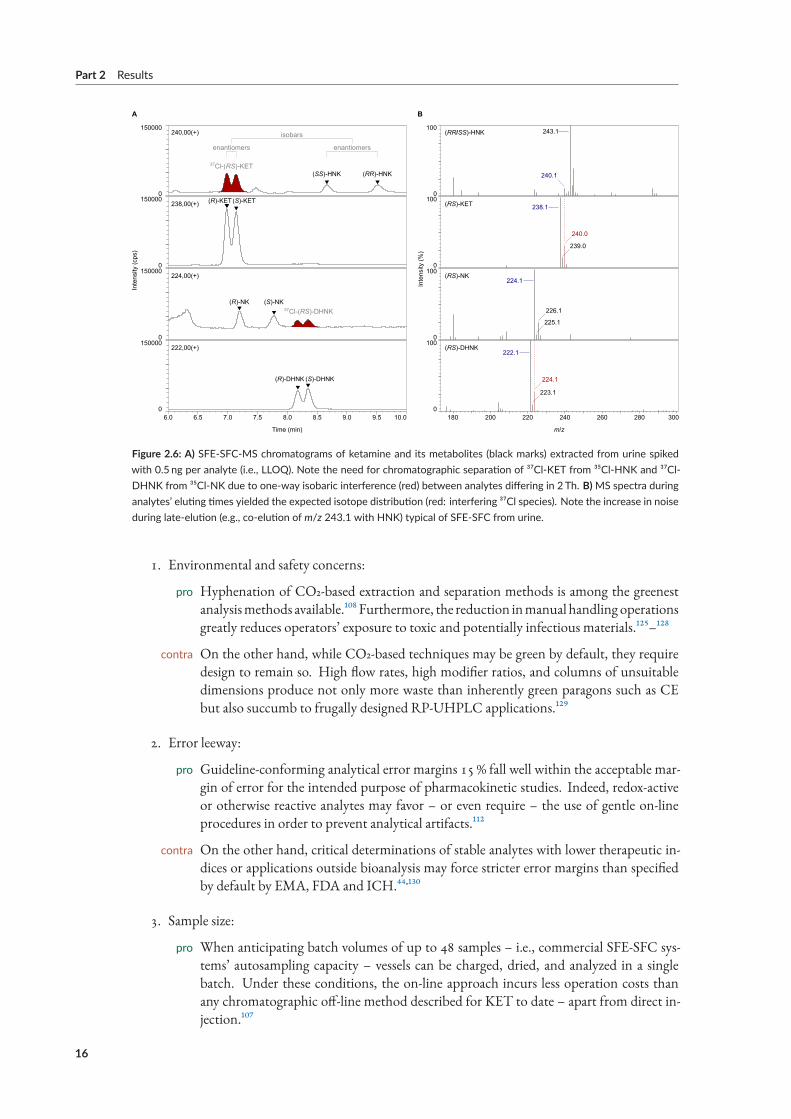
Figure 2.6: A) SFE‐SFC‐MS chromatograms of ketamine and its metabolites (black marks) extracted from urine spikedwith 0.5 ng per analyte (i.e., LLOQ). Note the need for chromatographic separation of ³⁷Cl‐KET from ³⁵Cl‐HNK and ³⁷Cl‐DHNK from ³⁵Cl‐NK due to one‐way isobaric interference (red) between analytes differing in 2 Th. B)MS spectra duringanalytes’ eluting times yielded the expected isotope distribution (red: interfering ³⁷Cl species). Note the increase in noiseduring late‐elution (e.g., co‐elution of m/z 243.1 with HNK) typical of SFE‐SFC from urine.
1. Environmental and safety concerns:
pro Hyphenation of CO2-based extraction and separation methods is among the greenestanalysismethods available.¹⁰⁸ Furthermore, the reduction inmanual handling operationsgreatly reduces operators’ exposure to toxic and potentially infectious materials.¹²⁵–¹²⁸
contra On the other hand, while CO2-based techniques may be green by default, they requiredesign to remain so. High flow rates, high modifier ratios, and columns of unsuitabledimensions produce not only more waste than inherently green paragons such as CEbut also succumb to frugally designed RP-UHPLC applications.¹²⁹
2. Error leeway:
pro Guideline-conforming analytical error margins 15 % fall well within the acceptable mar-gin of error for the intended purpose of pharmacokinetic studies. Indeed, redox-activeor otherwise reactive analytes may favor – or even require – the use of gentle on-lineprocedures in order to prevent analytical artifacts.¹¹²
contra On the other hand, critical determinations of stable analytes with lower therapeutic in-dices or applications outside bioanalysis may force stricter error margins than specifiedby default by EMA, FDA and ICH.⁴⁴,¹³⁰
3. Sample size:
pro When anticipating batch volumes of up to 48 samples – i.e., commercial SFE-SFC sys-tems’ autosampling capacity – vessels can be charged, dried, and analyzed in a singlebatch. Under these conditions, the on-line approach incurs less operation costs thanany chromatographic off-line method described for KET to date – apart from direct in-jection.¹⁰⁷
16
2.3 Bioanalysis I ‐ Chiral analysis of ketamine
contra When confrontedwith larger batch volumes, three factors decelerate sample-throughputand inflate costs: the batch exceeds autosampler capacity and therefore requires a man-ual change of racks. More extraction vessels are required to support simultaneous sampleprocessing (charging, drying) in order to prevent the necessity of bringing the analysis toa halt for intra-batch vessel cleaning. Finally, traditional sample treatment procedurescan be performed in parallel, e.g., rocking, centrifugation, and drying. Depending ontechnicians’ speed and the degree of automation, the bottleneck shifts from sample treat-ment to analysis. Hence, off-line (but parallel) treatment followed by fast analysis (e.g.,10min by SFC¹³¹) may break even with or even outperform on-line (but largely serial)methods when confronted with sufficiently large batch sizes.¹³²
In the case of HNK, chiral determination by either off- or on-line SFC technique provided highersample throughput than the reference RPLC method due to the latter’s time-intensive chromato-graphic separation (15min vs 60min, respectively).
2.3.6 Results of paper IX
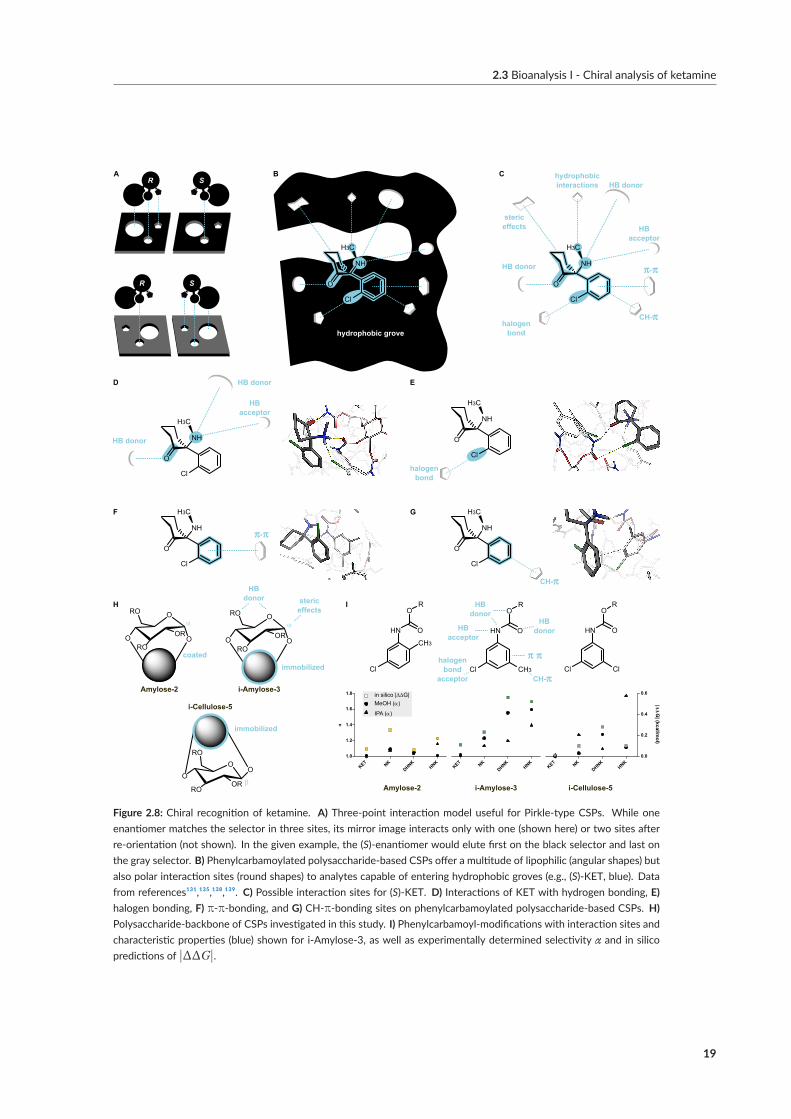
The earliest reports comparing chiral separation ofKETon cellulose-basedCSPs emphasized the infe-riority of SFC compared toNPLC, both in terms of enantioselectivity and peak shape.¹⁰³ Our resultson amylose-based CSPs provided redeeming evidence for polysaccharide-based CSPs in SFC-moderegarding the discrimination of antidepressant metabolite candidates, i.e., (S)-NK and (RR)-HNK.However, incomplete separation of (RS)-KET and (RS)-DHNK limited the development of fastermethods. Paper IX sought to overcome this limitation by identifying and optimizing the dominantvariables determining chiral recognition of KET.To this end, an empirical study informed by in silicomodeling investigated the effects exerted by three polysaccharide-based CSPs, the operation-mode,and parameters available during method development.UnlikePirkle-type SPs, amylose- and cellulose-basedCSPs function as chiral selectors due topolysac-
charides’ molecular, conformational, and macromolecular architecture (Figure 2.8 A and B). Mod-ern polysaccharide-basedCSPs aremultimodal, compatiblewithNPLC,RPLC,HILIC, and SFC.¹³³OnnativeCSPs, enantioselectivity relies heavily on hydrogenbonding and dipole-dipole-interactionsthat initially discouraged RPLC for fear of competition with polar bonding sites. Modification in-troduces non-polar interactions sites, e.g., alkylated phenyl moieties. Carbamoylation further freespolar interaction sites by offering additional nitrogen and oxygen atoms and reducing the degree ofintramolecular hydrogen bonding. Finally, the formation of hydrophobic ravines within stationaryphase cavities restricts access to polar MP constituents, thereby retaining polar interaction sites forsmall molecule analytes of intermediate polarity. Hence, RPLC,[¹³] HILIC[¹⁴] and NPLC[¹⁵] havebecome useful operation modes in their particular niches (Figure 2.8 C).¹³⁵SFC-screenings ofCSPs rely largely on trial-and-error and operators’ experience, as clear guidelines
are unavailable. Linear solvation energy relationships (LSERs), a subset of quantitative structure-retention relationships (QSRRs), represent an attempt at translating the large body of experimen-tal evidence into predictive and comparative models based on multilinear regression of retentiondata. However, QSRRs require either a representative selection of solute descriptors or a completedescription of possible retention mechanisms, neither of which available for the given separationtask.¹³⁶ Hence, a blind docking approach was explored to elucidate the contributions of different in-teractions and guide method development. By sorting the obtained docking poses in order of bind-
[¹³]Apart from favoring non-polar retention mechanisms, protic RP solvents offer MS compatibility; in contrast, aproticNP-solvents suppress ionization (ESI) or risk ignition in the presence of air (APCI corona discharge). Another advan-tage of RP is the possibility of direct injection of polar reconstitution solvents or aqueous biomatrix that would riskpeak shape deterioration under NP conditions.¹⁷,⁴²
[¹⁴]HILIC offers advantages in the simultaneous analysis of polar and non-polar analytes.¹³⁴[¹⁵]NPLC favors separation by polar retention mechanisms and offers the option of direct injection of organic solvents
without peak shape deterioration.¹³¹
17
Part 2 Results
ing free energy to create a representative set of possible interaction sites, hydrogen, π-π-, halogen,and CH-π bonds were identified as the main interaction types on three phenylcarbamoylated CSPs(Figure 2.8 D-G).
Equippedwith amodel to guide column selection, the energy difference |ΔG| for the highest dock-ing score between enantiomers confirmed KET as most problematic enantiomer pair but predictedthe highest enantioselectivity for tris(3-chloro-5-methylphenylcarbamate) substituted i-Amylose-3(Figure 2.8 H and I). Subsequent experiments confirmed both predictions, including an up to 1.5-fold amelioration of chiral recognition of (RS)-NK, (RS)-DHNK, and (RR/SS)-HNK. The im-provement was ascribed to steric hindrance by ortho- vsmeta-substituted phenyl moieties restrictingaccess to the hydrogen bonding carbamate group. The ability to form hydrogen networks also ex-plained the attenuated chiral recognition of HNK configuration in RPLC- vs SFC-mode.Depending on themobile phase composition, the balance of retentionmechanisms can shift from
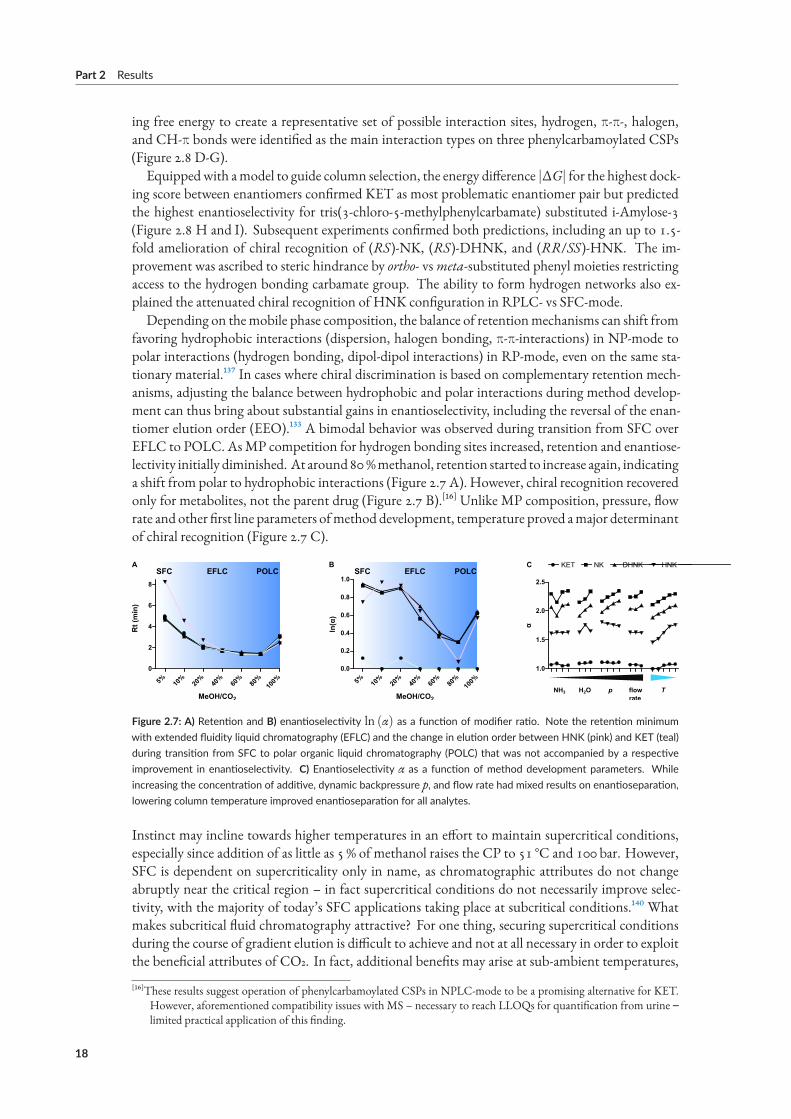
favoring hydrophobic interactions (dispersion, halogen bonding, π-π-interactions) in NP-mode topolar interactions (hydrogen bonding, dipol-dipol interactions) in RP-mode, even on the same sta-tionary material.¹³⁷ In cases where chiral discrimination is based on complementary retention mech-anisms, adjusting the balance between hydrophobic and polar interactions during method develop-ment can thus bring about substantial gains in enantioselectivity, including the reversal of the enan-tiomer elution order (EEO).¹³³ A bimodal behavior was observed during transition from SFC overEFLC to POLC. AsMP competition for hydrogen bonding sites increased, retention and enantiose-lectivity initially diminished. At around80%methanol, retention started to increase again, indicatinga shift from polar to hydrophobic interactions (Figure 2.7 A). However, chiral recognition recoveredonly for metabolites, not the parent drug (Figure 2.7 B).[¹⁶] Unlike MP composition, pressure, flowrate and other first line parameters ofmethod development, temperature proved amajor determinantof chiral recognition (Figure 2.7 C).
A
5% 10%
20%
40%
60%
80%
100%
0
2
4
6
8
Rt
(min
)
SFC EFLC POLC
MeOH/CO2
5% 10%
20%
40%
60%
80%
100%
0.0
0.2
0.4
0.6
0.8
1.0
MeOH/CO2
ln(α
)
SFC EFLC POLCB KET NK DHNK HNK
NH3 H2O p flowrate
T
1.0
1.5
2.0
2.5
α
C
Figure 2.7: A) Retention and B) enantioselectivity ln (α) as a function of modifier ratio. Note the retention minimumwith extended fluidity liquid chromatography (EFLC) and the change in elution order between HNK (pink) and KET (teal)during transition from SFC to polar organic liquid chromatography (POLC) that was not accompanied by a respectiveimprovement in enantioselectivity. C) Enantioselectivity α as a function of method development parameters. Whileincreasing the concentration of additive, dynamic backpressure p, and flow rate had mixed results on enantioseparation,lowering column temperature improved enantioseparation for all analytes.
Instinct may incline towards higher temperatures in an effort to maintain supercritical conditions,especially since addition of as little as 5 % of methanol raises the CP to 51 °C and 100 bar. However,SFC is dependent on supercriticality only in name, as chromatographic attributes do not changeabruptly near the critical region – in fact supercritical conditions do not necessarily improve selec-tivity, with the majority of today’s SFC applications taking place at subcritical conditions.¹⁴⁰ Whatmakes subcritical fluid chromatography attractive? For one thing, securing supercritical conditionsduring the course of gradient elution is difficult to achieve and not at all necessary in order to exploitthe beneficial attributes of CO2. In fact, additional benefits may arise at sub-ambient temperatures,
[¹⁶]These results suggest operation of phenylcarbamoylated CSPs in NPLC-mode to be a promising alternative for KET.However, aforementioned compatibility issues with MS – necessary to reach LLOQs for quantification from urine ‒limited practical application of this finding.
18
2.3 Bioanalysis I ‐ Chiral analysis of ketamine
O
Cl
NH
H3C
B
hydrophobic grove
A
R
R S
S
HB donor
C
O
Cl
NH
H3C
HBacceptor
hydrophobicinteractions
stericeffects
HB donor
halogenbond
CH-�
���-
HB donor
O
Cl
NH
H3C
HBacceptor
HB donor
O
Cl
NH
H3C
CH-�
G
D
O
Cl
NH
H3C
halogenbond
E
O
Cl
NH
H3C
���-
F
IH
CH-�
���
OR
HN O
Cl CH3
HBdonor
HBdonor
HBacceptor
halogenbond
acceptor
OR
HN O
CH3
Cl
O
ORO
OOR
RO
�
coated
OR
HN O
Cl Cl
i-Cellulose-5
�
O
O
ROOR
RO
O
immobilized
KETNK
DHNKHNK
1.0
1.2
1.4
1.6
1.8
α
KETNK
DHNKHNK
DHNKKET
NKHNK
0.0
0.2
0.4
0.6
|ΔΔ
G| (kcal/m
ol)
IPA (�)
MeOH (�)
in silico |��G|
i-Amylose-3Amylose-2 i-Cellulose-5
�O
ORO
OOR
RO
HBdonor steric
effects
immobilized
Amylose-2 i-Amylose-3
Figure 2.8: Chiral recognition of ketamine. A) Three‐point interaction model useful for Pirkle‐type CSPs. While oneenantiomer matches the selector in three sites, its mirror image interacts only with one (shown here) or two sites afterre‐orientation (not shown). In the given example, the (S)‐enantiomer would elute first on the black selector and last onthe gray selector. B) Phenylcarbamoylated polysaccharide‐based CSPs offer a multitude of lipophilic (angular shapes) butalso polar interaction sites (round shapes) to analytes capable of entering hydrophobic groves (e.g., (S)‐KET, blue). Datafrom references¹³¹,¹³⁵,¹³⁸,¹³⁹. C) Possible interaction sites for (S)‐KET. D) Interactions of KET with hydrogen bonding, E)halogen bonding, F) π‐π‐bonding, and G) CH‐π‐bonding sites on phenylcarbamoylated polysaccharide‐based CSPs. H)Polysaccharide‐backbone of CSPs investigated in this study. I) Phenylcarbamoyl‐modifications with interaction sites andcharacteristic properties (blue) shown for i‐Amylose‐3, as well as experimentally determined selectivity α and in silicopredictions of |ΔΔG|.
19
Part 2 Results
and it is worth looking first at the role temperature plays in GC and LC for orientation. Here, in-creasing temperature tends to accelerate separation and benefit efficiency. GC in particular utilizestemperature as the primary variable to adjust retention: Since heat transfers energy to analytes, rais-ing temperature causes solutes to enter the gas phase and spend less time in the SP. Acceleration ofthe chromatographic transfer between SP andMP also increases efficiency via number of theoreticalplates (N). Selectivity is also affected by temperature, as analytes varying in boiling point require dif-ferent amounts of heat to transfer into the gas phase. Finally, heat reduces the density and viscosityof the highly compressible MP, in turn leading to lower backpressures that accomodate higher flowrates and overall shorter run times.¹⁴¹[¹⁷]Similar trends govern high temperature liquid chromatography (HTLC), although here, solvent
gradients tend to dwarf temperature effects: Each 1 °C increment translates to approximately 1 %of acetonitrile added to the MP in RPLC. Again, retention decreases as temperature increases, asequilibria controlled by dH and dS start to shift.¹⁴²[¹⁸]
ln k = −dH◦
RT+
dS◦
R+ ln Φ (2.1)
wheredH◦ = standard molar enthalpy of transferring solute frommobile to stationary phasedS◦ = standard molar entropy of transferring solute frommobile to stationary phaseR = gas constantT = absolute temperatureΦ = phase ratio.
Since dH anddS vary fromanalyte to analyte depending on the retentionmechanismanddissociationequilibria (e.g., acidic andbasic analytes, cf. Figure 2.14A), temperature again controls selectivity. Re-garding efficiency, separation at high temperatures should impairNmax in principle. However,Nmaxis rarely achieved in practice due to prohibitive column lengths and run times (Figure 2.9 A). Instead,most HPLC applications take place under conditions dominated by resistance to mass transfer (theC-termof the vanDeemter equation) that employ higher than optimal flow rates (favoring speed overefficiency). In this segment of the diagram, temperature-dependent increases in diffusivity not onlyreduce viscosity – thereby allowing faster flow rates – but also increase the optimal flow rate, henceincreasing efficiency (Figure 2.9 B).¹⁴³[¹⁹]Given the congruity (and predictability) of temperature response between GC and LC, the same
should be true of SFC, since its MP shares characteristics of both GC and LC.⁴⁵ However, this pre-diction does not always hold true (Figure 2.9 C).
1. Similar to LC (Equation 2.1), the chromatographic system consumes heat by shifting the equi-librium to favor desorption and elution (LC-like response).
2. Especially when the proportion of organic co-solvent is high (i.e., LC-like), an increase in tem-perature is further associatedwith a decrease inMP cohesiveness that increases solubility, againeliciting an LC-like response.¹⁴⁵
3. At lower modifier ratios, however, the opposite effect is observed – sometimes referred to asSFC-like response sensu stricto: Given a constant volumetric flow rate and dynamic backpres-sure regulation, the decrease in density effectively decreases the delivery of MP mass. Hence,high temperatures favor retention (SFC-like response).¹⁴⁷
[¹⁷]Note that in GC, where the MP mainly acts as carrier gas, changes in density mainly affect backpressure and maximalflow rates. In SFC, the MP also serves as interaction partner for solutes and the SP; hence, the effects of density – andthus temperature – are more complex, as will be explained.
[¹⁸]Only in rare cases – namely when entropy dominates adsorption – does retention increase with temperature.³⁸[¹⁹]It is interesting to note a common theme behindHTLC,CE, SFC, and countless other incarnations of chromatography,
all striving for shorter run times, reduction of organic solvent use, and orthogonal selectivity.
20
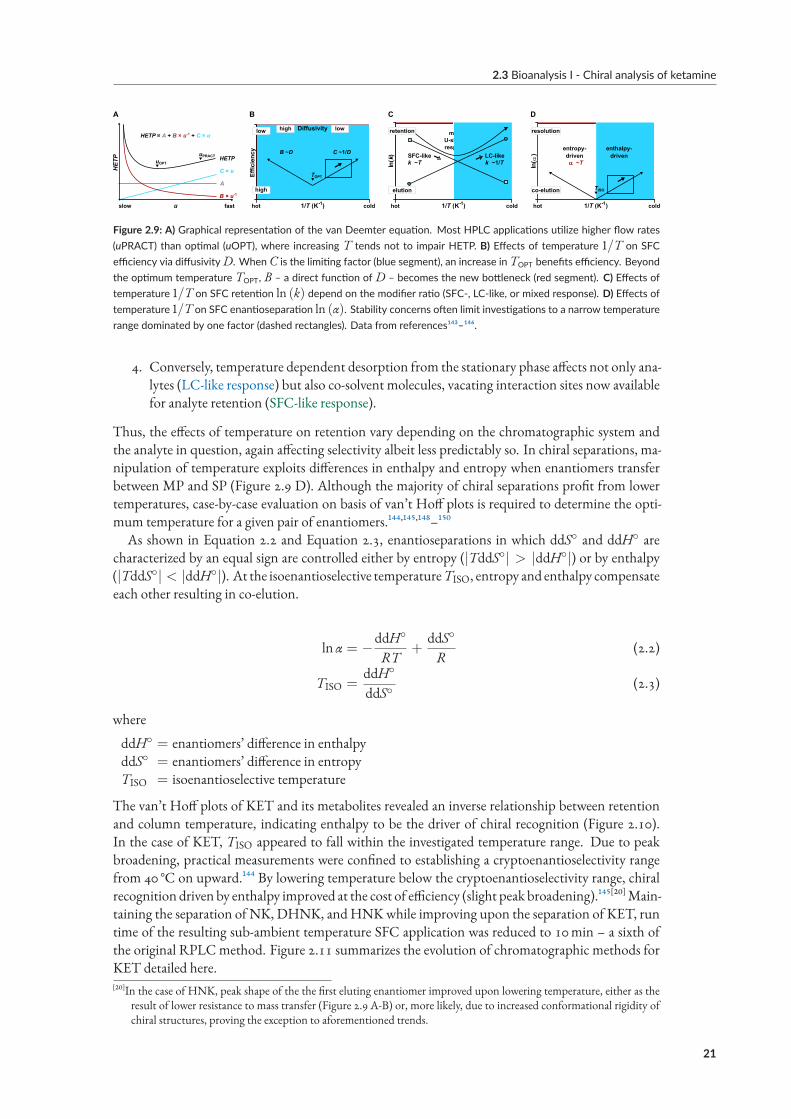
2.3 Bioanalysis I ‐ Chiral analysis of ketamine
A
u
A
C × u
B × u-1
HETPuOPT
uPRACT
fastslow
HE
TP
HETP = A + B × u-1 + C × u
Eff
icie
ncy
hot cold1/T (K-1)
B
TOPT
B ~D C ~1/D
high
low Diffusivityhigh lowmixed
U-shapedresponse
ln(k
) SFC-likek ~T
LC-likek ~1/T
hot cold1/T (K-1)
retention
elution
C
hot cold1/T (K-1)
� ~T � ~1/T
TISO
ln( �
)
entropy-driven
enthalpy-driven
resolution
co-elution
D
Figure 2.9: A) Graphical representation of the van Deemter equation. Most HPLC applications utilize higher flow rates(uPRACT) than optimal (uOPT), where increasing T tends not to impair HETP. B) Effects of temperature 1/T on SFCefficiency via diffusivityD. WhenC is the limiting factor (blue segment), an increase inTOPT benefits efficiency. Beyondthe optimum temperature TOPT, B – a direct function ofD – becomes the new bottleneck (red segment). C) Effects oftemperature 1/T on SFC retention ln (k) depend on the modifier ratio (SFC‐, LC‐like, or mixed response). D) Effects oftemperature 1/T on SFC enantioseparation ln (α). Stability concerns often limit investigations to a narrow temperaturerange dominated by one factor (dashed rectangles). Data from references¹⁴³–¹⁴⁶.
4. Conversely, temperature dependent desorption from the stationary phase affects not only ana-lytes (LC-like response) but also co-solvent molecules, vacating interaction sites now availablefor analyte retention (SFC-like response).
Thus, the effects of temperature on retention vary depending on the chromatographic system andthe analyte in question, again affecting selectivity albeit less predictably so. In chiral separations, ma-nipulation of temperature exploits differences in enthalpy and entropy when enantiomers transferbetween MP and SP (Figure 2.9 D). Although the majority of chiral separations profit from lowertemperatures, case-by-case evaluation on basis of van’t Hoff plots is required to determine the opti-mum temperature for a given pair of enantiomers.¹⁴⁴,¹⁴⁵,¹⁴⁸–¹⁵⁰As shown in Equation 2.2 and Equation 2.3, enantioseparations in which ddS◦ and ddH◦ are
characterized by an equal sign are controlled either by entropy (|TddS◦| > |ddH◦|) or by enthalpy(|TddS◦| < |ddH◦|). At the isoenantioselective temperatureTISO, entropy and enthalpy compensateeach other resulting in co-elution.
ln α = −ddH◦
RT+
ddS◦
R(2.2)
TISO =ddH◦
ddS◦(2.3)
where
ddH◦ = enantiomers’ difference in enthalpyddS◦ = enantiomers’ difference in entropyTISO = isoenantioselective temperature
The van’t Hoff plots of KET and its metabolites revealed an inverse relationship between retentionand column temperature, indicating enthalpy to be the driver of chiral recognition (Figure 2.10).In the case of KET, TISO appeared to fall within the investigated temperature range. Due to peakbroadening, practical measurements were confined to establishing a cryptoenantioselectivity rangefrom 40 °C on upward.¹⁴⁴ By lowering temperature below the cryptoenantioselectivity range, chiralrecognition driven by enthalpy improved at the cost of efficiency (slight peak broadening).¹⁴⁵[²⁰]Main-taining the separation of NK, DHNK, andHNKwhile improving upon the separation of KET, runtime of the resulting sub-ambient temperature SFC application was reduced to 10min – a sixth ofthe original RPLCmethod. Figure 2.11 summarizes the evolution of chromatographic methods forKET detailed here.[²⁰]In the case of HNK, peak shape of the the first eluting enantiomer improved upon lowering temperature, either as the
result of lower resistance to mass transfer (Figure 2.9 A-B) or, more likely, due to increased conformational rigidity ofchiral structures, proving the exception to aforementioned trends.
21
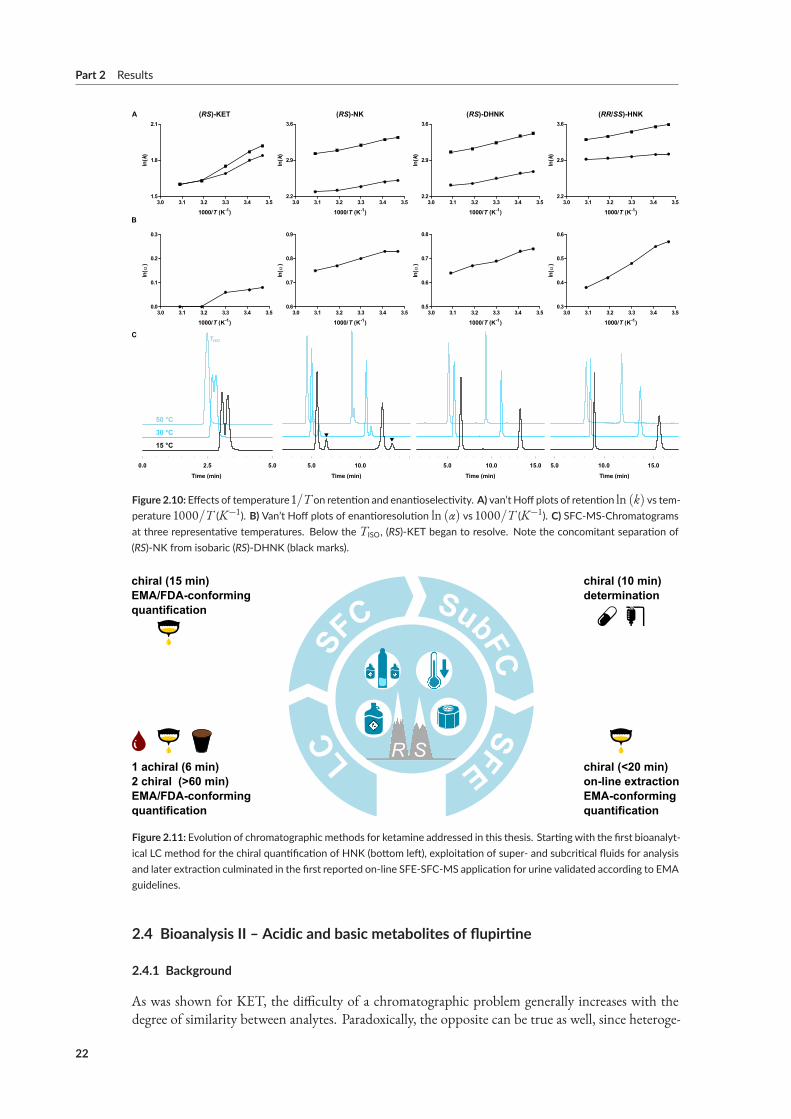
Part 2 Results
Time (min)
0.0 2.5 5.0 5.0 10.0 15.0
Time (min)
10.05.0
Time (min)
5.0 10.0 15.0
Time (min)
C
A
3.0 3.1 3.2 3.3 3.4 3.51.5
1.8
2.1
1000/T (K-1)
ln(k
)
3.0 3.1 3.2 3.3 3.4 3.52.2
2.9
3.6
1000/T (K-1)
ln(k
)
3.0 3.1 3.2 3.3 3.4 3.52.2
2.9
3.6
ln(k
)
3.0 3.1 3.2 3.3 3.4 3.52.2
2.9
3.6
ln(k
)
B
3.0 3.1 3.2 3.3 3.4 3.50.0
0.1
0.2
0.3
1000/T (K-1)
ln( �
)
3.0 3.1 3.2 3.3 3.4 3.50.6
0.7
0.8
0.9
1000/T (K-1)
ln( �
)
3.0 3.1 3.2 3.3 3.4 3.50.5
0.6
0.7
0.8
1000/T (K-1)
ln( �
)
3.0 3.1 3.2 3.3 3.4 3.50.3
0.4
0.5
0.6
1000/T (K-1)
ln( �
)
1000/T (K-1) 1000/T (K-1)
50 °C
30 °C
15 °C
TISO
(RS)-KET (RS)-NK (RS)-DHNK (RR/SS)-HNK
Figure 2.10: Effects of temperature 1/T on retention and enantioselectivity. A) van’t Hoff plots of retention ln (k) vs tem‐perature 1000/T (K−1). B) Van’t Hoff plots of enantioresolution ln (α) vs 1000/T (K−1). C) SFC‐MS‐Chromatogramsat three representative temperatures. Below the TISO, (RS)‐KET began to resolve. Note the concomitant separation of(RS)‐NK from isobaric (RS)‐DHNK (black marks).
R SLCSF
C SubFCS
FE
1 achiral (6 min)2 chiral (>60 min)EMA/FDA-conformingquantification
chiral (15 min)EMA/FDA-conformingquantification
chiral (10 min)determination
chiral (<20 min)on-line extractionEMA-conformingquantification
Figure 2.11: Evolution of chromatographic methods for ketamine addressed in this thesis. Starting with the first bioanalyt‐ical LC method for the chiral quantification of HNK (bottom left), exploitation of super‐ and subcritical fluids for analysisand later extraction culminated in the first reported on‐line SFE‐SFC‐MS application for urine validated according to EMAguidelines.
2.4 Bioanalysis II – Acidic and basic metabolites of flupirtine
2.4.1 Background
As was shown for KET, the difficulty of a chromatographic problem generally increases with thedegree of similarity between analytes. Paradoxically, the opposite can be true as well, since heteroge-
22
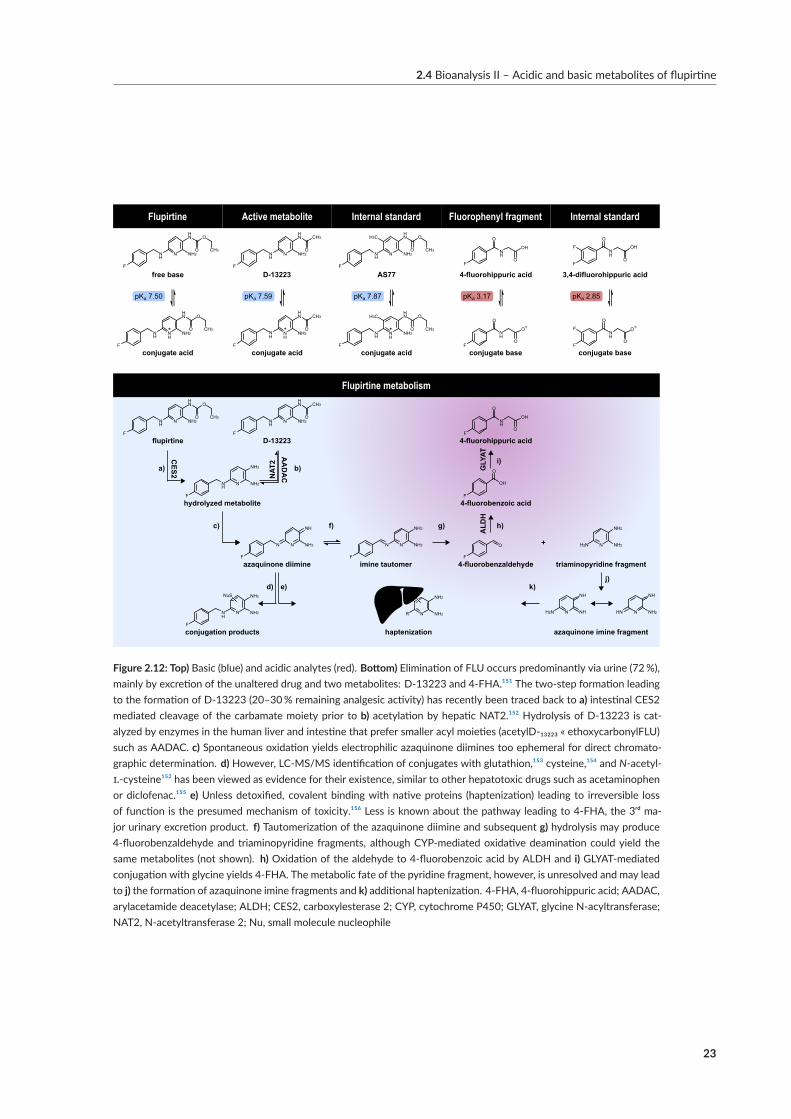
2.4 Bioanalysis II – Acidic and basic metabolites of flupirtine
Fluorophenyl fragment
F
NH
O
O
OH
4-fluorohippuric acid
F
NH
O
O
O
conjugate base
NH
F
N NH2
HN O
O CH3
Flupirtine
NH
F
NH
NH2
HN O
O CH3
conjugate acid
free base
NH
F
NH
NH2
HN CH3
O
NH
F
N NH2
HN CH3
O
conjugate acid
D-13223
Active metabolite Internal standard
3,4-difluorohippuric acid
conjugate base
F
NH
O
O
OHF
F
NH
O
O
OF
conjugate acid
AS77
Internal standard
NH
F
N NH2
HN O
O CH3
H3C
NH
F
NH
NH2
HN O
O CH3
H3C
pKa 3.17pKa 7.50 pKa 2.85pKa 7.59 pKa 7.87
NH
F
N NH2
NH2
NA
T2
AA
DA
C
CE
S2a) b)
hydrolyzed metabolite
c) f) g)
N
F
N NH2
NH2
imine tautomer
4-fluorobenzoic acid
4-fluorobenzaldehyde triaminopyridine fragment
N
F
N NH2
NH
azaquinone diimine
j)
NH
F
N NH2
NH2NuS
conjugation products
OH
F
O
O
F
h)
i)
+
Flupirtine metabolism
GLY
AT
AL
DH
flupirtine D-13223 4-fluorohippuric acidF
NH
O
O
OHNH
F
N NH2
HN O
O CH3NH
F
N NH2
HN CH3
O
azaquinone imine fragment
d) e) k)
haptenization
R N NH2
NH2
N NH2
NH2
H2N
N NH2
NH
HNN NH
NH
H2N
Figure 2.12: Top) Basic (blue) and acidic analytes (red). Bottom) Elimination of FLU occurs predominantly via urine (72%),mainly by excretion of the unaltered drug and two metabolites: D‐13223 and 4‐FHA.¹⁵¹ The two‐step formation leadingto the formation of D‐13223 (20–30% remaining analgesic activity) has recently been traced back to a) intestinal CES2mediated cleavage of the carbamate moiety prior to b) acetylation by hepatic NAT2.¹⁵² Hydrolysis of D‐13223 is cat‐alyzed by enzymes in the human liver and intestine that prefer smaller acyl moieties (acetylD‐₁₃₂₂₃ « ethoxycarbonylFLU)such as AADAC. c) Spontaneous oxidation yields electrophilic azaquinone diimines too ephemeral for direct chromato‐graphic determination. d) However, LC‐MS/MS identification of conjugates with glutathion,¹⁵³ cysteine,¹⁵⁴ and N‐acetyl‐l‐cysteine¹⁵² has been viewed as evidence for their existence, similar to other hepatotoxic drugs such as acetaminophenor diclofenac.¹⁵⁵ e) Unless detoxified, covalent binding with native proteins (haptenization) leading to irreversible lossof function is the presumed mechanism of toxicity.¹⁵⁶ Less is known about the pathway leading to 4‐FHA, the 3rd ma‐jor urinary excretion product. f) Tautomerization of the azaquinone diimine and subsequent g) hydrolysis may produce4‐fluorobenzaldehyde and triaminopyridine fragments, although CYP‐mediated oxidative deamination could yield thesame metabolites (not shown). h) Oxidation of the aldehyde to 4‐fluorobenzoic acid by ALDH and i) GLYAT‐mediatedconjugation with glycine yields 4‐FHA. The metabolic fate of the pyridine fragment, however, is unresolved and may leadto j) the formation of azaquinone imine fragments and k) additional haptenization. 4‐FHA, 4‐fluorohippuric acid; AADAC,arylacetamide deacetylase; ALDH; CES2, carboxylesterase 2; CYP, cytochrome P450; GLYAT, glycine N‐acyltransferase;NAT2, N‐acetyltransferase 2; Nu, small molecule nucleophile
23
Part 2 Results
neous analytes may call for mutually exclusive modes of elution to achieve run times and peak shapessuitable for quantification. By virtue of unlimited CO2/modifier miscibility and favorable equili-bration times, SFC can simultaneously address mixtures of highly polar (−7 ≤ logP < 2)¹⁵⁷ ornon-polar analytes (−2 ≤ logP < 10).¹⁵⁸ The need for an economic tool capable of targeting acidicand basic metabolites of the recently withdrawn analgesic flupirtine (FLU)[²¹] shown in Figure 2.12provided an opportunity to utilize SFC’s versatility in a metabolism study aimed at stratifying riskpopulations for FLU induced liver injury (FILI).[²²]
2.4.2 Aim
Previous bioanalytical methods for the determination of FLU utilizing RPLC-MS/MS¹⁶¹,¹⁶⁶–¹⁶⁸ orfluorescence detection¹⁶⁹ have been reported for metabolites retaining the central pyridine ring, i.e.,D-13223 and amphoteric conjugates with mercapturic acid,¹⁵⁴ but rarely included 4-fluorohippuricacid (4-FHA).¹⁵¹[²³] In a loosely related study on fluorapacin, an RPLC-UV determination of 4-FHAand 4-fluorobenzoic acidwithin 52min excluded the parent drug.¹⁷⁰Recently, Beirow et al. presenteda faster RPLC-UV method targeting FLU and 4-FHA (among other analytes) within as little as30min.¹⁷¹We hypothesized that the benefits of SFC for the simultaneous analysis of polar/non-polarcompounds would translate to the analysis of acidic/basic analytes, speeding up quantification evenfurther. Unlike UV/Vis or fluorescence detection, electrospray ionization and single quadrupoleMSin positive and negative allows for mass spectrometric resolution of co-eluting analytes without theneed for hard ion sources (e.g., APCI) or elaborate MS detectors (e.g., TOFMS, MS/MS). The aimof this study was to optimize an SFC-MS method towards similar, short retention times for high-throughput and robust quantification compliant with EMA guidelines for bioanalytical method val-idation.¹⁷²
2.4.3 Results of paper X
Whereas previous MS studies relied on non-analogous diphenhydramine¹⁵⁴,¹⁶¹,¹⁶⁷ or stable isotope-labeled (SIL) internal standards (IS),¹⁶⁶ this study utilized custom-made ISs obtained via in-housesynthesis. Starting from 2-chloro-5-methyl-3-nitropyridine, AS77 (methylated FLU) was used as ISfor basic analytes. Similarly, amide formation of 3,4-difluorobenzoic acid with glycine provided theIS for 4-FHA, namely 3,4-difluorohippuric acid (3,4-FHA).The column screening revealed trends in elution order andpeak shape (Figure 2.13A-C).Most SPs
retained acidic analytes more strongly than basic analytes, markedly so on the aminopropyl-modifiedLunaNH2 (a weak anion exchanger). Within the sub-set of basic analytes, the elution order was con-stant (AS77 < FLU < D-13223). Acidic analytes suffered from significant tailing on RP materials,while the dihydroxypropane SP caused tailing of basic analytes. The amylose-based SP provided fa-vorable retention[²⁴] (k > 2; t < 10min) within predefined limits regarding modifier consumption
[²¹]Flupirtine (ethyl N -{2-amino-6-[(4-fluorophenyl)methylamino]pyridin-3-yl}carbamate) is an opener of voltage-gated,potassium selective ion channels (KV7.2/3). The resulting neuronal efflux of potassium ions counteracts sodium ioninflux, thus lowering neuronal excitability.¹⁵⁹ Hence, FLU has shown positive effects in models for convulsive and psy-chological disorders, tinnitus, overactive bladder, and amyotrophic lateral sclerosis.¹⁶⁰ Its approveduse has been that of apainmedication, similar in terms of effectiveness to non-steroidal anti-inflammatory drugs (NSAIDs) or weak opioids,but not associated with gastrointestinal bleeding (a major side effect of NSAIDs), nor with obstipation, respiratorydepression or psychological dependency (cf. opioids).¹⁶¹
[²²]FILI is rare (<1 in 10,000 patients) but severe: As many as 15 % of reported cases entailed organ failure, 5 % of whichfatal or requiring liver transplantation.¹⁶² Unpredictability of FILI independent of dose and after a variable latencyperiod¹⁶³ has ultimately prompted the withdrawal after more than 30 years of use.¹⁶⁴ A thorough understanding ofbiotoxification may aid patient stratification and the development of non-toxic KV7 modulators.¹⁶⁵
[²³]Indeed, the available peer-reviewed data concerning the formation rate of 4-FHA from FLU in humans stems from asingle study involving comprehensive albeit elaborate radioactive labelling.¹⁵¹
[²⁴]Minimal and maximal values were set as to allow high throughput but also avoid matrix effects: SFC of urinary samplestends to suffer from ion suppression more frequently than signal enhancement.¹⁷³ However, this observation is notapplicable in equal measure across the whole of the chromatogram, as susceptibility to matrix effects is lowest for early
24
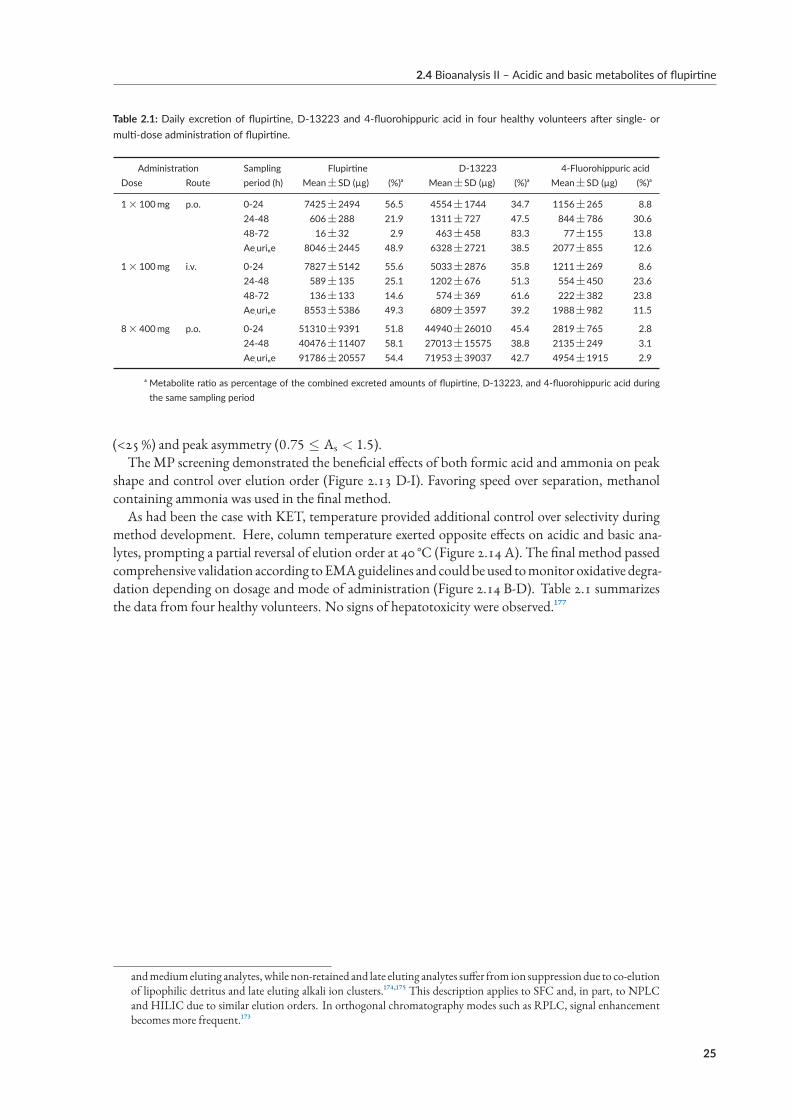
2.4 Bioanalysis II – Acidic and basic metabolites of flupirtine
Table 2.1: Daily excretion of flupirtine, D‐13223 and 4‐fluorohippuric acid in four healthy volunteers after single‐ ormulti‐dose administration of flupirtine.
Administration Sampling Flupirtine D‐13223 4‐Fluorohippuric acidDose Route period (h) Mean±SD (µg) (%)a Mean±SD (µg) (%)a Mean±SD (µg) (%)a
1×100mg p.o. 0‐24 7425±2494 56.5 4554±1744 34.7 1156±265 8.824‐48 606±288 21.9 1311±727 47.5 844±786 30.648‐72 16±32 2.9 463±458 83.3 77±155 13.8Ae,urie 8046±2445 48.9 6328±2721 38.5 2077±855 12.6
1×100mg i.v. 0‐24 7827±5142 55.6 5033±2876 35.8 1211±269 8.624‐48 589±135 25.1 1202±676 51.3 554±450 23.648‐72 136±133 14.6 574±369 61.6 222±382 23.8Ae,urie 8553±5386 49.3 6809±3597 39.2 1988±982 11.5
8×400mg p.o. 0‐24 51310±9391 51.8 44940±26010 45.4 2819±765 2.824‐48 40476±11407 58.1 27013±15575 38.8 2135±249 3.1Ae,urie 91786±20557 54.4 71953±39037 42.7 4954±1915 2.9
a Metabolite ratio as percentage of the combined excreted amounts of flupirtine, D‐13223, and 4‐fluorohippuric acid duringthe same sampling period
(<25%) and peak asymmetry (0.75 ≤ As < 1.5).The MP screening demonstrated the beneficial effects of both formic acid and ammonia on peak
shape and control over elution order (Figure 2.13 D-I). Favoring speed over separation, methanolcontaining ammonia was used in the final method.As had been the case with KET, temperature provided additional control over selectivity during
method development. Here, column temperature exerted opposite effects on acidic and basic ana-lytes, prompting a partial reversal of elution order at 40 °C (Figure 2.14 A). The final method passedcomprehensive validation according toEMAguidelines and couldbeused tomonitor oxidative degra-dation depending on dosage and mode of administration (Figure 2.14 B-D). Table 2.1 summarizesthe data from four healthy volunteers. No signs of hepatotoxicity were observed.¹⁷⁷
andmediumeluting analytes, while non-retained and late eluting analytes suffer from ion suppressiondue to co-elutionof lipophilic detritus and late eluting alkali ion clusters.¹⁷⁴,¹⁷⁵ This description applies to SFC and, in part, to NPLCand HILIC due to similar elution orders. In orthogonal chromatography modes such as RPLC, signal enhancementbecomes more frequent.¹⁷³
25
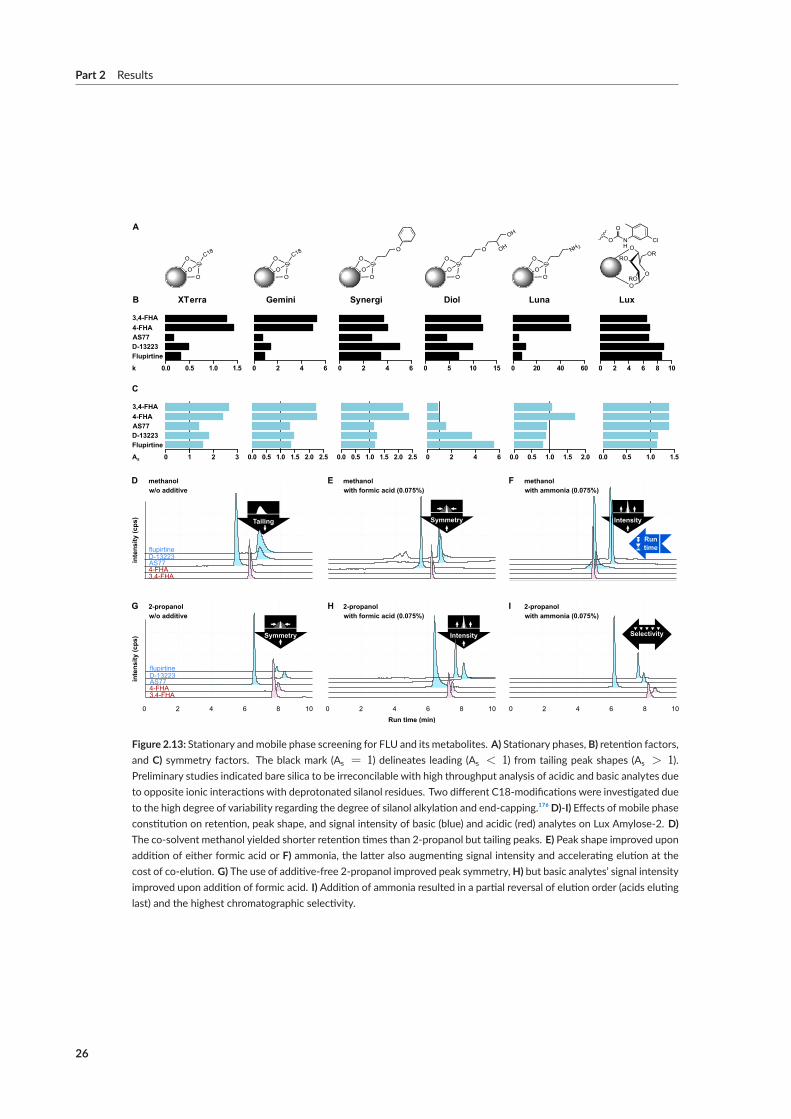
Part 2 Results
k
Synergi
0 2 4 6
Gemini
0 2 4 6
Diol
0 5 10 15
Luna
0 20 40 60
Lux
0 2 4 6 8 10
XTerra
0.0 0.5 1.0 1.5
Flupirtine
D-13223AS774-FHA
3,4-FHA
B
A
O
O
RO
ORO
OR
O NH
O
Cl
O
OO
SiC18
O
OO
Si
O
OH
OH
O
OO
Si
NH2
O
OO
Si
O
O
OO
SiC18
As 0 1 2 3 0.0 0.5 1.0 1.5 2.0 2.5 0.0 0.5 1.0 1.5 2.0 2.5 0 2 4 6
C
0.0 0.5 1.0 1.5 2.0 0.0 0.5 1.0 1.5
Flupirtine
D-13223AS774-FHA
3,4-FHA
D E
Tailing
flupirtineD-13223AS774-FHA3,4-FHA
inte
nsi
ty (
cps)
0 2 4 6 8 10
Symmetry
flupirtineD-13223AS774-FHA3,4-FHA
inte
nsi
ty (
cps)
Symmetry
100 2 4 6 8
Intensity
Intensity
Runtime
methanolw/o additive with formic acid (0.075%)
methanolwith ammonia (0.075%)methanol
100 2 4 6 8
Selectivity
2-propanolw/o additive with formic acid (0.075%)
2-propanolwith ammonia (0.075%)2-propanol
Run time (min)
F
G H I
Figure 2.13: Stationary andmobile phase screening for FLU and its metabolites. A) Stationary phases, B) retention factors,and C) symmetry factors. The black mark (As = 1) delineates leading (As < 1) from tailing peak shapes (As > 1).Preliminary studies indicated bare silica to be irreconcilable with high throughput analysis of acidic and basic analytes dueto opposite ionic interactions with deprotonated silanol residues. Two different C18‐modifications were investigated dueto the high degree of variability regarding the degree of silanol alkylation and end‐capping.¹⁷⁶D)‐I) Effects of mobile phaseconstitution on retention, peak shape, and signal intensity of basic (blue) and acidic (red) analytes on Lux Amylose‐2. D)The co‐solvent methanol yielded shorter retention times than 2‐propanol but tailing peaks. E) Peak shape improved uponaddition of either formic acid or F) ammonia, the latter also augmenting signal intensity and accelerating elution at thecost of co‐elution. G) The use of additive‐free 2‐propanol improved peak symmetry,H) but basic analytes’ signal intensityimproved upon addition of formic acid. I) Addition of ammonia resulted in a partial reversal of elution order (acids elutinglast) and the highest chromatographic selectivity.
26
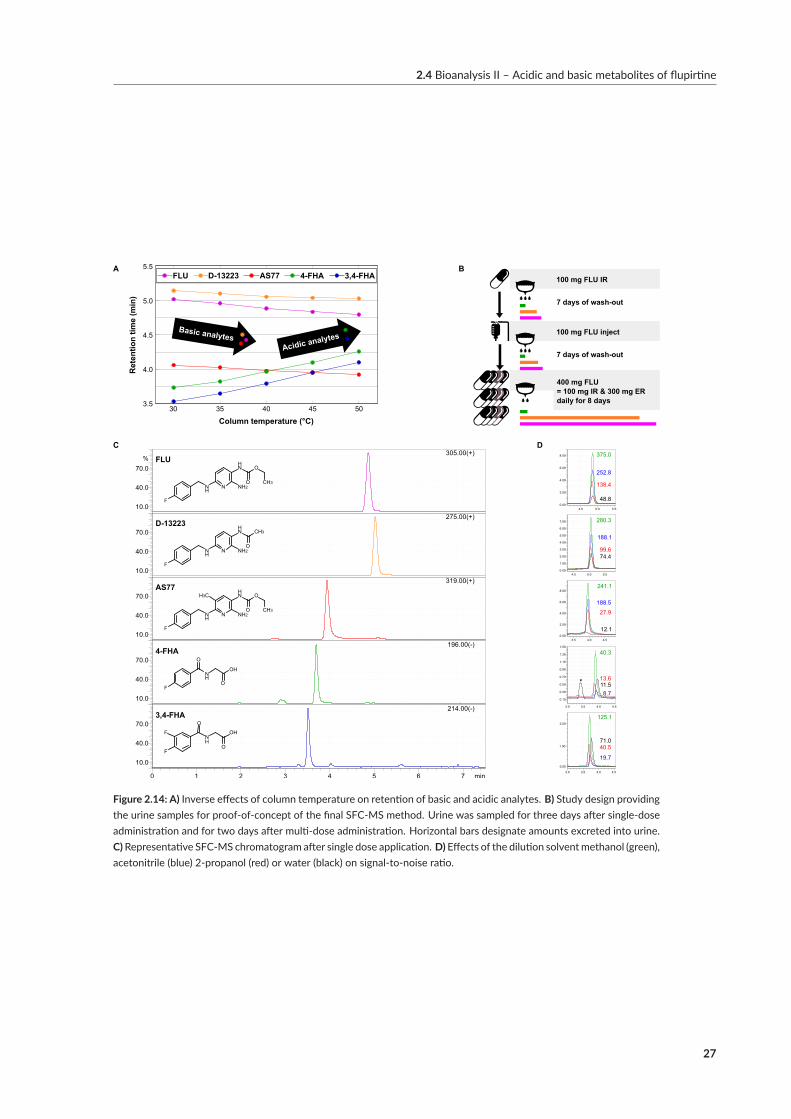
2.4 Bioanalysis II – Acidic and basic metabolites of flupirtine
A
Column temperature (°C)
FLU D-13223 AS77 4-FHA 3,4-FHA
Ret
enti
on
tim
e (m
in)
30 35 40 45 503.5
4.5
5.0
4.0
5.5
Basic analytesAcidic analytes
400 mg FLU= 100 mg IR & 300 mg ERdaily for 8 days
100 mg FLU IR
100 mg FLU inject
7 days of wash-out
7 days of wash-out
B
C
4.5 5.0 5.50.00
1.00
2.00
3.00
4.00
5.00
6.00
7.00
99.674.4
280.3
188.1
241.1
188.5
0.00
2.00
4.00
6.00
8.00
3.5 4.0 4.5
27.9
12.1
0.00
2.00
4.00
6.00
8.00
4.5 5.0 5.5
138.4
48.8
375.0
252.8
125.1
19.7
40.571.0
2.00
3.0 3.5 4.0
0.00
1.00
4.5
3.0 3.5 4.0 4.5
40.3
8.70.10
0.30
0.50
0.70
0.90
1.10
1.30
1.50
13.611.5
D
FLU
D-13223
AS77
4-FHA
3,4-FHA
%
F
NH
O
O
OH
NH
F
N NH2
HN O
O CH3
NH
F
N NH2
HN CH3
O
F
NH
O
O
OHF
NH
F
N NH2
HN O
O CH3
H3C
Figure 2.14: A) Inverse effects of column temperature on retention of basic and acidic analytes. B) Study design providingthe urine samples for proof‐of‐concept of the final SFC‐MS method. Urine was sampled for three days after single‐doseadministration and for two days after multi‐dose administration. Horizontal bars designate amounts excreted into urine.C)Representative SFC‐MS chromatogram after single dose application. D) Effects of the dilution solventmethanol (green),acetonitrile (blue) 2‐propanol (red) or water (black) on signal‐to‐noise ratio.
27

This page has been intentionally left blank.
Part 3Conclusion and outlook
Themainobjective of this projectwas todemonstrate the viability of SFC-MSwithinmedicinal chem-istry and bioanalysis. This goal was achieved: The development of chiral and achiral methods for thedetermination of synthetic and endogenous compounds confirmed the usefulness of SFC as a com-plementary separation technique to conventional HPLC, and ESI-MS as an economic alternativeto triple quadrupole MS/MS detection. During the evolution of an enantioselective quantificationmethod for antidepressantKETmetabolites, exploitation of SFs reduced analysis timesmore than six-fold. Benefitswere not restricted to chiral bioanalysis but also enabled fast and versatile quantificationof achiral FLU metabolites, including acidic fragments not addressed by previously reported meth-ods. The development of stability and purity assays for alkylated polysulfides and (E/Z)-aza-stilbenescorroborated the advantages of combining orthogonal analysis techniques when confronted with re-active and hydrolysis-prone compounds.The plethora of interconnected parameters available to SFCduringmethod development provides
not necessarily unique but certainly intricate dials for accomplishing or complicating a given separa-tion, as was expanded upon here for the parameter temperature. Post optimization, comprehensivevalidation demonstrated SFC’s ability to comply with bioanalytical performance requirements ac-cording to international guidelines. This included the first report of EMA-conforming SFE-SFC-MS from human urine, a labor-saving on-line technique utilizing SFC’s upstream synergy with CO2-based sample extraction.Infatuation with SFC is not a novel phenomenon. Whether users will judge themRubeGoldberg
contraptions or harbingers of the golden-green age of chromatography remains to be seen, but sci-ence fiction is no longer a viable genre for SFC reports to be classified as: After decades of strugglingwith hardware limitations and false expectations, SFC has carved a niche for itself as a technique com-plementary to HPLC, successful especially at chiral and semi-preparative tasks. Given the increasingsignificance of SFC in industry and slowbut growing incorporation into academia, establishing an ar-ray of applications for users outside this dominion to choose from and to guidemethod developmentwill remain a priority within the SFC-practicing community of medicinal chemists.
29

This page has been intentionally left blank.
Literature references
[1] D. S. Sholl and R. P. Lively. “Seven chemical separations to change the world”. In:Nature 532.7600(Apr. 2016), pp. 435–437.
[2] Verband der chemischen Industrie e.V. (VCI). “Consumption, rawmaterial base, prices, costs, climateprotection”. In: Energy statistics for the chemical industry (July 2019).
[3] M. B. Hicks et al. “Making the move towards modernized greener separations: introduction of theanalyticalmethod greenness score (AMGS) calculator”. In:GreenChem. 21.7 (2019), pp. 1816–1826.
[4] G. Purcaro. “Introduction to analytical gas chromatography”. In:Anal. Bioanal. Chem. 410.26 (June2018), pp. 6689–6690.
[5] A. T. James and A. J. P. Martin. “Gas-liquid partition chromatography: the separation and micro-estimationof volatile fatty acids fromformic acid tododecanoic acid”. In:Biochem. J.50.5 (Mar. 1952),pp. 679–690.
[6] I. G. Kolomnikov et al. “Early stages in the history of gas chromatography”. In: J. Chromatogr. A 1537(Feb. 2018), pp. 109–117.
[7] T. A. Berger. “A history of supercritical fluid chromatography (SFC)”. In: Supercritical Fluid Chro-matography. Ed. by G. Rossé. De Gruyter, Dec. 2018, pp. 1–22.
[8] P. R. Brown. “High-performance liquid chromatography. Past developments, present status, and fu-ture trends”. In: Anal. Chem. 62.19 (Oct. 1990), 995A–1008A.
[9] C.G.Horvath, B. A. Preiss, and S. R. Lipsky. “Fast liquid chromatography. Investigation of operatingparameters and the separation of nucleotides on pellicular ion exchangers”. In: Anal. Chem. 39.12(Oct. 1967), pp. 1422–1428.
[10] L. R. Snyder. “HPLC: past and present”. In: Anal. Chem. 72.11 (June 2000), 412 A–420 A.[11] D.Bolmatov et al. “TheFrenkel line: a direct experimental evidence for thenew thermodynamicbound-
ary”. In: Sci. Rep. 5 (2015), pp. 1–10.[12] T. Bryk et al. “Behavior of supercritical fluids across the Frenkel line”. In: J. Phys. Chem. Lett. 8.20
(Oct. 2017), pp. 4995–5001.[13] M. Raju et al. “Widom lines in binary mixtures of supercritical fluids”. In: Sci. Rep. 7.1 (Dec. 2017),
p. 3027.[14] D. E. Raynie. “Warning concerning the use of nitrous oxide in supercritical fluid extractions”. In:
Anal. Chem. 65.21 (Nov. 1993), pp. 3127–3128.[15] G. Guiochon and A. Tarafder. “Fundamental challenges and opportunities for preparative supercriti-
cal fluid chromatography”. In: J. Chromatogr. A 1218.8 (2011), pp. 1037–1114.[16] A. Tarafder. “Metamorphosis of supercritical fluid chromatography to SFC: an overview”. In: TrAC
Trends in Anal. Chem. 81 (July 2016), pp. 3–10.[17] D. Guillarme and J.-L. Veuthey. “Theory and practice of UHPLC and UHPLC-MS”. In:Handbook
of advanced chromatography/mass spectrometry techniques. Ed. by M. Holcapek and W. C. Byrdwell.Academic Press, Sept. 2017, pp. 1–38.
[18] S. Takishima andH.Masuoka. “Physical properties of substances related to chemical engineering”. In:Kagakukogaku bussei josu 11.31 (1989).
[19] V. Desfontaine et al. “Supercritical fluid chromatography in pharmaceutical analysis”. In: J. Pharm.Biomed. Anal. 113 (Sept. 2015), pp. 56–71.
[20] M. Saito. “History of supercritical fluid chromatography: instrumental development”. In: J. Biosci.Bioeng. 115.6 (June 2013), pp. 590–599.
31
Part 3 Literature references
[21] “Equations of state and formulations for mixtures”. In: Supercritical fluid science and technology. Ed.by R. Smith, H. Inomata, and C. Peters. Elsevier, Dec. 2013, pp. 333–480.
[22] M. Ashraf-Khorassani and M. Combs. “Method Development in Supercritical Fluid Chromatogra-phy”. In: Supercritical Fluid Chromatography. Ed. by C. F. Poole. Elsevier, July 2017, pp. 127–152.
[23] J. W. King. “Introduction”. In: Analytical supercritical chromatography and extraction. Ed. by M. L.Lee and K. E. Markides. Chromatography Conferences, June 1990, pp. 1–40.
[24] D. Tong, K. D. Bartle, and A. A. Clifford. “Principles and applications of unified chromatography”.In: J. Chromatogr. A 703.1-2 (June 1995), pp. 17–35.
[25] G. L. Losacco, J.-L. Veuthey, and D. Guillarme. “Supercritical fluid chromatography-mass spectrom-etry: recent evolution and current trends”. In: TrAC Trends Anal. Chem. 118 (Sept. 2019), pp. 731–738.
[26] L. Nováková et al. “Supercritical fluid chromatography in bioanalysis”. In: Supercritical Fluid Chro-matography. Ed. by G. Rosse. De Gruyter, Dec. 2018, pp. 33–76.
[27] M. Zoccali, P. Donato, and L. Mondello. “Recent advances in the coupling of carbon dioxide-basedextraction and separation techniques”. In: TrAC Trends Anal. Chem. 116 (July 2019), pp. 158–165.
[28] C. Cagniard de la Tour. “Effect obtained by simultaneous application of heat and pressure on certainliquids”. In: Ann. Chim. Phys. 21 (1882), pp. 127–132.
[29] T. Andrews. “The bakerian lecture. On the continuity of the gaseous and liquid states of matter”. In:Philos. Trans. R. Soc. London 159 (Jan. 1869), pp. 575–590.
[30] J. B.Hannay and J.Hogarth. “On the solubility of solids in gases”. In:Proc. R. Soc. London 30.200-205(Jan. 1880), pp. 178–188.
[31] E. Klesper, A.H. Corwin, andD. A. Turner. “Communications to the editor”. In: J. Org. Chem. 27.2(Feb. 1962), pp. 700–706.
[32] E. V. Piel. “Accelerated microparticulate bed liquid chromatography”. In: Anal. Chem. 38.4 (Apr.1966), pp. 670–672.
[33] C. West. “Current trends in supercritical fluid chromatography”. In: Anal. Bioanal. Chem. 410.25(Oct. 2018), pp. 6441–6457.
[34] L. C. Harps, J. F. Joseph, and M. K. Parr. “SFC for chiral separations in bioanalysis”. In: J. Pharm.Biomed. Anal. 162 (Jan. 2019), pp. 47–59.
[35] S. Lowes et al. “Tiered approaches to chromatographic bioanalytical method performance evaluation:recommendation for best practices and harmonization from the global bioanalysis consortiumharmo-nization team”. In: AAPS J. 17.1 (Jan. 2015), pp. 17–23.
[36] R. Mukhopadhyay. “SFC: embraced by industry but spurned by academia”. In: Anal. Chem. 80.9(May 2008), pp. 3091–3094.
[37] L. T. Taylor. “Supercritical fluid chromatography for the 21st century”. In: J. Supercrit. Fluids 47.3(Jan. 2009), pp. 566–573.
[38] B. Chankvetadze. “General method development, optimization and most recent developments”. In:6th Symposium on chiral chromatography. Aschaffenburg, Germany, Oct. 2019.
[39] Institut fürmedizinischeundpharmazeutischePrüfungsfragen. “Examinationquestionaire, item79”.In:Grundlagender pharmazeutischenAnalytik; ErsterAbschnitt der pharmazeutischenPrüfung. 2018.
[40] R. K. Hofstetter et al. “Supercritical fluid chromatography”. In: ChemTexts 5.3 (Sept. 2019), pp. 13–25.
[41] Y. Shen, B. Chen, and T. A. Van Beek. “Alternative solvents can make preparative liquid chromatog-raphy greener”. In:Green Chem. 17.7 (June 2015), pp. 4073–4081.
[42] J. M. Herniman and G. J. Langley. “Open Access UHPSFC/MS - an additional analytical resourcefor an academic mass spectrometry facility”. In:Rapid Commun.Mass Spectrom. 30.15 (Aug. 2016),pp. 1811–1817.
[43] E. Lesellier and C. West. “The many faces of packed column supercritical fluid chromatography ‒acritical review”. In: J. Chromatogr. A 1382 (Feb. 2015), pp. 2–46.
32
[44] H. Kočová Vlčková et al. “Current state of bioanalytical chromatography in clinical analysis”. In:An-alyst 143.6 (Feb. 2018), pp. 1305–1325.
[45] A. Tarafder, S. M. Collier, and J. F. Hill. “Addressing robust operation and reproducibility in SFC”.In: Supercritical Fluid Chromatography. Ed. by G. Rossé. De Gruyter, Dec. 2018, pp. 73–94.
[46] C. W. Grathwol et al. “Azologization and repurposing of a hetero-stilbene-based kinase inhibitor: to-wards the design of photoswitchable sirtuin inhibitors”. In: Beilstein J. Org. Chem. 15 (Sept. 2019),pp. 2170–2183.
[47] R. Hofstetter et al. “Crystal structure of 7,8,15,16,17-pentathiadispiro[5.2.5⁹.3⁶]heptadecane”. In:Acta Crystallogr. Sect. E Crystallogr. Commun. 75.6 (June 2019), pp. 888–891.
[48] K. Sugiyama et al. “New double-stage separation analysis method ‒directly coupled laboratory-scalesupercritical fluid extraction-supercritical fluid chromatography, monitored with a multiwavelengthultraviolet detector”. In: J. Chromatogr. A 332 (Sept. 1985), pp. 107–116.
[49] A. J. Ferrari et al. “Global variation in the prevalence and incidence of major depressive disorder: asystematic review of the epidemiological literature”. In:Psychol.Med. 43.3 (Mar. 2013), pp. 471–481.
[50] T. Vos et al. “Global, regional, and national incidence, prevalence, and years lived with disability for328 diseases and injuries for 195 countries, 1990–2016: a systematic analysis for the Global Burden ofDisease Study 2016”. In: Lancet 390.10100 (Sept. 2017), pp. 1211–1259.
[51] “Depression and other common mental disorders: global health estimates”. In:World Health Orga-nizationWHO/MSD/MER/2017.2 (2017), pp. 1–22.
[52] T. M. Hillhouse and J. H. Porter. “A brief history of the development of antidepressant drugs: Frommonoamines to glutamate.” In: Exp. Clin. Psychopharmacol. 23.1 (Feb. 2015), pp. 1–21.
[53] R. Machado-Vieira et al. “Rapid onset of antidepressant action: a new paradigm in the research andtreatment of major depressive disorder.” In: J. Clin. Psychiatry 69.6 (June 2008), pp. 946–58.
[54] J. Ormel, R. C. Kessler, and R. Schoevers. “Depression: more treatment but no drop in prevalence:howeffective is treatment?Andcanwedobetter?” In:Curr.Opin.Psychiatry32.4 (July 2019), pp. 348–354.
[55] D. Kolar. “Current status of electroconvulsive therapy formood disorders: a clinical review”. In:Evid.BasedMent. Heal. 20.1 (Feb. 2017), pp. 12–14.
[56] P.Y.Collins et al. “Grandchallenges in globalmental health”. In:Nature475.7354 (July 2011), pp. 27–30.
[57] U.S. Food and Drug Administration press announcements. “Ketamine nasal spray medication fortreatment-resistant depression”. In: FDA news release (03/05/2019. 2019.
[58] K. Hashimoto. “Rapid-acting antidepressant ketamine, its metabolites and other candidates: a histor-ical overview and future perspective”. In: Psychiatry Clin. Neurosci. (July 2019), pcn.12902.
[59] S. Sheikh and P. Hendry. “The expanding role of ketamine in the emergency department”. In:Drugs78.7 (Apr. 2018), pp. 727–735.
[60] G. Sanacora et al. “A consensus statement on the use of ketamine in the treatment ofmood disorders”.In: JAMA Psychiatry 74.4 (Apr. 2017), p. 399.
[61] R. N.Moda-Sava et al. “Sustained rescue of prefrontal circuit dysfunction by antidepressant-inducedspine formation”. In: Science 364.6436 (Apr. 2019).
[62] T. H. Pham and A. M. Gardier. “Fast-acting antidepressant activity of ketamine: highlights on brainserotonin, glutamate, andGABAneurotransmission in preclinical studies”. In: Pharmacol. Ther. 199(July 2019), pp. 58–90.
[63] K. Suzuki et al. “Effects of a ketaminemetabolite on synapticNMDARfunction”. In:Nature546.7659(June 2017), E1–E3.
[64] K. Zhang et al. “Lack of deuterium isotope effects in the antidepressant effects of (R)-ketamine in achronic social defeat stress model”. In: Psychopharmacology 235.11 (Nov. 2018), pp. 3177–3185.
[65] P. Zanos et al. “Ketamine and ketamine metabolite pharmacology: insights into therapeutic mecha-nisms”. In: Pharmacol. Rev. 70.3 (July 2018). Ed. by J. M.Witkin, pp. 621–660.
33
Part 3 Literature references
[66] H. Ihmsen. “Stereoselective pharmacokinetics of ketamine: R(-)-ketamine inhibits the elimination ofS(+)-ketamine”. In: Clin. Pharmacol. Ther. 70.5 (Nov. 2001), pp. 431–438.
[67] G. Geisslinger et al. “Pharmacokinetics and pharmacodynamics of ketamine enantiomers in surgicalpatients using a stereoselective analytical method”. In: Br. J. Anaesth. 70.6 (June 1993), pp. 666–671.
[68] S. R. Edwards and L. E. Mather. “Tissue uptake of ketamine and norketamine enantiomers in therat: indirect evidence for extrahepatic metabolic inversion”. In: Life Sci. 69.17 (Sept. 2001), pp. 2051–2066.
[69] V.Wsol, L. Skalova, and B. Szotakova. “Chiral inversion of drugs: coincidence or principle?” In:Curr.DrugMetab. 5.6 (Dec. 2004), pp. 517–533.
[70] E. W. Lumsden et al. “Antidepressant-relevant concentrations of the ketamine metabolite (2R,6R)-hydroxynorketamine do not block NMDA receptor function”. In: Proc. Natl. Acad. Sci. U. S. A.116.11 (Mar. 2019), pp. 5160–5169.
[71] K. Fukumoto et al. “Activity-dependent brain-derived neurotrophic factor signaling is required forthe antidepressant actions of (2R,6R)-hydroxynorketamine”. In: Proc. Natl. Acad. Sci. U. S. A. 116.1(Jan. 2019), pp. 297–302.
[72] C. Yang et al. “AMPA receptor activation-independent antidepressant actions of ketaminemetabolite(S)-norketamine”. In: Biol. Psychiatry 84.8 (Oct. 2018), pp. 591–600.
[73] P. Zanos et al. “(2R,6R)-hydroxynorketamine exerts mGlu 2 receptor-dependent antidepressant ac-tions”. In: Proc. Natl. Acad. Sci. U. S. A. 116.13 (Mar. 2019), pp. 6441–6450.
[74] J. Brecher. “Graphical representation of stereochemical configuration (IUPACRecommendations2006)”. In: Pure Appl. Chem. 78.10 (Jan. 2006), pp. 1897–1970.
[75] S. Bolze and R. Boulieu. “HPLC determination of ketamine, norketamine, and dehydronorketaminein plasma with a high-purity reversed-phase sorbent”. In: Clin. Chem. 44.3 (Mar. 1998), pp. 560–4.
[76] P. Delatour et al. “Enantioselective N-demethylation of ketamine in the horse”. In: J. Vet. Pharmacol.Ther. 14.2 (June 1991), pp. 209–212.
[77] G. Geisslinger et al. “Stereoselective high-performance liquid chromatographic determination of theenantiomers of ketamine andnorketamine inplasma”. In: J. Chromatogr. B568.1 (July 1991), pp. 165–176.
[78] J.-O. Svensson and L. L. Gustafsson. “Determination of ketamine and norketamine enantiomers inplasma by solid-phase extraction and high-performance liquid chromatography”. In: J. Chromatogr.B 678.2 (Apr. 1996), pp. 373–376.
[79] P. Hartvig et al. “Central nervous system effects of subdissociative doses of (S)-ketamine are relatedto plasma and brain concentrations measured with positron emission tomography in healthy volun-teers*”. In: Clin. Pharmacol. Ther. 58.2 (Aug. 1995), pp. 165–173.
[80] Y. Yanagihara et al. “Stereoselective high-performance liquid chromatographic determination of ke-tamine and its active metabolite, norketamine, in human plasma”. In: J. Chromatogr. B 746.2 (Sept.2000), pp. 227–231.
[81] T. Chang and A. J. Glazko. “A gas chromatographic assay for ketamine in human plasma”. In: Anes-thesiology 36.4 (Apr. 1972), pp. 401–404.
[82] J.Wieber et al. “Pharmacokinetics of ketamine inman”. In:Anaesthesist 24.6 (June 1975), pp. 260–3.[83] M. L. Williams et al. “Effects of protein calorie malnutrition on the pharmacokinetics of ketamine in
rats”. In:DrugMetab. Dispos. 32.8 (Aug. 2004), pp. 786–793.[84] J. N. Davisson. “Rapid gas chromatographie analysis of plasma levels of ketamine and major metabo-
lites employing either nitrogen selective or mass spectroscopic detection”. In: J. Chromatogr. B 146.2(Sept. 1978), pp. 344–349.
[85] K. Lian et al. “A novel derivatization approach for determination of ketamine in urine and plasma bygas chromatography-mass spectrometry”. In: J. Chromatogr. A 1264 (Nov. 2012), pp. 104–109.
[86] K.-C. Wang, T.-S. Shih, and S.-G. Cheng. “Use of SPE and LC/TIS/MS/MS for rapid detection andquantitation of ketamine and its metabolite, norketamine, in urine”. In: Forensic Sci. Int. 147.1 (Jan.2005), pp. 81–88.
34
[87] M. E. Rodriguez Rosas, S. Patel, and I. W. Wainer. “Determination of the enantiomers of ketamineand norketamine in human plasma by enantioselective liquid chromatography-mass spectrometry”.In: J. Chromatogr. B 794.1 (Aug. 2003), pp. 99–108.
[88] R. Moaddel et al. “A parallel chiral-achiral liquid chromatographic method for the determination ofthe stereoisomers of ketamine and ketaminemetabolites in the plasma and urine of patients with com-plex regional pain syndrome”. In: Talanta 82.5 (Oct. 2010), pp. 1892–1904.
[89] T. Legrand et al. “Determination of ketamine and norketamine in plasma by micro-liquid chromato-graphy-mass spectrometry”. In: J. Pharm. Biomed. Anal. 48.1 (Sept. 2008), pp. 171–176.
[90] R. Theurillat et al. “Characterization of the stereoselective biotransformation of ketamine to norke-taminevia determination of their enantiomers in equine plasma by capillary electrophoresis”. In: Elec-trophoresis 26.20 (Oct. 2005), pp. 3942–3951.
[91] R. Theurillat et al. “Enantioselective analysis of ketamine and its metabolites in equine plasma andurine by CE with multiple isomer sulfated β-CD”. In: Electrophoresis 28.15 (Aug. 2007), pp. 2748–2757.
[92] A. Schmitz et al. “CEprovides evidenceof the stereoselectivehydroxylationofnorketamine in equines”.In: Electrophoresis 30.16 (Aug. 2009), pp. 2912–2921.
[93] R. Theurillat et al. “Development of a method for analysis of ketamine and norketamine enantiomersin equine brain and cerebrospinal fluid by capillary electrophoresis”. In: Electrophoresis 35.19 (Oct.2014), pp. 2863–2869.
[94] R. Theurillat et al. “Microassay for ketamine and metabolites in plasma and serum based on enantios-elective capillary electrophoresis with highly sulfated γ-cyclodextrin and electrokinetic analyte injec-tion”. In: Electrophoresis 37.9 (May 2016), pp. 1129–1138.
[95] M. P. Juhascik andA. J. Jenkins. “Comparison of liquid/liquid and solid-phase extraction for alkalinedrugs”. In: J. Chromatogr. Sci. 47.7 (Aug. 2009), pp. 553–557.
[96] J. L. Bonnefous and R. Boulieu. “Comparison of solid-phase extraction and liquid-liquid extractionmethods for liquid chromatographic determination of diltiazem and its metabolites in plasma”. In: J.Liq. Chromatogr. 13.19 (Dec. 1990), pp. 3799–3807.
[97] D. G. Sitnikov, C. S. Monnin, and D. Vuckovic. “Systematic assessment of seven solvent and solid-phase extraction methods for metabolomics analysis of human plasma by LC-MS”. In: Sci. Rep. 6.1(Dec. 2016), p. 38885.
[98] M.Hasan et al. “Quantitative chiral and achiral determination of ketamine and its metabolites by LC-MS/MS in human serum, urine and fecal samples”. In: J. Pharm. Biomed. Anal. 139 (May 2017),pp. 87–97.
[99] C.Ramiole et al. “Determination of ketamine and itsmainmetabolites by liquid chromatography cou-pled to tandem mass spectrometry in pig plasma: Comparison of extraction methods”. In: J. Pharm.Biomed. Anal. 146 (2017), pp. 369–377.
[100] European Medicines Agency. “Guideline on bioanalytical method validation”. In: EMEA/CHMP /EWP-192217/2009. 2012.
[101] U.S. Department of Health and Human Services Food and Drug Administration. “Bioanalyticalmethod validation”. In:Guidance for Industry. 2018.
[102] X. Zhao et al. “Simultaneous population pharmacokinetic modelling of ketamine and three majormetabolites in patients with treatment-resistant bipolar depression”. In: Br. J. Clin. Pharmacol. 74.2(July 2012), pp. 304–314.
[103] H. Nelander, S. Andersson, and K. Öhlén. “Evaluation of the chiral recognition properties as well asthe column performance of four chiral stationary phases based on cellulose (3,5-dimethylphenylcar-bamate) by parallel HPLC and SFC”. In: J. Chromatogr. A 1218.52 (Dec. 2011), pp. 9397–9405.
[104] C. West et al. “Insights into chiral recognition mechanisms in supercritical fluid chromatography. II.Factors contributing to enantiomer separation on tris-(3,5-dimethylphenylcarbamate) of amylose andcellulose stationary phases”. In: J. Chromatogr. A 1218.15 (Apr. 2011), pp. 2033–2057.
35
Part 3 Literature references
[105] G. M. Fassauer et al. “Ketamine metabolites with antidepressant effects: fast, economical, and eco-friendly enantioselective separationbasedon supercritical-fluid chromatography (SFC) and single qua-drupole MS detection”. In: J. Pharm. Biomed. Anal. 146 (Nov. 2017), pp. 410–419.
[106] R. Hofstetter, G.M. Fassauer, and A. Link. “Supercritical fluid extraction (SFE) of ketamine metabo-lites fromdried urine and on-line quantification by supercritical fluid chromatography and singlemassdetection (on-line SFE-SFC-MS)”. In: J. Chromatogr. B 1076.January (Feb. 2018), pp. 77–83.
[107] H.Toki et al. “A rapid and sensitive chiral LC-MS/MSmethod for the determination of ketamine andnorketamine in mouse plasma, brain and cerebrospinal fluid applicable to the stereoselective pharma-cokinetic study of ketamine”. In: J. Pharm. Biomed. Anal. 148 (Jan. 2018), pp. 288–297.
[108] J. Płotka-Wasylka et al. “Extraction with environmentally friendly solvents”. In: TrAC - Trends Anal.Chem. 91 (June 2017), pp. 12–25.
[109] A. d. P. Sánchez-Camargo et al. “On-line coupling of supercritical fluid extraction and chromato-graphic techniques”. In: J. Sep. Sci. 40.1 (Jan. 2017), pp. 213–227.
[110] Y. Liang and T. Zhou. “Recent advances of online coupling of sample preparation techniques withultra high performance liquid chromatography and supercritical fluid chromatography”. In: J. Sep.Sci. 42.1 (Jan. 2019), pp. 226–242.
[111] M. Herrero et al. “Plants, seaweeds, microalgae and food by-products as natural sources of functionalingredients obtained using pressurized liquid extraction and supercritical fluid extraction”. In: TrACTrends Anal. Chem. 71 (Sept. 2015), pp. 26–38.
[112] A.Matsubara et al. “High-accuracy analysis system for the redox status of coenzymeQ10 by online su-percritical fluid extraction-supercritical fluid chromatography/mass spectrometry”. In: J. Chromatogr.A 1250 (Aug. 2012), pp. 76–79.
[113] M. Sakai et al. “Development of a practical online supercritical fluid extraction-supercritical fluid chro-matography/mass spectrometry system with an integrated split-flow method”. In: J. Chromatogr. A1592 (May 2019), pp. 161–172.
[114] M. Zoccali et al. “Carotenoids and apocarotenoids determination in intact human blood samples byonline supercritical fluid extraction-supercritical fluid chromatography-tandem mass spectrometry”.In: Anal. Chim. Acta 1032 (Nov. 2018), pp. 40–47.
[115] A.P.Wicker et al. “On-line supercritical fluid extraction-supercritical fluid chromatography-mass spec-trometry of polycyclic aromatic hydrocarbons in soil”. In: J. Chromatogr. B 1086.April (June 2018),pp. 82–88.
[116] M. Suzuki et al. “Use of on-line supercritical fluid extraction-supercritical fluid chromatography/ tan-demmass spectrometry to analyze disease biomarkers in dried serum spots compared with serum anal-ysis using liquid chromatography/tandem mass spectrometry”. In: Rapid Commun. Mass Spectrom.31.10 (May 2017), pp. 886–894.
[117] M. Zoccali et al. “Direct online extraction and determination by supercritical fluid extraction withchromatography and mass spectrometry of targeted carotenoids from red Habanero peppers (Cap-sicum chinense Jacq.)” In: J. Sep. Sci. 40.19 (Oct. 2017), pp. 3905–3913.
[118] T.Uchikata et al. “High-throughput phospholipid profiling systembased on supercritical fluid extrac-tion-supercritical fluid chromatography/mass spectrometry for dried plasma spot analysis”. In: J. Chro-matogr. A 1250 (Aug. 2012), pp. 69–75.
[119] M. L. Hopper and J. W. King. “Enhanced supercritical fluid carbon dioxide extraction of pesticidesfromfoodsusingpelletizeddiatomaceous earth”. In: J.Assoc.Off.Anal.Chem.74.4 (July 1991), pp. 661–666.
[120] A. Dispas et al. “Supercritical fluid chromatography: a promising alternative to current bioanalyticaltechniques”. In: Bioanalysis 10.2 (Dec. 2017), pp. 107–124.
[121] A.Dispas, P. Lebrun, and P.Hubert. “Validation of supercritical fluid chromatographymethods”. In:Supercritical Fluid Chromatography. Ed. by C. F. Poole. Elsevier, July 2017, pp. 317–344.
[122] R. Hofstetter, G. M. Fassauer, and A. Link. “The many (inter-)faces of supercritical fluid chromatog-raphy: the present and future prospects of online supercritical fluid extraction-supercritical fluid chro-matography”. In: Bioanalysis 10.14 (July 2018), pp. 1073–1076.
36
[123] F. Raposo. “Evaluation of analytical calibration based on least-squares linear regression for instrumen-tal techniques: a tutorial review”. In: TrAC Trends Anal. Chem. 77 (Mar. 2016), pp. 167–185.
[124] J. Hunter. “Calibration and the straight-line ‒current statistical practices”. In: J. Assoc. Off. Anal.Chem. 64.3 (Aug. 1981), pp. 574–583.
[125] P. B. Pedrosa and T. A. Cardoso. “Viral infections in workers in hospital and research laboratory set-tings: a comparative review of infection modes and respective biosafety aspects”. In: Int. J. Infect. Dis.15.6 (June 2011), e366–e376.
[126] N. Wurtz et al. “Survey of laboratory-acquired infections around the world in biosafety level 3 and 4laboratories”. In: Eur. J. Clin. Microbiol. Infec. Dis. 35.8 (May 2016), pp. 1247–1258.
[127] B. L. Herwaldt. “Laboratory-acquired parasitic infections from accidental exposures”. In: Clin. Mi-crobiol. Rev. 14.4 (Oct. 2001), pp. 659–688.
[128] I. M. Artika and C. N.Ma’roef. “Laboratory biosafety for handling emerging viruses”. In:Asian Pac.J. Trop. Biomed. 7.5 (May 2017), pp. 483–491.
[129] A. Noireau et al. “Purification of drug degradation products supported by analytical and preparativesupercritical fluid chromatography”. In: J. Pharm. Biomed. Anal. 170 (2019), pp. 40–47.
[130] B.Andri et al. “Is supercritical fluid chromatography hyphenated tomass spectrometry suitable for thequality control of vitamin D3 oily formulations?” In: J. Chromatogr. A 1515 (2017), pp. 209–217.
[131] R. K. Hofstetter et al. “Subcritical fluid chromatography at sub-ambient temperatures for the chiralresolution of ketaminemetabolites with rapid-onset antidepressant effects”. In:Molecules 24.10 (May2019), p. 1927.
[132] F. Barreto et al. “A simple and high-throughput method for determination and confirmation of 14coccidiostats in poultry muscle and eggs using liquid chromatography - quadrupole linear ion trap -tandemmass spectrometry (HPLC-QqLIT-MS/MS)”. In: Talanta 168 (June 2017), pp. 43–51.
[133] G. Jibuti et al. “HPLC separation of dihydropyridine derivatives enantiomers with emphasis on elu-tion order using polysaccharide-based chiral columns”. In: J. Sep. Sci. 35.19 (Oct. 2012), pp. 2529–2537.
[134] S.K.Manier et al. “Untargetedmetabolomics byhigh resolutionmass spectrometry coupled tonormaland reversed phase liquid chromatography as a tool to study the in vitro biotransformation of newpsychoactive substances”. In: Sci. Rep. 9.1 (Dec. 2019), p. 2741.
[135] I. Matarashvili et al. “Separation of enantiomers of chiral weak acids with polysaccharide-based chiralcolumns and aqueous-organic mobile phases in high-performance liquid chromatography: Typicalreversed-phase behavior?” In: J. Chromatogr. A 1483 (Feb. 2017), pp. 86–92.
[136] C.West, Y. Zhang, and L.Morin-Allory. “Insights into chiral recognitionmechanisms in supercriticalfluid chromatography. I. Non-enantiospecific interactions contributing to the retention on tris-(3,5-dimethylphenylcarbamate) amylose and cellulose stationary phases”. In: J. Chromatogr. A 1218.15(Apr. 2011), pp. 2019–2032.
[137] P. Žuvela et al. “Column characterization and selection systems in reversed-phase high-performanceliquid chromatography”. In: Chem. Rev. 119.6 (Jan. 2019), pp. 3674–3729.
[138] S. Niedermeier et al. “Simultaneous determination of dextromepromazine and related substances 2-methoxyphenothiazine and levomepromazine sulfoxide in levomepromazine on a cellulosetris-(4-methylbenzoate) chiral column”. In: J. Pharm. Biomed. Anal. 158 (Sept. 2018), pp. 294–299.
[139] J. Teixeira et al. “Chiral stationary phases for liquid chromatography”. In:Molecules 24.5 (Feb. 2019),p. 865.
[140] C.Muscat Galea et al. “Investigation of the effect of column temperature and back-pressure in achiralsupercritical fluid chromatography within the context of drug impurity profiling”. In: J. Chromatogr.A 1518 (Oct. 2017), pp. 78–88.
[141] Z. Lin et al. “A zone-heated gas chromatographic microcolumn: energy efficiency”. In: Sensors Actua-tors B Chem. 254 (Jan. 2018), pp. 561–572.
[142] Michelle Hong Chen and C. Horváth. “Temperature programming and gradient elution in reversed-phase chromatography with packed capillary columns”. In: J. Chromatogr. A 788.1-2 (Nov. 1997),pp. 51–61.
37
Part 3 Literature references
[143] D. Guillarme et al. “Recent developments in liquid chromatography-Impact on qualitative and quan-titative performance”. In: J. Chromatogr. A 1149.1 (May 2007), pp. 20–29.
[144] C. Panella et al. “Temperature and eluent composition effects on enantiomer separation of carvedilolby high-performance liquid chromatography on immobilized amylose-based chiral stationary phases”.In: J. Pharm. Anal. 9.5 (Oct. 2019), pp. 324–331.
[145] C. West et al. “Effects of mobile phase composition and temperature on the supercritical fluid chro-matography enantioseparation of chiral fluoro-oxoindole-type compounds with chlorinated polysac-charide stationary phases”. In: J. Chromatogr. A 1269 (Dec. 2012), pp. 325–335.
[146] D.T.Nguyen et al. “High throughput liquid chromatographywith sub-2μmparticles at high pressureand high temperature”. In: J. Chromatogr. A 1167.1 (Oct. 2007), pp. 76–84.
[147] D. Åsberg et al. “Evaluation of co-solvent fraction, pressure and temperature effects in analytical andpreparative supercritical fluid chromatography”. In: J. Chromatogr. A 1374 (Dec. 2014), pp. 254–260.
[148] R. D. Pauw et al. “Temperature effects in supercritical fluid chromatography: a trade-off between vis-cous heating and decompression cooling”. In: J. Chromatogr. A 1365 (Oct. 2014), pp. 212–218.
[149] R. Smith,D.Taylor, andS.Wilkins. “Temperaturedependenceof chiral discrimination in supercriticalfluid chromatography and high-performance liquid chromatography”. In: J. Chromatogr. A 697.1-2(Apr. 1995), pp. 591–596.
[150] L.Toribio et al. “Effects of organicmodifier and temperature on the enantiomeric separation of severalazole drugs using supercritical fluid chromatography and the Chiralpak AD column”. In: Biomed.Chromatogr. 28.1 (Jan. 2014), pp. 152–158.
[151] P. Hlavica and G. Niebch. “Pharmacokinetics and biotransformation of the analgesic flupirtine inhumans”. In: Arzneimittelforschung. 35.1 (Jan. 1985), pp. 67–74.
[152] K. Konishi et al. “In vitro approach to elucidate the relevance of carboxylesterase 2 andN-acetyltrans-ferase 2 to flupirtine-induced liver injury”. In: Biochem. Pharmacol. 155 (Sept. 2018), pp. 242–251.
[153] K. Methling et al. “Investigation of the in vitro metabolism of the analgesic flupirtine”. In: DrugMetab. Dispos. 37.3 (Dec. 2008), pp. 479–493.
[154] E. Scheuch et al. “Quantitative LC-MS/MS determination of flupirtine, itsN-acetylated and twomer-capturic acid derivatives in man”. In: J. Pharm. Biomed. Anal. 102 (Jan. 2015), pp. 377–385.
[155] I. Klopčič and M. S. Dolenc. “Chemicals and drugs forming reactive quinone and quinone iminemetabolites”. In: Chem. Res. Toxicol. 32.1 (Jan. 2019), pp. 1–34.
[156] A. S. Surur et al. “Flupirtine and retigabine as templates for ligand-based drug design of KV7.2/3 acti-vators”. In:Org. Biomol. Chem. 17.18 (Apr. 2019), pp. 4512–4522.
[157] A. Sen et al. “Analysis of polar urinarymetabolites formetabolic phenotyping using supercritical fluidchromatography and mass spectrometry”. In: J. Chromatogr. A 1449 (June 2016), pp. 141–155.
[158] K. Taguchi, E. Fukusaki, and T. Bamba. “Simultaneous analysis for water- and fat-soluble vitaminsby a novel single chromatography technique unifying supercritical fluid chromatography and liquidchromatography”. In: J. Chromatogr. A 1362 (2014), pp. 270–277.
[159] A. S. Surur et al. “Flupirtine analogues: explorative synthesis and influence of chemical structure onKv7.2/Kv7.3 channel opening activity”. In: ChemistryOpen 8 (Jan. 2019), pp. 41–44.
[160] C. Bock and A. Link. “How to replace the lost keys? Strategies towards safer Kv7 Channel Openers”.In: FutureMed. Chem. 11.4 (Feb. 2019), pp. 337–355.
[161] W.Siegmund et al. “Metabolic activation and analgesic effect of flupirtine inhealthy subjects, influenceof the polymorphic NAT2, UGT1A1 and GSTP1”. In: Br. J. Clin. Pharmacol. 73.3 (Sept. 2014),pp. 501–513.
[162] N. Anderson and J. Borlak. “Correlation versus causation? Pharmacovigilance of the analgesic flupir-tine exemplifies the need for refined spontaneous ADR reporting”. In: PLoS One 6.10 (Oct. 2011).Ed. by A. Timmer, e25221.
[163] F. Puls et al. “Pathology of flupirtine-induced liver injury”. In: Virchows Arch. 458.6 (June 2011),pp. 709–716.
38
[164] EuropeanMedicines Agency. “Withdrawal of pain medicine flupirtine endorsed”. In: EMA/153044/2018. 2018.
[165] C. Bock et al. “Synthesis and potassium Kv7 channel opening activity of thioether analogues of theanalgesic flupirtine”. In:Org. Biomol. Chem. 16 (Oct. 2018), pp. 8695–8699.
[166] Y. Liu et al. “Bioequivalence study of two formulations of flupirtine maleate capsules in healthy maleChinese volunteers under fasting and fed conditions”. In: Drug Des. Devel. Ther. 11 (Dec. 2017),pp. 3441–3448.
[167] X. Chen et al. “Simultaneous determination of flupirtine and its major active metabolite in humanplasma by liquid chromatography-tandemmass spectrometry”. In: J. Chromatogr. B 755 (May 2001),pp. 195–202.
[168] M. A. Patil et al. “Brain distribution and metabolism of flupirtine, a nonopioid analgesic drug withantiseizure effects, in neonatal rats”. In: Pharmaceutics 10.281 (Dec. 2018), pp. 1–13.
[169] P. K. Narang et al. “Quantitation of flupirtine and its active acetylated metabolite by reversed-phasehigh-performance liquid chromatography using fluorometric detection”. In: J. Chromatogr. 305 (July1984), pp. 135–143.
[170] H. Pan et al. “Identification and simultaneous determination of p-FHA and p-FBA , twometabolitesof anti-tumor agent-Fluorapacin in rat urine”. In: J. Chromatogr. B 877 (May 2009), pp. 1553–1560.
[171] K. Beirow, J. Jedamzik, and P. J. Bednarski. “Investigation of the metabolic pathway of flupirtinemetabolite 4-fluorohippuric acid in vitro byHPLC”. In: Pharmaceutical research: from basic researchto medical applications. Sept. 2019, POS.42.
[172] M. Kaza et al. “Bioanalytical method validation: new FDA guidance vs. EMA guideline. Better orworse?” In: J. Pharm. Biomed. Anal. 165 (Feb. 2019), pp. 381–385.
[173] V.Desfontaine et al. “Systematic evaluation ofmatrix effects in supercritical fluid chromatography ver-sus liquid chromatography coupled to mass spectrometry for biological samples”. In: J. Chromatogr.B 1079.December 2017 (Mar. 2018), pp. 51–61.
[174] A. Svan et al. “Thedifferences inmatrix effect between supercritical fluid chromatography and reversedphase liquid chromatography coupled to ESI/MS”. In: Anal. Chim. Acta 1000 (Feb. 2018), pp. 163–171.
[175] A. Haglind et al. “Major signal suppression from metal ion clusters in SFC/ESI-MS - Cause and ef-fects”. In: J. Chromatogr. B 1084.December 2017 (May 2018), pp. 96–105.
[176] A. Grand-Guillaume Perrenoud et al. “Analysis of basic compounds by supercritical fluid chromatog-raphy: attempts to improve peak shape and maintain mass spectrometry compatibility”. In: J. Chro-matogr. A 1262 (Nov. 2012), pp. 205–213.
[177] R. K. Hofstetter et al. “Simultaneous quantification of acidic and basic flupirtine metabolites by su-percritical fluid chromatography according to European Medicines Agency validation”. In: J. Chro-matogr. A 1603 (Oct. 2019), pp. 338–347.
39

This page has been intentionally left blank.
Part 4Publications
4.1 Peer‐reviewed articles
Paper I
Supercritical fluid chromatography: from science fiction to scientific fact
Authors Robert K. Hofstetter, MahmoudHasan, Carolin Eckert, and Andreas Link
Journal ChemTexts 5.3 (2019): 13.
Analytical content This lecture text departs from general convention by first introducing the virtuesof SFC, aiming to provide the incentives for delving into the physical and instrumental details ofSF-based techniques. The text concludes by addressing the undeniable challenges of SFC, explainingwhyHPLCandGCcontinue to dominatemainstreamchromatography, andhow to choose themostsuitable technique for a given separation problem.
Contributions
Robert K. Hofstetter Conceptualization, investigation, visualization, writing (original draft)MahmoudHasan InvestigationCarolin Eckert VisualizationAndreas Link Project administration, funding acquisition, writing (review and editing)
Robert K. Hofstetter Andreas Link
(signature) (signature)
41
Vol.:(0123456789)1 3
ChemTexts (2019) 5:13 https://doi.org/10.1007/s40828-019-0087-2
LECTURE TEXT
Supercritical fluid chromatography
From science fiction to scientific fact
Robert K. Hofstetter1 · Mahmoud Hasan2 · Carolin Eckert1 · Andreas Link1
Received: 6 May 2019 / Accepted: 29 May 2019 © Springer Nature Switzerland AG 2019
AbstractHigh-pressure gas chromatography is not a novel concept, but it is an intriguing one: the eco-friendly chimera seeks to combine the advantages of GC and HPLC, which has led to the development of supercritical fluid chromatography (SFC). But while the chromatographic age of supercritical fluids has been advertised by proponents and manufacturers for more than 50 years, SFC has largely been deprecated as science fiction due to complex method development, a perceived lack of robustness, and a tendency to fall short of expectations. For the longest time, separation scientists were justifiably skepti-cal—if not blissfully unaware—of the reformation process taking place within SFC, which has only recently escaped scientific anonymity/infamy by gaining industrial significance as the method of choice for chiral and semi-preparative separations. Indeed, the truly exceptional performance and a multitude of adjustable parameters make SFC arguably the most versatile of industrially employed chromatographic techniques. Here, the principal reasons for the renewed interest in SFC (what is SFC good for?) are reviewed, before addressing the underlying physical principles and instrumental requirements (what makes SFC work?). A discussion of the fundamental limitations (what is the catch?) follows. The frontiers between different types of chromatography are fading and may soon give way to unified or convergent analysis that is expected to provide a more accurate analytical vision than any singular form of chromatography.
Keywords Supercritical fluid chromatography · Green chemistry · Orthogonal chromatography · Chiral analysis · Preparative chromatography
AbbreviationsELSD Evaporative light scattering detectorFID Flame ionization detectorGC Gas chromatographyHPLC High-performance liquid chromatographyLC Liquid chromatographyMP Mobile phasescCO2 Supercritical CO2SFC Supercritical fluid chromatographyUHPSFC Ultrahigh-performance supercritical fluid
chromatography
UHPLC Ultrahigh-performance liquid chromatographyUV/Vis Ultraviolet-visible spectroscopy
The (r‑)evolution of supercritical fluid chromatography
Since its debut in 1962, supercritical fluid chromatography (SFC) has matured into arguably the most versatile of chro-matographic techniques [1]. The tale of SFC is no longer one of sudden revolutions (as it once was envisioned to be), but rather the sum of gradual improvements playing out over more than five decades of continual refinement since the first report on high-pressure gas chromatography in 1962 [2]. Only recently has SFC reached the industrial age, supersed-ing even as trusted a technique as high-performance liquid chromatography (HPLC) as the method of choice for chiral and semi-preparative applications in pharmaceutical, cos-metic, and food-related technologies. Its history of wishful thinking (supercritical fluid chromatography), inevitable
* Robert K. Hofstetter [email protected]
1 Pharmaceutical and Medicinal Chemistry, Institute of Pharmacy, University of Greifswald, Friedrich-Ludwig-Jahn-Str. 17, 17489 Greifswald, Germany
2 Department of Clinical Pharmacology, Center of Drug Absorption and Transport (C_DAT), University Medicine Greifswald, 17489 Greifswald, Germany
42
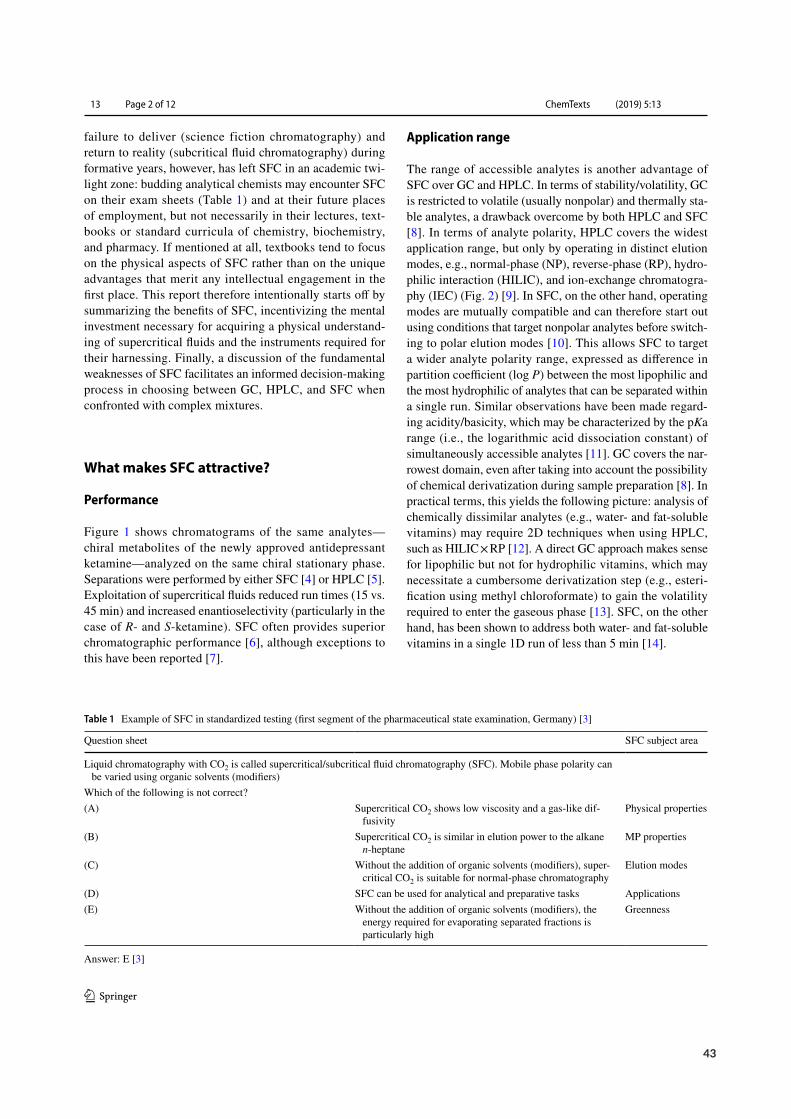
ChemTexts (2019) 5:13
1 3
13 Page 2 of 12
failure to deliver (science fiction chromatography) and return to reality (subcritical fluid chromatography) during formative years, however, has left SFC in an academic twi-light zone: budding analytical chemists may encounter SFC on their exam sheets (Table 1) and at their future places of employment, but not necessarily in their lectures, text-books or standard curricula of chemistry, biochemistry, and pharmacy. If mentioned at all, textbooks tend to focus on the physical aspects of SFC rather than on the unique advantages that merit any intellectual engagement in the first place. This report therefore intentionally starts off by summarizing the benefits of SFC, incentivizing the mental investment necessary for acquiring a physical understand-ing of supercritical fluids and the instruments required for their harnessing. Finally, a discussion of the fundamental weaknesses of SFC facilitates an informed decision-making process in choosing between GC, HPLC, and SFC when confronted with complex mixtures.
What makes SFC attractive?
Performance
Figure 1 shows chromatograms of the same analytes—chiral metabolites of the newly approved antidepressant ketamine—analyzed on the same chiral stationary phase. Separations were performed by either SFC [4] or HPLC [5]. Exploitation of supercritical fluids reduced run times (15 vs. 45 min) and increased enantioselectivity (particularly in the case of R- and S-ketamine). SFC often provides superior chromatographic performance [6], although exceptions to this have been reported [7].
Application range
The range of accessible analytes is another advantage of SFC over GC and HPLC. In terms of stability/volatility, GC is restricted to volatile (usually nonpolar) and thermally sta-ble analytes, a drawback overcome by both HPLC and SFC [8]. In terms of analyte polarity, HPLC covers the widest application range, but only by operating in distinct elution modes, e.g., normal-phase (NP), reverse-phase (RP), hydro-philic interaction (HILIC), and ion-exchange chromatogra-phy (IEC) (Fig. 2) [9]. In SFC, on the other hand, operating modes are mutually compatible and can therefore start out using conditions that target nonpolar analytes before switch-ing to polar elution modes [10]. This allows SFC to target a wider analyte polarity range, expressed as difference in partition coefficient (log P) between the most lipophilic and the most hydrophilic of analytes that can be separated within a single run. Similar observations have been made regard-ing acidity/basicity, which may be characterized by the pKa range (i.e., the logarithmic acid dissociation constant) of simultaneously accessible analytes [11]. GC covers the nar-rowest domain, even after taking into account the possibility of chemical derivatization during sample preparation [8]. In practical terms, this yields the following picture: analysis of chemically dissimilar analytes (e.g., water- and fat-soluble vitamins) may require 2D techniques when using HPLC, such as HILIC × RP [12]. A direct GC approach makes sense for lipophilic but not for hydrophilic vitamins, which may necessitate a cumbersome derivatization step (e.g., esteri-fication using methyl chloroformate) to gain the volatility required to enter the gaseous phase [13]. SFC, on the other hand, has been shown to address both water- and fat-soluble vitamins in a single 1D run of less than 5 min [14].
Table 1 Example of SFC in standardized testing (first segment of the pharmaceutical state examination, Germany) [3]
Answer: E [3]
Question sheet SFC subject area
Liquid chromatography with CO2 is called supercritical/subcritical fluid chromatography (SFC). Mobile phase polarity can be varied using organic solvents (modifiers)
Which of the following is not correct?(A) Supercritical CO2 shows low viscosity and a gas-like dif-
fusivityPhysical properties
(B) Supercritical CO2 is similar in elution power to the alkane n-heptane
MP properties
(C) Without the addition of organic solvents (modifiers), super-critical CO2 is suitable for normal-phase chromatography
Elution modes
(D) SFC can be used for analytical and preparative tasks Applications(E) Without the addition of organic solvents (modifiers), the
energy required for evaporating separated fractions is particularly high
Greenness
43
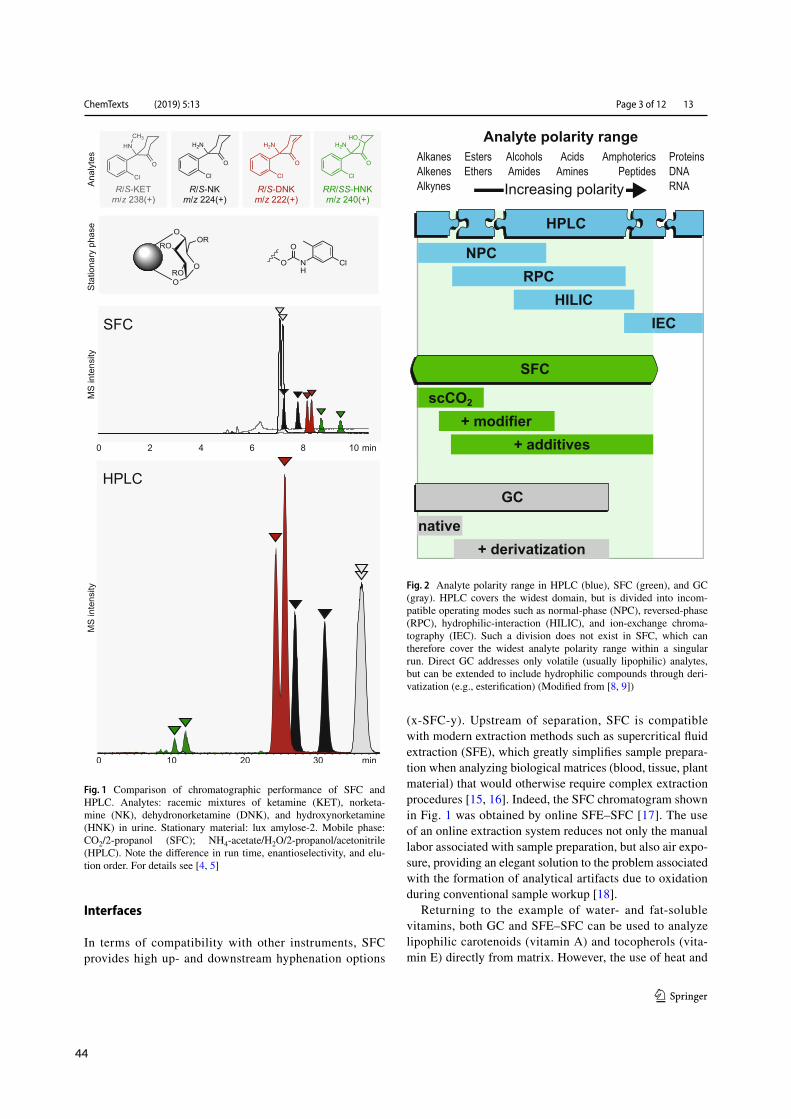
ChemTexts (2019) 5:13
1 3
Page 3 of 12 13
Interfaces
In terms of compatibility with other instruments, SFC provides high up- and downstream hyphenation options
(x-SFC-y). Upstream of separation, SFC is compatible with modern extraction methods such as supercritical fluid extraction (SFE), which greatly simplifies sample prepara-tion when analyzing biological matrices (blood, tissue, plant material) that would otherwise require complex extraction procedures [15, 16]. Indeed, the SFC chromatogram shown in Fig. 1 was obtained by online SFE–SFC [17]. The use of an online extraction system reduces not only the manual labor associated with sample preparation, but also air expo-sure, providing an elegant solution to the problem associated with the formation of analytical artifacts due to oxidation during conventional sample workup [18].
Returning to the example of water- and fat-soluble vitamins, both GC and SFE–SFC can be used to analyze lipophilic carotenoids (vitamin A) and tocopherols (vita-min E) directly from matrix. However, the use of heat and
Fig. 1 Comparison of chromatographic performance of SFC and HPLC. Analytes: racemic mixtures of ketamine (KET), norketa-mine (NK), dehydronorketamine (DNK), and hydroxynorketamine (HNK) in urine. Stationary material: lux amylose-2. Mobile phase: CO2/2-propanol (SFC); NH4-acetate/H2O/2-propanol/acetonitrile (HPLC). Note the difference in run time, enantioselectivity, and elu-tion order. For details see [4, 5]
Fig. 2 Analyte polarity range in HPLC (blue), SFC (green), and GC (gray). HPLC covers the widest domain, but is divided into incom-patible operating modes such as normal-phase (NPC), reversed-phase (RPC), hydrophilic-interaction (HILIC), and ion-exchange chroma-tography (IEC). Such a division does not exist in SFC, which can therefore cover the widest analyte polarity range within a singular run. Direct GC addresses only volatile (usually lipophilic) analytes, but can be extended to include hydrophilic compounds through deri-vatization (e.g., esterification) (Modified from [8, 9])
44
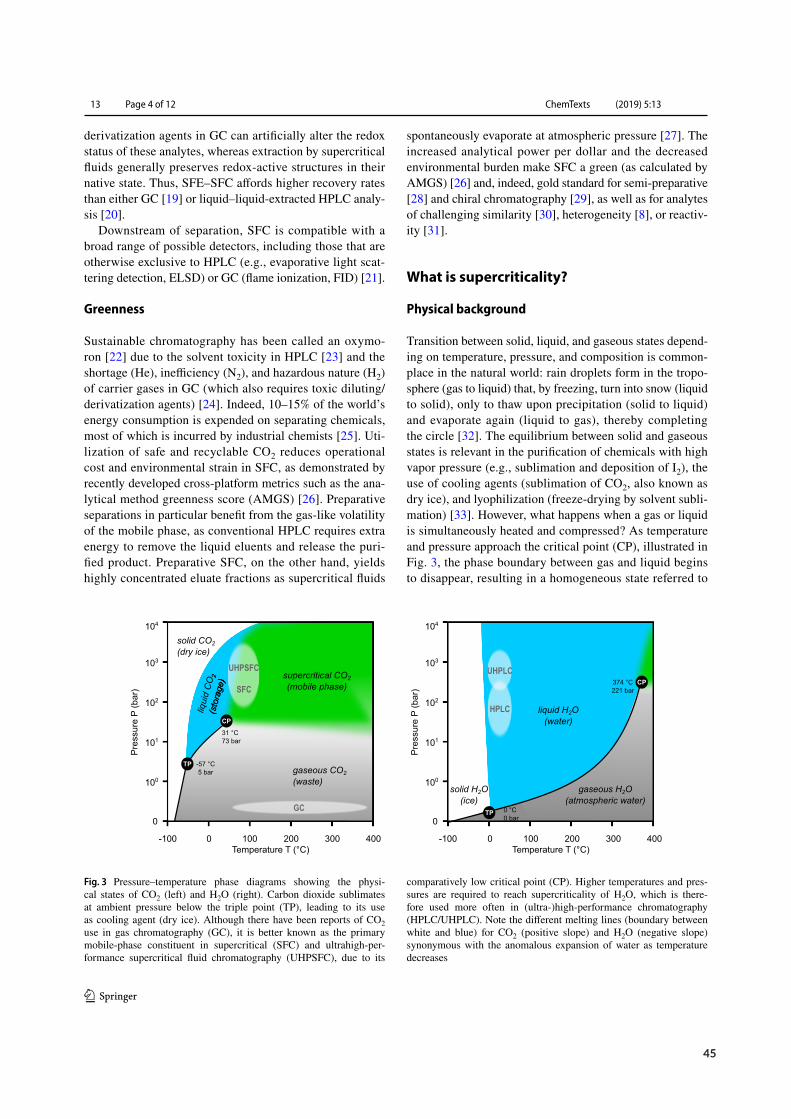
ChemTexts (2019) 5:13
1 3
13 Page 4 of 12
derivatization agents in GC can artificially alter the redox status of these analytes, whereas extraction by supercritical fluids generally preserves redox-active structures in their native state. Thus, SFE–SFC affords higher recovery rates than either GC [19] or liquid–liquid-extracted HPLC analy-sis [20].
Downstream of separation, SFC is compatible with a broad range of possible detectors, including those that are otherwise exclusive to HPLC (e.g., evaporative light scat-tering detection, ELSD) or GC (flame ionization, FID) [21].
Greenness
Sustainable chromatography has been called an oxymo-ron [22] due to the solvent toxicity in HPLC [23] and the shortage (He), inefficiency (N2), and hazardous nature (H2) of carrier gases in GC (which also requires toxic diluting/derivatization agents) [24]. Indeed, 10–15% of the world’s energy consumption is expended on separating chemicals, most of which is incurred by industrial chemists [25]. Uti-lization of safe and recyclable CO2 reduces operational cost and environmental strain in SFC, as demonstrated by recently developed cross-platform metrics such as the ana-lytical method greenness score (AMGS) [26]. Preparative separations in particular benefit from the gas-like volatility of the mobile phase, as conventional HPLC requires extra energy to remove the liquid eluents and release the puri-fied product. Preparative SFC, on the other hand, yields highly concentrated eluate fractions as supercritical fluids
spontaneously evaporate at atmospheric pressure [27]. The increased analytical power per dollar and the decreased environmental burden make SFC a green (as calculated by AMGS) [26] and, indeed, gold standard for semi-preparative [28] and chiral chromatography [29], as well as for analytes of challenging similarity [30], heterogeneity [8], or reactiv-ity [31].
What is supercriticality?
Physical background
Transition between solid, liquid, and gaseous states depend-ing on temperature, pressure, and composition is common-place in the natural world: rain droplets form in the tropo-sphere (gas to liquid) that, by freezing, turn into snow (liquid to solid), only to thaw upon precipitation (solid to liquid) and evaporate again (liquid to gas), thereby completing the circle [32]. The equilibrium between solid and gaseous states is relevant in the purification of chemicals with high vapor pressure (e.g., sublimation and deposition of I2), the use of cooling agents (sublimation of CO2, also known as dry ice), and lyophilization (freeze-drying by solvent subli-mation) [33]. However, what happens when a gas or liquid is simultaneously heated and compressed? As temperature and pressure approach the critical point (CP), illustrated in Fig. 3, the phase boundary between gas and liquid begins to disappear, resulting in a homogeneous state referred to
solid CO2(dry ice)
liqui
d C
O2
(sto
rage
)
-100 Temperature T (°C)
Pre
ssur
e P
(bar
)
104
103
102
101
0
100
0 100 200 300
2(s
tora
ge)) supercritical CO2
(mobile phase)
CP
gaseous CO2(waste)
31 °C73 bar
-57 °C5 bar
TP
GC
400
SFC
UHPSFC
solid H2O(ice)
104
103
102
101
0
100
Temperature T (°C)
liquid H2O(water)
CP
gaseous H2O(atmospheric water)
374 °C221 bar
0 °C0 bar
TP
HPLC
UHPLC
Pre
ssur
e P
(bar
)
-100 0 100 200 300 400
Fig. 3 Pressure–temperature phase diagrams showing the physi-cal states of CO2 (left) and H2O (right). Carbon dioxide sublimates at ambient pressure below the triple point (TP), leading to its use as cooling agent (dry ice). Although there have been reports of CO2 use in gas chromatography (GC), it is better known as the primary mobile-phase constituent in supercritical (SFC) and ultrahigh-per-formance supercritical fluid chromatography (UHPSFC), due to its
comparatively low critical point (CP). Higher temperatures and pres-sures are required to reach supercriticality of H2O, which is there-fore used more often in (ultra-)high-performance chromatography (HPLC/UHPLC). Note the different melting lines (boundary between white and blue) for CO2 (positive slope) and H2O (negative slope) synonymous with the anomalous expansion of water as temperature decreases
45
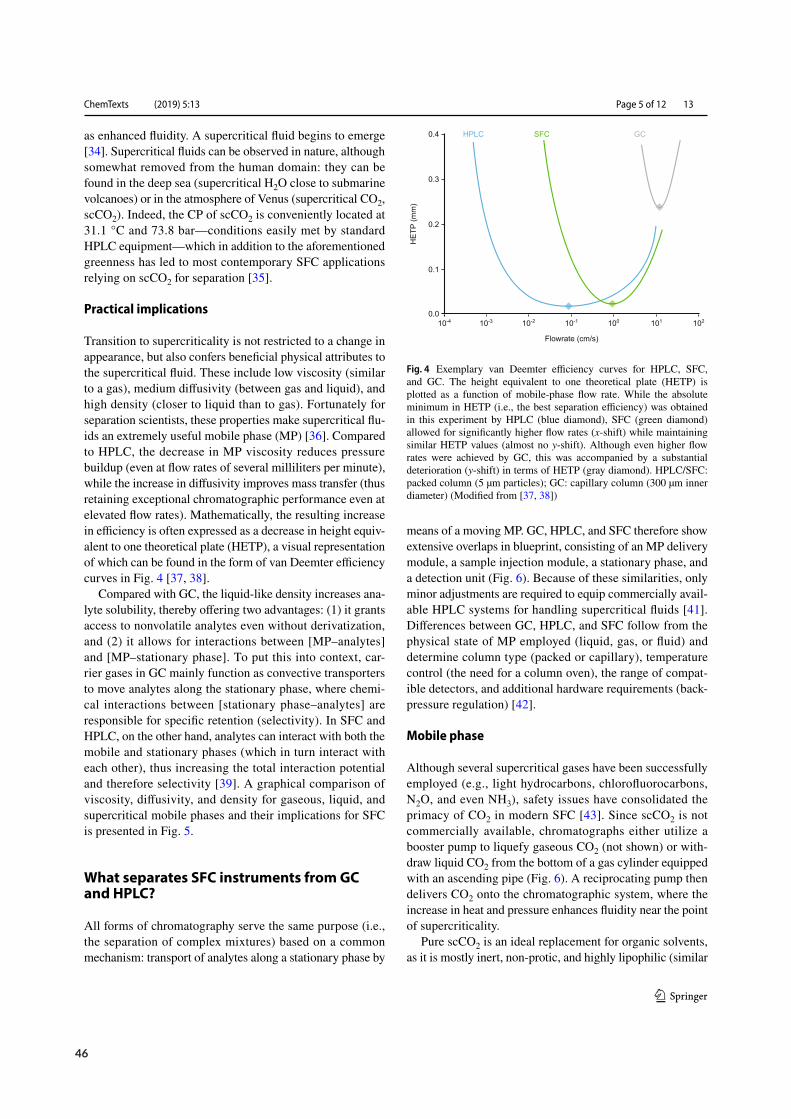
ChemTexts (2019) 5:13
1 3
Page 5 of 12 13
as enhanced fluidity. A supercritical fluid begins to emerge [34]. Supercritical fluids can be observed in nature, although somewhat removed from the human domain: they can be found in the deep sea (supercritical H2O close to submarine volcanoes) or in the atmosphere of Venus (supercritical CO2, scCO2). Indeed, the CP of scCO2 is conveniently located at 31.1 °C and 73.8 bar—conditions easily met by standard HPLC equipment—which in addition to the aforementioned greenness has led to most contemporary SFC applications relying on scCO2 for separation [35].
Practical implications
Transition to supercriticality is not restricted to a change in appearance, but also confers beneficial physical attributes to the supercritical fluid. These include low viscosity (similar to a gas), medium diffusivity (between gas and liquid), and high density (closer to liquid than to gas). Fortunately for separation scientists, these properties make supercritical flu-ids an extremely useful mobile phase (MP) [36]. Compared to HPLC, the decrease in MP viscosity reduces pressure buildup (even at flow rates of several milliliters per minute), while the increase in diffusivity improves mass transfer (thus retaining exceptional chromatographic performance even at elevated flow rates). Mathematically, the resulting increase in efficiency is often expressed as a decrease in height equiv-alent to one theoretical plate (HETP), a visual representation of which can be found in the form of van Deemter efficiency curves in Fig. 4 [37, 38].
Compared with GC, the liquid-like density increases ana-lyte solubility, thereby offering two advantages: (1) it grants access to nonvolatile analytes even without derivatization, and (2) it allows for interactions between [MP–analytes] and [MP–stationary phase]. To put this into context, car-rier gases in GC mainly function as convective transporters to move analytes along the stationary phase, where chemi-cal interactions between [stationary phase–analytes] are responsible for specific retention (selectivity). In SFC and HPLC, on the other hand, analytes can interact with both the mobile and stationary phases (which in turn interact with each other), thus increasing the total interaction potential and therefore selectivity [39]. A graphical comparison of viscosity, diffusivity, and density for gaseous, liquid, and supercritical mobile phases and their implications for SFC is presented in Fig. 5.
What separates SFC instruments from GC and HPLC?
All forms of chromatography serve the same purpose (i.e., the separation of complex mixtures) based on a common mechanism: transport of analytes along a stationary phase by
means of a moving MP. GC, HPLC, and SFC therefore show extensive overlaps in blueprint, consisting of an MP delivery module, a sample injection module, a stationary phase, and a detection unit (Fig. 6). Because of these similarities, only minor adjustments are required to equip commercially avail-able HPLC systems for handling supercritical fluids [41]. Differences between GC, HPLC, and SFC follow from the physical state of MP employed (liquid, gas, or fluid) and determine column type (packed or capillary), temperature control (the need for a column oven), the range of compat-ible detectors, and additional hardware requirements (back-pressure regulation) [42].
Mobile phase
Although several supercritical gases have been successfully employed (e.g., light hydrocarbons, chlorofluorocarbons, N2O, and even NH3), safety issues have consolidated the primacy of CO2 in modern SFC [43]. Since scCO2 is not commercially available, chromatographs either utilize a booster pump to liquefy gaseous CO2 (not shown) or with-draw liquid CO2 from the bottom of a gas cylinder equipped with an ascending pipe (Fig. 6). A reciprocating pump then delivers CO2 onto the chromatographic system, where the increase in heat and pressure enhances fluidity near the point of supercriticality.
Pure scCO2 is an ideal replacement for organic solvents, as it is mostly inert, non-protic, and highly lipophilic (similar
Fig. 4 Exemplary van Deemter efficiency curves for HPLC, SFC, and GC. The height equivalent to one theoretical plate (HETP) is plotted as a function of mobile-phase flow rate. While the absolute minimum in HETP (i.e., the best separation efficiency) was obtained in this experiment by HPLC (blue diamond), SFC (green diamond) allowed for significantly higher flow rates (x-shift) while maintaining similar HETP values (almost no y-shift). Although even higher flow rates were achieved by GC, this was accompanied by a substantial deterioration (y-shift) in terms of HETP (gray diamond). HPLC/SFC: packed column (5 µm particles); GC: capillary column (300 µm inner diameter) (Modified from [37, 38])
46
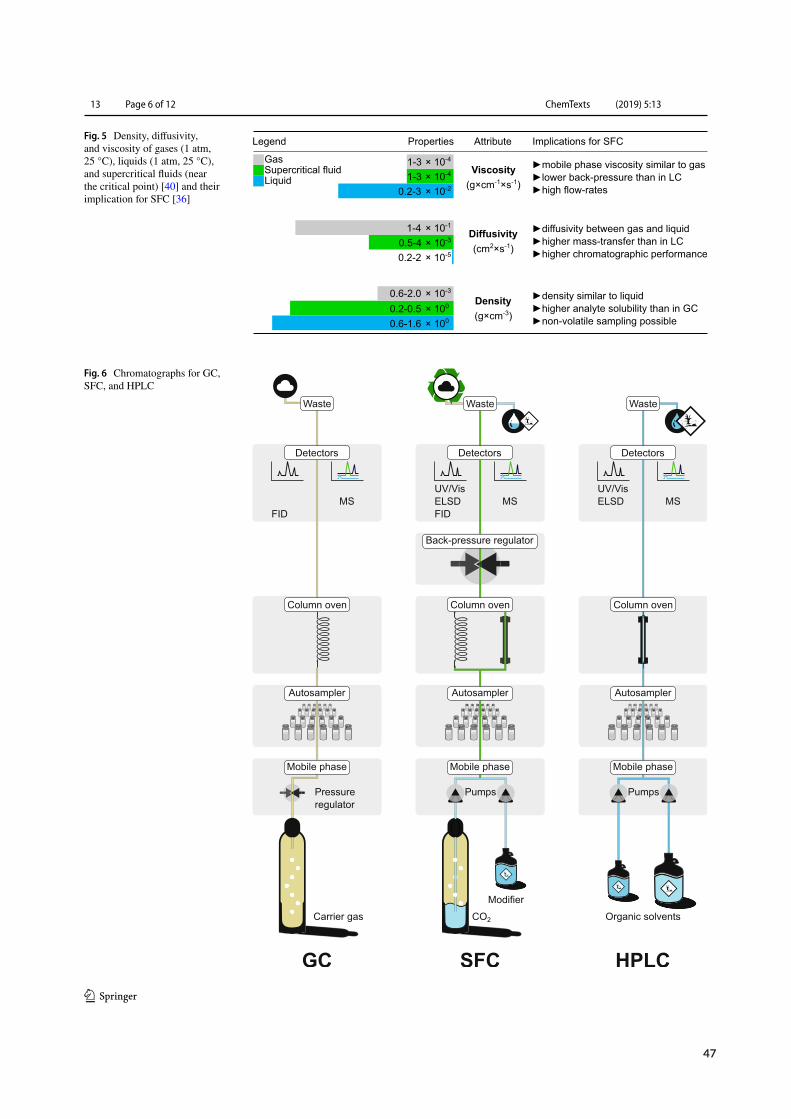
ChemTexts (2019) 5:13
1 3
13 Page 6 of 12
Fig. 5 Density, diffusivity, and viscosity of gases (1 atm, 25 °C), liquids (1 atm, 25 °C), and supercritical fluids (near the critical point) [40] and their implication for SFC [36]
GasSupercritical fluidLiquid
Legend
× 100
× 10-3
× 10-4
× 100
× 10-5
× 10-2
× 10-3
× 10-1
× 10-4
0.2-0.5
0.5-4
1-3
0.6-1.6
0.2-2
0.2-3
0.6-2.0
1-4
1-3
Properties
Density(g×cm-3)
Diffusivity(cm2×s-1)
Viscosity(g×cm-1×s-1)
Attribute
►mobile phase viscosity similar to gas►lower back-pressure than in LC►high flow-rates
►diffusivity between gas and liquid►higher mass-transfer than in LC►higher chromatographic performance
►density similar to liquid►higher analyte solubility than in GC►non-volatile sampling possible
Implications for SFC
Fig. 6 Chromatographs for GC, SFC, and HPLC
47
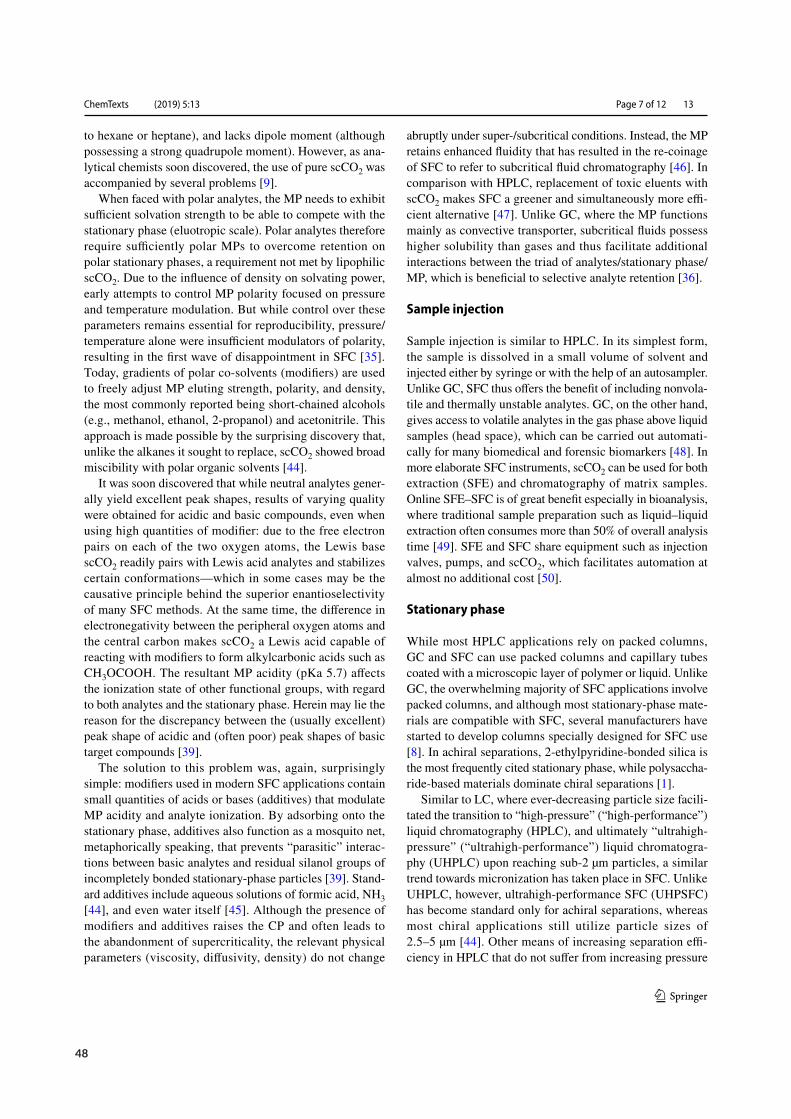
ChemTexts (2019) 5:13
1 3
Page 7 of 12 13
to hexane or heptane), and lacks dipole moment (although possessing a strong quadrupole moment). However, as ana-lytical chemists soon discovered, the use of pure scCO2 was accompanied by several problems [9].
When faced with polar analytes, the MP needs to exhibit sufficient solvation strength to be able to compete with the stationary phase (eluotropic scale). Polar analytes therefore require sufficiently polar MPs to overcome retention on polar stationary phases, a requirement not met by lipophilic scCO2. Due to the influence of density on solvating power, early attempts to control MP polarity focused on pressure and temperature modulation. But while control over these parameters remains essential for reproducibility, pressure/temperature alone were insufficient modulators of polarity, resulting in the first wave of disappointment in SFC [35]. Today, gradients of polar co-solvents (modifiers) are used to freely adjust MP eluting strength, polarity, and density, the most commonly reported being short-chained alcohols (e.g., methanol, ethanol, 2-propanol) and acetonitrile. This approach is made possible by the surprising discovery that, unlike the alkanes it sought to replace, scCO2 showed broad miscibility with polar organic solvents [44].
It was soon discovered that while neutral analytes gener-ally yield excellent peak shapes, results of varying quality were obtained for acidic and basic compounds, even when using high quantities of modifier: due to the free electron pairs on each of the two oxygen atoms, the Lewis base scCO2 readily pairs with Lewis acid analytes and stabilizes certain conformations—which in some cases may be the causative principle behind the superior enantioselectivity of many SFC methods. At the same time, the difference in electronegativity between the peripheral oxygen atoms and the central carbon makes scCO2 a Lewis acid capable of reacting with modifiers to form alkylcarbonic acids such as CH3OCOOH. The resultant MP acidity (pKa 5.7) affects the ionization state of other functional groups, with regard to both analytes and the stationary phase. Herein may lie the reason for the discrepancy between the (usually excellent) peak shape of acidic and (often poor) peak shapes of basic target compounds [39].
The solution to this problem was, again, surprisingly simple: modifiers used in modern SFC applications contain small quantities of acids or bases (additives) that modulate MP acidity and analyte ionization. By adsorbing onto the stationary phase, additives also function as a mosquito net, metaphorically speaking, that prevents “parasitic” interac-tions between basic analytes and residual silanol groups of incompletely bonded stationary-phase particles [39]. Stand-ard additives include aqueous solutions of formic acid, NH3 [44], and even water itself [45]. Although the presence of modifiers and additives raises the CP and often leads to the abandonment of supercriticality, the relevant physical parameters (viscosity, diffusivity, density) do not change
abruptly under super-/subcritical conditions. Instead, the MP retains enhanced fluidity that has resulted in the re-coinage of SFC to refer to subcritical fluid chromatography [46]. In comparison with HPLC, replacement of toxic eluents with scCO2 makes SFC a greener and simultaneously more effi-cient alternative [47]. Unlike GC, where the MP functions mainly as convective transporter, subcritical fluids possess higher solubility than gases and thus facilitate additional interactions between the triad of analytes/stationary phase/MP, which is beneficial to selective analyte retention [36].
Sample injection
Sample injection is similar to HPLC. In its simplest form, the sample is dissolved in a small volume of solvent and injected either by syringe or with the help of an autosampler. Unlike GC, SFC thus offers the benefit of including nonvola-tile and thermally unstable analytes. GC, on the other hand, gives access to volatile analytes in the gas phase above liquid samples (head space), which can be carried out automati-cally for many biomedical and forensic biomarkers [48]. In more elaborate SFC instruments, scCO2 can be used for both extraction (SFE) and chromatography of matrix samples. Online SFE–SFC is of great benefit especially in bioanalysis, where traditional sample preparation such as liquid–liquid extraction often consumes more than 50% of overall analysis time [49]. SFE and SFC share equipment such as injection valves, pumps, and scCO2, which facilitates automation at almost no additional cost [50].
Stationary phase
While most HPLC applications rely on packed columns, GC and SFC can use packed columns and capillary tubes coated with a microscopic layer of polymer or liquid. Unlike GC, the overwhelming majority of SFC applications involve packed columns, and although most stationary-phase mate-rials are compatible with SFC, several manufacturers have started to develop columns specially designed for SFC use [8]. In achiral separations, 2-ethylpyridine-bonded silica is the most frequently cited stationary phase, while polysaccha-ride-based materials dominate chiral separations [1].
Similar to LC, where ever-decreasing particle size facili-tated the transition to “high-pressure” (“high-performance”) liquid chromatography (HPLC), and ultimately “ultrahigh-pressure” (“ultrahigh-performance”) liquid chromatogra-phy (UHPLC) upon reaching sub-2 µm particles, a similar trend towards micronization has taken place in SFC. Unlike UHPLC, however, ultrahigh-performance SFC (UHPSFC) has become standard only for achiral separations, whereas most chiral applications still utilize particle sizes of 2.5–5 µm [44]. Other means of increasing separation effi-ciency in HPLC that do not suffer from increasing pressure
48
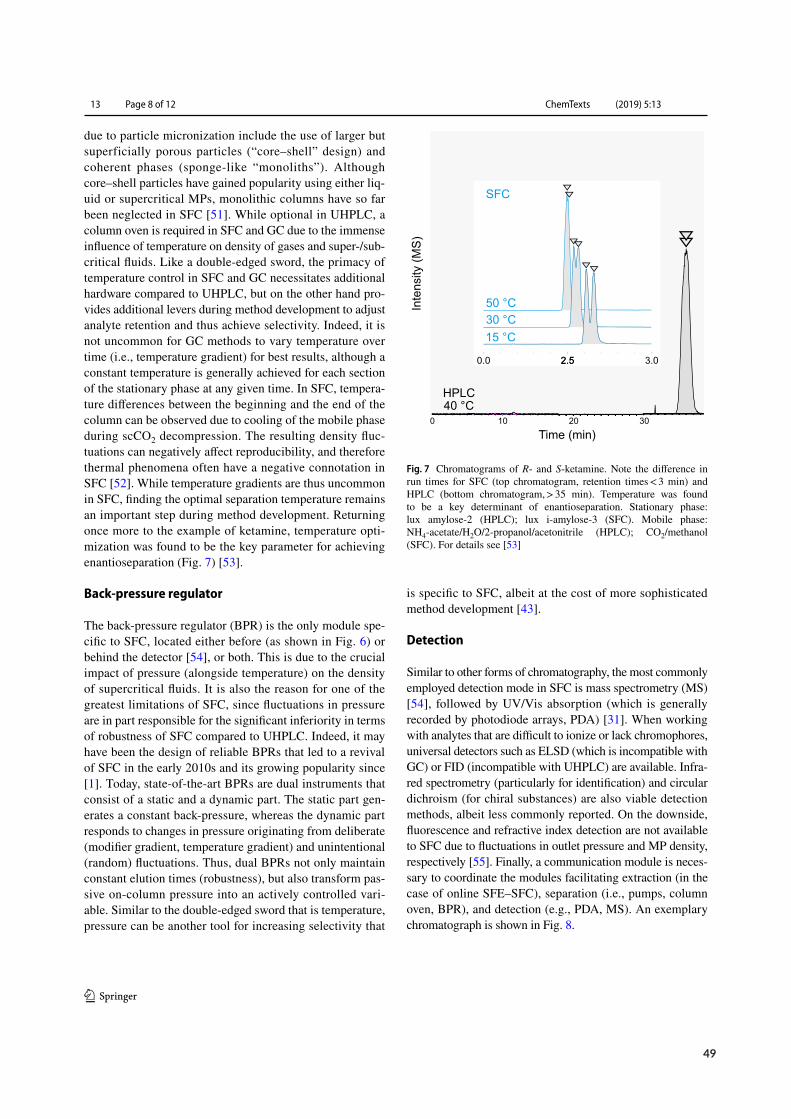
ChemTexts (2019) 5:13
1 3
13 Page 8 of 12
due to particle micronization include the use of larger but superficially porous particles (“core–shell” design) and coherent phases (sponge-like “monoliths”). Although core–shell particles have gained popularity using either liq-uid or supercritical MPs, monolithic columns have so far been neglected in SFC [51]. While optional in UHPLC, a column oven is required in SFC and GC due to the immense influence of temperature on density of gases and super-/sub-critical fluids. Like a double-edged sword, the primacy of temperature control in SFC and GC necessitates additional hardware compared to UHPLC, but on the other hand pro-vides additional levers during method development to adjust analyte retention and thus achieve selectivity. Indeed, it is not uncommon for GC methods to vary temperature over time (i.e., temperature gradient) for best results, although a constant temperature is generally achieved for each section of the stationary phase at any given time. In SFC, tempera-ture differences between the beginning and the end of the column can be observed due to cooling of the mobile phase during scCO2 decompression. The resulting density fluc-tuations can negatively affect reproducibility, and therefore thermal phenomena often have a negative connotation in SFC [52]. While temperature gradients are thus uncommon in SFC, finding the optimal separation temperature remains an important step during method development. Returning once more to the example of ketamine, temperature opti-mization was found to be the key parameter for achieving enantioseparation (Fig. 7) [53].
Back‑pressure regulator
The back-pressure regulator (BPR) is the only module spe-cific to SFC, located either before (as shown in Fig. 6) or behind the detector [54], or both. This is due to the crucial impact of pressure (alongside temperature) on the density of supercritical fluids. It is also the reason for one of the greatest limitations of SFC, since fluctuations in pressure are in part responsible for the significant inferiority in terms of robustness of SFC compared to UHPLC. Indeed, it may have been the design of reliable BPRs that led to a revival of SFC in the early 2010s and its growing popularity since [1]. Today, state-of-the-art BPRs are dual instruments that consist of a static and a dynamic part. The static part gen-erates a constant back-pressure, whereas the dynamic part responds to changes in pressure originating from deliberate (modifier gradient, temperature gradient) and unintentional (random) fluctuations. Thus, dual BPRs not only maintain constant elution times (robustness), but also transform pas-sive on-column pressure into an actively controlled vari-able. Similar to the double-edged sword that is temperature, pressure can be another tool for increasing selectivity that
is specific to SFC, albeit at the cost of more sophisticated method development [43].
Detection
Similar to other forms of chromatography, the most commonly employed detection mode in SFC is mass spectrometry (MS) [54], followed by UV/Vis absorption (which is generally recorded by photodiode arrays, PDA) [31]. When working with analytes that are difficult to ionize or lack chromophores, universal detectors such as ELSD (which is incompatible with GC) or FID (incompatible with UHPLC) are available. Infra-red spectrometry (particularly for identification) and circular dichroism (for chiral substances) are also viable detection methods, albeit less commonly reported. On the downside, fluorescence and refractive index detection are not available to SFC due to fluctuations in outlet pressure and MP density, respectively [55]. Finally, a communication module is neces-sary to coordinate the modules facilitating extraction (in the case of online SFE–SFC), separation (i.e., pumps, column oven, BPR), and detection (e.g., PDA, MS). An exemplary chromatograph is shown in Fig. 8.
Inte
nsity
(MS
)0 10 20 30
50 °C30 °C15 °C
3.0
40 °CHPLC
SFC
Time (min)
Fig. 7 Chromatograms of R- and S-ketamine. Note the difference in run times for SFC (top chromatogram, retention times < 3 min) and HPLC (bottom chromatogram, > 35 min). Temperature was found to be a key determinant of enantioseparation. Stationary phase: lux amylose-2 (HPLC); lux i-amylose-3 (SFC). Mobile phase: NH4-acetate/H2O/2-propanol/acetonitrile (HPLC); CO2/methanol (SFC). For details see [53]
49
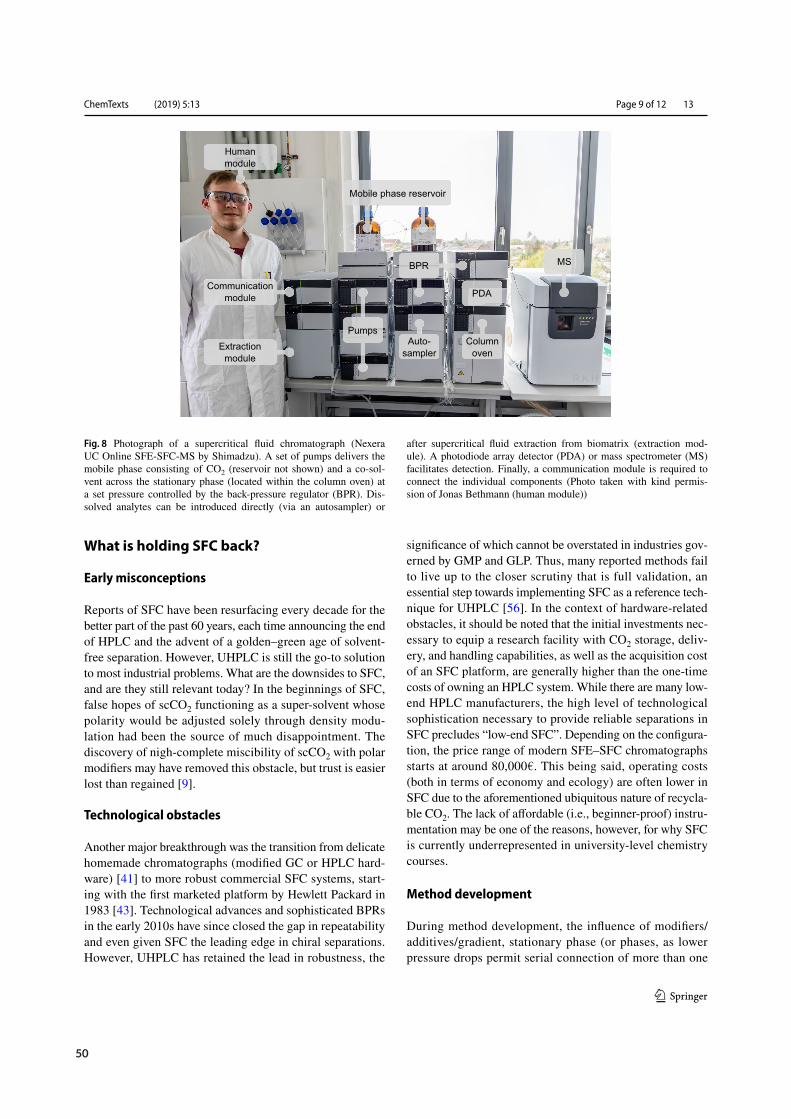
ChemTexts (2019) 5:13
1 3
Page 9 of 12 13
What is holding SFC back?
Early misconceptions
Reports of SFC have been resurfacing every decade for the better part of the past 60 years, each time announcing the end of HPLC and the advent of a golden–green age of solvent-free separation. However, UHPLC is still the go-to solution to most industrial problems. What are the downsides to SFC, and are they still relevant today? In the beginnings of SFC, false hopes of scCO2 functioning as a super-solvent whose polarity would be adjusted solely through density modu-lation had been the source of much disappointment. The discovery of nigh-complete miscibility of scCO2 with polar modifiers may have removed this obstacle, but trust is easier lost than regained [9].
Technological obstacles
Another major breakthrough was the transition from delicate homemade chromatographs (modified GC or HPLC hard-ware) [41] to more robust commercial SFC systems, start-ing with the first marketed platform by Hewlett Packard in 1983 [43]. Technological advances and sophisticated BPRs in the early 2010s have since closed the gap in repeatability and even given SFC the leading edge in chiral separations. However, UHPLC has retained the lead in robustness, the
significance of which cannot be overstated in industries gov-erned by GMP and GLP. Thus, many reported methods fail to live up to the closer scrutiny that is full validation, an essential step towards implementing SFC as a reference tech-nique for UHPLC [56]. In the context of hardware-related obstacles, it should be noted that the initial investments nec-essary to equip a research facility with CO2 storage, deliv-ery, and handling capabilities, as well as the acquisition cost of an SFC platform, are generally higher than the one-time costs of owning an HPLC system. While there are many low-end HPLC manufacturers, the high level of technological sophistication necessary to provide reliable separations in SFC precludes “low-end SFC”. Depending on the configura-tion, the price range of modern SFE–SFC chromatographs starts at around 80,000€. This being said, operating costs (both in terms of economy and ecology) are often lower in SFC due to the aforementioned ubiquitous nature of recycla-ble CO2. The lack of affordable (i.e., beginner-proof) instru-mentation may be one of the reasons, however, for why SFC is currently underrepresented in university-level chemistry courses.
Method development
During method development, the influence of modifiers/additives/gradient, stationary phase (or phases, as lower pressure drops permit serial connection of more than one
Extractionmodule
Communicationmodule
Mobile phase reservoir
Humanmodule
MS
Columnoven
Auto-sampler
BPR
Pumps
PDA
R.K.H
Fig. 8 Photograph of a supercritical fluid chromatograph (Nexera UC Online SFE-SFC-MS by Shimadzu). A set of pumps delivers the mobile phase consisting of CO2 (reservoir not shown) and a co-sol-vent across the stationary phase (located within the column oven) at a set pressure controlled by the back-pressure regulator (BPR). Dis-solved analytes can be introduced directly (via an autosampler) or
after supercritical fluid extraction from biomatrix (extraction mod-ule). A photodiode array detector (PDA) or mass spectrometer (MS) facilitates detection. Finally, a communication module is required to connect the individual components (Photo taken with kind permis-sion of Jonas Bethmann (human module))
50
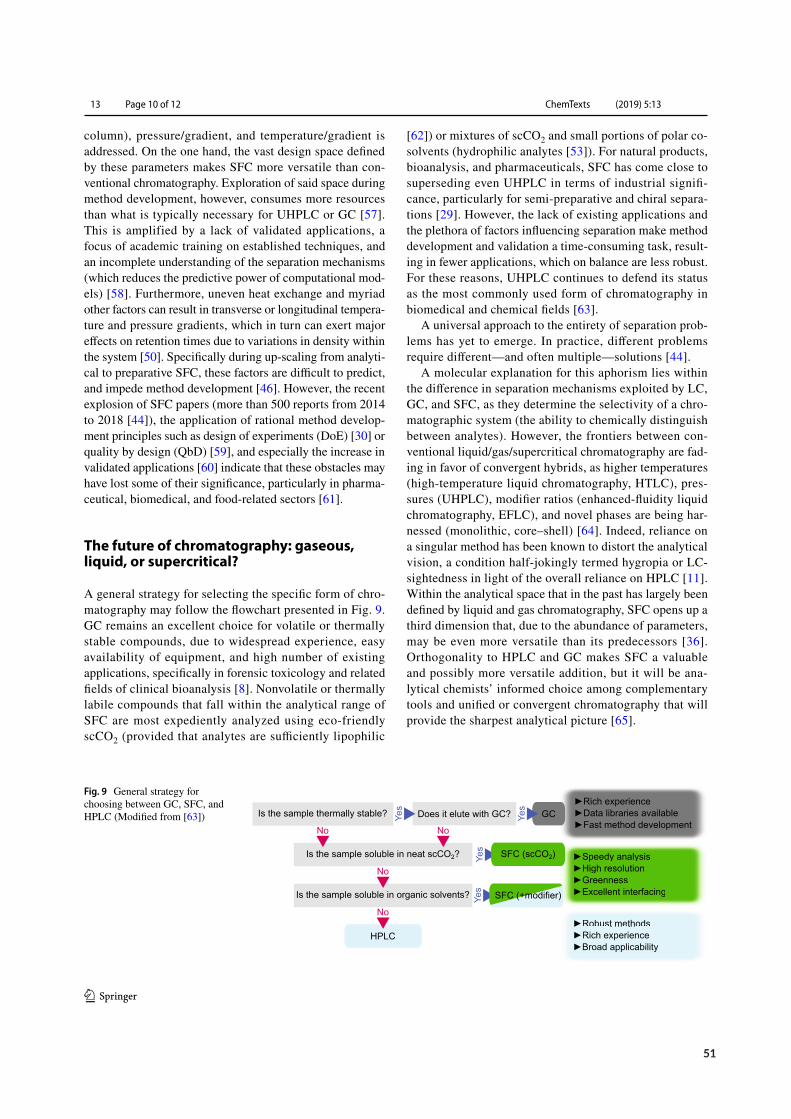
ChemTexts (2019) 5:13
1 3
13 Page 10 of 12
column), pressure/gradient, and temperature/gradient is addressed. On the one hand, the vast design space defined by these parameters makes SFC more versatile than con-ventional chromatography. Exploration of said space during method development, however, consumes more resources than what is typically necessary for UHPLC or GC [57]. This is amplified by a lack of validated applications, a focus of academic training on established techniques, and an incomplete understanding of the separation mechanisms (which reduces the predictive power of computational mod-els) [58]. Furthermore, uneven heat exchange and myriad other factors can result in transverse or longitudinal tempera-ture and pressure gradients, which in turn can exert major effects on retention times due to variations in density within the system [50]. Specifically during up-scaling from analyti-cal to preparative SFC, these factors are difficult to predict, and impede method development [46]. However, the recent explosion of SFC papers (more than 500 reports from 2014 to 2018 [44]), the application of rational method develop-ment principles such as design of experiments (DoE) [30] or quality by design (QbD) [59], and especially the increase in validated applications [60] indicate that these obstacles may have lost some of their significance, particularly in pharma-ceutical, biomedical, and food-related sectors [61].
The future of chromatography: gaseous, liquid, or supercritical?
A general strategy for selecting the specific form of chro-matography may follow the flowchart presented in Fig. 9. GC remains an excellent choice for volatile or thermally stable compounds, due to widespread experience, easy availability of equipment, and high number of existing applications, specifically in forensic toxicology and related fields of clinical bioanalysis [8]. Nonvolatile or thermally labile compounds that fall within the analytical range of SFC are most expediently analyzed using eco-friendly scCO2 (provided that analytes are sufficiently lipophilic
[62]) or mixtures of scCO2 and small portions of polar co-solvents (hydrophilic analytes [53]). For natural products, bioanalysis, and pharmaceuticals, SFC has come close to superseding even UHPLC in terms of industrial signifi-cance, particularly for semi-preparative and chiral separa-tions [29]. However, the lack of existing applications and the plethora of factors influencing separation make method development and validation a time-consuming task, result-ing in fewer applications, which on balance are less robust. For these reasons, UHPLC continues to defend its status as the most commonly used form of chromatography in biomedical and chemical fields [63].
A universal approach to the entirety of separation prob-lems has yet to emerge. In practice, different problems require different—and often multiple—solutions [44].
A molecular explanation for this aphorism lies within the difference in separation mechanisms exploited by LC, GC, and SFC, as they determine the selectivity of a chro-matographic system (the ability to chemically distinguish between analytes). However, the frontiers between con-ventional liquid/gas/supercritical chromatography are fad-ing in favor of convergent hybrids, as higher temperatures (high-temperature liquid chromatography, HTLC), pres-sures (UHPLC), modifier ratios (enhanced-fluidity liquid chromatography, EFLC), and novel phases are being har-nessed (monolithic, core–shell) [64]. Indeed, reliance on a singular method has been known to distort the analytical vision, a condition half-jokingly termed hygropia or LC-sightedness in light of the overall reliance on HPLC [11]. Within the analytical space that in the past has largely been defined by liquid and gas chromatography, SFC opens up a third dimension that, due to the abundance of parameters, may be even more versatile than its predecessors [36]. Orthogonality to HPLC and GC makes SFC a valuable and possibly more versatile addition, but it will be ana-lytical chemists’ informed choice among complementary tools and unified or convergent chromatography that will provide the sharpest analytical picture [65].
Fig. 9 General strategy for choosing between GC, SFC, and HPLC (Modified from [63])
51
ChemTexts (2019) 5:13
1 3
Page 11 of 12 13
References
1. Pilařová V, Plachká K, Khalikova MA et al (2019) Recent develop-ments in supercritical fluid chromatography–mass spectrometry: is it a viable option for analysis of complex samples? Trends Anal Chem 112:212–225. https ://doi.org/10.1016/j.trac.2018.12.023
2. Klesper E, Corwin AH, Turner DA (1962) High pressure gas chro-matography above critical temperatures. J Org Chem 27:700–701
3. Institut für medizinische und pharmazeutische Prüfungsfragen (2018) Question 79. In: Erster Abschnitt der pharmazeutischen Prüfung. Grundlagen der pharmazeutischen Analytik, IMPP, Mainz
4. Fassauer GM, Hofstetter R, Hasan M et al (2017) Ketamine metabolites with antidepressant effects: fast, economical, and eco-friendly enantioselective separation based on supercritical-fluid chromatography (SFC) and single quadrupole MS detection. J Pharm Biomed Anal 146:410–419. https ://doi.org/10.1016/j.jpba.2017.09.007
5. Hasan M, Hofstetter R, Fassauer GM et al (2017) Quantitative chiral and achiral determination of ketamine and its metabo-lites by LC-MS/MS in human serum, urine and fecal samples. J Pharm Biomed Anal 139:87–97. https ://doi.org/10.1016/j.jpba.2017.02.035
6. Desfontaine V, Nováková L, Guillarme D (2015) SFC-MS versus RPLC-MS for drug analysis in biological samples. Bioanalysis 7:1193–1195. https ://doi.org/10.4155/bio.15.41
7. Hoguet V, Charton J, Hecquet PE et al (2018) Supercritical fluid chromatography versus high performance liquid chromatography for enantiomeric and diastereoisomeric separations on coated polysaccharides-based stationary phases: application to dihydro-pyridone derivatives. J Chromatogr A 1549:39–50. https ://doi.org/10.1016/j.chrom a.2018.03.035
8. Kočová Vlčková H, Pilařová V, Svobodová P et al (2018) Current state of bioanalytical chromatography in clinical analysis. Analyst 143:1305–1325. https ://doi.org/10.1039/c7an0 1807j
9. Tarafder A (2016) Metamorphosis of supercritical fluid chroma-tography to SFC: an overview. Trends Anal Chem 81:3–10. https ://doi.org/10.1016/j.trac.2016.01.002
10. Sen A, Knappy C, Lewis MR et al (2016) Analysis of polar uri-nary metabolites for metabolic phenotyping using supercritical fluid chromatography and mass spectrometry. J Chromatogr A 1449:141–155. https ://doi.org/10.1016/j.chrom a.2016.04.040
11. Hofstetter RK, Hasan M, Fassauer GM et al (2019) Simultaneous quantification of acidic and basic flupirtine metabolites by super-critical fluid chromatography according to European Medicines Agency validation. J Chromatogr A. https ://doi.org/10.1016/j.chrom a.2019.04.067 (In press)
12. Bäurer S, Guo W, Polnick S, Lämmerhofer M (2019) Simulta-neous separation of water- and fat-soluble vitamins by selective comprehensive HILIC × RPLC (high-resolution sampling) and active solvent modulation. Chromatographia 82:167–180. https ://doi.org/10.1007/s1033 7-018-3615-0
13. Midttun Ø, McCann A, Aarseth O et al (2016) Combined meas-urement of 6 fat-soluble vitamins and 26 water-soluble functional vitamin markers and amino acids in 50 μL of serum or plasma by high-throughput mass spectrometry. Anal Chem 88:10427–10436. https ://doi.org/10.1021/acs.analc hem.6b023 25
14. Taguchi K, Fukusaki E, Bamba T (2014) Simultaneous analysis for water- and fat-soluble vitamins by a novel single chromatog-raphy technique unifying supercritical fluid chromatography and liquid chromatography. J Chromatogr A 1362:270–277. https ://doi.org/10.1016/j.chrom a.2014.08.003
15. Armenta S, de la Guardia M (2016) Green chromatography for the analysis of foods of animal origin. Trends Anal Chem 80:517–530. https ://doi.org/10.1016/j.trac.2015.06.012
16. Sakai M, Hayakawa Y, Funada Y et al (2019) Development of a practical online supercritical fluid extraction–supercritical fluid chromatography/mass spectrometry system with an integrated split-flow method. J Chromatogr A. https ://doi.org/10.1016/j.chrom a.2019.01.044
17. Hofstetter R, Fassauer GM, Link A (2018) Supercritical fluid extraction (SFE) of ketamine metabolites from dried urine and on-line quantification by supercritical fluid chromatography and single mass detection (on-line SFE-SFC-MS). J Chromatogr B 1076:77–83. https ://doi.org/10.1016/j.jchro mb.2018.01.024
18. Yamada T, Bamba T (2017) Lipid profiling by supercritical fluid chromatography/mass spectrometry. In: Wood P (ed) Lipidom-ics. Humana Press, New York, pp 109–131
19. Tyśkiewicz K, Dębczak A, Gieysztor R et al (2018) Determi-nation of fat- and water-soluble vitamins by supercritical fluid chromatography: a review. J Sep Sci 41:336–350. https ://doi.org/10.1002/jssc.20170 0598
20. Matsubara A, Harada K, Hirata K et al (2012) High-accuracy analysis system for the redox status of coenzyme Q10 by online supercritical fluid extraction–supercritical fluid chromatogra-phy/mass spectrometry. J Chromatogr A 1250:76–79. https ://doi.org/10.1016/J.CHROM A.2012.05.009
21. Thiébaut D (2018) Detection in SFC. In: Caudell T (ed) Prac-tical supercritical fluid chromatography and extraction. Rout-ledge, Amsterdam, pp 149–160
22. Peterson EA, Dillon B, Raheem I et al (2014) Sustainable chro-matography (an oxymoron?). Green Chem 16:4060–4075. https ://doi.org/10.1039/c4gc0 0615a
23. Yuan X, Kim EG, Sanders CA et al (2017) CO2-modified sol-vents for chromatographic separation. Green Chem 19:1757–1765. https ://doi.org/10.1039/c6gc0 3405e
24. Nowak T, Graffius GC, Liu Y et al (2016) GC-FID method for high-throughput analysis of residual solvents in pharmaceutical drugs and intermediates. Green Chem 18:3732–3739. https ://doi.org/10.1039/c6gc0 1210h
25. Sholl DS, Lively RP (2016) Seven chemical separations to change the world. Nature 532:435–437. https ://doi.org/10.1038/53243 5a
26. Hicks MB, Farrell W, Aurigemma C et al (2019) Making the move towards modernized greener separations: introduction of the ana-lytical method greenness score (AMGS) calculator. Green Chem 21:1816–1826. https ://doi.org/10.1039/C8GC0 3875A
27. Shen Y, Chen B, Van Beek TA (2015) Alternative solvents can make preparative liquid chromatography greener. Green Chem 17:4073–4081. https ://doi.org/10.1039/c5gc0 0887e
28. Galyan K, Reilly J (2018) Green chemistry approaches for the purification of pharmaceuticals. Curr Opin Green Sustain Chem 11:76–80. https ://doi.org/10.1016/J.COGSC .2018.04.018
29. Harps LC, Joseph JF, Parr MK (2019) SFC for chiral separations in bioanalysis. J Pharm Biomed Anal 162:47–59. https ://doi.org/10.1016/j.jpba.2018.08.061
30. Noireau A, Lemasson E, Mauge F et al (2019) Purification of drug degradation products supported by analytical and prepara-tive supercritical fluid chromatography. J Pharm Biomed Anal 170:40–47. https ://doi.org/10.1016/j.jpba.2019.03.033
31. Pirrone GF, Mathew RM, Makarov AA et al (2018) Supercriti-cal fluid chromatography-photodiode array detection-electrospray ionization mass spectrometry as a framework for impurity fate mapping in the development and manufacture of drug substances. J Chromatogr B 1080:42–49. https ://doi.org/10.1016/j.jchro mb.2018.02.006
32. Leharne S (2019) Transfer phenomena and interactions of non-aqueous phase liquids in soil and groundwater. ChemTexts 5:1–21. https ://doi.org/10.1007/s4082 8-019-0079-2
33. Dang TA, Lunk H-J (2018) Freeze drying: a novel method for preparation of solid analytical tungsten and molybdenum
52
ChemTexts (2019) 5:13
1 3
13 Page 12 of 12
standards. ChemTexts 4:1–12. https ://doi.org/10.1007/s4082 8-018-0066-z
34. Bolmatov D, Zhernenkov M, Zav’yalov D et al (2015) The Frenkel line: a direct experimental evidence for the new thermodynamic boundary. Sci Rep 5:1–10. https ://doi.org/10.1038/srep1 5850
35. Guiochon G, Tarafder A (2011) Fundamental challenges and opportu-nities for preparative supercritical fluid chromatography. J Chromatogr A 1218:1037–1114. https ://doi.org/10.1016/j.chrom a.2010.12.047
36. Desfontaine V, Guillarme D, Francotte E, Nováková L (2015) Supercritical fluid chromatography in pharmaceutical analysis. J Pharm Biomed Anal 113:56–71. https ://doi.org/10.1016/j.jpba.2015.03.007
37. Lee ML, Markides KE (1990) Analytical supercritical chromatog-raphy and extraction. In: 1st edn. Chromatography conferences, Provo, Utah
38. Tong D, Bartle KD, Clifford AA (1995) Principles and applica-tions of unified chromatography. J Chromatogr A 703:17–35. https ://doi.org/10.1016/0021-9673(94)01296 -Q
39. Lesellier E, West C (2015) The many faces of packed column supercritical fluid chromatography: a critical review. J Chromatogr A 1382:2–46. https ://doi.org/10.1016/j.chrom a.2014.12.083
40. Takishima S, Masuoka H (1989) Physical properties of sub-stances related to chemical engineering. Kagakukogaku bussei josu 11:31–60
41. Simpson RC, Gant JR, Brown PR (1986) Modification of con-ventional high-performance liquid chromatography equpment for use in carbon dioxide supercritical fluid chromatography. J Chromatogr A 371:109–119. https ://doi.org/10.1016/S0021 -9673(01)94698 -9
42. Berger TA (2017) Evolution of instrumentation for analytical scale supercritical fluid chromatography. In: Supercritical fluid chroma-tography. Elsevier, Amsterdam, pp 173–212
43. Nováková L, Grand-Guillaume Perrenoud A, Francois I et al (2014) Modern analytical supercritical fluid chromatography using columns packed with sub-2 μm particles: a tutorial. Anal Chim Acta 824:18–35. https ://doi.org/10.1016/j.aca.2014.03.034
44. West C (2018) Current trends in supercritical fluid chromatogra-phy. Anal Bioanal Chem 410:6441–6457. https ://doi.org/10.1007/s0021 6-018-1267-4
45. Liu J, Regalado EL, Mergelsberg I, Welch CJ (2013) Extending the range of supercritical fluid chromatography by use of water-rich modifiers. Org Biomol Chem 11:4925–4929. https ://doi.org/10.1039/c3ob4 1121d
46. Bennett R, Biba M, Liu J et al (2019) Enhanced fluidity liquid chromatography: a guide to scaling up from analytical to prepara-tive separations. J Chromatogr A. https ://doi.org/10.1016/j.chrom a.2019.02.017
47. DaSilva JO, Bennett R, Mann BF (2019) Doing more with less: evaluation of the use of high linear velocities in preparative supercritical fluid chromatography. J Chromatogr A. https ://doi.org/10.1016/J.CHROM A.2019.02.047
48. Mochalski P, Unterkofler K (2016) Quantification of selected volatile organic compounds in human urine by gas chromatog-raphy selective reagent ionization time of flight mass spectrom-etry (GC-SRI-TOF-MS) coupled with head-space solid-phase microextraction (HS-SPME). Analyst 141:4796–4803. https ://doi.org/10.1039/C6AN0 0825A
49. Sánchez-Camargo ADP, Parada-Alfonso F, Ibáñez E, Cifuentes A (2017) On-line coupling of supercritical fluid extraction and chromatographic techniques. J Sep Sci 40:213–227. https ://doi.org/10.1002/jssc.20160 1040
50. Hofstetter R, Fassauer GM, Link A (2018) The many (inter-)faces of supercritical fluid chromatography: the present and future prospects of online supercritical fluid extraction–supercritical fluid chromatography. Bioanalysis 10:1073–1076. https ://doi.org/10.4155/bio-2018-0100
51. Zajickova Z, Špánik I (2019) Applications of monolithic columns in gas chromatography and supercritical fluid chromatography. J Sep Sci. https ://doi.org/10.1002/jssc.20180 1071
52. Gritti F, Fogwill M, Gilar M, Jarrell JA (2016) Maximizing per-formance in supercritical fluid chromatography using low-den-sity mobile phases. J Chromatogr A 1468:217–227. https ://doi.org/10.1016/j.chrom a.2016.09.024
53. Hofstetter RK, Potlitz F, Schulig L et al (2019) Subcritical fluid chromatography at sub-ambient temperatures for the chiral reso-lution of ketamine metabolites with rapid-onset antidepressant effects. Molecules 24:1927. https ://doi.org/10.3390/molec ules2 41019 27
54. Guillarme D, Desfontaine V, Heinisch S, Veuthey JL (2018) What are the current solutions for interfacing supercritical fluid chroma-tography and mass spectrometry? J Chromatogr B 1083:160–170. https ://doi.org/10.1016/j.jchro mb.2018.03.010
55. Thiébaut D (2018) Detection in SFC. In: Caudell T (ed) Practi-cal supercritical fluid chromatography and extraction. Routledge, Amsterdam, pp 149–160
56. Dispas A, Jambo H, André S et al (2018) Supercritical fluid chromatography: a promising alternative to current bioanalyti-cal techniques. Bioanalysis 10:107–124. https ://doi.org/10.4155/bio-2017-0211
57. Dispas A, Lebrun P, Andri B et al (2014) Robust method opti-mization strategy-a useful tool for method transfer: the case of SFC. J Pharm Biomed Anal 88:519–524. https ://doi.org/10.1016/j.jpba.2013.09.030
58. Sykora D, Vozka J, Tesarova E (2016) Chromatographic methods enabling the characterization of stationary phases and retention prediction in high-performance liquid chromatography and super-critical fluid chromatography. J Sep Sci 39:115–131. https ://doi.org/10.1002/jssc.20150 1023
59. Dispas A, Avohou HT, Lebrun P et al (2018) ‘Quality by Design’ approach for the analysis of impurities in pharmaceutical drug products and drug substances. Trends Anal Chem 101:24–33. https ://doi.org/10.1016/j.trac.2017.10.028
60. Dispas A, Lebrun P, Hubert P (2017) Validation of supercritical fluid chromatography methods. In: Supercritical fluid chromatog-raphy: handbooks in separation science. Elsevier Inc., Amsterdam, pp 317–344
61. Liu L, Zhang Y, Zhou Y et al (2019) The application of super-critical fluid chromatography in food quality and food safety: an overview. Crit Rev Anal Chem. https ://doi.org/10.1080/10408 347.2019.15865 20
62. Hofstetter R, Elvers BJ, Potlitz F et al (2019) Crystal structure of 7,8,15,16,17-pentathiadispiro[5.2.59.36]heptadecane. Acta Crystallogr Sect E Crystallogr Commun 75:888–891. https ://doi.org/10.1107/S2056 98901 90071 38
63. Ashraf-Khorassani M, Combs M (2017) Method development in supercritical fluid chromatography. In: Supercritical fluid chroma-tography. Elsevier, Amsterdam, pp 127–152
64. Guillarme D, Veuthey J-L (2017) Theory and practice of UHPLC and UHPLC-MS. In: Advanced chromatography/mass spectrom-etry techniques. Academic Press and AOCS Press, London, pp 1–38
65. Desfontaine V, Nováková L, Ponzetto F et al (2016) Liquid chro-matography and supercritical fluid chromatography as alterna-tive techniques to gas chromatography for the rapid screening of anabolic agents in urine. J Chromatogr A 1451:145–155. https ://doi.org/10.1016/j.chrom a.2016.05.004
Publisher’s Note Springer Nature remains neutral with regard to jurisdictional claims in published maps and institutional affiliations.
53
Part 4 Publications
Paper II
Azologization and repurposing of a hetero‐stilbene‐based kinase inhibitor: towardsthe design of photoswitchable sirtuin inhibitors
Authors ChristophW. Grathwol, Nathalie Wössner, Sören Swyter, Adam C. Smith,Enrico Tapavicza, Robert K. Hofstetter, Anja Bodtke, Manfred Jung, and Andreas Link
Journal Beilstein J. Org. Chem. 15.1 (2019): 2170-2183.
Analytical content Stability and purity testing of small molecule drugs amenable to photo-inducedE-/Z-isomerization is challenging due to the dangers of stereochemical falsification during analysis.Here, consistent results by orthogonal chromatographic techniques (RPLC-HRMS and SFC-MS)confirmed the absence of analytical artifacts.
Contributions
ChristophW. Grathwol Conceptualization, investigation, visualization, writing (original draft)Nathalie Wössner InvestigationSören Swyter InvestigationAdamC. Smith Software, data curation, visualizationEnrico Tapavicza Software, data curation, visualizationRobert K. Hofstetter InvestigationAnja Bodtke InvestigationManfred Jung Resources, data curationAndreas Link Project administration, funding acquisition, supervision, writing (re-
view and editing)
Robert K. Hofstetter Andreas Link
(signature) (signature)
54
2170
Azologization and repurposing of a hetero-stilbene-basedkinase inhibitor: towards the design of photoswitchablesirtuin inhibitorsChristoph W. Grathwol1, Nathalie Wössner2, Sören Swyter2, Adam C. Smith3,Enrico Tapavicza3, Robert K. Hofstetter1, Anja Bodtke1, Manfred Jung2
and Andreas Link*1
Full Research Paper Open Access
Address:1Institute of Pharmacy, University of Greifswald,Friedrich-Ludwig-Jahn-Str. 17, 17489 Greifswald, Germany, 2Instituteof Pharmaceutical Sciences, University of Freiburg, Albertstr. 25,79104 Freiburg, Germany and 3Department of Chemistry andBiochemistry, California State University Long Beach, 1250 BellflowerBoulevard, Long Beach, CA, 90840 USA
Email:Andreas Link* - [email protected]
* Corresponding author
Keywords:azo compounds; epigenetics; photoswitch; sirtuins; stilbenes
Beilstein J. Org. Chem. 2019, 15, 2170–2183.doi:10.3762/bjoc.15.214
Received: 28 June 2019Accepted: 29 August 2019Published: 16 September 2019
This article is part of the thematic issue "Molecular switches".
Guest Editor: W. Szymanski
© 2019 Grathwol et al.; licensee Beilstein-Institut.License and terms: see end of document.
AbstractThe use of light as an external trigger to change ligand shape and as a result its bioactivity, allows the probing of pharmacological-ly relevant systems with spatiotemporal resolution. A hetero-stilbene lead resulting from the screening of a compound that wasoriginally designed as kinase inhibitor served as a starting point for the design of photoswitchable sirtuin inhibitors. Because theoriginal stilbenoid structure exerted unfavourable photochemical characteristics it was remodelled to its heteroarylic diazeno ana-logue. By this intramolecular azologization, the shape of the molecule was left unaltered, whereas the photoswitching ability wasimproved. As anticipated, the highly analogous compound showed similar activity in its thermodynamically stable stretched-out(E)-form. Irradiation of this isomer triggers isomerisation to the long-lived (Z)-configuration with a bent geometry causing aconsiderably shorter end‐to‐end distance. The resulting affinity shifts are intended to enable real‐time photomodulation of sirtuinsin vitro.
2170
IntroductionSirtuins are protein deacylases that cleave off not only acetyl,but also other acyl groups from the ε-amino group of lysines inhistones and many other substrate proteins. This class of lysinedeacetylases (KDACs) is distinguished from others by their de-pendence on the cosubstrate NAD+. In mammals, seven sirtuin
isoforms have been identified to date [1]. These can be groupedinto five classes (I, II, III, IV and V) according to their phyloge-netic relationship [2]. The isoforms Sirt1, Sirt2 and Sirt3 origi-nate from the same phylogenetic branch (class I), but differ intheir subcellular localization. Although Sirt1 and Sirt2 were
55
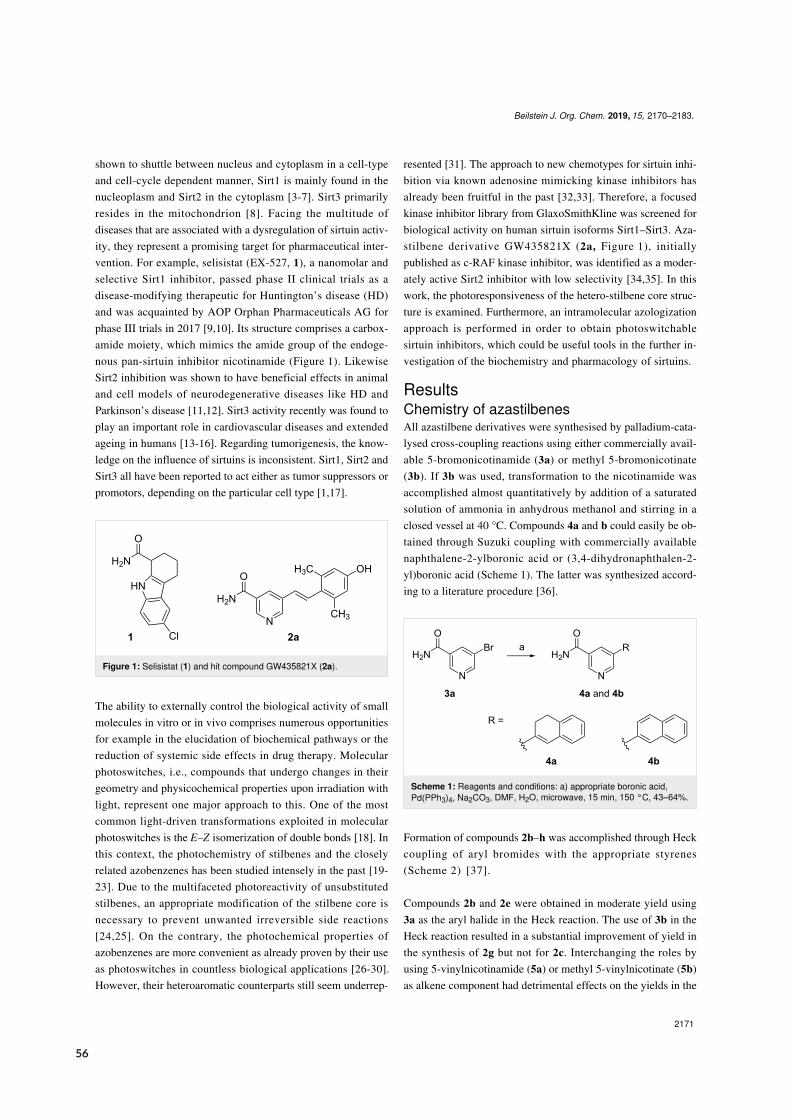
Beilstein J. Org. Chem. 2019, 15, 2170–2183.
2171
shown to shuttle between nucleus and cytoplasm in a cell-typeand cell-cycle dependent manner, Sirt1 is mainly found in thenucleoplasm and Sirt2 in the cytoplasm [3-7]. Sirt3 primarilyresides in the mitochondrion [8]. Facing the multitude ofdiseases that are associated with a dysregulation of sirtuin activ-ity, they represent a promising target for pharmaceutical inter-vention. For example, selisistat (EX-527, 1), a nanomolar andselective Sirt1 inhibitor, passed phase II clinical trials as adisease-modifying therapeutic for Huntington’s disease (HD)and was acquainted by AOP Orphan Pharmaceuticals AG forphase III trials in 2017 [9,10]. Its structure comprises a carbox-amide moiety, which mimics the amide group of the endoge-nous pan-sirtuin inhibitor nicotinamide (Figure 1). LikewiseSirt2 inhibition was shown to have beneficial effects in animaland cell models of neurodegenerative diseases like HD andParkinson’s disease [11,12]. Sirt3 activity recently was found toplay an important role in cardiovascular diseases and extendedageing in humans [13-16]. Regarding tumorigenesis, the know-ledge on the influence of sirtuins is inconsistent. Sirt1, Sirt2 andSirt3 all have been reported to act either as tumor suppressors orpromotors, depending on the particular cell type [1,17].
Figure 1: Selisistat (1) and hit compound GW435821X (2a).
The ability to externally control the biological activity of smallmolecules in vitro or in vivo comprises numerous opportunitiesfor example in the elucidation of biochemical pathways or thereduction of systemic side effects in drug therapy. Molecularphotoswitches, i.e., compounds that undergo changes in theirgeometry and physicochemical properties upon irradiation withlight, represent one major approach to this. One of the mostcommon light-driven transformations exploited in molecularphotoswitches is the E–Z isomerization of double bonds [18]. Inthis context, the photochemistry of stilbenes and the closelyrelated azobenzenes has been studied intensely in the past [19-23]. Due to the multifaceted photoreactivity of unsubstitutedstilbenes, an appropriate modification of the stilbene core isnecessary to prevent unwanted irreversible side reactions[24,25]. On the contrary, the photochemical properties ofazobenzenes are more convenient as already proven by their useas photoswitches in countless biological applications [26-30].However, their heteroaromatic counterparts still seem underrep-
resented [31]. The approach to new chemotypes for sirtuin inhi-bition via known adenosine mimicking kinase inhibitors hasalready been fruitful in the past [32,33]. Therefore, a focusedkinase inhibitor library from GlaxoSmithKline was screened forbiological activity on human sirtuin isoforms Sirt1–Sirt3. Aza-stilbene derivative GW435821X (2a, Figure 1), initiallypublished as c-RAF kinase inhibitor, was identified as a moder-ately active Sirt2 inhibitor with low selectivity [34,35]. In thiswork, the photoresponsiveness of the hetero-stilbene core struc-ture is examined. Furthermore, an intramolecular azologizationapproach is performed in order to obtain photoswitchablesirtuin inhibitors, which could be useful tools in the further in-vestigation of the biochemistry and pharmacology of sirtuins.
ResultsChemistry of azastilbenesAll azastilbene derivatives were synthesised by palladium-cata-lysed cross-coupling reactions using either commercially avail-able 5-bromonicotinamide (3a) or methyl 5-bromonicotinate(3b). If 3b was used, transformation to the nicotinamide wasaccomplished almost quantitatively by addition of a saturatedsolution of ammonia in anhydrous methanol and stirring in aclosed vessel at 40 °C. Compounds 4a and b could easily be ob-tained through Suzuki coupling with commercially availablenaphthalene-2-ylboronic acid or (3,4-dihydronaphthalen-2-yl)boronic acid (Scheme 1). The latter was synthesized accord-ing to a literature procedure [36].
Scheme 1: Reagents and conditions: a) appropriate boronic acid,Pd(PPh3)4, Na2CO3, DMF, H2O, microwave, 15 min, 150 °C, 43–64%.
Formation of compounds 2b–h was accomplished through Heckcoupling of aryl bromides with the appropriate styrenes(Scheme 2) [37].
Compounds 2b and 2e were obtained in moderate yield using3a as the aryl halide in the Heck reaction. The use of 3b in theHeck reaction resulted in a substantial improvement of yield inthe synthesis of 2g but not for 2c. Interchanging the roles byusing 5-vinylnicotinamide (5a) or methyl 5-vinylnicotinate (5b)as alkene component had detrimental effects on the yields in the
56
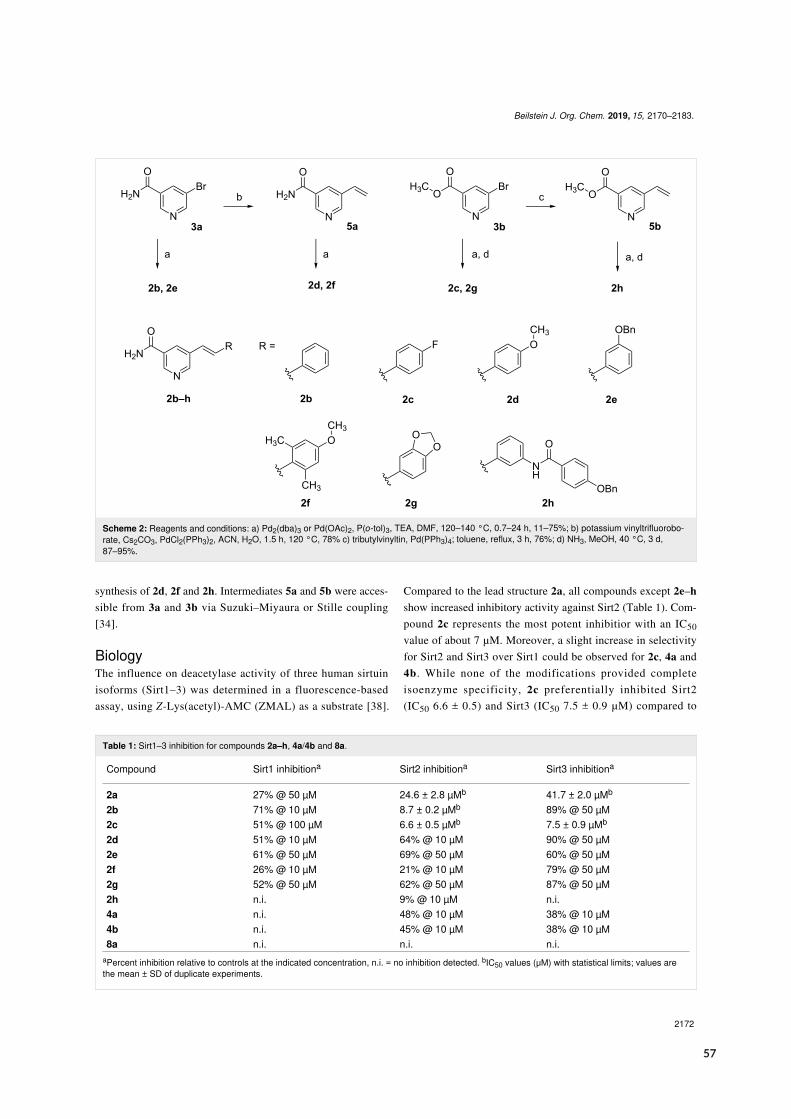
Beilstein J. Org. Chem. 2019, 15, 2170–2183.
2172
Scheme 2: Reagents and conditions: a) Pd2(dba)3 or Pd(OAc)2, P(o-tol)3, TEA, DMF, 120–140 °C, 0.7–24 h, 11–75%; b) potassium vinyltrifluorobo-rate, Cs2CO3, PdCl2(PPh3)2, ACN, H2O, 1.5 h, 120 °C, 78% c) tributylvinyltin, Pd(PPh3)4; toluene, reflux, 3 h, 76%; d) NH3, MeOH, 40 °C, 3 d,87–95%.
Table 1: Sirt1–3 inhibition for compounds 2a–h, 4a/4b and 8a.
Compound Sirt1 inhibitiona Sirt2 inhibitiona Sirt3 inhibitiona
2a 27% @ 50 µM 24.6 ± 2.8 µMb 41.7 ± 2.0 µMb
2b 71% @ 10 µM 8.7 ± 0.2 µMb 89% @ 50 µM2c 51% @ 100 µM 6.6 ± 0.5 µMb 7.5 ± 0.9 µMb
2d 51% @ 10 µM 64% @ 10 µM 90% @ 50 µM2e 61% @ 50 µM 69% @ 50 µM 60% @ 50 µM2f 26% @ 10 µM 21% @ 10 µM 79% @ 50 µM2g 52% @ 50 µM 62% @ 50 µM 87% @ 50 µM2h n.i. 9% @ 10 µM n.i.4a n.i. 48% @ 10 µM 38% @ 10 µM4b n.i. 45% @ 10 µM 38% @ 10 µM8a n.i. n.i. n.i.
aPercent inhibition relative to controls at the indicated concentration, n.i. = no inhibition detected. bIC50 values (μM) with statistical limits; values arethe mean ± SD of duplicate experiments.
synthesis of 2d, 2f and 2h. Intermediates 5a and 5b were acces-sible from 3a and 3b via Suzuki–Miyaura or Stille coupling[34].
BiologyThe influence on deacetylase activity of three human sirtuinisoforms (Sirt1–3) was determined in a fluorescence-basedassay, using Z-Lys(acetyl)-AMC (ZMAL) as a substrate [38].
Compared to the lead structure 2a, all compounds except 2e–hshow increased inhibitory activity against Sirt2 (Table 1). Com-pound 2c represents the most potent inhibitior with an IC50value of about 7 µM. Moreover, a slight increase in selectivityfor Sirt2 and Sirt3 over Sirt1 could be observed for 2c, 4a and4b. While none of the modifications provided completeisoenzyme specificity, 2c preferentially inhibited Sirt2(IC50 6.6 ± 0.5) and Sirt3 (IC50 7.5 ± 0.9 µM) compared to
57
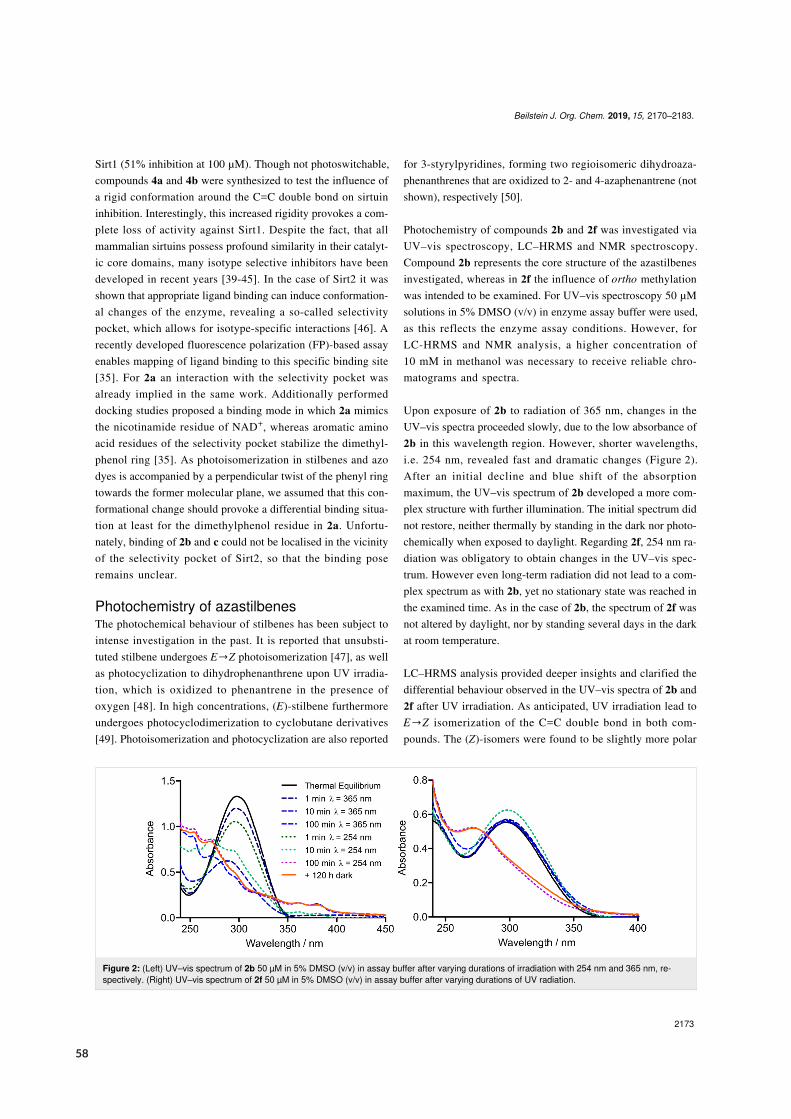
Beilstein J. Org. Chem. 2019, 15, 2170–2183.
2173
Figure 2: (Left) UV–vis spectrum of 2b 50 µM in 5% DMSO (v/v) in assay buffer after varying durations of irradiation with 254 nm and 365 nm, re-spectively. (Right) UV–vis spectrum of 2f 50 µM in 5% DMSO (v/v) in assay buffer after varying durations of UV radiation.
Sirt1 (51% inhibition at 100 µM). Though not photoswitchable,compounds 4a and 4b were synthesized to test the influence ofa rigid conformation around the C=C double bond on sirtuininhibition. Interestingly, this increased rigidity provokes a com-plete loss of activity against Sirt1. Despite the fact, that allmammalian sirtuins possess profound similarity in their catalyt-ic core domains, many isotype selective inhibitors have beendeveloped in recent years [39-45]. In the case of Sirt2 it wasshown that appropriate ligand binding can induce conformation-al changes of the enzyme, revealing a so-called selectivitypocket, which allows for isotype-specific interactions [46]. Arecently developed fluorescence polarization (FP)-based assayenables mapping of ligand binding to this specific binding site[35]. For 2a an interaction with the selectivity pocket wasalready implied in the same work. Additionally performeddocking studies proposed a binding mode in which 2a mimicsthe nicotinamide residue of NAD+, whereas aromatic aminoacid residues of the selectivity pocket stabilize the dimethyl-phenol ring [35]. As photoisomerization in stilbenes and azodyes is accompanied by a perpendicular twist of the phenyl ringtowards the former molecular plane, we assumed that this con-formational change should provoke a differential binding situa-tion at least for the dimethylphenol residue in 2a. Unfortu-nately, binding of 2b and c could not be localised in the vicinityof the selectivity pocket of Sirt2, so that the binding poseremains unclear.
Photochemistry of azastilbenesThe photochemical behaviour of stilbenes has been subject tointense investigation in the past. It is reported that unsubsti-tuted stilbene undergoes E→Z photoisomerization [47], as wellas photocyclization to dihydrophenanthrene upon UV irradia-tion, which is oxidized to phenantrene in the presence ofoxygen [48]. In high concentrations, (E)-stilbene furthermoreundergoes photocyclodimerization to cyclobutane derivatives[49]. Photoisomerization and photocyclization are also reported
for 3-styrylpyridines, forming two regioisomeric dihydroaza-phenanthrenes that are oxidized to 2- and 4-azaphenantrene (notshown), respectively [50].
Photochemistry of compounds 2b and 2f was investigated viaUV–vis spectroscopy, LC–HRMS and NMR spectroscopy.Compound 2b represents the core structure of the azastilbenesinvestigated, whereas in 2f the influence of ortho methylationwas intended to be examined. For UV–vis spectroscopy 50 µMsolutions in 5% DMSO (v/v) in enzyme assay buffer were used,as this reflects the enzyme assay conditions. However, forLC-HRMS and NMR analysis, a higher concentration of10 mM in methanol was necessary to receive reliable chro-matograms and spectra.
Upon exposure of 2b to radiation of 365 nm, changes in theUV–vis spectra proceeded slowly, due to the low absorbance of2b in this wavelength region. However, shorter wavelengths,i.e. 254 nm, revealed fast and dramatic changes (Figure 2).After an initial decline and blue shift of the absorptionmaximum, the UV–vis spectrum of 2b developed a more com-plex structure with further illumination. The initial spectrum didnot restore, neither thermally by standing in the dark nor photo-chemically when exposed to daylight. Regarding 2f, 254 nm ra-diation was obligatory to obtain changes in the UV–vis spec-trum. However even long-term radiation did not lead to a com-plex spectrum as with 2b, yet no stationary state was reached inthe examined time. As in the case of 2b, the spectrum of 2f wasnot altered by daylight, nor by standing several days in the darkat room temperature.
LC–HRMS analysis provided deeper insights and clarified thedifferential behaviour observed in the UV–vis spectra of 2b and2f after UV irradiation. As anticipated, UV irradiation lead toE→Z isomerization of the C=C double bond in both com-pounds. The (Z)-isomers were found to be slightly more polar
58
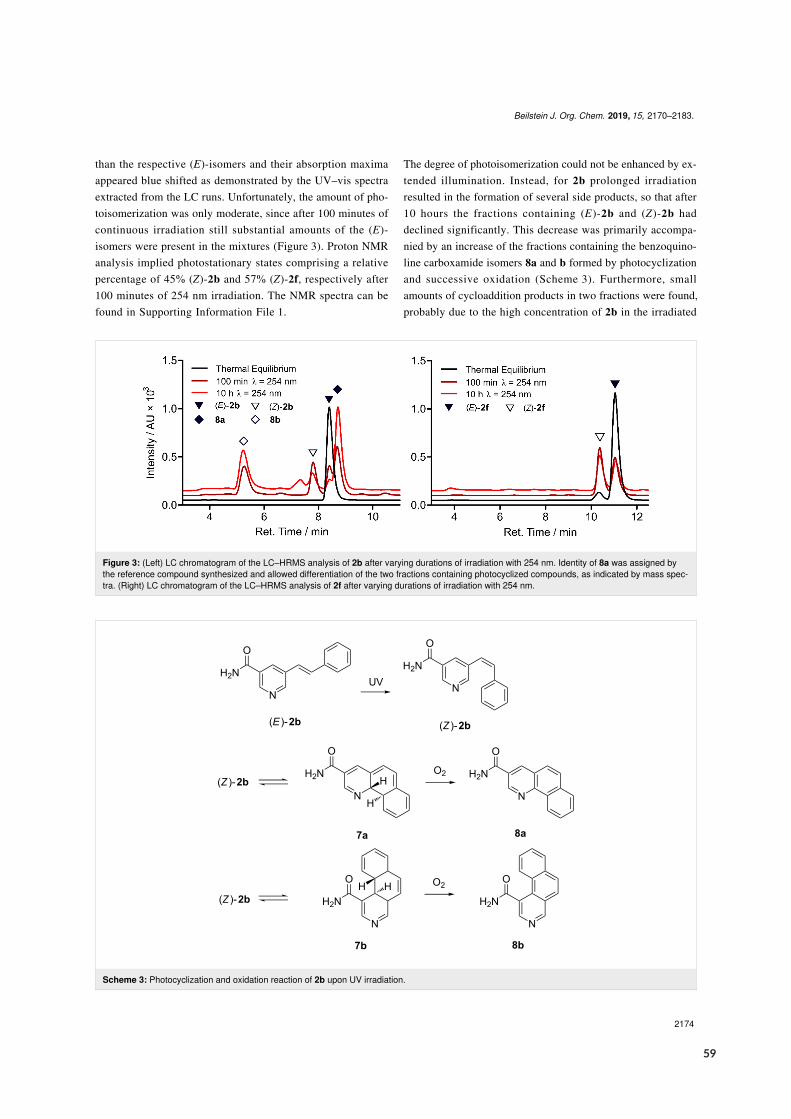
Beilstein J. Org. Chem. 2019, 15, 2170–2183.
2174
Figure 3: (Left) LC chromatogram of the LC–HRMS analysis of 2b after varying durations of irradiation with 254 nm. Identity of 8a was assigned bythe reference compound synthesized and allowed differentiation of the two fractions containing photocyclized compounds, as indicated by mass spec-tra. (Right) LC chromatogram of the LC–HRMS analysis of 2f after varying durations of irradiation with 254 nm.
Scheme 3: Photocyclization and oxidation reaction of 2b upon UV irradiation.
than the respective (E)-isomers and their absorption maximaappeared blue shifted as demonstrated by the UV–vis spectraextracted from the LC runs. Unfortunately, the amount of pho-toisomerization was only moderate, since after 100 minutes ofcontinuous irradiation still substantial amounts of the (E)-isomers were present in the mixtures (Figure 3). Proton NMRanalysis implied photostationary states comprising a relativepercentage of 45% (Z)-2b and 57% (Z)-2f, respectively after100 minutes of 254 nm irradiation. The NMR spectra can befound in Supporting Information File 1.
The degree of photoisomerization could not be enhanced by ex-tended illumination. Instead, for 2b prolonged irradiationresulted in the formation of several side products, so that after10 hours the fractions containing (E)-2b and (Z)-2b haddeclined significantly. This decrease was primarily accompa-nied by an increase of the fractions containing the benzoquino-line carboxamide isomers 8a and b formed by photocyclizationand successive oxidation (Scheme 3). Furthermore, smallamounts of cycloaddition products in two fractions were found,probably due to the high concentration of 2b in the irradiated
59
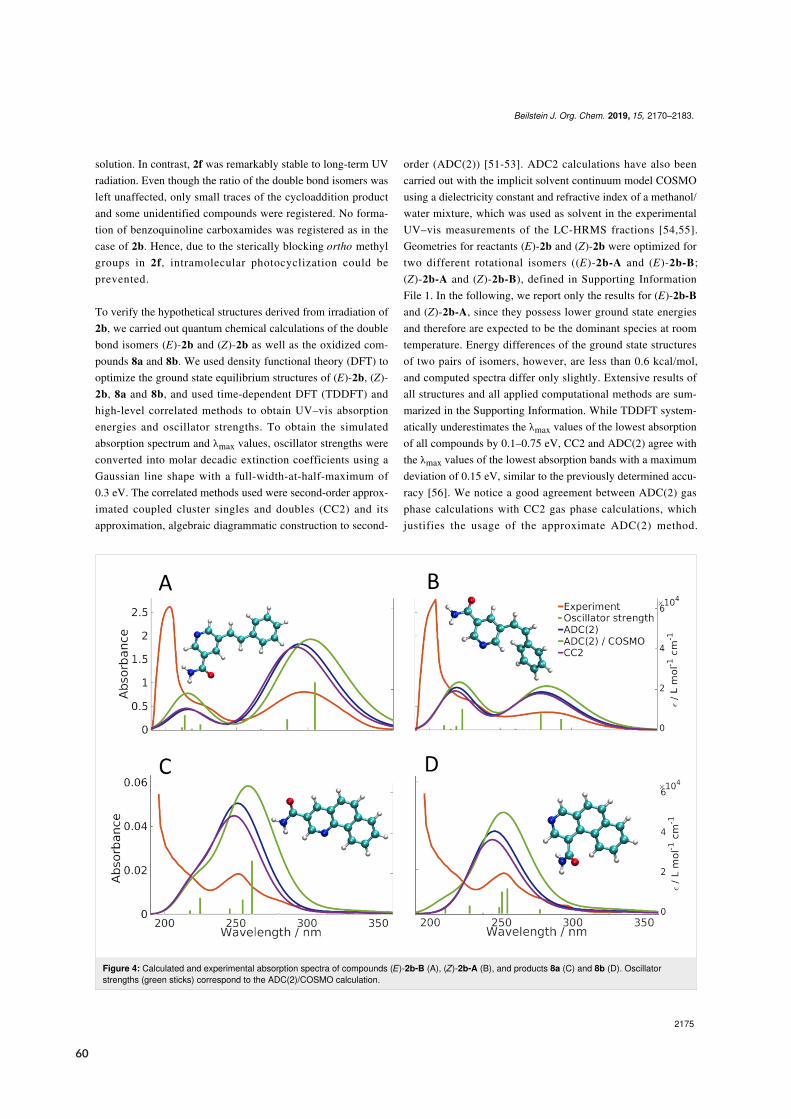
Beilstein J. Org. Chem. 2019, 15, 2170–2183.
2175
Figure 4: Calculated and experimental absorption spectra of compounds (E)-2b-B (A), (Z)-2b-A (B), and products 8a (C) and 8b (D). Oscillatorstrengths (green sticks) correspond to the ADC(2)/COSMO calculation.
solution. In contrast, 2f was remarkably stable to long-term UVradiation. Even though the ratio of the double bond isomers wasleft unaffected, only small traces of the cycloaddition productand some unidentified compounds were registered. No forma-tion of benzoquinoline carboxamides was registered as in thecase of 2b. Hence, due to the sterically blocking ortho methylgroups in 2f, intramolecular photocyclization could beprevented.
To verify the hypothetical structures derived from irradiation of2b, we carried out quantum chemical calculations of the doublebond isomers (E)-2b and (Z)-2b as well as the oxidized com-pounds 8a and 8b. We used density functional theory (DFT) tooptimize the ground state equilibrium structures of (E)-2b, (Z)-2b, 8a and 8b, and used time-dependent DFT (TDDFT) andhigh-level correlated methods to obtain UV–vis absorptionenergies and oscillator strengths. To obtain the simulatedabsorption spectrum and λmax values, oscillator strengths wereconverted into molar decadic extinction coefficients using aGaussian line shape with a full-width-at-half-maximum of0.3 eV. The correlated methods used were second-order approx-imated coupled cluster singles and doubles (CC2) and itsapproximation, algebraic diagrammatic construction to second-
order (ADC(2)) [51-53]. ADC2 calculations have also beencarried out with the implicit solvent continuum model COSMOusing a dielectricity constant and refractive index of a methanol/water mixture, which was used as solvent in the experimentalUV–vis measurements of the LC-HRMS fractions [54,55].Geometries for reactants (E)-2b and (Z)-2b were optimized fortwo different rotational isomers ((E)-2b-A and (E)-2b-B;(Z)-2b-A and (Z)-2b-B), defined in Supporting InformationFile 1. In the following, we report only the results for (E)-2b-Band (Z)-2b-A, since they possess lower ground state energiesand therefore are expected to be the dominant species at roomtemperature. Energy differences of the ground state structuresof two pairs of isomers, however, are less than 0.6 kcal/mol,and computed spectra differ only slightly. Extensive results ofall structures and all applied computational methods are sum-marized in the Supporting Information. While TDDFT system-atically underestimates the λmax values of the lowest absorptionof all compounds by 0.1–0.75 eV, CC2 and ADC(2) agree withthe λmax values of the lowest absorption bands with a maximumdeviation of 0.15 eV, similar to the previously determined accu-racy [56]. We notice a good agreement between ADC(2) gasphase calculations with CC2 gas phase calculations, whichjustifies the usage of the approximate ADC(2) method.
60
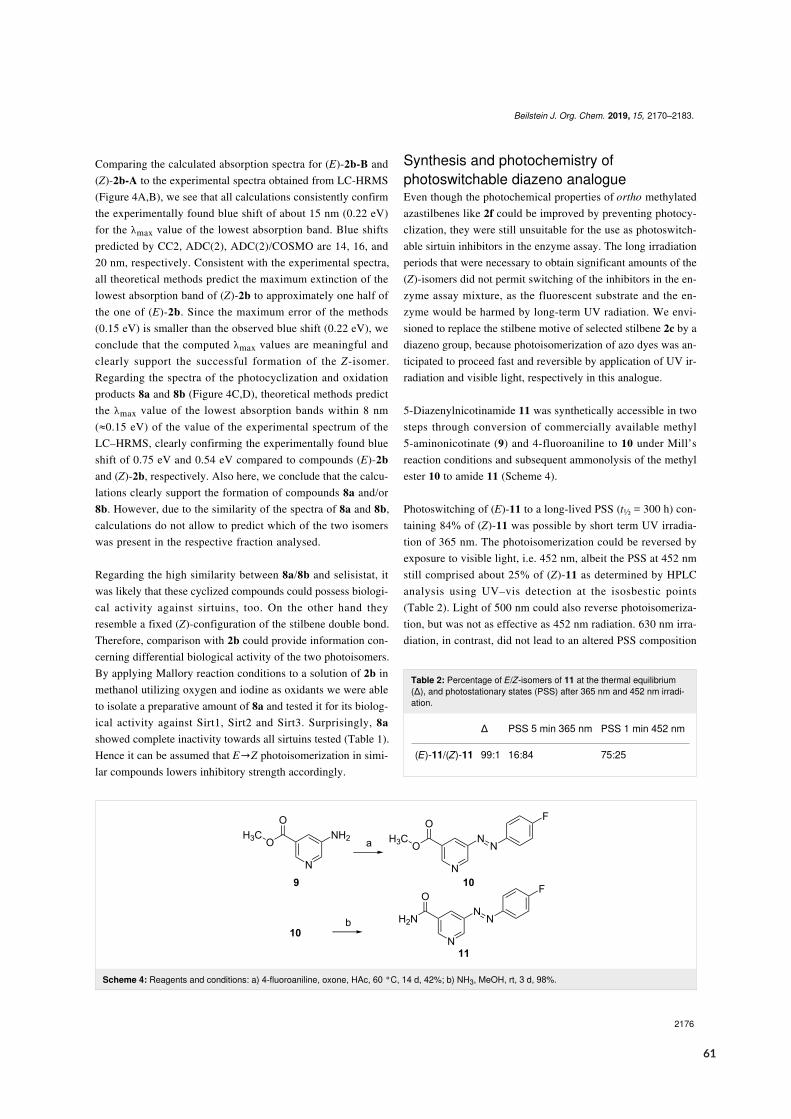
Beilstein J. Org. Chem. 2019, 15, 2170–2183.
2176
Scheme 4: Reagents and conditions: a) 4-fluoroaniline, oxone, HAc, 60 °C, 14 d, 42%; b) NH3, MeOH, rt, 3 d, 98%.
Comparing the calculated absorption spectra for (E)-2b-B and(Z)-2b-A to the experimental spectra obtained from LC-HRMS(Figure 4A,B), we see that all calculations consistently confirmthe experimentally found blue shift of about 15 nm (0.22 eV)for the λmax value of the lowest absorption band. Blue shiftspredicted by CC2, ADC(2), ADC(2)/COSMO are 14, 16, and20 nm, respectively. Consistent with the experimental spectra,all theoretical methods predict the maximum extinction of thelowest absorption band of (Z)-2b to approximately one half ofthe one of (E)-2b. Since the maximum error of the methods(0.15 eV) is smaller than the observed blue shift (0.22 eV), weconclude that the computed λmax values are meaningful andclearly support the successful formation of the Z-isomer.Regarding the spectra of the photocyclization and oxidationproducts 8a and 8b (Figure 4C,D), theoretical methods predictthe λmax value of the lowest absorption bands within 8 nm(≈0.15 eV) of the value of the experimental spectrum of theLC–HRMS, clearly confirming the experimentally found blueshift of 0.75 eV and 0.54 eV compared to compounds (E)-2band (Z)-2b, respectively. Also here, we conclude that the calcu-lations clearly support the formation of compounds 8a and/or8b. However, due to the similarity of the spectra of 8a and 8b,calculations do not allow to predict which of the two isomerswas present in the respective fraction analysed.
Regarding the high similarity between 8a/8b and selisistat, itwas likely that these cyclized compounds could possess biologi-cal activity against sirtuins, too. On the other hand theyresemble a fixed (Z)-configuration of the stilbene double bond.Therefore, comparison with 2b could provide information con-cerning differential biological activity of the two photoisomers.By applying Mallory reaction conditions to a solution of 2b inmethanol utilizing oxygen and iodine as oxidants we were ableto isolate a preparative amount of 8a and tested it for its biolog-ical activity against Sirt1, Sirt2 and Sirt3. Surprisingly, 8ashowed complete inactivity towards all sirtuins tested (Table 1).Hence it can be assumed that E→Z photoisomerization in simi-lar compounds lowers inhibitory strength accordingly.
Table 2: Percentage of E/Z-isomers of 11 at the thermal equilibrium(∆), and photostationary states (PSS) after 365 nm and 452 nm irradi-ation.
∆ PSS 5 min 365 nm PSS 1 min 452 nm
(E)-11/(Z)-11 99:1 16:84 75:25
Synthesis and photochemistry ofphotoswitchable diazeno analogueEven though the photochemical properties of ortho methylatedazastilbenes like 2f could be improved by preventing photocy-clization, they were still unsuitable for the use as photoswitch-able sirtuin inhibitors in the enzyme assay. The long irradiationperiods that were necessary to obtain significant amounts of the(Z)-isomers did not permit switching of the inhibitors in the en-zyme assay mixture, as the fluorescent substrate and the en-zyme would be harmed by long-term UV radiation. We envi-sioned to replace the stilbene motive of selected stilbene 2c by adiazeno group, because photoisomerization of azo dyes was an-ticipated to proceed fast and reversible by application of UV ir-radiation and visible light, respectively in this analogue.
5-Diazenylnicotinamide 11 was synthetically accessible in twosteps through conversion of commercially available methyl5-aminonicotinate (9) and 4-fluoroaniline to 10 under Mill’sreaction conditions and subsequent ammonolysis of the methylester 10 to amide 11 (Scheme 4).
Photoswitching of (E)-11 to a long-lived PSS (t½ = 300 h) con-taining 84% of (Z)-11 was possible by short term UV irradia-tion of 365 nm. The photoisomerization could be reversed byexposure to visible light, i.e. 452 nm, albeit the PSS at 452 nmstill comprised about 25% of (Z)-11 as determined by HPLCanalysis using UV–vis detection at the isosbestic points(Table 2). Light of 500 nm could also reverse photoisomeriza-tion, but was not as effective as 452 nm radiation. 630 nm irra-diation, in contrast, did not lead to an altered PSS composition
61
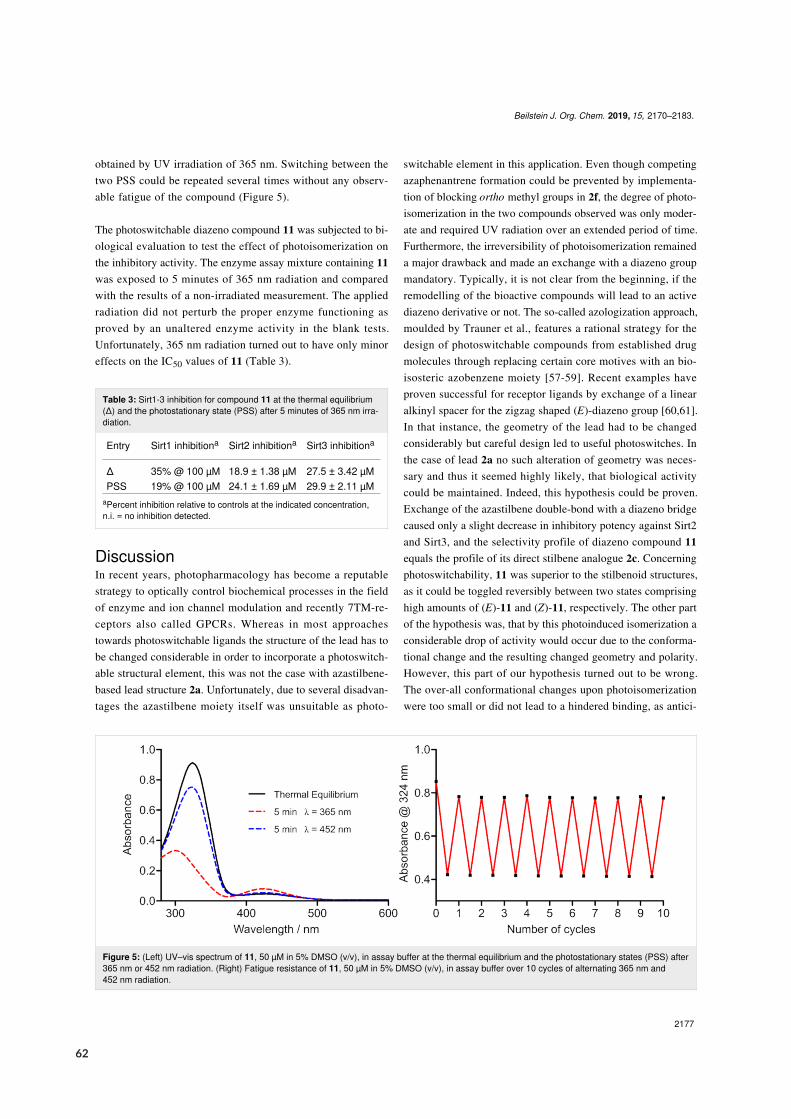
Beilstein J. Org. Chem. 2019, 15, 2170–2183.
2177
Figure 5: (Left) UV–vis spectrum of 11, 50 µM in 5% DMSO (v/v), in assay buffer at the thermal equilibrium and the photostationary states (PSS) after365 nm or 452 nm radiation. (Right) Fatigue resistance of 11, 50 µM in 5% DMSO (v/v), in assay buffer over 10 cycles of alternating 365 nm and452 nm radiation.
obtained by UV irradiation of 365 nm. Switching between thetwo PSS could be repeated several times without any observ-able fatigue of the compound (Figure 5).
The photoswitchable diazeno compound 11 was subjected to bi-ological evaluation to test the effect of photoisomerization onthe inhibitory activity. The enzyme assay mixture containing 11was exposed to 5 minutes of 365 nm radiation and comparedwith the results of a non-irradiated measurement. The appliedradiation did not perturb the proper enzyme functioning asproved by an unaltered enzyme activity in the blank tests.Unfortunately, 365 nm radiation turned out to have only minoreffects on the IC50 values of 11 (Table 3).
Table 3: Sirt1-3 inhibition for compound 11 at the thermal equilibrium(∆) and the photostationary state (PSS) after 5 minutes of 365 nm irra-diation.
Entry Sirt1 inhibitiona Sirt2 inhibitiona Sirt3 inhibitiona
∆ 35% @ 100 µM 18.9 ± 1.38 µM 27.5 ± 3.42 µMPSS 19% @ 100 µM 24.1 ± 1.69 µM 29.9 ± 2.11 µM
aPercent inhibition relative to controls at the indicated concentration,n.i. = no inhibition detected.
DiscussionIn recent years, photopharmacology has become a reputablestrategy to optically control biochemical processes in the fieldof enzyme and ion channel modulation and recently 7TM-re-ceptors also called GPCRs. Whereas in most approachestowards photoswitchable ligands the structure of the lead has tobe changed considerable in order to incorporate a photoswitch-able structural element, this was not the case with azastilbene-based lead structure 2a. Unfortunately, due to several disadvan-tages the azastilbene moiety itself was unsuitable as photo-
switchable element in this application. Even though competingazaphenantrene formation could be prevented by implementa-tion of blocking ortho methyl groups in 2f, the degree of photo-isomerization in the two compounds observed was only moder-ate and required UV radiation over an extended period of time.Furthermore, the irreversibility of photoisomerization remaineda major drawback and made an exchange with a diazeno groupmandatory. Typically, it is not clear from the beginning, if theremodelling of the bioactive compounds will lead to an activediazeno derivative or not. The so-called azologization approach,moulded by Trauner et al., features a rational strategy for thedesign of photoswitchable compounds from established drugmolecules through replacing certain core motives with an bio-isosteric azobenzene moiety [57-59]. Recent examples haveproven successful for receptor ligands by exchange of a linearalkinyl spacer for the zigzag shaped (E)-diazeno group [60,61].In that instance, the geometry of the lead had to be changedconsiderably but careful design led to useful photoswitches. Inthe case of lead 2a no such alteration of geometry was neces-sary and thus it seemed highly likely, that biological activitycould be maintained. Indeed, this hypothesis could be proven.Exchange of the azastilbene double-bond with a diazeno bridgecaused only a slight decrease in inhibitory potency against Sirt2and Sirt3, and the selectivity profile of diazeno compound 11equals the profile of its direct stilbene analogue 2c. Concerningphotoswitchability, 11 was superior to the stilbenoid structures,as it could be toggled reversibly between two states comprisinghigh amounts of (E)-11 and (Z)-11, respectively. The other partof the hypothesis was, that by this photoinduced isomerization aconsiderable drop of activity would occur due to the conforma-tional change and the resulting changed geometry and polarity.However, this part of our hypothesis turned out to be wrong.The over-all conformational changes upon photoisomerizationwere too small or did not lead to a hindered binding, as antici-
62
Beilstein J. Org. Chem. 2019, 15, 2170–2183.
2178
pated. This result is disappointing, because the photoswitchablesirtuin inhibitor 11 cannot be switched between active and inac-tive state, as envisioned. Possible reasons could be assigned tosubstituent effects as demonstrated by Simeth et al. [62]. Asrecently reported by Schehr et al., reducing agents like DTT,used to prevent enzyme oxidation in crystallization mixtures orin vitro assays, can reduce azo dyes to hydrazine derivativesvery fast and thus disable photoisomerization [63]. However, inour enzyme assay no such reducing agents were present, whichis why we assume that the photoswitchable diazeno groupshould still be intact in the enzyme assay mixture. Even if thechange in space orientation does not alter binding after irradia-tion, we would have predicted, that at least the significantdifference in polarity of (E)-11 and (Z)-11 should lead tomarked differences of sirtuin engagement in vitro. However,recent results from a carefully designed azologization study per-formed by Rustler et al. led to comparable difficulties [64].
ConclusionBased on lead structure GW435821X (2a) a small library ofanalogous azastilbene compounds was designed, synthesizedand tested for their inhibitory activity against the human sirtuinisoforms Sirt1, Sirt2 and Sirt3. Compared to the lead structurethe inhibitory potency could be increased to single digit µM po-tency for some compounds, while isoenzyme selectivity stillremains an issue. The photochemistry of azastilbene com-pounds 2b and 2f was studied. For 2b, besides photoisomeriza-tion, formation of benzoquinoline carboxamides by photocy-clization and oxidation was indicated by high accuracy massspectroscopy. Formation of 4-azaphenantrene derivative 8acould be proven by isolation and characterization of a prepara-tive sample. Theoretical UV–vis spectra for (E)-2b, (Z)-2b andtwo isomeric benzoquinoline carboxamides reproduced the ex-perimental data. Compound 2f was unsusceptible to photocy-clization due to sterically blocking ortho methyl groups butcould not be toggled between (E)- and (Z)-configuration. Thislead to the synthesis of a first diazenyl derivative of the leadstructure 2a with promising photochemical characteristics for anew class of photoswitchable sirtuin inhibitors, but the activitydifference for the (E)- and (Z)-isomers needs dramatic improve-ment before a useful molecular probe can be obtained by thisapproach.
ExperimentalGeneral remarksAll solvents and reagents were obtained from commercialsuppliers and were used without purification. Anhydrous sol-vents were purchased from Acros Organics. Thin-layer chroma-tography (TLC) was executed on silica gel 60 F254 aluminiumplates purchased from Merck. Visualization of the compoundswas accomplished by UV-light (254 nm and 366 nm) and by
staining with iodine, DNPH/H2SO4 (2 g 2,4-dinitrophenylhy-drazine and 5 mL H2SO4 in 50 mL EtOH and 16 mL water) orvanillin/sulfuric acid (3.0 g vanillin and 0.5 mL H2SO4 in100 mL EtOH) reagent. Synthesis was additionally monitoredusing high speed SFC/MS runs performed by a Nexera SFE-SFC/UHPLC switching system (Shimadzu Corporation, Kyoto,Japan) consisting of a pumping system (one LC-30ADSF forliquid CO2 and two LC-20ADXR for modifier and make-updelivery), an on-line supercritical fluid extraction module (SFE-30A auto extractor equipped with 0.2 mL extraction vessels) forreaction monitoring, an autosampler (SIL-30AC) for purifiedcompounds, a column thermostat (CTO-20AC) equipped with aTorus DIOL (Waters) or Phenomenex CSP (Lux Amylose-2,i-Amylose-3, i-Cellulose-5), a degasser (DGU-20A5R), a com-munications module (CBM-20A), and two back pressure regu-lators BPR A and B (SFC-30A). UV and MS spectra were re-corded via photodiode array detection (SPD-M20A) and elec-trospray ionization single quadrupole MS (LCMS-2020) con-trolled by Shimadzu LabSolution software (Version 5.91).Chromatographic purification of products was performed byflash chromatography on silica gel (20–45 µm, Carl Roth)applying pressured air up to 0.8 bar. NMR spectra were re-corded on a Bruker Avance III instrument (1H NMR: 400 MHz,13C NMR: 100.6 MHz). Chemical shifts were referenced totetramethylsilane (TMS) as internal standard in deuterated sol-vents and reported in parts per million (ppm). Coupling con-stants (J) are reported in Hz using the abbreviations: s = singlet,d = doublet, t = triplet, q = quartet, m = multiplet and combina-tions thereof, br = broad. Infrared (IR) spectra were recorded ona Bruker Alpha FT-IR spectrometer equipped with a diamondATR unit and are indicated in terms of absorbance frequency[cm−1]. Microwave synthesis was conducted in a Monowave300 microwave synthesis reactor from Anton Paar equippedwith appropriate sealed reaction vessels G10 (6 mL) or G30(20 mL), applying a maximum initial power of 850 W to reacha given temperature (IR sensor) for a given time with stirring at600 rpm. Melting points were measured in open capillary tubesusing a Melting Point M-565 apparatus from Büchi and areuncorrected. High accuracy mass spectra were recorded on aShimadzu LCMS-IT-TOF using ESI ionization. Purity of finalcompounds was determined by HPLC with DAD (applying the100% method at 220 nm). Preparative and analytical HPLCwere performed using Shimadzu devices CBM-20A, LC-20A P,SIL-20A, FRC-10A with SPD 20A UV–vis detector and anELSD-LTII. In analytical mode a LiChroCART® (250 × 4 mm)and in preparative mode a Hibar® RT (250 × 25 mm) column,both containing LiChrospher® 100 RP-18e (5 µm), were used.An Elementar Vario MICRO cube was used for the experimen-tal determination of elemental configurations of final pure prod-ucts. UV–vis spectra were obtained using a Thermo ScientificGenesys 10S UV–vis spectrophotometer.
63
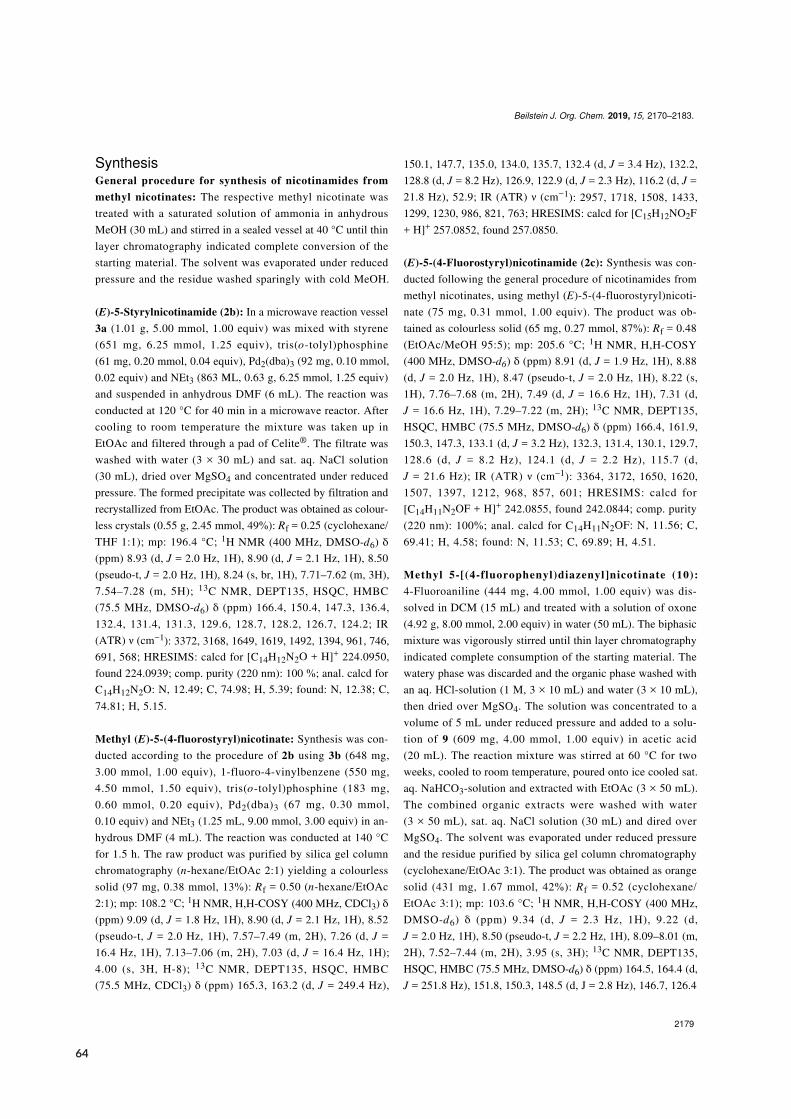
Beilstein J. Org. Chem. 2019, 15, 2170–2183.
2179
SynthesisGeneral procedure for synthesis of nicotinamides frommethyl nicotinates: The respective methyl nicotinate wastreated with a saturated solution of ammonia in anhydrousMeOH (30 mL) and stirred in a sealed vessel at 40 °C until thinlayer chromatography indicated complete conversion of thestarting material. The solvent was evaporated under reducedpressure and the residue washed sparingly with cold MeOH.
(E)-5-Styrylnicotinamide (2b): In a microwave reaction vessel3a (1.01 g, 5.00 mmol, 1.00 equiv) was mixed with styrene(651 mg, 6.25 mmol, 1.25 equiv), tris(o-tolyl)phosphine(61 mg, 0.20 mmol, 0.04 equiv), Pd2(dba)3 (92 mg, 0.10 mmol,0.02 equiv) and NEt3 (863 ΜL, 0.63 g, 6.25 mmol, 1.25 equiv)and suspended in anhydrous DMF (6 mL). The reaction wasconducted at 120 °C for 40 min in a microwave reactor. Aftercooling to room temperature the mixture was taken up inEtOAc and filtered through a pad of Celite®. The filtrate waswashed with water (3 × 30 mL) and sat. aq. NaCl solution(30 mL), dried over MgSO4 and concentrated under reducedpressure. The formed precipitate was collected by filtration andrecrystallized from EtOAc. The product was obtained as colour-less crystals (0.55 g, 2.45 mmol, 49%): Rf = 0.25 (cyclohexane/THF 1:1); mp: 196.4 °C; 1H NMR (400 MHz, DMSO-d6) δ(ppm) 8.93 (d, J = 2.0 Hz, 1H), 8.90 (d, J = 2.1 Hz, 1H), 8.50(pseudo-t, J = 2.0 Hz, 1H), 8.24 (s, br, 1H), 7.71–7.62 (m, 3H),7.54–7.28 (m, 5H); 13C NMR, DEPT135, HSQC, HMBC(75.5 MHz, DMSO-d6) δ (ppm) 166.4, 150.4, 147.3, 136.4,132.4, 131.4, 131.3, 129.6, 128.7, 128.2, 126.7, 124.2; IR(ATR) ν (cm−1): 3372, 3168, 1649, 1619, 1492, 1394, 961, 746,691, 568; HRESIMS: calcd for [C14H12N2O + H]+ 224.0950,found 224.0939; comp. purity (220 nm): 100 %; anal. calcd forC14H12N2O: N, 12.49; C, 74.98; H, 5.39; found: N, 12.38; C,74.81; H, 5.15.
Methyl (E)-5-(4-fluorostyryl)nicotinate: Synthesis was con-ducted according to the procedure of 2b using 3b (648 mg,3.00 mmol, 1.00 equiv), 1-fluoro-4-vinylbenzene (550 mg,4.50 mmol, 1.50 equiv), tris(o-tolyl)phosphine (183 mg,0.60 mmol, 0.20 equiv), Pd2(dba)3 (67 mg, 0.30 mmol,0.10 equiv) and NEt3 (1.25 mL, 9.00 mmol, 3.00 equiv) in an-hydrous DMF (4 mL). The reaction was conducted at 140 °Cfor 1.5 h. The raw product was purified by silica gel columnchromatography (n-hexane/EtOAc 2:1) yielding a colourlesssolid (97 mg, 0.38 mmol, 13%): Rf = 0.50 (n-hexane/EtOAc2:1); mp: 108.2 °C; 1H NMR, H,H-COSY (400 MHz, CDCl3) δ(ppm) 9.09 (d, J = 1.8 Hz, 1H), 8.90 (d, J = 2.1 Hz, 1H), 8.52(pseudo-t, J = 2.0 Hz, 1H), 7.57–7.49 (m, 2H), 7.26 (d, J =16.4 Hz, 1H), 7.13–7.06 (m, 2H), 7.03 (d, J = 16.4 Hz, 1H);4.00 (s, 3H, H-8); 13C NMR, DEPT135, HSQC, HMBC(75.5 MHz, CDCl3) δ (ppm) 165.3, 163.2 (d, J = 249.4 Hz),
150.1, 147.7, 135.0, 134.0, 135.7, 132.4 (d, J = 3.4 Hz), 132.2,128.8 (d, J = 8.2 Hz), 126.9, 122.9 (d, J = 2.3 Hz), 116.2 (d, J =21.8 Hz), 52.9; IR (ATR) ν (cm−1): 2957, 1718, 1508, 1433,1299, 1230, 986, 821, 763; HRESIMS: calcd for [C15H12NO2F+ H]+ 257.0852, found 257.0850.
(E)-5-(4-Fluorostyryl)nicotinamide (2c): Synthesis was con-ducted following the general procedure of nicotinamides frommethyl nicotinates, using methyl (E)-5-(4-fluorostyryl)nicoti-nate (75 mg, 0.31 mmol, 1.00 equiv). The product was ob-tained as colourless solid (65 mg, 0.27 mmol, 87%): Rf = 0.48(EtOAc/MeOH 95:5); mp: 205.6 °C; 1H NMR, H,H-COSY(400 MHz, DMSO-d6) δ (ppm) 8.91 (d, J = 1.9 Hz, 1H), 8.88(d, J = 2.0 Hz, 1H), 8.47 (pseudo-t, J = 2.0 Hz, 1H), 8.22 (s,1H), 7.76–7.68 (m, 2H), 7.49 (d, J = 16.6 Hz, 1H), 7.31 (d,J = 16.6 Hz, 1H), 7.29–7.22 (m, 2H); 13C NMR, DEPT135,HSQC, HMBC (75.5 MHz, DMSO-d6) δ (ppm) 166.4, 161.9,150.3, 147.3, 133.1 (d, J = 3.2 Hz), 132.3, 131.4, 130.1, 129.7,128.6 (d, J = 8.2 Hz), 124.1 (d, J = 2.2 Hz), 115.7 (d,J = 21.6 Hz); IR (ATR) ν (cm–1): 3364, 3172, 1650, 1620,1507, 1397, 1212, 968, 857, 601; HRESIMS: calcd for[C14H11N2OF + H]+ 242.0855, found 242.0844; comp. purity(220 nm): 100%; anal. calcd for C14H11N2OF: N, 11.56; C,69.41; H, 4.58; found: N, 11.53; C, 69.89; H, 4.51.
Methyl 5-[(4-fluorophenyl)diazenyl]nicotinate (10):4-Fluoroaniline (444 mg, 4.00 mmol, 1.00 equiv) was dis-solved in DCM (15 mL) and treated with a solution of oxone(4.92 g, 8.00 mmol, 2.00 equiv) in water (50 mL). The biphasicmixture was vigorously stirred until thin layer chromatographyindicated complete consumption of the starting material. Thewatery phase was discarded and the organic phase washed withan aq. HCl-solution (1 M, 3 × 10 mL) and water (3 × 10 mL),then dried over MgSO4. The solution was concentrated to avolume of 5 mL under reduced pressure and added to a solu-tion of 9 (609 mg, 4.00 mmol, 1.00 equiv) in acetic acid(20 mL). The reaction mixture was stirred at 60 °C for twoweeks, cooled to room temperature, poured onto ice cooled sat.aq. NaHCO3-solution and extracted with EtOAc (3 × 50 mL).The combined organic extracts were washed with water(3 × 50 mL), sat. aq. NaCl solution (30 mL) and dired overMgSO4. The solvent was evaporated under reduced pressureand the residue purified by silica gel column chromatography(cyclohexane/EtOAc 3:1). The product was obtained as orangesolid (431 mg, 1.67 mmol, 42%): Rf = 0.52 (cyclohexane/EtOAc 3:1); mp: 103.6 °C; 1H NMR, H,H-COSY (400 MHz,DMSO-d6) δ (ppm) 9.34 (d, J = 2.3 Hz, 1H), 9.22 (d,J = 2.0 Hz, 1H), 8.50 (pseudo-t, J = 2.2 Hz, 1H), 8.09–8.01 (m,2H), 7.52–7.44 (m, 2H), 3.95 (s, 3H); 13C NMR, DEPT135,HSQC, HMBC (75.5 MHz, DMSO-d6) δ (ppm) 164.5, 164.4 (d,J = 251.8 Hz), 151.8, 150.3, 148.5 (d, J = 2.8 Hz), 146.7, 126.4
64
Beilstein J. Org. Chem. 2019, 15, 2170–2183.
2180
(d, J = 6.7 Hz), 125.4 (d, J = 9.5 Hz), 116.6 (d, J = 23.2 Hz),52.7; IR (ATR) ν (cm−1): 3081, 1713, 1583, 1496, 1286, 1222,1092, 1000, 843, 498.
5-[(4-Fluorophenyl)diazenyl]nicotinamide (11): Synthesiswas conducted following the general procedure of nicoti-namides from methyl nicotinates, using 10 (160 mg, 0.62 mmol,1.00 equiv). The product was obtained as orange solid (149 mg,0.61 mmol, 98%): Rf = 0.65 (EtOAc/MeOH 95:5); mp:212.3 °C; 1H NMR, H,H-COSY (400 MHz, DMSO-d6) δ (ppm)9.24 (d, J = 2.3 Hz, 1H), 9.20 (d, J = 2.0 Hz, 1H), 8.58 (pseudo-t, J = 2.2 Hz, 1H), 8.38 (s, br, 1H), 8.08–8.02 (m, 2H), 7.80 (s,br, 1H), 7.53–7.45 (m, 2H); 13C NMR, DEPT135, HSQC,HMBC (75.5 MHz, DMSO-d6) δ (ppm) 165.6, 164.3 (d,J = 251.4 Hz), 150.7, 148.6 (d, J = 2.8 Hz), 148.2, 146.7, 130.5,125.7, 125.3 (d, J = 9.4 Hz), 116.6 (d, J = 23.2 Hz); IR (ATR) ν(cm−1): 3359, 3125, 1669, 1628, 1496, 1398, 1136, 838, 808,692; HRESIMS: calcd for [C12H9N4OF + H]+ 224.0760, found224.0753; comp. purity (220 nm): 100%; anal. calcd forC12H9N4OF: N, 22.94; C, 59.02; H, 3.71; found: N, 22.95; C,59.46; H, 3.92.
Cloning, expression and purification of recombinant pro-teins: Expression and purification of Sirt1133-747, Sirt256−356,and Sirt3118−395 was carried out as described previously. Iden-tity and purity were verified by SDS-PAGE [65]. Protein con-centration was determined by the Bradford assay [66]. Deacy-lase activity of sirtuin isotypes could be inhibited with nicoti-namide and was shown to be NAD+-dependent.
Bioassay: The inhibitory effect of compounds 2a–h, 4a/b, 8aand 11 on Sirt1–3 was detected via a previously reportedfluorescence based assay [38]. The synthetic substrateZ-Lys(acetyl)-AMC (ZMAL) is deacetylated by sirtuins, fol-lowed by tryptic digestion and thereby release of 7-amino-methylcoumarin, leading to a fluorescent readout. Inhibitionwas determined by comparing percentage substrate conversionto a DMSO control after subtraction of the blank fluorescencesignal. All compounds were tested at 100 µM, 50 µM and10 µM, respectively. For compounds that showed more than50% inhibition at 10 µM an IC50 value was determined. IC50values were calculated with OriginPro 9.0 G using a non-linearregression to fit the dose response curve. An enzyme-free blankcontrol and a 100% conversion control using AMC instead ofZMAL were measured as well. Inhibition measurements wereperformed in biological duplicates for all compounds.
Photochemistry: All photoisomerization experiments wereconducted under ruby light of 630 nm. Illumination wasexecuted using a Bio-Link 254 Crosslinker from Vilber-Lourmat equipped with six Vilber-Lourmat T8-C lamps (8 W,
254 nm) or six Vilber-Lourmat T8-L lamps (8W, 365 nm), re-spectively. Visible light radiation of 630 nm (red), 500 nm(green) and 452 nm (blue) was derived from a PaulmannFlexLED 3D strip. All compounds were irradiated in solution,using spectrophotometric grade solvents. Photoisomerizationand UV–vis spectra measurement was conducted in quartzcuvettes at room temperature.
Computational details: All calculations were carried out usingthe TURBOMOLE version 7.2 quantum chemistry package[67]. Geometry optimizations of all compounds in differentconformers were carried out using DFT with PBE approxima-tion to the exchange-correlation (XC) functional and employ-ing the SV(P) basis set [68,69]. The 10 lowest excitation ener-gies and their oscillator strengths were computed using theSV(P) basis and the larger def2-TZVP basis set [69]. This wasdone using TDDFT with the hybrid approximation to the XCfunctional PBE0, CC2, and ADC(2) [51-53,70-72]. ADC(2) andCC2 calculations make use of the resolution-of-identity approx-imation [73]. ADC(2) calculations were also done using thecontinuum solvent model COSMO as previously described[54,55,74-76]. A dielectric constant of 62.14 and a refractiveindex of 1.3379 were used, which corresponds to a solvent of a6/4-mixture of methanol/water, as experimentally determined[77,78]. Broadened absorption spectra were simulated byconverting oscillator strengths to decadic extinction coeffi-cients using a Gaussian line shape with a full-width-at-half-maximum of 0.3 eV [79-82].
Supporting InformationThe Supporting Information features experimental andanalytical data for the synthesis of intermediates andcompounds 4a, 4b, 2c–2h and 8a and 1H and 13C NMRspectra for all synthesized compounds. Procedures ofphotochemical experiments and their analysis aredescribed. Detailed summaries of electronic structurecalculations for two conformers (A and B) of each doublebond isomer ((E)-2b and (Z)-2b), photocyclization andoxidation products 8a and 8b are given.
Supporting Information File 1Experimental procedures, analytical data and quantumchemical calulations.[https://www.beilstein-journals.org/bjoc/content/supplementary/1860-5397-15-214-S1.pdf]
AcknowledgementsThe Jung group thanks the Deutsche Forschungsgemeinschaft(DFG, Ju295/14-1 and RTG1976) for funding.
65
Beilstein J. Org. Chem. 2019, 15, 2170–2183.
2181
ORCID® iDsChristoph W. Grathwol - https://orcid.org/0000-0003-0232-3279Enrico Tapavicza - https://orcid.org/0000-0002-0640-0297Robert K. Hofstetter - https://orcid.org/0000-0002-1077-9703Manfred Jung - https://orcid.org/0000-0002-6361-7716Andreas Link - https://orcid.org/0000-0003-1262-6636
PreprintA non-peer-reviewed version of this article has been previously publishedas a preprint doi:10.3762/bxiv.2019.53.v1
References1. Schiedel, M.; Robaa, D.; Rumpf, T.; Sippl, W.; Jung, M.
Med. Res. Rev. 2018, 38, 147–200. doi:10.1002/med.214362. Frye, R. A. Biochem. Biophys. Res. Commun. 2000, 273, 793–798.
doi:10.1006/bbrc.2000.30003. Vaziri, H.; Dessain, S. K.; Eaton, E. N.; Imai, S.-I.; Frye, R. A.;
Pandita, T. K.; Guarente, L.; Weinberg, R. A. Cell 2001, 107, 149–159.doi:10.1016/s0092-8674(01)00527-x
4. Perrod, S.; Cockell, M. M.; Laroche, T.; Renauld, H.; Ducrest, A.-L.;Bonnard, C.; Gasser, S. M. EMBO J. 2001, 20, 197–209.doi:10.1093/emboj/20.1.197
5. Tanno, M.; Sakamoto, J.; Miura, T.; Shimamoto, K.; Horio, Y.J. Biol. Chem. 2007, 282, 6823–6832. doi:10.1074/jbc.m609554200
6. Rumpf, T.; Schiedel, M.; Karaman, B.; Roessler, C.; North, B. J.;Lehotzky, A.; Oláh, J.; Ladwein, K. I.; Schmidtkunz, K.; Gajer, M.;Pannek, M.; Steegborn, C.; Sinclair, D. A.; Gerhardt, S.; Ovádi, J.;Schutkowski, M.; Sippl, W.; Einsle, O.; Jung, M. Nat. Commun. 2015,6, 6263. doi:10.1038/ncomms7263
7. North, B. J.; Verdin, E. PLoS One 2007, 2, e784.doi:10.1371/journal.pone.0000784
8. Schwer, B.; North, B. J.; Frye, R. A.; Ott, M.; Verdin, E. J. Cell Biol.2002, 158, 647–657. doi:10.1083/jcb.200205057
9. AOP Orphan Pharmaceuticals AG. 2017;https://www.aoporphan.com/global_en/our-company/newsroom/aop-orphan-pharmaceuticals-ag-to-acquire-selisistat-a-clinical-stage-drug-candidate-for-the-treatment-of-huntingtons-disease-hd (accessed June 17,2019).
10. Süssmuth, S. D.; Haider, S.; Landwehrmeyer, G. B.; Farmer, R.;Frost, C.; Tripepi, G.; Andersen, C. A.; Di Bacco, M.; Lamanna, C.;Diodato, E.; Massai, L.; Diamanti, D.; Mori, E.; Magnoni, L.;Dreyhaupt, J.; Schiefele, K.; Craufurd, D.; Saft, C.; Rudzinska, M.;Ryglewicz, D.; Orth, M.; Brzozy, S.; Baran, A.; Pollio, G.; Andre, R.;Tabrizi, S. J.; Darpo, B.; Westerberg, G.;the PADDINGTON Consortium. Br. J. Clin. Pharmacol. 2015, 79,465–476. doi:10.1111/bcp.12512
11. Chopra, V.; Quinti, L.; Kim, J.; Vollor, L.; Narayanan, K. L.; Edgerly, C.;Cipicchio, P. M.; Lauver, M. A.; Choi, S. H.; Silverman, R. B.;Ferrante, R. J.; Hersch, S.; Kazantsev, A. G. Cell Rep. 2012, 2,1492–1497. doi:10.1016/j.celrep.2012.11.001
12. Outeiro, T. F.; Kontopoulos, E.; Altmann, S. M.; Kufareva, I.;Strathearn, K. E.; Amore, A. M.; Volk, C. B.; Maxwell, M. M.;Rochet, J.-C.; McLean, P. J.; Young, A. B.; Abagyan, R.; Feany, M. B.;Hyman, B. T.; Kazantsev, A. G. Science 2007, 317, 516–519.doi:10.1126/science.1143780
13. Pillai, V. B.; Bindu, S.; Sharp, W.; Fang, Y. H.; Kim, G.; Gupta, M.;Samant, S.; Gupta, M. P. Am. J. Physiol.: Heart Circ. Physiol. 2016,310, H962–H972. doi:10.1152/ajpheart.00832.2015
14. Lu, Y.; Wang, Y.-d.; Wang, X.-y.; Chen, H.; Cai, Z.-j.; Xiang, M.-x.Int. J. Cardiol. 2016, 220, 700–705. doi:10.1016/j.ijcard.2016.06.236
15. He, X.; Zeng, H.; Chen, J.-X. Int. J. Cardiol. 2016, 215, 349–357.doi:10.1016/j.ijcard.2016.04.092
16. Bellizzi, D.; Rose, G.; Cavalcante, P.; Covello, G.; Dato, S.;De Rango, F.; Greco, V.; Maggiolini, M.; Feraco, E.; Mari, V.;Franceschi, C.; Passarino, G.; De Benedictis, G. Genomics 2005, 85,258–263. doi:10.1016/j.ygeno.2004.11.003
17. Serrano, L.; Martínez-Redondo, P.; Marazuela-Duque, A.;Vazquez, B. N.; Dooley, S. J.; Voigt, P.; Beck, D. B.;Kane-Goldsmith, N.; Tong, Q.; Rabanal, R. M.; Fondevila, D.;Muñoz, P.; Krüger, M.; Tischfield, J. A.; Vaquero, A. Genes Dev. 2013,27, 639–653. doi:10.1101/gad.211342.112
18. Cameron, D.; Eisler, S. J. Phys. Org. Chem. 2018, 31, e3858.doi:10.1002/poc.3858
19. Suzuki, H. Bull. Chem. Soc. Jpn. 1952, 25, 145–150.doi:10.1246/bcsj.25.145
20. Bandara, H. M. D.; Burdette, S. C. Chem. Soc. Rev. 2012, 41,1809–1825. doi:10.1039/c1cs15179g
21. Cammenga, H. K.; Emel’yanenko, V. N.; Verevkin, S. P.Ind. Eng. Chem. Res. 2009, 48, 10120–10128. doi:10.1021/ie900800q
22. Meier, H. Angew. Chem., Int. Ed. Engl. 1992, 31, 1399–1420.doi:10.1002/anie.199213993
23. Han, W.-G.; Lovell, T.; Liu, T.; Noodleman, L. ChemPhysChem 2002,3, 167–178.doi:10.1002/1439-7641(20020215)3:2<167::aid-cphc167>3.0.co;2-g
24. Irie, M. Chem. Rev. 2000, 100, 1685–1716. doi:10.1021/cr980069d25. Chung, J. W.; Yoon, S.-J.; An, B.-K.; Park, S. Y. J. Phys. Chem. C
2013, 117, 11285–11291. doi:10.1021/jp401440s26. Lerch, M. M.; Hansen, M. J.; van Dam, G. M.; Szymanski, W.;
Feringa, B. L. Angew. Chem., Int. Ed. 2016, 55, 10978–10999.doi:10.1002/anie.201601931
27. Hüll, K.; Morstein, J.; Trauner, D. Chem. Rev. 2018, 118,10710–10747. doi:10.1021/acs.chemrev.8b00037
28. Hoorens, M. W. H.; Szymanski, W. Trends Biochem. Sci. 2018, 43,567–575. doi:10.1016/j.tibs.2018.05.004
29. Tochitsky, I.; Kienzler, M. A.; Isacoff, E.; Kramer, R. H. Chem. Rev.2018, 118, 10748–10773. doi:10.1021/acs.chemrev.7b00723
30. Szymański, W.; Beierle, J. M.; Kistemaker, H. A. V.; Velema, W. A.;Feringa, B. L. Chem. Rev. 2013, 113, 6114–6178.doi:10.1021/cr300179f
31. Crespi, S.; Simeth, N. A.; König, B. Nat. Rev. Chem. 2019, 3, 133–146.doi:10.1038/s41570-019-0074-6
32. Trapp, J.; Jochum, A.; Meier, R.; Saunders, L.; Marshall, B.; Kunick, C.;Verdin, E.; Goekjian, P.; Sippl, W.; Jung, M. J. Med. Chem. 2006, 49,7307–7316. doi:10.1021/jm060118b
33. Falenczyk, C.; Schiedel, M.; Karaman, B.; Rumpf, T.; Kuzmanovic, N.;Grøtli, M.; Sippl, W.; Jung, M.; König, B. Chem. Sci. 2014, 5,4794–4799. doi:10.1039/c4sc01346h
34. McDonald, O.; Lackey, K.; Davis-Ward, R.; Wood, E.; Samano, V.;Maloney, P.; Deanda, F.; Hunter, R. Bioorg. Med. Chem. Lett. 2006,16, 5378–5383. doi:10.1016/j.bmcl.2006.07.063
35. Swyter, S.; Schiedel, M.; Monaldi, D.; Szunyogh, S.; Lehotzky, A.;Rumpf, T.; Ovádi, J.; Sippl, W.; Jung, M. Philos. Trans. R. Soc., B2018, 373, 20170083. doi:10.1098/rstb.2017.0083
36. Buettelmann, B.; Alanine, A.; Bourson, A.; Gill, R.; Heitz, M.-P.;Mutel, V.; Pinard, E.; Trube, G.; Wyler, R. Chimia 2004, 58, 630–633.doi:10.2533/000942904777677579
37. Heck, R. F. Palladium reagents in organic syntheses; Academic Press:London, United Kingdom, 1990.
66
Beilstein J. Org. Chem. 2019, 15, 2170–2183.
2182
38. Heltweg, B.; Trapp, J.; Jung, M. Methods 2005, 36, 332–337.doi:10.1016/j.ymeth.2005.03.003
39. Cui, H.; Kamal, Z.; Ai, T.; Xu, Y.; More, S. S.; Wilson, D. J.; Chen, L.J. Med. Chem. 2014, 57, 8340–8357. doi:10.1021/jm500777s
40. Ai, T.; Wilson, D. J.; More, S. S.; Xie, J.; Chen, L. J. Med. Chem. 2016,59, 2928–2941. doi:10.1021/acs.jmedchem.5b01376
41. Schiedel, M.; Rumpf, T.; Karaman, B.; Lehotzky, A.; Oláh, J.;Gerhardt, S.; Ovádi, J.; Sippl, W.; Einsle, O.; Jung, M. J. Med. Chem.2016, 59, 1599–1612. doi:10.1021/acs.jmedchem.5b01517
42. Rumpf, T.; Schiedel, M.; Karaman, B.; Roessler, C.; North, B. J.;Lehotzky, A.; Oláh, J.; Ladwein, K. I.; Schmidtkunz, K.; Gajer, M.;Pannek, M.; Steegborn, C.; Sinclair, D. A.; Gerhardt, S.; Ovádi, J.;Schutkowski, M.; Sippl, W.; Einsle, O.; Jung, M. Nat. Commun. 2015,6, 6263. doi:10.1038/ncomms7263
43. Suzuki, T.; Khan, M. N. A.; Sawada, H.; Imai, E.; Itoh, Y.;Yamatsuta, K.; Tokuda, N.; Takeuchi, J.; Seko, T.; Nakagawa, H.;Miyata, N. J. Med. Chem. 2012, 55, 5760–5773.doi:10.1021/jm3002108
44. Sundriyal, S.; Moniot, S.; Mahmud, Z.; Yao, S.; Di Fruscia, P.;Reynolds, C. R.; Dexter, D. T.; Sternberg, M. J. E.; Lam, E. W.-F.;Steegborn, C.; Fuchter, M. J. J. Med. Chem. 2017, 60, 1928–1945.doi:10.1021/acs.jmedchem.6b01690
45. Huang, S.; Song, C.; Wang, X.; Zhang, G.; Wang, Y.; Jiang, X.;Sun, Q.; Huang, L.; Xiang, R.; Hu, Y.; Li, L.; Yang, S.J. Chem. Inf. Model. 2017, 57, 669–679. doi:10.1021/acs.jcim.6b00714
46. Robaa, D.; Monaldi, D.; Wössner, N.; Kudo, N.; Rumpf, T.;Schiedel, M.; Yoshida, M.; Jung, M. Chem. Rec. 2018, 18, 1701–1707.doi:10.1002/tcr.201800044
47. Smakula, A. Z. Phys. Chem. 1934, 25B, 90–98.doi:10.1515/zpch-1934-2508
48. Buckles, R. E. J. Am. Chem. Soc. 1955, 77, 1040–1041.doi:10.1021/ja01609a073
49. Ciamician, G.; Silber, P. Ber. Dtsch. Chem. Ges. 1902, 35, 4128–4131.doi:10.1002/cber.19020350450
50. Lewis, F. D.; Kalgutkar, R. S.; Yang, J.-S. J. Am. Chem. Soc. 2001,123, 3878–3884. doi:10.1021/ja0042027
51. Christiansen, O.; Koch, H.; Jørgensen, P. Chem. Phys. Lett. 1995, 243,409–418. doi:10.1016/0009-2614(95)00841-q
52. Hättig, C.; Köhn, A. J. Chem. Phys. 2002, 117, 6939–6951.doi:10.1063/1.1506918
53. Hättig, C. Adv. Quantum Chem. 2005, 50, 37–60.doi:10.1016/s0065-3276(05)50003-0
54. Klamt, A.; Schüürmann, G. J. Chem. Soc., Perkin Trans. 2 1993,799–805. doi:10.1039/p29930000799
55. Lunkenheimer, B.; Köhn, A. J. Chem. Theory Comput. 2013, 9,977–994. doi:10.1021/ct300763v
56. Send, R.; Kühn, M.; Furche, F. J. Chem. Theory Comput. 2011, 7,2376–2386. doi:10.1021/ct200272b
57. Broichhagen, J.; Frank, J. A.; Trauner, D. Acc. Chem. Res. 2015, 48,1947–1960. doi:10.1021/acs.accounts.5b00129
58. Schoenberger, M.; Damijonaitis, A.; Zhang, Z.; Nagel, D.; Trauner, D.ACS Chem. Neurosci. 2014, 5, 514–518. doi:10.1021/cn500070w
59. Morstein, J.; Awale, M.; Reymond, J.-L.; Trauner, D. ACS Cent. Sci.2019, 5, 607–618. doi:10.1021/acscentsci.8b00881
60. Hauwert, N. J.; Mocking, T. A. M.; Da Costa Pereira, D.; Lion, K.;Huppelschoten, Y.; Vischer, H. F.; De Esch, I. J. P.; Wijtmans, M.;Leurs, R. Angew. Chem., Int. Ed. 2019, 58, 4531–4535.doi:10.1002/anie.201813110
61. Hauwert, N. J.; Mocking, T. A. M.; Da Costa Pereira, D.; Lion, K.;Huppelschoten, Y.; Vischer, H. F.; De Esch, I. J. P.; Wijtmans, M.;Leurs, R. Angew. Chem. 2019, 131, 4579–4583.doi:10.1002/ange.201813110
62. Simeth, N. A.; Bellisario, A.; Crespi, S.; Fagnoni, M.; König, B.J. Org. Chem. 2019, 84, 6565–6575. doi:10.1021/acs.joc.8b02973
63. Schehr, M.; Ianes, C.; Weisner, J.; Heintze, L.; Müller, M. P.; Pichlo, C.;Charl, J.; Brunstein, E.; Ewert, J.; Lehr, M.; Baumann, U.; Rauh, D.;Knippschild, U.; Peifer, C.; Herges, R. Photochem. Photobiol. Sci.2019, 18, 1398–1407. doi:10.1039/c9pp00010k
64. Rustler, K.; Maleeva, G.; Bregestovski, P.; König, B.Beilstein J. Org. Chem. 2019, 15, 780–788. doi:10.3762/bjoc.15.74
65. Schiedel, M.; Herp, D.; Hammelmann, S.; Swyter, S.; Lehotzky, A.;Robaa, D.; Oláh, J.; Ovádi, J.; Sippl, W.; Jung, M. J. Med. Chem. 2018,61, 482–491. doi:10.1021/acs.jmedchem.6b01872
66. Laemmli, U. K. Nature 1970, 227, 680–685. doi:10.1038/227680a067. TURBOMOLE, V7.2 2017; University of Karlsruhe and
Forschungszentrum Karlsruhe GmbH, TURBOMOLE GmbH:Karlsruhe, Germany, 2007, http://www.turbomole.com.
68. Perdew, J. P.; Burke, K.; Ernzerhof, M. Phys. Rev. Lett. 1996, 77,3865–3868. doi:10.1103/physrevlett.77.3865
69. Schäfer, A.; Horn, H.; Ahlrichs, R. J. Chem. Phys. 1992, 97,2571–2577. doi:10.1063/1.463096
70. Perdew, J. P.; Ernzerhof, M.; Burke, K. J. Chem. Phys. 1996, 105,9982–9985. doi:10.1063/1.472933
71. Bauernschmitt, R.; Ahlrichs, R. Chem. Phys. Lett. 1996, 256, 454–464.doi:10.1016/0009-2614(96)00440-x
72. Furche, F.; Ahlrichs, R. J. Chem. Phys. 2002, 117, 7433–7447.doi:10.1063/1.1508368
73. Eichkorn, K.; Weigend, F.; Treutler, O.; Ahlrichs, R. Theor. Chem. Acc.1997, 97, 119–124. doi:10.1007/s002140050244
74. De Haan, D. O.; Tapavicza, E.; Riva, M.; Cui, T.; Surratt, J. D.;Smith, A. C.; Jordan, M.-C.; Nilakantan, S.; Almodovar, M.;Stewart, T. N.; de Loera, A.; De Haan, A. C.; Cazaunau, M.;Gratien, A.; Pangui, E.; Doussin, J.-F. Environ. Sci. Technol. 2018, 52,4061–4071. doi:10.1021/acs.est.7b06105
75. Thompson, T.; Tapavicza, E. J. Phys. Chem. Lett. 2018, 9, 4758–4764.doi:10.1021/acs.jpclett.8b02048
76. Tapavicza, E.; Thompson, T.; Redd, K.; Kim, D.Phys. Chem. Chem. Phys. 2018, 20, 24807–24820.doi:10.1039/c8cp05181j
77. Mashimo, S.; Kuwabara, S.; Yagihara, S.; Higasi, K. J. Chem. Phys.1989, 90, 3292–3294. doi:10.1063/1.455883
78. Herráez, J. V.; Belda, R. J. Solution Chem. 2006, 35, 1315–1328.doi:10.1007/s10953-006-9059-4
79. Epstein, S. A.; Tapavicza, E.; Furche, F.; Nizkorodov, S. A.Atmos. Chem. Phys. 2013, 13, 9461–9477.doi:10.5194/acp-13-9461-2013
80. Schalk, O.; Geng, T.; Thompson, T.; Baluyot, N.; Thomas, R. D.;Tapavicza, E.; Hansson, T. J. Phys. Chem. A 2016, 120, 2320–2329.doi:10.1021/acs.jpca.5b10928
81. Cisneros, C.; Thompson, T.; Baluyot, N.; Smith, A. C.; Tapavicza, E.Phys. Chem. Chem. Phys. 2017, 19, 5763–5777.doi:10.1039/c6cp08064b
82. Tapavicza, E.; Furche, F.; Sundholm, D. J. Chem. Theory Comput.2016, 12, 5058–5066. doi:10.1021/acs.jctc.6b00720
67
Beilstein J. Org. Chem. 2019, 15, 2170–2183.
2183
License and TermsThis is an Open Access article under the terms of theCreative Commons Attribution License(http://creativecommons.org/licenses/by/4.0). Please notethat the reuse, redistribution and reproduction in particularrequires that the authors and source are credited.
The license is subject to the Beilstein Journal of OrganicChemistry terms and conditions:(https://www.beilstein-journals.org/bjoc)
The definitive version of this article is the electronic onewhich can be found at:doi:10.3762/bjoc.15.214
68
4.1 Peer‐reviewed articles
Paper III
Crystal structure of 7,8,15,16,17‐pentathiadispiro[5.2.5⁹.3⁶]heptadecane
Authors Robert K. Hofstetter, Benedict J. Elvers, Felix Potlitz, Andreas Link, and Carola Schulzke
Journal Acta Cryst. E 75.6 (2019): 888-891.
Analytical content Cyclic polysulfideswere found to release hydrogen sulfide in the presence ofwaterandnucleophiles. SinceRPLCof suchhydrolysis-prone analytesmay lead to the formation of analyti-cal artifacts, water-free SFC-MScorroborated the identity of 7,8,15,16,17-pentathiadispiro[5.2.5⁹.3⁶]heptadecane and verified the absence of starting material or degradation products.
Contributions
Robert K. Hofstetter Investigation, writing (original draft)Benedict J. Elvers Investigation, software, visualizationFelix Potlitz InvestigationAndreas Link Funding acquisition, resources, writing (original draft)Carola Schulze Project administration, resources, software, data curation, writing (origi-
nal draft, review and editing)
Robert K. Hofstetter Andreas Link
(signature) (signature)
69
electronic reprint
ISSN: 2056-9890
journals.iucr.org/e
Crystal structure of7,8,15,16,17-pentathiadispiro[5.2.59.36]heptadecane
Robert Hofstetter, Benedict J. Elvers, Felix Potlitz, Andreas Link andCarola Schulzke
Acta Cryst. (2019). E75, 888–891
IUCr JournalsCRYSTALLOGRAPHY JOURNALS ONLINE
This open-access article is distributed under the terms of the Creative Commons Attribution Licencehttp://creativecommons.org/licenses/by/4.0/legalcode, which permits unrestricted use, distribution, andreproduction in any medium, provided the original authors and source are cited.
Acta Cryst. (2019). E75, 888–891 Hofstetter et al. · C12H20S5
70
888 https://doi.org/10.1107/S2056989019007138 Acta Cryst. (2019). E75, 888–891
research communications
Received 29 March 2019
Accepted 16 May 2019
Edited by L. Fabian, University of East Anglia,
England
Keywords: crystal structure; sulfur-rich hetero-
cycles; spiro compounds; lenthionine deriva-
tive.
CCDC reference: 1916548
Supporting information: this article has
supporting information at journals.iucr.org/e
Crystal structure of 7,8,15,16,17-pentathiadi-spiro[5.2.59.36]heptadecane
Robert Hofstetter,a Benedict J. Elvers,b Felix Potlitz,a Andreas Linka* and Carola
Schulzkeb*
aInstitut fur Pharmazie, Universitat Greifswald, Friedrich-Ludwig-Jahn-Strasse 17, 17489 Greifswald, Germany, andbInstitut fur Biochemie, Universitat Greifswald, Felix-Hausdorff-Strasse 4, 17489 Greifswald, Germany. *Correspondence
e-mail: [email protected], [email protected]
The title compound, C12H20S5, crystallizes in the monoclinic space group P21/c
with four molecules in the unit cell. In the crystal, the asymmetric unit comprises
the entire molecule with the three cyclic moieties arranged in a line. The
molecules in the unit cell pack in a parallel fashion, with their longitudinal axes
arranged along a uniform direction. The packing is stabilized by the one-
dimensional propagation of non-classical hydrogen-bonding contacts between
the central sulfur atom of the S3 fragment and the C—H of a cyclohexyl group
from a glide-related molecule [C� � �S = 3.787 (2) A].
1. Chemical context
Cyclic polysulfides comprise a subgroup of pharmacologically
interesting organosulfur compounds that – depending on
constitution and conformation – have been shown to exert
specific antibacterial, antifungal, allelopathic and cytotoxic
activity (Davison & Sperry, 2017), as well as a plethora of H2S-
mediated effects relying on H2S formation (Szabo & Papa-
petropoulos, 2017). The benefits imparted by these
compounds have led to the evolution of synthetic pathways in
many natural products, as well as organoleptic detection
mechanisms in organisms confronted by them, including the
senses of smell and taste in humans. Thus, volatile organic
polysulfanes are among the most odorous compounds in
natural products, including meat (Zhao et al., 2019), plants
(Liang et al., 2017), and algae (Block et al., 2017). In fungi,
1,2,4-trithiolane, 1,2,4,6-tetrathiepane, and 1,2,3,4,5,6-hexa-
thiepane have been found to contribute to the unique aroma
of shiitake (Lentnius edodes), but it is 1,2,3,5,6-pentathiepane
(lenthionine) that combines the most potent biological (anti-
bacterial, antifungal, and anti-coagulative) and sensory
activity (Davison & Sperry, 2017). Structural characterizations
of this type of compounds are rather rare. The very few
reports available in the literature include the crystal structures
of pentathiepanes featuring two vicinal carbon atoms (Sugi-
hara et al., 1999). The conformational study of the title
compound, 7,8,15,16,17-pentathiadispiro[5.2.59.36]heptadec-
ane (C12H20S5), is supposed to aid in the elucidation of the
mechanism of action by which naturally occurring and
synthetic pentathiepanes exert potent activity (Behnisch-
Cornwell et al., 2019) and to advance the application of
lenthionine derivatives for medical and material purposes
(Tanagi et al., 2019).
ISSN 2056-9890
electronic reprint
71
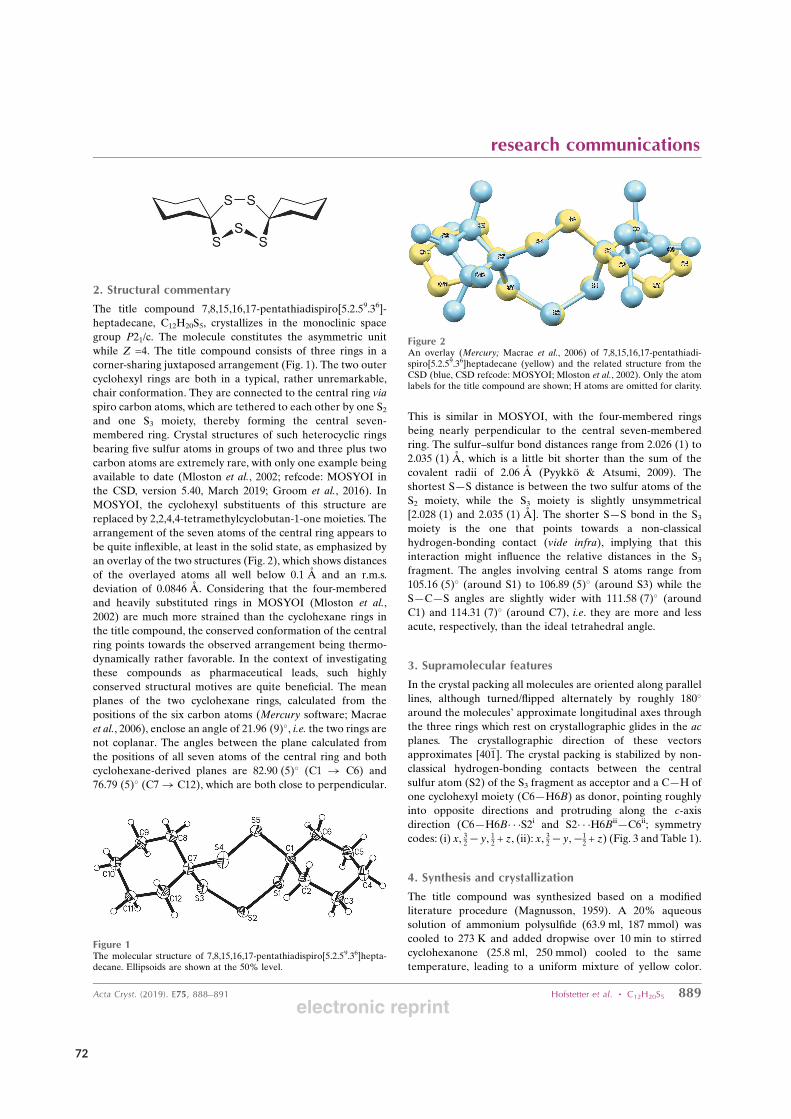
2. Structural commentary
The title compound 7,8,15,16,17-pentathiadispiro[5.2.59.36]-
heptadecane, C12H20S5, crystallizes in the monoclinic space
group P21/c. The molecule constitutes the asymmetric unit
while Z =4. The title compound consists of three rings in a
corner-sharing juxtaposed arrangement (Fig. 1). The two outer
cyclohexyl rings are both in a typical, rather unremarkable,
chair conformation. They are connected to the central ring via
spiro carbon atoms, which are tethered to each other by one S2and one S3 moiety, thereby forming the central seven-
membered ring. Crystal structures of such heterocyclic rings
bearing five sulfur atoms in groups of two and three plus two
carbon atoms are extremely rare, with only one example being
available to date (Mloston et al., 2002; refcode: MOSYOI in
the CSD, version 5.40, March 2019; Groom et al., 2016). In
MOSYOI, the cyclohexyl substituents of this structure are
replaced by 2,2,4,4-tetramethylcyclobutan-1-one moieties. The
arrangement of the seven atoms of the central ring appears to
be quite inflexible, at least in the solid state, as emphasized by
an overlay of the two structures (Fig. 2), which shows distances
of the overlayed atoms all well below 0.1 A and an r.m.s.
deviation of 0.0846 A. Considering that the four-membered
and heavily substituted rings in MOSYOI (Mloston et al.,
2002) are much more strained than the cyclohexane rings in
the title compound, the conserved conformation of the central
ring points towards the observed arrangement being thermo-
dynamically rather favorable. In the context of investigating
these compounds as pharmaceutical leads, such highly
conserved structural motives are quite beneficial. The mean
planes of the two cyclohexane rings, calculated from the
positions of the six carbon atoms (Mercury software; Macrae
et al., 2006), enclose an angle of 21.96 (9)�, i.e. the two rings arenot coplanar. The angles between the plane calculated from
the positions of all seven atoms of the central ring and both
cyclohexane-derived planes are 82.90 (5)� (C1 ! C6) and
76.79 (5)� (C7! C12), which are both close to perpendicular.
This is similar in MOSYOI, with the four-membered rings
being nearly perpendicular to the central seven-membered
ring. The sulfur–sulfur bond distances range from 2.026 (1) to
2.035 (1) A, which is a little bit shorter than the sum of the
covalent radii of 2.06 A (Pyykko & Atsumi, 2009). The
shortest S—S distance is between the two sulfur atoms of the
S2 moiety, while the S3 moiety is slightly unsymmetrical
[2.028 (1) and 2.035 (1) A]. The shorter S—S bond in the S3moiety is the one that points towards a non-classical
hydrogen-bonding contact (vide infra), implying that this
interaction might influence the relative distances in the S3fragment. The angles involving central S atoms range from
105.16 (5)� (around S1) to 106.89 (5)� (around S3) while the
S—C—S angles are slightly wider with 111.58 (7)� (around
C1) and 114.31 (7)� (around C7), i.e. they are more and less
acute, respectively, than the ideal tetrahedral angle.
3. Supramolecular features
In the crystal packing all molecules are oriented along parallel
lines, although turned/flipped alternately by roughly 180�
around the molecules’ approximate longitudinal axes through
the three rings which rest on crystallographic glides in the ac
planes. The crystallographic direction of these vectors
approximates [401]. The crystal packing is stabilized by non-
classical hydrogen-bonding contacts between the central
sulfur atom (S2) of the S3 fragment as acceptor and a C—H of
one cyclohexyl moiety (C6—H6B) as donor, pointing roughly
into opposite directions and protruding along the c-axis
direction (C6—H6B� � �S2i and S2� � �H6Bii—C6ii; symmetry
codes: (i) x, 32� y, 12 + z, (ii): x, 32� y,�12 + z) (Fig. 3 and Table 1).
4. Synthesis and crystallization
The title compound was synthesized based on a modified
literature procedure (Magnusson, 1959). A 20% aqueous
solution of ammonium polysulfide (63.9 ml, 187 mmol) was
cooled to 273 K and added dropwise over 10 min to stirred
cyclohexanone (25.8 ml, 250 mmol) cooled to the same
temperature, leading to a uniform mixture of yellow color.
research communications
Acta Cryst. (2019). E75, 888–891 Hofstetter et al. � C12H20S5 889
Figure 2An overlay (Mercury; Macrae et al., 2006) of 7,8,15,16,17-pentathiadi-spiro[5.2.59.36]heptadecane (yellow) and the related structure from theCSD (blue, CSD refcode: MOSYOI; Mloston et al., 2002). Only the atomlabels for the title compound are shown; H atoms are omitted for clarity.
Figure 1The molecular structure of 7,8,15,16,17-pentathiadispiro[5.2.59.36]hepta-decane. Ellipsoids are shown at the 50% level.
electronic reprint
72
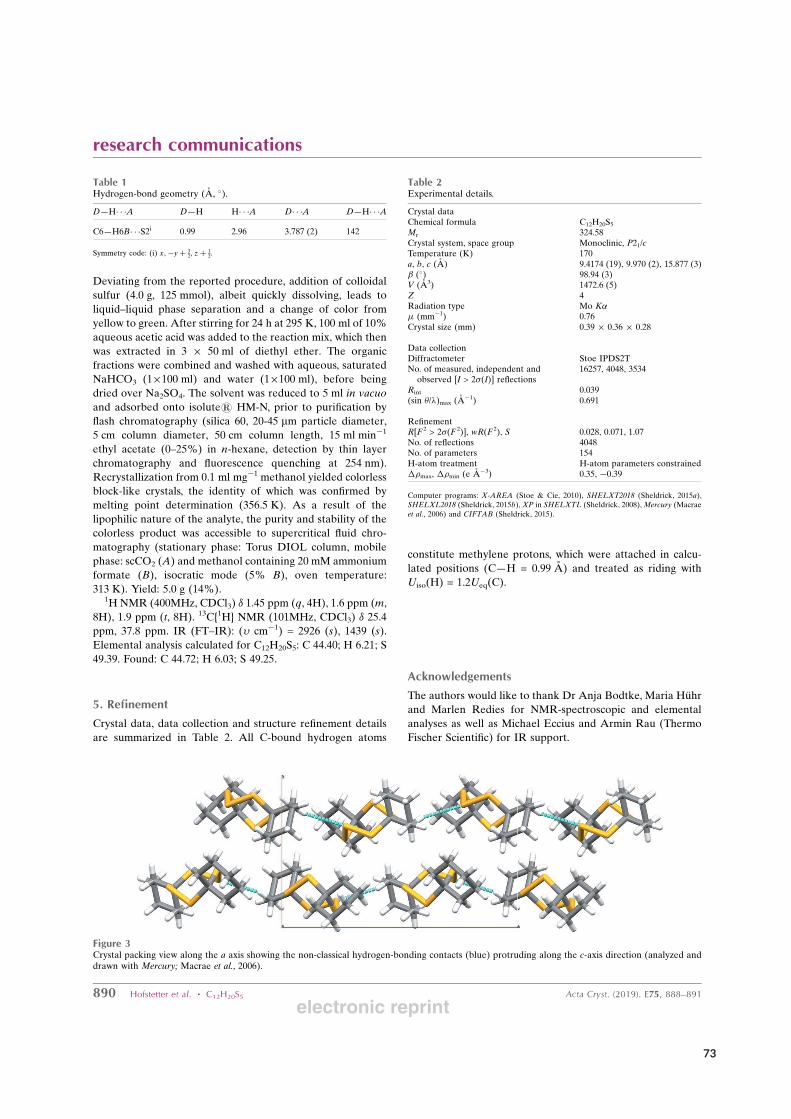
Deviating from the reported procedure, addition of colloidal
sulfur (4.0 g, 125 mmol), albeit quickly dissolving, leads to
liquid–liquid phase separation and a change of color from
yellow to green. After stirring for 24 h at 295 K, 100 ml of 10%
aqueous acetic acid was added to the reaction mix, which then
was extracted in 3 � 50 ml of diethyl ether. The organic
fractions were combined and washed with aqueous, saturated
NaHCO3 (1�100 ml) and water (1�100 ml), before being
dried over Na2SO4. The solvent was reduced to 5 ml in vacuo
and adsorbed onto isolute1 HM-N, prior to purification by
flash chromatography (silica 60, 20-45 mm particle diameter,
5 cm column diameter, 50 cm column length, 15 ml min�1
ethyl acetate (0–25%) in n-hexane, detection by thin layer
chromatography and fluorescence quenching at 254 nm).
Recrystallization from 0.1 ml mg�1 methanol yielded colorless
block-like crystals, the identity of which was confirmed by
melting point determination (356.5 K). As a result of the
lipophilic nature of the analyte, the purity and stability of the
colorless product was accessible to supercritical fluid chro-
matography (stationary phase: Torus DIOL column, mobile
phase: scCO2 (A) and methanol containing 20 mM ammonium
formate (B), isocratic mode (5% B), oven temperature:
313 K). Yield: 5.0 g (14%).1H NMR (400MHz, CDCl3) � 1.45 ppm (q, 4H), 1.6 ppm (m,
8H), 1.9 ppm (t, 8H). 13C{1H} NMR (101MHz, CDCl3) � 25.4ppm, 37.8 ppm. IR (FT–IR): (� cm�1) = 2926 (s), 1439 (s).
Elemental analysis calculated for C12H20S5: C 44.40; H 6.21; S
49.39. Found: C 44.72; H 6.03; S 49.25.
5. Refinement
Crystal data, data collection and structure refinement details
are summarized in Table 2. All C-bound hydrogen atoms
constitute methylene protons, which were attached in calcu-
lated positions (C—H = 0.99 A) and treated as riding with
Uiso(H) = 1.2Ueq(C).
Acknowledgements
The authors would like to thank Dr Anja Bodtke, Maria Huhr
and Marlen Redies for NMR-spectroscopic and elemental
analyses as well as Michael Eccius and Armin Rau (Thermo
Fischer Scientific) for IR support.
890 Hofstetter et al. � C12H20S5 Acta Cryst. (2019). E75, 888–891
research communications
Table 2Experimental details.
Crystal dataChemical formula C12H20S5Mr 324.58Crystal system, space group Monoclinic, P21/cTemperature (K) 170a, b, c (A) 9.4174 (19), 9.970 (2), 15.877 (3)� (�) 98.94 (3)V (A3) 1472.6 (5)Z 4Radiation type Mo K�� (mm�1) 0.76Crystal size (mm) 0.39 � 0.36 � 0.28
Data collectionDiffractometer Stoe IPDS2TNo. of measured, independent and
observed [I > 2�(I)] reflections16257, 4048, 3534
Rint 0.039(sin �/)max (A
�1) 0.691
RefinementR[F 2 > 2�(F 2)], wR(F 2), S 0.028, 0.071, 1.07No. of reflections 4048No. of parameters 154H-atom treatment H-atom parameters constrained�max, �min (e A�3) 0.35, �0.39
Computer programs: X-AREA (Stoe & Cie, 2010), SHELXT2018 (Sheldrick, 2015a),SHELXL2018 (Sheldrick, 2015b), XP in SHELXTL (Sheldrick, 2008),Mercury (Macraeet al., 2006) and CIFTAB (Sheldrick, 2015).
Table 1Hydrogen-bond geometry (A, �).
D—H� � �A D—H H� � �A D� � �A D—H� � �AC6—H6B� � �S2i 0.99 2.96 3.787 (2) 142
Symmetry code: (i) x;�yþ 32; zþ 1
2.
Figure 3Crystal packing view along the a axis showing the non-classical hydrogen-bonding contacts (blue) protruding along the c-axis direction (analyzed anddrawn with Mercury; Macrae et al., 2006).
electronic reprint
73
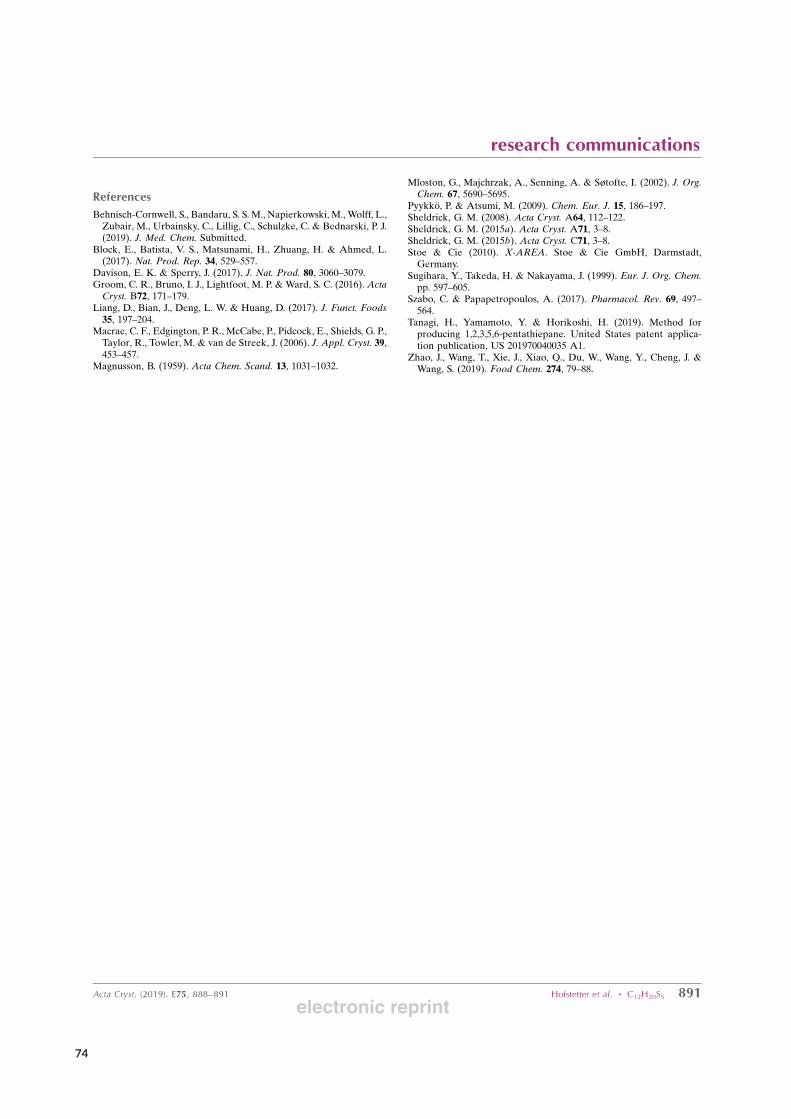
References
Behnisch-Cornwell, S., Bandaru, S. S. M., Napierkowski, M., Wolff, L.,Zubair, M., Urbainsky, C., Lillig, C., Schulzke, C. & Bednarski, P. J.(2019). J. Med. Chem. Submitted.
Block, E., Batista, V. S., Matsunami, H., Zhuang, H. & Ahmed, L.(2017). Nat. Prod. Rep. 34, 529–557.
Davison, E. K. & Sperry, J. (2017). J. Nat. Prod. 80, 3060–3079.Groom, C. R., Bruno, I. J., Lightfoot, M. P. & Ward, S. C. (2016). ActaCryst. B72, 171–179.
Liang, D., Bian, J., Deng, L. W. & Huang, D. (2017). J. Funct. Foods35, 197–204.
Macrae, C. F., Edgington, P. R., McCabe, P., Pidcock, E., Shields, G. P.,Taylor, R., Towler, M. & van de Streek, J. (2006). J. Appl. Cryst. 39,453–457.
Magnusson, B. (1959). Acta Chem. Scand. 13, 1031–1032.
Mloston, G., Majchrzak, A., Senning, A. & Søtofte, I. (2002). J. Org.Chem. 67, 5690–5695.
Pyykko, P. & Atsumi, M. (2009). Chem. Eur. J. 15, 186–197.Sheldrick, G. M. (2008). Acta Cryst. A64, 112–122.Sheldrick, G. M. (2015a). Acta Cryst. A71, 3–8.Sheldrick, G. M. (2015b). Acta Cryst. C71, 3–8.Stoe & Cie (2010). X-AREA. Stoe & Cie GmbH, Darmstadt,Germany.
Sugihara, Y., Takeda, H. & Nakayama, J. (1999). Eur. J. Org. Chem.pp. 597–605.
Szabo, C. & Papapetropoulos, A. (2017). Pharmacol. Rev. 69, 497–564.
Tanagi, H., Yamamoto, Y. & Horikoshi, H. (2019). Method forproducing 1,2,3,5,6-pentathiepane. United States patent applica-tion publication, US 201970040035 A1.
Zhao, J., Wang, T., Xie, J., Xiao, Q., Du, W., Wang, Y., Cheng, J. &Wang, S. (2019). Food Chem. 274, 79–88.
research communications
Acta Cryst. (2019). E75, 888–891 Hofstetter et al. � C12H20S5 891electronic reprint
74
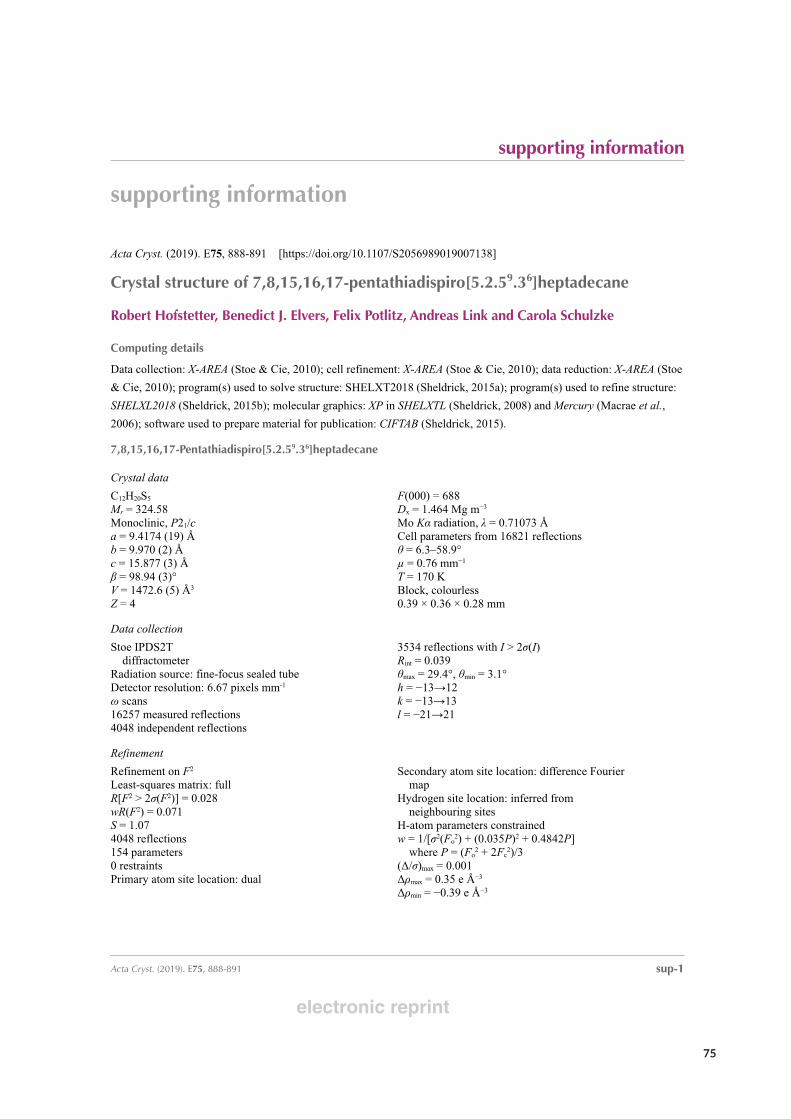
supporting information
sup-1Acta Cryst. (2019). E75, 888-891
supporting information
Acta Cryst. (2019). E75, 888-891 [https://doi.org/10.1107/S2056989019007138]
Crystal structure of 7,8,15,16,17-pentathiadispiro[5.2.59.36]heptadecane
Robert Hofstetter, Benedict J. Elvers, Felix Potlitz, Andreas Link and Carola Schulzke
Computing details
Data collection: X-AREA (Stoe & Cie, 2010); cell refinement: X-AREA (Stoe & Cie, 2010); data reduction: X-AREA (Stoe
& Cie, 2010); program(s) used to solve structure: SHELXT2018 (Sheldrick, 2015a); program(s) used to refine structure:
SHELXL2018 (Sheldrick, 2015b); molecular graphics: XP in SHELXTL (Sheldrick, 2008) and Mercury (Macrae et al.,
2006); software used to prepare material for publication: CIFTAB (Sheldrick, 2015).
7,8,15,16,17-Pentathiadispiro[5.2.59.36]heptadecane
Crystal data
C12H20S5
Mr = 324.58Monoclinic, P21/ca = 9.4174 (19) Åb = 9.970 (2) Åc = 15.877 (3) Åβ = 98.94 (3)°V = 1472.6 (5) Å3
Z = 4
F(000) = 688Dx = 1.464 Mg m−3
Mo Kα radiation, λ = 0.71073 ÅCell parameters from 16821 reflectionsθ = 6.3–58.9°µ = 0.76 mm−1
T = 170 KBlock, colourless0.39 × 0.36 × 0.28 mm
Data collection
Stoe IPDS2T diffractometer
Radiation source: fine-focus sealed tubeDetector resolution: 6.67 pixels mm-1
ω scans16257 measured reflections4048 independent reflections
3534 reflections with I > 2σ(I)Rint = 0.039θmax = 29.4°, θmin = 3.1°h = −13→12k = −13→13l = −21→21
Refinement
Refinement on F2
Least-squares matrix: fullR[F2 > 2σ(F2)] = 0.028wR(F2) = 0.071S = 1.074048 reflections154 parameters0 restraintsPrimary atom site location: dual
Secondary atom site location: difference Fourier map
Hydrogen site location: inferred from neighbouring sites
H-atom parameters constrainedw = 1/[σ2(Fo
2) + (0.035P)2 + 0.4842P] where P = (Fo
2 + 2Fc2)/3
(Δ/σ)max = 0.001Δρmax = 0.35 e Å−3
Δρmin = −0.39 e Å−3
electronic reprint
75
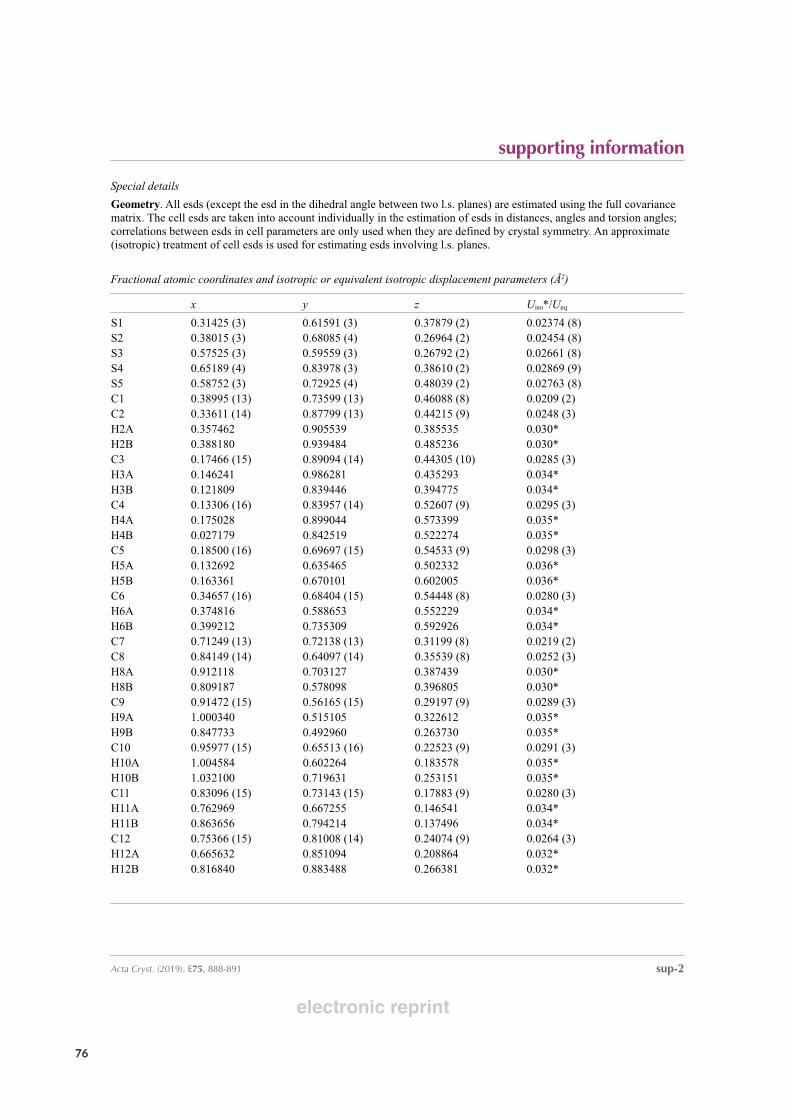
supporting information
sup-2Acta Cryst. (2019). E75, 888-891
Special details
Geometry. All esds (except the esd in the dihedral angle between two l.s. planes) are estimated using the full covariance matrix. The cell esds are taken into account individually in the estimation of esds in distances, angles and torsion angles; correlations between esds in cell parameters are only used when they are defined by crystal symmetry. An approximate (isotropic) treatment of cell esds is used for estimating esds involving l.s. planes.
Fractional atomic coordinates and isotropic or equivalent isotropic displacement parameters (Å2)
x y z Uiso*/Ueq
S1 0.31425 (3) 0.61591 (3) 0.37879 (2) 0.02374 (8)S2 0.38015 (3) 0.68085 (4) 0.26964 (2) 0.02454 (8)S3 0.57525 (3) 0.59559 (3) 0.26792 (2) 0.02661 (8)S4 0.65189 (4) 0.83978 (3) 0.38610 (2) 0.02869 (9)S5 0.58752 (3) 0.72925 (4) 0.48039 (2) 0.02763 (8)C1 0.38995 (13) 0.73599 (13) 0.46088 (8) 0.0209 (2)C2 0.33611 (14) 0.87799 (13) 0.44215 (9) 0.0248 (3)H2A 0.357462 0.905539 0.385535 0.030*H2B 0.388180 0.939484 0.485236 0.030*C3 0.17466 (15) 0.89094 (14) 0.44305 (10) 0.0285 (3)H3A 0.146241 0.986281 0.435293 0.034*H3B 0.121809 0.839446 0.394775 0.034*C4 0.13306 (16) 0.83957 (14) 0.52607 (9) 0.0295 (3)H4A 0.175028 0.899044 0.573399 0.035*H4B 0.027179 0.842519 0.522274 0.035*C5 0.18500 (16) 0.69697 (15) 0.54533 (9) 0.0298 (3)H5A 0.132692 0.635465 0.502332 0.036*H5B 0.163361 0.670101 0.602005 0.036*C6 0.34657 (16) 0.68404 (15) 0.54448 (8) 0.0280 (3)H6A 0.374816 0.588653 0.552229 0.034*H6B 0.399212 0.735309 0.592926 0.034*C7 0.71249 (13) 0.72138 (13) 0.31199 (8) 0.0219 (2)C8 0.84149 (14) 0.64097 (14) 0.35539 (8) 0.0252 (3)H8A 0.912118 0.703127 0.387439 0.030*H8B 0.809187 0.578098 0.396805 0.030*C9 0.91472 (15) 0.56165 (15) 0.29197 (9) 0.0289 (3)H9A 1.000340 0.515105 0.322612 0.035*H9B 0.847733 0.492960 0.263730 0.035*C10 0.95977 (15) 0.65513 (16) 0.22523 (9) 0.0291 (3)H10A 1.004584 0.602264 0.183578 0.035*H10B 1.032100 0.719631 0.253151 0.035*C11 0.83096 (15) 0.73143 (15) 0.17883 (9) 0.0280 (3)H11A 0.762969 0.667255 0.146541 0.034*H11B 0.863656 0.794214 0.137496 0.034*C12 0.75366 (15) 0.81008 (14) 0.24074 (9) 0.0264 (3)H12A 0.665632 0.851094 0.208864 0.032*H12B 0.816840 0.883488 0.266381 0.032*
electronic reprint
76
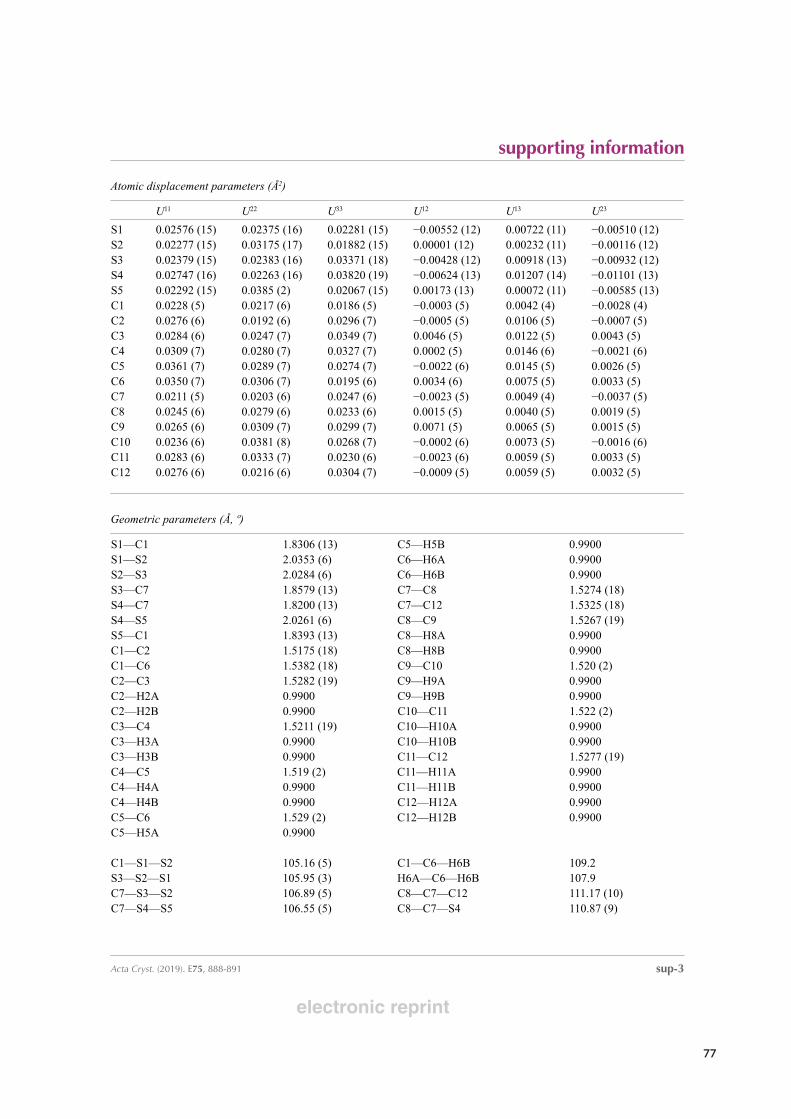
supporting information
sup-3Acta Cryst. (2019). E75, 888-891
Atomic displacement parameters (Å2)
U11 U22 U33 U12 U13 U23
S1 0.02576 (15) 0.02375 (16) 0.02281 (15) −0.00552 (12) 0.00722 (11) −0.00510 (12)S2 0.02277 (15) 0.03175 (17) 0.01882 (15) 0.00001 (12) 0.00232 (11) −0.00116 (12)S3 0.02379 (15) 0.02383 (16) 0.03371 (18) −0.00428 (12) 0.00918 (13) −0.00932 (12)S4 0.02747 (16) 0.02263 (16) 0.03820 (19) −0.00624 (13) 0.01207 (14) −0.01101 (13)S5 0.02292 (15) 0.0385 (2) 0.02067 (15) 0.00173 (13) 0.00072 (11) −0.00585 (13)C1 0.0228 (5) 0.0217 (6) 0.0186 (5) −0.0003 (5) 0.0042 (4) −0.0028 (4)C2 0.0276 (6) 0.0192 (6) 0.0296 (7) −0.0005 (5) 0.0106 (5) −0.0007 (5)C3 0.0284 (6) 0.0247 (7) 0.0349 (7) 0.0046 (5) 0.0122 (5) 0.0043 (5)C4 0.0309 (7) 0.0280 (7) 0.0327 (7) 0.0002 (5) 0.0146 (6) −0.0021 (6)C5 0.0361 (7) 0.0289 (7) 0.0274 (7) −0.0022 (6) 0.0145 (5) 0.0026 (5)C6 0.0350 (7) 0.0306 (7) 0.0195 (6) 0.0034 (6) 0.0075 (5) 0.0033 (5)C7 0.0211 (5) 0.0203 (6) 0.0247 (6) −0.0023 (5) 0.0049 (4) −0.0037 (5)C8 0.0245 (6) 0.0279 (6) 0.0233 (6) 0.0015 (5) 0.0040 (5) 0.0019 (5)C9 0.0265 (6) 0.0309 (7) 0.0299 (7) 0.0071 (5) 0.0065 (5) 0.0015 (5)C10 0.0236 (6) 0.0381 (8) 0.0268 (7) −0.0002 (6) 0.0073 (5) −0.0016 (6)C11 0.0283 (6) 0.0333 (7) 0.0230 (6) −0.0023 (6) 0.0059 (5) 0.0033 (5)C12 0.0276 (6) 0.0216 (6) 0.0304 (7) −0.0009 (5) 0.0059 (5) 0.0032 (5)
Geometric parameters (Å, º)
S1—C1 1.8306 (13) C5—H5B 0.9900S1—S2 2.0353 (6) C6—H6A 0.9900S2—S3 2.0284 (6) C6—H6B 0.9900S3—C7 1.8579 (13) C7—C8 1.5274 (18)S4—C7 1.8200 (13) C7—C12 1.5325 (18)S4—S5 2.0261 (6) C8—C9 1.5267 (19)S5—C1 1.8393 (13) C8—H8A 0.9900C1—C2 1.5175 (18) C8—H8B 0.9900C1—C6 1.5382 (18) C9—C10 1.520 (2)C2—C3 1.5282 (19) C9—H9A 0.9900C2—H2A 0.9900 C9—H9B 0.9900C2—H2B 0.9900 C10—C11 1.522 (2)C3—C4 1.5211 (19) C10—H10A 0.9900C3—H3A 0.9900 C10—H10B 0.9900C3—H3B 0.9900 C11—C12 1.5277 (19)C4—C5 1.519 (2) C11—H11A 0.9900C4—H4A 0.9900 C11—H11B 0.9900C4—H4B 0.9900 C12—H12A 0.9900C5—C6 1.529 (2) C12—H12B 0.9900C5—H5A 0.9900
C1—S1—S2 105.16 (5) C1—C6—H6B 109.2S3—S2—S1 105.95 (3) H6A—C6—H6B 107.9C7—S3—S2 106.89 (5) C8—C7—C12 111.17 (10)C7—S4—S5 106.55 (5) C8—C7—S4 110.87 (9)
electronic reprint
77
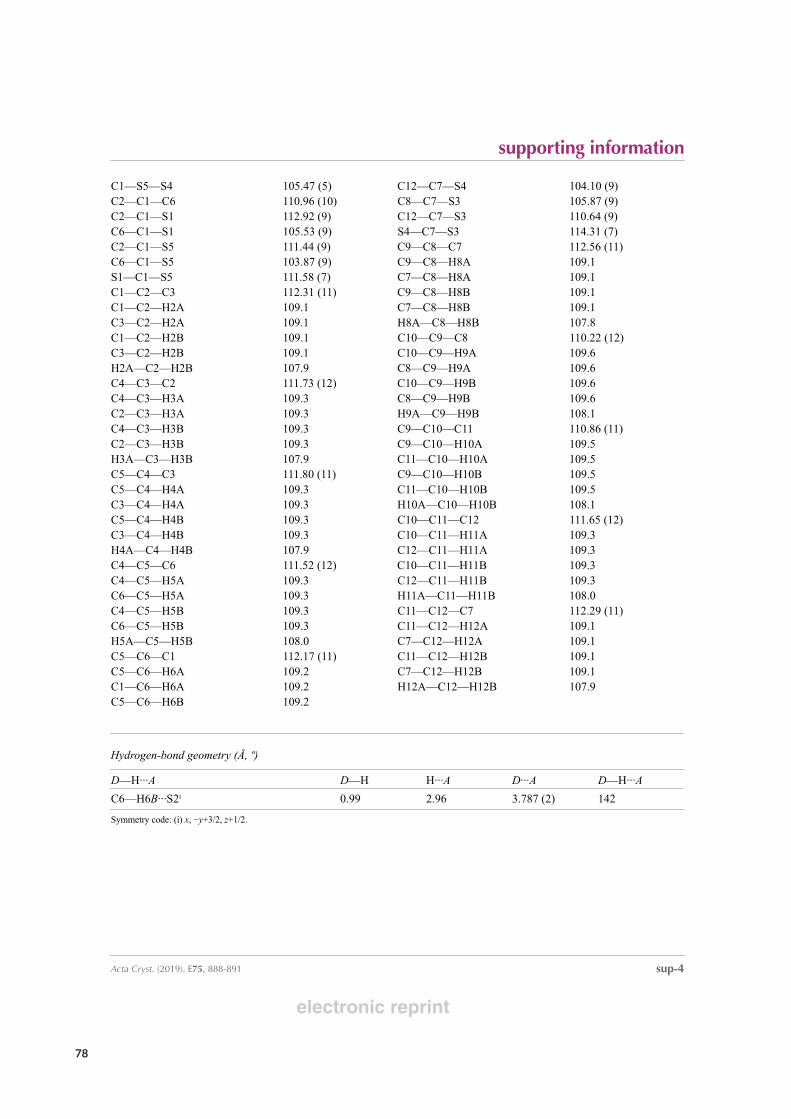
supporting information
sup-4Acta Cryst. (2019). E75, 888-891
C1—S5—S4 105.47 (5) C12—C7—S4 104.10 (9)C2—C1—C6 110.96 (10) C8—C7—S3 105.87 (9)C2—C1—S1 112.92 (9) C12—C7—S3 110.64 (9)C6—C1—S1 105.53 (9) S4—C7—S3 114.31 (7)C2—C1—S5 111.44 (9) C9—C8—C7 112.56 (11)C6—C1—S5 103.87 (9) C9—C8—H8A 109.1S1—C1—S5 111.58 (7) C7—C8—H8A 109.1C1—C2—C3 112.31 (11) C9—C8—H8B 109.1C1—C2—H2A 109.1 C7—C8—H8B 109.1C3—C2—H2A 109.1 H8A—C8—H8B 107.8C1—C2—H2B 109.1 C10—C9—C8 110.22 (12)C3—C2—H2B 109.1 C10—C9—H9A 109.6H2A—C2—H2B 107.9 C8—C9—H9A 109.6C4—C3—C2 111.73 (12) C10—C9—H9B 109.6C4—C3—H3A 109.3 C8—C9—H9B 109.6C2—C3—H3A 109.3 H9A—C9—H9B 108.1C4—C3—H3B 109.3 C9—C10—C11 110.86 (11)C2—C3—H3B 109.3 C9—C10—H10A 109.5H3A—C3—H3B 107.9 C11—C10—H10A 109.5C5—C4—C3 111.80 (11) C9—C10—H10B 109.5C5—C4—H4A 109.3 C11—C10—H10B 109.5C3—C4—H4A 109.3 H10A—C10—H10B 108.1C5—C4—H4B 109.3 C10—C11—C12 111.65 (12)C3—C4—H4B 109.3 C10—C11—H11A 109.3H4A—C4—H4B 107.9 C12—C11—H11A 109.3C4—C5—C6 111.52 (12) C10—C11—H11B 109.3C4—C5—H5A 109.3 C12—C11—H11B 109.3C6—C5—H5A 109.3 H11A—C11—H11B 108.0C4—C5—H5B 109.3 C11—C12—C7 112.29 (11)C6—C5—H5B 109.3 C11—C12—H12A 109.1H5A—C5—H5B 108.0 C7—C12—H12A 109.1C5—C6—C1 112.17 (11) C11—C12—H12B 109.1C5—C6—H6A 109.2 C7—C12—H12B 109.1C1—C6—H6A 109.2 H12A—C12—H12B 107.9C5—C6—H6B 109.2
Hydrogen-bond geometry (Å, º)
D—H···A D—H H···A D···A D—H···A
C6—H6B···S2i 0.99 2.96 3.787 (2) 142
Symmetry code: (i) x, −y+3/2, z+1/2.
electronic reprint
78
4.1 Peer‐reviewed articles
Paper IV
CO₂‐based supercritical fluid extraction–supercritical fluid chromatographyof saliva:single quadrupole mass spectrometric monitoring of caffeine
Authors Robert K. Hofstetter, Simon Kim, Lukas Schulig, Jonas Bethmann, and Andreas Link
Journal Pre-submission draft.
Analytical content Exploiting the well-known solubility and safety profile of caffeine, SFE-SFC-MSwas investigated as on-line treatment and analysis technique for salivary samples.
Contributions
Robert K. Hofstetter Conceptualization, supervision, writing (original draft)Simon Kim InvestigationLukas Schulig Software, data curation, visualization, writing (original draft, review and
editing)Michael Grimm Investigation, writing (review and editing)Maximilian Sager InvestigationPhilipp Aude InvestigationRebecca Keßler InvestigationJonas Bethmann ValidationWerner Weitschies SupervisionAndreas Link Project administration, funding, resources, supervision, writing (review
and editing)
Robert K. Hofstetter Andreas Link
(signature) (signature)
79
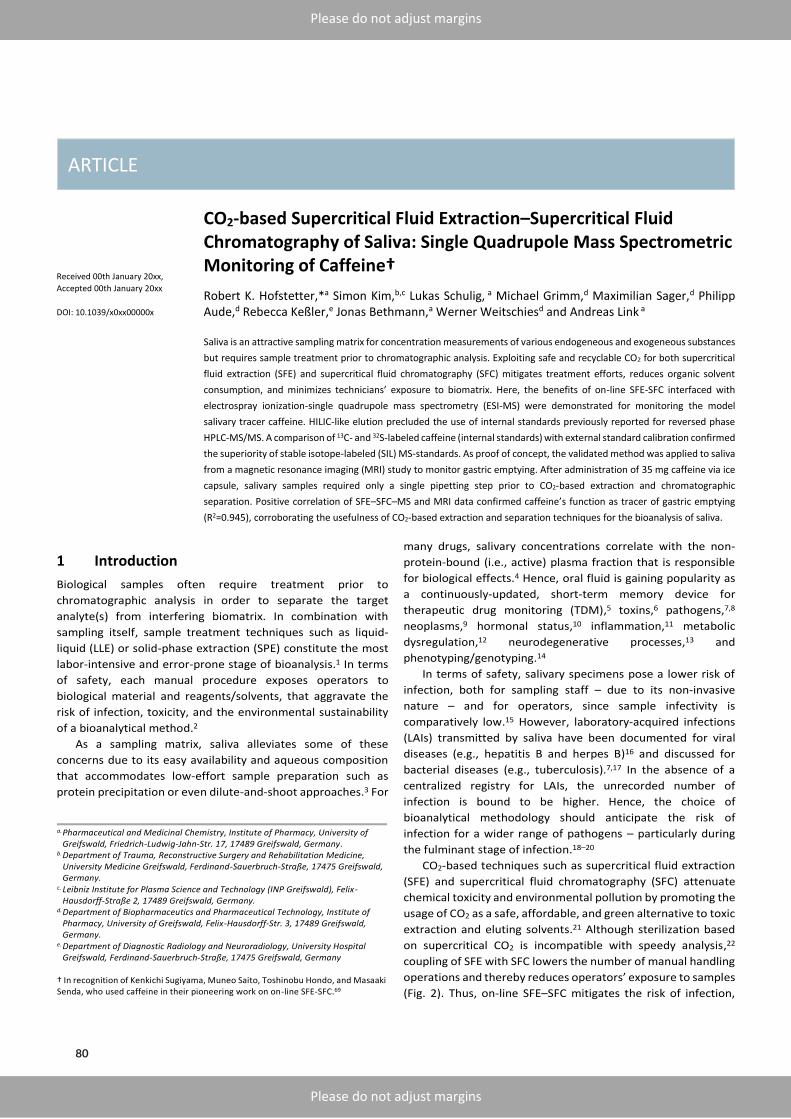
ARTICLE
Please do not adjust margins
Please do not adjust margins
Received 00th January 20xx,
Accepted 00th January 20xx
DOI: 10.1039/x0xx00000x
CO2-based Supercritical Fluid Extraction–Supercritical Fluid Chromatography of Saliva: Single Quadrupole Mass Spectrometric Monitoring of Caffeine†
Robert K. Hofstetter,*a Simon Kim,b,c Lukas Schulig, a Michael Grimm,d Maximilian Sager,d Philipp Aude,d Rebecca Keßler,e Jonas Bethmann,a Werner Weitschiesd and Andreas Link a
Saliva is an attractive sampling matrix for concentration measurements of various endogeneous and exogeneous substances
but requires sample treatment prior to chromatographic analysis. Exploiting safe and recyclable CO2 for both supercritical
fluid extraction (SFE) and supercritical fluid chromatography (SFC) mitigates treatment efforts, reduces organic solvent
consumption, and minimizes technicians’ exposure to biomatrix. Here, the benefits of on-line SFE-SFC interfaced with
electrospray ionization-single quadrupole mass spectrometry (ESI-MS) were demonstrated for monitoring the model
salivary tracer caffeine. HILIC-like elution precluded the use of internal standards previously reported for reversed phase
HPLC-MS/MS. A comparison of 13C- and 32S-labeled caffeine (internal standards) with external standard calibration confirmed
the superiority of stable isotope-labeled (SIL) MS-standards. As proof of concept, the validated method was applied to saliva
from a magnetic resonance imaging (MRI) study to monitor gastric emptying. After administration of 35 mg caffeine via ice
capsule, salivary samples required only a single pipetting step prior to CO2-based extraction and chromatographic
separation. Positive correlation of SFE–SFC–MS and MRI data confirmed caffeine’s function as tracer of gastric emptying
(R2=0.945), corroborating the usefulness of CO2-based extraction and separation techniques for the bioanalysis of saliva.
1 Introduction
Biological samples often require treatment prior to
chromatographic analysis in order to separate the target
analyte(s) from interfering biomatrix. In combination with
sampling itself, sample treatment techniques such as liquid-
liquid (LLE) or solid-phase extraction (SPE) constitute the most
labor-intensive and error-prone stage of bioanalysis.1 In terms
of safety, each manual procedure exposes operators to
biological material and reagents/solvents, that aggravate the
risk of infection, toxicity, and the environmental sustainability
of a bioanalytical method.2
As a sampling matrix, saliva alleviates some of these
concerns due to its easy availability and aqueous composition
that accommodates low-effort sample preparation such as
protein precipitation or even dilute-and-shoot approaches.3 For
many drugs, salivary concentrations correlate with the non-
protein-bound (i.e., active) plasma fraction that is responsible
for biological effects.4 Hence, oral fluid is gaining popularity as
a continuously-updated, short-term memory device for
therapeutic drug monitoring (TDM),5 toxins,6 pathogens,7,8
neoplasms,9 hormonal status,10 inflammation,11 metabolic
dysregulation,12 neurodegenerative processes,13 and
phenotyping/genotyping.14
In terms of safety, salivary specimens pose a lower risk of
infection, both for sampling staff – due to its non-invasive
nature – and for operators, since sample infectivity is
comparatively low.15 However, laboratory-acquired infections
(LAIs) transmitted by saliva have been documented for viral
diseases (e.g., hepatitis B and herpes B)16 and discussed for
bacterial diseases (e.g., tuberculosis).7,17 In the absence of a
centralized registry for LAIs, the unrecorded number of
infection is bound to be higher. Hence, the choice of
bioanalytical methodology should anticipate the risk of
infection for a wider range of pathogens – particularly during
the fulminant stage of infection.18–20
CO2-based techniques such as supercritical fluid extraction
(SFE) and supercritical fluid chromatography (SFC) attenuate
chemical toxicity and environmental pollution by promoting the
usage of CO2 as a safe, affordable, and green alternative to toxic
extraction and eluting solvents.21 Although sterilization based
on supercritical CO2 is incompatible with speedy analysis,22
coupling of SFE with SFC lowers the number of manual handling
operations and thereby reduces operators’ exposure to samples
(Fig. 2). Thus, on-line SFE–SFC mitigates the risk of infection,
a. Pharmaceutical and Medicinal Chemistry, Institute of Pharmacy, University of Greifswald, Friedrich-Ludwig-Jahn-Str. 17, 17489 Greifswald, Germany.
b. Department of Trauma, Reconstructive Surgery and Rehabilitation Medicine, University Medicine Greifswald, Ferdinand-Sauerbruch-Straße, 17475 Greifswald, Germany.
c. Leibniz Institute for Plasma Science and Technology (INP Greifswald), Felix-Hausdorff-Straße 2, 17489 Greifswald, Germany.
d. Department of Biopharmaceutics and Pharmaceutical Technology, Institute of Pharmacy, University of Greifswald, Felix-Hausdorff-Str. 3, 17489 Greifswald, Germany.
e. Department of Diagnostic Radiology and Neuroradiology, University Hospital Greifswald, Ferdinand-Sauerbruch-Straße, 17475 Greifswald, Germany
† In recognition of Kenkichi Sugiyama, Muneo Saito, Toshinobu Hondo, and Masaaki Senda, who used caffeine in their pioneering work on on-line SFE-SFC.69
80
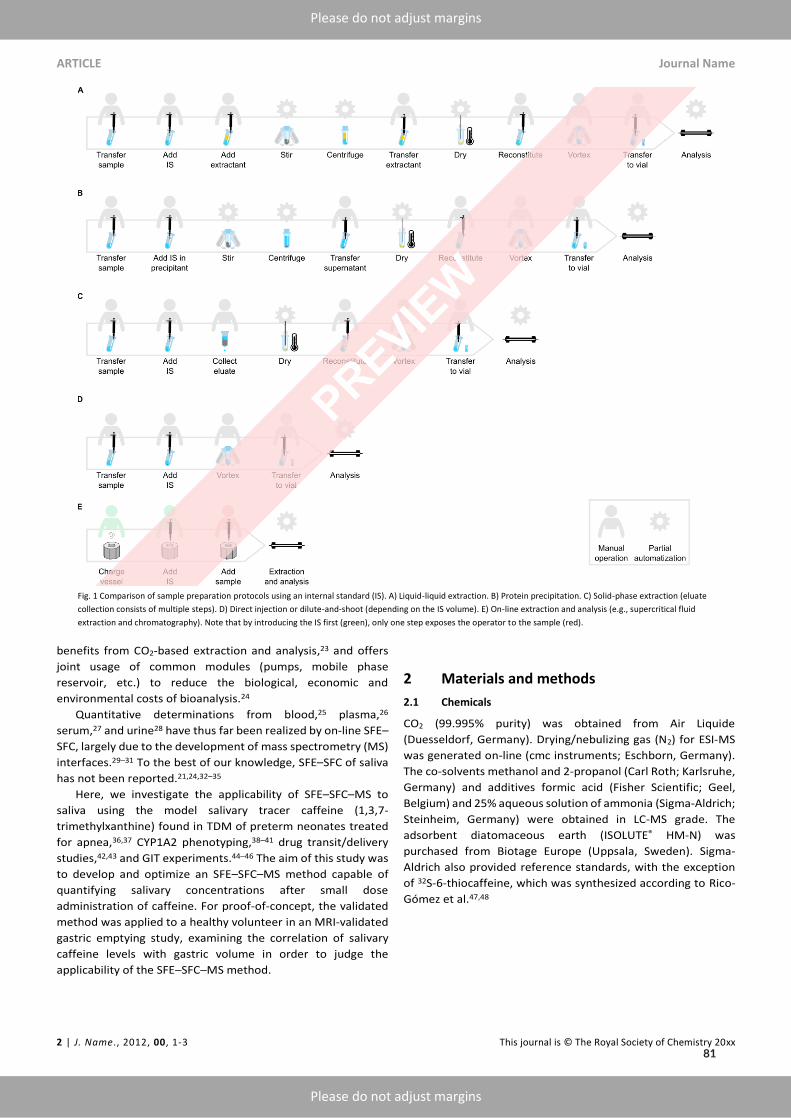
ARTICLE Journal Name
2 | J. Name., 2012, 00, 1-3 This journal is © The Royal Society of Chemistry 20xx
Please do not adjust margins
Please do not adjust margins
benefits from CO2-based extraction and analysis,23 and offers
joint usage of common modules (pumps, mobile phase
reservoir, etc.) to reduce the biological, economic and
environmental costs of bioanalysis.24
Quantitative determinations from blood,25 plasma,26
serum,27 and urine28 have thus far been realized by on-line SFE–
SFC, largely due to the development of mass spectrometry (MS)
interfaces.29–31 To the best of our knowledge, SFE–SFC of saliva
has not been reported.21,24,32–35
Here, we investigate the applicability of SFE–SFC–MS to
saliva using the model salivary tracer caffeine (1,3,7-
trimethylxanthine) found in TDM of preterm neonates treated
for apnea,36,37 CYP1A2 phenotyping,38–41 drug transit/delivery
studies,42,43 and GIT experiments.44–46 The aim of this study was
to develop and optimize an SFE–SFC–MS method capable of
quantifying salivary concentrations after small dose
administration of caffeine. For proof-of-concept, the validated
method was applied to a healthy volunteer in an MRI-validated
gastric emptying study, examining the correlation of salivary
caffeine levels with gastric volume in order to judge the
applicability of the SFE–SFC–MS method.
2 Materials and methods
2.1 Chemicals
CO2 (99.995% purity) was obtained from Air Liquide
(Duesseldorf, Germany). Drying/nebulizing gas (N2) for ESI-MS
was generated on-line (cmc instruments; Eschborn, Germany).
The co-solvents methanol and 2-propanol (Carl Roth; Karlsruhe,
Germany) and additives formic acid (Fisher Scientific; Geel,
Belgium) and 25% aqueous solution of ammonia (Sigma-Aldrich;
Steinheim, Germany) were obtained in LC-MS grade. The
adsorbent diatomaceous earth (ISOLUTE® HM-N) was
purchased from Biotage Europe (Uppsala, Sweden). Sigma-
Aldrich also provided reference standards, with the exception
of 32S-6-thiocaffeine, which was synthesized according to Rico-
Gómez et al.47,48
Fig. 1 Comparison of sample preparation protocols using an internal standard (IS). A) Liquid-liquid extraction. B) Protein precipitation. C) Solid-phase extraction (eluate
collection consists of multiple steps). D) Direct injection or dilute-and-shoot (depending on the IS volume). E) On-line extraction and analysis (e.g., supercritical fluid
extraction and chromatography). Note that by introducing the IS first (green), only one step exposes the operator to the sample (red).
81
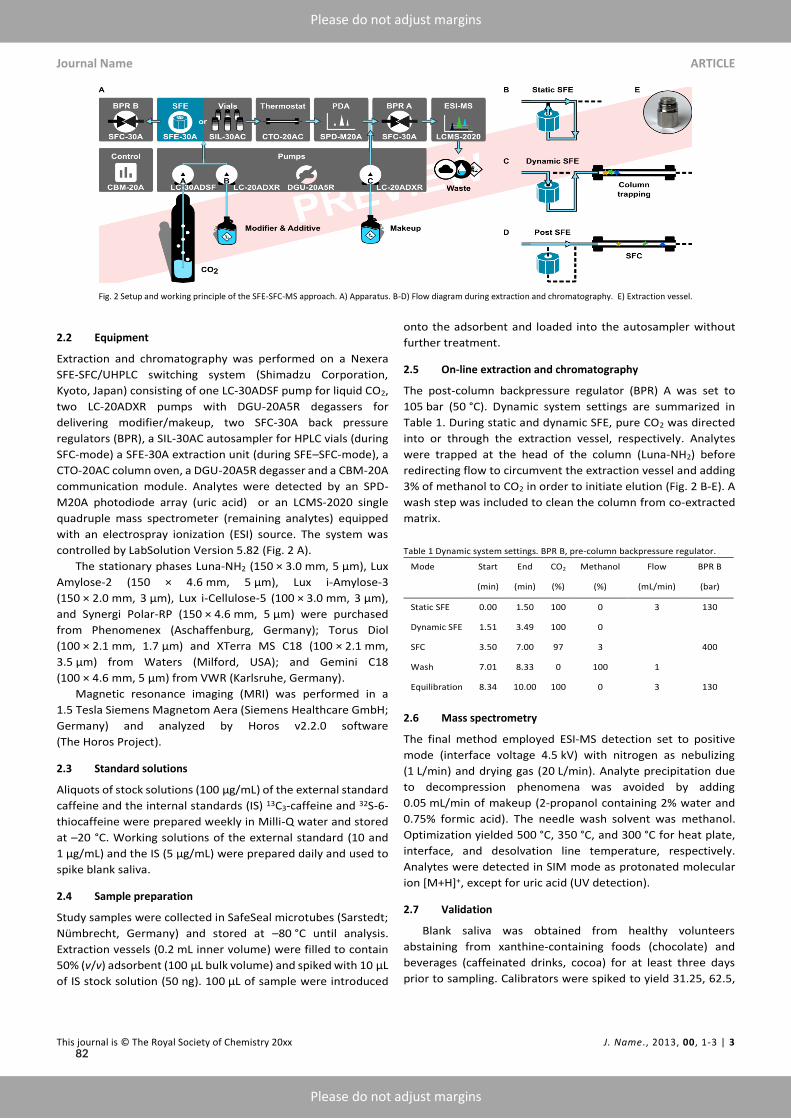
Journal Name ARTICLE
This journal is © The Royal Society of Chemistry 20xx J. Name., 2013, 00, 1-3 | 3
Please do not adjust margins
Please do not adjust margins
2.2 Equipment
Extraction and chromatography was performed on a Nexera
SFE-SFC/UHPLC switching system (Shimadzu Corporation,
Kyoto, Japan) consisting of one LC-30ADSF pump for liquid CO2,
two LC-20ADXR pumps with DGU-20A5R degassers for
delivering modifier/makeup, two SFC-30A back pressure
regulators (BPR), a SIL-30AC autosampler for HPLC vials (during
SFC-mode) a SFE-30A extraction unit (during SFE–SFC-mode), a
CTO-20AC column oven, a DGU-20A5R degasser and a CBM-20A
communication module. Analytes were detected by an SPD-
M20A photodiode array (uric acid) or an LCMS-2020 single
quadruple mass spectrometer (remaining analytes) equipped
with an electrospray ionization (ESI) source. The system was
controlled by LabSolution Version 5.82 (Fig. 2 A).
The stationary phases Luna-NH2 (150 × 3.0 mm, 5 µm), Lux
Amylose-2 (150 × 4.6 mm, 5 µm), Lux i-Amylose-3
(150 × 2.0 mm, 3 µm), Lux i-Cellulose-5 (100 × 3.0 mm, 3 µm),
and Synergi Polar-RP (150 × 4.6 mm, 5 µm) were purchased
from Phenomenex (Aschaffenburg, Germany); Torus Diol
(100 × 2.1 mm, 1.7 µm) and XTerra MS C18 (100 × 2.1 mm,
3.5 µm) from Waters (Milford, USA); and Gemini C18
(100 × 4.6 mm, 5 µm) from VWR (Karlsruhe, Germany).
Magnetic resonance imaging (MRI) was performed in a
1.5 Tesla Siemens Magnetom Aera (Siemens Healthcare GmbH;
Germany) and analyzed by Horos v2.2.0 software
(The Horos Project).
2.3 Standard solutions
Aliquots of stock solutions (100 µg/mL) of the external standard
caffeine and the internal standards (IS) 13C3-caffeine and 32S-6-
thiocaffeine were prepared weekly in Milli-Q water and stored
at –20 °C. Working solutions of the external standard (10 and
1 µg/mL) and the IS (5 µg/mL) were prepared daily and used to
spike blank saliva.
2.4 Sample preparation
Study samples were collected in SafeSeal microtubes (Sarstedt;
Nümbrecht, Germany) and stored at –80 °C until analysis.
Extraction vessels (0.2 mL inner volume) were filled to contain
50% (v/v) adsorbent (100 µL bulk volume) and spiked with 10 µL
of IS stock solution (50 ng). 100 µL of sample were introduced
onto the adsorbent and loaded into the autosampler without
further treatment.
2.5 On-line extraction and chromatography
The post-column backpressure regulator (BPR) A was set to
105 bar (50 °C). Dynamic system settings are summarized in
Table 1. During static and dynamic SFE, pure CO2 was directed
into or through the extraction vessel, respectively. Analytes
were trapped at the head of the column (Luna-NH2) before
redirecting flow to circumvent the extraction vessel and adding
3% of methanol to CO2 in order to initiate elution (Fig. 2 B-E). A
wash step was included to clean the column from co-extracted
matrix.
Table 1 Dynamic system settings. BPR B, pre-column backpressure regulator.
Mode Start End CO2 Methanol Flow BPR B
(min) (min) (%) (%) (mL/min) (bar)
Static SFE 0.00 1.50 100 0 3 130
Dynamic SFE 1.51 3.49 100 0
SFC 3.50 7.00 97 3
400
Wash 7.01 8.33 0 100 1
Equilibration 8.34 10.00 100 0 3 130
2.6 Mass spectrometry
The final method employed ESI-MS detection set to positive
mode (interface voltage 4.5 kV) with nitrogen as nebulizing
(1 L/min) and drying gas (20 L/min). Analyte precipitation due
to decompression phenomena was avoided by adding
0.05 mL/min of makeup (2-propanol containing 2% water and
0.75% formic acid). The needle wash solvent was methanol.
Optimization yielded 500 °C, 350 °C, and 300 °C for heat plate,
interface, and desolvation line temperature, respectively.
Analytes were detected in SIM mode as protonated molecular
ion [M+H]+, except for uric acid (UV detection).
2.7 Validation
Blank saliva was obtained from healthy volunteers
abstaining from xanthine-containing foods (chocolate) and
beverages (caffeinated drinks, cocoa) for at least three days
prior to sampling. Calibrators were spiked to yield 31.25, 62.5,
Fig. 2 Setup and working principle of the SFE-SFC-MS approach. A) Apparatus. B-D) Flow diagram during extraction and chromatography. E) Extraction vessel.
82
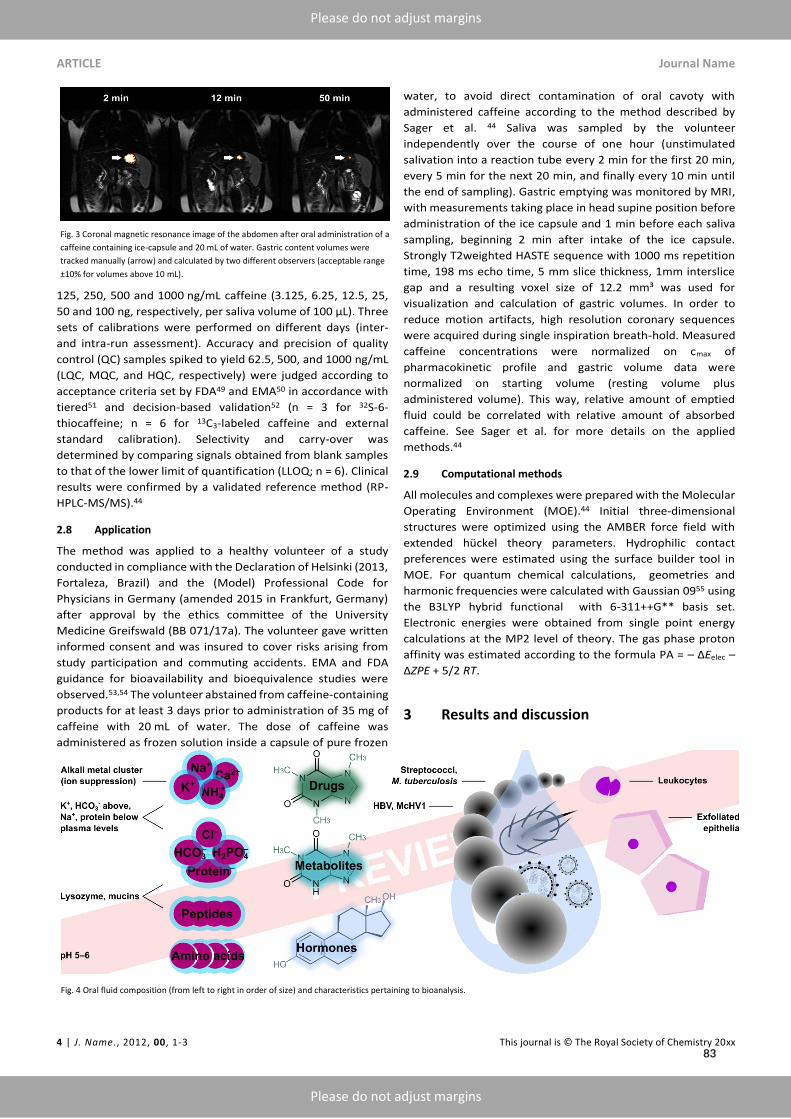
ARTICLE Journal Name
4 | J. Name., 2012, 00, 1-3 This journal is © The Royal Society of Chemistry 20xx
Please do not adjust margins
Please do not adjust margins
125, 250, 500 and 1000 ng/mL caffeine (3.125, 6.25, 12.5, 25,
50 and 100 ng, respectively, per saliva volume of 100 µL). Three
sets of calibrations were performed on different days (inter-
and intra-run assessment). Accuracy and precision of quality
control (QC) samples spiked to yield 62.5, 500, and 1000 ng/mL
(LQC, MQC, and HQC, respectively) were judged according to
acceptance criteria set by FDA49 and EMA50 in accordance with
tiered51 and decision-based validation52 (n = 3 for 32S-6-
thiocaffeine; n = 6 for 13C3-labeled caffeine and external
standard calibration). Selectivity and carry-over was
determined by comparing signals obtained from blank samples
to that of the lower limit of quantification (LLOQ; n = 6). Clinical
results were confirmed by a validated reference method (RP-
HPLC-MS/MS).44
2.8 Application
The method was applied to a healthy volunteer of a study
conducted in compliance with the Declaration of Helsinki (2013,
Fortaleza, Brazil) and the (Model) Professional Code for
Physicians in Germany (amended 2015 in Frankfurt, Germany)
after approval by the ethics committee of the University
Medicine Greifswald (BB 071/17a). The volunteer gave written
informed consent and was insured to cover risks arising from
study participation and commuting accidents. EMA and FDA
guidance for bioavailability and bioequivalence studies were
observed.53,54 The volunteer abstained from caffeine-containing
products for at least 3 days prior to administration of 35 mg of
caffeine with 20 mL of water. The dose of caffeine was
administered as frozen solution inside a capsule of pure frozen
water, to avoid direct contamination of oral cavoty with
administered caffeine according to the method described by
Sager et al. 44 Saliva was sampled by the volunteer
independently over the course of one hour (unstimulated
salivation into a reaction tube every 2 min for the first 20 min,
every 5 min for the next 20 min, and finally every 10 min until
the end of sampling). Gastric emptying was monitored by MRI,
with measurements taking place in head supine position before
administration of the ice capsule and 1 min before each saliva
sampling, beginning 2 min after intake of the ice capsule.
Strongly T2weighted HASTE sequence with 1000 ms repetition
time, 198 ms echo time, 5 mm slice thickness, 1mm interslice
gap and a resulting voxel size of 12.2 mm³ was used for
visualization and calculation of gastric volumes. In order to
reduce motion artifacts, high resolution coronary sequences
were acquired during single inspiration breath-hold. Measured
caffeine concentrations were normalized on cmax of
pharmacokinetic profile and gastric volume data were
normalized on starting volume (resting volume plus
administered volume). This way, relative amount of emptied
fluid could be correlated with relative amount of absorbed
caffeine. See Sager et al. for more details on the applied
methods.44
2.9 Computational methods
All molecules and complexes were prepared with the Molecular
Operating Environment (MOE).44 Initial three-dimensional
structures were optimized using the AMBER force field with
extended hückel theory parameters. Hydrophilic contact
preferences were estimated using the surface builder tool in
MOE. For quantum chemical calculations, geometries and
harmonic frequencies were calculated with Gaussian 0955 using
the B3LYP hybrid functional with 6-311++G** basis set.
Electronic energies were obtained from single point energy
calculations at the MP2 level of theory. The gas phase proton
affinity was estimated according to the formula PA = – ΔEelec –
ΔZPE + 5/2 RT.
3 Results and discussion
Fig. 3 Coronal magnetic resonance image of the abdomen after oral administration of a
caffeine containing ice-capsule and 20 mL of water. Gastric content volumes were
tracked manually (arrow) and calculated by two different observers (acceptable range
±10% for volumes above 10 mL).
Fig. 4 Oral fluid composition (from left to right in order of size) and characteristics pertaining to bioanalysis.
83
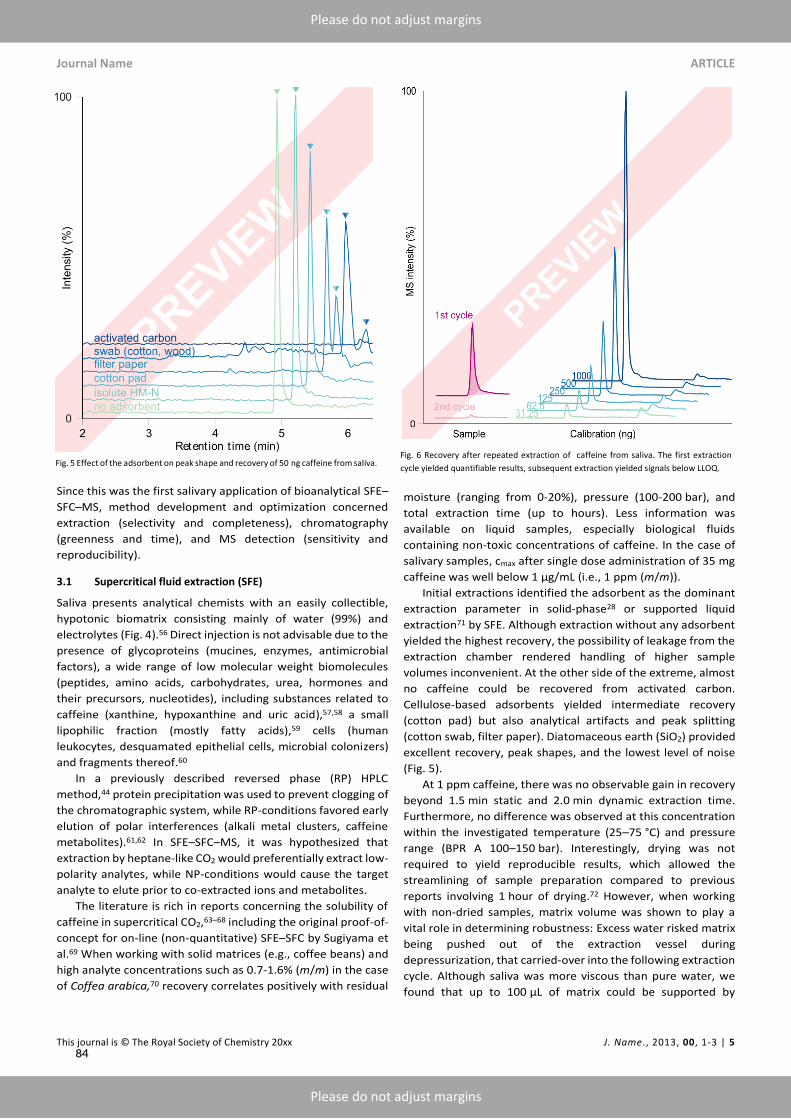
Journal Name ARTICLE
This journal is © The Royal Society of Chemistry 20xx J. Name., 2013, 00, 1-3 | 5
Please do not adjust margins
Please do not adjust margins
Since this was the first salivary application of bioanalytical SFE–
SFC–MS, method development and optimization concerned
extraction (selectivity and completeness), chromatography
(greenness and time), and MS detection (sensitivity and
reproducibility).
3.1 Supercritical fluid extraction (SFE)
Saliva presents analytical chemists with an easily collectible,
hypotonic biomatrix consisting mainly of water (99%) and
electrolytes (Fig. 4).56 Direct injection is not advisable due to the
presence of glycoproteins (mucines, enzymes, antimicrobial
factors), a wide range of low molecular weight biomolecules
(peptides, amino acids, carbohydrates, urea, hormones and
their precursors, nucleotides), including substances related to
caffeine (xanthine, hypoxanthine and uric acid),57,58 a small
lipophilic fraction (mostly fatty acids),59 cells (human
leukocytes, desquamated epithelial cells, microbial colonizers)
and fragments thereof.60
In a previously described reversed phase (RP) HPLC
method,44 protein precipitation was used to prevent clogging of
the chromatographic system, while RP-conditions favored early
elution of polar interferences (alkali metal clusters, caffeine
metabolites).61,62 In SFE–SFC–MS, it was hypothesized that
extraction by heptane-like CO2 would preferentially extract low-
polarity analytes, while NP-conditions would cause the target
analyte to elute prior to co-extracted ions and metabolites.
The literature is rich in reports concerning the solubility of
caffeine in supercritical CO2,63–68 including the original proof-of-
concept for on-line (non-quantitative) SFE–SFC by Sugiyama et
al.69 When working with solid matrices (e.g., coffee beans) and
high analyte concentrations such as 0.7-1.6% (m/m) in the case
of Coffea arabica,70 recovery correlates positively with residual
moisture (ranging from 0-20%), pressure (100-200 bar), and
total extraction time (up to hours). Less information was
available on liquid samples, especially biological fluids
containing non-toxic concentrations of caffeine. In the case of
salivary samples, cmax after single dose administration of 35 mg
caffeine was well below 1 µg/mL (i.e., 1 ppm (m/m)).
Initial extractions identified the adsorbent as the dominant
extraction parameter in solid-phase28 or supported liquid
extraction71 by SFE. Although extraction without any adsorbent
yielded the highest recovery, the possibility of leakage from the
extraction chamber rendered handling of higher sample
volumes inconvenient. At the other side of the extreme, almost
no caffeine could be recovered from activated carbon.
Cellulose-based adsorbents yielded intermediate recovery
(cotton pad) but also analytical artifacts and peak splitting
(cotton swab, filter paper). Diatomaceous earth (SiO2) provided
excellent recovery, peak shapes, and the lowest level of noise
(Fig. 5).
At 1 ppm caffeine, there was no observable gain in recovery
beyond 1.5 min static and 2.0 min dynamic extraction time.
Furthermore, no difference was observed at this concentration
within the investigated temperature (25–75 °C) and pressure
range (BPR A 100–150 bar). Interestingly, drying was not
required to yield reproducible results, which allowed the
streamlining of sample preparation compared to previous
reports involving 1 hour of drying.72 However, when working
with non-dried samples, matrix volume was shown to play a
vital role in determining robustness: Excess water risked matrix
being pushed out of the extraction vessel during
depressurization, that carried-over into the following extraction
cycle. Although saliva was more viscous than pure water, we
found that up to 100 µL of matrix could be supported by
Fig. 6 Recovery after repeated extraction of caffeine from saliva. The first extraction
cycle yielded quantifiable results, subsequent extraction yielded signals below LLOQ.Fig. 5 Effect of the adsorbent on peak shape and recovery of 50 ng caffeine from saliva.
84
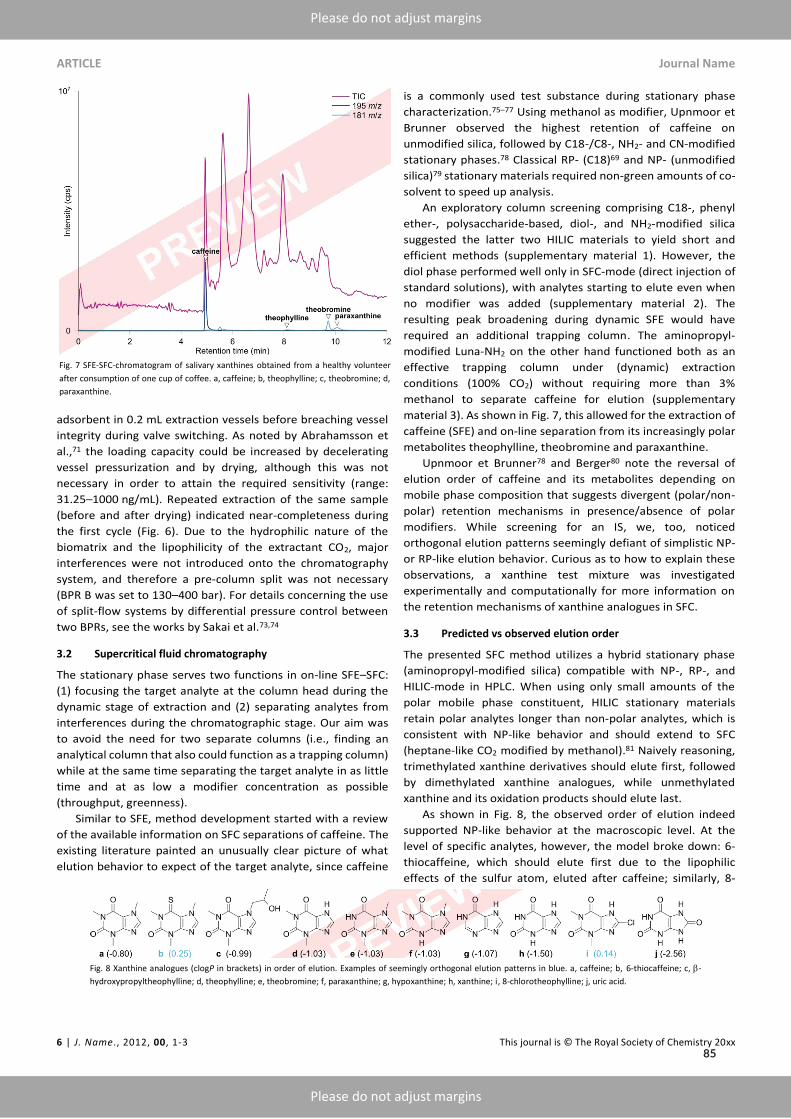
ARTICLE Journal Name
6 | J. Name., 2012, 00, 1-3 This journal is © The Royal Society of Chemistry 20xx
Please do not adjust margins
Please do not adjust margins
adsorbent in 0.2 mL extraction vessels before breaching vessel
integrity during valve switching. As noted by Abrahamsson et
al.,71 the loading capacity could be increased by decelerating
vessel pressurization and by drying, although this was not
necessary in order to attain the required sensitivity (range:
31.25–1000 ng/mL). Repeated extraction of the same sample
(before and after drying) indicated near-completeness during
the first cycle (Fig. 6). Due to the hydrophilic nature of the
biomatrix and the lipophilicity of the extractant CO2, major
interferences were not introduced onto the chromatography
system, and therefore a pre-column split was not necessary
(BPR B was set to 130–400 bar). For details concerning the use
of split-flow systems by differential pressure control between
two BPRs, see the works by Sakai et al.73,74
3.2 Supercritical fluid chromatography
The stationary phase serves two functions in on-line SFE–SFC:
(1) focusing the target analyte at the column head during the
dynamic stage of extraction and (2) separating analytes from
interferences during the chromatographic stage. Our aim was
to avoid the need for two separate columns (i.e., finding an
analytical column that also could function as a trapping column)
while at the same time separating the target analyte in as little
time and at as low a modifier concentration as possible
(throughput, greenness).
Similar to SFE, method development started with a review
of the available information on SFC separations of caffeine. The
existing literature painted an unusually clear picture of what
elution behavior to expect of the target analyte, since caffeine
is a commonly used test substance during stationary phase
characterization.75–77 Using methanol as modifier, Upnmoor et
Brunner observed the highest retention of caffeine on
unmodified silica, followed by C18-/C8-, NH2- and CN-modified
stationary phases.78 Classical RP- (C18)69 and NP- (unmodified
silica)79 stationary materials required non-green amounts of co-
solvent to speed up analysis.
An exploratory column screening comprising C18-, phenyl
ether-, polysaccharide-based, diol-, and NH2-modified silica
suggested the latter two HILIC materials to yield short and
efficient methods (supplementary material 1). However, the
diol phase performed well only in SFC-mode (direct injection of
standard solutions), with analytes starting to elute even when
no modifier was added (supplementary material 2). The
resulting peak broadening during dynamic SFE would have
required an additional trapping column. The aminopropyl-
modified Luna-NH2 on the other hand functioned both as an
effective trapping column under (dynamic) extraction
conditions (100% CO2) without requiring more than 3%
methanol to separate caffeine for elution (supplementary
material 3). As shown in Fig. 7, this allowed for the extraction of
caffeine (SFE) and on-line separation from its increasingly polar
metabolites theophylline, theobromine and paraxanthine.
Upnmoor et Brunner78 and Berger80 note the reversal of
elution order of caffeine and its metabolites depending on
mobile phase composition that suggests divergent (polar/non-
polar) retention mechanisms in presence/absence of polar
modifiers. While screening for an IS, we, too, noticed
orthogonal elution patterns seemingly defiant of simplistic NP-
or RP-like elution behavior. Curious as to how to explain these
observations, a xanthine test mixture was investigated
experimentally and computationally for more information on
the retention mechanisms of xanthine analogues in SFC.
3.3 Predicted vs observed elution order
The presented SFC method utilizes a hybrid stationary phase
(aminopropyl-modified silica) compatible with NP-, RP-, and
HILIC-mode in HPLC. When using only small amounts of the
polar mobile phase constituent, HILIC stationary materials
retain polar analytes longer than non-polar analytes, which is
consistent with NP-like behavior and should extend to SFC
(heptane-like CO2 modified by methanol).81 Naively reasoning,
trimethylated xanthine derivatives should elute first, followed
by dimethylated xanthine analogues, while unmethylated
xanthine and its oxidation products should elute last.
As shown in Fig. 8, the observed order of elution indeed
supported NP-like behavior at the macroscopic level. At the
level of specific analytes, however, the model broke down: 6-
thiocaffeine, which should elute first due to the lipophilic
effects of the sulfur atom, eluted after caffeine; similarly, 8-
Fig. 7 SFE-SFC-chromatogram of salivary xanthines obtained from a healthy volunteer
after consumption of one cup of coffee. a, caffeine; b, theophylline; c, theobromine; d,
paraxanthine.
Fig. 8 Xanthine analogues (clogP in brackets) in order of elution. Examples of seemingly orthogonal elution patterns in blue. a, caffeine; b, 6-thiocaffeine; c, -
hydroxypropyltheophylline; d, theophylline; e, theobromine; f, paraxanthine; g, hypoxanthine; h, xanthine; i, 8-chlorotheophylline; j, uric acid.
85
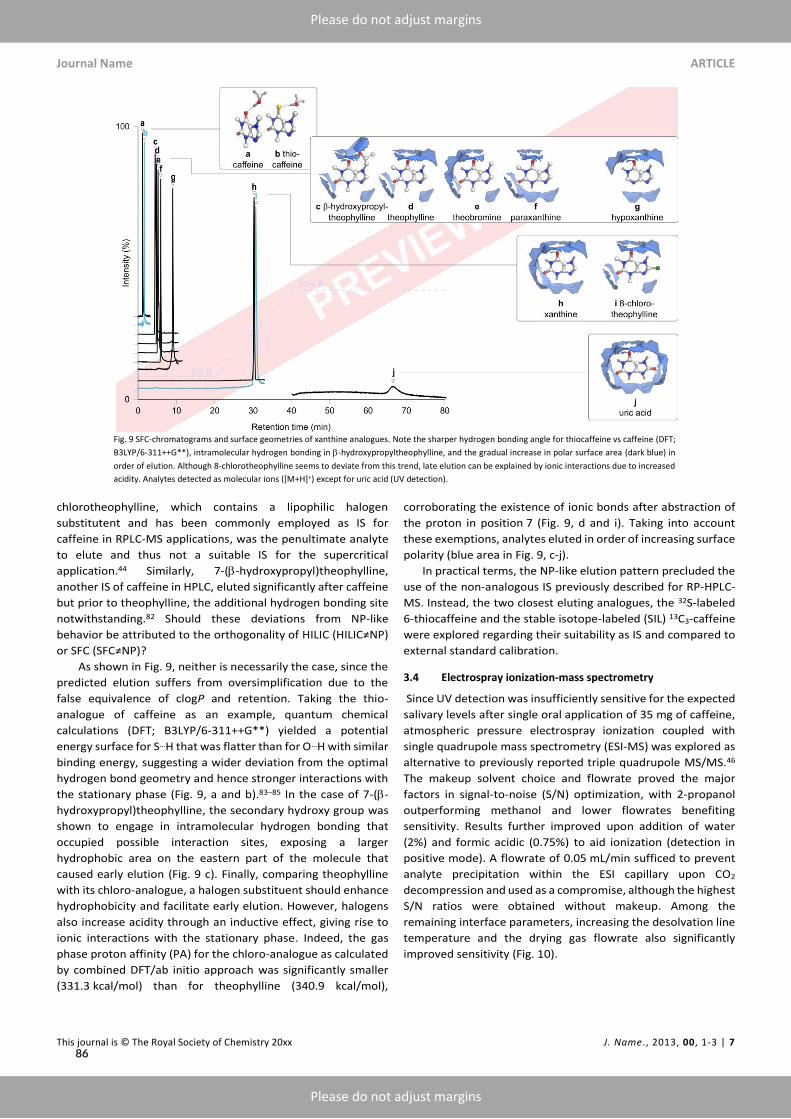
Journal Name ARTICLE
This journal is © The Royal Society of Chemistry 20xx J. Name., 2013, 00, 1-3 | 7
Please do not adjust margins
Please do not adjust margins
chlorotheophylline, which contains a lipophilic halogen
substitutent and has been commonly employed as IS for
caffeine in RPLC-MS applications, was the penultimate analyte
to elute and thus not a suitable IS for the supercritical
application.44 Similarly, 7-(-hydroxypropyl)theophylline,
another IS of caffeine in HPLC, eluted significantly after caffeine
but prior to theophylline, the additional hydrogen bonding site
notwithstanding.82 Should these deviations from NP-like
behavior be attributed to the orthogonality of HILIC (HILIC≠NP)
or SFC (SFC≠NP)?
As shown in Fig. 9, neither is necessarily the case, since the
predicted elution suffers from oversimplification due to the
false equivalence of clogP and retention. Taking the thio-
analogue of caffeine as an example, quantum chemical
calculations (DFT; B3LYP/6-311++G**) yielded a potential
energy surface for S…H that was flatter than for O…H with similar
binding energy, suggesting a wider deviation from the optimal
hydrogen bond geometry and hence stronger interactions with
the stationary phase (Fig. 9, a and b).83–85 In the case of 7-(-
hydroxypropyl)theophylline, the secondary hydroxy group was
shown to engage in intramolecular hydrogen bonding that
occupied possible interaction sites, exposing a larger
hydrophobic area on the eastern part of the molecule that
caused early elution (Fig. 9 c). Finally, comparing theophylline
with its chloro-analogue, a halogen substituent should enhance
hydrophobicity and facilitate early elution. However, halogens
also increase acidity through an inductive effect, giving rise to
ionic interactions with the stationary phase. Indeed, the gas
phase proton affinity (PA) for the chloro-analogue as calculated
by combined DFT/ab initio approach was significantly smaller
(331.3 kcal/mol) than for theophylline (340.9 kcal/mol),
corroborating the existence of ionic bonds after abstraction of
the proton in position 7 (Fig. 9, d and i). Taking into account
these exemptions, analytes eluted in order of increasing surface
polarity (blue area in Fig. 9, c-j).
In practical terms, the NP-like elution pattern precluded the
use of the non-analogous IS previously described for RP-HPLC-
MS. Instead, the two closest eluting analogues, the 32S-labeled
6-thiocaffeine and the stable isotope-labeled (SIL) 13C3-caffeine
were explored regarding their suitability as IS and compared to
external standard calibration.
3.4 Electrospray ionization-mass spectrometry
Since UV detection was insufficiently sensitive for the expected
salivary levels after single oral application of 35 mg of caffeine,
atmospheric pressure electrospray ionization coupled with
single quadrupole mass spectrometry (ESI-MS) was explored as
alternative to previously reported triple quadrupole MS/MS.46
The makeup solvent choice and flowrate proved the major
factors in signal-to-noise (S/N) optimization, with 2-propanol
outperforming methanol and lower flowrates benefiting
sensitivity. Results further improved upon addition of water
(2%) and formic acidic (0.75%) to aid ionization (detection in
positive mode). A flowrate of 0.05 mL/min sufficed to prevent
analyte precipitation within the ESI capillary upon CO2
decompression and used as a compromise, although the highest
S/N ratios were obtained without makeup. Among the
remaining interface parameters, increasing the desolvation line
temperature and the drying gas flowrate also significantly
improved sensitivity (Fig. 10).
Fig. 9 SFC-chromatograms and surface geometries of xanthine analogues. Note the sharper hydrogen bonding angle for thiocaffeine vs caffeine (DFT;
B3LYP/6-311++G**), intramolecular hydrogen bonding in -hydroxypropyltheophylline, and the gradual increase in polar surface area (dark blue) in
order of elution. Although 8-chlorotheophylline seems to deviate from this trend, late elution can be explained by ionic interactions due to increased
acidity. Analytes detected as molecular ions ([M+H]+) except for uric acid (UV detection).
86
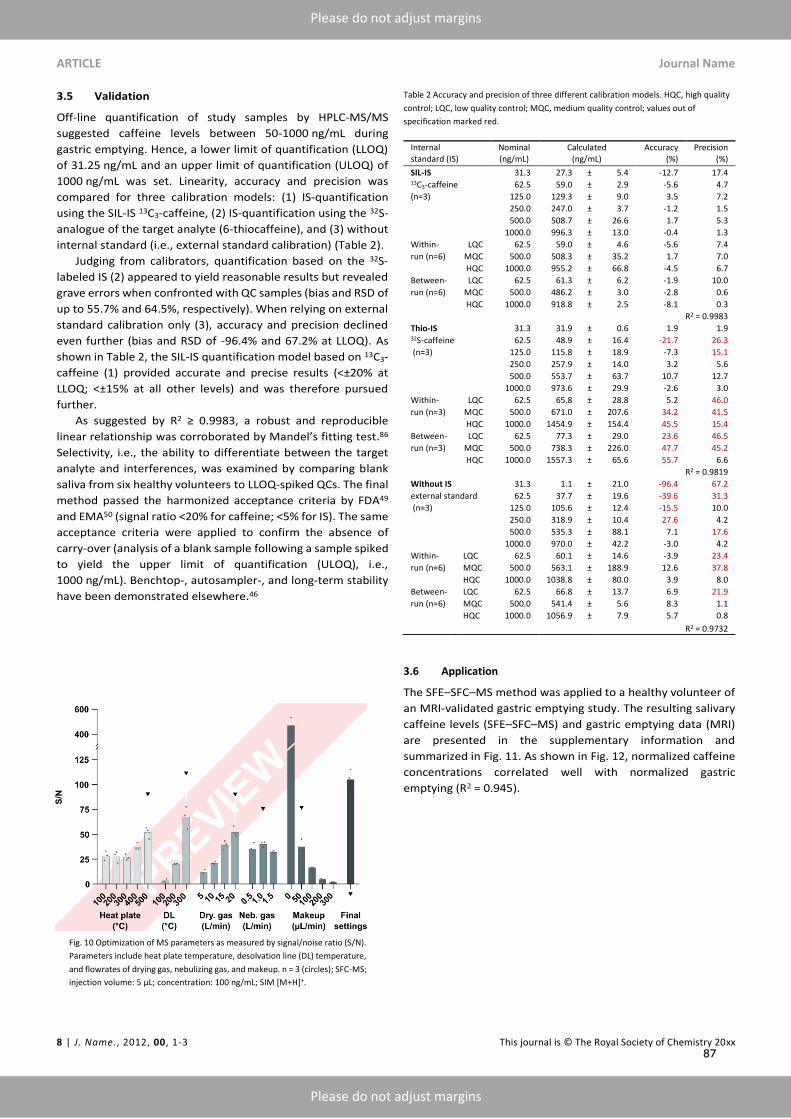
ARTICLE Journal Name
8 | J. Name., 2012, 00, 1-3 This journal is © The Royal Society of Chemistry 20xx
Please do not adjust margins
Please do not adjust margins
3.5 Validation
Off-line quantification of study samples by HPLC-MS/MS
suggested caffeine levels between 50-1000 ng/mL during
gastric emptying. Hence, a lower limit of quantification (LLOQ)
of 31.25 ng/mL and an upper limit of quantification (ULOQ) of
1000 ng/mL was set. Linearity, accuracy and precision was
compared for three calibration models: (1) IS-quantification
using the SIL-IS 13C3-caffeine, (2) IS-quantification using the 32S-
analogue of the target analyte (6-thiocaffeine), and (3) without
internal standard (i.e., external standard calibration) (Table 2).
Judging from calibrators, quantification based on the 32S-
labeled IS (2) appeared to yield reasonable results but revealed
grave errors when confronted with QC samples (bias and RSD of
up to 55.7% and 64.5%, respectively). When relying on external
standard calibration only (3), accuracy and precision declined
even further (bias and RSD of -96.4% and 67.2% at LLOQ). As
shown in Table 2, the SIL-IS quantification model based on 13C3-
caffeine (1) provided accurate and precise results (<±20% at
LLOQ; <±15% at all other levels) and was therefore pursued
further.
As suggested by R2 ≥ 0.9983, a robust and reproducible
linear relationship was corroborated by Mandel’s fitting test.86
Selectivity, i.e., the ability to differentiate between the target
analyte and interferences, was examined by comparing blank
saliva from six healthy volunteers to LLOQ-spiked QCs. The final
method passed the harmonized acceptance criteria by FDA49
and EMA50 (signal ratio <20% for caffeine; <5% for IS). The same
acceptance criteria were applied to confirm the absence of
carry-over (analysis of a blank sample following a sample spiked
to yield the upper limit of quantification (ULOQ), i.e.,
1000 ng/mL). Benchtop-, autosampler-, and long-term stability
have been demonstrated elsewhere.46
Table 2 Accuracy and precision of three different calibration models. HQC, high quality
control; LQC, low quality control; MQC, medium quality control; values out of
specification marked red.
3.6 Application
The SFE–SFC–MS method was applied to a healthy volunteer of
an MRI-validated gastric emptying study. The resulting salivary
caffeine levels (SFE–SFC–MS) and gastric emptying data (MRI)
are presented in the supplementary information and
summarized in Fig. 11. As shown in Fig. 12, normalized caffeine
concentrations correlated well with normalized gastric
emptying (R2 = 0.945).
Internal standard (IS)
Nominal (ng/mL)
Calculated (ng/mL)
Accuracy (%)
Precision (%)
SIL-IS 31.3 27.3 ± 5.4 -12.7 17.4 13C3-caffeine 62.5 59.0 ± 2.9 -5.6 4.7
(n=3) 125.0 129.3 ± 9.0 3.5 7.2
250.0 247.0 ± 3.7 -1.2 1.5
500.0 508.7 ± 26.6 1.7 5.3
1000.0 996.3 ± 13.0 -0.4 1.3
Within- LQC 62.5 59.0 ± 4.6 -5.6 7.4
run (n=6) MQC 500.0 508.3 ± 35.2 1.7 7.0
HQC 1000.0 955.2 ± 66.8 -4.5 6.7
Between- LQC 62.5 61.3 ± 6.2 -1.9 10.0
run (n=6) MQC 500.0 486.2 ± 3.0 -2.8 0.6
HQC 1000.0 918.8 ± 2.5 -8.1 0.3
R2 = 0.9983
Thio-IS 31.3 31.9 ± 0.6 1.9 1.9 32S-caffeine 62.5 48.9 ± 16.4 -21.7 26.3
(n=3) 125.0 115.8 ± 18.9 -7.3 15.1
250.0 257.9 ± 14.0 3.2 5.6
500.0 553.7 ± 63.7 10.7 12.7
1000.0 973.6 ± 29.9 -2.6 3.0
Within- LQC 62.5 65.8 ± 28.8 5.2 46.0
run (n=3) MQC 500.0 671.0 ± 207.6 34.2 41.5
HQC 1000.0 1454.9 ± 154.4 45.5 15.4
Between- LQC 62.5 77.3 ± 29.0 23.6 46.5
run (n=3) MQC 500.0 738.3 ± 226.0 47.7 45.2
HQC 1000.0 1557.3 ± 65.6 55.7 6.6
R2 = 0.9819
Without IS 31.3 1.1 ± 21.0 -96.4 67.2
external standard 62.5 37.7 ± 19.6 -39.6 31.3
(n=3) 125.0 105.6 ± 12.4 -15.5 10.0
250.0 318.9 ± 10.4 27.6 4.2
500.0 535.3 ± 88.1 7.1 17.6
1000.0 970.0 ± 42.2 -3.0 4.2
Within- LQC 62.5 60.1 ± 14.6 -3.9 23.4
run (n=6) MQC 500.0 563.1 ± 188.9 12.6 37.8
HQC 1000.0 1038.8 ± 80.0 3.9 8.0
Between- LQC 62.5 66.8 ± 13.7 6.9 21.9
run (n=6) MQC 500.0 541.4 ± 5.6 8.3 1.1
HQC 1000.0 1056.9 ± 7.9 5.7 0.8
R2 = 0.9732
Fig. 10 Optimization of MS parameters as measured by signal/noise ratio (S/N).
Parameters include heat plate temperature, desolvation line (DL) temperature,
and flowrates of drying gas, nebulizing gas, and makeup. n = 3 (circles); SFC-MS;
injection volume: 5 µL; concentration: 100 ng/mL; SIM [M+H]+.
87
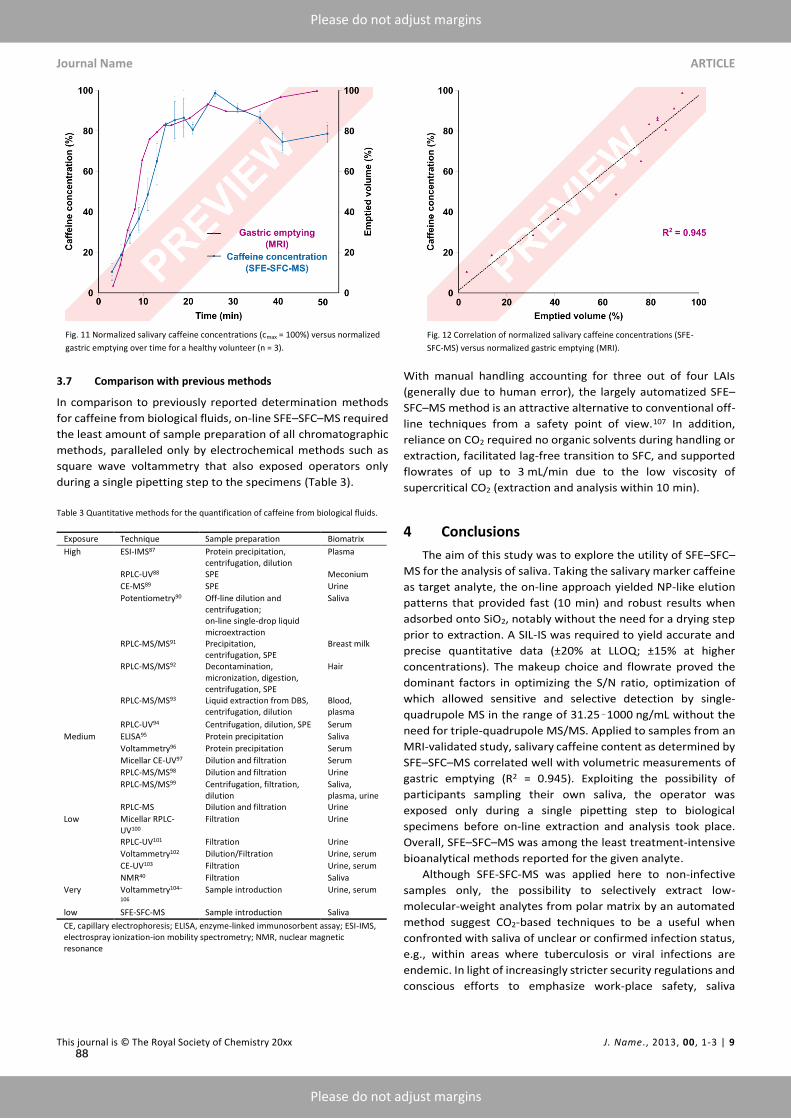
Journal Name ARTICLE
This journal is © The Royal Society of Chemistry 20xx J. Name., 2013, 00, 1-3 | 9
Please do not adjust margins
Please do not adjust margins
3.7 Comparison with previous methods
In comparison to previously reported determination methods
for caffeine from biological fluids, on-line SFE–SFC–MS required
the least amount of sample preparation of all chromatographic
methods, paralleled only by electrochemical methods such as
square wave voltammetry that also exposed operators only
during a single pipetting step to the specimens (Table 3).
Table 3 Quantitative methods for the quantification of caffeine from biological fluids.
Exposure Technique Sample preparation Biomatrix
High ESI-IMS87 Protein precipitation, centrifugation, dilution
Plasma
RPLC-UV88 SPE Meconium CE-MS89 SPE Urine Potentiometry90 Off-line dilution and
centrifugation; on-line single-drop liquid microextraction
Saliva
RPLC-MS/MS91 Precipitation,
centrifugation, SPE Breast milk
RPLC-MS/MS92 Decontamination,
micronization, digestion, centrifugation, SPE
Hair
RPLC-MS/MS93 Liquid extraction from DBS,
centrifugation, dilution Blood, plasma
RPLC-UV94 Centrifugation, dilution, SPE Serum
Medium ELISA95 Protein precipitation Saliva Voltammetry96 Protein precipitation Serum Micellar CE-UV97 Dilution and filtration Serum RPLC-MS/MS98 Dilution and filtration Urine RPLC-MS/MS99 Centrifugation, filtration,
dilution Saliva, plasma, urine
RPLC-MS Dilution and filtration Urine
Low Micellar RPLC-UV100
Filtration Urine
RPLC-UV101 Filtration Urine Voltammetry102 Dilution/Filtration Urine, serum CE-UV103 Filtration Urine, serum NMR40 Filtration Saliva
Very Voltammetry104–
106 Sample introduction Urine, serum
low SFE-SFC-MS Sample introduction Saliva
CE, capillary electrophoresis; ELISA, enzyme-linked immunosorbent assay; ESI-IMS, electrospray ionization-ion mobility spectrometry; NMR, nuclear magnetic resonance
With manual handling accounting for three out of four LAIs
(generally due to human error), the largely automatized SFE–
SFC–MS method is an attractive alternative to conventional off-
line techniques from a safety point of view.107 In addition,
reliance on CO2 required no organic solvents during handling or
extraction, facilitated lag-free transition to SFC, and supported
flowrates of up to 3 mL/min due to the low viscosity of
supercritical CO2 (extraction and analysis within 10 min).
4 Conclusions
The aim of this study was to explore the utility of SFE–SFC–
MS for the analysis of saliva. Taking the salivary marker caffeine
as target analyte, the on-line approach yielded NP-like elution
patterns that provided fast (10 min) and robust results when
adsorbed onto SiO2, notably without the need for a drying step
prior to extraction. A SIL-IS was required to yield accurate and
precise quantitative data (±20% at LLOQ; ±15% at higher
concentrations). The makeup choice and flowrate proved the
dominant factors in optimizing the S/N ratio, optimization of
which allowed sensitive and selective detection by single-
quadrupole MS in the range of 31.25–1000 ng/mL without the
need for triple-quadrupole MS/MS. Applied to samples from an
MRI-validated study, salivary caffeine content as determined by
SFE–SFC–MS correlated well with volumetric measurements of
gastric emptying (R2 = 0.945). Exploiting the possibility of
participants sampling their own saliva, the operator was
exposed only during a single pipetting step to biological
specimens before on-line extraction and analysis took place.
Overall, SFE–SFC–MS was among the least treatment-intensive
bioanalytical methods reported for the given analyte.
Although SFE-SFC-MS was applied here to non-infective
samples only, the possibility to selectively extract low-
molecular-weight analytes from polar matrix by an automated
method suggest CO2-based techniques to be a useful when
confronted with saliva of unclear or confirmed infection status,
e.g., within areas where tuberculosis or viral infections are
endemic. In light of increasingly stricter security regulations and
conscious efforts to emphasize work-place safety, saliva
Fig. 11 Normalized salivary caffeine concentrations (cmax = 100%) versus normalized
gastric emptying over time for a healthy volunteer (n = 3).
Fig. 12 Correlation of normalized salivary caffeine concentrations (SFE-
SFC-MS) versus normalized gastric emptying (MRI).
88
ARTICLE Journal Name
10 | J. Name., 2012, 00, 1-3 This journal is © The Royal Society of Chemistry 20xx
Please do not adjust margins
Please do not adjust margins
sampling in combination with SFE–SFC–MS presents a fast,
economic and safe alternative to blood analysis by HPLC, when
salivary markers are available.
Conflicts of interest
There are no conflicts to declare.
Acknowledgements
We gratefully acknowledge computing time on the Titan HPC
cluster (University of Rostock, ITMZ).
References
1 A. Medvedovici, E. Bacalum and V. David, Biomed.
Chromatogr., 2018, 32, e4137.
2 I. M. Artika and C. N. Ma’roef, Asian Pac. J. Trop. Biomed.,
2017, 7, 483–491.
3 Z. Niu, W. Zhang, C. Yu, J. Zhang and Y. Wen, TrAC Trends
Anal. Chem., 2018, 102, 123–146.
4 H. Elmongy and M. Abdel-Rehim, TrAC Trends Anal. Chem.,
2016, 83, 70–79.
5 L. Hutchinson, M. Sinclair, B. Reid, K. Burnett and B. Callan,
Br. J. Clin. Pharmacol., 2018, 84, 1089–1108.
6 S. Bhowmick, A. K. Kundu, J. Adhikari, D. Chatterjee, M.
Iglesias, J. Nriagu, D. N. Guha Mazumder, B. Shomar and D.
Chatterjee, Environ. Res., 2015, 142, 328–336.
7 R. C. Wood, A. K. Luabeya, K. M. Weigel, A. K. Wilbur, L.
Jones-Engel, M. Hatherill and G. A. Cangelosi, Sci. Rep.,
2015, 5, 8668.
8 K. L. Lightbody, J. B. Matthews, J. G. Kemp-Symonds, P. A.
Lambert and C. J. Austin, Equine Vet. J., 2018, 50, 213–219.
9 J. Kaur, R. Jacobs, Y. Huang, N. Salvo and C. Politis, Clin.
Oral Investig., 2018, 22, 633–640.
10 B. Pletzer, T.-A. Harris, A. Scheuringer and E. Hidalgo-
Lopez, Neuropsychopharmacology, 2019, 1–9.
11 S. Prasad, A. K. Tyagi and B. B. Aggarwal, Exp. Biol. Med.,
2016, 241, 783–799.
12 M. Numako, T. Toyo’oka, I. Noge, Y. Kitagawa, H. Mizuno
and K. Todoroki, Microchem. J., 2018, 142, 202–207.
13 T. Huan, T. Tran, J. Zheng, S. Sapkota, S. W. MacDonald, R.
Camicioli, R. A. Dixon and L. Li, J. Alzheimer’s Dis., 2018, 65,
1401–1416.
14 F. Bucardo, J. Nordgren, Y. Reyes, F. Gonzalez, S. Sharma
and L. Svensson, Sci. Rep., 2018, 8, 1502.
15 M. Niedrig, P. Patel, A. A. El Wahed, R. Schädler and S.
Yactayo, BMC Infect. Dis., 2018, 18, 707.
16 P. B. S. Pedrosa and T. A. O. Cardoso, Int. J. Infect. Dis.,
2011, 15, e366–e376.
17 S. H. J. van den Elsen, T. van der Laan, O. W. Akkerman, A.
G. M. van der Zanden, J.-W. C. Alffenaar and D. van
Soolingen, J. Clin. Microbiol., 2017, 55, 3292–3293.
18 K. Singh, Nat. Med., 2011, 17, 919–919.
19 J. Slots and H. Slots, Periodontol. 2000, 2011, 55, 48–69.
20 H. Masumoto, H. Kariwa, R. Klaus Hofstetter, R. Nakao, A.
Maeda, K. Yoshii, A. Someya, N. Okamoto and T. Yabu, J.
Gen. Virol., 2015, 96, 2099–2103.
21 M. Zoccali, P. Donato and L. Mondello, TrAC Trends Anal.
Chem., 2019, 116, 158–165.
22 N. Ribeiro, G. C. Soares, V. Santos‐Rosales, A. Concheiro, C.
Alvarez‐Lorenzo, C. A. García‐González and A. L. Oliveira, J.
Biomed. Mater. Res. Part B Appl. Biomater., 2019,
jbm.b.34398.
23 L. C. Harps, J. F. Joseph and M. K. Parr, J. Pharm. Biomed.
Anal., 2019, 162, 47–59.
24 A. del P. Sánchez-Camargo, F. Parada-Alonso, E. Ibáñez and
A. Cifuentes, J. Sep. Sci., 2019, 42, 243–257.
25 M. Zoccali, D. Giuffrida, F. Sala, S. V Giofr and L. Mondello,
Anal. Chim. Acta, 2018, in press, 1–8.
26 T. Uchikata, A. Matsubara, E. Fukusaki and T. Bamba, J.
Chromatogr. A, 2012, 1250, 69–75.
27 M. Suzuki, S. Nishiumi, T. Kobayashi, A. Sakai, Y. Iwata, T.
Uchikata, Y. Izumi, T. Azuma, T. Bamba and M. Yoshida,
Rapid Commun. Mass Spectrom., 2017, 31, 886–894.
28 R. Hofstetter, G. M. Fassauer and A. Link, J. Chromatogr. B,
2018, 1076, 77–83.
29 D. Guillarme, V. Desfontaine, S. Heinisch and J. L. Veuthey,
J. Chromatogr. B Anal. Technol. Biomed. Life Sci., 2018,
1083, 160–170.
30 V. Pilařová, K. Plachká, M. A. Khalikova, F. Svec and L.
Nováková, TrAC Trends Anal. Chem., 2019, 112, 212–225.
31 G. L. Losacco, J.-L. Veuthey and D. Guillarme, TrAC Trends
Anal. Chem., 2019, 118, 731–738.
32 Y. Liang and T. Zhou, J. Sep. Sci., 2019, 42, 226–242.
33 J. Liu, F. Ji, F. Chen, W. Guo, M. Yang, S. Huang, F. Zhang
and Y. Liu, J. Pharm. Biomed. Anal., 2018, 159, 513–523.
34 V. Pauk and K. Lemr, J. Chromatogr. B, 2018, 1086, 184–
196.
35 B. Prokopczyk, M. Wu, J. E. Cox and D. Hoffmann,
Carcinogenesis, 1992, 13, 863–866.
36 T. Yu, A. H. Balch, R. M. Ward, E. K. Korgenski and C. M. T.
Sherwin, BMC Pharmacol. Toxicol., 2016, 17, 22.
37 T. C. Lee, B. G. Charles, P. A. Steer and V. J. Flenady, Ther.
Drug Monit.
38 E. Begas, E. Kouvaras, A. K. Tsakalof, M. Bounitsi and E. K.
Asprodini, Biomed. Chromatogr., 2015, 29, 1657–1663.
39 N. Y. Jordan, J. Y. Mimpen, W. J. M. van den Bogaard, F. M.
Flesch, M. H. M. van de Meent and J. S. Torano, J.
Chromatogr. B, 2015, 995–996, 70–73.
40 E. Schievano, C. Finotello, L. Navarini and S. Mammi,
Talanta, 2015, 140, 36–41.
41 E. Urry, A. Jetter and H.-P. Landolt, Nutr. Metab. (Lond).,
2016, 13, 66.
42 S. Eaimtrakarn, Y. V. Rama Prasad, S. P. Puthli, Y.
Yoshikawa, N. Shibata and K. Takada, Drug Metab.
Pharmacokinet., 2002, 17, 284–291.
43 M. Muraoka, Z. Hu, T. Shimokawa, S. Sekino, R. Kurogoshi,
Y. Kuboi, Y. Yoshikawa and K. Takada, J. Control. Release,
1998, 52, 119–129.
44 M. Sager, P. Jedamzik, S. Merdivan, M. Grimm, F.
Schneider, M.-L. Kromrey, M. Hasan, S. Oswald, J. Kühn, M.
89
Journal Name ARTICLE
This journal is © The Royal Society of Chemistry 20xx J. Name., 2013, 00, 1-3 | 11
Please do not adjust margins
Please do not adjust margins
Koziolek and W. Weitschies, Eur. J. Pharm. Biopharm.,
2018, 127, 443–452.
45 M. Sager, F. Schneider, P. Jedamzik, M. Wiedmann, E.
Schremmer, M. Koziolek and W. Weitschies, Mol. Pharm.,
2017, 14, 4272–4280.
46 M. Sager, M. Grimm, P. Jedamzik, S. Merdivan, M.-L.
Kromrey, M. Hasan, M. Koziolek, M. V. Tzvetkov and W.
Weitschies, Mol. Pharm., 2019, 16, 1782–1786.
47 R. Rico-Gómez, F. Nájera, J. Manuel López-Romero and P.
Cañada-Rudner, Heterocycles, 2000, 53, 2275.
48 A. Manvar and A. Shah, Tetrahedron, 2013, 69, 8105–8127.
49 U.S. Department of Health and Human Services Food and
Drug Administration (FDA), Guid. Ind.
50 European Medicines Agency, Ref. number
EMEA/CHMP/EWP/192217/2009, 2012, 1–23.
51 S. Lowes, R. Hucker, M. Jemal, J. C. Marini, V. M. Rezende,
R. Shoup, P. Singhal, P. Timmerman, T. Yoneyama, N. Weng
and D. Zimmer, AAPS J., 2015, 17, 17–23.
52 P. Timmerman, M. Golob, J. Goodman, M. Knutsson, R.
Nelson, M. S. Fjording and S. White, Bioanalysis, 2018, 10,
1255–1259.
53 Food and Drug Administration, Guid. Ind.
54 European Medicines Agency, Ref. number
EMEA/CPMP/EWP/QWP/1401/98 Rev. 1/Corr, 2010, 1–27.
55 Gaussian Citation (https://gaussian.com/citation), 2019.
56 J. K. M. Aps and L. C. Martens, Forensic Sci. Int., 2005, 150,
119–131.
57 E. Pappa, E. Kousvelari and H. Vastardis, Oral Dis., 2019, 25,
16–25.
58 E. L. Sweeney, S. S. Al-Shehri, D. M. Cowley, H. G. Liley, N.
Bansal, B. G. Charles, P. N. Shaw, J. A. Duley and C. L. Knox,
Sci. Rep., 2018, 8, 15112.
59 J. Matczuk, M. Żendzian-Piotrowska, M. Maciejczyk and K.
Kurek, Adv. Clin. Exp. Med., 2017, 26, 1023–1031.
60 C. Theda, S. H. Hwang, A. Czajko, Y. J. Loke, P. Leong and J.
M. Craig, Sci. Rep., 2018, 8, 6944.
61 A. Svan, M. Hedeland, T. Arvidsson and C. E. Pettersson,
Anal. Chim. Acta, 2018, 1000, 163–171.
62 A. Haglind, M. Hedeland, T. Arvidsson and C. E. Pettersson,
J. Chromatogr. B, 2018, 1084, 96–105.
63 K. Tyśkiewicz, M. Konkol and E. Rój, Molecules, 2018, 23,
2625.
64 M. Sökmen, E. Demir and S. Y. Alomar, J. Supercrit. Fluids,
2018, 133, 171–176.
65 S. Jokić, T. Gagić, Ž. Knez, D. Šubarić and M. Škerget,
Molecules, 2018, 23, 1408.
66 S. Ilgaz, I. G. Sat and A. Polat, J. Food Sci. Technol., 2018,
55, 1407–1415.
67 D. V. Bermejo, E. Ibáñez, G. Reglero and T. Fornari, J.
Supercrit. Fluids, 2016, 107, 507–512.
68 M. T. Tena and M. Valcárcel, J. Chromatogr. A, 1996, 753,
299–305.
69 K. Sugiyama, M. Saito, T. Hondo and M. Senda, J.
Chromatogr. A, 1985, 332, 107–116.
70 J. dePaula and A. Farah, Beverages, 2019, 5, 37.
71 V. Abrahamsson, B. L. Henderson, F. Zhong, Y. Lin and I.
Kanik, Anal. Bioanal. Chem., , DOI:10.1007/s00216-019-
02189-z.
72 R. K. Hofstetter, F. Potlitz, L. Schulig, S. Kim, M. Hasan and
A. Link, Molecules, 2019, 24, 1927.
73 M. Sakai, Y. Hayakawa, Y. Funada, T. Ando, E. Fukusaki and
T. Bamba, J. Chromatogr. A, 2017, 1515, 218–231.
74 M. Sakai, Y. Hayakawa, Y. Funada, T. Ando, E. Fukusaki and
T. Bamba, J. Chromatogr. A, 2019, 1592, 161–172.
75 C. West, S. Khater and E. Lesellier, J. Chromatogr. A, 2012,
1250, 182–195.
76 C. West, M. A. Khalikova, E. Lesellier and K. Héberger, J.
Chromatogr. A, 2015, 1409, 241–250.
77 C. West, E. Lemasson, S. Bertin, P. Hennig and E. Lesellier,
J. Chromatogr. A, 2016, 1440, 212–228.
78 D. Upnmoor and G. Brunner, Berichte der
Bunsengesellschaft für Phys. Chemie, 1989, 93, 1009–1015.
79 P. Elisabeth, M. Yoshioka, Y. Yamauchi and M. Saito, Anal.
Sci., 1991, 7, 427–431.
80 T. A. Berger, Chromatographia, 2010, 72, 597–602.
81 R. K. Hofstetter, M. Hasan, G. M. Fassauer, C. Bock, A. S.
Surur, S. Behnisch, C. W. Grathwol, F. Potlitz, T. Oergel, W.
Siegmund and A. Link, J. Chromatogr. A, 2019, 1603, 338–
347.
82 J. Blanchard, C. W. Weber and L.-E. Shearer, J. Chromatogr.
Sci., 1990, 28, 640–642.
83 D. L. Howard and H. G. Kjaergaard, Phys. Chem. Chem.
Phys., 2008, 10, 4113.
84 D. Nguyen, L. Zandarashvili, M. A. White and J. Iwahara,
ChemBioChem, 2016, 17, 1636–1642.
85 F. Wennmohs, V. Staemmler and M. Schindler, J. Chem.
Phys., 2003, 119, 3208–3218.
86 F. Raposo, TrAC Trends Anal. Chem., 2016, 77, 167–185.
87 M. T. Jafari, B. Rezaei and M. Javaheri, Food Chem., 2011,
126, 1964–1970.
88 J. Baranowski, G. Pochopień and I. Baranowska, J.
Chromatogr. B Biomed. Sci. Appl., 1998, 707, 317–321.
89 U. L. Peri-Okonny, S. X. Wang, R. J. Stubbs and N. A.
Guzman, Electrophoresis, 2005, 26, 2652–2663.
90 I. Timofeeva, K. Medinskaia, L. Nikolaeva, D. Kirsanov and
A. Bulatov, Talanta, 2016, 150, 655–660.
91 E. Marchei, D. Escuder, C. R. Pallas, O. Garcia-Algar, A.
Gómez, B. Friguls, M. Pellegrini and S. Pichini, J. Pharm.
Biomed. Anal., 2011, 55, 309–316.
92 P. M. M. De Kesel, W. E. Lambert and C. P. Stove, Talanta,
2015, 144, 62–70.
93 P. M. De Kesel, W. E. Lambert and C. P. Stove, Bioanalysis,
2014, 6, 3011–3024.
94 R. del C. Lopez-Sanchez, V. J. Lara-Diaz, A. Aranda-
Gutierrez, J. A. Martinez-Cardona and J. A. Hernandez, J.
Anal. Methods Chem., 2018, 2018, 1–11.
95 J. J. Carvalho, M. G. Weller, U. Panne and R. J. Schneider,
Anal. Lett., 2012, 45, 2549–2561.
96 X.-Q. Xiong, K.-J. Huang, C.-X. Xu, C.-X. Jin and Q.-G. Zhai,
Chem. Ind. Chem. Eng. Q., 2013, 19, 359–368.
97 T. Hyötyläinen, H. Sirén and M.-L. Riekkola, J. Chromatogr.
A, 1996, 735, 439–447.
98 M. E. Rybak, C.-I. Pao and C. M. Pfeiffer, Anal. Bioanal.
Chem., 2014, 406, 771–784.
90
ARTICLE Journal Name
12 | J. Name., 2012, 00, 1-3 This journal is © The Royal Society of Chemistry 20xx
Please do not adjust margins
Please do not adjust margins
99 A. S. Ptolemy, E. Tzioumis, A. Thomke, S. Rifai and M.
Kellogg, J. Chromatogr. B, 2010, 878, 409–416.
100 I. Pérez‐Martinez, S. Sagrado and M. J. Medina-Hernández,
Anal. Chim. Acta, 1995, 304, 195–201.
101 M. S. Bispo, M. C. C. Veloso, H. L. C. Pinheiro, R. F. S. De
Oliveira, J. O. N. Reis and J. B. De Andrade, J. Chromatogr.
Sci., 2002, 40, 45–48.
102 R. N. Goyal, S. Bishnoi and B. Agrawal, J. Electroanal.
Chem., 2011, 655, 97–102.
103 Y. Zhao and C. E. Lunte, J. Chromatogr. B Biomed. Sci. Appl.,
1997, 688, 265–274.
104 E. Molaakbari, A. Mostafavi and H. Beitollahi, Sensors
Actuators B Chem., 2015, 208, 195–203.
105 A. Wong, A. M. Santos, T. A. Silva and O. Fatibello-Filho,
Talanta, 2018, 183, 329–338.
106 S. Jesny and K. Girish Kumar, Electroanalysis, 2017, 29,
1828–1837.
107 N. Wurtz, A. Papa, M. Hukic, A. Di Caro, I. Leparc-Goffart, E.
Leroy, M. P. Landini, Z. Sekeyova, J. S. Dumler, D. Bădescu,
N. Busquets, A. Calistri, C. Parolin, G. Palù, I. Christova, M.
Maurin, B. La Scola and D. Raoult, Eur. J. Clin. Microbiol.
Infect. Dis., 2016, 35, 1247–1258.
91
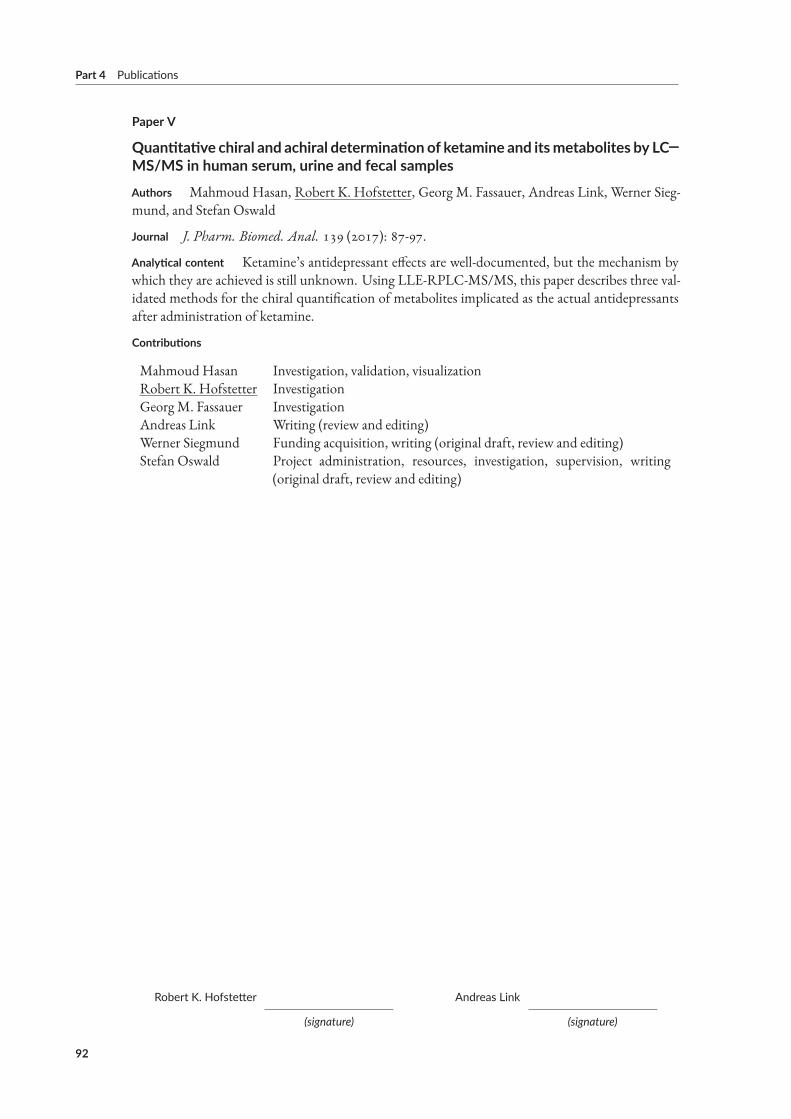
Part 4 Publications
Paper V
Quantitative chiral and achiral determination of ketamine and itsmetabolites by LC‒MS/MS in human serum, urine and fecal samples
Authors Mahmoud Hasan, Robert K. Hofstetter, Georg M. Fassauer, Andreas Link, Werner Sieg-mund, and Stefan Oswald
Journal J. Pharm. Biomed. Anal. 139 (2017): 87-97.
Analytical content Ketamine’s antidepressant effects are well-documented, but the mechanism bywhich they are achieved is still unknown. Using LLE-RPLC-MS/MS, this paper describes three val-idated methods for the chiral quantification of metabolites implicated as the actual antidepressantsafter administration of ketamine.
Contributions
MahmoudHasan Investigation, validation, visualizationRobert K. Hofstetter InvestigationGeorg M. Fassauer InvestigationAndreas Link Writing (review and editing)Werner Siegmund Funding acquisition, writing (original draft, review and editing)Stefan Oswald Project administration, resources, investigation, supervision, writing
(original draft, review and editing)
Robert K. Hofstetter Andreas Link
(signature) (signature)
92
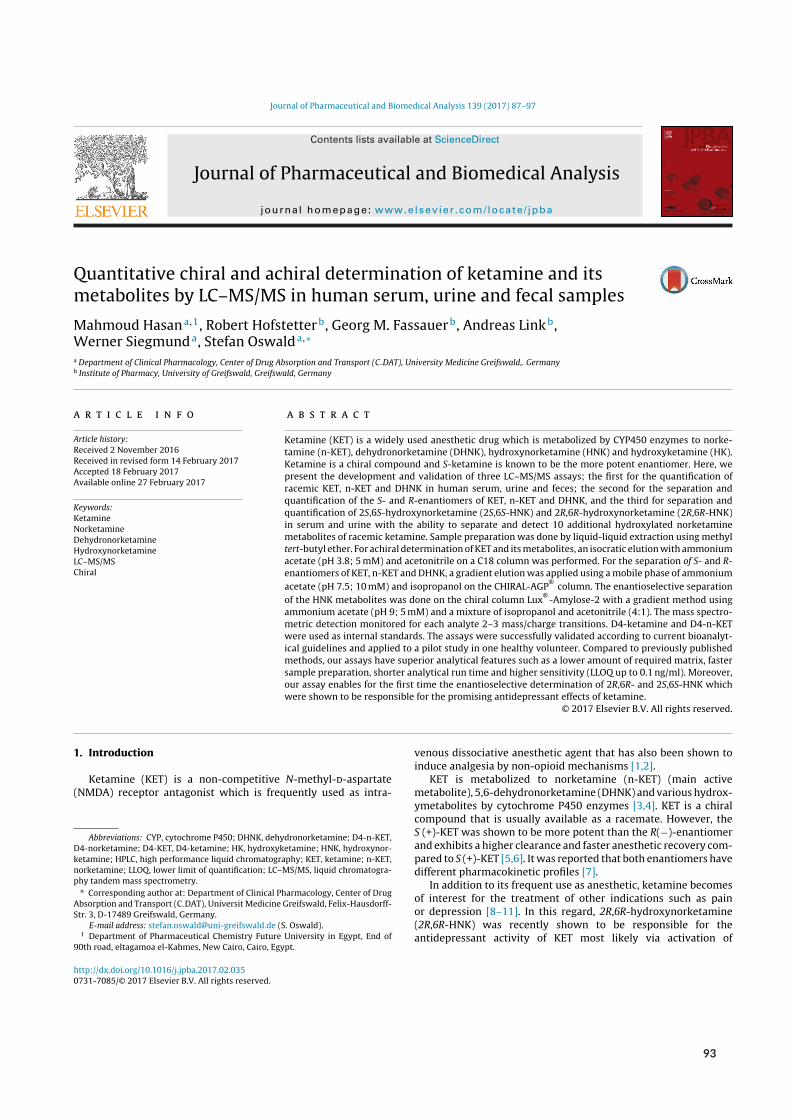
Journal of Pharmaceutical and Biomedical Analysis 139 (2017) 87–97
Contents lists available at ScienceDirect
Journal of Pharmaceutical and Biomedical Analysis
j o ur na l ho mepage: www.elsev ier .com/ locate / jpba
Quantitative chiral and achiral determination of ketamine and itsmetabolites by LC–MS/MS in human serum, urine and fecal samples
Mahmoud Hasana,1, Robert Hofstetterb, Georg M. Fassauerb, Andreas Linkb,Werner Siegmunda, Stefan Oswalda,∗
a Department of Clinical Pharmacology, Center of Drug Absorption and Transport (C DAT), University Medicine Greifswald,. Germanyb Institute of Pharmacy, University of Greifswald, Greifswald, Germany
a r t i c l e i n f o
Article history:Received 2 November 2016Received in revised form 14 February 2017Accepted 18 February 2017Available online 27 February 2017
Keywords:KetamineNorketamineDehydronorketamineHydroxynorketamineLC–MS/MSChiral
a b s t r a c t
Ketamine (KET) is a widely used anesthetic drug which is metabolized by CYP450 enzymes to norke-tamine (n-KET), dehydronorketamine (DHNK), hydroxynorketamine (HNK) and hydroxyketamine (HK).Ketamine is a chiral compound and S-ketamine is known to be the more potent enantiomer. Here, wepresent the development and validation of three LC–MS/MS assays; the first for the quantification ofracemic KET, n-KET and DHNK in human serum, urine and feces; the second for the separation andquantification of the S- and R-enantiomers of KET, n-KET and DHNK, and the third for separation andquantification of 2S,6S-hydroxynorketamine (2S,6S-HNK) and 2R,6R-hydroxynorketamine (2R,6R-HNK)in serum and urine with the ability to separate and detect 10 additional hydroxylated norketaminemetabolites of racemic ketamine. Sample preparation was done by liquid-liquid extraction using methyltert-butyl ether. For achiral determination of KET and its metabolites, an isocratic elution with ammoniumacetate (pH 3.8; 5 mM) and acetonitrile on a C18 column was performed. For the separation of S- and R-enantiomers of KET, n-KET and DHNK, a gradient elution was applied using a mobile phase of ammoniumacetate (pH 7.5; 10 mM) and isopropanol on the CHIRAL-AGP® column. The enantioselective separationof the HNK metabolites was done on the chiral column Lux® -Amylose-2 with a gradient method usingammonium acetate (pH 9; 5 mM) and a mixture of isopropanol and acetonitrile (4:1). The mass spectro-metric detection monitored for each analyte 2–3 mass/charge transitions. D4-ketamine and D4-n-KETwere used as internal standards. The assays were successfully validated according to current bioanalyt-ical guidelines and applied to a pilot study in one healthy volunteer. Compared to previously publishedmethods, our assays have superior analytical features such as a lower amount of required matrix, fastersample preparation, shorter analytical run time and higher sensitivity (LLOQ up to 0.1 ng/ml). Moreover,our assay enables for the first time the enantioselective determination of 2R,6R- and 2S,6S-HNK whichwere shown to be responsible for the promising antidepressant effects of ketamine.
© 2017 Elsevier B.V. All rights reserved.
1. Introduction
Ketamine (KET) is a non-competitive N-methyl-d-aspartate(NMDA) receptor antagonist which is frequently used as intra-
Abbreviations: CYP, cytochrome P450; DHNK, dehydronorketamine; D4-n-KET,D4-norketamine; D4-KET, D4-ketamine; HK, hydroxyketamine; HNK, hydroxynor-ketamine; HPLC, high performance liquid chromatography; KET, ketamine; n-KET,norketamine; LLOQ, lower limit of quantification; LC–MS/MS, liquid chromatogra-phy tandem mass spectrometry.
∗ Corresponding author at: Department of Clinical Pharmacology, Center of DrugAbsorption and Transport (C DAT), Universit Medicine Greifswald, Felix-Hausdorff-Str. 3, D-17489 Greifswald, Germany.
E-mail address: [email protected] (S. Oswald).1 Department of Pharmaceutical Chemistry Future University in Egypt, End of
90th road, eltagamoa el-Kahmes, New Cairo, Cairo, Egypt.
venous dissociative anesthetic agent that has also been shown toinduce analgesia by non-opioid mechanisms [1,2].
KET is metabolized to norketamine (n-KET) (main activemetabolite), 5,6-dehydronorketamine (DHNK) and various hydrox-ymetabolites by cytochrome P450 enzymes [3,4]. KET is a chiralcompound that is usually available as a racemate. However, theS (+)-KET was shown to be more potent than the R(−)-enantiomerand exhibits a higher clearance and faster anesthetic recovery com-pared to S (+)-KET [5,6]. It was reported that both enantiomers havedifferent pharmacokinetic profiles [7].
In addition to its frequent use as anesthetic, ketamine becomesof interest for the treatment of other indications such as painor depression [8–11]. In this regard, 2R,6R-hydroxynorketamine(2R,6R-HNK) was recently shown to be responsible for theantidepressant activity of KET most likely via activation of
http://dx.doi.org/10.1016/j.jpba.2017.02.0350731-7085/© 2017 Elsevier B.V. All rights reserved.
93
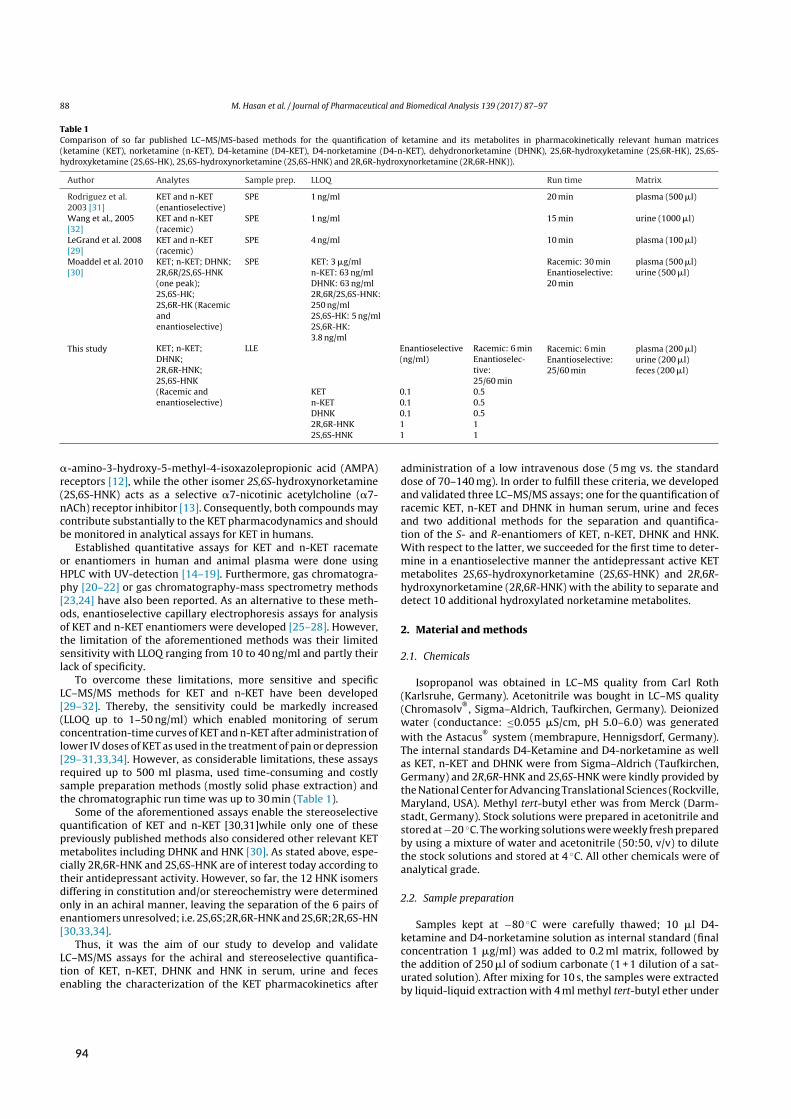
88 M. Hasan et al. / Journal of Pharmaceutical and Biomedical Analysis 139 (2017) 87–97
Table 1Comparison of so far published LC–MS/MS-based methods for the quantification of ketamine and its metabolites in pharmacokinetically relevant human matrices(ketamine (KET), norketamine (n-KET), D4-ketamine (D4-KET), D4-norketamine (D4-n-KET), dehydronorketamine (DHNK), 2S,6R-hydroxyketamine (2S,6R-HK), 2S,6S-hydroxyketamine (2S,6S-HK), 2S,6S-hydroxynorketamine (2S,6S-HNK) and 2R,6R-hydroxynorketamine (2R,6R-HNK)).
Author Analytes Sample prep. LLOQ Run time Matrix
Rodriguez et al.2003 [31]
KET and n-KET(enantioselective)
SPE 1 ng/ml 20 min plasma (500 �l)
Wang et al., 2005[32]
KET and n-KET(racemic)
SPE 1 ng/ml 15 min urine (1000 �l)
LeGrand et al. 2008[29]
KET and n-KET(racemic)
SPE 4 ng/ml 10 min plasma (100 �l)
Moaddel et al. 2010[30]
KET; n-KET; DHNK;2R,6R/2S,6S-HNK(one peak);2S,6S-HK;2S,6R-HK (Racemicandenantioselective)
SPE KET: 3 �g/mln-KET: 63 ng/mlDHNK: 63 ng/ml2R,6R/2S,6S-HNK:250 ng/ml2S,6S-HK: 5 ng/ml2S,6R-HK:3.8 ng/ml
Racemic: 30 minEnantioselective:20 min
plasma (500 �l)urine (500 �l)
This study KET; n-KET;DHNK;2R,6R-HNK;2S,6S-HNK(Racemic andenantioselective)
LLE Enantioselective(ng/ml)
Racemic: 6 minEnantioselec-tive:25/60 min
Racemic: 6 minEnantioselective:25/60 min
plasma (200 �l)urine (200 �l)feces (200 �l)
KET 0.1 0.5n-KET 0.1 0.5DHNK 0.1 0.52R,6R-HNK 1 12S,6S-HNK 1 1
�-amino-3-hydroxy-5-methyl-4-isoxazolepropionic acid (AMPA)receptors [12], while the other isomer 2S,6S-hydroxynorketamine(2S,6S-HNK) acts as a selective �7-nicotinic acetylcholine (�7-nACh) receptor inhibitor [13]. Consequently, both compounds maycontribute substantially to the KET pharmacodynamics and shouldbe monitored in analytical assays for KET in humans.
Established quantitative assays for KET and n-KET racemateor enantiomers in human and animal plasma were done usingHPLC with UV-detection [14–19]. Furthermore, gas chromatogra-phy [20–22] or gas chromatography-mass spectrometry methods[23,24] have also been reported. As an alternative to these meth-ods, enantioselective capillary electrophoresis assays for analysisof KET and n-KET enantiomers were developed [25–28]. However,the limitation of the aforementioned methods was their limitedsensitivity with LLOQ ranging from 10 to 40 ng/ml and partly theirlack of specificity.
To overcome these limitations, more sensitive and specificLC–MS/MS methods for KET and n-KET have been developed[29–32]. Thereby, the sensitivity could be markedly increased(LLOQ up to 1–50 ng/ml) which enabled monitoring of serumconcentration-time curves of KET and n-KET after administration oflower IV doses of KET as used in the treatment of pain or depression[29–31,33,34]. However, as considerable limitations, these assaysrequired up to 500 ml plasma, used time-consuming and costlysample preparation methods (mostly solid phase extraction) andthe chromatographic run time was up to 30 min (Table 1).
Some of the aforementioned assays enable the stereoselectivequantification of KET and n-KET [30,31]while only one of thesepreviously published methods also considered other relevant KETmetabolites including DHNK and HNK [30]. As stated above, espe-cially 2R,6R-HNK and 2S,6S-HNK are of interest today according totheir antidepressant activity. However, so far, the 12 HNK isomersdiffering in constitution and/or stereochemistry were determinedonly in an achiral manner, leaving the separation of the 6 pairs ofenantiomers unresolved; i.e. 2S,6S;2R,6R-HNK and 2S,6R;2R,6S-HN[30,33,34].
Thus, it was the aim of our study to develop and validateLC–MS/MS assays for the achiral and stereoselective quantifica-tion of KET, n-KET, DHNK and HNK in serum, urine and fecesenabling the characterization of the KET pharmacokinetics after
administration of a low intravenous dose (5 mg vs. the standarddose of 70–140 mg). In order to fulfill these criteria, we developedand validated three LC–MS/MS assays; one for the quantification ofracemic KET, n-KET and DHNK in human serum, urine and fecesand two additional methods for the separation and quantifica-tion of the S- and R-enantiomers of KET, n-KET, DHNK and HNK.With respect to the latter, we succeeded for the first time to deter-mine in a enantioselective manner the antidepressant active KETmetabolites 2S,6S-hydroxynorketamine (2S,6S-HNK) and 2R,6R-hydroxynorketamine (2R,6R-HNK) with the ability to separate anddetect 10 additional hydroxylated norketamine metabolites.
2. Material and methods
2.1. Chemicals
Isopropanol was obtained in LC–MS quality from Carl Roth(Karlsruhe, Germany). Acetonitrile was bought in LC–MS quality(Chromasolv
®, Sigma–Aldrich, Taufkirchen, Germany). Deionized
water (conductance: ≤0.055 �S/cm, pH 5.0–6.0) was generatedwith the Astacus
®system (membrapure, Hennigsdorf, Germany).
The internal standards D4-Ketamine and D4-norketamine as wellas KET, n-KET and DHNK were from Sigma–Aldrich (Taufkirchen,Germany) and 2R,6R-HNK and 2S,6S-HNK were kindly provided bythe National Center for Advancing Translational Sciences (Rockville,Maryland, USA). Methyl tert-butyl ether was from Merck (Darm-stadt, Germany). Stock solutions were prepared in acetonitrile andstored at −20 ◦C. The working solutions were weekly fresh preparedby using a mixture of water and acetonitrile (50:50, v/v) to dilutethe stock solutions and stored at 4 ◦C. All other chemicals were ofanalytical grade.
2.2. Sample preparation
Samples kept at −80 ◦C were carefully thawed; 10 �l D4-ketamine and D4-norketamine solution as internal standard (finalconcentration 1 �g/ml) was added to 0.2 ml matrix, followed bythe addition of 250 �l of sodium carbonate (1 + 1 dilution of a sat-urated solution). After mixing for 10 s, the samples were extractedby liquid-liquid extraction with 4 ml methyl tert-butyl ether under
94
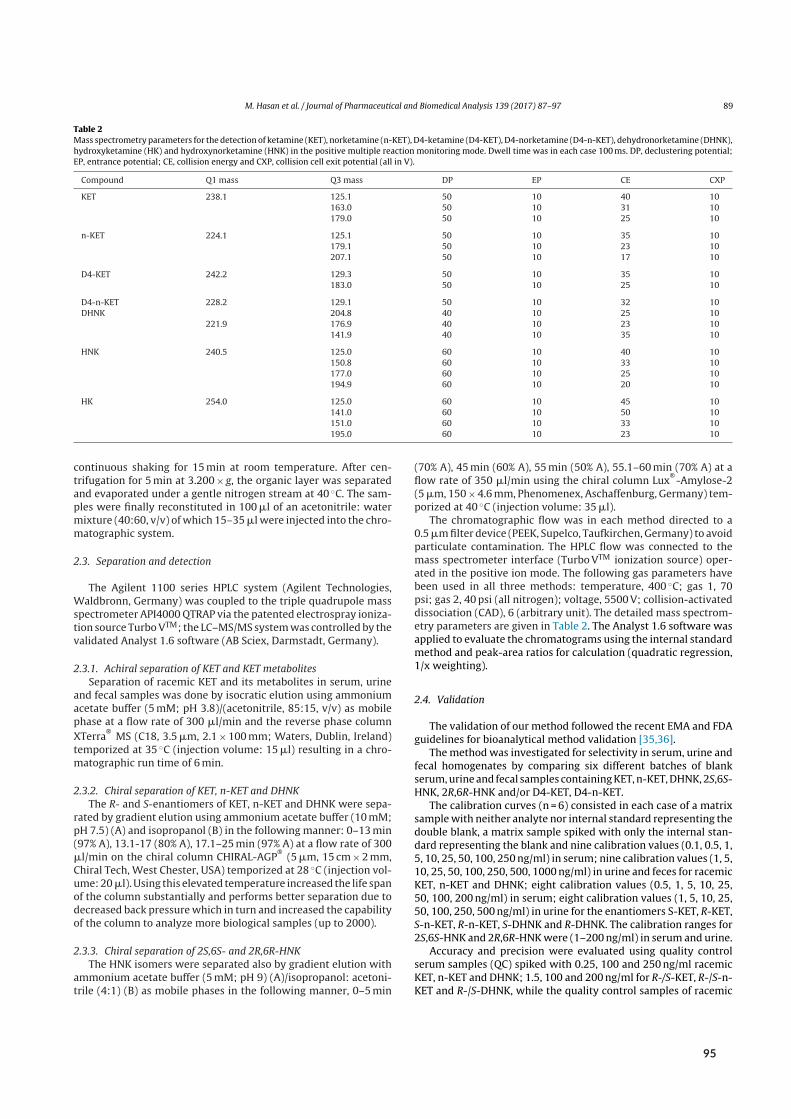
M. Hasan et al. / Journal of Pharmaceutical and Biomedical Analysis 139 (2017) 87–97 89
Table 2Mass spectrometry parameters for the detection of ketamine (KET), norketamine (n-KET), D4-ketamine (D4-KET), D4-norketamine (D4-n-KET), dehydronorketamine (DHNK),hydroxyketamine (HK) and hydroxynorketamine (HNK) in the positive multiple reaction monitoring mode. Dwell time was in each case 100 ms. DP, declustering potential;EP, entrance potential; CE, collision energy and CXP, collision cell exit potential (all in V).
Compound Q1 mass Q3 mass DP EP CE CXP
KET 238.1 125.1 50 10 40 10163.0 50 10 31 10179.0 50 10 25 10
n-KET 224.1 125.1 50 10 35 10179.1 50 10 23 10207.1 50 10 17 10
D4-KET 242.2 129.3 50 10 35 10183.0 50 10 25 10
D4-n-KET 228.2 129.1 50 10 32 10DHNK 204.8 40 10 25 10
221.9 176.9 40 10 23 10141.9 40 10 35 10
HNK 240.5 125.0 60 10 40 10150.8 60 10 33 10177.0 60 10 25 10194.9 60 10 20 10
HK 254.0 125.0 60 10 45 10141.0 60 10 50 10151.0 60 10 33 10195.0 60 10 23 10
continuous shaking for 15 min at room temperature. After cen-trifugation for 5 min at 3.200 × g, the organic layer was separatedand evaporated under a gentle nitrogen stream at 40 ◦C. The sam-ples were finally reconstituted in 100 �l of an acetonitrile: watermixture (40:60, v/v) of which 15–35 �l were injected into the chro-matographic system.
2.3. Separation and detection
The Agilent 1100 series HPLC system (Agilent Technologies,Waldbronn, Germany) was coupled to the triple quadrupole massspectrometer API4000 QTRAP via the patented electrospray ioniza-tion source Turbo VTM; the LC–MS/MS system was controlled by thevalidated Analyst 1.6 software (AB Sciex, Darmstadt, Germany).
2.3.1. Achiral separation of KET and KET metabolitesSeparation of racemic KET and its metabolites in serum, urine
and fecal samples was done by isocratic elution using ammoniumacetate buffer (5 mM; pH 3.8)/(acetonitrile, 85:15, v/v) as mobilephase at a flow rate of 300 �l/min and the reverse phase columnXTerra
®MS (C18, 3.5 �m, 2.1 × 100 mm; Waters, Dublin, Ireland)
temporized at 35 ◦C (injection volume: 15 �l) resulting in a chro-matographic run time of 6 min.
2.3.2. Chiral separation of KET, n-KET and DHNKThe R- and S-enantiomers of KET, n-KET and DHNK were sepa-
rated by gradient elution using ammonium acetate buffer (10 mM;pH 7.5) (A) and isopropanol (B) in the following manner: 0–13 min(97% A), 13.1-17 (80% A), 17.1–25 min (97% A) at a flow rate of 300�l/min on the chiral column CHIRAL-AGP
®(5 �m, 15 cm × 2 mm,
Chiral Tech, West Chester, USA) temporized at 28 ◦C (injection vol-ume: 20 �l). Using this elevated temperature increased the life spanof the column substantially and performs better separation due todecreased back pressure which in turn and increased the capabilityof the column to analyze more biological samples (up to 2000).
2.3.3. Chiral separation of 2S,6S- and 2R,6R-HNKThe HNK isomers were separated also by gradient elution with
ammonium acetate buffer (5 mM; pH 9) (A)/isopropanol: acetoni-trile (4:1) (B) as mobile phases in the following manner, 0–5 min
(70% A), 45 min (60% A), 55 min (50% A), 55.1–60 min (70% A) at aflow rate of 350 �l/min using the chiral column Lux
®-Amylose-2
(5 �m, 150 × 4.6 mm, Phenomenex, Aschaffenburg, Germany) tem-porized at 40 ◦C (injection volume: 35 �l).
The chromatographic flow was in each method directed to a0.5 �m filter device (PEEK, Supelco, Taufkirchen, Germany) to avoidparticulate contamination. The HPLC flow was connected to themass spectrometer interface (Turbo VTM ionization source) oper-ated in the positive ion mode. The following gas parameters havebeen used in all three methods: temperature, 400 ◦C; gas 1, 70psi; gas 2, 40 psi (all nitrogen); voltage, 5500 V; collision-activateddissociation (CAD), 6 (arbitrary unit). The detailed mass spectrom-etry parameters are given in Table 2. The Analyst 1.6 software wasapplied to evaluate the chromatograms using the internal standardmethod and peak-area ratios for calculation (quadratic regression,1/x weighting).
2.4. Validation
The validation of our method followed the recent EMA and FDAguidelines for bioanalytical method validation [35,36].
The method was investigated for selectivity in serum, urine andfecal homogenates by comparing six different batches of blankserum, urine and fecal samples containing KET, n-KET, DHNK, 2S,6S-HNK, 2R,6R-HNK and/or D4-KET, D4-n-KET.
The calibration curves (n = 6) consisted in each case of a matrixsample with neither analyte nor internal standard representing thedouble blank, a matrix sample spiked with only the internal stan-dard representing the blank and nine calibration values (0.1, 0.5, 1,5, 10, 25, 50, 100, 250 ng/ml) in serum; nine calibration values (1, 5,10, 25, 50, 100, 250, 500, 1000 ng/ml) in urine and feces for racemicKET, n-KET and DHNK; eight calibration values (0.5, 1, 5, 10, 25,50, 100, 200 ng/ml) in serum; eight calibration values (1, 5, 10, 25,50, 100, 250, 500 ng/ml) in urine for the enantiomers S-KET, R-KET,S-n-KET, R-n-KET, S-DHNK and R-DHNK. The calibration ranges for2S,6S-HNK and 2R,6R-HNK were (1–200 ng/ml) in serum and urine.
Accuracy and precision were evaluated using quality controlserum samples (QC) spiked with 0.25, 100 and 250 ng/ml racemicKET, n-KET and DHNK; 1.5, 100 and 200 ng/ml for R-/S-KET, R-/S-n-KET and R-/S-DHNK, while the quality control samples of racemic
95
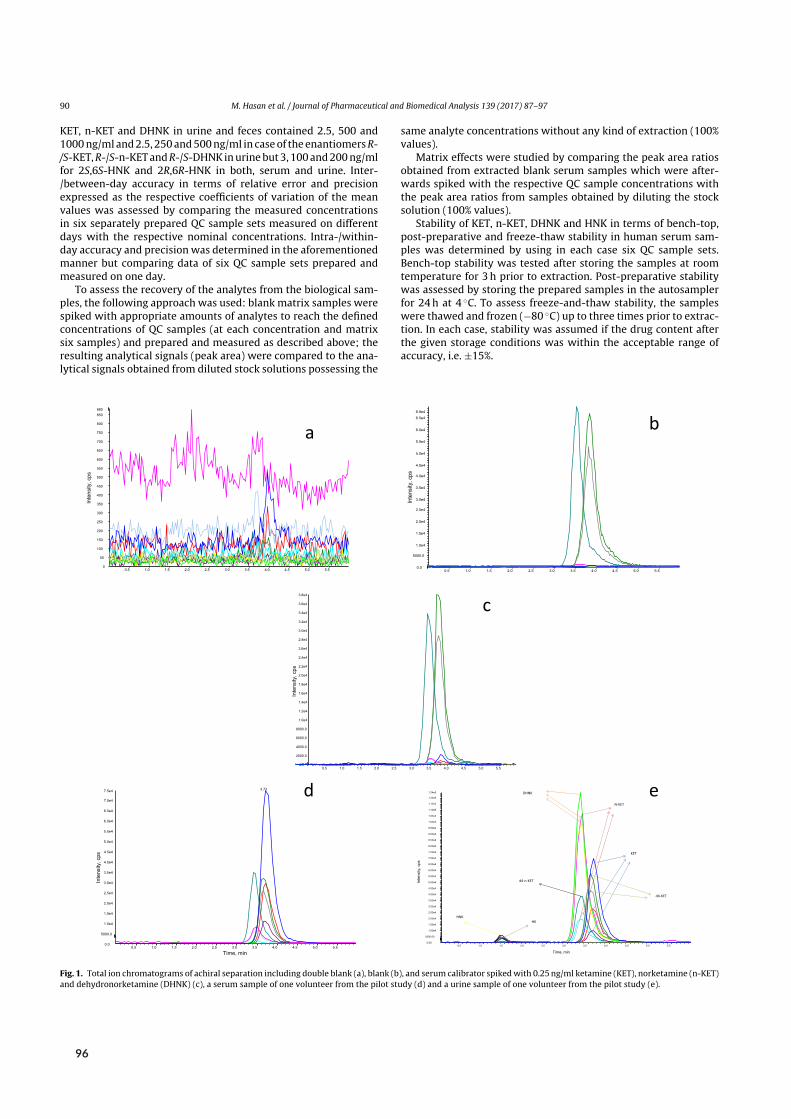
90 M. Hasan et al. / Journal of Pharmaceutical and Biomedical Analysis 139 (2017) 87–97
KET, n-KET and DHNK in urine and feces contained 2.5, 500 and1000 ng/ml and 2.5, 250 and 500 ng/ml in case of the enantiomers R-/S-KET, R-/S-n-KET and R-/S-DHNK in urine but 3, 100 and 200 ng/mlfor 2S,6S-HNK and 2R,6R-HNK in both, serum and urine. Inter-/between-day accuracy in terms of relative error and precisionexpressed as the respective coefficients of variation of the meanvalues was assessed by comparing the measured concentrationsin six separately prepared QC sample sets measured on differentdays with the respective nominal concentrations. Intra-/within-day accuracy and precision was determined in the aforementionedmanner but comparing data of six QC sample sets prepared andmeasured on one day.
To assess the recovery of the analytes from the biological sam-ples, the following approach was used: blank matrix samples werespiked with appropriate amounts of analytes to reach the definedconcentrations of QC samples (at each concentration and matrixsix samples) and prepared and measured as described above; theresulting analytical signals (peak area) were compared to the ana-lytical signals obtained from diluted stock solutions possessing the
same analyte concentrations without any kind of extraction (100%values).
Matrix effects were studied by comparing the peak area ratiosobtained from extracted blank serum samples which were after-wards spiked with the respective QC sample concentrations withthe peak area ratios from samples obtained by diluting the stocksolution (100% values).
Stability of KET, n-KET, DHNK and HNK in terms of bench-top,post-preparative and freeze-thaw stability in human serum sam-ples was determined by using in each case six QC sample sets.Bench-top stability was tested after storing the samples at roomtemperature for 3 h prior to extraction. Post-preparative stabilitywas assessed by storing the prepared samples in the autosamplerfor 24 h at 4 ◦C. To assess freeze-and-thaw stability, the sampleswere thawed and frozen (−80 ◦C) up to three times prior to extrac-tion. In each case, stability was assumed if the drug content afterthe given storage conditions was within the acceptable range ofaccuracy, i.e. ±15%.
0.5 1.0 1.5 2.0 2.5 3.0 3.5 4.0 4.5 5.0 5.5
Time, min
0.00
5000 .00
1.00e 4
1.50e 4
2.00e 4
2.50e 4
3.00e 4
3.50e 4
4.00e 4
4.50e 4
5.00e 4
5.50e 4
6.00e 4
6.50e 4
7.00e 4
7.50e 4
8.00e 4
8.50e 4
9.00e 4
9.50e 4
1.00e 5
1.05e 5
1.10e 5
1.15e 5
1.20e 5
1.24e 5
Inte
nsity
, cps
N-KET
KET
d4-KET
DHNK
d4-n- KET
HKHNK
0.5 1.0 1.5 2.0 2.5 3.0 3.5 4.0 4. 5 5.0 5.50
50
100
150
200
250
300
350
400
450
500
550
600
650
700
750
800
850880
Inte
nsity
, cps
0.5 1.0 1.5 2.0 2.5 3.0 3.5 4.0 4.5 5.0 5.50.0
2000 .0
4000 .0
6000 .0
8000 .0
1.0e 4
1.2e4
1.4e 4
1.6e 4
1.8e 4
2.0e 4
2.2e 4
2.4e 4
2.6e 4
2.8e 4
3.0e 4
3.2e 4
3.4e 4
3.6e 4
3.8e 4
Inte
nsity
, cps
0.5 1.0 1.5 2.0 2.5 3.0 3.5 4.0 4.5 5.0 5.50.0
5000.0
1.0e4
1.5e4
2.0e4
2.5e4
3.0e4
3.5e4
4.0e4
4.5e4
5.0e4
5.5e4
6.0e4
6.5e4
6.8e4In
tens
ity, c
ps
0.5 1.0 1.5 2.0 2.5 3.0 3.5 4.0 4. 5 5.0 5.5
Time, mi n
0.0
5000.0
1.0e4
1.5e4
2.0e4
2.5e4
3.0e4
3.5e4
4.0e4
4.5e4
5.0e4
5.5e4
6.0e4
6.5e4
7.0e4
7.5e4
Inte
nsity
, cps
3.73 e
b
c
d
a
Fig. 1. Total ion chromatograms of achiral separation including double blank (a), blank (b), and serum calibrator spiked with 0.25 ng/ml ketamine (KET), norketamine (n-KET)and dehydronorketamine (DHNK) (c), a serum sample of one volunteer from the pilot study (d) and a urine sample of one volunteer from the pilot study (e).
96
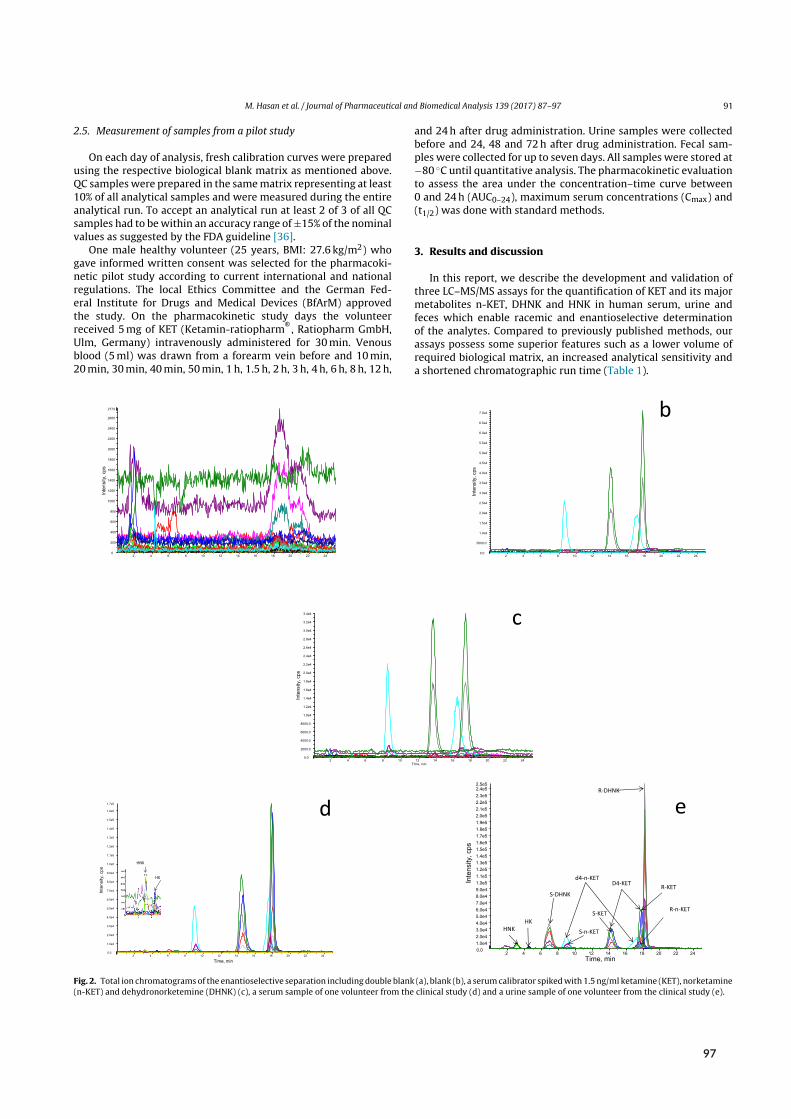
M. Hasan et al. / Journal of Pharmaceutical and Biomedical Analysis 139 (2017) 87–97 91
2.5. Measurement of samples from a pilot study
On each day of analysis, fresh calibration curves were preparedusing the respective biological blank matrix as mentioned above.QC samples were prepared in the same matrix representing at least10% of all analytical samples and were measured during the entireanalytical run. To accept an analytical run at least 2 of 3 of all QCsamples had to be within an accuracy range of ±15% of the nominalvalues as suggested by the FDA guideline [36].
One male healthy volunteer (25 years, BMI: 27.6 kg/m2) whogave informed written consent was selected for the pharmacoki-netic pilot study according to current international and nationalregulations. The local Ethics Committee and the German Fed-eral Institute for Drugs and Medical Devices (BfArM) approvedthe study. On the pharmacokinetic study days the volunteerreceived 5 mg of KET (Ketamin-ratiopharm
®, Ratiopharm GmbH,
Ulm, Germany) intravenously administered for 30 min. Venousblood (5 ml) was drawn from a forearm vein before and 10 min,20 min, 30 min, 40 min, 50 min, 1 h, 1.5 h, 2 h, 3 h, 4 h, 6 h, 8 h, 12 h,
and 24 h after drug administration. Urine samples were collectedbefore and 24, 48 and 72 h after drug administration. Fecal sam-ples were collected for up to seven days. All samples were stored at−80 ◦C until quantitative analysis. The pharmacokinetic evaluationto assess the area under the concentration–time curve between0 and 24 h (AUC0–24), maximum serum concentrations (Cmax) and(t1/2) was done with standard methods.
3. Results and discussion
In this report, we describe the development and validation ofthree LC–MS/MS assays for the quantification of KET and its majormetabolites n-KET, DHNK and HNK in human serum, urine andfeces which enable racemic and enantioselective determinationof the analytes. Compared to previously published methods, ourassays possess some superior features such as a lower volume ofrequired biological matrix, an increased analytical sensitivity anda shortened chromatographic run time (Table 1).
2 4 6 8 10 12 14 16 18 20 22 24Time, min
0.01.0e42.0e43.0e44.0e45.0e46.0e47.0e48.0e49.0e41.0e51.1e51.2e51.3e51.4e51.5e51.6e51.7e51.8e51.9e52.0e52.1e52.2e52.3e52.4e52.5e5
Inte
nsity
, cps
HNKHK
S-DHNK
R-DHNK
S-n-KET
R-n-KETS-KET
R-KETD4-K ETd4-n-K ET
2 4 6 8 10 12 14 16 18 20 22 24
Time, mi n
0.0
1.0e 4
2.0e 4
3.0e 4
4.0e 4
5.0e 4
6.0e 4
7.0e 4
8.0e 4
9.0e 4
1.0e 5
1.1e5
1.2e5
1.3e 5
1.4e 5
1.5e5
1.6e 5
1.7e 5
Inte
nsity
, cps
HNK
HK
2 4 6 8 10 12 14 16 18 20 22 240
200
400
600
800
1000
1200
1400
1600
1800
2000
2200
2400
2600
2773
Inte
nsity
, cps
2 4 6 8 10 12 14 16 18 20 22 240.0
5000.0
1.0e4
1.5e4
2.0e4
2.5e4
3.0e4
3.5e4
4.0e4
4.5e4
5.0e4
5.5e4
6.0e4
6.5e4
7.0e4
Inte
nsity
, cps
2 4 6 8 10 12 14 16 18 20 22 24Time, min
0.0
2000.0
4000.0
6000.0
8000.0
1.0e 4
1.2e 4
1.4e4
1.6e 4
1.8e4
2.0e 4
2.2e 4
2.4e 4
2.6e 4
2.8e 4
3.0e 4
3.2e 4
3.4e 4
Inte
nsity
, cps
b
c
d e
Fig. 2. Total ion chromatograms of the enantioselective separation including double blank (a), blank (b), a serum calibrator spiked with 1.5 ng/ml ketamine (KET), norketamine(n-KET) and dehydronorketemine (DHNK) (c), a serum sample of one volunteer from the clinical study (d) and a urine sample of one volunteer from the clinical study (e).
97
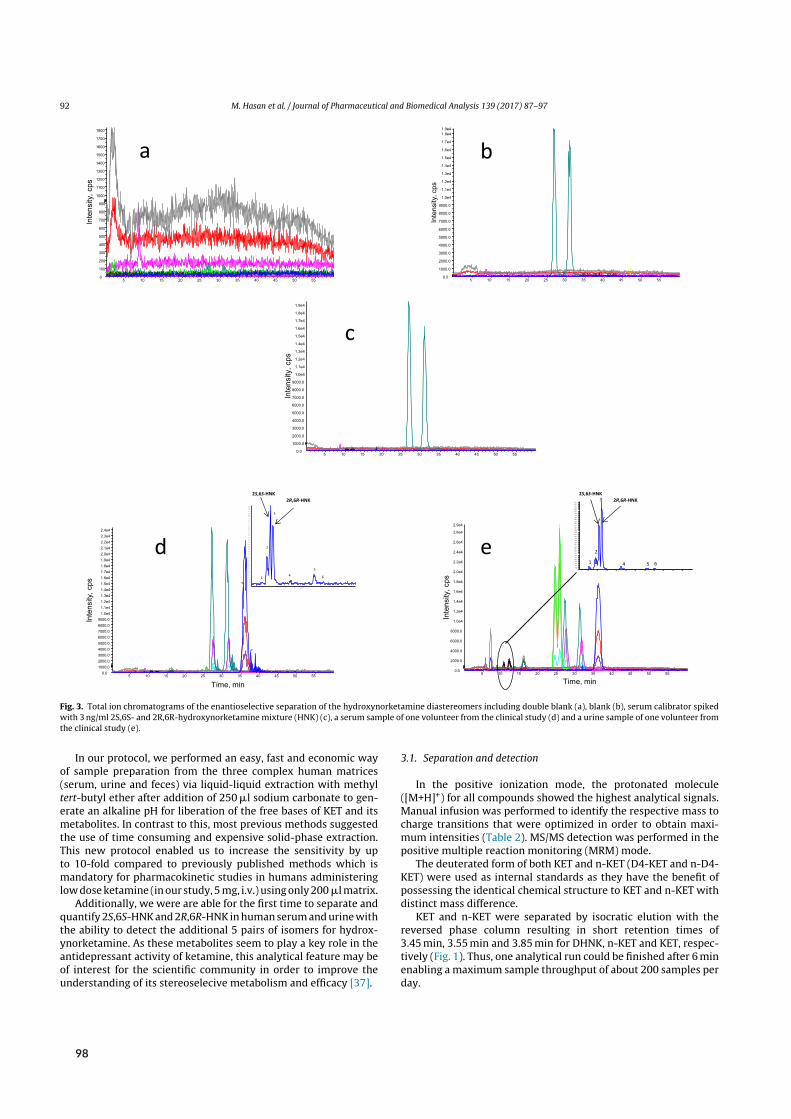
92 M. Hasan et al. / Journal of Pharmaceutical and Biomedical Analysis 139 (2017) 87–97
5 10 15 20 25 30 35 40 45 50 550
100
200
300
400
500
600
700
800
900
1000
1100
1200
1300
1400
1500
1600
1700
1800
Inte
nsity
, cps
5 10 15 20 25 30 35 40 45 50 550.0
1000.0
2000.0
3000.0
4000.0
5000.0
6000.0
7000.0
8000.0
9000.0
1.0e 4
1.1e4
1.2e 4
1.3e 4
1.4e 4
1.5e4
1.6e 4
1.7e 4
1.8e 41.9e 4
Inte
nsity
, cps
35.92 42.6938.93
5 10 15 20 25 30 35 40 45 50 55
Time, min
0.01000.02000.03000.04000.05000.06000.07000.08000.09000.0
1.0e41.1e41.2e41.3e41.4e41.5e41.6e41.7e41.8e41.9e42.0e42.1e42.2e42.3e42.4e4
Inte
nsity
, cps
100
120
140
160
180
200
220
240
260
280
300
320
340
360
380
400
420
440
460
480
500
520
540
560
580
600
620
640
660
680
700
720
740
760
780
800
820
840
860
880
900
920
5 10 15 20 25 30 35 40 45 50 55Time, min
0
20
40
60
801
2
3
4
5
6
2R,6R-HNK2S,6S-HNK
5 10 15 20 25 30 35 40 45 50 55
Time, min0.0
2000.0
4000.0
6000.0
8000.0
1.0e4
1.2e4
1.4e4
1.6e4
1.8e4
2.0e4
2.2e4
2.4e4
2.6e4
2.8e4
2.9e4
Inte
nsity
, cps
5 10 15 20 25 30 35 40 45 50 550
200
400
600
800
100 0120 0140 0160 0180 0200 0220 0240 0260 0280 0300 0320 0340 0360 0380 0400 0420 0440 0460 0480 0500 0520 0540 0560 0580 0600 0620 0640 0
1
2
3
4 5 6
2R,6R-HNK2S,6S-HNK
5 10 15 20 25 30 35 40 45 50 550.0
1000.0
2000.0
3000.0
4000.0
5000.0
6000.0
7000.0
8000.0
9000.0
1.0e4
1.1e4
1.2e4
1.3e4
1.4e4
1.5e4
1.6e4
1.7e4
1.8e4
1.9e4
Inte
nsity
, cps
a b
c
ed
Fig. 3. Total ion chromatograms of the enantioselective separation of the hydroxynorketamine diastereomers including double blank (a), blank (b), serum calibrator spikedwith 3 ng/ml 2S,6S- and 2R,6R-hydroxynorketamine mixture (HNK) (c), a serum sample of one volunteer from the clinical study (d) and a urine sample of one volunteer fromthe clinical study (e).
In our protocol, we performed an easy, fast and economic wayof sample preparation from the three complex human matrices(serum, urine and feces) via liquid-liquid extraction with methyltert-butyl ether after addition of 250 �l sodium carbonate to gen-erate an alkaline pH for liberation of the free bases of KET and itsmetabolites. In contrast to this, most previous methods suggestedthe use of time consuming and expensive solid-phase extraction.This new protocol enabled us to increase the sensitivity by upto 10-fold compared to previously published methods which ismandatory for pharmacokinetic studies in humans administeringlow dose ketamine (in our study, 5 mg, i.v.) using only 200 �l matrix.
Additionally, we were are able for the first time to separate andquantify 2S,6S-HNK and 2R,6R-HNK in human serum and urine withthe ability to detect the additional 5 pairs of isomers for hydrox-ynorketamine. As these metabolites seem to play a key role in theantidepressant activity of ketamine, this analytical feature may beof interest for the scientific community in order to improve theunderstanding of its stereoselecive metabolism and efficacy [37].
3.1. Separation and detection
In the positive ionization mode, the protonated molecule([M+H]+) for all compounds showed the highest analytical signals.Manual infusion was performed to identify the respective mass tocharge transitions that were optimized in order to obtain maxi-mum intensities (Table 2). MS/MS detection was performed in thepositive multiple reaction monitoring (MRM) mode.
The deuterated form of both KET and n-KET (D4-KET and n-D4-KET) were used as internal standards as they have the benefit ofpossessing the identical chemical structure to KET and n-KET withdistinct mass difference.
KET and n-KET were separated by isocratic elution with thereversed phase column resulting in short retention times of3.45 min, 3.55 min and 3.85 min for DHNK, n-KET and KET, respec-tively (Fig. 1). Thus, one analytical run could be finished after 6 minenabling a maximum sample throughput of about 200 samples perday.
98
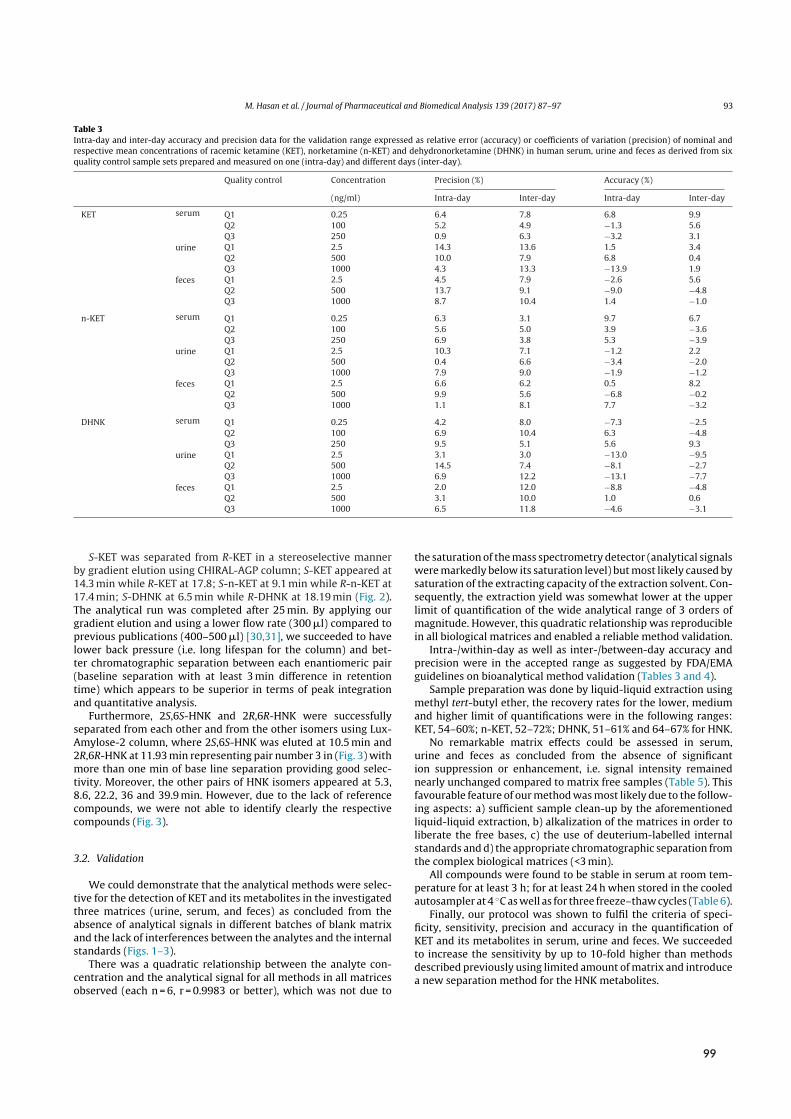
M. Hasan et al. / Journal of Pharmaceutical and Biomedical Analysis 139 (2017) 87–97 93
Table 3Intra-day and inter-day accuracy and precision data for the validation range expressed as relative error (accuracy) or coefficients of variation (precision) of nominal andrespective mean concentrations of racemic ketamine (KET), norketamine (n-KET) and dehydronorketamine (DHNK) in human serum, urine and feces as derived from sixquality control sample sets prepared and measured on one (intra-day) and different days (inter-day).
Quality control Concentration Precision (%) Accuracy (%)
(ng/ml) Intra-day Inter-day Intra-day Inter-day
KET serum Q1 0.25 6.4 7.8 6.8 9.9Q2 100 5.2 4.9 −1.3 5.6Q3 250 0.9 6.3 −3.2 3.1
urine Q1 2.5 14.3 13.6 1.5 3.4Q2 500 10.0 7.9 6.8 0.4Q3 1000 4.3 13.3 −13.9 1.9
feces Q1 2.5 4.5 7.9 −2.6 5.6Q2 500 13.7 9.1 −9.0 −4.8Q3 1000 8.7 10.4 1.4 −1.0
n-KET serum Q1 0.25 6.3 3.1 9.7 6.7Q2 100 5.6 5.0 3.9 −3.6Q3 250 6.9 3.8 5.3 −3.9
urine Q1 2.5 10.3 7.1 −1.2 2.2Q2 500 0.4 6.6 −3.4 −2.0Q3 1000 7.9 9.0 −1.9 −1.2
feces Q1 2.5 6.6 6.2 0.5 8.2Q2 500 9.9 5.6 −6.8 −0.2Q3 1000 1.1 8.1 7.7 −3.2
DHNK serum Q1 0.25 4.2 8.0 −7.3 −2.5Q2 100 6.9 10.4 6.3 −4.8Q3 250 9.5 5.1 5.6 9.3
urine Q1 2.5 3.1 3.0 −13.0 −9.5Q2 500 14.5 7.4 −8.1 −2.7Q3 1000 6.9 12.2 −13.1 −7.7
feces Q1 2.5 2.0 12.0 −8.8 −4.8Q2 500 3.1 10.0 1.0 0.6Q3 1000 6.5 11.8 −4.6 −3.1
S-KET was separated from R-KET in a stereoselective mannerby gradient elution using CHIRAL-AGP column; S-KET appeared at14.3 min while R-KET at 17.8; S-n-KET at 9.1 min while R-n-KET at17.4 min; S-DHNK at 6.5 min while R-DHNK at 18.19 min (Fig. 2).The analytical run was completed after 25 min. By applying ourgradient elution and using a lower flow rate (300 �l) compared toprevious publications (400–500 �l) [30,31], we succeeded to havelower back pressure (i.e. long lifespan for the column) and bet-ter chromatographic separation between each enantiomeric pair(baseline separation with at least 3 min difference in retentiontime) which appears to be superior in terms of peak integrationand quantitative analysis.
Furthermore, 2S,6S-HNK and 2R,6R-HNK were successfullyseparated from each other and from the other isomers using Lux-Amylose-2 column, where 2S,6S-HNK was eluted at 10.5 min and2R,6R-HNK at 11.93 min representing pair number 3 in (Fig. 3) withmore than one min of base line separation providing good selec-tivity. Moreover, the other pairs of HNK isomers appeared at 5.3,8.6, 22.2, 36 and 39.9 min. However, due to the lack of referencecompounds, we were not able to identify clearly the respectivecompounds (Fig. 3).
3.2. Validation
We could demonstrate that the analytical methods were selec-tive for the detection of KET and its metabolites in the investigatedthree matrices (urine, serum, and feces) as concluded from theabsence of analytical signals in different batches of blank matrixand the lack of interferences between the analytes and the internalstandards (Figs. 1–3).
There was a quadratic relationship between the analyte con-centration and the analytical signal for all methods in all matricesobserved (each n = 6, r = 0.9983 or better), which was not due to
the saturation of the mass spectrometry detector (analytical signalswere markedly below its saturation level) but most likely caused bysaturation of the extracting capacity of the extraction solvent. Con-sequently, the extraction yield was somewhat lower at the upperlimit of quantification of the wide analytical range of 3 orders ofmagnitude. However, this quadratic relationship was reproduciblein all biological matrices and enabled a reliable method validation.
Intra-/within-day as well as inter-/between-day accuracy andprecision were in the accepted range as suggested by FDA/EMAguidelines on bioanalytical method validation (Tables 3 and 4).
Sample preparation was done by liquid-liquid extraction usingmethyl tert-butyl ether, the recovery rates for the lower, mediumand higher limit of quantifications were in the following ranges:KET, 54–60%; n-KET, 52–72%; DHNK, 51–61% and 64–67% for HNK.
No remarkable matrix effects could be assessed in serum,urine and feces as concluded from the absence of significantion suppression or enhancement, i.e. signal intensity remainednearly unchanged compared to matrix free samples (Table 5). Thisfavourable feature of our method was most likely due to the follow-ing aspects: a) sufficient sample clean-up by the aforementionedliquid-liquid extraction, b) alkalization of the matrices in order toliberate the free bases, c) the use of deuterium-labelled internalstandards and d) the appropriate chromatographic separation fromthe complex biological matrices (<3 min).
All compounds were found to be stable in serum at room tem-perature for at least 3 h; for at least 24 h when stored in the cooledautosampler at 4 ◦C as well as for three freeze–thaw cycles (Table 6).
Finally, our protocol was shown to fulfil the criteria of speci-ficity, sensitivity, precision and accuracy in the quantification ofKET and its metabolites in serum, urine and feces. We succeededto increase the sensitivity by up to 10-fold higher than methodsdescribed previously using limited amount of matrix and introducea new separation method for the HNK metabolites.
99
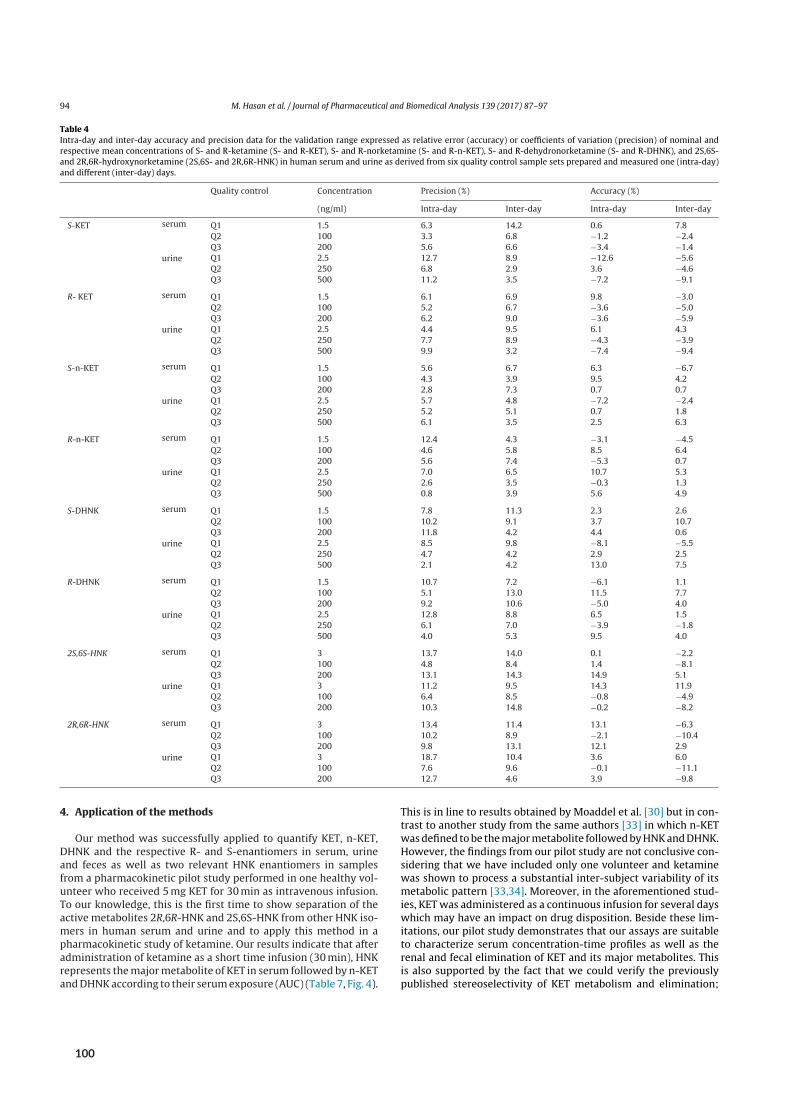
94 M. Hasan et al. / Journal of Pharmaceutical and Biomedical Analysis 139 (2017) 87–97
Table 4Intra-day and inter-day accuracy and precision data for the validation range expressed as relative error (accuracy) or coefficients of variation (precision) of nominal andrespective mean concentrations of S- and R-ketamine (S- and R-KET), S- and R-norketamine (S- and R-n-KET), S- and R-dehydronorketamine (S- and R-DHNK), and 2S,6S-and 2R,6R-hydroxynorketamine (2S,6S- and 2R,6R-HNK) in human serum and urine as derived from six quality control sample sets prepared and measured one (intra-day)and different (inter-day) days.
Quality control Concentration Precision (%) Accuracy (%)
(ng/ml) Intra-day Inter-day Intra-day Inter-day
S-KET serum Q1 1.5 6.3 14.2 0.6 7.8Q2 100 3.3 6.8 −1.2 −2.4Q3 200 5.6 6.6 −3.4 −1.4
urine Q1 2.5 12.7 8.9 −12.6 −5.6Q2 250 6.8 2.9 3.6 −4.6Q3 500 11.2 3.5 −7.2 −9.1
R- KET serum Q1 1.5 6.1 6.9 9.8 −3.0Q2 100 5.2 6.7 −3.6 −5.0Q3 200 6.2 9.0 −3.6 −5.9
urine Q1 2.5 4.4 9.5 6.1 4.3Q2 250 7.7 8.9 −4.3 −3.9Q3 500 9.9 3.2 −7.4 −9.4
S-n-KET serum Q1 1.5 5.6 6.7 6.3 −6.7Q2 100 4.3 3.9 9.5 4.2Q3 200 2.8 7.3 0.7 0.7
urine Q1 2.5 5.7 4.8 −7.2 −2.4Q2 250 5.2 5.1 0.7 1.8Q3 500 6.1 3.5 2.5 6.3
R-n-KET serum Q1 1.5 12.4 4.3 −3.1 −4.5Q2 100 4.6 5.8 8.5 6.4Q3 200 5.6 7.4 −5.3 0.7
urine Q1 2.5 7.0 6.5 10.7 5.3Q2 250 2.6 3.5 −0.3 1.3Q3 500 0.8 3.9 5.6 4.9
S-DHNK serum Q1 1.5 7.8 11.3 2.3 2.6Q2 100 10.2 9.1 3.7 10.7Q3 200 11.8 4.2 4.4 0.6
urine Q1 2.5 8.5 9.8 −8.1 −5.5Q2 250 4.7 4.2 2.9 2.5Q3 500 2.1 4.2 13.0 7.5
R-DHNK serum Q1 1.5 10.7 7.2 −6.1 1.1Q2 100 5.1 13.0 11.5 7.7Q3 200 9.2 10.6 −5.0 4.0
urine Q1 2.5 12.8 8.8 6.5 1.5Q2 250 6.1 7.0 −3.9 −1.8Q3 500 4.0 5.3 9.5 4.0
2S,6S-HNK serum Q1 3 13.7 14.0 0.1 −2.2Q2 100 4.8 8.4 1.4 −8.1Q3 200 13.1 14.3 14.9 5.1
urine Q1 3 11.2 9.5 14.3 11.9Q2 100 6.4 8.5 −0.8 −4.9Q3 200 10.3 14.8 −0.2 −8.2
2R,6R-HNK serum Q1 3 13.4 11.4 13.1 −6.3Q2 100 10.2 8.9 −2.1 −10.4Q3 200 9.8 13.1 12.1 2.9
urine Q1 3 18.7 10.4 3.6 6.0Q2 100 7.6 9.6 −0.1 −11.1Q3 200 12.7 4.6 3.9 −9.8
4. Application of the methods
Our method was successfully applied to quantify KET, n-KET,DHNK and the respective R- and S-enantiomers in serum, urineand feces as well as two relevant HNK enantiomers in samplesfrom a pharmacokinetic pilot study performed in one healthy vol-unteer who received 5 mg KET for 30 min as intravenous infusion.To our knowledge, this is the first time to show separation of theactive metabolites 2R,6R-HNK and 2S,6S-HNK from other HNK iso-mers in human serum and urine and to apply this method in apharmacokinetic study of ketamine. Our results indicate that afteradministration of ketamine as a short time infusion (30 min), HNKrepresents the major metabolite of KET in serum followed by n-KETand DHNK according to their serum exposure (AUC) (Table 7, Fig. 4).
This is in line to results obtained by Moaddel et al. [30] but in con-trast to another study from the same authors [33] in which n-KETwas defined to be the major metabolite followed by HNK and DHNK.However, the findings from our pilot study are not conclusive con-sidering that we have included only one volunteer and ketaminewas shown to process a substantial inter-subject variability of itsmetabolic pattern [33,34]. Moreover, in the aforementioned stud-ies, KET was administered as a continuous infusion for several dayswhich may have an impact on drug disposition. Beside these lim-itations, our pilot study demonstrates that our assays are suitableto characterize serum concentration-time profiles as well as therenal and fecal elimination of KET and its major metabolites. Thisis also supported by the fact that we could verify the previouslypublished stereoselectivity of KET metabolism and elimination;
100
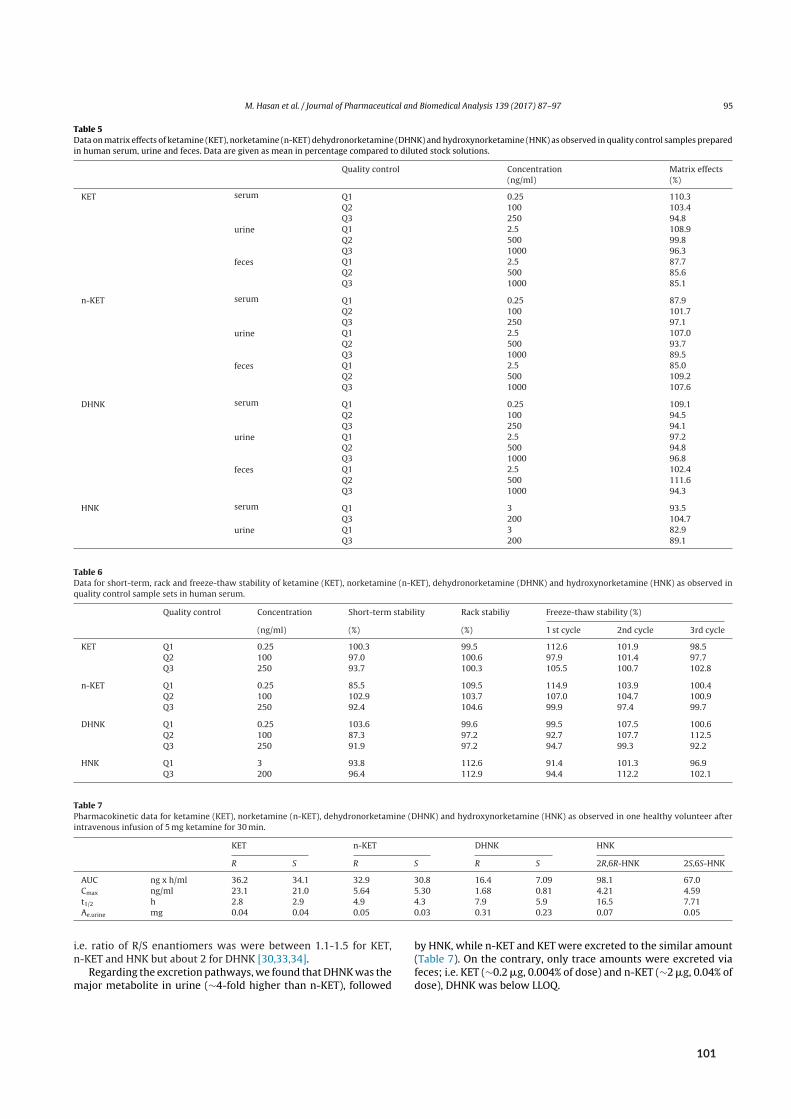
M. Hasan et al. / Journal of Pharmaceutical and Biomedical Analysis 139 (2017) 87–97 95
Table 5Data on matrix effects of ketamine (KET), norketamine (n-KET) dehydronorketamine (DHNK) and hydroxynorketamine (HNK) as observed in quality control samples preparedin human serum, urine and feces. Data are given as mean in percentage compared to diluted stock solutions.
Quality control Concentration Matrix effects(ng/ml) (%)
KET serum Q1 0.25 110.3Q2 100 103.4Q3 250 94.8
urine Q1 2.5 108.9Q2 500 99.8Q3 1000 96.3
feces Q1 2.5 87.7Q2 500 85.6Q3 1000 85.1
n-KET serum Q1 0.25 87.9Q2 100 101.7Q3 250 97.1
urine Q1 2.5 107.0Q2 500 93.7Q3 1000 89.5
feces Q1 2.5 85.0Q2 500 109.2Q3 1000 107.6
DHNK serum Q1 0.25 109.1Q2 100 94.5Q3 250 94.1
urine Q1 2.5 97.2Q2 500 94.8Q3 1000 96.8
feces Q1 2.5 102.4Q2 500 111.6Q3 1000 94.3
HNK serum Q1 3 93.5Q3 200 104.7
urine Q1 3 82.9Q3 200 89.1
Table 6Data for short-term, rack and freeze-thaw stability of ketamine (KET), norketamine (n-KET), dehydronorketamine (DHNK) and hydroxynorketamine (HNK) as observed inquality control sample sets in human serum.
Quality control Concentration Short-term stability Rack stabiliy Freeze-thaw stability (%)
(ng/ml) (%) (%) 1 st cycle 2nd cycle 3rd cycle
KET Q1 0.25 100.3 99.5 112.6 101.9 98.5Q2 100 97.0 100.6 97.9 101.4 97.7Q3 250 93.7 100.3 105.5 100.7 102.8
n-KET Q1 0.25 85.5 109.5 114.9 103.9 100.4Q2 100 102.9 103.7 107.0 104.7 100.9Q3 250 92.4 104.6 99.9 97.4 99.7
DHNK Q1 0.25 103.6 99.6 99.5 107.5 100.6Q2 100 87.3 97.2 92.7 107.7 112.5Q3 250 91.9 97.2 94.7 99.3 92.2
HNK Q1 3 93.8 112.6 91.4 101.3 96.9Q3 200 96.4 112.9 94.4 112.2 102.1
Table 7Pharmacokinetic data for ketamine (KET), norketamine (n-KET), dehydronorketamine (DHNK) and hydroxynorketamine (HNK) as observed in one healthy volunteer afterintravenous infusion of 5 mg ketamine for 30 min.
KET n-KET DHNK HNK
R S R S R S 2R,6R-HNK 2S,6S-HNK
AUC ng x h/ml 36.2 34.1 32.9 30.8 16.4 7.09 98.1 67.0Cmax ng/ml 23.1 21.0 5.64 5.30 1.68 0.81 4.21 4.59t1/2 h 2.8 2.9 4.9 4.3 7.9 5.9 16.5 7.71Ae.urine mg 0.04 0.04 0.05 0.03 0.31 0.23 0.07 0.05
i.e. ratio of R/S enantiomers was were between 1.1-1.5 for KET,n-KET and HNK but about 2 for DHNK [30,33,34].
Regarding the excretion pathways, we found that DHNK was themajor metabolite in urine (∼4-fold higher than n-KET), followed
by HNK, while n-KET and KET were excreted to the similar amount(Table 7). On the contrary, only trace amounts were excreted viafeces; i.e. KET (∼0.2 �g, 0.004% of dose) and n-KET (∼2 �g, 0.04% ofdose), DHNK was below LLOQ.
101
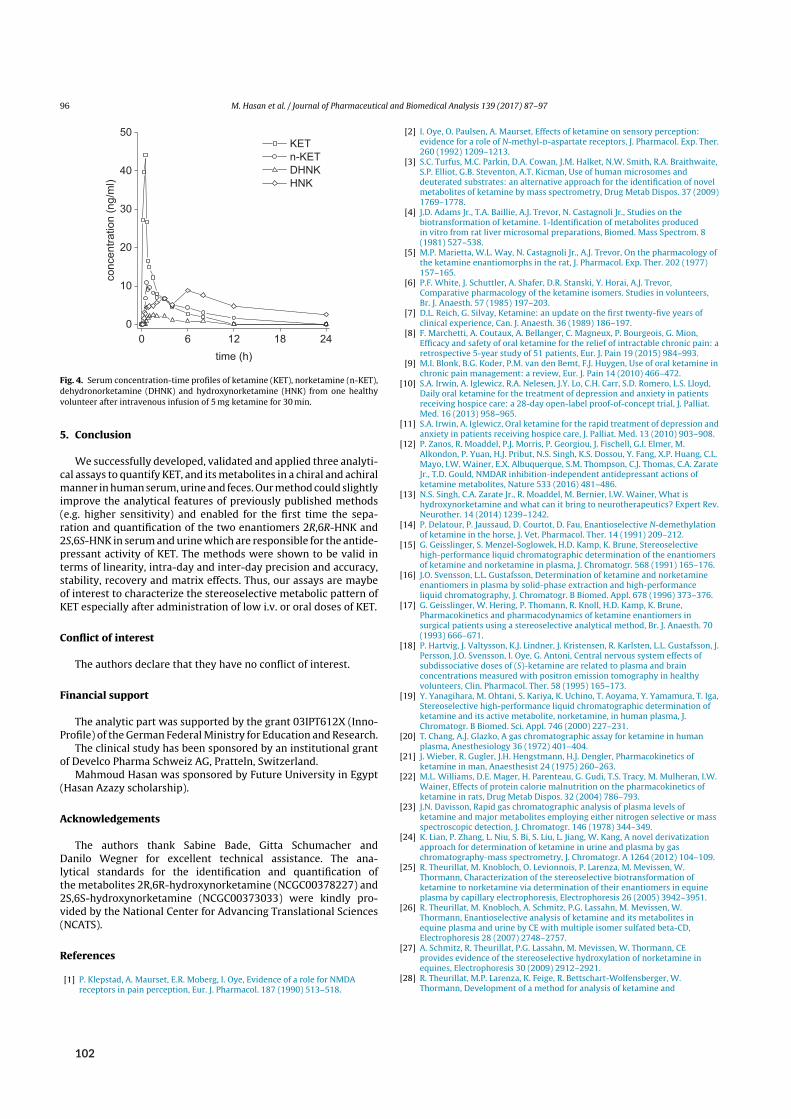
96 M. Hasan et al. / Journal of Pharmaceutical and Biomedical Analysis 139 (2017) 87–97
0 6 12 18 240
10
20
30
40
50
conc
entra
tion
(ng/
ml)
time (h )
KET n-KE T DHN K HN K
Fig. 4. Serum concentration-time profiles of ketamine (KET), norketamine (n-KET),dehydronorketamine (DHNK) and hydroxynorketamine (HNK) from one healthyvolunteer after intravenous infusion of 5 mg ketamine for 30 min.
5. Conclusion
We successfully developed, validated and applied three analyti-cal assays to quantify KET, and its metabolites in a chiral and achiralmanner in human serum, urine and feces. Our method could slightlyimprove the analytical features of previously published methods(e.g. higher sensitivity) and enabled for the first time the sepa-ration and quantification of the two enantiomers 2R,6R-HNK and2S,6S-HNK in serum and urine which are responsible for the antide-pressant activity of KET. The methods were shown to be valid interms of linearity, intra-day and inter-day precision and accuracy,stability, recovery and matrix effects. Thus, our assays are maybeof interest to characterize the stereoselective metabolic pattern ofKET especially after administration of low i.v. or oral doses of KET.
Conflict of interest
The authors declare that they have no conflict of interest.
Financial support
The analytic part was supported by the grant 03IPT612X (Inno-Profile) of the German Federal Ministry for Education and Research.
The clinical study has been sponsored by an institutional grantof Develco Pharma Schweiz AG, Pratteln, Switzerland.
Mahmoud Hasan was sponsored by Future University in Egypt(Hasan Azazy scholarship).
Acknowledgements
The authors thank Sabine Bade, Gitta Schumacher andDanilo Wegner for excellent technical assistance. The ana-lytical standards for the identification and quantification ofthe metabolites 2R,6R-hydroxynorketamine (NCGC00378227) and2S,6S-hydroxynorketamine (NCGC00373033) were kindly pro-vided by the National Center for Advancing Translational Sciences(NCATS).
References
[1] P. Klepstad, A. Maurset, E.R. Moberg, I. Oye, Evidence of a role for NMDAreceptors in pain perception, Eur. J. Pharmacol. 187 (1990) 513–518.
[2] I. Oye, O. Paulsen, A. Maurset, Effects of ketamine on sensory perception:evidence for a role of N-methyl-d-aspartate receptors, J. Pharmacol. Exp. Ther.260 (1992) 1209–1213.
[3] S.C. Turfus, M.C. Parkin, D.A. Cowan, J.M. Halket, N.W. Smith, R.A. Braithwaite,S.P. Elliot, G.B. Steventon, A.T. Kicman, Use of human microsomes anddeuterated substrates: an alternative approach for the identification of novelmetabolites of ketamine by mass spectrometry, Drug Metab Dispos. 37 (2009)1769–1778.
[4] J.D. Adams Jr., T.A. Baillie, A.J. Trevor, N. Castagnoli Jr., Studies on thebiotransformation of ketamine. 1-Identification of metabolites producedin vitro from rat liver microsomal preparations, Biomed. Mass Spectrom. 8(1981) 527–538.
[5] M.P. Marietta, W.L. Way, N. Castagnoli Jr., A.J. Trevor, On the pharmacology ofthe ketamine enantiomorphs in the rat, J. Pharmacol. Exp. Ther. 202 (1977)157–165.
[6] P.F. White, J. Schuttler, A. Shafer, D.R. Stanski, Y. Horai, A.J. Trevor,Comparative pharmacology of the ketamine isomers. Studies in volunteers,Br. J. Anaesth. 57 (1985) 197–203.
[7] D.L. Reich, G. Silvay, Ketamine: an update on the first twenty-five years ofclinical experience, Can. J. Anaesth. 36 (1989) 186–197.
[8] F. Marchetti, A. Coutaux, A. Bellanger, C. Magneux, P. Bourgeois, G. Mion,Efficacy and safety of oral ketamine for the relief of intractable chronic pain: aretrospective 5-year study of 51 patients, Eur. J. Pain 19 (2015) 984–993.
[9] M.I. Blonk, B.G. Koder, P.M. van den Bemt, F.J. Huygen, Use of oral ketamine inchronic pain management: a review, Eur. J. Pain 14 (2010) 466–472.
[10] S.A. Irwin, A. Iglewicz, R.A. Nelesen, J.Y. Lo, C.H. Carr, S.D. Romero, L.S. Lloyd,Daily oral ketamine for the treatment of depression and anxiety in patientsreceiving hospice care: a 28-day open-label proof-of-concept trial, J. Palliat.Med. 16 (2013) 958–965.
[11] S.A. Irwin, A. Iglewicz, Oral ketamine for the rapid treatment of depression andanxiety in patients receiving hospice care, J. Palliat. Med. 13 (2010) 903–908.
[12] P. Zanos, R. Moaddel, P.J. Morris, P. Georgiou, J. Fischell, G.I. Elmer, M.Alkondon, P. Yuan, H.J. Pribut, N.S. Singh, K.S. Dossou, Y. Fang, X.P. Huang, C.L.Mayo, I.W. Wainer, E.X. Albuquerque, S.M. Thompson, C.J. Thomas, C.A. ZarateJr., T.D. Gould, NMDAR inhibition-independent antidepressant actions ofketamine metabolites, Nature 533 (2016) 481–486.
[13] N.S. Singh, C.A. Zarate Jr., R. Moaddel, M. Bernier, I.W. Wainer, What ishydroxynorketamine and what can it bring to neurotherapeutics? Expert Rev.Neurother. 14 (2014) 1239–1242.
[14] P. Delatour, P. Jaussaud, D. Courtot, D. Fau, Enantioselective N-demethylationof ketamine in the horse, J. Vet. Pharmacol. Ther. 14 (1991) 209–212.
[15] G. Geisslinger, S. Menzel-Soglowek, H.D. Kamp, K. Brune, Stereoselectivehigh-performance liquid chromatographic determination of the enantiomersof ketamine and norketamine in plasma, J. Chromatogr. 568 (1991) 165–176.
[16] J.O. Svensson, L.L. Gustafsson, Determination of ketamine and norketamineenantiomers in plasma by solid-phase extraction and high-performanceliquid chromatography, J. Chromatogr. B Biomed. Appl. 678 (1996) 373–376.
[17] G. Geisslinger, W. Hering, P. Thomann, R. Knoll, H.D. Kamp, K. Brune,Pharmacokinetics and pharmacodynamics of ketamine enantiomers insurgical patients using a stereoselective analytical method, Br. J. Anaesth. 70(1993) 666–671.
[18] P. Hartvig, J. Valtysson, K.J. Lindner, J. Kristensen, R. Karlsten, L.L. Gustafsson, J.Persson, J.O. Svensson, I. Oye, G. Antoni, Central nervous system effects ofsubdissociative doses of (S)-ketamine are related to plasma and brainconcentrations measured with positron emission tomography in healthyvolunteers, Clin. Pharmacol. Ther. 58 (1995) 165–173.
[19] Y. Yanagihara, M. Ohtani, S. Kariya, K. Uchino, T. Aoyama, Y. Yamamura, T. Iga,Stereoselective high-performance liquid chromatographic determination ofketamine and its active metabolite, norketamine, in human plasma, J.Chromatogr. B Biomed. Sci. Appl. 746 (2000) 227–231.
[20] T. Chang, A.J. Glazko, A gas chromatographic assay for ketamine in humanplasma, Anesthesiology 36 (1972) 401–404.
[21] J. Wieber, R. Gugler, J.H. Hengstmann, H.J. Dengler, Pharmacokinetics ofketamine in man, Anaesthesist 24 (1975) 260–263.
[22] M.L. Williams, D.E. Mager, H. Parenteau, G. Gudi, T.S. Tracy, M. Mulheran, I.W.Wainer, Effects of protein calorie malnutrition on the pharmacokinetics ofketamine in rats, Drug Metab Dispos. 32 (2004) 786–793.
[23] J.N. Davisson, Rapid gas chromatographic analysis of plasma levels ofketamine and major metabolites employing either nitrogen selective or massspectroscopic detection, J. Chromatogr. 146 (1978) 344–349.
[24] K. Lian, P. Zhang, L. Niu, S. Bi, S. Liu, L. Jiang, W. Kang, A novel derivatizationapproach for determination of ketamine in urine and plasma by gaschromatography-mass spectrometry, J. Chromatogr. A 1264 (2012) 104–109.
[25] R. Theurillat, M. Knobloch, O. Levionnois, P. Larenza, M. Mevissen, W.Thormann, Characterization of the stereoselective biotransformation ofketamine to norketamine via determination of their enantiomers in equineplasma by capillary electrophoresis, Electrophoresis 26 (2005) 3942–3951.
[26] R. Theurillat, M. Knobloch, A. Schmitz, P.G. Lassahn, M. Mevissen, W.Thormann, Enantioselective analysis of ketamine and its metabolites inequine plasma and urine by CE with multiple isomer sulfated beta-CD,Electrophoresis 28 (2007) 2748–2757.
[27] A. Schmitz, R. Theurillat, P.G. Lassahn, M. Mevissen, W. Thormann, CEprovides evidence of the stereoselective hydroxylation of norketamine inequines, Electrophoresis 30 (2009) 2912–2921.
[28] R. Theurillat, M.P. Larenza, K. Feige, R. Bettschart-Wolfensberger, W.Thormann, Development of a method for analysis of ketamine and
102

M. Hasan et al. / Journal of Pharmaceutical and Biomedical Analysis 139 (2017) 87–97 97
norketamine enantiomers in equine brain and cerebrospinal fluid by capillaryelectrophoresis, Electrophoresis 35 (2014) 2863–2869.
[29] T. LeGrand, S. Roy, C. Monchaud, C. Grondin, M. Duval, E. Jacqz-Aigrain,Determination of ketamine and norketamine in plasma by micro-liquidchromatography-mass spectrometry, J. Pharm. Biomed. Anal. 48 (2008)171–176.
[30] R. Moaddel, S.L. Venkata, M.J. Tanga, J.E. Bupp, C.E. Green, L. Iyer, A. Furimsky,M.E. Goldberg, M.C. Torjman, I.W. Wainer, A parallel chiral-achiral liquidchromatographic method for the determination of the stereoisomers ofketamine and ketamine metabolites in the plasma and urine of patients withcomplex regional pain syndrome, Talanta 82 (2010) 1892–1904.
[31] M.E. Rodriguez Rosas, S. Patel, I.W. Wainer, Determination of the enantiomersof ketamine and norketamine in human plasma by enantioselective liquidchromatography-mass spectrometry, J. Chromatogr. B Analyt. Technol.Biomed. Life Sci. 794 (2003) 99–108.
[32] K.C. Wang, T.S. Shih, S.G. Cheng, Use of SPE and LC/TIS/MS/MS for rapiddetection and quantitation of ketamine and its metabolite, norketamine, inurine, Forensic Sci. Int. 147 (2005) 81–88.
[33] X. Zhao, S.L. Venkata, R. Moaddel, D.A. Luckenbaugh, N.E. Brutsche, L. Ibrahim,C.A. Zarate Jr., D.E. Mager, I.W. Wainer, Simultaneous populationpharmacokinetic modelling of ketamine and three major metabolites inpatients with treatment-resistant bipolar depression, Br. J. Clin. Pharmacol. 74(2012) 304–314.
[34] M.E. Goldberg, M.C. Torjman, R.J. Schwartzman, D.E. Mager, I.W. Wainer,Enantioselective pharmacokinetics of (R)- and (S)-ketamine after a 5-dayinfusion in patients with complex regional pain syndrome, Chirality 23 (2011)138–143.
[35] European Medicines Agency (EMA) and Committee for Medicinal Products forHuman Use (CHMP), Guideline on Bioanalytical Method Validation, FDA,2013, Ref Type: Online Source.
[36] Food and Drug Administration (FDA), Guidance for Industry—BioanalyticalMethod Validation, FDA, 2013, Ref Type: Online Source.
[37] P. Zanos, R. Moaddel, P.J. Morris, P. Georgiou, J. Fischell, G.I. Elmer, M.Alkondon, P. Yuan, H.J. Pribut, N.S. Singh, K.S. Dossou, Y. Fang, X.P. Huang, C.L.Mayo, I.W. Wainer, E.X. Albuquerque, S.M. Thompson, C.J. Thomas, C.A. ZarateJr., T.D. Gould, NMDAR inhibition-independent antidepressant actions ofketamine metabolites, Nature 533 (2016) 481–486.
103
Part 4 Publications
Paper VI
Ketamine metabolites with antidepressant effects: fast economical, and eco‐friend‐ly enantioselective separation based on supercritical‐fluid chromatography (SFC)and single quadrupole MS detection
Authors Georg M. Fassauer, Robert K. Hofstetter, Mahmoud Hasan, Stefan Oswald, ChristinaModeß, Werner Siegmund, and Andreas Link
Journal J. Pharm. Biomed. Anal. 146 (2017): 410-419.
Analytical content Switching to LLE-SFC-MS, this paper describes a single method for the chiralquantification of the same antidepressant metabolites but within a shorter time frame (15 minutes)and relying on a financially less demanding detection method (single quadrupole MS). The finalmethod was validated according to international guidelines – which remains the exception in bio-analytical SFC.
Contributions
GeorgM. Fassauer Methodology, visualization, writing (original draft)Robert K. Hofstetter Investigation, validation, writing (original draft)MahmoudHasan Investigation, validationStefan Oswald Project administration, resourcesChristina Modeß InvestigationWerner Siegmund Funding acquisition, project administration, resourcesAndreas Link Project administration, resources, supervision, writing (review and edit-
ing)
Robert K. Hofstetter Andreas Link
(signature) (signature)
104
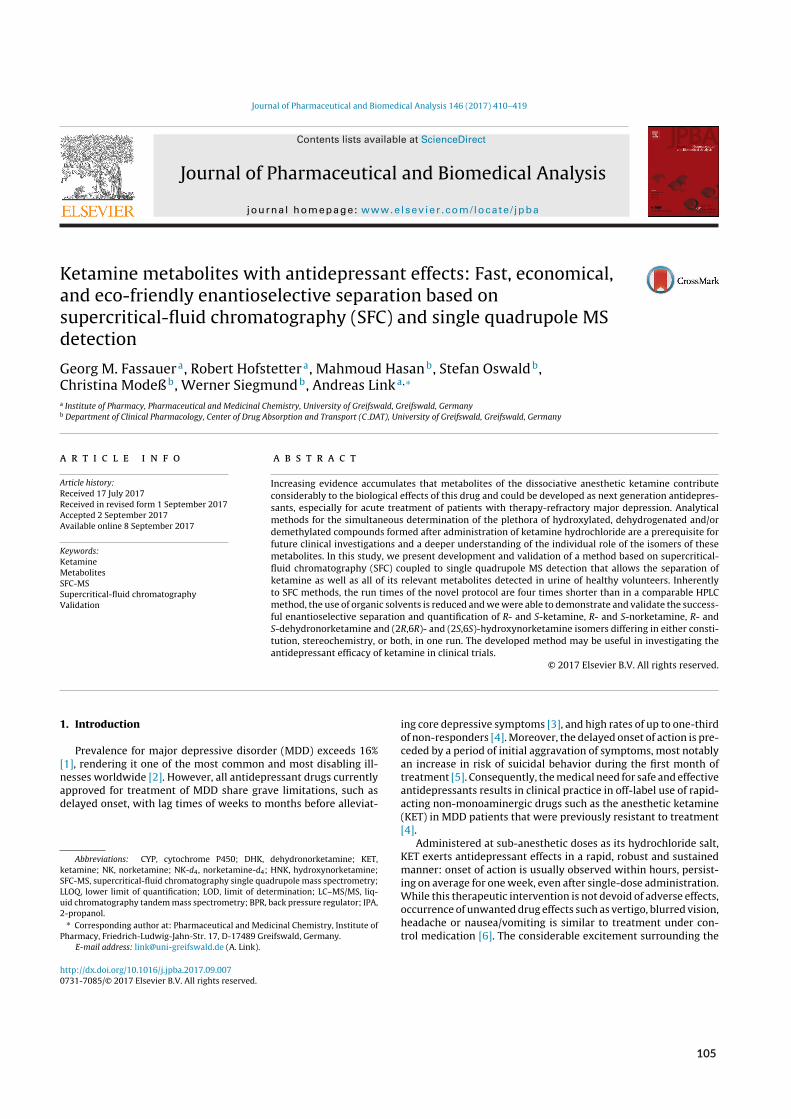
Journal of Pharmaceutical and Biomedical Analysis 146 (2017) 410–419
Contents lists available at ScienceDirect
Journal of Pharmaceutical and Biomedical Analysis
j o ur nal ho me page: www.elsev ier .com/ lo cate / jpba
Ketamine metabolites with antidepressant effects: Fast, economical,and eco-friendly enantioselective separation based onsupercritical-fluid chromatography (SFC) and single quadrupole MSdetection
Georg M. Fassauera, Robert Hofstettera, Mahmoud Hasanb, Stefan Oswaldb,Christina Modeßb, Werner Siegmundb, Andreas Linka,∗
a Institute of Pharmacy, Pharmaceutical and Medicinal Chemistry, University of Greifswald, Greifswald, Germanyb Department of Clinical Pharmacology, Center of Drug Absorption and Transport (C DAT), University of Greifswald, Greifswald, Germany
a r t i c l e i n f o
Article history:Received 17 July 2017Received in revised form 1 September 2017Accepted 2 September 2017Available online 8 September 2017
Keywords:KetamineMetabolitesSFC-MSSupercritical-fluid chromatographyValidation
a b s t r a c t
Increasing evidence accumulates that metabolites of the dissociative anesthetic ketamine contributeconsiderably to the biological effects of this drug and could be developed as next generation antidepres-sants, especially for acute treatment of patients with therapy-refractory major depression. Analyticalmethods for the simultaneous determination of the plethora of hydroxylated, dehydrogenated and/ordemethylated compounds formed after administration of ketamine hydrochloride are a prerequisite forfuture clinical investigations and a deeper understanding of the individual role of the isomers of thesemetabolites. In this study, we present development and validation of a method based on supercritical-fluid chromatography (SFC) coupled to single quadrupole MS detection that allows the separation ofketamine as well as all of its relevant metabolites detected in urine of healthy volunteers. Inherentlyto SFC methods, the run times of the novel protocol are four times shorter than in a comparable HPLCmethod, the use of organic solvents is reduced and we were able to demonstrate and validate the success-ful enantioselective separation and quantification of R- and S-ketamine, R- and S-norketamine, R- andS-dehydronorketamine and (2R,6R)- and (2S,6S)-hydroxynorketamine isomers differing in either consti-tution, stereochemistry, or both, in one run. The developed method may be useful in investigating theantidepressant efficacy of ketamine in clinical trials.
© 2017 Elsevier B.V. All rights reserved.
1. Introduction
Prevalence for major depressive disorder (MDD) exceeds 16%[1], rendering it one of the most common and most disabling ill-nesses worldwide [2]. However, all antidepressant drugs currentlyapproved for treatment of MDD share grave limitations, such asdelayed onset, with lag times of weeks to months before alleviat-
Abbreviations: CYP, cytochrome P450; DHK, dehydronorketamine; KET,ketamine; NK, norketamine; NK-d4, norketamine-d4; HNK, hydroxynorketamine;SFC-MS, supercritical-fluid chromatography single quadrupole mass spectrometry;LLOQ, lower limit of quantification; LOD, limit of determination; LC–MS/MS, liq-uid chromatography tandem mass spectrometry; BPR, back pressure regulator; IPA,2-propanol.
∗ Corresponding author at: Pharmaceutical and Medicinal Chemistry, Institute ofPharmacy, Friedrich-Ludwig-Jahn-Str. 17, D-17489 Greifswald, Germany.
E-mail address: [email protected] (A. Link).
ing core depressive symptoms [3], and high rates of up to one-thirdof non-responders [4]. Moreover, the delayed onset of action is pre-ceded by a period of initial aggravation of symptoms, most notablyan increase in risk of suicidal behavior during the first month oftreatment [5]. Consequently, the medical need for safe and effectiveantidepressants results in clinical practice in off-label use of rapid-acting non-monoaminergic drugs such as the anesthetic ketamine(KET) in MDD patients that were previously resistant to treatment[4].
Administered at sub-anesthetic doses as its hydrochloride salt,KET exerts antidepressant effects in a rapid, robust and sustainedmanner: onset of action is usually observed within hours, persist-ing on average for one week, even after single-dose administration.While this therapeutic intervention is not devoid of adverse effects,occurrence of unwanted drug effects such as vertigo, blurred vision,headache or nausea/vomiting is similar to treatment under con-trol medication [6]. The considerable excitement surrounding the
http://dx.doi.org/10.1016/j.jpba.2017.09.0070731-7085/© 2017 Elsevier B.V. All rights reserved.
105
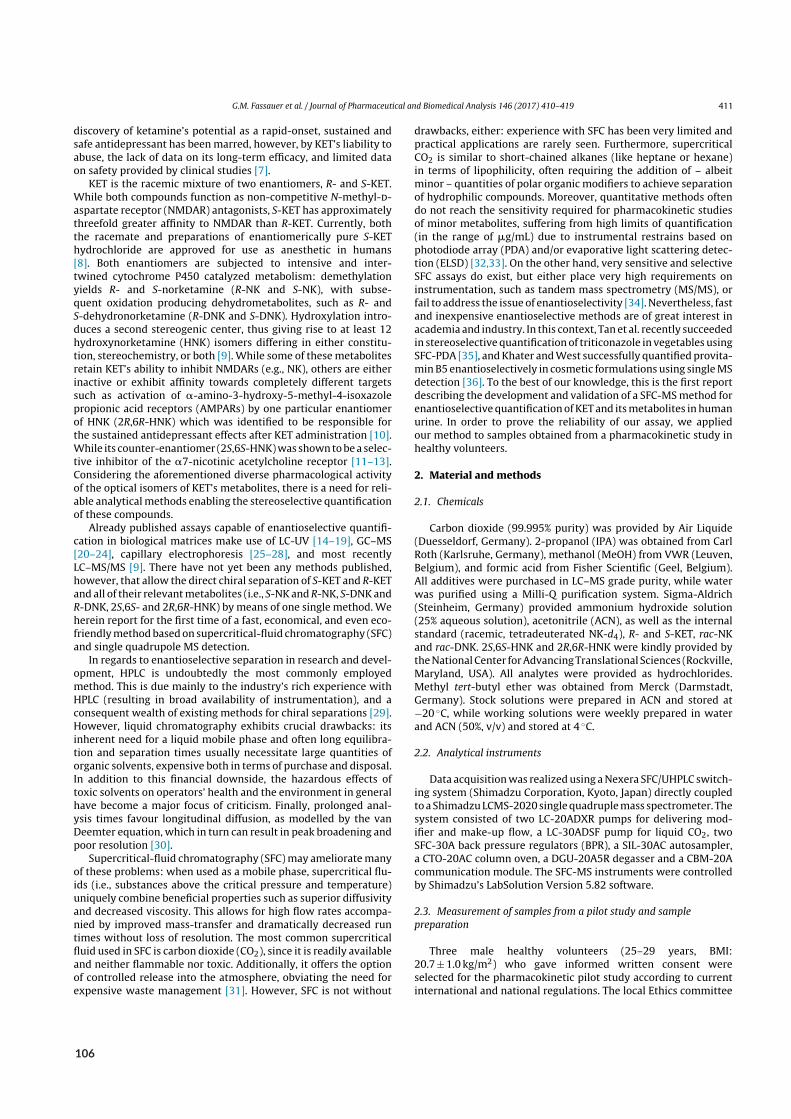
G.M. Fassauer et al. / Journal of Pharmaceutical and Biomedical Analysis 146 (2017) 410–419 411
discovery of ketamine’s potential as a rapid-onset, sustained andsafe antidepressant has been marred, however, by KET’s liability toabuse, the lack of data on its long-term efficacy, and limited dataon safety provided by clinical studies [7].
KET is the racemic mixture of two enantiomers, R- and S-KET.While both compounds function as non-competitive N-methyl-d-aspartate receptor (NMDAR) antagonists, S-KET has approximatelythreefold greater affinity to NMDAR than R-KET. Currently, boththe racemate and preparations of enantiomerically pure S-KEThydrochloride are approved for use as anesthetic in humans[8]. Both enantiomers are subjected to intensive and inter-twined cytochrome P450 catalyzed metabolism: demethylationyields R- and S-norketamine (R-NK and S-NK), with subse-quent oxidation producing dehydrometabolites, such as R- andS-dehydronorketamine (R-DNK and S-DNK). Hydroxylation intro-duces a second stereogenic center, thus giving rise to at least 12hydroxynorketamine (HNK) isomers differing in either constitu-tion, stereochemistry, or both [9]. While some of these metabolitesretain KET’s ability to inhibit NMDARs (e.g., NK), others are eitherinactive or exhibit affinity towards completely different targetssuch as activation of �-amino-3-hydroxy-5-methyl-4-isoxazolepropionic acid receptors (AMPARs) by one particular enantiomerof HNK (2R,6R-HNK) which was identified to be responsible forthe sustained antidepressant effects after KET administration [10].While its counter-enantiomer (2S,6S-HNK) was shown to be a selec-tive inhibitor of the �7-nicotinic acetylcholine receptor [11–13].Considering the aforementioned diverse pharmacological activityof the optical isomers of KET’s metabolites, there is a need for reli-able analytical methods enabling the stereoselective quantificationof these compounds.
Already published assays capable of enantioselective quantifi-cation in biological matrices make use of LC-UV [14–19], GC–MS[20–24], capillary electrophoresis [25–28], and most recentlyLC–MS/MS [9]. There have not yet been any methods published,however, that allow the direct chiral separation of S-KET and R-KETand all of their relevant metabolites (i.e., S-NK and R-NK, S-DNK andR-DNK, 2S,6S- and 2R,6R-HNK) by means of one single method. Weherein report for the first time of a fast, economical, and even eco-friendly method based on supercritical-fluid chromatography (SFC)and single quadrupole MS detection.
In regards to enantioselective separation in research and devel-opment, HPLC is undoubtedly the most commonly employedmethod. This is due mainly to the industry’s rich experience withHPLC (resulting in broad availability of instrumentation), and aconsequent wealth of existing methods for chiral separations [29].However, liquid chromatography exhibits crucial drawbacks: itsinherent need for a liquid mobile phase and often long equilibra-tion and separation times usually necessitate large quantities oforganic solvents, expensive both in terms of purchase and disposal.In addition to this financial downside, the hazardous effects oftoxic solvents on operators’ health and the environment in generalhave become a major focus of criticism. Finally, prolonged anal-ysis times favour longitudinal diffusion, as modelled by the vanDeemter equation, which in turn can result in peak broadening andpoor resolution [30].
Supercritical-fluid chromatography (SFC) may ameliorate manyof these problems: when used as a mobile phase, supercritical flu-ids (i.e., substances above the critical pressure and temperature)uniquely combine beneficial properties such as superior diffusivityand decreased viscosity. This allows for high flow rates accompa-nied by improved mass-transfer and dramatically decreased runtimes without loss of resolution. The most common supercriticalfluid used in SFC is carbon dioxide (CO2), since it is readily availableand neither flammable nor toxic. Additionally, it offers the optionof controlled release into the atmosphere, obviating the need forexpensive waste management [31]. However, SFC is not without
drawbacks, either: experience with SFC has been very limited andpractical applications are rarely seen. Furthermore, supercriticalCO2 is similar to short-chained alkanes (like heptane or hexane)in terms of lipophilicity, often requiring the addition of – albeitminor – quantities of polar organic modifiers to achieve separationof hydrophilic compounds. Moreover, quantitative methods oftendo not reach the sensitivity required for pharmacokinetic studiesof minor metabolites, suffering from high limits of quantification(in the range of �g/mL) due to instrumental restrains based onphotodiode array (PDA) and/or evaporative light scattering detec-tion (ELSD) [32,33]. On the other hand, very sensitive and selectiveSFC assays do exist, but either place very high requirements oninstrumentation, such as tandem mass spectrometry (MS/MS), orfail to address the issue of enantioselectivity [34]. Nevertheless, fastand inexpensive enantioselective methods are of great interest inacademia and industry. In this context, Tan et al. recently succeededin stereoselective quantification of triticonazole in vegetables usingSFC-PDA [35], and Khater and West successfully quantified provita-min B5 enantioselectively in cosmetic formulations using single MSdetection [36]. To the best of our knowledge, this is the first reportdescribing the development and validation of a SFC-MS method forenantioselective quantification of KET and its metabolites in humanurine. In order to prove the reliability of our assay, we appliedour method to samples obtained from a pharmacokinetic study inhealthy volunteers.
2. Material and methods
2.1. Chemicals
Carbon dioxide (99.995% purity) was provided by Air Liquide(Duesseldorf, Germany). 2-propanol (IPA) was obtained from CarlRoth (Karlsruhe, Germany), methanol (MeOH) from VWR (Leuven,Belgium), and formic acid from Fisher Scientific (Geel, Belgium).All additives were purchased in LC–MS grade purity, while waterwas purified using a Milli-Q purification system. Sigma-Aldrich(Steinheim, Germany) provided ammonium hydroxide solution(25% aqueous solution), acetonitrile (ACN), as well as the internalstandard (racemic, tetradeuterated NK-d4), R- and S-KET, rac-NKand rac-DNK. 2S,6S-HNK and 2R,6R-HNK were kindly provided bythe National Center for Advancing Translational Sciences (Rockville,Maryland, USA). All analytes were provided as hydrochlorides.Methyl tert-butyl ether was obtained from Merck (Darmstadt,Germany). Stock solutions were prepared in ACN and stored at−20 ◦C, while working solutions were weekly prepared in waterand ACN (50%, v/v) and stored at 4 ◦C.
2.2. Analytical instruments
Data acquisition was realized using a Nexera SFC/UHPLC switch-ing system (Shimadzu Corporation, Kyoto, Japan) directly coupledto a Shimadzu LCMS-2020 single quadruple mass spectrometer. Thesystem consisted of two LC-20ADXR pumps for delivering mod-ifier and make-up flow, a LC-30ADSF pump for liquid CO2, twoSFC-30A back pressure regulators (BPR), a SIL-30AC autosampler,a CTO-20AC column oven, a DGU-20A5R degasser and a CBM-20Acommunication module. The SFC-MS instruments were controlledby Shimadzu’s LabSolution Version 5.82 software.
2.3. Measurement of samples from a pilot study and samplepreparation
Three male healthy volunteers (25–29 years, BMI:20.7 ± 1.0 kg/m2) who gave informed written consent wereselected for the pharmacokinetic pilot study according to currentinternational and national regulations. The local Ethics committee
106
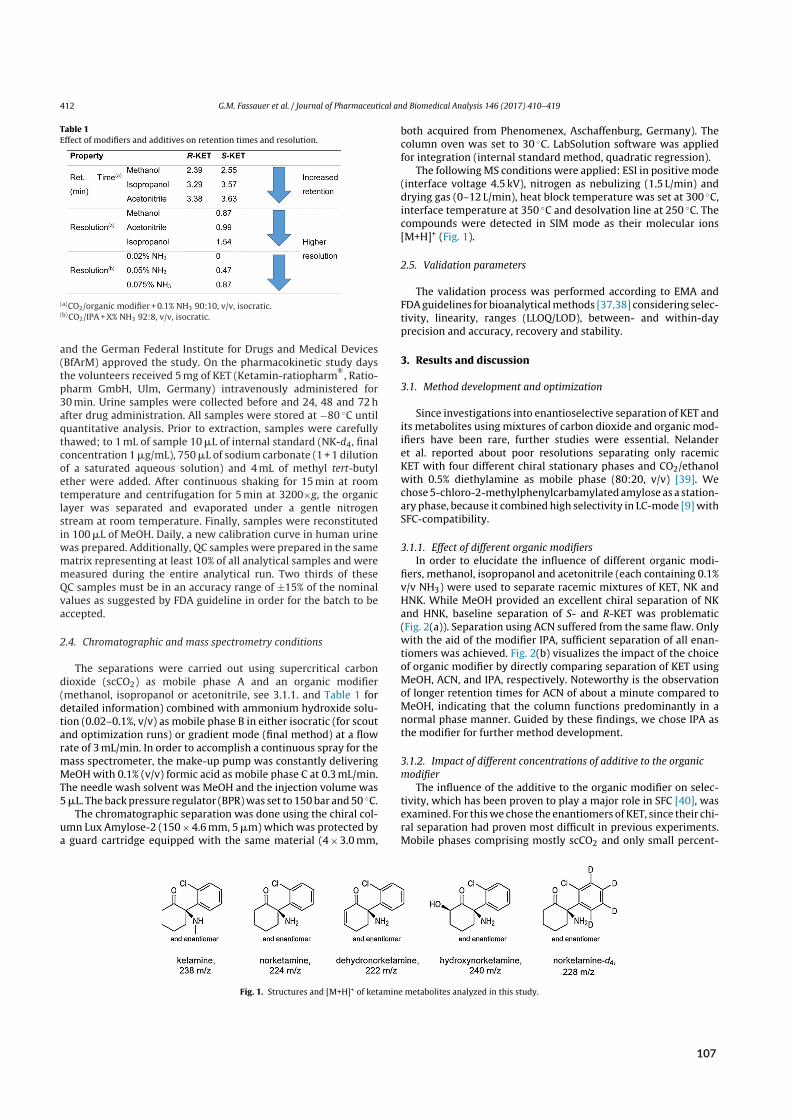
412 G.M. Fassauer et al. / Journal of Pharmaceutical and Biomedical Analysis 146 (2017) 410–419
Table 1Effect of modifiers and additives on retention times and resolution.
(a)CO2/organic modifier + 0.1% NH3 90:10, v/v, isocratic.(b)CO2/IPA + X% NH3 92:8, v/v, isocratic.
and the German Federal Institute for Drugs and Medical Devices(BfArM) approved the study. On the pharmacokinetic study daysthe volunteers received 5 mg of KET (Ketamin-ratiopharm
®, Ratio-
pharm GmbH, Ulm, Germany) intravenously administered for30 min. Urine samples were collected before and 24, 48 and 72 hafter drug administration. All samples were stored at −80 ◦C untilquantitative analysis. Prior to extraction, samples were carefullythawed; to 1 mL of sample 10 �L of internal standard (NK-d4, finalconcentration 1 �g/mL), 750 �L of sodium carbonate (1 + 1 dilutionof a saturated aqueous solution) and 4 mL of methyl tert-butylether were added. After continuous shaking for 15 min at roomtemperature and centrifugation for 5 min at 3200×g, the organiclayer was separated and evaporated under a gentle nitrogenstream at room temperature. Finally, samples were reconstitutedin 100 �L of MeOH. Daily, a new calibration curve in human urinewas prepared. Additionally, QC samples were prepared in the samematrix representing at least 10% of all analytical samples and weremeasured during the entire analytical run. Two thirds of theseQC samples must be in an accuracy range of ±15% of the nominalvalues as suggested by FDA guideline in order for the batch to beaccepted.
2.4. Chromatographic and mass spectrometry conditions
The separations were carried out using supercritical carbondioxide (scCO2) as mobile phase A and an organic modifier(methanol, isopropanol or acetonitrile, see 3.1.1. and Table 1 fordetailed information) combined with ammonium hydroxide solu-tion (0.02–0.1%, v/v) as mobile phase B in either isocratic (for scoutand optimization runs) or gradient mode (final method) at a flowrate of 3 mL/min. In order to accomplish a continuous spray for themass spectrometer, the make-up pump was constantly deliveringMeOH with 0.1% (v/v) formic acid as mobile phase C at 0.3 mL/min.The needle wash solvent was MeOH and the injection volume was5 �L. The back pressure regulator (BPR) was set to 150 bar and 50 ◦C.
The chromatographic separation was done using the chiral col-umn Lux Amylose-2 (150 × 4.6 mm, 5 �m) which was protected bya guard cartridge equipped with the same material (4 × 3.0 mm,
both acquired from Phenomenex, Aschaffenburg, Germany). Thecolumn oven was set to 30 ◦C. LabSolution software was appliedfor integration (internal standard method, quadratic regression).
The following MS conditions were applied: ESI in positive mode(interface voltage 4.5 kV), nitrogen as nebulizing (1.5 L/min) anddrying gas (0–12 L/min), heat block temperature was set at 300 ◦C,interface temperature at 350 ◦C and desolvation line at 250 ◦C. Thecompounds were detected in SIM mode as their molecular ions[M+H]+ (Fig. 1).
2.5. Validation parameters
The validation process was performed according to EMA andFDA guidelines for bioanalytical methods [37,38] considering selec-tivity, linearity, ranges (LLOQ/LOD), between- and within-dayprecision and accuracy, recovery and stability.
3. Results and discussion
3.1. Method development and optimization
Since investigations into enantioselective separation of KET andits metabolites using mixtures of carbon dioxide and organic mod-ifiers have been rare, further studies were essential. Nelanderet al. reported about poor resolutions separating only racemicKET with four different chiral stationary phases and CO2/ethanolwith 0.5% diethylamine as mobile phase (80:20, v/v) [39]. Wechose 5-chloro-2-methylphenylcarbamylated amylose as a station-ary phase, because it combined high selectivity in LC-mode [9] withSFC-compatibility.
3.1.1. Effect of different organic modifiersIn order to elucidate the influence of different organic modi-
fiers, methanol, isopropanol and acetonitrile (each containing 0.1%v/v NH3) were used to separate racemic mixtures of KET, NK andHNK. While MeOH provided an excellent chiral separation of NKand HNK, baseline separation of S- and R-KET was problematic(Fig. 2(a)). Separation using ACN suffered from the same flaw. Onlywith the aid of the modifier IPA, sufficient separation of all enan-tiomers was achieved. Fig. 2(b) visualizes the impact of the choiceof organic modifier by directly comparing separation of KET usingMeOH, ACN, and IPA, respectively. Noteworthy is the observationof longer retention times for ACN of about a minute compared toMeOH, indicating that the column functions predominantly in anormal phase manner. Guided by these findings, we chose IPA asthe modifier for further method development.
3.1.2. Impact of different concentrations of additive to the organicmodifier
The influence of the additive to the organic modifier on selec-tivity, which has been proven to play a major role in SFC [40], wasexamined. For this we chose the enantiomers of KET, since their chi-ral separation had proven most difficult in previous experiments.Mobile phases comprising mostly scCO2 and only small percent-
Fig. 1. Structures and [M+H]+ of ketamine metabolites analyzed in this study.
107
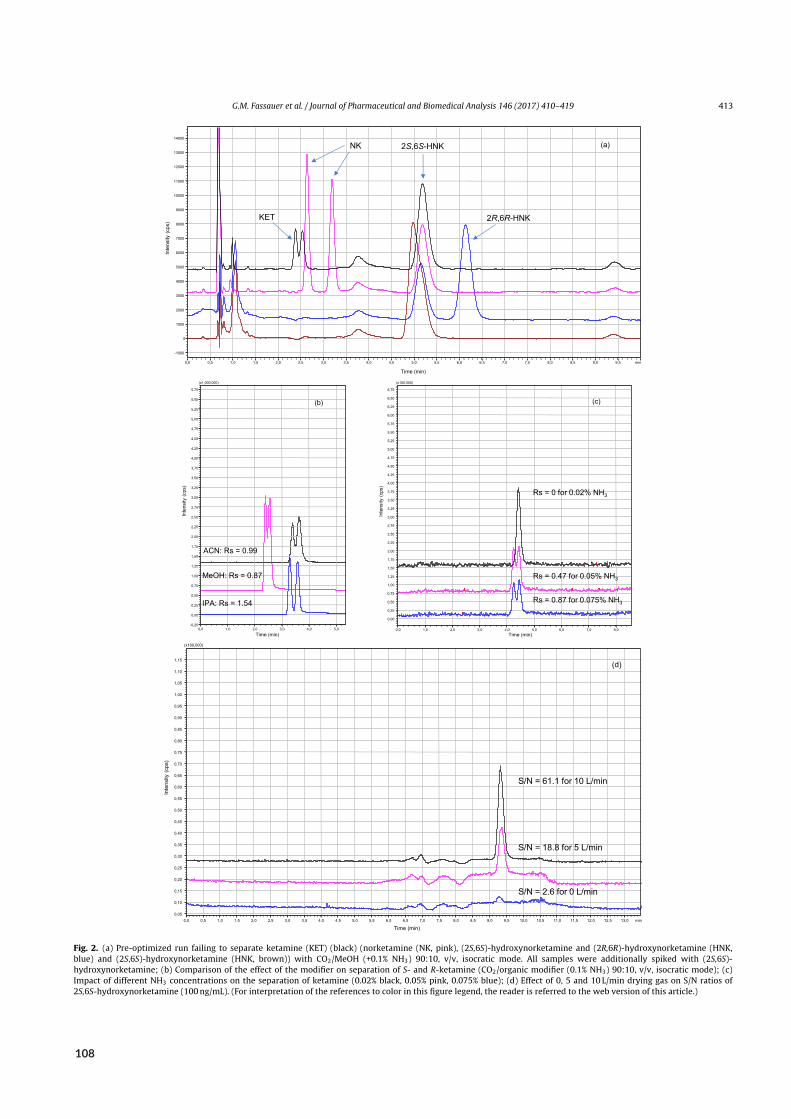
G.M. Fassauer et al. / Journal of Pharmaceutical and Biomedical Analysis 146 (2017) 410–419 413
0,0 0,5 1,0 1,5 2,0 2,5 3,0 3,5 4,0 4,5 5,0 5,5 6,0 6,5 7,0 7,5 8,0 8,5 9,0 9,5 min
0
Time (min)
(a)
KET
NK 2S,6S-HN K
2R,6R-HN K
0,0 1,0 2,0 3,0 4,0 5,0 -0,25
0,00
0,25
0,50
0,75
1,00
1,25
1,50
1,75
2,00
2,25
2,50
2,75
3,00
3,25
3,50
3,75
4,00
4,25
4,50
4,75
5,00
5,25
5,50
5,75
(x1,000 ,000 )
MeOH : Rs = 0.87
ytisnetnI(c
ps)
Time (min)
(b)
ACN : Rs = 0.99
IPA : Rs = 1.54
0,0 1,0 2,0 3,0 4,0 5,0 6,0 7,0 8,0 0,00
0,25
0,50
0,75
1,00
1,25
1,50
1,75
2,00
2,25
2,50
2,75
3,00
3,25
3,50
3,75
4,00
4,25
4,50
4,75
5,00
5,25
5,50
5,75
6,00
6,25
6,50
6,75
(x100 ,000 )
Rs = 0 for 0.0 2% NH3
Rs = 0.47 for 0.05% NH3
Rs = 0.87 for 0.075% NH3
ytisnetnI(c
ps)
Time (min)
(c)
(x100 ,000 )
S/N = 2.6 for 0 L/ min
S/N = 18.8 for 5 L/ min
S/N = 61.1 for 10 L/ min
(d)
Fig. 2. (a) Pre-optimized run failing to separate ketamine (KET) (black) (norketamine (NK, pink), (2S,6S)-hydroxynorketamine and (2R,6R)-hydroxynorketamine (HNK,blue) and (2S,6S)-hydroxynorketamine (HNK, brown)) with CO2/MeOH (+0.1% NH3) 90:10, v/v, isocratic mode. All samples were additionally spiked with (2S,6S)-hydroxynorketamine; (b) Comparison of the effect of the modifier on separation of S- and R-ketamine (CO2/organic modifier (0.1% NH3) 90:10, v/v, isocratic mode); (c)Impact of different NH3 concentrations on the separation of ketamine (0.02% black, 0.05% pink, 0.075% blue); (d) Effect of 0, 5 and 10 L/min drying gas on S/N ratios of2S,6S-hydroxynorketamine (100 ng/mL). (For interpretation of the references to color in this figure legend, the reader is referred to the web version of this article.)
108
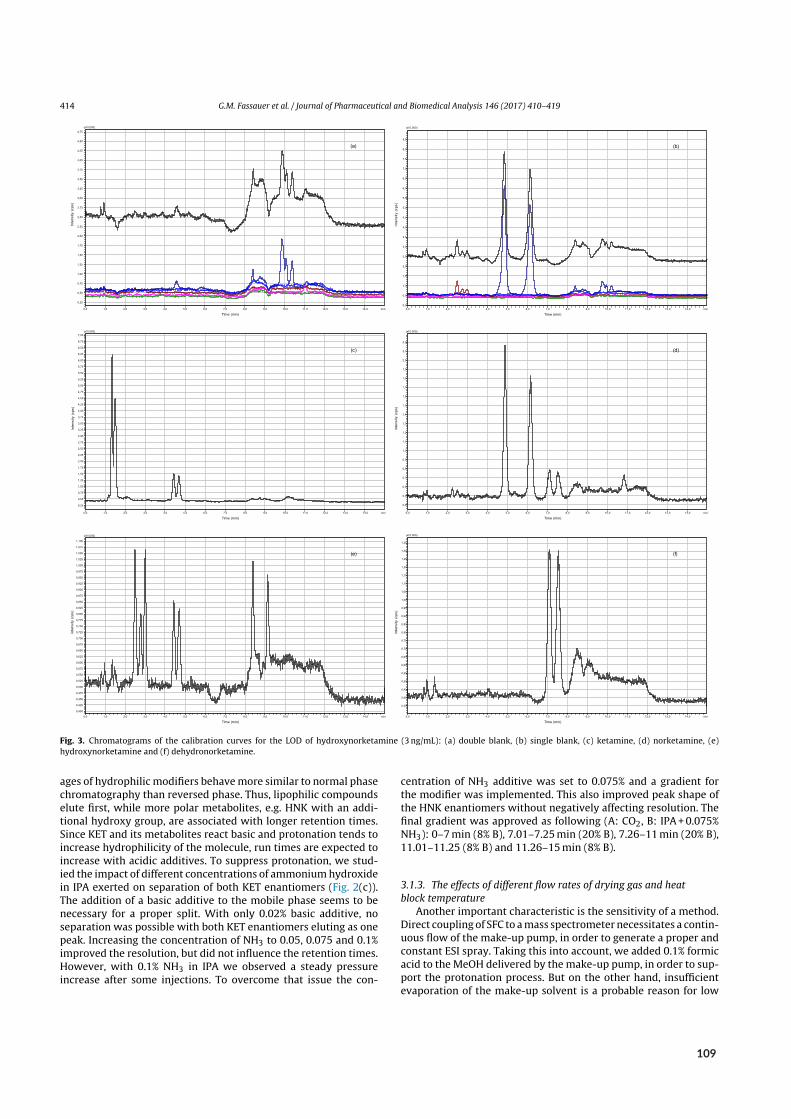
414 G.M. Fassauer et al. / Journal of Pharmaceutical and Biomedical Analysis 146 (2017) 410–419
0,0 1,0 2,0 3,0 4,0 5,0 6,0 7,0 8,0 9,0 10 ,0 11 ,0 12 ,0 13 ,0 14 ,0 min
Time (min)
(a)
0,0 1,0 2,0 3,0 4,0 5,0 6,0 7,0 8,0 9,0 10 ,0 11 ,0 12 ,0 13 ,0 14 ,0 min0,0
0,5
1,0
1,5
2,0
2,5
3,0
3,5
4,0
4,5
5,0
5,5
6,0
6,5
7,0
7,5
8,0
8,5
ytisnetnI(c
ps)
Time (min)
(b)
0,0 1,0 2,0 3,0 4,0 5,0 6,0 7,0 8,0 9,0 10 ,0 11 ,0 12 ,0 13 ,0 14 ,0 min
(x10 ,000 )
Time (min)
(c)
0,0 1,0 2,0 3,0 4,0 5,0 6,0 7,0 8,0 9,0 10 ,0 11 ,0 12 ,0 13 ,0 14 ,0 min
0,4
0,5
0,6
0,7
0,8
0,9
1,0
1,1
1,2
1,3
1,4
1,5
1,6
1,7
1,8
1,9
2,0
2,1
2,2
(x10 ,000 )
ytisnetnI(c
ps)
Time (min)
(d)
(x10 ,000 )
(e)
ytisnetnI(c
ps)
0,35
0,40
0,45
0,50
0,55
0,60
0,65
0,70
0,75
0,80
0,85
0,90
0,95
1,00
1,05
1,10
1,15
1,20
1,25
1,30
1,35
(x10 ,000 )
(f)
Fig. 3. Chromatograms of the calibration curves for the LOD of hydroxynorketamine (3 ng/mL): (a) double blank, (b) single blank, (c) ketamine, (d) norketamine, (e)hydroxynorketamine and (f) dehydronorketamine.
ages of hydrophilic modifiers behave more similar to normal phasechromatography than reversed phase. Thus, lipophilic compoundselute first, while more polar metabolites, e.g. HNK with an addi-tional hydroxy group, are associated with longer retention times.Since KET and its metabolites react basic and protonation tends toincrease hydrophilicity of the molecule, run times are expected toincrease with acidic additives. To suppress protonation, we stud-ied the impact of different concentrations of ammonium hydroxidein IPA exerted on separation of both KET enantiomers (Fig. 2(c)).The addition of a basic additive to the mobile phase seems to benecessary for a proper split. With only 0.02% basic additive, noseparation was possible with both KET enantiomers eluting as onepeak. Increasing the concentration of NH3 to 0.05, 0.075 and 0.1%improved the resolution, but did not influence the retention times.However, with 0.1% NH3 in IPA we observed a steady pressureincrease after some injections. To overcome that issue the con-
centration of NH3 additive was set to 0.075% and a gradient forthe modifier was implemented. This also improved peak shape ofthe HNK enantiomers without negatively affecting resolution. Thefinal gradient was approved as following (A: CO2, B: IPA + 0.075%NH3): 0–7 min (8% B), 7.01–7.25 min (20% B), 7.26–11 min (20% B),11.01–11.25 (8% B) and 11.26–15 min (8% B).
3.1.3. The effects of different flow rates of drying gas and heatblock temperature
Another important characteristic is the sensitivity of a method.Direct coupling of SFC to a mass spectrometer necessitates a contin-uous flow of the make-up pump, in order to generate a proper andconstant ESI spray. Taking this into account, we added 0.1% formicacid to the MeOH delivered by the make-up pump, in order to sup-port the protonation process. But on the other hand, insufficientevaporation of the make-up solvent is a probable reason for low
109
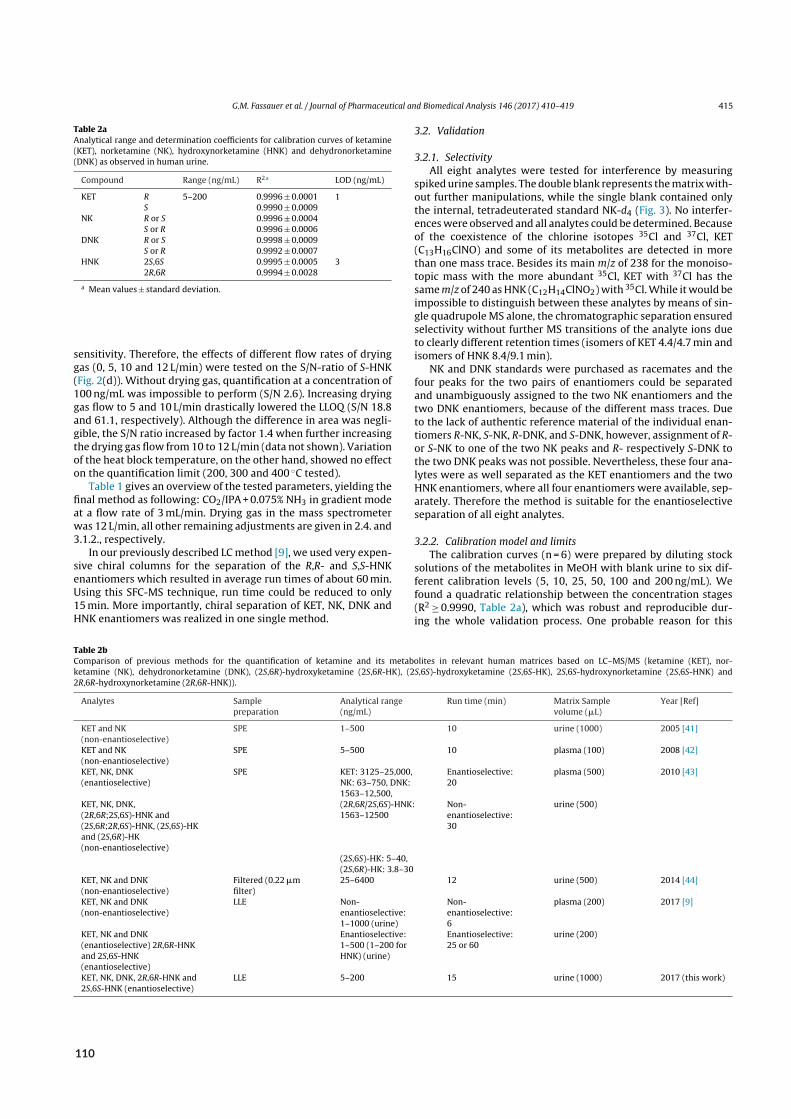
G.M. Fassauer et al. / Journal of Pharmaceutical and Biomedical Analysis 146 (2017) 410–419 415
Table 2aAnalytical range and determination coefficients for calibration curves of ketamine(KET), norketamine (NK), hydroxynorketamine (HNK) and dehydronorketamine(DNK) as observed in human urine.
Compound Range (ng/mL) R2a LOD (ng/mL)
KET R 5–200 0.9996 ± 0.0001 1S 0.9990 ± 0.0009
NK R or S 0.9996 ± 0.0004S or R 0.9996 ± 0.0006
DNK R or S 0.9998 ± 0.0009S or R 0.9992 ± 0.0007
HNK 2S,6S 0.9995 ± 0.0005 32R,6R 0.9994 ± 0.0028
a Mean values ± standard deviation.
sensitivity. Therefore, the effects of different flow rates of dryinggas (0, 5, 10 and 12 L/min) were tested on the S/N-ratio of S-HNK(Fig. 2(d)). Without drying gas, quantification at a concentration of100 ng/mL was impossible to perform (S/N 2.6). Increasing dryinggas flow to 5 and 10 L/min drastically lowered the LLOQ (S/N 18.8and 61.1, respectively). Although the difference in area was negli-gible, the S/N ratio increased by factor 1.4 when further increasingthe drying gas flow from 10 to 12 L/min (data not shown). Variationof the heat block temperature, on the other hand, showed no effecton the quantification limit (200, 300 and 400 ◦C tested).
Table 1 gives an overview of the tested parameters, yielding thefinal method as following: CO2/IPA + 0.075% NH3 in gradient modeat a flow rate of 3 mL/min. Drying gas in the mass spectrometerwas 12 L/min, all other remaining adjustments are given in 2.4. and3.1.2., respectively.
In our previously described LC method [9], we used very expen-sive chiral columns for the separation of the R,R- and S,S-HNKenantiomers which resulted in average run times of about 60 min.Using this SFC-MS technique, run time could be reduced to only15 min. More importantly, chiral separation of KET, NK, DNK andHNK enantiomers was realized in one single method.
3.2. Validation
3.2.1. SelectivityAll eight analytes were tested for interference by measuring
spiked urine samples. The double blank represents the matrix with-out further manipulations, while the single blank contained onlythe internal, tetradeuterated standard NK-d4 (Fig. 3). No interfer-ences were observed and all analytes could be determined. Becauseof the coexistence of the chlorine isotopes 35Cl and 37Cl, KET(C13H16ClNO) and some of its metabolites are detected in morethan one mass trace. Besides its main m/z of 238 for the monoiso-topic mass with the more abundant 35Cl, KET with 37Cl has thesame m/z of 240 as HNK (C12H14ClNO2) with 35Cl. While it would beimpossible to distinguish between these analytes by means of sin-gle quadrupole MS alone, the chromatographic separation ensuredselectivity without further MS transitions of the analyte ions dueto clearly different retention times (isomers of KET 4.4/4.7 min andisomers of HNK 8.4/9.1 min).
NK and DNK standards were purchased as racemates and thefour peaks for the two pairs of enantiomers could be separatedand unambiguously assigned to the two NK enantiomers and thetwo DNK enantiomers, because of the different mass traces. Dueto the lack of authentic reference material of the individual enan-tiomers R-NK, S-NK, R-DNK, and S-DNK, however, assignment of R-or S-NK to one of the two NK peaks and R- respectively S-DNK tothe two DNK peaks was not possible. Nevertheless, these four ana-lytes were as well separated as the KET enantiomers and the twoHNK enantiomers, where all four enantiomers were available, sep-arately. Therefore the method is suitable for the enantioselectiveseparation of all eight analytes.
3.2.2. Calibration model and limitsThe calibration curves (n = 6) were prepared by diluting stock
solutions of the metabolites in MeOH with blank urine to six dif-ferent calibration levels (5, 10, 25, 50, 100 and 200 ng/mL). Wefound a quadratic relationship between the concentration stages(R2 ≥ 0.9990, Table 2a), which was robust and reproducible dur-ing the whole validation process. One probable reason for this
Table 2bComparison of previous methods for the quantification of ketamine and its metabolites in relevant human matrices based on LC–MS/MS (ketamine (KET), nor-ketamine (NK), dehydronorketamine (DNK), (2S,6R)-hydroxyketamine (2S,6R-HK), (2S,6S)-hydroxyketamine (2S,6S-HK), 2S,6S-hydroxynorketamine (2S,6S-HNK) and2R,6R-hydroxynorketamine (2R,6R-HNK)).
Analytes Samplepreparation
Analytical range(ng/mL)
Run time (min) Matrix Samplevolume (�L)
Year [Ref]
KET and NK(non-enantioselective)
SPE 1–500 10 urine (1000) 2005 [41]
KET and NK(non-enantioselective)
SPE 5–500 10 plasma (100) 2008 [42]
KET, NK, DNK(enantioselective)
SPE KET: 3125–25,000,NK: 63–750, DNK:1563–12,500,
Enantioselective:20
plasma (500) 2010 [43]
KET, NK, DNK,(2R,6R;2S,6S)-HNK and(2S,6R;2R,6S)-HNK, (2S,6S)-HKand (2S,6R)-HK(non-enantioselective)
(2R,6R/2S,6S)-HNK:1563–12500
Non-enantioselective:30
urine (500)
(2S,6S)-HK: 5–40,(2S,6R)-HK: 3.8–30
KET, NK and DNK(non-enantioselective)
Filtered (0.22 �mfilter)
25–6400 12 urine (500) 2014 [44]
KET, NK and DNK(non-enantioselective)
LLE Non-enantioselective:1–1000 (urine)
Non-enantioselective:6
plasma (200) 2017 [9]
KET, NK and DNK(enantioselective) 2R,6R-HNKand 2S,6S-HNK(enantioselective)
Enantioselective:1–500 (1–200 forHNK) (urine)
Enantioselective:25 or 60
urine (200)
KET, NK, DNK, 2R,6R-HNK and2S,6S-HNK (enantioselective)
LLE 5–200 15 urine (1000) 2017 (this work)
110
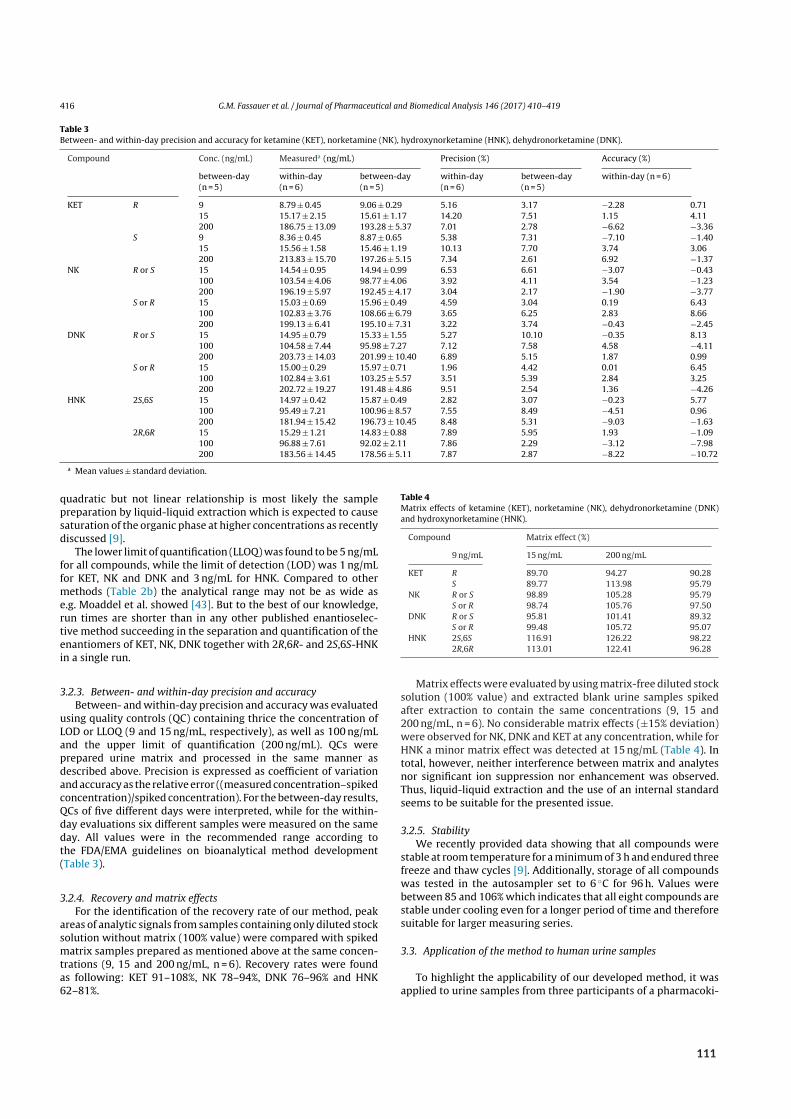
416 G.M. Fassauer et al. / Journal of Pharmaceutical and Biomedical Analysis 146 (2017) 410–419
Table 3Between- and within-day precision and accuracy for ketamine (KET), norketamine (NK), hydroxynorketamine (HNK), dehydronorketamine (DNK).
Compound Conc. (ng/mL) Measureda (ng/mL) Precision (%) Accuracy (%)
between-day(n = 5)
within-day(n = 6)
between-day(n = 5)
within-day(n = 6)
between-day(n = 5)
within-day (n = 6)
KET R 9 8.79 ± 0.45 9.06 ± 0.29 5.16 3.17 −2.28 0.7115 15.17 ± 2.15 15.61 ± 1.17 14.20 7.51 1.15 4.11200 186.75 ± 13.09 193.28 ± 5.37 7.01 2.78 −6.62 −3.36
S 9 8.36 ± 0.45 8.87 ± 0.65 5.38 7.31 −7.10 −1.4015 15.56 ± 1.58 15.46 ± 1.19 10.13 7.70 3.74 3.06200 213.83 ± 15.70 197.26 ± 5.15 7.34 2.61 6.92 −1.37
NK R or S 15 14.54 ± 0.95 14.94 ± 0.99 6.53 6.61 −3.07 −0.43100 103.54 ± 4.06 98.77 ± 4.06 3.92 4.11 3.54 −1.23200 196.19 ± 5.97 192.45 ± 4.17 3.04 2.17 −1.90 −3.77
S or R 15 15.03 ± 0.69 15.96 ± 0.49 4.59 3.04 0.19 6.43100 102.83 ± 3.76 108.66 ± 6.79 3.65 6.25 2.83 8.66200 199.13 ± 6.41 195.10 ± 7.31 3.22 3.74 −0.43 −2.45
DNK R or S 15 14.95 ± 0.79 15.33 ± 1.55 5.27 10.10 −0.35 8.13100 104.58 ± 7.44 95.98 ± 7.27 7.12 7.58 4.58 −4.11200 203.73 ± 14.03 201.99 ± 10.40 6.89 5.15 1.87 0.99
S or R 15 15.00 ± 0.29 15.97 ± 0.71 1.96 4.42 0.01 6.45100 102.84 ± 3.61 103.25 ± 5.57 3.51 5.39 2.84 3.25200 202.72 ± 19.27 191.48 ± 4.86 9.51 2.54 1.36 −4.26
HNK 2S,6S 15 14.97 ± 0.42 15.87 ± 0.49 2.82 3.07 −0.23 5.77100 95.49 ± 7.21 100.96 ± 8.57 7.55 8.49 −4.51 0.96200 181.94 ± 15.42 196.73 ± 10.45 8.48 5.31 −9.03 −1.63
2R,6R 15 15.29 ± 1.21 14.83 ± 0.88 7.89 5.95 1.93 −1.09100 96.88 ± 7.61 92.02 ± 2.11 7.86 2.29 −3.12 −7.98200 183.56 ± 14.45 178.56 ± 5.11 7.87 2.87 −8.22 −10.72
a Mean values ± standard deviation.
quadratic but not linear relationship is most likely the samplepreparation by liquid-liquid extraction which is expected to causesaturation of the organic phase at higher concentrations as recentlydiscussed [9].
The lower limit of quantification (LLOQ) was found to be 5 ng/mLfor all compounds, while the limit of detection (LOD) was 1 ng/mLfor KET, NK and DNK and 3 ng/mL for HNK. Compared to othermethods (Table 2b) the analytical range may not be as wide ase.g. Moaddel et al. showed [43]. But to the best of our knowledge,run times are shorter than in any other published enantioselec-tive method succeeding in the separation and quantification of theenantiomers of KET, NK, DNK together with 2R,6R- and 2S,6S-HNKin a single run.
3.2.3. Between- and within-day precision and accuracyBetween- and within-day precision and accuracy was evaluated
using quality controls (QC) containing thrice the concentration ofLOD or LLOQ (9 and 15 ng/mL, respectively), as well as 100 ng/mLand the upper limit of quantification (200 ng/mL). QCs wereprepared urine matrix and processed in the same manner asdescribed above. Precision is expressed as coefficient of variationand accuracy as the relative error ((measured concentration–spikedconcentration)/spiked concentration). For the between-day results,QCs of five different days were interpreted, while for the within-day evaluations six different samples were measured on the sameday. All values were in the recommended range according tothe FDA/EMA guidelines on bioanalytical method development(Table 3).
3.2.4. Recovery and matrix effectsFor the identification of the recovery rate of our method, peak
areas of analytic signals from samples containing only diluted stocksolution without matrix (100% value) were compared with spikedmatrix samples prepared as mentioned above at the same concen-trations (9, 15 and 200 ng/mL, n = 6). Recovery rates were foundas following: KET 91–108%, NK 78–94%, DNK 76–96% and HNK62–81%.
Table 4Matrix effects of ketamine (KET), norketamine (NK), dehydronorketamine (DNK)and hydroxynorketamine (HNK).
Compound Matrix effect (%)
9 ng/mL 15 ng/mL 200 ng/mL
KET R 89.70 94.27 90.28S 89.77 113.98 95.79
NK R or S 98.89 105.28 95.79S or R 98.74 105.76 97.50
DNK R or S 95.81 101.41 89.32S or R 99.48 105.72 95.07
HNK 2S,6S 116.91 126.22 98.222R,6R 113.01 122.41 96.28
Matrix effects were evaluated by using matrix-free diluted stocksolution (100% value) and extracted blank urine samples spikedafter extraction to contain the same concentrations (9, 15 and200 ng/mL, n = 6). No considerable matrix effects (±15% deviation)were observed for NK, DNK and KET at any concentration, while forHNK a minor matrix effect was detected at 15 ng/mL (Table 4). Intotal, however, neither interference between matrix and analytesnor significant ion suppression nor enhancement was observed.Thus, liquid-liquid extraction and the use of an internal standardseems to be suitable for the presented issue.
3.2.5. StabilityWe recently provided data showing that all compounds were
stable at room temperature for a minimum of 3 h and endured threefreeze and thaw cycles [9]. Additionally, storage of all compoundswas tested in the autosampler set to 6 ◦C for 96 h. Values werebetween 85 and 106% which indicates that all eight compounds arestable under cooling even for a longer period of time and thereforesuitable for larger measuring series.
3.3. Application of the method to human urine samples
To highlight the applicability of our developed method, it wasapplied to urine samples from three participants of a pharmacoki-
111
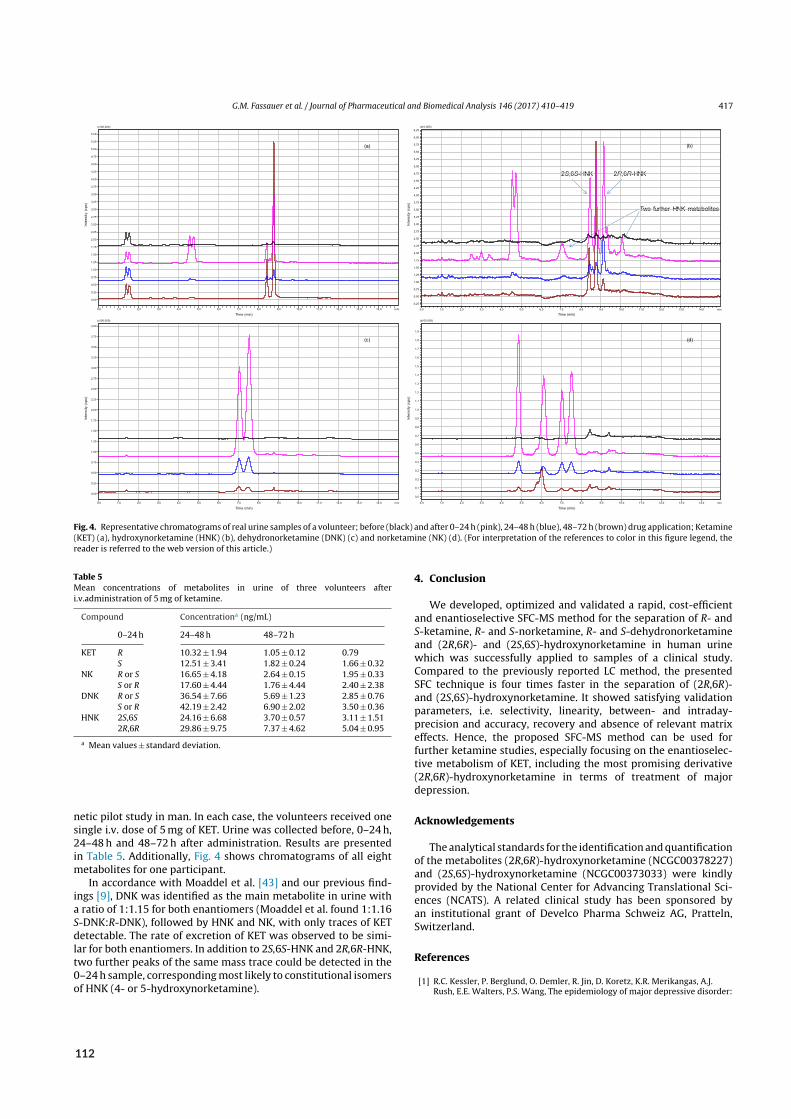
G.M. Fassauer et al. / Journal of Pharmaceutical and Biomedical Analysis 146 (2017) 410–419 417
0,0 1,0 2,0 3,0 4,0 5,0 6,0 7,0 8,0 9,0 10 ,0 11 ,0 12 ,0 13 ,0 14 ,0 min
0,00
0,25
0,50
0,75
1,00
1,25
1,50
1,75
2,00
2,25
2,50
2,75
3,00
3,25
3,50
3,75
4,00
4,25
4,50
4,75
5,00
5,25
5,50
Time (min)
(a)
2S,6S-HNK 2R,6R-HNK
Two further HNK metabolites
ytisnetnI(c
ps)
Time (min)0,0 1,0 2,0 3,0 4,0 5,0 6,0 7,0 8,0 9,0 10 ,0 11 ,0 12 ,0 13 ,0 14 ,0 min
0,25
0,50
0,75
1,00
1,25
1,50
1,75
2,00
2,25
2,50
2,75
3,00
3,25
3,50
3,75
4,00
4,25
4,50
4,75
5,00
5,25
5,50
5,75
6,00
6,25
(b)
0,00
0,25
0,50
0,75
1,00
1,25
1,50
1,75
2,00
2,25
2,50
2,75
3,00
3,25
3,50
3,75
4,00
(x100 ,000 )
(c)
ytisnetnI(c
ps)
0,0
0,1
0,2
0,3
0,4
0,5
0,6
0,7
0,8
0,9
1,0
1,1
1,2
1,3
1,4
1,5
1,6
1,7
1,8
1,9
(x100 ,000 )
(d)
Fig. 4. Representative chromatograms of real urine samples of a volunteer; before (black) and after 0–24 h (pink), 24–48 h (blue), 48–72 h (brown) drug application; Ketamine(KET) (a), hydroxynorketamine (HNK) (b), dehydronorketamine (DNK) (c) and norketamine (NK) (d). (For interpretation of the references to color in this figure legend, thereader is referred to the web version of this article.)
Table 5Mean concentrations of metabolites in urine of three volunteers afteri.v.administration of 5 mg of ketamine.
Compound Concentrationa (ng/mL)
0–24 h 24–48 h 48–72 h
KET R 10.32 ± 1.94 1.05 ± 0.12 0.79S 12.51 ± 3.41 1.82 ± 0.24 1.66 ± 0.32
NK R or S 16.65 ± 4.18 2.64 ± 0.15 1.95 ± 0.33S or R 17.60 ± 4.44 1.76 ± 4.44 2.40 ± 2.38
DNK R or S 36.54 ± 7.66 5.69 ± 1.23 2.85 ± 0.76S or R 42.19 ± 2.42 6.90 ± 2.02 3.50 ± 0.36
HNK 2S,6S 24.16 ± 6.68 3.70 ± 0.57 3.11 ± 1.512R,6R 29.86 ± 9.75 7.37 ± 4.62 5.04 ± 0.95
a Mean values ± standard deviation.
netic pilot study in man. In each case, the volunteers received onesingle i.v. dose of 5 mg of KET. Urine was collected before, 0–24 h,24–48 h and 48–72 h after administration. Results are presentedin Table 5. Additionally, Fig. 4 shows chromatograms of all eightmetabolites for one participant.
In accordance with Moaddel et al. [43] and our previous find-ings [9], DNK was identified as the main metabolite in urine witha ratio of 1:1.15 for both enantiomers (Moaddel et al. found 1:1.16S-DNK:R-DNK), followed by HNK and NK, with only traces of KETdetectable. The rate of excretion of KET was observed to be simi-lar for both enantiomers. In addition to 2S,6S-HNK and 2R,6R-HNK,two further peaks of the same mass trace could be detected in the0–24 h sample, corresponding most likely to constitutional isomersof HNK (4- or 5-hydroxynorketamine).
4. Conclusion
We developed, optimized and validated a rapid, cost-efficientand enantioselective SFC-MS method for the separation of R- andS-ketamine, R- and S-norketamine, R- and S-dehydronorketamineand (2R,6R)- and (2S,6S)-hydroxynorketamine in human urinewhich was successfully applied to samples of a clinical study.Compared to the previously reported LC method, the presentedSFC technique is four times faster in the separation of (2R,6R)-and (2S,6S)-hydroxynorketamine. It showed satisfying validationparameters, i.e. selectivity, linearity, between- and intraday-precision and accuracy, recovery and absence of relevant matrixeffects. Hence, the proposed SFC-MS method can be used forfurther ketamine studies, especially focusing on the enantioselec-tive metabolism of KET, including the most promising derivative(2R,6R)-hydroxynorketamine in terms of treatment of majordepression.
Acknowledgements
The analytical standards for the identification and quantificationof the metabolites (2R,6R)-hydroxynorketamine (NCGC00378227)and (2S,6S)-hydroxynorketamine (NCGC00373033) were kindlyprovided by the National Center for Advancing Translational Sci-ences (NCATS). A related clinical study has been sponsored byan institutional grant of Develco Pharma Schweiz AG, Pratteln,Switzerland.
References
[1] R.C. Kessler, P. Berglund, O. Demler, R. Jin, D. Koretz, K.R. Merikangas, A.J.Rush, E.E. Walters, P.S. Wang, The epidemiology of major depressive disorder:
112
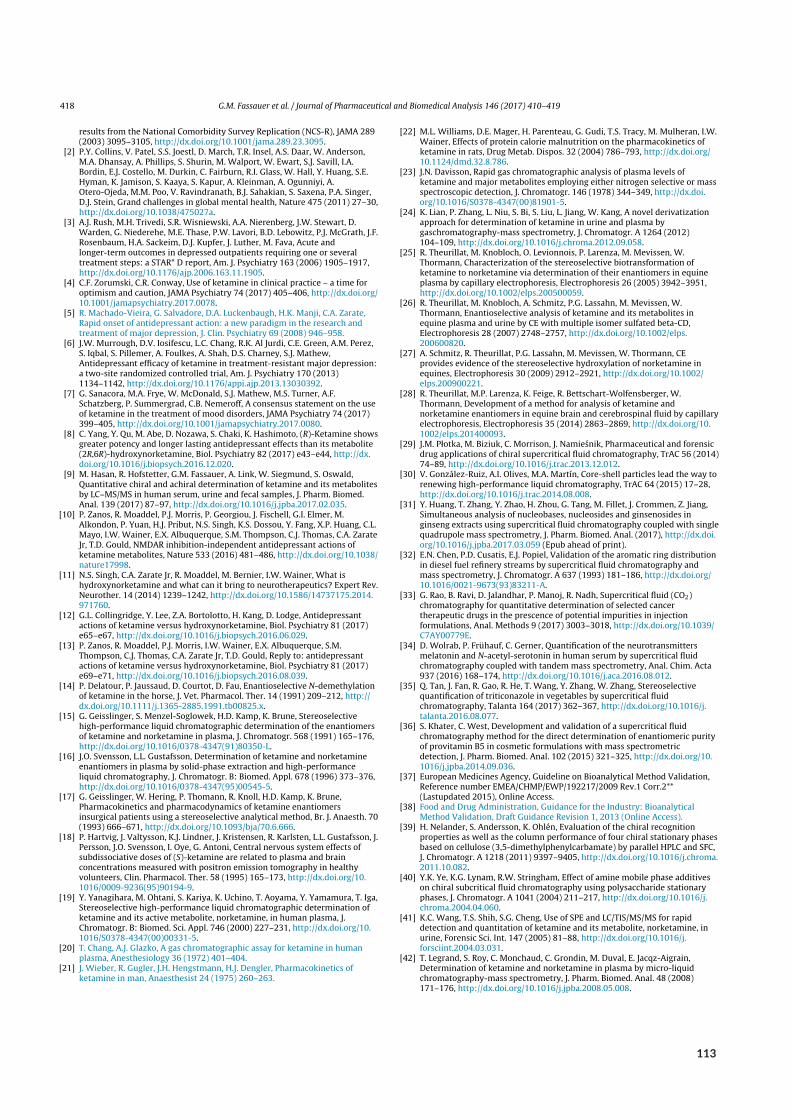
418 G.M. Fassauer et al. / Journal of Pharmaceutical and Biomedical Analysis 146 (2017) 410–419
results from the National Comorbidity Survey Replication (NCS-R), JAMA 289(2003) 3095–3105, http://dx.doi.org/10.1001/jama.289.23.3095.
[2] P.Y. Collins, V. Patel, S.S. Joestl, D. March, T.R. Insel, A.S. Daar, W. Anderson,M.A. Dhansay, A. Phillips, S. Shurin, M. Walport, W. Ewart, S.J. Savill, I.A.Bordin, E.J. Costello, M. Durkin, C. Fairburn, R.I. Glass, W. Hall, Y. Huang, S.E.Hyman, K. Jamison, S. Kaaya, S. Kapur, A. Kleinman, A. Ogunniyi, A.Otero-Ojeda, M.M. Poo, V. Ravindranath, B.J. Sahakian, S. Saxena, P.A. Singer,D.J. Stein, Grand challenges in global mental health, Nature 475 (2011) 27–30,http://dx.doi.org/10.1038/475027a.
[3] A.J. Rush, M.H. Trivedi, S.R. Wisniewski, A.A. Nierenberg, J.W. Stewart, D.Warden, G. Niederehe, M.E. Thase, P.W. Lavori, B.D. Lebowitz, P.J. McGrath, J.F.Rosenbaum, H.A. Sackeim, D.J. Kupfer, J. Luther, M. Fava, Acute andlonger-term outcomes in depressed outpatients requiring one or severaltreatment steps: a STAR* D report, Am. J. Psychiatry 163 (2006) 1905–1917,http://dx.doi.org/10.1176/ajp.2006.163.11.1905.
[4] C.F. Zorumski, C.R. Conway, Use of ketamine in clinical practice – a time foroptimism and caution, JAMA Psychiatry 74 (2017) 405–406, http://dx.doi.org/10.1001/jamapsychiatry.2017.0078.
[5] R. Machado-Vieira, G. Salvadore, D.A. Luckenbaugh, H.K. Manji, C.A. Zarate,Rapid onset of antidepressant action: a new paradigm in the research andtreatment of major depression, J. Clin. Psychiatry 69 (2008) 946–958.
[6] J.W. Murrough, D.V. Iosifescu, L.C. Chang, R.K. Al Jurdi, C.E. Green, A.M. Perez,S. Iqbal, S. Pillemer, A. Foulkes, A. Shah, D.S. Charney, S.J. Mathew,Antidepressant efficacy of ketamine in treatment-resistant major depression:a two-site randomized controlled trial, Am. J. Psychiatry 170 (2013)1134–1142, http://dx.doi.org/10.1176/appi.ajp.2013.13030392.
[7] G. Sanacora, M.A. Frye, W. McDonald, S.J. Mathew, M.S. Turner, A.F.Schatzberg, P. Summergrad, C.B. Nemeroff, A consensus statement on the useof ketamine in the treatment of mood disorders, JAMA Psychiatry 74 (2017)399–405, http://dx.doi.org/10.1001/jamapsychiatry.2017.0080.
[8] C. Yang, Y. Qu, M. Abe, D. Nozawa, S. Chaki, K. Hashimoto, (R)-Ketamine showsgreater potency and longer lasting antidepressant effects than its metabolite(2R,6R)-hydroxynorketamine, Biol. Psychiatry 82 (2017) e43–e44, http://dx.doi.org/10.1016/j.biopsych.2016.12.020.
[9] M. Hasan, R. Hofstetter, G.M. Fassauer, A. Link, W. Siegmund, S. Oswald,Quantitative chiral and achiral determination of ketamine and its metabolitesby LC–MS/MS in human serum, urine and fecal samples, J. Pharm. Biomed.Anal. 139 (2017) 87–97, http://dx.doi.org/10.1016/j.jpba.2017.02.035.
[10] P. Zanos, R. Moaddel, P.J. Morris, P. Georgiou, J. Fischell, G.I. Elmer, M.Alkondon, P. Yuan, H.J. Pribut, N.S. Singh, K.S. Dossou, Y. Fang, X.P. Huang, C.L.Mayo, I.W. Wainer, E.X. Albuquerque, S.M. Thompson, C.J. Thomas, C.A. ZarateJr, T.D. Gould, NMDAR inhibition-independent antidepressant actions ofketamine metabolites, Nature 533 (2016) 481–486, http://dx.doi.org/10.1038/nature17998.
[11] N.S. Singh, C.A. Zarate Jr, R. Moaddel, M. Bernier, I.W. Wainer, What ishydroxynorketamine and what can it bring to neurotherapeutics? Expert Rev.Neurother. 14 (2014) 1239–1242, http://dx.doi.org/10.1586/14737175.2014.971760.
[12] G.L. Collingridge, Y. Lee, Z.A. Bortolotto, H. Kang, D. Lodge, Antidepressantactions of ketamine versus hydroxynorketamine, Biol. Psychiatry 81 (2017)e65–e67, http://dx.doi.org/10.1016/j.biopsych.2016.06.029.
[13] P. Zanos, R. Moaddel, P.J. Morris, I.W. Wainer, E.X. Albuquerque, S.M.Thompson, C.J. Thomas, C.A. Zarate Jr, T.D. Gould, Reply to: antidepressantactions of ketamine versus hydroxynorketamine, Biol. Psychiatry 81 (2017)e69–e71, http://dx.doi.org/10.1016/j.biopsych.2016.08.039.
[14] P. Delatour, P. Jaussaud, D. Courtot, D. Fau, Enantioselective N-demethylationof ketamine in the horse, J. Vet. Pharmacol. Ther. 14 (1991) 209–212, http://dx.doi.org/10.1111/j.1365-2885.1991.tb00825.x.
[15] G. Geisslinger, S. Menzel-Soglowek, H.D. Kamp, K. Brune, Stereoselectivehigh-performance liquid chromatographic determination of the enantiomersof ketamine and norketamine in plasma, J. Chromatogr. 568 (1991) 165–176,http://dx.doi.org/10.1016/0378-4347(91)80350-L.
[16] J.O. Svensson, L.L. Gustafsson, Determination of ketamine and norketamineenantiomers in plasma by solid-phase extraction and high-performanceliquid chromatography, J. Chromatogr. B: Biomed. Appl. 678 (1996) 373–376,http://dx.doi.org/10.1016/0378-4347(95)00545-5.
[17] G. Geisslinger, W. Hering, P. Thomann, R. Knoll, H.D. Kamp, K. Brune,Pharmacokinetics and pharmacodynamics of ketamine enantiomersinsurgical patients using a stereoselective analytical method, Br. J. Anaesth. 70(1993) 666–671, http://dx.doi.org/10.1093/bja/70.6.666.
[18] P. Hartvig, J. Valtysson, K.J. Lindner, J. Kristensen, R. Karlsten, L.L. Gustafsson, J.Persson, J.O. Svensson, I. Oye, G. Antoni, Central nervous system effects ofsubdissociative doses of (S)-ketamine are related to plasma and brainconcentrations measured with positron emission tomography in healthyvolunteers, Clin. Pharmacol. Ther. 58 (1995) 165–173, http://dx.doi.org/10.1016/0009-9236(95)90194-9.
[19] Y. Yanagihara, M. Ohtani, S. Kariya, K. Uchino, T. Aoyama, Y. Yamamura, T. Iga,Stereoselective high-performance liquid chromatographic determination ofketamine and its active metabolite, norketamine, in human plasma, J.Chromatogr. B: Biomed. Sci. Appl. 746 (2000) 227–231, http://dx.doi.org/10.1016/S0378-4347(00)00331-5.
[20] T. Chang, A.J. Glazko, A gas chromatographic assay for ketamine in humanplasma, Anesthesiology 36 (1972) 401–404.
[21] J. Wieber, R. Gugler, J.H. Hengstmann, H.J. Dengler, Pharmacokinetics ofketamine in man, Anaesthesist 24 (1975) 260–263.
[22] M.L. Williams, D.E. Mager, H. Parenteau, G. Gudi, T.S. Tracy, M. Mulheran, I.W.Wainer, Effects of protein calorie malnutrition on the pharmacokinetics ofketamine in rats, Drug Metab. Dispos. 32 (2004) 786–793, http://dx.doi.org/10.1124/dmd.32.8.786.
[23] J.N. Davisson, Rapid gas chromatographic analysis of plasma levels ofketamine and major metabolites employing either nitrogen selective or massspectroscopic detection, J. Chromatogr. 146 (1978) 344–349, http://dx.doi.org/10.1016/S0378-4347(00)81901-5.
[24] K. Lian, P. Zhang, L. Niu, S. Bi, S. Liu, L. Jiang, W. Kang, A novel derivatizationapproach for determination of ketamine in urine and plasma bygaschromatography-mass spectrometry, J. Chromatogr. A 1264 (2012)104–109, http://dx.doi.org/10.1016/j.chroma.2012.09.058.
[25] R. Theurillat, M. Knobloch, O. Levionnois, P. Larenza, M. Mevissen, W.Thormann, Characterization of the stereoselective biotransformation ofketamine to norketamine via determination of their enantiomers in equineplasma by capillary electrophoresis, Electrophoresis 26 (2005) 3942–3951,http://dx.doi.org/10.1002/elps.200500059.
[26] R. Theurillat, M. Knobloch, A. Schmitz, P.G. Lassahn, M. Mevissen, W.Thormann, Enantioselective analysis of ketamine and its metabolites inequine plasma and urine by CE with multiple isomer sulfated beta-CD,Electrophoresis 28 (2007) 2748–2757, http://dx.doi.org/10.1002/elps.200600820.
[27] A. Schmitz, R. Theurillat, P.G. Lassahn, M. Mevissen, W. Thormann, CEprovides evidence of the stereoselective hydroxylation of norketamine inequines, Electrophoresis 30 (2009) 2912–2921, http://dx.doi.org/10.1002/elps.200900221.
[28] R. Theurillat, M.P. Larenza, K. Feige, R. Bettschart-Wolfensberger, W.Thormann, Development of a method for analysis of ketamine andnorketamine enantiomers in equine brain and cerebrospinal fluid by capillaryelectrophoresis, Electrophoresis 35 (2014) 2863–2869, http://dx.doi.org/10.1002/elps.201400093.
[29] J.M. Płotka, M. Biziuk, C. Morrison, J. Namiesnik, Pharmaceutical and forensicdrug applications of chiral supercritical fluid chromatography, TrAC 56 (2014)74–89, http://dx.doi.org/10.1016/j.trac.2013.12.012.
[30] V. González-Ruiz, A.I. Olives, M.A. Martín, Core-shell particles lead the way torenewing high-performance liquid chromatography, TrAC 64 (2015) 17–28,http://dx.doi.org/10.1016/j.trac.2014.08.008.
[31] Y. Huang, T. Zhang, Y. Zhao, H. Zhou, G. Tang, M. Fillet, J. Crommen, Z. Jiang,Simultaneous analysis of nucleobases, nucleosides and ginsenosides inginseng extracts using supercritical fluid chromatography coupled with singlequadrupole mass spectrometry, J. Pharm. Biomed. Anal. (2017), http://dx.doi.org/10.1016/j.jpba.2017.03.059 (Epub ahead of print).
[32] E.N. Chen, P.D. Cusatis, E.J. Popiel, Validation of the aromatic ring distributionin diesel fuel refinery streams by supercritical fluid chromatography andmass spectrometry, J. Chromatogr. A 637 (1993) 181–186, http://dx.doi.org/10.1016/0021-9673(93)83211-A.
[33] G. Rao, B. Ravi, D. Jalandhar, P. Manoj, R. Nadh, Supercritical fluid (CO2)chromatography for quantitative determination of selected cancertherapeutic drugs in the prescence of potential impurities in injectionformulations, Anal. Methods 9 (2017) 3003–3018, http://dx.doi.org/10.1039/C7AY00779E.
[34] D. Wolrab, P. Frühauf, C. Gerner, Quantification of the neurotransmittersmelatonin and N-acetyl-serotonin in human serum by supercritical fluidchromatography coupled with tandem mass spectrometry, Anal. Chim. Acta937 (2016) 168–174, http://dx.doi.org/10.1016/j.aca.2016.08.012.
[35] Q. Tan, J. Fan, R. Gao, R. He, T. Wang, Y. Zhang, W. Zhang, Stereoselectivequantification of triticonazole in vegetables by supercritical fluidchromatography, Talanta 164 (2017) 362–367, http://dx.doi.org/10.1016/j.talanta.2016.08.077.
[36] S. Khater, C. West, Development and validation of a supercritical fluidchromatography method for the direct determination of enantiomeric purityof provitamin B5 in cosmetic formulations with mass spectrometricdetection, J. Pharm. Biomed. Anal. 102 (2015) 321–325, http://dx.doi.org/10.1016/j.jpba.2014.09.036.
[37] European Medicines Agency, Guideline on Bioanalytical Method Validation,Reference number EMEA/CHMP/EWP/192217/2009 Rev.1 Corr.2**(Lastupdated 2015), Online Access.
[38] Food and Drug Administration, Guidance for the Industry: BioanalyticalMethod Validation, Draft Guidance Revision 1, 2013 (Online Access).
[39] H. Nelander, S. Andersson, K. Ohlén, Evaluation of the chiral recognitionproperties as well as the column performance of four chiral stationary phasesbased on cellulose (3,5-dimethylphenylcarbamate) by parallel HPLC and SFC,J. Chromatogr. A 1218 (2011) 9397–9405, http://dx.doi.org/10.1016/j.chroma.2011.10.082.
[40] Y.K. Ye, K.G. Lynam, R.W. Stringham, Effect of amine mobile phase additiveson chiral subcritical fluid chromatography using polysaccharide stationaryphases, J. Chromatogr. A 1041 (2004) 211–217, http://dx.doi.org/10.1016/j.chroma.2004.04.060.
[41] K.C. Wang, T.S. Shih, S.G. Cheng, Use of SPE and LC/TIS/MS/MS for rapiddetection and quantitation of ketamine and its metabolite, norketamine, inurine, Forensic Sci. Int. 147 (2005) 81–88, http://dx.doi.org/10.1016/j.forsciint.2004.03.031.
[42] T. Legrand, S. Roy, C. Monchaud, C. Grondin, M. Duval, E. Jacqz-Aigrain,Determination of ketamine and norketamine in plasma by micro-liquidchromatography-mass spectrometry, J. Pharm. Biomed. Anal. 48 (2008)171–176, http://dx.doi.org/10.1016/j.jpba.2008.05.008.
113

G.M. Fassauer et al. / Journal of Pharmaceutical and Biomedical Analysis 146 (2017) 410–419 419
[43] R. Moaddel, S.L. Venkata, M.J. Tanga, J.E. Bupp, C.E. Green, L. Iyer, A. Furimsky,M.E. Goldberg, M.C. Torjman, I.W. Wainer, A parallel chiral-achiral liquidchromatographic method for the determination of the stereoisomers ofketamine and ketamine metabolites in the plasma and urine of patients withcomplex regional pain syndrome, Talanta 82 (2010) 1892–1904, http://dx.doi.org/10.1016/j.talanta.2010.08.005.
[44] H.R. Lin, C.C. Liao, T.C. Lin, Improved identification of multiple drugs of abuseand relative metabolites in urine samples using liquid chromatography/triplequadrupole mass spectrometry coupled with a library search, Rapid Commun.Mass Spectrom. 28 (2014) 2043–2053, http://dx.doi.org/10.1002/rcm.6997.
114
4.1 Peer‐reviewed articles
Paper VII
Supercritical fluid extraction (SFE) of ketamine metabolites from dried urine and on‐line quantification by supercritical fluid chromatography and single mass detection(on‐line SFE‐SFC‐MS)
Authors Robert K. Hofstetter, Georg M. Fassauer, and Andreas Link
Journal J. Chromatogr. B 1076 (2018): 77-83.
Analytical content In many bioanalytical methods, sample preparation is the most laborious step ofanalysis. Here, SFE was proven a favorable alternative to conventional extraction techniques fromurine – validated fully in compliance with EMA guidelines.
Contributions
Robert K. Hofstetter Investigation, validation, visualization, writing (original draft)Georg M. Fassauer Methodology, data curation, supervision , writing (original draft)Andreas Link Project administration, resources, supervision, writing (review and edit-
ing)
Robert K. Hofstetter Andreas Link
(signature) (signature)
115
Contents lists available at ScienceDirect
Journal of Chromatography B
journal homepage: www.elsevier.com/locate/jchromb
Supercritical fluid extraction (SFE) of ketamine metabolites from dried urineand on-line quantification by supercritical fluid chromatography and singlemass detection (on-line SFE–SFC–MS)☆
Robert Hofstetter, Georg M. Fassauer, Andreas Link⁎
Institute of Pharmacy, Pharmaceutical and Medicinal Chemistry, University of Greifswald, Greifswald, Germany
A R T I C L E I N F O
Keywords:KetamineOn-line SFE–SFC–MSSupercritical fluid extractionSupercritical fluid chromatographyValidation
A B S T R A C T
On-line solid-phase supercritical fluid extraction (SFE) and chromatography (SFC) coupled to mass spectrometry(MS) has been evaluated for its usefulness with respect to metabolic profiling and pharmacological investigationsof ketamine in humans. The aim of this study was to develop and validate a rapid, highly selective and sensitiveSFE–SFC–MS method for the quantification of ketamine and its metabolites in miniature amounts in humanurine excluding liquid-liquid extraction (LLE). Several conditions were optimized systematically following therequirements of the European Medicines Agency: selectivity, carry-over, calibration curve parameters (LLOQ,range and linearity), within- and between-run accuracy and precision, dilution integrity, matrix effect, andstability. The method, which required a relatively small volume of human urine (20 μL per sample), was vali-dated for pharmacologically and toxicologically relevant concentrations ranging from 25.0 to 1000 ng/mL(r2 > 0.995). The lower limit of quantification (LLOQ) for all compounds was found to be as low as 0.5 ng. Inaddition, stability of analytes during removal of water from the urine samples using different conditions (filterpaper or ISOLUTE® HM-N) was studied. In conclusion, the method developed in this study can be successfullyapplied to studies of ketamine metabolites in humans, and may pave the way for routine application of on-lineSFE–SFC–MS in clinical investigations.
1. Introduction
Hyphenation of supercritical fluid extraction (SFE) with separationtechniques like liquid (LC), gas (GC) or supercritical fluid chromato-graphy (SFC) is not new to analysts' laboratories. Introduced in the1980s and early 1990s, a considerable number of online hybrid systemswere published: SFE–HPLC [1–3], SFE–GC [4], SFE–SFC–GC [5] andSFE–SFC [6–8], to name just a few. The advantages of on-line comparedto off-line systems are as obvious as they are operationally simple: thetime for sample preparation is reduced to a minimum, as well as the riskof cross contamination due to lower numbers of preparation steps,analytes susceptible to oxidation and/or degradation can be detected intheir native forms and total automatization of the analytical system isbut a step away [9]. In spite of these advantages, hyphenated SFE–-systems are not routinely used; instead, off-line analytics are still in
practice, necessitating conventional sample preparation like solid-phase(SPE) or liquid-liquid extraction (LLE), protein precipitation and fil-tration or application of dried matrix spot techniques. Although thetechnical equipment has improved dramatically over the last few years,on-line systems did not disseminate to the same extent, and recentpublications such as determination of unstable lycopene in food [10],quantification of complex polymer additives [11] and reactive quinoneanalysis [12] only hint at the magnitude of possible applications.
The combination of SFE and SFC in particular offers compellingadvantages, like mild extraction conditions and short analysis times dueto high diffusion properties and low viscosity of the mobile phase.Supercritical carbon dioxide (sCO2) is used most commonly because itis non-flammable, non-toxic, easily available and combines favorablephysical characteristics which enable a convenient conversion to itssupercritical state. Regarding polarity, sCO2 is highly lipophilic and
https://doi.org/10.1016/j.jchromb.2018.01.024Received 29 November 2017; Received in revised form 11 January 2018; Accepted 16 January 2018
☆ In memory of Professor Dr. rer. nat. Dr. h. c. Ernst Günter KLESPER (1927–2017), pioneer in supercritical fluid chromatography, who would have turned 90 on the 6th of December2017.
⁎ Corresponding author at: Pharmaceutical and Medicinal Chemistry, Institute of Pharmacy, Friedrich-Ludwig-Jahn-Str. 17, D-17489 Greifswald, Germany.E-mail address: [email protected] (A. Link).
Abbreviations: CYP, cytochrome P450; DHK, dehydronorketamine; KET, ketamine; NK, norketamine; KET-d4, ketamine-d4; HNK, hydroxynorketamine; SFE, supercritical fluid ex-traction; SFC–MS, supercritical fluid chromatography single quadrupole mass spectrometry; LC–MS/MS, liquid chromatography tandem mass spectrometry; BPR, back pressure regulator;IPA, 2-propanol; MeOH, methanol; LLQC, lower limit of quantification; ULOQ, upper limit of quantification; sCO2, supercritical carbon dioxide; LLE, liquid-liquid extraction; SPE, solid-phase extraction
Journal of Chromatography B 1076 (2018) 77–83
1570-0232/ © 2018 Elsevier B.V. All rights reserved.
T
116
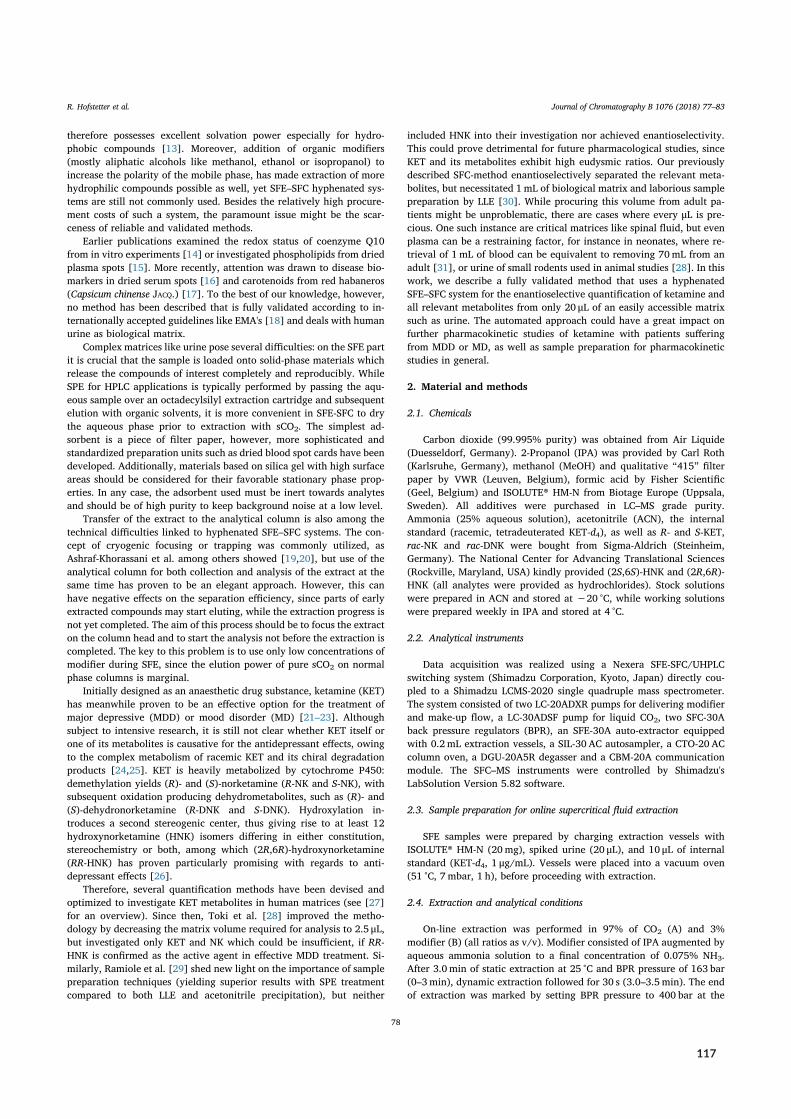
therefore possesses excellent solvation power especially for hydro-phobic compounds [13]. Moreover, addition of organic modifiers(mostly aliphatic alcohols like methanol, ethanol or isopropanol) toincrease the polarity of the mobile phase, has made extraction of morehydrophilic compounds possible as well, yet SFE–SFC hyphenated sys-tems are still not commonly used. Besides the relatively high procure-ment costs of such a system, the paramount issue might be the scar-ceness of reliable and validated methods.
Earlier publications examined the redox status of coenzyme Q10from in vitro experiments [14] or investigated phospholipids from driedplasma spots [15]. More recently, attention was drawn to disease bio-markers in dried serum spots [16] and carotenoids from red habaneros(Capsicum chinense JACQ.) [17]. To the best of our knowledge, however,no method has been described that is fully validated according to in-ternationally accepted guidelines like EMA's [18] and deals with humanurine as biological matrix.
Complex matrices like urine pose several difficulties: on the SFE partit is crucial that the sample is loaded onto solid-phase materials whichrelease the compounds of interest completely and reproducibly. WhileSPE for HPLC applications is typically performed by passing the aqu-eous sample over an octadecylsilyl extraction cartridge and subsequentelution with organic solvents, it is more convenient in SFE-SFC to drythe aqueous phase prior to extraction with sCO2. The simplest ad-sorbent is a piece of filter paper, however, more sophisticated andstandardized preparation units such as dried blood spot cards have beendeveloped. Additionally, materials based on silica gel with high surfaceareas should be considered for their favorable stationary phase prop-erties. In any case, the adsorbent used must be inert towards analytesand should be of high purity to keep background noise at a low level.
Transfer of the extract to the analytical column is also among thetechnical difficulties linked to hyphenated SFE–SFC systems. The con-cept of cryogenic focusing or trapping was commonly utilized, asAshraf-Khorassani et al. among others showed [19,20], but use of theanalytical column for both collection and analysis of the extract at thesame time has proven to be an elegant approach. However, this canhave negative effects on the separation efficiency, since parts of earlyextracted compounds may start eluting, while the extraction progress isnot yet completed. The aim of this process should be to focus the extracton the column head and to start the analysis not before the extraction iscompleted. The key to this problem is to use only low concentrations ofmodifier during SFE, since the elution power of pure sCO2 on normalphase columns is marginal.
Initially designed as an anaesthetic drug substance, ketamine (KET)has meanwhile proven to be an effective option for the treatment ofmajor depressive (MDD) or mood disorder (MD) [21–23]. Althoughsubject to intensive research, it is still not clear whether KET itself orone of its metabolites is causative for the antidepressant effects, owingto the complex metabolism of racemic KET and its chiral degradationproducts [24,25]. KET is heavily metabolized by cytochrome P450:demethylation yields (R)- and (S)-norketamine (R-NK and S-NK), withsubsequent oxidation producing dehydrometabolites, such as (R)- and(S)-dehydronorketamine (R-DNK and S-DNK). Hydroxylation in-troduces a second stereogenic center, thus giving rise to at least 12hydroxynorketamine (HNK) isomers differing in either constitution,stereochemistry or both, among which (2R,6R)-hydroxynorketamine(RR-HNK) has proven particularly promising with regards to anti-depressant effects [26].
Therefore, several quantification methods have been devised andoptimized to investigate KET metabolites in human matrices (see [27]for an overview). Since then, Toki et al. [28] improved the metho-dology by decreasing the matrix volume required for analysis to 2.5 μL,but investigated only KET and NK which could be insufficient, if RR-HNK is confirmed as the active agent in effective MDD treatment. Si-milarly, Ramiole et al. [29] shed new light on the importance of samplepreparation techniques (yielding superior results with SPE treatmentcompared to both LLE and acetonitrile precipitation), but neither
included HNK into their investigation nor achieved enantioselectivity.This could prove detrimental for future pharmacological studies, sinceKET and its metabolites exhibit high eudysmic ratios. Our previouslydescribed SFC-method enantioselectively separated the relevant meta-bolites, but necessitated 1mL of biological matrix and laborious samplepreparation by LLE [30]. While procuring this volume from adult pa-tients might be unproblematic, there are cases where every μL is pre-cious. One such instance are critical matrices like spinal fluid, but evenplasma can be a restraining factor, for instance in neonates, where re-trieval of 1mL of blood can be equivalent to removing 70mL from anadult [31], or urine of small rodents used in animal studies [28]. In thiswork, we describe a fully validated method that uses a hyphenatedSFE–SFC system for the enantioselective quantification of ketamine andall relevant metabolites from only 20 μL of an easily accessible matrixsuch as urine. The automated approach could have a great impact onfurther pharmacokinetic studies of ketamine with patients sufferingfrom MDD or MD, as well as sample preparation for pharmacokineticstudies in general.
2. Material and methods
2.1. Chemicals
Carbon dioxide (99.995% purity) was obtained from Air Liquide(Duesseldorf, Germany). 2-Propanol (IPA) was provided by Carl Roth(Karlsruhe, Germany), methanol (MeOH) and qualitative “415” filterpaper by VWR (Leuven, Belgium), formic acid by Fisher Scientific(Geel, Belgium) and ISOLUTE® HM-N from Biotage Europe (Uppsala,Sweden). All additives were purchased in LC–MS grade purity.Ammonia (25% aqueous solution), acetonitrile (ACN), the internalstandard (racemic, tetradeuterated KET-d4), as well as R- and S-KET,rac-NK and rac-DNK were bought from Sigma-Aldrich (Steinheim,Germany). The National Center for Advancing Translational Sciences(Rockville, Maryland, USA) kindly provided (2S,6S)-HNK and (2R,6R)-HNK (all analytes were provided as hydrochlorides). Stock solutionswere prepared in ACN and stored at −20 °C, while working solutionswere prepared weekly in IPA and stored at 4 °C.
2.2. Analytical instruments
Data acquisition was realized using a Nexera SFE-SFC/UHPLCswitching system (Shimadzu Corporation, Kyoto, Japan) directly cou-pled to a Shimadzu LCMS-2020 single quadruple mass spectrometer.The system consisted of two LC-20ADXR pumps for delivering modifierand make-up flow, a LC-30ADSF pump for liquid CO2, two SFC-30Aback pressure regulators (BPR), an SFE-30A auto-extractor equippedwith 0.2 mL extraction vessels, a SIL-30 AC autosampler, a CTO-20 ACcolumn oven, a DGU-20A5R degasser and a CBM-20A communicationmodule. The SFC–MS instruments were controlled by Shimadzu'sLabSolution Version 5.82 software.
2.3. Sample preparation for online supercritical fluid extraction
SFE samples were prepared by charging extraction vessels withISOLUTE® HM-N (20mg), spiked urine (20 μL), and 10 μL of internalstandard (KET-d4, 1 μg/mL). Vessels were placed into a vacuum oven(51 °C, 7mbar, 1 h), before proceeding with extraction.
2.4. Extraction and analytical conditions
On-line extraction was performed in 97% of CO2 (A) and 3%modifier (B) (all ratios as v/v). Modifier consisted of IPA augmented byaqueous ammonia solution to a final concentration of 0.075% NH3.After 3.0min of static extraction at 25 °C and BPR pressure of 163 bar(0–3min), dynamic extraction followed for 30 s (3.0–3.5 min). The endof extraction was marked by setting BPR pressure to 400 bar at the
R. Hofstetter et al. Journal of Chromatography B 1076 (2018) 77–83
78
117
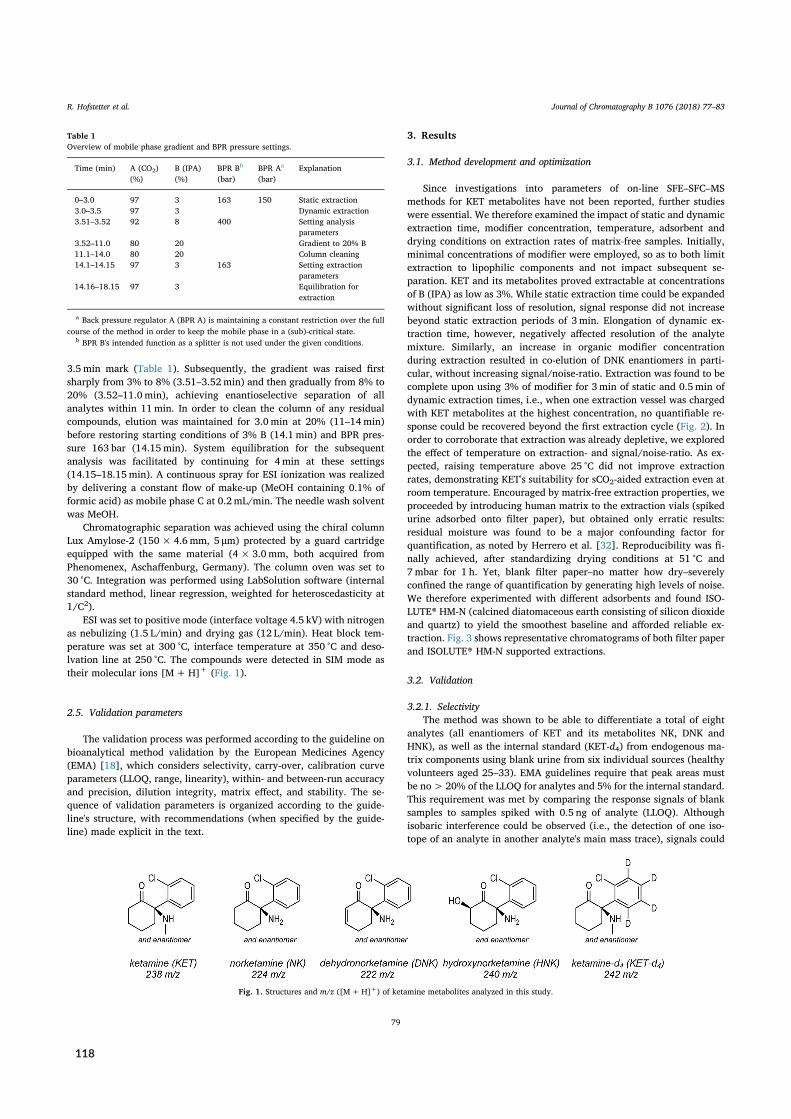
3.5 min mark (Table 1). Subsequently, the gradient was raised firstsharply from 3% to 8% (3.51–3.52min) and then gradually from 8% to20% (3.52–11.0min), achieving enantioselective separation of allanalytes within 11min. In order to clean the column of any residualcompounds, elution was maintained for 3.0 min at 20% (11–14min)before restoring starting conditions of 3% B (14.1 min) and BPR pres-sure 163 bar (14.15 min). System equilibration for the subsequentanalysis was facilitated by continuing for 4min at these settings(14.15–18.15min). A continuous spray for ESI ionization was realizedby delivering a constant flow of make-up (MeOH containing 0.1% offormic acid) as mobile phase C at 0.2mL/min. The needle wash solventwas MeOH.
Chromatographic separation was achieved using the chiral columnLux Amylose-2 (150× 4.6mm, 5 μm) protected by a guard cartridgeequipped with the same material (4× 3.0 mm, both acquired fromPhenomenex, Aschaffenburg, Germany). The column oven was set to30 °C. Integration was performed using LabSolution software (internalstandard method, linear regression, weighted for heteroscedasticity at1/C2).
ESI was set to positive mode (interface voltage 4.5 kV) with nitrogenas nebulizing (1.5 L/min) and drying gas (12 L/min). Heat block tem-perature was set at 300 °C, interface temperature at 350 °C and deso-lvation line at 250 °C. The compounds were detected in SIM mode astheir molecular ions [M+H]+ (Fig. 1).
2.5. Validation parameters
The validation process was performed according to the guideline onbioanalytical method validation by the European Medicines Agency(EMA) [18], which considers selectivity, carry-over, calibration curveparameters (LLOQ, range, linearity), within- and between-run accuracyand precision, dilution integrity, matrix effect, and stability. The se-quence of validation parameters is organized according to the guide-line's structure, with recommendations (when specified by the guide-line) made explicit in the text.
3. Results
3.1. Method development and optimization
Since investigations into parameters of on-line SFE–SFC–MSmethods for KET metabolites have not been reported, further studieswere essential. We therefore examined the impact of static and dynamicextraction time, modifier concentration, temperature, adsorbent anddrying conditions on extraction rates of matrix-free samples. Initially,minimal concentrations of modifier were employed, so as to both limitextraction to lipophilic components and not impact subsequent se-paration. KET and its metabolites proved extractable at concentrationsof B (IPA) as low as 3%. While static extraction time could be expandedwithout significant loss of resolution, signal response did not increasebeyond static extraction periods of 3min. Elongation of dynamic ex-traction time, however, negatively affected resolution of the analytemixture. Similarly, an increase in organic modifier concentrationduring extraction resulted in co-elution of DNK enantiomers in parti-cular, without increasing signal/noise-ratio. Extraction was found to becomplete upon using 3% of modifier for 3min of static and 0.5 min ofdynamic extraction times, i.e., when one extraction vessel was chargedwith KET metabolites at the highest concentration, no quantifiable re-sponse could be recovered beyond the first extraction cycle (Fig. 2). Inorder to corroborate that extraction was already depletive, we exploredthe effect of temperature on extraction- and signal/noise-ratio. As ex-pected, raising temperature above 25 °C did not improve extractionrates, demonstrating KET's suitability for sCO2-aided extraction even atroom temperature. Encouraged by matrix-free extraction properties, weproceeded by introducing human matrix to the extraction vials (spikedurine adsorbed onto filter paper), but obtained only erratic results:residual moisture was found to be a major confounding factor forquantification, as noted by Herrero et al. [32]. Reproducibility was fi-nally achieved, after standardizing drying conditions at 51 °C and7mbar for 1 h. Yet, blank filter paper–no matter how dry–severelyconfined the range of quantification by generating high levels of noise.We therefore experimented with different adsorbents and found ISO-LUTE® HM-N (calcined diatomaceous earth consisting of silicon dioxideand quartz) to yield the smoothest baseline and afforded reliable ex-traction. Fig. 3 shows representative chromatograms of both filter paperand ISOLUTE® HM-N supported extractions.
3.2. Validation
3.2.1. SelectivityThe method was shown to be able to differentiate a total of eight
analytes (all enantiomers of KET and its metabolites NK, DNK andHNK), as well as the internal standard (KET-d4) from endogenous ma-trix components using blank urine from six individual sources (healthyvolunteers aged 25–33). EMA guidelines require that peak areas mustbe no>20% of the LLOQ for analytes and 5% for the internal standard.This requirement was met by comparing the response signals of blanksamples to samples spiked with 0.5 ng of analyte (LLOQ). Althoughisobaric interference could be observed (i.e., the detection of one iso-tope of an analyte in another analyte's main mass trace), signals could
Table 1Overview of mobile phase gradient and BPR pressure settings.
Time (min) A (CO2)(%)
B (IPA)(%)
BPR Bb
(bar)BPR Aa
(bar)Explanation
0–3.0 97 3 163 150 Static extraction3.0–3.5 97 3 Dynamic extraction3.51–3.52 92 8 400 Setting analysis
parameters3.52–11.0 80 20 Gradient to 20% B11.1–14.0 80 20 Column cleaning14.1–14.15 97 3 163 Setting extraction
parameters14.16–18.15 97 3 Equilibration for
extraction
a Back pressure regulator A (BPR A) is maintaining a constant restriction over the fullcourse of the method in order to keep the mobile phase in a (sub)-critical state.
b BPR B's intended function as a splitter is not used under the given conditions.
Fig. 1. Structures and m/z ([M+H]+) of ketamine metabolites analyzed in this study.
R. Hofstetter et al. Journal of Chromatography B 1076 (2018) 77–83
79
118
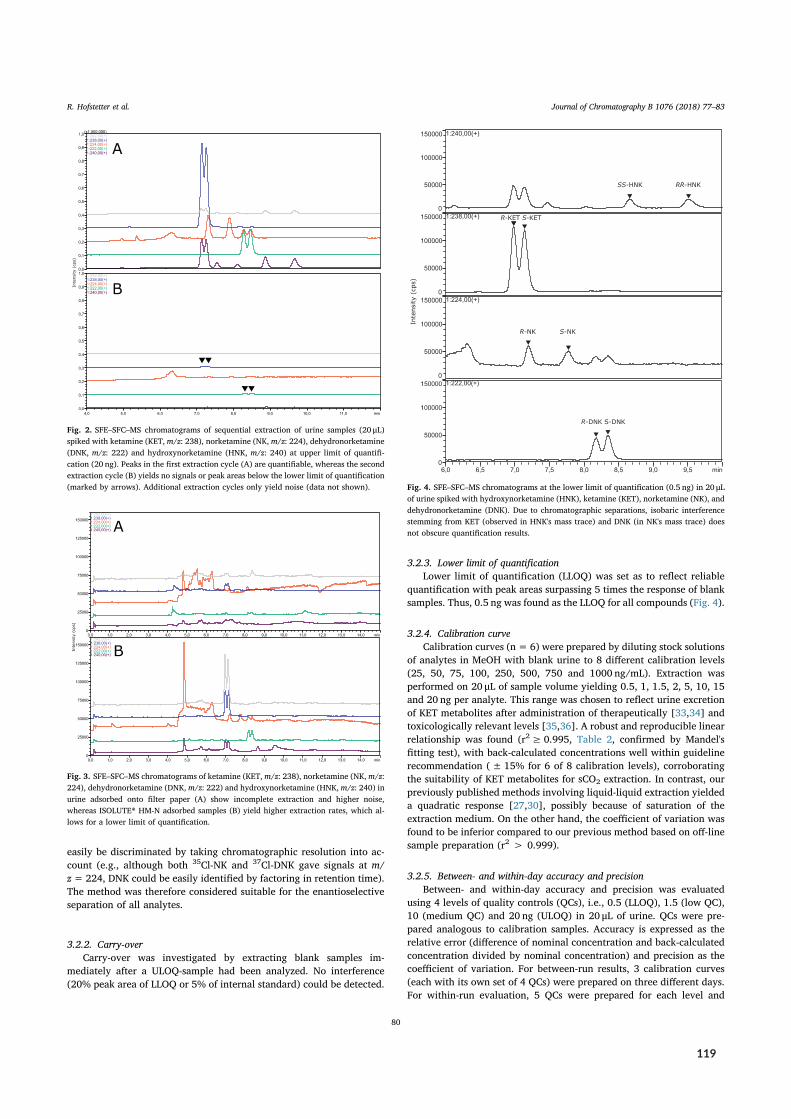
easily be discriminated by taking chromatographic resolution into ac-count (e.g., although both 35Cl-NK and 37Cl-DNK gave signals at m/z=224, DNK could be easily identified by factoring in retention time).The method was therefore considered suitable for the enantioselectiveseparation of all analytes.
3.2.2. Carry-overCarry-over was investigated by extracting blank samples im-
mediately after a ULOQ-sample had been analyzed. No interference(20% peak area of LLOQ or 5% of internal standard) could be detected.
3.2.3. Lower limit of quantificationLower limit of quantification (LLOQ) was set as to reflect reliable
quantification with peak areas surpassing 5 times the response of blanksamples. Thus, 0.5 ng was found as the LLOQ for all compounds (Fig. 4).
3.2.4. Calibration curveCalibration curves (n= 6) were prepared by diluting stock solutions
of analytes in MeOH with blank urine to 8 different calibration levels(25, 50, 75, 100, 250, 500, 750 and 1000 ng/mL). Extraction wasperformed on 20 μL of sample volume yielding 0.5, 1, 1.5, 2, 5, 10, 15and 20 ng per analyte. This range was chosen to reflect urine excretionof KET metabolites after administration of therapeutically [33,34] andtoxicologically relevant levels [35,36]. A robust and reproducible linearrelationship was found (r2≥ 0.995, Table 2, confirmed by Mandel'sfitting test), with back-calculated concentrations well within guidelinerecommendation (± 15% for 6 of 8 calibration levels), corroboratingthe suitability of KET metabolites for sCO2 extraction. In contrast, ourpreviously published methods involving liquid-liquid extraction yieldeda quadratic response [27,30], possibly because of saturation of theextraction medium. On the other hand, the coefficient of variation wasfound to be inferior compared to our previous method based on off-linesample preparation (r2 > 0.999).
3.2.5. Between- and within-day accuracy and precisionBetween- and within-day accuracy and precision was evaluated
using 4 levels of quality controls (QCs), i.e., 0.5 (LLOQ), 1.5 (low QC),10 (medium QC) and 20 ng (ULOQ) in 20 μL of urine. QCs were pre-pared analogous to calibration samples. Accuracy is expressed as therelative error (difference of nominal concentration and back-calculatedconcentration divided by nominal concentration) and precision as thecoefficient of variation. For between-run results, 3 calibration curves(each with its own set of 4 QCs) were prepared on three different days.For within-run evaluation, 5 QCs were prepared for each level and
Fig. 2. SFE–SFC–MS chromatograms of sequential extraction of urine samples (20 μL)spiked with ketamine (KET, m/z: 238), norketamine (NK, m/z: 224), dehydronorketamine(DNK, m/z: 222) and hydroxynorketamine (HNK, m/z: 240) at upper limit of quantifi-cation (20 ng). Peaks in the first extraction cycle (A) are quantifiable, whereas the secondextraction cycle (B) yields no signals or peak areas below the lower limit of quantification(marked by arrows). Additional extraction cycles only yield noise (data not shown).
Fig. 3. SFE–SFC–MS chromatograms of ketamine (KET, m/z: 238), norketamine (NK, m/z:224), dehydronorketamine (DNK, m/z: 222) and hydroxynorketamine (HNK, m/z: 240) inurine adsorbed onto filter paper (A) show incomplete extraction and higher noise,whereas ISOLUTE® HM-N adsorbed samples (B) yield higher extraction rates, which al-lows for a lower limit of quantification.
Fig. 4. SFE–SFC–MS chromatograms at the lower limit of quantification (0.5 ng) in 20 μLof urine spiked with hydroxynorketamine (HNK), ketamine (KET), norketamine (NK), anddehydronorketamine (DNK). Due to chromatographic separations, isobaric interferencestemming from KET (observed in HNK's mass trace) and DNK (in NK's mass trace) doesnot obscure quantification results.
R. Hofstetter et al. Journal of Chromatography B 1076 (2018) 77–83
80
119
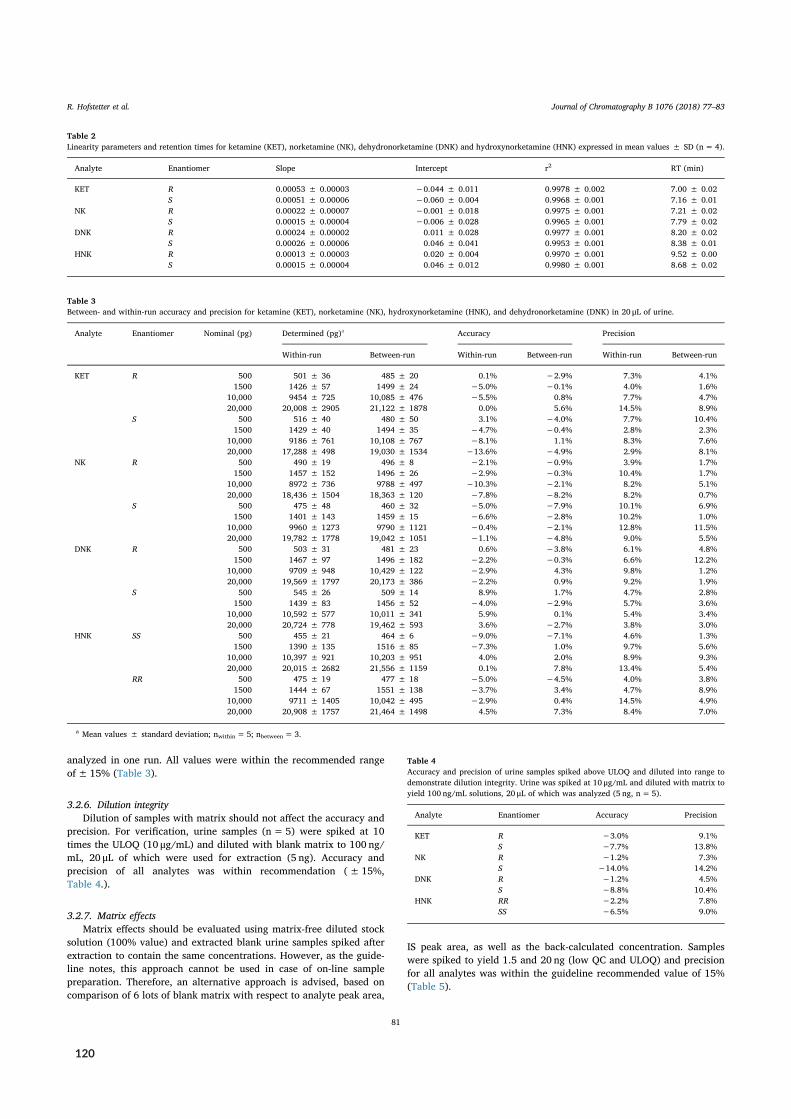
analyzed in one run. All values were within the recommended rangeof± 15% (Table 3).
3.2.6. Dilution integrityDilution of samples with matrix should not affect the accuracy and
precision. For verification, urine samples (n=5) were spiked at 10times the ULOQ (10 μg/mL) and diluted with blank matrix to 100 ng/mL, 20 μL of which were used for extraction (5 ng). Accuracy andprecision of all analytes was within recommendation (± 15%,Table 4.).
3.2.7. Matrix effectsMatrix effects should be evaluated using matrix-free diluted stock
solution (100% value) and extracted blank urine samples spiked afterextraction to contain the same concentrations. However, as the guide-line notes, this approach cannot be used in case of on-line samplepreparation. Therefore, an alternative approach is advised, based oncomparison of 6 lots of blank matrix with respect to analyte peak area,
IS peak area, as well as the back-calculated concentration. Sampleswere spiked to yield 1.5 and 20 ng (low QC and ULOQ) and precisionfor all analytes was within the guideline recommended value of 15%(Table 5).
Table 2Linearity parameters and retention times for ketamine (KET), norketamine (NK), dehydronorketamine (DNK) and hydroxynorketamine (HNK) expressed in mean values ± SD (n=4).
Analyte Enantiomer Slope Intercept r2 RT (min)
KET R 0.00053 ± 0.00003 −0.044 ± 0.011 0.9978 ± 0.002 7.00 ± 0.02S 0.00051 ± 0.00006 −0.060 ± 0.004 0.9968 ± 0.001 7.16 ± 0.01
NK R 0.00022 ± 0.00007 −0.001 ± 0.018 0.9975 ± 0.001 7.21 ± 0.02S 0.00015 ± 0.00004 −0.006 ± 0.028 0.9965 ± 0.001 7.79 ± 0.02
DNK R 0.00024 ± 0.00002 0.011 ± 0.028 0.9977 ± 0.001 8.20 ± 0.02S 0.00026 ± 0.00006 0.046 ± 0.041 0.9953 ± 0.001 8.38 ± 0.01
HNK R 0.00013 ± 0.00003 0.020 ± 0.004 0.9970 ± 0.001 9.52 ± 0.00S 0.00015 ± 0.00004 0.046 ± 0.012 0.9980 ± 0.001 8.68 ± 0.02
Table 3Between- and within-run accuracy and precision for ketamine (KET), norketamine (NK), hydroxynorketamine (HNK), and dehydronorketamine (DNK) in 20 μL of urine.
Analyte Enantiomer Nominal (pg) Determined (pg)a Accuracy Precision
Within-run Between-run Within-run Between-run Within-run Between-run
KET R 500 501 ± 36 485 ± 20 0.1% −2.9% 7.3% 4.1%1500 1426 ± 57 1499 ± 24 −5.0% −0.1% 4.0% 1.6%
10,000 9454 ± 725 10,085 ± 476 −5.5% 0.8% 7.7% 4.7%20,000 20,008 ± 2905 21,122 ± 1878 0.0% 5.6% 14.5% 8.9%
S 500 516 ± 40 480 ± 50 3.1% −4.0% 7.7% 10.4%1500 1429 ± 40 1494 ± 35 −4.7% −0.4% 2.8% 2.3%
10,000 9186 ± 761 10,108 ± 767 −8.1% 1.1% 8.3% 7.6%20,000 17,288 ± 498 19,030 ± 1534 −13.6% −4.9% 2.9% 8.1%
NK R 500 490 ± 19 496 ± 8 −2.1% −0.9% 3.9% 1.7%1500 1457 ± 152 1496 ± 26 −2.9% −0.3% 10.4% 1.7%
10,000 8972 ± 736 9788 ± 497 −10.3% −2.1% 8.2% 5.1%20,000 18,436 ± 1504 18,363 ± 120 −7.8% −8.2% 8.2% 0.7%
S 500 475 ± 48 460 ± 32 −5.0% −7.9% 10.1% 6.9%1500 1401 ± 143 1459 ± 15 −6.6% −2.8% 10.2% 1.0%
10,000 9960 ± 1273 9790 ± 1121 −0.4% −2.1% 12.8% 11.5%20,000 19,782 ± 1778 19,042 ± 1051 −1.1% −4.8% 9.0% 5.5%
DNK R 500 503 ± 31 481 ± 23 0.6% −3.8% 6.1% 4.8%1500 1467 ± 97 1496 ± 182 −2.2% −0.3% 6.6% 12.2%
10,000 9709 ± 948 10,429 ± 122 −2.9% 4.3% 9.8% 1.2%20,000 19,569 ± 1797 20,173 ± 386 −2.2% 0.9% 9.2% 1.9%
S 500 545 ± 26 509 ± 14 8.9% 1.7% 4.7% 2.8%1500 1439 ± 83 1456 ± 52 −4.0% −2.9% 5.7% 3.6%
10,000 10,592 ± 577 10,011 ± 341 5.9% 0.1% 5.4% 3.4%20,000 20,724 ± 778 19,462 ± 593 3.6% −2.7% 3.8% 3.0%
HNK SS 500 455 ± 21 464 ± 6 −9.0% −7.1% 4.6% 1.3%1500 1390 ± 135 1516 ± 85 −7.3% 1.0% 9.7% 5.6%
10,000 10,397 ± 921 10,203 ± 951 4.0% 2.0% 8.9% 9.3%20,000 20,015 ± 2682 21,556 ± 1159 0.1% 7.8% 13.4% 5.4%
RR 500 475 ± 19 477 ± 18 −5.0% −4.5% 4.0% 3.8%1500 1444 ± 67 1551 ± 138 −3.7% 3.4% 4.7% 8.9%
10,000 9711 ± 1405 10,042 ± 495 −2.9% 0.4% 14.5% 4.9%20,000 20,908 ± 1757 21,464 ± 1498 4.5% 7.3% 8.4% 7.0%
a Mean values ± standard deviation; nwithin= 5; nbetween= 3.
Table 4Accuracy and precision of urine samples spiked above ULOQ and diluted into range todemonstrate dilution integrity. Urine was spiked at 10 μg/mL and diluted with matrix toyield 100 ng/mL solutions, 20 μL of which was analyzed (5 ng, n=5).
Analyte Enantiomer Accuracy Precision
KET R −3.0% 9.1%S −7.7% 13.8%
NK R −1.2% 7.3%S −14.0% 14.2%
DNK R −1.2% 4.5%S −8.8% 10.4%
HNK RR −2.2% 7.8%SS −6.5% 9.0%
R. Hofstetter et al. Journal of Chromatography B 1076 (2018) 77–83
81
120
3.2.8. StabilityWe recently provided data showing that all compounds were stable
at room temperature for a minimum of 3 h and endured a minimum ofthree freeze-thaw cycles [27]. However, sample drying is performed at51 °C, thus requiring additional investigations into stability at thattemperature. Matrix samples spiked at medium QC concentration(n=3) were therefore subjected to 51 °C for 16 h, corresponding to thecombined drying and processing time of a maximum batch size of 48samples (i.e., the maximum capacity of the automated pretreatmentsystem). Mean accuracy of exposed samples was similar to freshlyprepared samples [6% (R-KET), 4% (S-KET), 3% (R-NK), 5% (S-NK), 8%(R-DNK), 4% (S-DNK), 4% (RR-HNK) and 11% (SS-HNK)], indicatingthat stability of all eight compounds as well as the internal standardexceeds the longest anticipated processing time.
4. Discussion
Prior to developing an online extraction method, we preparedsamples off-line using liquid-liquid extraction. This was accompaniedby eight consecutive manual operations, requiring off-and-on atten-dance of trained staff, exposition to organic solvents and extensiveafter-care cleaning or replacement of equipment. In comparison, samplepreparation for SFE is confined to drying, does not require attendance,toxic solvents, or disposables, resulting in considerably lower operatingcosts. Table 6 gives an overview of all reported sample preparationtechniques, demonstrating the advantages of the herein described
online approach. However, there are downsides to note as well: thefinancial acquisition costs of SFE units and a vacuum drying oven arestill significantly higher than those of conventional sample preparationequipment. Furthermore, we were not able to yield the same coeffi-cients of determination using on-line SFE–SFC compared to LLE–SFCanalysis (r2 > 0.995 vs 0.999, respectively), translating to both tech-niques yielding reliable results, with SFE-SFC entailing fast and eco-friendly sample preparation, and off-line LLE–SFC linked to smallestcompromises in accuracy. On the other hand, the online method yieldeda linear response for all analytes, whereas LLE gave a quadratic signal/concentration relationship possibly due to saturation of the organicphase [27,30]. Finally, although the online method's sample prepara-tion is extremely practical, Toki et al. have described direct injection ofmatrix, which represents the most reduced form of sample treatment to-date [28]. However, this puts increased strain on the hardware, asmatrix compounds can accumulate on the column or precipitate withinthe ESI capillary. Thus, we have found SFE to be an ideal extractiontechnique in connection to chromatographic separation and MS detec-tion, as primarily elutable compounds are being introduced into theanalytical system. Furthermore, inherently mild extraction conditionsallow for selective analysis of ketamine metabolites in their excretedform, thus obviating the risk of analytical artifacts due to hydrolysis ofacid- or base-labile conjugates [36].
5. Conclusions
Our main goal was the determination of the most promising meta-bolite (2R,6R)-HNK for the treatment of patients with MDD. The pri-marily detectable substances in plasma/serum are enantiomers of KET,with more than a 100 to 1000fold excess. In urine, on the other hand,concentrations of DNK and HNK are 2- and 4-fold higher than in plasma[33], and therefore the latter was preferred as target matrix. We thenreviewed all existing methods and found that while SFC was proven toachieve the fastest enantioselective separation of HNK [30], no hy-phenated method for online extraction/quantification of KET had beenreported. Indeed, there has been no internationally accepted validation(such as EMAs Guideline on bioanalytical method validation or FDAsGuidance for Industry) for an online SFE–SFC quantification method forany drug from human matrix. The validation presented here thereforeprovides both the most expedient tool for analysis of KET metabolitesto-date, as well as establishing the suitability of on-line SFE–SFC fordrug substances and metabolite screening in general.
Table 5Example for EMA-recommended investigation into matrix effects for on-line samplepreparations: analyte and IS areas at two concentration levels from 6 individual donorsare compared, with overall precision limited to 15% (n=6, data given for R-DNK in20 μL of urine).
Matrix 1500 pg 20,000 pg
Donor Analyte(area)
IS (area) Calc. (pg) Analyte(area)
IS (area) Calc. (pg)
1 361.735 1093.136 1468 4393.715 1002.027 18,4922 385.101 1103.593 1543 4092.084 955.538 18,0633 398.061 1156.198 1524 4039.004 859.393 19,8154 277.767 952.043 1303 3774.107 809.056 19,6685 400.284 1196.682 1483 4521.299 1123.704 16,9756 263.902 820.319 1429 3873.460 722.362 22,597Mean 1458 19,269Precision 5.9% 10.1%Accuracy −2.8% −3.7%
Table 6Comparison of sample preparation techniques for a standard batch of 48 samples via liquid-liquid extraction (LLE) [27,30], precipitation [29], solid-phase extraction (SPE) [29], or sCO2-extraction (SFE).
Technique LLE [27,30] Precipitation [29] SPE [29] SFE
Procedure Addition of phase I (basic) Addition of precipitant Addition of eluent Addition of adsorbentAddition of phase II (org.)RockingCentrifugation CentrifugationTransfer of supernatant Transfer of supernatant SPE elutionDrying Drying Drying DryingReconstitution Reconstitution ReconstitutionTransfer to vial Transfer to vial Transfer to vial
Equipment Automated shakerCentrifuge Centrifuge48 centrifuge tubes 48 Eppendorf tubes SPE plates/columns48 reagent tubes/N2-stream 48 reagent tubes/N2-stream 48 reagent tubes/N2-stream Drying oven48 HPLC vials & inserts 48 HPLC vials & inserts 48 HPLC vials & inserts 48 extraction vessels
Manual steps 8 6 5 2Solvent exposition High Medium Low NoneTime 2–4 h (skill-dependent) Data not reported Data not reported 1 h (automated)Response (r2) Quadratic (0.999) Data not reported Linear (0.988) Linear (0.995)
R. Hofstetter et al. Journal of Chromatography B 1076 (2018) 77–83
82
121
Acknowledgements
We thank Prof. Stefan Oswald for providing helpful advice and au-thentic standards. The analytical standards for the identification andquantification of the metabolites (2R,6R)-hydroxynorketamine (NCGC00378227) and (2S,6S)-hydroxynorketamine (NCGC00373033) werekindly provided by the National Center for Advancing TranslationalSciences (NCATS), National Institutes of Health.
References
[1] K.K. Unger, P. Roumeliotis, On-line high-pressure extraction-high-performance li-quid chromatography: equipment design and operation variables, J. Chromatogr. A282 (1983) 519–526, http://dx.doi.org/10.1016/S0021-9673(00)91629-7.
[2] H.R. Johansen, G. Becher, T. Greibrokk, Determination of planar PCBs by com-bining on-line SFE-HPLC and GC-ECD or GC/MS, Anal. Chem. 66 (1994)4068–4073, http://dx.doi.org/10.1021/AC00094A032.
[3] M. Ashraf-Khorassani, M. Barzegar, Y. Yamini, On-line coupling of supercriticalfluid extraction with high performance liquid chromatography, J. High Resolut.Chromatogr. 18 (1995) 472–476, http://dx.doi.org/10.1002/jhrc.1240180803.
[4] G.P. Blanch, G. Reglero, M. Herraiz, Analysis of wine aroma by off-line and onlinesupercritical fluid extraction-gas chromatography, J. Agric. Food Chem. 43 (1995)1251–1258, http://dx.doi.org/10.1021/jf00053a024.
[5] K.-S. Nam, J.W. King, Coupled SFE/SFC/GC for the trace analysis of pesticide re-sidues in fatty food samples, J. High Resolut. Chromatogr. 17 (1994) 577–582,http://dx.doi.org/10.1002/jhrc.1240170803.
[6] T. Hondo, M. Saito, M. Senda, Analysis of vitamin K by directly coupled super-critical fluid extraction/supercritical fluid chromatography, Bunseki Kagaku 35(1986) 316–319, http://dx.doi.org/10.2116/bunsekikagaku.35.3_316.
[7] W. Gmuer, J.O. Bosset, E. Plattner, Contribution to direct coupling of supercriticalfluid extraction to capillary supercritical fluid chromatography, J. Chromatogr. A388 (1987) 143–150, http://dx.doi.org/10.1016/S0021-9673(01)94475-9.
[8] N.J. Cotton, K.D. Bartle, A.A. Clifford, S. Ashraf, R. Moulder, C.J. Dowle, Analysis oflow molecular weight constituents of polypropylene and other polymeric materialsusing on-line SFE-SFC, J. High Resolut. Chromatogr. 14 (1991) 164–168, http://dx.doi.org/10.1002/jhrc.1240140305.
[9] S.M. Pourmortazavi, M. Rahimi-Nasrabadi, S.S. Hajimirsadeghi, Supercritical fluidtechnology in analytical chemistry, Curr. Anal. Chem. 10 (2014) 3–28, http://dx.doi.org/10.2174/1573411011410010004.
[10] J. Pól, T. Hyötyläinen, O. Ranta-Aho, M.-L. Riekkola, Determination of lycopene infood by on-line SFE coupled to HPLC using a single monolithic column for trappingand separation, J. Chromatogr. A 1052 (2004) 25–31, http://dx.doi.org/10.1016/J.CHROMA.2004.08.111.
[11] M. Thilén, R. Shishoo, Optimization of experimental parameters for the quantifi-cation of polymer additives using SFE/HPLC, J. Appl. Polym. Sci. 76 (2000)938–946, http://dx.doi.org/10.1002/(SICI)1097-4628(20000509)76:6<938::AID-APP21>3.0.CO;2-A.
[12] N.L.G.R. Juliasih, L.C. Yuan, Y. Atsuta, H. Daimon, Development of coupled su-percritical fluid extraction-high performance liquid chromatography for quinoneanalysis in activated sludge, Sep. Sci. Technol. 51 (2016) 439–446, http://dx.doi.org/10.1080/01496395.2015.1086803.
[13] K. Jurowski, K. Kochan, J. Walczak, M. Barańska, W. Piekoszewski, B. Buszewski,Comprehensive review of trends and analytical strategies applied for biologicalsamples preparation and storage in modern medical lipidomics: state of the art,TrAC Trends Anal. Chem. 86 (2017) 276–289, http://dx.doi.org/10.1016/J.TRAC.2016.10.014.
[14] A. Matsubara, K. Harada, K. Hirata, E. Fukusaki, T. Bamba, High-accuracy analysissystem for the redox status of coenzyme Q10 by online supercritical fluid extra-ction–supercritical fluid chromatography/mass spectrometry, J. Chromatogr. A1250 (2012) 76–79, http://dx.doi.org/10.1016/J.CHROMA.2012.05.009.
[15] T. Uchikata, A. Matsubara, E. Fukusaki, T. Bamba, High-throughput phospholipidprofiling system based on supercritical fluid extraction–supercritical fluid chro-matography/mass spectrometry for dried plasma spot analysis, J. Chromatogr. A1250 (2012) 69–75, http://dx.doi.org/10.1016/J.CHROMA.2012.06.031.
[16] M. Suzuki, S. Nishiumi, T. Kobayashi, A. Sakai, Y. Iwata, T. Uchikata, Y. Izumi,T. Azuma, T. Bamba, M. Yoshida, Use of on-line supercritical fluid extraction-su-percritical fluid chromatography/tandem mass spectrometry to analyze diseasebiomarkers in dried serum spots compared with serum analysis using liquid chro-matography/tandem mass spectrometry, Rapid Commun. Mass Spectrom. 31(2017) 886–894, http://dx.doi.org/10.1002/rcm.7857.
[17] M. Zoccali, D. Giuffrida, P. Dugo, L. Mondello, Direct online extraction and de-termination by supercritical fluid extraction with chromatography and mass spec-trometry of targeted carotenoids from red habanero peppers (Capsicum chinense
Jacq.), J. Sep. Sci. 40 (2017) 3905–3913, http://dx.doi.org/10.1002/jssc.201700669.
[18] European Medicines Agency, Guideline on Bioanalytical Method Validation, Comm.Med. Prod. Hum. Use 44 (2012), pp. 1–23 (doi:EMEA/CHMP/EWP/192217/2009).
[19] M. Ashraf-Khorassani, J.M. Levy, Quantitative analysis of polymer additives in lowdensity polyethylene using supercritical fluid extraction/supercritical fluid chro-matography, J. High Resolut. Chromatogr. 13 (1990) 742–747.
[20] A. del P. Sánchez-Camargo, F. Parada-Alfonso, E. Ibáñez, A. Cifuentes, On-linecoupling of supercritical fluid extraction and chromatographic techniques, J. Sep.Sci. 40 (2017) 213–227, http://dx.doi.org/10.1002/jssc.201601040.
[21] G. Sanacora, M.A. Frye, W. McDonald, S.J. Mathew, M.S. Turner, A.F. Schatzberg,P. Summergrad, C.B. Nemeroff, A consensus statement on the use of ketamine in thetreatment of mood disorders, JAMA Psychiat. 74 (2017) 399, http://dx.doi.org/10.1001/jamapsychiatry.2017.0080.
[22] R. Machado-Vieira, G. Salvadore, D.A. Luckenbaugh, H.K. Manji, C.A. Zarate Jr.,Rapid onset of antidepressant action: a new paradigm in the research and treatmentof major depressive disorder, J. Clin. Psychiatry 69 (2008) 946–958 http://www.ncbi.nlm.nih.gov/pubmed/18435563 (accessed November 24, 2017).
[23] J.W. Murrough, D.V. Iosifescu, L.C. Chang, R.K. Al Jurdi, C.E. Green, A.M. Perez,S. Iqbal, S. Pillemer, A. Foulkes, A. Shah, D.S. Charney, S.J. Mathew, Antidepressantefficacy of ketamine in treatment-resistant major depression: a two-site randomizedcontrolled trial, Am. J. Psychiatry 170 (2013) 1134–1142, http://dx.doi.org/10.1176/appi.ajp.2013.13030392.
[24] C. Yang, Y. Qu, M. Abe, D. Nozawa, S. Chaki, K. Hashimoto, (R)-Ketamine showsgreater potency and longer lasting antidepressant effects than its metabolite(2R,6R)-hydroxynorketamine, Biol. Psychiatry 82 (2017) e43–e44, http://dx.doi.org/10.1016/j.biopsych.2016.12.020.
[25] K. Suzuki, E. Nosyreva, K.W. Hunt, E.T. Kavalali, L.M. Monteggia, Effects of a ke-tamine metabolite on synaptic NMDAR function, Nature 546 (2017) E1–E3, http://dx.doi.org/10.1038/nature22084.
[26] P. Zanos, R. Moaddel, P.J. Morris, P. Georgiou, J. Fischell, G.I. Elmer, M. Alkondon,P. Yuan, H.J. Pribut, N.S. Singh, K.S.S. Dossou, Y. Fang, X.-P. Huang, C.L. Mayo,I.W. Wainer, E.X. Albuquerque, S.M. Thompson, C.J. Thomas, C.A. Zarate,T.D. Gould, T.D. Gould, NMDAR inhibition-independent antidepressant actions ofketamine metabolites, Nature 533 (2016) 481–486, http://dx.doi.org/10.1038/nature17998.
[27] M. Hasan, R. Hofstetter, G.M. Fassauer, A. Link, W. Siegmund, S. Oswald,Quantitative chiral and achiral determination of ketamine and its metabolites byLC–MS/MS in human serum, urine and fecal samples, J. Pharm. Biomed. Anal. 139(2017) 87–97, http://dx.doi.org/10.1016/j.jpba.2017.02.035.
[28] H. Toki, T. Ichikawa, A. Mizuno-Yasuhira, J. Yamaguchi, A rapid and sensitivechiral LC–MS/MS method for the determination of ketamine and norketamine inmouse plasma, brain and cerebrospinal fluid applicable to the stereoselectivepharmacokinetic study of ketamine, J. Pharm. Biomed. Anal. 148 (2018) 288–297,http://dx.doi.org/10.1016/j.jpba.2017.09.033.
[29] C. Ramiole, B.D. Hayer, V. Boudy, J. Legagneux, J. Fonsart, P. Houzé, Journal ofpharmaceutical and biomedical analysis determination of ketamine and its mainmetabolites by liquid chromatography coupled to tandem mass spectrometry in pigplasma: comparison of extraction methods, J. Pharm. Biomed. Anal. 146 (2017)369–377, http://dx.doi.org/10.1016/j.jpba.2017.09.001.
[30] G.M. Fassauer, R. Hofstetter, M. Hasan, S. Oswald, C. Modeß, W. Siegmund, A. Link,Ketamine metabolites with antidepressant effects: fast, economical, and eco-friendly enantioselective separation based on supercritical-fluid chromatography(SFC) and single quadrupole MS detection, J. Pharm. Biomed. Anal. 146 (2017)410–419, http://dx.doi.org/10.1016/j.jpba.2017.09.007.
[31] S. Albers, J. Elshoff, C. Völker, A. Richter, S. Läer, HPLC quantification of meto-prolol with solid-phase extraction for the drug monitoring of pediatric patients,Biomed. Chromatogr. 19 (2005) 202–207, http://dx.doi.org/10.1002/bmc.436.
[32] M. Herrero, A. del P. Sánchez-Camargo, A. Cifuentes, E. Ibáñez, Plants, seaweeds,microalgae and food by-products as natural sources of functional ingredients ob-tained using pressurized liquid extraction and supercritical fluid extraction, TrACTrends Anal. Chem. 71 (2015) 26–38, http://dx.doi.org/10.1016/J.TRAC.2015.01.018.
[33] R. Moaddel, S.L.V. Venkata, M.J. Tanga, J.E. Bupp, C.E. Green, L. Iyer, A. Furimsky,M.E. Goldberg, M.C. Torjman, I.W. Wainer, A parallel chiral-achiral liquid chro-matographic method for the determination of the stereoisomers of ketamine andketamine metabolites in the plasma and urine of patients with complex regionalpain syndrome, Talanta 82 (2010) 1892–1904, http://dx.doi.org/10.1016/j.talanta.2010.08.005.
[34] K. Starke, E. Board, S. Duckles, M. Eichelbaum, D. Ganten, F. Hofmann, C. Page, W.Rosenthal, G. Rubanyi, S. Diego, Handbook of Experimental Pharmacology, n.d.
[35] K.A. Moore, J. Sklerov, B. Levine, A.J. Jacobs, Urine concentrations of ketamine andnorketamine following illegal consumption, J. Anal. Toxicol. 25 (2001) 583–588.
[36] H. Lin, A.C. Lua, Detection of acid-labile conjugates of ketamine and its metabolitesin urine samples collected from pub participants, J. Anal. Toxicol. 28 (2004)181–186.
R. Hofstetter et al. Journal of Chromatography B 1076 (2018) 77–83
83
122
4.1 Peer‐reviewed articles
Paper VIII
The many (inter‐)faces of supercritical fluid chromatography: the present and futureprospects of online supercritical fluid extraction‒supercritical fluid chromatographyAuthors Robert K. Hofstetter, Georg M. Fassauer, and Andreas Link
Journal Bioanalysis (2018): 1073-1076.
Analytical content This editorial addresses the potential benefits and predicaments of on-line SFE-SFC.
Contributions
Robert K. Hofstetter Writing (original draft)Georg M. Fassauer SupervisionAndreas Link Project administration, resources, supervision, writing (review and edit-
ing)
Robert K. Hofstetter Andreas Link
(signature) (signature)
123
Editorial
For reprint orders, please contact: [email protected]
The many (inter-)faces of supercritical fluidchromatography: the present and futureprospects of online supercritical fluidextraction–supercritical fluidchromatographyRobert Hofstetter1, Georg M Fassauer1 & Andreas Link*,1
1Institute of Pharmacy, Pharmaceutical & Medicinal Chemistry, University of Greifswald, Greifswald, Germany*Author for correspondence: [email protected]
Automated supercritical fluid extraction–supercritical fluid chromatography is an innovative method withlow-effort sampling strategies (e.g., dried blood spots) that may make large-scale application faster,cheaper and greener than currently thought possible.
First draft submitted: 3 April 2018; Accepted for publication: 26 April 2018; Published online:10 July 2018
Keywords: automated sample preparation • biomatrix • green chemistry • online extraction • SFC • SFE • super-critical fluid chromatography
The science & the fiction behind supercritical fluid chromatographyFrom the 1990s, GC–MS instruments have been displayed as miracle machines that can identify the structureof unknown substances and even impossibly substituted hydrocarbons with one click of a mouse. However, eventoday this would be wishful thinking for the analytical chemist, and such depictions belong to the realm of sciencefiction. At the same time, supercritical fluid chromatography (SFC) was introduced to the analytical community.Unfortunately, optimistic claims along with the fitting acronym led to SFC also being dubbed science fictionchromatography. However, in recent times this has changed: SFC instruments have matured and reports continueto demonstrate that the low viscosity and high diffusivity of supercritical carbon dioxide results in improvedmass-transfer and superior performance. This holds true even at elevated flow-rates, provided that parameters suchas backpressure are under control. In addition, the use of toxic solvents is minimized, proving that SFC is notonly cheaper but also greener than other chromatographic methods [1]. Why then has SFC not become the goldstandard in bioanalysis? We asked a senior analytical chemist and her answer was surprisingly consistent with ourown experience: “For most compounds, there already exists an LC or GC method. For novel problems, I use thetechnology I’m most experienced with: if the analyte is polar, I use LC. If it is volatile, I use GC. There’s not muchI cannot resolve one way or the other, so I rarely need to look for alternatives.”
Indeed, LC and GC are long established technologies with a myriad of reported applications. However, while itmay take considerable time and effort to provide a comparable repertoire of methods for practical analysts to choosefrom, it is unlikely that the need for ever faster and cheaper analysis will not provide the necessary incentives forSFC to eventually catch up with these other methods. And although most of the benefits of doing so are self-evident(i.e., superior performance, economic appeal and compliance with eco-chemical principles), other virtues may havebeen underappreciated. One such feature can be found in SFC’s distinctive interfacing profile (x–SFC–y) in general,and it’s upstream compatibility with supercritical fluid extraction (SFE) in particular. Despite this combinationbeing seldom encountered in bioanalysis, it holds the key to automated screening for disease markers or affordableroutine therapeutic drug monitoring.
Bioanalysis (2018) 10(14), 1073–1076 ISSN 1757-6180 107310.4155/bio-2018-0100 C© 2018 Newlands Press
124
Editorial Hofstetter, Fassauer & Link
Sample preparation: a major determinant in bioanalysisBioanalysis usually consists of four key stages: sample collection, sample preparation, measurement, and dataprocessing. Most SFC reports naturally focus on chromatographic aspects, and it is easy to overlook the potentialfor upstream optimization. For example, it is not unusual for sample collection and preparation to take up morethan 80% of resources when dealing with biological samples [2]. Moreover, sample preparation alone often claimsmore than 50% of the overall analysis time, so bioanalytical techniques that either reduce or eliminate the need forsample preparation can free-up valuable resources [3]. This is key in routinization of potentially vital early screeningprograms, that as of yet are not affordable for large-scale implementation.
Why is sample preparation so time consuming? Typical techniques such as solid-phase extraction, liquid-liquid extraction and protein precipitation require approximately 5–8 manual steps, additional equipment, andtoxic solvent exposition, in order to extract the target compound(s) from highly interfering biological matrixcomponents [4]. Attempts at simplifying this process have been made, ranging from direct injection of liquidsamples (‘dilute-and-shoot’) to automated sample extraction, but online approaches continue to be an exception,not the rule [5]. SFC, on the other hand, has two major advantages regarding sample preparation: it rarely requiresanalyte derivatization (as opposed to GC) and is less prone to well-known reversed-phase liquid chromatographyissues when using purely organic reconstitution/injection solvents [6]. More importantly, SFC allows for easyhyphenation to SFE. This is a natural fit for both technologies because they can share injection valves, pumps, aswell as a common mobile phase, thus reducing the complexity and cost of equipment needed for creating an online(and vociferously eco-friendly) analytical system capable of all but automated sample extraction.
Comprehensive overview of bioanalytical SFE–SFCDirect SFE–SFC–UV was first described as early as 1985 by Sugiyama et al., who quantified caffeine from coffeebeans (Coffea arabica) [7]. Literature reports of the analysis of plant material by SFE–SFC–UV appeared again in2017 for the quantification of vanilloids in vanilla beans [8] and carotenoids from red Habanero peppers (Capsicumchinense Jacq.) [9]. With respect to in vitro bioanalysis, a higher ratio of reduced coenzyme Q10 could be extractedby SFE–SFC–MS from the bacterium Rhodobium marinum (compared to offline LLE–SFC), demonstrating thesuperiority of online approaches for the analysis of easily oxidized biomarkers [10]. In the case of blood analyses,the same group developed a high-throughput SFE–SFC–MS/MS profiling system for phospholipids (successfullyquantifying 134 analytes in less than 20 min [11]), as well as for a plethora of other disease biomarkers (four ofthem even polar with logP values of down to -3.5 [12]) by using dried blood spots as samples (inexpensive samplingdevices based on cellulose, which are also used for therapeutic drug monitoring). Most recently, our laboratoryoptimized an offline LLE–LC–MS/MS method for the quantification of antidepressant ketamine metabolites [13]
in urine samples [4]. Additional reports can be found in the form of conference presentations (for food andmycotoxin analysis) as well as commercial applications, the most ambitious being a screening of 500 pesticidesdirectly extracted from food products in just one automated 16-min run (Shimadzu). Interestingly, while self-made SFE–SFC interfaces dominated the scene throughout the early 1980s up to 2010s, most of the work in thepeer-reviewed literature over the last few years [4,8,9,12] was performed on instruments by this manufacturer.
Why are there not more (validated) SFE–SFC methods?Although these reports, including ours, emphasize the advantages of online sample preparation, the development ofSFE–SFC methods is challenging because our understanding of the physical mechanisms surrounding supercriticalfluid extraction is still incomplete. Moreover, as noted in the most recent review on the matter, “SFC bioanalyticalmethods are currently poorly validated. Additional work is required to evaluate the quantitative performances ofthis technique. Moreover, SFC should be compliant with the current recommendations (ICH, US FDA, EMA)before its implementation in routine analysis” [6]. Since then, only one report of validation according to FDA/EMAhas been published [14], and the dearth of fully validated methods indeed represents one of the greatest obstaclesto implementation of SFC in routine analysis. This verdict extends to the subset of bioanalytical SFE–SFCapplications, where again only one fully validated method is described [4]. On the other hand, are guidelines byICH, EMA and FDA up to date in order to accommodate online sample preparation methods?
Fuzzy parameters: matrix effects and recovery in online approachesAccording to EMA guidelines, matrix effects are investigated by comparison of peak areas from blank matrix spikedafter extraction and matrix-free analyte solution. This procedure is incompatible with online methods. Fortunately,
1074 Bioanalysis (2018) 10(14) future science group
125
The many (inter-)faces of SFC: the present & future prospects of online SFE−SFC Editorial
an alternative approach is provided for the case of online sample preparation, based on spiking six different lots ofmatrix and documentation of peak area variability from lot to lot (CV ≤15%).
Recovery, on the other hand, is estimated according to FDA guidelines by direct comparison of peak areasobtained from matrix spiked prior to extraction vs either matrix-free analyte solution (absolute recovery) or blankmatrix spiked after extraction (relative recovery). For example, take dried blood spots and see how peak areasof ‘stock solution’ could be obtained. It is tempting to spike either matrix-free blood spots or the empty extractionchamber with stock solutions, but neither guarantees complete transfer of the stock solution to the column (sinceboth approaches still incorporate an extraction step). Nor is direct injection (SFC) an option, as that would alterthe instrumental set-up (in turn requiring some sort of validation) and change several chromatographic parameters(e.g., retention time), so that a comparison of peak areas is of little value.
Incidentally, we compared peak areas obtained by sequential extraction of the same sample to gauge recoveryand found that the decrease in peak areas during the second extraction cycle was the most helpful tool in ourlaboratory. Officially, however, the recent announcement of the final draft on bioanalytical method validation onMay 22, 2018, has shed little light on recovery and matrix effects. Thus, a white paper and/or updated guidelinesare warranted to clarify likewise ill-defined parameters.
The future of SFE–SFCIn conclusion, the lack of training and experience, useful validated methods, and clear guidelines impede thewide-spread application of an otherwise promising and versatile instrument in bioanalysts’ toolbox. It remainsto be seen if online SFE–SFC systems will make traditional sample preparation obsolete once these obstaclesare removed. Probably not, since sample preparation in many cases serves other important purposes as well(e.g., analyte enrichment), and most automated techniques will still require some form of sample pretreatment(e.g., homogenization of the above mentioned plant materials, extensive drying of liquid biological matrices, evenlyophilisation in case of the microbial sample). Automated SFE–SFC is an innovative method with low-effortsampling strategies (e.g., dried blood spots) that may make large-scale application faster, cheaper and greener thancurrently thought possible. In turn, this may make the method economically attractive for routine screenings ofknown disease markers or therapeutic drug monitoring. Although not overtly spectacular as GC–MS was initially,automatable bioanalytical tools such as SFE–SFC may one day soon transform chromatography after all [11,12].
Acknowledgements
We thank PJ Bednarski for providing helpful advice in the production of this manuscript.
Financial & competing interests disclosure
The authors have no relevant affiliations or financial involvement with any organization or entity with a financial interest in or finan-
cial conflict with the subject matter or materials discussed in the manuscript. This includes employment, consultancies, honoraria,
stock ownership or options, expert testimony, grants or patents received or pending, or royalties.
No writing assistance was utilized in the production of this manuscript.
References1. Prasad TR, Joseph S, Kole P et al. Enantioselective supercritical fluid chromatography–tandem mass spectrometry method for
simultaneous estimation of risperidone and its 9-hydroxyl metabolites in rat plasma. Bioanalysis 9(22), 1739–1750 (2017).
2. P-lotka-Wasylka J, Rutkowska M, Owczarek K, Tobiszewski M, Namiesnik J. Extraction with environmentally friendly solvents. TrendsAnal. Chem. 91, 12–25 (2017).
3. Sanchez-Camargo A del P, Parada-Alfonso F, Ibanez E, Cifuent A. On-line coupling of supercritical fluid extraction andchromatographic techniques. J. Sep. Sci. 40, 213–227 (2017).
4. Hofstetter R, Fassauer GM, Link A. Supercritical fluid extraction (SFE) of ketamine metabolites from dried urine and on-linequantification by supercritical fluid chromatography and single mass detection (on-line SFE–SFC–MS). J. Chromatogr. B. 1076, 77–83(2018).
5. Wei D, Li M, King KW, Yang L. Online and automated sample extraction. Bioanalysis. 7(17), 2227–2233 (2015).
6. Dispas A, Jambo H, Andre S, Tyteca E, Hubert P. Supercritical fluid chromatography: a promising alternative to current bioanalyticaltechniques. Bioanalysis. 10(2), 107–124 (2018).
7. Sugiyama K, Saito M, Hondo T, Senda M. New double-stage separation analysis method: directly coupled laboratory-scale supercriticalfluid extraction—supercritical fluid chromatography, monitored with a multiwavelength ultraviolet detector. J. Chromatogr. 332,107–116 (1985).
future science group www.future-science.com 1075
126
Editorial Hofstetter, Fassauer & Link
8. Liang Y, Liu J, Zhong Q et al. Determination of major aromatic constituents in vanilla using on-line supercritical fluid extractioncoupled with supercritical fluid chromatography. J. Sep. Sci. (September 2017), 1–10 (2017).
9. Zoccali M, Giuffrida D, Dugo P, Mondello L. Direct online extraction and determination by supercritical fluid extraction withchromatography and mass spectrometry of targeted carotenoids from red Habanero peppers (Capsicum chinense Jacq.). J. Sep. Sci. 40(19),3905–3913 (2017).
10. Matsubara A, Harada K, Hirata K, Fukusaki E, Bamba T. High-accuracy analysis system for the redox status of coenzyme Q10 by onlinesupercritical fluid extraction–supercritical fluid chromatography/mass spectrometry. J. Chromatogr. A. 1250, 76–79 (2012).
11. Uchikata T, Matsubara A, Fukusaki E, Bamba T. High-throughput phospholipid profiling system based on supercritical fluidextraction–supercritical fluid chromatography/mass spectrometry for dried plasma spot analysis. J. Chromatogr. A. 1250, 69–75 (2012).
12. Suzuki M, Nishiumi S, Kobayashi T et al. Use of on-line supercritical fluid extraction-supercritical fluid chromatography/tandem massspectrometry to analyze disease biomarkers in dried serum spots compared with serum analysis using liquid chromatography/tandemmass spectrometry. Rapid Commun. Mass Spectrom. 31(10), 886–894 (2017).
13. Hasan M, Hofstetter R, Fassauer GM, Link A, Siegmund W, Oswald S. Quantitative chiral and achiral determination of ketamine andits metabolites by LC–MS/MS in human serum, urine and fecal samples. J. Pharm. Biomed. Anal. 139, 87–97 (2017).
14. Fassauer GM, Hofstetter R, Hasan M et al. Ketamine metabolites with antidepressant effects: fast, economical, and eco-friendlyenantioselective separation based on supercritical-fluid chromatography (SFC) and single quadrupole MS detection. J. Pharm. Biomed.Anal. 146, 410–419 (2017).
1076 Bioanalysis (2018) 10(14) future science group
127
Part 4 Publications
Paper IX
Subcritical fluid chromatography at sub‐ambient temperatures for the chiral resolu‐tion of ketamine metabolites with rapid‐onset antidepressant effects
Authors Robert K. Hofstetter, Felix Potlitz, Lukas Schulig, Simon Kim, Mahmoud Hasan, andAndreas Link
Journal Molecules 24.10 (2019): 1927.
Analytical content Previous SFC methods struggled with the enantioseparation of the parent drugketamine and its main excretion product 5,6-dehydronorketamine. Here, the dominant separationparameters on polysaccharide-based CSPs were explored. Identifiying temperature as a key variable,this led to the development of the fastest chromatographic method for the chiral separation of ke-tamine metabolites to-date (10min).
Contributions
Robert K. Hofstetter Supervision, writing (original draft)Felix Potlitz Investigation, validationLukas Schulig Software, data curation, visualizationSimon Kim InvestigationMahmoudHasan ValidationAndreas Link Project administration, funding, resources, supervision, writing (review
and editing)
Robert K. Hofstetter Andreas Link
(signature) (signature)
128
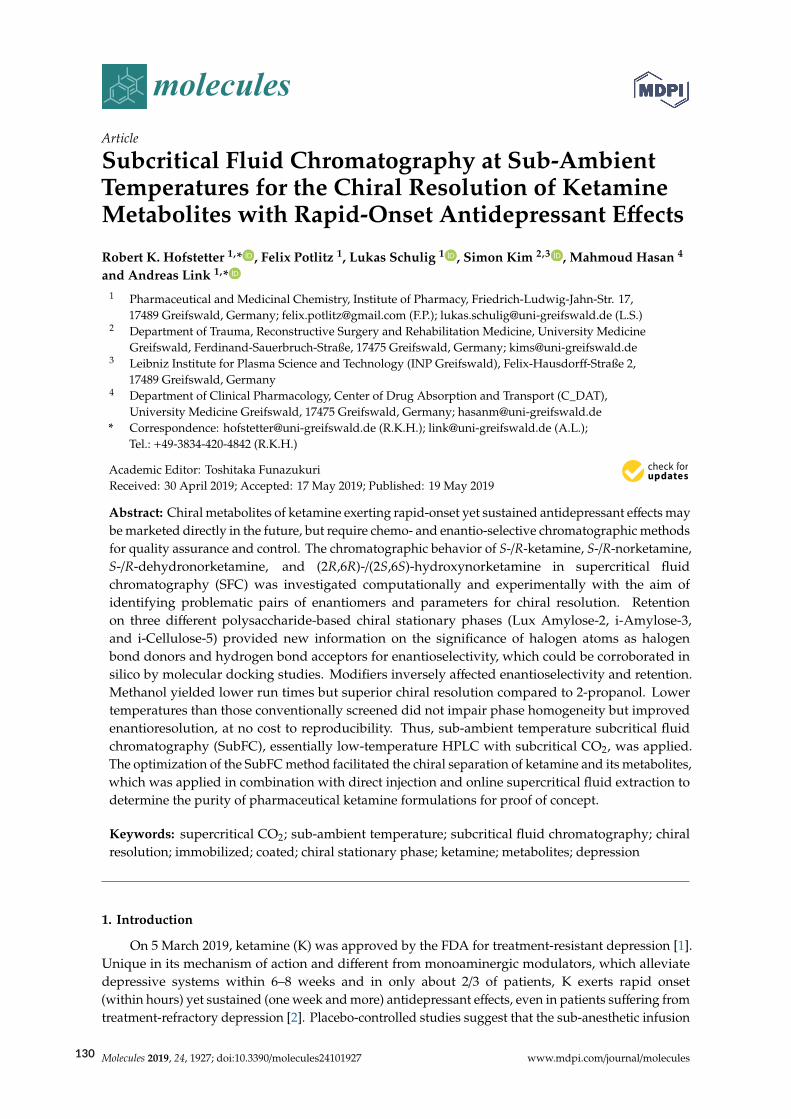
molecules
Article
Subcritical Fluid Chromatography at Sub-AmbientTemperatures for the Chiral Resolution of KetamineMetabolites with Rapid-Onset Antidepressant Effects
Robert K. Hofstetter 1,* , Felix Potlitz 1, Lukas Schulig 1 , Simon Kim 2,3 , Mahmoud Hasan 4
and Andreas Link 1,*1 Pharmaceutical and Medicinal Chemistry, Institute of Pharmacy, Friedrich-Ludwig-Jahn-Str. 17,
17489 Greifswald, Germany; [email protected] (F.P.); [email protected] (L.S.)2 Department of Trauma, Reconstructive Surgery and Rehabilitation Medicine, University Medicine
Greifswald, Ferdinand-Sauerbruch-Straße, 17475 Greifswald, Germany; [email protected] Leibniz Institute for Plasma Science and Technology (INP Greifswald), Felix-Hausdorff-Straße 2,
17489 Greifswald, Germany4 Department of Clinical Pharmacology, Center of Drug Absorption and Transport (C_DAT),
University Medicine Greifswald, 17475 Greifswald, Germany; [email protected]* Correspondence: [email protected] (R.K.H.); [email protected] (A.L.);
Tel.: +49-3834-420-4842 (R.K.H.)
Academic Editor: Toshitaka FunazukuriReceived: 30 April 2019; Accepted: 17 May 2019; Published: 19 May 2019
�����������������
Abstract: Chiral metabolites of ketamine exerting rapid-onset yet sustained antidepressant effects maybe marketed directly in the future, but require chemo- and enantio-selective chromatographic methodsfor quality assurance and control. The chromatographic behavior of S-/R-ketamine, S-/R-norketamine,S-/R-dehydronorketamine, and (2R,6R)-/(2S,6S)-hydroxynorketamine in supercritical fluidchromatography (SFC) was investigated computationally and experimentally with the aim ofidentifying problematic pairs of enantiomers and parameters for chiral resolution. Retentionon three different polysaccharide-based chiral stationary phases (Lux Amylose-2, i-Amylose-3,and i-Cellulose-5) provided new information on the significance of halogen atoms as halogenbond donors and hydrogen bond acceptors for enantioselectivity, which could be corroborated insilico by molecular docking studies. Modifiers inversely affected enantioselectivity and retention.Methanol yielded lower run times but superior chiral resolution compared to 2-propanol. Lowertemperatures than those conventionally screened did not impair phase homogeneity but improvedenantioresolution, at no cost to reproducibility. Thus, sub-ambient temperature subcritical fluidchromatography (SubFC), essentially low-temperature HPLC with subcritical CO2, was applied.The optimization of the SubFC method facilitated the chiral separation of ketamine and its metabolites,which was applied in combination with direct injection and online supercritical fluid extraction todetermine the purity of pharmaceutical ketamine formulations for proof of concept.
Keywords: supercritical CO2; sub-ambient temperature; subcritical fluid chromatography; chiralresolution; immobilized; coated; chiral stationary phase; ketamine; metabolites; depression
1. Introduction
On 5 March 2019, ketamine (K) was approved by the FDA for treatment-resistant depression [1].Unique in its mechanism of action and different from monoaminergic modulators, which alleviatedepressive systems within 6–8 weeks and in only about 2/3 of patients, K exerts rapid onset(within hours) yet sustained (one week and more) antidepressant effects, even in patients suffering fromtreatment-refractory depression [2]. Placebo-controlled studies suggest that the sub-anesthetic infusion
Molecules 2019, 24, 1927; doi:10.3390/molecules24101927 www.mdpi.com/journal/molecules130
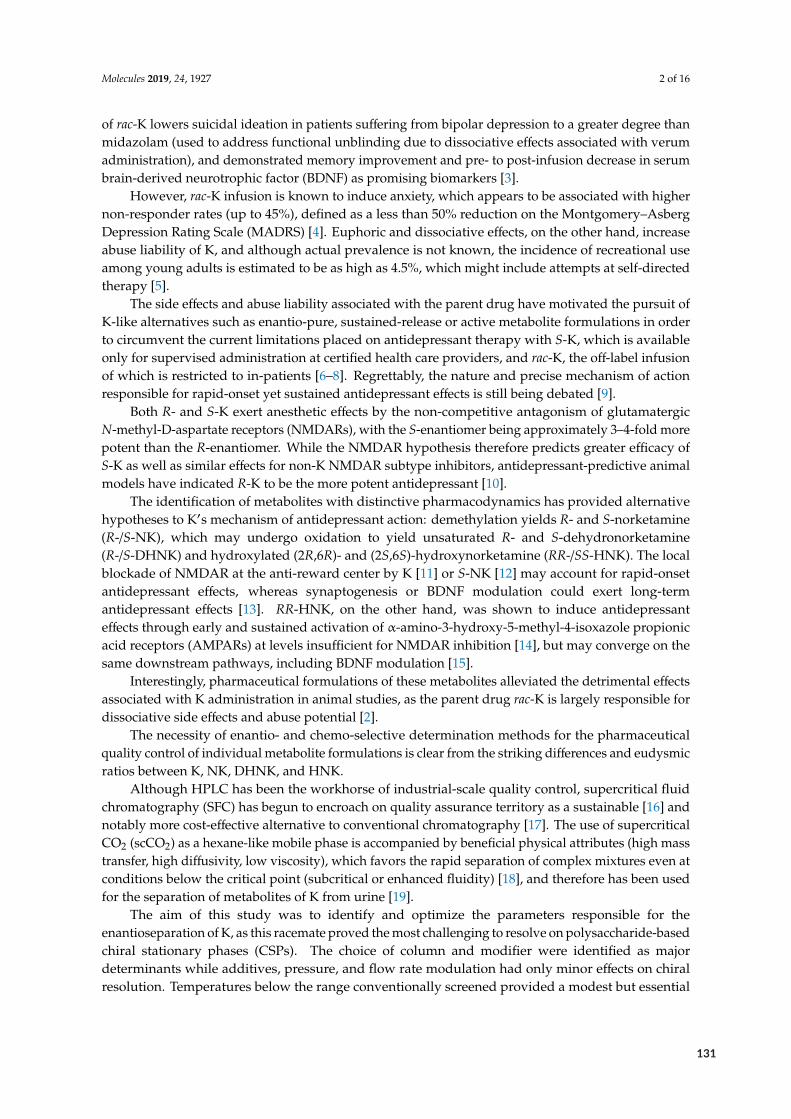
Molecules 2019, 24, 1927 2 of 16
of rac-K lowers suicidal ideation in patients suffering from bipolar depression to a greater degree thanmidazolam (used to address functional unblinding due to dissociative effects associated with verumadministration), and demonstrated memory improvement and pre- to post-infusion decrease in serumbrain-derived neurotrophic factor (BDNF) as promising biomarkers [3].
However, rac-K infusion is known to induce anxiety, which appears to be associated with highernon-responder rates (up to 45%), defined as a less than 50% reduction on the Montgomery–AsbergDepression Rating Scale (MADRS) [4]. Euphoric and dissociative effects, on the other hand, increaseabuse liability of K, and although actual prevalence is not known, the incidence of recreational useamong young adults is estimated to be as high as 4.5%, which might include attempts at self-directedtherapy [5].
The side effects and abuse liability associated with the parent drug have motivated the pursuit ofK-like alternatives such as enantio-pure, sustained-release or active metabolite formulations in orderto circumvent the current limitations placed on antidepressant therapy with S-K, which is availableonly for supervised administration at certified health care providers, and rac-K, the off-label infusionof which is restricted to in-patients [6–8]. Regrettably, the nature and precise mechanism of actionresponsible for rapid-onset yet sustained antidepressant effects is still being debated [9].
Both R- and S-K exert anesthetic effects by the non-competitive antagonism of glutamatergicN-methyl-D-aspartate receptors (NMDARs), with the S-enantiomer being approximately 3–4-fold morepotent than the R-enantiomer. While the NMDAR hypothesis therefore predicts greater efficacy ofS-K as well as similar effects for non-K NMDAR subtype inhibitors, antidepressant-predictive animalmodels have indicated R-K to be the more potent antidepressant [10].
The identification of metabolites with distinctive pharmacodynamics has provided alternativehypotheses to K′s mechanism of antidepressant action: demethylation yields R- and S-norketamine(R-/S-NK), which may undergo oxidation to yield unsaturated R- and S-dehydronorketamine(R-/S-DHNK) and hydroxylated (2R,6R)- and (2S,6S)-hydroxynorketamine (RR-/SS-HNK). The localblockade of NMDAR at the anti-reward center by K [11] or S-NK [12] may account for rapid-onsetantidepressant effects, whereas synaptogenesis or BDNF modulation could exert long-termantidepressant effects [13]. RR-HNK, on the other hand, was shown to induce antidepressanteffects through early and sustained activation of α-amino-3-hydroxy-5-methyl-4-isoxazole propionicacid receptors (AMPARs) at levels insufficient for NMDAR inhibition [14], but may converge on thesame downstream pathways, including BDNF modulation [15].
Interestingly, pharmaceutical formulations of these metabolites alleviated the detrimental effectsassociated with K administration in animal studies, as the parent drug rac-K is largely responsible fordissociative side effects and abuse potential [2].
The necessity of enantio- and chemo-selective determination methods for the pharmaceuticalquality control of individual metabolite formulations is clear from the striking differences and eudysmicratios between K, NK, DHNK, and HNK.
Although HPLC has been the workhorse of industrial-scale quality control, supercritical fluidchromatography (SFC) has begun to encroach on quality assurance territory as a sustainable [16] andnotably more cost-effective alternative to conventional chromatography [17]. The use of supercriticalCO2 (scCO2) as a hexane-like mobile phase is accompanied by beneficial physical attributes (high masstransfer, high diffusivity, low viscosity), which favors the rapid separation of complex mixtures even atconditions below the critical point (subcritical or enhanced fluidity) [18], and therefore has been usedfor the separation of metabolites of K from urine [19].
The aim of this study was to identify and optimize the parameters responsible for theenantioseparation of K, as this racemate proved the most challenging to resolve on polysaccharide-basedchiral stationary phases (CSPs). The choice of column and modifier were identified as majordeterminants while additives, pressure, and flow rate modulation had only minor effects on chiralresolution. Temperatures below the range conventionally screened provided a modest but essential
131
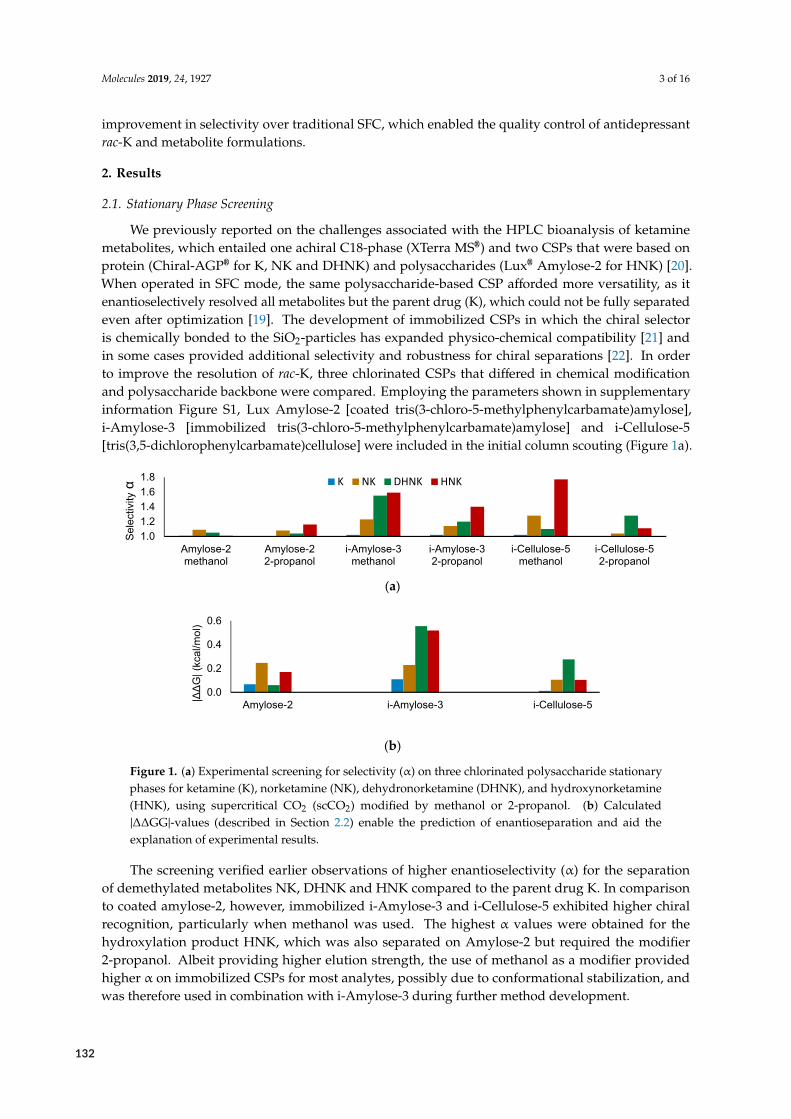
Molecules 2019, 24, 1927 3 of 16
improvement in selectivity over traditional SFC, which enabled the quality control of antidepressantrac-K and metabolite formulations.
2. Results
2.1. Stationary Phase Screening
We previously reported on the challenges associated with the HPLC bioanalysis of ketaminemetabolites, which entailed one achiral C18-phase (XTerra MS®) and two CSPs that were based onprotein (Chiral-AGP® for K, NK and DHNK) and polysaccharides (Lux® Amylose-2 for HNK) [20].When operated in SFC mode, the same polysaccharide-based CSP afforded more versatility, as itenantioselectively resolved all metabolites but the parent drug (K), which could not be fully separatedeven after optimization [19]. The development of immobilized CSPs in which the chiral selectoris chemically bonded to the SiO2-particles has expanded physico-chemical compatibility [21] andin some cases provided additional selectivity and robustness for chiral separations [22]. In orderto improve the resolution of rac-K, three chlorinated CSPs that differed in chemical modificationand polysaccharide backbone were compared. Employing the parameters shown in supplementaryinformation Figure S1, Lux Amylose-2 [coated tris(3-chloro-5-methylphenylcarbamate)amylose],i-Amylose-3 [immobilized tris(3-chloro-5-methylphenylcarbamate)amylose] and i-Cellulose-5[tris(3,5-dichlorophenylcarbamate)cellulose] were included in the initial column scouting (Figure 1a).
Molecules 2019, 24, x FOR PEER REVIEW 3 of 15
minor effects on chiral resolution. Temperatures below the range conventionally screened provided a modest but essential improvement in selectivity over traditional SFC, which enabled the quality control of antidepressant rac-K and metabolite formulations.
2. Results
2.1. Stationary Phase Screening
We previously reported on the challenges associated with the HPLC bioanalysis of ketamine metabolites, which entailed one achiral C18-phase (XTerra MS®) and two CSPs that were based on protein (Chiral-AGP® for K, NK and DHNK) and polysaccharides (Lux® Amylose-2 for HNK) [20]. When operated in SFC mode, the same polysaccharide-based CSP afforded more versatility, as it enantioselectively resolved all metabolites but the parent drug (K), which could not be fully separated even after optimization [19]. The development of immobilized CSPs in which the chiral selector is chemically bonded to the SiO2-particles has expanded physico-chemical compatibility [21] and in some cases provided additional selectivity and robustness for chiral separations [22]. In order to improve the resolution of rac-K, three chlorinated CSPs that differed in chemical modification and polysaccharide backbone were compared. Employing the parameters shown in supplementary information Figure S1, Lux Amylose-2 [coated tris(3-chloro-5-methylphenylcarbamate)amylose], i-Amylose-3 [immobilized tris(3-chloro-5-methylphenylcarbamate)amylose] and i-Cellulose-5 [tris(3,5-dichlorophenylcarbamate)cellulose] were included in the initial column scouting (Figure 1a).
(a)
(b)
Figure 1. (a) Experimental screening for selectivity (α) on three chlorinated polysaccharide stationary phases for ketamine (K), norketamine (NK), dehydronorketamine (DHNK), and hydroxynorketamine (HNK), using supercritical CO2 (scCO2) modified by methanol or 2-propanol. (b) Calculated |ΔΔGG|-values (described in Section 2.2) enable the prediction of enantioseparation and aid the explanation of experimental results.
The screening verified earlier observations of higher enantioselectivity (α) for the separation of demethylated metabolites NK, DHNK and HNK compared to the parent drug K. In comparison to coated amylose-2, however, immobilized i-Amylose-3 and i-Cellulose-5 exhibited higher chiral recognition, particularly when methanol was used. The highest α values were obtained for the hydroxylation product HNK, which was also separated on Amylose-2 but required the modifier 2-propanol. Albeit providing higher elution strength, the use of methanol as a modifier provided
1.01.21.41.61.8
Amylose-2methanol
Amylose-22-propanol
i-Amylose-3methanol
i-Amylose-32-propanol
i-Cellulose-5methanol
i-Cellulose-52-propanol
Sele
ctiv
ityα K NK DHNK HNK
0.0
0.2
0.4
0.6
Amylose-2 i-Amylose-3 i-Cellulose-5|ΔΔG
| (kc
al/m
ol)
Figure 1. (a) Experimental screening for selectivity (α) on three chlorinated polysaccharide stationaryphases for ketamine (K), norketamine (NK), dehydronorketamine (DHNK), and hydroxynorketamine(HNK), using supercritical CO2 (scCO2) modified by methanol or 2-propanol. (b) Calculated|∆∆GG|-values (described in Section 2.2) enable the prediction of enantioseparation and aid theexplanation of experimental results.
The screening verified earlier observations of higher enantioselectivity (α) for the separationof demethylated metabolites NK, DHNK and HNK compared to the parent drug K. In comparisonto coated amylose-2, however, immobilized i-Amylose-3 and i-Cellulose-5 exhibited higher chiralrecognition, particularly when methanol was used. The highest α values were obtained for thehydroxylation product HNK, which was also separated on Amylose-2 but required the modifier2-propanol. Albeit providing higher elution strength, the use of methanol as a modifier providedhigher α on immobilized CSPs for most analytes, possibly due to conformational stabilization, andwas therefore used in combination with i-Amylose-3 during further method development.
132
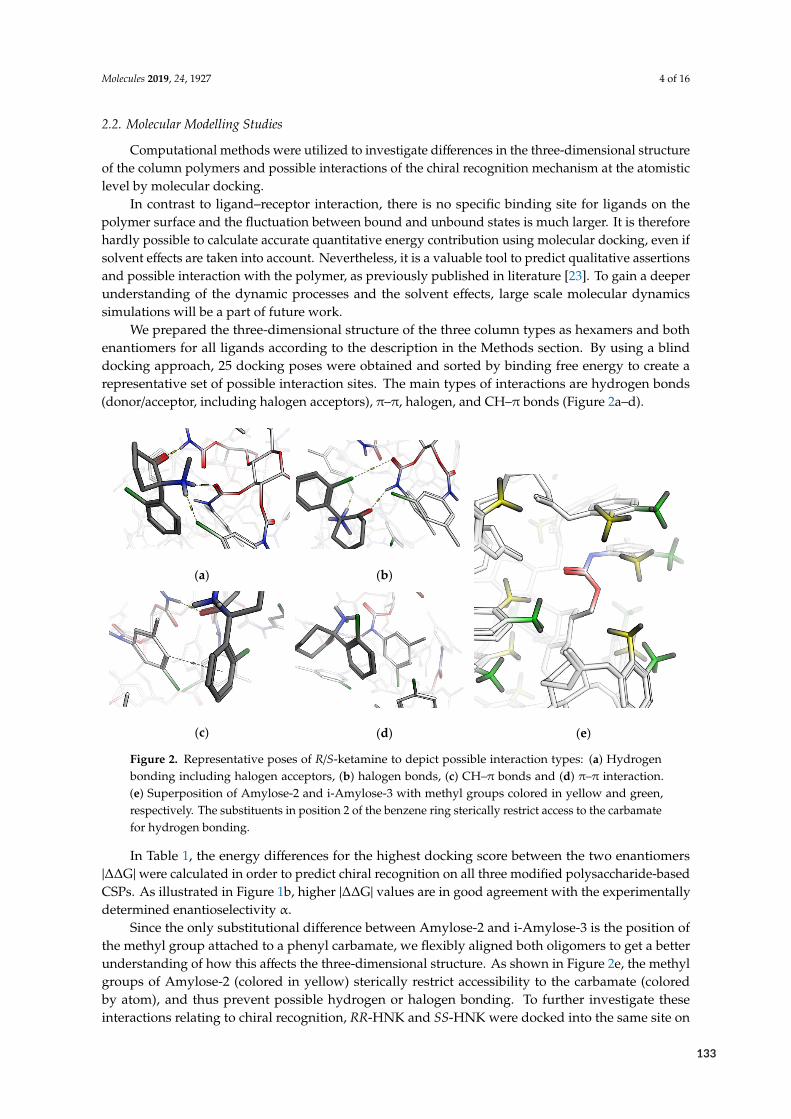
Molecules 2019, 24, 1927 4 of 16
2.2. Molecular Modelling Studies
Computational methods were utilized to investigate differences in the three-dimensional structureof the column polymers and possible interactions of the chiral recognition mechanism at the atomisticlevel by molecular docking.
In contrast to ligand–receptor interaction, there is no specific binding site for ligands on thepolymer surface and the fluctuation between bound and unbound states is much larger. It is thereforehardly possible to calculate accurate quantitative energy contribution using molecular docking, even ifsolvent effects are taken into account. Nevertheless, it is a valuable tool to predict qualitative assertionsand possible interaction with the polymer, as previously published in literature [23]. To gain a deeperunderstanding of the dynamic processes and the solvent effects, large scale molecular dynamicssimulations will be a part of future work.
We prepared the three-dimensional structure of the three column types as hexamers and bothenantiomers for all ligands according to the description in the Methods section. By using a blinddocking approach, 25 docking poses were obtained and sorted by binding free energy to create arepresentative set of possible interaction sites. The main types of interactions are hydrogen bonds(donor/acceptor, including halogen acceptors), π–π, halogen, and CH–π bonds (Figure 2a–d).
Molecules 2019, 24, x FOR PEER REVIEW 4 of 15
higher α on immobilized CSPs for most analytes, possibly due to conformational stabilization, and was therefore used in combination with i-Amylose-3 during further method development.
2.2. Molecular Modelling Studies
Computational methods were utilized to investigate differences in the three-dimensional structure of the column polymers and possible interactions of the chiral recognition mechanism at the atomistic level by molecular docking.
In contrast to ligand–receptor interaction, there is no specific binding site for ligands on the polymer surface and the fluctuation between bound and unbound states is much larger. It is therefore hardly possible to calculate accurate quantitative energy contribution using molecular docking, even if solvent effects are taken into account. Nevertheless, it is a valuable tool to predict qualitative assertions and possible interaction with the polymer, as previously published in literature [23]. To gain a deeper understanding of the dynamic processes and the solvent effects, large scale molecular dynamics simulations will be a part of future work.
We prepared the three-dimensional structure of the three column types as hexamers and both enantiomers for all ligands according to the description in the Methods section. By using a blind docking approach, 25 docking poses were obtained and sorted by binding free energy to create a representative set of possible interaction sites. The main types of interactions are hydrogen bonds (donor/acceptor, including halogen acceptors), π–π, halogen, and CH–π bonds (Figure 2a–d).
(a) (b)
(e) (c) (d)
Figure 2. Representative poses of R/S-ketamine to depict possible interaction types: (a) Hydrogen bonding including halogen acceptors, (b) halogen bonds, (c) CH–π bonds and (d) π–π interaction. (e) Superposition of Amylose-2 and i-Amylose-3 with methyl groups colored in yellow and green, respectively. The substituents in position 2 of the benzene ring sterically restrict access to the carbamate for hydrogen bonding.
In Table 1, the energy differences for the highest docking score between the two enantiomers |ΔΔG| were calculated in order to predict chiral recognition on all three modified polysaccharide-based CSPs. As illustrated in Figure 1b, higher |ΔΔG| values are in good agreement with the experimentally determined enantioselectivity α.
Since the only substitutional difference between Amylose-2 and i-Amylose-3 is the position of the methyl group attached to a phenyl carbamate, we flexibly aligned both oligomers to get a better understanding of how this affects the three-dimensional structure. As shown in Figure 2e, the methyl groups of Amylose-2 (colored in yellow) sterically restrict accessibility to the carbamate
Figure 2. Representative poses of R/S-ketamine to depict possible interaction types: (a) Hydrogenbonding including halogen acceptors, (b) halogen bonds, (c) CH–π bonds and (d) π–π interaction.(e) Superposition of Amylose-2 and i-Amylose-3 with methyl groups colored in yellow and green,respectively. The substituents in position 2 of the benzene ring sterically restrict access to the carbamatefor hydrogen bonding.
In Table 1, the energy differences for the highest docking score between the two enantiomers|∆∆G| were calculated in order to predict chiral recognition on all three modified polysaccharide-basedCSPs. As illustrated in Figure 1b, higher |∆∆G| values are in good agreement with the experimentallydetermined enantioselectivity α.
Since the only substitutional difference between Amylose-2 and i-Amylose-3 is the position ofthe methyl group attached to a phenyl carbamate, we flexibly aligned both oligomers to get a betterunderstanding of how this affects the three-dimensional structure. As shown in Figure 2e, the methylgroups of Amylose-2 (colored in yellow) sterically restrict accessibility to the carbamate (coloredby atom), and thus prevent possible hydrogen or halogen bonding. To further investigate theseinteractions relating to chiral recognition, RR-HNK and SS-HNK were docked into the same site on
133
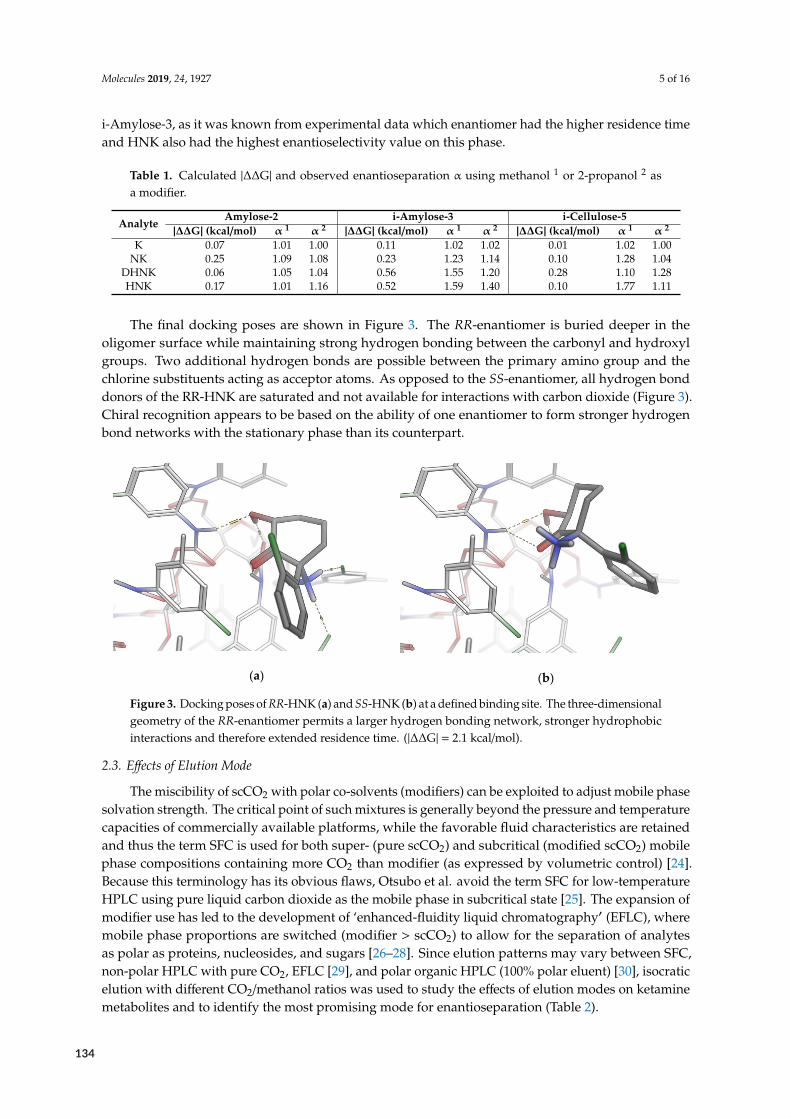
Molecules 2019, 24, 1927 5 of 16
i-Amylose-3, as it was known from experimental data which enantiomer had the higher residence timeand HNK also had the highest enantioselectivity value on this phase.
Table 1. Calculated |∆∆G| and observed enantioseparation α using methanol 1 or 2-propanol 2 asa modifier.
Amylose-2 i-Amylose-3 i-Cellulose-5Analyte
|∆∆G| (kcal/mol) α 1 α 2 |∆∆G| (kcal/mol) α 1 α 2 |∆∆G| (kcal/mol) α 1 α 2
K 0.07 1.01 1.00 0.11 1.02 1.02 0.01 1.02 1.00NK 0.25 1.09 1.08 0.23 1.23 1.14 0.10 1.28 1.04
DHNK 0.06 1.05 1.04 0.56 1.55 1.20 0.28 1.10 1.28HNK 0.17 1.01 1.16 0.52 1.59 1.40 0.10 1.77 1.11
The final docking poses are shown in Figure 3. The RR-enantiomer is buried deeper in theoligomer surface while maintaining strong hydrogen bonding between the carbonyl and hydroxylgroups. Two additional hydrogen bonds are possible between the primary amino group and thechlorine substituents acting as acceptor atoms. As opposed to the SS-enantiomer, all hydrogen bonddonors of the RR-HNK are saturated and not available for interactions with carbon dioxide (Figure 3).Chiral recognition appears to be based on the ability of one enantiomer to form stronger hydrogenbond networks with the stationary phase than its counterpart.
Molecules 2019, 24, x FOR PEER REVIEW 5 of 15
(colored by atom), and thus prevent possible hydrogen or halogen bonding. To further investigate these interactions relating to chiral recognition, RR-HNK and SS-HNK were docked into the same site on i-Amylose-3, as it was known from experimental data which enantiomer had the higher residence time and HNK also had the highest enantioselectivity value on this phase.
Table 1. Calculated |ΔΔG| and observed enantioseparation α using methanol 1 or 2-propanol 2 as a modifier.
Analyte Amylose-2 i-Amylose-3 i-Cellulose-5
|ΔΔG| (kcal/mol) α 1 α 2 |ΔΔG| (kcal/mol) α 1 α 2 |ΔΔG| (kcal/mol) α1 α2 K 0.07 1.01 1.00 0.11 1.02 1.02 0.01 1.02 1.00
NK 0.25 1.09 1.08 0.23 1.23 1.14 0.10 1.28 1.04 DHNK 0.06 1.05 1.04 0.56 1.55 1.20 0.28 1.10 1.28 HNK 0.17 1.01 1.16 0.52 1.59 1.40 0.10 1.77 1.11
The final docking poses are shown in Figure 3. The RR-enantiomer is buried deeper in the oligomer surface while maintaining strong hydrogen bonding between the carbonyl and hydroxyl groups. Two additional hydrogen bonds are possible between the primary amino group and the chlorine substituents acting as acceptor atoms. As opposed to the SS-enantiomer, all hydrogen bond donors of the RR-HNK are saturated and not available for interactions with carbon dioxide (Figure 3). Chiral recognition appears to be based on the ability of one enantiomer to form stronger hydrogen bond networks with the stationary phase than its counterpart.
(a) (b)
Figure 3. Docking poses of RR-HNK (a) and SS-HNK (b) at a defined binding site. The three-dimensional geometry of the RR-enantiomer permits a larger hydrogen bonding network, stronger hydrophobic interactions and therefore extended residence time. (|ΔΔG| = 2.1 kcal/mol)
2.3. Effects of Elution Mode
The miscibility of scCO2 with polar co-solvents (modifiers) can be exploited to adjust mobile phase solvation strength. The critical point of such mixtures is generally beyond the pressure and temperature capacities of commercially available platforms, while the favorable fluid characteristics are retained and thus the term SFC is used for both super- (pure scCO2) and subcritical (modified scCO2) mobile phase compositions containing more CO2 than modifier (as expressed by volumetric control) [24]. Because this terminology has its obvious flaws, Otsubo et al. avoid the term SFC for low-temperature HPLC using pure liquid carbon dioxide as the mobile phase in subcritical state [25]. The expansion of modifier use has led to the development of ‘enhanced-fluidity liquid chromatography′ (EFLC), where mobile phase proportions are switched (modifier > scCO2) to allow for the separation of analytes as polar as proteins, nucleosides, and sugars [26–28]. Since elution patterns may vary between SFC, non-polar HPLC with pure CO2, EFLC [29], and polar organic HPLC (100% polar eluent) [30], isocratic elution with different CO2/methanol ratios was used to
Figure 3. Docking poses of RR-HNK (a) and SS-HNK (b) at a defined binding site. The three-dimensionalgeometry of the RR-enantiomer permits a larger hydrogen bonding network, stronger hydrophobicinteractions and therefore extended residence time. (|∆∆G| = 2.1 kcal/mol).
2.3. Effects of Elution Mode
The miscibility of scCO2 with polar co-solvents (modifiers) can be exploited to adjust mobile phasesolvation strength. The critical point of such mixtures is generally beyond the pressure and temperaturecapacities of commercially available platforms, while the favorable fluid characteristics are retainedand thus the term SFC is used for both super- (pure scCO2) and subcritical (modified scCO2) mobilephase compositions containing more CO2 than modifier (as expressed by volumetric control) [24].Because this terminology has its obvious flaws, Otsubo et al. avoid the term SFC for low-temperatureHPLC using pure liquid carbon dioxide as the mobile phase in subcritical state [25]. The expansion ofmodifier use has led to the development of ‘enhanced-fluidity liquid chromatography′ (EFLC), wheremobile phase proportions are switched (modifier > scCO2) to allow for the separation of analytesas polar as proteins, nucleosides, and sugars [26–28]. Since elution patterns may vary between SFC,non-polar HPLC with pure CO2, EFLC [29], and polar organic HPLC (100% polar eluent) [30], isocraticelution with different CO2/methanol ratios was used to study the effects of elution modes on ketaminemetabolites and to identify the most promising mode for enantioseparation (Table 2).
134
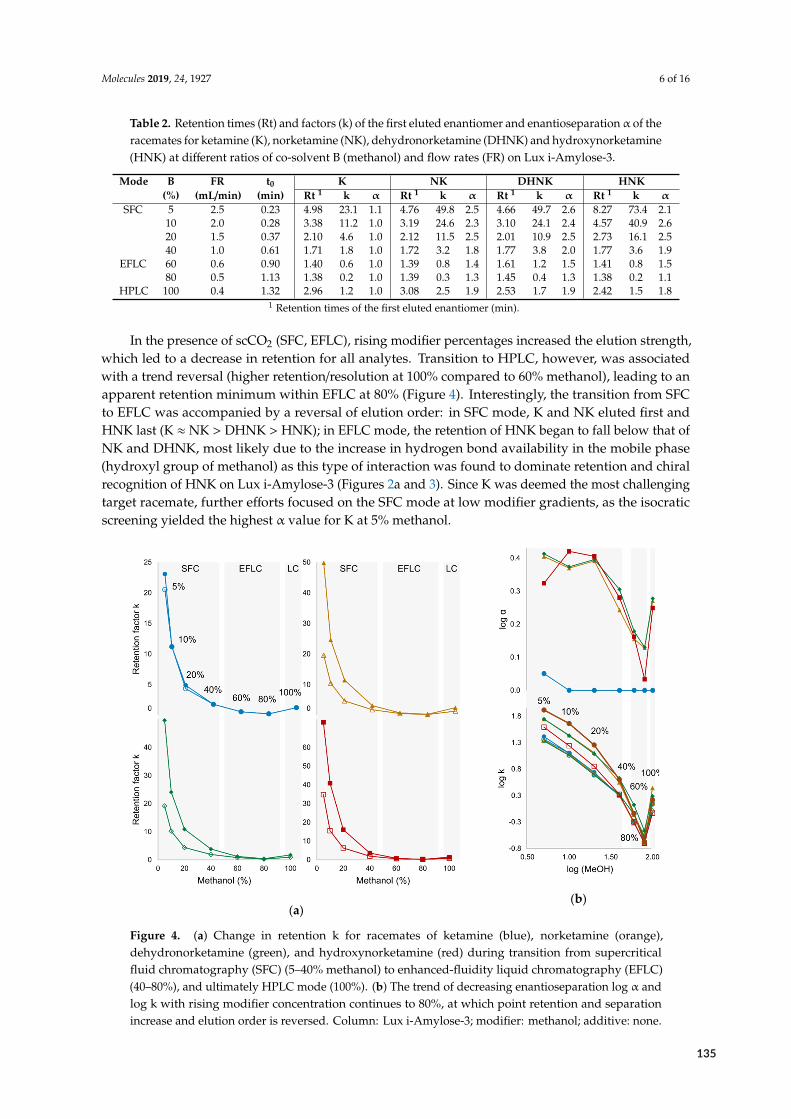
Molecules 2019, 24, 1927 6 of 16
Table 2. Retention times (Rt) and factors (k) of the first eluted enantiomer and enantioseparation α of theracemates for ketamine (K), norketamine (NK), dehydronorketamine (DHNK) and hydroxynorketamine(HNK) at different ratios of co-solvent B (methanol) and flow rates (FR) on Lux i-Amylose-3.
Mode B FR t0 K NK DHNK HNK(%) (mL/min) (min) Rt 1 k α Rt 1 k α Rt 1 k α Rt 1 k α
SFC 5 2.5 0.23 4.98 23.1 1.1 4.76 49.8 2.5 4.66 49.7 2.6 8.27 73.4 2.110 2.0 0.28 3.38 11.2 1.0 3.19 24.6 2.3 3.10 24.1 2.4 4.57 40.9 2.620 1.5 0.37 2.10 4.6 1.0 2.12 11.5 2.5 2.01 10.9 2.5 2.73 16.1 2.540 1.0 0.61 1.71 1.8 1.0 1.72 3.2 1.8 1.77 3.8 2.0 1.77 3.6 1.9
EFLC 60 0.6 0.90 1.40 0.6 1.0 1.39 0.8 1.4 1.61 1.2 1.5 1.41 0.8 1.580 0.5 1.13 1.38 0.2 1.0 1.39 0.3 1.3 1.45 0.4 1.3 1.38 0.2 1.1
HPLC 100 0.4 1.32 2.96 1.2 1.0 3.08 2.5 1.9 2.53 1.7 1.9 2.42 1.5 1.81 Retention times of the first eluted enantiomer (min).
In the presence of scCO2 (SFC, EFLC), rising modifier percentages increased the elution strength,which led to a decrease in retention for all analytes. Transition to HPLC, however, was associatedwith a trend reversal (higher retention/resolution at 100% compared to 60% methanol), leading to anapparent retention minimum within EFLC at 80% (Figure 4). Interestingly, the transition from SFCto EFLC was accompanied by a reversal of elution order: in SFC mode, K and NK eluted first andHNK last (K ≈ NK > DHNK > HNK); in EFLC mode, the retention of HNK began to fall below that ofNK and DHNK, most likely due to the increase in hydrogen bond availability in the mobile phase(hydroxyl group of methanol) as this type of interaction was found to dominate retention and chiralrecognition of HNK on Lux i-Amylose-3 (Figures 2a and 3). Since K was deemed the most challengingtarget racemate, further efforts focused on the SFC mode at low modifier gradients, as the isocraticscreening yielded the highest α value for K at 5% methanol.
Molecules 2019, 24, x FOR PEER REVIEW 6 of 15
study the effects of elution modes on ketamine metabolites and to identify the most promising mode for enantioseparation (Table 2).
Table 2. Retention times (Rt) and factors (k) of the first eluted enantiomer and enantioseparation α of the racemates for ketamine (K), norketamine (NK), dehydronorketamine (DHNK) and hydroxynorketamine (HNK) at different ratios of co-solvent B (methanol) and flow rates (FR) on Lux i-Amylose-3.
Mode B FR t0 K NK DHNK HNK (%) (mL/min) (min) Rt 1 k α Rt 1 k α Rt 1 k α Rt 1 k α
SFC 5 2.5 0.23 4.98 23.1 1.1 4.76 49.8 2.5 4.66 49.7 2.6 8.27 73.4 2.1 10 2.0 0.28 3.38 11.2 1.0 3.19 24.6 2.3 3.10 24.1 2.4 4.57 40.9 2.6 20 1.5 0.37 2.10 4.6 1.0 2.12 11.5 2.5 2.01 10.9 2.5 2.73 16.1 2.5 40 1.0 0.61 1.71 1.8 1.0 1.72 3.2 1.8 1.77 3.8 2.0 1.77 3.6 1.9
EFLC 60 0.6 0.90 1.40 0.6 1.0 1.39 0.8 1.4 1.61 1.2 1.5 1.41 0.8 1.5 80 0.5 1.13 1.38 0.2 1.0 1.39 0.3 1.3 1.45 0.4 1.3 1.38 0.2 1.1
HPLC 100 0.4 1.32 2.96 1.2 1.0 3.08 2.5 1.9 2.53 1.7 1.9 2.42 1.5 1.8 1 Retention times of the first eluted enantiomer (min).
In the presence of scCO2 (SFC, EFLC), rising modifier percentages increased the elution strength, which led to a decrease in retention for all analytes. Transition to HPLC, however, was associated with a trend reversal (higher retention/resolution at 100% compared to 60% methanol), leading to an apparent retention minimum within EFLC at 80% (Figure 4). Interestingly, the transition from SFC to EFLC was accompanied by a reversal of elution order: in SFC mode, K and NK eluted first and HNK last (K ≈ NK > DHNK > HNK); in EFLC mode, the retention of HNK began to fall below that of NK and DHNK, most likely due to the increase in hydrogen bond availability in the mobile phase (hydroxyl group of methanol) as this type of interaction was found to dominate retention and chiral recognition of HNK on Lux i-Amylose-3 (Figures 2a and 3). Since K was deemed the most challenging target racemate, further efforts focused on the SFC mode at low modifier gradients, as the isocratic screening yielded the highest α value for K at 5% methanol.
(a)
(b)
Figure 4. (a) Change in retention k for racemates of ketamine (blue), norketamine (orange), dehydronorketamine (green), and hydroxynorketamine (red) during transition from supercritical fluid chromatography (SFC) (5–40% methanol) to enhanced-fluidity liquid chromatography (EFLC)
Figure 4. (a) Change in retention k for racemates of ketamine (blue), norketamine (orange),dehydronorketamine (green), and hydroxynorketamine (red) during transition from supercriticalfluid chromatography (SFC) (5–40% methanol) to enhanced-fluidity liquid chromatography (EFLC)(40–80%), and ultimately HPLC mode (100%). (b) The trend of decreasing enantioseparation log α andlog k with rising modifier concentration continues to 80%, at which point retention and separationincrease and elution order is reversed. Column: Lux i-Amylose-3; modifier: methanol; additive: none.
135
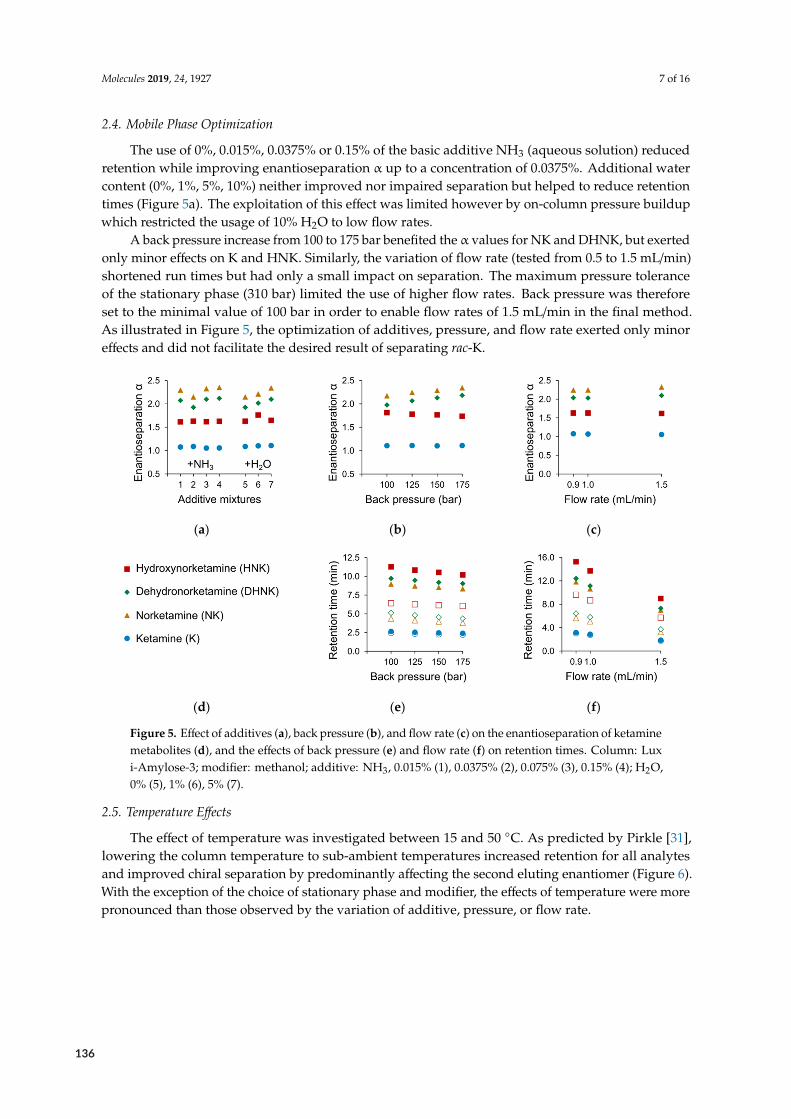
Molecules 2019, 24, 1927 7 of 16
2.4. Mobile Phase Optimization
The use of 0%, 0.015%, 0.0375% or 0.15% of the basic additive NH3 (aqueous solution) reducedretention while improving enantioseparation α up to a concentration of 0.0375%. Additional watercontent (0%, 1%, 5%, 10%) neither improved nor impaired separation but helped to reduce retentiontimes (Figure 5a). The exploitation of this effect was limited however by on-column pressure buildupwhich restricted the usage of 10% H2O to low flow rates.
A back pressure increase from 100 to 175 bar benefited the α values for NK and DHNK, but exertedonly minor effects on K and HNK. Similarly, the variation of flow rate (tested from 0.5 to 1.5 mL/min)shortened run times but had only a small impact on separation. The maximum pressure toleranceof the stationary phase (310 bar) limited the use of higher flow rates. Back pressure was thereforeset to the minimal value of 100 bar in order to enable flow rates of 1.5 mL/min in the final method.As illustrated in Figure 5, the optimization of additives, pressure, and flow rate exerted only minoreffects and did not facilitate the desired result of separating rac-K.
Molecules 2019, 24, x FOR PEER REVIEW 7 of 15
(40–80%), and ultimately HPLC mode (100%). (b) The trend of decreasing enantioseparation log α and log k with rising modifier concentration continues to 80%, at which point retention and separation increase and elution order is reversed. Column: Lux i-Amylose-3; modifier: methanol; additive: none.
2.4. Mobile phase optimization
The use of 0%, 0.015%, 0.0375% or 0.15% of the basic additive NH3 (aqueous solution) reduced retention while improving enantioseparation α up to a concentration of 0.0375%. Additional water content (0%, 1%, 5%, 10%) neither improved nor impaired separation but helped to reduce retention times (Figure 5a). The exploitation of this effect was limited however by on-column pressure buildup which restricted the usage of 10% H2O to low flow rates.
A back pressure increase from 100 to 175 bar benefited the α values for NK and DHNK, but exerted only minor effects on K and HNK. Similarly, the variation of flow rate (tested from 0.5 to 1.5 mL/min) shortened run times but had only a small impact on separation. The maximum pressure tolerance of the stationary phase (310 bar) limited the use of higher flow rates. Back pressure was therefore set to the minimal value of 100 bar in order to enable flow rates of 1.5 mL/min in the final method. As illustrated in Figure 5, the optimization of additives, pressure, and flow rate exerted only minor effects and did not facilitate the desired result of separating rac-K.
(a) (b) (c)
(d) (e) (f)
Figure 5. Effect of additives (a), back pressure (b), and flow rate (c) on the enantioseparation of ketamine metabolites (d), and the effects of back pressure (e) and flow rate (f) on retention times. Column: Lux i-Amylose-3; modifier: methanol; additive: NH3, 0.015% (1), 0.0375% (2), 0.075% (3), 0.15% (4); H2O, 0% (5), 1% (6), 5% (7).
2.5. Temperature Effects
The effect of temperature was investigated between 15 and 50 °C. As predicted by Pirkle [31], lowering the column temperature to sub-ambient temperatures increased retention for all analytes and improved chiral separation by predominantly affecting the second eluting enantiomer (Figure 6). With the exception of the choice of stationary phase and modifier, the effects of temperature were more pronounced than those observed by the variation of additive, pressure, or flow rate.
Figure 5. Effect of additives (a), back pressure (b), and flow rate (c) on the enantioseparation of ketaminemetabolites (d), and the effects of back pressure (e) and flow rate (f) on retention times. Column: Luxi-Amylose-3; modifier: methanol; additive: NH3, 0.015% (1), 0.0375% (2), 0.075% (3), 0.15% (4); H2O,0% (5), 1% (6), 5% (7).
2.5. Temperature Effects
The effect of temperature was investigated between 15 and 50 ◦C. As predicted by Pirkle [31],lowering the column temperature to sub-ambient temperatures increased retention for all analytesand improved chiral separation by predominantly affecting the second eluting enantiomer (Figure 6).With the exception of the choice of stationary phase and modifier, the effects of temperature were morepronounced than those observed by the variation of additive, pressure, or flow rate.
136
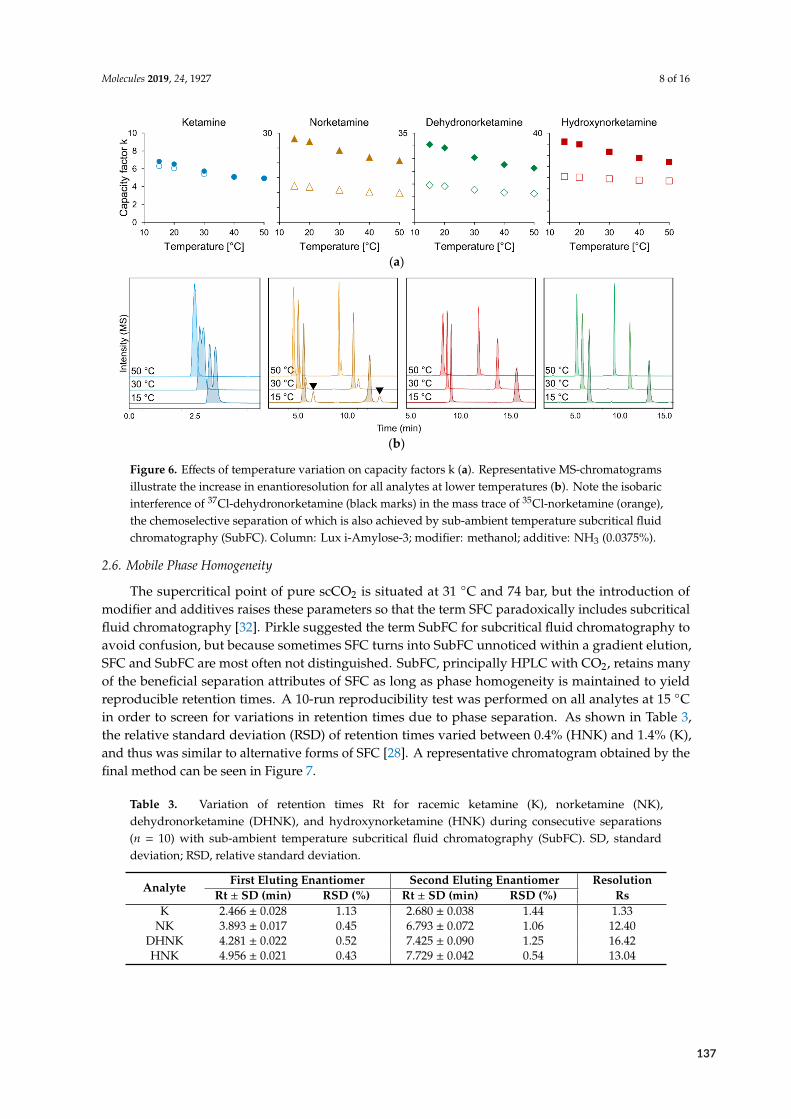
Molecules 2019, 24, 1927 8 of 16Molecules 2019, 24, x FOR PEER REVIEW 8 of 15
(a)
(b)
Figure 6. Effects of temperature variation on capacity factors k (a). Representative MS-chromatograms illustrate the increase in enantioresolution for all analytes at lower temperatures (b). Note the isobaric interference of 37Cl-dehydronorketamine (black marks) in the mass trace of 35Cl-norketamine (orange), the chemoselective separation of which is also achieved by sub-ambient temperature subcritical fluid chromatography (SubFC). Column: Lux i-Amylose-3; modifier: methanol; additive: NH3 (0.0375%).
2.6. Mobile Phase Homogeneity
The supercritical point of pure scCO2 is situated at 31 °C and 74 bar, but the introduction of modifier and additives raises these parameters so that the term SFC paradoxically includes subcritical fluid chromatography [32]. Pirkle suggested the term SubFC for subcritical fluid chromatography to avoid confusion, but because sometimes SFC turns into SubFC unnoticed within a gradient elution, SFC and SubFC are most often not distinguished. SubFC, principally HPLC with CO2, retains many of the beneficial separation attributes of SFC as long as phase homogeneity is maintained to yield reproducible retention times. A 10-run reproducibility test was performed on all analytes at 15 °C in order to screen for variations in retention times due to phase separation. As shown in Table 3, the relative standard deviation (RSD) of retention times varied between 0.4% (HNK) and 1.4% (K), and thus was similar to alternative forms of SFC [28]. A representative chromatogram obtained by the final method can be seen in Figure 7.
Table 3. Variation of retention times Rt for racemic ketamine (K), norketamine (NK), dehydronorketamine (DHNK), and hydroxynorketamine (HNK) during consecutive separations (n = 10) with sub-ambient temperature subcritical fluid chromatography (SubFC). SD, standard deviation; RSD, relative standard deviation.
Analyte First Eluting Enantiomer Second Eluting Enantiomer Resolution
Rt ± SD (min) RSD (%) Rt ± SD (min) RSD (%) Rs
K 2.466 ± 0.028 1.13 2.680 ± 0.038 1.44 1.33
NK 3.893 ± 0.017 0.45 6.793 ± 0.072 1.06 12.40
DHNK 4.281 ± 0.022 0.52 7.425 ± 0.090 1.25 16.42
HNK 4.956 ± 0.021 0.43 7.729 ± 0.042 0.54 13.04
Figure 6. Effects of temperature variation on capacity factors k (a). Representative MS-chromatogramsillustrate the increase in enantioresolution for all analytes at lower temperatures (b). Note the isobaricinterference of 37Cl-dehydronorketamine (black marks) in the mass trace of 35Cl-norketamine (orange),the chemoselective separation of which is also achieved by sub-ambient temperature subcritical fluidchromatography (SubFC). Column: Lux i-Amylose-3; modifier: methanol; additive: NH3 (0.0375%).
2.6. Mobile Phase Homogeneity
The supercritical point of pure scCO2 is situated at 31 ◦C and 74 bar, but the introduction ofmodifier and additives raises these parameters so that the term SFC paradoxically includes subcriticalfluid chromatography [32]. Pirkle suggested the term SubFC for subcritical fluid chromatography toavoid confusion, but because sometimes SFC turns into SubFC unnoticed within a gradient elution,SFC and SubFC are most often not distinguished. SubFC, principally HPLC with CO2, retains manyof the beneficial separation attributes of SFC as long as phase homogeneity is maintained to yieldreproducible retention times. A 10-run reproducibility test was performed on all analytes at 15 ◦Cin order to screen for variations in retention times due to phase separation. As shown in Table 3,the relative standard deviation (RSD) of retention times varied between 0.4% (HNK) and 1.4% (K),and thus was similar to alternative forms of SFC [28]. A representative chromatogram obtained by thefinal method can be seen in Figure 7.
Table 3. Variation of retention times Rt for racemic ketamine (K), norketamine (NK),dehydronorketamine (DHNK), and hydroxynorketamine (HNK) during consecutive separations(n = 10) with sub-ambient temperature subcritical fluid chromatography (SubFC). SD, standarddeviation; RSD, relative standard deviation.
First Eluting Enantiomer Second Eluting Enantiomer ResolutionAnalyte
Rt ± SD (min) RSD (%) Rt ± SD (min) RSD (%) RsK 2.466 ± 0.028 1.13 2.680 ± 0.038 1.44 1.33
NK 3.893 ± 0.017 0.45 6.793 ± 0.072 1.06 12.40DHNK 4.281 ± 0.022 0.52 7.425 ± 0.090 1.25 16.42HNK 4.956 ± 0.021 0.43 7.729 ± 0.042 0.54 13.04
137
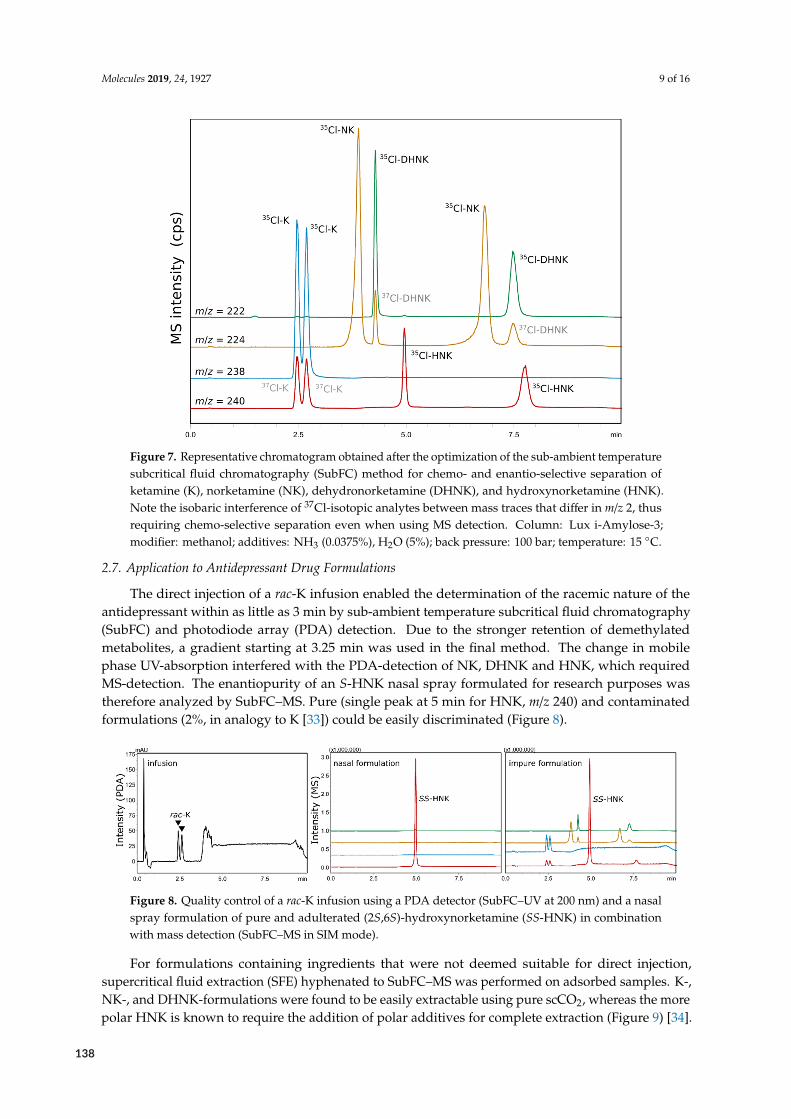
Molecules 2019, 24, 1927 9 of 16
Molecules 2019, 24, x FOR PEER REVIEW 9 of 15
Figure 7. Representative chromatogram obtained after the optimization of the sub-ambient temperature subcritical fluid chromatography (SubFC) method for chemo- and enantio-selective separation of ketamine (K), norketamine (NK), dehydronorketamine (DHNK), and hydroxynorketamine (HNK). Note the isobaric interference of 37Cl-isotopic analytes between mass traces that differ in m/z 2, thus requiring chemo-selective separation even when using MS detection. Column: Lux i-Amylose-3; modifier: methanol; additives: NH3 (0.0375%), H2O (5%); back pressure: 100 bar; temperature: 15 °C.
2.7. Application to Antidepressant Drug Formulations
The direct injection of a rac-K infusion enabled the determination of the racemic nature of the antidepressant within as little as 3 min by sub-ambient temperature subcritical fluid chromatography (SubFC) and photodiode array (PDA) detection. Due to the stronger retention of demethylated metabolites, a gradient starting at 3.25 min was used in the final method. The change in mobile phase UV-absorption interfered with the PDA-detection of NK, DHNK and HNK, which required MS-detection. The enantiopurity of an S-HNK nasal spray formulated for research purposes was therefore analyzed by SubFC–MS. Pure (single peak at 5 min for HNK, m/z 240) and contaminated formulations (2%, in analogy to K [33]) could be easily discriminated (Figure 8).
Figure 8. Quality control of a rac-K infusion using a PDA detector (SubFC–UV at 200 nm) and a nasal spray formulation of pure and adulterated (2S,6S)-hydroxynorketamine (SS-HNK) in combination with mass detection (SubFC–MS in SIM mode).
For formulations containing ingredients that were not deemed suitable for direct injection, supercritical fluid extraction (SFE) hyphenated to SubFC–MS was performed on adsorbed samples.
Figure 7. Representative chromatogram obtained after the optimization of the sub-ambient temperaturesubcritical fluid chromatography (SubFC) method for chemo- and enantio-selective separation ofketamine (K), norketamine (NK), dehydronorketamine (DHNK), and hydroxynorketamine (HNK).Note the isobaric interference of 37Cl-isotopic analytes between mass traces that differ in m/z 2, thusrequiring chemo-selective separation even when using MS detection. Column: Lux i-Amylose-3;modifier: methanol; additives: NH3 (0.0375%), H2O (5%); back pressure: 100 bar; temperature: 15 ◦C.
2.7. Application to Antidepressant Drug Formulations
The direct injection of a rac-K infusion enabled the determination of the racemic nature of theantidepressant within as little as 3 min by sub-ambient temperature subcritical fluid chromatography(SubFC) and photodiode array (PDA) detection. Due to the stronger retention of demethylatedmetabolites, a gradient starting at 3.25 min was used in the final method. The change in mobilephase UV-absorption interfered with the PDA-detection of NK, DHNK and HNK, which requiredMS-detection. The enantiopurity of an S-HNK nasal spray formulated for research purposes wastherefore analyzed by SubFC–MS. Pure (single peak at 5 min for HNK, m/z 240) and contaminatedformulations (2%, in analogy to K [33]) could be easily discriminated (Figure 8).
Molecules 2019, 24, x FOR PEER REVIEW 9 of 15
Figure 7. Representative chromatogram obtained after the optimization of the sub-ambient temperature subcritical fluid chromatography (SubFC) method for chemo- and enantio-selective separation of ketamine (K), norketamine (NK), dehydronorketamine (DHNK), and hydroxynorketamine (HNK). Note the isobaric interference of 37Cl-isotopic analytes between mass traces that differ in m/z 2, thus requiring chemo-selective separation even when using MS detection. Column: Lux i-Amylose-3; modifier: methanol; additives: NH3 (0.0375%), H2O (5%); back pressure: 100 bar; temperature: 15 °C.
2.7. Application to Antidepressant Drug Formulations
The direct injection of a rac-K infusion enabled the determination of the racemic nature of the antidepressant within as little as 3 min by sub-ambient temperature subcritical fluid chromatography (SubFC) and photodiode array (PDA) detection. Due to the stronger retention of demethylated metabolites, a gradient starting at 3.25 min was used in the final method. The change in mobile phase UV-absorption interfered with the PDA-detection of NK, DHNK and HNK, which required MS-detection. The enantiopurity of an S-HNK nasal spray formulated for research purposes was therefore analyzed by SubFC–MS. Pure (single peak at 5 min for HNK, m/z 240) and contaminated formulations (2%, in analogy to K [33]) could be easily discriminated (Figure 8).
Figure 8. Quality control of a rac-K infusion using a PDA detector (SubFC–UV at 200 nm) and a nasal spray formulation of pure and adulterated (2S,6S)-hydroxynorketamine (SS-HNK) in combination with mass detection (SubFC–MS in SIM mode).
For formulations containing ingredients that were not deemed suitable for direct injection, supercritical fluid extraction (SFE) hyphenated to SubFC–MS was performed on adsorbed samples.
Figure 8. Quality control of a rac-K infusion using a PDA detector (SubFC–UV at 200 nm) and a nasalspray formulation of pure and adulterated (2S,6S)-hydroxynorketamine (SS-HNK) in combinationwith mass detection (SubFC–MS in SIM mode).
For formulations containing ingredients that were not deemed suitable for direct injection,supercritical fluid extraction (SFE) hyphenated to SubFC–MS was performed on adsorbed samples. K-,NK-, and DHNK-formulations were found to be easily extractable using pure scCO2, whereas the morepolar HNK is known to require the addition of polar additives for complete extraction (Figure 9) [34].
138
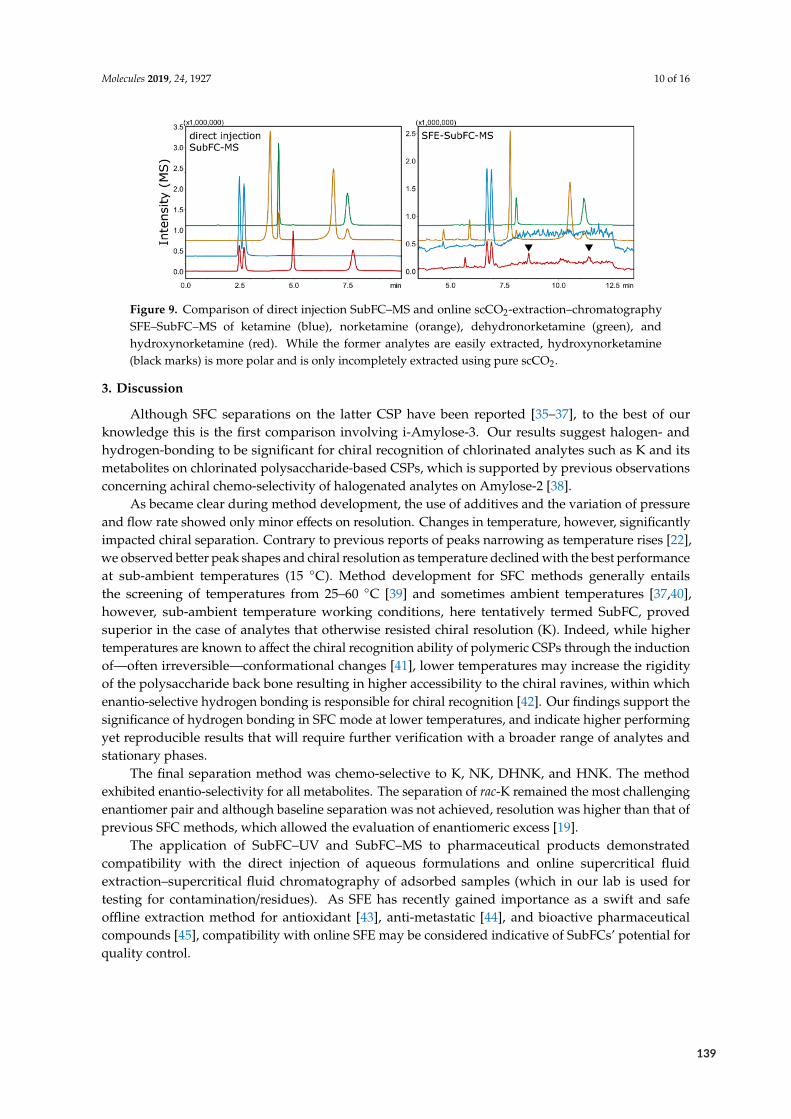
Molecules 2019, 24, 1927 10 of 16
Molecules 2019, 24, x FOR PEER REVIEW 10 of 15
K-, NK-, and DHNK-formulations were found to be easily extractable using pure scCO2, whereas the more polar HNK is known to require the addition of polar additives for complete extraction (Figure 9) [34].
Figure 9. Comparison of direct injection SubFC–MS and online scCO2-extraction–chromatography SFE–SubFC–MS of ketamine (blue), norketamine (orange), dehydronorketamine (green), and hydroxynorketamine (red). While the former analytes are easily extracted, hydroxynorketamine (black marks) is more polar and is only incompletely extracted using pure scCO2.
3. Discussion
Although SFC separations on the latter CSP have been reported [35–37], to the best of our knowledge this is the first comparison involving i-Amylose-3. Our results suggest halogen- and hydrogen-bonding to be significant for chiral recognition of chlorinated analytes such as K and its metabolites on chlorinated polysaccharide-based CSPs, which is supported by previous observations concerning achiral chemo-selectivity of halogenated analytes on Amylose-2 [38].
As became clear during method development, the use of additives and the variation of pressure and flow rate showed only minor effects on resolution. Changes in temperature, however, significantly impacted chiral separation. Contrary to previous reports of peaks narrowing as temperature rises [22], we observed better peak shapes and chiral resolution as temperature declined with the best performance at sub-ambient temperatures (15 °C). Method development for SFC methods generally entails the screening of temperatures from 25–60 °C [39] and sometimes ambient temperatures [37,40], however, sub-ambient temperature working conditions, here tentatively termed SubFC, proved superior in the case of analytes that otherwise resisted chiral resolution (K). Indeed, while higher temperatures are known to affect the chiral recognition ability of polymeric CSPs through the induction of – often irreversible – conformational changes [41], lower temperatures may increase the rigidity of the polysaccharide back bone resulting in higher accessibility to the chiral ravines, within which enantio-selective hydrogen bonding is responsible for chiral recognition [42]. Our findings support the significance of hydrogen bonding in SFC mode at lower temperatures, and indicate higher performing yet reproducible results that will require further verification with a broader range of analytes and stationary phases.
The final separation method was chemo-selective to K, NK, DHNK, and HNK. The method exhibited enantio-selectivity for all metabolites. The separation of rac-K remained the most challenging enantiomer pair and although baseline separation was not achieved, resolution was higher than that of previous SFC methods, which allowed the evaluation of enantiomeric excess [19].
The application of SubFC–UV and SubFC–MS to pharmaceutical products demonstrated compatibility with the direct injection of aqueous formulations and online supercritical fluid extraction–supercritical fluid chromatography of adsorbed samples (which in our lab is used for testing for contamination/residues). As SFE has recently gained importance as a swift and safe offline extraction method for antioxidant [43], anti-metastatic [44], and bioactive pharmaceutical compounds [45], compatibility with online SFE may be considered indicative of SubFCs’ potential for quality control.
Figure 9. Comparison of direct injection SubFC–MS and online scCO2-extraction–chromatographySFE–SubFC–MS of ketamine (blue), norketamine (orange), dehydronorketamine (green), andhydroxynorketamine (red). While the former analytes are easily extracted, hydroxynorketamine(black marks) is more polar and is only incompletely extracted using pure scCO2.
3. Discussion
Although SFC separations on the latter CSP have been reported [35–37], to the best of ourknowledge this is the first comparison involving i-Amylose-3. Our results suggest halogen- andhydrogen-bonding to be significant for chiral recognition of chlorinated analytes such as K and itsmetabolites on chlorinated polysaccharide-based CSPs, which is supported by previous observationsconcerning achiral chemo-selectivity of halogenated analytes on Amylose-2 [38].
As became clear during method development, the use of additives and the variation of pressureand flow rate showed only minor effects on resolution. Changes in temperature, however, significantlyimpacted chiral separation. Contrary to previous reports of peaks narrowing as temperature rises [22],we observed better peak shapes and chiral resolution as temperature declined with the best performanceat sub-ambient temperatures (15 ◦C). Method development for SFC methods generally entailsthe screening of temperatures from 25–60 ◦C [39] and sometimes ambient temperatures [37,40],however, sub-ambient temperature working conditions, here tentatively termed SubFC, provedsuperior in the case of analytes that otherwise resisted chiral resolution (K). Indeed, while highertemperatures are known to affect the chiral recognition ability of polymeric CSPs through the inductionof—often irreversible—conformational changes [41], lower temperatures may increase the rigidityof the polysaccharide back bone resulting in higher accessibility to the chiral ravines, within whichenantio-selective hydrogen bonding is responsible for chiral recognition [42]. Our findings support thesignificance of hydrogen bonding in SFC mode at lower temperatures, and indicate higher performingyet reproducible results that will require further verification with a broader range of analytes andstationary phases.
The final separation method was chemo-selective to K, NK, DHNK, and HNK. The methodexhibited enantio-selectivity for all metabolites. The separation of rac-K remained the most challengingenantiomer pair and although baseline separation was not achieved, resolution was higher than that ofprevious SFC methods, which allowed the evaluation of enantiomeric excess [19].
The application of SubFC–UV and SubFC–MS to pharmaceutical products demonstratedcompatibility with the direct injection of aqueous formulations and online supercritical fluidextraction–supercritical fluid chromatography of adsorbed samples (which in our lab is used fortesting for contamination/residues). As SFE has recently gained importance as a swift and safeoffline extraction method for antioxidant [43], anti-metastatic [44], and bioactive pharmaceuticalcompounds [45], compatibility with online SFE may be considered indicative of SubFCs’ potential forquality control.
139
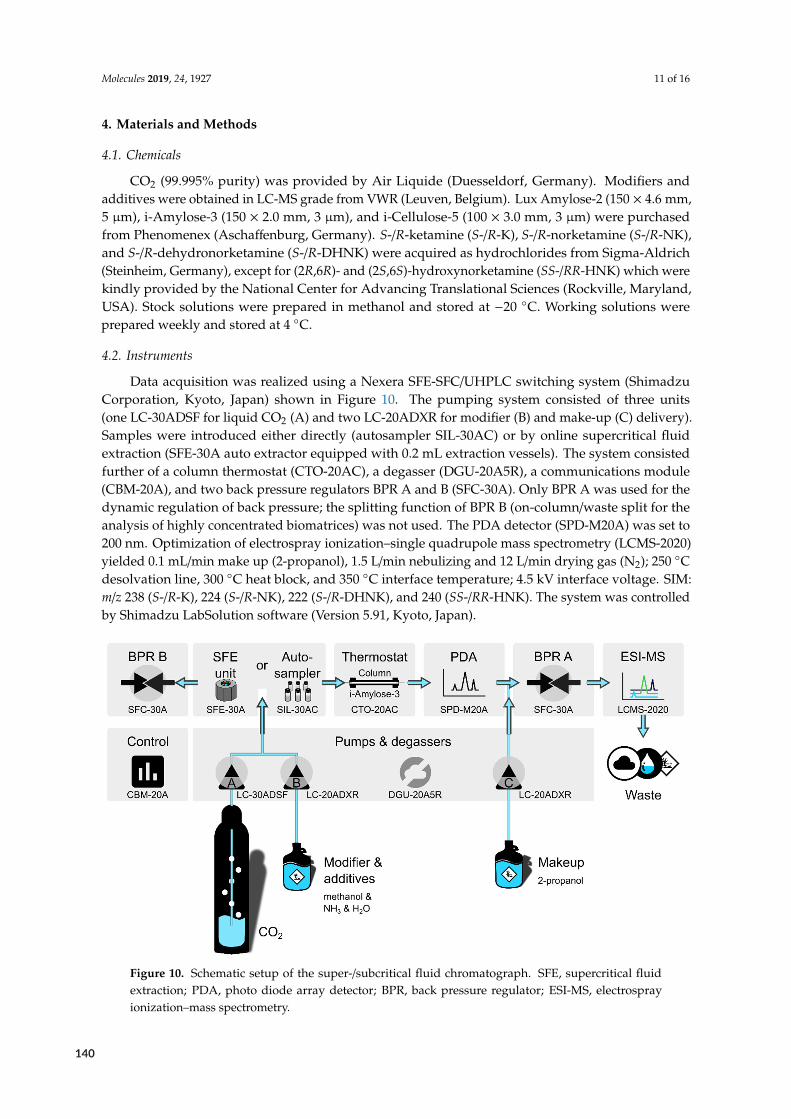
Molecules 2019, 24, 1927 11 of 16
4. Materials and Methods
4.1. Chemicals
CO2 (99.995% purity) was provided by Air Liquide (Duesseldorf, Germany). Modifiers andadditives were obtained in LC-MS grade from VWR (Leuven, Belgium). Lux Amylose-2 (150 × 4.6 mm,5 µm), i-Amylose-3 (150 × 2.0 mm, 3 µm), and i-Cellulose-5 (100 × 3.0 mm, 3 µm) were purchasedfrom Phenomenex (Aschaffenburg, Germany). S-/R-ketamine (S-/R-K), S-/R-norketamine (S-/R-NK),and S-/R-dehydronorketamine (S-/R-DHNK) were acquired as hydrochlorides from Sigma-Aldrich(Steinheim, Germany), except for (2R,6R)- and (2S,6S)-hydroxynorketamine (SS-/RR-HNK) which werekindly provided by the National Center for Advancing Translational Sciences (Rockville, Maryland,USA). Stock solutions were prepared in methanol and stored at −20 ◦C. Working solutions wereprepared weekly and stored at 4 ◦C.
4.2. Instruments
Data acquisition was realized using a Nexera SFE-SFC/UHPLC switching system (ShimadzuCorporation, Kyoto, Japan) shown in Figure 10. The pumping system consisted of three units(one LC-30ADSF for liquid CO2 (A) and two LC-20ADXR for modifier (B) and make-up (C) delivery).Samples were introduced either directly (autosampler SIL-30AC) or by online supercritical fluidextraction (SFE-30A auto extractor equipped with 0.2 mL extraction vessels). The system consistedfurther of a column thermostat (CTO-20AC), a degasser (DGU-20A5R), a communications module(CBM-20A), and two back pressure regulators BPR A and B (SFC-30A). Only BPR A was used for thedynamic regulation of back pressure; the splitting function of BPR B (on-column/waste split for theanalysis of highly concentrated biomatrices) was not used. The PDA detector (SPD-M20A) was set to200 nm. Optimization of electrospray ionization–single quadrupole mass spectrometry (LCMS-2020)yielded 0.1 mL/min make up (2-propanol), 1.5 L/min nebulizing and 12 L/min drying gas (N2); 250 ◦Cdesolvation line, 300 ◦C heat block, and 350 ◦C interface temperature; 4.5 kV interface voltage. SIM:m/z 238 (S-/R-K), 224 (S-/R-NK), 222 (S-/R-DHNK), and 240 (SS-/RR-HNK). The system was controlledby Shimadzu LabSolution software (Version 5.91, Kyoto, Japan).
Molecules 2019, 24, x FOR PEER REVIEW 11 of 15
4. Materials and Methods
4.1. Chemicals
CO2 (99.995% purity) was provided by Air Liquide (Duesseldorf, Germany). Modifiers and additives were obtained in LC-MS grade from VWR (Leuven, Belgium). Lux Amylose-2 (150 × 4.6 mm, 5 µm), i-Amylose-3 (150 × 2.0 mm, 3 µm), and i-Cellulose-5 (100 × 3.0 mm, 3 µm) were purchased from Phenomenex (Aschaffenburg, Germany). S-/R-ketamine (S-/R-K), S-/R-norketamine (S-/R-NK), and S-/R-dehydronorketamine (S-/R-DHNK) were acquired as hydrochlorides from Sigma-Aldrich (Steinheim, Germany), except for (2R,6R)- and (2S,6S)-hydroxynorketamine (SS-/RR-HNK) which were kindly provided by the National Center for Advancing Translational Sciences (Rockville, Maryland, USA). Stock solutions were prepared in methanol and stored at -20 °C. Working solutions were prepared weekly and stored at 4 °C.
4.2. Instruments
Data acquisition was realized using a Nexera SFE-SFC/UHPLC switching system (Shimadzu Corporation, Kyoto, Japan) shown in Figure 10. The pumping system consisted of three units (one LC-30ADSF for liquid CO2 (A) and two LC-20ADXR for modifier (B) and make-up (C) delivery). Samples were introduced either directly (autosampler SIL-30AC) or by online supercritical fluid extraction (SFE-30A auto extractor equipped with 0.2 mL extraction vessels). The system consisted further of a column thermostat (CTO-20AC), a degasser (DGU-20A5R), a communications module (CBM-20A), and two back pressure regulators BPR A and B (SFC-30A). Only BPR A was used for the dynamic regulation of back pressure; the splitting function of BPR B (on-column/waste split for the analysis of highly concentrated biomatrices) was not used. The PDA detector (SPD-M20A) was set to 200 nm. Optimization of electrospray ionization–single quadrupole mass spectrometry (LCMS-2020) yielded 0.1 mL/min make up (2-propanol), 1.5 L/min nebulizing and 12 L/min drying gas (N2); 250 °C desolvation line, 300 °C heat block, and 350 °C interface temperature; 4.5 kV interface voltage. SIM: m/z 238 (S-/R-K), 224 (S-/R-NK), 222 (S-/R-DHNK), and 240 (SS-/RR-HNK). The system was controlled by Shimadzu LabSolution software (Version 5.91, Kyoto, Japan).
Figure 10. Schematic setup of the super-/subcritical fluid chromatograph. SFE, supercritical fluid extraction; PDA, photo diode array detector; BPR, back pressure regulator; ESI-MS, electrospray ionization–mass spectrometry.
Figure 10. Schematic setup of the super-/subcritical fluid chromatograph. SFE, supercritical fluidextraction; PDA, photo diode array detector; BPR, back pressure regulator; ESI-MS, electrosprayionization–mass spectrometry.
140
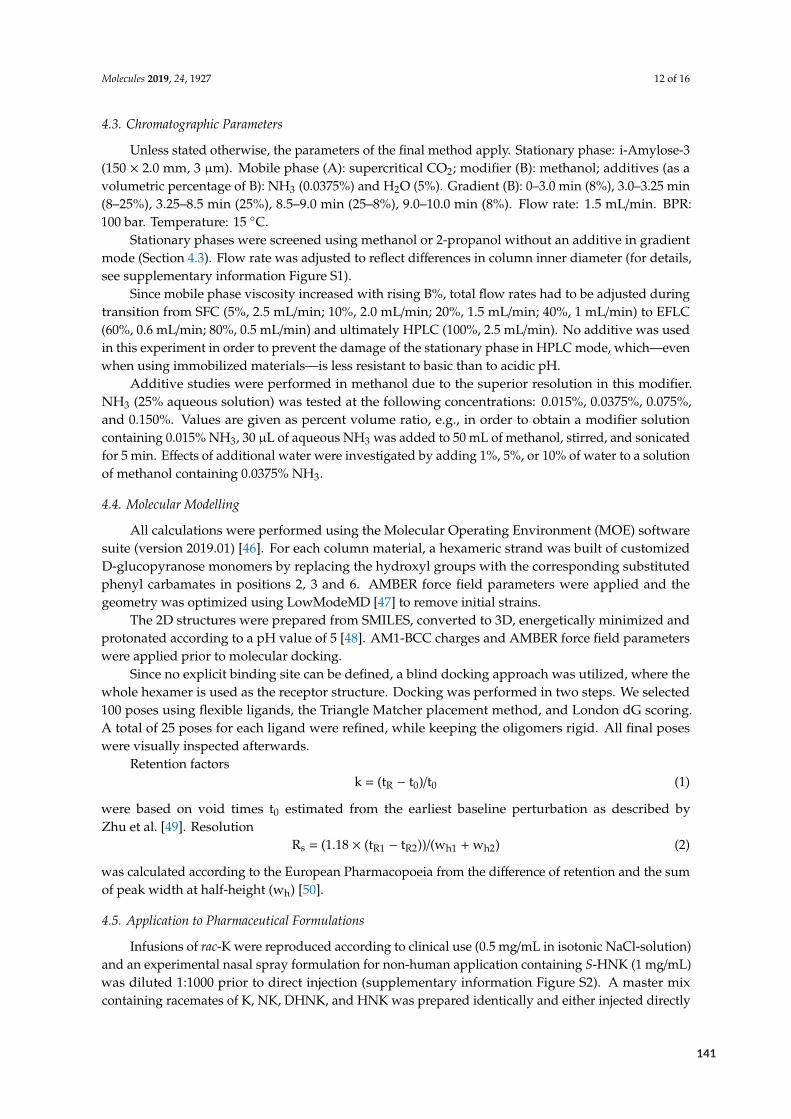
Molecules 2019, 24, 1927 12 of 16
4.3. Chromatographic Parameters
Unless stated otherwise, the parameters of the final method apply. Stationary phase: i-Amylose-3(150 × 2.0 mm, 3 µm). Mobile phase (A): supercritical CO2; modifier (B): methanol; additives (as avolumetric percentage of B): NH3 (0.0375%) and H2O (5%). Gradient (B): 0–3.0 min (8%), 3.0–3.25 min(8–25%), 3.25–8.5 min (25%), 8.5–9.0 min (25–8%), 9.0–10.0 min (8%). Flow rate: 1.5 mL/min. BPR:100 bar. Temperature: 15 ◦C.
Stationary phases were screened using methanol or 2-propanol without an additive in gradientmode (Section 4.3). Flow rate was adjusted to reflect differences in column inner diameter (for details,see supplementary information Figure S1).
Since mobile phase viscosity increased with rising B%, total flow rates had to be adjusted duringtransition from SFC (5%, 2.5 mL/min; 10%, 2.0 mL/min; 20%, 1.5 mL/min; 40%, 1 mL/min) to EFLC(60%, 0.6 mL/min; 80%, 0.5 mL/min) and ultimately HPLC (100%, 2.5 mL/min). No additive was usedin this experiment in order to prevent the damage of the stationary phase in HPLC mode, which—evenwhen using immobilized materials—is less resistant to basic than to acidic pH.
Additive studies were performed in methanol due to the superior resolution in this modifier.NH3 (25% aqueous solution) was tested at the following concentrations: 0.015%, 0.0375%, 0.075%,and 0.150%. Values are given as percent volume ratio, e.g., in order to obtain a modifier solutioncontaining 0.015% NH3, 30 µL of aqueous NH3 was added to 50 mL of methanol, stirred, and sonicatedfor 5 min. Effects of additional water were investigated by adding 1%, 5%, or 10% of water to a solutionof methanol containing 0.0375% NH3.
4.4. Molecular Modelling
All calculations were performed using the Molecular Operating Environment (MOE) softwaresuite (version 2019.01) [46]. For each column material, a hexameric strand was built of customizedD-glucopyranose monomers by replacing the hydroxyl groups with the corresponding substitutedphenyl carbamates in positions 2, 3 and 6. AMBER force field parameters were applied and thegeometry was optimized using LowModeMD [47] to remove initial strains.
The 2D structures were prepared from SMILES, converted to 3D, energetically minimized andprotonated according to a pH value of 5 [48]. AM1-BCC charges and AMBER force field parameterswere applied prior to molecular docking.
Since no explicit binding site can be defined, a blind docking approach was utilized, where thewhole hexamer is used as the receptor structure. Docking was performed in two steps. We selected100 poses using flexible ligands, the Triangle Matcher placement method, and London dG scoring.A total of 25 poses for each ligand were refined, while keeping the oligomers rigid. All final poseswere visually inspected afterwards.
Retention factorsk = (tR − t0)/t0 (1)
were based on void times t0 estimated from the earliest baseline perturbation as described byZhu et al. [49]. Resolution
Rs = (1.18 × (tR1 − tR2))/(wh1 + wh2) (2)
was calculated according to the European Pharmacopoeia from the difference of retention and the sumof peak width at half-height (wh) [50].
4.5. Application to Pharmaceutical Formulations
Infusions of rac-K were reproduced according to clinical use (0.5 mg/mL in isotonic NaCl-solution)and an experimental nasal spray formulation for non-human application containing S-HNK (1 mg/mL)was diluted 1:1000 prior to direct injection (supplementary information Figure S2). A master mixcontaining racemates of K, NK, DHNK, and HNK was prepared identically and either injected directly
141
Molecules 2019, 24, 1927 13 of 16
(for comparison) or adsorbed onto calcined SiO2/quartz (isolute® HM-N) and dried for 1 h at 40 ◦C.Supercritical fluid extraction was performed statically for 3.0 min and dynamically for 0.5 min withpure scCO2. The extract was directly introduced into the chromatographic system but was trappedat the column head, as elution did not proceed in the absence of a modifier. SubFC was performedas described above. Details of the extraction program are given in the supplementary information(Figure S3).
Supplementary Materials: The following are available online. Figure S1: System settings (column screening);Figure S2: System settings (SubFC); Figure S3: System settings (SFE- SubFC).
Author Contributions: Conceptualization, R.K.H. and S.K.; methodology, supervision and writing—originaldraft preparation, R.K.H.; investigation, R.K.H., F.P. and M.H.; software, formal analysis and data curation,L.S.; visualization, R.K.H. and L.S.; project administration, resources, funding acquisition, writing—review andediting, A.L.
Funding: The APC was funded by the DFG (German Research Foundation, 393148499) and the Open AccessPublication Fund of the University of Greifswald.
Acknowledgments: We thank Tzvetkov and Oswald for kindly providing standards of R- and S-norketamineand dehydronorketamine. The analytical standards for (2S,6S)-hydroxynorktamine (NCGC00373033) and(2R,6R)-hydroxynorketamine (NCGC00373033) were provided by the National Center for Advancing TranslationalSciences (NCATS), National Institutes of Health.
Conflicts of Interest: The authors declare no conflict of interest.
References
1. Ketamine Nasal Spray Medication for Treatment-Resistant Depression. Available online:https://www.fda.gov/news-events/press-announcements/fda-approves-new-nasal-spray-medication-treatment-resistant-depression-available-only-certified (accessed on 30 April 2019).
2. Zanos, P.; Moaddel, R.; Morris, P.J.; Riggs, L.M.; Highland, J.N.; Georgiou, P.; Pereira, E.F.R.; Albuquerque, E.X.;Thomas, C.J.; Zarate, C.A.; et al. Ketamine and Ketamine Metabolite Pharmacology: Insights into TherapeuticMechanisms. Pharmacol. Rev. 2018, 70, 621–660. [CrossRef] [PubMed]
3. Grunebaum, M.F.; Ellis, S.P.; Keilp, J.G.; Moitra, V.K.; Cooper, T.B.; Marver, J.E.; Burke, A.K.; Milak, M.S.;Sublette, M.E.; Oquendo, M.A.; et al. Ketamine versus midazolam in bipolar depression with suicidalthoughts: A pilot midazolam-controlled randomized clinical trial. Bipolar Disord. 2017, 19, 176–183.[CrossRef] [PubMed]
4. Aust, S.; Gärtner, M.; Basso, L.; Otte, C.; Wingenfeld, K.; Chae, W.R.; Heuser-Collier, I.; Regen, F.; Cosma, N.C.;van Hall, F.; et al. Anxiety during ketamine infusions is associated with negative treatment responses inmajor depressive disorder. Eur. Neuropsychopharmacol. 2019, 29, 529–538. [CrossRef]
5. Cusin, C. Ketamine as a Rapid Antidepressant. In The Massachusetts General Hospital Guide to Depression;Shapero, B.G., Mischoulon, D., Cusin, C., Eds.; Springer International Publishing: Cham, New York City, NY,USA, 2019; pp. 139–145, ISBN 978-3-319-97240-4.
6. Keiser, M.; Hasan, M.; Oswald, S. Affinity of Ketamine to Clinically Relevant Transporters. Mol. Pharm. 2018,15, 326–331. [CrossRef]
7. Naidoo, V.; Mdanda, S.; Ntshangase, S.; Naicker, T.; Kruger, H.G.; Govender, T.; Naidoo, P.; Baijnath, S. Brainpenetration of ketamine: Intranasal delivery vs. parenteral routes of administraion. J. Psychiatr. Res. 2019,112, 7–11. [CrossRef]
8. Li, W.; Liu, J.; Fan, M.; Li, Z.; Chen, Y.; Zhang, G.; Huang, Z.; Zhang, L. Scale-Up Synthesis and Identificationof GLYX-13, a NMDAR Glycine-Site Partial Agonist for the Treatment of Major Depressive Disorder. Molecules2018, 23, 996. [CrossRef] [PubMed]
9. Suzuki, K.; Nosyreva, E.; Hunt, K.W.; Kavalali, E.T.; Monteggia, L.M. Effects of a ketamine metabolite onsynaptic NMDAR function. Nature 2017, 546, E1–E3. [CrossRef]
10. Zanos, P.; Moaddel, R.; Morris, P.J.; Georgiou, P.; Fischell, J.; Elmer, G.I.; Alkondon, M.; Yuan, P.; Pribut, H.J.;Singh, N.S.; et al. NMDAR inhibition-independent antidepressant actions of ketamine metabolites. Nature2016, 533, 481–486. [CrossRef] [PubMed]
142
Molecules 2019, 24, 1927 14 of 16
11. Yang, Y.; Cui, Y.; Sang, K.; Dong, Y.; Ni, Z.; Ma, S.; Hu, H. Ketamine blocks bursting in the lateral habenula torapidly relieve depression. Nature 2018, 554, 317–322. [CrossRef]
12. Yang, C.; Kobayashi, S.; Nakao, K.; Dong, C.; Han, M.; Qu, Y.; Ren, Q.; Zhang, J.; Ma, M.; Toki, H.; et al.AMPA Receptor Activation–Independent Antidepressant Actions of Ketamine Metabolite (S)-Norketamine.Biol. Psychiatry 2018, 84, 591–600. [CrossRef]
13. Pham, T.H.; Gardier, A.M. Fast-acting antidepressant activity of ketamine: highlights on brain serotonin,glutamate, and GABA neurotransmission in preclinical studies. Pharmacol. Ther. 2019. [CrossRef] [PubMed]
14. Lumsden, E.W.; Troppoli, T.A.; Myers, S.J.; Zanos, P.; Aracava, Y.; Kehr, J.; Lovett, J.; Kim, S.;Wang, F.-H.; Schmidt, S.; et al. Antidepressant-relevant concentrations of the ketamine metabolite(2R,6R)-hydroxynorketamine do not block NMDA receptor function. Proc. Natl. Acad. Sci. USA2019, 116, 5160–5169. [CrossRef] [PubMed]
15. Fukumoto, K.; Fogaça, M.V.; Liu, R.-J.; Duman, C.; Kato, T.; Li, X.-Y.; Duman, R.S.Activity-dependent brain-derived neurotrophic factor signaling is required for the antidepressant actions of(2R,6R)-hydroxynorketamine. Proc. Natl. Acad. Sci. USA 2019, 116, 297–302. [CrossRef]
16. Hicks, M.B.; Farrell, W.; Aurigemma, C.; Lehmann, L.; Weisel, L.; Nadeau, K.; Lee, H.; Moraff, C.; Wong, M.;Huang, Y.; et al. Making the move towards modernized greener separations: introduction of the analyticalmethod greenness score (AMGS) calculator. Green Chem. 2019, 21, 1816–1826. [CrossRef]
17. Rossi, D.; Tarantino, M.; Rossino, G.; Rui, M.; Juza, M.; Collina, S. Approaches for multi-gram scale isolationof enantiomers for drug discovery. Expert Opin. Drug Discov. 2017, 12, 1253–1269. [CrossRef]
18. Pilarová, V.; Plachká, K.; Khalikova, M.A.; Svec, F.; Nováková, L. Recent developments in supercritical fluidchromatography—Mass spectrometry: Is it a viable option for analysis of complex samples? Trends Anal. Chem.2019, 112, 212–225. [CrossRef]
19. Fassauer, G.M.; Hofstetter, R.; Hasan, M.; Oswald, S.; Modeß, C.; Siegmund, W.; Link, A. Ketaminemetabolites with antidepressant effects: Fast, economical, and eco-friendly enantioselective separation basedon supercritical-fluid chromatography (SFC) and single quadrupole MS detection. J. Pharm. Biomed. Anal.2017, 146, 410–419. [CrossRef] [PubMed]
20. Hasan, M.; Hofstetter, R.; Fassauer, G.M.; Link, A.; Siegmund, W.; Oswald, S. Quantitative chiral and achiraldetermination of ketamine and its metabolites by LC–MS/MS in human serum, urine and fecal samples.J. Pharm. Biomed. Anal. 2017, 139, 87–97. [CrossRef] [PubMed]
21. Teixeira, J.; Tiritan, M.E.; Pinto, M.M.M.; Fernandes, C. Chiral Stationary Phases for Liquid Chromatography:Recent Developments. Molecules 2019, 24, 865. [CrossRef]
22. Chen, L.; Dean, B.; Liang, X. Evaluation of polysaccharide-based chiral stationary phases in modernSFC–MS/MS for enantioselective bioanalysis. Bioanalysis 2019, 11, 251–266. [CrossRef] [PubMed]
23. Peluso, P.; Dessì, A.; Dallocchio, R.; Mamane, V.; Cossu, S. Recent studies of docking and molecular dynamicssimulation for liquid-phase enantioseparations. Electrophoresis 2019, 0, 1–16. [CrossRef] [PubMed]
24. Tarafder, A. Metamorphosis of supercritical fluid chromatography to SFC: An Overview. Trends Anal. Chem.2016, 81, 3–10. [CrossRef]
25. Otsubo, M.; Motono, T.; Kitagawa, S.; Ohtani, H. Effect of Column Structure on Separation Efficiency inLow-Temperature HPLC Using Pure Liquid Carbon Dioxide as the Mobile Phase. Chromatography 2017,38, 31–37. [CrossRef]
26. Bennett, R.; Biba, M.; Liu, J.; Haidar Ahmad, I.A.; Hicks, M.B.; Regalado, E.L. Enhanced fluidity liquidchromatography: A guide to scaling up from analytical to preparative separations. J. Chromatogr. A 2019,1595, 190–198. [CrossRef] [PubMed]
27. Bennett, R.; Olesik, S.V. Enhanced fluidity liquid chromatography of inulin fructans using ternary solventstrength and selectivity gradients. Anal. Chim. Acta 2018, 999, 161–168. [CrossRef] [PubMed]
28. Bennett, R.; Olesik, S.V. Protein separations using enhanced-fluidity liquid chromatography. J. Chromatogr. A2017, 1523, 257–264. [CrossRef] [PubMed]
29. Khater, S.; Lozac’h, M.-A.; Adam, I.; Francotte, E.; West, C. Comparison of liquid and supercritical fluidchromatography mobile phases for enantioselective separations on polysaccharide stationary phases.J. Chromatogr. A 2016, 1467, 463–472. [CrossRef]
143
Molecules 2019, 24, 1927 15 of 16
30. West, C.; Konjaria, M.-L.; Shashviashvili, N.; Lemasson, E.; Bonnet, P.; Kakava, R.; Volonterio, A.;Chankvetadze, B. Enantioseparation of novel chiral sulfoxides on chlorinated polysaccharide stationaryphases in supercritical fluid chromatography. J. Chromatogr. A 2017, 1499, 174–182. [CrossRef]
31. Pirkle, W.H.; Wolf, C. Enantioseparations by subcritical fluid chromatography at cryogenic temperatures.J. Chromatogr. A 1997, 785, 173–178.
32. Tyskiewicz, K.; Gieysztor, R.; Maziarczyk, I.; Hodurek, P.; Rój, E.; Skalicka-Wozniak, K. Supercritical FluidChromatography with Photodiode Array Detection in the Determination of Fat-Soluble Vitamins in HempSeed Oil and Waste Fish Oil. Molecules 2018, 23, 1131. [CrossRef]
33. Esketamine hydrochloride. In European Pharmacopoeia 9.3; EDQM: Strasbourg, France, 2017; pp. 4895–4896.34. Hofstetter, R.; Fassauer, G.M.; Link, A. Supercritical fluid extraction (SFE) of ketamine metabolites from dried
urine and on-line quantification by supercritical fluid chromatography and single mass detection (on-lineSFE–SFC–MS). J. Chromatogr. B 2018, 1076, 77–83. [CrossRef]
35. Dascalu, A.-E.; Ghinet, A.; Billamboz, M.; Lipka, E. Performance comparison of chlorinated chiralstationary phases in supercritical fluid chromatography for separation of selected pyrrolidone derivatives.J. Pharm. Anal. 2019. [CrossRef]
36. Lipka, E.; Dascalu, A.-E.; Messara, Y.; Tsutsqiridze, E.; Farkas, T.; Chankvetadze, B. Separation of enantiomersof native amino acids with polysaccharide-based chiral columns in supercritical fluid chromatography.J. Chromatogr. A 2019, 1585, 207–212. [CrossRef]
37. Orosz, T.; Bajtai, A.; Minh Le, T.; Tanács, D.; Szakonyi, Z.; Fülöp, F.; Péter, A.; Ilisz, I. Chiral high-performanceliquid and supercritical fluid chromatographic enantioseparations of limonene-based bicyclic aminoalcoholsand aminodiols on polysaccharide-based chiral stationary phases. Biomed. Chromatogr. 2019, 33, e4517.[CrossRef]
38. Hofstetter, R.K.; Hasan, M.; Fassauer, G.M.; Bock, C.; Surur, A.S.; Behnisch, S.; Grathwol, C.W.; Potlitz, F.;Oergel, T.; Siegmund, W.; et al. Simultaneous quantification of acidic and basic flupirtine metabolites bysupercritical fluid chromatography according to European Medicines Agency validation. J. Chromatogr. A2019. (In press) [CrossRef]
39. Harps, L.C.; Joseph, J.F.; Parr, M.K. SFC for chiral separations in bioanalysis. J. Pharm. Biomed. Anal. 2019,162, 47–59. [CrossRef] [PubMed]
40. Kadkhodaei, K.; Forcher, L.; Schmid, M.G. Separation of enantiomers of new psychoactive substances byhigh-performance liquid chromatography. J. Sep. Sci. 2018, 41, 1274–1286. [CrossRef] [PubMed]
41. Ikai, T.; Okamoto, Y. Structure Control of Polysaccharide Derivatives for Efficient Separation of Enantiomersby Chromatography. Chem. Rev. 2009, 109, 6077–6101. [CrossRef]
42. Matarashvili, I.; Ghughunishvili, D.; Chankvetadze, L.; Takaishvili, N.; Khatiashvili, T.; Tsintsadze, M.;Farkas, T.; Bezhan, F. Separation of enantiomers of chiral weak acids with polysaccharide-based chiral columnsand aqueous-organic mobile phases in high-performance liquid chromatography: Typical reversed-phasebehavior? J. Chromatogr. A 2017, 1483, 86–92. [CrossRef] [PubMed]
43. Wang, C.; Duan, Z.; Fan, L.; Li, J. Supercritical CO2 Fluid Extraction of Elaeagnus mollis Diels Seed Oil andIts Antioxidant Ability. Molecules 2019, 24, 911. [CrossRef]
44. Wang, H.-L.; Chang, J.-C.; Fang, L.-W.; Hsu, H.-F.; Lee, L.-C.; Yang, J.-F.; Liang, M.-T.; Hsiao, P.-C.;Wang, C.-P.; Wang, S.-W.; et al. Bulnesia sarmientoi Supercritical Fluid Extract Exhibits Necroptotic Effectsand Anti-Metastatic Activity on Lung Cancer Cells. Molecules 2018, 23, 3304. [CrossRef]
45. Molino, A.; Larocca, V.; Di Sanzo, G.; Martino, M.; Casella, P.; Marino, T.; Karatza, D.; Musmarra, D. Extractionof Bioactive Compounds Using Supercritical Carbon Dioxide. Molecules 2019, 24, 782. [CrossRef] [PubMed]
46. Molecular Operating Environment (MOE) Software Suite; Version 2019.01; Chemical Computing Group, ULC:Montreal, QC, Canada, 2019.
47. Labute, P. LowModeMD - Implicit low-mode velocity filtering applied to conformational search of macrocyclesand protein loops. J. Chem. Inf. Model. 2010, 50, 792–800. [CrossRef] [PubMed]
48. West, C.; Melin, J.; Ansouri, H.; Mengue Metogo, M. Unravelling the effects of mobile phase additives insupercritical fluid chromatography. Part I: Polarity and acidity of the mobile phase. J. Chromatogr. A 2017,1492, 136–143. [CrossRef] [PubMed]
144
Molecules 2019, 24, 1927 16 of 16
49. Zhu, B.; Zhao, F.; Yu, J.; Wang, Z.; Song, Y.; Li, Q. Chiral separation and a molecular modeling study of eightazole antifungals on the cellulose tris(3,5-dichlorophenylcarbamate) chiral stationary phase. New J. Chem.2018, 42, 13421–13429. [CrossRef]
50. Chromatographic Separation Techniques. In European Pharmacopoeia 9.8; EDQM: Strasbourg, France, 2019;pp. 4286–4293.
Sample Availability: Samples of the compounds are not available from the authors.
© 2019 by the authors. Licensee MDPI, Basel, Switzerland. This article is an open accessarticle distributed under the terms and conditions of the Creative Commons Attribution(CC BY) license (http://creativecommons.org/licenses/by/4.0/).
145
Part 4 Publications
Paper X
Simultaneous quantification of acidic and basic flupirtine metabolites by supercriti‐cal fluid chromatography according to European Medicines Agency validation
Authors Robert K. Hofstetter, Mahmoud Hasan, Georg M. Fassauer, Christian Bock, Abdrrah-man S. Surur, Steven Behnisch, Christoph W. Grathwol, Felix Potlitz, Tobias Oergel, Werner Sieg-mund, and Andreas Link
Journal J. Pharm. Biomed. Anal. 146 (2017): 410-419.
Analytical content Switching to LLE-SFC-MS, this paper describes a single method for the chiralquantification of the same antidepressant metabolites but within a shorter time frame (15 minutes)and relying on a financially less demanding detection method (single quadrupole MS). The finalmethod was validated according to international guidelines – which remains the exception in bio-analytical SFC.
Contributions
Robert K. Hofstetter Supervision, validation, writing (original draft)MahmoudHasan Investigation (pilot study)Georg M. Fassauer Writing (review and editing)Christian Bock Investigation (Synthesis)Abdrrahman S. Surur Investigation (Synthesis)Steven Behnisch Data curationChristophW. Grathwol Investigation (Synthesis)Felix Potlitz ValidationTobias Oergel InvestigationWerner Siegmund Investigation (pilot study)Andreas Link Project administration, resources, supervision, writing (review and
editing)
Robert K. Hofstetter Andreas Link
(signature) (signature)
146
Journal of Chromatography A, 1603 (2019) 338–347
Contents lists available at ScienceDirect
Journal of Chromatography A
jo ur nal ho me pag e: www.elsev ier .com/ locate /chroma
Simultaneous quantification of acidic and basic flupirtine metabolitesby supercritical fluid chromatography according to EuropeanMedicines Agency validation
Robert K. Hofstettera, Mahmoud Hasanb, Georg M. Fassauera, Christian Bocka,Abdrrahman S. Surura, Steven Behnischa, Christoph W. Grathwola, Felix Potlitza,Tobias Oergela, Werner Siegmundb, Andreas Linka,∗
a Institute of Pharmacy, Pharmaceutical and Medicinal Chemistry, University of Greifswald, Greifswald, Germanyb Department of Clinical Pharmacology, Center of Drug Absorption and Transport (C DAT), University of Greifswald, Greifswald, Germany
a r t i c l e i n f o
Article history:Received 22 February 2019Received in revised form 15 April 2019Accepted 24 April 2019Available online 25 April 2019
Keywords:Supercritical fluid chromatographyValidationFlupirtineMetabolismHalogen bondsGreen chemistry
a b s t r a c t
Supercritical fluid chromatography (SFC) holds the potential to become an orthogonal method toHPLC/UHPLC in xenobiotic metabolism studies, due to its outstanding capacity to simultaneously sepa-rate highly similar (as HPLC) and physicochemically different analytes (problematic using HPLC). Paucityof guideline-conform validation, however, has been a major obstacle to clinical application of SFC, evenin cases where biotransformation yields chemically dissimilar metabolites that require more than oneHPLC method for comprehensive analysis. Here, a method based on supercritical fluid chromatographycoupled to single quadrupole MS detection was developed to simultaneously quantify the divisive anal-gesic flupirtine and its acidic and basic metabolites, represented by 4-fluorohippuric acid (4-FHA) and theactive metabolite D-13223 respectively, using custom-made synthetic internal standards. Experimentaldata on the fundamental retention mechanisms under supercritical conditions, indicating the impor-tance of halogen and �-�-bonding for specific retention on polysaccharide-based stationary-phases, isdiscussed. Compared to previous HPLC methods, the novel method offers higher versatility in terms of thetarget metabolite range (addressing both acidic and basic metabolites within a singular method), fasteranalysis (7.5 min), and compliance with green chemistry principles. Validation was performed accord-ing to EMA criteria on bioanalytical method validation, demonstrating selectivity, carry-over, calibrationcurve parameters (LLOQ, range, and linearity), within- and between-run accuracy and precision, dilu-tion integrity, matrix effect and stability. For proof-of-concept, the SFC method was applied to clinicalsamples of human urine obtained after single intravenous (100 mg), single oral (100 mg), and repeatedoral administration (400 mg). Flupirtine, D-13223, and 4-FHA could be quantified, shedding light on theextent of oxidative flupirtine metabolism in humans in the context of the unresolved biotoxification thathas led to the withdrawal of specific neuronal KV7 openers.
© 2019 Elsevier B.V. All rights reserved.
1. Introduction
Counterintuitively, simultaneous quantification of lipophilicprecursor drug substances and their hydrophilic metabolites can bechallenging, even though separation of dissimilar analytes appearsstraightforward. The reason being that analyte polarity range inHPLC, the most commonly employed chromatographic method
∗ Corresponding author at: Pharmaceutical and Medicinal Chemistry, Institute ofPharmacy, Friedrich-Ludwig-Jahn-Str. 17, D-17489 Greifswald, Germany.
E-mail address: [email protected] (A. Link).
in metabolism studies, is limited by mutually incompatible elu-tion modes defined by the choice of mobile and stationary phase,e.g. reversed-phase (RP), normal-phase (NP), hydrophilic interac-tion chromatography (HILIC), ion-exchange chromatography (IEC).Although RP spans the widest polarity range among HPLC elu-tion modes, simultaneously addressing polar analytes may requiresophisticated 2D techniques or the transition from one elutionmode to another (along with time-consuming equilibration peri-ods) in order to prevent the risk of methodology-related blind spots[1]. Miscibility of supercritical carbon dioxide (scCO2) and conven-tional solvents (polar modifiers such as methanol, acetonitrile, oreven water [2]) may make SFC coupled to UV or MS detection [3,4]
https://doi.org/10.1016/j.chroma.2019.04.0670021-9673/© 2019 Elsevier B.V. All rights reserved.
147
R.K. Hofstetter et al. / J. Chromatogr. A 1603 (2019) 338–347 339
a fast, green, and orthogonal addition to the armory of separationtechniques in xenobiotic metabolism studies and even targetedmetabolomics [5] that may be of particular use for spanning morethan one HPLC elution mode: Taguchi et al. demonstrated the utilityof SFC in cases of extreme polarity differences, separating 17 fat-/water-soluble vitamins (logP-range from −2.11 to 10.12) within aslittle as 4 min [6]. In comparison, Lämmerhofer et al. approached asimilar mixture of vitamins by developing an equally versatile but2D HPLC method (HILIC × RP) [7]. Sen et al. extended the applica-tion range of SFC further into domains traditionally reserved forHILIC when phenotyping metabolites as hydrophilic as logP = −7[8]
However, robust SFC instrumentation containing cooled pumpheads and electronically controlled back pressure regulators (BPR)has been realized only recently [9]. Thus, even though chiral andpreparative SFC applications in the pharmaceutical and biomedi-cal sector [10–13] have raised academic and industrial awareness[14], the number of comprehensively validated methods is still farfrom HPLC, leaving behind doubts regarding practical applicabilityand robustness of modern SFC [15]. We seek to address the gapbetween SFC’s claims and perceived utility by developing, validat-ing and clinically applying a quantitative bioanalytical method forthe analgesic flupirtine.
The triaminopyridine carbamate flupirtine is substrate toesterases, N-acetyltransferases (NAT), glucuronosyltransferases(UGT), glutathione S-transferases (GST), cytochromal oxidation(CYP450), and glycine N-acyltransferases (GLYAT) [16]. Althoughthe utility of SFC in regards to logD range has been qualitativelydemonstrated [6,8], quantitative aspects have not been addressed,nor did previous reports focus on analyte pKa-range, a crucialparameter in determining ionic interactions with the station-ary phase [17]. Previous in vivo studies of flupirtine metabolismutilized RP-HPLC coupled with fluorescence [18] or tandemmass (MS/MS) detection [19–21] and targeted analytes retain-ing flupirtine’s basic triaminopyridine-moiety such as the activemetabolite D-13223. To the best of our knowledge, reports of acidicmetabolites in humans required separate analytical methods (formercapturic acid derivatives M-424 and M-466) [16,22] or entailedradioactive labelling (inclusion of 4-fluorohippuric acid, 4-FHA)[23].
Herein we report the development of a versatile, time-savingand eco-friendly method based on SFC-MS capable of simulta-neously quantifying flupirtine along with acidic (represented by4-FHA; pKa = 3.17) and basic biotransformation products (D-13223;pKa (corresponding acid) = 7.59) from human urine. Syntheticaccess to methylated flupirtine (AS77) and difluorinated hip-puric acid (3,4-FHA) offers an alternative to deuterated standards.Method development gives detailed information on the influencesof stationary phase materials, mobile phase composition, columntemperature, and injection solvent. Validation is performed accord-ing to the guideline on bioanalytical method validation laid out bythe European Medicines Agency (EMA) [24]. For proof-of-concept,the novel method was applied to clinical samples obtained from apharmacokinetic study in healthy volunteers.
In the context of epidemic opioid abuse [25] and chronic under-treatment of pain [26], KV7-modulators such as flupirtine areattractive alternatives to non-steroidal anti-inflammatory drugs(NSAIDs) since they are not limited by respiratory depression orgastrointestinal bleeding [27,28]. However, unresolved flupirtineinduced liver injury (FILI) due to an as of yet elusive metabolite hasresulted in EMA’s recommendation to withdraw flupirtine, despiteexcellent tolerance in short-term use [29] and mounting evidenceof additional benefits in fields with unmet therapeutic needs suchas memory impairment, tinnitus, Creutzfeldt-Jakob disease, brainischemia, cocaine dependency, and epilepsy [30]. This has givenrise to a rich body of synthetically modified analogues of flupirtine,
aimed at retaining efficacy while avoiding toxicity [31–36]. In theabsence of a more thorough understanding of the biotoxification offlupirtine, these efforts remain empirical until suitable analyticaltools provide the theoretical framework for rational drug-design[37]. Additionally, a deeper understanding of individual metabolicprofiles could be used to develop a policy for patient stratificationthat prevents flupirtine administration to individuals predisposedto FILI. Thus, after more than 30 years of clinical use and shortlyafter its withdrawal, flupirtine metabolism studies have re-gainedtheir momentum [21,38,39].
2. Material and methods
2.1. Chemicals
Carbon dioxide was purchased in 99.995% purity from AirLiquide (Düsseldorf, Germany). Methanol (Carl Roth, Karlsruhe,Germany), 2-propanol and acetonitrile (VWR, Karlsruhe, Germany),formic acid (Fisher Scientific, Geel, Belgium) and 25% aque-ous ammonia (Sigma-Aldrich, Steinheim, Germany) was obtainedin LC–MS grade purity. Flupirtine and D-13223 were providedby AWD.pharma (Dresden, Germany); all other analytes, i.e. 4-fluorohippuric acid (4-FHA), methylated flupirtine (AS77) and3,4-difluorohippuric acid (3,4-FHA), were prepared according tosupplementary material and their identity verified by HRMS andNMR (S1: Synthesis). Stock and working solutions were preparedweekly in MS-grade methanol and stored at −20 ◦C and 4 ◦C, respec-tively.
2.2. Analytical instruments
Data acquisition was realized using a Nexera SFC/UHPLC switch-ing system (Shimadzu Corporation, Kyoto, Japan) consisting of oneLC-30ADSF pump for liquid CO2, two LC-20ADXR pumps for deliv-ering modifier/make-up, two SFC-30 A back pressure regulators(BPR), a SIL-30AC autosampler, a CTO-20AC column oven, a DGU-20A5R degasser and a CBM-20 A communication module. Columns(Synergi Polar-RP, Luna NH2, and Lux Amylose-2) were purchasedfrom Phenomenex (Aschaffenburg, Germany; 150 × 4.6 mm, 5 �m),except for Gemini C18 and Lichrosorb Diol (VWR, Karlsruhe,Germany; 100 × 4.6 mm, 5 �m) and XTerra MS C18 (Waters, Mil-ford, MA; 100 × 2.1 mm, 3.5 �m). The chromatography system wasdirectly coupled to a Shimadzu LCMS-2020 single quadrupole massspectrometer controlled by LabSolutions Version 5.82 software.Chemicalize was used for calculation of pKa [40].
2.3. Chromatographic and mass spectrometry conditions
Separations were carried out using mixtures of scCO2 and amodifier (methanol or 2-propanol), either pure or containing anadditive (ammonia or formic acid). Scouting runs were performedon six stationary phases comprising RP, hybrid and NP materials.Oven temperature was investigated in 5 ◦C increments between 30and 50 ◦C.
The final method utilized a lux amylose-2 stationary phase(150 × 4.6 mm, 5 �m) protected by a guard cartridge equippedwith the same material (4 × 3.0 mm) and heated to 40 ◦C. Themobile phase consisted of (A) scCO2 and (B) pH-adjusted modi-fier (0.075% ammonia and 0.225% water in methanol). Total-flowwas set to 4 mL/min, operating in gradient-mode: 0–6 min (5–25%B; ‘separation’), 6.01–6.5 min (25% B; ‘wash’), 6.51–7 min (25–5%B; ‘return to starting conditions’), 7.01–7.5 (5% B; ‘equilibration’).Pre- and post-column BPRs were set to 400 bar and 150 bar, respec-tively. A continuous ESI spray was realized by supplying 0.1 mL/minof make-up (methanol). Both injection volume and needle wash
148
340 R.K. Hofstetter et al. / J. Chromatogr. A 1603 (2019) 338–347
Table 1Analytes included in the study and their MS-properties, pKa values and chemi-cal structure. Hydrolysis of flupirtine followed by N-acetylation yields the activemetabolite D-13223 (quantified here using the synthetic analogue AS77 as internalstandard), whereas oxidative degradation produces 4-fluorohippuric acid (4-FHA),quantified using the difluorinated analogue 3,4-difluorohippuric acid (3,4-FHA).
Analyte Structure
flupirtinepKa: 7.50a
M: 304.13 g/molm/z: 305 (+)IS-group: 1
D-13223pKa: 7.59a
M: 274.12 g/molm/z: 275 (+)IS-group: 1
AS77pKa: 7.87a
M: 318.15 g/molm/z: 319 (+)IS of group 1
4-fluorohippuric acid (4-FHA)pKa: 3,17M: 195.05 g/molm/z: 194 (-)IS-group: 2
3,4-difluorohippuric acid (3,4-FHA)pKa: 2.85M: 215.04 g/molm/z: 214 (-)IS of group 2
solvent (methanol) were set to 5 �L. Optimization of mass spec-trometry conditions yielded an interface voltage of 4.5 kV, withnitrogen as nebulizing (1.5 L/min) and drying gas (5 L/min). Des-olvation line, heat block, and interface temperature of the finalmethod were set to 250 ◦C, 200 ◦C, and 350 ◦C, respectively. Ana-lytes containing a basic moiety (flupirtine, D-13223, AS77) weredetected in positive mode as [M+H]+, while the corresponding hip-puric acid derivatives (4-FHA, 3,4-FHA) were detected in negativemode as [M−H]− (Table 1). Integration was performed using Lab-Solutions software (internal standard method, linear regression,non-weighted for heteroscedasticity). Instrumentation is summa-rized in the supplementary material S2.
2.4. Sample preparation
Urine (200 �L) was spiked with 10 �L of internal standardsolution (20 �g/mL of each AS77 and 4-FHA in methanol; finalconcentration 0.95 �g/mL) and vortexed for 10 s. Macromolecu-lar matrix components were precipitated by addition of 800 �L ofice-cold acetonitrile and further vortexing for 1 min. After centrifu-gation for 15 min at 3200×g, the supernatant was used for analysis.
2.5. Validation parameters
Validation was performed according toEMEA/CHMP/EWP/192217/2009, the European MedicinesAgency’s (EMA) guideline on bioanalytical method validation[24]. This guideline covers selectivity, carry-over, calibrationcurve parameters (LLOQ, range, linearity), within-/between-runaccuracy and precision, dilution integrity, matrix effects andstability. Calibration curves in human urine were prepared daily
and included quality control samples (QCs, consisting of spikedhuman urine) equal to 10% of total analytical samples.
2.6. Clinical application
The validated assay was applied to urine samples of four healthyvolunteers of a clinical study group (male and female, 20–32 years,51.5–102 kg, height 162–197 cm, BMI 19.4–26.7 kg/m2), who gaveinformed written consent according to current international andnational regulations (EudraCT2007-007483-17; ClinicalTrials.govNCT01676246). The initial-controlled, randomized, cross-overstudy consisted of three segments, summarized in Fig. 1A: sin-gle i.v.-infusion (100 mg flupirtine, Katadolon
®inject, 50 mL over
30 min), single oral application (100 mg flupirtine, Katadolon®
hardcapsules, immediate release dosage form), and repeated oral appli-cation (400 mg flupirtine daily for eight days, Katadolon
®S long,
extended release dosage form). An interim period of at least sevendays was observed between each segment to ensure wash-out.Subjects’ health, as ascertained pre- and post-study by physicalexamination, routine clinical chemistry, history and haematologi-cal screenings for substance abuse, hepatitis B and C viruses as wellas HIV, showed no change during the study. For single dose admin-istration, urine was collected in 24-h-intervals from one day beforeand up to three days after administration. For repeated administra-tion, 24-h urine was sampled one day before and after final dose.All samples were stored at −20 ◦C until quantitative analysis.
3. Results and discussion
3.1. Method development and optimization
Since this is the first SFC investigation into flupirtine and itsmetabolites, method development began with a screening of viablestationary phases, followed by an investigation of the effects ofmodifier, additives, and finally gradient and temperature optimiza-tion. At each stage of the process, focus was placed on expediency,peak-shape, and greenness, as indicated by selectivity, elution time(RT), asymmetry factor (As), and minimal use of organic modifiers(B).
3.1.1. Screening of stationary phasesReversed-phase C18-silica (Xterra MS C18, Gemini-C18),
hybrid-phase ether-, diol- and NH2-modified silica (Synergi Polar-RP, LiChrosorb Diol, Luna NH2), and polysaccharide-based material(Lux Amylose-2) was included in the initial screening (Fig. 1B).
A review of the literature on HPLC-methods for flupirtine indi-cated reasonable success with alkylated stationary phases such asC18 [19,22,41] in HPLC, but at the same time revealed the challengesassociated with simultaneous analysis of both the lipophilic parentdrug and its polar metabolites, demanding the use of two differentstationary phases for acidic/hydrophilic and basic/lipophilic ana-lyte classes (NP and RP) [22]. Switching between modes of elution(RP and NP) within a single run conflicts with problems of elu-ent solubility and the need for extensive equilibration in HPLC. In aloosely related study on the metabolism of fluorapacin (not shown)where 4-FHA is formed as well, the high percentage of aqueousbuffer in a gradient elution required extreme run times of 26.86 minfor 4-FHA and 52.80 min for the related 4-fluoro benzoic acid [42].
In principle, SFC should be able to cover a wider target ana-lyte polarity range, due to the excellent miscibility of hexane-likescCO2 and polar modifiers, as well as extremely short equilibrationtimes (due to the superior mass transfer). However, preliminaryexperiments corroborated that plain C18-columns, such as Gem-ini C18 (moderate hydrophobicity, low polarity) and XTerra C18(decreased hydrophobicity, slightly higher polarity [43]) were notsuitable for simultaneous analysis of both basic/non-polar and
149
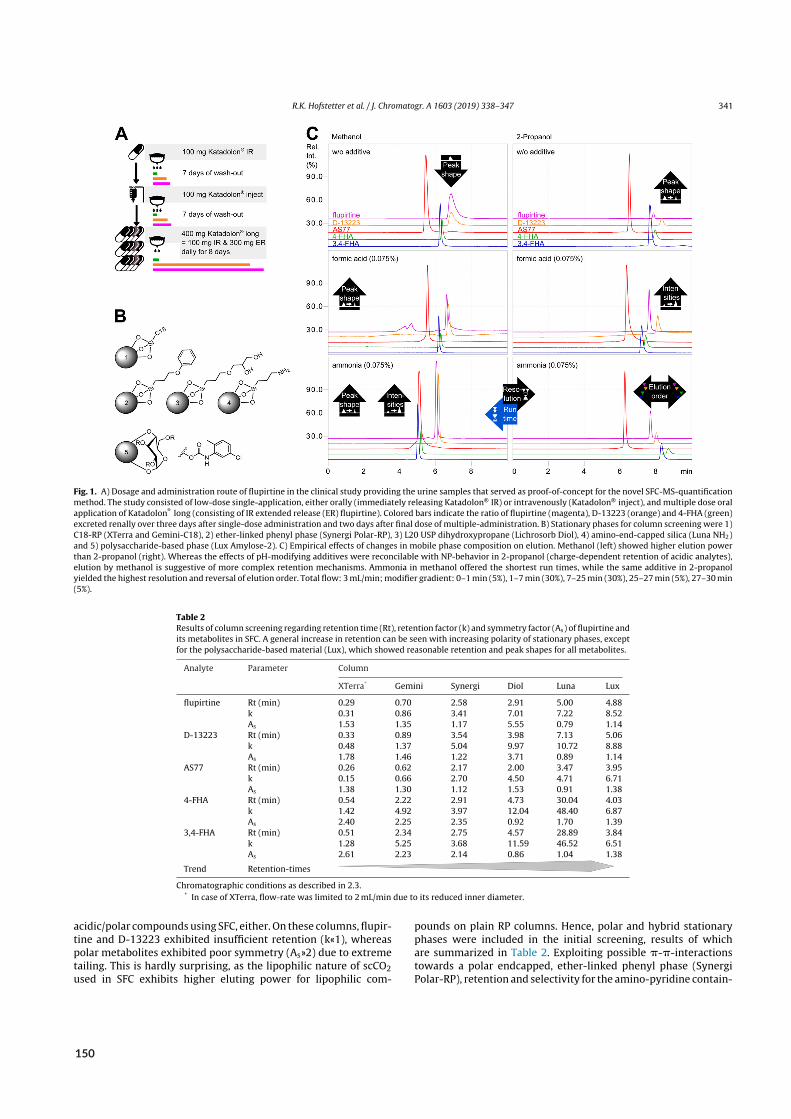
R.K. Hofstetter et al. / J. Chromatogr. A 1603 (2019) 338–347 341
Fig. 1. A) Dosage and administration route of flupirtine in the clinical study providing the urine samples that served as proof-of-concept for the novel SFC-MS-quantificationmethod. The study consisted of low-dose single-application, either orally (immediately releasing Katadolon® IR) or intravenously (Katadolon® inject), and multiple dose oralapplication of Katadolon® long (consisting of IR extended release (ER) flupirtine). Colored bars indicate the ratio of flupirtine (magenta), D-13223 (orange) and 4-FHA (green)excreted renally over three days after single-dose administration and two days after final dose of multiple-administration. B) Stationary phases for column screening were 1)C18-RP (XTerra and Gemini-C18), 2) ether-linked phenyl phase (Synergi Polar-RP), 3) L20 USP dihydroxypropane (Lichrosorb Diol), 4) amino-end-capped silica (Luna NH2)and 5) polysaccharide-based phase (Lux Amylose-2). C) Empirical effects of changes in mobile phase composition on elution. Methanol (left) showed higher elution powerthan 2-propanol (right). Whereas the effects of pH-modifying additives were reconcilable with NP-behavior in 2-propanol (charge-dependent retention of acidic analytes),elution by methanol is suggestive of more complex retention mechanisms. Ammonia in methanol offered the shortest run times, while the same additive in 2-propanolyielded the highest resolution and reversal of elution order. Total flow: 3 mL/min; modifier gradient: 0–1 min (5%), 1–7 min (30%), 7–25 min (30%), 25–27 min (5%), 27–30 min(5%).
Table 2Results of column screening regarding retention time (Rt), retention factor (k) and symmetry factor (As) of flupirtine andits metabolites in SFC. A general increase in retention can be seen with increasing polarity of stationary phases, exceptfor the polysaccharide-based material (Lux), which showed reasonable retention and peak shapes for all metabolites.
Analyte Parameter Column
XTerra* Gemini Synergi Diol Luna Lux
flupirtine Rt (min) 0.29 0.70 2.58 2.91 5.00 4.88k 0.31 0.86 3.41 7.01 7.22 8.52As 1.53 1.35 1.17 5.55 0.79 1.14
D-13223 Rt (min) 0.33 0.89 3.54 3.98 7.13 5.06k 0.48 1.37 5.04 9.97 10.72 8.88As 1.78 1.46 1.22 3.71 0.89 1.14
AS77 Rt (min) 0.26 0.62 2.17 2.00 3.47 3.95k 0.15 0.66 2.70 4.50 4.71 6.71As 1.38 1.30 1.12 1.53 0.91 1.38
4-FHA Rt (min) 0.54 2.22 2.91 4.73 30.04 4.03k 1.42 4.92 3.97 12.04 48.40 6.87As 2.40 2.25 2.35 0.92 1.70 1.39
3,4-FHA Rt (min) 0.51 2.34 2.75 4.57 28.89 3.84k 1.28 5.25 3.68 11.59 46.52 6.51As 2.61 2.23 2.14 0.86 1.04 1.38
Trend Retention-times
Chromatographic conditions as described in 2.3.* In case of XTerra, flow-rate was limited to 2 mL/min due to its reduced inner diameter.
acidic/polar compounds using SFC, either. On these columns, flupir-tine and D-13223 exhibited insufficient retention (k«1), whereaspolar metabolites exhibited poor symmetry (As»2) due to extremetailing. This is hardly surprising, as the lipophilic nature of scCO2used in SFC exhibits higher eluting power for lipophilic com-
pounds on plain RP columns. Hence, polar and hybrid stationaryphases were included in the initial screening, results of whichare summarized in Table 2. Exploiting possible �-�-interactionstowards a polar endcapped, ether-linked phenyl phase (SynergiPolar-RP), retention and selectivity for the amino-pyridine contain-
150
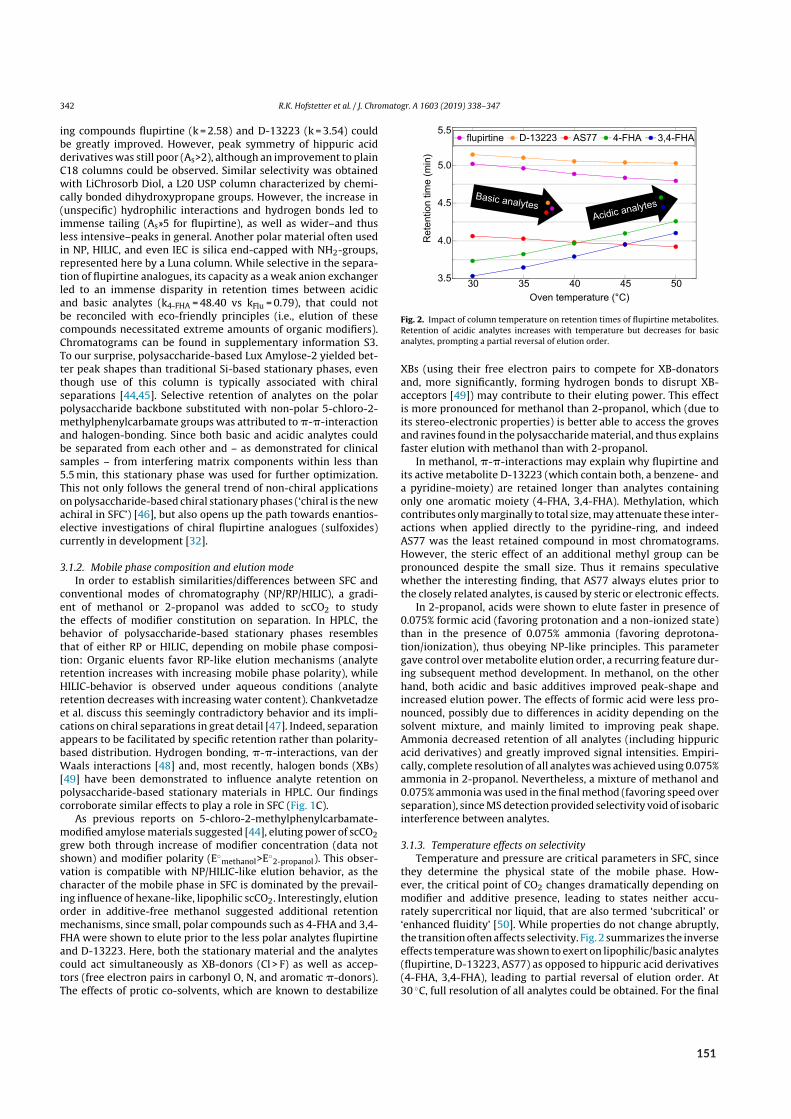
342 R.K. Hofstetter et al. / J. Chromatogr. A 1603 (2019) 338–347
ing compounds flupirtine (k = 2.58) and D-13223 (k = 3.54) couldbe greatly improved. However, peak symmetry of hippuric acidderivatives was still poor (As>2), although an improvement to plainC18 columns could be observed. Similar selectivity was obtainedwith LiChrosorb Diol, a L20 USP column characterized by chemi-cally bonded dihydroxypropane groups. However, the increase in(unspecific) hydrophilic interactions and hydrogen bonds led toimmense tailing (As»5 for flupirtine), as well as wider–and thusless intensive–peaks in general. Another polar material often usedin NP, HILIC, and even IEC is silica end-capped with NH2-groups,represented here by a Luna column. While selective in the separa-tion of flupirtine analogues, its capacity as a weak anion exchangerled to an immense disparity in retention times between acidicand basic analytes (k4-FHA = 48.40 vs kFlu = 0.79), that could notbe reconciled with eco-friendly principles (i.e., elution of thesecompounds necessitated extreme amounts of organic modifiers).Chromatograms can be found in supplementary information S3.To our surprise, polysaccharide-based Lux Amylose-2 yielded bet-ter peak shapes than traditional Si-based stationary phases, eventhough use of this column is typically associated with chiralseparations [44,45]. Selective retention of analytes on the polarpolysaccharide backbone substituted with non-polar 5-chloro-2-methylphenylcarbamate groups was attributed to �-�-interactionand halogen-bonding. Since both basic and acidic analytes couldbe separated from each other and – as demonstrated for clinicalsamples – from interfering matrix components within less than5.5 min, this stationary phase was used for further optimization.This not only follows the general trend of non-chiral applicationson polysaccharide-based chiral stationary phases (‘chiral is the newachiral in SFC’) [46], but also opens up the path towards enantios-elective investigations of chiral flupirtine analogues (sulfoxides)currently in development [32].
3.1.2. Mobile phase composition and elution modeIn order to establish similarities/differences between SFC and
conventional modes of chromatography (NP/RP/HILIC), a gradi-ent of methanol or 2-propanol was added to scCO2 to studythe effects of modifier constitution on separation. In HPLC, thebehavior of polysaccharide-based stationary phases resemblesthat of either RP or HILIC, depending on mobile phase composi-tion: Organic eluents favor RP-like elution mechanisms (analyteretention increases with increasing mobile phase polarity), whileHILIC-behavior is observed under aqueous conditions (analyteretention decreases with increasing water content). Chankvetadzeet al. discuss this seemingly contradictory behavior and its impli-cations on chiral separations in great detail [47]. Indeed, separationappears to be facilitated by specific retention rather than polarity-based distribution. Hydrogen bonding, �-�-interactions, van derWaals interactions [48] and, most recently, halogen bonds (XBs)[49] have been demonstrated to influence analyte retention onpolysaccharide-based stationary materials in HPLC. Our findingscorroborate similar effects to play a role in SFC (Fig. 1C).
As previous reports on 5-chloro-2-methylphenylcarbamate-modified amylose materials suggested [44], eluting power of scCO2grew both through increase of modifier concentration (data notshown) and modifier polarity (E◦
methanol>E◦2-propanol). This obser-
vation is compatible with NP/HILIC-like elution behavior, as thecharacter of the mobile phase in SFC is dominated by the prevail-ing influence of hexane-like, lipophilic scCO2. Interestingly, elutionorder in additive-free methanol suggested additional retentionmechanisms, since small, polar compounds such as 4-FHA and 3,4-FHA were shown to elute prior to the less polar analytes flupirtineand D-13223. Here, both the stationary material and the analytescould act simultaneously as XB-donors (Cl > F) as well as accep-tors (free electron pairs in carbonyl O, N, and aromatic �-donors).The effects of protic co-solvents, which are known to destabilize
Fig. 2. Impact of column temperature on retention times of flupirtine metabolites.Retention of acidic analytes increases with temperature but decreases for basicanalytes, prompting a partial reversal of elution order.
XBs (using their free electron pairs to compete for XB-donatorsand, more significantly, forming hydrogen bonds to disrupt XB-acceptors [49]) may contribute to their eluting power. This effectis more pronounced for methanol than 2-propanol, which (due toits stereo-electronic properties) is better able to access the grovesand ravines found in the polysaccharide material, and thus explainsfaster elution with methanol than with 2-propanol.
In methanol, �-�-interactions may explain why flupirtine andits active metabolite D-13223 (which contain both, a benzene- anda pyridine-moiety) are retained longer than analytes containingonly one aromatic moiety (4-FHA, 3,4-FHA). Methylation, whichcontributes only marginally to total size, may attenuate these inter-actions when applied directly to the pyridine-ring, and indeedAS77 was the least retained compound in most chromatograms.However, the steric effect of an additional methyl group can bepronounced despite the small size. Thus it remains speculativewhether the interesting finding, that AS77 always elutes prior tothe closely related analytes, is caused by steric or electronic effects.
In 2-propanol, acids were shown to elute faster in presence of0.075% formic acid (favoring protonation and a non-ionized state)than in the presence of 0.075% ammonia (favoring deprotona-tion/ionization), thus obeying NP-like principles. This parametergave control over metabolite elution order, a recurring feature dur-ing subsequent method development. In methanol, on the otherhand, both acidic and basic additives improved peak-shape andincreased elution power. The effects of formic acid were less pro-nounced, possibly due to differences in acidity depending on thesolvent mixture, and mainly limited to improving peak shape.Ammonia decreased retention of all analytes (including hippuricacid derivatives) and greatly improved signal intensities. Empiri-cally, complete resolution of all analytes was achieved using 0.075%ammonia in 2-propanol. Nevertheless, a mixture of methanol and0.075% ammonia was used in the final method (favoring speed overseparation), since MS detection provided selectivity void of isobaricinterference between analytes.
3.1.3. Temperature effects on selectivityTemperature and pressure are critical parameters in SFC, since
they determine the physical state of the mobile phase. How-ever, the critical point of CO2 changes dramatically depending onmodifier and additive presence, leading to states neither accu-rately supercritical nor liquid, that are also termed ‘subcritical’ or‘enhanced fluidity’ [50]. While properties do not change abruptly,the transition often affects selectivity. Fig. 2 summarizes the inverseeffects temperature was shown to exert on lipophilic/basic analytes(flupirtine, D-13223, AS77) as opposed to hippuric acid derivatives(4-FHA, 3,4-FHA), leading to partial reversal of elution order. At30 ◦C, full resolution of all analytes could be obtained. For the final
151
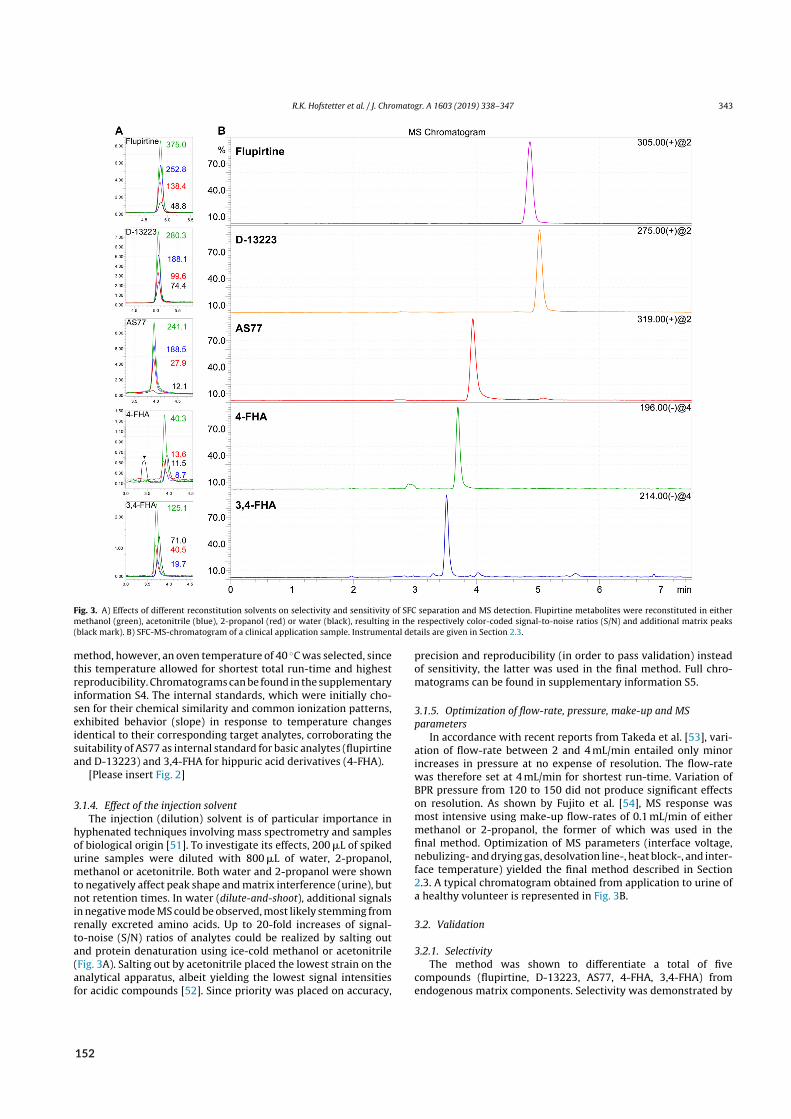
R.K. Hofstetter et al. / J. Chromatogr. A 1603 (2019) 338–347 343
Fig. 3. A) Effects of different reconstitution solvents on selectivity and sensitivity of SFC separation and MS detection. Flupirtine metabolites were reconstituted in eithermethanol (green), acetonitrile (blue), 2-propanol (red) or water (black), resulting in the respectively color-coded signal-to-noise ratios (S/N) and additional matrix peaks(black mark). B) SFC-MS-chromatogram of a clinical application sample. Instrumental details are given in Section 2.3.
method, however, an oven temperature of 40 ◦C was selected, sincethis temperature allowed for shortest total run-time and highestreproducibility. Chromatograms can be found in the supplementaryinformation S4. The internal standards, which were initially cho-sen for their chemical similarity and common ionization patterns,exhibited behavior (slope) in response to temperature changesidentical to their corresponding target analytes, corroborating thesuitability of AS77 as internal standard for basic analytes (flupirtineand D-13223) and 3,4-FHA for hippuric acid derivatives (4-FHA).
[Please insert Fig. 2]
3.1.4. Effect of the injection solventThe injection (dilution) solvent is of particular importance in
hyphenated techniques involving mass spectrometry and samplesof biological origin [51]. To investigate its effects, 200 �L of spikedurine samples were diluted with 800 �L of water, 2-propanol,methanol or acetonitrile. Both water and 2-propanol were shownto negatively affect peak shape and matrix interference (urine), butnot retention times. In water (dilute-and-shoot), additional signalsin negative mode MS could be observed, most likely stemming fromrenally excreted amino acids. Up to 20-fold increases of signal-to-noise (S/N) ratios of analytes could be realized by salting outand protein denaturation using ice-cold methanol or acetonitrile(Fig. 3A). Salting out by acetonitrile placed the lowest strain on theanalytical apparatus, albeit yielding the lowest signal intensitiesfor acidic compounds [52]. Since priority was placed on accuracy,
precision and reproducibility (in order to pass validation) insteadof sensitivity, the latter was used in the final method. Full chro-matograms can be found in supplementary information S5.
3.1.5. Optimization of flow-rate, pressure, make-up and MSparameters
In accordance with recent reports from Takeda et al. [53], vari-ation of flow-rate between 2 and 4 mL/min entailed only minorincreases in pressure at no expense of resolution. The flow-ratewas therefore set at 4 mL/min for shortest run-time. Variation ofBPR pressure from 120 to 150 did not produce significant effectson resolution. As shown by Fujito et al. [54], MS response wasmost intensive using make-up flow-rates of 0.1 mL/min of eithermethanol or 2-propanol, the former of which was used in thefinal method. Optimization of MS parameters (interface voltage,nebulizing- and drying gas, desolvation line-, heat block-, and inter-face temperature) yielded the final method described in Section2.3. A typical chromatogram obtained from application to urine ofa healthy volunteer is represented in Fig. 3B.
3.2. Validation
3.2.1. SelectivityThe method was shown to differentiate a total of five
compounds (flupirtine, D-13223, AS77, 4-FHA, 3,4-FHA) fromendogenous matrix components. Selectivity was demonstrated by
152
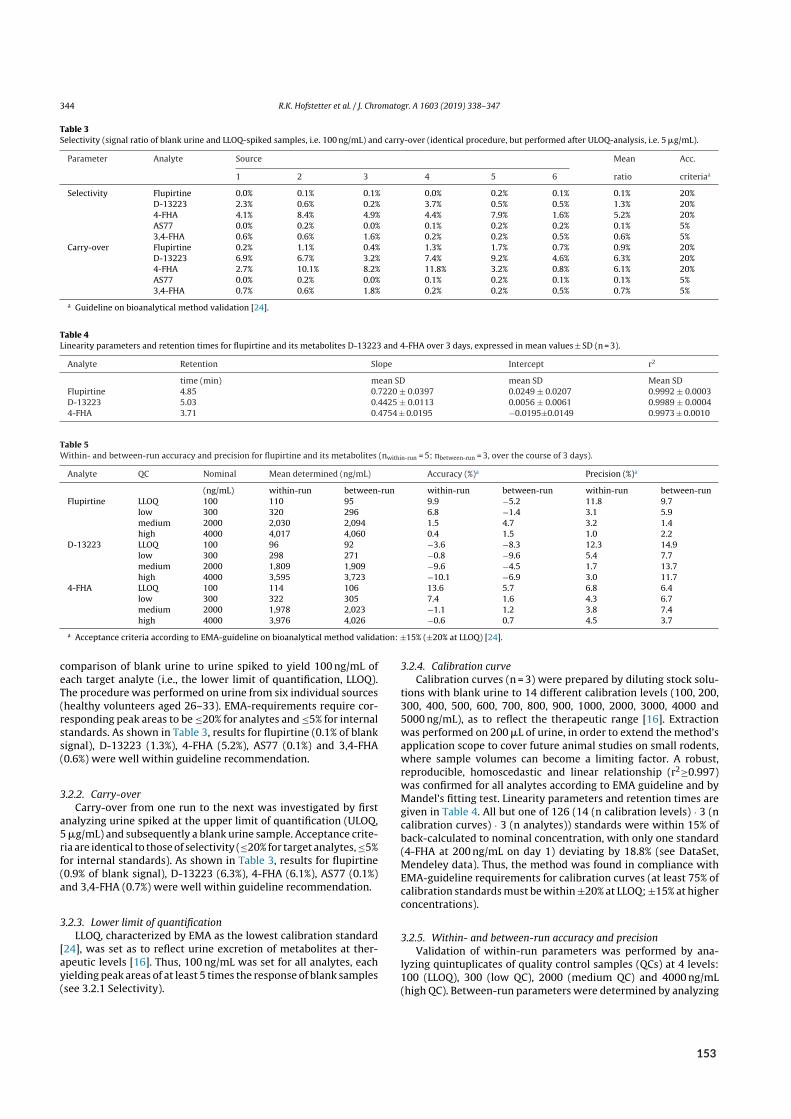
344 R.K. Hofstetter et al. / J. Chromatogr. A 1603 (2019) 338–347
Table 3Selectivity (signal ratio of blank urine and LLOQ-spiked samples, i.e. 100 ng/mL) and carry-over (identical procedure, but performed after ULOQ-analysis, i.e. 5 �g/mL).
Parameter Analyte Source Mean Acc.
1 2 3 4 5 6 ratio criteriaa
Selectivity Flupirtine 0.0% 0.1% 0.1% 0.0% 0.2% 0.1% 0.1% 20%D-13223 2.3% 0.6% 0.2% 3.7% 0.5% 0.5% 1.3% 20%4-FHA 4.1% 8.4% 4.9% 4.4% 7.9% 1.6% 5.2% 20%AS77 0.0% 0.2% 0.0% 0.1% 0.2% 0.2% 0.1% 5%3,4-FHA 0.6% 0.6% 1.6% 0.2% 0.2% 0.5% 0.6% 5%
Carry-over Flupirtine 0.2% 1.1% 0.4% 1.3% 1.7% 0.7% 0.9% 20%D-13223 6.9% 6.7% 3.2% 7.4% 9.2% 4.6% 6.3% 20%4-FHA 2.7% 10.1% 8.2% 11.8% 3.2% 0.8% 6.1% 20%AS77 0.0% 0.2% 0.0% 0.1% 0.2% 0.1% 0.1% 5%3,4-FHA 0.7% 0.6% 1.8% 0.2% 0.2% 0.5% 0.7% 5%
a Guideline on bioanalytical method validation [24].
Table 4Linearity parameters and retention times for flupirtine and its metabolites D-13223 and 4-FHA over 3 days, expressed in mean values ± SD (n = 3).
Analyte Retention Slope Intercept r2
time (min) mean SD mean SD Mean SDFlupirtine 4.85 0.7220 ± 0.0397 0.0249 ± 0.0207 0.9992 ± 0.0003D-13223 5.03 0.4425 ± 0.0113 0.0056 ± 0.0061 0.9989 ± 0.00044-FHA 3.71 0.4754 ± 0.0195 −0.0195±0.0149 0.9973 ± 0.0010
Table 5Within- and between-run accuracy and precision for flupirtine and its metabolites (nwithin-run = 5; nbetween-run = 3, over the course of 3 days).
Analyte QC Nominal Mean determined (ng/mL) Accuracy (%)a Precision (%)a
(ng/mL) within-run between-run within-run between-run within-run between-runFlupirtine LLOQ 100 110 95 9.9 −5.2 11.8 9.7
low 300 320 296 6.8 −1.4 3.1 5.9medium 2000 2,030 2,094 1.5 4.7 3.2 1.4high 4000 4,017 4,060 0.4 1.5 1.0 2.2
D-13223 LLOQ 100 96 92 −3.6 −8.3 12.3 14.9low 300 298 271 −0.8 −9.6 5.4 7.7medium 2000 1,809 1,909 −9.6 −4.5 1.7 13.7high 4000 3,595 3,723 −10.1 −6.9 3.0 11.7
4-FHA LLOQ 100 114 106 13.6 5.7 6.8 6.4low 300 322 305 7.4 1.6 4.3 6.7medium 2000 1,978 2,023 −1.1 1.2 3.8 7.4high 4000 3,976 4,026 −0.6 0.7 4.5 3.7
a Acceptance criteria according to EMA-guideline on bioanalytical method validation: ±15% (±20% at LLOQ) [24].
comparison of blank urine to urine spiked to yield 100 ng/mL ofeach target analyte (i.e., the lower limit of quantification, LLOQ).The procedure was performed on urine from six individual sources(healthy volunteers aged 26–33). EMA-requirements require cor-responding peak areas to be ≤20% for analytes and ≤5% for internalstandards. As shown in Table 3, results for flupirtine (0.1% of blanksignal), D-13223 (1.3%), 4-FHA (5.2%), AS77 (0.1%) and 3,4-FHA(0.6%) were well within guideline recommendation.
3.2.2. Carry-overCarry-over from one run to the next was investigated by first
analyzing urine spiked at the upper limit of quantification (ULOQ,5 �g/mL) and subsequently a blank urine sample. Acceptance crite-ria are identical to those of selectivity (≤20% for target analytes, ≤5%for internal standards). As shown in Table 3, results for flupirtine(0.9% of blank signal), D-13223 (6.3%), 4-FHA (6.1%), AS77 (0.1%)and 3,4-FHA (0.7%) were well within guideline recommendation.
3.2.3. Lower limit of quantificationLLOQ, characterized by EMA as the lowest calibration standard
[24], was set as to reflect urine excretion of metabolites at ther-apeutic levels [16]. Thus, 100 ng/mL was set for all analytes, eachyielding peak areas of at least 5 times the response of blank samples(see 3.2.1 Selectivity).
3.2.4. Calibration curveCalibration curves (n = 3) were prepared by diluting stock solu-
tions with blank urine to 14 different calibration levels (100, 200,300, 400, 500, 600, 700, 800, 900, 1000, 2000, 3000, 4000 and5000 ng/mL), as to reflect the therapeutic range [16]. Extractionwas performed on 200 �L of urine, in order to extend the method’sapplication scope to cover future animal studies on small rodents,where sample volumes can become a limiting factor. A robust,reproducible, homoscedastic and linear relationship (r2≥0.997)was confirmed for all analytes according to EMA guideline and byMandel’s fitting test. Linearity parameters and retention times aregiven in Table 4. All but one of 126 (14 (n calibration levels) · 3 (ncalibration curves) · 3 (n analytes)) standards were within 15% ofback-calculated to nominal concentration, with only one standard(4-FHA at 200 ng/mL on day 1) deviating by 18.8% (see DataSet,Mendeley data). Thus, the method was found in compliance withEMA-guideline requirements for calibration curves (at least 75% ofcalibration standards must be within ±20% at LLOQ; ±15% at higherconcentrations).
3.2.5. Within- and between-run accuracy and precisionValidation of within-run parameters was performed by ana-
lyzing quintuplicates of quality control samples (QCs) at 4 levels:100 (LLOQ), 300 (low QC), 2000 (medium QC) and 4000 ng/mL(high QC). Between-run parameters were determined by analyzing
153
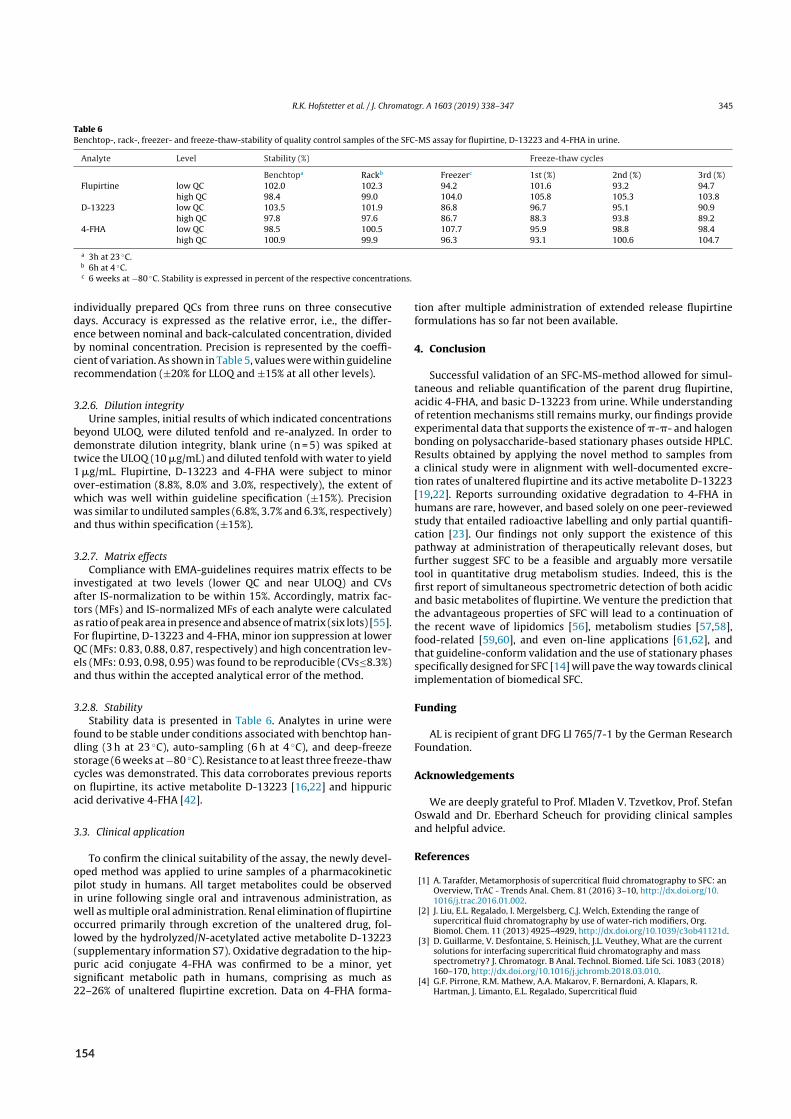
R.K. Hofstetter et al. / J. Chromatogr. A 1603 (2019) 338–347 345
Table 6Benchtop-, rack-, freezer- and freeze-thaw-stability of quality control samples of the SFC-MS assay for flupirtine, D-13223 and 4-FHA in urine.
Analyte Level Stability (%) Freeze-thaw cycles
Benchtopa Rackb Freezerc 1st (%) 2nd (%) 3rd (%)Flupirtine low QC 102.0 102.3 94.2 101.6 93.2 94.7
high QC 98.4 99.0 104.0 105.8 105.3 103.8D-13223 low QC 103.5 101.9 86.8 96.7 95.1 90.9
high QC 97.8 97.6 86.7 88.3 93.8 89.24-FHA low QC 98.5 100.5 107.7 95.9 98.8 98.4
high QC 100.9 99.9 96.3 93.1 100.6 104.7
a 3h at 23 ◦C.b 6h at 4 ◦C.c 6 weeks at −80 ◦C. Stability is expressed in percent of the respective concentrations.
individually prepared QCs from three runs on three consecutivedays. Accuracy is expressed as the relative error, i.e., the differ-ence between nominal and back-calculated concentration, dividedby nominal concentration. Precision is represented by the coeffi-cient of variation. As shown in Table 5, values were within guidelinerecommendation (±20% for LLOQ and ±15% at all other levels).
3.2.6. Dilution integrityUrine samples, initial results of which indicated concentrations
beyond ULOQ, were diluted tenfold and re-analyzed. In order todemonstrate dilution integrity, blank urine (n = 5) was spiked attwice the ULOQ (10 �g/mL) and diluted tenfold with water to yield1 �g/mL. Flupirtine, D-13223 and 4-FHA were subject to minorover-estimation (8.8%, 8.0% and 3.0%, respectively), the extent ofwhich was well within guideline specification (±15%). Precisionwas similar to undiluted samples (6.8%, 3.7% and 6.3%, respectively)and thus within specification (±15%).
3.2.7. Matrix effectsCompliance with EMA-guidelines requires matrix effects to be
investigated at two levels (lower QC and near ULOQ) and CVsafter IS-normalization to be within 15%. Accordingly, matrix fac-tors (MFs) and IS-normalized MFs of each analyte were calculatedas ratio of peak area in presence and absence of matrix (six lots) [55].For flupirtine, D-13223 and 4-FHA, minor ion suppression at lowerQC (MFs: 0.83, 0.88, 0.87, respectively) and high concentration lev-els (MFs: 0.93, 0.98, 0.95) was found to be reproducible (CVs≤8.3%)and thus within the accepted analytical error of the method.
3.2.8. StabilityStability data is presented in Table 6. Analytes in urine were
found to be stable under conditions associated with benchtop han-dling (3 h at 23 ◦C), auto-sampling (6 h at 4 ◦C), and deep-freezestorage (6 weeks at −80 ◦C). Resistance to at least three freeze-thawcycles was demonstrated. This data corroborates previous reportson flupirtine, its active metabolite D-13223 [16,22] and hippuricacid derivative 4-FHA [42].
3.3. Clinical application
To confirm the clinical suitability of the assay, the newly devel-oped method was applied to urine samples of a pharmacokineticpilot study in humans. All target metabolites could be observedin urine following single oral and intravenous administration, aswell as multiple oral administration. Renal elimination of flupirtineoccurred primarily through excretion of the unaltered drug, fol-lowed by the hydrolyzed/N-acetylated active metabolite D-13223(supplementary information S7). Oxidative degradation to the hip-puric acid conjugate 4-FHA was confirmed to be a minor, yetsignificant metabolic path in humans, comprising as much as22–26% of unaltered flupirtine excretion. Data on 4-FHA forma-
tion after multiple administration of extended release flupirtineformulations has so far not been available.
4. Conclusion
Successful validation of an SFC-MS-method allowed for simul-taneous and reliable quantification of the parent drug flupirtine,acidic 4-FHA, and basic D-13223 from urine. While understandingof retention mechanisms still remains murky, our findings provideexperimental data that supports the existence of �-�- and halogenbonding on polysaccharide-based stationary phases outside HPLC.Results obtained by applying the novel method to samples froma clinical study were in alignment with well-documented excre-tion rates of unaltered flupirtine and its active metabolite D-13223[19,22]. Reports surrounding oxidative degradation to 4-FHA inhumans are rare, however, and based solely on one peer-reviewedstudy that entailed radioactive labelling and only partial quantifi-cation [23]. Our findings not only support the existence of thispathway at administration of therapeutically relevant doses, butfurther suggest SFC to be a feasible and arguably more versatiletool in quantitative drug metabolism studies. Indeed, this is thefirst report of simultaneous spectrometric detection of both acidicand basic metabolites of flupirtine. We venture the prediction thatthe advantageous properties of SFC will lead to a continuation ofthe recent wave of lipidomics [56], metabolism studies [57,58],food-related [59,60], and even on-line applications [61,62], andthat guideline-conform validation and the use of stationary phasesspecifically designed for SFC [14] will pave the way towards clinicalimplementation of biomedical SFC.
Funding
AL is recipient of grant DFG LI 765/7-1 by the German ResearchFoundation.
Acknowledgements
We are deeply grateful to Prof. Mladen V. Tzvetkov, Prof. StefanOswald and Dr. Eberhard Scheuch for providing clinical samplesand helpful advice.
References
[1] A. Tarafder, Metamorphosis of supercritical fluid chromatography to SFC: anOverview, TrAC - Trends Anal. Chem. 81 (2016) 3–10, http://dx.doi.org/10.1016/j.trac.2016.01.002.
[2] J. Liu, E.L. Regalado, I. Mergelsberg, C.J. Welch, Extending the range ofsupercritical fluid chromatography by use of water-rich modifiers, Org.Biomol. Chem. 11 (2013) 4925–4929, http://dx.doi.org/10.1039/c3ob41121d.
[3] D. Guillarme, V. Desfontaine, S. Heinisch, J.L. Veuthey, What are the currentsolutions for interfacing supercritical fluid chromatography and massspectrometry? J. Chromatogr. B Anal. Technol. Biomed. Life Sci. 1083 (2018)160–170, http://dx.doi.org/10.1016/j.jchromb.2018.03.010.
[4] G.F. Pirrone, R.M. Mathew, A.A. Makarov, F. Bernardoni, A. Klapars, R.Hartman, J. Limanto, E.L. Regalado, Supercritical fluid
154
346 R.K. Hofstetter et al. / J. Chromatogr. A 1603 (2019) 338–347
chromatography-photodiode array detection-electrospray ionization massspectrometry as a framework for impurity fate mapping in the developmentand manufacture of drug substances, J. Chromatogr. B Anal. Technol. Biomed.Life Sci. 1080 (2018) 42–49, http://dx.doi.org/10.1016/j.jchromb.2018.02.006.
[5] C. Jenkinson, A. Taylor, K.-H. Storbeck, M. Hewison, Analysis of multiplevitamin D metabolites by ultra-performance supercritical fluidchromatography-tandem mass spectrometry (UPSFC-MS/MS), J. Chromatogr.B. 1087–1088 (2018) 43–48, http://dx.doi.org/10.1016/j.jchromb.2018.04.025.
[6] K. Taguchi, E. Fukusaki, T. Bamba, Simultaneous analysis for water- andfat-soluble vitamins by a novel single chromatography technique unifyingsupercritical fluid chromatography and liquid chromatography, J. Chromatogr.A 1362 (2014) 270–277, http://dx.doi.org/10.1016/j.chroma.2014.08.003.
[7] S. Bäurer, W. Guo, S. Polnick, M. Lämmerhofer, Simultaneous separation ofwater- and fat-soluble vitamins by selective comprehensive HILIC × RPLC(High-Resolution sampling) and active solvent modulation, Chromatographia82 (2019) 167–180, http://dx.doi.org/10.1007/s10337-018-3615-0.
[8] M. Lewis, A. Sen, C. Knappy, M.R. Lewis, R.S. Plumb, Analysis of polar urinarymetabolites for metabolic phenotyping using supercritical fluidchromatography and mass spectrometry, J. Chromatogr. A 1449 (2016)141–155, http://dx.doi.org/10.1016/j.chroma.2016.04.040.
[9] V. Pilarová, K. Plachká, M.A. Khalikova, F. Svec, L. Nováková, Recentdevelopments in supercritical fluid chromatography – mass spectrometry: isit a viable option for analysis of complex samples? TrAC Trends Anal. Chem.112 (2019) 212–225, http://dx.doi.org/10.1016/j.trac.2018.12.023.
[10] M.A. Khalikova, E. Lesellier, E. Chapuzet, D. Satínsky, C. West, Developmentand validation of ultra-high performance supercritical fluid chromatographymethod for quantitative determination of nine sunscreens in cosmeticsamples, Anal. Chim. Acta 1034 (2018), http://dx.doi.org/10.1016/j.aca.2018.06.013, 184–19.
[11] X. Zhang, X. Ding, J. Wang, B. Dean, Supercritical fluidchromatography-tandem mass spectrometry for high throughput bioanalysisof small molecules in drug discovery, J. Pharm. Biomed. Anal. 164 (2018)62–69, http://dx.doi.org/10.1016/j.jpba.2018.10.021.
[12] L.C. Harps, J.F. Joseph, M.K. Parr, SFC for chiral separations in bioanalysis, J.Pharm. Biomed. Anal. 162 (2019) 47–59, http://dx.doi.org/10.1016/j.jpba.2018.08.061.
[13] M. Johannsen, G. Brunner, Supercritical fluid chromatographic separation onpreparative scale and in continuous mode, J. Supercrit. Fluids 134 (2018)61–70, http://dx.doi.org/10.1016/j.supflu.2017.12.027.
[14] C. West, Current trends in supercritical fluid chromatography, Anal. Bioanal.Chem. 410 (2018) 6441–6457, http://dx.doi.org/10.1007/s00216-018-1267-4.
[15] A. Dispas, H. Jambo, S. André, E. Tyteca, P. Hubert, Supercritical fluidchromatography: a promising alternative to current bioanalytical techniques,Bioanalysis. 10 (2018) 107–124, http://dx.doi.org/10.4155/bio-2017-0211.
[16] W. Siegmund, C. Modess, E. Scheuch, K. Methling, M. Keiser, A. Nassif, D.Rosskopf, P.J. Bednarski, J. Borlak, B. Terhaag, Metabolic activation andanalgesic effect of flupirtine in healthy subjects, influence of the polymorphicNAT2, UGT1A1 and GSTP1, Br. J. Clin. Pharmacol. 73 (2014) 501–513, http://dx.doi.org/10.1111/bcp.12522.
[17] C. Galea, C. West, D. Mangelings, Y. Vander, Is the solvation parameter modelor its adaptations adequate to account for ionic interactions whencharacterizing stationary phases for drug impurity profiling with supercriticalfluid chromatography? Anal. Chim. Acta 924 (2016) 9–20, http://dx.doi.org/10.1016/j.aca.2016.04.014.
[18] P.K. Narang, J.F. Tourville, D.C. Chatterji, J.F. Gallelli, Quantitation of flupirtineand its active acetylated metabolite by reversed-phase high-performanceliquid chromatography using fluorometric detection, J. Chromatogr. 305(1984) 135–143, http://dx.doi.org/10.1016/S0378-4347(00)83321-6.
[19] Y. Liu, H. Huo, Z. Zhao, W. Hu, Y. Sun, Y. Tang, Bioequivalence study of twoformulations of flupirtine maleate capsules in healthy male Chinesevolunteers under fasting and fed conditions, Drug Des. Devel. Ther. 11 (2017)3441–3448, http://dx.doi.org/10.2147/DDDT.S149913.
[20] X. Chen, D. Zhong, H. Xu, B. Schug, H. Blume, Simultaneous determination offlupirtine and its major active metabolite in human plasma by liquidchromatography–tandem mass spectrometry, J. Chromatogr. B 755 (2001)195–202, http://dx.doi.org/10.1016/S0378-4347(01)00076-7.
[21] M.A. Patil, B.A. Matter, Y.H. Raol, D.W.A. Bourne, R.A. Kelley, U.B. Kompella,Brain distribution and metabolism of flupirtine, a nonopioid analgesic drugwith antiseizure effects, in neonatal rats, Pharmaceutics 10 (2018) 1–13,http://dx.doi.org/10.3390/pharmaceutics10040281.
[22] E. Scheuch, K. Methling, P.J. Bednarski, S. Oswald, W. Siegmund, QuantitativeLC–MS/MS determination of flupirtine, its N-acetylated and two mercapturicacid derivatives in man, J. Pharm. Biomed. Anal. 102 (2015) 377–385, http://dx.doi.org/10.1016/j.jpba.2014.09.010.
[23] P. Hlavica, G. Niebch, Pharmacokinetics and biotransformation of theanalgesic flupirtine in humans, Arzneimittelforschung 35 (1985) 67–74https://europepmc.org/abstract/med/4039154.
[24] European Medicines Agency, Guideline on bioanalytical method validation,Ref. Number EMEA/CHMP/EWP/192217/2009. (n.d.).
[25] N.D. Volkow, A.T. McLellan, Opioid abuse in chronic pain — misconceptionsand mitigation strategies, N. Engl. J. Med. 374 (2016) 1253–1263, http://dx.doi.org/10.1056/NEJMra1507771.
[26] M.T. Greco, A. Roberto, O. Corli, S. Deandrea, E. Bandieri, S. Cavuto, Quality ofcancer pain management: an update of a systematic review ofundertreatment of patients with cancer, J. Clin. Oncol. 32 (2014) 4149–4156,http://dx.doi.org/10.1200/JCO.2014.56.0383.
[27] C. Li, J. Ni, Z. Wang, M. Li, M. Gasparic, B. Terhaag, M.A. Überall, Analgesicefficacy and tolerability of flupirtine vs. tramadol in patients with subacutelow back pain : a double-blind multicentre trial, Curr. Med. Res. Opin. 24(2008) 3523–3530, http://dx.doi.org/10.1185/03007990802579769.
[28] J. Karan, R.K. Karwasra, R. Godara, A.R. Bansal, R. Tripura, A prospectiverandomized comparative evaluation of flupirtine and diclofenac sodium inpost inguinal hernia surgery pain, Int. J. Recent. Surg. Med. Sci. 2 (2016)107–110, http://dx.doi.org/10.5455/ijsm.inguinalhernia.
[29] Withdrawal of pain medicine flupirtine endorsed, EMA/153044/2018. (n.d.).[30] C. Bock, A. Link, How to replace the lost keys? Strategies towards safer KV7
Channel Openers, Future Med. Chem. 11 (2019) 337–355.[31] A.S. Surur, K. Beirow, C. Bock, L. Schulig, M.K. Kindermann, A. Bodtke, W.
Siegmund, P.J. Bednarski, A. Link, Flupirtine analogues: explorative synthesisand influence of chemical structure on KV7.2/KV7.3 channel opening activity,ChemistryOpen 8 (2019) 41–44, http://dx.doi.org/10.1002/open.201800244.
[32] C. Bock, K. Beirow, A.S. Surur, L. Schulig, A. Bodtke, P.J. Bednarski, A. Link,Synthesis and potassium Kv7 channel opening activity of thioether analoguesof the analgesic flupirtine, Org. Biomol. Chem. 16 (2018) 8695–8699, http://dx.doi.org/10.1039/c8ob02530d.
[33] X. Du, H. Gao, D. Jaffe, H. Zhang, N. Gamper, M-type K+ channels in peripheralnociceptive pathways, Br. J. Pharmacol. 175 (2018) 2158–2172, http://dx.doi.org/10.1111/bph.13978.
[34] M.A. Seefeld, H. Lin, J. Holenz, D. Downie, B. Donovan, T. Fu, K. Pasikanti, W.Zhen, M. Cato, K.W. Chaudhary, P. Brady, T. Bakshi, D. Morrow, S. Rajagopal, S.Kumar, N. Madhyastha, B. Mohan, R.W. Dougherty, R. Bhamidipati, Z. Mohd,G.A. Higgins, M. Chapman, C. Rouget, P. Lluel, Y. Matsuoka, Novel KV7 ionchannel openers for the treatment of epilepsy and implications for detrusortissue contraction, Bioorg. Med. Chem. Lett. 28 (2018) 3793–3797, http://dx.doi.org/10.1016/j.bmcl.2018.09.036.
[35] J. Makoukji, F. Saadeh, K.A. Mansour, S. El-sitt, J. Al Ali, N. Kinarivala, P.C.Trippier, R. Boustany, Flupirtine derivatives as potential treatment for theneuronal ceroid lipofuscinoses, Ann. Clin. Transl. Neurol. 5 (2018) 1089–1103,http://dx.doi.org/10.1002/acn3.625.
[36] V. Barrese, J.B. Stott, I.A. Greenwood, KCNQ-encoded potassium channels astherapeutic targets, Annu. Rev. Pharmacol. Toxicol. 58 (2018) 625–648, http://dx.doi.org/10.1146/annurev-pharmtox-010617-052912.
[37] A.S. Surur, C. Bock, K. Beirow, K. Wurm, L. Schulig, M.K. Kindermann, P.J.Bednariski, A. Link, Flupirtine and retigabine as templates for ligand-baseddrug design of KV7.2/3 activators, Org. Biomol. Chem. Accepted (2019), http://dx.doi.org/10.1039/C9OB00511K.
[38] K. Konishi, T. Fukami, T. Ogiso, M. Nakajima, In vitro approach to elucidate therelevance of carboxylesterase 2 and N-acetyltransferase 2 toflupirtine-induced liver injury, Biochem. Pharmacol. 155 (2018) 242–251,http://dx.doi.org/10.1016/j.bcp.2018.07.019.
[39] J. Dörr, K. Wernecke, J. Würfel, J. Bellmann-strobl, V. Siffrin, M. Sättler, M.Simons, A. Linsa, H. Tumani, F. Paul, Disease modification in multiple sclerosisby flupirtine – results of a randomized placebo controlled phase II Trial, Front.Neurol. 9 (2018) 1–6, http://dx.doi.org/10.3389/fneur.2018.00842.
[40] ChemAxon, Chemicalize, 2019 https://chemicalize.com/.[41] V. Franco, G. Gatti, R. Marchiselli, M. Paola, E. Perucca, A simple and rapid
HPLC-UV method for the determination of retigabine in human plasma,Biomed. Chromatogr. 32 (2018) 1–6, http://dx.doi.org/10.1002/bmc.4168.
[42] H. Pan, H. Zhou, S. Zeng, X. Xu, H. An, H. Jiang, Identification and simultaneousdetermination of p-FHA and p-FBA, two metabolites of anti-tumoragent—Fluorapacin in rat urine, J. Chromatogr. B. 877 (2009) 1553–1560,http://dx.doi.org/10.1016/j.jchromb.2009.03.044.
[43] D. Benhaim, E. Grushka, Characterization of the GEMINI C18TM column:lipophilicity measurement and LSER, J. Liq. Chromatogr. Relat. Technol. 31(2008) 2198–2218, http://dx.doi.org/10.1080/10826070802279202.
[44] G.M. Fassauer, R. Hofstetter, M. Hasan, S. Oswald, C. Modeß, W. Siegmund, A.Link, Ketamine metabolites with antidepressant effects: fast, economical, andeco-friendly enantioselective separation based on supercritical-fluidchromatography (SFC) and single quadrupole MS detection, J. Pharm. Biomed.Anal. 146 (2017) 410–419, http://dx.doi.org/10.1016/j.jpba.2017.09.007.
[45] R. Hofstetter, G.M. Fassauer, A. Link, Supercritical fluid extraction (SFE) ofketamine metabolites from dried urine and on-line quantification bysupercritical fluid chromatography and single mass detection (on-lineSFE–SFC–MS), J. Chromatogr. B Anal. Technol. Biomed. Life Sci. 1076 (2018)77–83, http://dx.doi.org/10.1016/j.jchromb.2018.01.024.
[46] E.L. Regalado, C.J. Welch, Separation of achiral analytes using supercriticalfluid chromatography with chiral stationary phases, Trends Analyt. Chem. 67(2015) 74–81, http://dx.doi.org/10.1016/j.trac.2015.01.004.
[47] I. Matarashvili, D. Ghughunishvili, L. Chankvetadze, N. Takaishvili, T.Khatiashvili, M. Tsintsadze, T. Farkas, F. Bezhan, Separation of enantiomers ofchiral weak acids with polysaccharide-based chiral columns andaqueous-organic mobile phases in high-performance liquid chromatography:typical reversed-phase behavior? J. Chromatogr. A 1483 (2017) 86–92, http://dx.doi.org/10.1016/j.chroma.2016.12.064.
[48] M. Li, Y. Zhao, J. Yu, J. Wang, X. Guo, Study of the enantiomeric separation ofthe anticholinergic drugs on two immobilized polysaccharide-based chiralstationary phases by HPLC and the possible chiral, Electrophoresis. 39 (2018)1361–1369, http://dx.doi.org/10.1002/elps.201800039.
[49] P. Peluso, V. Mamane, R. Dallocchio, A. Dessì, R. Vallano, D. Sanna, E. Aubert, P.Pale, S. Cossu, Polysaccharide-based chiral stationary phases as halogen bondacceptors: A novel strategy for detection of stereoselective sigma-hole bonds
155
R.K. Hofstetter et al. / J. Chromatogr. A 1603 (2019) 338–347 347
in solution, J. Sep. Sci. 41 (2017) 1247–1256, http://dx.doi.org/10.1002/jssc.201701206.
[50] V. Desfontaine, D. Guillarme, E. Francotte, L. Nováková, Supercritical fluidchromatography in pharmaceutical analysis, J. Pharm. Biomed. Anal. 113(2015) 56–71, http://dx.doi.org/10.1016/j.jpba.2015.03.007.
[51] A. Lindahl, S. Sääf, J. Lehtiö, A. Nordström, Tuning matabolome coverage inreversed phase LC-MS metabolomics of MeOH extracted samples using thereconstitution solvent composition, Anal. Chem. 89 (2017) 7356–7364, http://dx.doi.org/10.1021/acs.analchem.7b00475.
[52] C. Polson, P. Sarkar, B. Incledon, V. Raguvaran, R. Grant, Optimisation ofprotein precipitation based upon effectiveness of protein removal andionisation effect in liquid chromatography-tandem mass spectrometry, J.Chromatogr. B 785 (2003) 263–275, http://dx.doi.org/10.1016/S1570-0232(02)00914-5.
[53] H. Takeda, Y. Izumi, M. Takahashi, T. Paxton, S. Tamura, T. Koike, Y. Yu, N.Kato, K. Nagase, M. Shiomi, T. Bamba, Widely-targeted quantitative lipidomicsmethodology by supercritical fluid chromatography coupled withfast-scanning triple quadrupole mass spectrometry, J. Lipid Res. 5 (2018),http://dx.doi.org/10.1194/jlr.D083014, Supplementary information.
[54] Y. Fujito, Y. Hayakawa, Y. Izumi, T. Bamba, Importance of optimizingchromatographic conditions and mass spectrometric parameters forsupercritical fluid chromatography/mass spectrometry, J. Chromatogr. A 1508(2017) 138–147, http://dx.doi.org/10.1016/j.chroma.2017.05.071.
[55] R. Hofstetter, G.M. Fassauer, A. Link, The many (inter-)faces of supercriticalfluid chromatography: the present and future prospects of onlinesupercritical fluid extraction–supercritical fluid chromatography, Bioanalysis10 (2018) 1073–1076, http://dx.doi.org/10.4155/bio-2018-0100.
[56] M. Kobori, Y. Takahashi, H. Takeda, M. Takahashi, Y. Izumi, Y. Akimoto, M.Sakurai, H. Oike, T. Nakagawa, M. Itoh, T. Bamba, T. Kimura, Dietary intake ofcurcumin improves eIF2 signaling and reduces lipid levels in the whiteadipose tissue of obese mice /631/45/608 /631/337/2019/692/699/2743/2037 /38/61 /64/60 /38/39 article, Sci. Rep. 8 (2018) 1–13,http://dx.doi.org/10.1038/s41598-018-27105-w.
[57] M. Suzuki, S. Nishiumi, T. Kobayashi, A. Sakai, Y. Iwata, T. Uchikata, Y. Izumi, T.Azuma, T. Bamba, M. Yoshida, Use of on-line supercritical fluidextraction-supercritical fluid chromatography/tandem mass spectrometry toanalyze disease biomarkers in dried serum spots compared with serumanalysis using liquid chromatography/tandem mass spectrometry, RapidCommun. Mass Spectrom. 31 (2017) 886–894, http://dx.doi.org/10.1002/rcm.7857.
[58] S.J. Kumari, A. Ubhayasekera, S.R. Acharya, J. Bergquist, A novel, fast andsensitive supercritical fluid chromatography-tandem mass spectrometry(SFC-MS/MS) method for analysis of arachidonic acid metabolites, Analyst143 (2018) 3661–3669, http://dx.doi.org/10.1039/C8AN00788H.
[59] T. Ogawa, Y. Izumi, K. Kusumoto, E. Fukusaki, T. Bamba, Wide target analysisof acylglycerols in miso (Japanese fermented soybean paste) by supercriticalfluid chromatography coupled with triple quadrupole mass spectrometry andthe analysis of the correlation between taste and both acylglycerols and freefatty, Rapid Commun. Mass Spectrom. 31 (2017) 928–936, http://dx.doi.org/10.1002/rcm.7862.
[60] T. Yoshioka, Y. Nagatomi, K. Harayama, T. Bamba, Development of ananalytical method for polycyclic aromatic hydrocarbons in coffee beveragesand dark beer using novel high-sensitivity technique of supercritical fluidchromatography/mass spectrometry, J. Biosci. Bioeng. 126 (2018) 126–130,http://dx.doi.org/10.1016/J.JBIOSC.2018.01.014.
[61] M. Sakai, Y. Hayakawa, Y. Funada, T. Ando, E. Fukusaki, T. Bamba,Development of a practical online supercritical fluid extraction–supercriticalfluid chromatography/mass spectrometry system with an integratedsplit-flow method, J. Chromatogr. A. (2019), http://dx.doi.org/10.1016/j.chroma.2019.01.044, Ahead of p.
[62] M. Zoccali, D. Giuffrida, F. Sala, S.V. Giofr, L. Mondello, Carotenoids andapocarotenoids determination in intact human blood samples by onlinesupercritical fluid extraction-supercritical fluid chromatography-tandemmass spectrometry, Anal. Chim. Acta 1032 (2018) 40–47, http://dx.doi.org/10.1016/j.aca.2018.06.022.
156
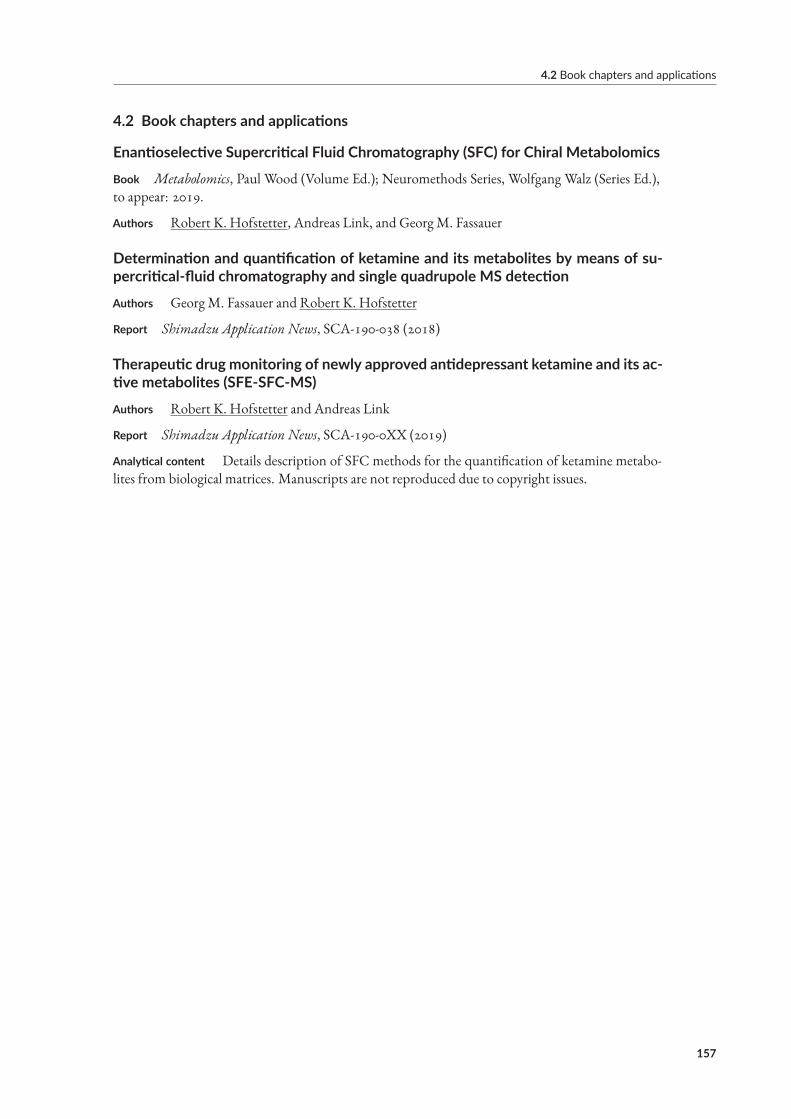
4.2 Book chapters and applications
4.2 Book chapters and applications
Enantioselective Supercritical Fluid Chromatography (SFC) for Chiral Metabolomics
Book Metabolomics, Paul Wood (Volume Ed.); Neuromethods Series, Wolfgang Walz (Series Ed.),to appear: 2019.
Authors Robert K. Hofstetter, Andreas Link, and Georg M. Fassauer
Determination and quantification of ketamine and its metabolites by means of su‐percritical‐fluid chromatography and single quadrupole MS detection
Authors GeorgM. Fassauer and Robert K. Hofstetter
Report Shimadzu Application News, SCA-190-038 (2018)
Therapeutic drug monitoring of newly approved antidepressant ketamine and its ac‐tive metabolites (SFE‐SFC‐MS)
Authors Robert K. Hofstetter and Andreas Link
Report Shimadzu Application News, SCA-190-0XX (2019)
Analytical content Details description of SFC methods for the quantification of ketamine metabo-lites from biological matrices. Manuscripts are not reproduced due to copyright issues.
157

This page has been intentionally left blank.
Declaration
Statutory declaration
I hereby declare that the submitted dissertation was written independently and I have not used anyoutside assistance except for the cited references and other sources stated in the document. I havenot adopted any text sections of a third party without consent. I am aware that the violation of thisregulation will lead to the failure of the dissertation.
Eigenständigkeitserklärung
Hiermit erkläre ich, dass diese Arbeit bisher vonmir weder an derMathematisch-Naturwissenschaft-lichen Fakultät der Universität Greifswald noch einer anderen wissenschaftlichen Einrichtung zumZwecke der Promotion eingereicht wurde.
Ferner erkläre ich, dass ich dieseArbeit selbstständig verfasst undkeine anderen als die darin angegebe-nen Hilfsmittel und Hilfen benutzt und keine Textabschnitte eines Dritten ohne Kennzeichnungübernommen habe.
Robert K. Hofstetter
(signature)
159

This page has been intentionally left blank.
Acknowledgements
My deepest gratitude to a number of people: I never would have started nor completed this doctoralstudy without their support.
My supervisor, Prof. Dr. Andreas Link, who welcomed me into his wonderful team. You gave usroom to develop our own ideas and still get stuff done. Also, thank you for not terminating our posi-tionmidwaywhenwe foundoutwhich of our lab surfaceswere solvent resistant (andwhichweren’t).
My family. I never will be able to repay you. Really, you will not see that money again.
My co-conspirators in analytical, editorial and personal matters. mk for being the best of colleagues.me for havingmy back. tö for refraining from breakingmy back. LS, the motor cortex of this thesis.Pars pro toto.
My team of undergraduate students. Each of you brought a different skill set to the table that left itsmark on the quality of this work. I am glad to call you my enablers.
My former supervisors, Prof. Dr. Ulrike Lindequist and Prof. Dr. Akihiko Maeda, whose excellentadvise – to seek out Prof. Dr. Link andどんどん失敗してください – was extremely helpful.
I thank Shimadzu for providing excellent training under Dr. Qisheng Zhong andMr. Akihiro Kuni-sawa at Osaka University, as well as Dr. Schulze for his good offices. I also thank theNational Centerfor Advancing Translational Sciences (NCATS), National Institutes ofHealth, for enantiopure stan-dards of HNK.
Each individual touched upon here deserves to be placed at the top of this list, mentioned first andby name. I will try to thank you in person and through action. Until then, please consider yourselfthe foundation of this work.
– A circle has no end. –
161
Related Documents