Interdecadal variability in Labrador Sea precipitation minus evaporation and salinity Paul G. Myers a, * , Simon A. Josey b , Brett Wheler a , Nilgun Kulan a,1 a Department of Earth and Atmospheric Sciences, University of Alberta, Edmonton, Alberta, Canada T6G 2E3 b James Rennell Division for Ocean Circulation and Climate, National Oceanography Centre, Empress Dock, Southampton SO14 3ZH, UK Accepted 19 June 2006 Available online 21 April 2007 Abstract Changes in the air–sea freshwater flux (equivalently Precipitation minus Evaporation, P E) over the interior of the Labrador Sea have been examined using the NCEP/NCAR and ERA40 reanalyses. A major increase in the net precipi- tation, equivalent to 9 cm yr 1 , is observed in the mid-1970s, consistent with a recent study that reported a similar change in the eastern sub-polar gyre. The increase in the Labrador Sea is primarily driven by changes in the P component which occur in spring (and to a lesser extent summer). The seasonality of the change is markedly different to that found for the eastern gyre which had a strong winter increase in precipitation. Potential links between the Labrador Sea P E increase and the NAO and other leading modes of atmospheric variability have been explored, but it has been found that the increase is not driven by long-term trends in these modes. The magnitudes of the increase in freshwater content for a range of depths (500, 1000, 1500, 2000 m) in the Labrador Sea are then calculated. Finally, it is suggested that the P E increase must have played some role in causing the observed freshening of the Labrador Sea and the wider North Atlantic sub-polar gyre region in recent decades, although the exact impact can not be quantified. Ó 2007 Elsevier Ltd. All rights reserved. 1. Introduction A number of recent studies (Dickson et al., 2002; Curry et al., 2003; Curry and Mauritzen, 2005) have sug- gested that the North Atlantic Ocean at high latitudes has been freshening over the last several decades. As the North Atlantic is one of the few regions of the world ocean where deep waters are formed, this freshwater signal is being transferred into the deep oceans (Dickson et al., 2002). The North Atlantic is a major source of deep waters for the world ocean and thus, a key player in the global meridional overturning circulation. This source is potentially very sensitive to additions of freshwater, through freshwater’s role as a stabilizing element in the buoyancy budget. Sources for the enhanced supply of freshwater to the northern North Atlantic 0079-6611/$ - see front matter Ó 2007 Elsevier Ltd. All rights reserved. doi:10.1016/j.pocean.2006.06.003 * Corresponding author. Tel.: +1 780 4926706; fax: +1 780 4922030. E-mail addresses: [email protected] (P.G. Myers), [email protected] (S.A. Josey), [email protected] (N. Kulan). 1 Present address: Department of Earth and Ocean Sciences, University of British Columbia, Vancouver, British Columbia, Canada. Progress in Oceanography 73 (2007) 341–357 Progress in Oceanography www.elsevier.com/locate/pocean

Welcome message from author
This document is posted to help you gain knowledge. Please leave a comment to let me know what you think about it! Share it to your friends and learn new things together.
Transcript
Progress in Oceanography 73 (2007) 341–357
Progress inOceanography
www.elsevier.com/locate/pocean
Interdecadal variability in Labrador Sea precipitationminus evaporation and salinity
Paul G. Myers a,*, Simon A. Josey b, Brett Wheler a, Nilgun Kulan a,1
a Department of Earth and Atmospheric Sciences, University of Alberta, Edmonton, Alberta, Canada T6G 2E3b James Rennell Division for Ocean Circulation and Climate, National Oceanography Centre, Empress Dock, Southampton SO14 3ZH, UK
Accepted 19 June 2006Available online 21 April 2007
Abstract
Changes in the air–sea freshwater flux (equivalently Precipitation minus Evaporation, P � E) over the interior of theLabrador Sea have been examined using the NCEP/NCAR and ERA40 reanalyses. A major increase in the net precipi-tation, equivalent to 9 cm yr�1, is observed in the mid-1970s, consistent with a recent study that reported a similar changein the eastern sub-polar gyre. The increase in the Labrador Sea is primarily driven by changes in the P component whichoccur in spring (and to a lesser extent summer). The seasonality of the change is markedly different to that found for theeastern gyre which had a strong winter increase in precipitation. Potential links between the Labrador Sea P � E increaseand the NAO and other leading modes of atmospheric variability have been explored, but it has been found that theincrease is not driven by long-term trends in these modes. The magnitudes of the increase in freshwater content for a rangeof depths (500, 1000, 1500, 2000 m) in the Labrador Sea are then calculated. Finally, it is suggested that the P � E increasemust have played some role in causing the observed freshening of the Labrador Sea and the wider North Atlantic sub-polargyre region in recent decades, although the exact impact can not be quantified.� 2007 Elsevier Ltd. All rights reserved.
1. Introduction
A number of recent studies (Dickson et al., 2002; Curry et al., 2003; Curry and Mauritzen, 2005) have sug-gested that the North Atlantic Ocean at high latitudes has been freshening over the last several decades. As theNorth Atlantic is one of the few regions of the world ocean where deep waters are formed, this freshwatersignal is being transferred into the deep oceans (Dickson et al., 2002). The North Atlantic is a major sourceof deep waters for the world ocean and thus, a key player in the global meridional overturning circulation.This source is potentially very sensitive to additions of freshwater, through freshwater’s role as a stabilizingelement in the buoyancy budget. Sources for the enhanced supply of freshwater to the northern North Atlantic
0079-6611/$ - see front matter � 2007 Elsevier Ltd. All rights reserved.
doi:10.1016/j.pocean.2006.06.003
* Corresponding author. Tel.: +1 780 4926706; fax: +1 780 4922030.E-mail addresses: [email protected] (P.G. Myers), [email protected] (S.A. Josey), [email protected] (N. Kulan).
1 Present address: Department of Earth and Ocean Sciences, University of British Columbia, Vancouver, British Columbia, Canada.
342 P.G. Myers et al. / Progress in Oceanography 73 (2007) 341–357
over recent decades include changes in excess precipitation (Josey and Marsh, 2005), river runoff (Petersonet al., 2002), melt from the Greenland ice cap (Steffen et al., 2004) and the export of sea-ice from the ArcticOcean (Dickson et al., 2000; Vinje, 2001).
As well as the long-term freshening, observations have been made of strong low salinity anomalies prop-agating around the sub-polar gyre (Dickson et al., 1988; Belkin et al., 1998) during the 1970s, 1980s and pos-sibly 1990s. These events, termed Great Salinity Anomalies (GSAs), were tracked passing from the NordicSeas, through the Irminger Sea into the Labrador Sea and then back into the eastern part of the gyre. Theorigin of these anomalies has been suggested to be enhanced export of freshwater/sea-ice through Fram Strait(Dickson et al., 1988; Belkin et al., 1998), extreme winters in the Labrador Sea (Belkin et al., 1998), enhancedfreshwater outflow from the Canadian Arctic Archipelago (Belkin et al., 1998) or some combination of theabove.
Josey and Marsh (2005) examined the variability in the air–sea flux of freshwater in the eastern half ofthe sub-polar gyre. Using atmospheric reanalysis data (NCEP, ERA40) they showed a major increase inP � E within the region during the 1970s. They also found that this change in P � E was mainly drivenby changes in precipitation and was linked to the East Atlantic Pattern, rather than the North AtlanticOscillation (NAO). Integrating the effect of the enhanced atmospheric provision of freshwater to thesea surface, they found that this flux was large enough to explain observations by Reverdin et al.(2002) of sea surface freshening along a section at 60 N in this region. Gonzalez-Pola et al. (2005) alsofound that the P � E regime is the main driver for changes in the salinity of Eastern North AtlanticCentral Water in the Bay of Biscay.
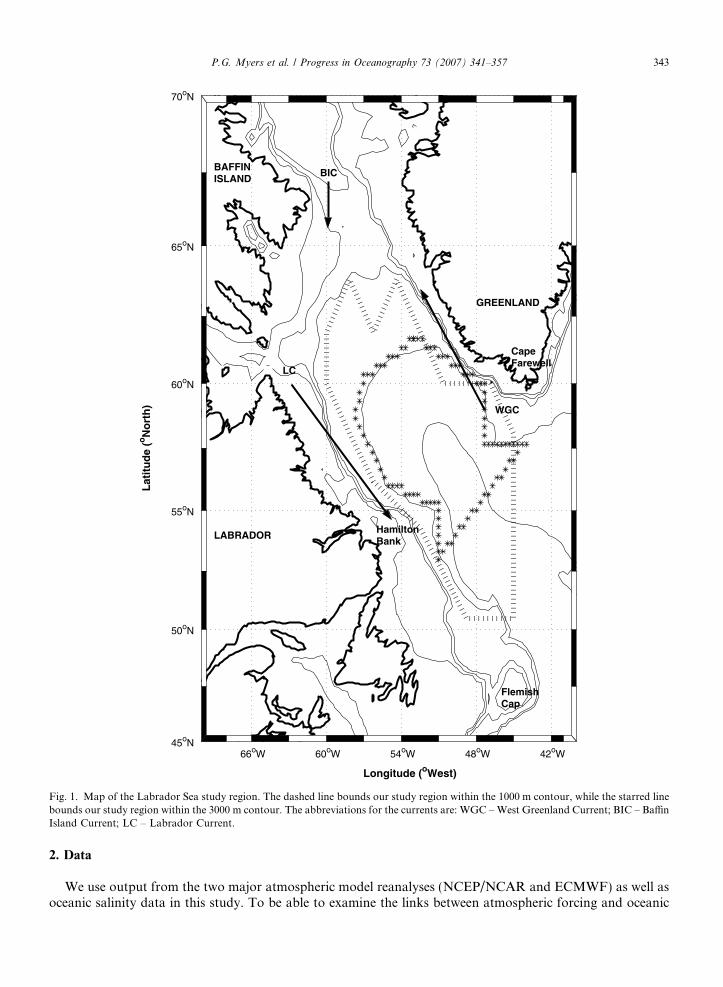
The Labrador Sea (Fig. 1) is a northern arm of the North Atlantic Ocean, shaped as a large bowl open tothe south, flanked by continental shelves, narrow along Greenland and wider along the Labrador Coast.Along these shelves and over the shelf breaks flow the West Greenland Current, the Baffin Island Currentand the Labrador Current, linking the large scale cyclonic circulation of the region. Near the surface theseboundary currents carry mainly cold and fresh water, isolated from the weakly stratified basin interior bystrong fronts (Lazier and Wright, 1993).
Walsh and Portis (1999) also used reanalysis data to examine variations of precipitation and evaporationover the North Atlantic Ocean, during the last 4 decades. They divided the basin into a number of sub-regions,one of which contained large parts of the Labrador Sea, as well as parts of Hudson Strait and lower Baffin Bay(their region R3). They found an inverse relationship between precipitation and the NAO in this region andsome evidence for reduced precipitation in the mid-1960s to early 1970s. The variation in P and E for the Lab-rador Sea alone was not quantified and thus the magnitude of changes in the freshwater flux to the sea remainsto be fully determined.
Houghton and Visbeck (2002) examined quasi-decadal fluctuations in salinity in the Labrador Sea andfound that they were due to both local and remote forcing. More recently observational (Loder et al.,1998; Schmidt and Send, submitted for publication) and modelling (Katsman et al., 2004) work hasstarted to examine how freshwater is exchanged between the boundary currents and the interior, to influ-ence restratification within the gyre interior. For example, Schmidt and Send (submitted for publication)suggest that the majority of the annual freshwater supply to the interior derives from the West GreenlandCurrent. In contrast, Myers (2005) suggested that increased export of freshwater from the Arctic into theLabrador Current on annual to decadal time scales does not necessarily lead to an enhanced freshwatercontent in the interior of the Labrador Sea. Thus, the question arises as to whether changes in P � E overthe interior of the Labrador Sea play a role in the observed freshening within this basin. We address thisquestion by examining interdecadal changes in the freshwater flux to the Labrador Sea using both NCEP/NCAR and ERA40 reanalyses with the focus being on the interior of the basin. We use two definitions ofthe interior of the basin, both shown in Fig. 1. One includes all of the basin beyond the continentalshelves and upper slopes, defined where the water depth is greater than 1000 m. The area of this regionis 106 km2. We also focus on a smaller region more consistent with the zones of deep water formation(Lilly et al., 1999), defined where the water is deeper than 3000 m, with an area of 4 · 105 km2. This cen-tral region covers our ocean data analysis, with a resolution of 1/3 deg. Our aims are to determinewhether any long-term changes in the atmospheric provision of freshwater to the basin have occurred,what is driving these changes and what their impact is on salinity.
66oW 60oW 54oW 48oW 42oW 45oN
50oN
55oN
60oN
65oN
70oN
Lat
itu
de
(oN
ort
h)
BAFFINISLAND
GREENLAND
LABRADOR
FlemishCap
HamiltonBank
CapeFarewell
WGC
BIC
LC
Longitude (oWest)
Fig. 1. Map of the Labrador Sea study region. The dashed line bounds our study region within the 1000 m contour, while the starred linebounds our study region within the 3000 m contour. The abbreviations for the currents are: WGC – West Greenland Current; BIC – BaffinIsland Current; LC – Labrador Current.
P.G. Myers et al. / Progress in Oceanography 73 (2007) 341–357 343
2. Data
We use output from the two major atmospheric model reanalyses (NCEP/NCAR and ECMWF) as well asoceanic salinity data in this study. To be able to examine the links between atmospheric forcing and oceanic
344 P.G. Myers et al. / Progress in Oceanography 73 (2007) 341–357
freshwater changes, we have considered the data over the longest possible period, even if some of the earlierdata is less reliable. In all such cases we show that choosing a different starting year for the analysis does notchange our main results.
The NCEP/NCAR and ERA40 atmospheric model reanalyses are described in Kistler et al. (2001) andSimmons and Gibson (2000), respectively. The NCEP/NCAR reanalysis is based on the 1995 version ofthe NCEP model and has a horizontal resolution of about 210 km. We have analysed NCEP/NCAR outputfor the period 1949–2002 but focus on the interval from 1958 onwards. The earlier fields are less reliable due toreductions in the amount and type of data available for assimilation (Kistler et al., 2001). The ERA40 reanal-ysis covers the interval September 1957–August 2002 and we have used 2.5 · 2.5 deg grid version of the outputfields. As the NCEP/NCAR fields have a higher resolution than ERA40 we used them as the primary datasetfor our study.
As proxy for the leading modes of atmospheric variability in the mid to high latitude North Atlantic, weemploy several widely used indices. These are produced by the National Oceanic and Atmospheric Adminis-tration/National Weather Service Climate Prediction Center (CPC). The indices are obtained from a methoddescribed by Barnston and Livezey (1987) consisting of a rotated principal component analysis of observed700 mb height anomalies. The indices we use are those for the NAO and Arctic Oscillation (AO) as well asthose for the associated East Atlantic Pattern (EAP) and East Atlantic Jet (EAJ).
The ocean salinity data were extracted from the extensive hydrographic database maintained by the Bed-ford Institute of Oceanography (BIO). To allow us to examine the time variability in salinity and freshwaterwithin the Labrador Sea, the data were mapped into overlapping 3-year running mean triads, covering theperiod 1949–1999. Each triad was defined to include all the data collected in a given year, as well as all avail-able data in the preceding and following year. The data were objectively mapped onto a 1/3 by 1/3 deg gridover the entire Labrador Sea using a modified version of the iterative Difference–correction scheme with depthdependence of Reynaud et al. (1995). Vertical binning and averaging was carried out using isopycnal coordi-nates. The isopycnal averaging avoids unrealistic diapycnal mixing of the properties by averaging them over asmaller range of isopycnals. To concentrate on changes within the interior of the Labrador Sea, the triad datawere then averaged over the region within the 3000 m isobath (Fig. 1) to give an average central Labrador Seasalinity for the central year of each triad, at each level. Details of the data processing (including quality con-trol), as well as further analysis of the resulting fields can be found in Kulan and Myers (submitted forpublication).
3. P � E variability
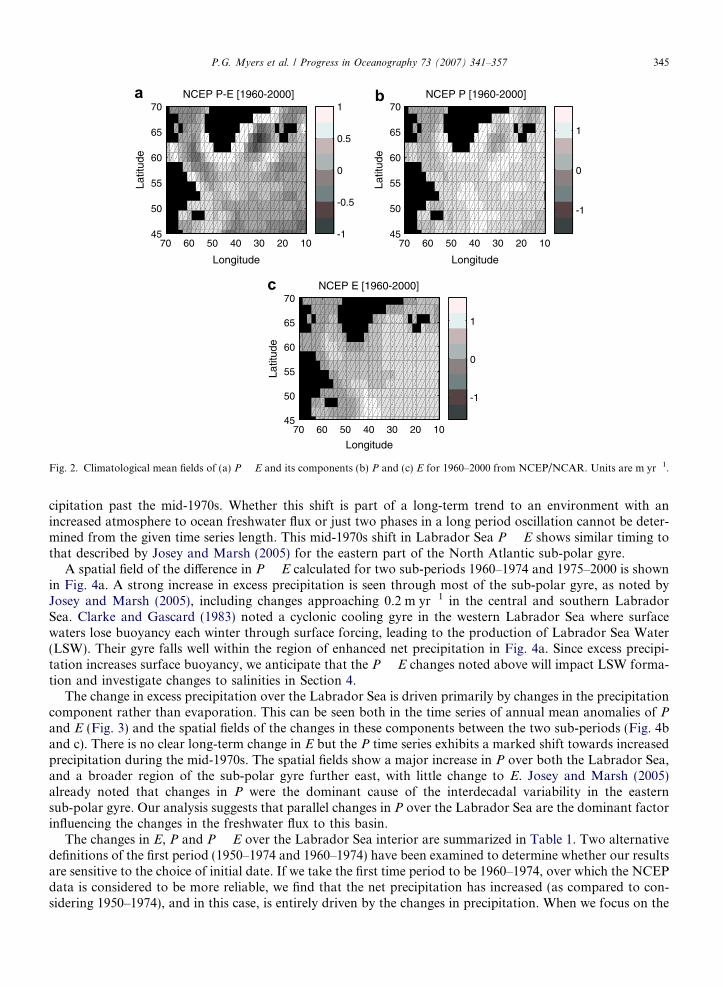
Climatological mean (1960–2000) fields of surface freshwater fluxes are shown in Fig. 2. The P � E field hasexcess precipitation through most of the sub-polar gyre, with maxima along the Greenland and Labrador Seacoasts, and a transition to net evaporation south of 45N (not shown). The component fields show that E tendsto decrease towards the coastal margins, possibly reflecting the effects of ice cover, whereas P remains rela-tively constant. These fields are consistent with other observationally derived products (Josey and Marsh,2005; Schmitt et al., 1989) as well as with the ERA40 reanalysis (Josey and Marsh, 2005). We have calculatedthe mean P � E for our Labrador Sea interior regions (Fig. 1) by averaging over each grid cell in the atmo-spheric analyses that falls within these domains. The full period mean value is an excess precipitation of27 cm yr�1 for the 1000 m region and 20 cm yr�1 for the 3000 m region, both of which are smaller than pre-vious estimates (e.g. 40 cm yr1; Walsh and Portis (1999) that included the more precipitative boundary currentregime. It should be pointed out that, at least in other regions of the globe, NCEP suffers from a strong drybias (Li and Chen, 2005). (Josey and Marsh, 2005) also found a dry bias with respect to rain gauge measure-ments in the eastern sub-polar gyre. In contrast there was good agreement between the temporal variability inNCEP/NCAR and the rain gauges. It is this variability we are interested in here.
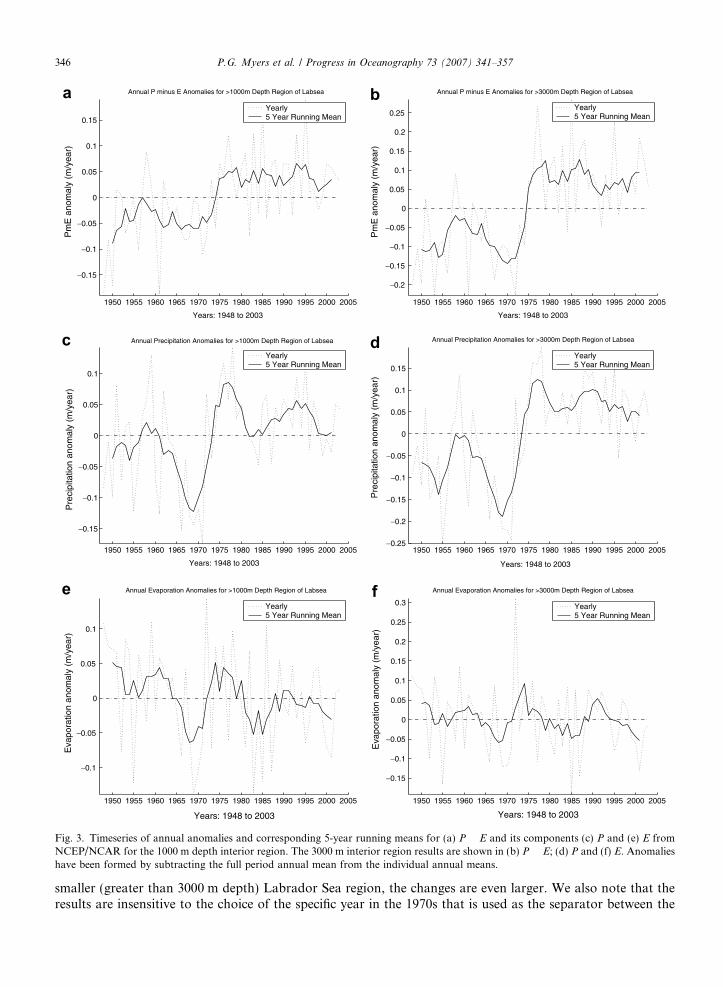
Time series of annual surface freshwater flux anomalies for our interior Labrador Sea regions are shown inFig. 3. Although in details the time series for the two regions vary, the general structures are very similar. Withrespect to their variance, the P � E time series are dominated by interannual variability but the 5-year runningmeans show a clear shift from negative to positive anomalies in the mid-1970s. The time series thus have twomain phases, relatively low net precipitation from the 1950s through to the 1970s and relatively high net pre-
Longitude
Latit
ude
NCEP P-E [1960-2000]
70 60 50 40 30 20 1045
50
55
60
65
70
-1
-0.5
0
0.5
1
Longitude
Latit
ude
NCEP P [1960-2000]
70 60 50 40 30 20 1045
50
55
60
65
70
-1
0
1
Longitude
Latit
ude
NCEP E [1960-2000]
70 60 50 40 30 20 1045
50
55
60
65
70
-1
0
1
Fig. 2. Climatological mean fields of (a) P � E and its components (b) P and (c) E for 1960–2000 from NCEP/NCAR. Units are m yr�1.
P.G. Myers et al. / Progress in Oceanography 73 (2007) 341–357 345
cipitation past the mid-1970s. Whether this shift is part of a long-term trend to an environment with anincreased atmosphere to ocean freshwater flux or just two phases in a long period oscillation cannot be deter-mined from the given time series length. This mid-1970s shift in Labrador Sea P � E shows similar timing tothat described by Josey and Marsh (2005) for the eastern part of the North Atlantic sub-polar gyre.
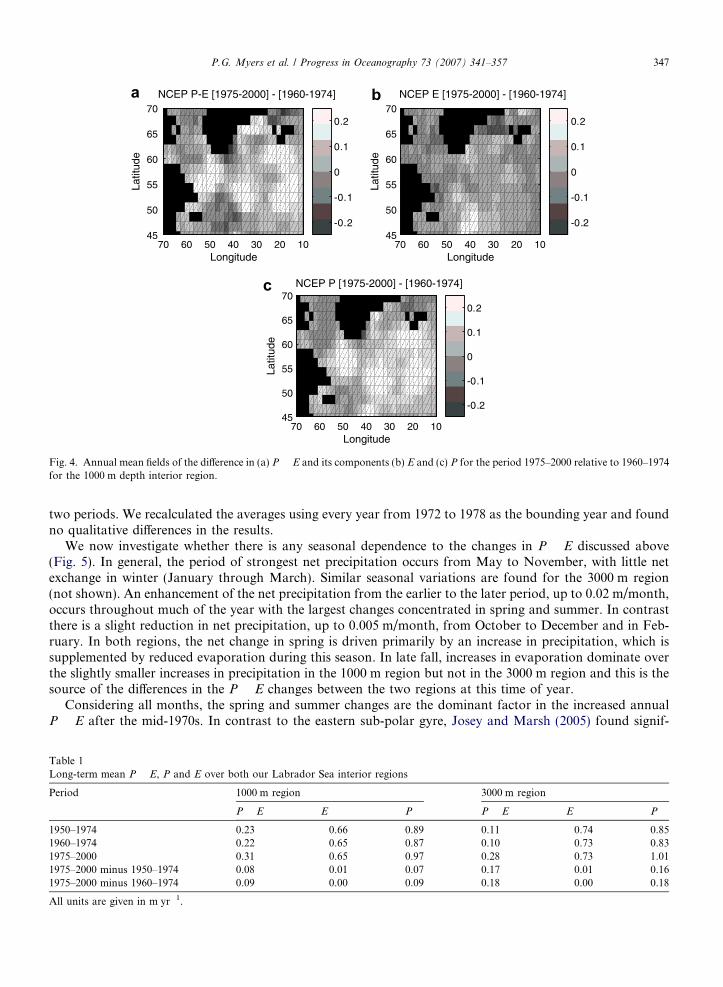
A spatial field of the difference in P � E calculated for two sub-periods 1960–1974 and 1975–2000 is shownin Fig. 4a. A strong increase in excess precipitation is seen through most of the sub-polar gyre, as noted byJosey and Marsh (2005), including changes approaching 0.2 m yr�1 in the central and southern LabradorSea. Clarke and Gascard (1983) noted a cyclonic cooling gyre in the western Labrador Sea where surfacewaters lose buoyancy each winter through surface forcing, leading to the production of Labrador Sea Water(LSW). Their gyre falls well within the region of enhanced net precipitation in Fig. 4a. Since excess precipi-tation increases surface buoyancy, we anticipate that the P � E changes noted above will impact LSW forma-tion and investigate changes to salinities in Section 4.
The change in excess precipitation over the Labrador Sea is driven primarily by changes in the precipitationcomponent rather than evaporation. This can be seen both in the time series of annual mean anomalies of P
and E (Fig. 3) and the spatial fields of the changes in these components between the two sub-periods (Fig. 4band c). There is no clear long-term change in E but the P time series exhibits a marked shift towards increasedprecipitation during the mid-1970s. The spatial fields show a major increase in P over both the Labrador Sea,and a broader region of the sub-polar gyre further east, with little change to E. Josey and Marsh (2005)already noted that changes in P were the dominant cause of the interdecadal variability in the easternsub-polar gyre. Our analysis suggests that parallel changes in P over the Labrador Sea are the dominant factorinfluencing the changes in the freshwater flux to this basin.
The changes in E, P and P � E over the Labrador Sea interior are summarized in Table 1. Two alternativedefinitions of the first period (1950–1974 and 1960–1974) have been examined to determine whether our resultsare sensitive to the choice of initial date. If we take the first time period to be 1960–1974, over which the NCEPdata is considered to be more reliable, we find that the net precipitation has increased (as compared to con-sidering 1950–1974), and in this case, is entirely driven by the changes in precipitation. When we focus on the
1950 1955 1960 1965 1970 1975 1980 1985 1990 1995 2000 2005
−0.15
−0.1
−0.05
0
0.05
0.1
0.15
Annual P minus E Anomalies for >1000m Depth Region of Labsea
Pm
E a
nom
aly
(m/y
ear)
Years: 1948 to 2003
1950 1955 1960 1965 1970 1975 1980 1985 1990 1995 2000 2005
−0.2
−0.15
−0.1
−0.05
0
0.05
0.1
0.15
0.2
0.25
Annual P minus E Anomalies for >3000m Depth Region of Labsea
Pm
E a
nom
aly
(m/y
ear)
Years: 1948 to 2003
1950 1955 1960 1965 1970 1975 1980 1985 1990 1995 2000 2005
−0.15
−0.1
−0.05
0
0.05
0.1
Annual Precipitation Anomalies for >1000m Depth Region of Labsea
Pre
cipi
tatio
n an
omal
y (m
/yea
r)
Years: 1948 to 2003
1950 1955 1960 1965 1970 1975 1980 1985 1990 1995 2000 2005−0.25
−0.2
−0.15
−0.1
−0.05
0
0.05
0.1
0.15
Annual Precipitation Anomalies for >3000m Depth Region of Labsea
Pre
cipi
tatio
n an
omal
y (m
/yea
r)
Years: 1948 to 2003
1950 1955 1960 1965 1970 1975 1980 1985 1990 1995 2000 2005
−0.1
−0.05
0
0.05
0.1
Annual Evaporation Anomalies for >1000m Depth Region of Labsea
Eva
pora
tion
anom
aly
(m/y
ear)
Years: 1948 to 2003
1950 1955 1960 1965 1970 1975 1980 1985 1990 1995 2000 2005
−0.15
−0.1
−0.05
0
0.05
0.1
0.15
0.2
0.25
0.3
Annual Evaporation Anomalies for >3000m Depth Region of Labsea
Eva
pora
tion
anom
aly
(m/y
ear)
Years: 1948 to 2003
Yearly5 Year Running Mean
Yearly5 Year Running Mean
Yearly5 Year Running Mean
Yearly5 Year Running Mean
Yearly5 Year Running Mean
Yearly5 Year Running Mean
Fig. 3. Timeseries of annual anomalies and corresponding 5-year running means for (a) P � E and its components (c) P and (e) E fromNCEP/NCAR for the 1000 m depth interior region. The 3000 m interior region results are shown in (b) P � E; (d) P and (f) E. Anomalieshave been formed by subtracting the full period annual mean from the individual annual means.
346 P.G. Myers et al. / Progress in Oceanography 73 (2007) 341–357
smaller (greater than 3000 m depth) Labrador Sea region, the changes are even larger. We also note that theresults are insensitive to the choice of the specific year in the 1970s that is used as the separator between the
Longitude
Latit
ude
NCEP P-E [1975-2000] - [1960-1974]
70 60 50 40 30 20 1045
50
55
60
65
70
-0.2
-0.1
0
0.1
0.2
Longitude
Latit
ude
NCEP E [1975-2000] - [1960-1974]
70 60 50 40 30 20 1045
50
55
60
65
70
-0.2
-0.1
0
0.1
0.2
Longitude
Latit
ude
NCEP P [1975-2000] - [1960-1974]
70 60 50 40 30 20 1045
50
55
60
65
70
-0.2
-0.1
0
0.1
0.2
Fig. 4. Annual mean fields of the difference in (a) P � E and its components (b) E and (c) P for the period 1975–2000 relative to 1960–1974for the 1000 m depth interior region.
P.G. Myers et al. / Progress in Oceanography 73 (2007) 341–357 347
two periods. We recalculated the averages using every year from 1972 to 1978 as the bounding year and foundno qualitative differences in the results.
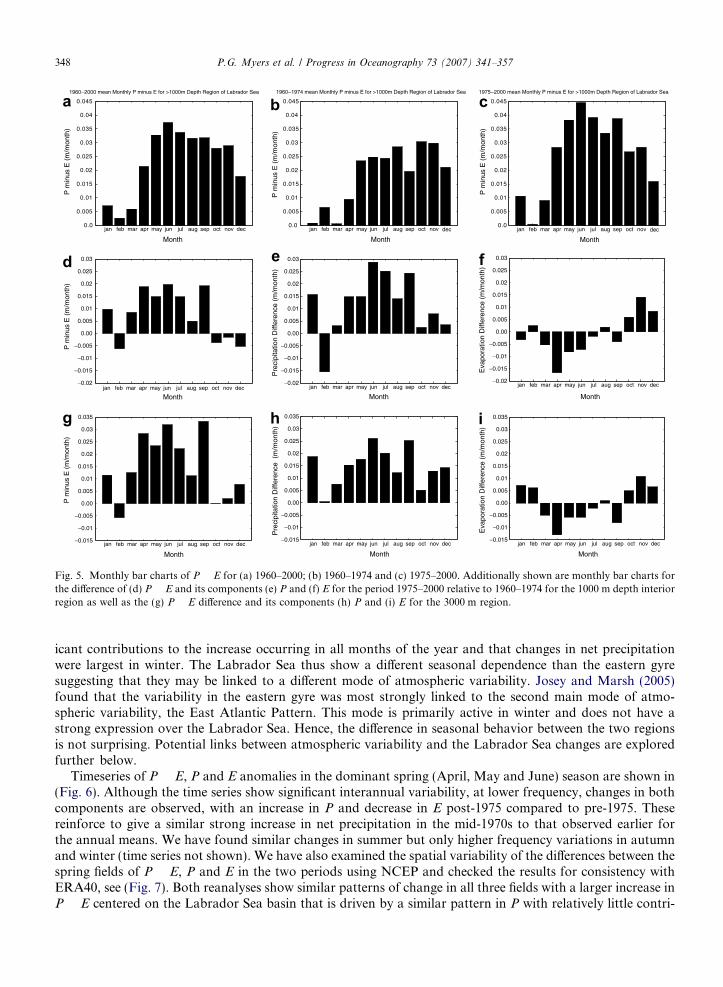
We now investigate whether there is any seasonal dependence to the changes in P � E discussed above(Fig. 5). In general, the period of strongest net precipitation occurs from May to November, with little netexchange in winter (January through March). Similar seasonal variations are found for the 3000 m region(not shown). An enhancement of the net precipitation from the earlier to the later period, up to 0.02 m/month,occurs throughout much of the year with the largest changes concentrated in spring and summer. In contrastthere is a slight reduction in net precipitation, up to 0.005 m/month, from October to December and in Feb-ruary. In both regions, the net change in spring is driven primarily by an increase in precipitation, which issupplemented by reduced evaporation during this season. In late fall, increases in evaporation dominate overthe slightly smaller increases in precipitation in the 1000 m region but not in the 3000 m region and this is thesource of the differences in the P � E changes between the two regions at this time of year.
Considering all months, the spring and summer changes are the dominant factor in the increased annualP � E after the mid-1970s. In contrast to the eastern sub-polar gyre, Josey and Marsh (2005) found signif-
Table 1Long-term mean P � E, P and E over both our Labrador Sea interior regions
Period 1000 m region 3000 m region
P � E E P P � E E P
1950–1974 0.23 0.66 0.89 0.11 0.74 0.851960–1974 0.22 0.65 0.87 0.10 0.73 0.831975–2000 0.31 0.65 0.97 0.28 0.73 1.011975–2000 minus 1950–1974 0.08 �0.01 0.07 0.17 �0.01 0.161975–2000 minus 1960–1974 0.09 0.00 0.09 0.18 0.00 0.18
All units are given in m yr�1.
jan feb mar apr may jun jul aug sep oct nov dec0.0
0.005
0.01
0.015
0.02
0.025
0.03
0.035
0.04
0.045
Month
P m
inus
E (
m/m
onth
)
1960−2000 mean Monthly P minus E for >1000m Depth Region of Labrador Sea
jan feb mar apr may jun jul aug sep oct nov dec0.0
0.005
0.01
0.015
0.02
0.025
0.03
0.035
0.04
0.045
Month
P m
inus
E (
m/m
onth
)
1960−1974 mean Monthly P minus E for >1000m Depth Region of Labrador Sea
0.0
0.005
0.01
0.015
0.02
0.025
0.03
0.035
0.04
0.045
P m
inus
E (
m/m
onth
)
1975−2000 mean Monthly P minus E for >1000m Depth Region of Labrador Sea
−0.02
−0.015
−0.01
−0.005
0.00
0.005
0.01
0.015
0.02
0.025
0.03
P m
inus
E (
m/m
onth
)
−0.02
−0.015
−0.01
−0.005
0.00
0.005
0.01
0.015
0.02
0.025
0.03
Pre
cipi
tatio
n D
iffer
ence
(m
/mon
th)
−0.02
−0.015
−0.01
−0.005
0.00
0.005
0.01
0.015
0.02
0.025
0.03
Eva
pora
tion
Diff
eren
ce (
m/m
onth
)
−0.015
−0.01
−0.005
0.00
0.005
0.01
0.015
0.02
0.025
0.03
0.035
P m
inus
E (
m/m
onth
)
−0.015
−0.01
−0.005
0.00
0.005
0.01
0.015
0.02
0.025
0.03
0.035
Pre
cipi
tatio
n D
iffer
ence
(m
/mon
th)
−0.015
−0.01
−0.005
0.00
0.005
0.01
0.015
0.02
0.025
0.03
0.035
Eva
pora
tion
Diff
eren
ce (
m/m
onth
)
jan feb mar apr may jun jul aug sep oct nov dec
Month
jan feb mar apr may jun jul aug sep oct nov dec
Month
jan feb mar apr may jun jul aug sep oct nov dec
Month
jan feb mar apr may jun jul aug sep oct nov dec
Month
jan feb mar apr may jun jul aug sep oct nov dec
Month
jan feb mar apr may jun jul aug sep oct nov dec
Month
jan feb mar apr may jun jul aug sep oct nov dec
Month
d e f
g h i
Fig. 5. Monthly bar charts of P � E for (a) 1960–2000; (b) 1960–1974 and (c) 1975–2000. Additionally shown are monthly bar charts forthe difference of (d) P � E and its components (e) P and (f) E for the period 1975–2000 relative to 1960–1974 for the 1000 m depth interiorregion as well as the (g) P � E difference and its components (h) P and (i) E for the 3000 m region.
348 P.G. Myers et al. / Progress in Oceanography 73 (2007) 341–357
icant contributions to the increase occurring in all months of the year and that changes in net precipitationwere largest in winter. The Labrador Sea thus show a different seasonal dependence than the eastern gyresuggesting that they may be linked to a different mode of atmospheric variability. Josey and Marsh (2005)found that the variability in the eastern gyre was most strongly linked to the second main mode of atmo-spheric variability, the East Atlantic Pattern. This mode is primarily active in winter and does not have astrong expression over the Labrador Sea. Hence, the difference in seasonal behavior between the two regionsis not surprising. Potential links between atmospheric variability and the Labrador Sea changes are exploredfurther below.
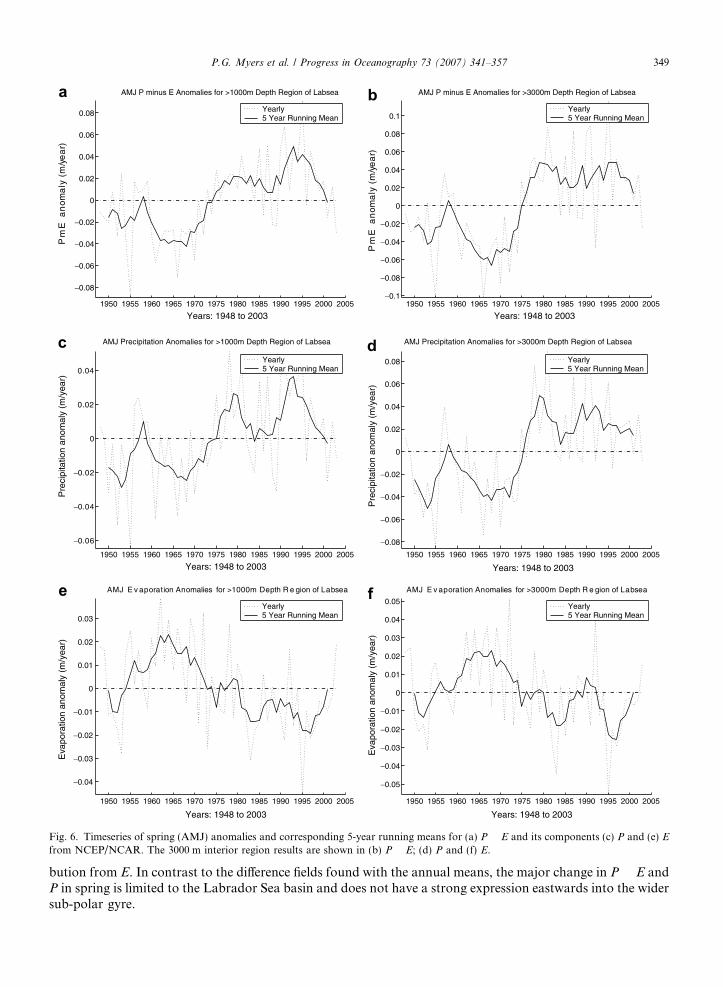
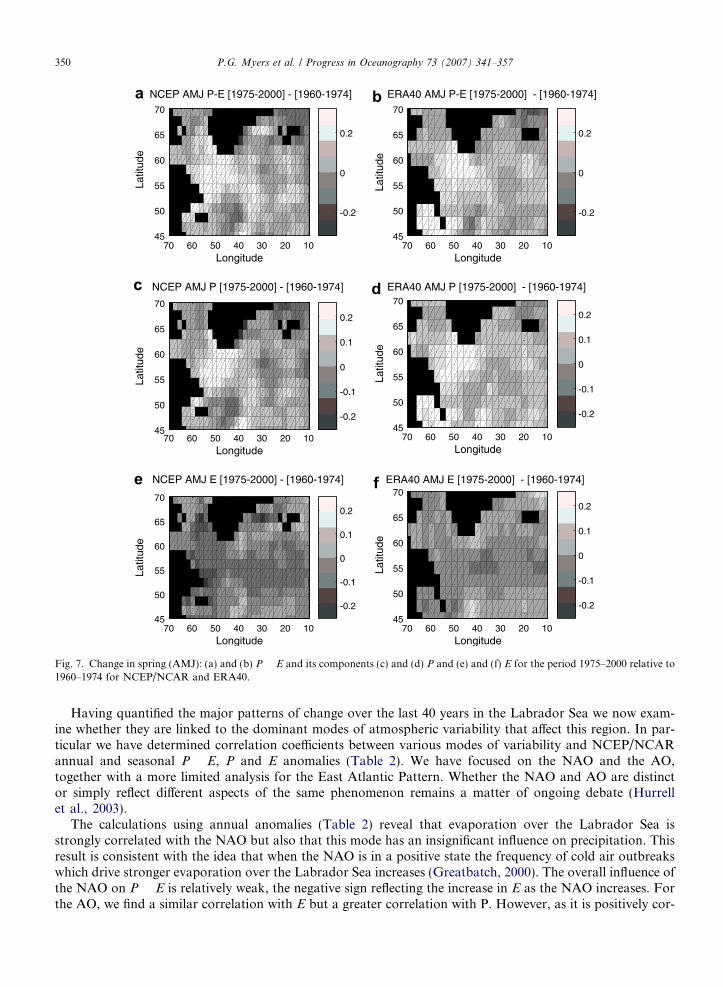
Timeseries of P � E, P and E anomalies in the dominant spring (April, May and June) season are shown in(Fig. 6). Although the time series show significant interannual variability, at lower frequency, changes in bothcomponents are observed, with an increase in P and decrease in E post-1975 compared to pre-1975. Thesereinforce to give a similar strong increase in net precipitation in the mid-1970s to that observed earlier forthe annual means. We have found similar changes in summer but only higher frequency variations in autumnand winter (time series not shown). We have also examined the spatial variability of the differences between thespring fields of P � E, P and E in the two periods using NCEP and checked the results for consistency withERA40, see (Fig. 7). Both reanalyses show similar patterns of change in all three fields with a larger increase inP � E centered on the Labrador Sea basin that is driven by a similar pattern in P with relatively little contri-
1950 1955 1960 1965 1970 1975 1980 1985 1990 1995 2000 2005
−0.08
−0.06
−0.04
−0.02
0
0.02
0.04
0.06
0.08
AMJ P minus E Anomalies for >1000m Depth Region of Labsea
Pm
E a
nom
aly
(m
/ye
ar)
Years: 1948 to 20031950 1955 1960 1965 1970 1975 1980 1985 1990 1995 2000 2005
−0.1
−0.08
−0.06
−0.04
−0.02
0
0.02
0.04
0.06
0.08
0.1
AMJ P minus E Anomalies for >3000m Depth Region of Labsea
Pm
E a
nom
aly
(m
/ye
ar)
Years: 1948 to 2003
1950 1955 1960 1965 1970 1975 1980 1985 1990 1995 2000 2005
−0.06
−0.04
−0.02
0
0.02
0.04
AMJ Precipitation Anomalies for >1000m Depth Region of Labsea
Pre
cipi
tatio
n an
omal
y (m
/yea
r)
Years: 1948 to 20031950 1955 1960 1965 1970 1975 1980 1985 1990 1995 2000 2005
−0.08
−0.06
−0.04
−0.02
0
0.02
0.04
0.06
0.08
AMJ Precipitation Anomalies for >3000m Depth Region of Labsea
Pre
cipi
tatio
n an
omal
y (m
/yea
r)
Years: 1948 to 2003
1950 1955 1960 1965 1970 1975 1980 1985 1990 1995 2000 2005
−0.04
−0.03
−0.02
−0.01
0
0.01
0.02
0.03
AMJ E v aporation Anomalies for >1000m Depth R e gion of Labsea
Eva
pora
tion
anom
aly
(m/y
ear)
Years: 1948 to 2003
1950 1955 1960 1965 1970 1975 1980 1985 1990 1995 2000 2005
−0.05
−0.04
−0.03
−0.02
−0.01
0
0.01
0.02
0.03
0.04
0.05
AMJ E v aporation Anomalies for >3000m Depth R e gion of Labsea
Eva
pora
tion
anom
aly
(m/y
ear)
Years: 1948 to 2003
Yearly5 Year Running Mean
Yearly5 Year Running Mean
Yearly5 Year Running Mean
Yearly5 Year Running Mean
Yearly5 Year Running Mean
Yearly5 Year Running Mean
Fig. 6. Timeseries of spring (AMJ) anomalies and corresponding 5-year running means for (a) P � E and its components (c) P and (e) E
from NCEP/NCAR. The 3000 m interior region results are shown in (b) P � E; (d) P and (f) E.
P.G. Myers et al. / Progress in Oceanography 73 (2007) 341–357 349
bution from E. In contrast to the difference fields found with the annual means, the major change in P � E andP in spring is limited to the Labrador Sea basin and does not have a strong expression eastwards into the widersub-polar gyre.
Longitude
Latit
ude
ERA40 AMJ P-E [1975-2000] - [1960-1974]
70 60 50 40 30 20 1045
50
55
60
65
70
-0.2
0
0.2
Longitude
Latit
ude
NCEP AMJ P-E [1975-2000] - [1960-1974]
70 60 50 40 30 20 1045
50
55
60
65
70
-0.2
0
0.2
Longitude
Latit
ude
ERA40 AMJ P [1975-2000] - [1960-1974]
70 60 50 40 30 20 1045
50
55
60
65
70
-0.2
-0.1
0
0.1
0.2
Longitude
Latit
ude
NCEP AMJ P [1975-2000] - [1960-1974]
70 60 50 40 30 20 1045
50
55
60
65
70
-0.2
-0.1
0
0.1
0.2
Longitude
Latit
ude
ERA40 AMJ E [1975-2000] - [1960-1974]
70 60 50 40 30 20 1045
50
55
60
65
70
-0.2
-0.1
0
0.1
0.2
Longitude
Latit
ude
NCEP AMJ E [1975-2000] - [1960-1974]
70 60 50 40 30 20 1045
50
55
60
65
70
-0.2
-0.1
0
0.1
0.2
c d
e f
Fig. 7. Change in spring (AMJ): (a) and (b) P � E and its components (c) and (d) P and (e) and (f) E for the period 1975–2000 relative to1960–1974 for NCEP/NCAR and ERA40.
350 P.G. Myers et al. / Progress in Oceanography 73 (2007) 341–357
Having quantified the major patterns of change over the last 40 years in the Labrador Sea we now exam-ine whether they are linked to the dominant modes of atmospheric variability that affect this region. In par-ticular we have determined correlation coefficients between various modes of variability and NCEP/NCARannual and seasonal P � E, P and E anomalies (Table 2). We have focused on the NAO and the AO,together with a more limited analysis for the East Atlantic Pattern. Whether the NAO and AO are distinctor simply reflect different aspects of the same phenomenon remains a matter of ongoing debate (Hurrellet al., 2003).
The calculations using annual anomalies (Table 2) reveal that evaporation over the Labrador Sea isstrongly correlated with the NAO but also that this mode has an insignificant influence on precipitation. Thisresult is consistent with the idea that when the NAO is in a positive state the frequency of cold air outbreakswhich drive stronger evaporation over the Labrador Sea increases (Greatbatch, 2000). The overall influence ofthe NAO on P � E is relatively weak, the negative sign reflecting the increase in E as the NAO increases. Forthe AO, we find a similar correlation with E but a greater correlation with P. However, as it is positively cor-
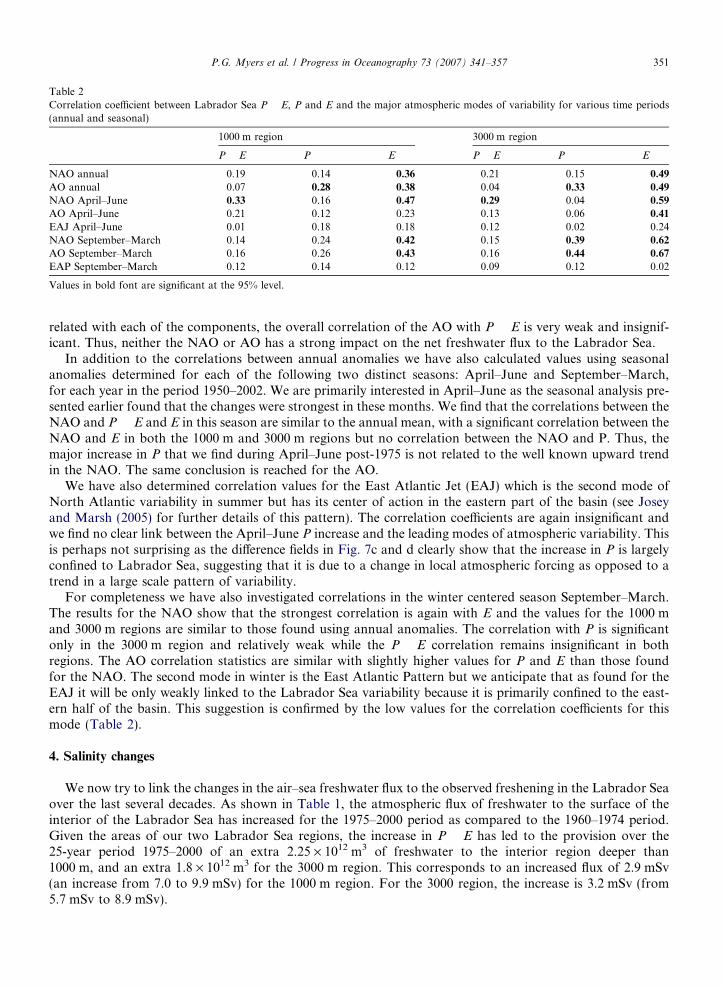
Table 2Correlation coefficient between Labrador Sea P � E, P and E and the major atmospheric modes of variability for various time periods(annual and seasonal)
1000 m region 3000 m region
P � E P E P � E P E
NAO annual �0.19 0.14 0.36 �0.21 0.15 0.49
AO annual �0.07 0.28 0.38 �0.04 0.33 0.49
NAO April–June �0.33 �0.16 0.47 �0.29 �0.04 0.59
AO April–June �0.21 �0.12 0.23 �0.13 0.06 0.41
EAJ April–June 0.01 �0.18 �0.18 0.12 0.02 �0.24NAO September–March �0.14 0.24 0.42 �0.15 0.39 0.62
AO September–March �0.16 0.26 0.43 �0.16 0.44 0.67
EAP September–March �0.12 �0.14 0.12 0.09 0.12 0.02
Values in bold font are significant at the 95% level.
P.G. Myers et al. / Progress in Oceanography 73 (2007) 341–357 351
related with each of the components, the overall correlation of the AO with P � E is very weak and insignif-icant. Thus, neither the NAO or AO has a strong impact on the net freshwater flux to the Labrador Sea.
In addition to the correlations between annual anomalies we have also calculated values using seasonalanomalies determined for each of the following two distinct seasons: April–June and September–March,for each year in the period 1950–2002. We are primarily interested in April–June as the seasonal analysis pre-sented earlier found that the changes were strongest in these months. We find that the correlations between theNAO and P � E and E in this season are similar to the annual mean, with a significant correlation between theNAO and E in both the 1000 m and 3000 m regions but no correlation between the NAO and P. Thus, themajor increase in P that we find during April–June post-1975 is not related to the well known upward trendin the NAO. The same conclusion is reached for the AO.
We have also determined correlation values for the East Atlantic Jet (EAJ) which is the second mode ofNorth Atlantic variability in summer but has its center of action in the eastern part of the basin (see Joseyand Marsh (2005) for further details of this pattern). The correlation coefficients are again insignificant andwe find no clear link between the April–June P increase and the leading modes of atmospheric variability. Thisis perhaps not surprising as the difference fields in Fig. 7c and d clearly show that the increase in P is largelyconfined to Labrador Sea, suggesting that it is due to a change in local atmospheric forcing as opposed to atrend in a large scale pattern of variability.
For completeness we have also investigated correlations in the winter centered season September–March.The results for the NAO show that the strongest correlation is again with E and the values for the 1000 mand 3000 m regions are similar to those found using annual anomalies. The correlation with P is significantonly in the 3000 m region and relatively weak while the P � E correlation remains insignificant in bothregions. The AO correlation statistics are similar with slightly higher values for P and E than those foundfor the NAO. The second mode in winter is the East Atlantic Pattern but we anticipate that as found for theEAJ it will be only weakly linked to the Labrador Sea variability because it is primarily confined to the east-ern half of the basin. This suggestion is confirmed by the low values for the correlation coefficients for thismode (Table 2).
4. Salinity changes
We now try to link the changes in the air–sea freshwater flux to the observed freshening in the Labrador Seaover the last several decades. As shown in Table 1, the atmospheric flux of freshwater to the surface of theinterior of the Labrador Sea has increased for the 1975–2000 period as compared to the 1960–1974 period.Given the areas of our two Labrador Sea regions, the increase in P � E has led to the provision over the25-year period 1975–2000 of an extra 2.25 · 1012 m3 of freshwater to the interior region deeper than1000 m, and an extra 1.8 · 1012 m3 for the 3000 m region. This corresponds to an increased flux of 2.9 mSv(an increase from 7.0 to 9.9 mSv) for the 1000 m region. For the 3000 region, the increase is 3.2 mSv (from5.7 mSv to 8.9 mSv).
352 P.G. Myers et al. / Progress in Oceanography 73 (2007) 341–357
Estimates of the provision of freshwater to the upper Labrador Sea between April and September, as thewater column restratifies post convection, based on analysis of salinity changes, range from 11 mSv (Khatiw-ala et al., 2002) to 24 mSv (Schmidt and Send, submitted for publication) and 30 mSv (Lazier, 1980). Themean atmospheric signal during April–September is 6.0 mSv, suggesting that the atmosphere providesbetween 20% and 50% to the observed seasonal freshening. When taking into account the enhancement since1975, 3/4 of which occurs in the April–September period, the atmospheric signal becomes even more impor-tant, thus, atmospheric forcing may play a greater role in explaining the seasonal freshening than suggested inprevious work (Khatiwala et al., 2002; Schmidt and Send, submitted for publication).
Curry and Mauritzen (2005) reported that the freshwater content of the sub-polar gyre had increased by15,000 km3 between 1965 and 1995, of which 10,000 km3 entered between the late 1960s and early 1970s, witha large contribution from the advective Great Salinity Anomaly. We suggest that part of the 5000 km3 increasereported to occur after 1975 is related to increases in the atmospheric P � E signal. In a pure budget sense,2250 km3 of additional freshwater was provided to the western sub-polar gyre (Labrador Sea) during the post1975 period by the atmosphere. This last number is large in magnitude and indicates that the atmosphericfreshwater flux could have played a significant role in the freshening. The Labrador Sea is only part of thesub-polar gyre region of Curry and Mauritzen (2005) and the analysis of Josey and Marsh (2005) revealsan additional gain of 4000 km3 from the atmosphere within the eastern part of the sub-polar gyre. Theincrease in freshwater from the atmosphere will only contribute to the observed change in freshwater contentif it is stored within the sub-polar gyre and so the overall effect of the P � E increase remains to be fullydetermined.
Observations of the sub-polar gyre circulation suggest that the additional freshwater supplied by the atmo-sphere to the Labrador Sea could remain in the gyre for long enough to contribute to the observed freshening.In a dataset of surface drifters examined by Cuny et al. (2002), all drifters released in the Labrador Searemained in the sub-polar gyre. Surface water is also taken up in the Labrador Sea Water (LSW) formedin winter. Three pathways for LSW have been documented (Lankhorst and Zenk, 2006), into the IrmingerSea, into the eastern basin under the NAC and south along the deep western boundary current. Only this lastpathway involves the export of freshwater from the sub-polar gyre. We do not wish to overstate the impor-tance of the increase in excess precipitation over the Labrador Sea (and the sub-polar gyre as a whole), as thereare other processes that provide freshwater to the sub-polar North Atlantic. These includes outflow from theArctic through Fram/Denmark Strait as well as Davis Strait, both of which have been estimated in the rangeof 100 mSv (e.g. Loder et al. (1998)). However, given the magnitude of the increase and the potential for it tobe retained within the gyre, we think it is reasonable to suggest that the P � E increase has played an impor-tant role in the freshening of the sub-polar North Atlantic over the last 25 years.
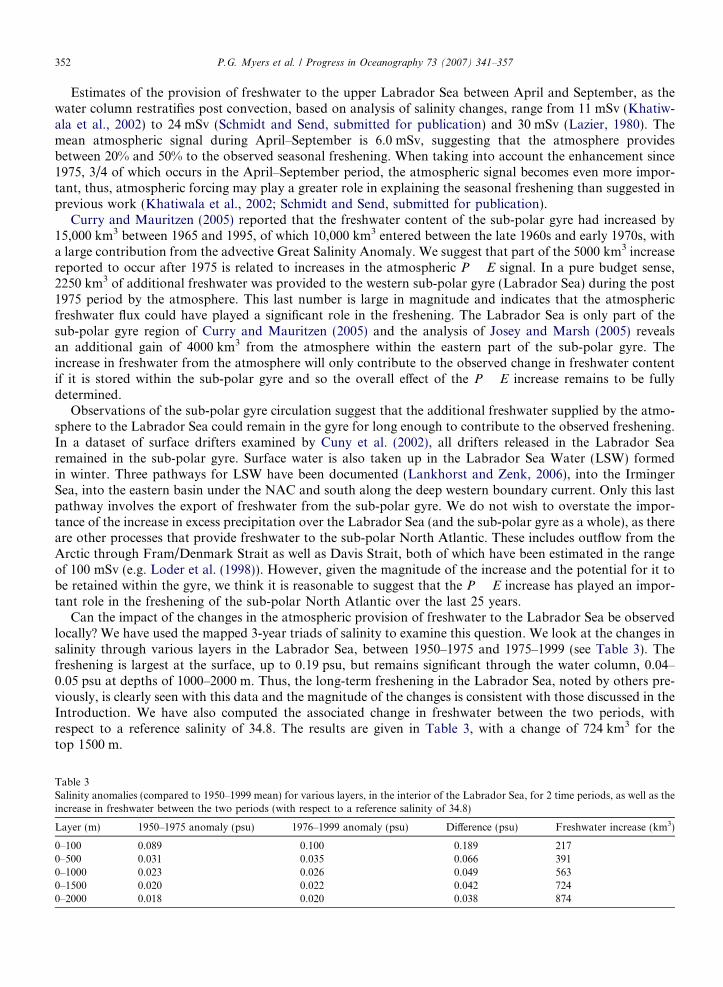
Can the impact of the changes in the atmospheric provision of freshwater to the Labrador Sea be observedlocally? We have used the mapped 3-year triads of salinity to examine this question. We look at the changes insalinity through various layers in the Labrador Sea, between 1950–1975 and 1975–1999 (see Table 3). Thefreshening is largest at the surface, up to 0.19 psu, but remains significant through the water column, 0.04–0.05 psu at depths of 1000–2000 m. Thus, the long-term freshening in the Labrador Sea, noted by others pre-viously, is clearly seen with this data and the magnitude of the changes is consistent with those discussed in theIntroduction. We have also computed the associated change in freshwater between the two periods, withrespect to a reference salinity of 34.8. The results are given in Table 3, with a change of 724 km3 for thetop 1500 m.
Table 3Salinity anomalies (compared to 1950–1999 mean) for various layers, in the interior of the Labrador Sea, for 2 time periods, as well as theincrease in freshwater between the two periods (with respect to a reference salinity of 34.8)
Layer (m) 1950–1975 anomaly (psu) 1976–1999 anomaly (psu) Difference (psu) Freshwater increase (km3)
0–100 0.089 �0.100 �0.189 2170–500 0.031 �0.035 �0.066 3910–1000 0.023 �0.026 �0.049 5630–1500 0.020 �0.022 �0.042 7240–2000 0.018 �0.020 �0.038 874
P.G. Myers et al. / Progress in Oceanography 73 (2007) 341–357 353
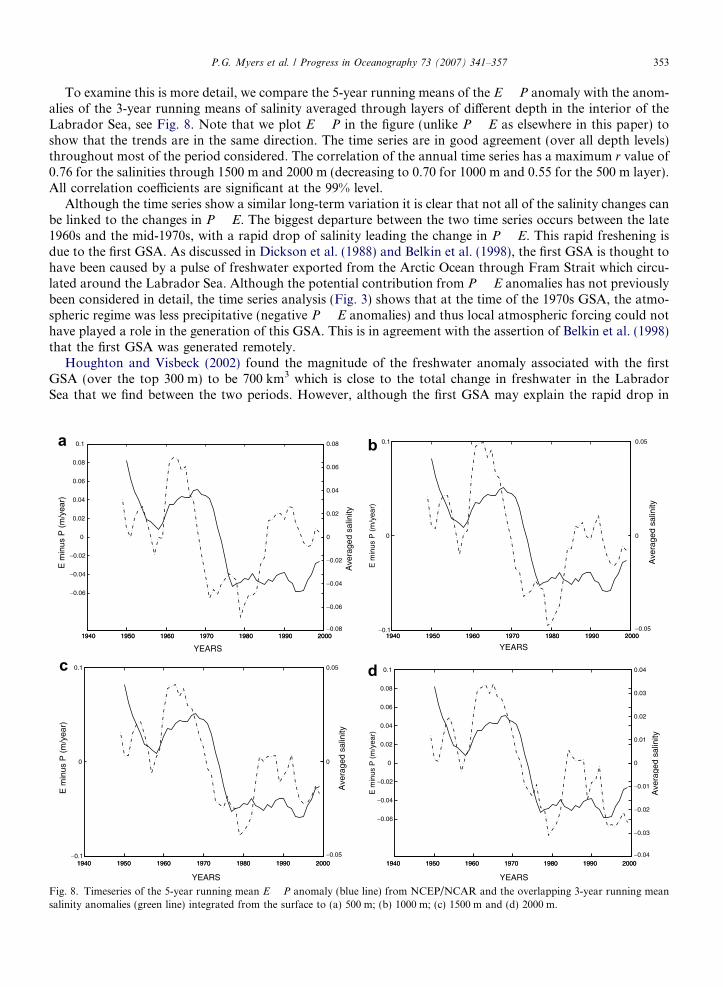
To examine this is more detail, we compare the 5-year running means of the E � P anomaly with the anom-alies of the 3-year running means of salinity averaged through layers of different depth in the interior of theLabrador Sea, see Fig. 8. Note that we plot E � P in the figure (unlike P � E as elsewhere in this paper) toshow that the trends are in the same direction. The time series are in good agreement (over all depth levels)throughout most of the period considered. The correlation of the annual time series has a maximum r value of0.76 for the salinities through 1500 m and 2000 m (decreasing to 0.70 for 1000 m and 0.55 for the 500 m layer).All correlation coefficients are significant at the 99% level.
Although the time series show a similar long-term variation it is clear that not all of the salinity changes canbe linked to the changes in P � E. The biggest departure between the two time series occurs between the late1960s and the mid-1970s, with a rapid drop of salinity leading the change in P � E. This rapid freshening isdue to the first GSA. As discussed in Dickson et al. (1988) and Belkin et al. (1998), the first GSA is thought tohave been caused by a pulse of freshwater exported from the Arctic Ocean through Fram Strait which circu-lated around the Labrador Sea. Although the potential contribution from P � E anomalies has not previouslybeen considered in detail, the time series analysis (Fig. 3) shows that at the time of the 1970s GSA, the atmo-spheric regime was less precipitative (negative P � E anomalies) and thus local atmospheric forcing could nothave played a role in the generation of this GSA. This is in agreement with the assertion of Belkin et al. (1998)that the first GSA was generated remotely.
Houghton and Visbeck (2002) found the magnitude of the freshwater anomaly associated with the firstGSA (over the top 300 m) to be 700 km3 which is close to the total change in freshwater in the LabradorSea that we find between the two periods. However, although the first GSA may explain the rapid drop in
1940 1950 1960 1970 1980 1990 2000
−0.06
−0.04
−0.02
0
0.02
0.04
0.06
0.08
0.1
E m
inus
P (
m/y
ear)
YEARS
1940 1950 1960 1970 1980 1990 2000−0.08
−0.06
−0.04
−0.02
0
0.02
0.04
0.06
0.08
Ave
rage
d sa
linity
1940 1950 1960 1970 1980 1990 2000−0.1
0
0.1
E m
inus
P (
m/y
ear)
YEARS1940 1950 1960 1970 1980 1990 2000
−0.05
0
0.05
Ave
rage
d sa
linity
1940 1950 1960 1970 1980 1990 2000−0.1
0
0.1
E m
inus
P (
m/y
ear)
YEARS
1940 1950 1960 1970 1980 1990 2000−0.05
0
0.05
Ave
rage
d sa
linity
1940 1950 1960 1970 1980 1990 2000
−0.06
−0.04
−0.02
0
0.02
0.04
0.06
0.08
0.1
E m
inus
P (
m/y
ear)
YEARS
1940 1950 1960 1970 1980 1990 2000−0.04
−0.03
−0.02
−0.01
0
0.01
0.02
0.03
0.04
Ave
rage
d sa
linity
a b
c d
Fig. 8. Timeseries of the 5-year running mean E � P anomaly (blue line) from NCEP/NCAR and the overlapping 3-year running meansalinity anomalies (green line) integrated from the surface to (a) 500 m; (b) 1000 m; (c) 1500 m and (d) 2000 m.
354 P.G. Myers et al. / Progress in Oceanography 73 (2007) 341–357
salinity in the 1970s, consideration of flushing timescales indicates that it cannot explain all of the fresh-ening between the two periods. The reason for this is that the interior of the Labrador Sea is a smallregion where advection is important. The flushing timescale for Labrador Sea Water has been estimatedto be approximately 4 years (Lazier et al., 2002). Thus, although some of the freshwater from the firstGSA may have been stored in the Labrador Sea, most of it has probably been flushed out into other partsof the sub-polar gyre (for which the flushing timescale is much longer). In contrast to the short-term nat-ure of the first GSA, and subsequent advective events, the increase in P � E in the 1970s has been main-tained to the present day (see Fig. 3) thus enabling the atmosphere to make an ongoing contribution tothe freshening within the Labrador Sea.
5. Summary and discussion
We have considered changes in the air–sea freshwater flux (P � E) to the interior of the Labrador Sea overthe last 50 years using output from atmospheric model reanalyses and related it to freshening of this basin overthe same period. Our analysis has been carried out in the context of a recent study (Josey and Marsh, 2005)which linked a significant increase in P � E over the eastern sub-polar gyre to freshening of that region.
We find significant temporal variability in the Labrador Sea P � E which has a strong interannual com-ponent, but also reveals distinct lower frequency variability. The low frequency variation has two mainphases: relatively low net precipitation prior to the mid-1970s, followed by a rapid transition to a highernet precipitation phase thereafter that persists through to the end, 2003, of the record considered. Thechange in net precipitation amounts to 9 (or 18) cm yr�1 depending on the interior region considered,when examining the period 1975–2000 compared to 1960–1974; similar results are obtained if the earlierperiod is extended to cover 1950–1974. It is driven largely by an increase in the precipitation componentas the evaporation field shows no clear long-term variation. This result is consistent with the study of(Josey and Marsh, 2005) who found a similar transition to stronger P � E in the eastern sub-polar gyrewhich was also precipitation driven. However, there are major differences between the seasonal dependenceof the two events. The eastern gyre change is distributed over all months of the year with a small increasein winter. In contrast, the Labrador Sea enhancement in net precipitation is concentrated in spring andsummer, with a decrease occurring in fall.
We have also examined whether the P � E increase in the Labrador Sea is linked to trends in the dominantmodes of atmospheric variability that are likely to affect this region. Annually averaged evaporation anomaliesover the Labrador Sea are strongly correlated with the NAO. However, this mode has an insignificant influ-ence on precipitation and its overall correlation with P � E is not really significant. For the AO, the correla-tion with annual P � E is insignificant, thus neither mode has a strong impact on the net freshwater flux to theLabrador Sea. Similar conclusions regarding the lack of influence of large scale modes on P � E are reachedwhen seasonal anomalies are considered suggesting that the observed net precipitation increase must be aresponse to local changes in the freshwater forcing of the basin by the atmosphere.
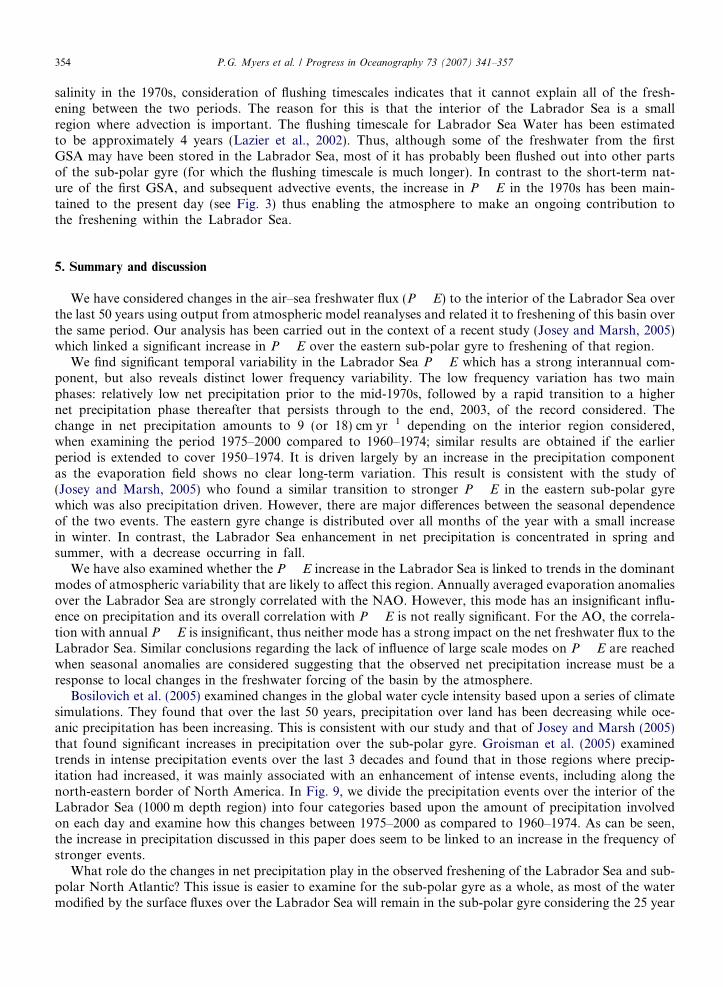
Bosilovich et al. (2005) examined changes in the global water cycle intensity based upon a series of climatesimulations. They found that over the last 50 years, precipitation over land has been decreasing while oce-anic precipitation has been increasing. This is consistent with our study and that of Josey and Marsh (2005)that found significant increases in precipitation over the sub-polar gyre. Groisman et al. (2005) examinedtrends in intense precipitation events over the last 3 decades and found that in those regions where precip-itation had increased, it was mainly associated with an enhancement of intense events, including along thenorth-eastern border of North America. In Fig. 9, we divide the precipitation events over the interior of theLabrador Sea (1000 m depth region) into four categories based upon the amount of precipitation involvedon each day and examine how this changes between 1975–2000 as compared to 1960–1974. As can be seen,the increase in precipitation discussed in this paper does seem to be linked to an increase in the frequency ofstronger events.
What role do the changes in net precipitation play in the observed freshening of the Labrador Sea and sub-polar North Atlantic? This issue is easier to examine for the sub-polar gyre as a whole, as most of the watermodified by the surface fluxes over the Labrador Sea will remain in the sub-polar gyre considering the 25 year
Fig. 9. Histogram dividing the observed daily precipitation amounts, over two periods, 1960–1974 and 1975–2000, into four categoriesbased on the intensity (amount) of water falling that day (P < 0.002 m, 0.002 m < P < 0.004 m, 0.004 m < P < 0.007 m, P > 0.007 m). Thevertical axes has been normalized based on the percentage of events in each category falling in the two time periods).
P.G. Myers et al. / Progress in Oceanography 73 (2007) 341–357 355
timespan (1975–2000) we are looking at. We find a provision of an extra 2250 km3 of freshwater to theLabrador Sea by the atmosphere during this time period. Considering that Josey and Marsh (2005) foundan additional provision of 4000 km3 to a region centered on the eastern sub-polar gyre, these amounts com-pare favourably with the 5000 km3 of post GSA freshwater found in the gyre by Curry and Mauritzen (2005).The freshening of the Labrador Sea is harder to attribute, as its flushing timescale is such that additional fresh-water provided to it can easily be removed within a few years and thus its contribution to the longer term(25 year) storage is difficult to determine. However, as the 1800 km3 of extra freshwater provided by the atmo-sphere is much larger than the observed freshening over the same period (726 km3 integrated over the upper1500 m), and is provided as a continuous source (rather than as a pulse like the GSA events), we suggest itmust play a role in the observed freshening.
To conclude, we have found a major enhancement of excess precipitation over the Labrador Sea in the mid-1970s which is maintained to the present day. This increase is likely to have played an important role in thefreshening of both the Labrador Sea and the wider sub-polar North Atlantic region over the last 25 years.Furthermore, when compared with an earlier analysis for the eastern gyre (Josey and Marsh, 2005) it is clearthat the seasonal dependence of the freshwater flux varies significantly with region and that variability in bothlarge scale atmospheric modes and local forcing needs to be taken into account. Detailed understanding of thefreshening of the mid–high latitude North Atlantic will thus require consideration of a range of atmosphericprocesses combined with changes that are due to advective signals within the ocean itself.
Acknowledgements
We would like to thank two anonymous reviewers for the useful and thought provoking questions that im-proved this manuscript. This work was funded by NSERC and CFCAS grants (GR-019 and the Canadian
356 P.G. Myers et al. / Progress in Oceanography 73 (2007) 341–357
CLIVAR network). Brett Wheler was also a recipient of an NSERC USRA during the time he worked on thisproject. The contribution from Josey was carried out under the UK Natural Environment Research CouncilRapid Climate Change Programme.
References
Barnston, A.G., Livezey, R.E., 1987. Classification, seasonality and persistence of low-frequency atmospheric circulation patterns.
Monthly Weather Review 115, 1083–1126.
Belkin, I.M., Levitus, S., Antonov, J., Malmberg, S.-A., 1998. ‘‘Great Salinity Anomalies’’ in the North Atlantic. Progress in
Oceanography 41, 1–68.
Clarke, R.A., Gascard, J., 1983. The formation of Labrador Sea Water. Part I: Large-scale processes. Journal of Physical Oceanography
13, 1764–1778.
Cuny, J., Rhines, P.B., Niiler, P.P., Bacon, S., 2002. Labrador Sea boundary currents and the fate of Irminger Sea Water. Journal of
Physical Oceanography 32, 627–647.
Curry, R., Dickson, B., Yashayaev, I., 2003. A change in the freshwater balance of the Atlantic Ocean over the past four decades. Nature
426, 826–829.
Curry, R., Mauritzen, C., 2005. Dilution of the northern North Atlantic Ocean in recent decades. Science 308, 1772–1774.
Dickson, R.R., Meincke, J., Malmberg, S.-A., Lee, A.J., 1988. ‘The Great Salinity Anomaly’ in the northern North Atlantic 1968–1982.
Progress in Oceanography 20, 103–151.
Dickson, R.R., Osborn, T.J., Hurrell, J.W., Meincke, J., Blindheim, J., Adlandsvik, B., Vinje, T., Alekseev, G., Maslowski, W., 2000. The
Arctic Ocean response to the North Atlantic Oscillation. Journal of Climate 13, 2671–2696.
Dickson, R.R., Yashayaev, I., Meincke, J., Turrell, W., Dye, S., Holfort, J., 2002. Rapid freshening of the deep North Atlantic over the
past four decades. Nature 416, 832–837.
Gonzalez-Pola, C., Lavin, A., Vargas-Yanez, M., 2005. Intense warming and salinity modification of intermediate water masses in the
southeastern corner of the Bay of Biscay for the period 1992–2003. Journal of Geophysical Research, 110.
Greatbatch, R.J., 2000. The North Atlantic oscillation. Stochastic Environmental Research and Risk Assessment 14, 213–242.
Groisman, P.Y., Knight, R.W., Easterling, D.E., Karl, T.R., Hegerl, G.C., Razuvaev, V.N., 2005. Trends in intense precipitation in the
climate record. Journal of Climate 18, 1326–1344.
Houghton, R.W., Visbeck, M.H., 2002. Quasi-decadal salinity fluctuations in the Labrador Sea. Journal of Physical Oceanography 32,
687–701.
Hurrell, J.W., Kushnir, Y., Ottersen, G., Visbeck, M., 2003. The North Atlantic oscillation: climate significance and environmental
impact. Geophysical Monograph Series 134.
Josey, S.A., Marsh, R., 2005. Surface freshwater flux variability and recent freshening of the North Atlantic in the eastern subpolar gyre.
Journal of Geophysical Research 110, C05008.
Katsman, C., Spall, M.A., Pickart, R.S., 2004. Boundary current eddies and their role in restratification of the Labrador Sea. Journal of
Physical Oceanography 34, 1967–1983.
Khatiwala, S., Schlosser, P., Visbeck, M., 2002. Rates and mechanisms of water mass transformations in the Labrador Sea as inferred
from tracer observations. Journal of Physical Oceanography 32, 666–686.
Kistler, R. et al., 2001. The NCEP-NCAR 50-year reanalysis: monthly means CD-ROM and documentation. Bulletin of the American
Meteorological Society 82, 247–267.
Kulan, N., Myers, P.G., submitted for publication. Comparing two climatologies of the Labrador Sea: geopotential vs. isopycnal.
Atmosphere–Ocean.
Lankhorst, M., Zenk, W., 2006. Lagrangian observations of the middepth and deep velocity fields of the northeastern Atlantic Ocean.
Journal of Physical Oceanography 36, 43–63.
Lazier, J., Hendry, R., Clarke, A., Yashayaev, I., Rhines, P., 2002. Convection and restratification in the Labrador Sea, 1990–2000. Deep
Sea Research 49, 1819–1835.
Lazier, J.R.N., 1980. Oceanographic conditions at O.W.S. Bravo 1964–1974. Atmosphere–Ocean 18, 227–238.
Lazier, J.R.N., Wright, D.G., 1993. Annual velocity variations in the Labrador Current. Journal of Physical Oceanography 23, 659–678.
Li, H., Chen, B., 2005. The evolution of precipitable water associated with the Asian and Australian monsoons as revealed from MODIS/
SSMI, ECMWF and NCEP reanalysis data sets. Geophysical Research Letters, 32. doi:10.1029/2005GL022570.
Lilly, J.M., Rhines, P.B., Visbeck, M., Davis, R., Lazier, J.R.N., Schott, F., Farmer, D., 1999. Observing deep convection in the Labrador
Sea during winter 1994/95. Journal of Physical Oceanography 29, 2065–2098.
Loder, J.W., Petrie, B., Gawarkiewicz, G., 1998. The costal ocean off northeastern North America: a large-scale view. In: Robinson, A.R.,
Brink, K.H. (Eds.), . In: The Sea, vol. 11. John Wiley, pp. 105–133.
Bosilovich, M.G., Schubert, S.D., Walker, G., 2005. Global changes of the water cycle intensity. Journal of Climate 18, 1591–1608.
Myers, P.G., 2005. Impact of freshwater from the Canadian Arctic Archipelago on Labrador Sea Water formation. Geophysical Research
Letters, 32.
Peterson, B.J., Holmes, R.M., McClelland, J.W., Vorosmarty, C.J., Lammers, R.B., Shiklomanov, A.I., Shiknomanov, I.A., Rahmstorf,
S., 2002. Increasing river discharge to the Arctic Ocean. Science 298, 2171–2173.
Reverdin, G., Durand, F., Mortensen, J., Schott, F., Valdimarsson, H., Zenk, W., 2002. Recent changes in the surface salinity of the
North Atlantic subpolar gyre. Journal of Geophysical Research, 107.
P.G. Myers et al. / Progress in Oceanography 73 (2007) 341–357 357
Reynaud, T.H., Weaver, A.J., Greatbatch, R.J., 1995. Summer mean circulation of the northwestern Atlantic Ocean. Journal of
Geophysical Research 100, 779–816.
Schmidt, S., Send, U., submitted for publication. Origin and composition of seasonal Labrador Sea freshwater. Journal of Physical
Oceanography.
Schmitt, R.W., Bogden, P.S., Dorman, C.E., 1989. Evaporation minus precipitation and density fluxes for the North Atlantic. Journal of
Physical Oceanography 19, 1208–1221.
Simmons, A.J., Gibson, J.K., 2000. The era-40 project plan. Technical Report ERA-40 Project Report Series No. 1, ECMWF.
Steffen, K., Nghiem, S.V., Huff, R., Neumann, G., 2004. The melt anomaly of 2002 on the Greenland Ice Sheet from active and passive
microwave satellite observations. Geophysical Research Letters, 31.
Vinje, T., 2001. Fram Strait ice fluxes and atmospheric circulation: 1950–2000. Journal of Climate 14, 3508–3517.
Walsh, J.E., Portis, D.H., 1999. Variations of precipitation and evaporation over the North Atlantic Ocean, 1958–1997. Journal of
Geophysical Research 104, 16613–16631.
Related Documents