Nordic Innovation Centre Telephone +47 47 61 44 00 ISSN 0283-7234 Stensberggata 25 Fax +47 22 56 55 65 NO-0170 OSLO [email protected] Norway www.nordicinnovation.net INTERCOMP A RISON AND METHOD FOR UNCERTAINTY CALCULATION OF WATER A ND HEAT FL OW Kaj Bryder T R 6 1 0 A p p r o v e d 2 0 0 4 - 1 1

Welcome message from author
This document is posted to help you gain knowledge. Please leave a comment to let me know what you think about it! Share it to your friends and learn new things together.
Transcript

8/18/2019 intercomparari lichid
http://slidepdf.com/reader/full/intercomparari-lichid 1/96
Nordic Innovation Centre Telephone +47 47 61 44 00 ISSN 0283-7234
Stensberggata 25 Fax +47 22 56 55 65NO-0170 OSLO [email protected] Norway www.nordicinnovation.net
INTERCOMPARISON AND METHOD
FOR UNCERTAINTY CALCULATION
OF WATER AND HEAT FLOW
Kaj Bryder
T R
6 1
0
A p pr o v e d
2 0 0 4 -1 1

8/18/2019 intercomparari lichid
http://slidepdf.com/reader/full/intercomparari-lichid 2/96

8/18/2019 intercomparari lichid
http://slidepdf.com/reader/full/intercomparari-lichid 3/96
NT TECHN REPORT 610 Approved 2004-11
Nordic Innovation Centre project number:
04195 (1610-02)
Authors:
Kaj Bryder )
Institution:
Danish Technological Institute
Title:
Intercomparison and method for uncertainty calculationof water and heat flow
Abstract:
A relatively high utilisation of district heating and limited resources of drinking water
makes metering of water and heat of great importance in both the Nordic and the
Baltic countries. This has further resulted in a heavy focus on testing and calibration
of the meters as well as on the uncertainty of the meter installation.
Combined with European wishes for establishing an accredited and uniform basis fortype testing and verification of e.g. water and heat meters this underlines the
importance of exchange of know how, intercomparison and setting up of common
methods for uncertainty calculations in the field of water and heat flow measurement.
The objective of this Nordtest-project “Intercomparison and method for uncertainty
calculation of water and heat flow” is to improve metering of water and district
heating in the Nordic and Baltic area by carrying out an intercomparison, and
preparation of a method for uncertainty calculations for calibration and for meter
installations by exchange of know-how at two work shops. This report is part of the
exchange of know how and is based on work shops held on 20 March 2002 at DTI in
Aarhus and 17–18 February 2004 at LNMC in Riga as well as it comprises the background and the results of the intercomparisons and the background of the method
of uncertainty calculations. The method of uncertainty calculations is carried out as a
separate document set up according to normal Nordtest specifications.
Technical Group:
Building and Construction (HVAC/VVS)
ISSN:
0283-7234
Language:
English
Pages:
51 p. + 3 annexes
Key Words:
Intercomparison, uncertainty, water and heat flow, test method
Distributed by:
Nordic Innovation Centre
Stensberggata 25 NO-0170 Oslo Norway
Report Internet address:
www.nordicinnovation.net

8/18/2019 intercomparari lichid
http://slidepdf.com/reader/full/intercomparari-lichid 4/96

8/18/2019 intercomparari lichid
http://slidepdf.com/reader/full/intercomparari-lichid 5/96
i
Content
Introduction .............................................................................................................................. ii
Summary and conclusion..................................................................................................................... iv
1. Legal requirements and flow facilities ............................................................................................1
1.1 Comparing of legal requirements and of flow facilities ................................................ 1
1.1.1 Comparing of legal requirements ....................................................................... 1
1.1.2 Comparing of flow facilities ................................................................................ 1
1.2 DTI flow facilities .......................................................................................................... 3
1.3 LEI flow facilities .......................................................................................................... 6
1.4 LNMC flow facilities ..................................................................................................... 9
1.4.1 LNMC facilities for testing of cold water meters up to 18 m3/h ......................... 9
1.4.2 LNMC facilities for testing of heat meters up to 40 m3/h ................................. 11
1.5 SP flow facilities .......................................................................................................... 15
2. Experiences from participation in intercomparisons..................................................... 17
2.1 Intercomparisons internationally.................................................................................. 17
2.1.1 The importance of intercomparisons according to EA...................................... 17
2.1.2 Basic types of intercomparisons ........................................................................ 17
2.1.3 Comparing of results of intercomparisons......................................................... 18
2.2 DTI participations and experiences.............................................................................. 18
2.2.1 DTI participation in intercomparisons............................................................... 18
2.2.2 The first international comparison..................................................................... 20
2.2.3 Danish comparisons and follow-up ................................................................... 24
2.3 LEI participations and experiences .............................................................................. 272.4 LNMC participations and experiences......................................................................... 28
2.5 SP participations and experiences................................................................................ 29
2.5.1 SP participation in comparisons ........................................................................ 29
2.5.2 Examples from various intercomparisons ......................................................... 30
3. The Nordic-Baltic intercomparison ................................................................................. 45
3.1 Setting up the intercomparison .................................................................................... 45
3.1.1 Reference meter packages and the calibrations ................................................. 45
3.1.2 Plan and schedule .............................................................................................. 46
3.2 Intercomparison instruction ......................................................................................... 46
3.3 Intercomparison results ................................................................................................ 46
4. Method for uncertainty calculations................................................................................ 50
References ............................................................................................................................... 51
Annexes
Annex 1: Intercomparison instruction (enclosed)
Annex 2: Intercomparison results (enclosed)
Annex 3: Method for uncertainty calculations (see special document)

8/18/2019 intercomparari lichid
http://slidepdf.com/reader/full/intercomparari-lichid 6/96
ii
Introduction
Objective of the project and the report
The objective of this Nordtest-project “Intercomparison and method for uncertaintycalculation of water and heat flow” is to improve metering of water and district heating in the
Nordic and Baltic area by carrying out an intercomparison, and preparation of a method for
uncertainty calculations for calibration and for meter installations by exchange of knowhow at
two work shops. This report is part of the exchange of know how and is based on work shops
held on 20 March 2002 at DTI in Aarhus and 17–18 February 2004 at LNMC in Riga as well
as it comprises the background and the results of the intercomparisons and the background of
the method of uncertianty calculations. The method of uncertainty calculations is carried out
as a separate document set up according to normal Nordtest specifications.
Participants of the project
The project has been intitiated and carried out as a co-operation between Latvian National
Metrology Centre, Lithuanian Energy Institute (LEI), Swedish National Testing and Research
Institute and Danish Technological Institute, which has been project manager.
Detailed information about the participants:
- Latvian National Metrology Centre (LNMC),
K. Valdemara iela 157, Riga, LV 1013- Janis Jansons (water meters)
- Arija Klints (heat meters, + 736 2988, [email protected])
- Lithuanian Energy Institute (LEI), Heat Research and Testing Laboratory,
3 Breslaujos str., 3035 Kaunas, Lithuania- Nerijus Pedisius (+370 740 1864, [email protected] )- Antonas Pedisius (+370 740 1863, [email protected])- Gediminas Zygmantas (+370 37 401 861, [email protected] )
- Swedish National Testing and Research Institute (SP), Laboratory for Volume and Flow,
Brinellgatan 4, 50115 Borås, Sweden- Kerstin Mattiasson (+.46 3316 5380, [email protected])
- Danish Technological Institute (DTI), The Flow Laboratory,
Teknologiparken, Kongsvang Allé 29, 8000 Aarhus C, Denmark- John Frederiksen (+45 7220 1235, [email protected] )- Kaj Bryder (+45 7220 1220, [email protected] )

8/18/2019 intercomparari lichid
http://slidepdf.com/reader/full/intercomparari-lichid 7/96
iii
Background of the project
A relatively high utilisation of district heating and limited resources of drinking water makes
metering of water and heat of great importance in both the Nordic and the Baltic countries.
This has further resulted in a heavy focus on testing and calibration of the meters as well as on
the uncertainty of the meter installation.
Combined with European wishes for establishing an accredited and uniform basis for type
testing and verification of e.g. water and heat meters this underlines the importance of
exchange of know how, intercomparison and setting up of common methods for uncertainty
calculations in the field of water and heat flow measurement.
As the national calibration laboratories for water and energy flow all the partners are deeply
involved in this process.
The flow laboratories at DTI in Denmark and SP in Sweden have for several years been
accredited in relation to the European co-operation of Accreditation (EA) as well as they are
participating in international standardisation work in the actual field.
The Baltic laboratories, LNMC in Latvia and LEI in Lithuania both are in process of fulfilling
the requirements for being accredited according to EA requirements.

8/18/2019 intercomparari lichid
http://slidepdf.com/reader/full/intercomparari-lichid 8/96
iv
Summary and conclusion
This Nordtest-project “Intercomparison and method for uncertainty calculation of water and
heat flow” comprises:
• Legal requirements for water and heat meter calibration and testing in the Nordic and the
Baltic countries (Denmark, Sweden, Latvia and Lithuania)
• Presentation of various calibration and testing facilities
• Presentation and discussion of existing intercomparisons in which the laboratories have
participated
• Basis of and results from the Nordic_Baltic intercomparison
• Basis of the method of uncertainty calculations.
The project has been carried out in co-operation between: Latvian National Metrology Centre,Lithuanian Energy Institute (LEI), Swedish National Testing and Research Institute and
Danish Technological Institute, which has been manager of the project and also coordinator
for this report.
The results of the project are:
- An intercomparison which can be used for future improvements of the calibration and
testing laboratories
- A method for uncertainty calculations for calibration of water and heat meters and based
on partly existing standards and manual about uncertainty calculations, partly on know
how and experiences from each of the laboratories
- A general exchange of know how and experiences between the laboratories about water
and heat meter calibration and testing
- The laboratories from the Baltic countries have gained better know how about water and
heat meter calibration and testing in the old EU countries.

8/18/2019 intercomparari lichid
http://slidepdf.com/reader/full/intercomparari-lichid 9/96
1
1. Legal requirements and flow facilities
1.1 Comparison of legal requirements and of flow facilities
1.1.1 Comparison of legal requirements
All the participant countries have legal requirements concerning type approval and
verification of water and heat meters.
The requirements to reverification of installed meters differ significantly from country to
country with Lithuania as the most restrictive and Denmark as the most tolerant country.
Table 1.1-1: Requirements to reverification of installed meters.
Country Water Meters District Heating Meters
Denmark up to 8 years or moredepending on the results of
a random spot test
up to 6 years or moredepending on the results of
a random spot test
Lithuania up to 2 years up to 2 years
Latvia up to 2 - 4 years up to 2 years
Sweden Up to 9 years up to 5 years
1.1.2 Comparison of flow facilities
Table 1.1-2 gives an overview of the actual flow facilities at the 4 participant laboratories.
The facilities are described in detail in the following sections.

8/18/2019 intercomparari lichid
http://slidepdf.com/reader/full/intercomparari-lichid 10/96
2
Table 1.1-2: Facilities to testing and calibration/verification of meters.
Country Water Meters Heat Meters
Denmark, DTI 0,005 - 425 (500) m3/h at 12 – 85°C
DN 4 – DN 200References:
Weighing tank (5, 60, 100, 5000 Kg) or reference meter
Uncertainty, flow:
±0,1 % by weighing tank,
±0,2 – 0,6 % at reference meter
Lithuania, LEI 0,030 – 30 m3/h at 25°C The same up to 40 – 45 °C
DN 15 – DN 100
References:
Volume tank or reference meter
Uncertainty: Uncertainty:±0,08 - 0,12% by volume tank, ±0,25% by volume tank,
±0,50% at reference meter ±0,50% at reference meter
Latvia, LNMC 0,015 – 18 m3/h at 20°C±5°C 0,03 – 40 m3/h at 50°C ±5°C,
DN 15 – DN 40 DN 15 – DN 50
References: References:
Weighing tank (300 kg) Volume tanks (50 and 500 l) or
reference meter
Uncertainty: Uncertainty (flow):
±(0,1 – 0,2) % ±0,25% by volume tank
±0,5% by reference meterSweden, SP 0,006 – 24 m3/h at 10 - 90°C
DN – DN 40
References:
Weighing tanks (50 - 1000 kg) or
Volume tanks (1 – 200 l) or
reference meter
Uncertainty (10 – 30°C): Uncertainty (30 – 90°C)::
±0,08% by volume tank, ±0,1% by volume tank,

8/18/2019 intercomparari lichid
http://slidepdf.com/reader/full/intercomparari-lichid 11/96
3
1.2 DTI flow facilities
The Flow Laboratory at DTI has three calibration/test rigs accredited for testing and
calibration of water meters and heat meters called “Small”, “Medium” and “Large” test rig
with detailed specifications as described in Table 1.2-1.
Table 1.2-1: Characteristics of the three test rigs i.a. according to DANAK accreditation
No. 200.
The test rigs have all been designed according to a reference determined by weighing and
time measurement (Static weighing method according to ISO 4185). A diagram of the large
test rig is shown in Figure 1.2-1.
Figure 1.2-1: Schematic diagram of the large calibration/test rig.

8/18/2019 intercomparari lichid
http://slidepdf.com/reader/full/intercomparari-lichid 12/96
4
Details of the weighing tank, the diverter, the section for test specimen and the pumps are
shown in Figure 1.2-2 to 1.2-6.
Figure 1.2-2: The weighing tanks for the large and medium-sized test rigs.
In the test rigs of the Flow Laboratory demineralised water runs with a temperature ranging
from 12°C to 85°C.
In addition, there is a certain interest in being able to calibrate at temperatures below 12°C,
which presupposes additional cooling ability. The water treatment, which involves total
demineralisation and the addition of NaOH (lye) ensures that the water obtains sufficient

8/18/2019 intercomparari lichid
http://slidepdf.com/reader/full/intercomparari-lichid 13/96
5
conductivity for measurements with magnetic inductive meters. Therefore, EN 1434 stipulates
conductivity greater than 200 µS/cm, which is used as criteria.
When measuring heat, the flow measurement is supplemented with the measurement of the
temperature difference between a temperature sensor placed in the district heating flow pipeand a sensor placed in the return pipe. Calibrating heat meters normally takes place through
temperature simulation in two temperature-regulated baths.
Figure 1.2-3: Test meters mounted in the large test rig. The diverter can be
seen in the background at the top of the photo.
Figure1.2-4: Test meters mounted in the medium test rig.

8/18/2019 intercomparari lichid
http://slidepdf.com/reader/full/intercomparari-lichid 14/96

8/18/2019 intercomparari lichid
http://slidepdf.com/reader/full/intercomparari-lichid 15/96
8/18/2019 intercomparari lichid
http://slidepdf.com/reader/full/intercomparari-lichid 16/96
8
In the sphere of scientific research, the most important works are related to improvement of
the state standards, particularly to restoring values of small velocities and flow rates.
Considerable attention is paid to investigation of energy resource supply and consumption
balance.
The Laboratory takes active part in fulfillment and implementation of the aims envisaged in
the plan of measures of The development program of the infrastructure (testing laboratories,
certification bodies) of conformity assessment and seeks the appointment by the Ministry of
Economy in 2003 to become an authorized body to evaluate conformity to the requirements
and to carry out itype examination of water, gas and liquid fuel meters, hot water boilers uop
to 400 kW burning gaseous and liquid fuels and gas appliances.
By the decision of the Government of Lithuania the Laboratory was appointed to carry out the
state safety examination of thermal equipment and gas appliances.
The Laboratory was accepted as corresponding membercorrespondent by the EUROMETtechnical committee FLOW.
From LEI-homepage Updated: 2003.08.05

8/18/2019 intercomparari lichid
http://slidepdf.com/reader/full/intercomparari-lichid 17/96
9
1.4 LNMC flow facilities
1.4.1 LNMC facilities for testing of cold water meters up to 18 m3 /h
The LNMC flow facilities for cold water meters are illustrated in Figure 1.4-1. The test rig is
manufactured by Karl Adolf Zenner, Germany in 1998 and according to standard ISO
4064/1-83. The calibration of meters in the range DN 15 – DN 40 is based on a 300 kg
weighing tank or a reference meter.
Figure 1.4-1: Diagram of LNMC flow calibration facilities for cold water meters.
Components The test bench is fitted with the following components:
1. Stand with tubes and outlet to fix the water meters.2. Flow rate control system with flow rate meters (4 pieces).3. Pumps (3 pieces).4. Measuring tank for the flow provision.5. Scales (300 kg with resolution e = 2 gr) with container (280 l).6. Tanks for water keeping with emptying device (2 pieces).7. Pipes, shutting-off devices, armature, ball valves.
8. Termometer, manometers.
The specifications of the facilities from Table 1.4-1.

8/18/2019 intercomparari lichid
http://slidepdf.com/reader/full/intercomparari-lichid 18/96
10
Table 1.4-1: LNMC facilities for calibration of cold water meters.

8/18/2019 intercomparari lichid
http://slidepdf.com/reader/full/intercomparari-lichid 19/96
11
1.4.2 LNMC facilities for testing of heat meters up to 40 m3 /h
The LNMC flow facilities for heat meters are illustrated in Figure 1.4-2. Calibration is based
on volume tanks up to 500 l tank or a reference meter. The facilities are further illustrated in
Figure 1.4-3 – 1.4-7.
Latvian National Metrology CentreDivision of heat and flora technical measurementsTEST RING SPI-1
RM1 – reference meter 1 (KROHNE “Alcometer“)
RM2 – reference meter (Endness + Hauser)
RT1 – reference transmeter 1 (KROHNE “Alcometer“)RT2 – reference transmeter 2 (Endness + Hauser)SS1 – start-stop device 1 (KROHNE “Alcometer“)SS1 – start-stop device 2 (Endness + Hauser)FM1 – frekvency meter C3-54 (KROHNE “Alcometer“)
FM2 – frekvency meter C3-54 (Endness + Hauser)
PC – computerR1 – receiver (500 l)
CS1 and KS3 – “reference ?”
VP1, 2, 3, 4 - ?VR1, 2, 3 – flow controllerMT1 (? l) and MT2 (50 l) – water tanksLE8, 5, 11, 10 – water level control deviceOS1 and OS2 – water pumps
FT – water collecting tank
Figure 1.4-2: Diagram of LNMC flow calibration facilities for heat meters.

8/18/2019 intercomparari lichid
http://slidepdf.com/reader/full/intercomparari-lichid 20/96
12
Figure 1.4-3: LNMC laboratory for calibration of heat meters.
Figure 1.4-4: Reference meters before inlet pipe section.

8/18/2019 intercomparari lichid
http://slidepdf.com/reader/full/intercomparari-lichid 21/96
13
Figure 1.4-5: Volume tanks for heat meters.

8/18/2019 intercomparari lichid
http://slidepdf.com/reader/full/intercomparari-lichid 22/96
14
Figure 1.4-6: Hydrostatic tank.
Figure 1.4-7: Thermostatic baths for heat metering.

8/18/2019 intercomparari lichid
http://slidepdf.com/reader/full/intercomparari-lichid 23/96
15
1.5 SP flow facilities
1.5.1 Several calibration facilities
Calibration means that the error of indication of the meter is measured, i.e. figures are given
on how much the output value from the meter has to be adjusted in order to be correct. When
manufactured, a meter with a pulse output signal is often marked with a K-factor
(pulses/litre). The correctness of this K-factor is found only after calibration. As the K-factor
normally varies with the flow, the meter needs to be calibrated at different flows for better
accuracy.
During the calibration, it is important that it is the output signal which is used, that is being
calibrated. The output in use can for example be pulse- or current signals, or a display. The
output signals can be handled by separate amplifiers and have different time constants or
zero-point suppressions. It is therefore important to calibrate the complete chain of signals.
The different types of meters require different calibration methods and calibration equipment
for best results. Useful questions to ask are:
Type of meter? (principle, resolution, type of output signal, time of integration etc)
Type of liquid? (density, viscosity, aggressiveness, temperature, pressure etc)
Manner of use? (flying or standing start and stop, normal volume to be measured,
installation etc)
Acceptable measurement uncertainty? (often 3 to 10 times better than the acceptable
tolerance when in use).
To meet the different requirements of calibration, our volume laboratory at SP is equipped
with some ten different types of calibration rigs. Several of these have been developed inhouse.
Figure 1.5-1: Flow calibration facilities at SP.

8/18/2019 intercomparari lichid
http://slidepdf.com/reader/full/intercomparari-lichid 24/96
16
The relevant facilities in relation to the actual intercomparison follow from Table 1.5-1.
Table 1.5-1: Characteristics of the SP test rigs.

8/18/2019 intercomparari lichid
http://slidepdf.com/reader/full/intercomparari-lichid 25/96
17
2. Participation in intercomparisons and experiences
2.1 Intercomparisons in general
2.1.1 The importance of intercomparisons according to EA
European co-operation of Accreditation (EA) consider interlaboratory comparisons
(intercomparisons) an essential element in the establishment of mutual confidence between
national calibration services.
“The goals of such interlaboratory comparisons are twofold:
a) to verify the competence of accredited laboratories, including verification of the reported
measurement uncertainty, whenever possible;
b) to verify the performance of national calibration laboratory accreditation bodies.
It is not the intention of the interlaboratory comparison to pass a judgement upon the
comparative capabilities of laboratories or services.”, /EA-Comp/
2.1.2 Basic types of intercomparisons
“The devices to be used for interlaboratory comparisons may be reference standards, gauges,
instruments or reference materials. They are measured by laboratories designated by
participating accreditation bodies. The measurement results are compared with the reference
values established by the reference laboratory.
There are two basic types of interlaboratory comparisons:(a) the circular type - circulation of the device amongst the participants; beginning and
ending at the Reference Laboratory;
(b) the star-shaped type - the device returns to the reference laboratory each time a
participant has finished the measurements, or each participant receives a sample of a
batch being previously measured by the reference laboratory.
Combination of the two types is possible, for instance the device may return to the reference
laboratory each time a ‘loop’ in a country has been completed.” /EA-Comp/

8/18/2019 intercomparari lichid
http://slidepdf.com/reader/full/intercomparari-lichid 26/96
18
2.1.3 Comparing of results of intercomparisons
“A convenient method of judging the quality of a measurement result is by calculating the
deviation En normalised with respect to the stated uncertainty, i.e.
where xlab is the measurement result of a participating laboratory as given in its calibration
certificate, xref is the reference value assigned to the measurement device on the date on which
xlab was obtained, Ulab is the uncertainty of xlab as given in the calibration certificate. Uref is
the uncertainty of xref which should include an allowance for the performance of the
measurement device over the course of the comparison (and may be time-dependent).
Absolute values of En less than unity should be obtained for the measurement to beacceptable.
In addition to a tabular presentation of the measurement results, they may also be presented
graphically. The laboratory’s results of one parameter, including the reference values, are
plotted, with bars indicating the stated uncertainty of the measurement, against time over the
period of the interlaboratory comparison.” /EA-Comp/
2.2 DTI participations and experiences
2.2.1 Participation in intercomparisonsDTI has participated in several international intercomparisons. An overview is given in Table
2.2-1.
In the next sections various examples from the intercomparisons has been taken up to give an
illustration of experiences, various ways of presentation and of typical problems related to
intercomparisons.
22(ref lab
ref lab
n
U U
x x E
+
−
=

8/18/2019 intercomparari lichid
http://slidepdf.com/reader/full/intercomparari-lichid 27/96
19
Table 2.2-1: DTI participation in national and international comparisons since 1991.
EU-BCR = European intercomparison co-financed by the BCR programme of EUEU-SMT = European intercomparison co-financed by the SMT programme of EUUK/DTI = Department of Trade & Industry, UKUN = International intercomparison co-financed by UNDanish Ring = Intercomparison carried out by “Intercomparison scheme for volumetric and heat meter
laboratories in Denmark”“References” refer to projects desribed in The Flow Laboratory for Water and Heat Measurement – Laboratory,activities and references, Danish Technological Institute, June 2001, /DTI-Flow/

8/18/2019 intercomparari lichid
http://slidepdf.com/reader/full/intercomparari-lichid 28/96
20
2.2.2 International experiences
In 1990 DTI became pilot laboratory of a BCR-project11: “Intercomparison of flow meter
calibration facilities for the measurement of flow at various temperatures”. The project
comprised flow measurements at 3 flow levels:
- “Small package” up to 1500 l/h
- “Medium package” up to 16.000 l/h
- “Large package” up to 180.000 l/h
All packages were further tested at water temperatures of 20, 50 and 70°C.
The project was co-financed by BCR with app. DKK 2m and after continual expansions the
project comprised a total of 12 laboratories (e.g. . PTB in Germany, NEL in Great Britain,
CETIAT in France and IMBC in Italy) in 11 different countries (Denmark, Sweden, Finland,Great Britain, Germany, the Netherlands, Belgium, France, Italy, Switzerland and Spain).
The calibration comprised 3 meter packages: “large”, “medium” and “small” with pipe
dimensions of 100 mm, 25 mm and 15 mm, respectively, which were circulated as illustrated
in Figure 2.2-1.
Figure 2.2-1: Various packages and rings from the BCR
intercomparison carried out from 1990 to 1994.
1 Bureau Commutaire Reference (BCR), which was the title of a special EU programme covering metrology.

8/18/2019 intercomparari lichid
http://slidepdf.com/reader/full/intercomparari-lichid 29/96
21
The project was completed in 1994. During the project the Flow Laboratory planned and
facilitated the practical implementation of the intercomparison, the initial tests of the meter
packages, the statistical calculations etc., and at the same time the Laboratory participated in
the comparisons on equal terms with the other laboratories.
Each of the three testing packages comprised a combination of an electromagnetic and a
turbine flow meter, which were tested for repeatability (at 10 repeated calibrations) and
sensitivity (five calibrations repeated incl. dismounting and remounting of the meters).
Figure 2.2-2 shows the results of the stability tests.
Figure 2.2-2: Examples of results of stability tests.

8/18/2019 intercomparari lichid
http://slidepdf.com/reader/full/intercomparari-lichid 30/96
22
Afterwards the intercalibrations between the 12 participant laboratories were carried out
together with repeated calibrations at the pilot laboratory (DTI) depending on the number of
participating laboratories in each ring.
Figure 2.2-3 shows an example of tests for the large package. Figure 2.2-4 shows the resultsof the repetitions for the small meter package.
Figure 2.2-3: Test examples from the large package.

8/18/2019 intercomparari lichid
http://slidepdf.com/reader/full/intercomparari-lichid 31/96
23
Figure 2.2-4: Results of the repeated tests for the small meter package.
Another presentation of comparison results is by Youden Plots placing the laboratory in
relation to a fixed reference value. From the Youden plot the laboratory is able to compare the
scatter of the results from the turbine meter with the scatter of the results from the
electromagnetic meter and in this way obtain information about the test facilities behaviour,
flow disturbance, pulsations and electrical disturbances. The Youden Plots also expose the
random and systematic uncertainties and possible errors.

8/18/2019 intercomparari lichid
http://slidepdf.com/reader/full/intercomparari-lichid 32/96
24
Such an example is shown in Figure 2.2-5 where both axes are in % deviation from fixed
reference values. Lab 1 and 11 are the calibrations at DTI before starting up and after
finishing the ring respectively.
Figure 2.2-5: Youden Plots of the results of the small package.
2.2.3 Danish comparisons and the exchange of international experience
As a follow up on participation in international intercomparisons it has thus been natural to
pass on experience to other Danish laboratories.
In 1993, at the request of various laboratories at district heating plants and meter
manufacturers this resulted in the establishment of a Danish intercomparison scheme called
“Intercomparison scheme for volumetric and heat meter laboratories in Denmark”.

8/18/2019 intercomparari lichid
http://slidepdf.com/reader/full/intercomparari-lichid 33/96
25
From the very beginning the intercomparison scheme was organised with a steering group
with representatives from Danish utility plants and meter manufacturers, respectively, with
their own laboratories as well as from Danish Technological Institute. In addition to Danish
Technological Institute, the steering group consists of representatives from Danish utility
plants and from the Association of Manufacturers of Energy and Flow Meters in Denmark. Atthe beginning, DANAK participated as observer, but as the intercomparisons recently have
become part of DANAK’s requirements, DANAK now participates as conclusive member.
The first intercomparison took place from 1994 - 1995 and a total of 13 Danish meter
laboratories participated with a total of 17 calibration benches. The intercomparison was
based on the circulation of a meter package consisting of two meters of different make
mounted in series and covering a volume flow from 125 l/h to 2000 l/h and a heat flow of app.
90 kW.
Figure 2.2-6: Intercomparisons initiated by Denmark – organised
in three Danish, and later in one international ring.
After the procurement of the meter package a number of tests were carried out on the chosen
reference meters, i.a. with regard to repeatability (showing the degree of correlation between
repeated measurements when the individual measurements are carried out under similar
conditions) and their reproducibility (showing the degree of correlation between measurement
results when the individual measurements are carried out under varying conditions). DTI
participated in the intercomparison as equivalent laboratory and as coordinating laboratory
and due to the many participants the intercomparison was organised in three rings as shown in
Figure 2.2-6.
At the end of 1995 contacts were taken to SP (Sveriges Provnings- och Forskningsinstitut),
Sweden, and to PTB (Physikalisch Technische Bundesanstalt, Berlin), in Germany, in order to
ensure international continuity. Both laboratories accepted the invitation to participate and in
that way the scope of intercomparisons was broadened to comprise a total of 15 laboratories
and 4 rings during the years 1995 - 1996.

8/18/2019 intercomparari lichid
http://slidepdf.com/reader/full/intercomparari-lichid 34/96
26
The background and the result of the DTI-PTB-SP intercomparison is desribed in detail in the
report Intercomparison of Flow Metering between DTI, PTB and SP, Final report, Danish
Technological Institute, September 1998 /DTI-1998/
As a natural follow-up - and also at the request of DANAK - it was at a later point decided torepeat the intercomparison with the meter package up to a volume flow of 2000 l/h and a heat
flow rate of app. 90 kW (“medium” package). In addition, the package was supplemented by
a “large” meter package exclusively covering a volume flow of up to 16,000 l/h (16 m3/h).
Today the “Intercomparison scheme for volumetric and heat meter laboratories in Denmark”
comprises the following packages.
- “Small” package comprising a coriolis mass flow meter and a magnetic inductive meter
of up to 125 l/h
- “Medium” package comprising two magnetic inductive meters of different make
covering a flow range of 125 l/h (2 m3/h) and heat measurements
- “Large” package comprising two magnetic inductive meters of different make covering a
flow range of 2000 - 16000 l/h.
The participants have i.a. comprised the laboratories stated in Table 2.2-2.
Table 2.2-2: The participants in the intercomparisons carried out under the “Intercomparison
scheme for volumetric and heat meter laboratories in Denmark”.

8/18/2019 intercomparari lichid
http://slidepdf.com/reader/full/intercomparari-lichid 35/96
27
2.3 LEI participations and experiences
LEI has participated in an intercomparison with Enermet in Finland covering flows up to
approx. 30.000 l/h at a water temperature of approx. 23 °C. The result formed as a certificate
follows from Figure 2.3-1.
Figure 2.3-1: Certificate from Enermet-LEI comparison.

8/18/2019 intercomparari lichid
http://slidepdf.com/reader/full/intercomparari-lichid 36/96
28
2.4 LNMC participations and experiences
LNMC has only participated in a single intercomparison. It was a comparison based on
calibration of a water meter at a German laboratory. The results from this intercomparison
have been of importance for the participation in this Nordic-Baltic intercomparison.
Flow measurements were compared between all LNMC laboratories (between Riga laboratory
and laboratories of branches):
- 2002 3 labs involved
- 2003 4 labs involved

8/18/2019 intercomparari lichid
http://slidepdf.com/reader/full/intercomparari-lichid 37/96
29
2.5 SP participations and experiences
2.5.1 Participation in intercomparisons
SP has participated in several intercomparisons (In Swedish “Jämförelsesmätningar”) asillustrated in Table 2.5-1.
Table
2.5-1: SP participation in intercomparisons.

8/18/2019 intercomparari lichid
http://slidepdf.com/reader/full/intercomparari-lichid 38/96
30
2.5.2 Examples from various intercomparisons
The following pages present selected illustrations from the following intercomparisons:
• SP Expl 1) Euromet Project A88/51 “Addendum to the Report on the Intercomparison of
the Calibration of a 5-litre Volume Standard”, 1991
• SP Expl 2) European calibration intercomparison on flow meters from BCR-Project:
Kerosene Calibration Intercomparison”, 3476/1/0/203/92/9-BCR, SP report 1995:77, SP,
1995
• SP Expl 3) Calibration techniques for coriolis mass flow meters, EU (SMT) Project
MAT1-CT940018, NEL, UK, 1997 (see also Table 2.2-1)
• SP Expl 4) An intercomparison of the measurement performance of five small water flow
calibration facilities at four European laboratories, NEL, 1999 (see also Table 2.2-1)
• SP Expl 5)EA Interlaboratory Comparison No. FL 3: Water meters, SP, 2001 (see
also//EA-SP FL3/ Final Report of the EA Inter-laboratory Comparison FL 3, Water
Meters, Swedac & SP, 2001)
The examples illustrates various experiences, problems and presentations of inter-
comparisons.

8/18/2019 intercomparari lichid
http://slidepdf.com/reader/full/intercomparari-lichid 39/96
31
SP Expl 1) Euromet Project A88/51 “Addendum to the Report on the
Intercomparison of the Calibration of a 5-litre Volume Standard”, 1991

8/18/2019 intercomparari lichid
http://slidepdf.com/reader/full/intercomparari-lichid 40/96
32

8/18/2019 intercomparari lichid
http://slidepdf.com/reader/full/intercomparari-lichid 41/96

8/18/2019 intercomparari lichid
http://slidepdf.com/reader/full/intercomparari-lichid 42/96
34

8/18/2019 intercomparari lichid
http://slidepdf.com/reader/full/intercomparari-lichid 43/96
35

8/18/2019 intercomparari lichid
http://slidepdf.com/reader/full/intercomparari-lichid 44/96
36

8/18/2019 intercomparari lichid
http://slidepdf.com/reader/full/intercomparari-lichid 45/96
37

8/18/2019 intercomparari lichid
http://slidepdf.com/reader/full/intercomparari-lichid 46/96

8/18/2019 intercomparari lichid
http://slidepdf.com/reader/full/intercomparari-lichid 47/96
39

8/18/2019 intercomparari lichid
http://slidepdf.com/reader/full/intercomparari-lichid 48/96
40
SP Expl 4) An intercomparison of the measurement performance of five
small watrer flow calibration facilities for at four European laboratories,
NEL, 1999
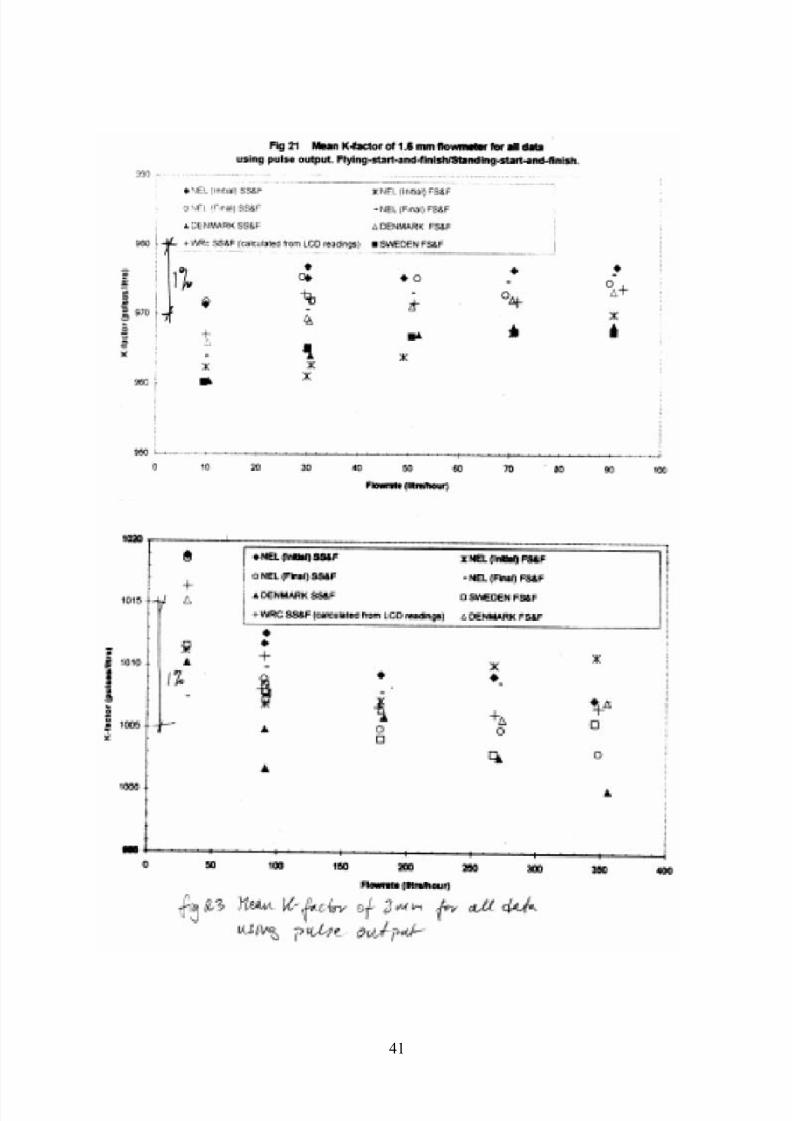
8/18/2019 intercomparari lichid
http://slidepdf.com/reader/full/intercomparari-lichid 49/96

8/18/2019 intercomparari lichid
http://slidepdf.com/reader/full/intercomparari-lichid 50/96
42
SP Expl 5) EA Interlaboratory Comparison No. FL 3: Water meters,
SP, 2001

8/18/2019 intercomparari lichid
http://slidepdf.com/reader/full/intercomparari-lichid 51/96
43

8/18/2019 intercomparari lichid
http://slidepdf.com/reader/full/intercomparari-lichid 52/96
44

8/18/2019 intercomparari lichid
http://slidepdf.com/reader/full/intercomparari-lichid 53/96
45
3 The Nordic-Baltic intercomparison
3.1 Setting up the intercomparison
3.1.1 Reference meter packages and the calibrations
Various packages were put into consideration. It was found that the Danish package former
used in several Danish intercomparisons as well as in an intercomparison with PTB in
Germany and SP in Sweden was very relevant for the actual facilities. The package is
illustrated in Figure 3.1-1.
Figure 3.1-1: The reference meter package.
According to the actual flow facilities and available meter packages the following Nordic-
Baltic intercomparison was selected:
Table 3.1-1: The Nordic-Baltic intercomparison.
Water flows
1 2 3 4
125 l/h 2000 l/h 60 l/h 125 l/h
Water temperature20°C ±2°C.

8/18/2019 intercomparari lichid
http://slidepdf.com/reader/full/intercomparari-lichid 54/96
46
Documentation of the intercomparison follows from:
• Intercalibration flow meter – Instructions for first round robin test, Flow rate 60 l/h -
2000 l/h, Nordtest Project No. 1610-02, Danish Technological Institute, 4 March 2003,
/NT-Instruct/
• EA-2/03 Interlaboratory Comparison, European co-operation of Accreditation (former
EAL), March 1996, /NT-Results/
3.1.2 Plan and schedule
According to the schedule originally laid out in it was decided to start up the intercomparisons
at the end of 2002, but it was also decided that there should be time for improving facilities
and staff both before and when carrying out the intercomparisons. Such circumstances e.g.
running-in of a test facility at LNMC in Latvia, and problems in fitting the tests into
scheduling of commercial tests and calibrations resulted, however, in several delays of theintercomparison so that it was not finishing until February 2004. The resulting timetable
follows from Table 3.1-2.
Table 3.1-2: Timetable of the intercomparison.
3.2 Intercomparison instruction
Based on former instructions and the discussions at the meetings an informative instruction
for the laboratories was carried out. The instruction follows from Annex 1.
3.3 Intercomparison results
A complete overview of the results of the intercomparison follows from Tables 3.3-1 to 3.3-5
and Figure 3.3-1 and 3.3-2. The tables also includes a calculation of the En-value that gives
an estimate of the test result compared with the accredited uncertainties of the laboratory (the
average from all laboratories are used as reference values). The complete test results follow
from Annex 2.

8/18/2019 intercomparari lichid
http://slidepdf.com/reader/full/intercomparari-lichid 55/96
47
Table 3.3-1: Flow number 2.1 (125 l/h).
Flow number 2.1 (125 l/h)
Labor Measured valueDeviation fromaverage
Std. Deviation ofmeasurements
Stated uncertainty En- value
Krohne E&H Krohne E&H Krohne E&H Krohne E&H Krohne E&HDTI 1 -0,13 0,95 -0,05 0,16 0,01 0,03 0,1 0,13 -0,34 0,95
LEI -0,04 0,63 0,04 -0,17 0,08 0,02 0,08 0,08 0,33 -1,29
SP -0,06 0,82 0,02 0,02 0,03 0,01 0,11 0,11 0,15 0,17
LNMC 1 0,00 1,00 0,08 0,21 0,02 0,02 0,095 0,095 0,59 1,49
LNMC 2 -0,21 0,67 -0,13 -0,13 0,05 0,19 0,1 0,1 -0,91 -0,88
DTI 2 -0,05 0,70 0,03 -0,10 0,02 0,03 0,1 0,13 0,22 -0,58
Average -0,08 0,80
Table 3.3-2: Flow number 3 (2000 l/h).
Flow number 3 (2000 l/h)
Labor Measured value
Deviation from
average
Std. Deviation of
measurements Stated uncertainty En- value
Krohne E&H Krohne E&H Krohne E&H Krohne E&H Krohne E&H
DTI 1 -0,19 0,52 -0,04 0,05 0,04 0,05 0,15 0,16 -0,20 0,27
LEI -0,14 0,55 0,01 0,08 0,15 0,02 0,08 0,08 0,11 0,64
SP -0,13 0,57 0,02 0,10 0,02 0,02 0,11 0,11 0,16 0,69
LNMC 1 -0,33 0,52 -0,18 0,05 0,00 0,05 0,048 0,048 -1,61 0,47
LNMC 2 -0,19 0,18 -0,04 -0,29 0,04 0,11 0,1 0,1 -0,26 -2,05
DTI 2 0,06 0,47 0,21 0,00 0,02 0,03 0,15 0,16 1,19 0,01
Average -0,15 0,47
Table 3.3-3: Flow number 3 (60 l/h).
Flow number 1 (60 l/h)
Labor Measured valueDeviation from
average
Std. Deviation of
measurementsStated uncertainty En- value
Krohne E&H Krohne E&H Krohne E&H Krohne E&H Krohne E&H
DTI 1 -0,13 1,33 0,00 0,25 0,03 0,04 0,12 0,15 -0,02 1,32
LEI -0,14 0,78 -0,01 -0,30 0,10 0,07 0,08 0,08 -0,10 -2,22
SP -0,21 1,21 -0,08 0,13 0,05 0,04 0,12 0,12 -0,51 0,77
LNMC 1 0,16 1,28 0,29 0,20 0,04 0,10 0,095 0,095 1,96 1,35
LNMC 2 -0,31 0,87 -0,18 -0,21 0,26 0,32 0,15 0,1 -0,98 -1,43
DTI 2 -0,13 1,03 0,00 -0,05 0,01 0,02 0,12 0,15 -0,02 -0,29
Average -0,13 1,08
Table 3.3-4: Flow number 2.2 (125 l/h). Flow number 2.2 (125 l/h)
Labor Measured valueDeviation fromaverage
Std. Deviation ofmeasurements
Stated uncertainty En- value
Krohne E&H Krohne E&H Krohne E&H Krohne E&H Krohne E&H
DTI 1 -0,10 0,94 0,00 0,15 0,03 0,05 0,17 0,17 -0,01 0,73
LEI -0,06 0,66 0,04 -0,13 0,03 0,03 0,08 0,08 0,28 -0,97
SP -0,22 0,91 -0,12 0,12 0,01 0,01 0,11 0,11 -0,78 0,75
LNMC 1 0,13 1,00 0,23 0,21 0,00 0,10 0,095 0,095 1,56 1,42
LNMC 2 -0,27 0,50 -0,17 -0,30 0,04 0,12 0,1 0,1 -1,15 -1,99
DTI 2 -0,07 0,75 0,03 -0,04 0,03 0,03 0,17 0,17 0,14 -0,21
Average -0,10 0,79

8/18/2019 intercomparari lichid
http://slidepdf.com/reader/full/intercomparari-lichid 56/96
48
Figure 3.3-1: Results and standard deviation for E&H and Krohne meters.
Figure 3.3-2: Results and standard deviation for Krohne meter.

8/18/2019 intercomparari lichid
http://slidepdf.com/reader/full/intercomparari-lichid 57/96
49
Table 3.3-5: Stated uncertainty from the laboratories.
Stated uncertainty from the laboratories
DTI LEI SP LNMC1 LNMC 2Flowrate
Reference meter:
l/h Krohne E&H Krohne E&H Krohne E&H Krohne E&H KrohneE&H
125 0,10 0,13 0,08 0,08 0,11 0,11 0,095 0,095 0,1 0,1
2000 0,15 0,16 0,08 0,08 0,11 0,11 0,048 0,048 0,1 0,1
60 0,12 0,15 0,08 0,08 0,12 0,12 0,095 0,095 0,15 0,1
125 0,17 0,17 0,08 0,08 0,11 0,11 0,095 0,095 0,1 0,1

8/18/2019 intercomparari lichid
http://slidepdf.com/reader/full/intercomparari-lichid 58/96
50
4. Method for uncertainty calculations
As a further result of the discussions of the two workshops and from various inputs from the
laboratories a method for the uncertainty calculations of testing and calibration facilities forwater and heat meters has been carried out.
Furthermore has the method been evaluated at a training seminar for flow laboratory
representatives from 7 new members in the European Union.
The method is described in a special document.

8/18/2019 intercomparari lichid
http://slidepdf.com/reader/full/intercomparari-lichid 59/96
51
References
/EA-Comp/ EA-2/03 Interlaboratory Comparison, European co-operation of
Accreditation (former EAL), March 1996
/EA-GUM/ EA-4/02 Expression of the Uncertainty of Measurement in Calibration,
December 1999
/DTI-Flow/ The Flow Laboratory for Water and Heat Measurement – Laboratory,
activities and references, Danish Technological Institute, June 2001
/DTI-Ext/ Intercomparison of Flow Metering between DTI, PTB and SP, Final report,
Danish Technological Institute, September 1998
/EA-SP FL3/ Final Report of the EA Inter-laboratory Comparison FL 3, Water Meters,Swedac & SP, 2001
/NT-Instruct/ Intercalibration flow meter – Instructions for first round robin, Flow rate 60
l/h - 2000 l/h, Nordtest Project No. 1610-02, Danish Technological Institute,
4 March 2003
/NT-Results/ EA-2/03 Interlaboratory Comparison, European co-operation of
Accreditation (former EAL), March 1996

8/18/2019 intercomparari lichid
http://slidepdf.com/reader/full/intercomparari-lichid 60/96

8/18/2019 intercomparari lichid
http://slidepdf.com/reader/full/intercomparari-lichid 61/96
Annex 1
Intercomparison
instruction

8/18/2019 intercomparari lichid
http://slidepdf.com/reader/full/intercomparari-lichid 62/96
_______________________________________________________________________________________
Annex 1: Intercomparison - INSTRUCTION
REV. 04.03.2003 & 28.05.2004 & 01.09.2004/ JOF
2
Content
1 Participating laboratories
1.1 Participants
2 Reference standard
2.1 General
2.2 Main dimensions
2.3 Volume flow meters
2.4 Temperature sensors
2.5 Calculation units
3 Calibration procedures
3.1 Water flows and temperatures
3.2 Mounting in the test bench
3.3 Electrical connections3.3.1 Earth connection
3.3.2 Display and output signal
3.4 Commissioning
3.4.1 Venting
3.4.2 Heating time for the electronic device
3.5 Calibration procedure
4 Laboratory reports
5 Transport of reference standard between the participants
5.1 Packing of reference standard
5.2 Method of transportation
5.3 Precautionary rules
5.4 Information for the next laboratory
6 Accident regarding reference standard
7 Presentation of the participating laboratories' calibration results
APPENDICES
A Calculation unit display and how to operate it
B Connections to output signals for volume and energy
C Reporting forms
D Reporting forms of the coordinating laboratory
E Information about calibration medium and procedures

8/18/2019 intercomparari lichid
http://slidepdf.com/reader/full/intercomparari-lichid 63/96
_______________________________________________________________________________________
Annex 1: Intercomparison - INSTRUCTION
REV. 04.03.2003 & 28.05.2004 & 01.09.2004/ JOF
3
1 PARTICIPATING LABORATORIES
1.1 Participants
Danish Technological Institute, Energy
Attn.: John Frederiksen/Jens B. Vestergaard
Kongsvang Allé 29
DK-8000 Aarhus C
Denmark
Tel: +45 72201235
Fax: +45 72201212
Email: [email protected]
Swedish National Testing and Research Institute (SP)
Laboratory for Volume and FlowAttn.: Kerstin Mattiasson
Brinellgatan 4
S-50115 Borås
Sweden
Tel: +46 3316 5380
Email: [email protected]
Lithuanian Energy Institute (LEI)
Heat Research and Testing Laboratory
Attn.: Nerijus Pedisus/ Antonas Pedirius /G. Zygmantes
3 Breslaujos str.
3035 Kaunas
Lithuania
Tel: +370 740 1864 / / +370 7401861
Email: [email protected]
Latvian National Metrology Centre (LNMC)
Attn.: Ariji Klints/Janis Jansons
K. Valdemara iela 157
Riga LV 1013
LatviaTel: +736 2988
Email: [email protected]

8/18/2019 intercomparari lichid
http://slidepdf.com/reader/full/intercomparari-lichid 64/96
_______________________________________________________________________________________
Annex 1: Intercomparison - INSTRUCTION
REV. 04.03.2003 & 28.05.2004 & 01.09.2004/ JOF
4
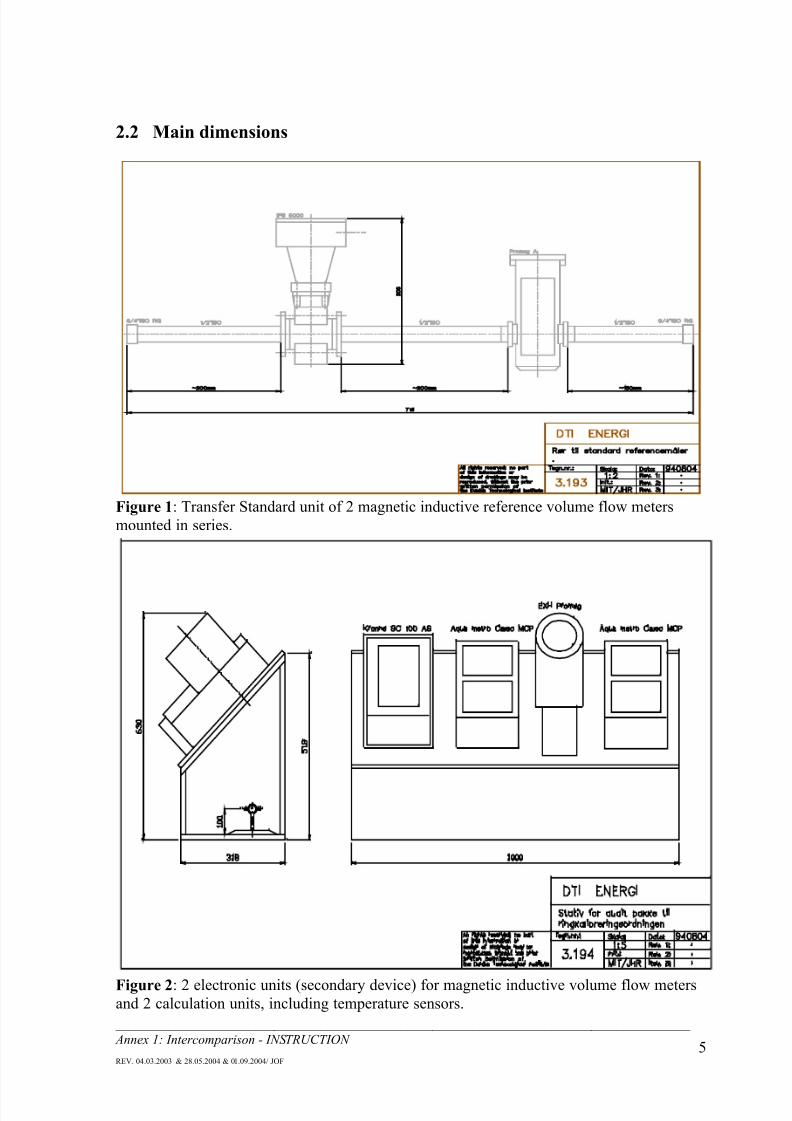
2 REFERENCE STANDARD
2.1 General
The reference standard consists of 2 magnetic inductive volume flow meters/volume meters, 2calculation units and 2 sets of flow and return temperature sensors.
The volume flow meters are mounted in series and thus constitute a complete unit that must
not be dismantled by any of the participants. The straight pipe length upstream of the first
volume flow meter is 200mm or approx. 12 X d i, as the pipe dimension is 2" ISO (DN
16mm). The pipe length is the same between the meters, and the straight length downstream
after the last meter is approximately 10 X di.
The inlets and outlets to/from the individual meters are conical, as the internal diameters of the
meters are less than those of the connected pipe diameters.
The units of calculation and the volume flow meters secondary device are assembled on an
inclined plate in a frame stand, which has 2 interior pipe carriers on which the volume flow
meters are mounted during transportation. All electrical connections are switched on,
including the temperature sensors of the type Pt 500.
The principal dimensions of the package appear from figures 1 and 2 as well as from section
2.2 and the manufacturers= specifications of the measurement equipment appear from the
sections 2.3 - 2.5.
In order to ensure that the volume flow meter can function satisfactorily, the conductivity of
the water in the measuring bench is required (manufacturer requirement) to be equal to or
higher than 20 S/cm.
8/18/2019 intercomparari lichid
http://slidepdf.com/reader/full/intercomparari-lichid 65/96
_______________________________________________________________________________________
Annex 1: Intercomparison - INSTRUCTION
REV. 04.03.2003 & 28.05.2004 & 01.09.2004/ JOF
5
2.2 Main dimensions
Figure 1: Transfer Standard unit of 2 magnetic inductive reference volume flow meters
mounted in series.
Figure 2: 2 electronic units (secondary device) for magnetic inductive volume flow metersand 2 calculation units, including temperature sensors.

8/18/2019 intercomparari lichid
http://slidepdf.com/reader/full/intercomparari-lichid 66/96
_______________________________________________________________________________________
Annex 1: Intercomparison - INSTRUCTION
REV. 04.03.2003 & 28.05.2004 & 01.09.2004/ JOF
6
2.3 Volume flow meters
Meter no. 1:Make: Krohne Altometer
Type: IFS 5000/Sc 100 AS
DN: 10, flange: DN 15
di: 7mm
qmax nominal: 2000 l/h, (15 m/s)
qmin nominal: 20 l/h, (0.15 m/s)
Pulse output: 1000 pulses per litre
Current output: 4-20 mA (not used)
Uncertainty: v <1 m/s: (0.3% RDG+1 mm/s)
(under ref. conditions) v <1 m/s: 0.4% RDG
Measured repeatability: < 0.06%Supply voltage: 220VAC 10% (48 - 63Hz)
Meter no. 2:
Make: Endress + Hauser
Type: Promag A/Promag 33
DN: 8mm, threaded connections: 2" BSP
di: 8mm
qmax nominal: 1800 l/h (excess volume flow: 163% FS)
qmin nominal: 20 l/h
Pulse output: 1000 pulses per litre
Current output: 4-20 mA (not used)
Uncertainty: 1-10 m/s: (0.1% RDG+0.1%FS)
(under ref. conditions) 0.5-1 m/s: (0.2% RDG+2%FS)
Measured repeatability: < 0.08%
Supply voltage: 85 - 260 VAC (45 - 65 Hz)
2.4 Temperature sensorsMake: Kamstrup
Type: Resistance temperature sensors Pt 500
Dimensions: D = 5.8 mm, l = 46.5
Temperature range: 20°C – 130°C

8/18/2019 intercomparari lichid
http://slidepdf.com/reader/full/intercomparari-lichid 67/96
_______________________________________________________________________________________
Annex 1: Intercomparison - INSTRUCTION
REV. 04.03.2003 & 28.05.2004 & 01.09.2004/ JOF
7
2.5 Calculation unit
Make: AQUA-METROType: CALEC MCP 300
Supply voltage: 230V (+10 -15%) 50/60 Hz
Pulse output: 1000 pulses per litre
Pulse factor, volume: 2 litres per pulse (not used)
Pulse factor, engergy: 0.1 kWh per pulse (counting cycle approx. 5 sec.)
Installation requirements: Volume flow meter is mounted in return flow
Temperature range: 0 – 180°C
Temperature difference: 2 - 180K
Display:
- Total energy volume, kWh - plus residual energy solution 0.01 Wh- Total volume, m3 - plus residual volume, solution 0.01l
- Volume flow, l/h
- Energy supply, kW
- Temperature in flow, °C
- Temperature in return flow, °C
- Temperature difference, K
3 CALIBRATION PROCEDURES
3.1 Water flows and temperature
Water flows:
Volume flow no.: 1: 60 l/h
2: 125 l/h
3: 2000 l/h
The actual test sequence is:
Volume flow 2, volume flow 3, volume flow 1 and volume flow 2 (to be repeated).
Water temperature in volume flow test section,
T = 20°C 3°C

8/18/2019 intercomparari lichid
http://slidepdf.com/reader/full/intercomparari-lichid 68/96

8/18/2019 intercomparari lichid
http://slidepdf.com/reader/full/intercomparari-lichid 69/96
_______________________________________________________________________________________
Annex 1: Intercomparison - INSTRUCTION
REV. 04.03.2003 & 28.05.2004 & 01.09.2004/ JOF
9
3.4.2 Heating up time for the electronic device
Connect the meters to the power supply and ensure that they are switched on for at least an
hour before finally starting the calibrations (see APPENDIX B).
3.5 Calibration procedure
1 Inspect and install the flow meter package as indicated under item 3.2. Do not
dismantle the package!
2 Carry out the electrical connections as indicated under item 3.3.
3 Fill the measuring length with water of 20°C and vent as indicated under item 3.4.1.
4 Apply voltage to the meters and the joint connector as indicated under item 3.4.2
5 Flush the meter package at volume flow no. 3 (2000 l/h).
This is to ensure that the electrodes are without any disturbing coating.
Then reduce the volume flow to volume flow no. 2 (125 l/h) and perform three
repeated measurements at this volume flow (at stable flow conditions) and a water
temperature (Tv) of 20°C 3°C.
6 Calculate the error indications of the meters and report the results to the DTI flow
laboratory, John Frederiksen or Jens B. Vestergaard, who will decide whether the
package has changed during transport or not.
7 When signal has been received indicating that the meter package is considered free of
defects, start by exercising the meter package for half an hour at volume flow no.3:
2000 l/h (Tv = 20°C 3°C).
Then reduce the volume flow to volume flow no. 2. Then carry out 5 repeated
calibrations of the meter package at this volume flow.
Then increase the water flow to flow no. 3: 2000 l/h
When stable conditions have been ensured, calibrate the package 5 consecutive times
at this water flow.
Then increase the water flow to flow no. 1: 60 l/h and
when stable conditions have been ensured, carry out 5 repeated calibrations at this
volume flow.
End calibrations by repeating the calibrations at volume flow no. 2: 125 l/h, and repeat
5 times. This repetition of flow no. 2 is to be carried out to see whether changes may
have occurred in the meter package meanwhile as well as to show something about the
reproducibility of the laboratory.
If the DISPLAY is used to read the meter, use the standing start/stop method and do
not read the display and the residual value until 10 secs. after each stop before as wellas after the measurement to allow the calculation unit time to complete its internal

8/18/2019 intercomparari lichid
http://slidepdf.com/reader/full/intercomparari-lichid 70/96
_______________________________________________________________________________________
Annex 1: Intercomparison - INSTRUCTION
REV. 04.03.2003 & 28.05.2004 & 01.09.2004/ JOF
10
calculations.
8 When the measurements are completed, drain the pipe length of the measuring bench
and dismantle the reference meter package.
9 Place the pipe with the volume flow meters in vertical position for approx. 4 hours
before placing it in transportation position inside the frame. Make sure that the
reference meter cannot overturn during the draining period.
10 Forward the package to the next planned laboratory.
Complete the reporting forms and return them to John Frederiksen, DTI-energy, Flowlab.,
Teknologiparken, DK-8000 Aarhus.
Email: [email protected]
4 LABORATORY REPORTS
The report must include (See APPENDIX E) :
- A simplified sketch of the test stand used, indicating the location of the transfer standard
- Information about the quality of the water (see item 3.2)
- Information about the calibration method used
Volume flow:
- Static weighing method with flying or standing start/stop
- Dynamic weighing method
- Use of reference meter
- The completed reporting forms contained in APPENDIX C
- Observations, if any, before, during and after the calibrations that may be of significance
to the measuring results.

8/18/2019 intercomparari lichid
http://slidepdf.com/reader/full/intercomparari-lichid 71/96
_______________________________________________________________________________________
Annex 1: Intercomparison - INSTRUCTION
REV. 04.03.2003 & 28.05.2004 & 01.09.2004/ JOF
11
5 TRANSPORT OF REFERENCE STANDARD BETWEEN THE
PARTICIPANTS
5.1 Packing of reference standard
There is no box included for packing the reference meters. In stead there is a frame stand (see
fig. 2) that also forms a plinth onto which the electronic units are mounted. Inside, there are
also two pipe carriers where the pipe and reference flow meters are to be placed as a complete
unit.
The wire connections, which must not be dismantled, are tied together, for example with a
cable strap.
5.2 Method of transportation
The method of transportation is the so-called "hand-carrying" method, i.e. a person
responsible from the laboratory follows the transport, ensuring that the reference meters are
not damaged which could result in the subsequent laboratories measuring according to a
transfer standard which would be inconsistent with the standard that was originally circulated.
Furthermore, the person in question must inform the coordinating laboratory in case of any
accident during transportation. The coordinating laboratory must also be informed of any
accidents occurring in the laboratory.
Transportation is intended to be carried out by passenger car or delivery van. The reference
meter package is to be placed on its largest surface to prevent it from overturning during
transportation.
The laboratory itself is to be responsible for transporting the equipment to the next laboratory
in the circulation plan.
5.3 Precautionary rules
Remember that no parts may be dismantled.
Avoid impact and heavy vibration.
Avoid dust and dirt.
Ensure that end caps are mounted at the pipe ends.
5.4 Information for the next laboratory
Once you start the calibration work you should contact the next laboratory to arrange when to
deliver the reference meter package.
The next laboratory is indicated on the list under item 1.2

8/18/2019 intercomparari lichid
http://slidepdf.com/reader/full/intercomparari-lichid 72/96
_______________________________________________________________________________________
Annex 1: Intercomparison - INSTRUCTION
REV. 04.03.2003 & 28.05.2004 & 01.09.2004/ JOF
12
6 ACCIDENT REGARDING REFERENCE STANDARD
If you find out or think that the reference meter package has met with an accident of some
sort, the coordinating laboratory is to be informed. This laboratory will then decide whether
the reference meter package can continue or must be returned for re-calibration.
7 PRESENTATION OF THE PARTICIPATING LABORATORIES'
CALIBRATION RESULTS
A form will be completed of the individual laboratories' measuring results and the deviation
from the mean value based on all the laboratories participating in the ring if the measuring
results do not deviate more than 0.5% from the mean value (APPENDIX D).
A graphic illustration will also be prepared based on this form.
The En-values of the individual laboratories will also be calculated and presented in a diagram.
When the ring has been completed, a ring calibration report will be prepared presenting the
results, among other things.

8/18/2019 intercomparari lichid
http://slidepdf.com/reader/full/intercomparari-lichid 73/96
_______________________________________________________________________________________
Annex 1: Intercomparison - INSTRUCTION
REV. 04.03.2003 & 28.05.2004 & 01.09.2004/ JOF
13
APPENDIX A
Figure 3 Calculation unit AQUA METRO
Operate the panel of AQUA METRO using the two arrow keys "arrow up" and "arrow down",
see the right-hand side of figure 3.
Normally, the display indicates the energy amount E that has passed.
After any change in the display indication, it returns to the energy amount E after 2 - 4 min.
When the display indicates E, press:
First
1: "Arrow up", press briefly = ∆T, then
2: "Arrow down", press briefly = More info?
3: "Arrow up", keep it down until indication = residual energy
4: "Arrow down", press briefly = residual volume?

8/18/2019 intercomparari lichid
http://slidepdf.com/reader/full/intercomparari-lichid 74/96
_______________________________________________________________________________________
Annex 1: Intercomparison - INSTRUCTION
REV. 04.03.2003 & 28.05.2004 & 01.09.2004/ JOF
14
APPENDIX B
Figure. 4 Output connections for flow and energy pulsesK factor flow: approx. 1000 pulses/l
Energy pulse value: 0.1kWh/pulse

8/18/2019 intercomparari lichid
http://slidepdf.com/reader/full/intercomparari-lichid 75/96
_______________________________________________________________________________________
Annex 1: Intercomparison - INSTRUCTION
REV. 04.03.2003 & 28.05.2004 & 01.09.2004/ JOF
15
APPENDIX C1 (to be completed by the participating laboratory)
REPORTING FORM NO. 1 - RAW DATA - VOLUME
FLOW T water
KROHNE Endress + Hauser
REF. FLOW REF. VOLUME VOLUME REF. FLOW REF. VOLUME VOLUME
NO. °C l/h l Pulses l l/h l pulses l
2
2
2
2
2
3
3
3
3
3
1
1
1
1
1
2
2
2
2
2
DATE: LABORATORY:

8/18/2019 intercomparari lichid
http://slidepdf.com/reader/full/intercomparari-lichid 76/96
_______________________________________________________________________________________
Annex 1: Intercomparison - INSTRUCTION
REV. 04.03.2003 & 28.05.2004 & 01.09.2004/ JOF
16
APPENDIX C2 (to be completed by the participating laboratory)
REPORTING FORM NO. 3 - MEAN VALUES - VOLUME ERRORS
FLOW KROHNE E+H KROHNE E+H ACCR.
NO. ERROR % ERROR % STDV % STDV % %
2
3
1
2
DATE: LABORATORY: RING NO.: SIGN.:
)x-x(*1-n
1 =STDV
2
iΣ

8/18/2019 intercomparari lichid
http://slidepdf.com/reader/full/intercomparari-lichid 77/96

8/18/2019 intercomparari lichid
http://slidepdf.com/reader/full/intercomparari-lichid 78/96
_______________________________________________________________________________________
Annex 1: Intercomparison - INSTRUCTION
REV. 04.03.2003 & 28.05.2004 & 01.09.2004/ JOF
18
APPENDIX D2 (to be completed by the participating laboratory)
RING NO. 1 - FLOW NO 2.2 - DEVIATION FROM THE MEAN VALUE OF ALL - VOLUME
LABORATOR
Y:
REFERENCE
MEAN VALUE %
MEASURED MEAN
VALUE
DEVIATION
%
ACCRED.
UNCERT.
NO. KROHNE E+H KROHNE E+H KROHNE E+H %
1
2
3
4
5
DATE: COORDINATING LABORATORY: SIGN.:
RING NO. 1 - DEVIATION FROM THE MEAN VALUE OF ALL - VOLUME
LABORATORY: REFERENCEMID-
DELVÆRDI - ALLE
MIDDELVÆRDI AF 5 DEVIATION: ERROR
REF.
ACCR.
UNCERT.
KROHN E+H KROHNE E+H KROHNE E+H
NO. % % % % % % %
1
2
3
4
5
DATE: COORDINATING LABORATORY: SIGN.:

8/18/2019 intercomparari lichid
http://slidepdf.com/reader/full/intercomparari-lichid 79/96
_______________________________________________________________________________________
Annex 1: Intercomparison - INSTRUCTION
REV. 04.03.2003 & 28.05.2004 & 01.09.2004/ JOF
19
APPENDIX E (to be completed by the participating laboratory)
Information about calibration medium and procedures
SUBJECT UNIT Tick [X]
Indicate figure value
Water quality
Softened
Demineralized
Electrical Conductivity S/cm
Filtering : (filtering degree) m
Full flow filter
Partial flow filter
No filter
Calibration method
Static weighing method
Dynamic weighing method
Volume measurement
Reference meter
Flying start/stop
Standing start/stop
Exercising the meters
Exercise duration Hours
Pressure in measuring length
after ref. meter package Bar

8/18/2019 intercomparari lichid
http://slidepdf.com/reader/full/intercomparari-lichid 80/96

8/18/2019 intercomparari lichid
http://slidepdf.com/reader/full/intercomparari-lichid 81/96
Annex 2
Intercomparison
results

8/18/2019 intercomparari lichid
http://slidepdf.com/reader/full/intercomparari-lichid 82/96
_______________________________________________________________________________________
Annex 1: Intercomparison - Results
REV. 28.05.2004 & 01.09.2004/ JOF
2
Content
1 Reported results
1.1 DTI 1
1.2 LEI
1.3 SP
1.4 LNMC1
1.5 LNMC2
1.6 DTI2

8/18/2019 intercomparari lichid
http://slidepdf.com/reader/full/intercomparari-lichid 83/96
_______________________________________________________________________________________
Annex 1: Intercomparison - Results
REV. 28.05.2004 & 01.09.2004/ JOF
3
1 Reported results
1.1 DTI 1
Figure 1.1-1 Results from Krohne meter DTI 1

8/18/2019 intercomparari lichid
http://slidepdf.com/reader/full/intercomparari-lichid 84/96
_______________________________________________________________________________________
Annex 1: Intercomparison - Results
REV. 28.05.2004 & 01.09.2004/ JOF
4
Figure 1.1-2 Results from E+H meter DTI 1

8/18/2019 intercomparari lichid
http://slidepdf.com/reader/full/intercomparari-lichid 85/96
_______________________________________________________________________________________
Annex 1: Intercomparison - Results
REV. 28.05.2004 & 01.09.2004/ JOF
5
1.2 LEI
Figure 1.2-1 Results from LEI test 1

8/18/2019 intercomparari lichid
http://slidepdf.com/reader/full/intercomparari-lichid 86/96
_______________________________________________________________________________________
Annex 1: Intercomparison - Results
REV. 28.05.2004 & 01.09.2004/ JOF
6
Figure 1.2-2 Results from LEI test 2

8/18/2019 intercomparari lichid
http://slidepdf.com/reader/full/intercomparari-lichid 87/96

8/18/2019 intercomparari lichid
http://slidepdf.com/reader/full/intercomparari-lichid 88/96
_______________________________________________________________________________________
Annex 1: Intercomparison - Results
REV. 28.05.2004 & 01.09.2004/ JOF
8
1.4 LNMC 1
Figure 1.4-1 Results from LNMC 1

8/18/2019 intercomparari lichid
http://slidepdf.com/reader/full/intercomparari-lichid 89/96
_______________________________________________________________________________________
Annex 1: Intercomparison - Results
REV. 28.05.2004 & 01.09.2004/ JOF
9
Figure 1.4-2 Results from LNMC 1

8/18/2019 intercomparari lichid
http://slidepdf.com/reader/full/intercomparari-lichid 90/96
_______________________________________________________________________________________
Annex 1: Intercomparison - Results
REV. 28.05.2004 & 01.09.2004/ JOF
10
Figure 1.4-3 Results from LNMC 1
8/18/2019 intercomparari lichid
http://slidepdf.com/reader/full/intercomparari-lichid 91/96
_______________________________________________________________________________________
Annex 1: Intercomparison - Results
REV. 28.05.2004 & 01.09.2004/ JOF
11
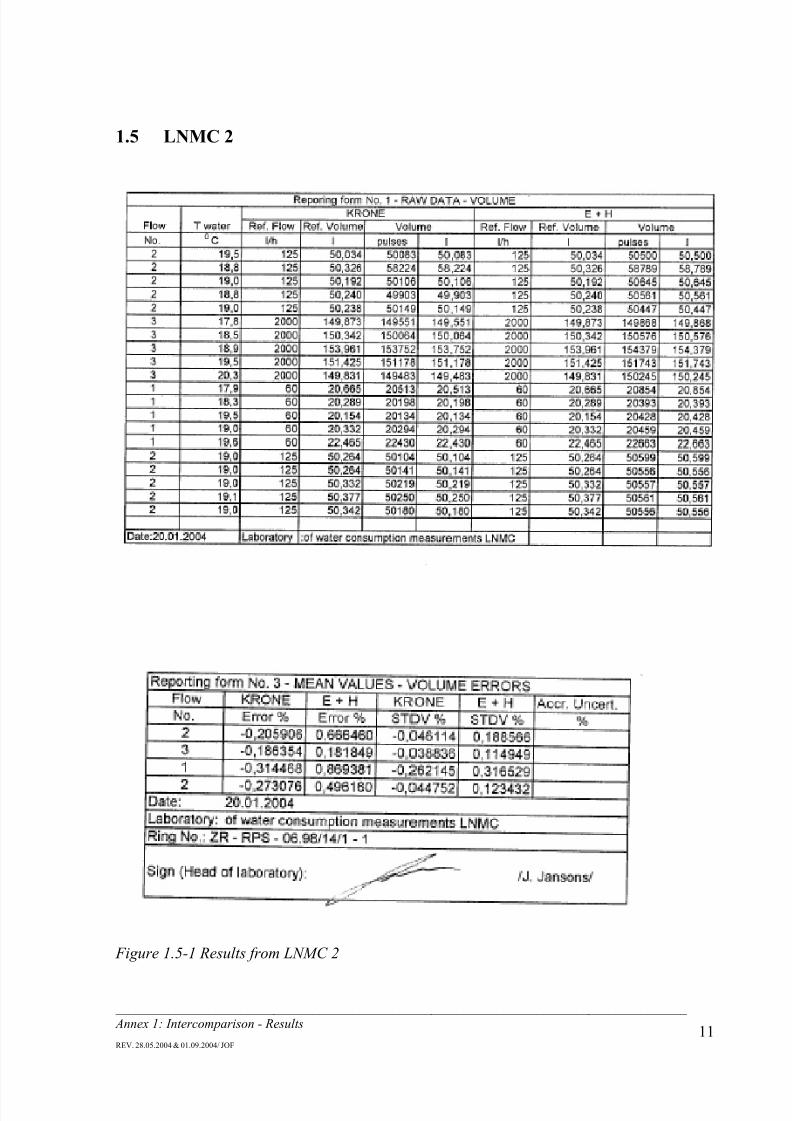
1.5 LNMC 2
Figure 1.5-1 Results from LNMC 2

8/18/2019 intercomparari lichid
http://slidepdf.com/reader/full/intercomparari-lichid 92/96
_______________________________________________________________________________________
Annex 1: Intercomparison - Results
REV. 28.05.2004 & 01.09.2004/ JOF
12
1.6 DTI 2
Figure 1.6-1 Results from Krohne meter DTI 2

8/18/2019 intercomparari lichid
http://slidepdf.com/reader/full/intercomparari-lichid 93/96
_______________________________________________________________________________________
Annex 1: Intercomparison - Results
REV. 28.05.2004 & 01.09.2004/ JOF
13
Figure 1.6-2 Results from E+H meter DTI 2

8/18/2019 intercomparari lichid
http://slidepdf.com/reader/full/intercomparari-lichid 94/96

8/18/2019 intercomparari lichid
http://slidepdf.com/reader/full/intercomparari-lichid 95/96
Annex 3
NT VVS 131
The approved methods NT VVS 131 Uncertainty calculations for calibration of
water and heat flow meters, can be downloaded at www.nordicinnovation.net.

8/18/2019 intercomparari lichid
http://slidepdf.com/reader/full/intercomparari-lichid 96/96
Nordic Innovation Centre
The Nordic Innovation Centre initiates and financesactivities that enhance innovation collaboration anddevelop and maintain a smoothly functioning market in
Return address:
Nordic Innovation Centre,
Stensberggata 25
NO-0170 Oslo, Norway
NORDTESTNORDTEST is a Nordic Innovation Centrebrand offering competence and experticein the field of harmonizing of norms andmethods,a large Nordic net-work of experts,more than 650 recommended Nordic testingmethods and 550 published technical reports.
www.nordicinnovation.net
Related Documents