INTERCITY VARIATION IN GENDER INEQUALITIES IN CHINA: ANALYSIS OF A 1995 NATIONAL SURVEY Xiaoling Shu and Yanjie Bian ABSTRACT Recent research portrays a mixed picture of the impact of post-1978 economic reforms on gender inequality in China. We analyze a 1995 national survey of urban China (10,967 individuals in 55 cities) and city- level data compiled from Chinese statistical yearbooks to show intercity covariations between an index of marketization and a set of indicators of gender inequality in the labor markets. Our analysis shows gender gaps in variables of human capital, political capital, labor market placement, and work earnings. Most of these gender inequalities remain constant across cities of varying degrees of product, labor, and capital market- ization. To the extent that the amount of gender inequality is correlated with marketization, this association is a non-monotonic one, indicating a nonlinear, accumulative marketization process. Major changes have taken place in the most marketized cities, where the gender disparity in affiliation with the state sector has diminished while gender-based occupational segregation has been on the rise. INTRODUCTION Recent research portrays a mixed picture of the impact of post-1978 economic reforms on gender inequality in China. One observation is that the growth of The Future of Market Transition, Volume 19, pages 267–307. Copyright © 2002 by Elsevier Science Ltd. All rights of reproduction in any form reserved. ISBN: 0-7623-0835-4 267 1 2 3 4 5 6 7 8 9 10 11 12 13 14 15 16 17 18 19 20 21 22 23 24 25 26 27 28 29 30 31 32 33 34 35 36 37 38 39 40

Welcome message from author
This document is posted to help you gain knowledge. Please leave a comment to let me know what you think about it! Share it to your friends and learn new things together.
Transcript
INTERCITY VARIATION IN GENDERINEQUALITIES IN CHINA: ANALYSISOF A 1995 NATIONAL SURVEY
Xiaoling Shu and Yanjie Bian
ABSTRACT
Recent research portrays a mixed picture of the impact of post-1978economic reforms on gender inequality in China. We analyze a 1995national survey of urban China (10,967 individuals in 55 cities) and city-level data compiled from Chinese statistical yearbooks to show intercitycovariations between an index of marketization and a set of indicators ofgender inequality in the labor markets. Our analysis shows gender gapsin variables of human capital, political capital, labor market placement,and work earnings. Most of these gender inequalities remain constantacross cities of varying degrees of product, labor, and capital market-ization. To the extent that the amount of gender inequality is correlatedwith marketization, this association is a non-monotonic one, indicating anonlinear, accumulative marketization process. Major changes have takenplace in the most marketized cities, where the gender disparity inaffiliation with the state sector has diminished while gender-basedoccupational segregation has been on the rise.
INTRODUCTION
Recent research portrays a mixed picture of the impact of post-1978 economicreforms on gender inequality in China. One observation is that the growth of
The Future of Market Transition, Volume 19, pages 267–307.Copyright © 2002 by Elsevier Science Ltd.All rights of reproduction in any form reserved.ISBN: 0-7623-0835-4
267
1
2
3
4
5
6
7
8
9
10
11
12
13
14
15
16
17
18
19
20
21
22
23
24
25
26
27
28
29
30
31
32
33
34
35
36
37
38
39
40
market economies created off-farm employment opportunities for rural women,narrowed the gender gap in household income contribution, and enhancedwomen’s relative status to men’s (Entwisle et al., 1995; Matthews & Nee, 2000;Michelson & Parish, 2000). Another observation, mostly from the cities, is thatas markets eroded the power of the state both as employer and advocator ofwomen’s rights, labor market discrimination against female workers re-emerged in hiring/layoffs, job placement, promotion, and wage determinationin both state and non-state sectors, lowering the economic status of womenrelative to men (Honig & Hershatter, 1988; Ran, 1988; Robinson, 1985; Wu,1995; Lee, 1995; Honig, 2000; Hershatter, 2000). Evidence from rural Chinaalso shows that men are leading the expansion of family businesses whilewomen are left behind to specialize in agriculture (Entwisle et al., 1995).Discrimination from the family may also have risen (Davis, 1995; Entwisle etal., 1995; Michelson & Parish, 2000). Yet a third observation is that despitechanges brought by state policy shifts and especially economic reforms, in thecities gender gaps in earnings and other work statuses have remained stablefrom the 1950s to the 1990s (Bian & Logan, 1996; Bian, Logan & Shu, 2000;Zhou, Tuma & Moen, 1996, 1997).
All three assessments about the trends of gender inequality have some merit.In his critical review of recent scholarship on China’s gender inequalities,Whyte (2000) identifies several areas in which controversies may lie. Forinstance, the realms in which research attention is focused differ, soassessments about women’s relative statuses in work and non-work lives orabout rural and urban women may lead to very different conclusions. Researchconducted in the same realm but with different indicators and measures canalso lead to different conclusions because even if the researchers have the sameconceptual goals behind their diverse research tools, these indicators andmeasures may mean different things. Finally, controversies lie in the differentdata sources used, especially when researchers collect their data from differentlocations, in different time periods, or with different designs. Given China’stremendous regional variations in socioeconomic development and pace ofreform, this last problem is particularly severe. Whyte’s suggestion isconstructive: Serious scholarly work that assesses the impact of reforms ongender inequality must carefully identify a realm of research, utilize a well-defined set of indicators and measures, and rely on comparable and systematicdata.
Inspired by Whyte’s suggestion, we examine in this paper intercity variationin gender inequalities in the labor markets by analyzing national data from the1995 Chinese Household Income Project (CHIP). We focus on four sets ofindicators and measures of labor market inequality available from the data:
268 XIAOLING SHU AND YANJIE BIAN
1
2
3
4
5
6
7
8
9
10
11
12
13
14
15
16
17
18
19
20
21
22
23
24
25
26
27
28
29
30
31
32
33
34
35
36
37
38
39
40
human capital, political capital, labor market placement, and work earnings.Although these four do not exhaust all sources of labor market inequality, theyare the most important aspects of work statuses of women and men as informedby an established gender and work literature (see a review by Marini, 1989) andby the research of Chinese social stratification (see a review by Bian, 2002).Because these indicators and measures were defined within a single surveyproject and data collection in multiple locations followed a uniform set ofprocedures, the data lend us a fairly high-quality assessment about measuredgender inequalities at a national level.
Because of known inter-region and intercity variations in pace of reforms(Nee, 1996; Parish & Michelson, 1996; Xie & Hannum, 1996), Chinese citiesconceivably will vary in level of marketization – the extent to whichcommodities are processed through product markets, people are matched tojobs through labor markets, and investment finances are allocated throughcapital markets. If, among the cities included in the 1995 CHIP data, level ofmarketization is associated negatively with degree of gender inequalitiesmeasured, this would be systematic evidence for the theme that markettransition reduces gender inequality in a big country like China (Nee &Matthews, 1996). If the association is positive, it lends support for thealternative theme that markets increase gender inequalities. If the results showno association or a curve-linear association, then additional careful studies intothe causes of these patterns are needed. Our statistical analyses that follow willnot in any way offer theoretical interpretations of any of these possible resultsbut only present carefully documented quantitative patterns that may implyclues to such interpretations.
DATA AND MEASURES
Individual-Level Data and Measures
The individual level data are from the urban portion of the 1995 CHIP. Througha multistage sampling procedure, this project selected 11 province-leveladministrative units (out of a total of 31). These were Beijing, Shanxi,Liaoning, Jiansu, Anhu, Heinan, Hubei, Guangdong, Yunan, Gansu, andSichuan. Then 69 cities and towns (out of a total of 226) were selected. Thesample contains 21,696 individuals from 6,931 households. These householdsurveys collected information on all household members. Because we haveno reliable macrolevel data for 14 county-headquarters, 1,174 individuals inthe non-agricultural labor force were excluded from this analysis. Under theassumption that within-household clustering is negligible (Shu & Bian, 2001),
269Gender Inequalities in China
1
2
3
4
5
6
7
8
9
10
11
12
13
14
15
16
17
18
19
20
21
22
23
24
25
26
27
28
29
30
31
32
33
34
35
36
37
38
39
40
we treat all wage-earning household members, ages 18–60, as independentobservations for this analysis.
In addition to age of wage earners, we measured gender inequality in fourareas: human capital, political capital, labor market placement, and workearnings. The two measures of human capital are a continuous variable of yearsof schooling and a dichotomous variable of college education. In previousstudies, these measures have shown consistent, positive effects on attainment ofpolitical capital, favorable labor market placements, and wage attainments inurban workplaces (Lin & Bian, 1991; Walder, 1992, 1995; Bian, 1994; Bian &Logan, 1996; Zhou et al., 1996, 1997). We use Communist party membershipas the measure of political capital. Recent studies show that even in the reformera Communist party membership is carefully screened for political loyalty,and membership increases opportunities for mobility into elite classes (Walderet al., 2000, 2001; Bian, Shu & Logan, 2001), although its impact on wageattainment is less consistent from one study to another (see a review by Nee &Matthews, 1996).
Labor market placement is measured by placement in work sectors,occupations, and industries. Three work sectors are the state, the collective, andthe new sector. The contrast between state and collective sectors entails ananalogy of core and peripheral sectors in advanced capitalist economies(Walder, 1986; Lin & Bian, 1991), and its changing structure in the reform erais complicated by the booming, more prosperous new sector, which is largelyindependent of state control and heterogeneous in property-rights arrange-ments. It encompasses private businesses, joint ventures, foreign investment,township enterprises, and other hybrid forms of ownership. The new-sectorvariable is constructed from respondents’ reports about their work-unit sector,employment status, and occupations. Because of the undersampling ofemployees in private enterprises and individual entrepreneurs (geitihu),individuals in these new forms of ownership are substantially under-represented in this sample1 (Chinese Statistical Bureau, 1998).
Informed by recent studies on urban classes (Davis, 1995, 2000), weidentified five occupational categories: owners and operators of private busi-nesses, professional and technical workers, cadres and managers of governmentagencies and state firms, office clerks, and skilled and unskilled workers.Finally, we identified five industries: manufacturing; mining, construction, andtransportation; commerce, real estate, finance, and service; education, culture,and public health; and party and government agencies. We identify theseindustries based on the social and economic rankings of the industries and thedocumented gender disparity in industry segregation, e.g. women are morelikely to be employed in sales, service, and education, while men are
270 XIAOLING SHU AND YANJIE BIAN
1
2
3
4
5
6
7
8
9
10
11
12
13
14
15
16
17
18
19
20
21
22
23
24
25
26
27
28
29
30
31
32
33
34
35
36
37
38
39
40
more likely employed in heavy industry (Whyte, 1984). A crude industryclassification was used in the data collection, which does not afford for carefulanalysis of within industry heterogeneity.
Work earnings are difficult to measure precisely because of institutionaluncertainties on the legitimacy of some sources of earnings. From the CHIPdata, we identified three sources of compensation workers earn at theworkplace: regular salary, bonus and subsidies, and earnings from privatebusinesses. The annual earnings were calculated as the sum of total salary(bonuses, subsidies, and stipends for temporarily laid-off workers) andearnings from private businesses including earnings as owners of privateenterprises and operators of private businesses.
City-Level Data and Measures
The city-level data was compiled from the China Statistical Yearbooks and theStatistical Yearbooks of selected cities for 1995.2 In Table 1, we compare the1995 CHIP urban sample with China-wide statistics by the Central PlaceHierarchy3 – a ranking of cities based on the levels of their socioeconomicdevelopment (Skinner, Henderson & Yuan, 2000).
Although higher-level cities were oversampled, the distribution of sampledindividuals in the non-agricultural labor force is consistent with the nationaldistribution across the Central-Place Hierarchy. Five of 10 apex metropolisesand six of 20 central metropolises were included in our sample. However,only 16 of 225 greater cities and 11 of 768 local cities were included, indicatingthat these lower-level cities are under-represented in the city sample. Thedistribution of city residents across the Central-Place Hierarchy is moreconsistent with the national distribution, with residents of regional cities and ofgreater cities slightly overrepresented and residents of local cities slightlyunderrepresented. Similarly, the distribution of individuals in the non-agricultural labor force is also very similar to the national statistics, withindividuals of regional cities and of greater cities slightly overrepresented andindividuals of local cities slightly underrepresented. Thus the 1995 CHIPsample is fairly representative of the Chinese urban labor force.
In the city-level data we compiled, three variables were used to measuredegree of marketization. Marketization of the commodity market is measuredby the percentage of industrial output by nonstate enterprises out of the totalindustrial output. Marketization of the labor market is measured by thepercentage of employees in nonstate firms out of the total number of workers.And marketization of the capital market is measured by the percentage offoreign investment out of the total investment in the city.
271Gender Inequalities in China
1
2
3
4
5
6
7
8
9
10
11
12
13
14
15
16
17
18
19
20
21
22
23
24
25
26
27
28
29
30
31
32
33
34
35
36
37
38
39
40
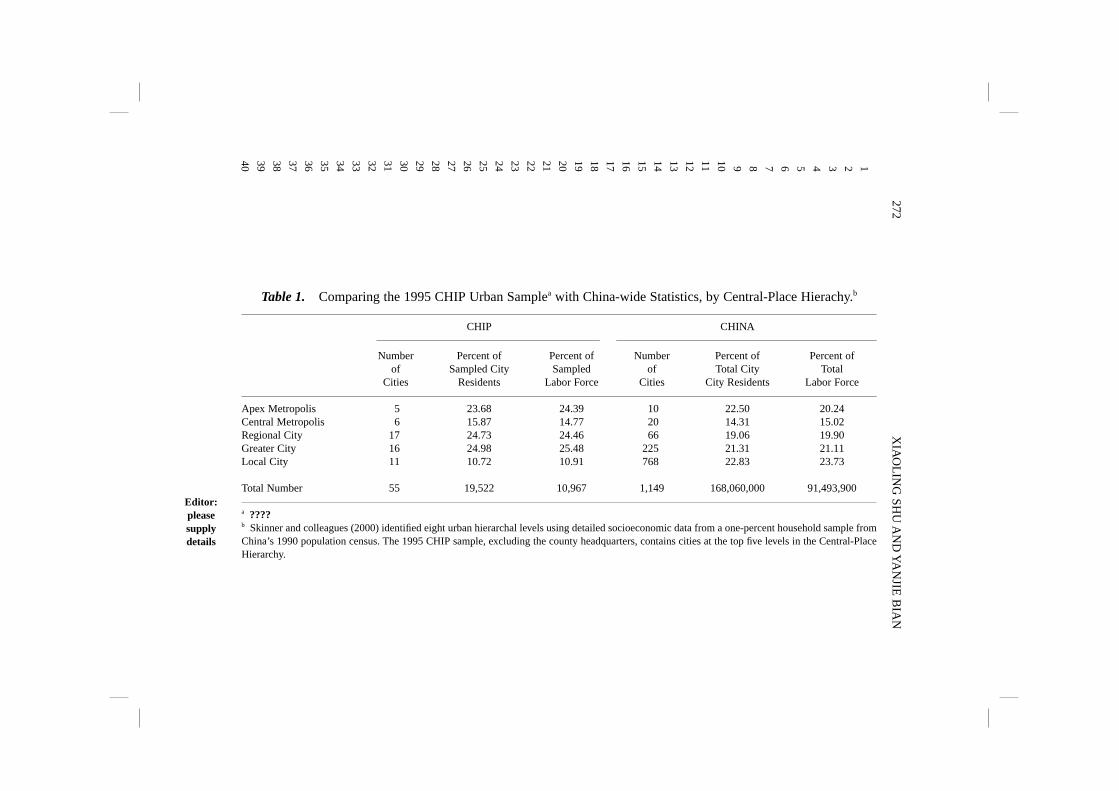
Table 1. Comparing the 1995 CHIP Urban Samplea with China-wide Statistics, by Central-Place Hierachy.b
CHIP CHINA
Number Percent of Percent of Number Percent of Percent ofof Sampled City Sampled of Total City Total
Cities Residents Labor Force Cities City Residents Labor Force
Apex Metropolis 5 23.68 24.39 10 22.50 20.24Central Metropolis 6 15.87 14.77 20 14.31 15.02Regional City 17 24.73 24.46 66 19.06 19.90Greater City 16 24.98 25.48 225 21.31 21.11Local City 11 10.72 10.91 768 22.83 23.73
Total Number 55 19,522 10,967 1,149 168,060,000 91,493,900
a ????b Skinner and colleagues (2000) identified eight urban hierarchal levels using detailed socioeconomic data from a one-percent household sample fromChina’s 1990 population census. The 1995 CHIP sample, excluding the county headquarters, contains cities at the top five levels in the Central-PlaceHierarchy.
Editor:pleasesupplydetails
272X
IAO
LIN
G SH
U A
ND
YA
NJIE
BIA
N
12345678910111213141516171819202122232425262728293031323334353637383940
Table 2 presents city-level variables used in the analysis and the correlationsamong these variables. On average, in these 55 cities in 1995, less than 45% ofindustrial commodities were produced by non-state sector, 36% of thenonagricultural labor force were in new and collective enterprises and business,and less than 4% of total investment were from foreign investment. The averageGDP per capita was 10,494.96 yuan.
We further reduce the three indicators of marketization in commoditymarket, labor market, and capital market into one latent construct. This latentconstruct can be identified using confirmatory factor analysis as described bythe following equation:
y = �y� + �
Where y is a vector of the three observed indicators, �y is a matrix ofparameters linking the latent construct, � to the observed indicators, and � is avector of error terms. The model assumes that each indicator is a function of theunderlying latent construct and an error term that is independent of the latentconstruct (Joreskog & Sorbom, 1988, 1993). The fit statistics for this one-factorconfirmatory factor analysis model (�2 = 0.9, df = 1, GFI = 1.00, RMR = 0.031,and BIC = � 1.32) indicate that this model fits our data well. The factor scoresgenerated from this analysis were then used to construct a composite measureof marketization. This standardized measure of marketization has a mean of 0and a standard deviation of 1, with negative values for lower degrees ofmarketization and positive values for higher degrees of marketization.
The three indicators of marketization are fairly highly correlated with oneanother (from 0.47 to 0.68), and this results in a composite measure ofmarketization that has strong associations with all three indicators, as evidentin the high correlations among them (from 0.80 to 0.90). In contrast, thecomposite measure of marketization is only moderately associated (0.42) witheconomic development level as measured by GDP per capita.
We divide the cities into four groups based on their scores on the index ofmarketization. The distribution of cities on this marketization index is highlyskewed, with the majority of cities having scores less than 0.5. Because ourinterest is in the relationship between marketization and gender inequality, weuse this index both as a continuous variable and a categorical variable bydifferentiating the cities into four groups. Cities with scores less than � 0.5 arethe “least marketized cities” – 16 cities are in this group containing 38% of theindividual wage earners (“respondents”) in the sample. Cities with scoresbetween � 0.5 and less than 0.5 are “marketized cities”; 27 such cities accountfor 49% of the total respondents. Seven cities have scores between 0.5 and 1.5and these are characterized as “highly marketized cities” containing 8% of the
273Gender Inequalities in China
1
2
3
4
5
6
7
8
9
10
11
12
13
14
15
16
17
18
19
20
21
22
23
24
25
26
27
28
29
30
31
32
33
34
35
36
37
38
39
40
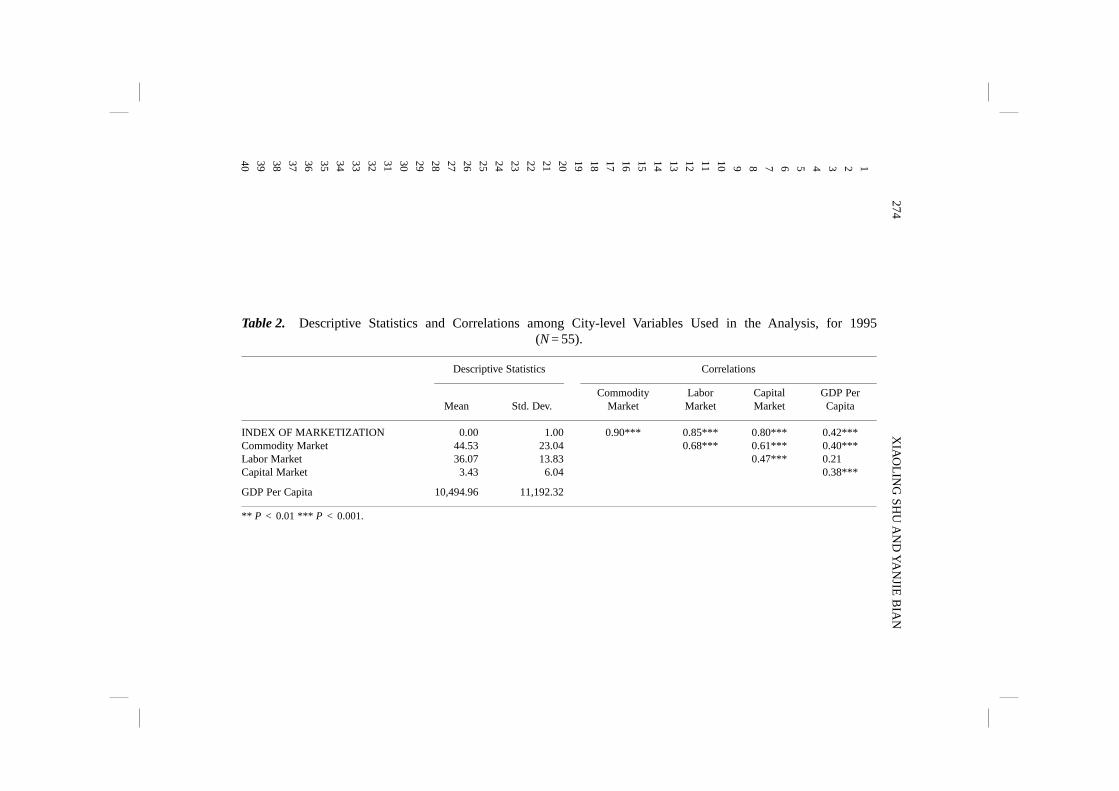
Table 2. Descriptive Statistics and Correlations among City-level Variables Used in the Analysis, for 1995(N = 55).
Descriptive Statistics Correlations
Commodity Labor Capital GDP PerMean Std. Dev. Market Market Market Capita
INDEX OF MARKETIZATION 0.00 1.00 0.90*** 0.85*** 0.80*** 0.42***Commodity Market 44.53 23.04 0.68*** 0.61*** 0.40***Labor Market 36.07 13.83 0.47*** 0.21Capital Market 3.43 6.04 0.38***
GDP Per Capita 10,494.96 11,192.32
** P < 0.01 *** P < 0.001.
274X
IAO
LIN
G SH
U A
ND
YA
NJIE
BIA
N
12345678910111213141516171819202122232425262728293031323334353637383940
respondents. The remaining five cities score higher than 1.5 on the index ofmarketization and are characterized as the “most marketized cities” with 5%of the respondents.
ANALYSIS
Describing Gender Gaps
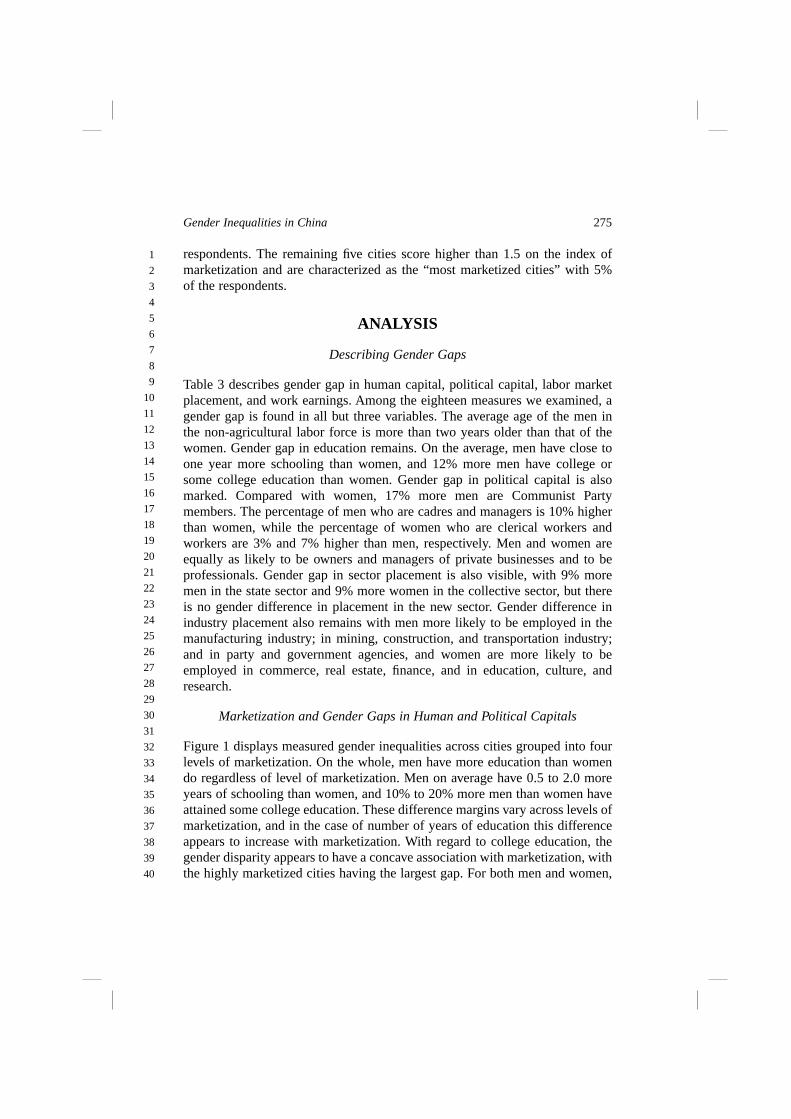
Table 3 describes gender gap in human capital, political capital, labor marketplacement, and work earnings. Among the eighteen measures we examined, agender gap is found in all but three variables. The average age of the men inthe non-agricultural labor force is more than two years older than that of thewomen. Gender gap in education remains. On the average, men have close toone year more schooling than women, and 12% more men have college orsome college education than women. Gender gap in political capital is alsomarked. Compared with women, 17% more men are Communist Partymembers. The percentage of men who are cadres and managers is 10% higherthan women, while the percentage of women who are clerical workers andworkers are 3% and 7% higher than men, respectively. Men and women areequally as likely to be owners and managers of private businesses and to beprofessionals. Gender gap in sector placement is also visible, with 9% moremen in the state sector and 9% more women in the collective sector, but thereis no gender difference in placement in the new sector. Gender difference inindustry placement also remains with men more likely to be employed in themanufacturing industry; in mining, construction, and transportation industry;and in party and government agencies, and women are more likely to beemployed in commerce, real estate, finance, and in education, culture, andresearch.
Marketization and Gender Gaps in Human and Political Capitals
Figure 1 displays measured gender inequalities across cities grouped into fourlevels of marketization. On the whole, men have more education than womendo regardless of level of marketization. Men on average have 0.5 to 2.0 moreyears of schooling than women, and 10% to 20% more men than women haveattained some college education. These difference margins vary across levels ofmarketization, and in the case of number of years of education this differenceappears to increase with marketization. With regard to college education, thegender disparity appears to have a concave association with marketization, withthe highly marketized cities having the largest gap. For both men and women,
275Gender Inequalities in China
1
2
3
4
5
6
7
8
9
10
11
12
13
14
15
16
17
18
19
20
21
22
23
24
25
26
27
28
29
30
31
32
33
34
35
36
37
38
39
40
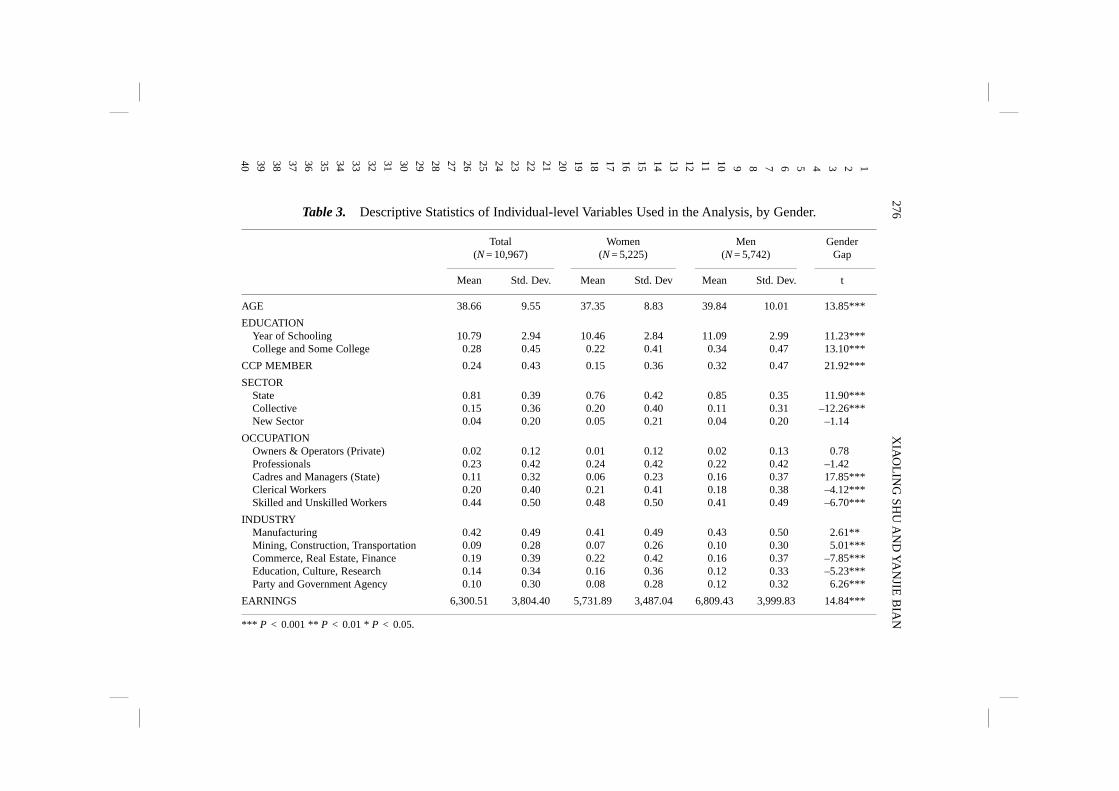
Table 3. Descriptive Statistics of Individual-level Variables Used in the Analysis, by Gender.
Total Women Men Gender(N = 10,967) (N = 5,225) (N = 5,742) Gap
Mean Std. Dev. Mean Std. Dev Mean Std. Dev. t
AGE 38.66 9.55 37.35 8.83 39.84 10.01 13.85***
EDUCATIONYear of Schooling 10.79 2.94 10.46 2.84 11.09 2.99 11.23***College and Some College 0.28 0.45 0.22 0.41 0.34 0.47 13.10***
CCP MEMBER 0.24 0.43 0.15 0.36 0.32 0.47 21.92***
SECTORState 0.81 0.39 0.76 0.42 0.85 0.35 11.90***Collective 0.15 0.36 0.20 0.40 0.11 0.31 –12.26***New Sector 0.04 0.20 0.05 0.21 0.04 0.20 –1.14
OCCUPATIONOwners & Operators (Private) 0.02 0.12 0.01 0.12 0.02 0.13 0.78Professionals 0.23 0.42 0.24 0.42 0.22 0.42 –1.42Cadres and Managers (State) 0.11 0.32 0.06 0.23 0.16 0.37 17.85***Clerical Workers 0.20 0.40 0.21 0.41 0.18 0.38 –4.12***Skilled and Unskilled Workers 0.44 0.50 0.48 0.50 0.41 0.49 –6.70***
INDUSTRYManufacturing 0.42 0.49 0.41 0.49 0.43 0.50 2.61**Mining, Construction, Transportation 0.09 0.28 0.07 0.26 0.10 0.30 5.01***Commerce, Real Estate, Finance 0.19 0.39 0.22 0.42 0.16 0.37 –7.85***Education, Culture, Research 0.14 0.34 0.16 0.36 0.12 0.33 –5.23***Party and Government Agency 0.10 0.30 0.08 0.28 0.12 0.32 6.26***
EARNINGS 6,300.51 3,804.40 5,731.89 3,487.04 6,809.43 3,999.83 14.84***
*** P < 0.001 ** P < 0.01 * P < 0.05.
276X
IAO
LIN
G SH
U A
ND
YA
NJIE
BIA
N
12345678910111213141516171819202122232425262728293031323334353637383940
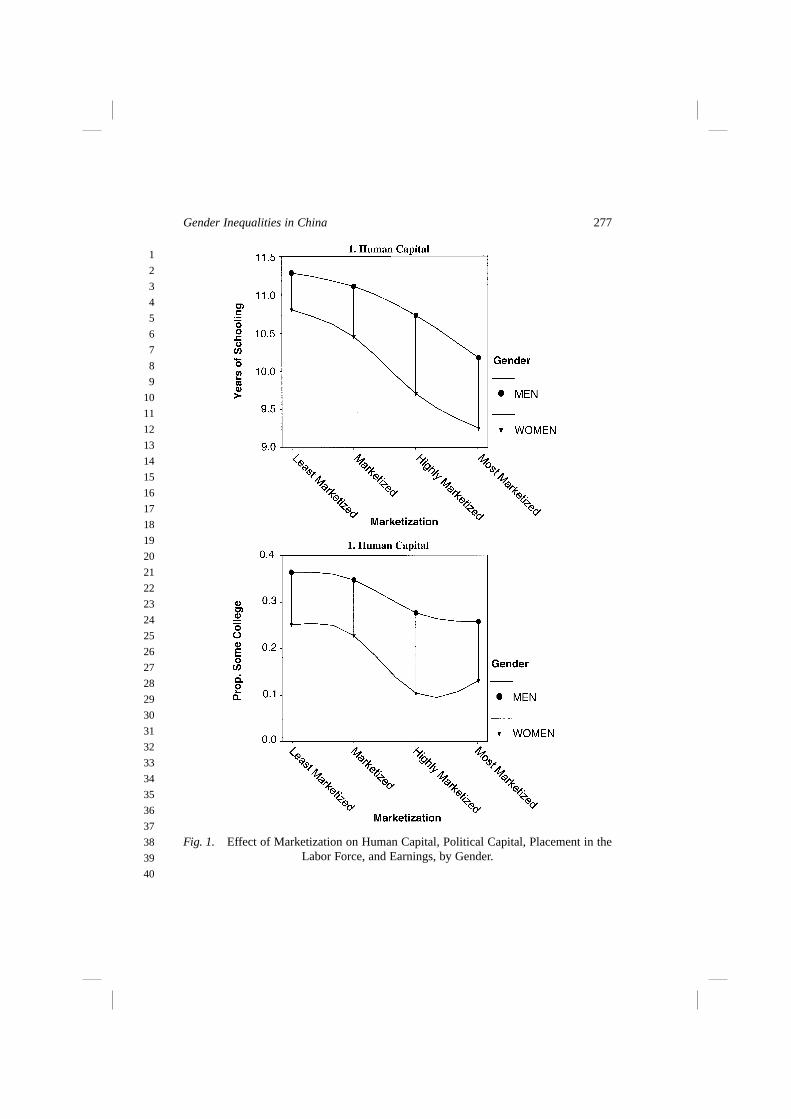
Fig. 1. Effect of Marketization on Human Capital, Political Capital, Placement in theLabor Force, and Earnings, by Gender.
277Gender Inequalities in China
1
2
3
4
5
6
7
8
9
10
11
12
13
14
15
16
17
18
19
20
21
22
23
24
25
26
27
28
29
30
31
32
33
34
35
36
37
38
39
40
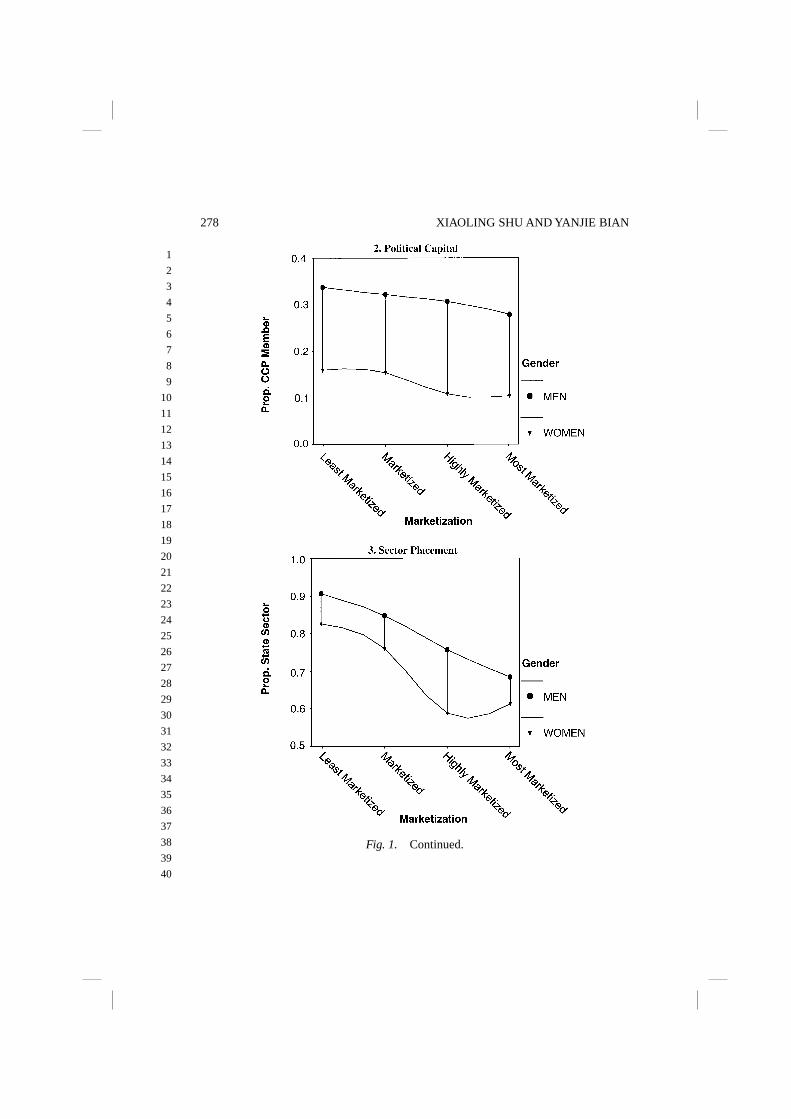
Fig. 1. Continued.
278 XIAOLING SHU AND YANJIE BIAN
1
2
3
4
5
6
7
8
9
10
11
12
13
14
15
16
17
18
19
20
21
22
23
24
25
26
27
28
29
30
31
32
33
34
35
36
37
38
39
40
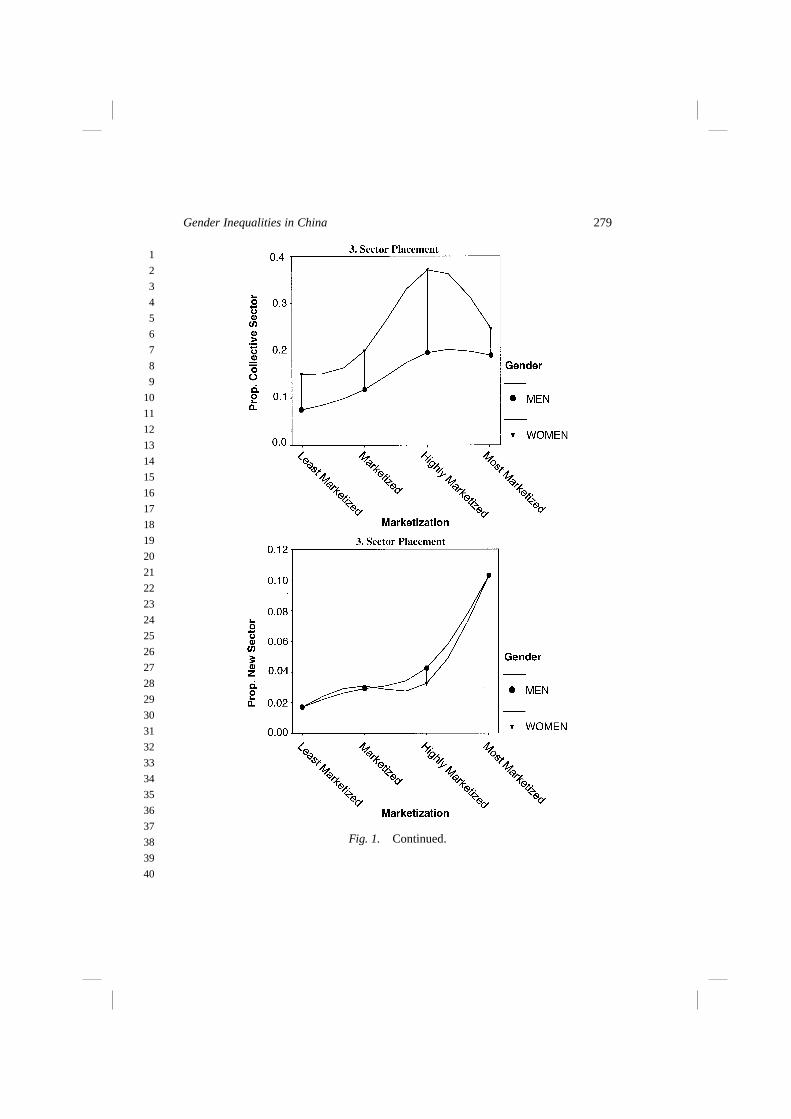
Fig. 1. Continued.
279Gender Inequalities in China
1
2
3
4
5
6
7
8
9
10
11
12
13
14
15
16
17
18
19
20
21
22
23
24
25
26
27
28
29
30
31
32
33
34
35
36
37
38
39
40
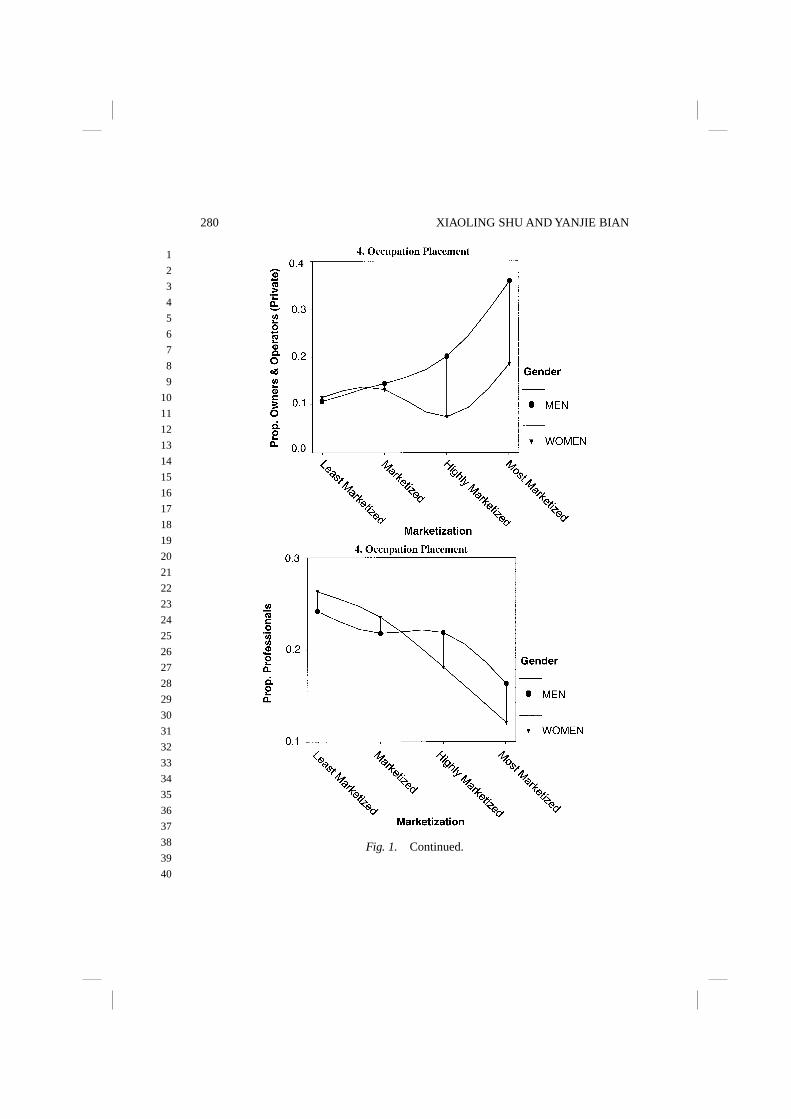
Fig. 1. Continued.
280 XIAOLING SHU AND YANJIE BIAN
1
2
3
4
5
6
7
8
9
10
11
12
13
14
15
16
17
18
19
20
21
22
23
24
25
26
27
28
29
30
31
32
33
34
35
36
37
38
39
40
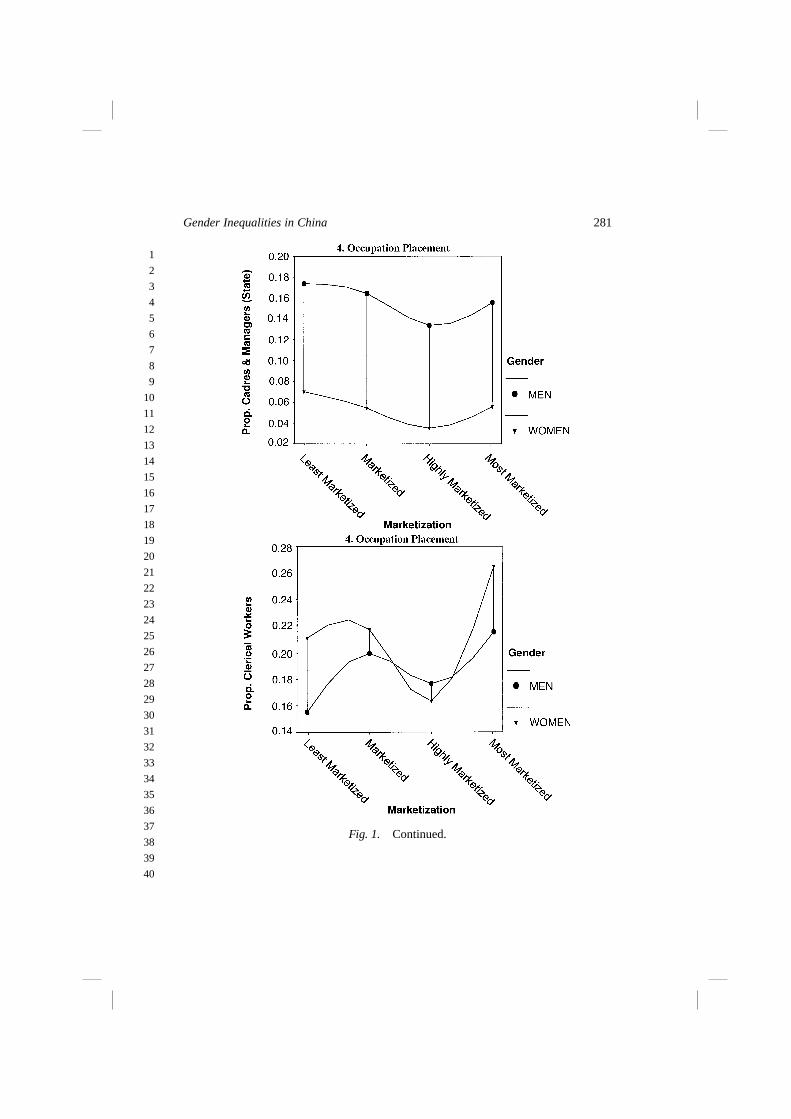
Fig. 1. Continued.
281Gender Inequalities in China
1
2
3
4
5
6
7
8
9
10
11
12
13
14
15
16
17
18
19
20
21
22
23
24
25
26
27
28
29
30
31
32
33
34
35
36
37
38
39
40
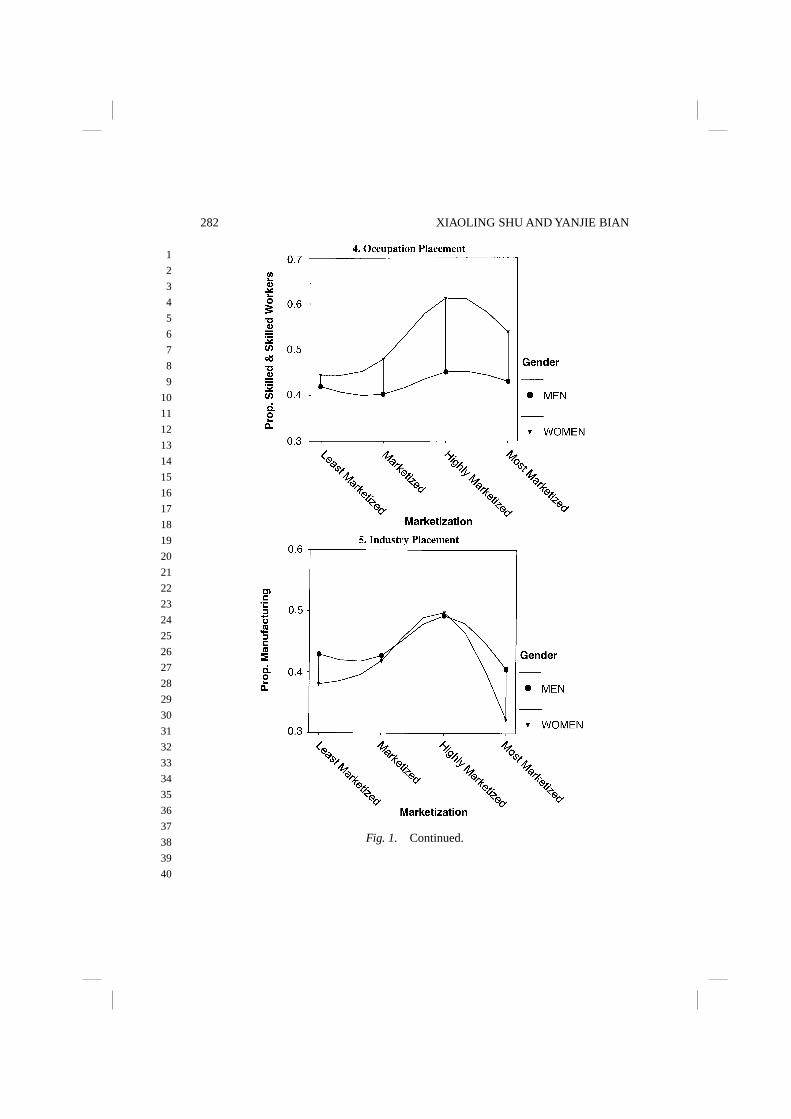
Fig. 1. Continued.
282 XIAOLING SHU AND YANJIE BIAN
1
2
3
4
5
6
7
8
9
10
11
12
13
14
15
16
17
18
19
20
21
22
23
24
25
26
27
28
29
30
31
32
33
34
35
36
37
38
39
40
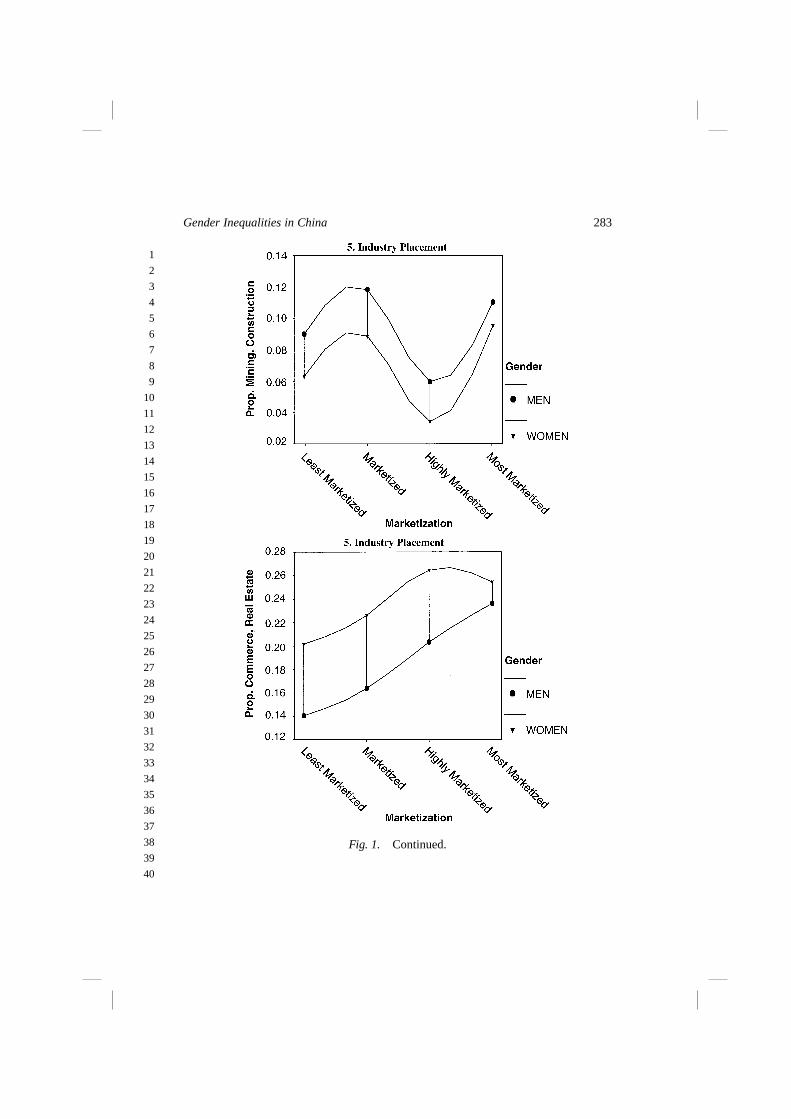
Fig. 1. Continued.
283Gender Inequalities in China
1
2
3
4
5
6
7
8
9
10
11
12
13
14
15
16
17
18
19
20
21
22
23
24
25
26
27
28
29
30
31
32
33
34
35
36
37
38
39
40
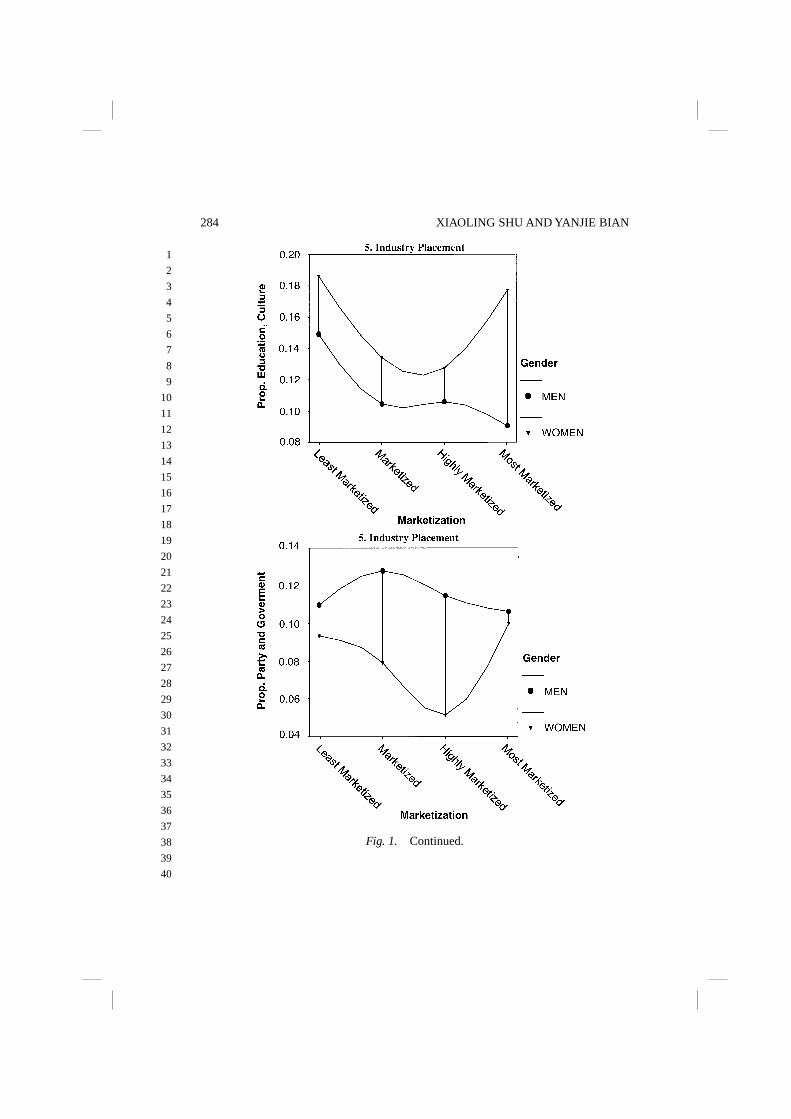
Fig. 1. Continued.
284 XIAOLING SHU AND YANJIE BIAN
1
2
3
4
5
6
7
8
9
10
11
12
13
14
15
16
17
18
19
20
21
22
23
24
25
26
27
28
29
30
31
32
33
34
35
36
37
38
39
40
years of schooling and the proportion of college educated decline withmarketization. In the Chinese context, the more marketized cities have beenexpanding their manufacturing and service sectors, thus having large numbersof low-educated workers in construction and service sectors. This may havecaused the observed negative association between education and marketizationacross cities.
Gender difference in Communist party membership has a 20% marginfavoring men, and this differential does not vary by level of marketization. Forboth men and women, the proportion of party members slightly declines withmarketization.
Marketization and Gender Gaps in Labor Market Placements
Gender differences in sector placement are marked across all levels ofmarketization. There were 8% to 20% more men in the state sector and 8% to20% more women in the collective sector, and these gender differentials arelargest in highly marketized cities. Because the collective sector is still less
Fig. 1. Continued.
285Gender Inequalities in China
1
2
3
4
5
6
7
8
9
10
11
12
13
14
15
16
17
18
19
20
21
22
23
24
25
26
27
28
29
30
31
32
33
34
35
36
37
38
39
40
attractive than the state sector (Bian & Li, 2000), this finding points to thepoorer sector placement of women with marketization. In the most highlymarketized cities, the state sector starts to lose its relative advantage over thenonstate sectors making the state sector not as desirable,4 allowing morewomen to move into this sector. Nevertheless, no gender difference is found inemployment in the new sector, which is true in all levels of marketization eventhough significantly more people are getting jobs in the new sector in moremarketized cities (from less than 2% in the least marketized cities to 10% in themost marketized cities). Because the new sector contains market opportunitiesper se, this particular finding indicates that market growth does not necessarilydiscriminate against or favor women in new sector jobs. However, because ourdata do not provide a representative sample of the new sector, we are unsureabout the extent to which this finding can be generalized.
Gender disparity was found in two of the five occupations we examined.There were 10% more men in state cadres and manager positions than women,a pattern that is consistent across all levels of marketization. The proportion ofpeople who are cadres and managers of state agencies and enterprises remainconstant across all levels of marketization. This indicates that market growthhas not eroded the size of the state elite nor the gender gap in the state elite. Onthe contrary, 3% to 20% more women were workers, and this gender gapincreases with marketization and decreases at the high end of marketization.Considering that the average earnings ratio between workers and cadresdecreased from 70% to 50% in the most marketized cities, gender gap resultingfrom occupation-based earnings differentials is likely to increase withmarketization. Gender gap in owning and managing private businesses alsogrows with marketization, although this gender gap is not statisticallysignificant. With marketization, the proportion of people in professional jobsdecreases for both men and women, but the decline is faster for women thanfor men.
Overall, the pattern of occupational placement with marketization indicatesthat marketization has a larger impact on women’s occupational placement thanon men’s as evidenced by a larger variation in occupation distribution acrossthe four groups of cities. Although with marketization, there have been adecrease in the proportion employed in professional jobs and an increase in theproportion in skilled and unskilled worker jobs, the sizes of both changes arelarger for women than for men. Increasing marketization usually is accom-panied by the expansion of manufacturing and service sector jobs in theChinese context. Considering that the ratio in earnings between workers andprofessionals declined from 79% to 64% in the most marketized cities, we
286 XIAOLING SHU AND YANJIE BIAN
1
2
3
4
5
6
7
8
9
10
11
12
13
14
15
16
17
18
19
20
21
22
23
24
25
26
27
28
29
30
31
32
33
34
35
36
37
38
39
40
derive that this occupational shift has a profound implication for genderdisparity in earnings.
Gender gaps also exist in industry placement in every industry exceptmanufacturing. Men were more likely to be in mining, construction,transportation, and party and government agencies, while women were morelikely to be in commerce, real estate, finance, and education, cultural, research,and technology. Among the five industries, only in the commerce, real estate,and finance industry does the proportion of employees linearly increase withmarketization. This increase is faster for men than for women. The proportionof people in party and government agencies decreases with marketization,with those in the highly marketized cities having the lowest proportion. Again,this decrease is faster for men than for women. Gender gap in mining,construction, transportation, in commerce, real estate, and finance (exceptthe most marketized cities), and in education, culture, research, technology, andpublic health (again except the most marketized cities) remains constant withmarketization. Gender gap in party and government agencies increaseswith marketization but then almost disappears in the most marketized cities.
Marketization and Gender Gap in Work Earnings
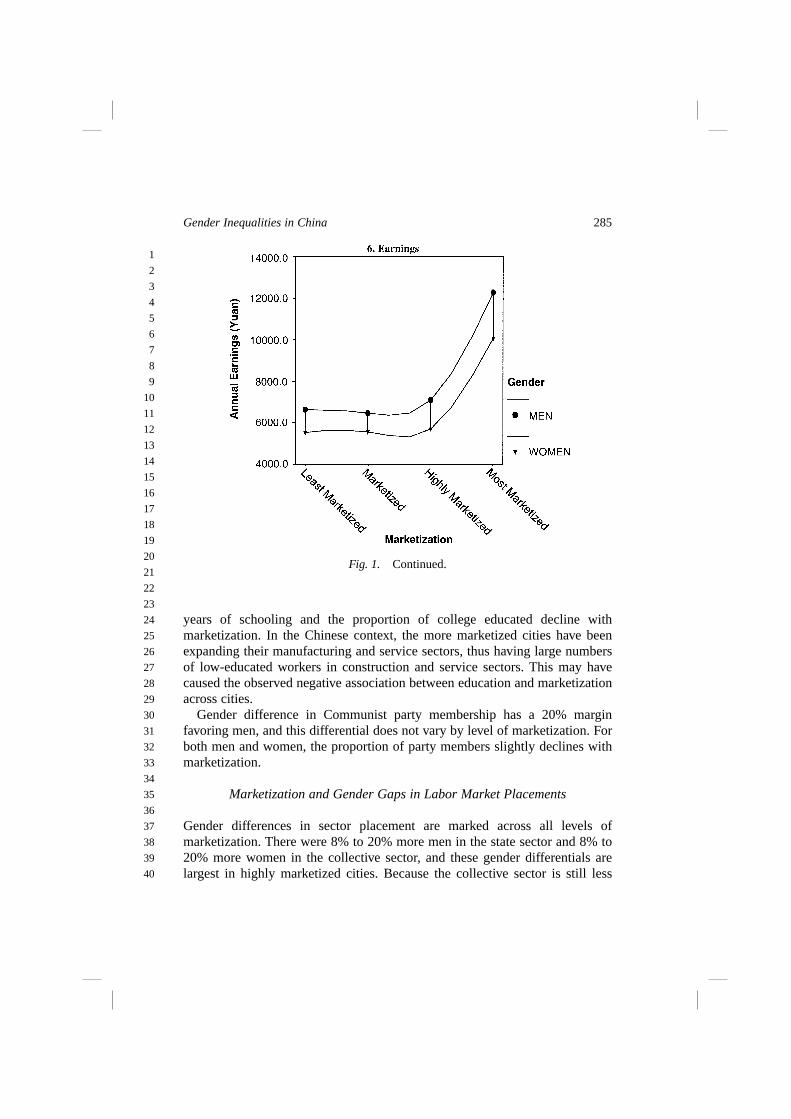
The size of the gender gap in earnings is independent of the process ofmarketization. While the average earnings rose from about 6,200 yuan to morethan 11,000 yuan in the most marketized cities, gender gap in earningsincreased at a similar pace from about 1,100 yuan to about 2,000 yuan inthe most marketized cities. In these cities, despite the nearly doubling of theaverage annual earnings from 5,538 yuan for women and 6,648 yuan for mento 10,083 yuan for women and 12,277 yuan for men, women’s earnings in allfour groups of cities remain within 81% to 86% of men’s.
Interactive Effects of Marketization and Gender
Marked gender difference is found in labor cohort composition, as illustrated inFigure 2. Compared with women, men in the older labor cohorts (entry in1958–1960 and earlier) account for 32% of the male labor force, and womenin this same cohorts account for only 20% of the female labor force. Much ofthis gender difference is due to the policy of a five-year earlier retirement agefor women than men. Because this cohort difference may affect the previouslydescribed gender inequalities, we present estimates of the effects of gender,marketization, and the interactive effect of gender and marketization onthe various measures of gender inequality, controlling for cohort effects inTable 4.
287Gender Inequalities in China
1
2
3
4
5
6
7
8
9
10
11
12
13
14
15
16
17
18
19
20
21
22
23
24
25
26
27
28
29
30
31
32
33
34
35
36
37
38
39
40
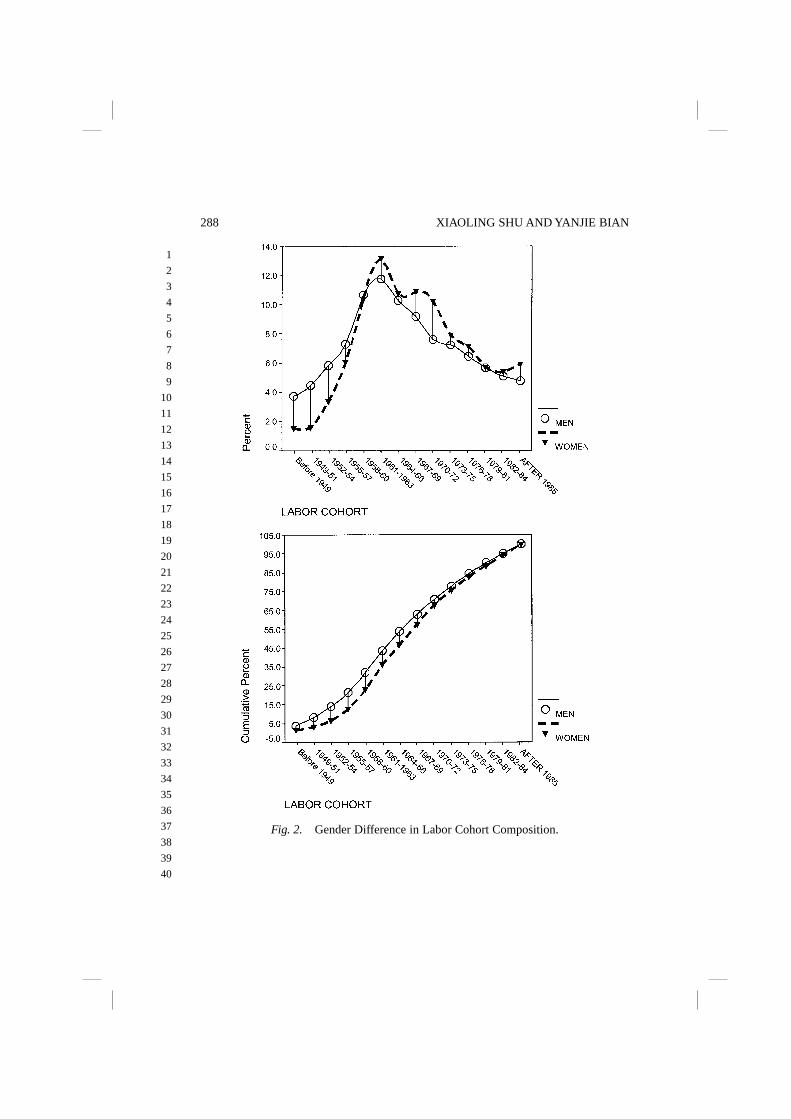
Fig. 2. Gender Difference in Labor Cohort Composition.
288 XIAOLING SHU AND YANJIE BIAN
1
2
3
4
5
6
7
8
9
10
11
12
13
14
15
16
17
18
19
20
21
22
23
24
25
26
27
28
29
30
31
32
33
34
35
36
37
38
39
40
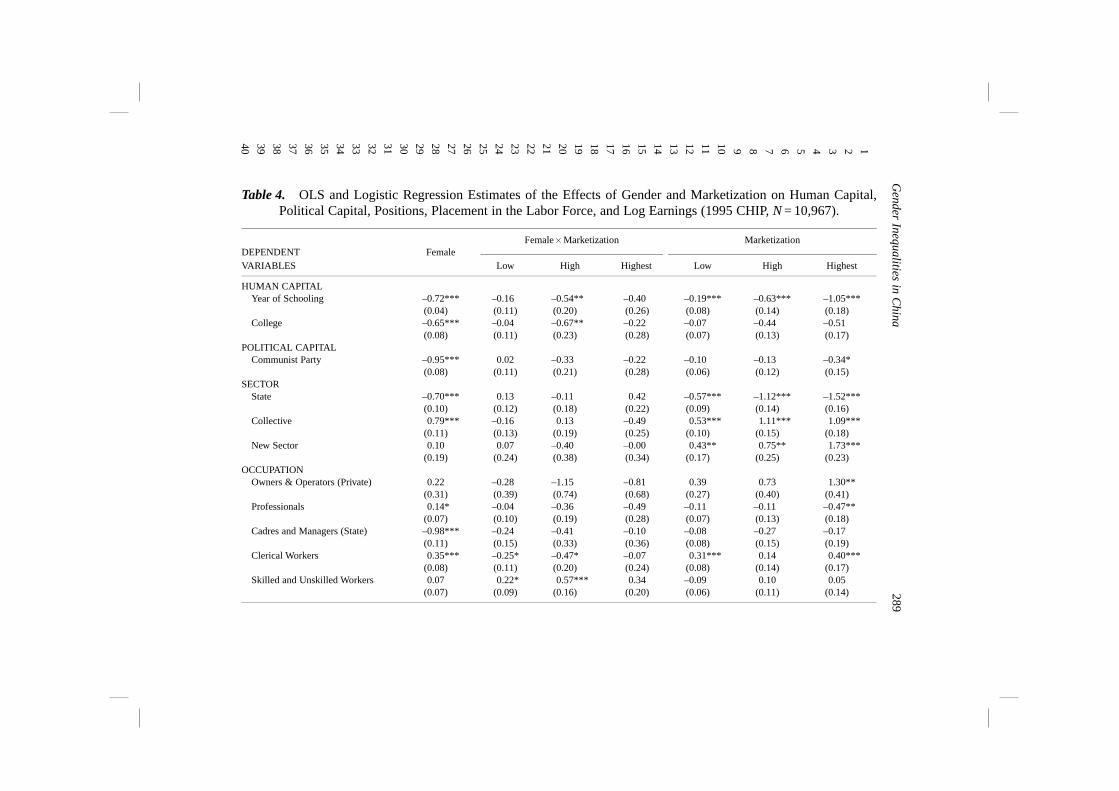
Table 4. OLS and Logistic Regression Estimates of the Effects of Gender and Marketization on Human Capital,Political Capital, Positions, Placement in the Labor Force, and Log Earnings (1995 CHIP, N = 10,967).
Female � Marketization MarketizationDEPENDENT FemaleVARIABLES Low High Highest Low High Highest
HUMAN CAPITALYear of Schooling –0.72*** –0.16 –0.54** –0.40 –0.19*** –0.63*** –1.05***
(0.04) (0.11) (0.20) (0.26) (0.08) (0.14) (0.18)College –0.65*** –0.04 –0.67** –0.22 –0.07 –0.44 –0.51
(0.08) (0.11) (0.23) (0.28) (0.07) (0.13) (0.17)POLITICAL CAPITAL
Communist Party –0.95*** 0.02 –0.33 –0.22 –0.10 –0.13 –0.34*(0.08) (0.11) (0.21) (0.28) (0.06) (0.12) (0.15)
SECTORState –0.70*** 0.13 –0.11 0.42 –0.57*** –1.12*** –1.52***
(0.10) (0.12) (0.18) (0.22) (0.09) (0.14) (0.16)Collective 0.79*** –0.16 0.13 –0.49 0.53*** 1.11*** 1.09***
(0.11) (0.13) (0.19) (0.25) (0.10) (0.15) (0.18)New Sector 0.10 0.07 –0.40 –0.00 0.43** 0.75** 1.73***
(0.19) (0.24) (0.38) (0.34) (0.17) (0.25) (0.23)OCCUPATION
Owners & Operators (Private) 0.22 –0.28 –1.15 –0.81 0.39 0.73 1.30**(0.31) (0.39) (0.74) (0.68) (0.27) (0.40) (0.41)
Professionals 0.14* –0.04 –0.36 –0.49 –0.11 –0.11 –0.47**(0.07) (0.10) (0.19) (0.28) (0.07) (0.13) (0.18)
Cadres and Managers (State) –0.98*** –0.24 –0.41 –0.10 –0.08 –0.27 –0.17(0.11) (0.15) (0.33) (0.36) (0.08) (0.15) (0.19)
Clerical Workers 0.35*** –0.25* –0.47* –0.07 0.31*** 0.14 0.40***(0.08) (0.11) (0.20) (0.24) (0.08) (0.14) (0.17)
Skilled and Unskilled Workers 0.07 0.22* 0.57*** 0.34 –0.09 0.10 0.05(0.07) (0.09) (0.16) (0.20) (0.06) (0.11) (0.14) 289
Gender Inequalities in C
hina
12345678910111213141516171819202122232425262728293031323334353637383940
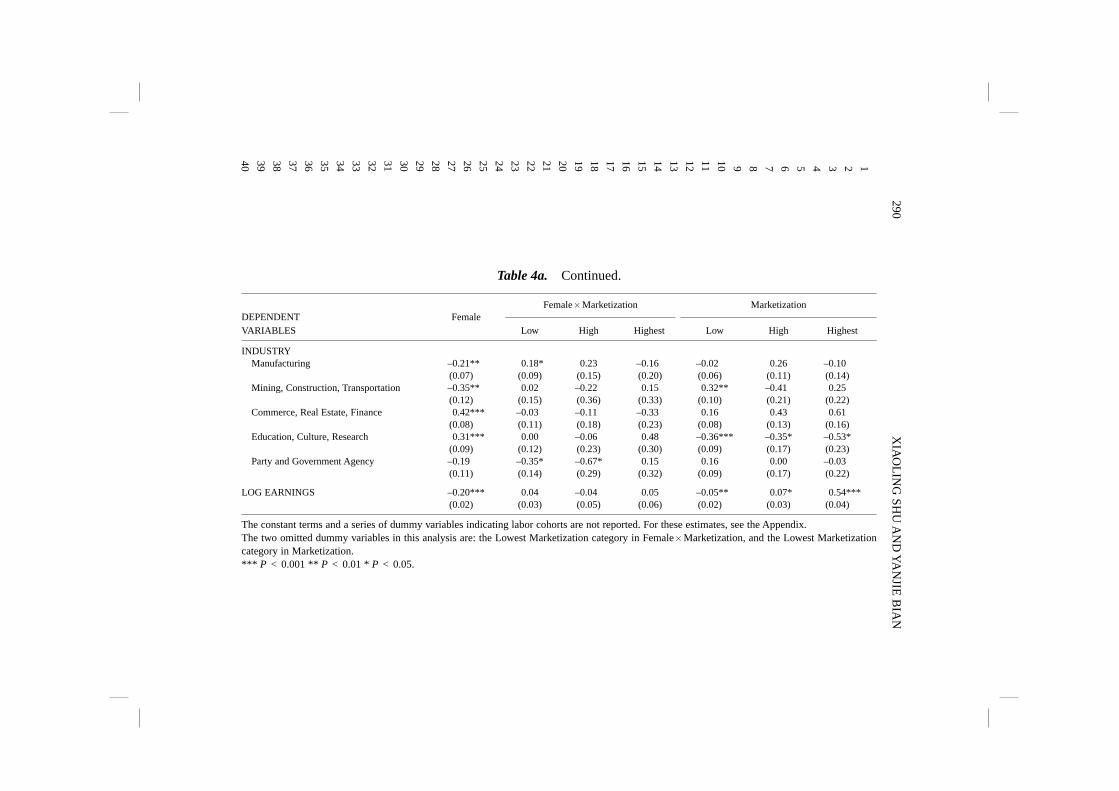
Table 4a. Continued.
Female � Marketization MarketizationDEPENDENT FemaleVARIABLES Low High Highest Low High Highest
INDUSTRYManufacturing –0.21** 0.18* 0.23 –0.16 –0.02 0.26 –0.10
(0.07) (0.09) (0.15) (0.20) (0.06) (0.11) (0.14)Mining, Construction, Transportation –0.35** 0.02 –0.22 0.15 0.32** –0.41 0.25
(0.12) (0.15) (0.36) (0.33) (0.10) (0.21) (0.22)Commerce, Real Estate, Finance 0.42*** –0.03 –0.11 –0.33 0.16 0.43 0.61
(0.08) (0.11) (0.18) (0.23) (0.08) (0.13) (0.16)Education, Culture, Research 0.31*** 0.00 –0.06 0.48 –0.36*** –0.35* –0.53*
(0.09) (0.12) (0.23) (0.30) (0.09) (0.17) (0.23)Party and Government Agency –0.19 –0.35* –0.67* 0.15 0.16 0.00 –0.03
(0.11) (0.14) (0.29) (0.32) (0.09) (0.17) (0.22)
LOG EARNINGS –0.20*** 0.04 –0.04 0.05 –0.05** 0.07* 0.54***(0.02) (0.03) (0.05) (0.06) (0.02) (0.03) (0.04)
The constant terms and a series of dummy variables indicating labor cohorts are not reported. For these estimates, see the Appendix.The two omitted dummy variables in this analysis are: the Lowest Marketization category in Female � Marketization, and the Lowest Marketizationcategory in Marketization.*** P < 0.001 ** P < 0.01 * P < 0.05.
290X
IAO
LIN
G SH
U A
ND
YA
NJIE
BIA
N
12345678910111213141516171819202122232425262728293031323334353637383940
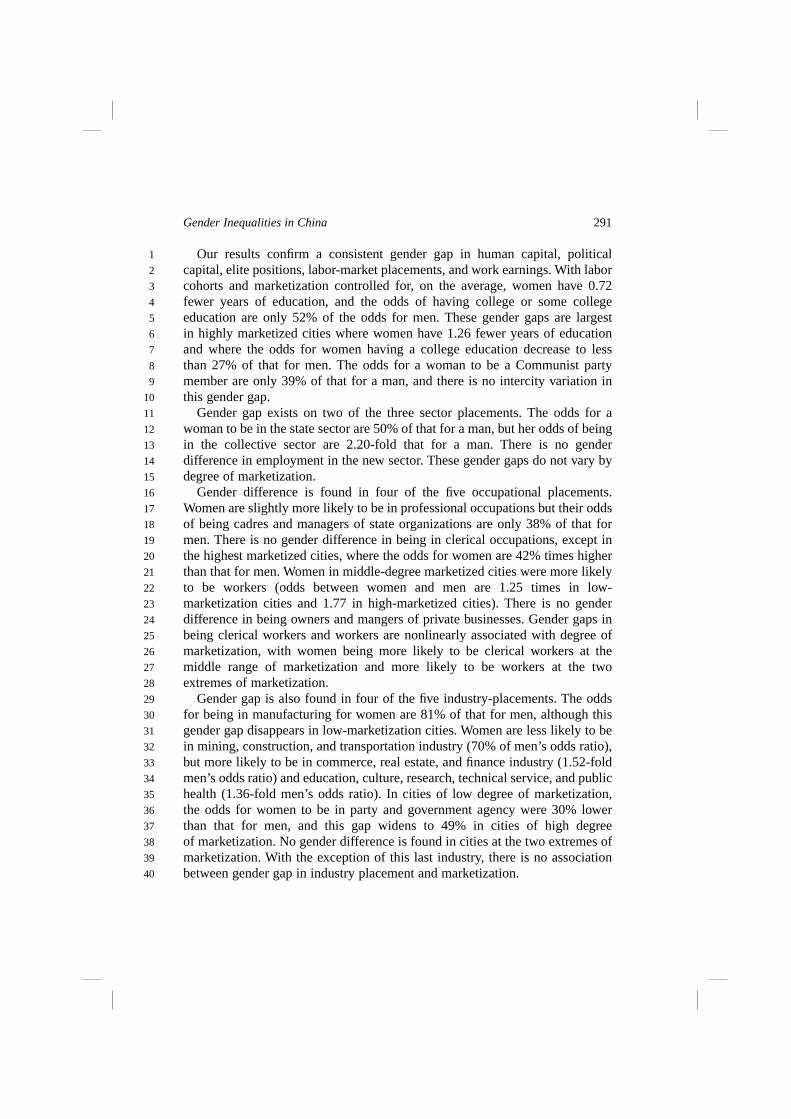
Our results confirm a consistent gender gap in human capital, politicalcapital, elite positions, labor-market placements, and work earnings. With laborcohorts and marketization controlled for, on the average, women have 0.72fewer years of education, and the odds of having college or some collegeeducation are only 52% of the odds for men. These gender gaps are largestin highly marketized cities where women have 1.26 fewer years of educationand where the odds for women having a college education decrease to lessthan 27% of that for men. The odds for a woman to be a Communist partymember are only 39% of that for a man, and there is no intercity variation inthis gender gap.
Gender gap exists on two of the three sector placements. The odds for awoman to be in the state sector are 50% of that for a man, but her odds of beingin the collective sector are 2.20-fold that for a man. There is no genderdifference in employment in the new sector. These gender gaps do not vary bydegree of marketization.
Gender difference is found in four of the five occupational placements.Women are slightly more likely to be in professional occupations but their oddsof being cadres and managers of state organizations are only 38% of that formen. There is no gender difference in being in clerical occupations, except inthe highest marketized cities, where the odds for women are 42% times higherthan that for men. Women in middle-degree marketized cities were more likelyto be workers (odds between women and men are 1.25 times in low-marketization cities and 1.77 in high-marketized cities). There is no genderdifference in being owners and mangers of private businesses. Gender gaps inbeing clerical workers and workers are nonlinearly associated with degree ofmarketization, with women being more likely to be clerical workers at themiddle range of marketization and more likely to be workers at the twoextremes of marketization.
Gender gap is also found in four of the five industry-placements. The oddsfor being in manufacturing for women are 81% of that for men, although thisgender gap disappears in low-marketization cities. Women are less likely to bein mining, construction, and transportation industry (70% of men’s odds ratio),but more likely to be in commerce, real estate, and finance industry (1.52-foldmen’s odds ratio) and education, culture, research, technical service, and publichealth (1.36-fold men’s odds ratio). In cities of low degree of marketization,the odds for women to be in party and government agency were 30% lowerthan that for men, and this gap widens to 49% in cities of high degreeof marketization. No gender difference is found in cities at the two extremes ofmarketization. With the exception of this last industry, there is no associationbetween gender gap in industry placement and marketization.
291Gender Inequalities in China
1
2
3
4
5
6
7
8
9
10
11
12
13
14
15
16
17
18
19
20
21
22
23
24
25
26
27
28
29
30
31
32
33
34
35
36
37
38
39
40
Women’s income was approximately 20% less than men, and this earningsgender gap is consistent across levels of marketization indicating a persistentgender gap in earnings independent of the market transition process.
A Hierarchical Model
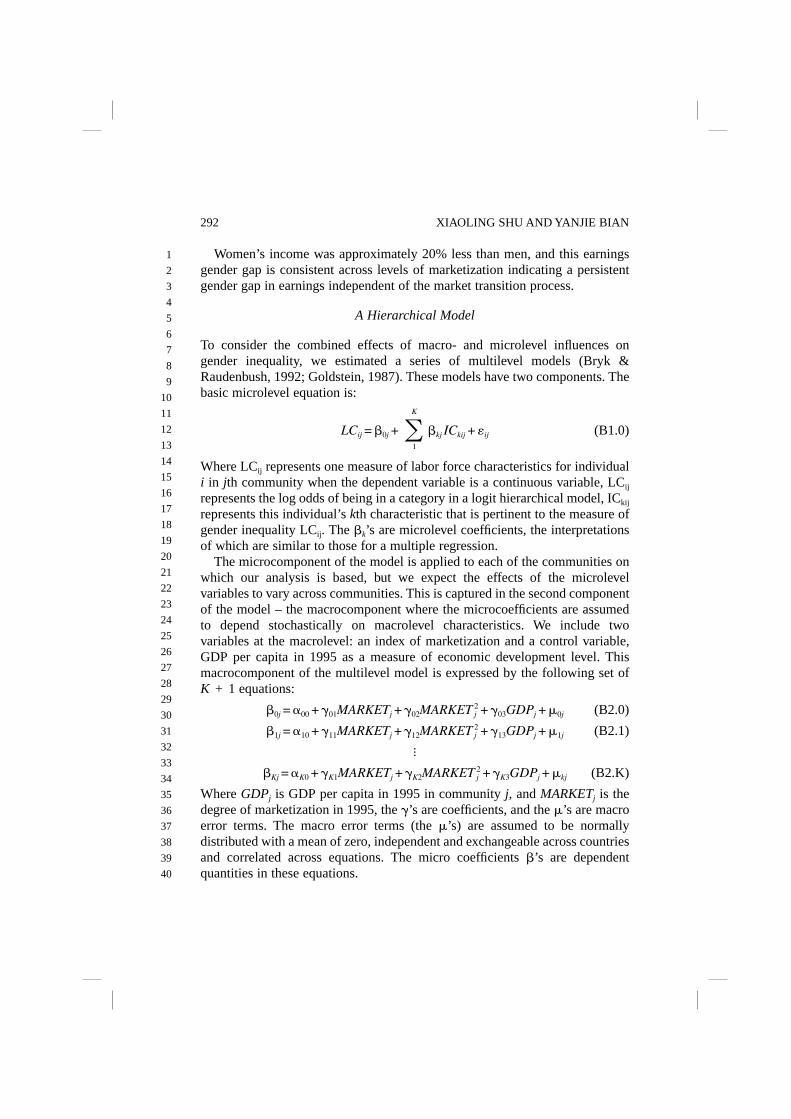
To consider the combined effects of macro- and microlevel influences ongender inequality, we estimated a series of multilevel models (Bryk &Raudenbush, 1992; Goldstein, 1987). These models have two components. Thebasic microlevel equation is:
LCij = �0j + �K
1
�kj ICkij + �ij (B1.0)
Where LCij represents one measure of labor force characteristics for individuali in jth community when the dependent variable is a continuous variable, LCij
represents the log odds of being in a category in a logit hierarchical model, ICkij
represents this individual’s kth characteristic that is pertinent to the measure ofgender inequality LCij. The �k’s are microlevel coefficients, the interpretationsof which are similar to those for a multiple regression.
The microcomponent of the model is applied to each of the communities onwhich our analysis is based, but we expect the effects of the microlevelvariables to vary across communities. This is captured in the second componentof the model – the macrocomponent where the microcoefficients are assumedto depend stochastically on macrolevel characteristics. We include twovariables at the macrolevel: an index of marketization and a control variable,GDP per capita in 1995 as a measure of economic development level. Thismacrocomponent of the multilevel model is expressed by the following set ofK + 1 equations:
�0j = 00 + 01MARKETj + 02MARKET 2j + 03GDPj + �0j (B2.0)
�1j = 10 + 11MARKETj + 12MARKET 2j + 13GDPj + �1j (B2.1)
�
�Kj = K0 + K1MARKETj + K2MARKET 2j + K3GDPj + �kj (B2.K)
Where GDPj is GDP per capita in 1995 in community j, and MARKETj is thedegree of marketization in 1995, the ’s are coefficients, and the �’s are macroerror terms. The macro error terms (the �’s) are assumed to be normallydistributed with a mean of zero, independent and exchangeable across countriesand correlated across equations. The micro coefficients �’s are dependentquantities in these equations.
292 XIAOLING SHU AND YANJIE BIAN
1
2
3
4
5
6
7
8
9
10
11
12
13
14
15
16
17
18
19
20
21
22
23
24
25
26
27
28
29
30
31
32
33
34
35
36
37
38
39
40
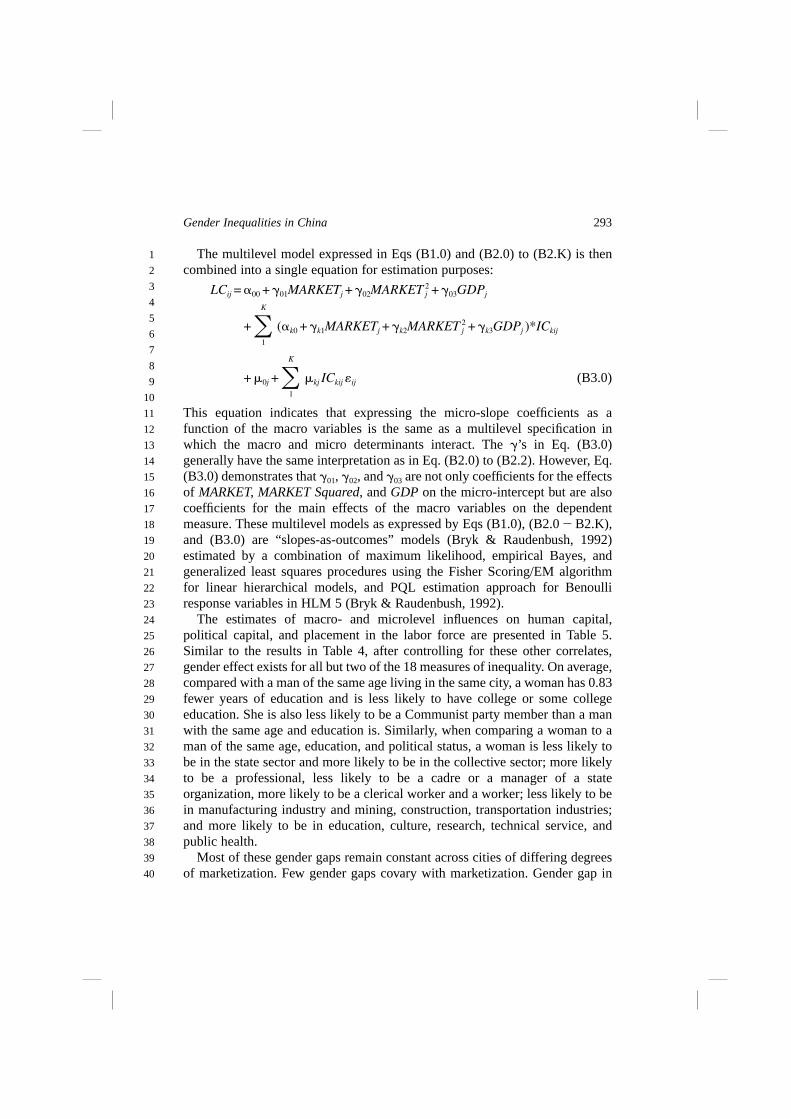
The multilevel model expressed in Eqs (B1.0) and (B2.0) to (B2.K) is thencombined into a single equation for estimation purposes:
LCij = 00 + 01MARKETj + 02MARKET 2j + 03GDPj
+�K
1
(k0 + k1MARKETj + k2MARKET 2j + k3GDPj )*ICkij
+ �0j +�K
1
�kj ICkij �ij (B3.0)
This equation indicates that expressing the micro-slope coefficients as afunction of the macro variables is the same as a multilevel specification inwhich the macro and micro determinants interact. The ’s in Eq. (B3.0)generally have the same interpretation as in Eq. (B2.0) to (B2.2). However, Eq.(B3.0) demonstrates that 01, 02, and 03 are not only coefficients for the effectsof MARKET, MARKET Squared, and GDP on the micro-intercept but are alsocoefficients for the main effects of the macro variables on the dependentmeasure. These multilevel models as expressed by Eqs (B1.0), (B2.0 � B2.K),and (B3.0) are “slopes-as-outcomes” models (Bryk & Raudenbush, 1992)estimated by a combination of maximum likelihood, empirical Bayes, andgeneralized least squares procedures using the Fisher Scoring/EM algorithmfor linear hierarchical models, and PQL estimation approach for Benoulliresponse variables in HLM 5 (Bryk & Raudenbush, 1992).
The estimates of macro- and microlevel influences on human capital,political capital, and placement in the labor force are presented in Table 5.Similar to the results in Table 4, after controlling for these other correlates,gender effect exists for all but two of the 18 measures of inequality. On average,compared with a man of the same age living in the same city, a woman has 0.83fewer years of education and is less likely to have college or some collegeeducation. She is also less likely to be a Communist party member than a manwith the same age and education is. Similarly, when comparing a woman to aman of the same age, education, and political status, a woman is less likely tobe in the state sector and more likely to be in the collective sector; more likelyto be a professional, less likely to be a cadre or a manager of a stateorganization, more likely to be a clerical worker and a worker; less likely to bein manufacturing industry and mining, construction, transportation industries;and more likely to be in education, culture, research, technical service, andpublic health.
Most of these gender gaps remain constant across cities of differing degreesof marketization. Few gender gaps covary with marketization. Gender gap in
293Gender Inequalities in China
1
2
3
4
5
6
7
8
9
10
11
12
13
14
15
16
17
18
19
20
21
22
23
24
25
26
27
28
29
30
31
32
33
34
35
36
37
38
39
40
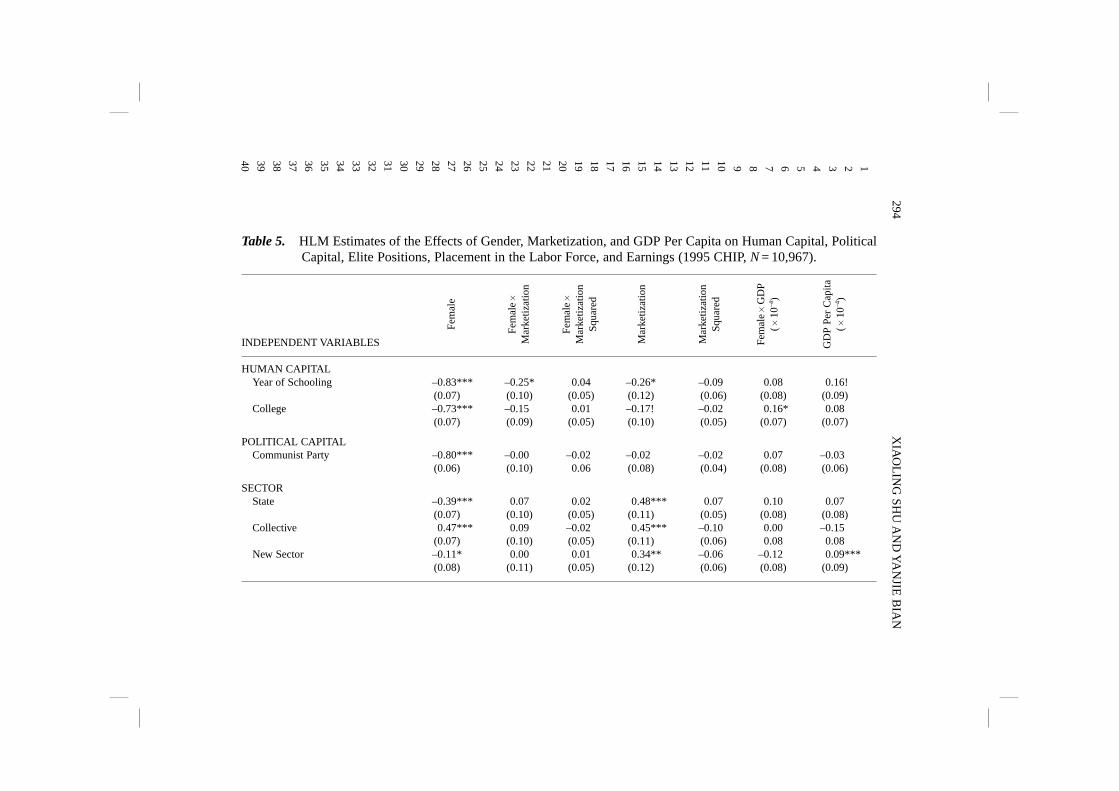
Table 5. HLM Estimates of the Effects of Gender, Marketization, and GDP Per Capita on Human Capital, PoliticalCapital, Elite Positions, Placement in the Labor Force, and Earnings (1995 CHIP, N = 10,967).
INDEPENDENT VARIABLES
HUMAN CAPITALYear of Schooling –0.83*** –0.25* 0.04 –0.26* –0.09 0.08 0.16!
(0.07) (0.10) (0.05) (0.12) (0.06) (0.08) (0.09)College –0.73*** –0.15 0.01 –0.17! –0.02 0.16* 0.08
(0.07) (0.09) (0.05) (0.10) (0.05) (0.07) (0.07)
POLITICAL CAPITALCommunist Party –0.80*** –0.00 –0.02 –0.02 –0.02 0.07 –0.03
(0.06) (0.10) 0.06 (0.08) (0.04) (0.08) (0.06)
SECTORState –0.39*** 0.07 0.02 0.48*** 0.07 0.10 0.07
(0.07) (0.10) (0.05) (0.11) (0.05) (0.08) (0.08)Collective 0.47*** 0.09 –0.02 0.45*** –0.10 0.00 –0.15
(0.07) (0.10) (0.05) (0.11) (0.06) 0.08 0.08New Sector –0.11* 0.00 0.01 0.34** –0.06 –0.12 0.09***
(0.08) (0.11) (0.05) (0.12) (0.06) (0.08) (0.09)
Fem
ale
Fem
ale
�
Mar
ketiz
atio
n
Fem
ale
�
Mar
ketiz
atio
nSq
uare
d
Mar
ketiz
atio
n
Mar
ketiz
atio
nSq
uare
d
Fem
ale
�G
DP
(�10
–4)
GD
P Pe
r C
apita
( �10
–4)
294X
IAO
LIN
G SH
U A
ND
YA
NJIE
BIA
N
12345678910111213141516171819202122232425262728293031323334353637383940
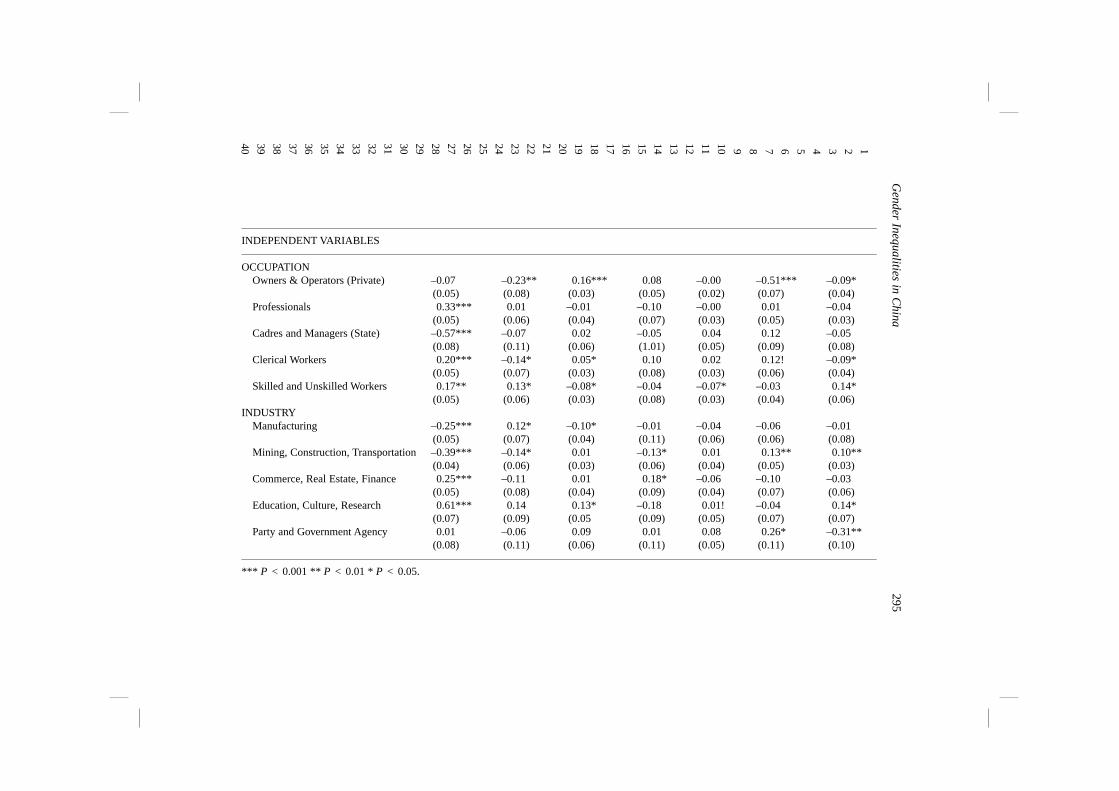
INDEPENDENT VARIABLES
OCCUPATIONOwners & Operators (Private) –0.07 –0.23** 0.16*** 0.08 –0.00 –0.51*** –0.09*
(0.05) (0.08) (0.03) (0.05) (0.02) (0.07) (0.04)Professionals 0.33*** 0.01 –0.01 –0.10 –0.00 0.01 –0.04
(0.05) (0.06) (0.04) (0.07) (0.03) (0.05) (0.03)Cadres and Managers (State) –0.57*** –0.07 0.02 –0.05 0.04 0.12 –0.05
(0.08) (0.11) (0.06) (1.01) (0.05) (0.09) (0.08)Clerical Workers 0.20*** –0.14* 0.05* 0.10 0.02 0.12! –0.09*
(0.05) (0.07) (0.03) (0.08) (0.03) (0.06) (0.04)Skilled and Unskilled Workers 0.17** 0.13* –0.08* –0.04 –0.07* –0.03 0.14*
(0.05) (0.06) (0.03) (0.08) (0.03) (0.04) (0.06)INDUSTRY
Manufacturing –0.25*** 0.12* –0.10* –0.01 –0.04 –0.06 –0.01(0.05) (0.07) (0.04) (0.11) (0.06) (0.06) (0.08)
Mining, Construction, Transportation –0.39*** –0.14* 0.01 –0.13* 0.01 0.13** 0.10**(0.04) (0.06) (0.03) (0.06) (0.04) (0.05) (0.03)
Commerce, Real Estate, Finance 0.25*** –0.11 0.01 0.18* –0.06 –0.10 –0.03(0.05) (0.08) (0.04) (0.09) (0.04) (0.07) (0.06)
Education, Culture, Research 0.61*** 0.14 0.13* –0.18 0.01! –0.04 0.14*(0.07) (0.09) (0.05 (0.09) (0.05) (0.07) (0.07)
Party and Government Agency 0.01 –0.06 0.09 0.01 0.08 0.26* –0.31**(0.08) (0.11) (0.06) (0.11) (0.05) (0.11) (0.10)
*** P < 0.001 ** P < 0.01 * P < 0.05.
295G
ender Inequalities in China
12345678910111213141516171819202122232425262728293031323334353637383940
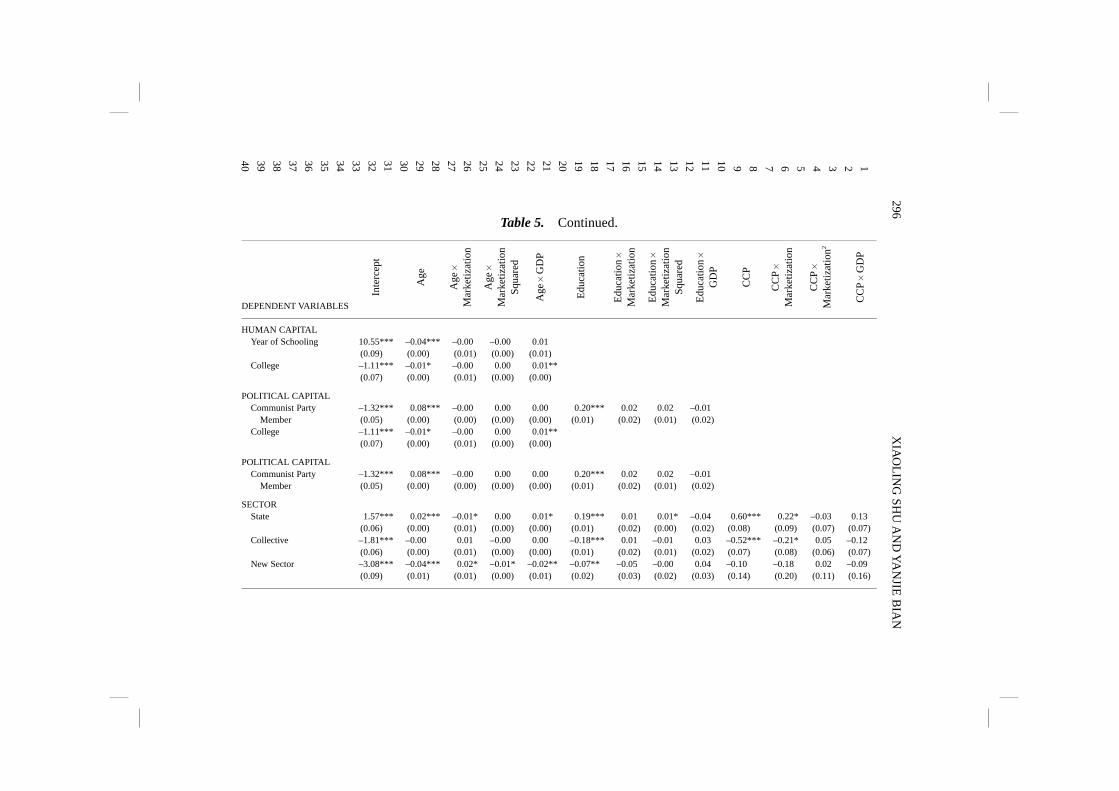
Table 5. Continued.
DEPENDENT VARIABLES
HUMAN CAPITALYear of Schooling 10.55*** –0.04*** –0.00 –0.00 0.01
(0.09) (0.00) (0.01) (0.00) (0.01)College –1.11*** –0.01* –0.00 0.00 0.01**
(0.07) (0.00) (0.01) (0.00) (0.00)
POLITICAL CAPITALCommunist Party –1.32*** 0.08*** –0.00 0.00 0.00 0.20*** 0.02 0.02 –0.01
Member (0.05) (0.00) (0.00) (0.00) (0.00) (0.01) (0.02) (0.01) (0.02)College –1.11*** –0.01* –0.00 0.00 0.01**
(0.07) (0.00) (0.01) (0.00) (0.00)
POLITICAL CAPITALCommunist Party –1.32*** 0.08*** –0.00 0.00 0.00 0.20*** 0.02 0.02 –0.01
Member (0.05) (0.00) (0.00) (0.00) (0.00) (0.01) (0.02) (0.01) (0.02)
SECTORState 1.57*** 0.02*** –0.01* 0.00 0.01* 0.19*** 0.01 0.01* –0.04 0.60*** 0.22* –0.03 0.13
(0.06) (0.00) (0.01) (0.00) (0.00) (0.01) (0.02) (0.00) (0.02) (0.08) (0.09) (0.07) (0.07)Collective –1.81*** –0.00 0.01 –0.00 0.00 –0.18*** 0.01 –0.01 0.03 –0.52*** –0.21* 0.05 –0.12
(0.06) (0.00) (0.01) (0.00) (0.00) (0.01) (0.02) (0.01) (0.02) (0.07) (0.08) (0.06) (0.07)New Sector –3.08*** –0.04*** 0.02* –0.01* –0.02** –0.07** –0.05 –0.00 0.04 –0.10 –0.18 0.02 –0.09
(0.09) (0.01) (0.01) (0.00) (0.01) (0.02) (0.03) (0.02) (0.03) (0.14) (0.20) (0.11) (0.16)
Inte
rcep
t
Age
Age
�
Mar
ketiz
atio
n
Age
�
Mar
ketiz
atio
nSq
uare
d
Age
�G
DP
Edu
catio
n
Edu
catio
n�
Mar
ketiz
atio
n
Edu
catio
n�
Mar
ketiz
atio
nSq
uare
d
Edu
catio
n�
GD
P
CC
P
CC
P�
Mar
ketiz
atio
n
CC
P�
Mar
ketiz
atio
n2
CC
P�
GD
P
296X
IAO
LIN
G SH
U A
ND
YA
NJIE
BIA
N
12345678910111213141516171819202122232425262728293031323334353637383940
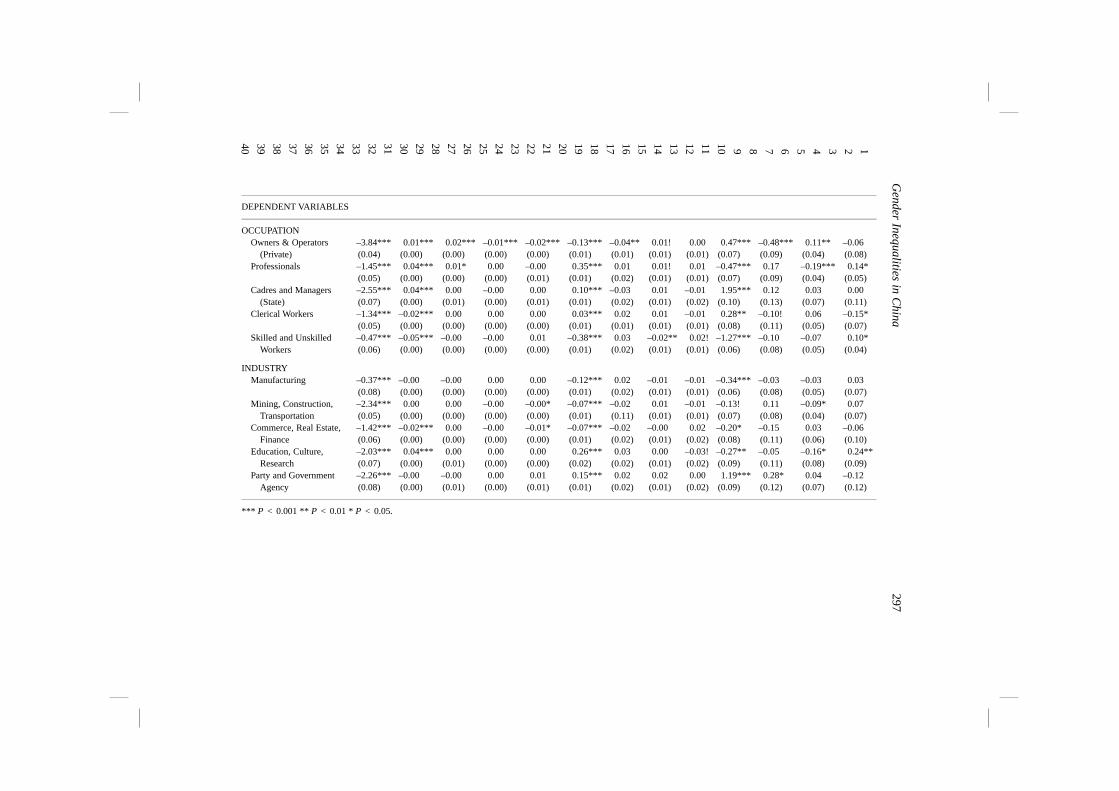
DEPENDENT VARIABLES
OCCUPATIONOwners & Operators –3.84*** 0.01*** 0.02*** –0.01*** –0.02*** –0.13*** –0.04** 0.01! 0.00 0.47*** –0.48*** 0.11** –0.06
(Private) (0.04) (0.00) (0.00) (0.00) (0.00) (0.01) (0.01) (0.01) (0.01) (0.07) (0.09) (0.04) (0.08)Professionals –1.45*** 0.04*** 0.01* 0.00 –0.00 0.35*** 0.01 0.01! 0.01 –0.47*** 0.17 –0.19*** 0.14*
(0.05) (0.00) (0.00) (0.00) (0.01) (0.01) (0.02) (0.01) (0.01) (0.07) (0.09) (0.04) (0.05)Cadres and Managers –2.55*** 0.04*** 0.00 –0.00 0.00 0.10*** –0.03 0.01 –0.01 1.95*** 0.12 0.03 0.00
(State) (0.07) (0.00) (0.01) (0.00) (0.01) (0.01) (0.02) (0.01) (0.02) (0.10) (0.13) (0.07) (0.11)Clerical Workers –1.34*** –0.02*** 0.00 0.00 0.00 0.03*** 0.02 0.01 –0.01 0.28** –0.10! 0.06 –0.15*
(0.05) (0.00) (0.00) (0.00) (0.00) (0.01) (0.01) (0.01) (0.01) (0.08) (0.11) (0.05) (0.07)Skilled and Unskilled –0.47*** –0.05*** –0.00 –0.00 0.01 –0.38*** 0.03 –0.02** 0.02! –1.27*** –0.10 –0.07 0.10*
Workers (0.06) (0.00) (0.00) (0.00) (0.00) (0.01) (0.02) (0.01) (0.01) (0.06) (0.08) (0.05) (0.04)
INDUSTRYManufacturing –0.37*** –0.00 –0.00 0.00 0.00 –0.12*** 0.02 –0.01 –0.01 –0.34*** –0.03 –0.03 0.03
(0.08) (0.00) (0.00) (0.00) (0.00) (0.01) (0.02) (0.01) (0.01) (0.06) (0.08) (0.05) (0.07)Mining, Construction, –2.34*** 0.00 0.00 –0.00 –0.00* –0.07*** –0.02 0.01 –0.01 –0.13! 0.11 –0.09* 0.07
Transportation (0.05) (0.00) (0.00) (0.00) (0.00) (0.01) (0.11) (0.01) (0.01) (0.07) (0.08) (0.04) (0.07)Commerce, Real Estate, –1.42*** –0.02*** 0.00 –0.00 –0.01* –0.07*** –0.02 –0.00 0.02 –0.20* –0.15 0.03 –0.06
Finance (0.06) (0.00) (0.00) (0.00) (0.00) (0.01) (0.02) (0.01) (0.02) (0.08) (0.11) (0.06) (0.10)Education, Culture, –2.03*** 0.04*** 0.00 0.00 0.00 0.26*** 0.03 0.00 –0.03! –0.27** –0.05 –0.16* 0.24**
Research (0.07) (0.00) (0.01) (0.00) (0.00) (0.02) (0.02) (0.01) (0.02) (0.09) (0.11) (0.08) (0.09)Party and Government –2.26*** –0.00 –0.00 0.00 0.01 0.15*** 0.02 0.02 0.00 1.19*** 0.28* 0.04 –0.12
Agency (0.08) (0.00) (0.01) (0.00) (0.01) (0.01) (0.02) (0.01) (0.02) (0.09) (0.12) (0.07) (0.12)
*** P < 0.001 ** P < 0.01 * P < 0.05.
297G
ender Inequalities in China
12345678910111213141516171819202122232425262728293031323334353637383940
years of education is negatively associated with marketization; the moremarketized the city, the larger the gender gap in years of schooling. Gender gapin clerical occupations placement is negatively associated with marketization,while gender gap in mining, construction, and transportation increases withmarketization. A curvilinear association is found between marketization andgender gap in three occupational placements: With an increase in market-ization, gender gap in placement in owners and managers of private businessesemerges (for cities with a marketization score of 0), with women being lesslikely to be in this occupation. This gender gap peaks in cities with amarketization score of 0.72 and starts to decrease. There is also a U-shapedassociation between gender gap in placement in clerical occupations andmarketization and a concave association between gender gap in placement inworker occupations and marketization. A curvilinear association is foundbetween marketization and gender gap in being employed in the manufacturingindustry. Least marketized cities have the largest gender gap in employment inthe manufacturing industry. This gender gap keeps shrinking and disappears inmore marketized cities but reemerges in the most marketized cities.
Effects of human and political capital variables on labor-market placementsand on wage attainments are highly consistent with the analyses of CHIP databy other researchers (Xie & Hannum, 1996; Hauser & Xie, 2001; Bian &Zhang, in this volume). These effects, self-evident in Table 5 and other tables,are not in our analytic interest here and are thus given no further attention.
Table 6 shows the results from a nonlinear hierarchical model estimating theeffects of gender and marketization on earnings after controlling for age,education, political status, labor force placement, and GDP per capita of thecity. Compared with a man of the same age, education, political status,placement in the labor force, and living in the same city, a woman makes 9.0%less in annual earnings. There is no intercity variation on this gender disparity.Marketization has not interrupted the existing gender gap in earnings, despitethe increase in overall earnings with marketization. The advantage enjoyed bystate sector declined with marketization, and the return to owners and operatorsof private businesses rose exponentially with marketization.
SUMMARY AND DISCUSSION
Our analysis shows that by 1995 Chinese men and women in the cities differin level of human and political capitals, labor market placements, and workearnings. Compared with a man of the same individual characteristics living inthe same city, a woman has fewer years of education and is less likely to havea college education, be a Communist party member, be in the state sector, be
298 XIAOLING SHU AND YANJIE BIAN
1
2
3
4
5
6
7
8
9
10
11
12
13
14
15
16
17
18
19
20
21
22
23
24
25
26
27
28
29
30
31
32
33
34
35
36
37
38
39
40
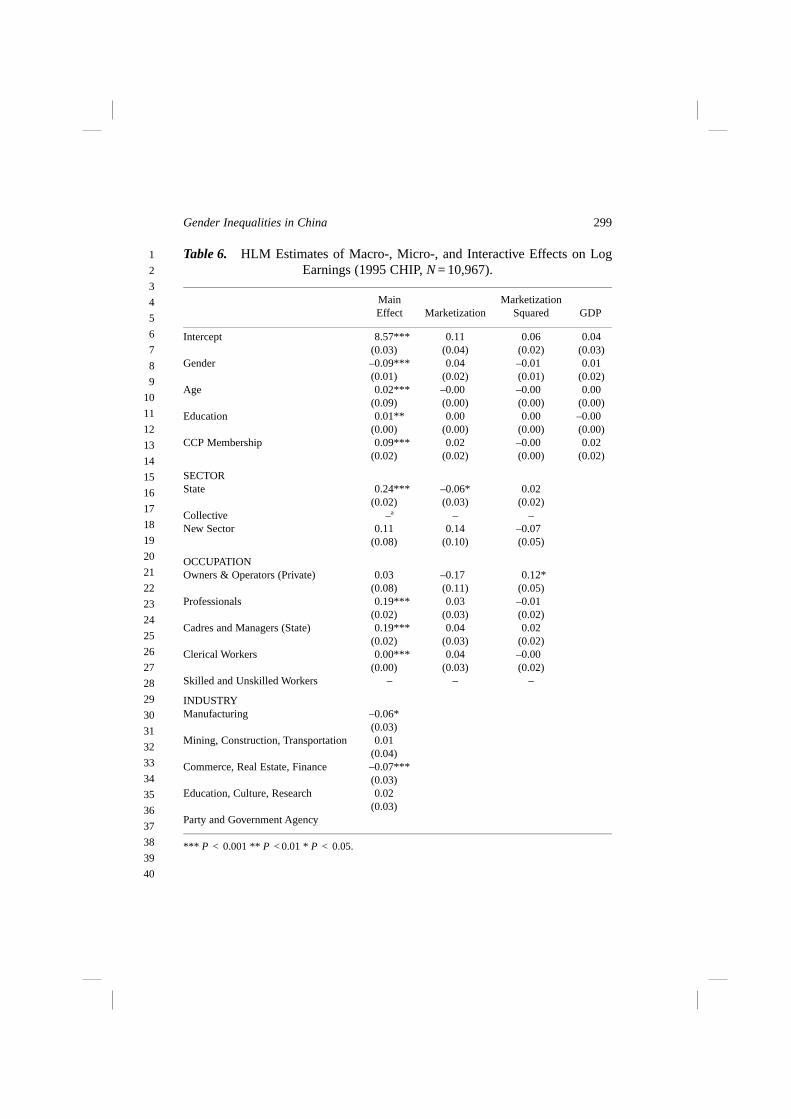
Table 6. HLM Estimates of Macro-, Micro-, and Interactive Effects on LogEarnings (1995 CHIP, N = 10,967).
Main MarketizationEffect Marketization Squared GDP
Intercept 8.57*** 0.11 0.06 0.04(0.03) (0.04) (0.02) (0.03)
Gender –0.09*** 0.04 –0.01 0.01(0.01) (0.02) (0.01) (0.02)
Age 0.02*** –0.00 –0.00 0.00(0.09) (0.00) (0.00) (0.00)
Education 0.01** 0.00 0.00 –0.00(0.00) (0.00) (0.00) (0.00)
CCP Membership 0.09*** 0.02 –0.00 0.02(0.02) (0.02) (0.00) (0.02)
SECTORState 0.24*** –0.06* 0.02
(0.02) (0.03) (0.02)Collective –a – –New Sector 0.11 0.14 –0.07
(0.08) (0.10) (0.05)
OCCUPATIONOwners & Operators (Private) 0.03 –0.17 0.12*
(0.08) (0.11) (0.05)Professionals 0.19*** 0.03 –0.01
(0.02) (0.03) (0.02)Cadres and Managers (State) 0.19*** 0.04 0.02
(0.02) (0.03) (0.02)Clerical Workers 0.00*** 0.04 –0.00
(0.00) (0.03) (0.02)Skilled and Unskilled Workers – – –
INDUSTRYManufacturing –0.06*
(0.03)Mining, Construction, Transportation 0.01
(0.04)Commerce, Real Estate, Finance –0.07***
(0.03)Education, Culture, Research 0.02
(0.03)Party and Government Agency
*** P < 0.001 ** P < 0.01 * P < 0.05.
299Gender Inequalities in China
1
2
3
4
5
6
7
8
9
10
11
12
13
14
15
16
17
18
19
20
21
22
23
24
25
26
27
28
29
30
31
32
33
34
35
36
37
38
39
40
a cadre or manager in a state enterprise, and be in manufacturing, mining,construction, and transportation. They are more likely than men are to be aclerical worker or a worker and to be in education, culture, research, technicalservice, and public health.
This pattern of gender gap in human and political capital and gendersegregation in labor force is by and large consistent with prior studies ongender gap in education (Lavely et al., 1990), in political capital (Bian, Shu &Logan, 2001; Lin & Bian, 1991; Zhou, Tuma & Moen, 1996), and in laborforce placement (Bian, 1994; Bian & Logan, 1996; Lin & Bian, 1991; Whyte,1984; Zhou, Tuma & Moen, 1996; Zhou, Tuma & Moen, 1997). As in the pre-reform era (Whyte, 1984), in 1995 a woman’s annual earnings wereapproximately 14% to19% less than a male counterpart, and this gap shrinks to9% after controlling for human and political capitals, labor market placement,and city-level variation in development and marketization. A 1993 sample fromTianjin indicates that in 1978, the wage ratio between women and men was86.8%, and this percentage remained almost unchanged through 1993 (Bian &Logan, 1996, Table 3). A 20-city sample from 1994 shows that women’s wageswere 81% to 86% of men’s wages between 1978 and 1993 (Zhou, 2000), anda comparison of the 1988 and 1995 CHIP data demonstrates that women made83.9% and 83.8% of men’s earnings in 1988 and 1995, respectively (Shu &Bian, 2001).
Most of these gender inequalities remain constant across cities of differingdegrees of marketization. We analyzed the intercity variation in genderdisparity in human and political capital, labor force placement, and workearnings both by comparing four groups of cities grouped into different levelsof marketization and using a series of hierarchical models to estimate theinteractive effects between gender and an continuous index of marketization. Inall these estimates, we found little evidence for a linear covariation betweengender disparity and marketization. Other studies based on the 1988 and 1995CHIP data did not find a systematic intercity variation in gender disparity inearnings with economic growth (Hauser & Xie, 2001) or with the growth of theratio of nonstate workers, foreign investment, and manufacturing industry(Bian & Zhang, 2002). These findings support the assertion that within therealm of gender relationship there are relatively separate and autonomouscomponents from the economic domain not readily penetrable by economicforces. The gender relationships appear to operate according to its internallogic not immediately subject to the influences of the growth of the markets.
To the extent that market transition influences gender inequality, therelationship is a nonmonotonic one. In particular, the association betweenmarketization and gender gap in labor force placements is curvilinear; there is
300 XIAOLING SHU AND YANJIE BIAN
1
2
3
4
5
6
7
8
9
10
11
12
13
14
15
16
17
18
19
20
21
22
23
24
25
26
27
28
29
30
31
32
33
34
35
36
37
38
39
40
a concave association between marketization and gender gap being owners andmanagers of private businesses and gender gap in being workers; and there isa U-shaped association between marketization and gender gap in placement inclerical occupations and gender gap in the manufacturing industry.
These changes point to the nonlinear process of marketization whereimportant fundamental changes took place in the most marketized cities. Thesenonlinear changes reveal the increasing significance of the occupational andindustrial placement and the relative declining importance of sector affiliationin accounting for gender gap in earnings in the most marketized cities. One ofthe major sources of gender inequalities in pre-reform China and in the lessmarketized cities remains the segregation of female workers in the collectivesector, which provides substantially lower earnings and fringe benefits (Whyte,1984). However, this ownership-based economic segmentation is less markedin the most marketized cities as evidenced by the much narrower pay disparitybetween the state sector and the collective sector in these cities. On the otherhand, occupation- and industry-based pay differentials have been on the rise inthese highly marketized cities. These new patterns of occupational andindustrial placement in the most marketized cities indicate that the sources ofgender inequalities in the labor force is starting to shift from the sectoraffiliation to occupational and industrial placement.
Our analyses point to new directions for future research about genderinequalities in China’s transitional economy. Necessarily, one must assess andmeasure the development of product, labor, and capital markets in any localityand time in which data about gender inequalities are collected. In localitieswhere these markets grow slowly and gradually, research should focus on howgender inequalities between the state and nonstate sectors have continueddespite the introduction of market forces. In more and increasingly marketizedlocalities, the research tasks should include analyses of how market forces,especially labor markets, maintain gender disparity in the labor force bymoving women workers from the disadvantaged collective sector to low-payingjobs. The underlying process for this mobility must be studied to see how itmay have sustained the gender gap in labor market opportunities and outcomes.Careful empirical research into both economic and sociological logics ofgender relationships in work, domestic spheres, and belief system is needed.
NOTES
1. Among China’s 190,930 million urban employees in 1995, 4.6% (2.4% were menand 2.2% were women) worked in nonstate and non-collective firms except private
301Gender Inequalities in China
1
2
3
4
5
6
7
8
9
10
11
12
13
14
15
16
17
18
19
20
21
22
23
24
25
26
27
28
29
30
31
32
33
34
35
36
37
38
39
40
business (siyin) and individual entrepreneurs (geiti), and 10.7% (sex compositionunknown) were individual entrepreneurs or employees in private businesses.
2. Multiple data sources were used to compile the city-level database: Urban Socio-economic Research Team of Chinese State Statistical Bureau, 1993. Chinese UrbanStatistical Yearbook; Chinese Statistical Publishing House, Urban SocioeconomicResearch Team of Chinese State Statistical Bureau, 1994. Chinese Urban StatisticalYearbook; Chinese Statistical Publishing House, Urban Socioeconomic Research Teamof Chinese State Statistical Bureau, 1996. Chinese Urban Statistical Yearbook; ChineseStatistical Publishing House, Consortium on Chinese Urban Development and ChineseAssociation of Administration Science, 1996. Statistical Yearbook of Chinese Cities;Chinese City Statistical Yearbook Press. Statistical Yearbook of Beijing 1996; StatisticalYearbook of Liaoning 1996; Statistical Yearbook of Jiansu 1996; Statistical Yearbook ofAnhui 1996; Statistical Yearbook of Heinan 1996; Statistical Yearbook of Hubei 1996;Statistical Yearbook of Sichuan 1996; Statistical Yearbook of Yunnan 1996; StatisticalYearbook of Gansu 1996; Statistical Bureau of Datong, 1995. Statistical Abstract ofDatong; Statistical Bureau of Changzhi, 1996, Statistical Yearbook of Changzhi;Statistical Bureau of Guangzhou, 1996, Statistical Yearbook of Guangzhou; FoshanStatistical Yearbook Committee, 1996, Statistical Yearbook of Foshan; GuangdongPeople’s Publishing House, Zhangjian Statistical Bureau, Statistical Yearbook ofZhanjian, 1990–1995; Shenzhen Statistical Yearbook 1996; Chinese Statistical Publish-ing House, Huizhou Statistical Bureau, 1996, Huizhou Statistical Yearbook; ChineseStatistical Publishing House, Zhaoqing Statistical Bureau, 1996, Zhaoqing StatisticalYearbook; Shantou Economic Special Zone Yearbook Committee, 1996, ShantouEconomic Special Zone Yearbook.
3. Skinner and colleagues (2000) identified eight urban hierarchical levels usingdetailed socioeconomic data from a 1% household sample from China’s 1990 popula-tion census. The 1995 CHIP sample, excluding the county headquarters, contains citiesat the top five levels in the Central-Place Hierarchy.
4. The average earnings in the most marketized cities are 1.49- to 2.24-fold those inless marketized cities. The largest increase took place in the collective sector, makingthe earning ratio between the collective and the state sector rise from 62% and 74% to84%.
ACKNOWLEDGMENTS
This is a revised version of a paper presented at the Research Committee 28 ofthe International Sociological Association 2001 annual conference, August2001, Berkeley, CA. We thank Bill Skinner for generously providing his dataon Central-Place Hierarchy and summary statistics from the one% Chinese1990 population census, Zhang Zhanxin for his assistance in compiling city-level data, and Jennifer Gregson for her assistance in data analysis. We alsothank editor Kevin Leicht for his helpful comments. Direct all correspondenceto Xiaoling Shu, Department of Sociology, University of California, Davis,One Shields Avenue, Davis, CA 95616 or send e-mail to [email protected].
302 XIAOLING SHU AND YANJIE BIAN
1
2
3
4
5
6
7
8
9
10
11
12
13
14
15
16
17
18
19
20
21
22
23
24
25
26
27
28
29
30
31
32
33
34
35
36
37
38
39
40
REFERENCES
Bian, Y. (1994). Work and inequality in urban China. Albany: State University of New YorkPress.
Bian, Y. (2002). Chinese Social Stratification and Social Mobility. Annual Review of Sociology(forthcoming).
Bian, Y., & Li, Y. (2000). Social Network Capital of Urban Chinese Families. HsinghuaSociological Review, 2, 1–14.
Bian, Y., & Logan, J. R. (1996). Market Transition and the Persistence of Power: The ChangingStratification System in Urban China. American Sociological Review, 61, 739–758.
Bian, Y., Logan, J. R., & Shu, X. (2000). Wage and Job Inequalities in the Working Lives of Menand Women in Tianjin. In: B. Entwisle & G. E. Henderson (Eds), Re-Drawing Boundaries:Work, Households, and Gender in China (pp. 111–133). Berkeley: University of CaliforniaPress.
Bian, Y., Shu, X., & Logan, J. R. (2001). Communist Party Membership and Regime Dynamicsin China. Social Forces, 79, 805–841.
Bian, Y., & Zhang, Z. (2002). Marketization, Segmentation, and Income in Urban China: 1988 and1995. Research in Social Stratification and Mobility (this volume).
China Educational Commission (1996). Educational Statistics Yearbook of China. Beijing:People’s Education Publishing House.
Davis, D. (1990). Urban Job Mobility. In: D. Davis & E. F. Vogel (Eds), Chinese Society on theEve of Tiananmen. Cambridge, CA: Harvard University Press.
Davis, D. (1995). Inequality and Stratification in the Nineties. China Review, 11, 1–5.Davis-Friedman, D. (1991). Long Lives: Chinese Elderly and the Communist Revolution.
Cambridge: Harvard University Press.Entwisle, B., Henderson, G. E., Short, S. E., Bouma, J., & Fengying, Z. (1995). Gender and
Family Businesses in Rural China. PUBLISHER ???.Griffin, K., & Zhao, R. (1993). The Distribution of Income in China. New York: St. Martin’s
Press.Hauser, S., & Xie, Y. (2001). Temporal and Regional Variation in Earnings Inequality: Urban
China in Transition between 1988 and 1995. Paper presented at the InternationalSociological Association RC28 Conference, Berkeley, CA.
Honig, E., & Hershatter, G. (1988). Personal Voices: Chinese Women in the 1980s. Stanford, CA:Stanford University Press.
Joreskog, K. G., & Sorbom, D. (1988). LISREL VII: A Guide to the Program and Applications(2nd ed.). Chicago: SPSS, Inc.
Joreskog, K. G., & Sorbom, D. (1993). LISREL VIII: Structural Equation Modeling with theSIMPLIS Command Language. Chicago: Scientific Software International, Inc.
Khan, A. R., Griffin, K., Riskin, C., & Zhao, R. (1992). Household Income and Its Distribution inChina. China Quarterly, 132, 1029–1061.
Lavely, W., Zhenyu, X., Bohua, L., & Freeman, R. (1990). The Rise in Female Education in China:National and Regional Patterns. China Quarterly, 121, 61–93.
Lin, N., & Bian, Y. (1991). Getting Ahead in Urban China. American Journal of Sociology, 97,657–688.
Marini, M. M. (1989). Sex Differences in Earnings in the United States. Annual Review ofSociology, 15, 343–380.
Author:pleasesupply
303Gender Inequalities in China
1
2
3
4
5
6
7
8
9
10
11
12
13
14
15
16
17
18
19
20
21
22
23
24
25
26
27
28
29
30
31
32
33
34
35
36
37
38
39
40
Matthews, R., & Nee, V. (2000). Gender Inequality and Economic Growth in Rural China. SocialScience Research, 29, 606–632.
Michelson, E., & Parish, W. L. (2000). Gender Differentials in Economic Success: Rural Chinain 1991. In: B. Entwisle & G. E. Henderson (Eds), Re-Drawing Boundaries: Work,Households, and Gender in China (pp. 134–156). Berkeley: University of CaliforniaPress.
Naughton, B. (1995). Growing Out of the Plan: Chinese Economic Reform: 1978–1993. City:Cambridge University Press.
Nee, V. (1989). A Theory of Market Transition: From Redistribution to Markets in State Socialism.American Sociological Review, 54, 663–681.
Nee, V. (1991). Social Inequalities in Reforming State Socialism: Between Redistribution andMarkets in China. American Sociological Review, 56, 267–282.
Nee, V. (1996). The Emergence of a Market Society: Changing Mechanisms of Stratification inChina. American Journal of Sociology, 101, 908–949.
Nee, V., & Matthews, R. (1996). Market Transition and Societal Transformation in ReformingState Socialism. Annual Review of Sociology, 22, 401–435.
Oi, J. (1992). Fiscal Reform and the Economic Foundations of Local State Corpratism in China.World Politics, 45, 99–126.
Parish, W. L., & Michelson, E. (1996). Politics and Markets: Dual Transformations. AmericanJournal of Sociology, 101, 1042–1059.
Ran, M. (1988). Women’s Employment Challenge. Beijing Review (July), 29–30.Raudenbush, S. W., Bryk, A., Cheong, Y. F., & Congdon, R. (2000). HLM 5: Hierarchical Linear
and Nonlinear Modeling. Lincolnwood, IL: Scientific Software International, Inc.Robinson, J. (1985). Of Women and Washing Machines: Employment, Housework, and the
Reproduction of Motherhood in Socialist China. China Quarterly, 101, 32–57.Rona-Tas, A. (1994). The First Shall Be Last? Entrepreneurship and Communist Cadres in the
Transition from Socialism. American Journal of Sociology, 100, 40–69.Shirk, S. (1993). The Political Logic of Economic Reform in China. Berkeley and Los Angeles:
University of California Press.Shu, X., & Bian, Y. (2001). Marketization and Gender Gap in Earnings in Urban China. Paper
presented at the American Sociological Association annual meeting, Anaheim, CA.Skinner, G., Henderson, W. M., & Jianhua, Y. (2000). China’s Fertility Transition through Regional
Space. Social Science History, 24, 613–652.Stark, D. (1996). Recombinant Property in East European Capitalism. American Journal of
Sociology, 101, 993–1027.Walder, A. G. (1995). Career Mobility and the Communist Political Order. American Sociological
Review, 60, 309–328.Walder, A. G. (1996). Markets and Inequality in Transitional Economies: Toward Testable
Theories. American Journal of Sociology, 101, 1060–1073.Whyte, K. M. (1984). Sexual Inequality under Socialism: The Chinese Case in Perspective. In:
J. L. Watson (Ed.), Class and Social Stratification in Post-Revolution China. New York:Cambridge University Press.
Whyte, K. M. (2000). The Perils of Assessing Trends in Gender Inequality in China. Pp. 157–67In: B. Entwisle & G. E. Henderson (Eds), Re-Drawing Boundaries: Work, Households, andGender in China. Berkeley: University of California Press.
Wu, N. (1995). Employment and Chinese Women. Beijing Review (March), 6–12.Xie, Y., & Hannum, E. (1996). Regional Variation in Earnings Inequality in Reform-Era Urban
China. American Journal of Sociology, 101, 950–992.
304 XIAOLING SHU AND YANJIE BIAN
1
2
3
4
5
6
7
8
9
10
11
12
13
14
15
16
17
18
19
20
21
22
23
24
25
26
27
28
29
30
31
32
33
34
35
36
37
38
39
40

Zhou, X. (2000). Economic Transformation and Income Inequality in Urban China: Evidence fromPanel Data. American Journal of Sociology, 105, 1135–1174.
Zhou, X., Tuma, N. B., & Moen, P. (1996). Stratification Dynamics under State Socialism: TheCase of Urban China: 1949–1993. Social Forces, 74, 759–796.
Zhou, X., Tuma, N. B., & Moen, P. (1997). Institutional Change and Job-Shift Patterns in UrbanChina: 1949 to 1994. American Sociological Review, 62, 339–365.
305Gender Inequalities in China
1
2
3
4
5
6
7
8
9
10
11
12
13
14
15
16
17
18
19
20
21
22
23
24
25
26
27
28
29
30
31
32
33
34
35
36
37
38
39
40
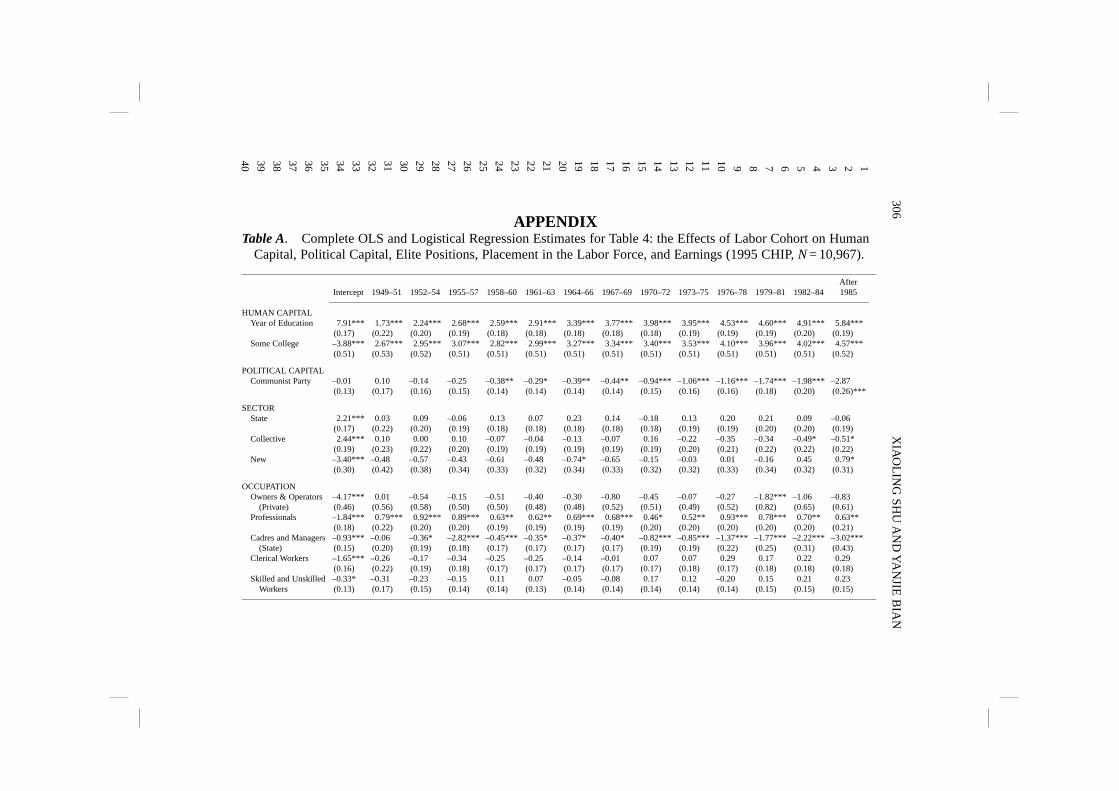
APPENDIXTable A. Complete OLS and Logistical Regression Estimates for Table 4: the Effects of Labor Cohort on Human
Capital, Political Capital, Elite Positions, Placement in the Labor Force, and Earnings (1995 CHIP, N = 10,967).
AfterIntercept 1949–51 1952–54 1955–57 1958–60 1961–63 1964–66 1967–69 1970–72 1973–75 1976–78 1979–81 1982–84 1985
HUMAN CAPITALYear of Education 7.91*** 1.73*** 2.24*** 2.68*** 2.59*** 2.91*** 3.39*** 3.77*** 3.98*** 3.95*** 4.53*** 4.60*** 4.91*** 5.84***
(0.17) (0.22) (0.20) (0.19) (0.18) (0.18) (0.18) (0.18) (0.18) (0.19) (0.19) (0.19) (0.20) (0.19)Some College –3.88*** 2.67*** 2.95*** 3.07*** 2.82*** 2.99*** 3.27*** 3.34*** 3.40*** 3.53*** 4.10*** 3.96*** 4.02*** 4.57***
(0.51) (0.53) (0.52) (0.51) (0.51) (0.51) (0.51) (0.51) (0.51) (0.51) (0.51) (0.51) (0.51) (0.52)
POLITICAL CAPITALCommunist Party –0.01 0.10 –0.14 –0.25 –0.38** –0.29* –0.39** –0.44** –0.94*** –1.06*** –1.16*** –1.74*** –1.98*** –2.87
(0.13) (0.17) (0.16) (0.15) (0.14) (0.14) (0.14) (0.14) (0.15) (0.16) (0.16) (0.18) (0.20) (0.26)***
SECTORState 2.21*** 0.03 0.09 –0.06 0.13 0.07 0.23 0.14 –0.18 0.13 0.20 0.21 0.09 –0.06
(0.17) (0.22) (0.20) (0.19) (0.18) (0.18) (0.18) (0.18) (0.18) (0.19) (0.19) (0.20) (0.20) (0.19)Collective 2.44*** 0.10 0.00 0.10 –0.07 –0.04 –0.13 –0.07 0.16 –0.22 –0.35 –0.34 –0.49* –0.51*
(0.19) (0.23) (0.22) (0.20) (0.19) (0.19) (0.19) (0.19) (0.19) (0.20) (0.21) (0.22) (0.22) (0.22)New –3.40*** –0.48 –0.57 –0.43 –0.61 –0.48 –0.74* –0.65 –0.15 –0.03 0.01 –0.16 0.45 0.79*
(0.30) (0.42) (0.38) (0.34) (0.33) (0.32) (0.34) (0.33) (0.32) (0.32) (0.33) (0.34) (0.32) (0.31)
OCCUPATIONOwners & Operators –4.17*** 0.01 –0.54 –0.15 –0.51 –0.40 –0.30 –0.80 –0.45 –0.07 –0.27 –1.82*** –1.06 –0.83
(Private) (0.46) (0.56) (0.58) (0.50) (0.50) (0.48) (0.48) (0.52) (0.51) (0.49) (0.52) (0.82) (0.65) (0.61)Professionals –1.84*** 0.79*** 0.92*** 0.89*** 0.63** 0.62** 0.69*** 0.68*** 0.46* 0.52** 0.93*** 0.78*** 0.70** 0.63**
(0.18) (0.22) (0.20) (0.20) (0.19) (0.19) (0.19) (0.19) (0.20) (0.20) (0.20) (0.20) (0.20) (0.21)Cadres and Managers –0.93*** –0.06 –0.36* –2.82*** –0.45*** –0.35* –0.37* –0.40* –0.82*** –0.85*** –1.37*** –1.77*** –2.22*** –3.02***
(State) (0.15) (0.20) (0.19) (0.18) (0.17) (0.17) (0.17) (0.17) (0.19) (0.19) (0.22) (0.25) (0.31) (0.43)Clerical Workers –1.65*** –0.26 –0.17 –0.34 –0.25 –0.25 –0.14 –0.01 0.07 0.07 0.29 0.17 0.22 0.29
(0.16) (0.22) (0.19) (0.18) (0.17) (0.17) (0.17) (0.17) (0.17) (0.18) (0.17) (0.18) (0.18) (0.18)Skilled and Unskilled –0.33* –0.31 –0.23 –0.15 0.11 0.07 –0.05 –0.08 0.17 0.12 –0.20 0.15 0.21 0.23
Workers (0.13) (0.17) (0.15) (0.14) (0.14) (0.13) (0.14) (0.14) (0.14) (0.14) (0.14) (0.15) (0.15) (0.15)
306X
IAO
LIN
G SH
U A
ND
YA
NJIE
BIA
N
12345678910111213141516171819202122232425262728293031323334353637383940
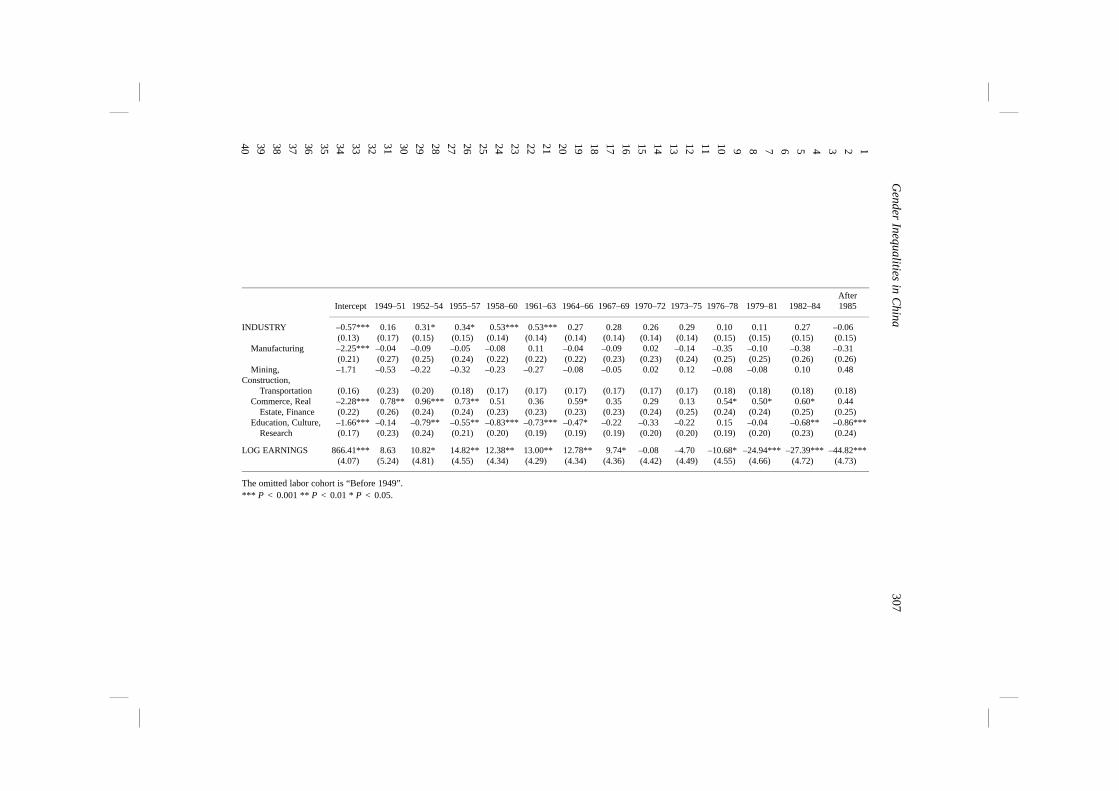
AfterIntercept 1949–51 1952–54 1955–57 1958–60 1961–63 1964–66 1967–69 1970–72 1973–75 1976–78 1979–81 1982–84 1985
INDUSTRY –0.57*** 0.16 0.31* 0.34* 0.53*** 0.53*** 0.27 0.28 0.26 0.29 0.10 0.11 0.27 –0.06(0.13) (0.17) (0.15) (0.15) (0.14) (0.14) (0.14) (0.14) (0.14) (0.14) (0.15) (0.15) (0.15) (0.15)
Manufacturing –2.25*** –0.04 –0.09 –0.05 –0.08 0.11 –0.04 –0.09 0.02 –0.14 –0.35 –0.10 –0.38 –0.31(0.21) (0.27) (0.25) (0.24) (0.22) (0.22) (0.22) (0.23) (0.23) (0.24) (0.25) (0.25) (0.26) (0.26)
Mining,Construction,
–1.71 –0.53 –0.22 –0.32 –0.23 –0.27 –0.08 –0.05 0.02 0.12 –0.08 –0.08 0.10 0.48
Transportation (0.16) (0.23) (0.20) (0.18) (0.17) (0.17) (0.17) (0.17) (0.17) (0.17) (0.18) (0.18) (0.18) (0.18)Commerce, Real –2.28*** 0.78** 0.96*** 0.73** 0.51 0.36 0.59* 0.35 0.29 0.13 0.54* 0.50* 0.60* 0.44
Estate, Finance (0.22) (0.26) (0.24) (0.24) (0.23) (0.23) (0.23) (0.23) (0.24) (0.25) (0.24) (0.24) (0.25) (0.25)Education, Culture, –1.66*** –0.14 –0.79** –0.55** –0.83*** –0.73*** –0.47* –0.22 –0.33 –0.22 0.15 –0.04 –0.68** –0.86***
Research (0.17) (0.23) (0.24) (0.21) (0.20) (0.19) (0.19) (0.19) (0.20) (0.20) (0.19) (0.20) (0.23) (0.24)
LOG EARNINGS 866.41*** 8.63 10.82* 14.82** 12.38** 13.00** 12.78** 9.74* –0.08 –4.70 –10.68* –24.94*** –27.39*** –44.82***(4.07) (5.24) (4.81) (4.55) (4.34) (4.29) (4.34) (4.36) (4.42) (4.49) (4.55) (4.66) (4.72) (4.73)
The omitted labor cohort is “Before 1949”.*** P < 0.001 ** P < 0.01 * P < 0.05.
307G
ender Inequalities in China
12345678910111213141516171819202122232425262728293031323334353637383940

Related Documents