Interchange Regulation: Implications for Credit Unions Adam J. Levitin Associate Professor Georgetown University Law Center

Welcome message from author
This document is posted to help you gain knowledge. Please leave a comment to let me know what you think about it! Share it to your friends and learn new things together.
Transcript

Interchange Regulation:
Implications for Credit Unions
Adam J. LevitinAssociate Professor
Georgetown University Law Center
ideas grow here
PO Box 2998
Madison, WI 53701-2998
Phone (608) 231-8550
PUBLICATION #224 (11/10)
www.filene.org ISBN 978-1-936468-03-4


Interchange Regulation:
Implications for Credit Unions
Adam J. LevitinAssociate Professor
Georgetown University Law Center

Copyright © 2010 by Filene Research Institute. All rights reserved.ISBN 978-1-936468-03-4Printed in U.S.A.

Deeply embedded in the credit union tradition is an ongoing
search for better ways to understand and serve credit union
members. Open inquiry, the free flow of ideas, and debate are
essential parts of the true democratic process.
The Filene Research Institute is a 501(c)(3) not-for-profit
research organization dedicated to scientific and thoughtful
analysis about issues affecting the future of consumer finance.
Through independent research and innovation programs the
Institute examines issues vital to the future of credit unions.
Ideas grow through thoughtful and scientific analysis of top-
priority consumer, public policy, and credit union competitive
issues. Researchers are given considerable latitude in their
exploration and studies of these high-priority issues.
The Institute is governed by an Administrative Board made
up of the credit union industry’s top leaders. Research topics
and priorities are set by the Research Council, a select group
of credit union CEOs, and the Filene Research Fellows, a blue
ribbon panel of academic experts. Innovation programs are
developed in part by Filene i3, an assembly of credit union
executives screened for entrepreneurial competencies.
The name of the Institute honors Edward A. Filene, the “father
of the U.S. credit union movement.” Filene was an innova-
tive leader who relied on insightful research and analysis when
encouraging credit union development.
Since its founding in 1989, the Institute has worked with over
one hundred academic institutions and published hundreds of
research studies. The entire research library is available online
at www.filene.org.
Progress is the constant replacing of the best there
is with something still better!
— Edward A. Filene
iii
Filene Research Institute


v
The Filene Research Institute would like to thank Card Services for
Credit Unions (CSCU) for its generous support of this and other
important payments research.
Acknowledgments


vii
Executive Summary and Commentary ix
About the Author xiii
Chapter 1 The Interchange System 1
Chapter 2 The Durbin Amendment 9
Chapter 3 The Filene Interchange Survey 15
Chapter 4 Impact of the Durbin Amendment 33
Chapter 5 Conclusion 43
Endnotes 47
Table of Contents


ix
by Ben Rogers,
Research DirectorWhen Jane Doe swipes her debit card for groceries, gas, or a book at
the airport, little does she know that her behavior supports a whole
ecosystem. The merchant certainly gets paid, but only after cough-
ing up an interchange fee that supports the debit card network, the
institution that issued the card, and sometimes even Jane herself in
the form of cardholder rewards. But a provision in 2010’s finan-
cial reform legislation is sending a tremor through that ecosystem,
directly affecting debit card issuers like credit unions.
What Is the Research About?When Congress passed the Dodd- Frank Act in the summer of 2010,
its main provisions—aimed squarely at large banks and other sys-
temically important institutions—did little to affect the operations
of credit unions. But one amendment, added late in the process by
Senator Dick Durbin (D-IL), restricts a key source of many credit
unions’ profits: debit card interchange. Despite lobbying against it,
and an eventual waiver for financial institutions with assets of less
than $10 billion (B), the Durbin Amendment passed in the final law.
Pending the Federal Reserve’s implementation rules, due for com-
ment in early 2011, it may be the act’s hardest pill for credit unions
to swallow.
This report builds on similar research by Professor Adam Levitin of
Georgetown University Law Center and the Filene Research Institute
over the past year. As new laws and regulations have begun to change
the face of credit union compliance, Filene has published the fol-
lowing reports: An Analysis of the Consumer Financial Protection Act
(2010), Overdraft Regulation (2010), and The Credit C.A.R.D. Act
(2009). Each seeks to explain the relevant new law and outline its
challenges and opportunities for credit unions.
What Did the Research Reveal?The Durbin Amendment will push down the approximately $17B
in debit interchange paid to issuing financial institutions every year.
Here are some of the key takeaways from the review and a special
Filene survey:
• Growing credit union debit: Debit card activity at credit unions
has grown briskly in the past four years. Median debit transaction
dollar volume grew at an average rate of 12% from 2006 to 2009,
while the median number of transactions grew at a rate of 9%
over the same period.
Executive Summary and Commentary

x
• Curtailed interchange will hurt: According to a Filene credit
union survey, debit interchange accounts for between 4% and 5%
of credit unions’ gross revenue, while credit interchange is in the
range of 1.5% to 2.5%. A 50% or greater decline in debit inter-
change revenue is possible for institutions larger than $10B, with
20–40 basis points (bps) as a realistic possibility—down from the
current range of 75–125 bps.
• Reasonable and proportional: The true cost of the Durbin
Amendment will become clear once the Fed rules on which
charges are reasonable and proportional to the cost incurred by
institutions to process debit transactions. Institutions may include
the cost of fraud but not the cost of overhead or marketing.
• Multi-homing: Institutions with less than $10B in assets may
be shielded from the “reasonable and proportional” interchange
standards, but they will still be subject to “multi- homing”—the
requirement that each card be capable of processing a transaction
on more than one network. Competition among networks will
allow merchants to route transactions to the network that saves
them the most money, which will push down income for issuers.
What Are the Implications for Credit Unions?Any regulatory movements will affect profitability, especially in a
core product like debit cards. But the Durbin Amendment is particu-
larly noteworthy for its likely middle- and long- term implications.
• Competition for small issuers: It is likely that competitive
pressures will encourage networks to adopt separate interchange
schedules for smaller institutions, which could leave small issu-
ers’ debit interchange revenue largely untouched by the Durbin
Amendment. If a two- tiered interchange structure emerges, it will
help make credit unions more competitive in the card issuance
market.
• Mobile advances: Regulatory reform will likely encourage
payment card networks to push aggressively into new (and less
regulated) markets, particularly mobile commerce. If so, credit
unions will generally have to look to license customizable mobile
software platforms and piggyback on network- negotiated deals to
gain a foothold in mobile payment transactions.
• Threats to fees abound: The Durbin Amendment highlights the
difficulties that credit unions face from an increasing reliance on
fee- based revenue. Credit unions may find it necessary to adjust
the bundle of services they offer along with deposit accounts,
possibly reemphasizing credit cards that maintain their attractive
interchange rates.

xi
The tremors set off by the Durbin Amendment will roil the retail
financial services industry. The $10B exemption may salvage debit
interchange revenue for most credit unions. But expect it to hasten
the move into new technologies and encourage the issuance of more
credit cards as large banks and payment networks seek to win back
lost income.


xiii
Adam J. LevitinAdam J. Levitin is an associate professor of law at Georgetown Uni-
versity Law Center in Washington, DC, where he teaches courses in
bankruptcy, commercial law, consumer finance, contracts, and struc-
tured finance. Before joining the Georgetown faculty, Professor Levi-
tin practiced in the Business Finance & Restructuring Department
of Weil, Gotshal & Manges LLP in New York. He has also served as
special counsel to the Congressional Oversight Panel supervising the
Troubled Asset Relief Program and as the Robert Zinman Resident
Scholar at the American Bankruptcy Institute.
About the Author


Many merchants find that the cost of accepting payment cards is one of the fastest- growing costs of doing business, and one over which they have little control. US interchange rates are the high-est in the developed world, and US merchants have observed regulators in numerous foreign jurisdictions taking legislative action to reduce already lower interchange rates.
CHAPTE R 1The Interchange System

2
Among the many provisions of the Dodd- Frank Wall Street Reform
and Consumer Protection Act of 20101 is a provision regulating
debit and credit card interchange fees—the fees paid on every card
transaction by merchants’ banks to the financial institutions that
issue the cards.2 Interchange fees and related payment card network
rules have been the subject of intense regulatory scrutiny and litiga-
tion globally for the past decade,3 but the Dodd- Frank provision,
known as the Durbin Amendment, marks the first time the fees have
been regulated in the United States. The Durbin Amendment was
strongly opposed by many credit unions and their trade organiza-
tions,4 and it promises to have far- reaching effects not just on credit
unions’ debit and credit card operations but on the credit union
business model more generally.
This research brief first reviews the provisions of the Durbin Amend-
ment. It then considers how these changes are likely to affect the
payment card industry in general, and card issuers in particular.
Next it presents the results of
an original survey of credit
unions to provide an empirical
picture of the role that inter-
change revenue plays in credit
unions’ business models and
how the Durbin Amendment
is likely to affect credit unions.
It concludes with an analysis of
the implications of the Durbin
Amendment for credit unions’ business overall and some sugges-
tions for how credit unions can respond to the changed regulator
environment.
Every payment card transaction in the United States involves five
parties: a purchaser, a merchant, the purchaser’s financial institution,
the merchant’s bank, and a payment card network.5 When the card is
used to make a purchase, the consumer’s account at his or her finan-
cial institution is debited for the full amount of the transaction. The
The total amount of interchange revenue from credit and
debit card transactions is unknown but is estimated to be
about $48B annually. Some sources estimate debit interchange
as being about $20B; the author’s estimated breakdown is
similar—roughly $31B in credit interchange and $17B in debit
interchange.

3
consumer’s financial institution then
remits the amount of the purchase
to the merchant’s bank through the
network, minus a fee known as the
interchange fee, as well as various
card network fees. The merchant’s
bank then credits the merchant’s
account for the full purchase
amount of the transaction minus a
fee taken by the merchant’s bank,
known as the merchant discount
fee. Figure 1 illustrates the fee divi-
sion for a hypothetical transaction.
The total amount of interchange
revenue from credit and debit card
transactions is unknown but is esti-
mated to be about $48B annually.6
The credit/debit breakdown is also
unknown. Some sources estimate
debit interchange as being about
$20B7; the author’s estimated break-
down is similar—roughly $31B in credit interchange and $17B in
debit interchange.8 Figures 2 and 3 provide some sense of the break-
down of debit and credit transaction volume and total transaction
value for different payment systems. Figure 4 shows the breakdown
for payment cards in further detail, differentiating between signature-
and PIN- based account-linked debit cards and prepaid cards.
The interchange fee is set by the payment card network. Typically the
fee is a combination of a flat fee and a percentage of the transaction;
in some cases the total fee is capped. Fees depend on the type of card
used, the level of rewards and service on the card, and the type and
transaction volume of the merchant. Interchange fee schedules do
not vary based on the identity of the financial institutions involved.
Despite fee schedules that are based on merchant and cardholder
characteristics, interchange is technically an interbank fee, but it is
usually passed on to the merchant as part of the merchant discount
fee charged by the merchant’s bank. Most large merchants pay
discount fees that are structured as “interchange plus,” meaning the
discount fee is the interchange fee plus network fees plus an addi-
tional percentage that pays for the acquirer’s costs and profit mar-
gin. (“Blended rate” merchant discount fees are more common for
smaller merchants.)
Payment card networks maintain a number of rules related to the
terms on which merchants accept cards. These rules, which vary
Card
association
(Network)Cardholder
$100
purchase on
credit card
Merchant Acquirer
Retains
$0.30
Retains
$98.00
Pays $0.10
to card
association
(switch fee)Pays $2.00
to acquirer
(merchant
discount fee) Pays $1.60
to issuer
(interchange
fee)
Receives
$0.10
Issuer
Receives
$1.60
Figure 1: Fee Division in Network Illustrated with a $100 Credit Card Purchase with a Hypothetical 2% Merchant Discount Rate and a 1.6% Interchange Rate

4
Credit cards Debit cards (PIN and signature) Other payment systemsChecks
Note: Prepaid, EBT, and ACH transactions are included under “Other payment systems.”
Cash
0%
10%
20%
30%
Mar
ket
shar
e of
tra
nsa
ctio
n v
alu
e
40%
50%
60%
70%
80%
90%
100%
1990
1991
1992
1993
1994
1995
1996
1997
1998
1999
2000
2001
2002
2003
2004
2005
2006
2007
2008
Figure 2: Market Share of Consumer Payments by Dollar Amount
Source: Nilson Reports.
Credit cards Debit cards (PIN and signature) Other payment systemsChecks
Note: Prepaid, EBT, and ACH transactions are included under “Other payment systems.”
Cash
0%
10%
20%
30%
Mar
ket
shar
e of
tra
nsa
ctio
ns
40%
50%
60%
70%
80%
90%
100%
1990
1991
1992
1993
1994
1995
1996
1997
1998
1999
2000
2001
2002
2003
2004
2005
2006
2007
2008
Figure 3: Market Share of Consumer Payments by Transaction Volume
Source: Nilson Reports.

5
among networks, generally require merchants to
accept all of the payment card networks’ cards
in all of their locations for all transactions (no
minimum or maximum purchase amounts) and
to route the clearance of all transactions made
using the card network’s cards through the card
network. The rules also forbid merchants to
discriminate among the networks’ cards, against
card users (including surcharging), or against
the payment card network in favor of other card
networks.
Interchange fees on credit and debit cards
constitute an important source of US financial
institution revenue, estimated at $48B in 2008.9
They are also highly controversial. Merchants
and consumer advocates contend that inter-
change fees are uncompetitively high because
merchants are neither able to bargain over the
fees nor pass them along to card users due to
payment card network rules. Merchants argue
that because payment card network rules forbid them from passing
along interchange fees to card users, a large portion of the fees are
ultimately passed on to all consumers in the form of higher prices.
Merchants allege that this results in a regressive cross- subsidy from
cash to electronic payment users, whereby cash consumers are subsi-
dizing payment card rewards programs.10
Payment card networks argue that interchange fees are a critical tool
for balancing price elasticities—willingness to pay—between mer-
chants and consumers in order to maximize the size and hence the
value of the network.11 They also contend that interchange is neces-
sary to reimburse issuers for the cost of processing purely payment
transactions, including fraud prevention. Merchants and consumer
advocates challenge these assertions and contend that interchange
originated not as a method for balancing price elasticities but as a
method for evading usury laws.12 They also contend that (1) inter-
change revenue enables more aggressive underwriting standards
because with an expanded cardholder base, increased interchange
revenue can offset credit losses,13 and (2) because interchange is used
Sh
are
of p
aym
ent
pu
rch
ases
by
valu
e, 2
00
9
0%
30%
20%
10%
40%
50%
60%
70%
Credit Signature debit PIN debit Prepaid
62%
23%
14%
2%
Figure 4: Market Share of Payment Transactions, 2009
Source: Nilson Report, Issue 948 (May 2010).
While merchants receive many benefits from accepting payment card transactions, such as reduced
theft costs, easier cash management, easier accounting, reduced credit risk, potentially faster
transaction speed, and even possibly greater sales volume and ticket amounts, they do not perceive
increasing benefits that correspond to the increased costs.

6
to fund rewards programs and marketing, it encourages excessive use
of credit cards in particular.14
This research brief takes no position on the propriety of interchange
fees. Instead, it merely notes the existence of the controversy, the
important role interchange plays in payment card networks’ com-
petition for card issuers, and the motivations behind the legislation.
Payment card networks’ revenue is based on the total dollar amount
of all transactions as the networks’ fee is a percentage of the transac-
tion amount. The key determinant of the volume and amount of
transactions is the number of cards issued on the network. Therefore,
networks must compete with
one another for a share of the
card issuer market. Networks
compete by offering higher
interchange rates to issuers.
Interchange rates, however, are
currently one-size-fits- all for
issuers, so networks offer larger
issuers additional compensation
for issuing cards on their network in the form of individually negoti-
ated payments. Because card networks use interchange to compete
for issuer market share, competition tends to drive up interchange
rates. Moreover, since MasterCard’s and Visa’s initial public offerings
(IPOs) in 2005–2006, there has been shareholder pressure for the
networks to raise their own fees, which tend to be passed along to
merchants in the merchant discount rate.
Thus, many merchants find that the cost of accepting payment cards
is one of the fastest- growing costs of doing business and one that
they can do little to control. While merchants receive many benefits
from accepting payment card transactions, such as reduced theft
costs, easier cash management, easier accounting, reduced credit ris k,
potentially faster transaction speed, and even possibly greater sales
volume and ticket amounts, they do not perceive increasing benefits
that correspond to the increased costs. There is, of course, a thresh-
old to merchants’ price elasticity; if interchange rates become too
high, a merchant might refuse to accept the network’s cards. Opting
out of accepting cards altogether is an impossible proposition for
many merchants, however, because consumers expect to be able to
pay with plastic. A merchant that refuses to take payment cards puts
itself at a severe competitive disadvantage.
US interchange rates are the highest in the developed world,15 and
US merchants have observed regulators in numerous foreign juris-
dictions, including the European Union (EU), Australia, Hungary,
Israel, Mexico, New Zealand, Poland, Switzerland, and the UK,
take action to reduce already lower interchange rates.16 Prior to the
US interchange rates are the highest in the developed world,
and US merchants have observed regulators in numerous for-
eign jurisdictions, including the EU, Australia, Hungary, Israel,
Mexico, New Zealand, Poland, Switzerland, and the UK, take
action to reduce already lower interchange rates.

7
Durbin Amendment, however, no US regulatory agency had author-
ity over interchange rates. Accordingly, US merchants have brought
litigation and have pushed hard for a legislative solution to what they
perceive as an unfair interchange system that enriches financial insti-
tutions at their expense and their consumers’. The Department of
Justice has sued American Express, MasterCard, and Visa over their
credit card network rules and has reached settlements with Mas-
terCard and Visa. The most substantial product to date, however,
of the merchants’ campaign for interchange reform is the Durbin
Amendment.


The Durbin Amendment, passed by the Sen-ate, requires interchange fees on debit cards to be “reasonable and proportional” and opens the door for more competition among payment systems that will likely result in lower inter-change fees. The amendment was supported by merchants but strongly opposed by credit unions and community banks.
CHAPTER 2The Durbin Amendment

10
The Durbin Amendment aims to improve competition among
payment card networks by reducing interchange fees on debit cards
and allowing merchants greater ability to steer transactions toward
lower-cost payment systems. The amendment was strongly supported
by merchants and consumer groups but fiercely opposed by financial
institutions, particularly credit unions and community banks.17 The
amendment’s bipartisan passage (64–33, with 47 Democrats and
Independents and 17 Republicans supporting it) in the Senate ver-
sion of the financial reform bill was a surprise; while there had been
previous attempts to move interchange legislation, and interchange
is the subject of massive litigation, the amendment’s passage in the
Senate was not expected.18
The legislation contains two operative sections. One section
addresses only debit cards.19 The other section addresses all payment
cards, debit and credit. The first part of the amendment requires
that interchange fees on debit card transactions be “reasonable and
proportional to the cost incurred by the issuer with respect to the
transaction.”20 The amendment instructs the Federal Reserve to pro-
mulgate regulations for assessing whether interchange fees are in fact
reasonable and proportional to the cost incurred by the issuer with
respect to the transaction.21
In determining what fees would be “reasonable and proportional,”
the amendment directs the Fed to consider the similarity between
debit and check transactions that it requires to clear at par (meaning
without a discount fee).22 The amendment also provides that in its
rule- making, the Fed shall only take into account issuers’ incremen-
tal costs for debit transactions,23 thereby excluding sunk costs like
overhead and marketing. The Fed is permitted, however, to adjust
its determination of a reasonable and proportional fee to account
for the issuer’s net debit fraud prevention costs if the issuer complies
with the fraud prevention standards that the amendment requires
the Fed to establish.24 The Fed is instructed that the fraud preven-
tion standards must require issuers to develop and implement cost-
effective fraud prevention technology,25 and that in its consideration

11
of cost- effectiveness, the Fed must consider the relationship between
fraud and PIN- authorized and signature- authorized debit transac-
tions (most networks use PIN technology; signature is used only by
MasterCard and Visa26), the allocation of fraud and data security
liability and costs, and the incentives interchange creates in affecting
fraud losses.27 The Fed is also given authority to regulate network
fees to ensure that they are used to reimburse issuers directly or
indirectly.28
Small issuers with less than $10B in consolidated assets are exempt
from the “reasonable and proportional to cost” requirement,29 as are
cards used for government- administered payment programs (e.g.,
SNAP, Social Security, and unemployment benefits) and prepaid,
reloadable debit cards that are not marketed as gift cards or gift
certificates and that do not charge a fee for the first in- network ATM
usage in a month or overdraft fees.30 By virtue of exemption from
the “reasonable and proportional to cost” requirement, small issuers
are also exempt from the subsidiary fraud prevention standards. The
$10B exemption is not inflation indexed.
The second operative part of the amendment prohibits certain
payment card network rules that restrict merchants’ ability to steer
consumers toward particular payment systems. The small issuer
exemption does not apply to this part of the amendment. First, the
amendment prohibits exclusive
arrangements for processing
debit card transactions.31 The
amendment requires that every
electronic debit transaction—
rather than every debit card—be
capable of being processed on
at least two unaffiliated net-
works, enabling what is known
as “multi- homing”32 (mea ning that the transaction can find its way
“home” over multiple network routings). The requirement that at
least two unaffiliated debit networks be able to process each transac-
tion opens the door to competition among networks for transaction
processing; where there is only one network on a card, there is no
competition for the transaction once the consumer presents the card
to the merchant.
Second, the amendment prohibits the networks from restricting mer-
chants’ ability to decide on the routing of debit transactions.33 Com-
bined with the multi- homing requirement, this permits merchants to
route payments to the debit network offering them the lowest cost,
rather than the current system, whereby the card’s processor routes
the transaction according to the preferred routing flagging encoded
on the card. This means that card networks will have to compete
While merchants’ ability to offer discounts will be constrained
by their profit margins—merchants cannot generally discount
below margin—the ability to offer in-kind incentives might
provide them with greater ability to steer transactions toward
favored payment mechanisms.

12
with one another for merchant routing, presumably resulting in
lower interchange rates.
Third, the amendment prohibits payment card networks from
preventing merchants from offering discounts or in- kind incentives
for the use of cash, check, debit, or credit for payment, so long as the
discounts or incentives do not discriminate by issuer or network.34
This provision expands on an existing federal law, the Cash Discount
Act,35 to clarify that discounts are permitted not only for cash and
checks but also for debit and credit transactions. Unaddressed is
whether these discounts or incentives could discriminate on the basis
of card types within networks, such as between cards with rewards
programs and cards without rewards programs (and hence higher
interchange fee rates). Likewise unaddressed is whether merchants
can distinguish between PIN and signature debit cards. These cards
are run on different networks, so distinguishing between them could
be viewed as discriminating on the basis of network rather than on
product offering.
The provision does not specifically authorize surcharging, which
most network rules prohibit.36 Mathematically, surcharging is indis-
tinguishable from discounting, but in terms of behavior economic
effects, surcharging is much more effective at changing consumer
behavior, much like the difference between the bottle half- full and
the bottle half- empty.37 While merchants’ ability to offer discounts
will be constrained by their profit margins—merchants cannot gen-
erally discount below margin—the ability to offer in- kind incentives
might provide them with greater ability to steer transactions toward
favored payment mechanisms. For example, a merchant might offer
dedicated debit- only checkout lanes, a free store- brand product or
coupon for future use, or an entry in a raffle with a purchase of $X or
more on debit.
Finally, the amendment limits payment card network rules that for-
bid merchants from imposing minimum and maximum transaction
amounts for credit cards.38 Henceforth, merchants will not be violat-
ing network rules by refusing to accept credit cards for transactions
under $10, and federal agencies and higher education institutions
may impose maximum dollar amounts.39 The amendment does not
affect payment card network rules forbidding minimum transaction
amounts for debit cards.
The amendment specifically states that it does not authorize mer-
chants to discriminate among card issuers.40 Thus, as long as network
rules prohibit such discrimination, merchants may not discriminate
among issuers. There is no exemption for smaller issuers from the
second part of the Durbin Amendment; it applies to all debit and
credit card issuers and networks.
13
Much of the Durbin Amendment will be implemented through reg-
ulations. Numerous issues remain to be resolved in the rule-making:
• What constitutes a fee that is “reasonable and proportional to
cost”? Fees that are a percentage of the transaction amount are
unlikely to qualify, as the cost to an issuer of a debit transaction
is not dependent on transaction value. Fraud expense excluded,
a $20 debit transaction imposes the same costs on an issuer as
a $2,000 debit transaction. Thus, the current fee structure of a
small flat fee plus a percentage of the transaction is unlikely to
remain intact; instead, flat fees or capped percentages are more
likely to prevail. It is not clear, however, that any interchange fee
is in fact reasonable and proportional to cost. The existence of
zero or reverse interchange (paid from the issuer to the acquirer)
electronic debit payment systems in the United States (where
some PIN debit networks had reverse interchange before 1998)
and other developed countries (such as Australia’s EFTPOS
system) raises the possibility that “reasonable and proportional to
cost” might be interpreted as par (zero interchange) or virtually
so. In any case, debit interchange fees are expected to fall signifi-
cantly, particularly for signature debit, where interchange fees are
close to those on credit cards.
• Whether merchants can offer discounts for PIN but not signature
debit or otherwise steer transactions toward PIN debit. Argu-
ably, such steering would be interpreted as discriminating against
signature networks rather than signature products.
• Whether fraud- prevention cost adjustments will be granted on a
generic basis or whether issuers will have to apply for individual-
ized variances.
• Whether fraud- prevention standards will mandate the use of
PIN or chip-and- PIN technology or fraud loss- allocation rules
will be restructured for issuers to receive the fraud adjustment.
Merchants absorb the majority of payment fraud losses under
payment card network rules;41 if the merchant cannot prove that
it followed proper security procedures or it was a card-not- present
transaction, the merchant generally bears the loss.42 The 2009
LexisNexis True Cost of Fraud Study estimates that merchants
lost $100B to fraudulent payment card transactions in 2009,
compared with $11B in financial institution losses and $4.8B in
consumer out-of- pocket costs.43 Merchants, however, rarely bear
fraud liability on PIN debit transactions; because of the two-
factor authentication, it is hard for a consumer to claim that the
transaction was not authorized. Moreover, financial institution
fraud losses are much lower from PIN debit. According to Fiserv,
fraud losses for financial institutions on signature debit in 2009
were 7.5 times higher than for PIN debit.44

14
• The Fed could conceivably use the rule- making as a tool for
encouraging the adoption of better fraud- prevention systems and/
or rationalizing fraud- loss allocation in payment cards by setting
a low “reasonable and proportional to cost” fee but then granting
more generous upward adjustments for issuers that comply with
fraud- prevention standards.
• Whether the multi- homing requirement means that each card
must be capable of routing through two unaffiliated networks or
that each card must be capable of routing through two unaffili-
ated signature debit and two unaffiliated PIN debit networks.
• Whether the networks will be required to offer separate pricing
for financial institutions with net assets less than $10B.
• What sort of restrictions will be placed on network fees and
payments to issuers (other than interchange) in order to prevent
circumvention of the Durbin Amendment? Will network fees
be restricted to a “reasonable and proportional to cost” standard
to prevent side payments to issuers? Will networks be prohib-
ited from tying issuance of credit and debit to prevent payments
as part of credit issuance arrangements from compensating for
reduced debit interchange?
• Whether issuers will be prohibited from taking acts to steer con-
sumers toward one network or type of system (such as signature
debit), including charging consumers penalty fees for using PIN
debit (as some issuers currently do).45
The resolution of these issues depends on how aggressive the Fed is
in its rule- making. The timeframe for the Fed’s rule- making is quite
short, which suggests that the Fed will be cautious in its rule- making
but might follow up with additional rule- makings as it assesses the
impact of the initial rule- making. The Fed is required to prescribe
regulations implementing the “reasonable and proportional to cost”
requirement and fraud- prevention standards within nine months of
the passage of the Dodd- Frank Act, meaning by April 21, 2011.46
Because the Fed must put the rule- making out for notice and com-
ment 90 days before it becomes effective, the proposed rule must
be complete in early January 2011. The Fed also has until July 21,
2011, to prescribe regulations regarding multi- homing through
prohibitions on debit card exclusivity and routing selection.47 These
provisions of the Durbin Amendment are not self- executing without
the Fed’s rule- making. The “reasonable and proportional to cost”
provision becomes effective July 21, 2011.48 The discounting and
authorization of minimum and maximum amounts for credit card
transactions were effective as of the signing date of the Dodd- Frank
Act, July 21, 2010.

The Filene Interchange Survey gauged the impact of the Durbin Amendment on credit unions. Credit unions were asked about their debit and credit card transaction volume and size, their revenue on cards, and their fraud costs.
CHAPTER 3The Filene Interchange Survey

16
In July 2010, the Filene Institute undertook a survey of its credit
union members to gauge the likely impact of the Durbin Amend-
ment on credit unions. The survey was administered via the Survey-
Monkey website and consisted of 32 questions, some with multiple
subparts for time series data. Ninety- one valid survey responses were
received; not all respondents answered all questions.
General Profile of RespondentsOf the respondents, 50 (55%) were from state credit unions and 41
(45%) were from federal credit unions. Median (mean) asset size was
$428 million (M) ($1.18B), and median (mean) membership was
53,233 (123,223). Larger credit unions are heavily overrepresented
in the survey: More than three- quarters of respondents reported
assets of over $100M, almost half reported assets of over $500M,
and a quarter of respondents reported assets of over $1B. As a result,
the survey covers almost 12% of credit unions with over $500M in
assets, but less than 1% of credit unions with less than $500M in
assets. Figure 5 shows the distribution in terms of National Credit
Union Association (NCUA) asset group sizes.
Given the sample size—just over 1% of all credit unions—there is
a question of whether the results are a representative sampling or
might reflect a self- selection bias or stochastic variation. It is not
possible to answer with certainty, so the survey’s results should be
taken as illustrative of a segment of the credit union system and not
necessarily representative. Nonetheless, there is reason to believe that
the survey is at least directionally accurate; responses generally track
results in other credit union surveys and for financial institutions
in general. As Figure 6 shows, profitability as reported in the Filene
survey largely tracks credit unions as a whole. Figure 7 shows profit-
ability breakdown by asset size.

17
Nu
mb
er o
f re
spon
den
ts
0
25
15
20
5
10
30
35
40
45
$0–$2M $2M–$10M $10M–$50M $50M–$100M
Credit union asset size
31
7 8
$100M–$500M
29
$500M–$1B
21
>$1B
21
Figure 5: Survey Respondents by NCUA Asset Group Size
Respondents (mean) All credit unionsRespondents (median)
0
10
Ret
urn
on
ass
ets
(bas
is p
oin
ts)
20
30
40
50
60
70
80
90
2006 2007 2008 2009
Figure 6: Respondents’ Return on Assets, 2006–2009
Source: Filene Interchange Survey; CUNA 2009 End of Year Report, CU Spreads.

18
Respondents’ Debit and Credit Card ProgramsBasic Program FeaturesNearly all respondents (88 of 91) offer debit cards to their members.
Of those issuing cards, most (86%) issue the cards directly, while a
minority (14%) issue cards via an agent bank relationship. Ninety-
five percent of respondents that issue debit cards issue both PIN and
signature debit cards. Only 5% issue only PIN or only signature
debit cards. Most respondents that offer debit cards (95%) do not
charge an annual fee. Respondents’ debit cards generally do not have
rewards programs. Ten percent offer rewards for all their debit cards,
while 22% offer rewards only on signature debit transactions. Sixty-
eight percent do not offer debit rewards at all. The transaction mix in
2009 on respondents’ debit cards tilted toward signature debit. The
median (mean) percentage of signature transactions was 60% (59%).
This closely tracks the 61:39 signature-to- PIN debit transaction ratio
for the United States.49 No significant correlations exist between
signature-to- PIN ratio and debit interchange revenue as a percentage
of gross revenue.
Reflecting the overrepresentation of large credit unions, which
prior research has found to be more likely to offer credit cards,
most respondents (84 of 91, or 92%) also offer credit cards to their
members, a significantly higher percentage than credit unions in
2009
>$1B
$500
M–$
1B
$100
M–$
500M
Mean Median
Credit union asset size
–80
–60
–40Ret
urn
on
ass
ets
(bas
is p
oin
ts)
–20
0
20
40
60
80
100
2006
>$1B
$500
M–$
1B
$100
M–$
500M
<$100
M
2007
>$1B
$500
M–$
1B
$100
M–$
500M
<$100
M
2008
>$1B
$500
M–$
1B
$100
M–$
500M
<$100
M
<$100
M
Figure 7: Respondents’ Return on Assets by Size

19
general (51%).50 Of those that offer credit cards, 82% issue them
directly, while 18% use an agent bank. Credit unions also issue many
fewer credit cards than debit cards. On average, respondents issue
only about a third (37%) as many credit cards as they do debit cards.
Most respondents (82%) do not charge an annual fee on their credit
cards, but most (86%) offer some form of rewards on at least some of
their credit cards.
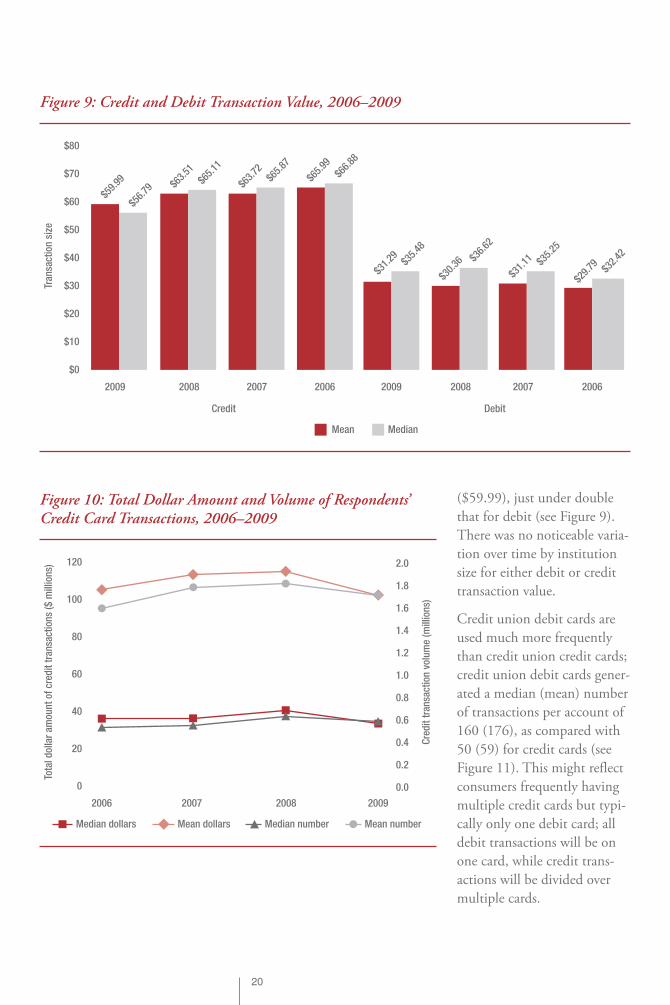
Transaction Volume, Amount, and SizeRespondents had a median (mean) 5.1 million (11.3 million) debit
transactions in 2009, with a median (mean) total debit purchase
volume of $177.3M ($307.3M). This compares with median (mean)
credit transactions of 583,000 (1.7 million) in 2009, and median
(mean) credit purchase volume of $33M ($102M). The wide
discrepancies between medians and means reflect the variation in
respondent institution size.
As Figure 8 shows, both the volume and total dollar amount of debit
transactions have grown steadily over the past four years, tracking
the general phenomenon of growth in both debit card transaction
volume and the total dollar amount of debit card transactions as
debit replaces both checks and cash at point of sale. Median total
dollar amount of debit transactions grew at an average rate of 12%
from 2006 to 2009, while the median number of transactions grew
at a rate of 9% over the same period. The median (mean) 2009 debit
transaction value based on these figures was $35.48 ($31.29) (s ee
Figure 9).
By comparison, as shown in
Figure 10, both the volume
and the total dollar amount
of debit transactions has risen
and fallen over the past four
years. This tracks the general
trend of growth in credit card
usage followed by a sharp pull-
back in 2009 with constrained
economic conditions. Median
total dollar amount of credit
transactions grew at an aver-
age rate of 9% from 2006 to
2009, but the median number
of transactions fell at a rate
of 8% over the same period.
The median (mean) 2009
credit transaction value based
on these figures was $56.79
Median dollars Mean dollars Median number Mean number
$0
Tota
l dol
lar
amou
nt
of d
ebit
tra
nsa
ctio
ns
($ m
illio
ns)
Deb
it t
ran
sact
ion
vol
um
e (m
illio
ns)
$50
$100
$150
$200
$250
$300
$350
0
2
4
6
8
10
12
2006 2007 2008 2009
Figure 8: Total Dollar Amount and Volume of Respondents’ Debit Card Transactions, 2006–2009
20
($59.99), just under double
that for debit (see Figure 9).
There was no noticeable varia-
tion over time by institution
size for either debit or credit
transaction value.
Credit union debit cards are
used much more frequently
than credit union credit cards;
credit union debit cards gener-
ated a median (mean) number
of transactions per account of
160 (176), as compared with
50 (59) for credit cards (see
Figure 11). This might reflect
consumers frequently having
multiple credit cards but typi-
cally only one debit card; all
debit transactions will be on
one card, while credit trans-
actions will be divided over
multiple cards.
Mean Median
Credit Debit
$0
$10
Tran
sact
ion
siz
e
$20
$30
$40
$50
$60
$70
$80
2009
$59.
99
$56.
79$6
3.51
$65.
11
$63.
72$6
5.87
$65.
99$6
6.88
$31.
29 $35.
48
$31.
11 $35.
25
$29.
79 $32.
42
$30.
36$3
6.62
2008 2007 2006 2009 2008 2007 2006
Figure 9: Credit and Debit Transaction Value, 2006–2009
Median dollars Mean dollars Median number Mean number
0
Tota
l dol
lar
amou
nt
of c
red
it t
ran
sact
ion
s ($
mill
ion
s)
Cre
dit
tra
nsa
ctio
n v
olu
me
(mill
ion
s)
20
40
60
80
100
120
0.0
1.2
1.0
0.8
0.6
0.4
0.2
1.4
1.6
1.8
2.0
2006 2007 2008 2009
Figure 10: Total Dollar Amount and Volume of Respondents’ Credit Card Transactions, 2006–2009
21
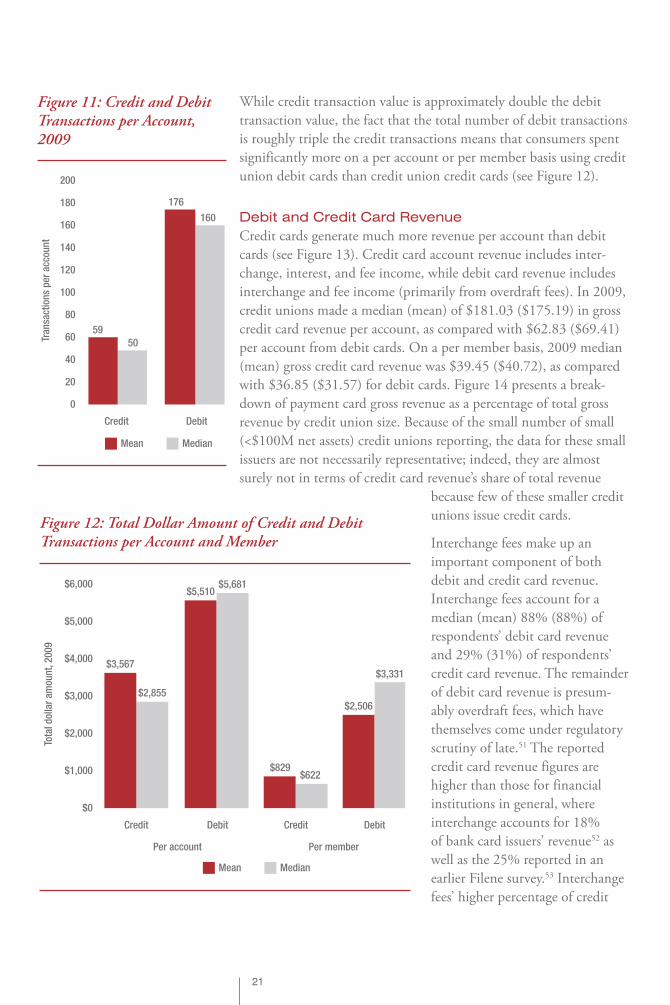
While credit transaction value is approximately double the debit
transaction value, the fact that the total number of debit transactions
is roughly triple the credit transactions means that consumers spent
significantly more on a per account or per member basis using credit
union debit cards than credit union credit cards (see Figure 12).
Debit and Credit Card RevenueCredit cards generate much more revenue per account than debit
cards (see Figure 13). Credit card account revenue includes inter-
change, interest, and fee income, while debit card revenue includes
interchange and fee income (primarily from overdraft fees). In 2009,
credit unions made a median (mean) of $181.03 ($175.19) in gross
credit card revenue per account, as compared with $62.83 ($69.41)
per account from debit cards. On a per member basis, 2009 median
(mean) gross credit card revenue was $39.45 ($40.72), as compared
with $36.85 ($31.57) for debit cards. Figure 14 presents a break-
down of payment card gross revenue as a percentage of total gross
revenue by credit union size. Because of the small number of small
(<$100M net assets) credit unions reporting, the data for these small
issuers are not necessarily representative; indeed, they are almost
surely not in terms of credit card revenue’s share of total revenue
because few of these smaller credit
unions issue credit cards.
Interchange fees make up an
important component of both
debit and credit card revenue.
Interchange fees account for a
median (mean) 88% (88%) of
respondents’ debit card revenue
and 29% (31%) of respondents’
credit card revenue. The remainder
of debit card revenue is presum-
ably overdraft fees, which have
themselves come under regulatory
scrutiny of late.51 The reported
credit card revenue figures are
higher than those for financial
institutions in general, where
interchange accounts for 18%
of bank card issuers’ revenue52 as
well as the 25% reported in an
earlier Filene survey.53 Interchange
fees’ higher percentage of credit
Mean Median
Credit Debit
0
20
Tran
sact
ion
s p
er a
ccou
nt
40
60
80
100
120
59
176
160
50
140
160
180
200
Figure 11: Credit and Debit Transactions per Account, 2009
Mean Median
Per account Per member
$0
$1,000
Tota
l dol
lar
amou
nt,
2009
$2,000
$3,000
$4,000
$5,000
$6,000
$3,567
$2,855
$5,510$5,681
$2,506
$3,331
$829$622
Credit Debit Credit Debit
Figure 12: Total Dollar Amount of Credit and Debit Transactions per Account and Member

22
Mean Median
Per account Per member
Gro
ss r
even
ue,
20
09
$175
.19
$181
.03
$69.
41
$62.
83
$31.
57$3
6.85
$40.
72
$39.
45
Credit Debit Credit Debit
$0
$20
$40
$60
$80
$100
$120
$140
$160
$180
$200
Figure 13: Gross Credit and Debit Revenue per Account and per Member, 2009
Credit Debit
Med
ian
pay
men
t ca
rd g
ross
rev
enu
e as
a p
erce
nta
ge
of m
edia
n c
red
it u
nio
n g
ross
rev
enu
e
0%
5%
10%
15%
20%
25%
>$1B
3.46%
5.39%
5.36%
5.90%
4.38%
6.79%
6.52%
16.04%
$500M–$1B $100M–$500M <$100M
Figure 14: Payment Card Gross Revenue as a Percentage of Total Gross Revenue, 2009

23
union credit card revenue indicates
that credit unions are less reliant on
interest (capped at 18% effective rate
for federal credit unions) and other
fee income (annual fees, late fees,
overlimit fees, etc.) than banks.
In absolute terms, median (mean)
gross interchange revenue from debit
cards increased by 14% (21%) from
2006 to 2009, while median (mean)
gross interchange revenue from credit
cards increased by only 5% (5%) over
the same period (see Figures 15 and
16). The discrepancies between mean
and median figures in Figures 15 and
16 also underscore that there is signif-
icant variation in terms of gross debit
interchange revenue, which gener-
ally correlates with the size of the
credit union. Gross debit interchange
revenue has an 89% correlation with
credit union asset size and a 96% cor-
relation with credit union member-
ship size; for credit interchange, the
correlations are weaker, at 35% for
both asset and membership size.
Median (mean) gross interchange
revenue in 2009 was $1.7M ($3.4M)
for debit and $.6M ($1.6M) for
credit. On a per account basis (debit
card account or credit card account),
that translates to $55.61 ($60.99) for
debit and $52.05 ($55.10) for credit.
On a per member basis, it is $32.61
($27.74) for debit and $11.34
($12.81) for credit (see Figure 17).
Interchange revenue plays an impor-
tant role in credit unions’ bottom
line, as shown by Figures 18–22.
When interchange is expressed in relation to credit union gross
revenue, as in Figures 18 and 19, the discrepancies between the mean
and median figures narrow substantially, and nearly disappear for
debit interchange. This indicates that there is relatively constrained
deviation in terms of the role of interchange (especially debit inter-
change) in credit unions’ overall revenue models. As Figures 18
Mean Median
Gro
ss d
ebit
inte
rch
ang
e re
ven
ue
($ m
illio
ns)
$2.9
$1.2
$2.8
$1.4
$3.4
$1.7
$3.2
$1.5
2006 2007 2008 2009
$0
$0.5
$1.0
$1.5
$2.0
$2.5
$3.0
$3.5
$4.0
Figure 15: Gross Debit Interchange Revenue, 2006–2009
Mean Median
Gro
ss c
red
it c
ard
inte
rch
ang
e re
ven
ue
($ m
illio
ns)
$0.6
$1.5
$0.5
$1.6
$0.6
$1.6
$0.6
$1.6
2006 2007 2008 2009
$0
$0.4
$0.2
$0.6
$0.8
$1.0
$1.2
$1.4
$1.6
$1.8
Figure 16: Gross Credit Interchange Revenue, 2006–2009

24
and 19 illustrate, debit interchange
accounts for between 4% and 5% of
credit unions’ gross revenue, while
credit interchange is in the range of
1.5% to 2.5%.
Figure 20 provides a breakdown by
credit union size and shows that
larger credit unions are less depen-
dent on payment card interchange
revenue than smaller ones, perhaps
because of more diversif ied lines of
business; if smaller credit unions
provide primarily transaction account
services, then they will necessarily
be more dependent on interchange
income than larger credit unions
that offer a wider array of financial
products.54 This suggests that credit
unions with more diversified income
sources will be less affected by the
Durbin Amendment than other
credit unions. Figures 21 and 22
show the relationship of gross interchange income net revenue; given
the profitability levels of credit unions, gross interchange income
represents a much larger share of profits. Because of the subjective
Mean Median
Per member Per account
$0
$20
$10
Gro
ss in
terc
han
ge
reve
nu
e, 2
00
9
$30
$40
$50
$60
$70
$12.81$11.34
$27.74
$32.61
$60.99
$55.61$55.10$52.05
Credit Debit Credit Debit
Figure 17: Gross Interchange Revenue per Member and per Account, 2009
Mean Median
Deb
it in
terc
han
ge
as a
per
cen
t of
gro
ss r
even
ue
4.61%
3.72%3.91% 3.96%
4.53%4.79%
4.39%4.22%
2006 2007 2008 2009
0%
1%
2%
3%
4%
5%
6%
Figure 18: Gross Debit Interchange Revenue as Percentage of Credit Union Gross Revenue, 2006–2009

25
Mean Median
Gro
ss c
red
it c
ard
inte
rch
ang
e re
ven
ue
as a
per
cen
tag
e of
gro
ss r
eveu
ne
1.81%
2.36%
1.59%
2.21%
1.67%
2.09%
1.62%
2.21%
2006 2007 2008 2009
0.00%
0.50%
1.00%
1.50%
2.00%
2.50%
Figure 19: Gross Credit Interchange Revenue as Percentage of Credit Union Gross Revenue, 2006–2009
2009
>$1B
$500
M–$
1B
$100
M–$
500M
Credit Debit
Credit union asset size
0%
2%
1%
3%
Med
ian
gro
ss in
terc
han
ge
reve
nu
e as
a p
erce
nta
ge
of
med
ian
cre
dit
un
ion
gro
ss r
even
ue
4%
5%
6%
7%
8%
9%
10%
2006
>$1B
$500
M–$
1B
$100
M–$
500M
<$100
M
2007
>$1B
$500
M–$
1B
$100
M–$
500M
<$100
M
2008
>$1B
$500
M–$
1B
$100
M–$
500M
<$100
M
<$100
M
Figure 20: Median Gross Interchange Revenue as a Percentage of Median Credit Union Gross Revenue by Credit Union Asset Size, 2006–2009

26
Mean Median
Gro
ss d
ebit
inte
rch
ang
e re
ven
ue
as a
per
cen
tag
e of
net
rev
enu
e
31% 35% 31%
40%32%
63%59%
196%
2006 2007 2008 2009
0%
20%
40%
60%
80%
100%
120%
140%
160%
180%
200%
Figure 21: Gross Debit Interchange Revenue as Percentage of Credit Union Net Revenue, 2006–2009
Mean Median
Gro
ss c
red
it in
terc
han
ge
reve
nu
e
as a
per
cen
tag
e of
net
rev
enu
e
17% 16% 16% 17%
22%
15%
75%
29%
2006 2007 2008 2009
0%
10%
20%
30%
40%
50%
60%
70%
80%
Figure 22: Gross Credit Card Interchange Revenue as Percentage of Credit Union Net Revenue, 2006–2009

27
nature of associating costs such as overhead or cost of funds with
particular programs or accounts, the Filene survey did not collect
information on debit or credit program costs other than fraud and
charge- off data.
Fraud CostsThe Filene Interchange Survey asked credit unions about their fraud
losses on payment card transactions. These data do not provide a
means of gauging what fraud prevention adjustments to “reasonable
and proportional to cost” debit interchange rates would be. There is
an efficient level of fraud that is likely greater than zero, as at some
point the marginal cost of reducing fraud starts to outweigh the
marginal benefit. The data reported, then, let us see something close
to the marginal cost of fraud prevention. While knowing actual fraud
costs helps determine what the marginal cost of fraud prevention is,
it is not informative about the total costs of fraud prevention, as mar-
ginal costs do not account for fixed costs. Moreover, fraud prevention
costs need to be considered not just in light of past fraud rates but
also in terms of anticipated fraud rates. Current fraud rates might be
low, but without investment in technology upgrades, future fraud
rates could easily rise. Further, fraud prevention is often a matter of
relative security; it is impossible for a system to be completely fraud
proof, but an issuer that presents a more formidable target is likely
to divert fraud toward other issuers. Accordingly, fraud prevention
costs also reflect issuers trying not to fall behind in this arms race
and become favored targets for fraud. In any case, it bears emphasis
that it is not clear whether the Fed will set a one-size-fits- all cost-
of-fraud-prevention adjustment to its determination of “reasonable
and proportional to cost” or whether issuers will be able to apply for
individualized variances from a baseline adjustment (which could be
zero).
Figures 23 and 24 show interchange per transaction and fraud losses
per transaction over time for debit and credit, respectively.55 For
debit, fraud losses tend to run about $0.01 per transaction, while
interchange revenue ranges from $0.30 to $0.35 per transaction.
For credit, fraud losses range from $0.04 to $0.07 per transaction,
while interchange revenue has been between $0.89 and $1.07 per
transaction.

28
Mean Median
Debit interchange per transaction Debit fraud per transaction
$0.00
$0.05
$0.10
$0.15
$0.20
$0.25
$0.30
$0.35
$0.40
2006
$0.3
68
$0.3
18
$0.3
20 $0.3
45
$0.2
92$0
.321
$0.3
03$0
.304
$0.0
12
$0.0
10
$0.0
11
$0.0
10
$0.0
10
$0.0
08
$0.0
12
$0.0
16
2007 2008 2009 2006 2007 2008 2009
Figure 23: Debit Interchange Revenue and Debit Fraud Losses per Transaction, 2006–2009
Mean Median
Credit card interchange per transaction Credit card fraud per transaction
$0.00
$0.20
$0.40
$0.60
$0.80
$1.00
$1.20
2006
$1.0
681
$0.9
474
$1.0
079
$0.8
900
$0.9
488
$0.8
989
$1.0
353
$0.9
265
$0.0
393
$0.0
477
$0.0
415
$0.0
644
$0.0
523
$0.0
629
$0.0
438
$0.0
507
2007 2008 2009 2006 2007 2008 2009
Figure 24: Credit Card Interchange Revenue and Credit Card Fraud Losses per Transaction, 2006–2009

29
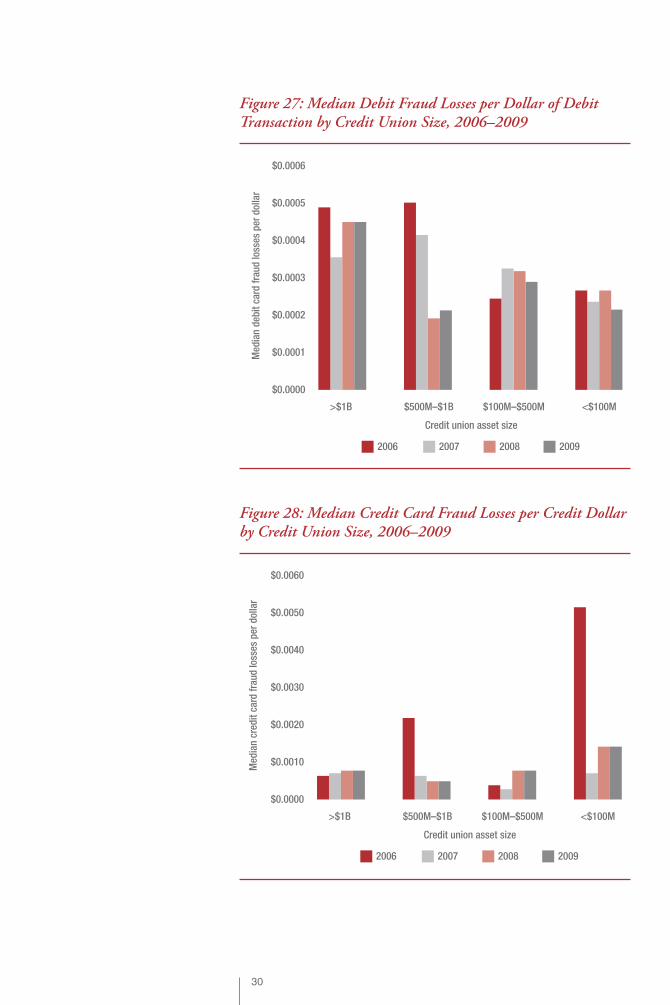
Figures 25–28 illustrate fraud losses by institution size on a per
transaction and per dollar basis. On both a per transaction and a
per dollar basis, the fraud losses on debit, but not credit, are higher
2006 2008 20092007
$0.0000
$0.0020
Deb
it f
rau
d lo
sses
per
tra
nsa
ctio
n
$0.0040
$0.0060
$0.0080
$0.0100
$0.0120
$0.0140
$0.0160
$0.0180
$0.0200
>$1B $500M–$1B
Credit union asset size
$100M–$500M <$100M
Figure 25: Median Debit Fraud Losses per Debit Transaction by Credit Union Size, 2006–2009
2006 2008 20092007
$0.0000
$0.0500
Med
ian
deb
it c
ard
fra
ud
loss
es p
er d
olla
r
$0.1000
$0.1500
$0.2000
$0.2500
$0.3000
$0.3500
$0.4000
>$1B $500M–$1B
Credit union asset size
$100M–$500M <$100M
Figure 26: Median Credit Card Fraud Losses per Transaction by Credit Union Size, 2006–2009
30
2006 2008 20092007
$0.0000
$0.0001Med
ian
deb
it c
ard
fra
ud
loss
es p
er d
olla
r
$0.0002
$0.0003
$0.0004
$0.0005
$0.0006
>$1B $500M–$1B
Credit union asset size
$100M–$500M <$100M
Figure 27: Median Debit Fraud Losses per Dollar of Debit Transaction by Credit Union Size, 2006–2009
2006 2008 20092007
$0.0000
$0.0010
Med
ian
cre
dit
car
d f
rau
d lo
sses
per
dol
lar
$0.0020
$0.0030
$0.0040
$0.0050
$0.0060
>$1B $500M–$1B
Credit union asset size
$100M–$500M <$100M
Figure 28: Median Credit Card Fraud Losses per Credit Dollar by Credit Union Size, 2006–2009

31
for larger credit unions. The reason for this is not clear; it might be
a function of larger credit unions presenting more targets for third-
party fraud, or it could relate to looser associative connections in
larger credit unions presenting less of an inhibition to first- party
fraud. In Figures 26 and 28, the unusual spike in 2006 for small
credit unions should be discounted as an anomaly resulting from a
single institution’s fraud losses, as there were a very small number of
respondents (5) in this category.


Although the Durbin Amendment will likely reduce interchange fees, it is not yet determined whether it will reduce interchange rates or will ultimately affect the viability of some of the less profitable small or medium- sized credit unions.
CHAPTER 4Impact of the Durbin Amendment

34
The Durbin Amendment is likely to reduce both debit and credit
card interchange fees. It is not clear, yet, how much of a reduction
there will be in debit interchange rates as a result of the amendment.
Speculation has varied wildly. But there is reason to believe that fees
will drop at least to something in the range of 20–40 basis points
(bps), based on the EU’s settlement with MasterCard and Visa for
cross- border transaction credit interchange and Australia’s regulation
of credit interchange. If so, it will represent a steep decline in debit
interchange fees, which often range from 75 to 125 bps plus a flat fee
component.56 A 50% or greater decline in debit interchange rev-
enue is well within the range of possible outcomes from the Durbin
Amendment.57
Some bank issuers, like Bank of America, estimate that they will
incur a 60%–80% reduction in debit interchange revenue.58 Like-
wise, Fifth Third Bank reports that its average debit interchange was
101 bps on signature debit and
57 bps on PIN debit, translating
to $0.36 revenue per signa-
ture transaction versus $0.23
per PIN transaction. Because
issuers’ costs are unlikely to be
noticeably different between signature and PIN debit, this suggests
that the “reasonable and proportional to cost” would force at least a
36%–44% reduction in signature debit rates, to where they match
PIN rates, but also probably a further reduction, to the extent that
PIN debit rates are higher than the “reasonable and proportional to
cost” standard. Issuers with large signature- debit portfolios are likely,
therefore, to see much greater revenue reductions than PIN- debit
issuers.
While most of the Durbin Amendment focuses on debit cards (only
the discounting and minimum/maximum amount provisions apply
to credit cards), it is likely to have a significant impact on credit
card interchange. Debit interchange is already lower than credit card
interchange, and the Durbin Amendment will further lower debit
Issuers with large signature-debit portfolios are likely to see
much greater revenue reductions than PIN-debit issuers.

35
interchange fees. The reasonable and proportional to actual cost
provision will reduce fees significantly, particularly for signature debit
and Interlink, the largest (and highest- priced) PIN debit network.
The multi- homing provision will further force down fees because it
will make the networks compete for transaction routing by offer-
ing merchants the lowest prices. The small issuer (<$10B net assets)
exemption does not apply to the multi- homing requirement. This
will make debit transactions even more preferable for merchants,
who now have the ability to steer transactions toward debit via dis-
counts and in- kind incentives. The effect will be to create downward
pressure on credit card interchange, at least for those transactions
where credit competes with debit.
Credit and debit do not compete for all transactions; debit is seldom
used for Internet and large- ticket items. For smaller- ticket items
(under $200 and especially under $40), credit and debit compete
directly, and lower debit inter-
change fees plus merchants’
ability to steer transactions will
likely result in a significant
reduction of credit card inter-
change for smaller transactions.
The credit card networks are
likely to develop interchange fee
schedules that vary based on transaction value, with interchange fees
on large- ticket transactions possibly increasing to offset lost revenue
from small- ticket transactions; nothing in the Durbin Amendment
directly regulates networks’ ability to set credit interchange fees,
although the provision authorizing the Fed to regulate network fees
in order to prevent circumvention of debit interchange could con-
ceivably be interpreted as granting the Fed authority to address credit
interchange.
A steep reduction in debit and credit interchange income will eat
heavily into financial institutions’ bottom line. As Figures 18 and
19 show, combined debit and credit interchange income repre-
sents somewhere in the range of 5.5%—7.5% of credit union gross
revenue. It bears emphasis that the Durbin Amendment will not
eliminate all interchange income. Even if the Fed were to mandate
zero interchange on debit, credit interchange would not be elimi-
nated, even if it were reduced. Thus, we might posit a moderate
scenario and a severe scenario. In the moderate scenario, there is a
50% reduction in debit interchange income and a 10% reduction in
credit interchange income. This would result, before revenue mitiga-
tion, in a 2.15%–2.75% reduction in gross credit union revenue. In
the severe scenario, there is an 80% reduction in debit interchange
income and a 25% reduction in credit interchange income, resulting
The combined effect of the Durbin Amendment, the Credit
CARD Act, and overdraft regulation is likely to place consider-
able stress on depositories’ consumer financial services business
model.

36
in a 3.575%–4.625% premitigation reduction in gross credit union
revenue.
In addition to reduced interchange income, there might also be addi-
tional costs from implementing security standards to comply with
the Fed’s rule- making. While the Fed’s rule- making does not have the
authority to mandate security standards itself, only to provide for an
adjustment in what interchange fees are “reasonable and proportional
to cost,” the card networks or the Payment Card Industry (PCI)
Security Council might require issuers to implement the standards
necessary for an adjustment in order to ensure systemwide confor-
mity and avoid having to individualize interchange fees on the basis
of issuer security measures. One possibility is that the entire payment
card industry (debit and credit) will move to chip-and- PIN cards.
This will necessitate reissuance of existing cards, which will entail
expenses for issuers, even if the reissuance is phased in over time,
as chip-and- PIN cards are currently more expensive than regular
magnetic- strip cards.
The inevitable reduction in interchange income from the Durbin
Amendment will come on top of the Credit CARD Act and debit
overdraft regulation, which are likely to reduce payment card rev-
enue, and an economic downturn that has increased credit risk and
reduced consumer spending. The combined effect of these changes is
likely to place considerable stress on depositories’ consumer financial
services business model.
The cornerstone of most depositories’ consumer financial services
business model is the deposit account. The standard depository
relationship involves providing
the consumer with a bundle
of products: transaction and
savings accounts, transaction
instruments (checks and pay-
ment cards), rewards points,
lines of credit (credit card
and overdraft), and balance
transfer privileges. This system is very good at attracting low- cost
funding via deposits, but for it to work economically, it requires
that the revenue- generating parts of the bundle—interchange
and overdraft—subsidize the other parts of the bundle. Thus, the
cost of maintaining free checking accounts is subsidized by debit
interchange fee revenue. Some estimates place debit interchange at
between 10% and 30% of revenue from checking accounts for credit
unions and community banks.59
The free checking account is generally attributed as a credit union
innovation. Most survey respondents (81%) offer truly free checking;
Credit unions can ill afford to scare away funding, and to the
extent that commercial banks respond to the Durbin Amend-
ment by raising fees on checking accounts, it will only make
credit unions more attractive to consumers.

37
14% waive fees if a minimum balance or number of transactions
is maintained. This contrasts notably to major commercial banks,
where relatively few checking accounts are completely free, regardless
of transaction volume or minimum balances.
While the Durbin Amendment will reduce credit unions’ debit inter-
change revenue, it is unlikely that free checking will be abandoned, if
only because of credit unions’ heavy reliance on deposits for funding.
Credit unions can ill afford to scare away funding, and to the extent
that commercial banks respond to the Durbin Amendment by rais-
ing fees on checking accounts, it will only make credit unions more
attractive to consumers.
Nonetheless, with revenue- generating components of the deposi-
tory relationship under regulatory pressure, all depositories, not just
credit unions, will need to reexamine their deposit account product
bundling. This might involve unpacking the bundle and charging
a la carte for services, perhaps with the basic savings account being
free but charging for other services. Thus, one possibility for revenue
mitigation is to charge consumers transaction fees. This could be
done on a per transaction basis (potentially with a number of free
transactions per month), on a graded scale based on account balances
or purchases of other services or bundles of service. Alternatively,
members could be charged annual fees for debit cards. Credit unions
should proceed with caution in testing such new business models to
avoid jeopardizing existing member relationships.
The impact on consumers of revised business models will necessar-
ily differ; some consumers may benefit, while others may end up
paying more for their finan-
cial services. Irrespective, one
potential negative impact for
consumers might be to make
depository relationship prod-
ucts harder to compare—each
institution could well offer its
own nonstandard bundling that will frustrate comparison shopping
by consumers. At this point it is not clear whether regulatory reform
will result in a shifting of fee structures or in reduced profitability for
financial institutions or both.
Impact on Credit Unions: Two- Tiered Pricing?As of the end of 2009, only three credit unions—Navy FCU, North
Carolina State Employees Credit Union, and Pentagon FCU—had
over $10B in assets.60 All other credit unions are exempt from the
first part of the Durbin Amendment by virtue of their size. For these
Fortunately for credit unions, it is likely that competitive pres-
sures will encourage networks to adopt separate interchange
schedules for smaller institutions.

38
credit unions, the most critical question is whether debit card net-
works will institute separate interchange schedules for smaller institu-
tions or continue with one-size-fits- all schedules. If the former, credit
unions will not be impacted by the Durbin Amendment nearly as
severely as they would be in the latter. As the amendment does not
directly grant the Fed authority to mandate separate interchange
fee schedules for large and small issuers, the decision to do so will
presumably be each individual network’s.
Fortunately for credit unions, it is likely that competitive pressures
will encourage networks to adopt separate interchange schedules for
smaller institutions. The Durbin Amendment should not affect the
profitability of signing up small issuers for a network; the networks’
own revenue is based on transaction volume, and interchange is
not paid by the network but by the acquirer bank. Networks want
to maximize the number of cards issued on their brand, which
means that they are generally eager to sign up more issuers, unless
that comes at the price of losing large issuers. Networks could also
conceivably have different fees for transactions on large and small
issuers’ cards. If so, small issuers might benefit because if their cards
yielded higher network fees, the networks would be more incentiv-
ized to court them. While this would make small issuers’ debit cards
substantially more expensive than large issuers’, merchants might
still come out ahead because of the heavy concentration of debit card
market share among large issuers (see Figure 29 on page 40).
Large issuers might object to more generous pricing for their smaller
competitors, but their leverage with the networks is limited. They
could threaten to shift their business to networks that have one- tier
pricing, but that would increase the ability of those networks to push
for transaction market share by lowering their one- tier interest rates.
The very largest banks could, in theory, become their own stand-
alone networks (or purchase existing debit networks),61 but these
banks compete primarily with one another and not with smaller
financial institutions, so two- tiered pricing is unlikely to motivate
such a realignment.
It is unlikely, therefore, that networks will adopt single- tier pricing.
Instead, the networks are likely to move to separate pricing for small
issuers because if one network does and the others do not follow,
that network will gain significant market share by aggregating the
business of numerous small issuers. Knowing this, many networks
are likely to institute separate interchange rates for small issuers. In
particular, Visa, the debit network market leader, is unlikely to leave
room for rival MasterCard to expand its debit market share. Under-
standably, however, credit unions will be nervous about what inter-
change pricing under the Durbin Amendment will look like until
they see it.

39
If two- tier pricing is the result of the Durbin Amendment, it will
benefit smaller issuers like credit unions. Payment card issuance (par-
ticularly for credit) has economies of scale. State-of-the- art dynamic
underwriting, fraud detection, rewards programs, national direct-
mail advertising, and processing can all be highly automated, which
involves substantial fixed costs that are feasible only when defrayed
over large account and transaction volumes. Dynamic underwriting
capability and fraud detection are essential for backloaded, behav-
iorally triggered pricing models. Moreover, economies of scale also
benefit issuers in terms of funding and liquidity. Larger depository
issuers have deep pools of low- cost funds in the form of deposits and
are also able to support securitization facilities that provide ongoing
liquidity.
Credit unions are already at a disadvantage when attempting to
compete with large banks and finance companies on business models
that require economies of scale,
and this disadvantage is likely
to become more pronounced.
Many card industry observers
believe that “size will become a
more pronounced advantage for
credit card issuers, and not just
from a branding perspective . . . [but also because of ] large issuers’
sophisticated systems for determining creditworthiness and more-
efficient back-office operations will become crucial in eking out
profit in the increasingly constrained credit card industry.”62
The dominance of large institutions in the card issuance market is a
function of the economies of scale in the card business. Card issu-
ance, particularly credit card issuance, is highly concentrated among
a handful of large banks. For credit cards, 10 large bank issuers make
up almost 90% of the market in terms of dollars transacted and
outstandings, with the top 5 alone providing nearly three- quarters of
the total.63 For all debit products combined, the top 10 institutions
have 51% of market share and the top 5 have 43%. Notably, as illus-
trated in Figure 29, card transaction volume does not track deposi-
tory relationships; as of 2009, the top 10 financial institutions had
only 39% of deposits (and 36% of insured deposits). While some
of this discrepancy may be explained by the concentration of large
deposits (including business deposits) at large banks, it is clear that
many consumers use credit cards issued by financial institutions with
which they have no other relationship, and that many credit union
members do not use their credit union account as their primary debit
transaction account.
If a two- tiered interchange structure emerges from the Durbin
Amendment’s implementation, it will help make credit unions
If a two-tiered interchange structure emerges from the Durbin
Amendment’s implementation, it will help make credit unions
more competitive in the card issuance market.

40
more competitive in the card issuance market. While economies
of scale will still favor larger issuers, one critical advantage of large
issuers—the ability to offer what appears to be generous rewards
programs—will be limited. Rewards are funded by interchange, so
reduced interchange income will result in reduced rewards programs
or explicit fees for rewards.64 Reduced rewards programs will make
large issuers’ card offerings less enticing to consumers, who might
then be more receptive to product cross- selling from smaller issuers
like credit unions, with whom they already have relationships, be it
through deposit accounts, auto loans, or mortgages.
Mobile CommerceRegulatory reform will likely encourage payment card networks
to push aggressively into new (and less regulated) markets, such as
mobile commerce.65 Mobile commerce, particularly mobile pay-
ments, enables close integration of payment systems (where the
mobile device substitutes for the card), account management tools,
and merchant coupons, rebates, loyalty programs, and advertis-
ing. In essence, mobile commerce platforms can combine the more
regulated payments and banking space with the less regulated sales
and advertising space, potentially allowing financial institutions to
offset reduced payments income with new income from sales and
advertising- related services and cross- selling opportunities. And
Top 5 Top 10
Purchase volume Deposits
0%
30%
20%
10%
Mar
ket
shar
e, 2
00
9
40%
50%
60%
70%
80%
90%
100%
Credit card
74%
90%
43%
51%
32%
39%37%
45%
Debit Bank holding
companies
Single
depositories
Figure 29: Market Share of Consumer Payments and Deposits
Source: FDIC Statistics on Depositary Institutions, FDIC Summary of Deposits, Nilson Report.

41
because financial institutions have the paramount security concerns
in the mobile space, it gives them greater leverage to control mobile
commerce platforms relative to device and operating system develop-
ers and telecom providers.
Mobile commerce poses competitive challenges for credit unions and
other small card issuers. Successful mobile commerce platforms will
require seamless integration of payments, banking, and sales ser-
vices with mobile devices, operating systems, and telecom networks.
Smaller issuers lack the resources to engage in extensive software
development as well as bargaining power when dealing with device
and operating system manufacturers and telecom carriers. Instead,
credit unions will generally have to look to license customizable
mobile software platforms and piggyback on network- negotiated
deals to gain a foothold in mobile payments transactions. This might
place credit unions and other small issuers at a disadvantage vis-à- vis
larger banks, but it also suggests a new area for credit union coopera-
tion and joint ventures.


The Durbin Amendment will undoubt-edly affect the profitability of current credit unions. Credit unions may have to adjust their bundling of services and prepare for a likely transition to mobile commerce. Overall, the amendment illustrates the challenges credit unions face in relying on fee- based revenue.
CHAPTER 5Conclusion

44
The Durbin Amendment poses numerous challenges for credit
unions. While the ultimate impact of the amendment cannot be
judged before the Fed’s rule- making, it will undoubtedly affect the
profitability of the current credit union business model. While it will
not be the make-or- break measure for most credit unions, it could
ultimately affect the viability of some of the less profitable small or
medium- sized credit unions. Credit unions may find it necessary to
adjust the bundle of services they offer along with deposit accounts,
and there may be ways of mitigating the revenue impact of the
Durbin Amendment. The Durbin Amendment may also make credit
unions more competitive in card issuance by reducing the advantage
of large financial institutions. The Durbin Amendment is also likely
to usher in a quicker transition to mobile commerce, which presents
numerous challenges to credit unions.
Ultimately, though, the Durbin Amendment illustrates t he difficul-
ties that credit unions face from an increasing reliance on fee- based
revenue (see Figure 30) to generate profit and retained earnings. Fee-
based income represents an important component of credit unions’
return on assets (ROA), and retained earnings are a critical method
for credit unions to grow their asset base. Going forward, however,
regulatory scrutiny is likely to be most intense on fees, driven by
an unarticulated theory that if fee income is too high, it is a sign of
market malfunction, as competition should drive down fee levels to
relatively low profit levels, much like the Durbin Amendment’s “rea-
sonable and proportional to cost” requirement aims to do.
Fee-based income results in a redistribution of wealth from one set
of credit union members to another; while credit unions need to
Going forward, regulatory scrutiny is likely to be most intense on fees, driven by an unarticulated
theory that if fee income is too high, it is a sign of market malfunction, as competition should
drive down fee levels to relatively low profit levels, much like the Durbin Amendment’s “reasonable
and proportional to cost” requirement aims to do.

45
be able to cover their operating expenses and to grow to fill their
members’ needs, excessive fee- based income is ultimately inconsistent
with the mutual nature of credit unions. Mutuals should generally
aim to set fee- based income to cover costs, not to serve as profit
centers. Because of an inability to issue equity, mutuals’ ability to
grow is necessarily constrained, but if credit unions uphold their
long tradition of offering fairly
priced, understandable financial
products to their members and
emphasize this distinction from
other financial institutions,
there are significant opportuni-
ties for organic growth driven
by increased membership rather
than fees. The credit union system faces numerous challenges to its
business model from regulatory changes, and not all credit unions
will be strong enough to successfully adapt to the changing market
and regulatory conditions. For more solid credit unions, however,
these changes also present an opportunity to refocus and reinvigorate
credit unions’ traditional core strengths.
Fee income Other incomeGross spread
0%
10%
20%
30%
Sh
are
of c
red
it u
nio
n in
com
e
40%
50%
60%
70%
80%
90%
100%
1990
1989
1991
1992
1993
1994
1995
1996
1997
1998
1999
2000
2001
2002
2003
2004
2005
2006
2007
2008
2009
Figure 30: Sources of Credit Union Income
Source: CUNA, Credit Union Year-End Survey, 2009, 21.
While the Durbin Amendment will not be the make-or-break
measure for most credit unions, it could ultimately affect the
viability of some of the less profitable small or medium-sized
credit unions.

47
1. Pub. L. 111- 203.
2. Dodd-Frank Act, § 920, codified at 15 U.S.C. 1693r.
3. See Terri Bradford, Developments in Interchange Fees in the
United States and Abroad, Payment Systems Research Briefing,
Federal Reserve Bank of Kansas City, April 2008.
4. See, e.g., “Interchange Deal Pushes Credit Unions into a Cor-
ner,” Credit Union Journal, June 22, 2010.
5. In the case of American Express and Discover, the financial
institutions and the network are often the same firm.
6. Michele Samaad, “Hidden Card Swipe Fees May Cripple
Businesses,” Credit Union Times, February 24, 2010 ($48B in
2008); Government Accountability Office, Rising Interchange
Fees Have Increased Costs for Merchants, but Options for Reducing
Fees Pose Challenges, GAO-10- 45 (November 2009), 13 ($45B
in 2007).
7. Kate Fitzgerald, “Debit Interchange Measures May Cost Banks
More Than $5B,” American Banker, June 28, 2010.
8. This estimate is based on an application of the average credit
card interchange fee rate, roughly 1.85% to the total dol-
lar amount of credit card transactions in 2009 of the 100
largest issuers of $1.662 trillion. See Nilson Report, Issue
948 (May 2010). This figure concurs with the credit card
interchange income figure provided by Payments Source of
$31,721,694,000 for 2009 (Payments Source, Bank Card and
Credit Card Interchange Fees, www.paymentsource.com).
9. See supra note 6.
10. See, e.g., Scott Schuh et al., Who Gains and Who Loses from
Credit Card Payments? Theory and Calibrations, Federal Reserve
Bank of Boston Public Policy Discussion Paper No. 10-3
(2010); Efraim Berkovich, Trickle- Up Wealth Transfer: Cross-
Subsidization in the Payment Card Market, The Hispanic
Institute, November 2009; Adam J. Levitin, Priceless? The
Competitive Costs of Credit Card Merchant Restraints, 55 UCLA
L. Rev. 1321 (2008) [hereinafter Levitin, Economic Costs];
Adam J. Levitin, Priceless? The Social Costs of Credit Card Mer-
chant Restraints, 45 Harv. J. on Legis. 1 (2008). But see Steve
Semararo, The Reverse-Robin-Hood-Cross- Subsidy Hypothesis: Do
Credit Card Systems Effectively Tax the Poor to Reward the Rich?,
40 Rutgers L.J. 419 (2009).
11. See, e.g., Todd J. Zywicki, The Economics of Payment Card
Interchange Fees and the Limits of Regulation, Int’l Center for L.
& Econ. Fin. Reg. Program White Paper Series, June 2, 2010;
Endnotes

48
Timothy Muris, Payment Card Regulation and the (Mis)Applica-
tion of the Economics of Two- Sided Markets, 4 Colum. Bus. L.
Rev. 515 (2005). Interchange fee structures vary significantly
among electronic payment systems globally; not every system
has interchange fees, and some systems involve interchange
flowing from card issuers to merchants’ banks, as was the case
with debit cards in the United States into the 1990s.
12. Levitin, Economic Costs, supra note 10.
13. Adam J. Levitin, “A Christmas Present for Consumers,” Detroit
Free Press, November 28, 2008.
14. Levitin, Economic Costs, supra note 10.
15. James M. Lyon, The Interchange Fee Debate: Issues and Econom-
ics, The Region, Federal Reserve Bank of Minneapolis, June
2006.
16. Terri Bradford and Fumiko Hayashi, Developments in Inter-
change Fees in the United States and Abroad, Payment System
Research Briefing, Federal Reserve Bank of Kansas City, April
2009.
17. See Letter from Senator Dick Durbin to Camden Fine, presi-
dent and CEO, Independent Community Bankers of America,
and Dan Mica, president and CEO, Credit Union National
Association, May 14, 2010, at durbin.senate.gov/ showRelease.
cfm?releaseId=324990.
18. See, e.g., Mark Jewell, “Law Aims to Restrict Transaction
Charges, but You May Not Benefit,” The Ledger, May 17,
2010, C4; Peter Eichenbaum, “Credit- Card Fees May Be Next
as Lobby ‘Smells Blood,’” Bloomberg Businessweek, May 19,
2010.
19. An unresolved question is whether the Durbin Amendment
applies to ATM transactions.
20. Dodd-Frank Act, § 920(a)(2).
21. Id. § 920(a)(3).
22. Id. § 920(a)(4)(A).
23. Id. § 920(a)(4)(B).
24. Id. §§ 920(a)(5)(A), 920 (a)(5)(ii)(I) (net fraud costs).
25. Id. § 920(a)(5)(ii)(II).
26. Visa also owns Interlink, a PIN debit network in the United
States, while MasterCard owns the Maestro PIN debit network.
27. Id. § 920(a)(5)(B)(ii).
28. Id. § 920(a)(8).
29. Id. § 920(a)(6).
30. Id. § 920(a)(7).

49
31. Id. § 920(b)(1).
32. Id. § 920(b)(1)(A).
33. Id. § 920(b)(1)(B).
34. Id. § 920(b)(2).
35. Cash Discount Act of 1981, codified at 15 U.S.C. § 1666f.
36. See Levitin, Economic Costs, supra note 10.
37. Id.
38. Dodd-Frank Act, § 920(b)(3).
39. Id. § 920(b)(3)(A)(i)(II).
40. Id. § 920(b)(4).
41. 2009 LexisNexis True Cost of Fraud Study.
42. Adam J. Levitin, Private Disordering: Payment Card Network
Fraud Liability Rules, 5 Brooklyn J. Corp. Fin. & Comm. L.
(forthcoming 2010).
43. LexisNexis, supra note 41.
44. Fiserv, Risk Management: Your Performance in a Soaring Fraud
Climate (reporting 2009 fraud losses of 7.5 bps for signature
debit and 1.0 bps for PIN debit, and 2008 fraud losses of
5.2 bps for signature debit and .8 bps for PIN debit).
45. BAI Banking Strategies, World of Choice: Consumer Payment
Preferences, January/February 2009, 18 (reporting that U.S.
Bancorp was charging cardholders in Colorado, Indiana, Ken-
tucky, and Ohio $0.25 for each PIN debit transaction and that
Wells Fargo was charging $1/month to customers who used
PIN debit at least once a month).
46. Id. §§ 920(a)(3)(A), (a)(5)(B), (a)(8)(C).
47. Id. § 920(b)(1)(A)- (B).
48. Id. § 920(a)(9).
49. Andrew Martin, “How Visa, Using Card Fees, Dominates a
Market,” New York Times, January 4, 2010, A1 (reporting 61%
of debit transactions are on signature debit networks).
50. Adam J. Levitin, The Credit C.A.R.D. Act: Opportunities and
Challenges for Credit Unions (Madison, WI: Filene Research
Institute, 2009).
51. Adam J. Levitin, Overdraft Regulation: A Silver Lining in the
Regulatory Clouds? (Madison, WI: Filene Research Institute,
2010).
52. 2010 Bankcard Profitability Survey, Cards & Payments,
May 2010.
53. Levitin, supra note 52.

50
54. See CUNA Credit Union Year- End Report, 2009, 13 (report-
ing higher loans/membership and loans/asset ratios for larger
credit unions).
55. It is not clear whether respondents provided gross or net fraud
loss figures, i.e., whether they netted losses against subsequent
recoveries.
56. ATM & Debit News, September 24, 2009, 8.
57. Kate Fitzgerald, “Debit Interchange Measures May Cost Banks
More Than $5B,” American Banker, June 28, 2010.
58. Bank of America, 2Q10 Earnings Report, 37 (estimating that
premitigation debit interchange will drop from $2.9B to
between $0.6B and $1.1B).
59. Kate Fitzgerald, “Debit Interchange Measures May Cost Banks
More Than $5B,” American Banker, June 28, 2010.
60. National Credit Union Administration.
61. Adam J. Levitin, Payments Wars: The Merchant- Bank Struggle
for Control of Payment Systems, 12 Stan. J. L. Bus. & Fin. 425
(2007).
62. Kate Fitzgerald, “Small Issuers Last Stand?” Cards & Payments,
August 2009, 22.
63. Nilson Reports, Issues 917, 918, 919, author’s calculations.
64. Stephanie Bell, “Reform Law Might Prompt U.S. Bancorp to
Dump Debit Rewards,” Payments Source, July 21, 2010.
65. To the extent that the Durbin Amendment results in PIN debit
becoming a viable Internet payment medium (through either
a software or a hardware solution to PIN security), it stands to
benefit credit unions. Credit cards currently dominate Inter-
net commerce, and credit unions have minimal market share
in credit cards. A viable, secure debit payment option on the
Internet would increase debit’s market share at credit’s expense,
and thereby also increase credit unions’ share of Internet pay-
ments. Thus, the increased transaction volume would mitigate
credit unions’ reduced income from lower interchange fees.

Interchange Regulation:
Implications for Credit Unions
Adam J. LevitinAssociate Professor
Georgetown University Law Center
ideas grow here
PO Box 2998
Madison, WI 53701-2998
Phone (608) 231-8550
PUBLICATION #224 (11/10)
www.filene.org ISBN 978-1-936468-03-4
Related Documents