ATMOSPHERIC AND OCEANIC SCIENCE LETTERS, 2012, VOL. 5, NO. 4, 295−300 Interannual Variability of Sea Surface Temperature in the Northern Indian Ocean Associated with ENSO and IOD WU Yan-Ling 1, 2 , DU Yan 2 , ZHANG Yu-Hong 1, 2 , and ZHENG Xiao-Tong 3 1 Graduate University of Chinese Academy of Sciences, Beijing 100049, China 2 State Key Laboratory of Tropical Oceanography, South China Sea Institute of Oceanology, Chinese Academy of Sciences, Guang- zhou 510301, China 3 Ocean University of China, Qingdao 266100, China Received 27 March 2012; revised 9 May 2012; accepted 28 May 2012; published 16 July 2012 Abstract The Northern Indian Ocean (NIO) sea surface temperature (SST) warming, associated with the El Niño/Southern Oscillations (ENSO) and the Indian Ocean Dipole (IOD) mode, is investigated using the International Comprehensive Ocean-Atmosphere Data Set (ICOADS) monthly data for the period 1979−2010. Statistical analy- ses are used to identify respective contribution from ENSO and IOD. The results indicate that the first NIO SST warming in September−November is associated with an IOD event, while the second NIO SST warming in spring-summer following the mature phase of ENSO is associated with an ENSO event. In the year that IOD co-occurred with ENSO, NIO SST warms twice, rising in the ENSO developing year and decay year. Both short- wave radiation and latent heat flux contribute to the NIO SST variation. The change in shortwave radiation is due to the change in cloudiness. A cloud-SST feedback plays an important role in NIO SST warming. The latent heat flux is related to the change in monsoonal wind. In the first NIO warming, the SST anomaly is mainly due to the change in the latent heat flux. In the second NIO warming, both factors are important. Keywords: El Niño, Indian Ocean Dipole mode, sea surface temperature, interannual variability Citation: Wu, Y.-L., Y. Du, Y.-H. Zhang, et al., 2012: Interannual variability of sea surface temperature in the Northern Indian Ocean associated with ENSO and IOD, Atmos. Oceanic Sci. Lett., 5, 295–300. 1 Introduction The interannual sea surface temperature (SST) vari- ability in the tropical Indian Ocean (IO) is mainly influ- enced by tropical air-sea interactions such as the El Niño/Southern Oscillations (ENSO) and the Indian Ocean Dipole mode (IOD). Previous studies by Klein et al. (1999) and Alexander et al. (2002) indicate that the ENSO influences the IO through atmospheric teleconnections. It causes a basin-wide warming with a one-season lag called the Indian Ocean Basin Mode (IOBM), and it emerges as the first empirical orthogonal function (EOF) mode of tropical IO SST variability (Weare, 1979; Yang et al., 2007; Saji et al., 1999). The second EOF mode of the tropical IO SST is the IOD, which often develops in June Corresponding author: DU Yan, [email protected] and peaks in October (Saji et al., 1999). During IOD events, an east-west dipole pattern in SST anomalies evolves in the tropical IO. The change of SST is found to be closely related to the change in equatorial surface wind, which reverses direction from westerlies to easterlies during the peak phase of positive IOD with negative SST anomalies in the east and positive SST anomalies in the west of the tropical IO. The IOD influences the climate in areas inside and outside the tropical IO (Saji and Yama- gata, 2003a; Annamalai and Murtugudde, 2004; Yamagata et al., 2004; Yu et al., 2005). The Northern Indian Ocean (NIO) warms twice in as- sociation with ENSO, peaking in September-October- November (SON(0)) and June-July-Auguest (JJA(1)), respectively (Du et al., 2009; hereafter, the developing and decay years of ENSO are designated by (0) and (1)). Surface heat flux is the major forcing for both types of warming, including the latent heat flux associated with wind and shortwave radiation flux associated with cloudiness (Klein et al., 1999; Du et al., 2009). Previous studies have revealed that the first warming is due to ENSO-induced changes in the atmospheric circulation, which reduces cloud cover and evaporation (Klein et al., 1999; Alexander et al., 2002). El Niño also induces SST gradients across the equator from early spring in the de- cay year (Wu et al., 2008). Through wind-evaporation- SST (WES) feedback, the SST gradients anchor an anti- symmetrical pattern of surface wind, with northeasterly and southwesterly wind anomalies north and south of the equator, respectively (Xie and Philander, 1994; Kawa- mura et al., 2001). This antisymmetrical wind pattern per- sists through early summer and causes the second warm- ing in the NIO after the onset of the southwest monsoon (Du et al., 2009; Schott et al., 2009). Furthermore, the second NIO warming may influence the Northwest Pa- cific monsoon (Huang and Hu, 2008). In this study, we focus on the two SST warming events in the NIO. Because IOD and El Niño episodes are sig- nificantly correlated, particularly during the IOD mature phase in SON, and because several recent IOD and ENSO events occurred simultaneously, the question of whether IOD influences the NIO warming should be addressed (Saji and Yamagata, 2003b; Meyers et al., 2007). To in- vestigate this question, the two SST warming events are examined using several datasets. The results show that the warming during the years when El Niño occurs with and

Welcome message from author
This document is posted to help you gain knowledge. Please leave a comment to let me know what you think about it! Share it to your friends and learn new things together.
Transcript
ATMOSPHERIC AND OCEANIC SCIENCE LETTERS, 2012, VOL. 5, NO. 4, 295−300
Interannual Variability of Sea Surface Temperature in the Northern Indian Ocean Associated with ENSO and IOD WU Yan-Ling1, 2, DU Yan2, ZHANG Yu-Hong1, 2, and ZHENG Xiao-Tong3 1 Graduate University of Chinese Academy of Sciences, Beijing 100049, China 2 State Key Laboratory of Tropical Oceanography, South China Sea Institute of Oceanology, Chinese Academy of Sciences, Guang-
zhou 510301, China 3 Ocean University of China, Qingdao 266100, China
Received 27 March 2012; revised 9 May 2012; accepted 28 May 2012; published 16 July 2012
Abstract The Northern Indian Ocean (NIO) sea surface temperature (SST) warming, associated with the El Niño/Southern Oscillations (ENSO) and the Indian Ocean Dipole (IOD) mode, is investigated using the International Comprehensive Ocean-Atmosphere Data Set (ICOADS) monthly data for the period 1979−2010. Statistical analy-ses are used to identify respective contribution from ENSO and IOD. The results indicate that the first NIO SST warming in September−November is associated with an IOD event, while the second NIO SST warming in spring-summer following the mature phase of ENSO is associated with an ENSO event. In the year that IOD co-occurred with ENSO, NIO SST warms twice, rising in the ENSO developing year and decay year. Both short-wave radiation and latent heat flux contribute to the NIO SST variation. The change in shortwave radiation is due to the change in cloudiness. A cloud-SST feedback plays an important role in NIO SST warming. The latent heat flux is related to the change in monsoonal wind. In the first NIO warming, the SST anomaly is mainly due to the change in the latent heat flux. In the second NIO warming, both factors are important.
Keywords: El Niño, Indian Ocean Dipole mode, sea surface temperature, interannual variability Citation: Wu, Y.-L., Y. Du, Y.-H. Zhang, et al., 2012: Interannual variability of sea surface temperature in the Northern Indian Ocean associated with ENSO and IOD, Atmos. Oceanic Sci. Lett., 5, 295–300.
1 Introduction The interannual sea surface temperature (SST) vari-
ability in the tropical Indian Ocean (IO) is mainly influ-enced by tropical air-sea interactions such as the El Niño/Southern Oscillations (ENSO) and the Indian Ocean Dipole mode (IOD). Previous studies by Klein et al. (1999) and Alexander et al. (2002) indicate that the ENSO influences the IO through atmospheric teleconnections. It causes a basin-wide warming with a one-season lag called the Indian Ocean Basin Mode (IOBM), and it emerges as the first empirical orthogonal function (EOF) mode of tropical IO SST variability (Weare, 1979; Yang et al., 2007; Saji et al., 1999). The second EOF mode of the tropical IO SST is the IOD, which often develops in June
Corresponding author: DU Yan, [email protected]
and peaks in October (Saji et al., 1999). During IOD events, an east-west dipole pattern in SST anomalies evolves in the tropical IO. The change of SST is found to be closely related to the change in equatorial surface wind, which reverses direction from westerlies to easterlies during the peak phase of positive IOD with negative SST anomalies in the east and positive SST anomalies in the west of the tropical IO. The IOD influences the climate in areas inside and outside the tropical IO (Saji and Yama-gata, 2003a; Annamalai and Murtugudde, 2004; Yamagata et al., 2004; Yu et al., 2005).
The Northern Indian Ocean (NIO) warms twice in as-sociation with ENSO, peaking in September-October- November (SON(0)) and June-July-Auguest (JJA(1)), respectively (Du et al., 2009; hereafter, the developing and decay years of ENSO are designated by (0) and (1)). Surface heat flux is the major forcing for both types of warming, including the latent heat flux associated with wind and shortwave radiation flux associated with cloudiness (Klein et al., 1999; Du et al., 2009). Previous studies have revealed that the first warming is due to ENSO-induced changes in the atmospheric circulation, which reduces cloud cover and evaporation (Klein et al., 1999; Alexander et al., 2002). El Niño also induces SST gradients across the equator from early spring in the de-cay year (Wu et al., 2008). Through wind-evaporation- SST (WES) feedback, the SST gradients anchor an anti-symmetrical pattern of surface wind, with northeasterly and southwesterly wind anomalies north and south of the equator, respectively (Xie and Philander, 1994; Kawa-mura et al., 2001). This antisymmetrical wind pattern per-sists through early summer and causes the second warm-ing in the NIO after the onset of the southwest monsoon (Du et al., 2009; Schott et al., 2009). Furthermore, the second NIO warming may influence the Northwest Pa-cific monsoon (Huang and Hu, 2008).
In this study, we focus on the two SST warming events in the NIO. Because IOD and El Niño episodes are sig-nificantly correlated, particularly during the IOD mature phase in SON, and because several recent IOD and ENSO events occurred simultaneously, the question of whether IOD influences the NIO warming should be addressed (Saji and Yamagata, 2003b; Meyers et al., 2007). To in-vestigate this question, the two SST warming events are examined using several datasets. The results show that the warming during the years when El Niño occurs with and
296 ATMOSPHERIC AND OCEANIC SCIENCE LETTERS VOL. 5
without the IOD are different. The role latent heat flux and shortwave radiation flux play in NIO warming is dis-cussed in the last section of this paper.
2 Data and methods Because the influence of El Niño on the tropical Indian
Ocean changed after the abrupt interdecadal climate change in the mid-1970s, the data used in our work are from January 1979 to December 2010 with a monthly resolution (Nitta and Yamada, 1989; Xie et al., 2010). The anomalies of atmospheric fields and SST are derived from version 2.5 of the International Comprehensive Ocean- Atmosphere Data Set (ICOADS 2.5) in evenly spaced 1°×1° bins. Because of the spatial inhomogeneity of the ICOADS data, the Niño 3.4 and IOD indices are com-puted from the Hadley Centre Global Sea Ice and Sea Surface Temperature (HadISST). To confirm the results, we also use surface wind, net latent heat flux, and short-wave heat flux data from the National Centers for Envi-ronmental Prediction-Department of Energy Reanalysis II (NCEP Reanalysis 2) and sea surface temperature data from the National Oceanic and Atmospheric Administra-tion (NOAA) Optimum Interpolation Sea Surface Tem-perature (OISST). For mixed layer heat budget analysis, we use the heat flux from Objectively Analyzed air-sea Fluxes (OAFlux) data and the upper ocean temperature from Simple Ocean Data Assimilation (SODA 2.1.6). The latent heat flux of OAFlux used is from January 1979 to December 2010, while the shortwave radiation flux is from January 1984 to December 2007. The SODA data are used to calculate the mixed layer depth from January 1979 to December 2007. Following Saji et al. (1999), the Dipole Mode Index (DMI) is defined as the SST anomaly differences between the western (10°S–10°N, 50–70°E) and eastern (10°S–0°, 90–110°E) tropical IO (the former minus the latter).
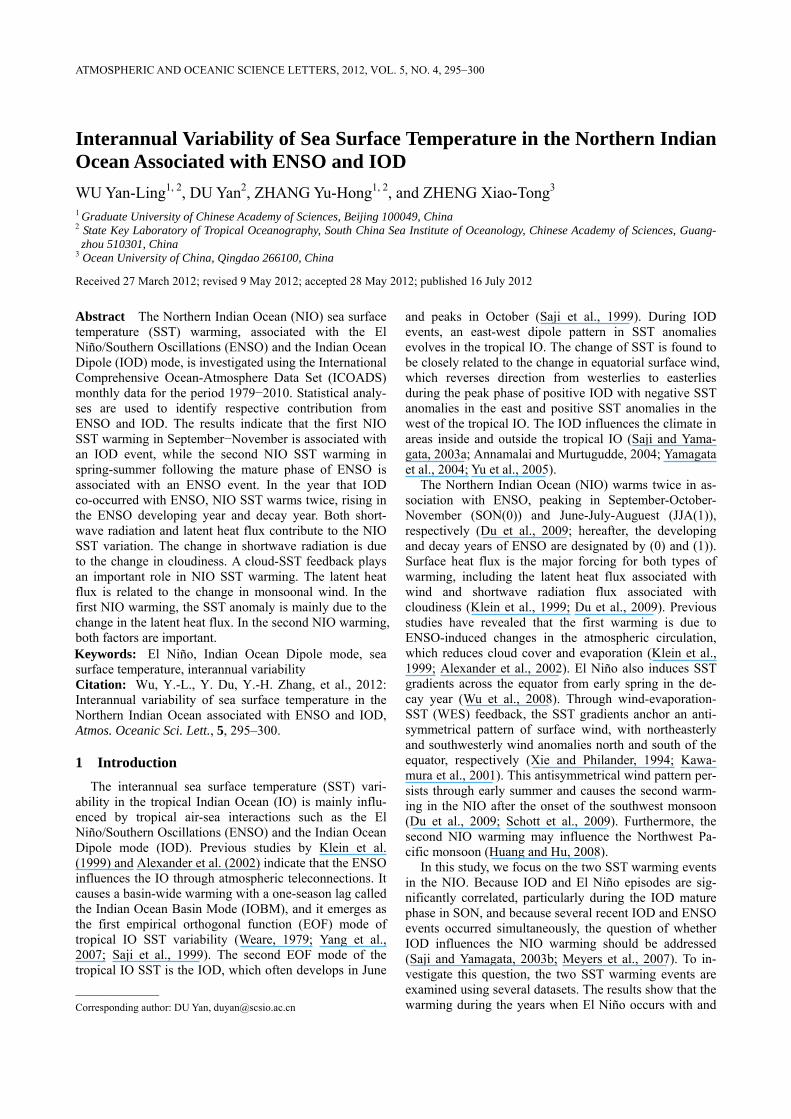
Because the ICOADS is based on conventional meas-urements along ship tracks, we computed the percentage of available observations in the 32 years and selected a line from 51.5°E to 95.5°E in the North Indian Ocean (Fig. 1; Chowdary et al., 2012). Anomalies were computed by subtracting the climatological seasonal cycle from the data. Additionally, the interseasonal and interdecadal anomalies are filtered using a 4- to 84-month band filter. All analyses are performed using filtered data.
The changes of latent heat flux can be influenced by atmospheric variability, such as wind speed and SST. The atmospheric forcing component of latent heat flux (AtF) can be regarded as an active forcing term. Therefore, a decomposition method in de Szoeke et al. (2007) and Du et al. (2009) is used to decompose latent heat flux before analysis. Hereafter, a positive heat flux contributes to SST warming, and a negative value contributes to SST cool-ing.
In addition to a linear correlation and a composite technique, a partial correlation is used to document the respective impacts of IOD and ENSO in our work. The definition of the partial correlation is as follows:
1,2 1 2 2
2 212 12( ) (1 )(1 )y y y yr r r r r r= − ⋅ − − , (1)
where 1yr is the linear correlation of the dependent vari-
able, y, and the Niño3.4 index; 2yr is the correlation
between y and DMI; r12 is the correlation between the Niño3.4 index and DMI; and
1,2yr is the correlation be-
tween y from which the IOD effect has been partialled and the Niño3.4 index from which the IOD effect has been partialled. This method has been successfully used to investigate the respective contributions from ENSO and IOD to ocean and atmospheric variations in the tropical southwestern Indian Ocean (Yamagate et al., 2004; Yu et al., 2005).
3 Results 3.1 Impacts of ENSO and IOD
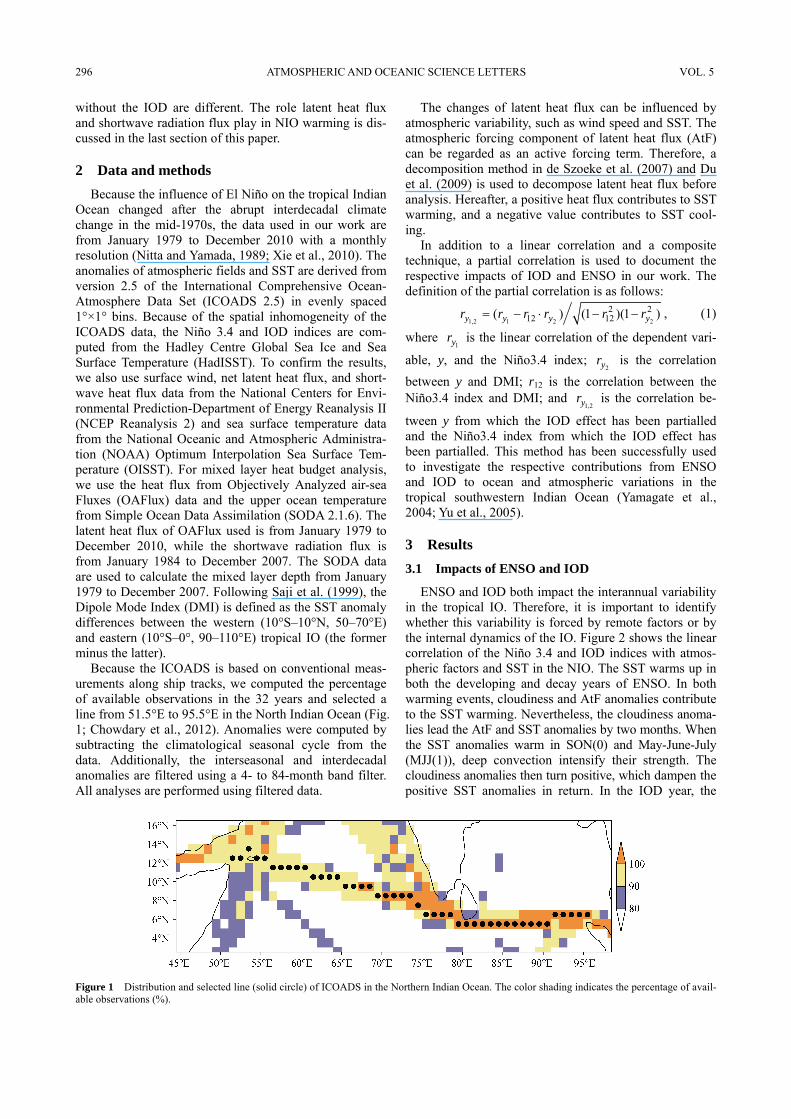
ENSO and IOD both impact the interannual variability in the tropical IO. Therefore, it is important to identify whether this variability is forced by remote factors or by the internal dynamics of the IO. Figure 2 shows the linear correlation of the Niño 3.4 and IOD indices with atmos-pheric factors and SST in the NIO. The SST warms up in both the developing and decay years of ENSO. In both warming events, cloudiness and AtF anomalies contribute to the SST warming. Nevertheless, the cloudiness anoma-lies lead the AtF and SST anomalies by two months. When the SST anomalies warm in SON(0) and May-June-July (MJJ(1)), deep convection intensify their strength. The cloudiness anomalies then turn positive, which dampen the positive SST anomalies in return. In the IOD year, the
Figure 1 Distribution and selected line (solid circle) of ICOADS in the Northern Indian Ocean. The color shading indicates the percentage of avail-able observations (%).
NO. 4 WU ET AL.: NIO SST ASSOCIATED WITH ENSO AND IOD 297
Figure 2 Correlation of the Niño3.4 NDJ(0) index with atmospheric factors: (a) SSTA (shading), AtF (contour), and wind velocity anomaly (vector, values less than 0.2 are masked out); (b) SSTA (shading) and cloudiness anomaly (contour). (c) and (d) are the same as (a) and (b), but for the correla-tion of the IOD SON(0) index with atmospheric factors. AtF stands for the atmospheric forcing component of latent heat flux.
SST warms up from September to November. The nega-tive cloudiness anomalies lead by approximately two months from July to September. The question then arises: for the NIO warming in SON, which mode is more im-portant, ENSO or IOD?
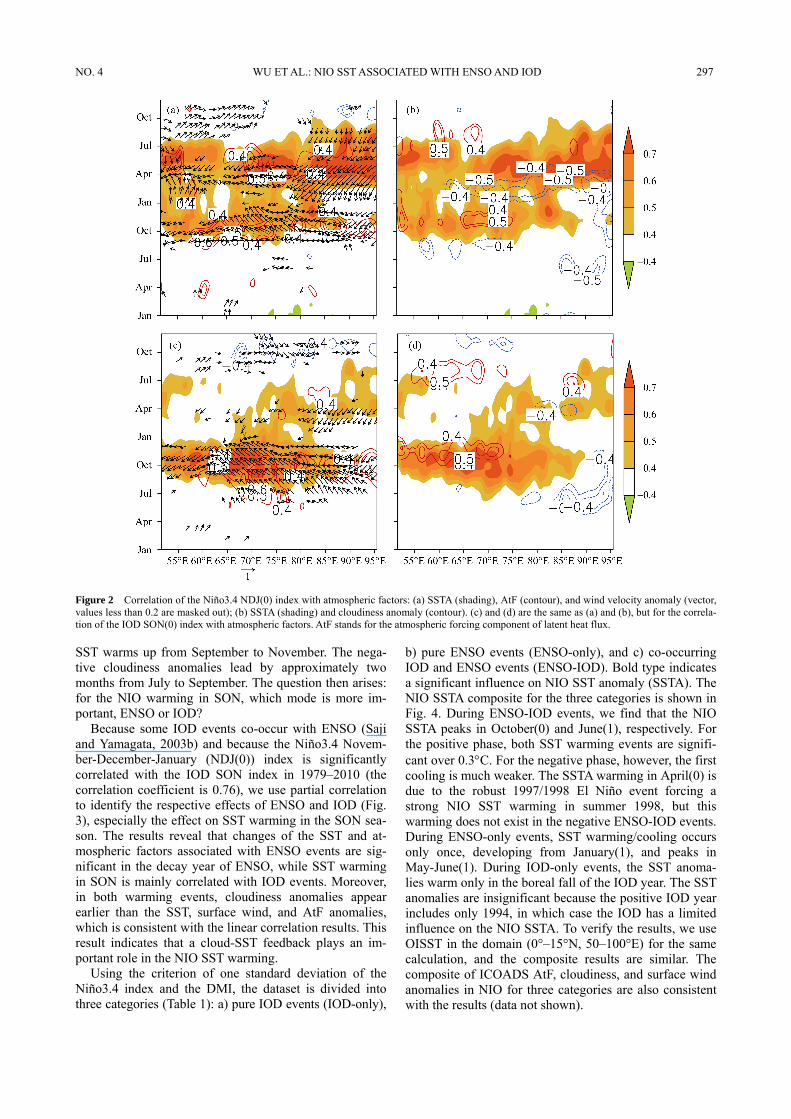
Because some IOD events co-occur with ENSO (Saji and Yamagata, 2003b) and because the Niño3.4 Novem-ber-December-January (NDJ(0)) index is significantly correlated with the IOD SON index in 1979–2010 (the correlation coefficient is 0.76), we use partial correlation to identify the respective effects of ENSO and IOD (Fig. 3), especially the effect on SST warming in the SON sea-son. The results reveal that changes of the SST and at-mospheric factors associated with ENSO events are sig-nificant in the decay year of ENSO, while SST warming in SON is mainly correlated with IOD events. Moreover, in both warming events, cloudiness anomalies appear earlier than the SST, surface wind, and AtF anomalies, which is consistent with the linear correlation results. This result indicates that a cloud-SST feedback plays an im-portant role in the NIO SST warming.
Using the criterion of one standard deviation of the Niño3.4 index and the DMI, the dataset is divided into three categories (Table 1): a) pure IOD events (IOD-only),
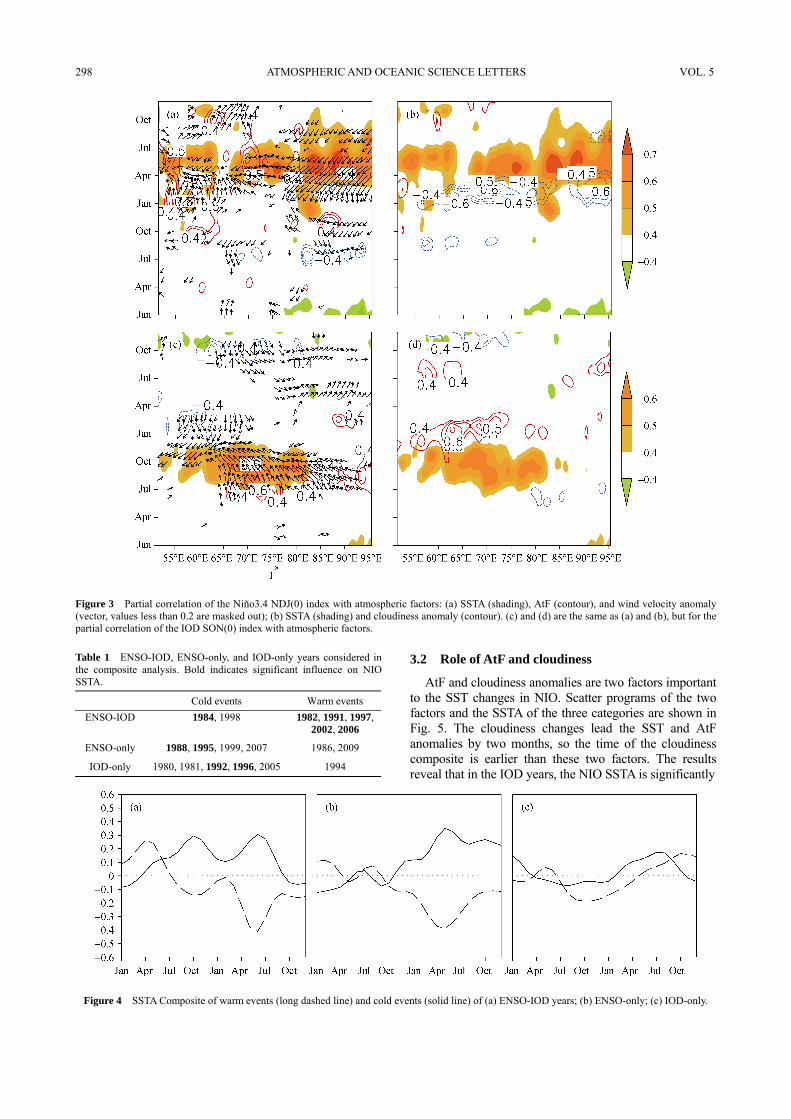
b) pure ENSO events (ENSO-only), and c) co-occurring IOD and ENSO events (ENSO-IOD). Bold type indicates a significant influence on NIO SST anomaly (SSTA). The NIO SSTA composite for the three categories is shown in Fig. 4. During ENSO-IOD events, we find that the NIO SSTA peaks in October(0) and June(1), respectively. For the positive phase, both SST warming events are signifi-cant over 0.3°C. For the negative phase, however, the first cooling is much weaker. The SSTA warming in April(0) is due to the robust 1997/1998 El Niño event forcing a strong NIO SST warming in summer 1998, but this warming does not exist in the negative ENSO-IOD events. During ENSO-only events, SST warming/cooling occurs only once, developing from January(1), and peaks in May-June(1). During IOD-only events, the SST anoma-lies warm only in the boreal fall of the IOD year. The SST anomalies are insignificant because the positive IOD year includes only 1994, in which case the IOD has a limited influence on the NIO SSTA. To verify the results, we use OISST in the domain (0°–15°N, 50–100°E) for the same calculation, and the composite results are similar. The composite of ICOADS AtF, cloudiness, and surface wind anomalies in NIO for three categories are also consistent with the results (data not shown).
298 ATMOSPHERIC AND OCEANIC SCIENCE LETTERS VOL. 5
Figure 3 Partial correlation of the Niño3.4 NDJ(0) index with atmospheric factors: (a) SSTA (shading), AtF (contour), and wind velocity anomaly (vector, values less than 0.2 are masked out); (b) SSTA (shading) and cloudiness anomaly (contour). (c) and (d) are the same as (a) and (b), but for the partial correlation of the IOD SON(0) index with atmospheric factors. Table 1 ENSO-IOD, ENSO-only, and IOD-only years considered in the composite analysis. Bold indicates significant influence on NIO SSTA.
Cold events Warm events ENSO-IOD 1984, 1998 1982, 1991, 1997,
2002, 2006
ENSO-only 1988, 1995, 1999, 2007 1986, 2009
IOD-only 1980, 1981, 1992, 1996, 2005 1994
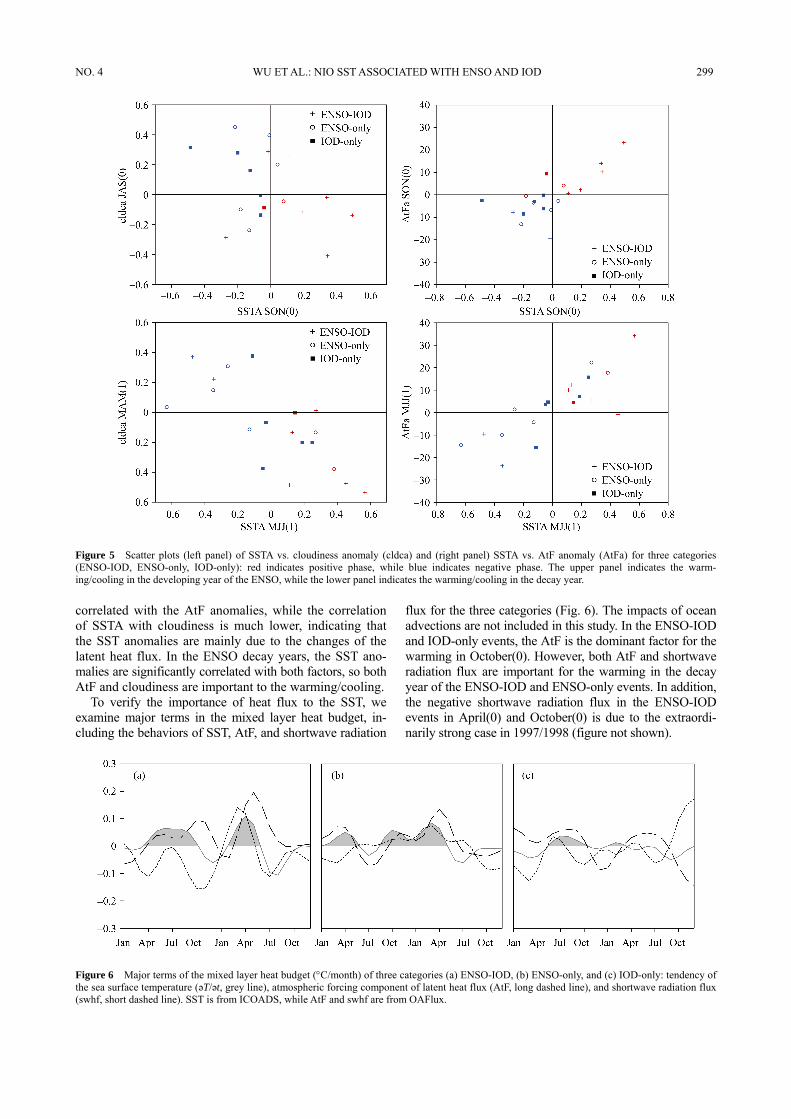
3.2 Role of AtF and cloudiness
AtF and cloudiness anomalies are two factors important to the SST changes in NIO. Scatter programs of the two factors and the SSTA of the three categories are shown in Fig. 5. The cloudiness changes lead the SST and AtF anomalies by two months, so the time of the cloudiness composite is earlier than these two factors. The results reveal that in the IOD years, the NIO SSTA is significantly
Figure 4 SSTA Composite of warm events (long dashed line) and cold events (solid line) of (a) ENSO-IOD years; (b) ENSO-only; (c) IOD-only.
NO. 4 WU ET AL.: NIO SST ASSOCIATED WITH ENSO AND IOD 299
Figure 5 Scatter plots (left panel) of SSTA vs. cloudiness anomaly (cldca) and (right panel) SSTA vs. AtF anomaly (AtFa) for three categories (ENSO-IOD, ENSO-only, IOD-only): red indicates positive phase, while blue indicates negative phase. The upper panel indicates the warm-ing/cooling in the developing year of the ENSO, while the lower panel indicates the warming/cooling in the decay year. correlated with the AtF anomalies, while the correlation of SSTA with cloudiness is much lower, indicating that the SST anomalies are mainly due to the changes of the latent heat flux. In the ENSO decay years, the SST ano-malies are significantly correlated with both factors, so both AtF and cloudiness are important to the warming/cooling.
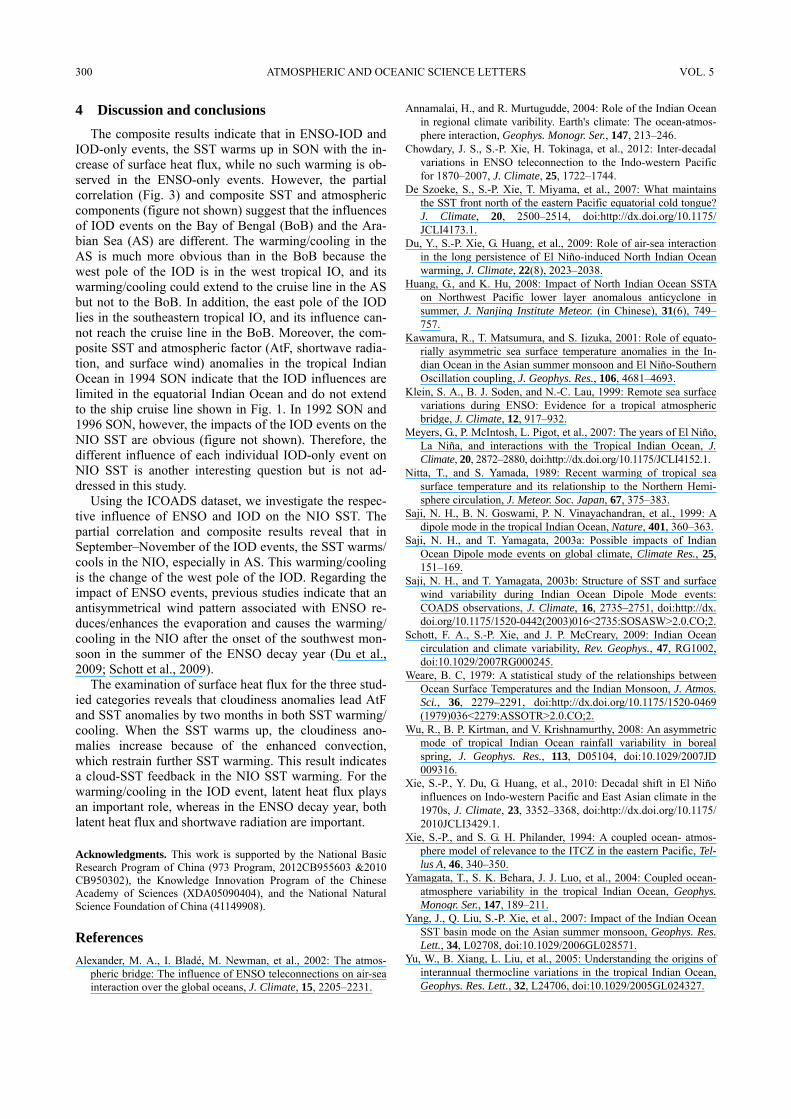
To verify the importance of heat flux to the SST, we examine major terms in the mixed layer heat budget, in-cluding the behaviors of SST, AtF, and shortwave radiation
flux for the three categories (Fig. 6). The impacts of ocean advections are not included in this study. In the ENSO-IOD and IOD-only events, the AtF is the dominant factor for the warming in October(0). However, both AtF and shortwave radiation flux are important for the warming in the decay year of the ENSO-IOD and ENSO-only events. In addition, the negative shortwave radiation flux in the ENSO-IOD events in April(0) and October(0) is due to the extraordi-narily strong case in 1997/1998 (figure not shown).
Figure 6 Major terms of the mixed layer heat budget (°C/month) of three categories (a) ENSO-IOD, (b) ENSO-only, and (c) IOD-only: tendency of the sea surface temperature (əT/ət, grey line), atmospheric forcing component of latent heat flux (AtF, long dashed line), and shortwave radiation flux (swhf, short dashed line). SST is from ICOADS, while AtF and swhf are from OAFlux.
300 ATMOSPHERIC AND OCEANIC SCIENCE LETTERS VOL. 5
4 Discussion and conclusions The composite results indicate that in ENSO-IOD and
IOD-only events, the SST warms up in SON with the in-crease of surface heat flux, while no such warming is ob-served in the ENSO-only events. However, the partial correlation (Fig. 3) and composite SST and atmospheric components (figure not shown) suggest that the influences of IOD events on the Bay of Bengal (BoB) and the Ara-bian Sea (AS) are different. The warming/cooling in the AS is much more obvious than in the BoB because the west pole of the IOD is in the west tropical IO, and its warming/cooling could extend to the cruise line in the AS but not to the BoB. In addition, the east pole of the IOD lies in the southeastern tropical IO, and its influence can-not reach the cruise line in the BoB. Moreover, the com-posite SST and atmospheric factor (AtF, shortwave radia-tion, and surface wind) anomalies in the tropical Indian Ocean in 1994 SON indicate that the IOD influences are limited in the equatorial Indian Ocean and do not extend to the ship cruise line shown in Fig. 1. In 1992 SON and 1996 SON, however, the impacts of the IOD events on the NIO SST are obvious (figure not shown). Therefore, the different influence of each individual IOD-only event on NIO SST is another interesting question but is not ad-dressed in this study.
Using the ICOADS dataset, we investigate the respec-tive influence of ENSO and IOD on the NIO SST. The partial correlation and composite results reveal that in September–November of the IOD events, the SST warms/ cools in the NIO, especially in AS. This warming/cooling is the change of the west pole of the IOD. Regarding the impact of ENSO events, previous studies indicate that an antisymmetrical wind pattern associated with ENSO re-duces/enhances the evaporation and causes the warming/ cooling in the NIO after the onset of the southwest mon-soon in the summer of the ENSO decay year (Du et al., 2009; Schott et al., 2009).
The examination of surface heat flux for the three stud- ied categories reveals that cloudiness anomalies lead AtF and SST anomalies by two months in both SST warming/ cooling. When the SST warms up, the cloudiness ano- malies increase because of the enhanced convection, which restrain further SST warming. This result indicates a cloud-SST feedback in the NIO SST warming. For the warming/cooling in the IOD event, latent heat flux plays an important role, whereas in the ENSO decay year, both latent heat flux and shortwave radiation are important. Acknowledgments. This work is supported by the National Basic Research Program of China (973 Program, 2012CB955603 &2010 CB950302), the Knowledge Innovation Program of the Chinese Academy of Sciences (XDA05090404), and the National Natural Science Foundation of China (41149908).
References Alexander, M. A., I. Bladé, M. Newman, et al., 2002: The atmos-
pheric bridge: The influence of ENSO teleconnections on air-sea interaction over the global oceans, J. Climate, 15, 2205–2231.
Annamalai, H., and R. Murtugudde, 2004: Role of the Indian Ocean in regional climate varibility. Earth's climate: The ocean-atmos- phere interaction, Geophys. Monogr. Ser., 147, 213–246.
Chowdary, J. S., S.-P. Xie, H. Tokinaga, et al., 2012: Inter-decadal variations in ENSO teleconnection to the Indo-western Pacific for 1870–2007, J. Climate, 25, 1722–1744.
De Szoeke, S., S.-P. Xie, T. Miyama, et al., 2007: What maintains the SST front north of the eastern Pacific equatorial cold tongue? J. Climate, 20, 2500–2514, doi:http://dx.doi.org/10.1175/ JCLI4173.1.
Du, Y., S.-P. Xie, G. Huang, et al., 2009: Role of air-sea interaction in the long persistence of El Niño-induced North Indian Ocean warming, J. Climate, 22(8), 2023–2038.
Huang, G., and K. Hu, 2008: Impact of North Indian Ocean SSTA on Northwest Pacific lower layer anomalous anticyclone in summer, J. Nanjing Institute Meteor. (in Chinese), 31(6), 749– 757.
Kawamura, R., T. Matsumura, and S. Iizuka, 2001: Role of equato-rially asymmetric sea surface temperature anomalies in the In-dian Ocean in the Asian summer monsoon and El Niño-Southern Oscillation coupling, J. Geophys. Res., 106, 4681–4693.
Klein, S. A., B. J. Soden, and N.-C. Lau, 1999: Remote sea surface variations during ENSO: Evidence for a tropical atmospheric bridge, J. Climate, 12, 917–932.
Meyers, G., P. McIntosh, L. Pigot, et al., 2007: The years of El Niño, La Niña, and interactions with the Tropical Indian Ocean, J. Climate, 20, 2872–2880, doi:http://dx.doi.org/10.1175/JCLI4152.1.
Nitta, T., and S. Yamada, 1989: Recent warming of tropical sea surface temperature and its relationship to the Northern Hemi-sphere circulation, J. Meteor. Soc. Japan, 67, 375–383.
Saji, N. H., B. N. Goswami, P. N. Vinayachandran, et al., 1999: A dipole mode in the tropical Indian Ocean, Nature, 401, 360–363.
Saji, N. H., and T. Yamagata, 2003a: Possible impacts of Indian Ocean Dipole mode events on global climate, Climate Res., 25, 151–169.
Saji, N. H., and T. Yamagata, 2003b: Structure of SST and surface wind variability during Indian Ocean Dipole Mode events: COADS observations, J. Climate, 16, 2735–2751, doi:http://dx. doi.org/10.1175/1520-0442(2003)016<2735:SOSASW>2.0.CO;2.
Schott, F. A., S.-P. Xie, and J. P. McCreary, 2009: Indian Ocean circulation and climate variability, Rev. Geophys., 47, RG1002, doi:10.1029/2007RG000245.
Weare, B. C, 1979: A statistical study of the relationships between Ocean Surface Temperatures and the Indian Monsoon, J. Atmos. Sci., 36, 2279–2291, doi:http://dx.doi.org/10.1175/1520-0469 (1979)036<2279:ASSOTR>2.0.CO;2.
Wu, R., B. P. Kirtman, and V. Krishnamurthy, 2008: An asymmetric mode of tropical Indian Ocean rainfall variability in boreal spring, J. Geophys. Res., 113, D05104, doi:10.1029/2007JD 009316.
Xie, S.-P., Y. Du, G. Huang, et al., 2010: Decadal shift in El Niño influences on Indo-western Pacific and East Asian climate in the 1970s, J. Climate, 23, 3352–3368, doi:http://dx.doi.org/10.1175/ 2010JCLI3429.1.
Xie, S.-P., and S. G. H. Philander, 1994: A coupled ocean- atmos-phere model of relevance to the ITCZ in the eastern Pacific, Tel-lus A, 46, 340–350.
Yamagata, T., S. K. Behara, J. J. Luo, et al., 2004: Coupled ocean- atmosphere variability in the tropical Indian Ocean, Geophys. Monogr. Ser., 147, 189–211.
Yang, J., Q. Liu, S.-P. Xie, et al., 2007: Impact of the Indian Ocean SST basin mode on the Asian summer monsoon, Geophys. Res. Lett., 34, L02708, doi:10.1029/2006GL028571.
Yu, W., B. Xiang, L. Liu, et al., 2005: Understanding the origins of interannual thermocline variations in the tropical Indian Ocean, Geophys. Res. Lett., 32, L24706, doi:10.1029/2005GL024327.
Related Documents


