Interactive Program Debugging and Optimization for Directive-Based, Efficient GPU Computing Seyong Lee † , Dong Li † , and Jeffrey S. Vetter † ? † Oak Ridge National Laboratory, ? Georgia Institute of Technology {lees2, lid1}@ornl.gov, {vetter}@computer.org Abstract—Directive-based GPU programming models are gaining momentum, since they transparently relieve program- mers from dealing with complexity of low-level GPU pro- gramming, which often reflects the underlying architecture. However, too much abstraction in directive models puts a significant burden on programmers for debugging applications and tuning performance. In this paper, we propose a directive- based, interactive program debugging and optimization system. This system enables intuitive and synergistic interaction among programmers, compilers, and runtimes for more productive and efficient GPU computing. We have designed and im- plemented a series of prototype tools within our new open source compiler framework, called Open Accelerator Research Compiler (OpenARC); OpenARC supports the full feature set of OpenACC V1.0. Our evaluation on twelve OpenACC benchmarks demonstrates that our prototype debugging and optimization system can detect a variety of translation errors. Additionally, the optimization provided by our prototype min- imizes memory transfers, when compared to a fully manual memory management scheme. Keywords-interactive debugging; performance optimization; directive programming; GPU; OpenACC; OpenARC I. I NTRODUCTION GPU computing is now a mainstream computing scheme in high performance computing (e.g., Titan [1], TSUB- AME2 [2], Tiahne-1A [3], and Keeneland [4]). GPU-like architectures have been highlighted as possible building blocks for future Exascale systems [5]. A key factor driving the popularity of GPUs is their capability to deliver cost- effective and energy-effective performance. However, these strengths come at the cost of programmability: programming GPUs requires expertise and can be complicated and error- prone. Recently, several directive-based GPU programming mod- els have been proposed to improve the productivity of GPU computing [6], [7], [8], [9], [10], [11], [12]. To understand these emerging GPU programming models in terms of programmability and performance, our previous work [13] thoroughly investigated them from multiple perspectives, and identified their limitations. Among those limitations, debuggability is one of the most immediate and pressing issues for directive-based GPU programming models. On one hand, these programming models hide multiple stages of complex optimizations and translations from programmers to improve productivity. On the other hand, the opaque nature of these programming models impose great challenges for users to debug and verify the program. For example, these models raise the abstraction of GPU memory hierarchy and provide unified memory management across architectures; this new level of abstraction complicates debugging for memory-related problems. In addition, these models employ a thread/task parallelism model different from the low-level programming models (e.g., CUDA [14]), which complicates debugging for concurrency. Although the GPU community has a number of tools [15], [16], [17], [18], [19] to de- bug, profile, and analyze GPU codes, they are limited to applications written in the low-level programming models. When applied to directive-based programming models, they lack the proper capabilities to attribute specific output GPU translated code, performance, and errors with their respective directive-annotated input programs. Hence, they do not give straightforward views for programmers to diagnose logic errors and performance problems at the directive level. Another significant challenge for directive-based program- ming models is performance optimization, and, in particular, optimizing CPU-GPU data movement. In most of today’s accelerator based systems, the address spaces for GPU and CPU are separate: to communicate data between the two, ap- plications suffer a relatively high penalty from data transfer cost. This cost is especially high in discrete GPUs because of communication cost across the PCI-e bus. Although architectures that fuse GPUs and CPUs into a single chip are gaining in popularity [20], and many examples exist in the consumer market, they still require precise data orchestration and coordination between the CPU and the GPU for efficient performance. Directive-based programming models expose CPU-GPU memory management explicitly to programmers, forcing them to dictate the CPU-GPU data movement and coordination. Hence, minimizing data movement with cor- rectness guarantees is left to the programmers, which can be difficult to realize, given the opaqueness of the translation from the high-level model to the low-level model. Although recent efforts [21], [9], [22], [23], [24] proposed automatic CPU-GPU data transfer schemes, they are limited to avoid- ing redundant transfers, and some of them cannot work with directive-based programming models.

Welcome message from author
This document is posted to help you gain knowledge. Please leave a comment to let me know what you think about it! Share it to your friends and learn new things together.
Transcript

Interactive Program Debugging and Optimizationfor Directive-Based, Efficient GPU Computing
Seyong Lee†, Dong Li†, and Jeffrey S. Vetter† ?
†Oak Ridge National Laboratory, ?Georgia Institute of Technology{lees2, lid1}@ornl.gov, {vetter}@computer.org
Abstract—Directive-based GPU programming models aregaining momentum, since they transparently relieve program-mers from dealing with complexity of low-level GPU pro-gramming, which often reflects the underlying architecture.However, too much abstraction in directive models puts asignificant burden on programmers for debugging applicationsand tuning performance. In this paper, we propose a directive-based, interactive program debugging and optimization system.This system enables intuitive and synergistic interaction amongprogrammers, compilers, and runtimes for more productiveand efficient GPU computing. We have designed and im-plemented a series of prototype tools within our new opensource compiler framework, called Open Accelerator ResearchCompiler (OpenARC); OpenARC supports the full featureset of OpenACC V1.0. Our evaluation on twelve OpenACCbenchmarks demonstrates that our prototype debugging andoptimization system can detect a variety of translation errors.Additionally, the optimization provided by our prototype min-imizes memory transfers, when compared to a fully manualmemory management scheme.
Keywords-interactive debugging; performance optimization;directive programming; GPU; OpenACC; OpenARC
I. INTRODUCTION
GPU computing is now a mainstream computing schemein high performance computing (e.g., Titan [1], TSUB-AME2 [2], Tiahne-1A [3], and Keeneland [4]). GPU-likearchitectures have been highlighted as possible buildingblocks for future Exascale systems [5]. A key factor drivingthe popularity of GPUs is their capability to deliver cost-effective and energy-effective performance. However, thesestrengths come at the cost of programmability: programmingGPUs requires expertise and can be complicated and error-prone.
Recently, several directive-based GPU programming mod-els have been proposed to improve the productivity of GPUcomputing [6], [7], [8], [9], [10], [11], [12]. To understandthese emerging GPU programming models in terms ofprogrammability and performance, our previous work [13]thoroughly investigated them from multiple perspectives,and identified their limitations. Among those limitations,debuggability is one of the most immediate and pressingissues for directive-based GPU programming models. Onone hand, these programming models hide multiple stages ofcomplex optimizations and translations from programmers to
improve productivity. On the other hand, the opaque natureof these programming models impose great challenges forusers to debug and verify the program. For example, thesemodels raise the abstraction of GPU memory hierarchy andprovide unified memory management across architectures;this new level of abstraction complicates debugging formemory-related problems. In addition, these models employa thread/task parallelism model different from the low-levelprogramming models (e.g., CUDA [14]), which complicatesdebugging for concurrency. Although the GPU communityhas a number of tools [15], [16], [17], [18], [19] to de-bug, profile, and analyze GPU codes, they are limited toapplications written in the low-level programming models.When applied to directive-based programming models, theylack the proper capabilities to attribute specific output GPUtranslated code, performance, and errors with their respectivedirective-annotated input programs. Hence, they do not givestraightforward views for programmers to diagnose logicerrors and performance problems at the directive level.
Another significant challenge for directive-based program-ming models is performance optimization, and, in particular,optimizing CPU-GPU data movement. In most of today’saccelerator based systems, the address spaces for GPU andCPU are separate: to communicate data between the two, ap-plications suffer a relatively high penalty from data transfercost. This cost is especially high in discrete GPUs becauseof communication cost across the PCI-e bus. Althougharchitectures that fuse GPUs and CPUs into a single chip aregaining in popularity [20], and many examples exist in theconsumer market, they still require precise data orchestrationand coordination between the CPU and the GPU for efficientperformance. Directive-based programming models exposeCPU-GPU memory management explicitly to programmers,forcing them to dictate the CPU-GPU data movement andcoordination. Hence, minimizing data movement with cor-rectness guarantees is left to the programmers, which can bedifficult to realize, given the opaqueness of the translationfrom the high-level model to the low-level model. Althoughrecent efforts [21], [9], [22], [23], [24] proposed automaticCPU-GPU data transfer schemes, they are limited to avoid-ing redundant transfers, and some of them cannot work withdirective-based programming models.

A. Contributions
To address the above problems, we propose and imple-ment an interactive program debugging and optimizationsystem for productive and efficient GPU computing us-ing directive programming models. Our work is the firsteffort toward improving traceability and debuggability fordirective-based GPU programming. Our major contributionsare summarized as follows:• We propose a directive-based, interactive GPU program
debugging technique, which provides an intuitive andsynergistic environment to provide better interactionamong programmers, compilers, and runtimes than ex-isting debugging tools [15], [18], [19].
• Our technique is able to verify correctness in theGPU-kernel translation and the CPU-GPU memory-transfer-code generation, solving the aforementioneddebuggability problem.
• We present a combined compile-time/runtime methodthat interacts with the programmer to identify redundantCPU-GPU memory transfers, such that the programmercan optimize memory transfers iteratively, through thedirectives, and based on the suggestions offered by theproposed system. This intuitive user-interaction mini-mizes redundant data transfers, which is not availablein the previous software coherence mechanisms [21],[22], [23] due to correctness constraints.
The rest of this paper is organized as follows. §II ex-plains the background on the directive-based GPU pro-gramming and reviews related work. §III presents the pro-posed directive-based, interactive program debugging andoptimization techniques. Evaluation and conclusions arepresented in §IV and §V, respectively.
II. BACKGROUND AND RELATED WORK
A. Directive-Based GPU Programming
Directive-based GPU programming models consist ofthree components: the compiler directives, library routines,and environment variables. With the directive-based pro-gramming models, GPU programs are written by augment-ing sequential programs with a set of directives that describeimportant program properties, such as parallelism types toexecute loops, and data scope and sharing rules to managedata and synchronize with CPU. At compile time, thedirective compilers translate the annotated programs intolow-level GPU programs by performing all the complextransformations, such as GPU-kernel-code generation andCPU-GPU memory-transfer-code generation.
Our work is based on OpenACC directives. Ope-nACC [11] is the first directive-based GPU programmingstandard portable across devices and compiler vendors. Inan OpenACC program, a compute region specifies a coderegion to be executed on GPU, and the directives manageparallelism and guide how loops in the compute region
# pragma acc d a t a c r e a t e ( q , w , . . . ) . . .{ . . . / / Some compute r e g i o n s
f o r ( i t =1 ; i t <= NITER ; i t ++ )f o r ( c g i t =1 ; c g i t <= cg i tmax ; c g i t ++ ) {
. . . / / Some compute r e g i o n s# pragma acc k e r n e l s l oop gang workerf o r ( j =1 ; j<= l a s t c o l − f i r s t c o l +1 ; j ++){ q [ j ] = w[ j ] ; }. . . / / Some compute r e g i o n s
} . . . / / Some compute r e g i o n s}
Listing 1: Code excerpt from NAS Parallel Benchmark CG portedto OpenACC. The code is manually optimized for memory man-agement
should be executed; a data region sets a data boundary forGPU memory allocation, and the directives manage data andcontrol memory transfers between CPU and GPU.
The major benefit of using directive-based GPU program-ming models is that they obviate the need for dealing withcomplexity of low-level GPU programming languages, suchas CUDA [14] and OpenCL [25], and they also hide most ofcomplex optimization details specific to the underlying GPUarchitectures. These high-level abstractions allow program-mers to focus on their algorithms, hence improving theirproductivity and portability. In addition, programmers caneasily provide performance-critical information to the com-pilers, enabling various compile-time/runtime optimizationsto better utilize the underlying system resources.
However, the high-level abstraction bestowed by directivemodels puts a significant burden on programmers in terms ofdebugging and performance optimization, as we shall showin the next section.
B. Motivation for Improving GPU Program Debugging
The high-level programming and automatic transforma-tion in directive models bring several challenges for de-bugging GPU programs, especially when combined withimplicit compiler optimizations. For example, automaticprivatization and reduction variable recognition are twoimportant compiler techniques used to parallelize loops [26].Due to their importance, the existing GPU-directive compil-ers support these features to some extent. However, if thedirective compilers miss privatization/reduction transforma-tion opportunities, and the programmers do not explicitlyspecify data sharing rules for each compute region, theresulting GPU program can suffer from a race condition dueto an incorrect data dependency. Identifying this concurrencyproblem is very difficult, and demands deep knowledge ofboth GPU programs and underlying compilers.
Moreover, evaluations with existing GPU-directive com-pilers [13] reveal that some compiler implementations donot always follow directives inserted by users, or evenworse, those implementations can generate incorrect output
codes, when the directives provided by programmers conflictwith internal compiler analyses. These unexpected behaviorsadd additional challenges to the already complex debuggingproblems.
To improve debuggability for the directive-based GPUprogramming models, we must have a systematic approachthat exposes more information to programmers for debug-ging purposes while maintaining high-level abstractions.First, we need more intuitive tools to delineate the incorrectcode regions. Second, we need traceability mechanismsto attribute errors and performance issues back to inputdirective programs.
To address the above issues, we develop a directive-based,GPU kernel debugging mechanism that detects erroneousGPU kernels through step-by-step comparison betweentranslated GPU kernels and corresponding input computeregions, described in §III-A.
C. Motivation for Improving GPU Memory Management
Currently, GPU programming models assume separateaddress spaces for CPU and GPU. To share data betweenCPU and GPU, many programs use explicit data transfersbetween CPU and GPU memories. GPU directives providea rich set of data clauses to control memory transfers.These clauses rely on programmers to orchestrate memorymanagement, which is another source for debugging andperformance issues.
Listing 1 shows an excerpt from NAS Parallel BenchmarkCG that we ported to OpenACC. The code is fully tuned forGPU memory allocation and CPU-GPU memory transfers.Within the code, the data directive is used to specify thatGPU memory should be allocated for variable q and w forthe duration of the following code region. In addition, eachcompute region is annotated with the kernels directive to tellthe compiler that the compute region should be transformedinto GPU kernels to be executed on GPU. In this example,there is no CPU-GPU data transfer for variables q and w,because these variables do not appear in any explicit/implicitmemory-transfer clauses (e.g., copy and update host). Wedo not need to transfer data between CPU and GPU forthese variables, because they are accessed only by GPU(i.e., private GPU-only data). To identify private GPU-onlydata to avoid redundant data transfers, the whole programshould be examined to check whether there is any CPUcode accessing the data. Considering possible aliasing issues,this process is very complex and error-prone. Moreover, ifa variable is shared between CPU and GPU, locating theproper points to trigger CPU-GPU memory transfers is alsonon-trivial. For example, if a compute region resides in aloop, as shown in Listing 1, conservative data transfers maylead to redundant transfers, while inappropriately deferredtransfers can cause incorrect outputs.
To guarantee program correctness, a naive memory man-agement scheme is to copy all the data accessed in a compute
1
10
100
1000
10000
100000
BACKPROP
BFS
CFD CG
EP
HOTSPOT
JACOBI
KMEANS
LUD
NW
SPMU
L SRAD
Normalize
d Va
lues
Normalized total execu2on 2me Normalized total transferred data size
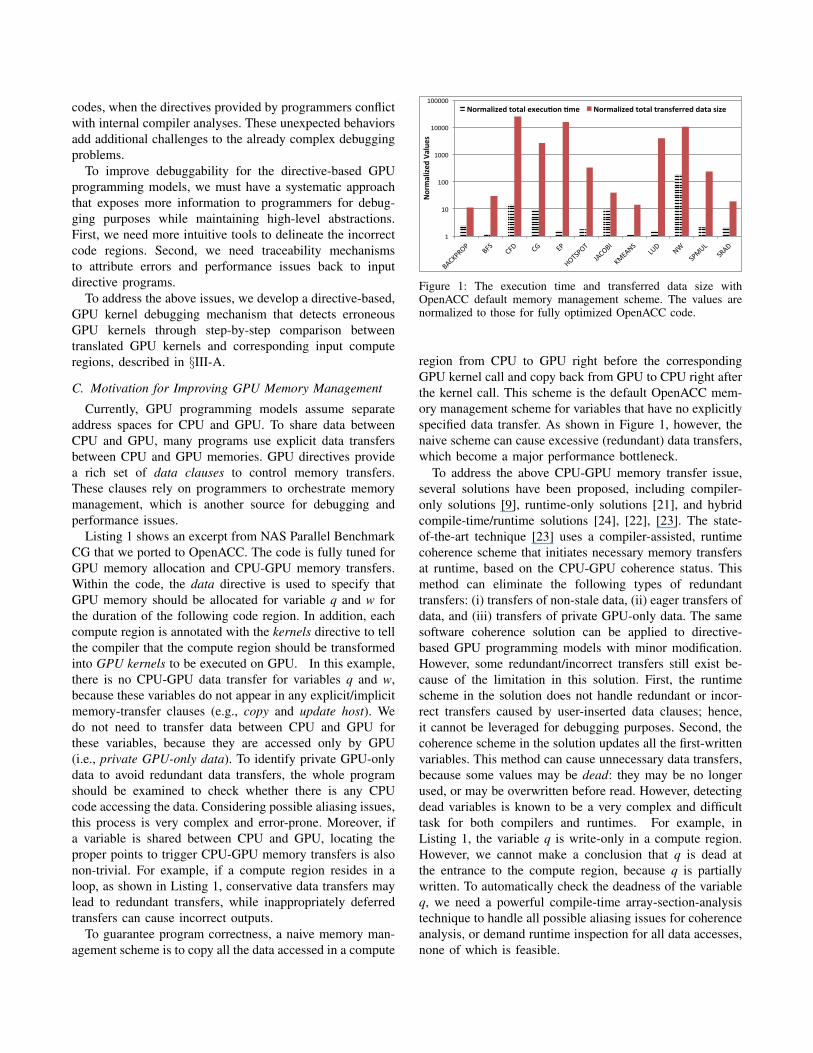
Figure 1: The execution time and transferred data size withOpenACC default memory management scheme. The values arenormalized to those for fully optimized OpenACC code.
region from CPU to GPU right before the correspondingGPU kernel call and copy back from GPU to CPU right afterthe kernel call. This scheme is the default OpenACC mem-ory management scheme for variables that have no explicitlyspecified data transfer. As shown in Figure 1, however, thenaive scheme can cause excessive (redundant) data transfers,which become a major performance bottleneck.
To address the above CPU-GPU memory transfer issue,several solutions have been proposed, including compiler-only solutions [9], runtime-only solutions [21], and hybridcompile-time/runtime solutions [24], [22], [23]. The state-of-the-art technique [23] uses a compiler-assisted, runtimecoherence scheme that initiates necessary memory transfersat runtime, based on the CPU-GPU coherence status. Thismethod can eliminate the following types of redundanttransfers: (i) transfers of non-stale data, (ii) eager transfers ofdata, and (iii) transfers of private GPU-only data. The samesoftware coherence solution can be applied to directive-based GPU programming models with minor modification.However, some redundant/incorrect transfers still exist be-cause of the limitation in this solution. First, the runtimescheme in the solution does not handle redundant or incor-rect transfers caused by user-inserted data clauses; hence,it cannot be leveraged for debugging purposes. Second, thecoherence scheme in the solution updates all the first-writtenvariables. This method can cause unnecessary data transfers,because some values may be dead: they may be no longerused, or may be overwritten before read. However, detectingdead variables is known to be a very complex and difficulttask for both compilers and runtimes. For example, inListing 1, the variable q is write-only in a compute region.However, we cannot make a conclusion that q is dead atthe entrance to the compute region, because q is partiallywritten. To automatically check the deadness of the variableq, we need a powerful compile-time array-section-analysistechnique to handle all possible aliasing issues for coherenceanalysis, or demand runtime inspection for all data accesses,none of which is feasible.

To address the above problems, we propose a directive-based, interactive memory-transfer verification and opti-mization technique, described in §III-B.
Table I compares our work with the existing ones. Ingeneral, our work complements the existing ones by pro-viding high-level debugging and optimization capability fordirective-based GPU programs.
III. DIRECTIVE-BASED, INTERACTIVE PROGRAMDEBUGGING AND OPTIMIZATION
This section presents the interactive program debuggingand optimization scheme. The proposed scheme consistsof two parts: GPU-kernel verification (§III-A) to locateproblematic kernels, and memory transfer verification andoptimization (§III-B) to detect incorrect/missing/redundantmemory transfers.
A. GPU Kernel Verification
Even though debugging in the directive-based GPU pro-gramming is very difficult, directive models provide at leastone good reference for debugging: the original sequentialprogram. If we can compare execution outputs of the inputsequential CPU program to those of the translated GPUprogram in a lockstep manner, we can pinpoint the coderegions requiring debugging. For various reasons (e.g., highoverhead and too complex to trace all threads executing GPUkernels at finer granularity), a lockstep debugging strategyis impractical. Hence, we propose to compare these resultsat the granularity of a GPU kernel.
With the directive-based GPU models, the manual kernelverification is non-trivial. First, GPU memory is hidden bydirective models, and thus programmers can not directly ac-cess GPU data. To compare the outputs of GPU kernels withthose of corresponding code regions in the input sequentialprogram, we must tweak the code to leverage CPU memoryto make the comparison. Second, each kernel verificationmay require customized memory transfer patterns, whichcomplicates debugging. Third, naive comparisons do notwork due to inconsistent floating-point precision betweenCPU and GPU. In particular, CPU and GPU may usedifferent numbers of bits to store floating-point numbers, andnon-deterministic computation order enforced by parallelGPU thread executions can result in different outputs forthe same computation.
We address the above kernel debugging problemsthrough a user-assisted, automatic kernel verification mech-anism. With the proposed mechanism, a user can spec-ify which specific kernels to verify by adding direc-tives or using environment variables (e.g., “verificationOp-tions=complement=0,kernels=main kernel0” informs thecompiler to verify a specific kernel, main kernel0.). Atthe heart of the proposed mechanism, we introduce twotechniques, called automatic memory-transfer demotion anduser-configurable result comparison.
1 { . . . / / Some compute r e g i o n s2 f o r ( i t =1 ; i t <= NITER ; i t ++ )3 f o r ( c g i t =1 ; c g i t <= cg i tmax ; c g i t ++ ) {4 . . . / / Some compute r e g i o n s5 # pragma acc k e r n e l s loop async ( 1 ) \6 gang worker copy ( q ) co py i n (w)7 f o r ( j =1 ; j<= l a s t c o l − f i r s t c o l +1 ; j ++)8 { q [ j ] = w[ j ] ; }9 / / S e q u e n t i a l CPU v e r s i o n w i l l be added .
10 # pragma acc w a i t ( 1 )11 / / R e s u l t compar i son codes w i l l be added .12 . . . / / Some compute r e g i o n s13 } . . . / / Some compute r e g i o n s14 }
Listing 2: Modified version of Listing 1 after applying memory-transfer demotion, but before result-comparison transformation.
The memory-transfer demotion refines memory transferpatterns such that all data accessed by the target GPUkernel are copied from CPU to GPU right before the kernelinvocation, and all data modified by the kernel are copiedback to a temporary space on the CPU after the kernelfinished. This is implemented by (i) moving (demoting)any related data clauses in enclosing data regions to thetarget compute region (changing original data managementpolicy), and (ii) adjusting transfer types for each data asnecessary (e.g., putting the data in a copyin clause ifthe data are read-only; otherwise, in a copy clause).Thememory-transfer demotion rules out program errors causedby missing memory transfers, and avoids unnecessary resultcomparison. With this method, the memory transfers aswell as the kernel execution are converted to asynchronousones to allow maximal overlapping with sequential CPUexecution. Although this method has impacts on communi-cation behaviors between CPU and GPU, it does not changethe behavior of the target kernel. The main goal of thekernel verification is to verify that the translated GPU kernelbehaves correctly with respect to the input sequential CPUcode, so enforcing a strict execution order between CPU andGPU is not necessary. Moreover, all directives and runtimecalls unrelated to the target kernel are removed, such thatthe unrelated compute regions are sequentially executed onCPU. This method allows the target kernel to always usedata generated by the original sequential program, hence itavoids error propagation from the previous code regions.Listing 2 shows the codes after memory-transfer demotionis applied to Listing 1. In particular, data clauses in theenclosing data directive are moved to the target computeregion, and additional directives are added for asynchronouskernel execution.
After memory-transfer demotion, the compiler makes an-other pass (i.e., result-comparison transformation) to com-pare the outputs of CPU and GPU. The compiler generatesnew versions of the code and some harness code to make

Table I: Comparison of debugging (DG) and optimization (OP) tools
DG and OP tools High-level DG and OP fordirective-based programming
Data transferoptimization
User interac-tion
Configurabilityof DG and OP
fine-grained anddetailed profiling
GPU PerfStudio [15] andVisual Profiler [17]
No No Limited Limited Yes
TotalView [18] andDDT [19]
Limited No Limited No Yes
[22], [23], [24] No Yes No Limited NoThis paper Yes Yes Rich Rich No
the comparison (line 9 and 11 in Listing 2). If the outputdifference is bigger than the allowed error margin, thenan error will be reported to the user. To handle variouscomputation precision mismatch between CPU and GPU,the transformation allows users to configure the error marginaccording to the program characteristics and the underlyingarchitectures. The user can also decide when to make theresult comparison with user-defined conditions. For example,“minValueToCheck=1e-32” enforces that result is comparedonly if its value is bigger than a specified threshold (1e-32).
By comparing execution results of the reference sequentialprogram and the translated GPU program at runtime at akernel granularity, we can easily identify problematic kernelscaused by various reasons, such as incorrect user annotationsor incorrect compiler translation. However, the proposedkernel verification mechanism cannot detect errors causedby incorrect memory transfers. Hence, we further proposea memory transfer verification scheme, explained in thefollowing section.
B. Memory Transfer Verification and Optimization
The memory-transfer verification and optimizationscheme uses runtime coherence checking as an offlineprofiling tool to detect incorrect, missing, or redundantmemory transfers. To accurately capture variable accessinformation, each variable of interest (e.g., the variableshared between CPU and GPU and accessed within acompute region) is associated with one of three coherencestatuses (“notstale”, “maystale”, “stale”) on both CPU andGPU. In the current implementation, we track coherencestatus at the granularity of entire array or memoryregion allocated by a malloc call. Tracking memoryaccesses at this granularity is a common practice in GPUprogramming [27], [23]. Although CPU-GPU memorycoherence at finer granularities can further reduce theoverall size of memory transfers, too frequent statusupdates at finer granularity suffer from high data transferlatency between CPU and GPU. Therefore, using datacoherence at a coarse granularity and efficiently utilizingGPU memories is a preferred approach to minimize bothfrequency and data size of CPU-GPU memory transfers.The coarse-grained coherence is also preferable for trackingpurpose, since a fine grained tracking can take significantexecution time, resulting in bad user experiences for
debugging. In addition, because of aliasing issues, trackingat finer granularities is very vulnerable to losing trackingaccuracy.
The coherence state is maintained by the runtime. Inparticular, all variables of interest start out as not-stale onCPU and GPU until the first write. If a variable is modifiedon either a CPU or GPU device, the state on the otherdevice is set to stale. The state of a stale variable is reset tonot-stale if the up-to-date value is copied back to the stalevariable through memory transfers, or if the stale variable isoverwritten locally. The runtime coherence state is used todetect missing memory transfers. In particular, if the stateof a variable to be accessed by the local device is stale, thismeans that the other remote device has modified the variable,requiring a memory transfer from the remote device to thelocal device before the local access (i.e., missing transfer).The coherence state is also used to detect incorrect andredundant transfers. In particular, if the state of a variable fora memory transfer at the source is stale, then the memorytransfer is incorrect, because the outdated value is copied(i.e., incorrect transfer); if the state of a variable for amemory transfer at the target is not-stale, then the memorytransfer is redundant, because the target already has the up-to-date value (i.e., redundant transfer).
The above runtime checking mechanisms cannot detectcertain redundant transfers. Particularly, when a memorytransfer occurs, if the target is dead (refer to §II-C), then thememory transfer is redundant, because the copied value willnot be used any more. As explained in §II-C, detecting deadvariables accurately at either compile-time or runtime aloneis known to be very challenging. Therefore, we propose analternative, hybrid approach that combines the best effortsof the compiler and the runtime. This approach asks thecompiler to specify those presumably dead variables (may-dead) and verified dead variables (must-dead) based on astatic analysis. Then, the runtime checks which memorytransfers actually involve may-dead/must-dead variables andreports them to programmers. It is up to the programmersto decide which memory transfers are redundant and safeto delete. The programmers’ decisions are saved back intothe input directive program for production run. These stepsare repeated until no redundant or incorrect transfer isfound. This hybrid approach makes a best effort to guaranteeprogram correctness by conservatively detecting dead vari-

ables, while providing sufficient hints for users to optimizeperformance.
Algorithm 1 May-Dead/May-Live Variable Analysis
OUTLive(EXIT )⇐ ∅OUTDead(EXIT )⇐ ∅OUTLive(n)⇐
⋃s,s∈succ(n) INLive(s)
OUTDead(n)⇐⋂
s,s∈succ(n) INDead(s)INLive(n) ⇐ OUTLive(n) − KILL(n) − DEF (n) +USE(n)INDead(n) ⇐ OUTDead(n) −KILL(n) +DEF (n) −USE(n)
Algorithm 1 shows the data flow analysis to identify may-dead and must-dead variables. The algorithm also introducesmay-live variables (i.e., variables that are accessed laterbut read before written) to facilitate analysis. The analysisbegins by initializing may-dead and may-live sets at theprogram exit (OUTDead(EXIT ) and OUTLive(EXIT )).From the exits to the program entry, the analysis checkswritten variables (DEF(n)) and read variables (USE(n)) ineach statement (n). The KILL(n) set refers to variables thathave gone stale during execution of the statement n. If avariable is written-first in all of the following executionpaths, it is added to may-dead set; if the variable is readin some of the following execution paths, it is added tomay-live set. If a variable is neither may-dead nor may-live,the variable will not be accessed any more in the followingexecution paths (i.e., adding to must-dead). We perform theabove analysis twice, one for CPU variables and the otherfor GPU variables. Then, the may-dead and the must-deadvariables in CPU and GPU are passed to the runtime. Theruntime sets the state of must-dead variables to “not-stale”and sets the state of may-dead variables to “may-stale”. Atruntime, memory transfers occurred to those variables withthe not-stale state are reported as redundant, while memorytransfers occurred to those variables with the may-stale stateare reported as may-redundant.
To enforce the above runtime memory-transfer-checkingmechanism, the compiler should insert various runtime-check calls, detailed as follows:• Each read/write access should be preceded by runtime
checks, particularly check read() and check write().They detect any missing or may-missing memory trans-fers; the may-missing refers to the case where a targetvariable is stale, but it is written before read. This caserequires a memory transfer only if written data do notfully overlap with data that are read later.
• Each write access, which changes the variable state atthe remote device to stale, should be also followedby reset status(), if the corresponding variable at theremote device is may-dead or must-dead at the currentstatement; reset status() changes the variable state at
the remote device to may-stale or not-stale to detectredundant transfer.
• reset status() call should be added for many otherscenarios. These scenarios change variable states, in-cluding a memory deallocation call and a GPU kernelcall containing reduction. The memory deallocationsets the variable state to stale; the GPU kernel callcontaining reduction sets the state of the reductionvariable on GPU to stale, if the reduction is performedin a way that only CPU has the final reduction result.
• Each memory transfer should be followed byset status() to check any incorrect/redundant/may-redundant transfers.
To implement the above runtime checks, we could naivelyinsert the checks for each read/write access. However, thisimplementation is inefficient and results in large runtimeoverhead. We introduce a number of techniques to reduce theoverhead. These techniques are based on a simple fact thatstatic and successive accesses to a variable on CPU (GPU)without any interfering GPU (CPU) kernel calls will notchange its coherence state on CPU (GPU). These techniquesare detailed as follows:• Coherence checking (read check() and write check())
for GPU data is only necessary at the kernel boundary,because no CPU execution can change variable stateson GPU during the kernel execution.
• The read check() call for CPU data needs to be insertedonly for the first-read accesses along some path fromprogram entry or from each GPU kernel call; a similarrule is applied to write check().
• The reset status() call to change the status of may-deador must-dead GPU variables needs to be inserted onlyto the last-CPU-write accesses along some path fromprogram entry or from each GPU kernel call. For may-dead or must-dead CPU variables, the reset status() callneeds to be inserted only at the kernel boundary (rightafter a GPU kernel call).
The above optimizations require the compiler to locatefirst-read, first-write, and last-write accesses. To find first-read/write accesses, we use an algorithm similar to theone in [23]. To find last-write accesses, we use a similaralgorithm (Algorithm 2), but performing backward, all-pathdata flow analysis along some path from program exits orfrom the next kernel calls.
Algorithm 2 Last-Write Analysis
OUTWrite(EXIT )⇐ ∅OUTWrite(n)⇐
⋂s,s∈succ(n) INWrite(s)
INWrite(n)⇐ OUTWrite(n) +DEF (n)−KILL(n)LASTWrite(n)⇐ INWrite(n)−OUTWrite(n)
In addition to the above optimizations, if the first-CPU-read/write accesses reside in a loop and the loop does not
contain any GPU kernel calls, the corresponding runtimechecks can be moved before the loop. This method reducesadditional profiling overhead. Furthermore, unlike the pre-vious runtime coherence scheme [23], which optimizes theplacement of coherence checks only for the CPU side, ourscheme optimizes the placement for both CPU and GPU.Optimizing GPU-coherence-check placement allows us todetect additional redundant transfers, which was not possiblein the previous schemes. We use Listing 3 as an exampleto further explain this opportunity. In Listing 3, GPU-writechecks are inserted before each kernel call (line 3 and 6).However, set status() in line 8 can not detect redundantmemory transfer in line 8 because check write() in line 6changes the CPU state of b to stale at each iteration. If thewrite checks in line 3 and 6 are moved before the enclosingloop (line 1), set status() in line 8 can detect redundantmemory transfer in line 8. We generalize the above exampleand conclude that write check() call for a GPU kernel can bemoved before the enclosing loop if the two conditions hold:(i) the enclosing loop does not contains CPU codes accessingthe target variable, and (ii) no memory transfer call for thevariable exists before the write check() call within the loop.
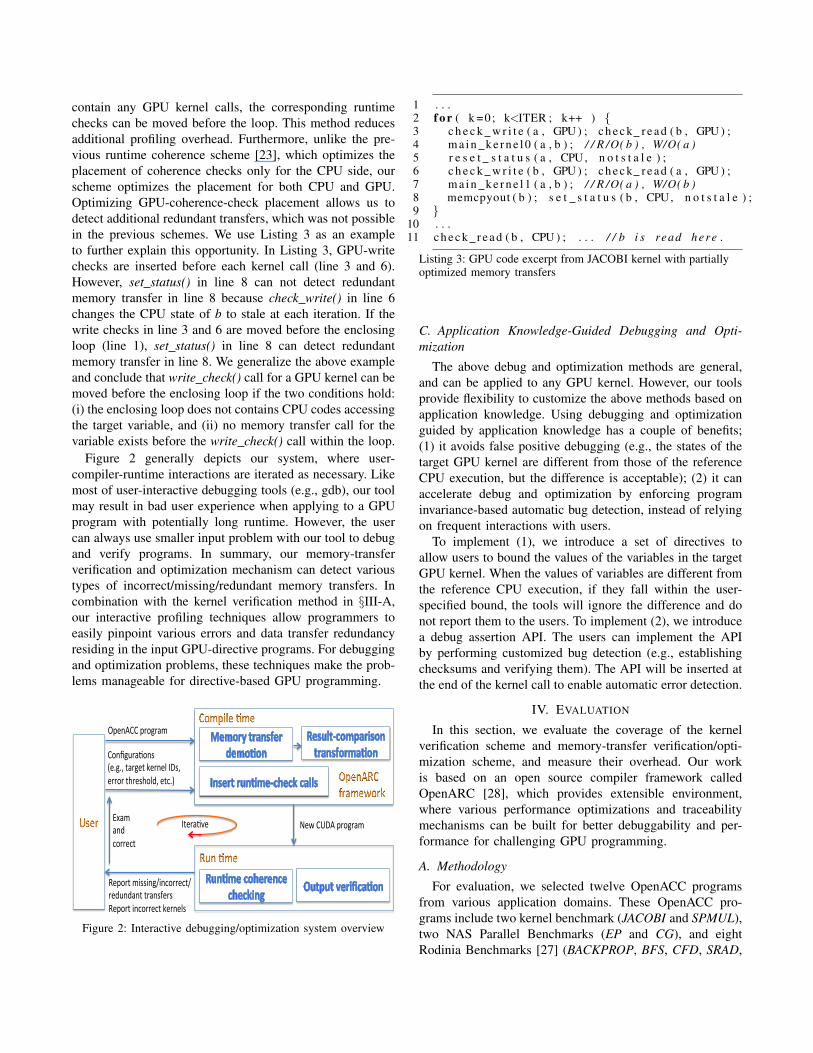
Figure 2 generally depicts our system, where user-compiler-runtime interactions are iterated as necessary. Likemost of user-interactive debugging tools (e.g., gdb), our toolmay result in bad user experience when applying to a GPUprogram with potentially long runtime. However, the usercan always use smaller input problem with our tool to debugand verify programs. In summary, our memory-transferverification and optimization mechanism can detect varioustypes of incorrect/missing/redundant memory transfers. Incombination with the kernel verification method in §III-A,our interactive profiling techniques allow programmers toeasily pinpoint various errors and data transfer redundancyresiding in the input GPU-directive programs. For debuggingand optimization problems, these techniques make the prob-lems manageable for directive-based GPU programming.
OpenACC'program'
Configura/ons''(e.g.,'target'kernel'IDs,'error'threshold,'etc.)'
New'CUDA'program'
Report'missing/incorrect/'redundant'transfers'Report'incorrect'kernels'
Exam'and'correct'
'''''''''''''''''Itera/ve'
Figure 2: Interactive debugging/optimization system overview
1 . . .2 f o r ( k =0; k<ITER ; k++ ) {3 c h e c k w r i t e ( a , GPU ) ; c h e c k r e a d ( b , GPU ) ;4 m a i n k e r n e l 0 ( a , b ) ; / / R /O( b ) , W/O( a )5 r e s e t s t a t u s ( a , CPU, n o t s t a l e ) ;6 c h e c k w r i t e ( b , GPU ) ; c h e c k r e a d ( a , GPU ) ;7 m a i n k e r n e l 1 ( a , b ) ; / / R /O( a ) , W/O( b )8 memcpyout ( b ) ; s e t s t a t u s ( b , CPU, n o t s t a l e ) ;9 }
10 . . .11 c h e c k r e a d ( b , CPU ) ; . . . / / b i s read here .
Listing 3: GPU code excerpt from JACOBI kernel with partiallyoptimized memory transfers
C. Application Knowledge-Guided Debugging and Opti-mization
The above debug and optimization methods are general,and can be applied to any GPU kernel. However, our toolsprovide flexibility to customize the above methods based onapplication knowledge. Using debugging and optimizationguided by application knowledge has a couple of benefits;(1) it avoids false positive debugging (e.g., the states of thetarget GPU kernel are different from those of the referenceCPU execution, but the difference is acceptable); (2) it canaccelerate debug and optimization by enforcing programinvariance-based automatic bug detection, instead of relyingon frequent interactions with users.
To implement (1), we introduce a set of directives toallow users to bound the values of the variables in the targetGPU kernel. When the values of variables are different fromthe reference CPU execution, if they fall within the user-specified bound, the tools will ignore the difference and donot report them to the users. To implement (2), we introducea debug assertion API. The users can implement the APIby performing customized bug detection (e.g., establishingchecksums and verifying them). The API will be inserted atthe end of the kernel call to enable automatic error detection.
IV. EVALUATION
In this section, we evaluate the coverage of the kernelverification scheme and memory-transfer verification/opti-mization scheme, and measure their overhead. Our workis based on an open source compiler framework calledOpenARC [28], which provides extensible environment,where various performance optimizations and traceabilitymechanisms can be built for better debuggability and per-formance for challenging GPU programming.
A. Methodology
For evaluation, we selected twelve OpenACC programsfrom various application domains. These OpenACC pro-grams include two kernel benchmark (JACOBI and SPMUL),two NAS Parallel Benchmarks (EP and CG), and eightRodinia Benchmarks [27] (BACKPROP, BFS, CFD, SRAD,

HOTSPOT, KMEANS, LUD, and NW). These programs aretranslated to output CUDA programs by OpenARC andthen compiled using GCC 4.4.6 and NVCC 5.0 using -O3option. We executed compiled programs on a platform withIntel Xeon X5660 host CPUs and a NVIDIA Tesla M2090GPU, using the largest available inputs that fit into the GPUmemory. To get reliable results, we ran experiments multipletimes (from 10 to 200 times, depending on the runtimevariation). The reported results are the average values.
0"
2"
4"
6"
8"
10"
12"
14"
BACKPROP"
BFS"
CFD" CG
"EP"
HOTSPOT"
JACOBI"
KMEANS"
LUD"
NW"
SPMUL"
SRAD"
Norm
alized+E
xecu0o
n+Tim
e+
GPU"Mem"Free" GPU"Mem"Alloc" Mem"Transfer"
AsyncHWait" ResultHComp" CPU"Time"
2915
Figure 3: Breakup of execution time for kernel verification tests.The execution times are normalized to those of sequential CPUexecutions.
Table II: Summary for the kernel verification tests to detect raceconditions caused by missing privatization or incorrect reductionrecognition
Description Count
Number of tested kernels 46Number of kernels containing private data 16Number of kernels containing reduction 4Number of kernels incurring active errors 4Number of kernels incurring latent errors 16
B. Kernel Verification
Figure 3 shows the breakdown of execution times whenverifying all kernels in input programs. Within the figure,Result-Comp refers to the time to compare GPU kernelresults against reference CPU results, Mem Transfer refersto memory transfers time between CPU and GPU, Async-Wait refers to the time that the host CPU has to wait to finishasynchronous GPU kernel executions and memory transfers,and CPU Time refers to the time spent for the host CPUwork. The breakdown indicates that Result-Comp and MemTransfer constitute most of the overhead. This is becauseeach kernel verification always uses reference CPU data toavoid error contamination from previous GPU computation,and all data written by the kernels are examined to detectany errors potentially affecting program outputs.
Table II summarizes kernel verification tests to find kernelerrors caused by race conditions. Those errors may occur ifthe GPU directive compiler fail to detect missing private
− Copying b from d e v i c e t o h o s t i n u p d a t e 0( e n c l o s i n g loop i n d e x = 1) i s r e d u n d a n t .
− Copying b from d e v i c e t o h o s t i n u p d a t e 0( e n c l o s i n g loop i n d e x = 2) i s r e d u n d a n t .
. . . / / r e p e a t e d u n t i l t h e l a s t k−l oop i t e r a t i o n
Listing 4: Sample debugging messages for JACOBI kernel inListing 3. update0 refers to memcpyout(b) in line 8 in Listing 3.
variables or reduction variables. For those tests, private/re-duction clauses are manually removed from the directiveprograms, and the directive compiler is configured to dis-able any automatic privatization or reduction recognition.In the table, active errors refer to the cases where raceconditions actively alter program output, while latent errorsdo not change program behaviors. The proposed verificationscheme successfully detected all active errors, but none oflatent errors was detected. Further investigation found thatthe latent errors are related to private data. Even if a privatevariable is incorrectly translated as shared, the resulting racecondition may not affect the program outputs if the compilercaches the intermediate values of the falsely shared variable;the race condition occurs when the value finally dumps backto the variable; however, the variable is no longer used aftervalue dumping, hence incurring no visible errors. This showsthat our verification scheme can effectively detect errors thatdirectly affect kernel outputs. Theoretically, the proposedscheme can detect various active errors. In practice, theinconsistent floating-point precision between CPU and GPUcan make error detection non-trivial and demand limited userinvolvement to pre-define error conditions.
C. Memory Transfer Verification and Interactive Optimiza-tion
To evaluate the performance of our memory transfer ver-ification/optimization scheme, we first created unoptimizedversions for tested programs. Then, the programs were iter-atively optimized to find optimal transfer patterns accordingto our tool’s suggestions. At each verification iteration,the tool provides three types of suggestions: (i) informa-tion on redundant memory transfers, (ii) error messageson missing/incorrect transfers, and (iii) warnings of may-redundant/may-missed transfers. Listing 4 shows sampledebugging output that the tool generates for the JACOBIkernel in Listing 3, which says memory transfer of variable bfrom the device to the host in line 8 in Listing 3 is redundantexcept for the first iteration of the enclosing k-loop (line 2),indicating that the memory transfer can be deferred until thek-loop finishes (line 10). Then, user can modify data clausesin the input program according to the suggestions and rerunthe program (iterate the verification steps as necessary).
Among the three types of suggestions, warning messagesrequire special attention, since programmers have to verifycorrectness of the suggested changes. The may-redundant/
may-missed transfers occur because of uncertainty in may-dead variables. In most cases, verifying deadness is relativelyeasy, since our tool informs which code section should bechecked. If the whole data of the variable is written atthat code, then the programmer can know the variable isguaranteed to be dead. In some cases, like NAS benchmarkCG in Listing 1, where data are partially written, however,deciding deadness may become non-trivial. This challengearises from the fact that the programmer has to check all theexecution paths following the tool-suggested point to checkwhether written parts cover all the following reads.
Table III: Memory-transfer-verification performance. In the table,# incorrect iterations refers to the number of iterations where thetool suggests incorrectly, and # uncaught redundancy refers to thenumber of redundant memory transfers that the tool can not detect,compared to the manually optimized versions.
Benchmark # total iter-ations
# incorrect it-erations
# uncaught re-dundancy
BACKPROP 3 1 0BFS 3 0 0CFD 4 0 1CG 2 0 0EP 2 0 0HOTSPOT 2 0 0JACOBI 3 0 0KMEANS 2 0 0LUD 4 3 0NW 2 0 0SPMUL 3 0 0SRAD 2 0 0
Table III summarizes the performance of the proposedscheme; in most cases, we successfully figure out optimalmemory transfer patterns with up to four iterative verifica-tion steps. However, the table also indicates that the memorytransfer verification scheme may falsely suggest in somecases (e.g., non-zero incorrect iterations in BACKPROP andLUD). Those cases occur when the compiler cannot resolvethe relationship between (may-)aliased pointers. If the userfollows the false suggestions, the resulting programs maybe corrupted. However, the next verification step (i.e., kernelverification) is able to detect new errors caused by the previ-ous incorrect suggestions and indicate the previous incorrectsuggestions. (The memory transfer and kernel verificationschemes complement each other.) Therefore, the user isstill able to find optimal memory transfer patterns, eventhough intermediate wrong suggestions may unnecessarilyprolong the iteration steps (e.g., LUD). The undetectedredundant transfer in CFD is because current implementationlocally optimizes the memory-transfer-checking mechanismproposed in §III-B.
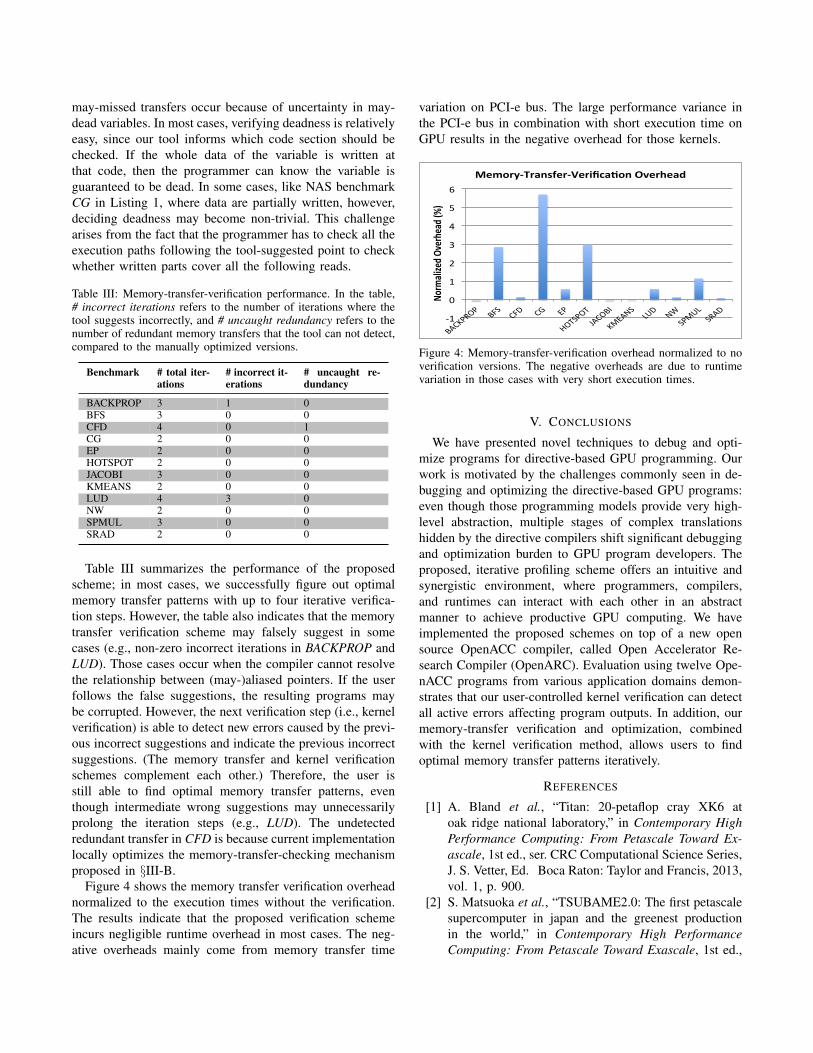
Figure 4 shows the memory transfer verification overheadnormalized to the execution times without the verification.The results indicate that the proposed verification schemeincurs negligible runtime overhead in most cases. The neg-ative overheads mainly come from memory transfer time
variation on PCI-e bus. The large performance variance inthe PCI-e bus in combination with short execution time onGPU results in the negative overhead for those kernels.
-‐1
0
1
2
3
4
5
6
BACKPROP
BFS
CFD
CG EP
HOTSP
OT
JACOBI
KMEANS
LUD NW
SPMUL SRA
D
Norm
alized O
verhead (
%)
Memory-‐Transfer-‐Verifica<on Overhead
Figure 4: Memory-transfer-verification overhead normalized to noverification versions. The negative overheads are due to runtimevariation in those cases with very short execution times.
V. CONCLUSIONS
We have presented novel techniques to debug and opti-mize programs for directive-based GPU programming. Ourwork is motivated by the challenges commonly seen in de-bugging and optimizing the directive-based GPU programs:even though those programming models provide very high-level abstraction, multiple stages of complex translationshidden by the directive compilers shift significant debuggingand optimization burden to GPU program developers. Theproposed, iterative profiling scheme offers an intuitive andsynergistic environment, where programmers, compilers,and runtimes can interact with each other in an abstractmanner to achieve productive GPU computing. We haveimplemented the proposed schemes on top of a new opensource OpenACC compiler, called Open Accelerator Re-search Compiler (OpenARC). Evaluation using twelve Ope-nACC programs from various application domains demon-strates that our user-controlled kernel verification can detectall active errors affecting program outputs. In addition, ourmemory-transfer verification and optimization, combinedwith the kernel verification method, allows users to findoptimal memory transfer patterns iteratively.
REFERENCES
[1] A. Bland et al., “Titan: 20-petaflop cray XK6 atoak ridge national laboratory,” in Contemporary HighPerformance Computing: From Petascale Toward Ex-ascale, 1st ed., ser. CRC Computational Science Series,J. S. Vetter, Ed. Boca Raton: Taylor and Francis, 2013,vol. 1, p. 900.
[2] S. Matsuoka et al., “TSUBAME2.0: The first petascalesupercomputer in japan and the greenest productionin the world,” in Contemporary High PerformanceComputing: From Petascale Toward Exascale, 1st ed.,

ser. CRC Computational Science Series, J. S. Vetter,Ed. Boca Raton: Taylor and Francis, 2013, vol. 1, p.900.
[3] X. Liao, Y. Lu, and M. Xie, “Tianhe-1A supercom-puter: System and application,” in Contemporary HighPerformance Computing: From Petascale Toward Ex-ascale, 1st ed., ser. CRC Computational Science Series,J. S. Vetter, Ed. Boca Raton: Taylor and Francis, 2013,vol. 1, p. 900.
[4] J. S. Vetter et al., “Keeneland: Bringing heterogeneousGPU computing to the computational science commu-nity,” IEEE Computing in Science and Engineering,vol. 13, no. 5, pp. 90–95, 2011.
[5] P. Kogge et al., “Exascale computing study: Tech-nology challenges in achieving Exascale systems,”DARPA Information Processing Techniques Office,Tech. Rep., 2008.
[6] J. C. Beyer, E. J. Stotzer, A. Hart, and B. R. de Supin-ski, “OpenMP for Accelerators.” in IWOMP’11, 2011,pp. 108–121.
[7] T. D. Han and T. S. Abdelrahman, “hiCUDA: High-level GPGPU programming,” IEEE Transactions onParallel and Distributed Systems, vol. 22, no. 1, pp.78–90, 2011.
[8] HMPP, “OpenHMPP directive-based programmingmodel for hybrid computing,” [Online]. Available: http://www.caps-entreprise.com/openhmpp-directives/, (ac-cessed Jan. 29, 2014).
[9] S. Lee and R. Eigenmann, “OpenMPC: ExtendedOpenMP programming and tuning for GPUs,” inSC’10: Proceedings of the 2010 ACM/IEEE conferenceon Supercomputing. IEEE press, 2010.
[10] A. Leung et al., “A mapping path for multi-GPGPUaccelerated computers from a portable high level pro-gramming abstraction,” in Proceedings of the 3rd Work-shop on General-Purpose Computation on GraphicsProcessing Units, ser. GPGPU ’10. ACM, 2010, pp.51–61.
[11] OpenACC, “OpenACC: Directives for Accelerators,”[Online]. Available: http://www.openacc-standard.org,(accessed Jan. 29, 2014).
[12] PGI Accelerator, “The Portland Group, PGI Fortranand C Accelarator Programming Model,” [Online].Available: http://www.pgroup.com/resources/accel.htm, (accessed Jan. 29, 2014).
[13] S. Lee and J. S. Vetter, “Early evaluation of directive-based GPU programming models for productive Exas-cale computing,” in the International Conference forHigh Performance Computing, Networking, Storage,and Analysis (SC). IEEE press, 2012.
[14] NVIDIA, “CUDA,” [Online]. Available:https://developer.nvidia.com/category/zone/cuda-zone,(accessed Jan. 29, 2014).
[15] AMD, “GPU PerfStudio 2,” [Online]. Available:
http://developer.amd.com/tools-and-sdks/graphics-development/gpu-perfstudio-2/, (accessedJan. 29, 2014).
[16] A. D. Malony, S. Biersdorff, W. Spear, andS. Mayanglambam, “An experimental approach to per-formance measurement of heterogeneous parallel appli-cations using CUDA,” in Proceedings of the 24th ACMInternational Conference on Supercomputing, ser. ICS’10. ACM, 2010, pp. 127–136.
[17] NVIDIA, “NVIDIA Visual Profiler,” [Online].Available: https://developer.nvidia.com/nvidia-visual-profiler, (accessed Jan. 29, 2014).
[18] RogueWave, “TotalView graphical debugger,” [On-line]. Available: http://www.roguewave.com/products/totalview.aspx, (accessed Jan. 29, 2014).
[19] Allinea, “Distributed Debugging Tool (DDT),” [On-line]. Available: http://www.allinea.com/products/ddt/,(accessed Jan. 29, 2014).
[20] K. Spafford et al., “The tradeoffs of fused memoryhierarchies in heterogeneous architectures,” in ACMComputing Frontiers (CF), Cagliari, Italy, 2012.
[21] I. Gelado et al., “An asymmetric distributed sharedmemory model for heterogeneous parallel systems,”in Proceedings of the fifteenth edition of ASPLOS onArchitectural support for programming languages andoperating systems, ser. ASPLOS ’10. ACM, 2010, pp.347–358.
[22] T. B. Jablin et al., “Automatic CPU-GPU communica-tion management and optimization,” in Proceedings ofthe 32nd ACM SIGPLAN conference on Programminglanguage design and implementation, ser. PLDI ’11.ACM, 2011, pp. 142–151.
[23] S. Pai, R. Govindarajan, and M. J. Thazhuthaveetil,“Fast and efficient automatic memory managementfor GPUs using compiler-assisted runtime coherencescheme,” in Proceedings of the 21st internationalconference on Parallel architectures and compilationtechniques, ser. PACT ’12. ACM, 2012, pp. 33–42.
[24] T. B. Jablin et al., “Dynamically managed data forCPU-GPU architectures,” in Proceedings of the TenthInternational Symposium on Code Generation and Op-timization, ser. CGO ’12. ACM, 2012, pp. 165–174.
[25] OpenCL, “OpenCL,” [Online]. Available: http://www.khronos.org/opencl/, (accessed Jan. 29, 2014).
[26] C. Dave et al., “Cetus: A source-to-source compilerinfrastructure for multicores,” IEEE Computer, vol. 42,no. 12, pp. 36–42, 2009.
[27] S. Che et al., “Rodinia: A benchmark suite for hetero-geneous computing,” in Proceedings of the IEEE In-ternational Symposium on Workload Characterization(IISWC), 2009.
[28] “OpenARC: Open Accelerator Research Compiler,”[Online]. Available: http://ft.ornl.gov/research/openarc,(accessed Jan. 29, 2014).
Related Documents