FINNISH METEOROLOGICAL INSTITUTE CONTRIBUTIONS No. 124 INTERACTIONS BETWEEN LAND SURFACE, FORESTS AND CLIMATE: REGIONAL MODELLING STUDIES IN THE BOREAL ZONE Yao Gao Division of Atmospheric Sciences Department of Physics Faculty of Science University of Helsinki Helsinki, Finland Academic dissertation To be presented, with the permission of the Faculty of Science of the University of Helsinki, for public criticism in the Auditorium Brainstorm at the Finnish Meteorological Institute, Helsinki, on October 4 th , 2016, at 12 o’clock noon. Finnish Meteorological Institute Helsinki, 2016

Welcome message from author
This document is posted to help you gain knowledge. Please leave a comment to let me know what you think about it! Share it to your friends and learn new things together.
Transcript
FINNISH METEOROLOGICAL INSTITUTE CONTRIBUTIONS No. 124
INTERACTIONS BETWEEN LAND SURFACE, FORESTS AND CLIMATE:
REGIONAL MODELLING STUDIES IN THE BOREAL ZONE
Yao Gao
Division of Atmospheric Sciences Department of Physics
Faculty of Science University of Helsinki
Helsinki, Finland
Academic dissertation
To be presented, with the permission of the Faculty of Science of the University of Helsinki, for public criticism in the Auditorium Brainstorm at the Finnish Meteorological Institute, Helsinki, on October 4th, 2016, at 12 o’clock noon.
Finnish Meteorological Institute Helsinki, 2016
Author’s Address: Finnish Meteorological Institute Climate Research Unit P.O. BOX 503, FI-00101 Helsinki, Finland [email protected]
Supervisors: Docent Tuula Aalto, Ph.D. Department of Physics, University of Helsinki Climate Research Unit, Finnish Meteorological Institute Tiina Markkanen, Ph.D. Climate Research Unit, Finnish Meteorological Institute Professor Ari Laaksonen, Ph.D. Department of Applied Physics, University of Eastern Finland Climate Research Unit, Finnish Meteorological Institute
Reviewers: Docent Samuli Launiainen, Ph.D. Natural Resources Institute Finland Docent Katri Rankinen, Ph.D. Finnish Environment Institute
Opponent: Eleanor Burke, Ph.D. Climate Science Division, UK Met Office Hadley Center
Custos: Professor Timo Vesala, Ph.D. Department of Physics, University of Helsinki
ISBN 978-951-697-893-5 (paperback) ISSN 0782-6117
Helsinki 2016 Erweko Oy
ISBN 978-951-697-894-2 (pdf version) http://ethesis.helsinki.fi
Helsinki 2016 Helsingin yliopiston verkkojulkaisut

Published by Finnish Meteorological Institute Series title, number and report code of publication (Erik Palménin aukio 1), P.O. Box 503 Finnish Meteorological Institute FIN-00101 Helsinki, Finland Contributions 124, FMI-CONT-124 Date October 2016 Author(s) Yao Gao Title Interactions between land surface, forests and climate: regional modelling studies in the boreal zone Abstract
Interactions between the land surface and climate are complex as a range of physical, chemical and biological processes take place. Changes in the land surface or the climate can affect the water, energy and carbon cycles in the Earth system. This thesis discusses a number of critical issues that concern land-atmospheric interactions in the boreal zone, which is characterised by vast areas of peatlands, extensive boreal forests and a long snow cover period. Regional climate modelling and land surface modelling were used as the main tools for this study, in conjunction with observational data for evaluation.
First, to better describe the present-day land cover in the regional climate model, we introduced an up-to-date and high-resolution land cover map to replace the inaccurate and outdated default land cover map for Fennoscandia. Second, in order to provide background information for future forest management actions for climate change mitigation, we studied the biogeophysical effects on the regional climate of peatland forestation, which has been the dominant land cover change in Finland over the last century. Moreover, climate variability can influence the land surface. Although drought is uncommon in northern Europe, an extreme drought occurred in the summer of 2006 in Finland, and induced visible drought symptoms in boreal forests. Thus, we assessed a set of drought indicators with drought impact data in boreal forests in Finland to indicate summer drought in boreal forests. Finally, the impacts of summer drought on water use efficiency of boreal Scots pine forests were studied to gain a deeper understanding of carbon and water dynamics in boreal forest ecosystems.
In summary, the key findings of this thesis include: 1) the updated land cover map led to a slight decrease in biases of the simulated climate conditions. It is expected that the model performance could be improved by further development in model physics. 2) Peatland forestation in Finland can induce a warming effect in the spring of up to 0.43 K and a slight cooling effect in the growing season of less than 0.1 K due to decreased surface albedo and increased evapotranspiration, respectively. Corresponding to spring warming, the snow clearance day was advanced by up to 5 days over a 15-year mean. 3) The soil moisture index SMI was the most capable of the assessed drought indicators in capturing the spatial extent of observed forest damage induced by the extreme drought in 2006 in Finland. Thus, a land surface model capable of reliable predictions of regional soil moisture is important in future drought predictions in the boreal zone. 4) The inherent water use efficiency (IWUE) showed an increase during drought at the ecosystem level, and IWUE was found to be more appropriate than the ecosystem water use efficiency (EWUE) in indicating the impacts of drought on ecosystem functioning. The combined effects of soil moisture drought and atmospheric drought on stomatal conductance have to be taken into account in land surface models at the global scale when simulating the drought effects on plant functioning.
Publishing unit Climate Research Classification (UDC) Keywords 551.58 peatland forestation, regional climate, boreal forests, 556.5 drought, water use efficiency, land surface model ISSN and series title 0782-6117 Finnish Meteorological Institute Contributions ISBN Language Pages 978-951-697-893-5 (paperback) English 146 978-951-697-894-2 (pdf)

1
Acknowledgements
It has been an amazing journey to me to do my PhD studies in Finland, which is such a
peaceful country with the purest nature and the most lovely people. During this journey, there
were always helpful people around me, helping with my worries and encouraging me to keep
moving towards the destination. Quite often I feel very lucky to have the chance to know the
country and the people here in my life. I would like to express my sincere gratitude to all the
people who have offered helping hands during my studies.
I deeply appreciate Prof. Ari Laaksonen for giving me the opportunity to work on an
interesting multi-disciplinary project at the Finnish Meteorological Institute (FMI), which has
an excellent working environment and good facilities. I am grateful to Ari for his enormous
trust, patience and encouragement to let me start from scratch in the beginning. During my
work, Ari has been always supportive and given fast responses. I also want to thank Prof.
Timo Vesala, who gave me a chance to be a PhD candidate at the Division of Atmospheric
Sciences, Department of Physics, University of Helsinki.
I owe a debt of gratitude to my daily supervisor Dr. Tiina Markkanen, for her invaluable
guidance at every step to achieve my PhD. Due to her kindness, she soon “luckily” became
the one whom I bother first when encountering problems, but she never complained and
always did her best to help me. Whenever I got lost my focus in my research, Tiina was
always the intellectual woman to direct me forward. I appreciate the plentiful time and
patience she spent on supervising me, correcting my mistakes and teaching me the way of
doing research. Moreover, her independent, aspirant, sensible, encouraging and elegant
personality is something that I can learn from throughout my life. Tiina, I can never thank you
enough.
Many special thanks also go to Dos. Tuula Aalto, the dedicated and considerate group leader
of the carbon cycle modelling group at FMI. Tuula has also been giving me extraordinary
guidance on my work too. Her insightful opinions always work like magic keys to open doors,
and they played an indispensable role in facilitating the progress of my study. I also want to
thank Tuula for her trust on me, and for providing me an opportunity to continue working on

2
her collaborative projects with interesting research topics after my PhD. I also would like to
appreciate my former group leader of the climate modelling group at FMI, Dr. Leif Backman,
who helped me to start my work smoothly and gave supervision on the first two papers of my
thesis with great patience.
I am truly thankful to all of my co-authors and colleges, who have actively assisted my work.
Thanks to them all for creating a friendly and supportive work environment, and thanks for
their contributions and willingness to help during the work. Their enthusiasm in research has
made my work even more enjoyable.
I wish to thank Dos. Samuli Launiainen and Dos. Katri Rankinen, who carefully reviewed this
thesis and gave valuable suggestions for improvements.
During my studies here abroad, my Chinese friends have shared many enjoyable moments
with me. With their company and support, I feel much less homesick and lonely. They deserve
my earnest thanks and I wish all the best for their future!
I would give special thanks to Mr. Cees Timmers, a friend with great wisdom, who positively
affected me with his generous attitude to life and encouraged me to pursue what I want.
My deepest appreciation goes to my family for their endless love. Thanks to my mother and
father, who always provide me the most stable environment to let me enjoy the best aspects of
life. My dear grandma, I will carry forward your spirit, trying to be brave and strong in life.
Last but not least, I want to thank my husband for his patient love, support and
encouragement in all those years. Without you, I just would not make it.
Helsinki, September 2016
Yao Gao

3
Abbreviations CLC Corine Land Cover CMIP Coupled Model Intercomparison Project EC Eddy Covariance EDF Extreme Drought that affects Forest health ET Evapotranspiration EWUE Ecosystem Water Use Efficiency EWUEt Transpiration-based Ecosystem Water Use Efficiency FNFI1 1st Finnish National Forest Inventory FNFI10 10th Finnish National Forest Inventory GCMs Global Circulation Models GHGs Greenhouse Gases GLCCD Global Land Cover Characteristics Database GPP Gross Primary Production IWUE Inherent Water Use Efficiency IWUEt Transpiration-based Inherent Water Use Efficiency LAI Leaf Area Index LSMs Land Surface Models LSS Land Surface Scheme MPI–ESM Max Planck Institute for Meteorology Earth System Model PFTs Plant Functional Types REW Relative Extractable Water SMA Soil Moisture Anomaly SMI Soil Moisture Index SPI Standardised Precipitation Index SPEI Standardised Precipitation-Evapotranspiration Index VPD Vapour Pressure Deficit WMO World Meteorological Organization WUE Water Use Efficiency
4
Contents List of publications……………………………………………………………………………5 1. Introduction……………………………………………………………………………...…6 2. Scientific background …………………………………………………………………….10
2.1 Surface energy and water balance ................................................................................... 10 2.2 Photosynthesis, transpiration and stomatal conductance ................................................ 12
3. Material and methods …………………………………………………………………….14 3.1 Models ............................................................................................................................. 14
3.1.1 REMO regional climate model ................................................................................. 14 3.1.2 JSBACH land surface model .................................................................................... 17
3.2 Observations .................................................................................................................... 19 3.2.1 Land cover maps ....................................................................................................... 19 3.2.2 Meteorological observations and ecosystem flux data ............................................. 21 3.2.3 Forest health observation data .................................................................................. 23
3.3 Studied indicators ............................................................................................................ 24 3.3.1 Drought indicators .................................................................................................... 24 3.3.2 Ecosystem functioning metrics ................................................................................. 25
4. Overview of key results…………………………………………………………………...28 4.1 Effects of land cover on regional climate ........................................................................ 28
4.1.1 Implementing an updated land cover map in the regional climate model REMO .... 28 4.1.2 Biogeophysical impacts of peatland forestation on regional climate changes in Finland ............................................................................................................................... 30
4.2 Indicating summer drought in boreal forests with drought indicators ............................ 32 4.3 Response of water use efficiency to summer drought in boreal Scots pine forest .......... 35 4.4 Limitation of our regional modelling studies .................................................................. 39
5. Review of papers and author's contribution……………………………………………40 6. Concluding remarks………………………………………………………………………42 References……………………………………………………………………………………45
5
List of publications
This thesis consists of an introductory review, followed by four peer-reviewed research
articles. In the review, these papers are cited according to their roman numerals.
I: Gao Y., Weiher S., Markkanen T., Pietikäinen J.-P., Gregow H., Henttonen H. M., Jacob
D. and Laaksonen A.: Implementation of the CORINE land use classification in the
regional climate model REMO. Boreal Env. Res., 20, 261–282, 2015.
II: Gao, Y., Markkanen, T., Backman, L., Henttonen, H. M., Pietikäinen, J.-P., Mäkelä, H.
M., and Laaksonen, A.: Biogeophysical impacts of peatland forestation on regional
climate changes in Finland. Biogeosciences, 11, 7251–7267,
doi:10.5194/bg-11-7251-2014, 2014.
III: Gao Y., Markkanen T., Thum T., Aurela M., Lohila A., Mammarella I., Kämäräinen M.,
Hagemann S. and Aalto T.: Assessing various drought indicators in representing summer
drought in boreal forests in Finland. Hydrol. Earth. Syst. Sci., 20, 175-191,
doi:10.5194/hess-20-175-2016, 2016.
IV: Gao, Y., Markkanen, T., Aurela M., Mammarella I., Thum T., Tsuruta A., Yang H. and
Aalto T.: Response of water use efficiency to summer drought in boreal Scots pine forests
in Finland. Biogeosciences Discuss., doi:10.5194/bg-2016-198, in review, 2016.
6
1. Introduction
The land surface interacts with the climate through physical, chemical and biological
processes, which impact on the energy balance and hydrologic cycle of the Earth, as well as
on the atmospheric composition (Bonan, 2008). In the context of global climate change
induced by anthropogenic emissions of greenhouse gases (GHGs) (IPCC, 2013), detailed
analyses of the processes that modulate land-atmosphere interactions are essential for precise
future climate predictions and suitable climate change mitigation measures.
Land use and land cover change can have impacts on the climate, and will continue to be an
important climate forcing in the future (Feddema et al., 2005). A large body of research has
investigated the effects of land use and land cover change on climate over the last decade
(Bathiany et al., 2010; Gálos et al., 2011; Göttel et al., 2008; Ge and Zou, 2013; Pielke et al.,
2011). In this work, we focused on Finland, where peatland forestation has been intensively
conducted (drainage to stimulate forest growth) in naturally treeless or sparsely treed
peatlands over the second half of 20th century (Päivänen and Hånell, 2012). The peatland area
in Finland in the 1950s was estimated to be 9.7 million ha (Ilvessalo, 1956), of which around
5.5 million ha had been drained for peatland forestation by the beginning of 2000s
(Minkkinen et al., 2002; Tomppo et al., 2011). The climatic impacts of peatland forestation
have been studied with site-level data and observation-based regional data over Finland
(Lohila et al., 2010; Solantie, 1994). However, those studies using observational data were
notable to distinguish the effects of peatland forestation on regional climate conditions from
global climate changes caused by the increase in concentrations of atmospheric GHGs. In
particular, regional scale quantification of the impacts of peatland forestation on the climate
from the biogeophysical aspects has not been investigated. Such information is needed for
future forest management in regard to climate mitigation.
Moreover, the variability of climate conditions can influence the land surface. Boreal forests
have been recognised as a “tipping element” of the Earth system as they are highly sensitive
to climate warming (Lenton et al., 2008). Climate extremes such as drought can lead to
reductions in forest transpiration and productivity, and even tree mortality in boreal forests
7
(Allen et al., 2010; Ciais et al., 2005; Granier et al., 2007; Peng et al., 2011). In the summer of
2006, visible drought symptoms on forest appearance were observed in around 30% of forest
health observation sites in southern Finland (< 65 °N) (Muukkonen et al., 2015).
Various drought indicators have been proposed in recent years. However, a number of factors
lead to difficulties in drought indication, such as the cumulative nature of drought, the
temporal and spatial variance during drought development, and the diverse systems that
drought could have impacts on (Heim, 2002). Based on meteorological variables, the
Standardised Precipitation Index (SPI) and the Standardised Precipitation-Evapotranspiration
Index (SPEI) can be calculated at different time scales, and provide a spatially and temporally
invariant comparison of drought (McKee et al., 1993; McKee et al., 1995; Vicente-Serrano et
al., 2010). Prolonged meteorological drought can initiate shortage in soil moisture, which is
closely linked to plant physiology (Mishra and Singh, 2010; Seneviratne et al., 2010). The soil
moisture status can be investigated relative to the long-term normal as Soil Moisture Anomaly
(SMA), or instantaneously as Soil Moisture Index (SMI) (also referred to as Relative
Extractable Water (REW)) (Granier et al., 1999; Lagergren and Lindroth, 2002; Orlowsky and
Seneviratne, 2013). Although those drought indicators are globally applicable, their
capabilities in indicating specific drought phenomenon at a regional level have rarely been
validated in reference to drought impact data (Blauhut et al., 2015). In particular, few drought
studies exist in northern Europe because of the low occurrence of drought.
Furthermore, the disturbance of ecosystem functioning has an impact on the water, energy and
carbon cycles, for instance, turning an ecosystem from a carbon sink to a carbon source under
severe drought (Keenan et al., 2013; Ma et al., 2012; Reichstein et al., 2013). Water Use
Efficiency (WUE) is a key metric describing plant functioning. It quantifies the trade-off
between photosynthetic carbon assimilation and transpiration at the leaf level (Farquhar et al.,
1982). With the widespread application of the eddy covariance (EC) technique, WUE can be
calculated at the ecosystem level (EWUE) as the ratio between gross primary production
(GPP) and evapotranspiration (ET) (Arneth et al., 2006; Law et al., 2002; Lloyd et al., 2002).
The impact of drought on EWUE has been broadly studied; however, there is no agreement
8
on the changes of EWUE in the forest ecosystem in regard to drought (Ge et al., 2014;
Granier et al., 2008; Reichstein et al., 2007; Wolf et al., 2013). In addition, the ecosystem
level inherent water use efficiency (IWUE), which can partly counteract the effect of
increased vapour pressure deficit (VPD) on ET, has been proposed, and has been shown to
increase during a short-term moderate drought (Beer et al., 2009).
Land surface and regional climate models have paved the way for a detailed exploration of the
underlying processes that modulate land surface and climate interactions. Regional climate
models with high spatial resolution are able to resolve small-scale atmospheric physical and
fluid dynamic processes; therefore, they are applicable for the estimation of location, timing
and intensity of the climatic influence caused by regional land cover change (Castro et al.,
2005; Déqué et al., 2005; Jacob et al., 2007; McGregor, 1997). Land Surface Models (LSMs)
focus on land surface processes. LSMs can simulate plant photosynthesis and phenology and
the energy, water and carbon exchange between the land surface and the atmosphere (Pitman,
2003). LSMs have also been recognised as a valuable tool to derive spatial distribution of soil
moisture, due to the limitations of ground observed soil moisture in space and time and the
inability of microwave remote sensing to detect soil moisture in deeper soil layers other than a
few centimetres from the surface (Hain et al., 2011; Rebel et al., 2012; Seneviratne et al.,
2010). To ensure reliable analyses, model results need to be evaluated with observed datasets
and to be interpreted with caution.
This thesis aims to increase our understanding of the interactions between the land surface,
forests and climate in the boreal zone. More specifically, the objectives of this thesis are to:
- quantify peatland forestation impacts on the regional climate in Finland from biogeophysical
aspects;
- assess the performance of various drought indicators in representing summer drought in
boreal forests;
- improve our knowledge of the response of ecosystem functioning to summer drought in
boreal Scots pine forests;

9
- identify the benefits and insufficiencies of modelling approaches in investigating land
surface and climate interactions in the boreal zone.
10
2. Scientific background
2.1 Surface energy and water balance
Land surface, forests and climate are linked through the balance of incoming and outgoing
energy, in combination with the water balance at the Earth's surface (Fig. 1). Assuming a
layer of horizontally homogenous vegetation exists as an interface between the land surface
and the atmosphere, the energy balance equation is:
R" = LE + H + G + ∆Q+ (2.1)
where net surface radiation (Rn) is the total amount of energy absorbed by the Earth's surface.
Latent heat flux (LE) is a turbulent flux of energy associated with evaporation from or
condensation to the surface and transpiration by vegetation. Sensible heat flux (H) is a
turbulent flux of energy induced by the vertical temperature gradient between the air and the
surface. Ground heat flux (G) is the heat flux to soil due to temperature gradient within soil.
∆Qs represents the part of energy stored in the assumed interface layer, and it is a sum of
several storage terms, such as the energy used for photosynthesis and released in respiration,
the heat storages in biomass. ∆Qs is often omitted in climate models, as the amount is very
low (Pitman, 2003).
Rn includes two parts: net shortwave radiation and net longwave radiation. The net shortwave
radiation is calculated as the incoming shortwave radiation at the surface (Rs) minus the
reflected part (αRs). Thus, the net shortwave radiation is closely linked to the reflectivity of
surface (surface albedo: α ). Different surfaces or vegetation covers have different
reflectivities. The net longwave radiation is a balance between incoming longwave radiation
at the surface (RL) and outgoing longwave radiation from the surface. The outgoing longwave
radiation is a result of absorbed energy release from the Earth's surface, and can be estimated
following Stefan-Boltzmann's Law as εσT+6, where σ is the Stefan-Boltzmann constant, T+
is surface temperature and ε is surface emissivity. Rn can be formulated by equation:
R" = R+ − αR+ + R8 − εσT+6 (2.2)
11
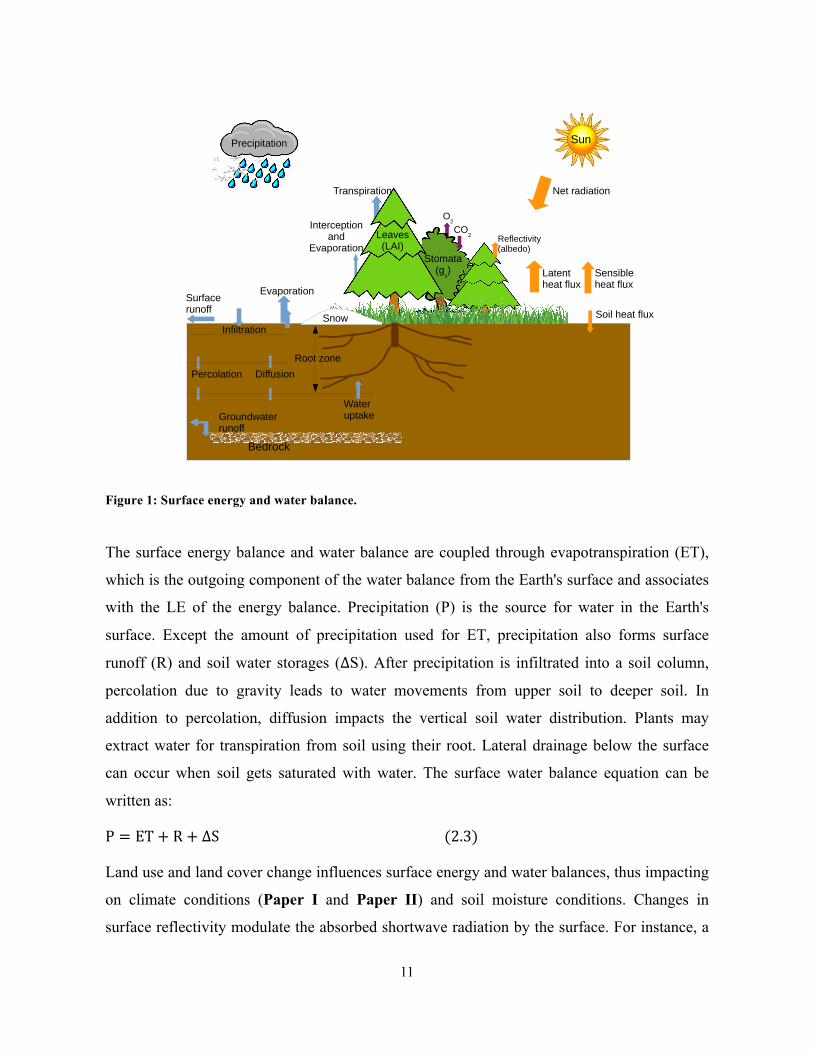
Figure 1: Surface energy and water balance.
The surface energy balance and water balance are coupled through evapotranspiration (ET),
which is the outgoing component of the water balance from the Earth's surface and associates
with the LE of the energy balance. Precipitation (P) is the source for water in the Earth's
surface. Except the amount of precipitation used for ET, precipitation also forms surface
runoff (R) and soil water storages (∆S). After precipitation is infiltrated into a soil column,
percolation due to gravity leads to water movements from upper soil to deeper soil. In
addition to percolation, diffusion impacts the vertical soil water distribution. Plants may
extract water for transpiration from soil using their root. Lateral drainage below the surface
can occur when soil gets saturated with water. The surface water balance equation can be
written as:
P = ET + R + ∆S (2.3)
Land use and land cover change influences surface energy and water balances, thus impacting
on climate conditions (Paper I and Paper II) and soil moisture conditions. Changes in
surface reflectivity modulate the absorbed shortwave radiation by the surface. For instance, a
Precipitation Sun
Snow
Root zone
Bedrock
Evaporation
Transpiration
Interception and
Evaporation
Surface runoff
Infiltration
Water uptake
Percolation Diffusion
Groundwater runoff
Leaves(LAI)
CO2
O2
Net radiation
Latent heat flux
Sensible heat flux
Soil heat flux
Stomata (g
s)
Reflectivity (albedo)
12
snow-covered open area can reflect much more incoming shortwave radiation than a
non-snow-covered coniferous forest. Various vegetation types have different ability in
transpiration, which is related to leaf area and root depth. Leaf area also determines the
precipitation interception capacity. Changes in ET amount can lead to changes in LE.
Moreover, the changes in the distribution of root depth can have an impact on soil hydrology.
The root zone depth is a surface parameter that describes where plants may extract water for
transpiration from soil using their root. Furthermore, the turbulent exchange of momentum,
energy and moisture between the surface and the atmosphere is influenced by the roughness
of the surface, which can be parameterised as roughness length in models. Forests have larger
roughness length compared to other vegetation types. Three components (P, ET, ∆S) of the
surface water balance have been used in the calculation of different drought indicators, which
are assessed for indicating summer drought in boreal forests (Paper III).
2.2 Photosynthesis, transpiration and stomatal conductance
In the photosynthesis processes, plants assimilate CO2 from the atmosphere in the
environment with light and water (H2O) to produce carbohydrates (CH2O) and release O2 to
the atmosphere which can be generally shown as equation below:
CO2 + H2O + light → CH2O + O2 (2.4)
Light, temperature and water are the most important environment conditions that affect
photosynthesis. The assimilation rate of a plant can be strongly limited in low light
environment and get saturated when there is plenty light. As the activity of enzymes used for
photosynthesis is mainly dependent on temperature, the leaf temperature thus has an impact
on the assimilation rate. Under an environment with sufficient light and warm temperature,
water availability is the limiting factor that most relevant to the photosynthesis capacity,
which determines the light-saturated assimilation rate. Visible impacts on forest appearance
have been caused by the summer drought in Finland in 2006 (Muukkonen et al., 2015; Paper
III).
Transpiration is the process of water movement through plants to the atmosphere. Associating

13
with the opening of stomata to allow the diffusion of CO2 from the atmosphere into the leaf
for photosynthesis, transpiration is considered as an unavoidable cost of photosynthesis.
Transpiration transports water and mineral nutrients from roots to leaves, and cool the surface
temperature of plants.
The stomatal conductance is defined as the diffusion coefficient of CO2 multiplied with the
cross sectional area of the stomata. According to mass conservation, transpired H2O diffuses
through stomata 1.6 times faster than CO2. Paper IV studies the summer drought impact on
ecosystem functioning, which is related to photosynthetic carbon assimilation and
transpiration and their connections through stomatal conductance.
14
3. Material and methods
The regional climate model REMO was used in Paper I and II; and the LSM JSBACH was
used in Paper III and IV. The meteorological forcing data for the regional JSBACH
simulation in Paper III were adopted from the REMO simulation using the updated land
cover map in Paper I. In the sections below, the models and their schemes that are most
relevant to this study, as well as various observational data studied in this work are presented.
3.1 Models
3.1.1 REMO regional climate model
REMO is a hydrostatic, three-dimensional atmospheric circulation model that was developed
at the Max Planck Institute for Meteorology in Hamburg, Germany (Jacob and Podzun, 1997;
Jacob et al., 2001). REMO has showed the ability to represent the basic spatiotemporal
patterns of present-day European climate in multi-model intercomparison works, despite the
fact that biases exist in the simulations (Hagemann et al., 2004; Jacob et al., 2001; Jacob et al.,
2007; Kotlarski et al., 2014). The dynamic core of REMO follows Europa-Modell, which is
the former numerical weather prediction model of the German Weather Service (Majewski,
1991). The physical packages (i.e., physical parameterisation scheme) in REMO were
originally adopted from the general circulation model ECHAM4 (Roeckner et al., 1996) and
many of them have been updated afterwards (see details in section 3.1.1.1). The prognostic
variables in REMO include surface pressure, temperature, horizontal wind components,
specific humidity and cloud liquid water and ice.
The model uses a rotated spherical Arakawa-C grid horizontally (Arakawa and Lamb, 1977),
and a terrain-following hybrid sigma-pressure coordinate system vertically. Temporally, a
leap-frog scheme with semi-implicit correction is applied. REMO calculates the fluid
dynamics and atmospheric physical processes inside the model domain with the forcing from
the boundaries, which contains information in regard to large-scale circulation outside the
domain. This is implemented with a relaxation scheme developed by Davies (1976), in which
15
the large-scale forcing decreases exponentially toward the centre of the domain at the eight
outermost gridboxes at each lateral boundary.
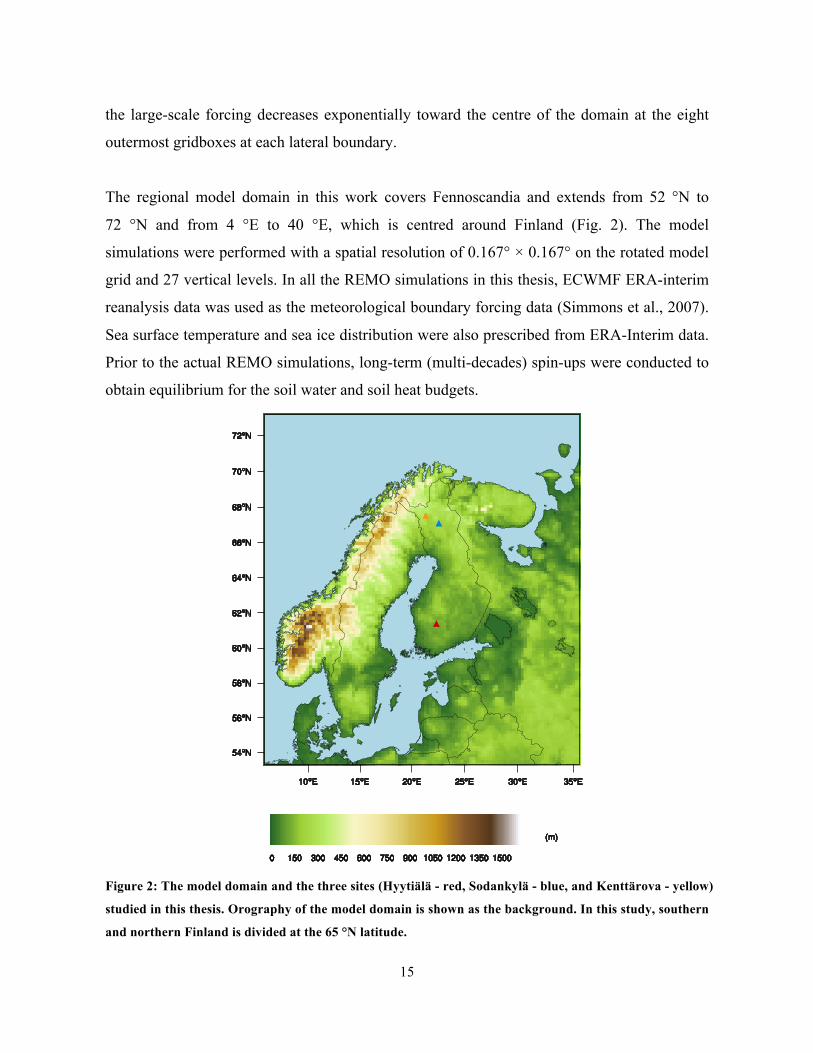
The regional model domain in this work covers Fennoscandia and extends from 52 °N to
72 °N and from 4 °E to 40 °E, which is centred around Finland (Fig. 2). The model
simulations were performed with a spatial resolution of 0.167° × 0.167° on the rotated model
grid and 27 vertical levels. In all the REMO simulations in this thesis, ECWMF ERA-interim
reanalysis data was used as the meteorological boundary forcing data (Simmons et al., 2007).
Sea surface temperature and sea ice distribution were also prescribed from ERA-Interim data.
Prior to the actual REMO simulations, long-term (multi-decades) spin-ups were conducted to
obtain equilibrium for the soil water and soil heat budgets.
Figure 2: The model domain and the three sites (Hyytiälä - red, Sodankylä - blue, and Kenttärova - yellow)
studied in this thesis. Orography of the model domain is shown as the background. In this study, southern
and northern Finland is divided at the 65 °N latitude.
16
3.1.1.1 The land surface scheme of REMO
The Land Surface Scheme (LSS) of REMO contains a set of surface parameters describing
land surface characteristics, which control the surface energy and water balances in REMO.
As the impacts of land cover change on climate conditions were studied in Paper I and Paper
II, the LSS of REMO is briefly introduced in this section.
In REMO LSS, each model gridbox is composed of fractions of land (vegetation and bare
soil), water (ocean and inland lake), and sea ice (Semmler et al., 2004). The biogeophysical
characteristics of land cover types (Olson, 1994a, b) in the default land cover map are
described by a set of surface parameters (Table 3 in Paper I) (Hagemann et al., 1999;
Hagemann, 2002). Those land surface parameters are then averaged according to the
fractional coverage of land cover types in a model gridbox (Claussen et al., 1994; Hagemann
et al., 1999). Three of the land surface parameters that strongly depend on the vegetation
phenology (background surface albedo, leaf area index (LAI), and fractional green vegetation
cover) were prescribed with intra-annual cycles using a monthly varying growth factor, which
accounts for the seasonal growth of vegetation (Hagemann, 2002; Rechid and Jacob, 2006).
Surface albedo is equal to the background surface albedo when there is no snow coverage,
while it is a function of snow albedo, background surface albedo and snow depth in the
snow-cover period (Kotlarski, 2007). In the REMO LSS used in this work, the intra-annual
cycle of background surface albedo has been improved with an advanced parameterisation
using global distributions of pure soil and vegetation albedo derived from MODIS satellite
data from the period 2001–2004 (Rechid, 2008; Rechid et al., 2009). This updated method for
deriving background surface albedo was acceptable for Paper I as it attempted to fit the best
descriptions of the present-day land cover into REMO. However, the method is not suitable
for historical land-use change studies (such as Paper II) because those albedo maps were not
measured during the period with historical land cover. This problem has been recognised by
Preuschmann (2012) and a new method has been proposed. Unfortunately, the proposed
method was not feasible for high-latitude areas with an extensive snow-cover season, because
snow cover hinders the possibility of deriving background albedo values from satellite albedo
17
data. Therefore, a simplified method was developed in Paper II to derive the background
surface albedo values for the land cover classes in the maps; the parameter values in the snow
albedo scheme were also corrected according to Køltzow (2007), Räisänen et al. (2014) and
Roesch et al. (2001) (for a more detailed description of the simplified method see Appendix B
in Paper II). In addition, small corrections were also made for the surface parameters of
coniferous forest and mixed forest in Paper I and Paper II.
The soil temperature is simulated in REMO with heat diffusion equations solved for a
five-layer profile (layer thickness: 0.065, 0.254, 0.913, 2.902 and 5.7 m). The heat
conductivity and heat capacity required by the heat diffusion equations are dependent on the
soil types, for which the FAO/UNESCO soil map of the world is used (FAO/UNESCO,
1971-1981; Kotlarski, 2007). In regard to the soil hydrology, a simple bucket scheme is used
(Manabe, 1969) where the maximum water depth corresponds to the root zone depth
(Hagemann, 2002). The bucket can be filled with precipitation and snow melt, and depleted
through ET (evaporation only occurs in the upper 10 cm of soil) and lateral drainage. The
separation of the water supplement into surface runoff and infiltration follows the Arno
scheme (Dümenil and Todini, 1992). Hagemann and Gates (2003) improved the Arno scheme
to account for the higher resolution subgrid heterogeneity of field capacities within a model
gridbox due to the availability of a high resolution land cover map. Three soil hydrology
parameters (Beta, Wmin and Wmax) were introduced in the improved Arno scheme to
account for the shape of the subgrid distribution of soil water capacities, subgrid minimum
and subgrid maximum soil water capacities.
3.1.2 JSBACH land surface model
JSBACH is the land surface component of the Max Planck Institute for Meteorology Earth
System Model (MPI–ESM) (Roeckner et al., 1996; Stevens et al., 2013). It can be fully
coupled with the atmospheric global circulation model, but it can also run offline as a
comprehensive process-based terrestrial ecosystem model. Land vegetation cover is described
as plant functional types (PFTs) with a set of properties with respect to the processes
accounted for by JSBACH. The photosynthesis model of Farquhar et al. (1980) and Collatz et
18
al. (1992) is used for C3 and C4 plants, respectively.
The land physics of JSBACH were mainly adopted from the physical package of the general
circulation model ECHAM5 (Roeckner et al., 2003). The original soil hydrology scheme in
JSBACH is the simple bucket scheme used in REMO (described in section 3.1.1.1). It was
updated with a 5-layer soil hydrology scheme that has the same vertical distribution as the soil
heat profile in the thermal module (Hagemann and Stacke, 2015). Therefore, the active soil
depth could be below the root zone until bedrock appears. The soil layers below the root zone
can transport water upwards for plant transpiration when the root zone has dried out.
Moreover, unlike the bucket scheme where the whole bucket has to be largely saturated, bare
soil evaporation in the 5-layer scheme can occur when the uppermost soil layer is wet.
The regional JSBACH simulation in Paper III was performed offline at a temporal resolution
of 30 minutes and a spatial resolution of 0.167° × 0.167° at the Fennoscandian domain. The
model was driven by the meteorological data simulated by REMO using the updated land
cover map in Paper I, in which the temperature and precipitation were bias corrected with the
FMI gridded observational data (Aalto et al., 2013). The PFT distribution over the domain
was prescribed based on the more accurate land cover map in Paper I. In addition, in Paper
III and Paper IV, site-level simulations with JSBACH at Finnish EC sites (Hyytiälä,
Sodankylä, and Kenttärova; shown in Fig. 2) were carried out using the half-hourly local
meteorological observations as model forcing. The parameter settings in the JSBACH
site-level simulations were mostly based on site-specific information. Prior to the actual
regional and site-level JSBACH simulations, long-term spin-up runs were conducted to obtain
equilibrium for the soil water and soil heat, as well as for the ecosystem carbon pools.
3.1.2.1 Stomatal conductance model in JSBACH
Stomatal conductance (gs) plays an important role in regulating photosynthesis and
transpiration, especially under water stress. As Paper IV studies the influence of summer
drought on ecosystem functioning in boreal Scots pine forests in Finland, the stomatal
conductance model used in the current version of JSBACH is introduced below.
19
Firstly, the net assimilation rate (An [mol m-2 s-1]) and gs [mol m-2 s-1] are calculated for
unstressed condition, i.e., nonwater limited condition, as the unstressed net assimilation rate
(An,pot [mol m-2 s-1]) and the unstressed stomatal conductance (gs,pot [mol m-2 s-1]). The An,pot is
calculated using the photosynthesis model in JSBACH, for which the intercellular CO2
concentration under unstressed condition (Ci,pot [mol mol-1]) is needed. The Ci,pot is prescribed
using the atmospheric CO2 concentration (Ca [mol mol-1]), where Ci,pot = 0.87Ca for C3 plants
and Ci,pot = 0.67Ca for C4 plants (Knorr, 2000). After the An,pot is determined, the gs,pot is
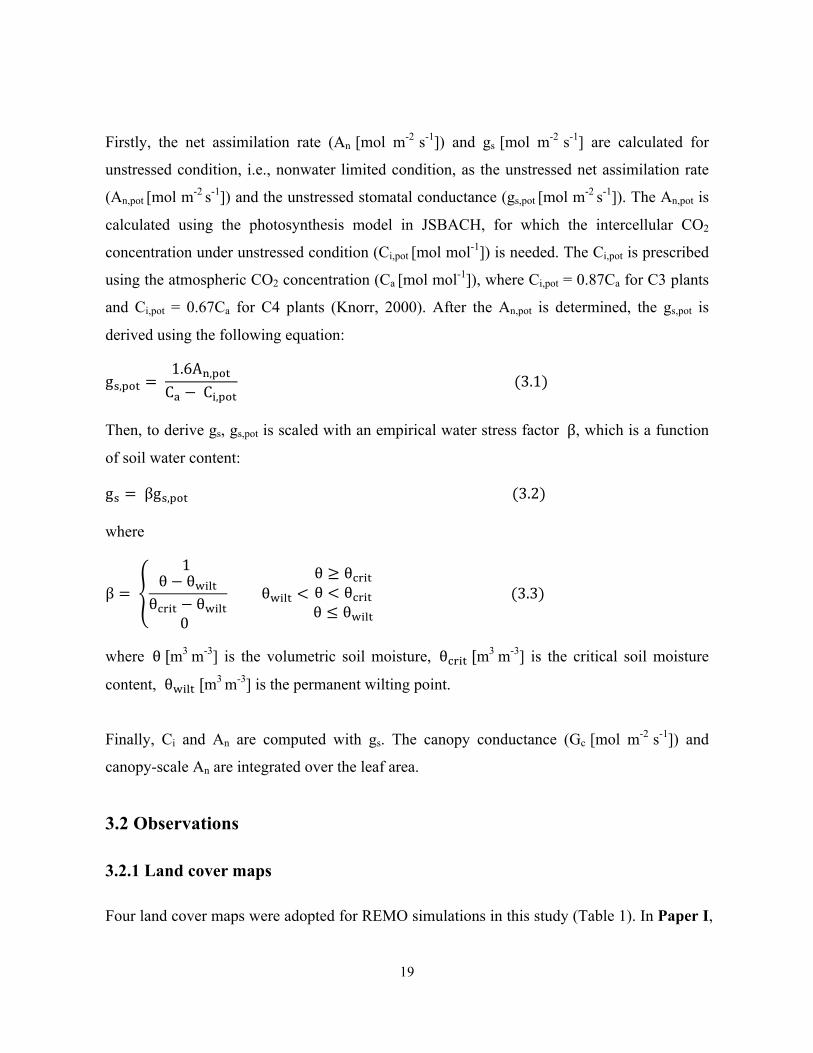
derived using the following equation:
g+,?@A = 1.6A",?@ACE − CF,?@A
(3.1)
Then, to derive gs, gs,pot is scaled with an empirical water stress factor β, which is a function
of soil water content:
g+ = βg+,?@A (3.2)
where
β =
1 θ − θIFJAθKLFA − θIFJA
0
θIFJA <θ ≥ θKLFAθ < θKLFAθ ≤ θIFJA
(3.3)
where θ [m3 m-3] is the volumetric soil moisture, θKLFA [m3 m-3] is the critical soil moisture
content, θIFJA [m3 m-3] is the permanent wilting point.
Finally, Ci and An are computed with gs. The canopy conductance (Gc [mol m-2 s-1]) and
canopy-scale An are integrated over the leaf area.
3.2 Observations
3.2.1 Land cover maps
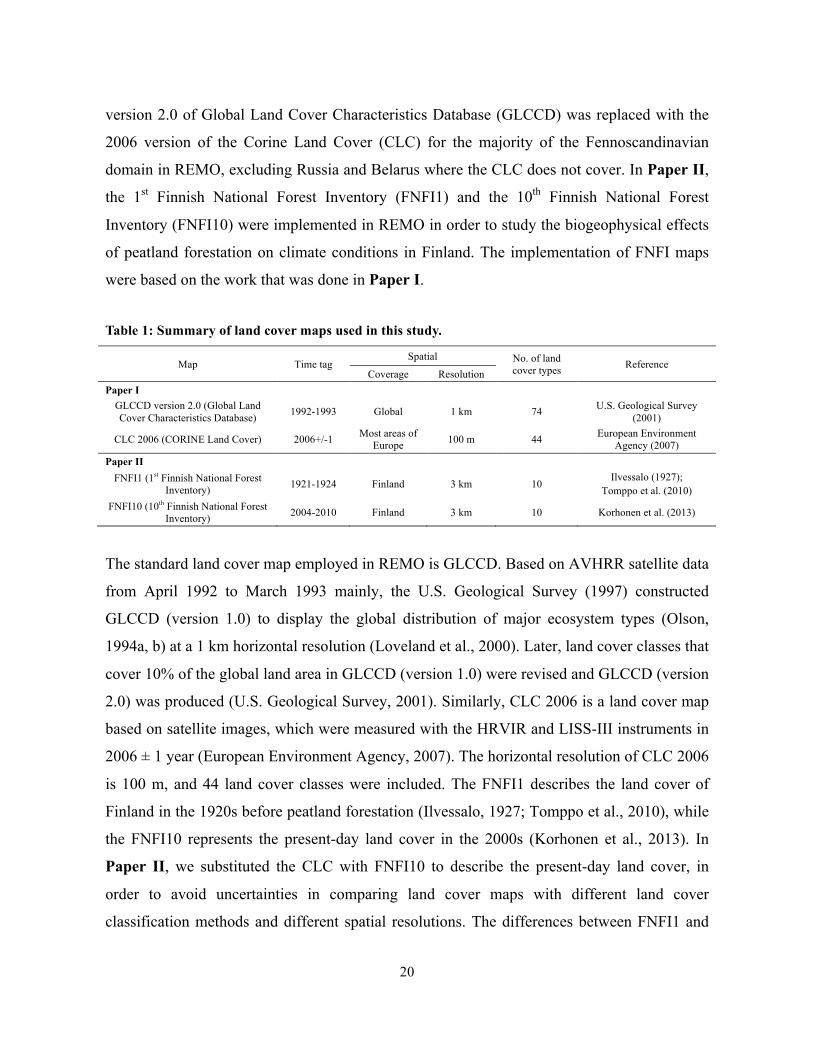
Four land cover maps were adopted for REMO simulations in this study (Table 1). In Paper I,
20
version 2.0 of Global Land Cover Characteristics Database (GLCCD) was replaced with the
2006 version of the Corine Land Cover (CLC) for the majority of the Fennoscandinavian
domain in REMO, excluding Russia and Belarus where the CLC does not cover. In Paper II,
the 1st Finnish National Forest Inventory (FNFI1) and the 10th Finnish National Forest
Inventory (FNFI10) were implemented in REMO in order to study the biogeophysical effects
of peatland forestation on climate conditions in Finland. The implementation of FNFI maps
were based on the work that was done in Paper I.
Table 1: Summary of land cover maps used in this study.
Map Time tag Spatial No. of land
cover types Reference Coverage Resolution
Paper I GLCCD version 2.0 (Global Land Cover Characteristics Database) 1992-1993 Global 1 km 74 U.S. Geological Survey
(2001)
CLC 2006 (CORINE Land Cover) 2006+/-1 Most areas of Europe 100 m 44 European Environment
Agency (2007) Paper II
FNFI1 (1st Finnish National Forest Inventory) 1921-1924 Finland 3 km 10
Ilvessalo (1927); Tomppo et al. (2010)
FNFI10 (10th Finnish National Forest Inventory) 2004-2010 Finland 3 km 10 Korhonen et al. (2013)
The standard land cover map employed in REMO is GLCCD. Based on AVHRR satellite data
from April 1992 to March 1993 mainly, the U.S. Geological Survey (1997) constructed
GLCCD (version 1.0) to display the global distribution of major ecosystem types (Olson,
1994a, b) at a 1 km horizontal resolution (Loveland et al., 2000). Later, land cover classes that
cover 10% of the global land area in GLCCD (version 1.0) were revised and GLCCD (version
2.0) was produced (U.S. Geological Survey, 2001). Similarly, CLC 2006 is a land cover map
based on satellite images, which were measured with the HRVIR and LISS-III instruments in
2006 ± 1 year (European Environment Agency, 2007). The horizontal resolution of CLC 2006
is 100 m, and 44 land cover classes were included. The FNFI1 describes the land cover of
Finland in the 1920s before peatland forestation (Ilvessalo, 1927; Tomppo et al., 2010), while
the FNFI10 represents the present-day land cover in the 2000s (Korhonen et al., 2013). In
Paper II, we substituted the CLC with FNFI10 to describe the present-day land cover, in
order to avoid uncertainties in comparing land cover maps with different land cover
classification methods and different spatial resolutions. The differences between FNFI1 and
21
FNFI10 show the largest historical changes on land cover in Finland due to peatland
forestation, which has started at 1950s. According to the FNFI series, the area of undrained
mires was 8.83 million ha at 1951-1953 (FNFI3), 4.32 million ha at 1986-1994 (FNFI8), 4.14
million ha at 1996-2003 (FNFI9) and 4.00 million ha at 2004-2010 (FNFI10) (Päivänen and
Hånell, 2012). Both the FNFI land cover maps are at a 3 km resolution and include 10 land
cover classes that follow the CLC nomenclature. Both FNFI1 and FNFI10 land cover maps
are post-products that were especially prepared for this study from the respective FNFI field
measurement data (see detailed description of the procedures in Appendix A in Paper II).
The FNFI land cover maps are at a 3 km resolution and include 10 land cover classes that
follow the CLC nomenclature, where the land cover type “peat bogs” is defined as naturally
treeless peatland and mires where the stocking level is low or the mean height of trees is
below 5 m at maturity.
In order to utilise the existing land surface parameters for the default land cover types,
translations of the land cover types in the newly introduced land cover maps to the Olson land
cover types in GLCCD (version 2.0) have been conducted through comparing the definitions
and matching the surface characteristics of land cover types. It is obvious to find appropriate
analogues for some land cover types; for instance, matching the coniferous forest, mixed
forest and broad-leaved forest in FNFI maps with conifer boreal forest, cool mixed forest and
cool broadleaf forest in GLCCD, respectively. However, for some land cover types, such as
transitional woodland/shrub in FNFI maps, it is not straightforward to find correspondence
land cover types in GLCCD, and GLCCD land cover types with suitable land surface
parameters were adopted. All the translations are listed in Table 1 in Paper I and Table B1 in
Appendix B in Paper II.
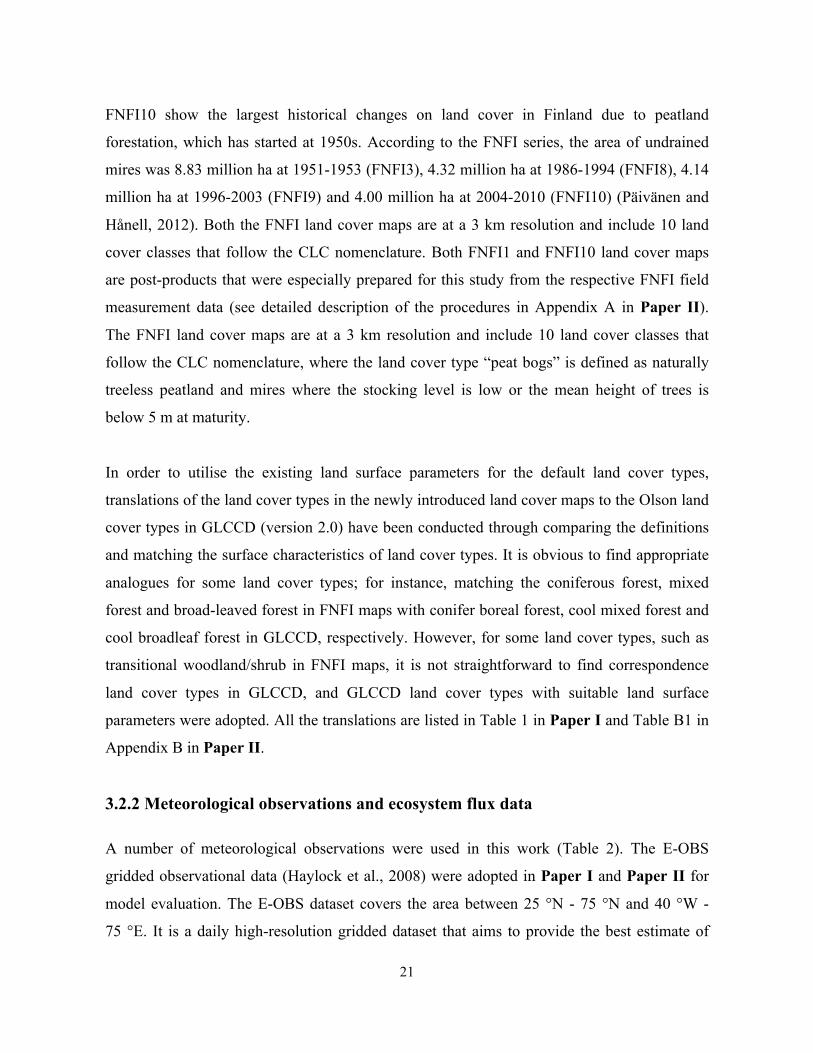
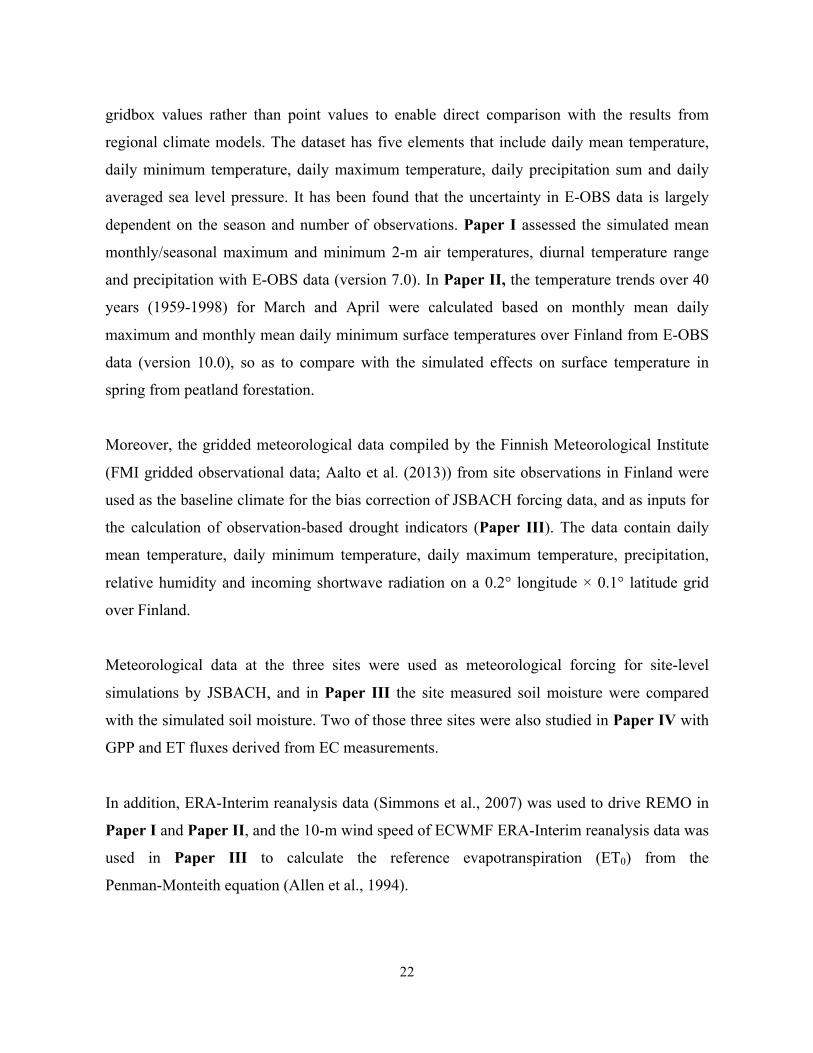
3.2.2 Meteorological observations and ecosystem flux data
A number of meteorological observations were used in this work (Table 2). The E-OBS
gridded observational data (Haylock et al., 2008) were adopted in Paper I and Paper II for
model evaluation. The E-OBS dataset covers the area between 25 °N - 75 °N and 40 °W -
75 °E. It is a daily high-resolution gridded dataset that aims to provide the best estimate of
22
gridbox values rather than point values to enable direct comparison with the results from
regional climate models. The dataset has five elements that include daily mean temperature,
daily minimum temperature, daily maximum temperature, daily precipitation sum and daily
averaged sea level pressure. It has been found that the uncertainty in E-OBS data is largely
dependent on the season and number of observations. Paper I assessed the simulated mean
monthly/seasonal maximum and minimum 2-m air temperatures, diurnal temperature range
and precipitation with E-OBS data (version 7.0). In Paper II, the temperature trends over 40
years (1959-1998) for March and April were calculated based on monthly mean daily
maximum and monthly mean daily minimum surface temperatures over Finland from E-OBS
data (version 10.0), so as to compare with the simulated effects on surface temperature in
spring from peatland forestation.
Moreover, the gridded meteorological data compiled by the Finnish Meteorological Institute
(FMI gridded observational data; Aalto et al. (2013)) from site observations in Finland were
used as the baseline climate for the bias correction of JSBACH forcing data, and as inputs for
the calculation of observation-based drought indicators (Paper III). The data contain daily
mean temperature, daily minimum temperature, daily maximum temperature, precipitation,
relative humidity and incoming shortwave radiation on a 0.2° longitude × 0.1° latitude grid
over Finland.
Meteorological data at the three sites were used as meteorological forcing for site-level
simulations by JSBACH, and in Paper III the site measured soil moisture were compared
with the simulated soil moisture. Two of those three sites were also studied in Paper IV with
GPP and ET fluxes derived from EC measurements.
In addition, ERA-Interim reanalysis data (Simmons et al., 2007) was used to drive REMO in
Paper I and Paper II, and the 10-m wind speed of ECWMF ERA-Interim reanalysis data was
used in Paper III to calculate the reference evapotranspiration (ET0) from the
Penman-Monteith equation (Allen et al., 1994).
23
Table 2: Summary of meteorological observations and ecosystem flux data used in this study.
Data Spatial coverage or site
Spatial resolution or location Time period Time
resolution Functionality Reference
E-OBS Land area of the Fennoscandian domain (Fig. 2)
0.22 rotated grid (Paper I);
0.25 regular grid (Paper II)
2000-2009 (Paper I); March and
April of 1959-1998 (Paper II)
Monthly or seasonal
Model evaluation (Paper I and Paper II)
Haylock et al. (2008)
FMI-gridded observational
data Finland 0.2° lon × 0.1° lat 1981-2010 Daily
Baseline climate for bias correction of REMO simulation
(Paper III); Drought indicator
calculation (Paper III)
Aalto et al. (2013)
ERA-Interim The
Fennoscandian domain (Fig. 2)
80 km
2000-2009 (Paper I); 1797-1996 (Paper II)
6-hourly
Meteorological forcing for REMO regional simulation (Paper I,
Paper II); 10-m wind speed was
used for calculatingET0 for drought indicator
(Paper III)
Simmons et al. (2007)
Site meteorological
data
Hyytiälä, Sodankylä, Kenttärova
(Fig. 2)
61°51′ N, 24°17′ E;
67°22′ N, 26°38′ E;
67°59′ N, 24°15′ E
Summer (June, July, August) of 1999-2009 for Hyytiälä; Summer of
2001-2008 for Sodankylä; Summer of
2008-2010 for Kenttärova
Half-hourly
Meteorological forcing for JSBACH site-level
simulations (Paper III, Paper IV)
Aurela (2005); Aurela et al.
(2015); Vesala et al.
(2005)
Site soil moisture data
Hyytiälä, Sodankylä, Kenttärova
The same as above
The same as above Daily
Drought indicator calculation (Paper III,
Paper IV)
The same as above
Ecosystem flux data
Hyytiälä, Sodankylä
61°51′ N, 24°17′ E;
67°22′ N, 26°38′ E;
Summer of 1999-2009 for
Hyytiälä; Summer of
2001-2008 for Sodankylä
Daily Water use efficiency
calculation (Paper IV)
Mammarella et al. (2016);
Aurela et al. (2015)
3.2.3 Forest health observation data
The forest drought damage percentages in Finland of forest health observation data from 2005
to 2008 in Muukkonen et al. (2015) were adopted in Paper IV. The forest health observation
data are products of the pan-European monitoring programme ICP Forests (the International
Co-operative Programme on the Assessment and Monitoring of Air Pollution Effects on
Forests). Forest drought damage symptoms have been identified since 2005 in Finland
through visual inspections, following internationally standardized methods (Eichorn et al.,
24
2010) and national field guidelines (e.g. Lindgren et al., 2005). The inspections have been
carried out at forest stands during July and August annually by 10-12 trained observers in
Finland. A drought damage site was recognized when a single sample tree in a study site
showed drought symptoms. Therefore, uncertainties in the data can rise from subjective
interpretations and inappropriate time point of the visual inspections. In the summer of 2006,
24.4% of the 603 forest health observation sites over entire Finland showed drought
symptoms, in comparison to 2-4% drought damaged sites in a normal year. Most of the
drought damaged sites located in southern Finland, totalling to 30% of the observation sites in
southern Finland.
3.3 Studied indicators
3.3.1 Drought indicators
The drought indicators studied in Paper III are summarized in Table 3. The SPI is the most
prominent and widely used drought indicator and has been recommended as a standard
drought indicator by the World Meteorological Organization (WMO) due to its flexibility for
various time scales, simplicity in input parameters and calculation, as well as effectiveness in
decision making (Hayes et al., 2011; Sheffield and Wood, 2011). The SPEI was developed
based on the SPI. In addition to precipitation, the SPEI accounts for temperature impacts on
drought (Vicente-Serrano et al., 2010). The SPI and SPEI can be used to indicate the impacts
of drought on various water resources, such as agriculture drought and hydrological drought,
when calculated with different time scales (World Meteorological Organization, 2012). The
SMA has been adopted in the Coupled Model Intercomparison Project (CMIP) in order to
study soil moisture drought under current and future projections in Global Circulation Models
(GCMs) (Orlowsky and Seneviratne, 2013). The SMI has been used to investigate soil water
related plant physiology issues, as it can represent the relative plant available water in the root
zone (Granier et al., 1999; Lagergren and Lindroth, 2002).
25
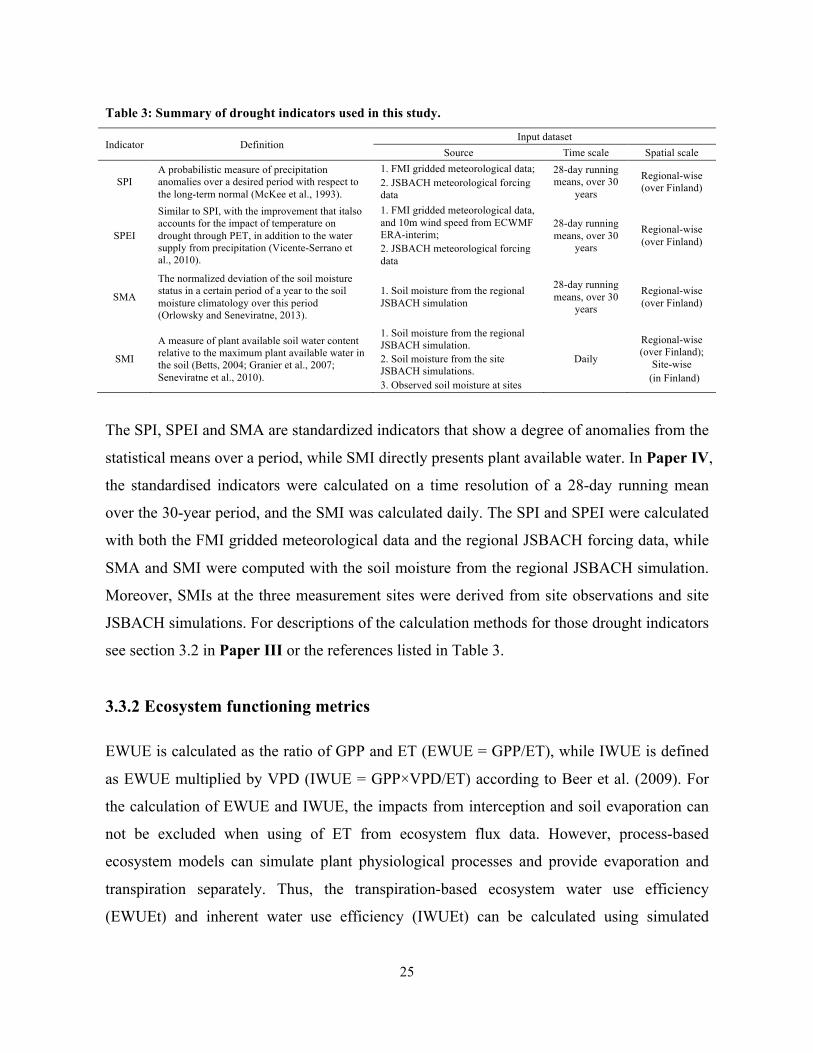
Table 3: Summary of drought indicators used in this study.
Indicator Definition Input dataset
Source Time scale Spatial scale
SPI A probabilistic measure of precipitation anomalies over a desired period with respect to the long-term normal (McKee et al., 1993).
1. FMI gridded meteorological data; 2. JSBACH meteorological forcing data
28-day running means, over 30
years
Regional-wise (over Finland)
SPEI
Similar to SPI, with the improvement that italso accounts for the impact of temperature on drought through PET, in addition to the water supply from precipitation (Vicente-Serrano et al., 2010).
1. FMI gridded meteorological data, and 10m wind speed from ECWMF ERA-interim; 2. JSBACH meteorological forcing data
28-day running means, over 30
years
Regional-wise (over Finland)
SMA
The normalized deviation of the soil moisture status in a certain period of a year to the soil moisture climatology over this period (Orlowsky and Seneviratne, 2013).
1. Soil moisture from the regional JSBACH simulation
28-day running means, over 30
years
Regional-wise (over Finland)
SMI
A measure of plant available soil water content relative to the maximum plant available water in the soil (Betts, 2004; Granier et al., 2007; Seneviratne et al., 2010).
1. Soil moisture from the regional JSBACH simulation. 2. Soil moisture from the site JSBACH simulations. 3. Observed soil moisture at sites
Daily
Regional-wise (over Finland);
Site-wise (in Finland)
The SPI, SPEI and SMA are standardized indicators that show a degree of anomalies from the
statistical means over a period, while SMI directly presents plant available water. In Paper IV,
the standardised indicators were calculated on a time resolution of a 28-day running mean
over the 30-year period, and the SMI was calculated daily. The SPI and SPEI were calculated
with both the FMI gridded meteorological data and the regional JSBACH forcing data, while
SMA and SMI were computed with the soil moisture from the regional JSBACH simulation.
Moreover, SMIs at the three measurement sites were derived from site observations and site
JSBACH simulations. For descriptions of the calculation methods for those drought indicators
see section 3.2 in Paper III or the references listed in Table 3.
3.3.2 Ecosystem functioning metrics
EWUE is calculated as the ratio of GPP and ET (EWUE = GPP/ET), while IWUE is defined
as EWUE multiplied by VPD (IWUE = GPP×VPD/ET) according to Beer et al. (2009). For
the calculation of EWUE and IWUE, the impacts from interception and soil evaporation can
not be excluded when using of ET from ecosystem flux data. However, process-based
ecosystem models can simulate plant physiological processes and provide evaporation and
transpiration separately. Thus, the transpiration-based ecosystem water use efficiency
(EWUEt) and inherent water use efficiency (IWUEt) can be calculated using simulated

26
transpiration. In Paper IV, both EWUE and IWUE were calculated at daily time scales with
ecosystem flux data and JSBACH site-level simulations at a southern (Hyytiälä) and a
northern (Sodankylä) boreal Scots pine (Pinus sylvestris) forest sites in Finland, while
EWUEt and IWUEt were calculated with JSBACH site-level simulations.

27
28
4. Overview of key results
4.1 Effects of land cover on regional climate
4.1.1 Implementing an updated land cover map in the regional climate model
REMO
Land surface parameters are typically attributed to land cover types in climate models.
Therefore, the best information on land cover that is available should be used in climate
models to reduce the uncertainties in simulation results. The default global land cover map in
REMO is GLCCD, which has been found to be inaccurate in representing the present-day
land cover distribution in Finland. For instance, the fraction of peatlands over land area in
Finland estimated by FNFI10 is 7.4% in Korhonen et al. (2013) but 0% in GLCCD, and the
large area of deciduous forest in the middle of Finland in GLCCD is deemed unrealistic.
Moreover, the use of Narrow Conifers as the dominant vegetation type in the lake area in
southern Finland by GLCCD is incorrect. However, those deficiencies are not observed in
CLC, which is a more accurate and higher resolution representation of present-day land cover
in Europe. In Paper I, CLC was implemented in REMO for the northern European domain,
and the impacts of the updated land cover map on regional climate conditions were analysed
with the differences between two decadal (2001-2009) model runs.
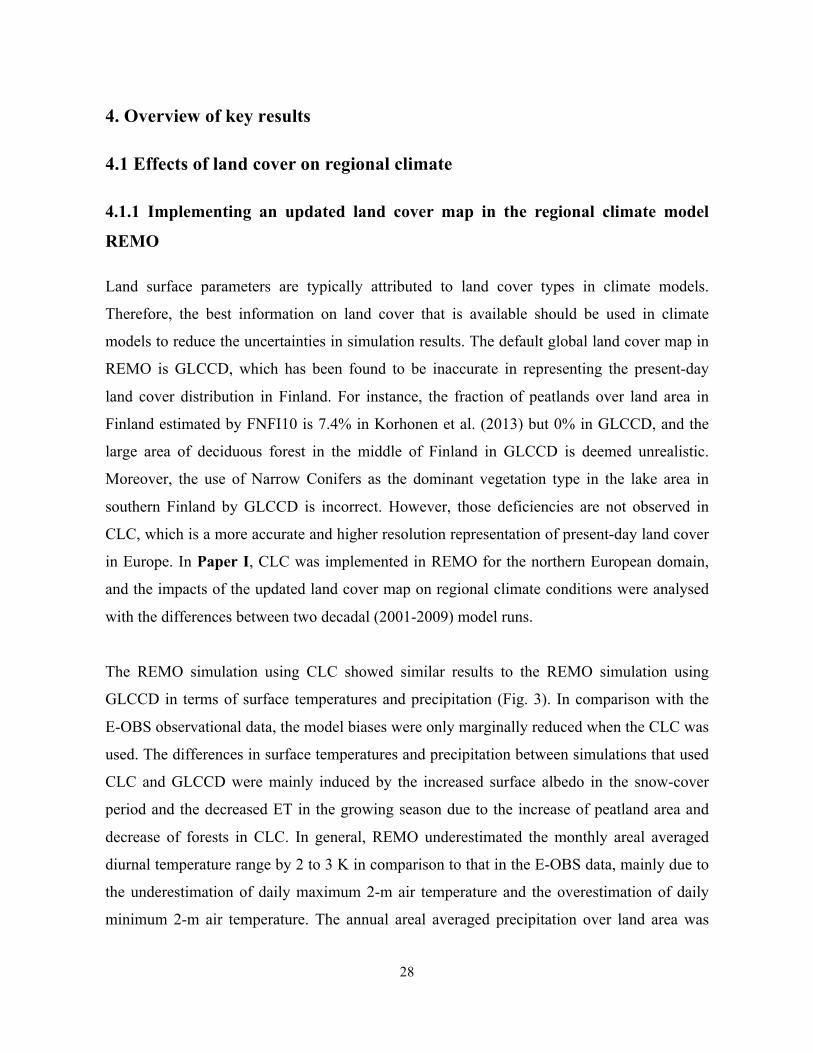
The REMO simulation using CLC showed similar results to the REMO simulation using
GLCCD in terms of surface temperatures and precipitation (Fig. 3). In comparison with the
E-OBS observational data, the model biases were only marginally reduced when the CLC was
used. The differences in surface temperatures and precipitation between simulations that used
CLC and GLCCD were mainly induced by the increased surface albedo in the snow-cover
period and the decreased ET in the growing season due to the increase of peatland area and
decrease of forests in CLC. In general, REMO underestimated the monthly areal averaged
diurnal temperature range by 2 to 3 K in comparison to that in the E-OBS data, mainly due to
the underestimation of daily maximum 2-m air temperature and the overestimation of daily
minimum 2-m air temperature. The annual areal averaged precipitation over land area was
29
overestimated by about 27%. Thus, in order to reduce bias in simulated climate by REMO,
further developments in model physics are required and are the subject of ongoing research.
For example, the 5-layer soil hydrology scheme that was introduced in JSBACH by
Hagemann and Stacke (2015) was investigated with its simulated soil moisture over Finland
(Paper III). This advanced soil hydrology scheme, which was also implemented in REMO to
replace the simple bucket soil hydrology scheme, is under a testing phase. Furthermore, as
there are numerous lakes located in our Fennoscandinavian domain, the implementation of a
lake model in REMO is an ongoing process (J.-P. Pietikäinen, Finnish Meteorological
Institute, personal communication). Moreover, spatially more explicit land cover maps with a
parameter set tailored for the study area could reduce the uncertainties in the simulation
results of climate models.
Figure 3: a) Differences (REMO – E-OBS) in monthly areal averaged daily maximum 2-m temperature
(black) and daily minimum 2-m temperature (red) between the REMO simulation using GLCCD and
E-OBS data (solid lines), and between the REMO simulation using CLC and E-OBS data (dashed lines); b)
Areal averaged monthly mean diurnal temperature ranges in REMO simulations using GLCCD (solid line)
and CLC (dashed line), and in E-OBS (dotted line); c) Monthly mean precipitation averaged over all land
grid points in REMO simulations using GLCCD (solid line) and CLC (dashed line), and in E-OBS (dotted
line). In those figures, the multi-year monthly means were computed over a 9-year period from 1 January
2001 to 31 December 2009 and the area means were computed over the land area in REMO simulation.
Some deficiencies may influence the results of this study as well. Firstly, the translations of
the land cover types between CLC and GLCCD were subjective to a certain extent. Secondly,
the freedom for REMO simulations was limited and the modelled results may be constrained
because the model domain was relatively small (Køltzow, 2007). Furthermore, as E-OBS are
gridded data interpolated from site measurements, the relatively sparse measurement station
density in northern Europe, measurement errors and imperfect interpolation methods are
c
30
possible reasons for the data biases (Haylock et al., 2008).
4.1.2 Biogeophysical impacts of peatland forestation on regional climate changes
in Finland
In Paper II, the biogeophysical impacts of peatland forestation on regional climate conditions
in Finland were studied based on the differences in regional climate conditions between the
REMO simulations with FNFI10 (post-drainage) and FNFI1 (pre-drainage) land cover maps.
The uncertainties related to the model bias were considered to be eliminated by using this
“delta change approach” (Gálos et al., 2011).
Results showed that surface albedo decreased strongly during the snow-cover period and
slightly in the growing season in peatland forestation area (Fig. 5c in Paper II). The biggest
difference in surface albedo occurred in the snow-melt period between the snow-covered open
area and the non-snow-covered forest because of advanced snow clearance day (i.e., the first
day after that the total number of snow-covered days does not exceed the total number of
snow-free days) due to peatland forestation. Other surface parameters describing vegetation
characteristics, including LAI, roughness length, fractional green vegetation cover and forest
ratio, increased throughout the year after peatland forestation. The strongly decreased surface
albedo increases the absorption of the shortwave radiation in the surface, especially in spring
when the incoming solar radiation is more sufficient than in winter. In the growing season, the
increased LAI and fractional green vegetation cover can lead to an increase in ET, thus more
energy were consumed through latent heat flux than gained by the slight decrease in surface
albedo. Moreover, the increased roughness length can increase turbulent mixing and
consequently the magnitudes of turbulent fluxes.
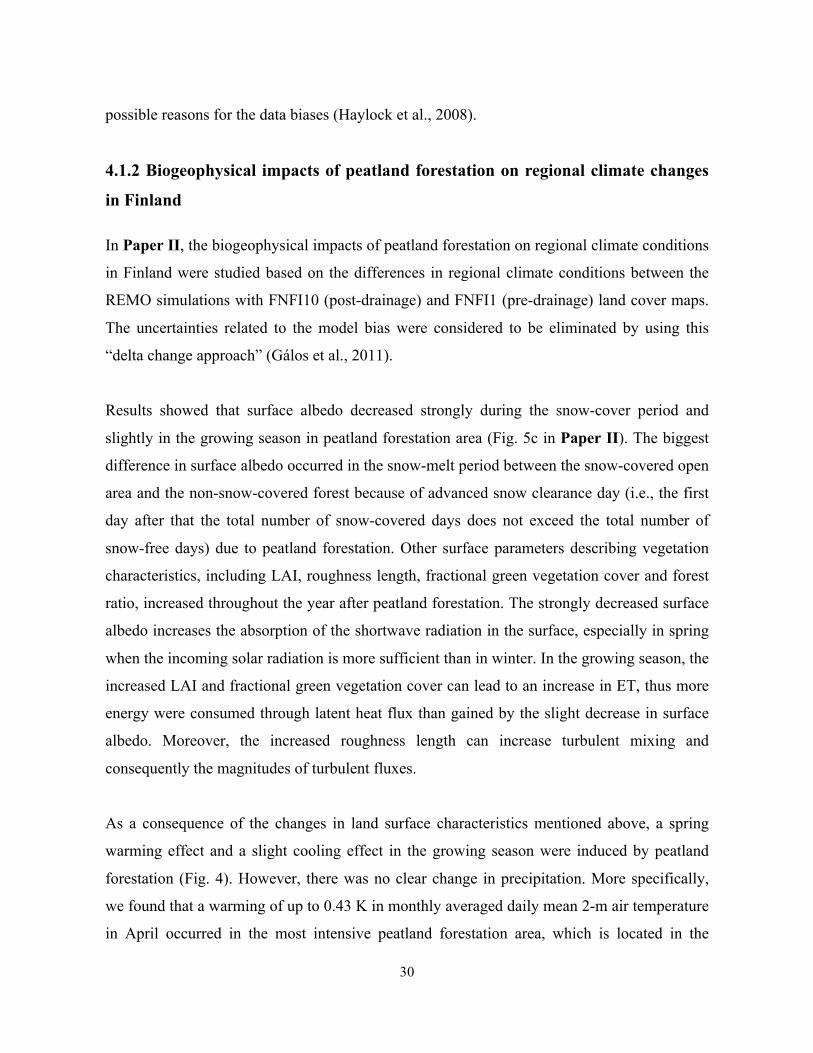
As a consequence of the changes in land surface characteristics mentioned above, a spring
warming effect and a slight cooling effect in the growing season were induced by peatland
forestation (Fig. 4). However, there was no clear change in precipitation. More specifically,
we found that a warming of up to 0.43 K in monthly averaged daily mean 2-m air temperature
in April occurred in the most intensive peatland forestation area, which is located in the
31
middle west of Finland, whereas the temperature showed a slight cooling of less than 0.1 K in
the growing season (from May to October). Also, the snow clearance day was advanced by up
to 5 days in an average of 15-year analyses period in this area. Moreover, it is found that a
positive feedback induced by peatland forestation occurred between the lower surface albedo
and warmer surface air temperature in the snow-melt period. The warming caused by lower
surface albedo led to a quicker and earlier snow melting, which induce more decrease in
surface albedo and increase in surface air temperature. Furthermore, in a more detailed
analysis of the simulated results at the five selected sub-regions (Table 1 in Paper II), which
represent a range of peatland forestation intensities, the results showed that the magnitudes of
differences in the climate variables were dependent on the intensity of land cover changes,
while the timings of the extremes mostly relied on geographical locations that define the
radiation balance through the seasonal cycle.
Figure 4: Upper panel: Changes of fractional coverage of the peat bogs and coniferous forest from 1920s
to 2000s (FNFI10 - FNFI1). Lower panel: The 15-year (1 December 1982 – 30 November 1996) averaged
differences between the model simulation using FNFI10 and using FNFI1 in monthly-averaged daily mean
2-m air temperature in April and June.
32
To validate the realism of the simulated spring warming effect due to peatland forestation, the
40-year (1958-1998) trends of surface temperatures (monthly mean daily maximum and
monthly mean daily minimum) in March and April based on E-OBS data were investigated.
The monthly mean daily maximum temperature in both months showed a statistically
significant increase in major areas of peatland forestation, but the same increases were not
shown in the trends of monthly mean daily minimum temperature. The reason for this is that
daily maximum temperature closely depends on the absorption of the shortwave radiation in
the surface, while daily minimum temperature is more influenced by the general climate
change caused by the increase of GHGs. Nevertheless, it is difficult to compare exact
magnitudes and locations of temperature changes in the simulations and observations, as
many other factors can impact the temperature change in reality. In addition, we also found
that the differences in the regional averaged 11-day running means of the simulated net
surface solar radiation of the most intensive peatland forestation area (Fig. 5d in Paper II)
agrees well with the observed differences (averaged over 1971 to 2000) in daily mean net
surface solar radiation (Fig. 4 in Lohila et al., 2010) between open peatland and forest sites
located in southern and northern Finland (more detailed analyses about this can be seen in
section 5.2 in Paper II).
Overall, the biogeophysical changes due to peatland forestation can lead to warming in spring
and cooling in the growing season of surface. Those impacts on surface air temperature are
rather local, and their magnitudes and timings are dependent on the intensity and geographical
location of peatland forestation. This study also highlights the potential impacts on climate
from the projected increase of woody plants with the earlier onset of the growing season at
high latitudes (Falloon et al., 2012; Zhang et al., 2013).
4.2 Indicating summer drought in boreal forests with drought indicators
Paper III investigated the performance of the drought indicators introduced in section 3.3.1
in describing the timing, spatial extent and intensity of drought in summer over a 30-year
period (1981-2010) in Finland. In particular, this study assessed the capabilities of those
33
drought indicators, in conjunction with the forest health observation data described in section
3.2.3, to capture the Extreme Drought affecting Forest health (EDF) in boreal forests in
Finland. The EDF is defined in this study according to the extreme drought in Finland in 2006,
which caused visible impacts on forest appearance compared to normal years (Muukkonen et
al., 2015). In addition, as the JSBACH simulated regional soil moisture was used in the
calculation of the soil moisture indicators (SMA and SMI), this study also aimed to provide
some insights into the capability of the 5-layer soil hydrology scheme in JSBACH to simulate
soil moisture dynamics across Finland.
Firstly, it was found that simulated soil moisture was in good agreement with the observed
soil moisture at the three sites (Hyytiälä, Sodankylä, Kenttärova), in regard to the seasonal
dynamics of soil moisture and the timing of dry spells (Fig. 2 in Paper III). Nevertheless,
differences existed in the rates of change and amplitudes of variations between the simulated
and observed soil moisture. Differences in the meteorological forcing data and soil type
between the site and the regional grid were the main reasons for the discrepancies between
soil moisture of the site-level simulations and site-located grid results from the regional
simulation. In regional modelling, effective soil characteristics are chosen to represent the
average characteristics of a gridbox due to the large heterogeneity of soil characteristics.
The SPI, SPEI and SMA are standardised indicators that describe the degree of anomalies
over a period, while SMI is directly related to plant available water. The results showed that
the standardised indicators presented less variability along the latitude transection than was
observed with SMI, with the latter indicating drought-prone areas in the shallow soil area
along the coastline in southern Finland, and drought-resistant areas in the peat soil area
(latitudes 66 °N to 68 °N) in northern Finland. We also found that the buffering effects of soil
moisture (i.e. the integrative behaviour of soil moisture) and associated soil moisture memory
can delay and extend the drought episodes as indicated by soil moisture indicators, in
comparison to those by the meteorological indicators. The SPEI showed higher time
correlation coefficients with the soil moisture indicators than SPI, as SPEI takes into account
the surface water balance rather than precipitation only. An example of the drought evolution
34
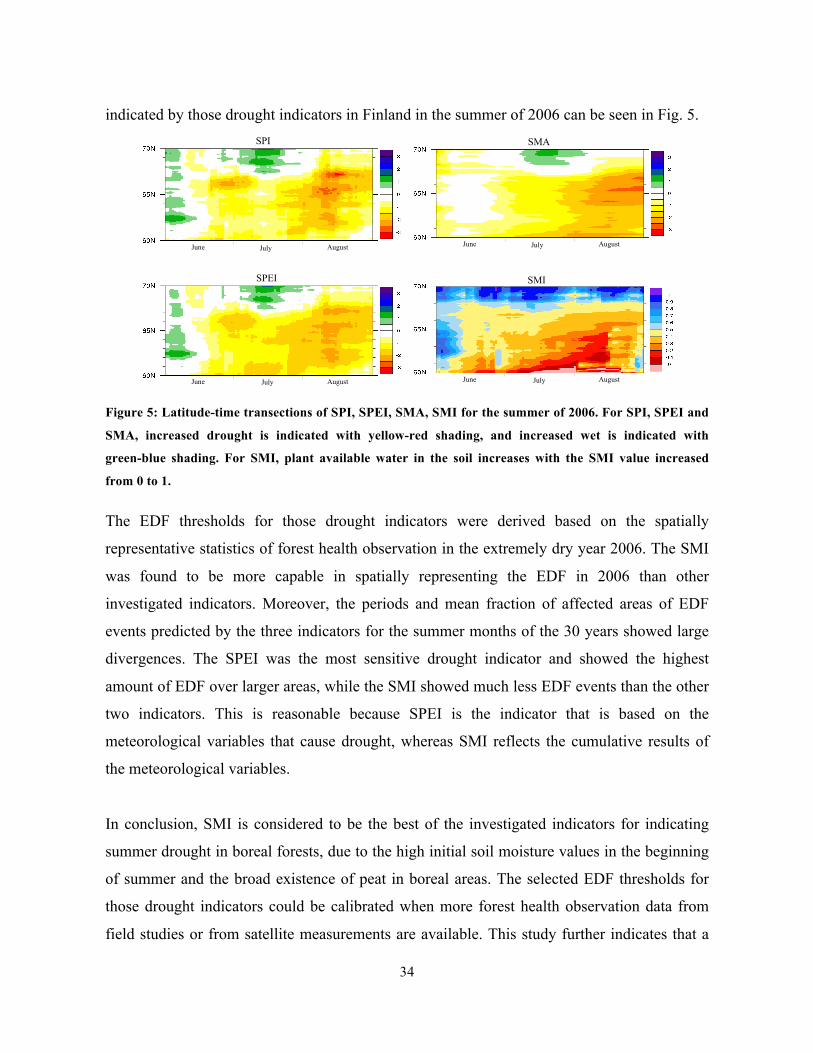
indicated by those drought indicators in Finland in the summer of 2006 can be seen in Fig. 5.
Figure 5: Latitude-time transections of SPI, SPEI, SMA, SMI for the summer of 2006. For SPI, SPEI and
SMA, increased drought is indicated with yellow-red shading, and increased wet is indicated with
green-blue shading. For SMI, plant available water in the soil increases with the SMI value increased
from 0 to 1.
The EDF thresholds for those drought indicators were derived based on the spatially
representative statistics of forest health observation in the extremely dry year 2006. The SMI
was found to be more capable in spatially representing the EDF in 2006 than other
investigated indicators. Moreover, the periods and mean fraction of affected areas of EDF
events predicted by the three indicators for the summer months of the 30 years showed large
divergences. The SPEI was the most sensitive drought indicator and showed the highest
amount of EDF over larger areas, while the SMI showed much less EDF events than the other
two indicators. This is reasonable because SPEI is the indicator that is based on the
meteorological variables that cause drought, whereas SMI reflects the cumulative results of
the meteorological variables.
In conclusion, SMI is considered to be the best of the investigated indicators for indicating
summer drought in boreal forests, due to the high initial soil moisture values in the beginning
of summer and the broad existence of peat in boreal areas. The selected EDF thresholds for
those drought indicators could be calibrated when more forest health observation data from
field studies or from satellite measurements are available. This study further indicates that a
June AugustJuly
SPI
June AugustJuly
SPEI
June AugustJuly
SMA
SMI
June July August
35
land surface model that is capable of reliable prediction of soil moisture is necessary for the
evaluation of drought risks in boreal areas in future climate predictions.
4.3 Response of water use efficiency to summer drought in boreal Scots pine
forest
Paper IV studied the response of water use efficiency to summer drought at daily time scales
at a southern (Hyytiälä) and a northern (Sodankylä) Scots pine forest sites in Finland (site
characteristics can be found in Table 1 in Paper IV). The summer period (June-August) from
an 11-year dataset for Hyytiälä (1999-2009) and from an 8-year dataset for Sodankylä
(2001-2008) were analysed according to data availability. Drought was indicated by the soil
moisture indicator SMI, which was studied in Paper III or volumetric soil moisture (θ) when
the parameters of the soil properties were not measured e.g. at Sodankylä. In addition, the
results based on the JSBACH site-level simulations were evaluated against the observed
results, due to the importance of understanding and projecting biosphere-atmosphere
feedbacks of terrestrial ecosystems under climate change.
Overall, the coupling between GPP and ET followed a non-linear relationship (Fig. 1 and Fig.
S2 in Paper IV). At both sites, GPP and ET increased with increasing incoming solar
radiation, air temperature and VPD, but the impact from soil moisture was not clear. It was
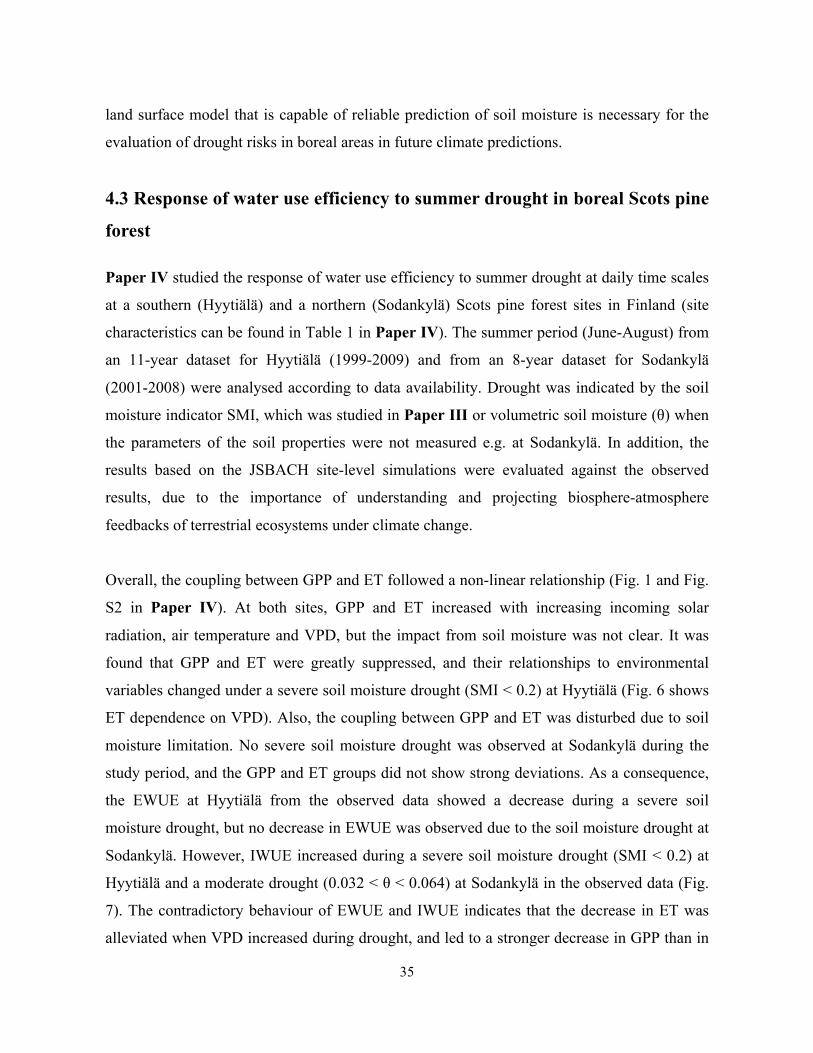
found that GPP and ET were greatly suppressed, and their relationships to environmental
variables changed under a severe soil moisture drought (SMI < 0.2) at Hyytiälä (Fig. 6 shows
ET dependence on VPD). Also, the coupling between GPP and ET was disturbed due to soil
moisture limitation. No severe soil moisture drought was observed at Sodankylä during the
study period, and the GPP and ET groups did not show strong deviations. As a consequence,
the EWUE at Hyytiälä from the observed data showed a decrease during a severe soil
moisture drought, but no decrease in EWUE was observed due to the soil moisture drought at
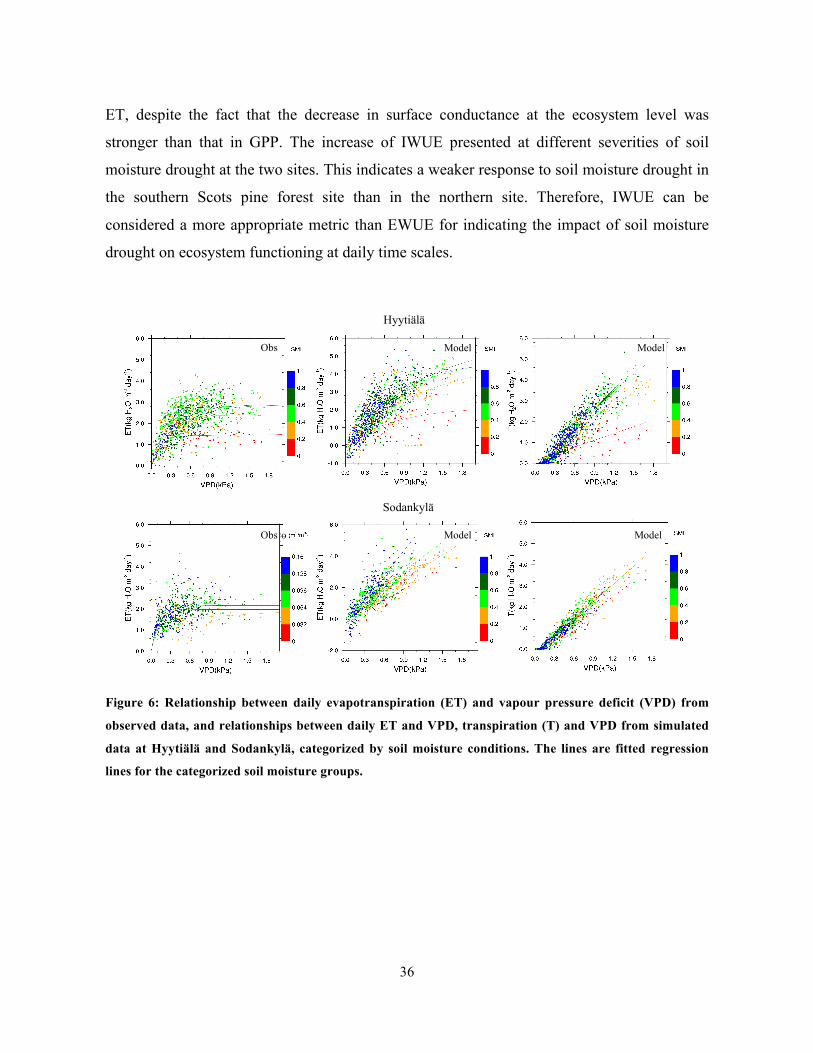
Sodankylä. However, IWUE increased during a severe soil moisture drought (SMI < 0.2) at
Hyytiälä and a moderate drought (0.032 < θ < 0.064) at Sodankylä in the observed data (Fig.
7). The contradictory behaviour of EWUE and IWUE indicates that the decrease in ET was
alleviated when VPD increased during drought, and led to a stronger decrease in GPP than in
36
ET, despite the fact that the decrease in surface conductance at the ecosystem level was
stronger than that in GPP. The increase of IWUE presented at different severities of soil
moisture drought at the two sites. This indicates a weaker response to soil moisture drought in
the southern Scots pine forest site than in the northern site. Therefore, IWUE can be
considered a more appropriate metric than EWUE for indicating the impact of soil moisture
drought on ecosystem functioning at daily time scales.
Figure 6: Relationship between daily evapotranspiration (ET) and vapour pressure deficit (VPD) from
observed data, and relationships between daily ET and VPD, transpiration (T) and VPD from simulated
data at Hyytiälä and Sodankylä, categorized by soil moisture conditions. The lines are fitted regression
lines for the categorized soil moisture groups.
Hyytiälä
Sodankylä
Obs
Obs Model Model
Model Model
θ
37
Figure 7: Relationship between daily ecosystem level water use efficiency (EWUE) and evapotranspiration
(ET), and the relationship between gross primary production multiplied by vapour pressure deficit
(GPP×VPD) and ET from observed data at Hyytiälä and Sodankylä; the relationship between daily
transpiration-based ecosystem water use efficiency (EWUEt) and transpiration (T), and the relationship
between GPP × VPD and T from simulated data at Hyytiälä and Sodankylä.
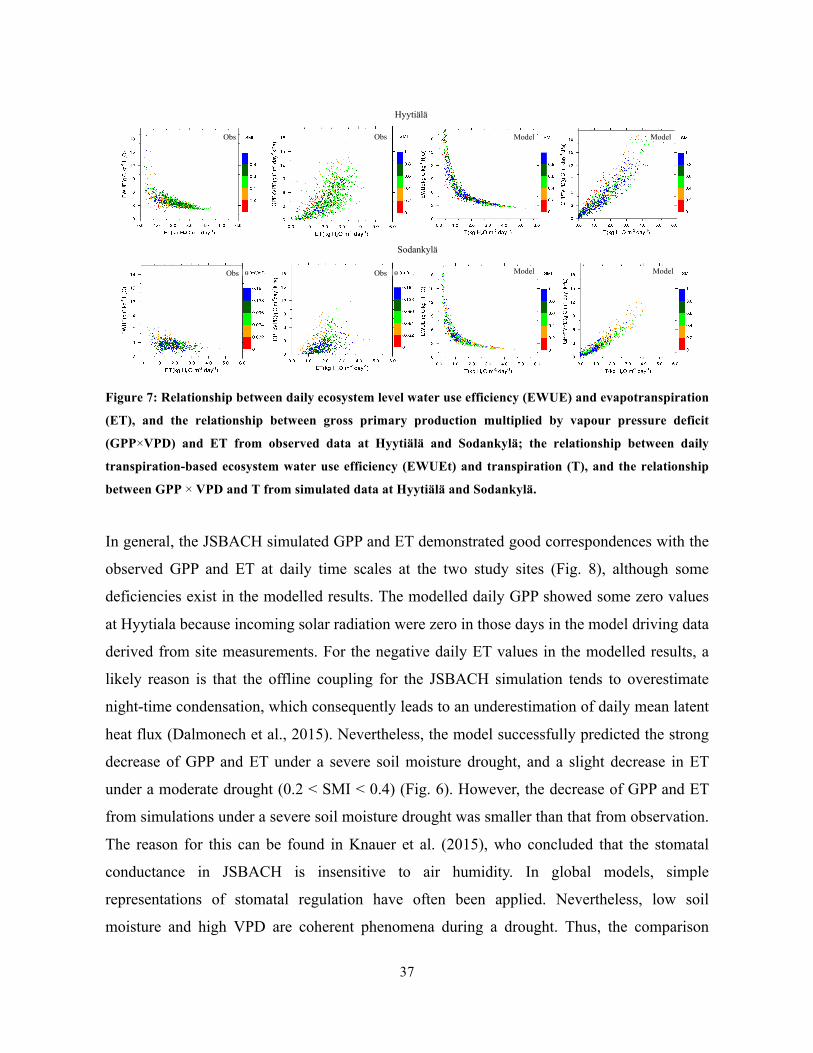
In general, the JSBACH simulated GPP and ET demonstrated good correspondences with the
observed GPP and ET at daily time scales at the two study sites (Fig. 8), although some
deficiencies exist in the modelled results. The modelled daily GPP showed some zero values
at Hyytiala because incoming solar radiation were zero in those days in the model driving data
derived from site measurements. For the negative daily ET values in the modelled results, a
likely reason is that the offline coupling for the JSBACH simulation tends to overestimate
night-time condensation, which consequently leads to an underestimation of daily mean latent
heat flux (Dalmonech et al., 2015). Nevertheless, the model successfully predicted the strong
decrease of GPP and ET under a severe soil moisture drought, and a slight decrease in ET
under a moderate drought (0.2 < SMI < 0.4) (Fig. 6). However, the decrease of GPP and ET
from simulations under a severe soil moisture drought was smaller than that from observation.
The reason for this can be found in Knauer et al. (2015), who concluded that the stomatal
conductance in JSBACH is insensitive to air humidity. In global models, simple
representations of stomatal regulation have often been applied. Nevertheless, low soil
moisture and high VPD are coherent phenomena during a drought. Thus, the comparison
Hyytiälä
Sodankylä
Obs Obs
ObsObs
Model Model
ModelModelθ θ
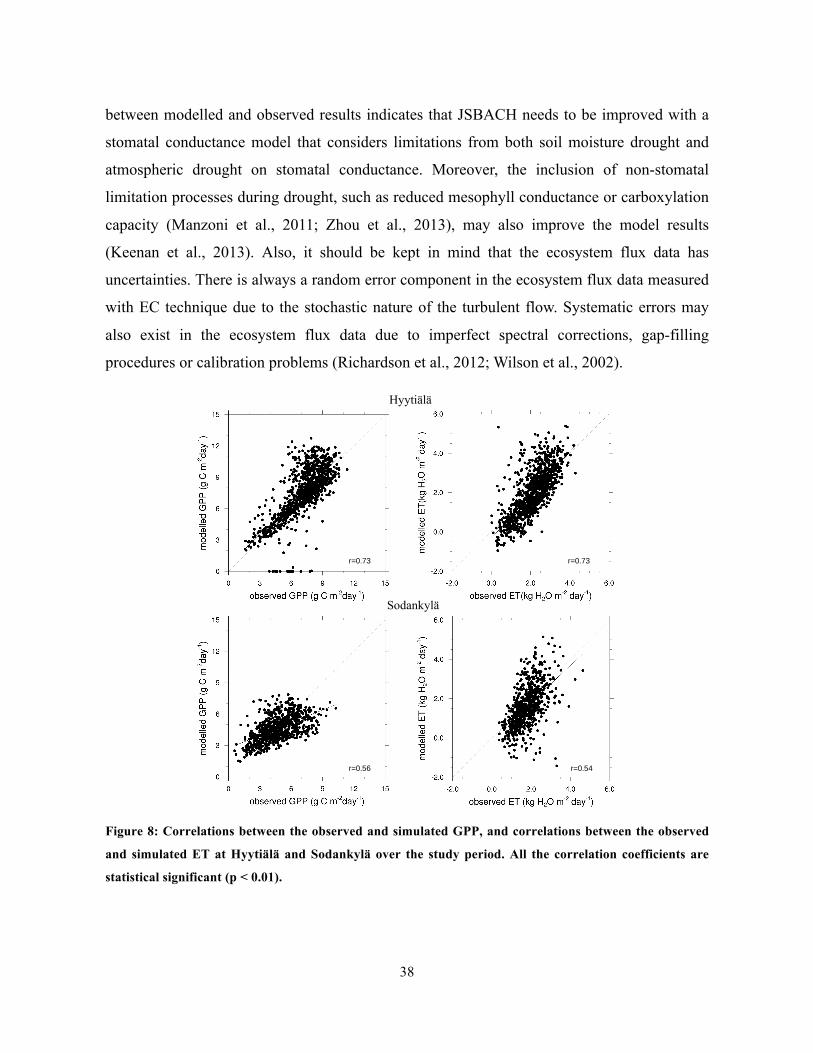
38
between modelled and observed results indicates that JSBACH needs to be improved with a
stomatal conductance model that considers limitations from both soil moisture drought and
atmospheric drought on stomatal conductance. Moreover, the inclusion of non-stomatal
limitation processes during drought, such as reduced mesophyll conductance or carboxylation
capacity (Manzoni et al., 2011; Zhou et al., 2013), may also improve the model results
(Keenan et al., 2013). Also, it should be kept in mind that the ecosystem flux data has
uncertainties. There is always a random error component in the ecosystem flux data measured
with EC technique due to the stochastic nature of the turbulent flow. Systematic errors may
also exist in the ecosystem flux data due to imperfect spectral corrections, gap-filling
procedures or calibration problems (Richardson et al., 2012; Wilson et al., 2002).
Figure 8: Correlations between the observed and simulated GPP, and correlations between the observed
and simulated ET at Hyytiälä and Sodankylä over the study period. All the correlation coefficients are
statistical significant (p < 0.01).
Hyytiälä
Sodankylä
r=0.73 r=0.73
r=0.54r=0.56
39
4.4 Limitation of our regional modelling studies
Our regional modelling studies can be improved in several aspects. Firstly, as land surface
parameters are attributed according to land cover types in those models, accurate land cover
maps are always the preconditions for regional simulations. Secondly, tailored land surface
parameter values for the study area rather than the default global-wised parameter values are
required, for the aim to reduce the inaccuracies in modelling land surface physical processes.
Thirdly, high-quality soil type distribution, representative soil parameters, and more
sophisticated soil hydrology models have the capability to improve the simulated soil
moisture. Then, the meteorological forcing data is of vital importance for LSMs to simulate
realistic soil moisture and plant functioning. Moreover, it is expected that further development
in model physics could reduce model biases when considering the costs of model efficiency.
The simple bucket soil hydrology scheme in REMO is insufficient to represent the complex
soil hydrological processes, and the 5-layer soil hydrology scheme has been implemented in
REMO and is under a testing phase. The default stomatal conductance model in JSBACH is
insensitive to air humidity. This leads to an overestimation of GPP and ET under a severe soil
moisture drought. A stomatal conductance model that considers both soil moisture drought
and atmospheric drought needs to be implemented in JSBACH. Finally, the modelling studies
only used one regional climate model and one land surface model. Ensemble simulations with
multi-model intercomparisons will help to reduce model biases and the uncertainties of our
understanding on our topics.
40
5. Review of papers and author's contribution
Paper I describes the implementation of an updated and more accurate high-resolution land
cover map to replace the standard land cover map in the regional climate model REMO. The
impacts of the improved land cover map on the simulated regional climate conditions were
analysed with observation-based E-OBS data as a reference. Although the model biases of the
simulated climate conditions were only marginally reduced, the newly introduced land cover
map provides more realistic reference for future land cover change studies. It is expected that
land surface physical processes and land surface parameter values in the model could be
developed further to make more improvements. Stefan Weiher made the technical
implementation of the maps and simulations. I carried out the data analyses and prepared the
manuscript with contributions from the other co-authors.
Paper II discusses the biogeophysical impacts of peatland forestation on regional climate
changes in Finland. The differences between the climate conditions simulated by REMO
using the land cover maps based on pre-drainage (1920s) and after-drainage (2000s) Finnish
National Forest Inventories (FNFI) were analysed. Peatland forestation led to a spring
warming that was mainly induced by the decreased albedo, whereas a slight cooling was
found in the growing season mostly due to the increased evapotranspiration (ET). As a
consequence of the spring warming effect, the snow clearance days in peatland forestation
areas were advanced. The extents of these climate effects are closely related to the intensity
and geological locations of peatland forestation. In addition, the modelled results are
qualitatively supported by the observational data. Dr. Henttonen prepared the FNFI land cover
maps for this study from the FNFI field measurement data. I implemented the FNFI maps into
REMO and performed the simulations. I analysed the results and prepared the manuscript
with contribution from the other co-authors.
Paper III investigates the performance of a set of drought indicators for their ability in
indicating summer drought in boreal forests in Finland. In particular, the forest health
observation data, which showed severe drought damage on forest due to the Extreme Drought
affecting Forest health (EDF) in 2006 in Finland, were used as a reference to determine the
41
EDF thresholds of those drought indicators. The soil moisture index SMI was found to be the
best in indicating EDF in boreal forests, because of high initial soil moisture values in the
beginning of summer and the existence of deep organic soil that less prone to drought. Thus,
it is important for the assessment of drought risks in the future, especially in boreal areas, that
a land surface model capable of reliable predictions of soil moisture and high-quality soil type
distribution are used, in addition to climate data. Dr. Markkanen and Dr. Thum provided the
JSBACH simulated soil moisture data for this study. I carried out the calculation of the
drought indicators. I analysed the results and prepared the manuscript with contributions from
the other co-authors.
Paper IV studies the response of water use efficiency to summer drought in boreal Scots pine
forests in Finland at daily time scales, mainly using ecosystem flux data measured by EC
technique. In addition, the JSBACH simulation results were evaluated against observed
results at two Scots pine forest sites in southern and northern Finland. Results showed that the
gross primary production (GPP) and ET were greatly decreased during a severe soil moisture
drought. The inherent water use efficiency (IWUE) is more appropriate than the ecosystem
water use efficiency (EWUE) for indicating the impacts on ecosystem functioning from
drought through the exclusion of the vapour pressure deficit (VPD) effect on ET. The
JSBACH model successfully captured the soil moisture drought limitation on stomatal
conductance. However, in order to adequately simulate the effects of drought on plant
functioning, the limitation caused by atmospheric drought has to be incorporated. Ecosystem
flux data were provided by Dr. Aurela and Dr. Mammarella. I carried out the data analyses
and prepared the manuscript with contributions from the other co-authors.
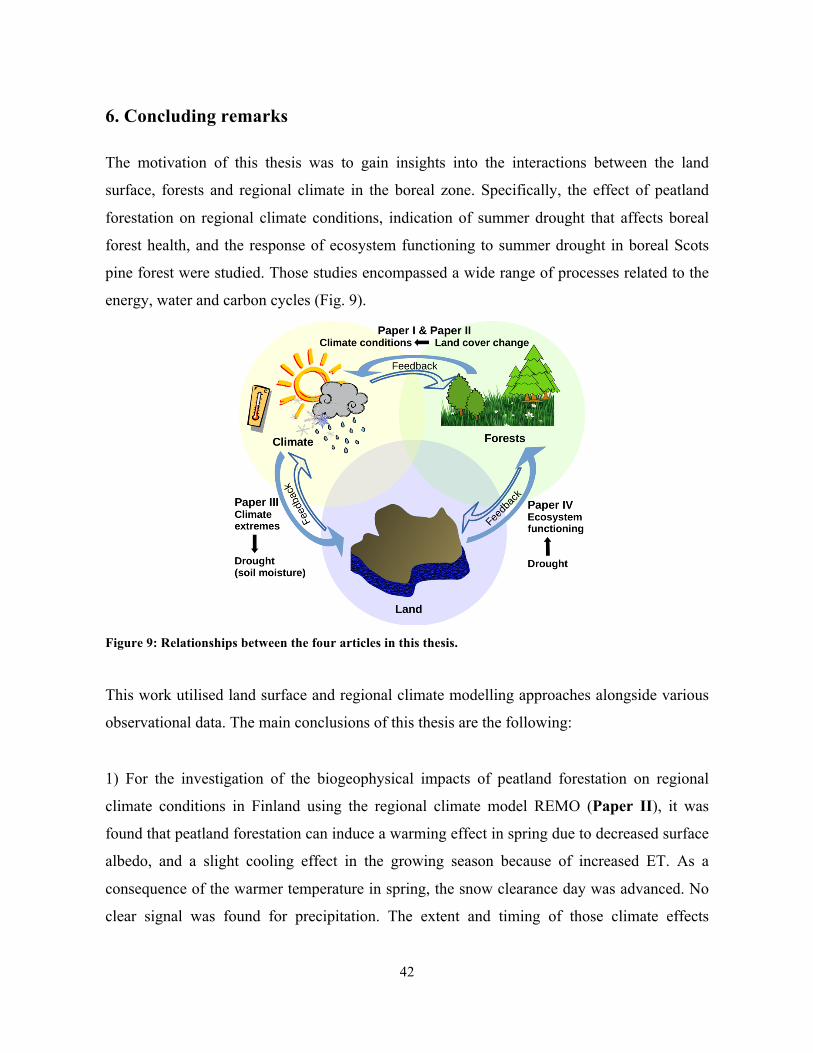
42
6. Concluding remarks
The motivation of this thesis was to gain insights into the interactions between the land
surface, forests and regional climate in the boreal zone. Specifically, the effect of peatland
forestation on regional climate conditions, indication of summer drought that affects boreal
forest health, and the response of ecosystem functioning to summer drought in boreal Scots
pine forest were studied. Those studies encompassed a wide range of processes related to the
energy, water and carbon cycles (Fig. 9).
Figure 9: Relationships between the four articles in this thesis.
This work utilised land surface and regional climate modelling approaches alongside various
observational data. The main conclusions of this thesis are the following:
1) For the investigation of the biogeophysical impacts of peatland forestation on regional
climate conditions in Finland using the regional climate model REMO (Paper II), it was
found that peatland forestation can induce a warming effect in spring due to decreased surface
albedo, and a slight cooling effect in the growing season because of increased ET. As a
consequence of the warmer temperature in spring, the snow clearance day was advanced. No
clear signal was found for precipitation. The extent and timing of those climate effects
43
depended on the intensity and location of the peatland forestation. In the most intensive
peatland forestation area, a warming of up to 0.43 K in spring and a cooling of less than 0.1 K
in the growing season in 2-m air temperature were observed, and the snow clearance day was
advanced by up to 5 days. In particular, the modelled warming effect in spring was in good
agreement qualitatively with the temperature trends of March and April calculated with
40-year observational data.
2) The soil moisture index SMI was the most capable among the assessed drought indicators
in capturing the spatial extent of observed forest damage induced by the extreme drought in
2006 in Finland (Paper III). This is because the high initial soil moisture content or the
existence of peat in boreal forests in Finland often hinders the standardized indicators (SPI,
SPEI and SMA) to capture drought that indicated by the SMI. Thus, in order to assess the
drought risks in boreal areas in the future, a land surface model capable of reliable prediction
of soil moisture is needed. Unbiased meteorological data are also important as a model
forcing.
3) According to ecosystem flux data, GPP and ET were greatly suppressed during a severe
soil moisture drought (Paper IV). The decrease of ET was alleviated because of the increased
VPD during drought, and led to a decrease of EWUE despite a stronger decrease of surface
conductance at the ecosystem level than GPP. IWUE increased during a moderate drought at
the northern site and a severe drought at the southern site. This indicates that the southern site
had a weaker response to drought than the northern site. From those results, we conclude that
IWUE is more appropriate than EWUE in indicating the impacts of drought on ecosystem
functioning, through the exclusion of the VPD effect on ET.
4) With the implementation of a more accurate, up-to-date and high resolution land cover map
into REMO to replace the inaccurate default land cover map over the Fennoscandian domain
(Paper I), we found that biases from REMO simulations of the present-day climate were only
slightly reduced. This would indicate that improvements in the model performance could be
achieved with better descriptions of the land surface physical processes and more accurate
44
land surface parameter values. Small-scale spatial climate variability related to historical land
cover changes have been investigated using REMO due to its high spatial resolution (Paper
II). Regional soil moisture used in the calculation of the soil moisture index SMI was
produced by the land surface model JSBACH with its 5-layer soil hydrology scheme in Paper
III. In the future, high quality soil type distributions and soil parameters are of vital
importance to improve the accuracy of simulated regional soil moisture. The soil hydrology
scheme could be further developed by incorporation of soil type heterogeneity in a gridbox
and along the soil profile. Furthermore, realistic simulations of plant functioning are needed to
understand and project feedbacks between climate change and plant physiological responses.
Plant controls of stomatal conductance, photosynthesis and transpiration under water stress in
boreal Scots pine forests were simulated by JSBACH in Paper IV, and the modelled results
were compared with the EC observations. The results showed that JSBACH successfully
reflected the soil moisture drought limitations on stomatal conductance. However, the
combined effects from atmospheric drought and soil moisture drought has to be taken into
account in the model to adequately simulate the drought effects on plant functioning. In
addition, the non-stomatal limitations on photosynthesis during drought, such as reduced
carboxylation capacity and mesophyll conductance, may also lead to improvements in model
performance.
Information from regional studies is essential for the development of future strategies for
climate change mitigation or forest management. The topics that could benefit from this study
are diverse. For example, future drought prediction under high resolution climate projections;
the relationship between drought impacts on forest health and productivity or bioenergy.
Moreover, the feedbacks relevant to this study should be explored. For instance, peatland
forestation may lead to changes in soil properties and soil hydrology, which can influence
regional soil moisture distribution and also drought; changes in climate can also stimulate
land cover change, such as the projected forestation of tundra at high latitudes.
45
References
Aalto, J., Pirinen, P., Heikkinen, J., and Venäläinen, A.: Spatial interpolation of monthly climate data for Finland: comparing the performance of kriging and generalized additive models, Theoretical and Applied Climatology, 112, 99-111, 2013.
Allen, C. D., Macalady, A. K., Chenchouni, H., Bachelet, D., McDowell, N., Vennetier, M., Kitzberger, T., Rigling, A., Breshears, D. D., and Hogg, E. T.: A global overview of drought and heat-induced tree mortality reveals emerging climate change risks for forests, Forest Ecology and Management, 259, 660-684, 2010.
Allen, R. G., Smith, M., Pereira, L. S., and Perrier, A.: An update for the calculation of reference evapotranspiration, ICID Bulletin, 43, 35-92, 1994.
Arakawa, A., and Lamb, V. R.: Computational design of the basic dynamical processes of the UCLA general circulation model, Methods in computational physics, 17, 173-265, 1977.
Arneth, A., Veenendaal, E. M., Best, C., Timmermans, W., Kolle, O., Montagnani, L., and Shibistova, O.: Water use strategies and ecosystem-atmosphere exchange of CO2 in two highly seasonal environments, Biogeosciences, 3, 421-437, 2006.
Aurela, M.: Carbon dioxide exchange in subarctic ecosystems measured by a micrometeorological technique, Ph.D. thesis, Finnish Meteorological Institute, Helsinki, Finland, 2005.
Aurela, M., Lohila, A., Tuovinen, J.-P., Hatakka, J., Penttilä, T., and Laurila, T.: Carbon dioxide and energy flux measurements in four northern-boreal ecosystems at Pallas, Boreal Environment Research, 20, 455-473, 2015.
Bathiany, S., Claussen, M., Brovkin, V., Raddatz, T., and Gayler, V.: Combined biogeophysical and biogeochemical effects of large-scale forest cover changes in the MPI earth system model, Biogeosciences, 7, 1383-1399, 2010.
Beer, C., Ciais, P., Reichstein, M., Baldocchi, D., Law, B. E., Papale, D., Soussana, J. F., Ammann, C., Buchmann, N., Frank, D., Gianelle, D., Janssens, I. A., Knohl, A., Köstner, B., Moors, E., Roupsard, O., Verbeeck, H., Vesala, T., Williams, C. A., and Wohlfahrt, G.: Temporal and among-site variability of inherent water use efficiency at the ecosystem level, Global Biogeochemical Cycles, 23, 10.1029/2008GB003233, 2009.
Betts, A. K.: Understanding Hydrometeorology Using Global Models, Bulletin of the American Meteorological Society, 85, 1673-1688, 10.1175/BAMS-85-11-1673, 2004.
Blauhut, V., Gudmundsson, L., and Stahl, K.: Towards pan-European drought risk maps: quantifying the link between drought indices and reported drought impacts, Environmental Research Letters, 10, 014008, 10.1088/1748-9326/10/1/014008, 2015.
Bonan, G. B.: Forests and Climate Change: Forcings, Feedbacks, and the Climate Benefits of Forests, Science, 320, 1444-1449, 10.1126/science.1155121, 2008.
Castro, C. L., Pielke Sr., R. A., and Leoncini, G.: Dynamical downscaling: Assessment of value retained and added using the Regional Atmospheric Modeling System (RAMS), Journal of Geophysical Research: Atmospheres, 110, D05108, 10.1029/2004JD004721, 2005.
Ciais, P., Reichstein, M., Viovy, N., Granier, A., Ogee, J., Allard, V., Aubinet, M., Buchmann, N., Bernhofer, C., Carrara, A., Chevallier, F., De Noblet, N., Friend, A. D., Friedlingstein, P., Grunwald, T., Heinesch, B., Keronen, P., Knohl, A., Krinner, G., Loustau, D., Manca, G., Matteucci, G., Miglietta, F., Ourcival, J. M., Papale, D., Pilegaard, K., Rambal, S., Seufert, G., Soussana, J. F., Sanz, M. J., Schulze, E. D., Vesala, T., and Valentini, R.: Europe-wide reduction in primary productivity caused by the heat and drought in 2003, Nature, 437, 529-533, 2005.
Claussen, M., Lohmann, U., Roeckner, E., and Schulzweida, U.: A global data set of land surface parameters, MPI Report No. 135, Max Planck Institute for Meterology, Hamburg, Germany, 33 pp., 1994.
Collatz, G., Ribas-Carbo, M., and Berry, J.: Coupled photosynthesis-stomatal conductance model for leaves of C4 plants, Australian Journal of Plant Physiology, 19, 519-538, 10.1071/PP9920519, 1992.
Dalmonech, D., Zaehle, S., Schürmann, G. J., Brovkin, V., Reick, C., and Schnur, R.: Separation of the Effects of Land and Climate Model Errors on Simulated Contemporary Land Carbon Cycle Trends in the MPI Earth System Model version 1, Journal of Climate, 28, 272-291, 2015.
Dümenil, L., and Todini, E.: A rainfall-runoff scheme for use in the Hamburg climate model, in: Advances in
46
Theoretical Hydrology – a Tribute to James Dooge, European Geophysical Society Series on Hydrological Sciences, edited by: O'Kane, J. P., Elsevier, Amsterdam, Netherland, 129-157, 1992.
Déqué, M., Jones, R. G., Wild, M., Giorgi, F., Christensen, J. H., Hassell, D. C., Vidale, P. L., Rockel, B., Jacob, D., Kjellström, E., De Castro, M., Kucharski, F., and Van den Hurk, B.: Global high resolution versus Limited Area Model climate change projections over Europe: quantifying confidence level from PRUDENCE results, Climate Dynamics, 25, 653-670, 10.1007/s00382-005-0052-1, 2005.
Davies, H. C.: A laterul boundary formulation for multi-level prediction models, Quarterly Journal of the Royal Meteorological Society, 102, 405-418, 10.1002/qj.49710243210, 1976.
Eichhorn, J., Roskams, P., Ferretti, M., Mues, V., Szepesi, A., and Durrant, D.: Visual Assessment of Crown Condition and Damaging Agents Manual, Part IV in: Manual on methods and criteria for harmonized sampling, assessment, monitoring and analysis of the effects of air pollution on forests, UNECE ICP Forests Programme Co-ordinating Centre, Hamburg, 46 pp., 2010.
European Environment Agency: CLC2006 technical guidelines, EEA Technical Report No. 17, Copenhagen, Denmark, 2007.
Falloon, P. D., Dankers, R., Betts, R. A., Jones, C. D., Booth, B. B. B., and Lambert, F. H.: Role of vegetation change in future climate under the A1B scenario and a climate stabilisation scenario, using the HadCM3C Earth system model, Biogeosciences, 9, 4739-4756, 2012.
FAO/UNESCO: Soil map of the world, UNESCO, Paris, 1971-1981. Farquhar, G., O'Leary, M., and Berry, J.: On the relationship between carbon isotope discrimination and the
intercellular carbon dioxide concentration in leaves, Australian Journal of Plant Physiology, 9, 121-137, 10.1071/PP9820121, 1982.
Farquhar, G. D., Caemmerer, S., and Berry, J. A.: A biochemical model of photosynthetic CO2 assimilation in leaves of C3 species, Planta, 149, 78-90, 10.1007/bf00386231, 1980.
Feddema, J. J., Oleson, K. W., Bonan, G. B., Mearns, L. O., Buja, L. E., Meehl, G. A., and Washington, W. M.: The importance of land-cover change in simulating future climates, Science, 310, 1674-1678, 2005.
Gálos, B., Mátyás, C., and Jacob, D.: Regional characteristics of climate change altering effects of afforestation, Environment Research Letter, 6, 044010, 10.1088/1748-9326/6/4/044010, 2011.
Göttel, H., Alexander, J., Keup-Thiel, E., Rechid, D., Hagemann, S., Blome, T., Wolf, A., and Jacob, D.: Influence of changed vegetations fields on regional climate simulations in the Barents Sea Region, Climatic Change, 87, 35-50, 10.1007/s10584-007-9341-5, 2008.
Ge, J., and Zou, C.: Impacts of woody plant encroachment on regional climate in the southern Great Plains of the United States, Journal of Geophysical Research: Atmospheres, 118, 9093-9104, 10.1002/jgrd.50634, 2013.
Ge, Z.-M., Kellomaki, S., Zhou, X., and Peltola, H.: The role of climatic variability in controlling carbon and water budgets in a boreal Scots pine forest during ten growing seasons, Boreal Environment Research, 19, 181-195, 2014.
Granier, A., Bréda, N., Biron, P., and Villette, S.: A lumped water balance model to evaluate duration and intensity of drought constraints in forest stands, Ecological Modelling, 116, 269-283, 10.1016/S0304-3800(98)00205-1, 1999.
Granier, A., Reichstein, M., Bréda, N., Janssens, I. A., Falge, E., Ciais, P., Grünwald, T., Aubinet, M., Berbigier, P., Bernhofer, C., Buchmann, N., Facini, O., Grassi, G., Heinesch, B., Ilvesniemi, H., Keronen, P., Knohl, A., Köstner, B., Lagergren, F., Lindroth, A., Longdoz, B., Loustau, D., Mateus, J., Montagnani, L., Nys, C., Moors, E., Papale, D., Peiffer, M., Pilegaard, K., Pita, G., Pumpanen, J., Rambal, S., Rebmann, C., Rodrigues, A., Seufert, G., Tenhunen, J., Vesala, T., and Wang, Q.: Evidence for soil water control on carbon and water dynamics in European forests during the extremely dry year: 2003, Agricultural and Forest Meteorology, 143, 123-145, 10.1016/j.agrformet.2006.12.004, 2007.
Granier, A., Bréda, N., Longdoz, B., Gross, P., and Ngao, J.: Ten years of fluxes and stand growth in a young beech forest at Hesse, North-eastern France, Annals Forest Science, 65, 704, 10.1051/forest:2008052, 2008.
Hagemann, S., Botzet, M., Dümenil, L., and Machenhauer, B.: Derivation of global GCM boundary conditions from 1 KM land use satellite data, MPI Report No. 289, Max Planck Institute for Meteorology, Hamburg, Germany, 27 pp., 1999.
Hagemann, S.: An improved land surface parameter dataset for global and regional climate models, MPI Report No. 336, Max Planck Institute for Meteorology, Hamburg, Germany, 17 pp., 2002.
Hagemann, S., and Gates, L. D.: Improving a subgrid runoff parameterization scheme for climate models by the use of high resolution data derived from satellite observations, Climate Dynamics, 21, 349-359, 10.1007/s00382-003-0349-x, 2003.
47
Hagemann, S., Machenhauer, B., Jones, R., Christensen, O. B., Déqué, M., Jacob, D., and Vidale, P. L.: Evaluation of water and energy budgets in regional climate models applied over Europe, Climate Dynamics, 23, 547-567, 10.1007/s00382-004-0444-7, 2004.
Hagemann, S., and Stacke, T.: Impact of the soil hydrology scheme on simulated soil moisture memory, Climate Dynamics, 44, 1731-1750, 10.1007/s00382-014-2221-6, 2015.
Hain, C. R., Crow, W. T., Mecikalski, J. R., Anderson, M. C., and Holmes, T.: An intercomparison of available soil moisture estimates from thermal infrared and passive microwave remote sensing and land surface modeling, Journal of Geophysical Research: Atmospheres, 116, D15107, 10.1029/2011JD015633, 2011.
Hayes, M., Svoboda, M., Wall, N., and Widhalm, M.: The lincoln declaration on drought indices: universal meteorological drought index recommended, Bulletin of the American Meteorological Society, 92, 485-488, 10.1175/2010BAMS3103.1, 2011.
Haylock, M. R., Hofstra, N., Klein Tank, A. M. G., Klok, E. J., Jones, P. D., and New, M.: A European daily high-resolution gridded data set of surface temperature and precipitation for 1950–2006, Journal of Geophysical Research: Atmospheres, 113, D20119, 10.1029/2008JD010201, 2008.
Heim, R. R.: A review of twentieth-century drought indices used in the United States, Bulletin of the American Meteorological Society, 83, 1149-1165, 2002.
Ilvessalo, Y.: Suomen metsät. Tulokset vuosina 1921-1924 suoritetusta valtakunnan metsien arviomisesta (Summary in English: The forests of Finland. Results of the general survey of the forests in the country carried out during the years 1921-1924), Communicationes ex Instituto Quaestionum Forestalium Finlandiae, Finnish Forest Research Institute, Helsinki, Finland, 1927.
Ilvessalo, Y.: Suomen metsät vuosina 1921-24 vuosiin 1951-53: kolmeen valtakunnan metsien inventointiin perustuva tutkimus (The forests of Finland from 1921-24 to 1951-53. A survey based on three national forest inventories), Communicationes Instituti Forestalis Fenniae, Finnish Forest Research Institute, Helsinki, Finland, 277 pp., 1956.
IPCC: Climate change 2013: The physical science basis. Working group 1 contribution to the fifth assessment report of the intergovernmental panel on climate change, Cambridge, United Kingdom and New York, NY, USA, 1535 pp., 2013.
Jacob, D., and Podzun, R.: Sensitivity studies with the regional climate model REMO, Meteorology and Atmospheric Physics, 63, 119-129, 10.1007/BF01025368, 1997.
Jacob, D., Van den Hurk, B., Andrae, U., Elgered, G., Fortelius, C., Graham, L., Jackson, S., Karstens, U., KoÈpken, C., and Lindau, R.: A comprehensive model inter-comparison study investigating the water budget during the BALTEX-PIDCAP period, Meteorology and Atmospheric Physics, 77, 19-43, 2001.
Jacob, D., Bärring, L., Christensen, O. B., Christensen, J. H., de Castro, M., Déqué, M., Giorgi, F., Hagemann, S., Hirschi, M., Jones, R., Kjellström, E., Lenderink, G., Rockel, B., Sánchez, E., Schär, C., Seneviratne, S. I., Somot, S., Van Ulden, A., and Van den Hurk, B.: An inter-comparison of regional climate models for Europe: Model performance in present-day climate, Climatic Change, 81, 31-52, 2007.
Køltzow, M.: The effect of a new snow and sea ice albedo scheme on regional climate model simulations, Journal of Geophysical Research: Atmospheres, 112, D07110, 10.1029/2006JD007693, 2007.
Keenan, T. F., Hollinger, D. Y., Bohrer, G., Dragoni, D., Munger, J. W., Schmid, H. P., and Richardson, A. D.: Increase in forest water-use efficiency as atmospheric carbon dioxide concentrations rise, Nature, 499, 324-327, 10.1038/nature12291, 2013.
Knauer, J., Werner, C., and Zaehle, S.: Evaluating stomatal models and their atmospheric drought response in a land surface scheme: A multibiome analysis, Journal of Geophysical Research: Biogeosciences, 120, 1894-1911, 10.1002/2015JG003114, 2015.
Knorr, W.: Annual and interannual CO2 exchanges of the terrestrial biosphere: process-based simulations and uncertainties, Global Ecology and Biogeography, 9, 225-252, 10.1046/j.1365-2699.2000.00159.x, 2000.
Korhonen, K. T., Ihalainen, A., Viiri, H., Heikkinen, J., Henttonen, H. M., Hotanen, J. P., Mäkelä, H., Nevalainen, S., and Pitkänen, J.: Suomen metsät 2004-2008 ja niiden kehitys 1921-2008 (The forests of Finland in 2004-2008 and their development from 1921-2008), Metsätieteen aikakauskirja, Finnish Meteorological Institute, Helsinki, Finland, 2013.
Kotlarski, S.: A subgrid glacier parameterisation for use in regional climate modelling, Ph.D. thesis, University of Hamburg, Max Planck Institute for Meterology, Hamburg, Germany, 2007.
Kotlarski, S., Keuler, K., Christensen, O. B., Colette, A., Déqué, M., Gobiet, A., Goergen, K., Jacob, D., Lüthi, D., van Meijgaard, E., Nikulin, G., Schär, C., Teichmann, C., Vautard, R., Warrach-Sagi, K., and Wulfmeyer, V.: Regional climate modeling on European scales: a joint standard evaluation of the EURO-CORDEX
48
RCM ensemble, Geoscientific Model Development, 7, 1297-1333, 2014. Lagergren, F., and Lindroth, A.: Transpiration response to soil moisture in pine and spruce trees in Sweden,
Agricultural and Forest Meteorology, 112, 67-85, 10.1016/S0168-1923(02)00060-6, 2002. Law, B. E., Falge, E., Gu, L., Baldocchi, D. D., Bakwin, P., Berbigier, P., Davis, K., Dolman, A. J., Falk, M.,
Fuentes, J. D., Goldstein, A., Granier, A., Grelle, A., Hollinger, D., Janssens, I. A., Jarvis, P., Jensen, N. O., Katul, G., Mahli, Y., Matteucci, G., Meyers, T., Monson, R., Munger, W., Oechel, W., Olson, R., Pilegaard, K., Paw U, K. T., Thorgeirsson, H., Valentini, R., Verma, S., Vesala, T., Wilson, K., and Wofsy, S.: Environmental controls over carbon dioxide and water vapor exchange of terrestrial vegetation, Agricultural and Forest Meteorology, 113, 97-120, 10.1016/S0168-1923(02)00104-1, 2002.
Lenton, T. M., Held, H., Kriegler, E., Hall, J. W., Lucht, W., Rahmstorf, S., and Schellnhuber, H. J.: Tipping elements in the Earth's climate system, Proceedings of the National Academy of Sciences, 105, 1786-1793, 10.1073/pnas.0705414105, 2008.
Lindgren, M., Nevalainen, S., Pouttu, A., Rantanen, H., and Salemaa, M.: Metsäpuiden elinvoimaisuuden arviointi, Forest Focus/ICP Level 1, Finnish Forest Research Institute, Helsinki, Finland, 56 pp., 2005.
Lloyd, J. O. N., Shibistova, O., Zolotoukhine, D., Kolle, O., Arneth, A., Wirth, C., Styles, J. M., Tchebakova, N. M., and Schulze, E. D.: Seasonal and annual variations in the photosynthetic productivity and carbon balance of a central Siberian pine forest, Tellus B, 54, 590-610, 10.1034/j.1600-0889.2002.01487.x, 2002.
Lohila, A., Minkkinen, K., Laine, J., Savolainen, I., Tuovinen, J.-P., Korhonen, L., Laurila, T., Tietäväinen, H., and Laaksonen, A.: Forestation of boreal peatlands: Impacts of changing albedo and greenhouse gas fluxes on radiative forcing, Journal of Geophysical Research: Biogeosciences, 115, G04011, 10.1029/2010JG001327, 2010.
Loveland, T. R., Reed, B. C., Brown, J. F., Ohlen, D. O., Zhu, Z., Yang, L., and Merchant, J. W.: Development of a global land cover characteristics database and IGBP DISCover from 1 km AVHRR data, International Journal of Remote Sensing, 21, 1303-1330, 10.1080/014311600210191, 2000.
Ma, Z., Peng, C., Zhu, Q., Chen, H., Yu, G., Li, W., Zhou, X., Wang, W., and Zhang, W.: Regional drought-induced reduction in the biomass carbon sink of Canada's boreal forests, Proceedings of the National Academy of Sciences, 109, 2423-2427, 10.1073/pnas.1111576109, 2012.
Majewski, D.: The Europa-Modell of the Deutscher Wetterdienst. ECMWF Seminar on numerical methods in atmospheric models, Reading, UK, 1991.
Mammarella, I., Peltola, O., Nordbo, A., Järvi, L., and Rannik, Ü.: EddyUH: an advanced software package for eddy covariance flux calculation for a wide range of instrumentation and ecosystems, Atmospheric Measurement Technique Discussion, 2016, 1-33, 10.5194/amt-2015-323, 2016.
Manabe, S.: Climate and the ocean circulation 1: I. The atmospheric circulation and the hydrology of earth's surface, Monthly Weather Review, 97, 739-774, 1969.
Manzoni, S., Vico, G., Katul, G., Fay, P. A., Polley, W., Palmroth, S., and Porporato, A.: Optimizing stomatal conductance for maximum carbon gain under water stress: A meta-analysis across plant functional types and climates, Functional Ecology, 25, 456-467, 10.1111/j.1365-2435.2010.01822.x, 2011.
McGregor, J.: Regional climate modelling, Meteorology and Atmospheric Physics, 63, 105-117, 1997. McKee, T. B., Doeskin, N. J., and Kleist, J.: The relationship of drought frequency and duration to time scales,
8th Conference on Applied Climatology, Anaheim, Califonia, 1993. McKee, T. B., Doesken, N. J., and Kleist, J.: Drought monitoring with multiple time scales, 9th Conference on
Applied Climatology, Dallas, Texas, 1995. Minkkinen, K., Korhonen, R., Savolainen, I., and Laine, J.: Carbon balance and radiative forcing of Finnish
peatlands 1900–2100 – the impact of forestry drainage, Global Change Biology, 8, 785-799, 10.1046/j.1365-2486.2002.00504.x, 2002.
Mishra, A. K., and Singh, V. P.: A review of drought concepts, Journal of Hydrology, 391, 202-216, 10.1016/j.jhydrol.2010.07.012, 2010.
Muukkonen, P., Nevalainen, S., Lindgren, M., and Peltoniemi, M.: Spatial occurrence of drought-associated damages in Finnish boreal forests: results from forest condition monitoring and GIS analysis, Boreal Environment Research, 20, 172-180, 2015.
Olson, J. S.: Global ecosystem framework-definitions: USGS EROS Data Center Internal Report, Sioux Falls, SD, 37 pp., 1994a.
Olson, J. S.: Global ecosystem framework-translation strategy: USGS EROS Data Center Internal Report,, Sioux Falls, SD, 39 pp., 1994b.
Orlowsky, B., and Seneviratne, S. I.: Elusive drought: uncertainty in observed trends and short- and long-term
49
CMIP5 projections, Hydrol. Earth Syst. Sci., 17, 1765-1781, 10.5194/hess-17-1765-2013, 2013. Päivänen, J., and Hånell, B.: Peatland ecology and forestry: A sound approach, Department of Forest Ecology,
University of Helsinki, 2012. Peng, C., Ma, Z., Lei, X., Zhu, Q., Chen, H., Wang, W., Liu, S., Li, W., Fang, X., and Zhou, X.: A
drought-induced pervasive increase in tree mortality across Canada's boreal forests, Nature Climate Change, 1, 467-471, 2011.
Pielke, R. A., Pitman, A., Niyogi, D., Mahmood, R., McAlpine, C., Hossain, F., Goldewijk, K. K., Nair, U., Betts, R., Fall, S., Reichstein, M., Kabat, P., and de Noblet, N.: Land use/land cover changes and climate: modeling analysis and observational evidence, Wiley Interdisciplinary Reviews: Climate Change, 2, 828-850, 10.1002/wcc.144, 2011.
Pitman, A. J.: The evolution of, and revolution in, land surface schemes designed for climate models, International Journal of Climatology, 23, 479-510, 10.1002/joc.893, 2003.
Preuschmann, S.: Regional surface albedo characteristics - analysis of albedo data and application to land-cover changes for a regional climate model, Ph.D. thesis, University of Hamburg, Max Planck Institute for Meterology, Hamburg, Germany, 2012.
Räisänen, P., Luomaranta, A., Järvinen, H., Takala, M., Jylhä, K., Bulygina, O., Riihelä, A., Laaksonen, A., Koskinen, J., and Pulliainen, J.: Evaluation of North Eurasian snow-off dates in the ECHAM5.4 atmospheric GCM, Geoscientific Model Development, 7, 3037-3057, 2014.
Rebel, K. T., de Jeu, R. A. M., Ciais, P., Viovy, N., Piao, S. L., Kiely, G., and Dolman, A. J.: A global analysis of soil moisture derived from satellite observations and a land surface model, Hydrology and Earth System Sciences, 16, 833-847, 2012.
Rechid, D., and Jacob, D.: Influence of monthly varying vegetation on the simulated climate in Europe, Meteorologische Zeitschrift, 15, 99-116, 2006.
Rechid, D.: On biogeophysical interactions between vegetation phenology and climate simulated over Europe, Ph.D., University of Hamburg, Max Planck Institute for Meterology, Hamburg, Germany, 2008.
Rechid, D., Raddatz, T., and Jacob, D.: Parameterization of snow-free land surface albedo as a function of vegetation phenology based on MODIS data and applied in climate modelling, Theoretical and Applied Climatology, 95, 245-255, 10.1007/s00704-008-0003-y, 2009.
Reichstein, M., Ciais, P., Papale, D., Valentini, R., Running, S., Viovy, N., Cramer, W., Granier, A., OgÉE, J., Allard, V., Aubinet, M., Bernhofer, C., Buchmann, N., Carrara, A., GrÜNwald, T., Heimann, M., Heinesch, B., Knohl, A., Kutsch, W., Loustau, D., Manca, G., Matteucci, G., Miglietta, F., Ourcival, J. M., Pilegaard, K., Pumpanen, J., Rambal, S., Schaphoff, S., Seufert, G., Soussana, J. F., Sanz, M. J., Vesala, T., and Zhao, M.: Reduction of ecosystem productivity and respiration during the European summer 2003 climate anomaly: a joint flux tower, remote sensing and modelling analysis, Global Change Biology, 13, 634-651, 10.1111/j.1365-2486.2006.01224.x, 2007.
Reichstein, M., Bahn, M., Ciais, P., Frank, D., Mahecha, M. D., Seneviratne, S. I., Zscheischler, J., Beer, C., Buchmann, N., Frank, D. C., Papale, D., Rammig, A., Smith, P., Thonicke, K., van der Velde, M., Vicca, S., Walz, A., and Wattenbach, M.: Climate extremes and the carbon cycle, Nature, 500, 287-295, 10.1038/nature12350, 2013.
Richardson, A. D., Aubinet, M., Barr, A. G., Hollinger, D. Y., Ibrom, A., Lasslop, G., and Reichstein, M.: Uncertainty Quantification, in: Eddy Covariance: A Practical Guide to Measurement and Data Analysis, edited by: Aubinet, M., Vesala, T., and Papale, D., Springer Netherlands, Dordrecht, 173-209, 2012.
Roeckner, E., Arpe, K., Bengtsson, L., Christoph, M., Claussen, M., Dümenil, L., Esch, M., Giogetta, M., Schlese, U., and Schultzweida, U.: The atmospheric general circulation model ECHAM4: Model description and simulation of the present-day climate, MPI report No. 218, Max Planck Institute for Meterology, Hamburg, Germany, 90, 1996.
Roeckner, E., Bäuml, G., Bonaventura, L., Brokopf, R., Esch, M., Giorgetta, M., Hagemann, S., Kirchner, I., Kornblueh, L., Manzini, E., Rhodin, A., Schlese, U., Schultzweida, U., and Tompkins, A.: The atmospheric general circulation model ECHAM5, part I: model description, MPI report No. 349, Max Planck Institute for meteorology, Hamburg, Germany, 127, 2003.
Roesch, A., Wild, M., Gilgen, H., and Ohmura, A.: A new snow cover fraction parametrization for the ECHAM4 GCM, Climate Dynamics, 17, 933-946, 10.1007/s003820100153, 2001.
Semmler, T., Jacob, D., Schlünzen, K. H., and Podzun, R.: Influence of sea ice treatment in a regional climate model on boundary layer values in the Fram Strait region, Monthly Weather Review, 132, 985-999, 10.1175/1520-0493(2004)132<0985:IOSITI>2.0.CO;2, 2004.
50
Seneviratne, S. I., Corti, T., Davin, E. L., Hirschi, M., Jaeger, E. B., Lehner, I., Orlowsky, B., and Teuling, A. J.: Investigating soil moisture–climate interactions in a changing climate: A review, Earth-Science Reviews, 99, 125-161, 10.1016/j.earscirev.2010.02.004, 2010.
Sheffield, J., and Wood, E. F.: Drought: past problems and future scenarios, Earthscan, London, UK and Washington, DC, USA, 2011.
Simmons, A., Uppala, S., Dee, D., and Kobayashi, S.: ERA-Interim: New ECMWF reanalysis products from 1989 onwards, ECMWF newsletter, 110, 25-35, 2007.
Solantie, R.: Suurten suo-ojitusten vaikutus ilman lämpötilaan erityisesti Alajärven Möksyn havaintojen perusteella (The impact of large scale wetland drainage on air tempearture based on observations in Möksy in Alajärvi), Finnish Meterological Institute, Helsinki, 40, 1994.
Stevens, B., Giorgetta, M., Esch, M., Mauritsen, T., Crueger, T., Rast, S., Salzmann, M., Schmidt, H., Bader, J., Block, K., Brokopf, R., Fast, I., Kinne, S., Kornblueh, L., Lohmann, U., Pincus, R., Reichler, T., and Roeckner, E.: Atmospheric component of the MPI-M Earth System Model: ECHAM6, Journal of Advances in Modeling Earth Systems, 5, 146-172, 10.1002/jame.20015, 2013.
Tomppo, E., Gschwantner, M., Lawrence, M., and McRoberts, R. E.: National Forest Inventories, Pathways for Common Reporting. European Science Foundation, Springer, The Netherlands, 2010.
Tomppo, E., Heikkinen, J., Henttonen, H. M., Ihalainen, A., Katila, M., Mäkelä, H., Tuomainen, H., and Vainikainen, N.: Designing and Conducting a Forest Inventory-case: 9th National Forest Inventory of Finland: Designing and Conducting a Forest Inventory-Case: 9th National Forest Inventory of Finland, Springer, The Netherlands, 2011.
U.S. Geological Survey: Global land cover characteristics data base, U.S. Geological Survey, Reston, USA, 1997.
U.S. Geological Survey: Global land cover characteristics data base version 2.0, U.S. Geological Survey, Reston, USA, 2001.
Vesala, T., Suni, T., Rannik, Ü., Keronen, P., Markkanen, T., Sevanto, S., Grönholm, T., Smolander, S., Kulmala, M., Ilvesniemi, H., Ojansuu, R., Uotila, A., Levula, J., Mäkelä, A., Pumpanen, J., Kolari, P., Kulmala, L., Altimir, N., Berninger, F., Nikinmaa, E., and Hari, P.: Effect of thinning on surface fluxes in a boreal forest, Global Biogeochemical Cycles, 19, 10.1029/2004GB002316, 2005.
Vicente-Serrano, S. M., Beguería, S., and López-Moreno, J. I.: A multiscalar drought index sensitive to global warming: The Standardized Precipitation Evapotranspiration Index, Journal of Climate, 23, 1696-1718, 10.1175/2009JCLI2909.1, 2010.
Wilson, K., Goldstein, A., Falge, E., Aubinet, M., Baldocchi, D., Berbigier, P., Bernhofer, C., Ceulemans, R., Dolman, H., Field, C., Grelle, A., Ibrom, A., Law, B. E., Kowalski, A., Meyers, T., Moncrieff, J., Monson, R., Oechel, W., Tenhunen, J., Valentini, R., and Verma, S.: Energy balance closure at FLUXNET sites, Agricultural and Forest Meteorology, 113, 223-243, http://dx.doi.org/10.1016/S0168-1923(02)00109-0, 2002.
Wolf, S., Eugster, W., Ammann, C., Häni, M., Zielis, S., Hiller, R., Stieger, J., Imer, D., Merbold, L., and Buchmann, N.: Contrasting response of grassland versus forest carbon and water fluxes to spring drought in Switzerland, Environmental Research Letters, 8, 035007, doi:10.1088/1748-9326/8/3/035007, 2013.
World Meteorological Organization: Standardized Precipitation Index User Guide, WMO-No. 1090, 16 pp., 2012.
Zhang, Y., Susan Moran, M., Nearing, M. A., Ponce Campos, G. E., Huete, A. R., Buda, A. R., Bosch, D. D., Gunter, S. A., Kitchen, S. G., Henry McNab, W., Morgan, J. A., McClaran, M. P., Montoya, D. S., Peters, D. P. C., and Starks, P. J.: Extreme precipitation patterns and reductions of terrestrial ecosystem production across biomes, Journal of Geophysical Research: Biogeosciences, 118, 148-157, 10.1029/2012JG002136, 2013.
Zhou, S., Duursma, R. A., Medlyn, B. E., Kelly, J. W. G., and Prentice, I. C.: How should we model plant responses to drought? An analysis of stomatal and non-stomatal responses to water stress, Agricultural and Forest Meteorology, 182–183, 204-214, 10.1016/j.agrformet.2013.05.009, 2013.
Related Documents