Interactions between Intracellular Domains as Key Determinants of the Quaternary Structure and Function of Receptor Heteromers * □ S Received for publication, February 18, 2010, and in revised form, June 7, 2010 Published, JBC Papers in Press, June 18, 2010, DOI 10.1074/jbc.M110.115634 Gemma Navarro ‡ , Sergi Ferre ´ § , Arnau Cordomi ¶ , Estefania Moreno ‡ , Josefa Mallol ‡ , Vicent Casado ´ ‡ , Antoni Corte ´s ‡ , Hanne Hoffmann , Jordi Ortiz , Enric I. Canela ‡ , Carme Lluís ‡ , Leonardo Pardo ¶ , Rafael Franco ‡ **, and Amina S. Woods §1 From the ‡ Centro de Investigacio ´n Biome ´dica en Red Sobre Enfermedades Neurodegenerativas, Department of Biochemistry and Molecular Biology, Faculty of Biology, University of Barcelona, 08028 Barcelona, Spain, the § Intramural Research Program, National Institute on Drug Abuse, Department of Health and Human Services, Baltimore, Maryland 21224, the ¶ Laboratori de Medicina Computacional, Unitat de Bioestadística, and Neuroscience Institute and Department of Biochemistry and Molecular Biology, Facultat de Medicina, Universitat Auto ´noma de Barcelona, 08193 Bellaterra, Spain, and the **Centro de Investigacio ´n Me ´dica Aplicada, Universidad de Navarra, 31008 Pamplona, Spain G protein-coupled receptor (GPCR) heteromers are macro- molecular complexes with unique functional properties differ- ent from those of its individual protomers. Little is known about what determines the quaternary structure of GPCR heteromers resulting in their unique functional properties. In this study, using resonance energy transfer techniques in experiments with mutated receptors, we provide for the first time clear evidence for a key role of intracellular domains in the deter- mination of the quaternary structure of GPCR heteromers between adenosine A 2A , cannabinoid CB 1 , and dopamine D 2 receptors. In these interactions, arginine-rich epitopes form salt bridges with phosphorylated serine or threonine residues from CK1/2 consensus sites. Each receptor (A 2A , CB 1 , and D 2 ) was found to include two evolutionarily conserved intracel- lular domains to establish selective electrostatic interactions with intracellular domains of the other two receptors, indi- cating that these particular electrostatic interactions consti- tute a general mechanism for receptor heteromerization. Mutation experiments indicated that the interactions of the intracellular domains of the CB 1 receptor with A 2A and D 2 receptors are fundamental for the correct formation of the quaternary structure needed for the function (MAPK signal- ing) of the A 2A -CB 1 -D 2 receptor heteromers. Analysis of MAPK signaling in striatal slices of CB 1 receptor KO mice and wild-type littermates supported the existence of A 1 -CB 1 -D 2 recep- tor heteromer in the brain. These findings allowed us to propose the first molecular model of the quaternary structure of a receptor heteromultimer. Receptor heteromers are the focus of intense research, as through heteromerization receptors become unique functional entities with different properties from those of either receptor when not engaged in heteromerization resulting in new thera- peutic targets (1– 4). Their unique properties provide a “bio- chemical fingerprint” thus allowing their identification in native tissues (1, 3). There is already a long list of discovered heteromers with two different G protein-coupled receptors (GPCRs) 2 (2, 4). Furthermore, we recently obtained evidence for the existence of receptor heteromultimers, i.e. heteromers including more than two different receptors, and reported on heteromers, including the GPCRs adenosine A 2A , cannabinoid CB 1 , and dopamine D 2 receptors, in transfected cells (5). Evidence of GPCR homomultimers has also been recently demonstrated in living cells (6, 7). Many important ques- tions regarding receptor heteromers and heteromultimers remain unanswered. What is the arrangement of their GPCR units (quaternary structure)? What are the molecular deter- minants of their quaternary structure? Last but not least, what is their functional significance in native tissues? It was inferred that different molecular mechanisms were involved in GPCR homo- and heteromerization. For family C GPCRs, disulfide bonds between extracellular domains as well as coiled-coil interactions between C-terminal domains seem to be necessary for the formation of functional homomeric or heteromeric receptors (8). For oligomerization of family A GPCRs, the helical transmembrane (TM) domains seem to be particularly important (7, 9 –15). In this study, by using mutated A 2A , CB 1 , and D 2 receptors, we investigated the rele- vance of electrostatic interactions (16) between intracellular domains in the determination of the quaternary structure of GPCR heteromers between A 2A , CB 1 , and D 2 receptors. Our initial goal was to obtain evidence for multiple intracellular interactions in the A 2A -CB 1 -D 2 receptor heteromultimer. Sig- nificantly, the same intracellular domains involved in A 2A - CB 1 -D 2 receptor heteromultimerization were also involved in * This work was supported, in whole or in part, by a National Institutes of Health grant from intramural funds to NIDA. This work was also supported by Spanish Ministerio de Ciencia y Tecnología Grants SAF2008-00146, SAF2006-05481, and SAF2008-03229-E/ for ERA-NET Coordination of Research Activities and Instituto de Salud Carlos III (RD07/0067/0008) Grant 060110 from Fundacio ´ La Marato ´ de TV3. □ S The on-line version of this article (available at http://www.jbc.org) contains supplemental Figs. 1 and 2 and Table 1. 1 To whom correspondence should be addressed: National Institute on Drug Abuse, Intramural Research Program, Department of Health and Human Services, 333 Cassell Dr., Baltimore, MD 21224. Tel.: 443-740-2747; Fax: 443- 740-2144; E-mail: [email protected]. 2 The abbreviations used are: GPCR, G protein-coupled receptor; SRET, sequential resonance energy transfer; ANOVA, analysis of variance; PDB, Protein Data Bank; BRET, bioluminescence resonance energy transfer; TM, transmembrane; IL3, intracellular loop 3. THE JOURNAL OF BIOLOGICAL CHEMISTRY VOL. 285, NO. 35, pp. 27346 –27359, August 27, 2010 Printed in the U.S.A. 27346 JOURNAL OF BIOLOGICAL CHEMISTRY VOLUME 285 • NUMBER 35 • AUGUST 27, 2010

Welcome message from author
This document is posted to help you gain knowledge. Please leave a comment to let me know what you think about it! Share it to your friends and learn new things together.
Transcript
Interactions between Intracellular Domains as KeyDeterminants of the Quaternary Structure and Function ofReceptor Heteromers*□S
Received for publication, February 18, 2010, and in revised form, June 7, 2010 Published, JBC Papers in Press, June 18, 2010, DOI 10.1074/jbc.M110.115634
Gemma Navarro‡, Sergi Ferre§, Arnau Cordomi¶, Estefania Moreno‡, Josefa Mallol‡, Vicent Casado‡, Antoni Cortes‡,Hanne Hoffmann�, Jordi Ortiz�, Enric I. Canela‡, Carme Lluís‡, Leonardo Pardo¶, Rafael Franco‡**, and Amina S. Woods§1
From the ‡Centro de Investigacion Biomedica en Red Sobre Enfermedades Neurodegenerativas, Department of Biochemistry andMolecular Biology, Faculty of Biology, University of Barcelona, 08028 Barcelona, Spain, the §Intramural Research Program,National Institute on Drug Abuse, Department of Health and Human Services, Baltimore, Maryland 21224, the ¶Laboratori deMedicina Computacional, Unitat de Bioestadística, and �Neuroscience Institute and Department of Biochemistry and MolecularBiology, Facultat de Medicina, Universitat Autonoma de Barcelona, 08193 Bellaterra, Spain, and the **Centro de InvestigacionMedica Aplicada, Universidad de Navarra, 31008 Pamplona, Spain
G protein-coupled receptor (GPCR) heteromers are macro-molecular complexes with unique functional properties differ-ent from those of its individual protomers. Little is known aboutwhat determines the quaternary structure of GPCR heteromersresulting in their unique functional properties. In this study,using resonance energy transfer techniques in experimentswith mutated receptors, we provide for the first time clearevidence for a key role of intracellular domains in the deter-mination of the quaternary structure of GPCR heteromersbetween adenosine A2A, cannabinoid CB1, and dopamine D2
receptors. In these interactions, arginine-rich epitopes formsalt bridges with phosphorylated serine or threonine residuesfromCK1/2 consensus sites. Each receptor (A2A, CB1, and D2)was found to include two evolutionarily conserved intracel-lular domains to establish selective electrostatic interactionswith intracellular domains of the other two receptors, indi-cating that these particular electrostatic interactions consti-tute a general mechanism for receptor heteromerization.Mutation experiments indicated that the interactions ofthe intracellular domains of the CB1 receptor with A2A andD2
receptors are fundamental for the correct formation of thequaternary structure needed for the function (MAPK signal-ing) of the A2A-CB1-D2 receptor heteromers. Analysis ofMAPK signaling in striatal slices of CB1 receptor KOmice andwild-type littermates supported the existence ofA1-CB1-D2 recep-tor heteromer in the brain. These findings allowed us to proposethe firstmolecularmodel of the quaternary structure of a receptorheteromultimer.
Receptor heteromers are the focus of intense research, asthrough heteromerization receptors become unique functionalentities with different properties from those of either receptorwhen not engaged in heteromerization resulting in new thera-peutic targets (1–4). Their unique properties provide a “bio-chemical fingerprint” thus allowing their identification innative tissues (1, 3). There is already a long list of discoveredheteromers with two different G protein-coupled receptors(GPCRs)2 (2, 4). Furthermore, we recently obtained evidencefor the existence of receptor heteromultimers, i.e. heteromersincluding more than two different receptors, and reported onheteromers, including the GPCRs adenosine A2A, cannabinoidCB1, and dopamine D2 receptors, in transfected cells (5).Evidence of GPCR homomultimers has also been recentlydemonstrated in living cells (6, 7). Many important ques-tions regarding receptor heteromers and heteromultimersremain unanswered. What is the arrangement of their GPCRunits (quaternary structure)? What are the molecular deter-minants of their quaternary structure? Last but not least,what is their functional significance in native tissues?It was inferred that different molecular mechanisms were
involved in GPCR homo- and heteromerization. For family CGPCRs, disulfide bonds between extracellular domains as wellas coiled-coil interactions between C-terminal domains seemto be necessary for the formation of functional homomeric orheteromeric receptors (8). For oligomerization of family AGPCRs, the helical transmembrane (TM) domains seem to beparticularly important (7, 9–15). In this study, by usingmutated A2A, CB1, and D2 receptors, we investigated the rele-vance of electrostatic interactions (16) between intracellulardomains in the determination of the quaternary structure ofGPCR heteromers between A2A, CB1, and D2 receptors. Ourinitial goal was to obtain evidence for multiple intracellularinteractions in the A2A-CB1-D2 receptor heteromultimer. Sig-nificantly, the same intracellular domains involved in A2A-CB1-D2 receptor heteromultimerization were also involved in
* This work was supported, in whole or in part, by a National Institutes ofHealth grant from intramural funds to NIDA. This work was also supportedby Spanish Ministerio de Ciencia y Tecnología Grants SAF2008-00146,SAF2006-05481, and SAF2008-03229-E/ for ERA-NET Coordination ofResearch Activities and Instituto de Salud Carlos III (RD07/0067/0008)Grant 060110 from Fundacio La Marato de TV3.
□S The on-line version of this article (available at http://www.jbc.org) containssupplemental Figs. 1 and 2 and Table 1.
1 To whom correspondence should be addressed: National Institute on DrugAbuse, Intramural Research Program, Department of Health and HumanServices, 333 Cassell Dr., Baltimore, MD 21224. Tel.: 443-740-2747; Fax: 443-740-2144; E-mail: [email protected].
2 The abbreviations used are: GPCR, G protein-coupled receptor; SRET,sequential resonance energy transfer; ANOVA, analysis of variance; PDB,Protein Data Bank; BRET, bioluminescence resonance energy transfer; TM,transmembrane; IL3, intracellular loop 3.
THE JOURNAL OF BIOLOGICAL CHEMISTRY VOL. 285, NO. 35, pp. 27346 –27359, August 27, 2010Printed in the U.S.A.
27346 JOURNAL OF BIOLOGICAL CHEMISTRY VOLUME 285 • NUMBER 35 • AUGUST 27, 2010
A2A-D2, A2A-CB1, and CB1-D2 receptor heteromerization. Athree-dimensional model of the quaternary structure of thereceptor heteromultimer was obtained by using the informa-tion from resonance energy transfer between A2A, CB1, and D2receptors in the receptor heteromultimer. Furthermore, a bio-chemical property of the receptor heteromultimerwas found tobe dependent on its correct quaternary structure, determinedby the intracellular electrostatic interactions, which allowed itsidentification in rodent brain tissue.
EXPERIMENTAL PROCEDURES
Cell Culture—HEK-293T cells were grown in Dulbecco’smodified Eagle’s medium (DMEM) (Invitrogen) supplementedwith 2 mM L-glutamine, 100 units/ml penicillin/streptomycin,and 5% (v/v) heat-inactivated fetal bovine serum (FBS) (all sup-plements were from Invitrogen). CHO cell lines were main-tained in �-minimal essential medium without nucleosides,containing 10% fetal calf serum, 50 �g/ml penicillin, 50 �g/mlstreptomycin, and 2 mM L-glutamine (300 �g/ml). Cells weremaintained at 37 °C in an atmosphere of 5% CO2 and werepassaged when they were 80–90% confluent, twice a week.Mutant Receptors—Ser374 in the C-terminal domain of the
human A2A receptor was mutated to Ala to obtain the A2AA374
receptor. The sequence 199RIFLAARRQ207 (boldface lettersindicate the amino acid involved in the interaction betweenthe receptors and the residues that were mutated) in the cyto-plasmat the end ofTM5of humanA2A receptorwasmutated to199RIFLAAAAQ207 to obtain the A2A
A205-A206 receptor. Thesequence 462SVSTDTSAE470 in the C-terminal domain ofhuman CB1 receptor was mutated to 462SVSTDAAAE470
to obtain the CB1A467-A468 receptor. The sequence
321TSEDGKVQVT330 in the third intracellular loop of humanCB1 receptor was mutated to 321AAEDGKVQVT330 to obtainCB1A321-A322 receptor. Mutations were performed by site-di-rected mutagenesis (Cellogenetics, Ijamsville, MD).Fusion Proteins and Expression Vectors—The human cDNAs
of the A2A, CB1, and the mutant versions of these receptors orthe human D2, D2S, and D4.4 receptors, cloned in pcDNA3.1,were amplified without their stop codons using sense and anti-sense primers harboring unique EcoRI and BamHI sites toclone A2A, A2A
A374, andA2AA205-A206 receptors in theRluc cor-
responding vector, EcoRI and KpnI to clone D2 and D2S recep-tors in the GFP2 corresponding vector, BamHI and EcoRI tocloneCB1, CB1A467-A468, andCB1A321-A322 in the enhancedYFPcorresponding vector, and XhoI and BamHI sites to clone D4.4receptor in the Rluc corresponding vector. The amplified frag-mentswere subcloned to be in-frame into restriction sites of themultiple cloning sites of pcDNA3.1-Rluc, pGFP2-N3(h),pEYFP-N1 (Clontech) to give the plasmids corresponding toA2A-Rluc, A2A
A374-Rluc A2AA205-A206-Rluc, D4-Rluc, D2-GFP2,
D2S-GFP2, CB1-YFP, CB1A467-A468-YFP, and CB1A321-A322-YFPreceptor fusion proteins. The cDNA of the 5HT2B-YFP fusionprotein was kindly provided by Dr. Irma Nardi (University ofPisa, Italy). Under these conditions, the fusion proteins areexpressed at the membrane level, are not strongly overex-pressed, and are quantitatively expressed in similar amounts(5).
Transient Transfection and Sample Preparation—HEK-293T or CHO cells growing in 6-well dishes were transientlytransfectedwith the corresponding fusion protein cDNAby thepolyethyleneimine method (Sigma). Cells were incubated (4 h)with the corresponding cDNA together with polyethylene-imine (5.47 mM in nitrogen residues) and 150 mM NaCl in aserum-starved medium. After 4 h, the medium was changed toa fresh complete culturemedium. Forty eight hours after trans-fection, cells were washed twice in quick succession in Hanks’balanced salt solutionwith 10mMglucose, detached, and resus-pended in the same buffer containing 1 mM EDTA. To controlthe cell number, sample protein concentration was determinedusing a Bradford assay kit (Bio-Rad) using bovine serum albu-min dilutions as standards. Cell suspension (20 �g of protein)was distributed into 96-well microplates; black plates withtransparent bottom were used for FRET and fluorescencedeterminations, and white plates with white bottom were usedfor BRET and SRET experiments.BRET Experiments—HEK-293T cells expressing the corre-
sponding donor (receptor Rluc) and increasing amounts of thecorresponding acceptor (receptor GFP2 for BRET2 or receptorYFP for BRET1), as indicated in figure legends, were used.Withaliquots of transfected cells (20 �g of protein), three differentdeterminations were performed in parallel. (i) To quantify fluo-rescence proteins expression, cells were distributed in 96-wellmicroplates (black plates with transparent bottom), and fluo-rescence was read in a Fluostar Optima Fluorimeter (BMGLabtechnologies, Offenburg, Germany) equipped with a highenergy xenon flash lamp, using an excitation filter at 410 nm forreceptor GFP2 reading (BRET2) or 485 nm for receptor YFPreading (BRET1), and emission was detected using filters at 510nm (for GFP2) or 530 nm (for YFP). Receptor fluorescenceexpressionwas determined as fluorescence of the sampleminusthe fluorescence of cells expressing receptor Rluc alone. (ii) ForBRET2 and BRET1 measurements, the equivalent of 20 �g ofcell suspensionwas distributed in 96-wellmicroplates (Corning3600, white plates with white bottom), and 5 �M DeepBlueC(BRET2) or coelenterazine H (BRET1) (Molecular Probes,Eugene,OR)was added. For BRET2 experiments, readingswerecollected immediately (�30 s) after addition of DeepBlueCusing aMithras LB 940 (Berthold Technologies, DLReady, Ger-many) that allows the integration of the signals detected in theshort wavelength filter at 410 nm and the long wavelength filterat 510 nm. In BRET1 after 1min of adding coelenterazineH, thereadings were collected using a Mithras LB 940 that allows theintegration of the signals detected in the short wavelength filterat 485 nm and the long wavelength filter at 530 nm. (iii) Toquantify receptor Rluc expression, luminescence readings wereperformed after 10 min of adding 5 �M coelenterazine H. Thenet BRET is defined as ((long wavelength emission)/(shortwavelength emission)) � Cf, where Cf corresponds to ((longwavelength emission)/(short wavelength emission)) for theRluc construct expressed alone in the same experiment.FRET Experiments—HEK-293T cells expressing the corre-
sponding donor (receptor GFP2) and increasing amounts of thecorresponding acceptor (receptor YFP), as indicated in figurelegends, were used. Using aliquots of transfected cells (20 �g ofprotein), two different determinations were performed in par-
Quaternary Structure of Receptor Heteromers
AUGUST 27, 2010 • VOLUME 285 • NUMBER 35 JOURNAL OF BIOLOGICAL CHEMISTRY 27347
allel. (i) To quantify YFP fluorescence, due to receptor YFPexpression, the same procedure as described for BRET experi-ments was used. (ii) For FRETmeasurements, the equivalent of20 �g of cell suspension was distributed into 96-well micro-plates (black plates with a transparent bottom) and read in aFluostar Optima fluorimeter equipped with a high energyxenon flash lamp, using an excitation filter at 410 nm and anemission filters at 510 nm (Chx) and 530 nm (Chy). Gain set-tings were identical for all experiments to keep the relative con-tribution of the fluorophores to the detection channels con-stant for spectral unmixing. The contribution of GFP2 and YFPproteins alone to the two detection channels (spectral signature(17)) was measured in experiments with cells expressing onlyone of these proteins and normalized to the sum of the signalobtained in the two detection channels. The spectral signaturesof the different receptors fused to either GFP2 or YFP did notvary significantly from the determined spectral signatures ofthe fluorescent proteins alone. In determinations i and ii, linearunmixing was done taking into account the spectral signatureas described by Zimmermann et al. (17) to separate the twoemission spectra. For quantitation of the fluorescence emittedby each of two individual fluorophores (FluoA correspondingto the donor and FluoB corresponding to the acceptor) in FRETexperiments, Equation 1 was applied,
FluoA � S/�1 � 1/R�
FluoB � S/�1 � R�
Being (Eq. 1)
S � Chx � Chy
R � �ByQ � Bx�/� Ax � AyQ�
Q � Chx/Chy
where Chx and Chy represent the signals in detection chan-nels x and y, and Ax, Bx and Ay, Bx represent the normalizedcontributions of FluoA or FluoB to channels x and y, as theyare known from the spectral signatures of the fluorescentproteins.Sequential Resonance Energy Transfer (SRET) Experiments—
The recently introduced sequential BRET-FRET (SRET) tech-nique (5) not only allows the demonstration of heteromeriza-tion of three proteins but can also provide information aboutthe quaternary structure of the heterotrimeric complex. Bytransfecting three receptors separately fused to Rluc, GFP2, andYFP, the detection of the SRET2 signal demonstrates the phys-ical interactions between the three receptors. In SRET2, theoxidation of the Rluc substrate DeepBlueC triggers GFP2 exci-tation (BRET2), which triggers a subsequent excitation ofYFP (FRET) (see Fig. 1). Emission of YFP after addition ofDeepBlueC is only possible if the three fusion proteins are inclose proximity (�10 nm), allowing bioluminescent and fluo-rescent SRET to occur. For SRET experiments, HEK-293T cellswere transiently co-transfected with the indicated amounts ofplasmid cDNAs corresponding to receptor Rluc, receptorGFP2, and receptor YFP (see figure legends). In the experimentswithout casein kinase 1/2 inhibitors, cells were used 48 h post-transfection. When using casein kinase 1/2 inhibitors, cellswere treated with casein kinase 1 inhibitor IC 261 (50 �M; Cal-
biochem) and casein kinase 2 inhibitor TBAC (10 �M; Calbio-chem) 4 h after transfection, and after 24 h, the medium waschanged to a fresh complete culture medium containing thesame amount of inhibitors, and cells were used 48 h post-trans-fection. Using aliquots of transfected cells (20 �g of protein),different determinations were performed in parallel. (i) Quan-tification of protein-YFP expression was performed as indi-cated in FRET experiments. The sample fluorescence is thefluorescence calculated as described minus the fluorescence ofcells expressing only protein-Rluc and protein-GFP2. (ii) Quan-tification of protein-Rluc expression was by determination ofthe luminescence due to protein-Rluc. Cells were distributed in96-well microplates (Corning 3600, white plates with whitebottom), and luminescence was determined 10 min after addi-tion of 5 �M coelenterazine H in a Mithras LB 940 multimodereader. (iii) BRET and FRETwere combined to generate a tech-nique called sequential BRET-FRET (SRET) that permits iden-tification of heteromers formed by three different proteins.Cells were distributed in 96-well microplates (Corning 3600,white plates with white bottom), and 5 �MDeepBlueC (Molec-ular Probes, Eugene, OR) was added. The SRET2 signal wascollected using a Mithras LB 940 reader with detection filtersfor short wavelength (410 nm) and long wavelength (530 nm).By analogy with BRET, net SRET2 is defined as ((long wave-length emission)/(short wavelength emission)) � Cf, where Cfcorresponds to long wavelength emission/short wavelengthemission for cells expressing protein-Rluc and protein-GFP2.Linear unmixing was done for SRET2 quantification, takinginto account the spectral signature to separate the two fluores-cence emission spectra (17). (iv) Using aliquots of cells trans-fected for SRET experiments, BRET1, BRET2, and FRET mea-surements were performed as indicated above. A SRET2
saturation curve can be obtained determining SRET2 as a func-tion of increasing expression of the FRET acceptor (receptorYFP). From these saturation curves, an apparent SRETmax wasdetermined by fitting data to a monophasic saturation curve bynonlinear regression using the commercial Grafit curve-fittingsoftware (Erithacus Software, Surrey, UK). These parametershave a similar meaning to these parameters when applied toBRET assays (5).ERK Phosphorylation Assays—Wild-type littermates and
CB1 receptor knock-out CD1 albino Swiss male mice, 8 weeksold, weighing 25 g were used. The generation of mice lackingCB1 receptor has been described elsewhere (18, 19). Mice werehoused five per cage in a temperature- (21 � 1 °C) and humid-ity-controlled (55 � 10%) room with a 12:12 h light/dark cycle(light between 08:00 and 20:00 h) with food and water ad libi-tum. Animal procedureswere conducted according to standardethical guidelines (European Communities Council Directive86/609/EEC) and approved by the Local Ethical Committee(IMAS-IMIM/UPF). Mice were decapitated with a guillotine,and the brains were rapidly removed and placed in ice-coldoxygenated (O2/CO2, 95:5%) Krebs-HCO3
� buffer (124 mM
NaCl, 4 mM KCl, 1.25 mM NaH2PO4, 1.5 mM MgCl2, 1.5 mM
CaCl2, 10mMglucose, and 26mMNaHCO3, pH7.4). The brainswere sliced at 4 °C in a brain matrix (Zivic Instruments, Pitts-burgh, PA) into 0.5-mm coronal slices. Slices were kept at 4 °Cin Krebs-HCO3
� buffer during the dissection of the striatum.
Quaternary Structure of Receptor Heteromers
27348 JOURNAL OF BIOLOGICAL CHEMISTRY VOLUME 285 • NUMBER 35 • AUGUST 27, 2010
Each slice was transferred into an incubation tube containing 1ml of ice-coldKrebs-HCO3
� buffer. The temperaturewas raisedto 23 °C, and after 30 min, the media were replaced by 2 ml ofKrebs-HCO3
� buffer (23 °C). The slices were incubated underconstant oxygenation (O2/CO2, 95:5%) at 30 °C for 4–5 h in anEppendorf thermomixer (Eppendorf-5 Prime, Inc., Boulder,CO). The media were replaced by 200 �l of fresh Krebs-HCO3
�
buffer, and after 30min, 1 �M of the A2A receptor agonist CGS-21680, 1 �M of the D2 receptor agonist quinpirole, or both pre-pared in Krebs-HCO3
� buffer were added. After 10 min, theincubation solution was discarded, and slices were frozen ondry ice and stored at �80 °C. When ERK phosphorylationassays were performed in cell cultures, CHO cells (48 h aftertransfection) were cultured in serum-free medium for 16 hbefore the addition of any agent. Cells were resuspended inHanks’ balanced salt solution buffer and were treated for 5 minwith CGS2168 (200 nM), quinpirole (1�M), or amixture of bothligands and rinsed with ice-cold phosphate-buffered saline.Both cells and slices were lysed by the addition of 500 �l ofice-cold lysis buffer (50 mM Tris-HCl, pH 7.4, 50 mM NaF, 150mMNaCl, 45 mM �-glycerophosphate, 1% Triton X-100, 20 �M
phenylarsine oxide, 0.4mMNaVO4, andprotease inhibitormix-ture). The cellular debris was removed by centrifugation at13,000 � g for 5 min at 4 °C, and the protein was quantified bythe bicinchoninic acid method using bovine serum albumindilutions as standard. To determine the level of ERK1/2 phos-phorylation, equivalent amounts of protein (10 �g) were sepa-rated by electrophoresis on a denaturing 7.5% SDS-polyacryl-amide gel and transferred onto PVDF membranes. Themembranes were then probed with a mouse anti-phospho-ERK1/2 antibody (Sigma, 1:2500). To rule out that the differ-ences observed were due to the application of unequal amountsof lysates, PVDF blots were stripped and probed with a rabbitanti-ERK1/2 antibody that recognizes both phosphorylatedand nonphosphorylated ERK1/2 (Sigma, 1:40,000). Bands werevisualized by the addition of anti-mouse HRP-conjugated(Dako, Glostrup, Denmark) or anti-rabbit HRP-conjugated(Sigma) secondary antibodies, respectively, and SuperSignalWest Pico chemiluminescent substrate (Pierce). Bands densi-ties were quantified with LAS-3000 (Fujifilm), and the level ofphosphorylated ERK1/2 isoforms was normalized for differ-ences in loading using the total ERK protein band intensities.Quantitative analysis of detected bands was performed byImageGauge version 4.0 software. Bifactorial ANOVAandposthoc Bonferroni tests were used for statistical comparisons.Mass Spectometric Analysis—0.3 �l of equimolar solutions
of the various peptides were deposited on the sample plate fol-lowed by 0.3 �l of matrix, a saturated solution of 2,4,6-trihy-droxyacetophenone in 50% ethanol, and left to dry at roomtemperature. Spectra of each sample spot were acquired using aMALDI TOF-TOF instrument (Applied Biosystem 4700 pro-teomics analyzer, Framingham,MA) in positive ionmode. Eachspectrum is the average of 1000 shots. All peptideswere synthe-sized at The Johns Hopkins School of Medicine “Synthesis andSequencing Facility.”Computational Models of D2, CB1, and A2A Receptors—The
amino acid sequences of the human D2 receptor (accessionnumber P14416), CB1 receptor (P21554), and A2A receptor
(P29274) receptors were obtained from UniProt. Structuralsimulations of the A2A receptor are based on its crystal struc-ture (PDB code 3EML) (20). Simulations of the D2 and CB1receptors are based on computational models constructed byhomology modeling techniques using the crystal structure ofthe �2-adrenergic receptor (PDB code 2RH1) (21, 22) as tem-plate. Because of the absence of P5.50 Ballesteros-Weinsteinnumbering (23) in the CB1 receptor, we superimposedTyr292(5.58) and Lys300(5.66) to Tyr219(5.58) and Lys227(5.66)of the �2-adrenergic receptor. Tyr5.58 and Lys5.66 are struc-tural and functional amino acids involved in the stabilization ofthe active state by interacting with Arg3.50 and Asp/Glu6.30,respectively, as revealed by the recent crystal structure of theligand-free opsin, which contains several distinctive features ofthe active state (24). The highly conserved NPXXYXn � 5,6F(K/R) motif at the junction between TM7 and Hx8 is one residueshorter in the �2-adrenergic receptor (n� 5) than in rhodopsinand D2 or CB1 receptors (n � 6). Thus, this junction in D2 orCB1 receptors was modeled as in rhodopsin (PDB codes 1GZMand 2Z73) (25, 26). The unambiguous assignment of the TMboundaries to a particular position is not possible. However, wehave assumed that TM5ofA2A extends to positionArg206(5.67)as shown in the crystal structure (20), andTM5ofD2 extends toposition Arg220(5.69) according to the �2-based homologymodel (21, 22). These definitions of TM5 cause Arg205(5.66)–Arg206(5.67) of the A2A receptor and 215(5.64)VLR-RRRKRVN224 of the D2 receptor to be located at the end ofTM5 in the cytoplasm. In contrast, the Swiss Protein Databaseassigns these epitopes of A2A and D2 in IL3. The crystal struc-ture of squid rhodopsin (PDB code 2Z73) has shown that inaddition to the conserved amphipathicHx8 that runs parallel tothe membrane, the C terminus expands toward TM6 (25).However, the structural homology, among GPCRs, probablydoes not extend to this C-tail domain because of its high varia-bility in length and amino acid composition among the mem-bers of the family. This C-tail is formed by 59 amino acids in theCB1 receptor (Ser414–Leu472), only 1 amino acid in the D2receptor (Cys443), and 104 amino acids in the A2A receptor(Arg309–Ser412). Nevertheless, Ser414–Asn437 of the CB1 recep-tor and Arg309–Gly330 of the A2A receptor, forming part of thisC-tail sequence, were modeled, in an arbitrary manner, basedon the structure of squid rhodopsin.Computational Models of Receptor Heteromers—Cysteine
cross-linking experiments have suggested that receptor oligo-merization involves the surfaces of TM1, -4, and/or -5 (10, 12,13). Thus, the structures of receptor heteromers were modeledin such a manner that substituted cysteines at position 1.35could be cross-linked (TM1–TM1) (13); or positions 4.41, 4.44,4.48, 4.51, and 4.59 (TM4-TM4invago) (12); or positions 4.50,4.54, and 4.58 (TM4-TM4ago) (12); or position 5.41 (TM5-TM5) (12).
RESULTS
Quaternary Structure of the A2A-CB1-D2 Receptor Heteromer—Anobvious initial question about receptor heteromersmade upof three different receptors is whether each receptor interactswith the other two or not, i.e. if they form a triangular or lineararrangement. As in a prior report (5), we first demonstrated the
Quaternary Structure of Receptor Heteromers
AUGUST 27, 2010 • VOLUME 285 • NUMBER 35 JOURNAL OF BIOLOGICAL CHEMISTRY 27349
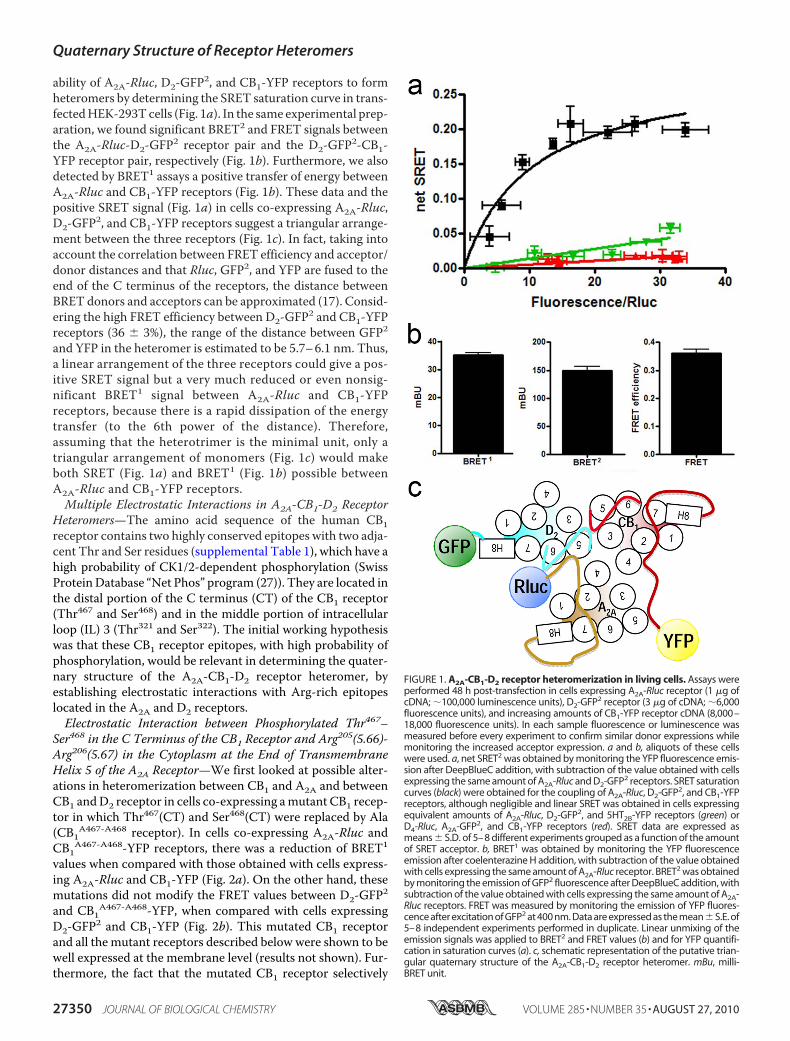
ability of A2A-Rluc, D2-GFP2, and CB1-YFP receptors to formheteromers by determining the SRET saturation curve in trans-fectedHEK-293Tcells (Fig. 1a). In the same experimental prep-aration, we found significant BRET2 and FRET signals betweenthe A2A-Rluc-D2-GFP2 receptor pair and the D2-GFP2-CB1-YFP receptor pair, respectively (Fig. 1b). Furthermore, we alsodetected by BRET1 assays a positive transfer of energy betweenA2A-Rluc and CB1-YFP receptors (Fig. 1b). These data and thepositive SRET signal (Fig. 1a) in cells co-expressing A2A-Rluc,D2-GFP2, and CB1-YFP receptors suggest a triangular arrange-ment between the three receptors (Fig. 1c). In fact, taking intoaccount the correlation between FRET efficiency and acceptor/donor distances and that Rluc, GFP2, and YFP are fused to theend of the C terminus of the receptors, the distance betweenBRET donors and acceptors can be approximated (17). Consid-ering the high FRET efficiency between D2-GFP2 and CB1-YFPreceptors (36 � 3%), the range of the distance between GFP2and YFP in the heteromer is estimated to be 5.7–6.1 nm. Thus,a linear arrangement of the three receptors could give a pos-itive SRET signal but a very much reduced or even nonsig-nificant BRET1 signal between A2A-Rluc and CB1-YFPreceptors, because there is a rapid dissipation of the energytransfer (to the 6th power of the distance). Therefore,assuming that the heterotrimer is the minimal unit, only atriangular arrangement of monomers (Fig. 1c) would makeboth SRET (Fig. 1a) and BRET1 (Fig. 1b) possible betweenA2A-Rluc and CB1-YFP receptors.Multiple Electrostatic Interactions in A2A-CB1-D2 Receptor
Heteromers—The amino acid sequence of the human CB1receptor contains two highly conserved epitopes with two adja-cent Thr and Ser residues (supplemental Table 1), which have ahigh probability of CK1/2-dependent phosphorylation (SwissProteinDatabase “Net Phos” program (27)). They are located inthe distal portion of the C terminus (CT) of the CB1 receptor(Thr467 and Ser468) and in the middle portion of intracellularloop (IL) 3 (Thr321 and Ser322). The initial working hypothesiswas that these CB1 receptor epitopes, with high probability ofphosphorylation, would be relevant in determining the quater-nary structure of the A2A-CB1-D2 receptor heteromer, byestablishing electrostatic interactions with Arg-rich epitopeslocated in the A2A and D2 receptors.Electrostatic Interaction between Phosphorylated Thr467–
Ser468 in the C Terminus of the CB1 Receptor and Arg205(5.66)-Arg206(5.67) in the Cytoplasm at the End of TransmembraneHelix 5 of the A2A Receptor—We first looked at possible alter-ations in heteromerization between CB1 and A2A and betweenCB1 andD2 receptor in cells co-expressing amutant CB1 recep-tor in which Thr467(CT) and Ser468(CT) were replaced by Ala(CB1A467-A468 receptor). In cells co-expressing A2A-Rluc andCB1A467-A468-YFP receptors, there was a reduction of BRET1
values when compared with those obtained with cells express-ing A2A-Rluc and CB1-YFP (Fig. 2a). On the other hand, thesemutations did not modify the FRET values between D2-GFP2and CB1A467-A468-YFP, when compared with cells expressingD2-GFP2 and CB1-YFP (Fig. 2b). This mutated CB1 receptorand all the mutant receptors described below were shown to bewell expressed at the membrane level (results not shown). Fur-thermore, the fact that the mutated CB1 receptor selectively
FIGURE 1. A2A-CB1-D2 receptor heteromerization in living cells. Assays wereperformed 48 h post-transfection in cells expressing A2A-Rluc receptor (1 �g ofcDNA; �100,000 luminescence units), D2-GFP2 receptor (3 �g of cDNA; �6,000fluorescence units), and increasing amounts of CB1-YFP receptor cDNA (8,000–18,000 fluorescence units). In each sample fluorescence or luminescence wasmeasured before every experiment to confirm similar donor expressions whilemonitoring the increased acceptor expression. a and b, aliquots of these cellswere used. a, net SRET2 was obtained by monitoring the YFP fluorescence emis-sion after DeepBlueC addition, with subtraction of the value obtained with cellsexpressing the same amount of A2A-Rluc and D2-GFP2 receptors. SRET saturationcurves (black) were obtained for the coupling of A2A-Rluc, D2-GFP2, and CB1-YFPreceptors, although negligible and linear SRET was obtained in cells expressingequivalent amounts of A2A-Rluc, D2-GFP2, and 5HT2B-YFP receptors (green) orD4-Rluc, A2A-GFP2, and CB1-YFP receptors (red). SRET data are expressed asmeans � S.D. of 5–8 different experiments grouped as a function of the amountof SRET acceptor. b, BRET1 was obtained by monitoring the YFP fluorescenceemission after coelenterazine H addition, with subtraction of the value obtainedwith cells expressing the same amount of A2A-Rluc receptor. BRET2 was obtainedby monitoring the emission of GFP2 fluorescence after DeepBlueC addition, withsubtraction of the value obtained with cells expressing the same amount of A2A-Rluc receptors. FRET was measured by monitoring the emission of YFP fluores-cence after excitation of GFP2 at 400 nm. Data are expressed as the mean�S.E. of5–8 independent experiments performed in duplicate. Linear unmixing of theemission signals was applied to BRET2 and FRET values (b) and for YFP quantifi-cation in saturation curves (a). c, schematic representation of the putative trian-gular quaternary structure of the A2A-CB1-D2 receptor heteromer. mBu, milli-BRET unit.
Quaternary Structure of Receptor Heteromers
27350 JOURNAL OF BIOLOGICAL CHEMISTRY VOLUME 285 • NUMBER 35 • AUGUST 27, 2010
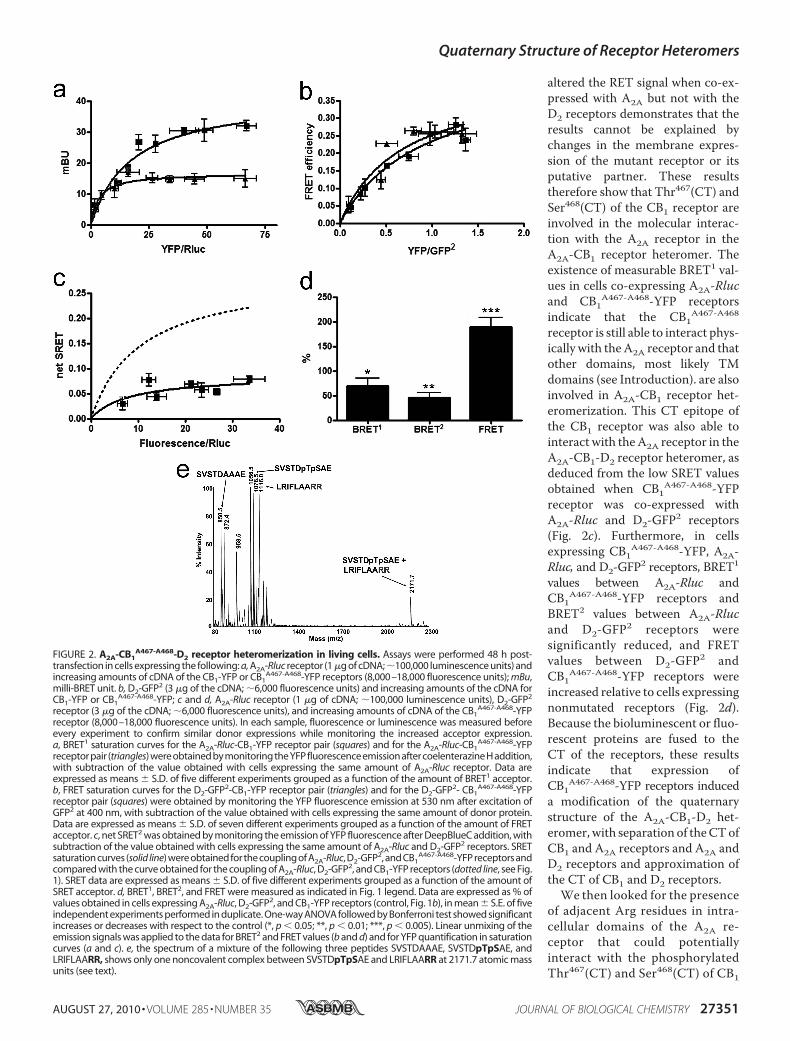
altered the RET signal when co-ex-pressed with A2A but not with theD2 receptors demonstrates that theresults cannot be explained bychanges in the membrane expres-sion of the mutant receptor or itsputative partner. These resultstherefore show that Thr467(CT) andSer468(CT) of the CB1 receptor areinvolved in the molecular interac-tion with the A2A receptor in theA2A-CB1 receptor heteromer. Theexistence of measurable BRET1 val-ues in cells co-expressing A2A-Rlucand CB1A467-A468-YFP receptorsindicate that the CB1A467-A468receptor is still able to interact phys-ically with theA2A receptor and thatother domains, most likely TMdomains (see Introduction). are alsoinvolved in A2A-CB1 receptor het-eromerization. This CT epitope ofthe CB1 receptor was also able tointeract with theA2A receptor in theA2A-CB1-D2 receptor heteromer, asdeduced from the low SRET valuesobtained when CB1A467-A468-YFPreceptor was co-expressed withA2A-Rluc and D2-GFP2 receptors(Fig. 2c). Furthermore, in cellsexpressing CB1A467-A468-YFP, A2A-Rluc, and D2-GFP2 receptors, BRET1
values between A2A-Rluc andCB1A467-A468-YFP receptors andBRET2 values between A2A-Rlucand D2-GFP2 receptors weresignificantly reduced, and FRETvalues between D2-GFP2 andCB1A467-A468-YFP receptors wereincreased relative to cells expressingnonmutated receptors (Fig. 2d).Because the bioluminescent or fluo-rescent proteins are fused to theCT of the receptors, these resultsindicate that expression ofCB1A467-A468-YFP receptors induceda modification of the quaternarystructure of the A2A-CB1-D2 het-eromer,with separation of theCTofCB1 and A2A receptors and A2A andD2 receptors and approximation ofthe CT of CB1 and D2 receptors.
We then looked for the presenceof adjacent Arg residues in intra-cellular domains of the A2A re-ceptor that could potentiallyinteract with the phosphorylatedThr467(CT) and Ser468(CT) of CB1
FIGURE 2. A2A-CB1A467-A468-D2 receptor heteromerization in living cells. Assays were performed 48 h post-
transfection in cells expressing the following: a, A2A-Rluc receptor (1 �g of cDNA; �100,000 luminescence units) andincreasing amounts of cDNA of the CB1-YFP or CB1
A467-A468-YFP receptors (8,000–18,000 fluorescence units); mBu,milli-BRET unit. b, D2-GFP2 (3 �g of the cDNA; �6,000 fluorescence units) and increasing amounts of the cDNA forCB1-YFP or CB1
A467-A468-YFP; c and d, A2A-Rluc receptor (1 �g of cDNA; �100,000 luminescence units), D2-GFP2
receptor (3 �g of the cDNA; �6,000 fluorescence units), and increasing amounts of cDNA of the CB1A467-A468-YFP
receptor (8,000–18,000 fluorescence units). In each sample, fluorescence or luminescence was measured beforeevery experiment to confirm similar donor expressions while monitoring the increased acceptor expression.a, BRET1 saturation curves for the A2A-Rluc-CB1-YFP receptor pair (squares) and for the A2A-Rluc-CB1
A467-A468-YFPreceptor pair (triangles) were obtained by monitoring the YFP fluorescence emission after coelenterazine H addition,with subtraction of the value obtained with cells expressing the same amount of A2A-Rluc receptor. Data areexpressed as means � S.D. of five different experiments grouped as a function of the amount of BRET1 acceptor.b, FRET saturation curves for the D2-GFP2-CB1-YFP receptor pair (triangles) and for the D2-GFP2- CB1
A467-A468-YFPreceptor pair (squares) were obtained by monitoring the YFP fluorescence emission at 530 nm after excitation ofGFP2 at 400 nm, with subtraction of the value obtained with cells expressing the same amount of donor protein.Data are expressed as means � S.D. of seven different experiments grouped as a function of the amount of FRETacceptor. c, net SRET2 was obtained by monitoring the emission of YFP fluorescence after DeepBlueC addition, withsubtraction of the value obtained with cells expressing the same amount of A2A-Rluc and D2-GFP2 receptors. SRETsaturation curves (solid line) were obtained for the coupling of A2A-Rluc, D2-GFP2, and CB1
A467-A468-YFP receptors andcompared with the curve obtained for the coupling of A2A-Rluc, D2-GFP2, and CB1-YFP receptors (dotted line, see Fig.1). SRET data are expressed as means � S.D. of five different experiments grouped as a function of the amount ofSRET acceptor. d, BRET1, BRET2, and FRET were measured as indicated in Fig. 1 legend. Data are expressed as % ofvalues obtained in cells expressing A2A-Rluc, D2-GFP2, and CB1-YFP receptors (control, Fig. 1b), in mean � S.E. of fiveindependent experiments performed in duplicate. One-way ANOVA followed by Bonferroni test showed significantincreases or decreases with respect to the control (*, p � 0.05; **, p � 0.01; ***, p � 0.005). Linear unmixing of theemission signals was applied to the data for BRET2 and FRET values (b and d) and for YFP quantification in saturationcurves (a and c). e, the spectrum of a mixture of the following three peptides SVSTDAAAE, SVSTDpTpSAE, andLRIFLAARR, shows only one noncovalent complex between SVSTDpTpSAE and LRIFLAARR at 2171.7 atomic massunits (see text).
Quaternary Structure of Receptor Heteromers
AUGUST 27, 2010 • VOLUME 285 • NUMBER 35 JOURNAL OF BIOLOGICAL CHEMISTRY 27351
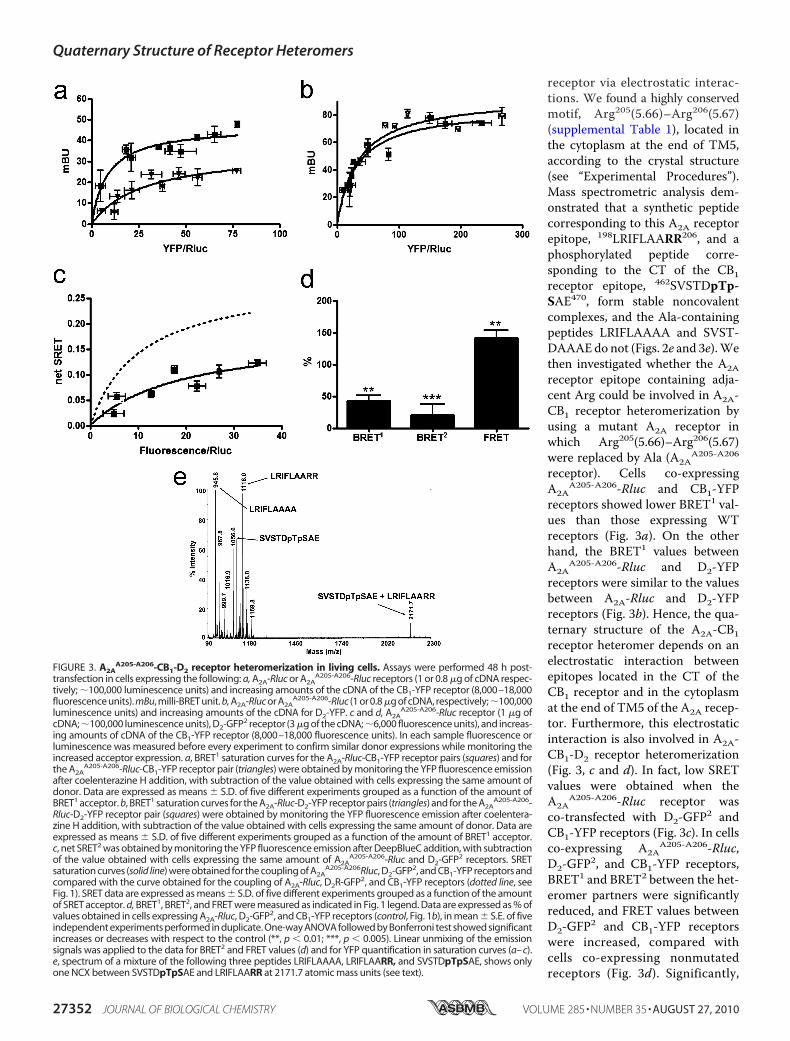
receptor via electrostatic interac-tions. We found a highly conservedmotif, Arg205(5.66)–Arg206(5.67)(supplemental Table 1), located inthe cytoplasm at the end of TM5,according to the crystal structure(see “Experimental Procedures”).Mass spectrometric analysis dem-onstrated that a synthetic peptidecorresponding to this A2A receptorepitope, 198LRIFLAARR206, and aphosphorylated peptide corre-sponding to the CT of the CB1receptor epitope, 462SVSTDpTp-SAE470, form stable noncovalentcomplexes, and the Ala-containingpeptides LRIFLAAAA and SVST-DAAAEdo not (Figs. 2e and 3e).Wethen investigated whether the A2Areceptor epitope containing adja-cent Arg could be involved in A2A-CB1 receptor heteromerization byusing a mutant A2A receptor inwhich Arg205(5.66)–Arg206(5.67)were replaced by Ala (A2A
A205-A206
receptor). Cells co-expressingA2A
A205-A206-Rluc and CB1-YFPreceptors showed lower BRET1 val-ues than those expressing WTreceptors (Fig. 3a). On the otherhand, the BRET1 values betweenA2A
A205-A206-Rluc and D2-YFPreceptors were similar to the valuesbetween A2A-Rluc and D2-YFPreceptors (Fig. 3b). Hence, the qua-ternary structure of the A2A-CB1receptor heteromer depends on anelectrostatic interaction betweenepitopes located in the CT of theCB1 receptor and in the cytoplasmat the end of TM5 of the A2A recep-tor. Furthermore, this electrostaticinteraction is also involved in A2A-CB1-D2 receptor heteromerization(Fig. 3, c and d). In fact, low SRETvalues were obtained when theA2A
A205-A206-Rluc receptor wasco-transfected with D2-GFP2 andCB1-YFP receptors (Fig. 3c). In cellsco-expressing A2A
A205-A206-Rluc,D2-GFP2, and CB1-YFP receptors,BRET1 and BRET2 between the het-eromer partners were significantlyreduced, and FRET values betweenD2-GFP2 and CB1-YFP receptorswere increased, compared withcells co-expressing nonmutatedreceptors (Fig. 3d). Significantly,
FIGURE 3. A2AA205-A206-CB1-D2 receptor heteromerization in living cells. Assays were performed 48 h post-
transfection in cells expressing the following: a, A2A-Rluc or A2AA205-A206-Rluc receptors (1 or 0.8 �g of cDNA respec-
tively; �100,000 luminescence units) and increasing amounts of the cDNA of the CB1-YFP receptor (8,000–18,000fluorescence units). mBu, milli-BRET unit. b, A2A-Rluc or A2A
A205-A206-Rluc (1 or 0.8 �g of cDNA, respectively;�100,000luminescence units) and increasing amounts of the cDNA for D2-YFP. c and d, A2A
A205-A206-Rluc receptor (1 �g ofcDNA; �100,000 luminescence units), D2-GFP2 receptor (3 �g of the cDNA; �6,000 fluorescence units), and increas-ing amounts of cDNA of the CB1-YFP receptor (8,000–18,000 fluorescence units). In each sample fluorescence orluminescence was measured before every experiment to confirm similar donor expressions while monitoring theincreased acceptor expression. a, BRET1 saturation curves for the A2A-Rluc-CB1-YFP receptor pairs (squares) and forthe A2A
A205-A206-Rluc-CB1-YFP receptor pair (triangles) were obtained by monitoring the YFP fluorescence emissionafter coelenterazine H addition, with subtraction of the value obtained with cells expressing the same amount ofdonor. Data are expressed as means � S.D. of five different experiments grouped as a function of the amount ofBRET1 acceptor. b, BRET1 saturation curves for the A2A-Rluc-D2-YFP receptor pairs (triangles) and for the A2A
A205-A206-Rluc-D2-YFP receptor pair (squares) were obtained by monitoring the YFP fluorescence emission after coelentera-zine H addition, with subtraction of the value obtained with cells expressing the same amount of donor. Data areexpressed as means � S.D. of five different experiments grouped as a function of the amount of BRET1 acceptor.c, net SRET2 was obtained by monitoring the YFP fluorescence emission after DeepBlueC addition, with subtractionof the value obtained with cells expressing the same amount of A2A
A205-A206-Rluc and D2-GFP2 receptors. SRETsaturation curves (solid line) were obtained for the coupling of A2A
A205-A206Rluc, D2-GFP2, and CB1-YFP receptors andcompared with the curve obtained for the coupling of A2A-Rluc, D2R-GFP2, and CB1-YFP receptors (dotted line, seeFig. 1). SRET data are expressed as means � S.D. of five different experiments grouped as a function of the amountof SRET acceptor. d, BRET1, BRET2, and FRET were measured as indicated in Fig. 1 legend. Data are expressed as % ofvalues obtained in cells expressing A2A-Rluc, D2-GFP2, and CB1-YFP receptors (control, Fig. 1b), in mean � S.E. of fiveindependent experiments performed in duplicate. One-way ANOVA followed by Bonferroni test showed significantincreases or decreases with respect to the control (**, p � 0.01; ***, p � 0.005). Linear unmixing of the emissionsignals was applied to the data for BRET2 and FRET values (d) and for YFP quantification in saturation curves (a– c).e, spectrum of a mixture of the following three peptides LRIFLAAAA, LRIFLAARR, and SVSTDpTpSAE, shows onlyone NCX between SVSTDpTpSAE and LRIFLAARR at 2171.7 atomic mass units (see text).
Quaternary Structure of Receptor Heteromers
27352 JOURNAL OF BIOLOGICAL CHEMISTRY VOLUME 285 • NUMBER 35 • AUGUST 27, 2010
this outcome is qualitatively thesame as the one shown in Fig. 2dwith CB1
A467-A468-YFP receptor,as it would be expected if bothmutants disrupt the same inter-molecular interaction.Electrostatic Interaction between
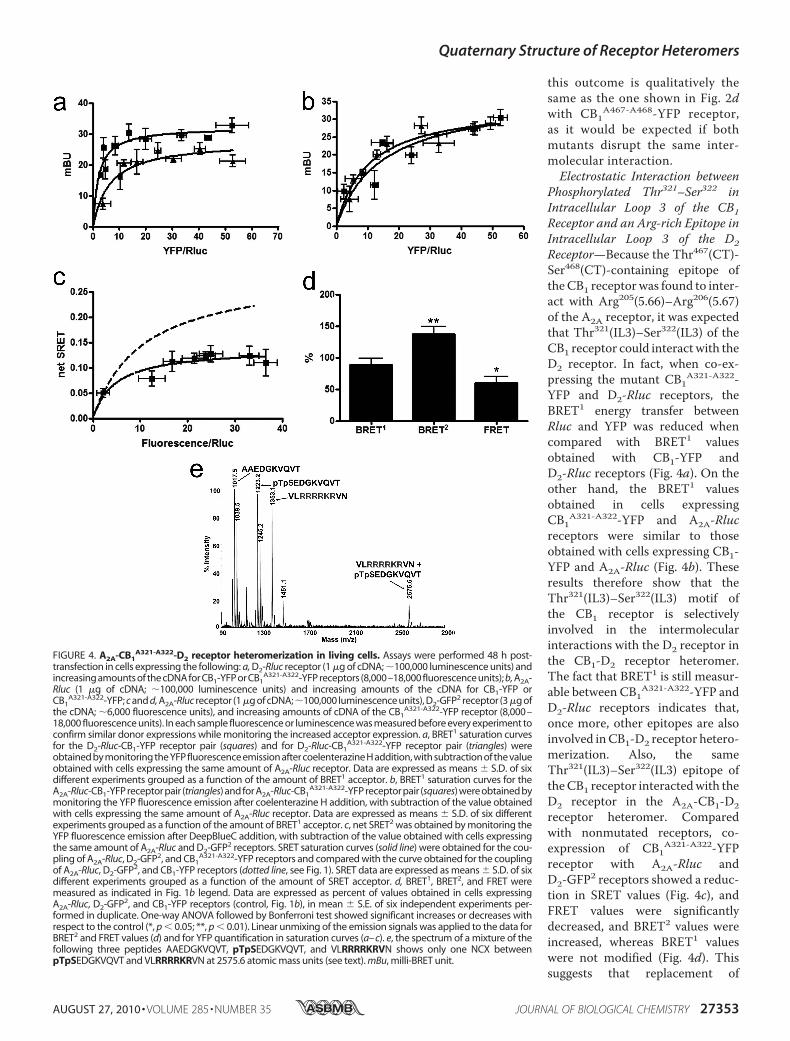
Phosphorylated Thr321–Ser322 inIntracellular Loop 3 of the CB1Receptor and an Arg-rich Epitope inIntracellular Loop 3 of the D2Receptor—Because the Thr467(CT)-Ser468(CT)-containing epitope oftheCB1 receptorwas found to inter-act with Arg205(5.66)–Arg206(5.67)of the A2A receptor, it was expectedthat Thr321(IL3)–Ser322(IL3) of theCB1 receptor could interact with theD2 receptor. In fact, when co-ex-pressing the mutant CB1A321-A322-YFP and D2-Rluc receptors, theBRET1 energy transfer betweenRluc and YFP was reduced whencompared with BRET1 valuesobtained with CB1-YFP andD2-Rluc receptors (Fig. 4a). On theother hand, the BRET1 valuesobtained in cells expressingCB1A321-A322-YFP and A2A-Rlucreceptors were similar to thoseobtained with cells expressing CB1-YFP and A2A-Rluc (Fig. 4b). Theseresults therefore show that theThr321(IL3)–Ser322(IL3) motif ofthe CB1 receptor is selectivelyinvolved in the intermolecularinteractions with the D2 receptor inthe CB1-D2 receptor heteromer.The fact that BRET1 is still measur-able between CB1A321-A322-YFP andD2-Rluc receptors indicates that,once more, other epitopes are alsoinvolved inCB1-D2 receptor hetero-merization. Also, the sameThr321(IL3)–Ser322(IL3) epitope oftheCB1 receptor interactedwith theD2 receptor in the A2A-CB1-D2receptor heteromer. Comparedwith nonmutated receptors, co-expression of CB1A321-A322-YFPreceptor with A2A-Rluc andD2-GFP2 receptors showed a reduc-tion in SRET values (Fig. 4c), andFRET values were significantlydecreased, and BRET2 values wereincreased, whereas BRET1 valueswere not modified (Fig. 4d). Thissuggests that replacement of
FIGURE 4. A2A-CB1A321-A322-D2 receptor heteromerization in living cells. Assays were performed 48 h post-
transfection in cells expressing the following: a, D2-Rluc receptor (1 �g of cDNA; �100,000 luminescence units) andincreasing amounts of the cDNA for CB1-YFP or CB1
A321-A322-YFP receptors (8,000–18,000 fluorescence units); b, A2A-Rluc (1 �g of cDNA; �100,000 luminescence units) and increasing amounts of the cDNA for CB1-YFP orCB1
A321-A322-YFP; c and d, A2A-Rluc receptor (1 �g of cDNA;�100,000 luminescence units), D2-GFP2 receptor (3 �g ofthe cDNA; �6,000 fluorescence units), and increasing amounts of cDNA of the CB1
A321-A322-YFP receptor (8,000–18,000 fluorescence units). In each sample fluorescence or luminescence was measured before every experiment toconfirm similar donor expressions while monitoring the increased acceptor expression. a, BRET1 saturation curvesfor the D2-Rluc-CB1-YFP receptor pair (squares) and for D2-Rluc-CB1
A321-A322-YFP receptor pair (triangles) wereobtained by monitoring the YFP fluorescence emission after coelenterazine H addition, with subtraction of the valueobtained with cells expressing the same amount of A2A-Rluc receptor. Data are expressed as means � S.D. of sixdifferent experiments grouped as a function of the amount of BRET1 acceptor. b, BRET1 saturation curves for theA2A-Rluc-CB1-YFP receptor pair (triangles) and for A2A-Rluc-CB1
A321-A322-YFP receptor pair (squares) were obtained bymonitoring the YFP fluorescence emission after coelenterazine H addition, with subtraction of the value obtainedwith cells expressing the same amount of A2A-Rluc receptor. Data are expressed as means � S.D. of six differentexperiments grouped as a function of the amount of BRET1 acceptor. c, net SRET2 was obtained by monitoring theYFP fluorescence emission after DeepBlueC addition, with subtraction of the value obtained with cells expressingthe same amount of A2A-Rluc and D2-GFP2 receptors. SRET saturation curves (solid line) were obtained for the cou-pling of A2A-Rluc, D2-GFP2, and CB1
A321-A322-YFP receptors and compared with the curve obtained for the couplingof A2A-Rluc, D2-GFP2, and CB1-YFP receptors (dotted line, see Fig. 1). SRET data are expressed as means � S.D. of sixdifferent experiments grouped as a function of the amount of SRET acceptor. d, BRET1, BRET2, and FRET weremeasured as indicated in Fig. 1b legend. Data are expressed as percent of values obtained in cells expressingA2A-Rluc, D2-GFP2, and CB1-YFP receptors (control, Fig. 1b), in mean � S.E. of six independent experiments per-formed in duplicate. One-way ANOVA followed by Bonferroni test showed significant increases or decreases withrespect to the control (*, p � 0.05; **, p � 0.01). Linear unmixing of the emission signals was applied to the data forBRET2 and FRET values (d) and for YFP quantification in saturation curves (a– c). e, the spectrum of a mixture of thefollowing three peptides AAEDGKVQVT, pTpSEDGKVQVT, and VLRRRRKRVN shows only one NCX betweenpTpSEDGKVQVT and VLRRRRKRVN at 2575.6 atomic mass units (see text). mBu, milli-BRET unit.
Quaternary Structure of Receptor Heteromers
AUGUST 27, 2010 • VOLUME 285 • NUMBER 35 JOURNAL OF BIOLOGICAL CHEMISTRY 27353
Thr321(IL3) and Ser322(IL3) by Alain CB1 receptor induces a modifi-cation of the quaternary structureof the A2A-CB1-D2 receptor het-eromer with separation of the CTof the CB1 and D2 receptors and anapproximation of the CT of theD2 and A2A receptors. Thus, CB1receptor uses two different CK1/2-dependent phosphorylatableepitopes, located in their CT(Thr467–Ser468) and IL3 (Thr321–Ser322) domains, to establishsimultaneous electrostatic inter-actions with the A2A and D2 recep-tors, respectively, in the A2A-CB1-D2 receptor heteromer.Next step was finding out which
intracellular epitope of the D2 recep-tor is involved in CB1-D2 receptorheteromerization. D2 receptor con-tains two highly conserved Arg-richepitopes (supplemental Table 1),215(5.64)VLRRRRKRVN224, locatedat the end of TM5 in the cytoplasm(according to the homology mod-eling using the �2-adrenergicreceptor as a template; see under“Experimental Procedures”), and266NRRRVEAARR275, in the mid-dle of IL3. Because the VLR-RRRKRVN epitope is most proba-bly involved in A2A-D2 receptorheteromerization (28, 29), weexplored the possibility that IL3 ofthe D2 receptor could interact withIL3 of the CB1 receptor (phos-phorylated Thr321–Ser322), The D2short isoform (D2S), an alternativesplicing that lacks 29 amino acidresidues of IL3 (30), including266NRRRVEAARR275, was used.SRET values were clearly reducedwhenD2S-GFP2 receptorwas co-ex-pressed with A2A-Rluc and CB1-YFP receptors (Fig. 5c). Signifi-cantly, the D2S receptor led to thesame qualitative modifications ofthe quaternary structure of the A2A-CB1-D2 receptor heteromer asthose induced by CB1A321-A322-YFPreceptor (Fig. 5d). Thus, in cellsexpressing A2A-Rluc, CB1-YFP, andD2S-GFP2 receptors, FRET valuesbetween D2S-GFP2 and CB1-YFPreceptors were significantly de-creased, whereas BRET2 valuesbetween A2A-Rluc and D2S-GFP2
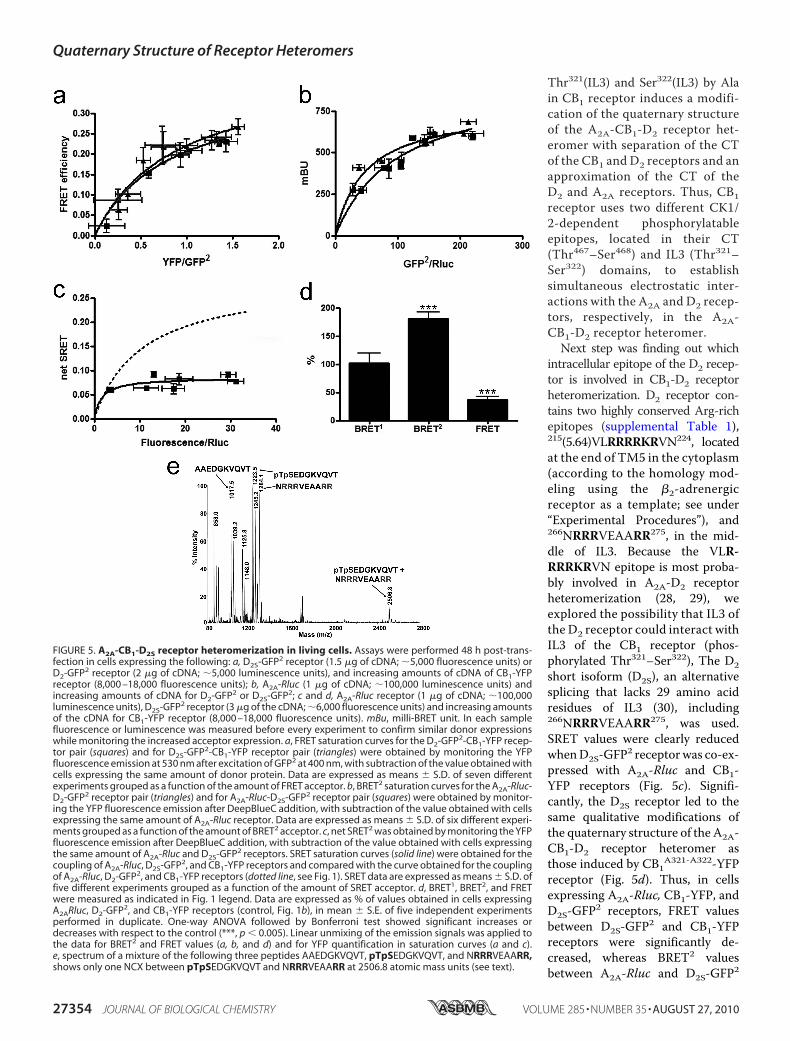
FIGURE 5. A2A-CB1-D2S receptor heteromerization in living cells. Assays were performed 48 h post-trans-fection in cells expressing the following: a, D2S-GFP2 receptor (1.5 �g of cDNA; �5,000 fluorescence units) orD2-GFP2 receptor (2 �g of cDNA; �5,000 luminescence units), and increasing amounts of cDNA of CB1-YFPreceptor (8,000 –18,000 fluorescence units); b, A2A-Rluc (1 �g of cDNA; �100,000 luminescence units) andincreasing amounts of cDNA for D2-GFP2 or D2S-GFP2; c and d, A2A-Rluc receptor (1 �g of cDNA; �100,000luminescence units), D2S-GFP2 receptor (3 �g of the cDNA; �6,000 fluorescence units) and increasing amountsof the cDNA for CB1-YFP receptor (8,000 –18,000 fluorescence units). mBu, milli-BRET unit. In each samplefluorescence or luminescence was measured before every experiment to confirm similar donor expressionswhile monitoring the increased acceptor expression. a, FRET saturation curves for the D2-GFP2-CB1-YFP recep-tor pair (squares) and for D2S-GFP2-CB1-YFP receptor pair (triangles) were obtained by monitoring the YFPfluorescence emission at 530 nm after excitation of GFP2 at 400 nm, with subtraction of the value obtained withcells expressing the same amount of donor protein. Data are expressed as means � S.D. of seven differentexperiments grouped as a function of the amount of FRET acceptor. b, BRET2 saturation curves for the A2A-Rluc-D2-GFP2 receptor pair (triangles) and for A2A-Rluc-D2S-GFP2 receptor pair (squares) were obtained by monitor-ing the YFP fluorescence emission after DeepBlueC addition, with subtraction of the value obtained with cellsexpressing the same amount of A2A-Rluc receptor. Data are expressed as means � S.D. of six different experi-ments grouped as a function of the amount of BRET2 acceptor. c, net SRET2 was obtained by monitoring the YFPfluorescence emission after DeepBlueC addition, with subtraction of the value obtained with cells expressingthe same amount of A2A-Rluc and D2S-GFP2 receptors. SRET saturation curves (solid line) were obtained for thecoupling of A2A-Rluc, D2S-GFP2, and CB1-YFP receptors and compared with the curve obtained for the couplingof A2A-Rluc, D2-GFP2, and CB1-YFP receptors (dotted line, see Fig. 1). SRET data are expressed as means � S.D. offive different experiments grouped as a function of the amount of SRET acceptor. d, BRET1, BRET2, and FRETwere measured as indicated in Fig. 1 legend. Data are expressed as % of values obtained in cells expressingA2ARluc, D2-GFP2, and CB1-YFP receptors (control, Fig. 1b), in mean � S.E. of five independent experimentsperformed in duplicate. One-way ANOVA followed by Bonferroni test showed significant increases ordecreases with respect to the control (***, p � 0.005). Linear unmixing of the emission signals was applied tothe data for BRET2 and FRET values (a, b, and d) and for YFP quantification in saturation curves (a and c).e, spectrum of a mixture of the following three peptides AAEDGKVQVT, pTpSEDGKVQVT, and NRRRVEAARR,shows only one NCX between pTpSEDGKVQVT and NRRRVEAARR at 2506.8 atomic mass units (see text).
Quaternary Structure of Receptor Heteromers
27354 JOURNAL OF BIOLOGICAL CHEMISTRY VOLUME 285 • NUMBER 35 • AUGUST 27, 2010
receptors were increased, andBRET1 values between A2A-Rlucand CB1-YFP receptors were notmodified, when comparedwith cellsco-expressing A2A-Rluc, D2-GFP2,and CB1-YFP receptors (Fig. 5d).These results indicate that in theA2A-CB1-D2 receptor heteromer,CB1 receptors interactwith theArg-rich domain located in IL3 of the D2receptor.Notably, expression of D2S-GFP2
or D2-GFP2 receptors with eitherCB1-YFP or A2A-Rluc or receptorsgives similar FRET (Fig. 5a) orBRET2 (Fig. 5b) values, respectively.This indicates that in the absence ofthe 266NRRRVEAARR275 epitopein D2S-GFP2, the CB1 receptor canpotentially interact with the otherArg-rich domain, 215(5.64)VLR-RRRKRVN224, present in both iso-forms of the D2 receptor. Asexpected, mass spectrometric anal-ysis demonstrated that a syntheticpeptide of the epitope locatedin IL3 of the CB1 receptor(321pTpSEDGKVQVT330), but notits equivalent Ala-containing pep-tide (AAEDGKVQVT), formedstable noncovalent complexeswith the two Arg-rich epitopes ofthe D2 receptor (215(5.64)VLR-RRRKRVN224 and 266NRRRVEA-ARR275) (Figs. 4e and 5e).Electrostatic Interaction between
Phosphorylated Ser374 in the C Ter-minus of the A2A Receptor and anArg-rich Domain in the Cytoplasmat the End of TransmembraneHelix 5 of the D2 Receptor—The215(5.64)VLRRRRKRVN224 epitopeof the D2 receptor was shown tobe involved in A2A-D2 receptor het-eromerization by interacting withthe CT domain of the A2A receptor(19, 20). We found a dramaticreduction of BRET1 values in cellsco-expressing a mutant A2A-Rlucreceptor, in which Ser374(CT) wasreplaced by Ala (A2A
A374-Rlucreceptor), and D2-YFP receptor(Fig. 6a). On the other hand, co-ex-pression of A2A
A374-Rluc and CB1-YFP receptors gave similar BRET1
values than WT receptors (Fig. 6b).These results confirm thatSer374(CT) of the A2A receptor is
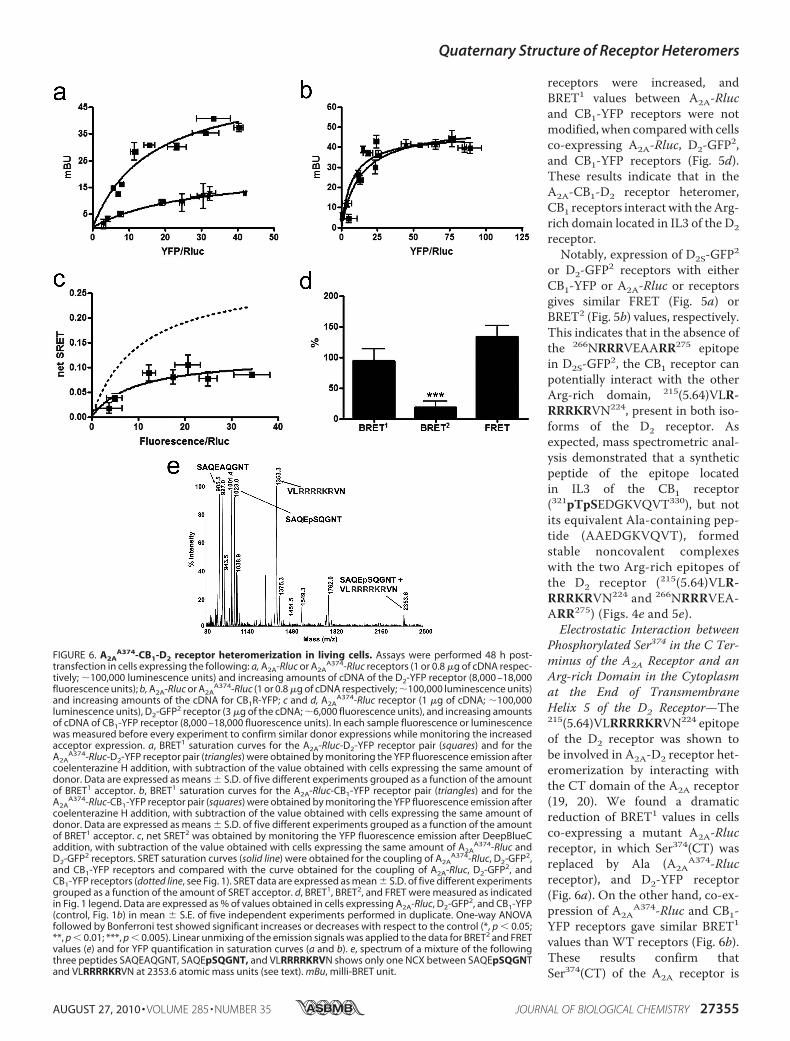
FIGURE 6. A2AA374-CB1-D2 receptor heteromerization in living cells. Assays were performed 48 h post-
transfection in cells expressing the following: a, A2A-Rluc or A2AA374-Rluc receptors (1 or 0.8 �g of cDNA respec-
tively; �100,000 luminescence units) and increasing amounts of cDNA of the D2-YFP receptor (8,000 –18,000fluorescence units); b, A2A-Rluc or A2A
A374-Rluc (1 or 0.8 �g of cDNA respectively; �100,000 luminescence units)and increasing amounts of the cDNA for CB1R-YFP; c and d, A2A
A374-Rluc receptor (1 �g of cDNA; �100,000luminescence units), D2-GFP2 receptor (3 �g of the cDNA; �6,000 fluorescence units), and increasing amountsof cDNA of CB1-YFP receptor (8,000 –18,000 fluorescence units). In each sample fluorescence or luminescencewas measured before every experiment to confirm similar donor expressions while monitoring the increasedacceptor expression. a, BRET1 saturation curves for the A2A-Rluc-D2-YFP receptor pair (squares) and for theA2A
A374-Rluc-D2-YFP receptor pair (triangles) were obtained by monitoring the YFP fluorescence emission aftercoelenterazine H addition, with subtraction of the value obtained with cells expressing the same amount ofdonor. Data are expressed as means � S.D. of five different experiments grouped as a function of the amountof BRET1 acceptor. b, BRET1 saturation curves for the A2A-Rluc-CB1-YFP receptor pair (triangles) and for theA2A
A374-Rluc-CB1-YFP receptor pair (squares) were obtained by monitoring the YFP fluorescence emission aftercoelenterazine H addition, with subtraction of the value obtained with cells expressing the same amount ofdonor. Data are expressed as means � S.D. of five different experiments grouped as a function of the amountof BRET1 acceptor. c, net SRET2 was obtained by monitoring the YFP fluorescence emission after DeepBlueCaddition, with subtraction of the value obtained with cells expressing the same amount of A2A
A374-Rluc andD2-GFP2 receptors. SRET saturation curves (solid line) were obtained for the coupling of A2A
A374-Rluc, D2-GFP2,and CB1-YFP receptors and compared with the curve obtained for the coupling of A2A-Rluc, D2-GFP2, andCB1-YFP receptors (dotted line, see Fig. 1). SRET data are expressed as mean � S.D. of five different experimentsgrouped as a function of the amount of SRET acceptor. d, BRET1, BRET2, and FRET were measured as indicatedin Fig. 1 legend. Data are expressed as % of values obtained in cells expressing A2A-Rluc, D2-GFP2, and CB1-YFP(control, Fig. 1b) in mean � S.E. of five independent experiments performed in duplicate. One-way ANOVAfollowed by Bonferroni test showed significant increases or decreases with respect to the control (*, p � 0.05;**, p � 0.01; ***, p � 0.005). Linear unmixing of the emission signals was applied to the data for BRET2 and FRETvalues (e) and for YFP quantification in saturation curves (a and b). e, spectrum of a mixture of the followingthree peptides SAQEAQGNT, SAQEpSQGNT, and VLRRRRKRVN shows only one NCX between SAQEpSQGNTand VLRRRRKRVN at 2353.6 atomic mass units (see text). mBu, milli-BRET unit.
Quaternary Structure of Receptor Heteromers
AUGUST 27, 2010 • VOLUME 285 • NUMBER 35 JOURNAL OF BIOLOGICAL CHEMISTRY 27355
involved in themolecular interaction with the D2 receptor. Notsurprisingly, Ser374(CT) of the A2A receptor was also found tobe involved in providing the quaternary structure of the A2A-CB1-D2 receptor heteromer. Low SRET values were obtainedwhen A2A
A374-Rluc was co-expressed with D2-GFP2 and CB1-YFP receptors (Fig. 6c), compared with cells co-expressing thenonmutated receptors. From the analysis of BRET1, BRET2,and FRET occurring between partners in cells expressingA2A
A374-Rluc, CB1-YFP, and D2-GFP2 receptors, it wasobserved that BRET2 values were significantly reduced, butFRET and BRET1 values were not significantly modified (Fig.6d). These results indicate that the CT-mutated A2A recep-tor induces a modification of the quaternary structure of theA2A-CB1-D2 receptor heteromer, with separation of the CTof the A2A and D2 receptors. Therefore, the A2A receptoruses a double-Arg motif (Arg205(5.66)–Arg206(5.67)) locatedin the cytoplasm at the end of transmembrane helix 5 and aCK1/2-dependent phosphorylatable epitope located in CT(Ser374) to establish selective electrostatic interactions withthe CB1 and D2 receptors, respectively. Hence, mass spectro-metric analysis of a mixture of peptides corresponding tothe cytoplasmic epitope at the end of TM5 of the D2(215(5.64)VLRRRRKRVN224) and the CT epitopes of the A2Areceptor (370SAQEpSQGNT378) and the mutant A2A recep-tor (370SAQEAQGNT378) resulted in noncovalent com-plexes between the D2 and the A2A receptor epitopes, but notin the case of the mutant A2A receptor (Fig. 6e).Role of Casein Kinase 1/2-mediated Phosphorylation in the
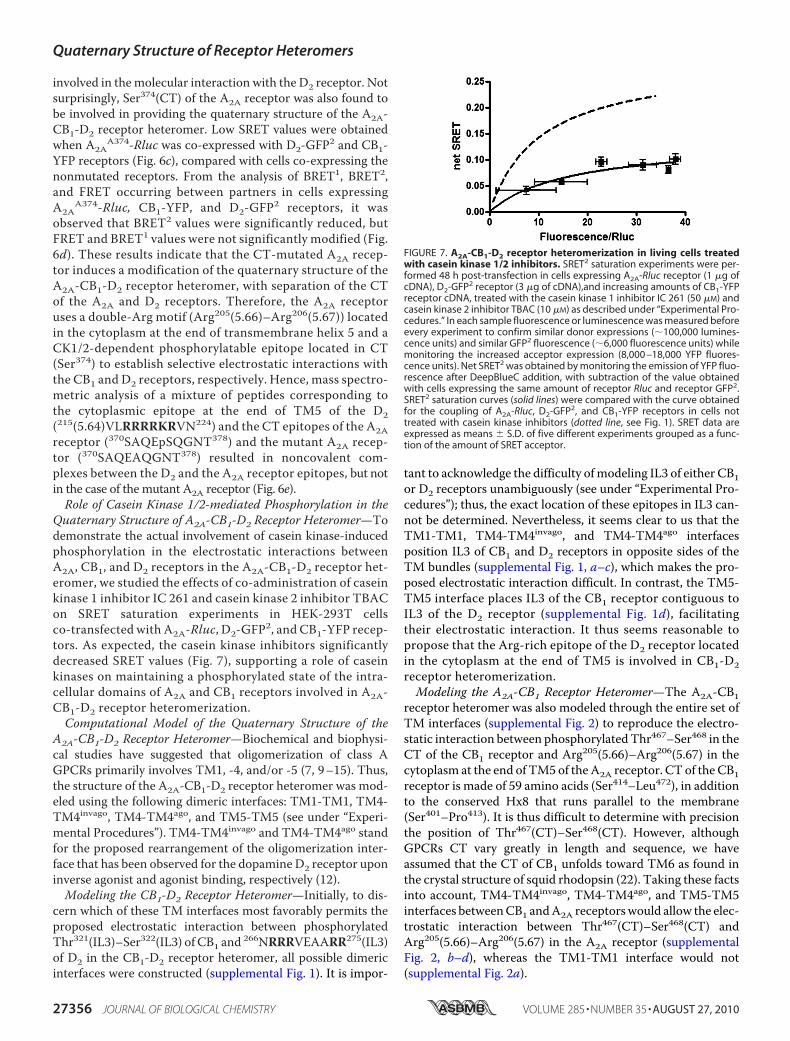
Quaternary Structure of A2A-CB1-D2 Receptor Heteromer—Todemonstrate the actual involvement of casein kinase-inducedphosphorylation in the electrostatic interactions betweenA2A, CB1, and D2 receptors in the A2A-CB1-D2 receptor het-eromer, we studied the effects of co-administration of caseinkinase 1 inhibitor IC 261 and casein kinase 2 inhibitor TBACon SRET saturation experiments in HEK-293T cellsco-transfected with A2A-Rluc, D2-GFP2, and CB1-YFP recep-tors. As expected, the casein kinase inhibitors significantlydecreased SRET values (Fig. 7), supporting a role of caseinkinases on maintaining a phosphorylated state of the intra-cellular domains of A2A and CB1 receptors involved in A2A-CB1-D2 receptor heteromerization.Computational Model of the Quaternary Structure of the
A2A-CB1-D2 Receptor Heteromer—Biochemical and biophysi-cal studies have suggested that oligomerization of class AGPCRs primarily involves TM1, -4, and/or -5 (7, 9–15). Thus,the structure of the A2A-CB1-D2 receptor heteromer was mod-eled using the following dimeric interfaces: TM1-TM1, TM4-TM4invago, TM4-TM4ago, and TM5-TM5 (see under “Experi-mental Procedures”). TM4-TM4invago and TM4-TM4ago standfor the proposed rearrangement of the oligomerization inter-face that has been observed for the dopamine D2 receptor uponinverse agonist and agonist binding, respectively (12).Modeling the CB1-D2 Receptor Heteromer—Initially, to dis-
cern which of these TM interfaces most favorably permits theproposed electrostatic interaction between phosphorylatedThr321(IL3)–Ser322(IL3) of CB1 and 266NRRRVEAARR275(IL3)of D2 in the CB1-D2 receptor heteromer, all possible dimericinterfaces were constructed (supplemental Fig. 1). It is impor-
tant to acknowledge the difficulty ofmodeling IL3 of either CB1or D2 receptors unambiguously (see under “Experimental Pro-cedures”); thus, the exact location of these epitopes in IL3 can-not be determined. Nevertheless, it seems clear to us that theTM1-TM1, TM4-TM4invago, and TM4-TM4ago interfacesposition IL3 of CB1 and D2 receptors in opposite sides of theTM bundles (supplemental Fig. 1, a–c), which makes the pro-posed electrostatic interaction difficult. In contrast, the TM5-TM5 interface places IL3 of the CB1 receptor contiguous toIL3 of the D2 receptor (supplemental Fig. 1d), facilitatingtheir electrostatic interaction. It thus seems reasonable topropose that the Arg-rich epitope of the D2 receptor locatedin the cytoplasm at the end of TM5 is involved in CB1-D2receptor heteromerization.Modeling the A2A-CB1 Receptor Heteromer—The A2A-CB1
receptor heteromer was also modeled through the entire set ofTM interfaces (supplemental Fig. 2) to reproduce the electro-static interaction between phosphorylatedThr467–Ser468 in theCT of the CB1 receptor and Arg205(5.66)–Arg206(5.67) in thecytoplasm at the end of TM5 of theA2A receptor. CT of the CB1receptor is made of 59 amino acids (Ser414–Leu472), in additionto the conserved Hx8 that runs parallel to the membrane(Ser401–Pro413). It is thus difficult to determine with precisionthe position of Thr467(CT)–Ser468(CT). However, althoughGPCRs CT vary greatly in length and sequence, we haveassumed that the CT of CB1 unfolds toward TM6 as found inthe crystal structure of squid rhodopsin (22). Taking these factsinto account, TM4-TM4invago, TM4-TM4ago, and TM5-TM5interfaces betweenCB1 andA2A receptorswould allow the elec-trostatic interaction between Thr467(CT)–Ser468(CT) andArg205(5.66)–Arg206(5.67) in the A2A receptor (supplementalFig. 2, b–d), whereas the TM1-TM1 interface would not(supplemental Fig. 2a).
FIGURE 7. A2A-CB1-D2 receptor heteromerization in living cells treatedwith casein kinase 1/2 inhibitors. SRET2 saturation experiments were per-formed 48 h post-transfection in cells expressing A2A-Rluc receptor (1 �g ofcDNA), D2-GFP2 receptor (3 �g of cDNA),and increasing amounts of CB1-YFPreceptor cDNA, treated with the casein kinase 1 inhibitor IC 261 (50 �M) andcasein kinase 2 inhibitor TBAC (10 �M) as described under “Experimental Pro-cedures.” In each sample fluorescence or luminescence was measured beforeevery experiment to confirm similar donor expressions (�100,000 lumines-cence units) and similar GFP2 fluorescence (�6,000 fluorescence units) whilemonitoring the increased acceptor expression (8,000 –18,000 YFP fluores-cence units). Net SRET2 was obtained by monitoring the emission of YFP fluo-rescence after DeepBlueC addition, with subtraction of the value obtainedwith cells expressing the same amount of receptor Rluc and receptor GFP2.SRET2 saturation curves (solid lines) were compared with the curve obtainedfor the coupling of A2A-Rluc, D2-GFP2, and CB1-YFP receptors in cells nottreated with casein kinase inhibitors (dotted line, see Fig. 1). SRET data areexpressed as means � S.D. of five different experiments grouped as a func-tion of the amount of SRET acceptor.
Quaternary Structure of Receptor Heteromers
27356 JOURNAL OF BIOLOGICAL CHEMISTRY VOLUME 285 • NUMBER 35 • AUGUST 27, 2010
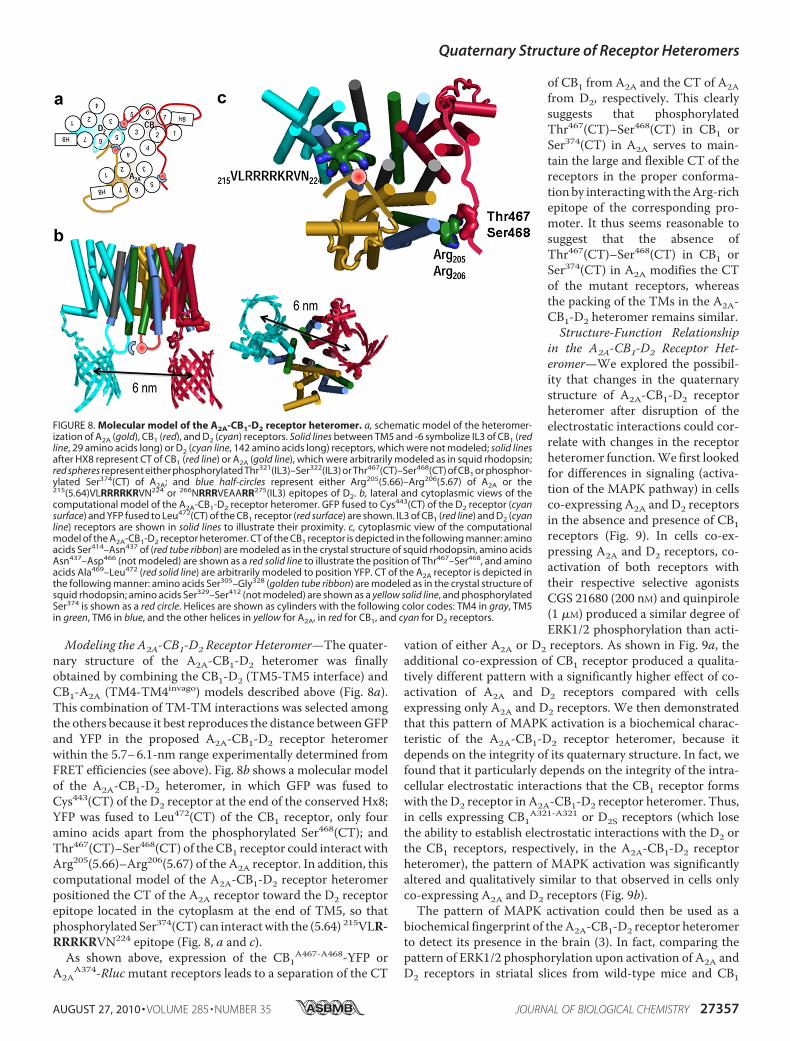
Modeling the A2A-CB1-D2 Receptor Heteromer—The quater-nary structure of the A2A-CB1-D2 heteromer was finallyobtained by combining the CB1-D2 (TM5-TM5 interface) andCB1-A2A (TM4-TM4invago) models described above (Fig. 8a).This combination of TM-TM interactions was selected amongthe others because it best reproduces the distance betweenGFPand YFP in the proposed A2A-CB1-D2 receptor heteromerwithin the 5.7–6.1-nm range experimentally determined fromFRET efficiencies (see above). Fig. 8b shows a molecular modelof the A2A-CB1-D2 heteromer, in which GFP was fused toCys443(CT) of the D2 receptor at the end of the conserved Hx8;YFP was fused to Leu472(CT) of the CB1 receptor, only fouramino acids apart from the phosphorylated Ser468(CT); andThr467(CT)–Ser468(CT) of theCB1 receptor could interact withArg205(5.66)–Arg206(5.67) of the A2A receptor. In addition, thiscomputational model of the A2A-CB1-D2 receptor heteromerpositioned the CT of the A2A receptor toward the D2 receptorepitope located in the cytoplasm at the end of TM5, so thatphosphorylated Ser374(CT) can interactwith the (5.64) 215VLR-RRRKRVN224 epitope (Fig. 8, a and c).
As shown above, expression of the CB1A467-A468-YFP orA2A
A374-Rlucmutant receptors leads to a separation of the CT
of CB1 from A2A and the CT of A2Afrom D2, respectively. This clearlysuggests that phosphorylatedThr467(CT)–Ser468(CT) in CB1 orSer374(CT) in A2A serves to main-tain the large and flexible CT of thereceptors in the proper conforma-tion by interactingwith theArg-richepitope of the corresponding pro-moter. It thus seems reasonable tosuggest that the absence ofThr467(CT)–Ser468(CT) in CB1 orSer374(CT) in A2A modifies the CTof the mutant receptors, whereasthe packing of the TMs in the A2A-CB1-D2 heteromer remains similar.Structure-Function Relationship
in the A2A-CB1-D2 Receptor Het-eromer—We explored the possibil-ity that changes in the quaternarystructure of A2A-CB1-D2 receptorheteromer after disruption of theelectrostatic interactions could cor-relate with changes in the receptorheteromer function.We first lookedfor differences in signaling (activa-tion of the MAPK pathway) in cellsco-expressing A2A and D2 receptorsin the absence and presence of CB1receptors (Fig. 9). In cells co-ex-pressing A2A and D2 receptors, co-activation of both receptors withtheir respective selective agonistsCGS 21680 (200 nM) and quinpirole(1 �M) produced a similar degree ofERK1/2 phosphorylation than acti-
vation of either A2A or D2 receptors. As shown in Fig. 9a, theadditional co-expression of CB1 receptor produced a qualita-tively different pattern with a significantly higher effect of co-activation of A2A and D2 receptors compared with cellsexpressing only A2A and D2 receptors. We then demonstratedthat this pattern of MAPK activation is a biochemical charac-teristic of the A2A-CB1-D2 receptor heteromer, because itdepends on the integrity of its quaternary structure. In fact, wefound that it particularly depends on the integrity of the intra-cellular electrostatic interactions that the CB1 receptor formswith the D2 receptor in A2A-CB1-D2 receptor heteromer. Thus,in cells expressing CB1A321-A321 or D2S receptors (which losethe ability to establish electrostatic interactions with the D2 orthe CB1 receptors, respectively, in the A2A-CB1-D2 receptorheteromer), the pattern of MAPK activation was significantlyaltered and qualitatively similar to that observed in cells onlyco-expressing A2A and D2 receptors (Fig. 9b).The pattern of MAPK activation could then be used as a
biochemical fingerprint of theA2A-CB1-D2 receptor heteromerto detect its presence in the brain (3). In fact, comparing thepattern of ERK1/2 phosphorylation upon activation of A2A andD2 receptors in striatal slices from wild-type mice and CB1
FIGURE 8. Molecular model of the A2A-CB1-D2 receptor heteromer. a, schematic model of the heteromer-ization of A2A (gold), CB1 (red), and D2 (cyan) receptors. Solid lines between TM5 and -6 symbolize IL3 of CB1 (redline, 29 amino acids long) or D2 (cyan line, 142 amino acids long) receptors, which were not modeled; solid linesafter HX8 represent CT of CB1 (red line) or A2A (gold line), which were arbitrarily modeled as in squid rhodopsin;red spheres represent either phosphorylated Thr321(IL3)–Ser322(IL3) or Thr467(CT)–Ser468(CT) of CB1 or phosphor-ylated Ser374(CT) of A2A; and blue half-circles represent either Arg205(5.66)–Arg206(5.67) of A2A or the215(5.64)VLRRRRKRVN224 or 266NRRRVEAARR275(IL3) epitopes of D2. b, lateral and cytoplasmic views of thecomputational model of the A2A-CB1-D2 receptor heteromer. GFP fused to Cys443(CT) of the D2 receptor (cyansurface) and YFP fused to Leu472(CT) of the CB1 receptor (red surface) are shown. IL3 of CB1 (red line) and D2 (cyanline) receptors are shown in solid lines to illustrate their proximity. c, cytoplasmic view of the computationalmodel of the A2A-CB1-D2 receptor heteromer. CT of the CB1 receptor is depicted in the following manner: aminoacids Ser414–Asn437 of (red tube ribbon) are modeled as in the crystal structure of squid rhodopsin, amino acidsAsn437–Asp466 (not modeled) are shown as a red solid line to illustrate the position of Thr467–Ser468, and aminoacids Ala469–Leu472 (red solid line) are arbitrarily modeled to position YFP. CT of the A2A receptor is depicted inthe following manner: amino acids Ser305–Gly328 (golden tube ribbon) are modeled as in the crystal structure ofsquid rhodopsin; amino acids Ser329–Ser412 (not modeled) are shown as a yellow solid line, and phosphorylatedSer374 is shown as a red circle. Helices are shown as cylinders with the following color codes: TM4 in gray, TM5in green, TM6 in blue, and the other helices in yellow for A2A, in red for CB1, and cyan for D2 receptors.
Quaternary Structure of Receptor Heteromers
AUGUST 27, 2010 • VOLUME 285 • NUMBER 35 JOURNAL OF BIOLOGICAL CHEMISTRY 27357
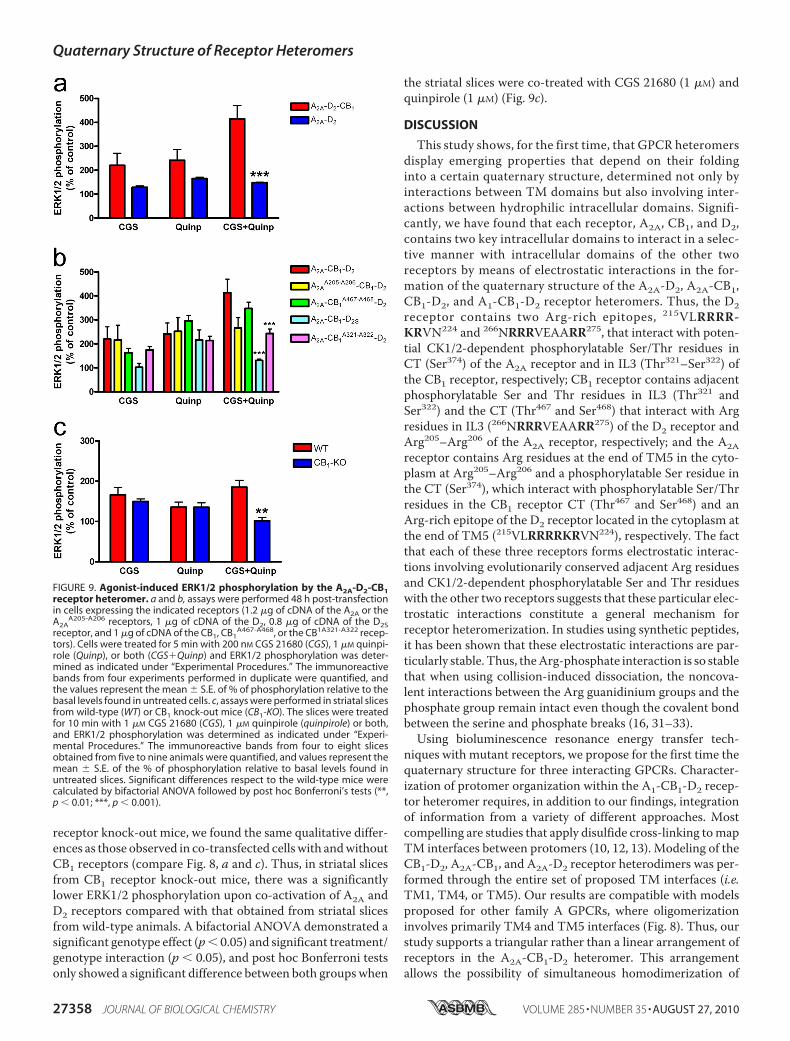
receptor knock-out mice, we found the same qualitative differ-ences as those observed in co-transfected cellswith andwithoutCB1 receptors (compare Fig. 8, a and c). Thus, in striatal slicesfrom CB1 receptor knock-out mice, there was a significantlylower ERK1/2 phosphorylation upon co-activation of A2A andD2 receptors compared with that obtained from striatal slicesfrom wild-type animals. A bifactorial ANOVA demonstrated asignificant genotype effect (p� 0.05) and significant treatment/genotype interaction (p � 0.05), and post hoc Bonferroni testsonly showed a significant difference between both groupswhen
the striatal slices were co-treated with CGS 21680 (1 �M) andquinpirole (1 �M) (Fig. 9c).
DISCUSSION
This study shows, for the first time, that GPCR heteromersdisplay emerging properties that depend on their foldinginto a certain quaternary structure, determined not only byinteractions between TM domains but also involving inter-actions between hydrophilic intracellular domains. Signifi-cantly, we have found that each receptor, A2A, CB1, and D2,contains two key intracellular domains to interact in a selec-tive manner with intracellular domains of the other tworeceptors by means of electrostatic interactions in the for-mation of the quaternary structure of the A2A-D2, A2A-CB1,CB1-D2, and A1-CB1-D2 receptor heteromers. Thus, the D2receptor contains two Arg-rich epitopes, 215VLRRRR-KRVN224 and 266NRRRVEAARR275, that interact with poten-tial CK1/2-dependent phosphorylatable Ser/Thr residues inCT (Ser374) of the A2A receptor and in IL3 (Thr321–Ser322) ofthe CB1 receptor, respectively; CB1 receptor contains adjacentphosphorylatable Ser and Thr residues in IL3 (Thr321 andSer322) and the CT (Thr467 and Ser468) that interact with Argresidues in IL3 (266NRRRVEAARR275) of the D2 receptor andArg205–Arg206 of the A2A receptor, respectively; and the A2Areceptor contains Arg residues at the end of TM5 in the cyto-plasm at Arg205–Arg206 and a phosphorylatable Ser residue inthe CT (Ser374), which interact with phosphorylatable Ser/Thrresidues in the CB1 receptor CT (Thr467 and Ser468) and anArg-rich epitope of the D2 receptor located in the cytoplasm atthe end of TM5 (215VLRRRRKRVN224), respectively. The factthat each of these three receptors forms electrostatic interac-tions involving evolutionarily conserved adjacent Arg residuesand CK1/2-dependent phosphorylatable Ser and Thr residueswith the other two receptors suggests that these particular elec-trostatic interactions constitute a general mechanism forreceptor heteromerization. In studies using synthetic peptides,it has been shown that these electrostatic interactions are par-ticularly stable. Thus, theArg-phosphate interaction is so stablethat when using collision-induced dissociation, the noncova-lent interactions between the Arg guanidinium groups and thephosphate group remain intact even though the covalent bondbetween the serine and phosphate breaks (16, 31–33).Using bioluminescence resonance energy transfer tech-
niques with mutant receptors, we propose for the first time thequaternary structure for three interacting GPCRs. Character-ization of protomer organization within the A1-CB1-D2 recep-tor heteromer requires, in addition to our findings, integrationof information from a variety of different approaches. Mostcompelling are studies that apply disulfide cross-linking tomapTM interfaces between protomers (10, 12, 13). Modeling of theCB1-D2, A2A-CB1, and A2A-D2 receptor heterodimers was per-formed through the entire set of proposed TM interfaces (i.e.TM1, TM4, or TM5). Our results are compatible with modelsproposed for other family A GPCRs, where oligomerizationinvolves primarily TM4 and TM5 interfaces (Fig. 8). Thus, ourstudy supports a triangular rather than a linear arrangement ofreceptors in the A2A-CB1-D2 heteromer. This arrangementallows the possibility of simultaneous homodimerization of
FIGURE 9. Agonist-induced ERK1/2 phosphorylation by the A2A-D2-CB1receptor heteromer. a and b, assays were performed 48 h post-transfectionin cells expressing the indicated receptors (1.2 �g of cDNA of the A2A or theA2A
A205-A206 receptors, 1 �g of cDNA of the D2, 0.8 �g of cDNA of the D2Sreceptor, and 1 �g of cDNA of the CB1, CB1
A467-A468, or the CB1A321-A322 recep-tors). Cells were treated for 5 min with 200 nM CGS 21680 (CGS), 1 �M quinpi-role (Quinp), or both (CGSQuinp) and ERK1/2 phosphorylation was deter-mined as indicated under “Experimental Procedures.” The immunoreactivebands from four experiments performed in duplicate were quantified, andthe values represent the mean � S.E. of % of phosphorylation relative to thebasal levels found in untreated cells. c, assays were performed in striatal slicesfrom wild-type (WT) or CB1 knock-out mice (CB1-KO). The slices were treatedfor 10 min with 1 �M CGS 21680 (CGS), 1 �M quinpirole (quinpirole) or both,and ERK1/2 phosphorylation was determined as indicated under “Experi-mental Procedures.” The immunoreactive bands from four to eight slicesobtained from five to nine animals were quantified, and values represent themean � S.E. of the % of phosphorylation relative to basal levels found inuntreated slices. Significant differences respect to the wild-type mice werecalculated by bifactorial ANOVA followed by post hoc Bonferroni’s tests (**,p � 0.01; ***, p � 0.001).
Quaternary Structure of Receptor Heteromers
27358 JOURNAL OF BIOLOGICAL CHEMISTRY VOLUME 285 • NUMBER 35 • AUGUST 27, 2010
each receptor unit using the TM1 interface, which is a wellestablished phenomenon in the GPCR field. Thus, this studyopens up a new conceptual challenge in the field of receptorheteromerization, which is the idea that GPCRs can form notonly heteromultimers of three different receptor units but alsohigher order heteromultimers or “receptor nets.”The interactions of the intracellular domains of the CB1
receptor with A2A and D2 receptors were found to be funda-mental for the correct formation of the quaternary structureneeded for the function of the A2A-CB1-D2 receptor hetero-mers. Thus, mutant receptors lacking the interacting aminoacids significantly disrupted RET and a specific qualitative pat-tern of ERK1/2 phosphorylation induced by co-activation ofA2A and D2 receptors. The fact that such a disruption of thequaternary structure of theA2A-CB1-D2 receptor heteromer (asdemonstrated by SRET experiments) was associated with a sig-nificant qualitative change in signaling indicates that electro-static interactions between intracellular domains are also keydeterminants for the specific biochemical properties of theA2A-CB1-D2 receptor heteromer. These biochemical charac-teristics and the specific qualitative pattern ofMAPK activationcould be used as a biochemical fingerprint of the A2A-CB1-D2receptor heteromer presence in the brain. CB1 receptor KOmice experiments provided strong support for the existence ofA2A-CB1-D2 receptor heteromer in the striatum. It has beenhypothesized that A2A-CB1-D2 receptor heteromers aremostlylocated in one subtype of striatal neuron, the GABAergicenkephalinergic neuron, where the three receptors are highlyco-expressed and exert a significant control of basal gangliafunction (34). Most probably, the results obtained with MAPKsignaling are just a minor but the first described example ofmany of the potential properties of the A2A-CB1-D2 receptorheteromers.
Acknowledgments—We thank Prof. Olga Valverde and Prof. Cather-ine Ledent (Department of Experimental and Health Sciences, Bio-medical Research Park, Barcelona University Pompeu Fabra, Barce-lona, Spain) for generously supplying wild-type and CB1 receptor KOmice. We thank the Office of National Drug Control Policy and JodieFranklin (The Johns Hopkins Synthesis and Sequencing Facility) forthe peptide synthesis. We acknowledge the technical help obtainedfrom Jasmina Jimenez (Molecular Neurobiology Laboratory, Barce-lona University).
REFERENCES1. Ferre, S., Ciruela, F., Woods, A. S., Lluis, C., and Franco, R. (2007) Trends
Neurosci. 30, 440–4462. Pin, J. P., Neubig, R., Bouvier,M., Devi, L., Filizola,M., Javitch, J. A., Lohse,
M. J.,Milligan,G., Palczewski, K., Parmentier,M., and Spedding,M. (2007)Pharmacol. Rev. 59, 5–13
3. Ferre, S., Baler, R., Bouvier, M., Caron, M. G., Devi, L. A., Durroux, T.,Fuxe, K., George, S. R., Javitch, J. A., Lohse, M. J., Mackie, K., Milligan, G.,Pfleger, K. D., Pin, J. P., Volkow, N. D., Waldhoer, M., Woods, A. S., andFranco, R. (2009) Nat. Chem. Biol. 5, 131–134
4. Dalrymple, M. B., Pfleger, K. D., and Eidne, K. A. (2008) Pharmacol. Ther.118, 359–371
5. Carriba, P., Navarro, G., Ciruela, F., Ferre, S., Casado, V., Agnati, L.,Cortes, A., Mallol, J., Fuxe, K., Canela, E. I., Lluís, C., and Franco, R. (2008)
Nat. Methods 5, 727–7336. Gandia, J., Galino, J., Amaral, O. B., Soriano, A., Lluís, C., Franco, R., and
Ciruela, F. (2008) FEBS Lett. 582, 2979–29847. Davies, A., Gowen, B. E., Krebs, A. M., Schertler, G. F., and Saibil, H. R.
(2001) J. Mol. Biol. 314, 455–4638. Maurel, D., Comps-Agrar, L., Brock, C., Rives, M. L., Bourrier, E., Ayoub,
M. A., Bazin, H., Tinel, N., Durroux, T., Prezeau, L., Trinquet, E., and Pin,J. P. (2008) Nat. Methods 5, 561–567
9. Fotiadis, D., Liang, Y., Filipek, S., Saperstein, D. A., Engel, A., and Palcze-wski, K. (2003) Nature 421, 127–128
10. Klco, J. M., Lassere, T. B., and Baranski, T. J. (2003) J. Biol. Chem. 278,35345–35353
11. Liang, Y., Fotiadis, D., Filipek, S., Saperstein, D. A., Palczewski, K., andEngel, A. (2003) J. Biol. Chem. 278, 21655–21662
12. Guo, W., Shi, L., Filizola, M., Weinstein, H., and Javitch, J. A. (2005) Proc.Natl. Acad. Sci. U.S.A. 102, 17495–17500
13. Guo, W., Urizar, E., Kralikova, M., Mobarec, J. C., Shi, L., Filizola, M., andJavitch, J. A. (2008) EMBO J. 27, 2293–2304
14. Gonzalez-Maeso, J., Ang, R. L., Yuen, T., Chan, P., Weisstaub, N. V.,Lopez-Gimenez, J. F., Zhou, M., Okawa, Y., Callado, L. F., Milligan, G.,Gingrich, J. A., Filizola, M., Meana, J. J., and Sealfon, S. C. (2008) Nature452, 93–97
15. Han, Y., Moreira, I. S., Urizar, E., Weinstein, H., and Javitch, J. A. (2009)Nat. Chem. Biol. 5, 688–695
16. Woods, A. S., and Ferre, S. (2005) J. Proteome Res. 4, 1397–140217. Zimmermann, T., Rietdorf, J., Girod, A., Georget, V., and Pepperkok, R.
(2002) FEBS Lett. 531, 245–24918. Ledent, C., Valverde, O., Cossu, G., Petitet, F., Aubert, J. F., Beslot, F.,
Bohme, G. A., Imperato, A., Pedrazzini, T., Roques, B. P., Vassart, G.,Fratta, W., and Parmentier, M. (1999) Science 283, 401–404
19. Aso, E., Ozaita, A., Valdizan, E. M., Ledent, C., Pazos, A., Maldonado, R.,and Valverde, O. (2008) J. Neurochem. 105, 565–572
20. Jaakola, V. P., Griffith, M. T., Hanson, M. A., Cherezov, V., Chien, E. Y.,Lane, J. R., Ijzerman, A. P., and Stevens, R. C. (2008) Science 322,1211–1217
21. Cherezov, V., Rosenbaum, D.M., Hanson,M. A., Rasmussen, S. G., Thian,F. S., Kobilka, T. S., Choi, H. J., Kuhn, P., Weis, W. I., Kobilka, B. K., andStevens, R. C. (2007) Science 318, 1258–1265
22. Rasmussen, S. G., Choi, H. J., Rosenbaum, D. M., Kobilka, T. S., Thian,F. S., Edwards, P. C., Burghammer, M., Ratnala, V. R., Sanishvili, R., Fisch-etti, R. F., Schertler, G. F., Weis, W. I., and Kobilka, B. K. (2007) Nature450, 383–387
23. Ballesteros, J. A., and Weinstein, H. (1995) in Methods in Neurosciences,Vol. 25, pp. 366–428, Elsevier, San Diego, CA
24. Park, J. H., Scheerer, P., Hofmann, K. P., Choe, H. W., and Ernst, O. P.(2008) Nature 454, 183–187
25. Murakami, M., and Kouyama, T. (2008) Nature 453, 363–36726. Li, J., Edwards, P. C., Burghammer,M., Villa, C., and Schertler, G. F. (2004)
J. Mol. Biol. 343, 1409–143827. Blom, N., Gammeltoft, S., and Brunak, S. (1999) J. Mol. Biol. 294,
1351–136228. Ciruela, F., Burgueno, J., Casado, V., Canals, M., Marcellino, D., Goldberg,
S. R., Bader, M., Fuxe, K., Agnati, L. F., Lluis, C., Franco, R., Ferre, S., andWoods, A. S. (2004) Anal. Chem. 76, 5354–5363
29. Azdad, K., Gall, D., Woods, A. S., Ledent, C., Ferre, S., and Schiffmann,S. N. (2009) Neuropsychopharmacology 34, 972–986
30. Missale, C., Nash, S. R., Robinson, S. W., Jaber, M., and Caron, M. G.(1998) Physiol. Rev. 78, 189–225
31. Jackson, S. N., Wang, H. Y., and Woods, A. S. (2005) J. Proteome Res. 4,2360–2363
32. Jackson, S. N., Moyer, S. C., and Woods, A. S. (2008) J. Am. Soc. MassSpectrom. 19, 1535–1541
33. Jackson, S.N.,Wang,H. Y., Yergey, A., andWoods,A. S. (2006) J. ProteomeRes. 5, 122–126
34. Ferre, S., Goldberg, S. R., Lluis, C., and Franco, R. (2009) Neuropharma-cology 56, Suppl. 1, 226–234
Quaternary Structure of Receptor Heteromers
AUGUST 27, 2010 • VOLUME 285 • NUMBER 35 JOURNAL OF BIOLOGICAL CHEMISTRY 27359
Related Documents


![Regulation of the intracellular Ca2+. Regulation of intracellular [H]:](https://static.cupdf.com/doc/110x72/5a4d1b717f8b9ab0599b56a5/regulation-of-the-intracellular-ca2-regulation-of-intracellular-h.jpg)