Interaction of Clinically Important Human DNA Topoisomerase I Poison, Topotecan, with Double- Stranded DNA SERGEI STRELTSOV, 1 VLADIMIR OLEINIKOV, 2,3 MIKHAIL ERMISHOV, 2,3 KONSTANTIN MOCHALOV, 2 ALYONA SUKHANOVA, 3 YURI NECHIPURENKO, 1 SERGEI GROKHOVSKY, 1,4 ALEXEI ZHUZE, 1 MICHEL PLUOT, 3 IGOR NABIEV 3 1 Engelhardt Institute of Molecular Biology, Russian Academy of Sciences, Ul. Vavilova 32, 119991 Moscow, Russia 2 Shemyakin & Ovchinnikov Institute of Bioorganic Chemistry, Russian Academy of Sciences, 16/10 Ul. Miklukho- Maklaya, 117997 Moscow, Russia 3 EA3306, Institut Fe ´de ´ratif de Recherche 53 Biomole ´cules, UFR de Pharmacie, Universite ´ de Reims Champagne–Ardenne, 51 Rue Cognacq Jay, 51096 Reims Cedex, France 4 University of Oslo, Centre for Medical Studies in Moscow, 119991 Moscow, Russia Received 13 December 2002; revised 6 March 2003; accepted 31 March 2003 ABSTRACT: Topotecan (TPT), a water-soluble derivative of camptothecin, is a potent antitumor poison of human DNA topoisomerase I (top1) that stabilizes the cleavage complex between the enzyme and DNA. The role of the recently discovered TPT affinity to DNA remains to be defined. The aim of this work is to clarify the molecular mechanisms of the TPT–DNA interaction and to propose the models of TPT–DNA complexes in solution in the absence of top1. It is shown that TPT molecules form dimers with a dimerization constant of (4.0 0.7) 10 3 M 1 and the presence of DNA provokes more than a 400-fold increase of the effective dimerization constant. Flow linear dichroism spectroscopy accompanied by circular dichroism, fluorescence, and surface-enhanced Raman scattering experiments provide evidence that TPT dimers are able to bind DNA by bridging different DNA molecules or distant DNA structural domains. This effect may provoke modification of the intrinsic geometry of the cruciform DNA structures, leading to the appearance of new crossover points that serve as the sites of the top1 loading position. The data presume the hypothesis of TPT-mediated modulation of top1–DNA recognition before ternary complex formation. © 2003 Wiley Periodicals, Inc. Biopolymers (Biospectroscopy) 72: 442– 454, 2003 Keywords: DNA binding; topotecan; camptothecin; Raman scattering spectroscopy; sur- face-enhanced Raman scattering; human DNA topoisomerase I; flow linear dichroism INTRODUCTION Camptothecins (CPTs) are specific inhibitors of human DNA topoisomerase I (top1), which is in- volved in cellular DNA replication and transcrip- tion. 1 The inhibitory activity of CPTs is realized through the formation of a reversible top1– drug– DNA ternary complex. 1 Therefore, top1 is an at- tractive target for anticancer drug development and the water-soluble CPT derivative, topotecan (TPT), has revealed significant antitumor activity in clinics. 2 CPTs have been traditionally described as unique antitumor compounds exhibiting no affin- ity toward DNA alone 3–6 or top1 alone, 6 but re- cent data have shown direct DNA binding by the lactone form of TPT in the absence of top1. 7–9 Further studies have revealed TPT’s capability of Correspondence to: I. Nabiev ([email protected]). Contract grant sponsors: Re ´gion Champagne–Ardenne, FRM, and ARERS, France (to I.N., A.S., V.O., M.P.); Associa- tion for International Cancer Research, UK (to I.N., V.O.); INTAS, EC; NATO CLG program (to I.N., M.P., V.O., A.S.); FEBS (to A.S.). Contract grant sponsor: Russian Foundation for Basic Re- search, Russia (to V.O., S.S, A.Z., S.G.); contract grant numbers: RFBR 00-04-48105, 01-04-48657, 01-03-32669, 02-04-48339. Biopolymers (Biospectroscopy), Vol. 72, 442– 454 (2003) © 2003 Wiley Periodicals, Inc. 442

Welcome message from author
This document is posted to help you gain knowledge. Please leave a comment to let me know what you think about it! Share it to your friends and learn new things together.
Transcript

Interaction of Clinically Important Human DNATopoisomerase I Poison, Topotecan, with Double-Stranded DNA
SERGEI STRELTSOV,1 VLADIMIR OLEINIKOV,2,3 MIKHAIL ERMISHOV,2,3 KONSTANTIN MOCHALOV,2
ALYONA SUKHANOVA,3 YURI NECHIPURENKO,1 SERGEI GROKHOVSKY,1,4 ALEXEI ZHUZE,1 MICHEL PLUOT,3
IGOR NABIEV3
1 Engelhardt Institute of Molecular Biology, Russian Academy of Sciences, Ul. Vavilova 32, 119991 Moscow, Russia
2 Shemyakin & Ovchinnikov Institute of Bioorganic Chemistry, Russian Academy of Sciences, 16/10 Ul. Miklukho-Maklaya, 117997 Moscow, Russia3 EA3306, Institut Federatif de Recherche 53 Biomolecules, UFR de Pharmacie, Universite de ReimsChampagne–Ardenne, 51 Rue Cognacq Jay, 51096 Reims Cedex, France4 University of Oslo, Centre for Medical Studies in Moscow, 119991 Moscow, Russia
Received 13 December 2002; revised 6 March 2003; accepted 31 March 2003
ABSTRACT: Topotecan (TPT), a water-soluble derivative of camptothecin, is a potentantitumor poison of human DNA topoisomerase I (top1) that stabilizes the cleavagecomplex between the enzyme and DNA. The role of the recently discovered TPT affinityto DNA remains to be defined. The aim of this work is to clarify the molecularmechanisms of the TPT–DNA interaction and to propose the models of TPT–DNAcomplexes in solution in the absence of top1. It is shown that TPT molecules formdimers with a dimerization constant of (4.0 � 0.7) � 103 M�1 and the presence of DNAprovokes more than a 400-fold increase of the effective dimerization constant. Flowlinear dichroism spectroscopy accompanied by circular dichroism, fluorescence, andsurface-enhanced Raman scattering experiments provide evidence that TPT dimers areable to bind DNA by bridging different DNA molecules or distant DNA structuraldomains. This effect may provoke modification of the intrinsic geometry of the cruciformDNA structures, leading to the appearance of new crossover points that serve as thesites of the top1 loading position. The data presume the hypothesis of TPT-mediatedmodulation of top1–DNA recognition before ternary complex formation. © 2003 WileyPeriodicals, Inc. Biopolymers (Biospectroscopy) 72: 442–454, 2003
Keywords: DNA binding; topotecan; camptothecin; Raman scattering spectroscopy; sur-face-enhanced Raman scattering; human DNA topoisomerase I; flow linear dichroism
INTRODUCTION
Camptothecins (CPTs) are specific inhibitors ofhuman DNA topoisomerase I (top1), which is in-
volved in cellular DNA replication and transcrip-tion.1 The inhibitory activity of CPTs is realizedthrough the formation of a reversible top1–drug–DNA ternary complex.1 Therefore, top1 is an at-tractive target for anticancer drug developmentand the water-soluble CPT derivative, topotecan(TPT), has revealed significant antitumor activityin clinics.2
CPTs have been traditionally described asunique antitumor compounds exhibiting no affin-ity toward DNA alone3–6 or top1 alone,6 but re-cent data have shown direct DNA binding by thelactone form of TPT in the absence of top1.7–9
Further studies have revealed TPT’s capability of
Correspondence to: I. Nabiev ([email protected]).Contract grant sponsors: Region Champagne–Ardenne,
FRM, and ARERS, France (to I.N., A.S., V.O., M.P.); Associa-tion for International Cancer Research, UK (to I.N., V.O.);INTAS, EC; NATO CLG program (to I.N., M.P., V.O., A.S.);FEBS (to A.S.).
Contract grant sponsor: Russian Foundation for Basic Re-search, Russia (to V.O., S.S, A.Z., S.G.); contract grant numbers:RFBR 00-04-48105, 01-04-48657, 01-03-32669, 02-04-48339.Biopolymers (Biospectroscopy), Vol. 72, 442–454 (2003)© 2003 Wiley Periodicals, Inc.
442

interacting with DNA within the minor groove ina nearly 55° orientation to the DNA long axis andwith a preference for GC-rich sequences.9
Our previous experiments led to the finding ofseveral effects that influence the biological activ-ity of some CPT drugs (CPT, SN-38, 10,11-meth-ylenedioxy-CPT), namely, the formation of J-typeaggregates in an aqueous buffer solution.10 Theseaggregates are stereospecific [being undetectablefor the 20(R)-stereoisomer of CPT] and are formedby the stacking interaction between quinolinerings of CPT chromophores (Fig. 1) with the in-verse position of the nitrogen atoms. The aggre-gates penetrate within the cells with a muchhigher efficiency than their monomeric forms, andthe cellular uptake of aggregated and monomericspecies correlates with cytotoxic effects producedby the drugs.10
In this study we show that even water-solubleCPT derivative TPT is able to form the dimers inaqueous solution; we characterize these dimers bymeans of fluorescence, circular dichroism (CD),UV–visible (UV–vis), and surface-enhanced Ra-man scattering (SERS) spectroscopy; and we an-alyze the role of these dimers in TPT–DNA inter-actions. We demonstrate that the formation ofTPT dimers is further increased by the presenceof double-stranded DNA and that these dimersare able to bind together two distinct DNA mole-cules or two very distinct structural domains ofthe same DNA molecule in solution. The ability ofthe TPT dimers to bind the distinct DNA(s) struc-tural domains may induce formation of the new orstabilization of the existing DNA crossover pointsthat are known to be the loading positions fortop1.11–13 Our studies suggest a hypothesis of thecreation of TPT-induced DNA structural sites oftop1–DNA recognition.
MATERIALS AND METHODS
The TPT (hycamtin�, Fig. 1) used in the study (agift of GlaxoSmithKline Beecham) was purifiedby HPLC. The molar extinction coefficient (�380)for TPT determined by UV–vis spectroscopy was20,000 M�1 cm�1. Calf thymus DNA, DMSO, andsodium cacodylate were purchased from Sigma.
The DNA was dissolved in 1 mM cacodylatebuffer (pH 6.8) over 3 days and further dialyzed 3times against the same buffer. Each dialysis wasperformed for 12 h. The concentrations of calfthymus DNA were determined by UV–vis spec-
troscopy using the molar extinction coefficient(�260) of 6600 calculated for one base of DNA.14
The TPT–DNA complexes were prepared fromthe 2 � 10�4 M TPT stock solution in 1 mMcacodylate buffer (pH 6.8) and the 1 mM bp DNAstock solution in the same buffer. The complexeswere incubated for 72 h before investigation.
The UV–vis spectra were recorded with a Cary-118 UV–vis spectrophotometer. The fluorescenceintensity was measured with a Hitachi MPF-2Aspectrofluorimeter (Japan) in cuvettes with anoptical pathlength of 0.1 cm so that the opticaldensity of probed solutions on the excitationwavelength did not exceed 0.1 optical units.
The Raman and SERS spectra were recordedwith a Jobin Yvon Ramanor HG-2S spectrometer;a 647.1-nm line of a krypton laser (model 164-03,Spectra Physics) was used for excitation. The ir-
Figure 1. The chemical structures of CPT and TPT.
TOPOTECAN–DNA INTERACTION 443

radiation power on the sample did not exceed 30mW in SERS and 200 mW in Raman scatteringexperiments. All spectra were registered with at 2cm�1 scanning step, and the integration time ofeach point was 0.7 s for SERS and 3 s for Ramanspectra. Silver hydrosol was prepared by reduc-tion of silver nitrate with sodium citrate, and itused as a SERS-active substrate as described inthe literature.15 The data accumulation and av-eraging of 10 independent scans were used forRaman spectra recording. The stability of thesamples during laser irradiation was controlledby a comparison of the spectra as a function oftime. The spectrum of free (unbound) TPT wasobtained by subtracting the spectrum of thebuffer from the TPT/buffer spectrum. The stan-dard buffer spectrum was subtracted from theexperimental spectra using the water band at1645 cm�1 as an internal control. The spectrawere treated with LabCalc (Galactic Industries)software as described in the literature.16
The CD and flow linear dichroism (FLD) spec-tra were recorded with a Jasco 500C dichrographequipped with the linear dichroism option totransform circular polarized light into linearlight. A self-made flow cell with an optical lengthof 1 mm and a volume of 200 �L was used fororientation of DNA in the flow.17 Further detailson the FLD measurements and calculation of theligand orientation at DNA binding can be foundelsewhere.9,18–20 The CD spectra of TPT in lacton(pH 4.5) and carboxylate forms (pH 9.8) wererecorded in 1 mM sodium cacodylate aqueous so-lution in order to standardize the ionic conditions.
RESULTS AND DISCUSSION
TPT Dimerization in Solution Probed by UV–Visand Fluorescence Spectroscopy
We employed UV–vis, fluorescence, and CD spec-troscopy (Figs. 2 and 3) to analyze the mutualinteraction of TPT molecules in aqueous solution.Figure 2(A) shows the UV–vis spectra of TPT, andFigure 2(B) shows the fluorescence spectra of thesame samples at different concentrations. The or-dinate values in Figure 2(A,B) are � � A/(Cl) andi � I/C, respectively, where A is the optical den-sity in the UV–vis spectrum, I is the intensity ofthe fluorescence, l is the optical length of thecuvette, and C is the molar concentration of TPTin solution.
The UV–vis spectra show that an increase of
the TPT concentration induces the increase of theabsorbance ratio of the bands at 386 and 415 nm(A386/A415). The intensity of the band at 415 nm isknown to reflect the extent of deprotonation of theA-ring hydroxy group of the CPT derivatives: it isabsent at neutral pH and increases upon depro-tonation of the A-ring hydroxy group at basicpH.10 Therefore, the observed concentration-de-pendent decrease of the intensity of the 415-nmband measured at a constant pH 6.8 [Fig. 2(A,B)]is the result of the increase of the concentration ofTPT molecules with the neutral C10 hydroxylgroup. The only reason for the appearance or sta-bilization of this proton in TPT solution at con-stant pH may be the formation of an intermolec-ular hydrogen bond between two TPT molecules.Obviously, an increase of the TPT concentrationin solution induces an increase of the dimer con-centration.21
The fluorescence emission spectra [Fig. 2(B)]show concentration-dependent quenching of TPTfluorescence induced by the increase of its concen-tration. The appearance of the A386/A415 ratio de-pendence at TPT concentrations ranging from10�5 to 10�4 M [Fig. 2(C)] provides evidence of theformation of TPT dimers.
TPT Dimerization Constant in Solution
The nonlinear concentration dependence of theintensity of the 530-nm fluorescence band wasused for the calculation of the TPT dimerizationconstant in aqueous solution [Fig. 2(D)]. It shouldbe noted that in the absence of TPT dimerization(TPT aqueous solution in the presence of 10%DMSO, see below) this dependence is linear [Fig.2(D)]. The following system of equations is validfor the monomer–dimer equilibrium in solution:
Ij � i1 � C1j � i2 � C2j (1)
K � C2j /C1j2 (2)
Cj � C1j � 2 � C2j (3)
where C1j, C2j, and Cj are the monomer concen-tration, dimer concentration, and total TPT con-centration, respectively; K is the dimerizationconstant; Ij, i1, and i2 are the total and specificfluorescence intensities of the monomers anddimers, respectively. Here ij � Ij/Cj. All experi-ments were done in cuvettes with the same opti-cal length. Equations (1)–(3) are valid for eachexperimental point {j} of dependences Ij (Cj).
444 STRELTSOV ET AL.

Hence, this system contains 3 � j equationswith (2 � j � 3) variables (K, i1, i2, C1j, and C2j).When j � 3, the number of equations becomesbigger than the number of unknown values.This system is solved by minimization of theroot mean square deviations of Ij from theirexperimental values. The deviations of the cal-culated values (Ij,calc) from the measured values(Ij), are presented in Figure 2(E). The dimeriza-tion constant was found to be (4.0 � 0.7) � 103
M�1.
CD Spectroscopy of TPT in Solution
TPT at neutral pH is represented by a mixture offour molecular forms,21–23 including closed or hy-drolyzed lactone ring TPT forms (pKa of lactonefrom hydrolysis � 7.3) with the nonionized orionized C10 hydroxyl group that TPT forms (pKaof deprotonation � 6.5). To ascertain the effects oflactone ring hydrolysis and C10 hydroxyl groupdeprotonation on TPT aggregation, the CD spec-tra at pH 4.5 and 9.8 were analyzed (Fig. 3). At
Figure 2. The concentration dependence of the UV–vis and fluorescence spectra ofTPT. (A) UV–vis spectra of TPT at concentrations of (- � -) 2.3 � 10�3, ( � � � ) 2.3 � 10�4,(—) 2.3 � 10�5, and (- - -) 2.3 � 10�6 M. (B) Spectra of TPT fluorescence excitation at�400 nm and emission at �550 nm at concentrations of (—) 2.2 � 10�6 and (- - -) 5.5� 10�5 M. (C) The dependence of the absorbance ratio of UV–vis bands at 386 and 415nm (A386/A415) on the TPT concentration. (D) The dependence of the fluorescenceintensity on the TPT concentration (Œ) with 10% DMSO and (■) without DMSO (by themean root square minimization method). The wavelength of the excitation is 390 nm,and the fluorescence intensity is measured at 530 nm. (E) The deviation values of thetotal fluorescence intensity of the monomers and dimers (Ij) that are defined as thedifference between the experimental and calculated values of Ij. All UV–vis and fluo-rescence measurements are carried out in 1 mM cacodylate buffer (pH 6.8).
TOPOTECAN–DNA INTERACTION 445

pH 4.5 TPT comprises a closed lactone form and anonionized C10 hydroxyl group, whereas at pH9.8 the lactone ring is hydrolyzed and the C10hydroxyl group is deprotonated.
The CD spectrum of TPT includes the strongsignals in the 210–260 nm region that are deter-mined by the asymmetrical carbon in the 20 po-sition (Fig. 1). The long wavelength part of theTPT CD spectrum (300–450 nm) is determinedby the quinoline rings (Fig. 1, rings A and B) oftheir chromophores, which are known to be quiteflat and thus do not produce significant CD sig-nals.
An increase of the TPT concentration from 2� 10�5 to 1.7 � 10�4 M at pH 4.5 provokes asignificant relative increase of the negative CDband at 390 nm [Fig. 3(B)]. This fact reflects anincrease of the environment asymmetry of thequinoline part of the TPT molecules, and it there-fore sustains the quinoline participation in aggre-
gate formation. The addition of 10% (v/v) DMSOreverses the sign of the TPT CD spectrum [Fig.3(B)]. We have shown previously that the CDspectra of both TPT in DMSO and the monomericform of TPT in aqueous solutions have the samesigns24 whereas a reversion of the sign of the395-nm band in the CD spectra of TPT from pos-itive to negative is indicative of mutual interac-tion of the drug molecules.10,24 Therefore, the ad-dition of DMSO induces dissociation of TPTaggregates [Fig. 3(B)] and the positive 395-nmband in the CD spectrum is characteristic of themonomeric form of TPT in solution.
The CD spectrum of TPT at pH 9.8 is found tobe very similar to that for monomeric TPT inDMSO solution. An increase of the TPT concen-tration does not induce CD spectral variations(not shown). Thus, at basic pH values the TPTmolecules are in monomeric form as a result oflactone ring hydrolysis and/or C10OOH groupdeprotonation. Taking into account the knowndissociation of CPT (not possessing a hydroxylgroup in the C10 position, Fig. 1) aggregates uponhydrolysis of lactone,10,24 one may conclude thatthe nonhydrolyzed lactone form of TPT is thenecessary condition for TPT dimerization. Other-wise, the proton of the C10OOH group mostlikely plays a role in further stabilization of TPTdimers through the hydrogen bond(s).21
SERS Spectral Markers of TPT Dimerization inSolution
To find the spectral markers of TPT dimerizationin solution, SERS spectra were recorded at 5� 10�6 to 5 � 10�4 M TPT concentrations (Fig. 4,spectrum B). Major Raman bands were found tobe downshifted in the SERS spectra (Fig. 4). Theother differences between the Raman and SERSspectra include an increase of the SERS band at1609 cm�1 and the disappearance of the Ramanband at 1650 cm�1. The Raman band at 1617cm�1 is assigned to A–B ring vibration of the TPTmolecule,25 being a counterpart of the band at1609 cm�1 in the SERS spectrum. An increase ofthis band in SERS compared to Raman spectraindicates that adsorption of TPT molecules on thesurface of silver hydrosol particles proceedsthrough the A–B ring system. By contrast, thedisappearance in the SERS spectra of the 1650cm�1 Raman band, which is assigned to D- andE-ring carbonyl groups,9 indicates the inaccessi-bility of the D–E rings of TPT to the surface.
An increase of the TPT concentration from 5
Figure 3. (A) The CD spectra of TPT at (—) 2 � 10�5
(pH 4.5), (—) 1.7 � 10�4 (pH 4.5), ( � � � ) 2 � 10�5 (pH9.8), and (- � -) 1.7 � 10�4 M with 10% (v/v) DMSO.Cuvettes with optical pathlengths of 0.5 and 2 cm areused for 2 � 10�5 and 1.7 � 10�4 M concentrations ofTPT, respectively. (B) The magnified long wavelengthregion of the CD spectra in (A). The measurements arecarried out in 1 mM sodium cacodylate aqueous solu-tion with pH adjusting.
446 STRELTSOV ET AL.
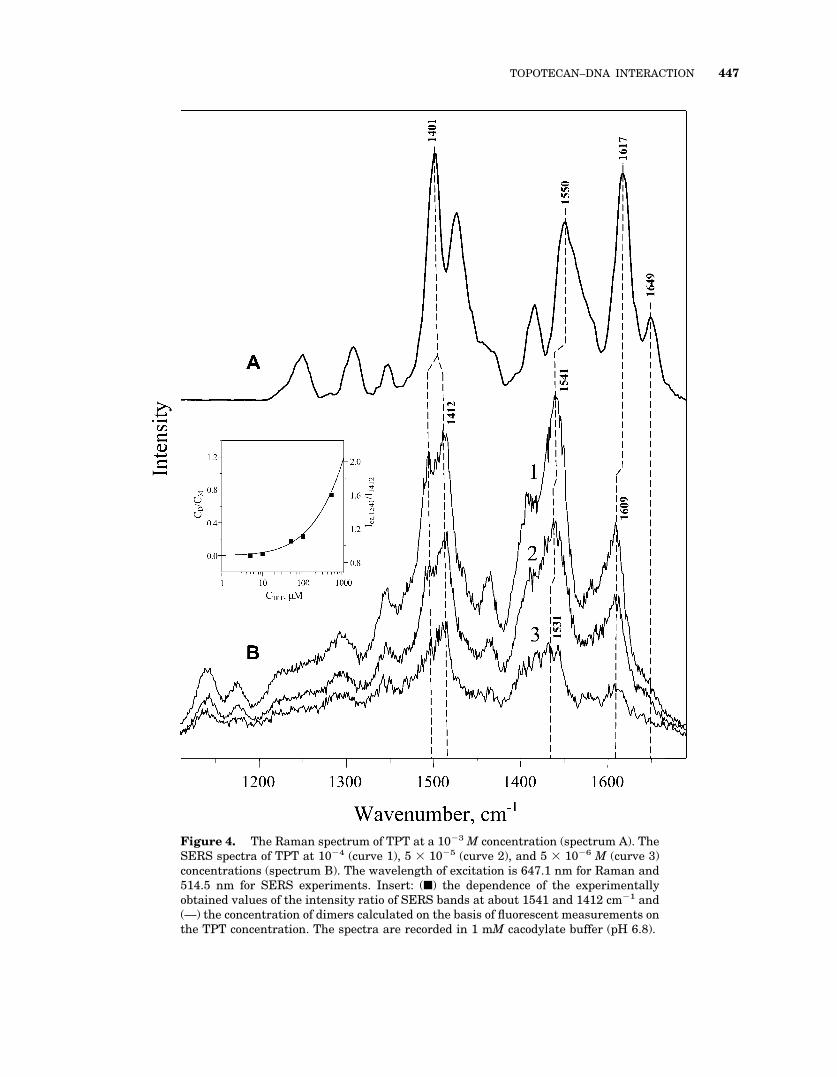
Figure 4. The Raman spectrum of TPT at a 10�3 M concentration (spectrum A). TheSERS spectra of TPT at 10�4 (curve 1), 5 � 10�5 (curve 2), and 5 � 10�6 M (curve 3)concentrations (spectrum B). The wavelength of excitation is 647.1 nm for Raman and514.5 nm for SERS experiments. Insert: (■) the dependence of the experimentallyobtained values of the intensity ratio of SERS bands at about 1541 and 1412 cm�1 and(—) the concentration of dimers calculated on the basis of fluorescent measurements onthe TPT concentration. The spectra are recorded in 1 mM cacodylate buffer (pH 6.8).
TOPOTECAN–DNA INTERACTION 447

� 10�6 to 5 � 10�4 M induces variations of therelative intensities of the bands at 1412 and 1541cm�1 and upshifts of the bands at 1531–1541cm�1 (Fig. 4, spectrum B). These spectral changesresult from intermolecular interactions of TPTmolecules that are induced by dimer formationand alteration of dimer accessibility to the silverhydrosol particle surface. Thus, the ratio of inten-sities (I1541/I1412) can serve as a measure of TPTdimerization.
Figure 4 shows the experimental values of theI1541/I1412 ratios at a given TPT concentration andthe calculated dependence of the Cdimer/Cmonomerratio on the total TPT concentration. The depen-dence of the Cdimer/Cmonomer ratio on the total TPTconcentration was obtained from Eqs. (2) and (3)while taking into account the value of dimeriza-tion constant determined above. The similarity ofthe shapes of the experimental and calculatedcurves validate the use of the intensity ratio of the1541 and 1412 cm�1 SERS bands for the deter-mination of the content of TPT dimers in solution.
Structure of TPT Dimer in Solution
It was found that two TPT molecules in lactoneform constitute a dimer through a stacking interac-tion of an A–B ring stabilized by two hydrogenbonds between the hydroxyl group of the A ring ofone monomer and the N1 atom of the B ring ofanother monomer. This finding was used for theproposal of the possible structures of TPT dimers insolution (Fig. 5). The nonplanarity of the TPT E ringpresumes three possible conformations: with the Erings of the monomers inverted to the outside of thedimer [Fig. 5(A)]; with the E rings of the monomersinverted to the inside of the dimer [Fig. 5(B)]; andwith the E rings of the monomers inverted to theone side [Fig. 5(C)]. It should be noted that thestructures represented in Figure 5(A,B) possess asecond-order axis of symmetry, which passes be-tween the planes of TPT dimer molecules. Thestructure shown in Figure 5(C) has only a spiralaxis of symmetry, which is perpendicular to theplane of the A ring and passes through its center.21
It is possible that an equilibrium between thesethree dimer forms exists at neutral pH.
TPT–DNA Binding in Solution Probed with CD,Fluorescence, FLD, and SERS Spectroscopy
An increase of the DNA concentration at a con-stant concentration of TPT induces an increase ofthe negative CD signal at 390 nm [Fig. 6(A)],
accompanied by the quenching of the TPT fluo-rescence intensity. Both of these effects wereshown to be characteristic for the TPT dimer for-mation [Figs. 2(B) and 3(B)].
The SERS spectra of TPT–DNA complexes aresimilar to those of TPT in solution [Fig. 6(C)]. Itshould be noted that the SERS spectrum of theTPT–DNA complex was recorded with experimen-tal conditions providing complete DNA binding ofTPT molecules and controlled with CD, fluores-cence, and FLD measurements (see Conclusionssection). Thus, the resemblance of the spectrameans that the DNA-bound TPT interacts withthe hydrosol particle with the same conformationas the non-DNA-bound TPT does, which isthrough the quinoline part of its chromophore.Hence, the quinoline fragment of the TPT chro-mophore is oriented outside the DNA and is avail-able for binding with the hydrosol surface. Thisconclusion confirms a model of TPT–DNA inter-action through the E ring of the TPT molecule.9
On the other hand, DNA binding of TPT via the Ering with simultaneous dimer formation confirmsthe participation of the TPT quinoline part in the
Figure 5. Models of the dimers formed by TPT mol-ecules. (A–C) Three possible conformations of the TPTdimer are presented. Each dimer is stabilized by thehydrogen bonds between the oxygen atom of the A ringof one monomer and the N1 atom of another. (– – –) Theintermolecular hydrogen bonds.
448 STRELTSOV ET AL.

Figure 6. CD, FLD, SERS, and UV–vis spectra of TPT in the absence or presence ofDNA. (A) The CD spectra of (- - -) TPT and (—) the TPT–DNA complex with CTPT � 1.4� 10�5 M and CDNA � 3.5 � 10�4 M bp. (B) The FLD spectrum of the TPT–DNAcomplex with CTPT � 1 � 10�5 M and CDNA � 3 � 10�4 M bp. (C) The SERS spectraof TPT (curve 1), TPT–DNA complex (curve 2), and DNA (curve 3) with CTPT � 1.4� 10�5 M and CDNA � 3.5 � 10�4 M bp. The cuvette pathlength is 2 cm for CD and 0.1cm for FLD experiments. The average flow speed gradient in the FLD measurements is700 c�1. (D) The UV–vis spectra of different concentrations of TPT in pure buffersolution and in buffer solution in the presence of DNA. The concentrations of TPT insolution are 2.14 � 10�5 (trace 1) and 2.14 � 10�4 M (trace 2). The TPT–DNA complexis prepared with TPT and DNA concentrations of 1.35 � 10�5 and 3.22 � 10�4 M bp,respectively (trace 3). Insert: the dependence of the FLD signal of TPT at 380 nm on theDNA concentration. The concentration of TPT is 1.35 � 10�5 M. The spectra arerecorded in 1 mM cacodylate buffer (pH 6.8).
TOPOTECAN–DNA INTERACTION 449

formation of dimers and hence the model of TPTdimer proposed above.
Figure 6(C) shows that the DNA contributiondoes not perturb the identification of the charac-teristic TPT bands in the SERS spectrum of thecomplex, which permits the use of previously an-alyzed SERS spectral markers for dimer identifi-cation in the presence of DNA. The addition ofDNA provokes an increase of the I1541/I1412 ratiofrom 0.9 to 1.05 and a clear upshift of the 1532cm�1 band to 1541 cm�1 [Fig. 6(C)]. These modi-fications demonstrate that DNA-induced dimer-ization of TPT molecules is characteristic fordimerization of TPT in solution.
Figure 6(D) shows UV–vis spectra of TPT in so-lution at concentrations of 2.14 � 10�5 (trace 1) and2.14 � 10�4 M (trace 2) and of the TPT–DNA com-plex for TPT and DNA concentrations equal to 1.35� 10�5 M and 3.22 � 10�4 M bp, respectively (trace3). The insert shows that the titration of the TPTsolution with the DNA leads to the appearance ofthe plateau, demonstrating that all TPT moleculesbecome DNA bound. An increase of TPT concentra-tion in solution from 2.14 � 10�5 to 2.14 � 10�4 Mprovokes a decrease of a 415-nm shoulder in theUV–vis spectrum [Fig. 6(D), traces 1 and 2], whichis indicative of the TPT dimer formation.26 It shouldbe noted that the addition of DNA leads to completedisappearance of the 415-nm shoulder in the UV–vis spectrum of the TPT–DNA complex [Fig. 6(D),trace 3]. The data show that the DNA provokesformation of TPT dimers in solution and thesedimers bind the DNA.
Taking into account that only the monomerform of DNA-bound TPT molecules contributes tothe absorption band at 415 nm, the monomerconcentration should be equal to 1.9 � 10�6 M(compare with the total TPT concentration of 1.35� 10�5 M). Applying Eq. (2), the effective dimer-ization constant of TPT with the excess of DNA isfound to be 1.6 � 106 M�1, which is 400-foldhigher than its dimerization constant in the ab-sence of DNA. On the other hand, if the dimerabsorbance contributes to the band at 415 nm, theevaluated TPT monomer concentration is againless important and subsequently leads to an evengreater value for the TPT dimerization constantin the presence of DNA.
Binding Curves of TPT–DNA Interaction inSolution
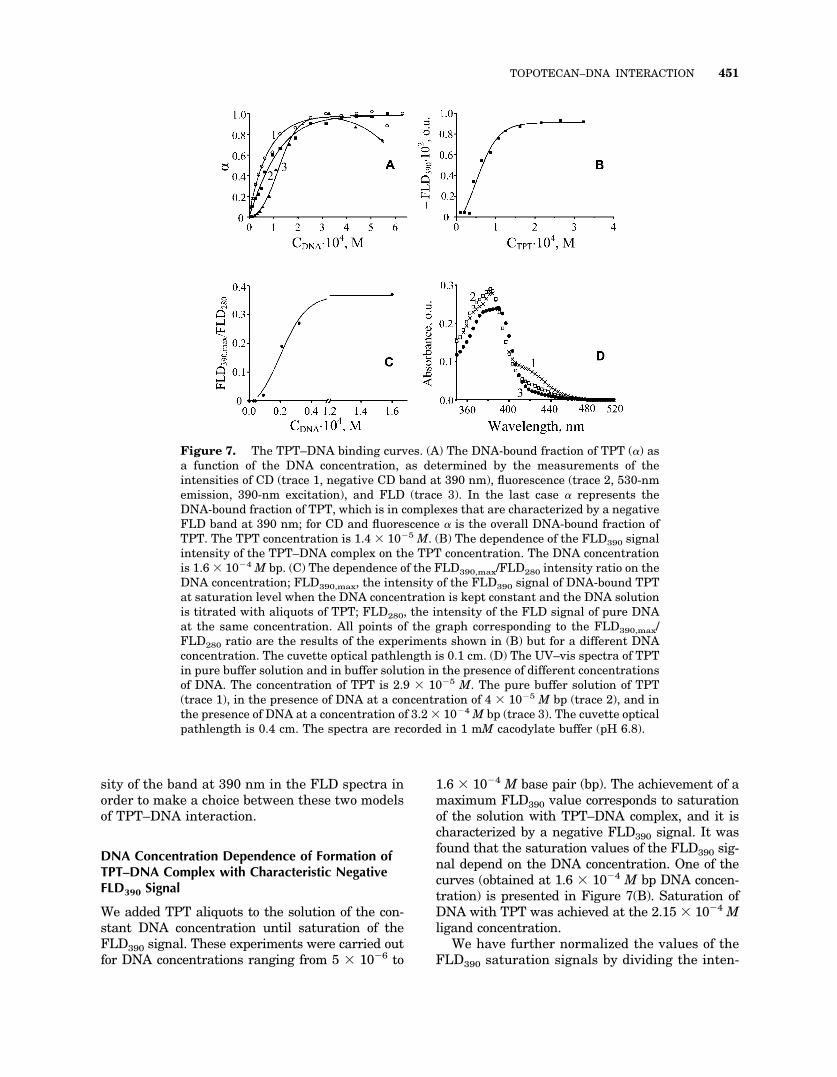
We obtained TPT–DNA binding curves by titra-tion of a 1.4 � 10�5 M solution of TPT with the
DNA followed by measurement of the intensitiesof the band at 390 nm in CD and FLD spectra andat 530 nm in the fluorescence emission spectra.The appearance of the negative FLD390 signalpresumes the formation of a TPT–DNA complexand shows that the direction of the correspondingdipole moment of the adsorbed TPT moleculeforms an angle of more than 55° with the longDNA axis.9,20 The intensities of the fluorescenceand CD signals reach their saturation levels,whereas the FLD signal reaches its maximum (fora DNA concentration corresponding to the satu-ration of fluorescence and CD signals) and thendiminishes.
In order to analyze the differences in the be-havior of CD, FLD, and fluorescence signals, the �parameter was introduced:
� � I� � I�,TPT)/(I�,max � I�,TPT) (4)
where I� corresponds to the intensities of the CDand FLD bands at 390 nm and the fluorescenceintensity of the band at 530 nm for the currentDNA concentration, I�,TPT is the intensity of thesame bands in the absence of DNA, and I�,max isthe maximum value of these signals.
The � values determined by means of CD, flu-orescence, and FLD measurements as a functionof the DNA concentration are represented bytraces 1, 2, and 3, respectively, in Figure 7(A).The forms of traces 1 and 2 are very similar andthe � parameter in this case can be considered asthe fraction of DNA-bound TPT molecules. Trace3 is different and it is S shaped.
The S shape of trace 3 in Figure 7(A) presumesthe formation of TPT–DNA complexes of at leasttwo types according to two qualitatively differentbinding models.26,27 The first model presumesthat the different TPT–DNA complexes differ inbinding constant values and in the length occu-pied by TPT on the DNA sequence.26,27 In thiscase the FLD technique should preferably detectthe complex where TPT exhibits a bigger bindingconstant and occupies a longer DNA se-quence.26,27 The second model suggests that anincrease of the DNA concentration provokes aTPT-mediated intermolecular DNA interaction.The resulting complex should be characterized bythe larger value of specific FLD390 signal of boundTPT than those for TPT molecules adsorbed onthe single DNA molecules.28,29 DNA–TPT bindingcurves were further obtained by titration of DNAwith the TPT aliquots and detection of the inten-
450 STRELTSOV ET AL.
sity of the band at 390 nm in the FLD spectra inorder to make a choice between these two modelsof TPT–DNA interaction.
DNA Concentration Dependence of Formation ofTPT–DNA Complex with Characteristic NegativeFLD390 Signal
We added TPT aliquots to the solution of the con-stant DNA concentration until saturation of theFLD390 signal. These experiments were carried outfor DNA concentrations ranging from 5 � 10�6 to
1.6 � 10�4 M base pair (bp). The achievement of amaximum FLD390 value corresponds to saturationof the solution with TPT–DNA complex, and it ischaracterized by a negative FLD390 signal. It wasfound that the saturation values of the FLD390 sig-nal depend on the DNA concentration. One of thecurves (obtained at 1.6 � 10�4 M bp DNA concen-tration) is presented in Figure 7(B). Saturation ofDNA with TPT was achieved at the 2.15 � 10�4 Mligand concentration.
We have further normalized the values of theFLD390 saturation signals by dividing the inten-
Figure 7. The TPT–DNA binding curves. (A) The DNA-bound fraction of TPT (�) asa function of the DNA concentration, as determined by the measurements of theintensities of CD (trace 1, negative CD band at 390 nm), fluorescence (trace 2, 530-nmemission, 390-nm excitation), and FLD (trace 3). In the last case � represents theDNA-bound fraction of TPT, which is in complexes that are characterized by a negativeFLD band at 390 nm; for CD and fluorescence � is the overall DNA-bound fraction ofTPT. The TPT concentration is 1.4 � 10�5 M. (B) The dependence of the FLD390 signalintensity of the TPT–DNA complex on the TPT concentration. The DNA concentrationis 1.6 � 10�4 M bp. (C) The dependence of the FLD390,max/FLD280 intensity ratio on theDNA concentration; FLD390,max, the intensity of the FLD390 signal of DNA-bound TPTat saturation level when the DNA concentration is kept constant and the DNA solutionis titrated with aliquots of TPT; FLD280, the intensity of the FLD signal of pure DNAat the same concentration. All points of the graph corresponding to the FLD390,max/FLD280 ratio are the results of the experiments shown in (B) but for a different DNAconcentration. The cuvette optical pathlength is 0.1 cm. (D) The UV–vis spectra of TPTin pure buffer solution and in buffer solution in the presence of different concentrationsof DNA. The concentration of TPT is 2.9 � 10�5 M. The pure buffer solution of TPT(trace 1), in the presence of DNA at a concentration of 4 � 10�5 M bp (trace 2), and inthe presence of DNA at a concentration of 3.2 � 10�4 M bp (trace 3). The cuvette opticalpathlength is 0.4 cm. The spectra are recorded in 1 mM cacodylate buffer (pH 6.8).
TOPOTECAN–DNA INTERACTION 451

sity of the FLD280 signal of the solution by thecorresponding DNA concentration measured inthe absence of TPT. Figure 7(C) shows the depen-dence of the normalized FLD390 signal on theDNA concentration. The normalized FLD390 sig-nal was found to be constant at DNA concentra-tions exceeding 0.5 � 10�4 M bp. This fact reflectsthe formation of the saturated DNA–TPT com-plex. The FLD390 signal is decreased with thedecrease of the DNA concentration from 0.5� 10�4 to 0.5 � 10�5 M bp, and it remains con-stant and close to zero for the lower DNA concen-trations.
The experimental curve presented in Figure7(C) cannot be explained by the first model of TPTbinding described above, which assumes forma-tion of TPT–DNA complexes with different bind-ing constants and different lengths of occupationof DNA with TPT. Indeed, an increase of theligand concentration should provoke replacementof the complex characterized by a high length ofDNA occupation with the TPT by the complexwith a smaller length of occupation. DNA satura-tion by the ligand should lead to the appearanceof only one type of complex, and the number ofTPT molecules bound to the single DNA moleculewill not be dependent on the DNA concentration.Therefore, for each DNA concentration, theFLD390 signal at saturation conditions should bedirectly proportional to the DNA concentration,providing us with the parallel to the X-axis curvein Figure 7(C). The experimental curve presentedin Figure 7(C) does not confirm the model thatpresumes the existence of TPT–DNA complexeswith different binding constants and differentlengths of DNA occupation by the drug. The sameconclusions may be drawn for cooperative DNAbinding with the dimers and monomers of TPT.
Otherwise, the data presented in Figure 7(C)correlate with the model in which several DNAmolecules are linked by TPT. At low DNA concen-trations the complex of TPT with single DNAmolecules (not possessing a significant LD390 sig-nal) is dominant [Fig. 7(C)]. An increase of theDNA concentration provokes the replacement ofthis complex with the complex containing severalDNA molecules, which is characterized by thenegative LD390 signal. The appearance of thecharacteristic negative LD390 signal for this typeof complex is caused by a change of orientation ofthe long wavelength dipole moment of the TPTchromophore relative to the long DNA axis com-pared to its orientation in the complex of TPTwith the single DNA molecule. Thus, the data of
Figure 7(C) provide us with evidence of the exis-tence of TPT–DNA complexes with participationof several DNA molecules. As we have shownbefore, TPT dimers participate in the formation ofTPT–DNA complexes. Consequently, one maysuggest the model of a TPT–DNA complex whereseveral DNA molecules are stabilized by the sym-metrical TPT dimer structures. Apparently, thecomplexes of TPT dimers with a single DNA mol-ecule should appear first [Fig. 7(A), initial parts oftraces 1 and 2] whereas the complexes of TPTdimers with several DNA molecules will appearwhen the density of DNA-bound TPT dimers be-comes sufficient to hold different DNA moleculesvia TPT dimer bridges.
This model perfectly explains the S shape ofthe TPT–DNA binding curve as determined bymeans of FLD and presented in trace 3 in Figure7(A). The initial growth of the curve slope (atCDNA � 10�4 M bp) means that the quantity ofDNA molecules in TPT solution becomes suffi-cient for formation of complexes between TPT andseveral DNA molecules. The further increase ofthe DNA concentration at a fixed TPT concentra-tion leads to saturation and therefore to diminu-tion of the curve slope. Finally, the density of theTPT molecules bound to DNA becomes insuffi-cient for retention of DNA molecules together,which results in the decrease of concentration ofthe complexes at DNA concentrations of �3� 10�4 M bp. [Fig. 7(A)]. It should be noted thatthis conclusion is valid for a TPT–DNA complexcharacterized by a negative FLD390 signal whenthe total quantity of DNA-bound TPT moleculesdoes not decrease.
Figure 7(D) shows the absorption spectra ob-tained by titration of 2.9 � 10�5 M TPT with twodifferent DNA concentrations. The diminishing ofthe intensity of the band at 415 nm is observedupon the increase of the DNA concentration. Thisfact indicates the formation of TPT dimers26 andconfirms that the TPT dimers participate in theformation of both types of complexes.
The addition of DNA to the TPT solution leadsto an increase of the intensity of the TPT absorp-tion band at 375 nm: in the presence of 4 � 10�5
M bp DNA the band is more intense than that inthe spectrum of free TPT [Fig. 7(D)]. A furtherincrease of the DNA concentration provokes thedecrease of this band. These observations confirmour conclusion that the TPT dimers may form atleast two different types of TPT–DNA complexes.
452 STRELTSOV ET AL.

CONCLUSIONS
Recent studies have shown that TPT interactsdirectly with double-stranded and single-stranded DNA and this interaction stabilizes itsactive lactone form.8,9 We employed UV–vis, flu-orescence, CD, FLD, and SERS spectroscopy inthis work to probe TPT dimerization in solutionand its role in TPT–DNA interactions. The X-raydiffraction data show that the CPT derivativesmay form dimers by overlapping their rings withthe center of the symmetry located between theA–D planes of dimer-forming monomers.30
We have shown for the first time that TPT, awater-soluble derivative of CPT, may form dimersat concentrations of �10�5 M. The appearanceand growth of the CD signals upon the increase ofthe TPT concentration can be attributed to thestacking interactions of the quinoline rings of themolecules in polar solutions.10,21,24 It is mostprobable that the stacking interaction involvesquinoline chromophores (rings A and B) of the twoTPT molecules, with the inverse position of thenitrogens of their B rings leading to the formationof an internally dissymmetric chromophore.Quinoline rings are known to have a tendency tooverlap according to crystallographic data.31 Thequinoline-type stacking interaction between theA–B rings of TPT molecules is also confirmed bythe characteristic changes in the profile of theUV–vis spectra of the drug [Fig. 2(A)], which issimilar to those found for the mutual interactionof the quinolines.32 This interaction leads to adecrease in the long wavelength band in the ab-sorption spectrum [Fig. 2(A)] that was found to besensitive only to hydroxyl group substitution inthe A ring or to the protonation of the nitrogen ofthe B ring.10 On the other hand, this band wasfound to be insensitive to the modifications in thevicinity of the rest of the CPT chromophore.10
Finally, Figure 5 presents the possible models ofthe TPT dimer formed in solution. The dimer isstabilized by the stacking interaction between theoverlapped A and B rings and by the intermolec-ular hydrogen bonds between the A-ring hydroxylgroups and the B-ring nitrogen atoms of two dif-ferent TPT molecules.
The use of this experimental system enabled usto show that the dimers are formed by the lactoneform of TPT molecules and that the DNA bindingprovokes an increase of the level of TPT dimeriza-tion. Because DNA binding of TPT induces thedimerization process and the lactone form of TPT isobligatory for dimer formation, this explains the
known effect of the stabilization of the TPT lactoneform upon DNA binding.8,9 In addition, the SERSstudy of TPT–DNA complexes demonstrates thatthe TPT dimer interacts with DNA through the Erings and confirms that the dimer is formed viastacking of the A–B rings of TPT molecules.
The FLD spectroscopy data show that the TPTmolecules interact with DNA in the form ofdimers and that these dimers bind different DNAmolecules together. Moreover, the spatial proxim-ity of two distinct structural domains of the sameDNA molecules may also be bound by TPT. Thisspatial proximity may be realized in the cross-overs of the supercoiled plasmid DNA within thecruciform structures and so forth. The experi-ments of the TPT binding with these specificstructures are in progress now.
What biological role may the capability of thetop1 poison TPT play in binding the distinct DNAstructural domains? We hypothesize that this ef-fect may be essential for the modulation of thetop1–DNA specific recognition before ternarycomplex formation.
Regions of DNA that act as recombinant cross-over points are shown to be the loading positions fortop1.11 Our data suggest a hypothesis of drug-in-duced modulation of the specific structural sites oftop1–DNA recognition. The TPT dimers are shownto be capable of binding two distinct DNA structuraldomains: the process may lead to modulation ofjunctional migration, modification of the intrinsicgeometry of the cruciform DNA structure, or even tothe creation of new cruciform DNA structures. Thelast case may correspond to the appearance of thedrug-induced crossover points that serve as thesites of the top1 loading position.33–35
The hypothesis that TPT may open new top1binding sites on DNA may be tested by a compar-ison of the top1–DNA association constants withand without TPT. Our recent analysis of the ki-netics of top1 association and dissociation withthe CPT-independent and CPT-dependent oligo-nucleotides in the presence of different CPT de-rivatives probed by the surface plasmon reso-nance technique demonstrates that the presenceof TPT provokes a three- to fivefold increase oftop1–DNA association.36
Usually TPT is administered to patients in thelow nanomolar concentration range whereas inthis work we used complementary biophysicaltechniques operating with 10–20 �M TPT concen-trations in solution. Other than this difference,our study demonstrates clear evidence of the co-operative effect of the increase of the TPT dimeriza-tion constant upon TPT–DNA interaction. In the
TOPOTECAN–DNA INTERACTION 453

absence of DNA, the TPT dimerization constant iscalculated to be 4 � 103 M�1. (Nearly half of the allTPT molecules are in the dimeric form at the 2� 10�4 M TPT concentration.) The decrease of theTPT concentration from 2 � 10�4 to 2 � 10�5 Mleads to the decrease of the quantity of the TPTdimers whereas an excess of DNA induces a dra-matic decrease of the relative quantity of mono-meric TPT: the signal of monomeric TPT in UV–visand SERS spectra becomes undetectable, being lessthan 10% of the total TPT concentration. The sim-ple calculations show that this effect of DNA-in-duced TPT dimerization is accompanied by at leasta 103-fold increase of the TPT effective dimerizationconstant. One may expect that in an in vivo systemthese cooperative effects may take place in the re-gions of high local DNA concentrations.
The authors acknowledge Drs. I. Kudelina and A.Mikheikin for skillful technical assistance.
REFERENCES
1. Pommier, Y.; Pourquier, P.; Fan, Y.; Strumberg, D.Biochim Biophys Acta 1998, 1400, 83–105 and ref-erences therein.
2. Macdonald, J. S.; Benedetti, J. K.; Modiano, M.;Alberts, D. S.; Mac Donald, J.; Bendetti, J.; Modi-ano, M.; Alberts, D. Invest New Drugs 1997, 15,357–359.
3. Li, L. H.; Fraser, T. J.; Olin, E. J.; Bhuyan, B. K.Cancer Res 1972, 32, 2643–2650.
4. Hsiang, Y.-H.; Hertzberg, R.; Hecht, S.; Liu, L. F.J Biol Chem 1985, 260, 14873–14878.
5. Kuwahara, J.; Suzuki, T.; Funakoshi, K.; Sugiura,Y. Biochemistry 1986, 25, 1216–1221.
6. Hertzberg, R. P.; Caranfa, M. J.; Hecht, S. M. Bio-chemistry 1989, 28, 4629–4638.
7. Yang, D.; Strode, J. T.; Spielmann, H. P.; Wang,A. H.-G.; Burke, T. G. J Am Chem Soc 1998, 120,2979–2980.
8. Yao, S.; Murali, D.; Seetharamulu, P.; Haridas, K.;Petluru, P. N.; Reddy, D. G.; Hausheer, F. H. Can-cer Res 1998, 58, 3782–3786.
9. Streltsov, S.; Sukhanova, A.; Mikheikin, A.;Grokhovsky, S.; Zhuze, A.; Kudelina, I.; Mochalov,K.; Oleinikov, V.; Jardillier, J.-C.; Nabiev, I. J PhysChem B 2001, 105, 9643–9652.
10. Nabiev, I.; Fleury, F.; Kudelina, I.; Pommier, Y.;Charton, F.; Riou, J.-F.; Alix, A. J.; Manfait, M.Biochem Pharmacol 1998, 55, 1163–1174.
11. Bullock, P.; Champoux, J. J.; Botchan, M. Science1985, 230, 954–958.
12. Timsit, Y.; Moras, D. J Mol Biol 1991, 221, 919–940.
13. Zechiedrich, E. L.; Osheroff, N. EMBO J 1990, 9,4555–4562.
14. Taboury, J. A.; Taillandier, E. Nucleic Acid Res1985, 13, 4469–4483.
15. Nabiev, I.; Chourpa, I.; Riou, J.-F.; Nguyen, C. H.;Lavelle, F.; Manfait, M. Biochemistry 1994, 33,9013–9023.
16. Fleury, F.; Ianoul, A.; Kryukov, E.; Sukhanova, A.;Kudelina, I.; Wynne-Jones, A.; Bronstein, I.; Mai-zieres, M.; Berjot, M.; Dodson, G.; Wilkinson, A.;Holden, J.; Feofanov, A.; Alix, A.; Jardillier, J.-C.;Nabiev, I. Biochemistry 1998, 37, 14630–14642.
17. Makarov, V. L.; Streltsov, S. A.; Vengerov, Yu.;Khorlin, A. A.; Gursky, G. V. Mol Biol 1983, 17,885–897.
18. Norden, B.; Kubista, M.; Kurucsev, T. Q Rev Bio-phys 1992, 25, 51–170.
19. Hogan, M.; Dattagupta, N.; Crothers, D. M. Bio-chemistry 1979, 18, 280–288.
20. Bailly, C.; Riou, J.-F.; Colson, P.; Houssier, C.; Ro-drigues-Pereira, E.; Prudhomme, M. Biochemistry1997, 36, 3917–3929.
21. Streltsov, S.; Grokhovskii, S.; Kudelina, I.; Oleini-kov, V.; Zhuze, A. Mol Biol 2001, 35, 365–373.
22. Fassberg, J.; Stella, V. J. J. Pharm Sci 1992, 81,676–684.
23. Lackey, K.; Sternbach, D. D.; Croom, D. K.; Emer-son, D. L.; Evans, M. G.; Leitner, P. L.; Luzzio,M. G.; McIntyre, G.; Vuong, A.; Yates, J.; Bester-man, J. M. J Med Chem 1996, 39, 713–719.
24. Fleury, F.; Kudelina, I.; Nabiev, I. FEBS Lett 1997,406, 151–156.
25. Chourpa, I.; Beljebbar, A.; Sockalingum, G.; Riou,J. F.; Manfait, M. Biochim Biophys Acta 1997,1334, 349–360.
26. Streltsov, S.; Mikheikin, A.; Nechipurenko, Yu. MolBiol 2001, 35, 374–381.
27. Nechipurenko, Yu.; Mikheikin, A.; Streltsov, S.;Zasedatelev, A.; Nabiev, I. J Biomol Struct Dyn2001, 18, 703–708.
28. Streltsov, S.; Borodina, M.; Semenov, T. J BiomolStruct Dyn 1996, 14, 357–363.
29. Streltsov, S.; Martinkina, L.; Vengerov, Yu. FEBSLett 1999, 444, 231–234.
30. Band, Y. B.; Scharf, B. Chem Phys Lett 1975, 127,381–386 and references therein.
31. Yoshioka, H.; Nakatsu, K. Chem Phys Lett 1971,11, 255–258.
32. Knapp, E. W.; Fisher, S. H. Chem Phys Lett 1984,103, 479–483.
33. Been, M. D.; Burgess, R. R.; Champoux, J. J. Nu-cleic Acids Res 1984, 12, 3097–3114.
34. Thiyagarajan, M.; Kotani, H.; Holloman, W. K.;Kmiec, E. B. Biochim Biophys Acta 1993, 1173,155–164.
35. Thiyagarajan, M. M.; Waldman, S. A.; Noe, M.;Kmiec, E. B. Eur J Biochem 1998, 255, 347–355.
36. Devy, J.; Wargnier, R.; Pluot, M.; Cohen, J. H. M.;Nabiev, I.; Sukhanova, A. J Mol Recognit, submitted.
454 STRELTSOV ET AL.
Related Documents