The Fourth International Symposium on Computational Wind Engineering(CWE2006), Yokohama, 2006 Interaction Envelopes For Limit State Design Of Chimneys K. S. Babu Narayan a , Subhash C. Yaragal b, and Yukio Tamura c a&b Department of Civil Engineering , National Institute of Technology Karnataka, Surathkal, PO: Srinivasnagar-575 025, Mangalore, INDIA. Professor, Department of Architectural Engineering, TokyoPolytechnic University, 1583, Iiyama, Atsugi, Kanagawa, JAPAN 243-0297 ABSTRACT: Chimneys as an indirect and effective means of air pollution control are popular from time immemorial. Environmental protection agencies have been forced to frame, implement and monitor stringent pollution control policies. With control regulations becoming more stringent, chimneys of heights over 400 meters are being erected and used. Design of reinforced concrete tall stacks for load and wind induced moments by trial and error technique involves rigorous computational efforts. Availability of interaction envelopes helps reduce computational time. This paper presents such design aids for tall stacks. KEYWORDS: Tall stacks, Chimneys, Stability, Interaction Envelopes, Limit State Design 1 INTRODUCTION Chimneys as an indirect means of air pollution control are immensely popular. Owing to the advancements in the field of concrete and construction technology RCC chimneys of staggering heights are being conceived, analyzed, designed, detailed and constructed. The analysis and design of chimneys as a hollow circular RCC section for combined load and moment involves rigorous computational efforts by trial and error approach. The problem offers tremendous scope for computerization and optimization. This paper presents the development of an interactive user friendly computer package employing rectangular stress block, for the complex problem on hand. The package has great utility in the design office for real time design and also for generation of interaction envelopes for use as and when desired. 2 FUNCTIONAL DESIGN The design of chimney is a two-fold problem of satisfying the functional and structural requirements. The functional design includes stack height determination, effective height, plume rise, maximum downwind concentration, plume rise determination, lapse rate, atmospheric stability, plume rise formulae and wind speed correction. As regards to chimney sizing exit velocity, base dimensions, exit size (top diameter). 3 LOADS, FORCES, STRESSES AND EFFECTS IN CHIMNEY DESIGN Chimney is a wind sensitive structure. Its behavior is essentially considered as that of a vertical cantilever. The loads acting on chimneys are as follows, (a) Self-weight of the chimney acts vertically downwards. Compressive stress at any section is primarily due to its self weight of the shell and that of the lining above that section, which depends on the cross-sectional area and the •\ 439•\—

Welcome message from author
This document is posted to help you gain knowledge. Please leave a comment to let me know what you think about it! Share it to your friends and learn new things together.
Transcript
The Fourth International Symposium on Computational Wind Engineering(CWE2006), Yokohama, 2006
Interaction Envelopes For Limit State Design Of Chimneys
K. S. Babu Narayan a , Subhash C. Yaragal b, and Yukio Tamura c
a&b Department of Civil Engineering, National Institute of Technology Karnataka, Surathkal, PO: Srinivasnagar-575 025, Mangalore, INDIA.
Professor, Department of Architectural Engineering, Tokyo Polytechnic University, 1583, Iiyama, Atsugi, Kanagawa, JAPAN 243-0297
ABSTRACT: Chimneys as an indirect and effective means of air pollution control are popular from time immemorial. Environmental protection agencies have been forced to frame, implement and monitor stringent pollution control policies. With control regulations becoming more stringent, chimneys of heights over 400 meters are being erected and used. Design of reinforced concrete tall stacks for load and wind induced moments by trial and error technique involves rigorous computational efforts. Availability of interaction envelopes helps reduce computational time. This paper presents such design aids for tall stacks.
KEYWORDS: Tall stacks, Chimneys, Stability, Interaction Envelopes, Limit State Design
1 INTRODUCTION Chimneys as an indirect means of air pollution control are immensely popular. Owing to the advancements in the field of concrete and construction technology RCC chimneys of staggering heights are being conceived, analyzed, designed, detailed and constructed. The analysis and design of chimneys as a hollow circular RCC section for combined load and moment involves rigorous computational efforts by trial and error approach. The problem offers tremendous scope for computerization and optimization.
This paper presents the development of an interactive user friendly computer package employing rectangular stress block, for the complex problem on hand. The package has great utility in the design office for real time design and also for generation of interaction envelopes for use as and when desired.
2 FUNCTIONAL DESIGN The design of chimney is a two-fold problem of satisfying the functional and structural requirements. The functional design includes stack height determination, effective height, plume rise, maximum downwind concentration, plume rise determination, lapse rate, atmospheric stability, plume rise formulae and wind speed correction. As regards to chimney sizing exit velocity, base dimensions, exit size (top diameter).
3 LOADS, FORCES, STRESSES AND EFFECTS IN CHIMNEY DESIGN Chimney is a wind sensitive structure. Its behavior is essentially considered as that of a vertical cantilever. The loads acting on chimneys are as follows, (a) Self-weight of the chimney acts vertically downwards. Compressive stress at any section is primarily due to its self weight of the shell and that of the lining above that section, which depends on the cross-sectional area and the
•\ 439•\—
density of the material used. (b) Live load: Live load due to the moment of painter's trolley and the men working on it may be taken as 5 kN/m2 on platform used for cleaning and maintenance works etc. (c) Wind load: The wind load exerted at any point on a chimney can be considered as the sum of static and dynamic load component. The dynamic component, which can cause oscillations of a structure, is generated due to the following reasons, (i) Gusts-they cause dynamic pressure changes initiating in line oscillations, (ii)Vortex shedding-this loads to transverse vibration and (iii) Bufetting-a down wind chimney can oscillate due to the bufetting effect of an upstream structure. Magnitude of force exerted by wind is dependent on wind speed, its fluctuations, Reynold,s number etc.
Static wind effects Wind exerts a static force on a bluff body obstructing an air stream. The distribution of wind pressure around the circumference of such a body depends on its shape and direction of wind incidence. Such a pressure causes circumferential bending whose magnitude is significant for large diameter chimneys. The drag force acting on a chimney, is correctly estimated by right estimation of drag coefficient which depends on the shape and shear force and bending moments which the chimney fabric has to withstand safely. The circumferential bending as a result of radial distribution of wind pressure on a horizontal section of a chimney depends on Reynold,s number. It is assumed that the along-wind resultant of such pressures is balanced by the resultant of shear forces induced in the structure and these shear forces, in turn, are assumed to vary sinusoidal along the circumference of the chimney.
Dynaimic wind effects Dynamic wind problems arise from periodic variations in the pressure distribution on the shell of the chimney. There are three forms of dynamic action namely (i) In-wind oscillations, (ii) Cross-wind oscillations and (iii) Ovalling oscillations. Ocillations (i) and (iii) are small and in most cases may be ignored. Model tests show that in-wind oscillations caused by the oscillating drag force which occurs at around one half of the critical wind speed for cross-wind oscillations. Moreover they are very weak and easily damped out. Cross-wind oscillations are by far the most important and any tall chimney should be checked for the effects of such oscillations. Chimneys, which are of particular concern, are those with low damping, low stiffness and high slenderness. (d) Seismic loads: An earthquake resistant design essentially consists of evaluating the structural response to the ground motion and then calculating the corresponding shear forces and bending moment, which the structure needs to safely resist. Chimney vibration is essentially a dynamic problem of transient nature. For analysis, chimney is treated as a cantilever beam with predominant flexural deformations and is analyzed by one of the following methods, namely (i) Response spectrum method, (ii) Modal analysis technique, and (iii) Time history response analysis.
3.1 Structural Design Consideration
Among the advantages claimed for the limit-state approach are the degree of safety of the various
parts of a structure is more uniform and that a probabilistic approach to safety is possible. Code of practice requirements for the design of RC chimneys varies from country to country. Most countries have regulations for general RC structural work and some of these have particular clauses relating to chimney design. Some countries like U.S.A, Poland, India, France have
particular codes for RC chimneys. The design is difficult involving lengthy, cumbersome and iterative computational effort. All codes of practice have recognized this fact and encourage designers to use time saver techniques like computational algorithm and interaction envelopes to optimize the structural design of chimney.
•\ 440•\
4 PROGRAM DEVELOPMENT AND DISCUSSION The program has been organized in two phases. First phase of the program generates, values for
plotting interaction diagram. Second phase utilizes values generated for designing. Phase I: With the cover ratio and thickness ratio as in-put data the program determines for the
given percentage of steel the distances to the designated 73 rows of reinforcement both from the highly compressed edge and centroid of the section for the given position of neutral axis.
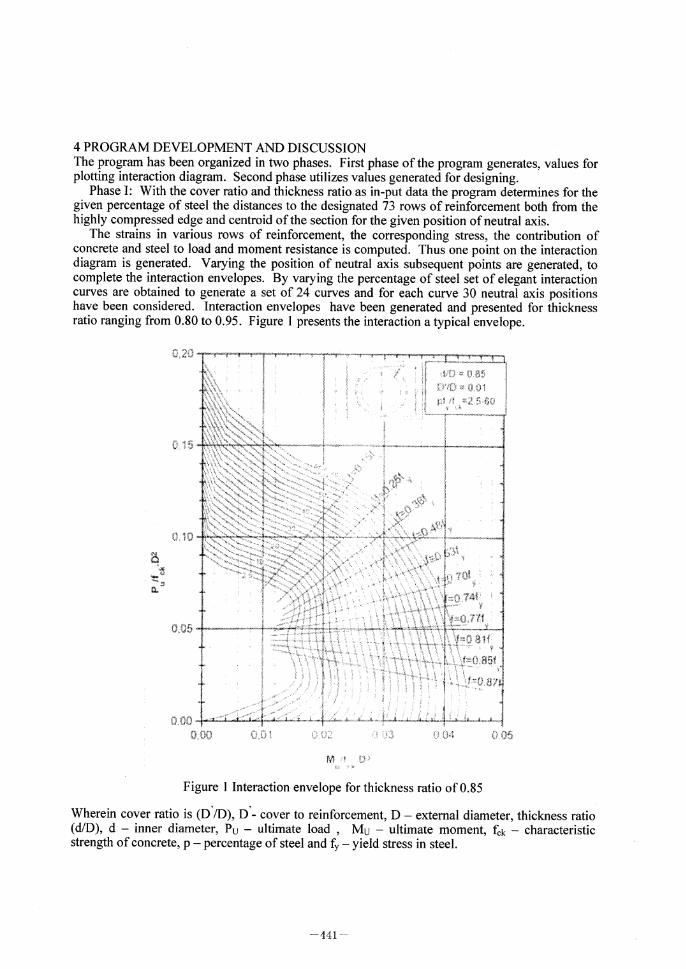
The strains in various rows of reinforcement, the corresponding stress, the contribution of concrete and steel to load and moment resistance is computed. Thus one point on the interaction diagram is generated. Varying the position of neutral axis subsequent points are generated, to complete the interaction envelopes. By varying the percentage of steel set of elegant interaction curves are obtained to generate a set of 24 curves and for each curve 30 neutral axis positions have been considered. Interaction envelopes have been generated and presented for thickness ratio ranging from 0.80 to 0.95. Figure .1 presents the interaction a typical envelope.
Figure 1 Interaction envelope for thickness ratio of 0.85
Wherein cover ratio is (D'/D), D'- cover to reinforcement, D-external diameter, thickness ratio (d/D), d-inner diameter, Pu-ultimate load , Mu-ultimate moment, fck-characteristic strength of concrete, p-percentage of steel and fy-yield stress in steel.
•\4 41•\
Phase II: If the user wishes to design a circular chimney section the program receives, cover ratio, thickness ratio, grades of concrete and steel, external diameter, load and moment combination as input-data runs the first phase, interpolates the steel reinforcement required to satisfy the combination of load and moment acting on the section and area of reinforcement is
given as output. Applications of the Program (a) For generating interaction envelopes for design of chimneys .
(b) To obtain the required area of steel for the given section. (c) For the design of hollow or solid circular section like columns or bridge piers and (d) With little modification can be used for the design of pre-stressed pipes and for the design of caissons.
Limit State of Serviceability To ensure satisfactory performance of a structure serviceability check are needed. Main aspects of serviceability are deflection and cracking. Limiting deflections is one of the criteria for design of structure and also to limit crack width. A program is also been developed for computing the deflection of chimneys with height of the chimney, external diameter at top and bottom, thickness ratio, characteristic strength of concrete and wind load intensity at every 5 m intervals as input data. New-Marks numerical method is applied to compute chimney deflections.
5 CONCLUSIONS From the study the following conclusions are drawn; (i) Availability of interaction envelopes and computer algorithm immensely help the designer in expeditiously solving the design problem, (ii) Adoption of rectangular stress block leads to tremendous reduction in computational effort, leads to slight conservatism which is justified vis-a-vis the time saved, (iii) Distribution of reinforcement in more than one layer may be considered while detailing, as results are not affected (iv) Flue openings were not considered in the study for strength, being sensitive to the position and size, and (v) The program developed can be used in structural optimization exercise wherein the total cost can be minimized or the ratio of cost to strength or cost to efficiency can be minimized.
6 REFERENCES 1. Charles E. Rynolds and James C Steedman, "Reinforced concrete designers hand book", Ninth edition .
2. Prem Chand, "Design of circular RC chimney section subjected to axial load and bending moment", The Indian Concrete Journal, Vol. 68, No. 7, July 1994, pp. 357-364.
3. Gupta S. R. Davalath and Murthy K. S. Madugula, "Analyses/design of reinforced concrete circular cross section", ACI Structural Journal, Vol. 85, No. 6, Tital No. 85-s55, Nov-Dec 1988.
4. S. N. Manohar, "Tall chimneys design and construction", Tata McGraw Hill Publishing Company Limited New Delhi and Tor Steel Research Foundation in India, Bangalore 1985.
5. G. M. Pinfold, "Reinforced concrete chimneys and towers", A Viewpoint Publication 1975. 6. Mark Fintal, "Hand book of reinforced concrete engineering", Second Edition, pp. 565-573. 7. R. Ranganathan and A Muftha, "Evaluation of reliability RCC Chimneys", International Journal of Structures,
Vol. 17, No. 1, paper No-154, Jan-Jun 1997, pp. 19-35. 8. Wadi S. Rumman and Ru-Tung Sun, "Ultimate strength design of reinforced concrete chimneys", ACI Journal,
Vol. 74, No. 4, Titalno. 74-18, July-August, pp. 179-184. 9. ACI Committee 307, "Standard practice for the design and construction of cast-in-place reinforced concrete
chimneys", ACI Structural Journal, Vol. 88, No. 1, Tital no. 88-512, Jan-Feb 1998, pp. 99-101. 10. IS: 4998 (Part I)-1975, "Criteria for design of reinforced concrete chimneys", Bureau of Indian Standards, New
Delhi. 11. IS: 456-1978, "Code of practice for plain and reinforced concrete", Bureau of Indian Standards, New Delhi. 12. IS: 1893-1984, "Criteria for earth quake resistant design of structures", (Fourth Revision), BIS, New Delhi. 13. IS: 875 (Part 3)-1988, "Code of practice for design loads (Other than earthquake) for buildings and structures",
BIS, New Delhi.
•\4 42•\
The Fourth International Symposium on
Computational Wind Engineering(CWE2006), Yokohama, 2006
Wind load simulation for high speed train stations
Nahrnkeon Hura, Sa Ryang Kim b, Chan-Shik Won',Chang-koon Choi d
a Dept. of Mechanical Eng., Sogang Univ., Sinsoo 1, Mapo, Seoul 121-742, Korea bDept. of Precision Mechanical Eng., Kangnung Nat'l. Univ.,
Jibyun 123, Gangneung Gangwon 210-702, Korea cResearch Institute for Applied Science and Technology, Sogang Univ.
Sinsoo 1, Mapo, Seoul 121-742, Korea dDept. of Civil and Environment Eng., KAIST,
Guseong 373-1, Yuseong, Daejeon 305-701, Korea
ABSTRACT: In this paper, the results from scaled model wind tunnel test and CFD for four high speed train station building are introduced. Those two methods show similar results for the wind loads on the station building. Therefore it is shown that CFD is a good tool to predict the wind load instead of the wind tunnel testing.
KEYWORDS: Wind load, High speed train station, Building, Pressure, CFD.
1 INTRODUCTION
The high speed train station buildings such as Chonan-Asan stations, Daejeon station2, Gwangmyeong station3, and Gyeongju station4 in Korea have unique shapes and building structures. To consider the safety of these buildings under unusual weather condition, the wind load should be obtained by wind tunnel tests or computer simulations and taken into account in the design process. The computer hardwares and the simulation techniques are developing very fast as the time goes. Therefore, it can be said that the computer simulation can be replace the expense and time spending wind tunnel tests. Recently, in many fields of architecture, mechanical engineering, equipment, and construction industry, computer simulations are come into use for verifying the design.
In this presentation, the results will be introduced from the wind tunnel tests and the computer simulations on the effect of the wind load generated from the wind with high velocity, like a typhoon, for the station buildings mentioned above. Computer simulations are performed with a commercial CFD code, STAR-CD, and the wind tunnel tests are carried out in POSTECH.
•\ 443•\
2 CHONAN-ASAN STATION
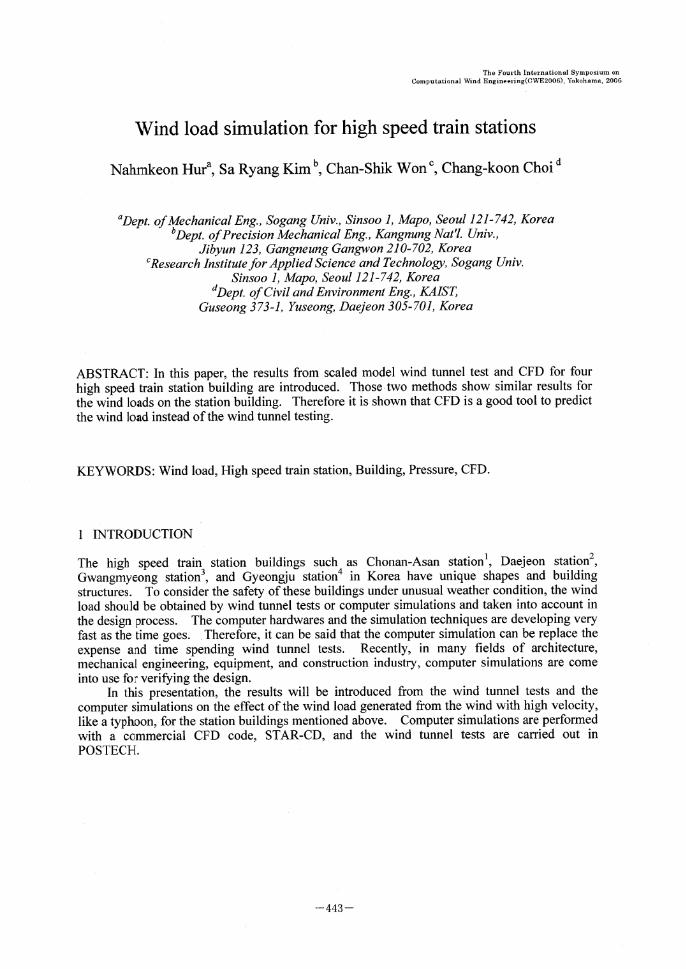
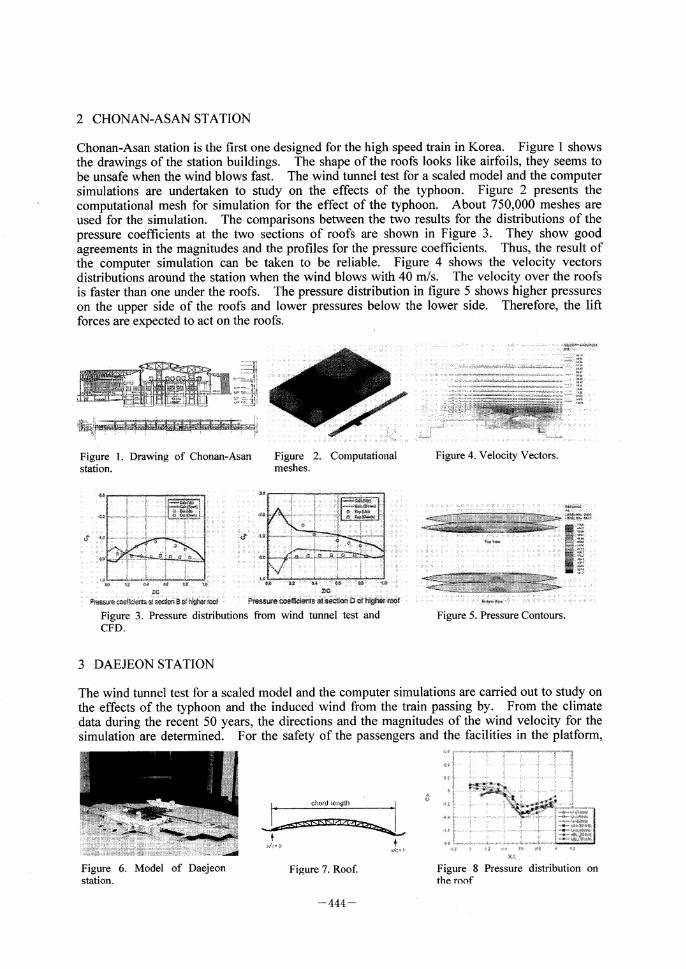
Chonan-Asan station is the first one designed for the high speed train in Korea. Figure 1 shows the drawings of the station buildings. The shape of the roofs looks like airfoils, they seems to be unsafe when the wind blows fast. The wind tunnel test for a scaled model and the computer simulations are undertaken to study on the effects of the typhoon. Figure 2 presents the computational mesh for simulation for the effect of the typhoon. About 750,000 meshes are used for the simulation. The comparisons between the two results for the distributions of the
pressure coefficients at the two sections of roofs are shown in Figure 3. They show good agreements in the magnitudes and the profiles for the pressure coefficients. Thus, the result of the computer simulation can be taken to be reliable. Figure 4 shows the velocity vectors distributions around the station when the wind blows with 40 m/s. The velocity over the roofs is faster than one under the roofs. The pressure distribution in figure 5 shows higher pressures on the upper side of the roofs and lower pressures below the lower side. Therefore, the lift forces are expected to act on the roofs.
Figure 1. Drawing of Chonan-Asan station.
Figure 2. Computational meshes.
Figure 4. Velocity Vectors.
Figure 3. Pressure distributions from wind tunnel test and CFD.
Figure 5. Pressure Contours.
3 DAEJEON STATION
The wind tunnel test for a scaled model and the computer simulations are carried out to study on the effects of the typhoon and the induced wind from the train passing by. From the climate data during the recent 50 years, the directions and the magnitudes of the wind velocity for the simulation are determined. For the safety of the passengers and the facilities in the platform,
Figure 6. Model of Daejeon station.
Figure 7. Roof. Figure 8 Pressure distribution on the roof
•\ 444•\
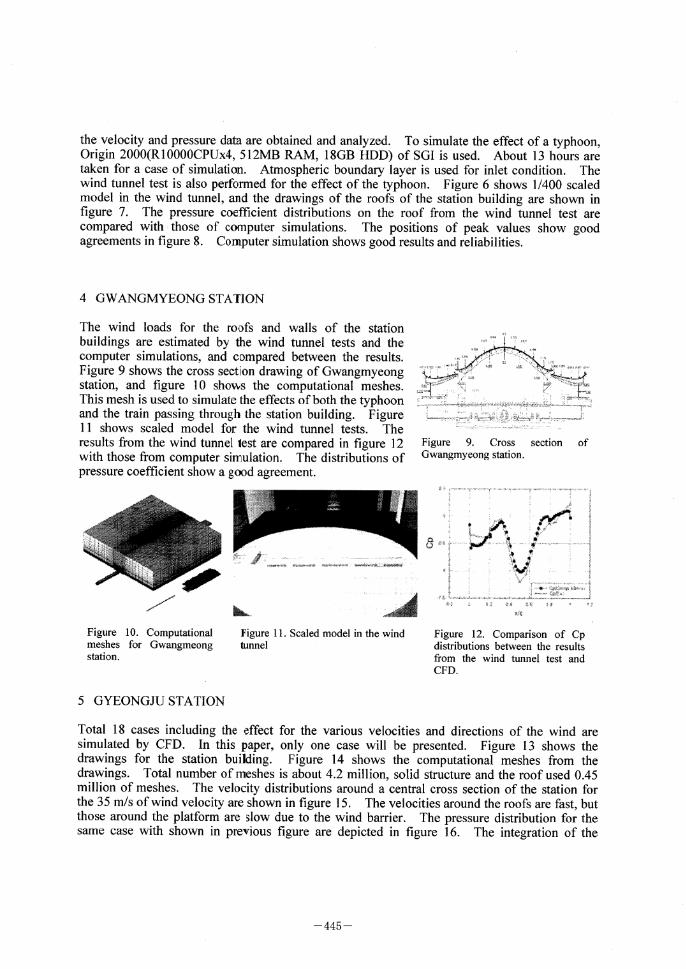
the velocity and pressure data are obtained and analyzed. To simulate the effect of a typhoon, Origin 2000(R 10000CPUx4, 512MB RAM, 18GB HDD) of SGI is used. About 13 hours are taken for a case of simulation. Atmospheric boundary layer is used for inlet condition. The wind tunnel test is also performed for the effect of the typhoon. Figure 6 shows 1/400 scaled model in the wind tunnel, and the drawings of the roofs of the station building are shown in figure 7. The pressure coefficient distributions on the roof from the wind tunnel test are compared with those of computer simulations. The positions of peak values show good agreements in figure 8. Computer simulation shows good results and reliabilities.
4 GWANGMYEONG STATION
The wind loads for the roofs and walls of the station buildings are estimated by the wind tunnel tests and the computer simulations, and compared between the results. Figure 9 shows the cross section drawing of Gwangmyeong station, and figure 10 shows the computational meshes. This mesh is used to simulate the effects of both the typhoon and the train passing through the station building. Figure 11 shows scaled model for the wind tunnel tests. The results from the wind tunnel lest are compared in figure 12 with those from computer simulation. The distributions of
pressure coefficient show a good agreement.
Figure 9. Cross section of Gwangmyeong station.
Figure 10. Computational meshes for Gwangmeong station.
Figure 11. Scaled model in the wind tunnel
Figure 12. Comparison of Cp distributions between the results
from the wind tunnel test and CFD.
5 GYEONGJU STATION
Total 18 cases including the effect for the various velocities and directions of the wind are simulated by CFD. In this paper, only one case will be presented. Figure 13 shows the drawings for the station building. Figure 14 shows the computational meshes from the drawings. Total number of meshes is about 4.2 million, solid structure and the roof used 0 .45 million of meshes. The velocity distributions around a central cross section of the station for the 35 m/s of wind velocity are shown in figure 15. The velocities around the roofs are fast , but those around the platform are slow due to the wind barrier. The pressure distribution for the same case with shown in previous figure are depicted in figure 16. The integration of the
•\ 445•\
pressure around the roof gives the total wind load acts on the roof. That value is used to design the structures of the roofs and the station building.
Figure 13. Drawing of Gyeongju station. Figure 14. Computational meshes for Gyeongju station.
Figure 15. Velocity vectors at central cross section of Gyeongju station.
Figure 16. Pressure contours at central cross section of Gyeongju station.
6 CONCLUSIONS
In this paper, the brief introductions are shown for the simulation of effects of the wind on the high speed train station. The results from the computer simulations show good agreements with those from the wind tunnel tests. Therefore, it can be said that the computer simulation predicts real situation quite well. Hence a broad application of computer simulation on wind load is expected in the field of civil and architectural engineering.
REFERENCES
1 N. Hur et al., A Study on Wind Pressure at Chonan Station of Korean High Speed Train Railway, in Korean, prepared for Korean High-Speed Rail Construction Authority, KHRCA Report, KHRCA, 1995.
2. N. Hur et al., A Report on Design of Taejeon Station of Korean High Speed Railway (Wind Pressure), in Korean, prepared for Korean High-Speed Rail Construction Authority, KHRCA Report, KHRCA, 1997.
3 N. Hur et al., A Report on Design of Nam-Seoul Station of Korean High Speed Railway (Wind Pressure), in Korean, prepared for Korean High-Speed Rail Construction Authority, KHRCA Report, KHRCA, 1997.
4 N. Hur et al., A Report on Design of Kyungju Station of Korean High Speed Railway (Wind Pressure), in Korean, prepared for Korean High-Speed Rail Construction Authority, KHRCA Report, KHRCA, 2006.
•\ 446•\
The Fourth International Symposium on
Computational Wind Engineering(CWE2006), Yokohama, 2006
The aerodynamic characteristic of the transformable airfoil
Jong-Ho Haa, Chang-Koon Choib
'Construction Technology International , Daejeon, Korea bDepartment of Civil & Env Engineering , KAIST, Daejeon, Korea
ABSTRACT: The equations for fluids are quite complex and can be difficult to solve, especially if the geometry of a problem is intricate. To overcome such difficulties, Computational Fluid Dynamics (CFD) has been constantly developed over the past few decades and now both commercial and in-house codes can provide more and more robust and accurate results. Combined with the use of wind tunnel test data, CFD can be used in the design process to drive geometry change instead of being used mainly as a design validation tool. In this study we presented the concept of the transformable airfoil in CRW(Canard Rotor Wing). This is based on NACA642-215 airfoil and flow field in the vicinity of this airfoil is simulated using FLUENT. The results are compared with those of NACA 642-215 airfoil's wind tunnel test and we examined its applicability of the transformable airfoil in the civil structures.
KEYWORDS: Transformable Airfoil, CFD, Aerodynamic Characteristic, Rotary Wing, UAV, CRW
1 INTRODUCTION
Aerodynamics is the science of airflow over airplanes, cars, buildings, civil structures and other objects. Aerodynamic principles are used to find the best ways in which airplanes produce lift, reduce drag, and remain stable (by controlling the shape and size of the wing, the angle at which it is positioned with respect to the air-stream, and the flight speed). In the design of a commercially viable wing, it is critical that the design team have an accurate assessment of the aerodynamic characteristics of the airfoils that are being considered. Errors in the aerodynamic coefficients will result in errors in the aircraft's performance estimates and economic projections. Most of errors are resulted from such that the equations for fluids are quite complex and can be difficult to solve, especially if the geometry of a problem in intricate. The calculation of lift and drag coefficients for subsonic flow over an airfoil is very important for aerodynamic applications and has been a subject of continued research. The most desirable situation is to have accurate experimental data sets for the correct airfoils throughout the design space. However, such data sets are not always available and the designer must rely on calculations. Recent applications of CFD to solve the Navier-Stokes equations for flow around the airfoils are reflected in the works. In this study we presented the concept of the transformable airfoil in CRW(Canard Rotor Wing). This is based on NACA642-215 airfoil and flow field in the vicinity of this airfoil is simulated using commercial CFD code (FLUENT). The results are compared with those of NACA 642-215 airfoil's wind tunnel test. Such analysis for flow field around object can be used in various fields, so we examined its applicability in the civil structures.
•\ 447•\
2 NUMERICAL ANALYSIS FOR THE TRANSFORMABLE AIRFOIL
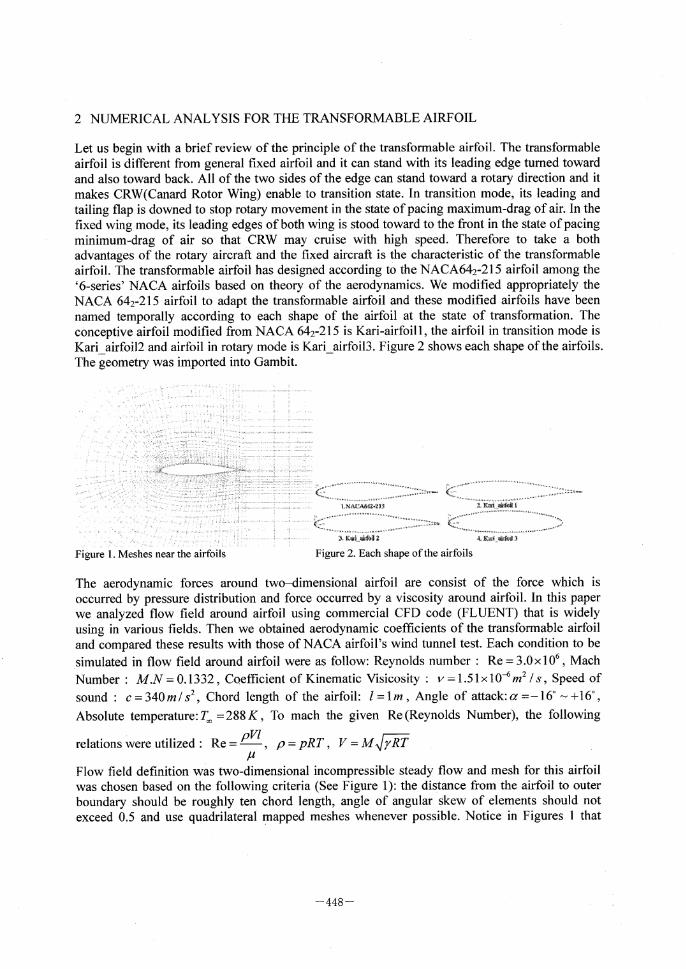
Let us begin with a brief review of the principle of the transformable airfoil. The transformable airfoil is different from general fixed airfoil and it can stand with its leading edge turned toward and also toward back. All of the two sides of the edge can stand toward a rotary direction and it makes CRW(Canard Rotor Wing) enable to transition state. In transition mode, its leading and tailing flap is downed to stop rotary movement in the state of pacing maximum-drag of air. In the fixed wing mode, its leading edges of both wing is stood toward to the front in the state of pacing minimum-drag of air so that CRW may cruise with high speed. Therefore to take a both advantages of the rotary aircraft and the fixed aircraft is the characteristic of the transformable airfoil. The transformable airfoil has designed according to the NACA642-215 airfoil among the '6 -series' NACA airfoils based on theory of the aerodynamics. We modified appropriately the
NACA 642-215 airfoil to adapt the transformable airfoil and these modified airfoils have been named temporally according to each shape of the airfoil at the state of transformation. The conceptive airfoil modified from NACA 642-215 is Kari-airfoill, the airfoil in transition mode is Kari_airfoil2 and airfoil in rotary mode is Kari_airfoil3. Figure 2 shows each shape of the airfoils. The geometry was imported into Gambit.
Figure 1. Meshes near the airfoils Figure 2. Each shape of the airfoils
The aerodynamic forces around two—dimensional airfoil are consist of the force which is
occurred by pressure distribution and force occurred by a viscosity around airfoil. In this paper
we analyzed flow field around airfoil using commercial CFD code (FLUENT) that is widely
using in various fields. Then we obtained aerodynamic coefficients of the transformable airfoil
and compared these results with those of NACA airfoil's wind tunnel test. Each condition to be
simulated in flow field around airfoil were as follow: Reynolds number : Re = 3.0•~106 , Mach
Number : M.N = 0.1332 , Coefficient of Kinematic Visicosity : v= 1.51•~10-6 m2 / s, Speed of
sound : c= 340 m / s2 , Chord length of the airfoil: l=1m, Angle of attack: a =-16•‹•`+16•‹,
Absolute temperature: T•‡ =288K , To mach the given Re (Reynolds Number), the following
relations were utilized
Flow field definition was two-dimensional incompressible steady flow and mesh for this airfoil was chosen based on the following criteria (See Figure 1): the distance from the airfoil to outer boundary should be roughly ten chord length, angle of angular skew of elements should not exceed 0.5 and use quadrilateral mapped meshes whenever possible. Notice in Figures 1 that
•\ 448•\
mesh spacing is much tighter near the airfoil than at the outer boundary. This was done to capture boundary layer information in an effort to obtain an accurate flow description. The
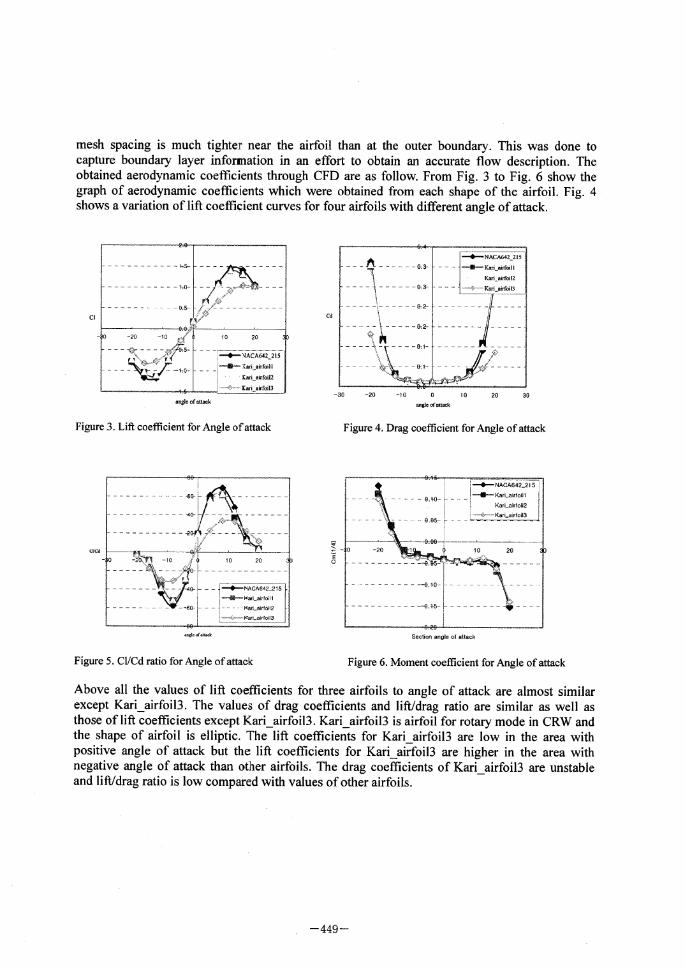
obtained aerodynamic coefficients through CFD are as follow. From Fig. 3 to Fig. 6 show the
graph of aerodynamic coefficients which were obtained from each shape of the airfoil. Fig. 4 shows a variation of lift coefficient curves for four airfoils with different angle of attack .
Figure 3. Lift coefficient for Angle of attack Figure 4. Drag coefficient for Angle of attack
Figure 5. Cl/Cd ratio for Angle of attack Figure 6. Moment coefficient for Angle of attack
Above all the values of lift coefficients for three airfoils to angle of attack are almost similar except Kari _airfoil3. The values of drag coefficients and lift/drag ratio are similar as well as those of lift coefficients except Kari _airfoil3. Kari_airfoil3 is airfoil for rotary mode in CRW and the shape of airfoil is elliptic. The lift coefficients for Kari _airfoil3 are low in the area with positive angle of attack but the lift coefficients for Kari _airfoil3 are higher in the area with negative angle of attack than other airfoils. The drag coefficients of Kari _airfoil3 are unstable and lift/drag ratio is low compared with values of other airfoils.
•\ 449•\
3 CONCLUSION
The aerodynamic characteristics of a conceptive transformable airfoil in fixed wing mode and transition mode in CRW are similar to those of NACA642-215 airfoil. The aerodynamic characteristic of elliptic airfoil(Kari_airfoil3) is lower than other airfoils presented this paper, but it is expected that balance for a validation of angle of attack will be favorable. The variation of aerodynamic coefficients from modification for NACA 642-215 airfoil to adapt the transformable airfoil is relatively low. From these results, we found its applicability in the civil structures. However the analysis results for flow field around transformable airfoil should be examined repeatedly before adapting to the civil structures, also it is necessary that numerical analysis flow field presented above should be examined by various methods such as experimental method and other numerical analysis method. After examination and certification process, if these results are adapted to the civil structures, we expect that evaluation method of the aerodynamic performance in the civil structures will be more improved.
4 REFERENCES
Journals 1 Jong -Ho Ha and Jong-won Lee, A study on the transformable airfoil of the CRW Air-Vehicle, Proceedings of
the 2003 KSAS Fall Conference Vol. 1, (2003) 409-413. 2 Seong-Wook Choi and Jai-Moo Kim, Analysis on Aerodynamic Characteristics of the CRW Air-Vehicle,
Proceedings of the 2003 KSAS Spring Conference Vol. 1, (2003) 29-32. 3 Pulliam, T. H and Chausses, D. S., A Diagonal form of an implicit approximate factorization algorithm, Journal
of computational physics, Vol. 39, (1981), pp347-363.
Monographs, Multi-author volumes, Proceedings 1 John D. Anderson JR, Fundamentals of aerodynamics, 2nd" Edition, McGraw-Hill, New York, 1991, pp 15-22, pp
251-253. 2 Darrol Stinton, The design of the aeroplane, Granada, London, 1983, pp 77-114. 3 KSAS(Korean Society for Aeronautical and Space Sciences), Introduction to aeronautics and astronautics,
KSAS, Seoul, 1991, pp 45-50. 4 Ira H. Abbott and Albert E. Von Doenhoff, The theory of wing sections, Donver, New York, 1959, pp 576-577.
•\ 450•\
The Fourth International Symposium on ComputationaI Wind Fngineering(CWE2006), Yokohama, 2006
Speed up effects over 3-D complex hills with transmission towers collapsed during typhoon passage
Kangpyo Choa, Sungil Hong b
aDivision of Architecture , Wonkwang University, 344-2 Shinyong-dong, Iksan, Chonbuk, Korea bWind Engineering Research Center, TPU, 1583 Iiyama, Atsugi, Kanagawa, Japan
ABSTRACT: This paper presents topographic effects over 3-D complex hills with transmission towers collapsed during typhoon passage. The meteorological station data were analyzed and wind-tunnel tests were performed to investigate the possible causes of the failure. Topographic factors from the experiment were compared with those from major codes and standards. It was observed that topographic factors from the major codes and standards are hard to apply to the ac-tual complex 3-D hills. Topographic effects are very difficult to be reflected in the codes and standards because actual terrains are so complex. It is understandable that only AIJ recommenda-tions require that topographic effects over 3-D hills be estimated in the wind-tunnel tests.
KEYWORDS: topographic factor; transmission tower; 3-D complex terrain; typhoon; wind-tunnel experiment; codes and standards
1 INTRODUCTION Wind loads on a structure depend upon the characteristics of approach wind, the geometry of the structure, wind exposure, wind-induced interference effects, wind-structure interaction, and to-pography. Jackson et al. [1], Bowen[2], Taylor et al. [3 ], and Selvem[4] reported simple methods to estimate topographic factors for three types of topographical features: (1) 2-D hills, (2) 2-D escarpments, and (3) 3-D axisymmetric hills. These studies were based on a single isolated hill, ridge or cliff which was idealized. Sometimes the methods are hard to apply to the actual situa-tions. Li et a1.[5] confirmed that topographic factors of the major codes and standards are rather different, especially in the influent range of the topography in horizontal direction, as well as in the vertical direction. Chock et al. [6,7] made three topographic model of mountains of Hawaii and performed wind-tunnel experiments for evaluation of topographic amplification of wind speed. They concluded that the magnitude of wind speed-up did not have a strong relationship to site elevation in complex terrain; that topographic influences on wind speed are highly direc-tional; and that three-dimensional effects, such as channeling and downslope acceleration phe-nomena through valleys, can be significant.
When typhoon "Maemi" crashed into South Korea's southern provinces, several transmis-sion towers located on hills were collapsed. Major codes and standards in the world would pro-vide information to estimate wind loads on transmission towers. However, the topographic factor over hills and escarpments in major codes and standards is very scattered even in the same slope of a hill or an escarpment. In this study, topographic factors of the hill were measured by ex-periments. A 1:833 scale topographic model of actual site was tested in the 4.5m x 2.5m boundary layer wind tunnel. A normal problem associated with model blockage can be avoided
by the large boundary layer wind tunnel. Topographic factors for the actual sites from a series of wind tunnel tests were provided. The topographic factors from the experiment were compared with those from the major codes and standards.
2 DESCRIPTION OF TYPHOON "MAEMI" AND THE TRANSMISSION TOWERS The typhoon No. 14 "Maemi" brought record winds of instantaneous maximum wind speed of 60m / sec in Jejudo, Korea. The typhoon affected the most southern part of Korean peninsula.
•\ 451•\
According to the Tongyoung Meteorological Station, during typhoon passage, the maximum wind speed and instantane-ous maximum wind speed were 30.8m /sec (South) and 43.8m / sec (South-East), respectively.
The transmission towers in the mountains called Mt. Ilbong and Mt. Iibong were collapsed during typhoon at-tack. The mountains are located about 7.5 km NNE of the center of Tongyoung. The top of Mt. Ilbong is about 190 m and the top of Mt. Ilbong is about 226 m above sea level.
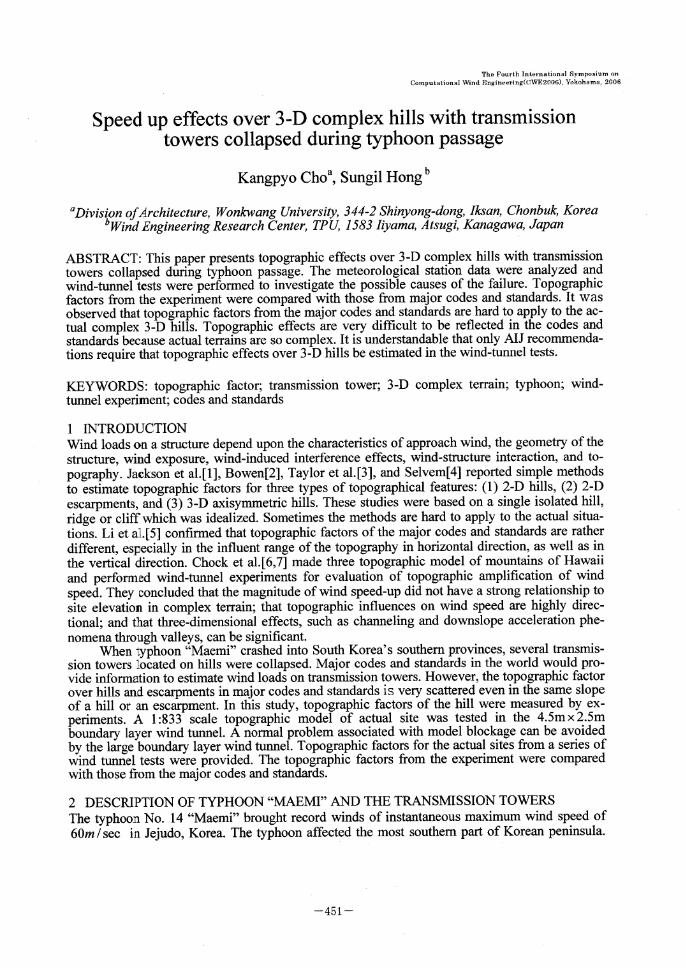
The two transmission towers are the tower #141(Fig. 1) and the tower #142. The towers were built in 1976 and weresupposed to be repaired and reinforced sooner or later. The tower #141 was located 125m above sea level in between two hills. When winds enter a narrow canyon, the streamlines of the wind may converge or contract, causing an amplification of wind speeds in the narrow part of the can-yon(Fig. 2). The tower #142 was 75m above sea level in the mid-slope of the Mt. Iibong.
Figure 1. A collapsed transmission tower
3 WIND TUNNEL EXPERIMENTS
The accurately contoured 1:833 scaled topographic model of Mt. Ilbong and Mt. Iibong was built
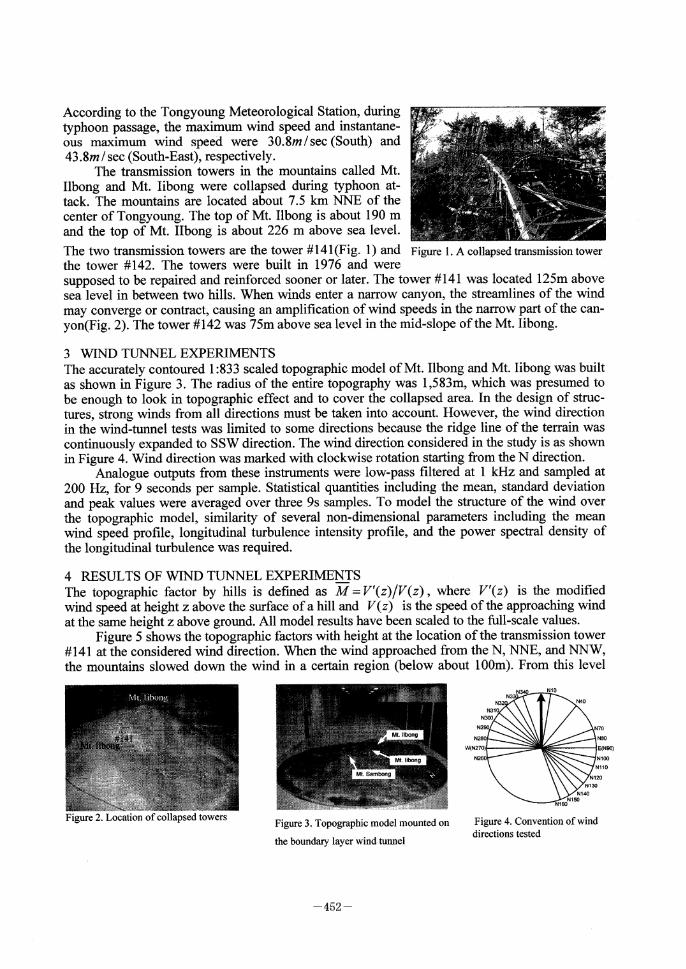
as shown in Figure 3. The radius of the entire topography was 1,583m, which was presumed to be enough to look in topographic effect and to cover the collapsed area. In the design of struc-tures, strong winds from all directions must be taken into account. However, the wind direction in the wind-tunnel tests was limited to some directions because the ridge line of the terrain was continuously expanded to SSW direction. The wind direction considered in the study is as shown in Figure 4. Wind direction was marked with clockwise rotation starting from the N direction.
Analogue outputs from these instruments were low-pass filtered at 1 kHz and sampled at
200 Hz, for 9 seconds per sample. Statistical quantities including the mean, standard deviation and peak values were averaged over three 9s samples. To model the structure of the wind over the topographic model, similarity of several non-dimensional parameters including the mean wind speed profile, longitudinal turbulence intensity profile, and the power spectral density of
the longitudinal turbulence was required.
4 RESULTS OF WIND TUNNEL EXPERIMENTS
The topographic factor by hills is defined as M = V'(z)/V (z) , where V'(z) is the modified wind speed at height z above the surface of a hill and V(z) is the speed of the approaching wind at the same height z above ground. All model results have been scaled to the full-scale values.
Figure 5 shows the topographic factors with height at the location of the transmission tower #141 at the considered wind direction. When the wind approached from the N, NNE, and NNW, the mountains slowed down the wind in a certain region (below about 100m). From this level
Figure 2. Location of collapsed towersFigure 3. Topographic model mounted on
the boundary layer wind tunnel
Figure 4. Convention of wind
directions tested
•\ 452•\
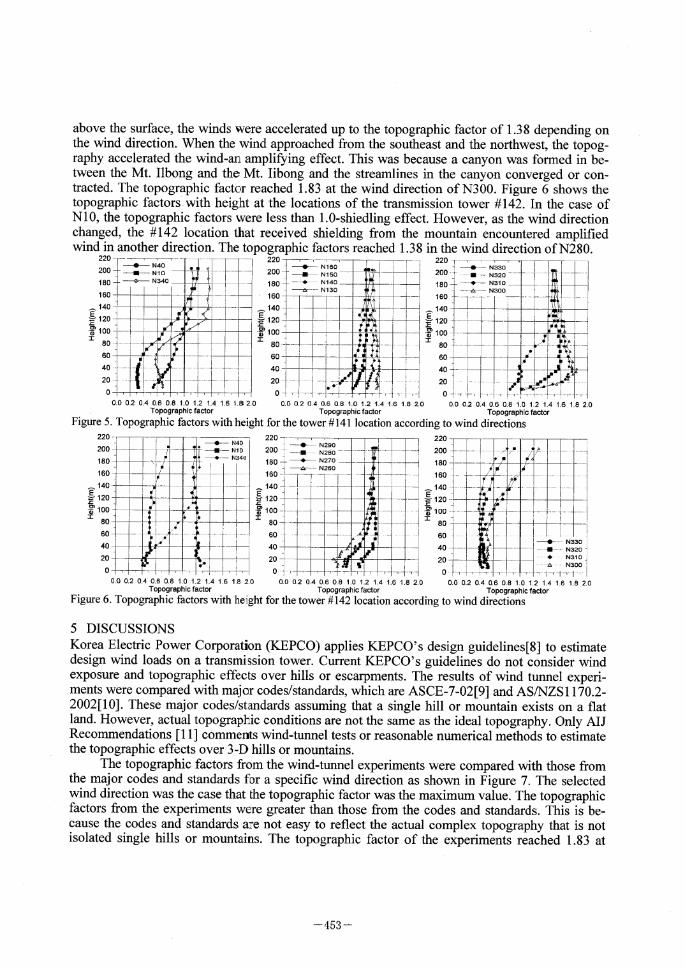
above the surface, the winds were accelerated up to the topographic factor of 1.38 depending on the wind direction. When the wind approached from the southeast and the northwest, the topog-raphy accelerated the wind-an amplifying effect. This was because a canyon was formed in be-tween the Mt. Ilbong and the Mt. Iibong and the streamlines in the canyon converged or con-tracted. The topographic factor reached 1.83 at the wind direction of N300. Figure 6 shows the topographic factors with height at the locations of the transmission tower #142 . In the case of N10, the topographic factors were less than 1.0-shiedling effect. However, as the wind direction
changed, the #142 location that received shielding from the mountain encountered amplified wind in another direction. The topographic factors reached 1.38 in the wind direction of N280.
Figure 5. Topographic factors with height for the tower #141 location according to wind directions
Figure 6. Topographic factors with height for the tower #142 location according to wind directions
5 DISCUSSIONS Korea Electric Power Corporation (KEPCO) applies KEPCO's design guidelines[8] to estimate design wind loads on a transmission tower. Current KEPCO's guidelines do not consider wind exposure and topographic effects over hills or escarpments. The results of wind tunnel experi-ments were compared with major codes/standards, which are ASCE-7-02[9] and AS/NZS 1170.2-2002[101 These major codes/standards assuming that a single hill or mountain exists on a flat land. However, actual topographic conditions are not the same as the ideal topography. Only AIJ Recommendations [111 comments wind-tunnel tests or reasonable numerical methods to estimate the topographic effects over 3-D hills or mountains.
The topographic factors from the wind-tunnel experiments were compared with those from the major codes and standards for a specific wind direction as shown in Figure 7. The selected wind direction was the case that the topographic factor was the maximum value. The topographic factors from the experiments were greater than those from the codes and standards. This is be-cause the codes and standards are not easy to reflect the actual complex topography that is not isolated single hills or mountains. The topographic factor of the experiments reached 1.83 at
―453―
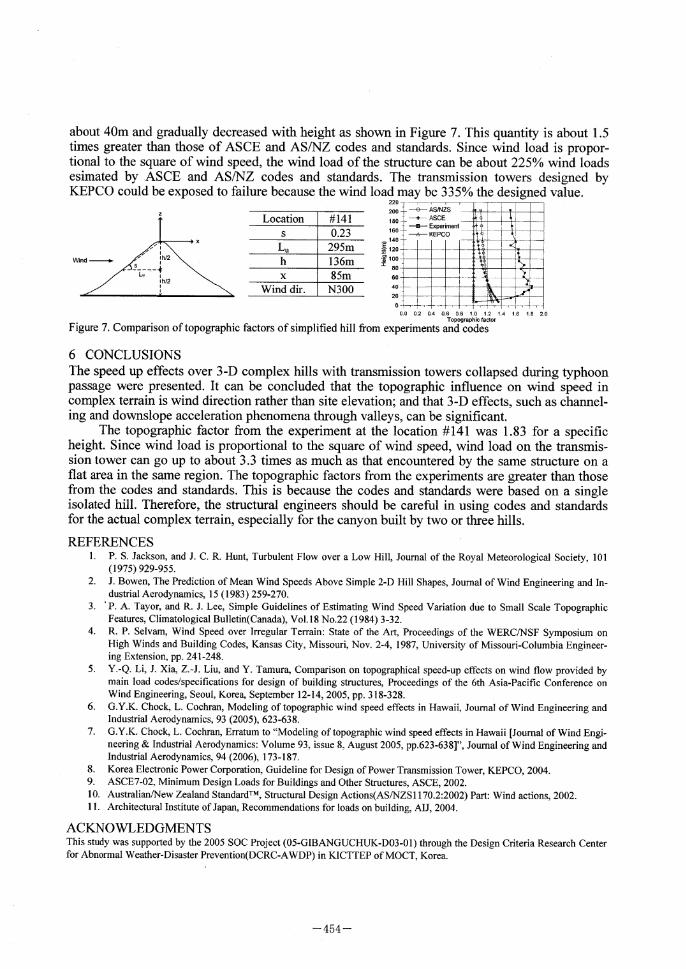
about 40m and gradually decreased with height as shown in Figure 7. This quantity is about 1.5 times greater than those of ASCE and AS/NZ codes and standards. Since wind load is propor-
tional to the square of wind speed, the wind load of the structure can be about 225% wind loads esimated by ASCE and AS/NZ codes and standards. The transmission towers designed by KEPCO could be exposed to failure because the wind load may be 335% the designed value.
r igure I. Lomparison of topographic tactors of simplified hill from experiments and codes
6 CONCLUSIONS
The speed up effects over 3-D complex hills with transmission towers collapsed during typhoon
passage were presented. It can be concluded that the topographic influence on wind speed in complex terrain is wind direction rather than site elevation; and that 3-D effects, such as channel-ing and downslope acceleration phenomena through valleys, can be significant.
The topographic factor from the experiment at the location #141 was 1.83 for a specific height. Since wind load is proportional to the square of wind speed, wind load on the transmis-sion tower can go up to about 3.3 times as much as that encountered by the same structure on a flat area in the same region. The topographic factors from the experiments are greater than those from the codes and standards. This is because the codes and standards were based on a single isolated hill. Therefore, the structural engineers should be careful in using codes and standards
for the actual complex terrain, especially for the canyon built by two or three hills.
REFERENCES 1. P. S. Jackson, and J. C. R. Hunt, Turbulent Flow over a Low Hill, Journal of the Royal Meteorological Society, 101
(1975) 929-955. 2. J. Bowen, The Prediction of Mean Wind Speeds Above Simple 2-D Hill Shapes, Journal of Wind Engineering and In-
dustrial Aerodynamics, 15 (1983) 259-270. 3. ' P. A. Tayor, and R. J. Lee, Simple Guidelines of Estimating Wind Speed Variation due to Small Scale Topographic
Features, Climatological Bulletin(Canada), Vol.18 No.22 (1984) 3-32. 4. R. P. Selvam, Wind Speed over Irregular Terrain: State of the Art, Proceedings of the WERC/NSF Symposium on
High Winds and Building Codes, Kansas City, Missouri, Nov. 2-4, 1987, University of Missouri-Columbia Engineer- ing Extension, pp. 241-248.
5. Y.-Q. Li, J. Xia, Z.-J. Liu, and Y. Tamura, Comparison on topographical speed-up effects on wind flow provided by main load codes/specifications for design of building structures, Proceedings of the 6th Asia-Pacific Conference on Wind Engineering, Seoul, Korea, September 12-14, 2005, pp. 318-328.
6. G.Y.K. Chock, L. Cochran, Modeling of topographic wind speed effects in Hawaii, Journal of Wind Engineering and Industrial Aerodynamics, 93 (2005), 623-638.
7. G.Y.K. Chock, L. Cochran, Erratum to "Modeling of topographic wind speed effects in Hawaii [Journal of Wind Engi- neering & Industrial Aerodynamics: Volume 93, issue 8, August 2005, pp.623-638]", Journal of Wind Engineering and
Industrial Aerodynamics, 94 (2006), 173-187. 8. Korea Electronic Power Corporation, Guideline for Design of Power Transmission Tower, KEPCO, 2004.
9. ASCE7-02, Minimum Design Loads for Buildings and Other Structures, ASCE, 2002. 10. Australian/New Zealand StandardTM, Structural Design Actions(AS/NZS1170.2:2002) Part: Wind actions, 2002.
11. Architectural Institute of Japan, Recommendations for loads on building, AIJ, 2004.
ACKNOWLEDGMENTS This study was supported by the 2005 SOC Project (05-GIBANGUCHUK-D03-01) through the Design Criteria Research Center for Abnormal Weather-Disaster Prevention(DCRC-AWDP) in KICTTEP of MOCT, Korea.
―454―
The Fourth International Symposium on
Computational Wind Engineering(CWE2006), Yokohama, 2006
Numerical Simulation of Unsteady 3-D F around
a Yawed and Inclined Circular Cylinder
DongHun Yeoa & Nicholas P. Jones b
'University of Illinois at Urbana-Champaign, 205 N. Mathews Ave. Urbana, IL, USA 'johns Hopkins University, 3400 N. Charles St. Baltimore, MD, USA
ABSTRACT: A three-dimensional Detached Eddy Simulation (DES) study was conducted to in-vestigate the three-dimensional characteristics of the fully-developed flow past a yawed and in-clined circular cylinder. We simulated the flow at Reynolds number (Re) of 1.4 x 10⁵ (based on freestream velocity U and the diameter of the cylinder D) over a cylinder with an axial length of 20D. The simulation shows that swirling flow structures with low pressure are developed along the cylinder axis. As a result, a fluctuating force is generated on the cylinder surface with fre-quency much lower than that of Karman vortex shedding.
KEYWORDS: yawed and inclined circular cylinder, DES, three-dimensional flow.
1 INTRODUCTION
Flow oblique to a bluff body has complex three-dimensional characteristics due to both the flow structures and the geometry of the body. The flow past a yawed and inclined circular cylinder has been of significant interest to the engineering community. One of the applications is large-amplitude and low-frequency vibration of the stays of cable-stayed bridges induced by oblique wind. Much research on the excitation mechanism has been conducted, but complete understand-ing of the underlying mechanism remains elusive.
Theoretical and experimental studies in early research attempted to show that the flow around a yawed cylinder can be associated with that of a non-yawed cylinder by the component of the freestream flow normal to the cylinder axis [1]. This is known as the Independence Principle or the Cosine Rule. Several experimental investigations assessed deviations from the prediction of the Independence Principle [2]. However, experiments have inherent difficulties in identifying and visualizing the three-dimensional complex flow structures around an oblique cylinder.
Numerical studies of the phenomenon have been restricted to low Reynolds number flows due to the availability of computational resources and appropriate numerical methods. Kawamura and Hayashi [3] simulated the flow around a yawed circular cylinder at Re = 2,000 based on a finite difference method (FDM) and observed a significant effect of spanwise boundary conditions. Lu-cor and Karniadakis [4] applied direct numerical simulation (DNS) to study of flow past a yawed circular cylinder at Re = 1,000 and presented a flow structure that featured traveling inclined "braids"; de-tailed explanations, however, were not provided.
To overcome the limitations from both experiments and numerical simulations, we apply the three-dimensional DES approach to a simulation of the flow. DES enables simulation of un-steady three-dimensional flow at high Reynolds number while maintaining reasonable computa-tional requirements to improve the understanding of the complex characteristics of the flow.
While there have been many efforts to investigate the characteristics of cylinder flow, this is, to the authors' knowledge, the first study to focus on the three-dimensional characteristics of the fully-developed flow at high Reynolds number around a yawed and inclined circular cylinder us-ing numerical simulation.
―455―
2 NUMERICAL SIMULATION
2.1 Spalart-Allmaras DES approach
Spalart et al. [5] developed the concept of DES, which is a hybrid method of combining the strengths of Reynolds-Averaged Navier Stokes equations (RANS) in the boundary layer region and of Large Eddy Simulation (LES) in the highly separated flow region by modifying the turbu-lence length scale in the Spalart-Allmaras (S-A) RANS turbulence model. The transition between RANS and LES is controlled by the grid spacing and the wall distance. The RANS region in DES alleviates the near-wall resolution requirement, and therefore DES can simulate highly separated flows at high Reynolds numbers at a manageable computational cost.
2.2 Definition of angles
The definitions of yaw and inclination angle of a cylinder are shown in Figure 1. The yaw angle /3 is defined herein as the angle between a horizontally skewed cylinder and an axis oriented normal to the incoming flow, and the inclination angle 8 is defined as the angle between a ver-tically sloued cylinder and its horizontal axis.
Figure 1. A yawed and inclined cylinder
2.3 Numerical Methods
Three-dimensional DES with the S-A DES model was conducted for a flow at Re=140,000 past a
yawed and inclined circular cylinder using the WIND-US CFD code [6]. The code uses a cell-vortexed finite-volume approach and has been being developed by the NPARC (National Project for Application-oriented Research in CFD) Alliance.
The computational domain had an extent of 40D in the streamwise direction (20D each in the upstream and downstream region), 40D in the cross-stream direction (20D from the center of the cylinder to the top and bottom side), and 20D cylinder length in the spanwise direction.
The simulation employed a constant velocity for the upstream boundary, zeroth order extrapo-lation with fixed static pressure for the downstream boundary, inviscid condition for the top and bottom boundary, and periodic condition for the spanwise wall boundary to avoid end effects, which potentially significantly affect three-dimensional flow structures. Since the first grid nor-mal to the cylinder surface was located around wall unit y{ (this non-dimensional viscous length scale is based on the viscosity and wall shear stress of a flow) of 1, a no-slip condition on the surface was employed without wall treatments. A spanwise grid AZ in the global cross-stream dimension was 0.1D. 129 grids were employed on the cylinder surface along the perime-ter; The total size of the grids was about 3.0 x 10⁶ elements. The numerical scheme used a 5th order upwind scheme for convection, a 2nd order central scheme for viscosity, and a two-step MacCormack implicit scheme for time integration with 4 Newton sub-iterations per timestep. A non-dimensional timestep of 0.01 (calculated as At = Ut/D) was used. The simulation assumed turbulent separation from the cylinder surface, and the analysis did not consider the issue of boundary layer transition: the Re of 140,000 is in the sub-critical range.
―456―
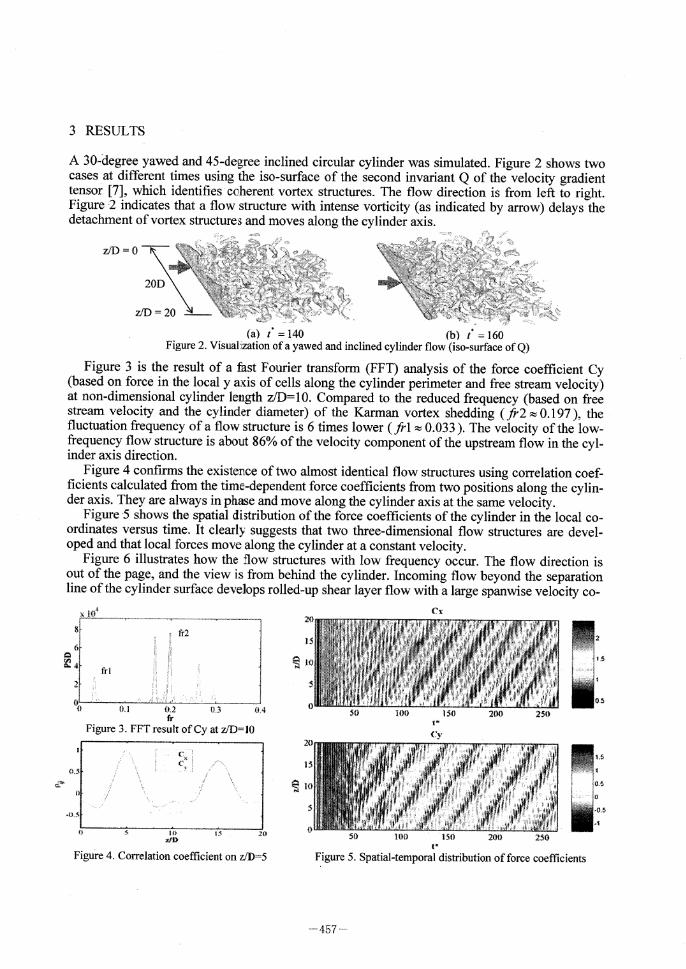
3 RESULTS
A 30-degree yawed and 45-degree inclined circular cylinder was simulated . Figure 2 shows two cases at different times using the iso-surface of the second invariant Q of the velocity gradient tensor [7], which identifies coherent vortex structures. The flow direction is from left to right . Figure 2 indicates that a flow structure with intense vorticity (as indicated by arrow) delays the detachment of vortex structures and moves along the cylinder axis.
(a) t* = 140(b) t* = 160 Figure 2. Visualization of a yawed and inclined cylinder flow (iso-surface of Q)
Figure 3 is the result of a fast Fourier transform (FFT) analysis of the force coefficient Cy (based on force in the local y axis of cells along the cylinder perimeter and free stream velocity) at non-dimensional cylinder length z/D=10. Compared to the reduced frequency (based on free stream velocity and the cylinder diameter) of the Karman vortex shedding (fr2 0.197 }, the fluctuation frequency of a flow structure is 6 times lower (frl 0.033 ). The velocity of the low-frequency flow structure is about 86% of the velocity component of the upstream flow in the cyl-inder axis direction.
Figure 4 confirms the existence of two almost identical flow structures using correlation coef-ficients calculated from the time-dependent force coefficients from two positions along the cylin-der axis. They are always in phase and move along the cylinder axis at the same velocity .
Figure 5 shows the spatial distribution of the force coefficients of the cylinder in the local co-ordinates versus time. It clearly suggests that two three-dimensional flow structures are devel-oped and that local forces move along the cylinder at a constant velocity .
Figure 6 illustrates how the flow structures with low frequency occur. The flow direction is out of the page, and the view is from behind the cylinder . Incoming flow beyond the separation line of the cylinder surface develops rolled-up shear layer flow with a large spanwise velocity co-
Figure 3. FFT result of Cy at z/D=10
Figure 4. Correlation coefficient on z/D=5 Figure 5. Spatial-temporal distribution of force coefficients
―457―
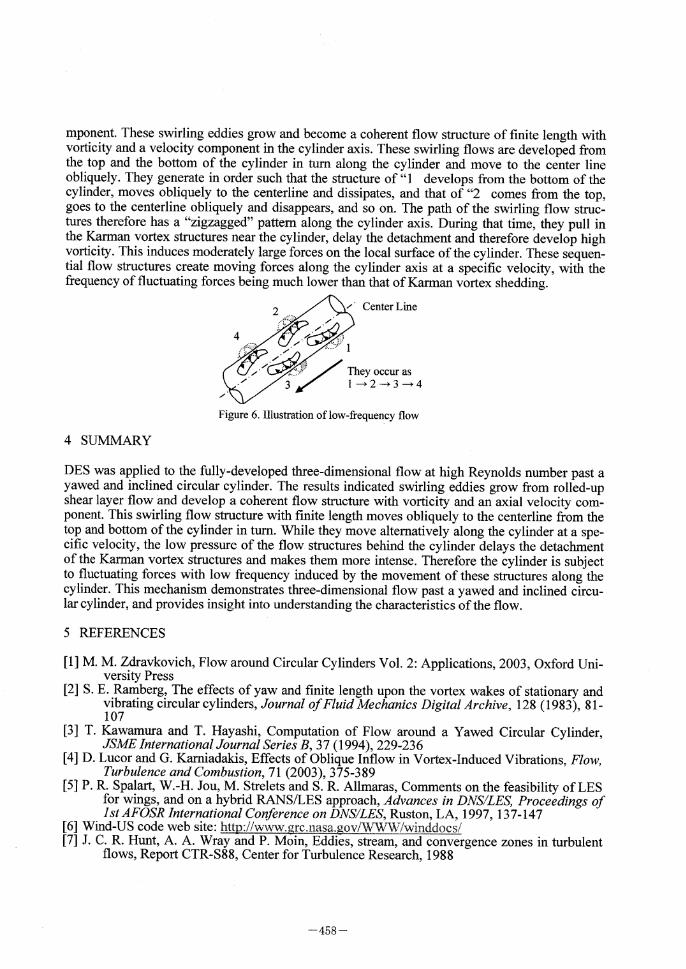
mponent. These swirling eddies grow and become a coherent flow structure of finite length with vorticity and a velocity component in the cylinder axis. These swirling flows are developed from the top and the bottom of the cylinder in turn along the cylinder and move to the center line obliquely. They generate in order such that the structure of "1 develops from the bottom of the cylinder, moves obliquely to the centerline and dissipates, and that of "2 comes from the top , goes to the centerline obliquely and disappears, and so on. The path of the swirling flow struc-tures therefore has a "zigzagged" pattern along the cylinder axis. During that time, they pull in the Karman vortex structures near the cylinder, delay the detachment and therefore develop high vorticity. This induces moderately large forces on the local surface of the cylinder . These sequen-tial flow structures create moving forces along the cylinder axis at a specific velocity , with the frequency of fluctuating forces being much lower than that of Karman vortex shedding .
Figure 6. Illustration of low-frequency flow
4 SUMMARY
DES was applied to the fully-developed three-dimensional flow at high Reynolds number past a yawed and inclined circular cylinder. The results indicated swirling eddies grow from rolled-up shear layer flow and develop a coherent flow structure with vorticity and an axial velocity com-ponent. This swirling flow structure with finite length moves obliquely to the centerline from the top and bottom of the cylinder in turn. While they move alternatively along the cylinder at a spe-cific velocity, the low pressure of the flow structures behind the cylinder delays the detachment of the Karman vortex structures and makes them more intense. Therefore the cylinder is subject to fluctuating forces with low frequency induced by the movement of these structures along the cylinder. This mechanism demonstrates three-dimensional flow past a yawed and inclined circu-lar cylinder, and provides insight into understanding the characteristics of the flow.
5 REFERENCES
[1] M. M. Zdravkovich, Flow around Circular Cylinders Vol. 2: Applications, 2003, Oxford Uni- versity Press
[2] S. E. Ramberg, The effects of yaw and finite length upon the vortex wakes of stationary and vibrating circular cylinders, Journal of Fluid Mechanics Digital Archive, 128 (1983), 81- 107
[3] T. Kawamura and T. Hayashi, Computation of Flow around a Yawed Circular Cylinder, JSME International Journal Series B, 37 (1994), 229-236
[4] D. Lucor and G. Karniadakis, Effects of Oblique Inflow in Vortex-Induced Vibrations, Flow, Turbulence and Combustion, 71 (2003), 375-389
[5] P. R. Spalart, W.-H. Jou, M. Strelets and S. R. Allmaras, Comments on the feasibility of LES for wings, and on a hybrid RANS/LES approach, Advances in DNS/LES, Proceedings of
1st AFOSR International Conference on DNS/LES, Ruston, LA, 1997, 137-147 [6] Wind-US code web site: htt ://www.grc. nasa. o /WWW /winddocs/[7] J. C. R. Hunt, A. A. Wray and P. Moin, Eddies, stream, and convergence zones in turbulent
flows, Report CTR-S88, Center for Turbulence Research, 1988
―458―
Related Documents


![[BS en 13084-2-2007] -- Free-standing Chimneys. Concrete Chimneys](https://static.cupdf.com/doc/110x72/577c7e1f1a28abe054a09ebb/bs-en-13084-2-2007-free-standing-chimneys-concrete-chimneys.jpg)