INTERACTION BETWEEN LEGIONELLA PNEUMOPHILA AND BIOFILM FORMING ORGANISM PSEUDOMONAS AERUGINOSA WON CHOONG YUN (B.Sc. (Hons.), NUS) A THESIS SUBMITTED FOR THE DEGREE OF MASTER OF SCIENCE DEPARTMENT OF MICROBIOLOGY NATIONAL UNIVERSITY OF SINGAPORE 2006

Welcome message from author
This document is posted to help you gain knowledge. Please leave a comment to let me know what you think about it! Share it to your friends and learn new things together.
Transcript

INTERACTION BETWEEN LEGIONELLA PNEUMOPHILA
AND BIOFILM FORMING ORGANISM
PSEUDOMONAS AERUGINOSA
WON CHOONG YUN
(B.Sc. (Hons.), NUS)
A THESIS SUBMITTED
FOR THE DEGREE OF MASTER OF SCIENCE
DEPARTMENT OF MICROBIOLOGY
NATIONAL UNIVERSITY OF SINGAPORE
2006

Acknowledgements
Department of Microbiology, NUS i
Acknowledgements
I would like to express my heartfelt gratitude to the following people who have
made a difference in my life during the course of this study:
A/Prof Lee Yuan Kun for his invaluable guidance, constant encouragement and
patience throughout the course of this study.
Dr Gamini Kumarasinghe from the Department of Laboratory Medicine, National
University Hospital, A/Prof Zhang Lian Hui from Institute of Molecular and Cell
Biology, and A/Prof Tim Tolker-Nielsen from BioCentrum-DTU, The Technical
University of Denmark, for kindly providing bacterial strains for this study.
Mr Ma Xi from Nalco Company for his invaluable advice, generous assistance
and constant concern. Dr Chen Hui and Mr Tim Lim, also from Nalco Company,
for their generous sharing of experiences and gracious assistance.
Mr Low Chin Seng for his precious technical assistance and for being a fatherly-
figure in a laboratory setting. Mdm Chew Lai Meng for her encouragement and
warm friendship.
Ho Phui San, Lee Hui Cheng, Wang Shugui and especially Chow Wai Ling and
Janice Yong Jing Ying for their generous help, precious friendship and incredible
understanding when absentmindedness get the better of me. Post-graduate life has
never been better without them!

Acknowledgements
Department of Microbiology, NUS ii
Toh Yi Er and Lee Kong Heng from Confocal Microscopy Unit, and Toh Kok Tee
from Flow Cytometry Unit for their invaluable technical assistance.
My family and husband, Clement Choo, for their generous love, unwavering
support and relentless encouragement through difficult time of my life. Especially
my father, for his thought-provoking discussions and tremendous help in software
improvements for this study. My son for sharing his precious life with me.

Table of Contents
Department of Microbiology, NUS iii
Table of Contents
Acknowledgements i
Table of Contents iii
List of Tables x
List of Figures xi
List of Abbreviations xv
Summary xvii
Chapter 1: Introduction 1
Chapter 2: Literature Review 5
2.1 Legionella 5
2.1.1 Introduction to Legionella 5
2.1.2 General characteristics of Legionella 5
2.1.3 Taxonomy of Legionella 7
2.1.4 Legionella and Diseases 8
2.1.4.1 Clinical presentation 8
2.1.4.2 Diagnosis 9
2.1.4.3 Epidemiology 10
2.1.4.4 Epidemiology in Singapore 13
2.1.4.5 Treatment 15
2.1.5 Ecology of Legionella 16
2.1.5.1 Natural and man-made habitats 16
2.1.5.2 Distribution of Legionella in Singapore 18
2.1.5.3 Association of Legionella with protozoa 19
2.1.5.4 Association of Legionella with biofilm 21

Table of Contents
Department of Microbiology, NUS iv
2.1.5.5 Interaction of Legionella with Pseudomonas spp. 24
2.2 Biofilm 24
2.2.1 Introduction to biofilm 24
2.2.2 General characteristics of biofilm 25
2.2.3 Biofilm development 26
2.2.4 Stages of biofilm development 27
2.2.4.1 Stage 1: Reversible attachment 27
2.2.4.2 Stage 2: Irreversible attachment 28
2.2.4.3 Stage 3: Maturation-1 29
2.2.4.4 Stage 4: Maturation-2 29
2.2.4.5 Stage 5: Dispersion 30
2.2.5 Determinants of biofilm structure 31
2.2.6 Microbial diversity of biofilms 33
2.2.7 Microbial positioning in biofilm 34
2.3 Prevention of legionellosis 35
2.3.1 Control of legionellosis 35
2.3.2 Detection of Legionella 36
2.3.3 Risk assessment of cooling tower for Legionnaires’ disease
outbreaks 37
2.3.4 Water treatment in cooling towers 38
Chapter 3: Materials and Methods 41
3.1 Bacterial strains and culture 41
3.1.1 Bacterial Strains 41
3.1.2 Culture Media 41

Table of Contents
Department of Microbiology, NUS v
3.1.3 Maintenance of stock cultures 42
3.2 Growth kinetic studies 42
3.2.1 Growth kinetics of L. pneumophila 42
3.2.2 Growth kinetics of P. aeruginosa PAO1 43
3.2.3 Growth kinetics of P. aeruginosa PAO1-CFP 43
3.3 Determination of the influent flow rate (Q) for continuous culture in
CDC Biofilm Reactor (CBR) 43
3.4 Optimization of labelling processes 44
3.4.1 Optimization of L. pneumophila labelling with CFDA-SE 44
3.4.2 Optimization of planktonic P. aeruginosa PAO1-CFP labelling
with PI 44
3.4.3 Flow cytometry 45
3.4.4 Optimization of P. aeruginosa PAO1-CFP biofilm labelling with PI 45
3.5 P. aeruginosa PAO1-CFP biofilm formation in CDC Biofilm Reactor
(CBR) 46
3.5.1 CDC Biofilm Reactor 46
3.5.2 Setup of CDC Biofilm Reactor assembly 47
3.5.3 P. aeruginosa PAO1-CFP biofilm formation 48
3.6 Introduction of L. pneumophila into P. aeruginosa PAO1-CFP biofilms 50
3.7 Introduction of NALCO 7320 into developing and mature
P. aeruginosa PAO1-CFP biofilms containing L. pneumophila 51
3.8 Monitoring of each organism in CBR continuous flow system 52
3.8.1 Preparation for sampling 52
3.8.2 Taking samples 52
Table of Contents
Department of Microbiology, NUS vi
3.8.2.1 Sampling bulk fluid 52
3.8.2.2 Sampling biofilm 53
3.8.3 Preparation of coupons 53
3.8.3.1 Preparation of coupons intended for enumeration 53
3.8.3.2 Preparation of coupons intended for visualization by CLSM 53
3.8.4 Disaggregation by homogenization 54
3.8.5 Enumeration of each organism 55
3.8.5.1 Enumeration of P. aeruginosa PAO1-CFP by culture 55
3.8.5.2 Enumeration of L. pneumophila by immunofluorescence 56
3.8.6 Detection of exogenous contaminants 58
3.8.7 Visualization and image acquisition by CLSM 59
3.8.8 Application of COMSTAT image analysis software package 60
3.8.8.1 Preparation of image stacks 60
3.8.8.2 Thresholding of images 61
3.8.8.3 COMSTAT image analysis for P. aeruginosa PAO1-CFP
biofilm structure 61
3.8.8.4 COMSTAT image analysis for porosity of P. aeruginosa
PAO1-CFP biofilm 63
3.8.8.5 COMSTAT image analysis for L. pneumophila distribution 64
3.8.9 Statistical analysis 65
3.9 Screening for effective P. aeruginosa PAO1 biofilm-removing agent 65
3.9.1 Kinetics of P. aeruginosa PAO1 biofilm formation in microtiter
plate 65
3.9.2 Quantification of biofilm 66

Table of Contents
Department of Microbiology, NUS vii
3.9.3 Biofilm-removing agents used 67
3.9.4 P. aeruginosa PAO1 biofilm removal screening 68
3.10 Antimicrobial susceptibility testing of NALCO 7320 69
Chapter 4: Results 70
4.1 Growth kinetics 70
4.2 Determination of the influent flow rate (Q) for continuous culture in CDC
Biofilm Reactor (CBR) 72
4.3 Optimization of labelling processes 74
4.3.1 Optimization of L. pneumophila labelling with CFDA-SE 74
4.3.2 Optimization of planktonic P. aeruginosa PAO1-CFP labelling
with PI 75
4.3.3 Optimization of P. aeruginosa PAO1-CFP biofilm labelling with PI 77
4.4 Kinetics of P. aeruginosa PAO1-CFP biofilm formation in CDC
Biofilm Reactor (CBR) 80
4.4.1 Kinetics of biofilm formation 80
4.4.2 Structure of biofilm by image analysis 81
4.4.3 Detachment of biofilm 85
4.5 Introduction of L. pneumophila to developing and mature P. aeruginosa
PAO1-CFP biofilms 87
4.5.1 Adhesion and persistence of L. pneumophila in developing and
mature biofilms 87
4.5.2 Distributions of L. pneumophila cells in developing and mature
biofilms 90
4.5.3 Bio-volume distributions of developing and mature biofilms 95

Table of Contents
Department of Microbiology, NUS viii
4.5.4 Surface-to-biovolume ratio distributions of developing and
mature biofilms 97
4.5.5 Porosity distributions of developing and mature biofilms 100
4.5.6 Correlation between SBR and porosity 103
4.5.7 Correlation between legionellae adhesion and parameters of
P. aeruginosa PAO1-CFP biofilm 104
4.5.8 Localization of L. pneumophila in P. aeruginosa PAO1-CFP
biofilms 105
4.6 Screening for effective P. aeruginosa PAO1 biofilm removing agent 108
4.6.1 Kinetics of P. aeruginosa PAO1 biofilm formation in microtiter
plate 108
4.6.2 P. aeruginosa PAO1 biofilm removal screening 109
4.7 Characterization of NALCO 7320 111
4.7.1 Kinetics of P. aeruginosa PAO1 biofilm removal 111
4.7.2 Antimicrobial susceptibility testing 112
4.8 Introduction of NALCO 7320 into developing and mature P. aeruginosa
PAO1-CFP biofilms containing L. pneumophila 114
4.8.1 Persistence of P. aeruginosa PAO1-CFP in CBR 114
4.8.2 Structure of P. aeruginosa PAO1-CFP biofilms treated by NALCO
7320 115
4.8.3 Persistence of L. pneumophila in P. aeruginosa PAO1-CFP biofilms
treated with NALCO 7320 120
4.8.4 Distribution of L. pneumophila in P. aeruginosa PAO1-CFP biofilms
treated with NALCO 7320 123

Table of Contents
Department of Microbiology, NUS ix
4.8.5 Bio-volume distributions of developing and mature biofilms treated
with NALCO 7320 125
4.8.6 Porosity distributions of P. aeruginosa PAO1-CFP biofilms treated
with NALCO 7320 127
Chapter 5: Discussion 130
References 147
Appendix 175

List of Tables
Department of Microbiology, NUS x
List of Tables
Table 3.1. Table 3.2. Table 4.1. Table 4.2. Table 4.3. Table 4.4. Table 4.5. Table 4.6. Table 4.7. Table 4.8. Table 4.9.
Sampling points of 6 independent experiments for the study of P. aeruginosa PAO1-CFP biofilm formation. List of biofilm-removing agents used. Effect of treatment duration on staining and viability of L. pneumophila cells. Effect of treatment duration on staining of P. aeruginosa PAO1-CFP cells. Table showing Pearson’s correlation between Log (Number of L. pneumophila cells) and Log (Number of CFDA pixels per µm3). The ratio of SBR at the bottom 20% versus the top 20% of developing and mature biofilm. Comparing means of porosity over time. Table showing Pearson’s correlation between porosity and SBR. Table showing Pearson’s correlation between legionellae adhesion to P. aeruginosa PAO1-CFP biofilm (representing the number of legionellae per coupon per 106 legionellae inoculated into CBR) and parameters of the biofilm. Efficacy of biofilm removing agents. Table showing Pearson’s correlation between bio-volume and legionellae loss.
49 68 74 76 92 100 101 103 104 110 122

List of Figures
Department of Microbiology, NUS xi
List of Figures Figure 3.1. Figure 4.1. Figure 4.2. Figure 4.3. Figure 4.4. Figure 4.5. Figure 4.6. Figure 4.7. Figure 4.8. Figure 4.9.
Schematic diagram of the CDC Biofilm Reactor assembly. Growth curve of L. pneumophila cultured in BCYE broth at 37°C with shaking at 120rpm. Growth curve of P. aeruginosa PAO1 cultured in MM liquid media at 30°C with shaking at 120rpm. Growth curve of P. aeruginosa PAO1-CFP cultured in MM liquid media at 30°C with shaking at 120rpm. Graph of Ln(OD600nm) against time (hr) plotted for the exponential growth phase of P. aeruginosa PAO1-CFP. Histograms illustrating the number of events (cells) plotted against FL1-H (representing green fluorescence of CFDA-stained cells) for L. pneumophila cells that were (A) mock treated, or treated with CFDA-SE for (B) 20mins, (C) 30mins, or (D) 40mins. Histograms illustrating the number of events (cells) plotted against PMT4 Log (representing red fluorescence of PI-stained cells) for P. aeruginosa PAO1-CFP cells that were (A) mock treated, or treated with 1.0mg/ml PI for (B) 5mins, (C) 10mins, or (D) 15mins. Histograms illustrating the number of events (cells) plotted against PMT4 Log (representing red fluorescence of PI-stained cells) for P. aeruginosa PAO1-CFP cells that were (A) mock treated, or treated with 0.1mg/ml PI for (B) 5mins, (C) 10mins, (D) 15mins, or (E) 30mins. CLSM images of a 7 days old P. aeruginosa PAO1-CFP biofilm and adhered L. pneumophila, stained with 0.1mg/ml PI for 5mins: (A) P. aeruginosa PAO1-CFP biofilm (blue fluorescence), (B) CFDA-stained L. pneumophila (green fluorescence), (C) PI-stained P. aeruginosa PAO1-CFP biofilm, and (D) overlapping display of the above 3 images. CLSM images of a 7 days old P. aeruginosa PAO1-CFP biofilm and adhered L. pneumophila, stained with 0.1mg/ml PI for 15mins: (A) P. aeruginosa PAO1-CFP biofilm (blue fluorescence), (B) CFDA-stained L. pneumophila (green fluorescence), (C) PI-stained P. aeruginosa PAO1-CFP biofilm, and (D) overlapping
47 70 71 71 72 74 75 76 77 78

List of Figures
Department of Microbiology, NUS xii
Figure 4.10. Figure 4.11. Figure 4.12. Figure 4.13. Figure 4.14. Figure 4.15. Figure 4.16. Figure 4.17. Figure 4.18. Figure 4.19. Figure 4.20. Figure 4.21. Figure 4.22.
display of the above 3 images. CLSM images of a 7 days old P. aeruginosa PAO1-CFP biofilm and adhered L. pneumophila, stained with 0.1mg/ml PI for 30mins: (A) P. aeruginosa PAO1-CFP biofilm (blue fluorescence), (B) CFDA-stained L. pneumophila (green fluorescence), (C) PI-stained P. aeruginosa PAO1-CFP biofilm, and (D) overlapping display of the above 3 images. Viable cell counts of P. aeruginosa PAO1-CFP biofilm formed in CBR at 30°C with stirring at 120rpm. Bio-volume of P. aeruginosa PAO1-CFP biofilm formed in CBR at 30°C with stirring at 120rpm. Average thickness of P. aeruginosa PAO1-CFP biofilm formed in CBR at 30°C with stirring at 120rpm. Maximum thickness of P. aeruginosa PAO1-CFP biofilm formed in CBR at 30°C with stirring at 120rpm. Substratum coverage of P. aeruginosa PAO1-CFP biofilm formed in CBR at 30°C with stirring at 120rpm. Surface-to-biovolume ratio (SBR) of P. aeruginosa PAO1-CFP biofilm formed in CBR at 30°C with stirring at 120rpm. Roughness coefficient of P. aeruginosa PAO1-CFP biofilm formed in CBR at 30°C with stirring at 120rpm. Viable cell counts of planktonic P. aeruginosa PAO1-CFP in the bulk fluid of CBR at 30°C with stirring at 120rpm. CLSM image of a P. aeruginosa PAO1-CFP biofilm (blue) structure indicative of dispersion stage of biofilm development, with adhered L. pneumophila (green). Adhesion of L. pneumophila to different developmental stages of P. aeruginosa PAO1-CFP biofilm. Status of L. pneumophila in our continuous flow CBR system. Persistence of L. pneumophila in P. aeruginosa PAO1-CFP biofilm.
79 80 82 82 83 83 84 84 85 86 87 89 89

List of Figures
Department of Microbiology, NUS xiii
Figure 4.23. Figure 4.24. Figure 4.25. Figure 4.26. Figure 4.27. Figure 4.28. Figure 4.29. Figure 4.30. Figure 4.31. Figure 4.32. Figure 4.33. Figure 4.34. Figure 4.35. Figure 4.36. Figure 4.37.
Distribution of L. pneumophila in (A) developing, and (B) mature P. aeruginosa PAO1-CFP biofilms. Percentage loss of L. pneumophila in developing P. aeruginosa PAO1-CFP biofilm. Percentage loss of L. pneumophila in mature P. aeruginosa PAO1-CFP biofilm. Bio-volume distribution of (A) developing, and (B) mature P. aeruginosa PAO1-CFP biofilms. Surface-to-biovolume ratio (SBR) distribution of (A) developing, and (B) mature P. aeruginosa PAO1-CFP biofilms. Porosity of P. aeruginosa PAO1-CFP biofilm. Porosity distribution of (A) developing, and (B) mature P. aeruginosa PAO1-CFP biofilms. Scatterplot of porosity and SBR both obtained from all data of 6 independent experiments. CLSM images of P. aeruginosa PAO1-CFP biofilm (blue) with adhered L. pneumophila (green) taken on different occasions: (A) 3hrs after legionellae introduction to developing biofilm (3-days-old), (B) 4 days after legionellae introduction to developing biofilm, (C) 3hrs after legionellae introduction to mature biofilm (7-days-old), and (D) 4 days after legionellae introduction to mature biofilm. Kinetics of P. aeruginosa PAO1 biofilm formation in microtitre plate at 30°C. Highest percentage biofilm removal of various biofilm-removing agents. Kinetics of biofilm removal by NALCO 7320. Visual determination of minimum inhibitory concentration (MIC). Determination of minimum bactericidal concentration (MBC) of NALCO 7320. Viable cell counts of P. aeruginosa PAO1-CFP biofilms
93 94 94 96 99 101 102 103 107 108 109 111 113 113 114

List of Figures
Department of Microbiology, NUS xiv
Figure 4.38. Figure 4.39. Figure 4.40. Figure 4.41. Figure 4.42. Figure 4.43. Figure 4.44. Figure 4.45. Figure 4.46. Figure 4.47. Figure 4.48. Figure 4.49. Figure 4.50. Figure 4.51.
treated with NALCO 7320. Viable cell counts of planktonic P. aeruginosa PAO1-CFP in CBR treated with NALCO 7320. Bio-volume of P. aeruginosa PAO1-CFP biofilm in CBR treated with NALCO 7320. Average thickness of P. aeruginosa PAO1-CFP biofilm in CBR treated with NALCO 7320. Maximum thickness of P. aeruginosa PAO1-CFP biofilm in CBR treated with NALCO 7320. Substratum coverage of P. aeruginosa PAO1-CFP biofilm in CBR treated with NALCO 7320. Surface-to-biovolume ratio of P. aeruginosa PAO1-CFP biofilm in CBR treated with NALCO 7320. Roughness coefficient of P. aeruginosa PAO1-CFP biofilm in CBR treated with NALCO 7320. Persistence of L. pneumophila in P. aeruginosa PAO1-CFP biofilms treated with NALCO 7320. Cell counts of planktonic L. pneumophila in CBR treated with NALCO 7320. Scatterplot of bio-volume and legionellae loss, obtained from 4 independent experiments. Effect of NALCO 7320 on the distribution of L. pneumophila in (A) developing, and (B) mature P. aeruginosa PAO1-CFP biofilms. Effect of NALCO 7320 on the distribution of bio-volume in (A) developing, and (B) mature P. aeruginosa PAO1-CFP biofilms. Porosity of P. aeruginosa PAO1-CFP biofilm in CBR treated with NALCO 7320. Effect of NALCO 7320 on porosity distribution of (A) developing, and (B) mature P. aeruginosa PAO1-CFP biofilms.
115 117 117 118 118 119 119 121 121 122 124 126 128 129

List of Abbreviations
Department of Microbiology, NUS xv
List of Abbreviations
3OC12-HSL
µmax
θ
BCYE
CBR
CFDA-SE
CFU
CLSM
DBNPA
DFA
dH2O
EPS
H. vermiformis
LB
LB+gen
LD
LLAP
L. pneumophila
MBC
MIC
MM
MM+gen
N-(3-oxododecanoyl)-L-homoserine lactone
Maximum specific growth rate
Hydraulic residence time
Buffered charcoal yeast extract
CDC biofilm reactor
5-(and-6)-carboxyfluorescein diacetate, succinimidyl ester Colony forming unit
Confocal laser scanning microscope
2,2-Dibromo-3-nitrilopropionamide
Direct florescent antibody
Deionized water
Extracellular polysaccharides
Hartmannella vermiformis
Luria Bertani
Luria Bertani + 60µg/ml gentamicin
Legionnaires’ disease
Legionella-like amoebal pathogens
Legionella pneumophila
Minimum bactericidal concentration
Minimum inhibitory concentration
Minimal media
Minimal media + 60µg/ml gentamicin

List of Abbreviations
Department of Microbiology, NUS xvi
OD
P. aeruginosa
Optical density
Pseudomonas aeruginosa
P. aeruginosa PAO1-CFP
PBS
PCR
PF
PFA
PI
ppm
Q
r
rpm
SBR
SDS
td
V
VBNC
Pseudomonas aeruginosa PAO1 tagged with cyan-fluorescent-protein (CFP) Phosphate buffer solution
Polymerase chain reaction
Pontiac fever
Paraformaldehyde
Propidium iodide
Parts per million
Nutrient influent flow rate
Correlation coefficient
Revolutions per minute
Surface to bio-volume ratio
Sodium dodecyl sulphate
Doubling time
Maximum volume of bulk fluid in CBR during continuous flow Viable but non-culturable

Summary
Department of Microbiology, NUS xvii
Summary
In present study, a reproducible model Pseudomonas aeruginosa PAO1-CFP
biofilm, with distinct stages of biofilm development, was established in CDC
Biofilm Reactor continuous flow system using defined minimal media at 30°C.
Splitting certain data, such as bio-volume and surface-to-biovolume ratio (SBR),
into 5 sections along biofilm thickness and applying a novel method of biofilm
porosity quantification in a 3-dimensional context provided greater insights of
biofilm structures and properties. Consequently, biofilm structures and
development were better described, and the first physical evidence of porous
channels within biofilm cell cluster was observed.
Legionella pneumophila adhesion study revealed that legionellae adhesion to
biofilms was independent of developmental stage of the latter. Instead, biofilm
structure and porosity were found to determine the amount and even localization
of legionellae adhesion to biofilm. Additionally, L. pneumophila persistence study
revealed that legionellae was least likely to get desorbed at bottom 60% of the
biofilms, especially at bottom 20%, and unbalanced advective transport of
legionellae towards biofilm surface commenced upon biofilm maturation, most
probably due to unbalanced cell growth.
Eight commercially available biofilm-removing agents were screened using
microtitre plate assay for one with the highest efficacy. Subsequently, application
of the selected biocide, NALCO 7320, (at bactericidal concentration to planktonic
P. aeruginosa PAO1) to P. aeruginosa PAO1-CFP biofilms yielded complete

Summary
Department of Microbiology, NUS xviii
disinfection of developing biofilm while a resistant subpopulation was found in
the remains of mature biofilm.
Porosity distribution and biofilm structural analysis suggested that NALCO 7320
caused biofilm detachment by affecting the nature of extracellular polysaccharides
(EPS) matrix that bound the microbial cells together as a microcolony, while
applying biocidal effect on P. aeruginosa PAO1-CFP cells within the biofilm.
Legionellae persistence in biocide-treated biofilms was found to be independent
on the stage of biofilm development and loss of biomass, but regions of the
biofilms in which legionellae best persist were detected. Since EPS is a major
component in biofilm matrix, it was hypothesized to play an important role in
legionellae persistence in biocide-treated biofilms.

Introduction
Department of Microbiology, NUS 1
Chapter 1: Introduction
L. pneumophila, the main species of the genus Legionella, was first recognized as
a pathogen after an outbreak of acute pneumonia, called Legionnaires’ disease that
occurred at the convention of the American Legion in Philadelphia, USA, during
1976 (Fraser et al., 1977). To date, forty eight species of Legionella have been
described, including 70 distinct serogroups (Borella et al., 2005). Approximately
half of the 48 species of legionellae have been associated with legionellosis, but it
is likely that most legionellae can cause human disease under appropriate
conditions (Fields, 1996). L. pneumophila is responsible of approximately 91% of
all reported community cases of legionellosis and among the 15 serogroups of this
species, L. pneumophila serogroup 1 accounts for the 84% of confirmed cases (Yu
et al., 2002).
The real number of cases of Legionnaires’ disease is unknown, although in the
USA, it is estimated that the incidence is 20 cases per million population (Borella
et al., 2005). In Europe, during the period 2003-2004, a total of 10,322 cases of
Legionnaires’ disease was reported, with national infection rates ranging from 0 to
28.7 cases per million population (Ricketts and Joseph, 2005). The mean annual
incidence rates were 0.9 (Heng et al., 1997) and 1.7 (Goh et al., 2005) per 100,000
population in Singapore, during the period 1986-1996 and 1998-2002
respectively. Because of the difficulty in distinguishing Legionella associated
diseases from other forms of pneumonia and influenza, many cases are
unreported. Nevertheless, the overall case-fatality rate is high especially among

Introduction
Department of Microbiology, NUS 2
seriously immunosuppressed individuals, at 24% for the adequately treated and
80% for those without treatment (Fliermans, 1995).
Legionella associated diseases have emerged in the last half of the 20th century
because of human alteration of the environment. Legionella spp. is part of the
natural aquatic environment and the bacterium is capable of surviving extreme
ranges of environmental conditions (Fliermans et al., 1981). However, when
allowed to remain in their natural habitat, legionellae are rarely the causative
agents of human disease since natural freshwater environments have not been
implicated as reservoirs of legionellosis. Main sources of L. pneumophila are
waters from hot distribution systems and cooling towers. Numerous cases of
legionellosis have been found to occur after exposure to contaminated waters in
offices, hotels, hospitals and cruise ships, among other locations (Borella et al.,
2005).
Factors leading to outbreaks or sporadic cases are not completely understood, but
certain events are considered prerequisites for infection. These include the
presence of the bacterium in aquatic environment, amplification to an unknown
infectious dose and transmission via aerosol to a human host that is susceptible to
infection (Fliermans, 1995). Although amoebae are key factors in Legionella
amplification process (Fields, 1996), this pathogen is able to survive as free
organism for long periods within biofilms which are widespread in man-made
water systems. Its persistence has been attributed to survival within biofilms
(Rogers and Keevil, 1992; Rogers et al., 1994). Additionally, association of

Introduction
Department of Microbiology, NUS 3
Legionella to biofilm may explain, at least in part, why legionellae are relatively
hard to eradicate in water systems, as biofilms exhibit a marked resistance to
biocidal compounds and chlorination (LeChevallier et al., 1988). Therefore a
more extensive knowledge on biofilm-associated legionellae may lead to the most
effective control measures to prevent legionellosis.
Majority of Legionella-biofilm studies employed naturally occurring microbial
biofilm communities, and failed to identify all the organisms present and their
contribution to the survival and multiplication of legionellae. Additionally,
Pseudomonas aeruginosa PAO1, a wound isolate (Holloway, 1955), is generally
found in the same aquatic environments as L. pneumophila (Murga et al., 2001), is
the most widely used P. aeruginosa laboratory strain (Stover et al., 2000) and its
biofilm development has been well documented (Sauer et al., 2002). Therefore in
the present study, a reproducible model P. aeruginosa PAO1-CFP biofilm was
established in a CDC Biofilm Reactor continuous flow system using defined
minimal media at 30°C. Since P. aeruginosa PAO1 biofilms are structurally and
dynamically complex biological systems with regulated developmental stages
(Sauer et al., 2002), it was hypothesized that legionellae interacts differently with
biofilms at different developmental stages and responds differently to biocidal
treatments while residing in biofilms at different developmental stages.
To allow further insights into biofilm development, current method of quantifying
biofilm structures was improved by splitting up certain descriptive data into 5
sections along the thickness of the biofilm and a novel method of quantifying
Introduction
Department of Microbiology, NUS 4
biofilm porosity in a 3-dimensional context was developed. Using the model and
better descriptive methods of biofilm structure and porosity, it was determined if
there is any difference (in numbers and distribution pattern) in accumulation and
persistence of L. pneumophila in developing and mature biofilm, and if the
structure or porosity of biofilm plays a role in the accumulation and persistence of
L. pneumophila.
In a bid to deepen the knowledge on the effect of biocide on legionellae-
associated to biofilms, a biocide was first selected by screening through eight
commercially available biofilm-removing agents for one with the highest efficacy
using microtitre plate assay. Subsequently, the effects of the selected biocide,
NALCO 7320 (at bactericidal concentration to planktonic P. aeruginosa PAO1)
on the persistence and structure of P. aeruginosa PAO1-CFP biofilm, and the
persistence of biofilm-associated legionellae were characterized.

Literature Review
Department of Microbiology, NUS 5
Chapter 2: Literature Review
2.1 Legionella
2.1.1 Introduction to Legionella
The terror of the unknown is seldom better displayed than by the response of a
population to the appearance of an epidemic, particularly when the epidemic
strikes without apparent cause. Between July 22 and August 3, 1976, there was a
remarkable incidence of febrile respiratory disease among persons who had
attended the American Legion Convention in Philadelphia from July 21 to 24.
“Legionnaires’ disease” (LD) is the term used to describe the illness that occurred
among persons attending the convention (Fraser et al., 1977).
The etiologic agent of LD was first isolated in guinea pigs from lung specimens
collected on autopsy and subsequently, serologic evidence for the etiological role
of the bacterium, designated L. pneumophila subsp. pneumophila, was obtained by
indirect fluorescent antibody staining (McDade et al., 1977). In fact, the first
strains of Legionella were already isolated in guinea pigs by using procedures for
the isolation of Rickettsia by Tatlock in 1943 (McDade et al., 1979).
2.1.2 General characteristics of Legionella
Members of the genus Legionella are faintly staining Gram-negative, aerobic rods
or filaments (usually found after growth in enriched laboratory media), 0.3-0.9µm
in width and 2-20µm or more in length (Brenner et al., 1985). They are neither
encapsulated nor acid-fast; they do not form endospores or microcysts (Brenner et
al., 1985). They are chemoorganotrophic, where amino acids are utilized as

Literature Review
Department of Microbiology, NUS 6
carbon and energy sources, while carbohydrates are neither fermented nor
oxidized (Tesh and Miller, 1981). Furthermore, they are nutritiously fastidious
where L-cysteine-HCL is absolutely necessary for their growth and iron salts in
the medium enhance their growth (Feeley et al., 1978).
The cell wall is made up of two three-layered unit membranes (Brenner et al.,
1985) and is predominated by branched chain fatty acids (Fisher-Hoch et al.,
1979). The fatty acid composition of the cell wall varies among the different
species belonging to the genus Legionella, thus fatty acid analysis is useful for the
differentiation of Legionella species (Diogo et al., 1999). In addition, the cellular
fatty acid composition of the bacteria is found to be similar to that of known
thermophilic bacteria (Fliermans, 1995). Therefore, it is not surprising to see
Legionella associated with thermally elevated habitats (Verissimo et al., 1991).
Various L. pneumophila strains and isolates of species other than L. pneumophila
are able to produce flagella (Heuner et al., 1995), which are later shown to be a
positive predictor for virulence in Legionella (Bosshardt et al., 1997). Ott et al.
(1991) demonstrated that the expression of the gene flaA, encoding the flagella
subunit, is temperature-dependent. Further studies in the same laboratory revealed
that the expression of flaA is also influenced by the growth phase, the viscosity
and the osmolarity of the medium, and by amino acids (Heuner et al., 1999).
Similar to a number of other Gram-negative bacteria, Legionella is able to enter a
viable but non-culturable (VBNC) state under low-nutrient conditions (Hussong et

Literature Review
Department of Microbiology, NUS 7
al., 1987). Also, the loss of culturability appeared to be accelerated at higher
temperature of 37°C, as compared to 4°C (Hussong et al., 1987). Many
procedures to reactivate VBNC legionellae have failed, with the exception of the
passage through Acanthamoeba castellani (Steinert et al., 1997). Both amoeba-
reactivated cells and plate-grown L. pneumophila cells had the same capacity for
intracellular survival in human monocytes and intraperitoneally infected guinea
pigs, which is considered a parameter for virulence. However, reactivation of
VBNC cells was not observed in the animal model. Although there is a correlation
of Legionella infection of amoeba, human cell lines and animal models, it cannot
be excluded that VBNC forms are virulent for human.
2.1.3 Taxonomy of Legionella
The family Legionellaceae consists of the single genus Legionella (Fields et al.,
2002). At least 48 species comprising 70 serogroups have been distinguished
(Fields et al., 2002; Borella et al., 2005). Legionella pneumophila consists of 15
serogroups, of which serogroup 1 is the most common, followed by serogroups 4
and 6 (Den Boer and Yzerman, 2004). The number of species and serogroups of
legionellae continues to increase. Phylogenetically, the nearest relative to the
Legionellaceae is Coxiella burnetti, the etiologic agent of Q fever (Adeleke et al.,
1996 and Swanson and Hammer, 2000). These organisms have similar
intracellular lifestyles and may utilize common genes to infect their host.
Some legionellae cannot be grown on routine Legionella media and has been
termed Legionella-like amoebal pathogens (LLAPs; Adeleke et al., 1996). LLAP

Literature Review
Department of Microbiology, NUS 8
was first recovered and isolated from the sputum of a patient with pneumonia by
cocultivating with its host amoebae (Fry et al., 1991). Additional LLAP strains
may be human pathogens as well, but proving this is difficult because they cannot
be detected by conventional techniques used for legionellae (Fields et al., 2002).
2.1.4 Legionella and Diseases
2.1.4.1 Clinical presentation
Diseases caused by Legionella are collectively termed legionellosis. Legionellosis
classically presents as two distinct clinical entities, Legionnaires’ disease (LD;
Fraser et al., 1977), a severe multisystem disease involving pneumonia, and
Pontiac fever (PF; Glick et al., 1978), a self-limited flu-like illness.
Features of LD include fever, non-productive cough, headache, myalgias, rigors,
dyspnea, diarrohea and delirium (Tsai et al., 1979). Histological reports describe
intra- and extracellular bacteria in phagocytes, fibroblasts and epithelial cells
(Fields, 1996). Chest X-rays often show evidence of pneumonia, but it is
impossible to distinguish LD from other types of pneumonia on the basis of
symptoms alone (Edelstein, 1993). As a result, many cases go probably
unreported. This assumption is supported by serologic surveys which show that
many persons in an apparently healthy population have antibodies against
legionellae (Paszko-Kolva et al., 1993).
The clinically distinct self-limited and non-pneumonic PF is a milder, influenza-
like form of disease (Fields et al., 1990). It usually appears on an epidemic mode

Literature Review
Department of Microbiology, NUS 9
(Tossa et al., 2006) but many persons who seroconvert to Legionella will be
entirely asymptomatic (Boshuizen et al., 2001). Because of its benignity and lack
of specificity, the occurrence of PF is often undiagnosed and is therefore even less
reported than LD.
To date, there is no consensus on the duration of the incubation period, on its
clinical symptoms, nor on the causal species of Legionella. Since the microbe has
never been isolated from PF patients, it has been speculated that PF is caused by
VBNC forms of Legionella (Steinert et al., 1997). Other hypotheses to explain PF
include changes in virulence factors, toxic or hypersensitivity reactions to bacteria
(Kaufmann et al., 1981) or their products; high levels of endotoxin in aerosolized
water may be responsible for clinical symptoms (Fields et al., 2001).
2.1.4.2 Diagnosis
Although Legionella species are gram-negative bacilli, they are rarely visualized
on Gram stains of clinical material (Stout et al., 2003). A Gram stain of a sputum
specimen showing polymorphonuclear leukocytes without bacteria can be a
valuable clue to Legionella infection (Muder and Yu, 2002).
Clincal specimens used for culture of Legionella species include sputum or
bronchoalveolar lavage specimens, bronchial aspirates, lung biopsy specimens and
blood (Den Boer and Yzerman, 2004). Isolation of Legionella species from a
clinical specimen on selective media provides a definitive diagnosis. Buffered
charcoal yeast extract agar that contains antibiotics to suppress commensal flora is

Literature Review
Department of Microbiology, NUS 10
commercially available. However, certain media formulations that are selective
for L. pneumophila may inhibit growth of other Legionella species (Muder and
Yu, 2002). Preheating steps and acid washing procedures were developed to
reduce overgrowth by other microorganisms, thus serve as additional means of
increasing the sensitivity of sputum culture (Den Boer and Yzerman, 2004).
Species-specific DFA testing is more often applied directly to clinical specimens
(Stout et al., 2003). Since the sensitivity of the DFA stain is much lower than for
culture (range, 25 to 75%), it was suggested that this test should not be performed
routinely (Edelstein, 1993). It should be noted that the sensitivity and specificity
of DFA testing of clinical specimens is not precisely known for species other than
L. pneumophila (Muder and Yu, 2002).
The commercially available Legionella urinary antigen test reliably detects only
infection due to L. pneumophila serogroup 1. Urinary antigen test results are
occasionally positive in cases of disease due to other Legionella species, but the
sensitivity is low; consequently, a negative test result is of little value in excluding
Legionella infection (Muder and Yu, 2002). Potentially, PCR could detect all
known Legionella species. However, so far the sensitivity of the test varies from
11 to 100% and many publications report specificities of lower than 99% (Den
Boer and Yzerman, 2004).
At present, optimal sensitivity for diagnosis of LD will be achieved by using a
combination of culture, serological investigation and urinary antigen detection

Literature Review
Department of Microbiology, NUS 11
(Den Boer and Yzerman, 2004). After reviewing the diagnostic methods of LD,
Den Boer and Yzerman (2004) postulated that easy-to-perform PCR test with high
sensitivity and a specificity of above 99% may become accepted as new gold
standard for diagnosis of LD in the future. On the contrary, the sensitivity and
specificity of detecting seroconversion to Legionella species other than L.
pneumophila is still uncertain. While seroconversion alone can be used for the
diagnosis of infection due to other species, such diagnoses should be regarded as
presumptive unless there are supporting microbiologic or epidemiologic data
(Muder and Yu, 2002).
2.1.4.3 Epidemiology
Studies have estimated that between 8,000 and 18,000 persons are hospitalized
with legionellosis annually in the United States (Marston et al., 1997). Failure to
utilize available diagnostic tools may result in the mistaken impression that
Legionella infections are not occurring in a hospital or a community. For
Legionella infections in particular, national extrapolations are potentially
misleading because of the critical importance of local microenvironment.
As summarized by Fliermans (1995), the overall case-fatality rate is high. Among
previously healthy individuals, 7-9% die when treated with erythromycin, while
25% die when hospitalized but not treated with appropriate antibiotics. Among
seriously immunosuppressed individuals, the mortality rate is 24% for the
adequately treated and 80% for those without treatment.

Literature Review
Department of Microbiology, NUS 12
In the same study carried out by Marston et al. (1997) involving patients with
community-acquired pneumonia requiring hospitalization, Legionella spp. was
found to be responsible for 2–5% of the cases studied. In the USA, 91% of
isolates from Legionnaires’ disease patients are typed as Legionella pneumophila
serogroup 1 (Marston et al., 1997). This is in contrast to the situation in Australia
and New Zealand, where 30% of the cases of Legionnaires’ disease are caused by
Legionella longbeachae (Yu et al., 2002).
In an international collaborative study conducted by Yu et al. (2002), community
acquired LD is dominated by L. pneumophila serogroup 1 (84.2% of all isolates).
Species other than L. pneumophila were rare: L. longbeachae (3.9%) and L.
bozemanii (2.4%) accounted for most of the nonpneumophila cases. L. micdadei,
L. feeleii, L. dumoffii, L. wadsworthii and L. anisa combined accounted for 2.2%
of the remaining cases. Hospital-acquired pneumonia have also involved
serogroups other than L. pneumophila serogroup 1 (especially serogroups 4 and 6)
and Legionella species other than L. pneumophila, especially L. micdadei, L.
dumoffii and L. bozemanii (Fang et al., 1989). Nevertheless, L. pneumophila
serogroup 1 is still the dominant cause of legionellosis.
Epidemiological studies indicate that Legionella is an opportunistic pathogen,
with elderly and immuno-compromised patients being most susceptible
(Fliermans, 1996). Other risk factors for the disease include smoking, male sex,
chronic lung disease, hematologic malignancies, end-stage renal disease, lung
cancer, immunosuppresion and diabetes (Marston et al., 1994). Differences in host

Literature Review
Department of Microbiology, NUS 13
susceptibility and bacterial virulence make it difficult to clearly define an
infectious dose (Steinert et al., 2002).
The best-documented route for transmission of infection is the generation of an
infective aerosol from a Legionella contaminated water source (Winn, 1999).
Aspiration of contaminated potable water is another probable mechanism for
infection of the lower respiratory tract (Blatt et al., 1993). Entry through the
gastrointestinal tract has been suggested to explain abdominal infections, although
this portal of entry has not been proved. Direct entry of bacteria into flesh wound
may also cause nosocomial Legionella infection (Winn, 1999). There has been no
evidence of human-to-human transmission or documented laboratory infections.
2.1.4.4 Epidemiology in Singapore
To find out if the disease occurs in Singapore, legionellosis was made
administratively notifiable in 1985 and legally notifiable in 2000, to the
Quarantine and Epidemiology Department, Ministry of the Environment. The first
local case of LD, a 27 year old Chinese male plumber, was admitted to Toa Payoh
Hospital on 4th February, 1986 (Lim et al., 1986). Clinical suspicion of LD was
confirmed by the presence of serum antibody to L. pneumophila (titre 1:512) by
an indirect fluorescent antibody test and it is not known where the patient acquired
the illness from.
In an attempt to determine the level of antibodies to L. pneumophila serogroups 1
to 4 in 150 young normal adults who are blood bank donors, Nadarajah et al.

Literature Review
Department of Microbiology, NUS 14
(1987) discovered a 20% overall prevalence of antibodies to L. pneumophila in
the normal population studied. In addition, a national serologic survey of the
general population conducted in 1993 showed a prevalence of 10.3% in those
below 20 years of age and 21.9% in those 20 years of age and above (Heng et al.,
1997). These results suggest that L. pneumophila is wide spread in the
environment in Singapore, which is confirmed by a surveillance of Legionella
bacteria in various artificial water systems (Heng et al., 1997). Despite the
ubiquitous distribution of Legionella in artificial water systems in Singapore and
high prevalence of sero-converted individuals, there has been no clustering of
cases by person and place and no common source outbreak linked to any artificial
water system since the disease was made notifiable in 1985. Goh et al. (2005)
suggested that the absence of outbreak was due to the low prevalence of the highly
pathogenic Pontiac subtype of L. pneumophila locally or low Legionella counts in
the cooling towers and other water systems here (only one fifth with Legionella
colony count above 10 colony-forming units (CFU) /ml).
During the period 1986 to 1996, a total of 258 sporadic cases of community-
acquired legionellosis was reported, giving a mean annual morbidity rate of 0.9
per 100,000 population (Heng et al., 1997). However, a total of 273 cases,
including 37 imported cases, were reported during the period 1998-2002, giving a
mean annual incidence rate of 1.7 per 100,000 population (Goh et al., 2005).
These are lower than that of the USA (20 per 100,000 population per year; Borella
et al., 2005) and Scotland (5.1 per 100,000 population), and comparable to that of
Denmark (1.8 per 100,000 population), Germany (1.6 per 100,000 population) and

Literature Review
Department of Microbiology, NUS 15
England and Wales (0.2 per 100,000 population; Heng et al., 1997). In both
studies conducted in Singapore, cases were reported predominantly among males,
ethnic Indians, the elderly and those with concurrent medical conditions. The
overall case-fatality rate was 14.7% for the period 1986-1996 (Heng et al., 1997)
and 5.5% for 1998-2002 (Goh et al., 2005).
Legionella pneumonia accounted for 2% to 7% of the community-acquired
pneumonia among hospitalized patients in Singapore (Ong and Eng, 1995) The
incidence of community-acquired pneumonia due to legionellosis in USA is 2-5%
(Marston et al., 1997), in Italy is 5.9% (Montagna et al., 2006) and in Brazil is
5.1% (Chedid et al., 2005). Thus in most countries, it is less than 10%.
2.1.4.5 Treatment
In order to administer accurate treatment to patients with Legionnaires’ disease,
correct diagnosis is critical. Unfortunately, it is not possible to clinically
distinguish patients with Legionnaires’ disease from patients with other types of
pneumonia (Edelstein, 1993). Furthermore, delay in starting appropriate therapy
has been associated with increased mortality (Heath et al., 1996). Thus, Bartlett et
al. (2000) proposed that empirical therapy for persons hospitalized with
community-acquired pneumonia should include coverage for Legionnaires’
disease.
Historically, erythromycin has been the drug of choice for Legionnaires’ disease
(Fields et al., 2002). In vitro data suggest that azithromycin and many

Literature Review
Department of Microbiology, NUS 16
fluoroquinolone agents have superior activity against Legionella spp.
Additionally, these agents have fewer side effects than erythromycin (Edelstein,
1998). Since azithromycin and levofloxacin has been licensed by the Food and
Drug Admininstration for the treatment of Legionnaires’ disease, thus they are
preferred over erythromycin (Fields et al., 2002).
2.1.5 Ecology of Legionella
2.1.5.1 Natural and man-made habitats
Water is the major reservoir for legionellae and the bacteria are found in
freshwater environments worldwide (Fliermans et al., 1981). Legionellae have
been detected in as many as 40% of freshwater environments by culture and in up
to 80% of freshwater sites by PCR (Fields, 2002). Furthermore, Legionella has
been shown to survive in marine waters (Heller et al., 1998) and even ocean
waters receiving treated sewage have been found to contain Legionella species
(Palmer et al., 1993). In contrast with the aquatic environment, L. longbeachae is
a frequent isolate from potting soil (Steele et al., 1990). This species is the leading
cause of legionellosis in Australia and occurs in gardeners and those exposed to
commercial potting soil (Ruehlemann and Crawford, 1996).
L. pneumophila multiplies at temperatures between 25ºC and 42ºC, with an
optimal growth temperature of 35ºC (Katz and Hammel, 1987). However, in
nature or in association with algae, the optimum growth temperature of Legionella
spp. may be 45°C or higher (Fliermans et al., 1981). Most cases of legionellosis
can be traced to human-made aquatic environments where the water temperature
Literature Review
Department of Microbiology, NUS 17
is higher than ambient temperature (Fields et al., 2002). Thermally altered aquatic
environments can shift the balance between protozoa and bacteria, resulting in
rapid multiplication of legionellae, which can translate into human disease.
Legionellosis is a disease that has emerged in the last half of the 20th century
because of human alteration of the environment. Left in their natural state,
legionellae would be an extremely rare cause of human disease, as natural
freshwater environments have not been implicated as reservoirs of outbreaks of
legionellosis. Furthermore, the population densities of Legionella spp. in
freshwater are extremely low and at the highest densities measured Legionella
spp. account for less than 1% of the total bacterial population (Fliermans et al.,
1981).
Human infection occurs exclusively by inhalation of contaminated aerosols which
can be produced by air conditioning systems, cooling towers, whirlpools, spas,
fountains, ice machines, vegetable misters, dental devices and even shower heads
(Atlas, 1999). In addition, the presence of dead-end loops, stagnation in plumbing
systems and periods of non-use or construction have been shown to be technical
risk factors (Ciesielski et al., 1984; Atlas, 1999). Also, the material of the piping
system has been shown to influence the occurrence of high bacterial
concentrations. In this respect, the use of copper as plumbing material may help to
minimize the risk of legionellosis whereas plastic materials support high numbers
of L. pneumophila (Rogers et al., 1994).

Literature Review
Department of Microbiology, NUS 18
2.1.5.2 Distribution of Legionella in Singapore
The first L. pneumophila was isolated from hospital cooling towers in Singapore
(Nadarajah and Goh, 1986). Subsequently, Meers et al. (1989) took 87 water
samples from 48 cooling-towers on 15 sites and isolated 19 strains of Legionella
from 7 of the sites. All of the isolates are known to cause legionellosis (Yu et al.,
2002). 53% of the isolates belong to L. pneumophila serogroup 1, which is the
dominant causal agent for both community- and hospital-acquired legionellosis
(Fang et al., 1989; Yu et al., 2002).
For the period of 1991 to 1996, the overall isolation rate of Legionella bacteria
was 36% (1107 positive samples / 3095 samples taken) for cooling towers, 33%
(2/6) for public showers, 29% (30/103) for indoor decorative fountains, 15%
(10/68) for outdoor decorative fountains, 15% (4/26) for outdoor man-made
decorative waterfalls and 2% (1/48) for spa pools (Heng et al., 1997). The
isolation rate was not correlated with rainfall. The majority of the isolates (85.6%)
belonged to L. pneumophila while 46.9% belonged to serogroup 1.
Based on the samples collected during epidemiologic investigations in the period
of 1998 to 2002, Legionella bacteria were isolated from 550 (59.6%) of 923
cooling towers, 41 (38.3%) of 107 water fountains, 6 (16.2%) of 37 mist fans and
23 (23.7%) of 97 water taps/shower heads (Goh et al., 2005). Of 188 Legionella
bacteria isolated from cooling towers, L. pneumophila was found to be the
predominant species (65.4%) while 50.4% belonged to serogroup 1. The non-
pneumophila isolates are known to cause legionellosis (Yu et al., 2002) and they

Literature Review
Department of Microbiology, NUS 19
were L. bozemanii (14.9%), L. anisa (6.4%) and L. dumoffii (1.6%). Legionella
bacteria count was also found to be generally low, with 39 (20.7%) cooling towers
exceeding 10 CFU/ml.
2.1.5.3 Association of Legionella with protozoa
A universal trait of legionellae and LLAP organisms is their intracellular
existence. These bacteria are capable of infecting and multiplying within a variety
of mammalian and protozoan cell lines (Fields, 1996). Most of these studies were
conducted with L. pneumophila, primarily because this species is responsible for
the majority of legionellosis (Marston, 1994). It appears that L. pneumophila may
also have the most extensive host range of legionellae (Fields, 1996).
Protozoa do not only provide nutrients for the intracellular legionellae, but also
represent a shelter when environmental conditions become unfavorable (Thomas
et al., 2004). Compared to in vitro grown L. pneumophila, amoeba-grown bacteria
have been shown to be highly resistance to chemical disinfectants and to treatment
with biocides (Barker et al., 1992). Particularly inside Acanthamoeba cysts, the
bacteria are able to survive high temperatures, disinfection procedures and drying
(Rowbotham, 1986; Kilvington and Price, 1990; Winiecka-Krusnell and Linder,
1999). Furthermore, cooling tower amoebae containing legionellae may adapt to
biocides and may even be stimulated by biocides (Srikanth and Berk, 1993).
Legionella may also use protozoa to colonize new habitats where inhaled protozoa
represent a vehicle for effective transmission to humans (Cirillo et al., 1994). In

Literature Review
Department of Microbiology, NUS 20
addition, these vehicles of respirable size of 1-5µm containing L. pneumophila are
highly resistant to biocides (Berk et al., 1998). Interestingly, the same study
showed that more intense vesicle formation has been noticed before encystations
and when the amoeba are exposed to a mixed bacterial population, corresponding
to the conditions occurring in their natural environment. Interaction of Legionella
and protozoa also contributes and enhances the infection process itself (Cirillo et
al., 1994; Cirillo et al., 1999). However, the underlying mechanisms of this
phenomenon are not well elucidated yet (Steinert et al., 2002). In addition,
Brieland et al. (1997) demonstrated that L. pneumophila-infected amoeba were
more pathogenic than an equivalent number of bacteria or co-inoculum of the
bacteria and amoeba. A passage through Acanthamoeba castellanii was found to
reactivate viable but non-culturable (VBNC) Legionella into culturable state
(Steinert et al., 1997).
While protozoa are the natural hosts of legionellae, the infection of human
phagocytic cells is opportunistic (Fields et al., 2002). Much of our understanding
of the pathogenesis of legionellae has come from an analysis of the infection
process in both protozoa and human host cells. Studies contrasting the role that
virulent factors play in these two host populations allow speculation on the
bacteria’s transition from their obligatory relationship with protozoa to their
opportunistic relationship with humans.

Literature Review
Department of Microbiology, NUS 21
2.1.5.4 Association of Legionella with biofilm
Biofilms are the primary site of Legionella growth and persistence. In natural
hydrothermal areas, Legionella spp. were isolated in higher numbers from
biofilms than from water (Marrão et al., 1993). Similarly, in a man-made model
potable water system, the bacteria are more easily detected from swab samples of
biofilm than from flowing water (Rogers et al., 1994). Thus, suggesting that the
majority of the legionellae are biofilm associated. Furthermore, the association of
Legionella to biofilm may explain, at least in part, why legionellae are relatively
hard to eradicate in water systems, as biofilms exhibit a marked resistance to
biocidal compounds and chlorination (LeChevallier et al., 1988).
Only a limited number of studies attempted to characterize the bacteria’s
association within these complex ecosystems (Rogers and Keevil, 1992; Walker et
al., 1993; Rogers et al., 1994; Rogers et al., 1995). Rogers and Keevil (1992)
demonstrated that legionellae occurred in microcolonies within aquatic biofilm in
the absence of amoebae, thus providing the first evidence that legionellae is able
to grow extracellularly within the biofilm. Walker et al. (1993) evaluated the
effect of surface materials on growth of L. pneumophila using gas
chromatography-mass spectrometry analysis of genus-specific hydroxy fatty
acids, while Rogers et al. (1994) evaluated the effect of temperature and surface
materials on the growth of L. pneumophila. Rogers et al. (1995) used biofilm
models to evaluate silver efficacy against L. pneumophila and this study
represents a vast improvement over previous studies, which primarily evaluated
the susceptibility of agar-grown bacteria in sterile water.

Literature Review
Department of Microbiology, NUS 22
Majority of Legionella-biofilm studies that have been conducted employed
naturally occurring microbial communities. Such studies have the advantage of
representing a true and natural microbial community, but not all the organisms
present have been identified and their contribution to the survival and
multiplication of legionellae remains unknown. Nevertheless, biofilm matrices are
known to provide shelter and a gradient of nutrients. Complex nutrients available
in the biofilm may result in the multiplication of legionellae. Commensal bacteria
such as Flavobacterium breve, an environmental Pseudomonas, Alcaligenes and
Acinetobacter and blue-green algae (Cyanobacterium spp.) can stimulate the
growth of Legionella in the aquatic environment (Tison et al., 1980; Stout et al.,
1985; Wadowsky and Yee, 1985). Understanding the conditions under which L.
pneumophila can multiply extracellularly could have tremendous impact on
control strategies for the prevention of legionellosis.
Murga et al. (2001) attempted to detect extracellular growth of L. pneumophila by
using a biofilm reactor and a defined bacterial biofilm grown on non-
supplemented potable water. The base biofilm was composed of Pseudomonas
aeruginosa, Klebsiella pneumoniae and the Flavobacterium-like organism
isolated from a water sample containing legionellae. L. pneumophila was found to
associate with and persist in these biofilms with and without Hartmanella
vermiformis. However, L. pneumophila cells did not appear to develop
microcolonies and growth measurement studies indicate that L. pneumophila did
not multiply within this biofilm in the absence of amoebae. Nonetheless, L.
pneumophila did multiply in the biofilm and planktonic phase in the presence of

Literature Review
Department of Microbiology, NUS 23
H. vermiformis and the majority of these bacteria appeared to be shed into the
planktonic phase. These studies suggest that L. pneumophila may persist in
biofilms in the absence of amoebae, but in the model, the amoebae were required
for multiplication of the bacteria. Nevertheless, additional studies are needed to
determine if legionellae possess a means to multiply independent of a host cell
within biofilms.
Langmark et al. (2005) studied the accumulation and fate of microorganisms and
microspheres in biofilms formed in a novel pilot-scale water distribution system.
They demonstrated that the accumulation of L. pneumophila is independent of the
indigenous biofilm cell density; instead it is dependent on particle surface
properties, where hydrophilic spheres accumulated to a larger extent than
hydrophobic ones. Although combined chlorine concentration exceeding 0.2mg/L
inhibited the establishment of culturable L. pneumophila within system, the loss of
fluorescence in situ hybridization-positive cells closely resembled that of inert
fluorescent microspheres instead. Thus implying that the fate of culturable
legionellae within the system is best described in terms of loss of culturability
rather than physical desorption. Nevertheless, it is unknown if those persisting
legionellae were still viable despite the loss of culturability. Last but not least, this
study demonstrated that desorption is one of the primary mechanisms affecting the
fate of microspheres and legionellae in biofilms, followed by disinfection and
biological grazing.

Literature Review
Department of Microbiology, NUS 24
2.1.5.5 Interaction of Legionella with Pseudomonas spp.
Inhibitive effect of P. aeruginosa on Legionella has been reported (Hussong et al.,
1987; Gomez-Lus, 1993). In addition, Leoni and Legnani (2001) sampled hot
water supplies in public buildings and found that there is an inverse correlation (r
= -0.26; p < 0.05) between the concentration of Legionella spp. and that of P.
aeruginosa. Interestingly, Kimura et al. (2005) reported that the quorum-sensing
signal, N-(3-oxododecanoyl)-L-homoserine lactone (3OC12-HSL) of P.
aeruginosa suppressed growth of L. pneumophila in a dose-dependent manner. In
addition, significant suppressions of virulence factor genes (dotA, rtxA and lvh)
were demonstrated in L. pneumophila exposed to 3OC12-HSL.
Most recently, in an attempt to determine the fate of L. pneumophila when
introduced to single species or mixed cultures of defined heterotrophic bacteria,
Mampel et al. (2006) reported no attachment of L. pneumophila to a 2-day old
biofilm formed by the Pseudomonas spp. in a flow chamber system.
2.2 Biofilm
2.2.1 Introduction to biofilm
Putative biofilm microcolonies have been identified by morphology in the 3.3-3.4
billion year old South African Kornberg formation (Westall et al., 2001). In the
context of evolution and adaptation, biofilms appeared to provide homeostasis in
the face of the fluctuating and harsh conditions of the primitive earth, thereby
facilitating the development of complex interactions between individual cells
(Hall-Stoodley et al., 2004).

Literature Review
Department of Microbiology, NUS 25
2.2.2 General characteristics of biofilm
Biofilms develop on surfaces in diverse environments, both natural and man-
made, and they may contaminate industrial pipelines, cooling water towers, dental
unit water lines, catheters, ventilators and medical implants, causing biofouling
and significant financial losses (Characklis, 1990a; Flemming, 2002). Occurrence
in such wide range of environments, where a surface is exposed to adequate
moisture; therefore it is difficult to generalize about their structure and
physiological activities (Sutherland, 2001). Furthermore, biofilms can be
composed of a population that developed from a single species or a community
derived from multiple microbial species (Sutherland, 2001).
Nevertheless, Davey and O'Toole (2000) noted that biofilms formed from single
species in vitro and those produced in nature by mixed species consortia exhibit
similar overall structural features. Most biofilms have been found to exhibit some
level of heterogeneity in that patches of cells in biofilm microcolonies are held
together by an extracellular polysaccharides (EPS) matrix that varies in density,
creating open areas where water channels are formed. The ability of these
channels to facilitate efficient nutrient uptake by infusing fluid from the bulk
phase into the biofilm (Stoodley et al., 1994), thereby optimizing nutrient and
waste-product exchange, provided the first link between form and function.
EPS composition is complex, presumably varies from organism to organism and
includes polysaccharides, nucleic acids and proteins (Sutherland, 2001). The
nature of the matrix is dependent on both intrinsic and extrinsic factors, where the

Literature Review
Department of Microbiology, NUS 26
former arises in accordance with genetic profile of component microbial cells and
the latter includes the physico-chemical environment in which the biofilm and its
matrix are located (Sutherland, 2001).
Now, many laboratory biofilm studies have concentrated on laboratory models in
which Pseudomonas aeruginosa has been the microbial species of interest
(Sutherland, 2001), because it is a ubiquitous Gram-negative environmental
bacterium that forms biofilms on wet surfaces (Stover et al., 2000).
2.2.3 Biofilm development
Today, the combination of high resolution three-dimensional imaging techniques,
specific molecular fluorescent stains, molecular-reporter technology and biofilm-
culturing apparatus has shown that biofilms are not simply passive assemblages of
cells that are stuck to surfaces, but are structurally and dynamically complex
biological systems whose cells express genes in a pattern that differs profoundly
from that of their planktonic counterparts (Sauer et al., 2002).
Proteomic studies indicated that biofilm formation in Pseudomonas aeruginosa
proceeds as a regulated developmental sequence and five stages have been
proposed (Sauer et al., 2002, Stoodley et al., 2002). Briefly, stages one and two
are generally identified by a loose or transient association with the surface,
followed by robust adhesion. Stages three and four involve the aggregation of
cells into microcolonies and subsequent growth and maturation. Lastly, stage five
is characterized by a return to transient motility where biofilm cells are sloughed

Literature Review
Department of Microbiology, NUS 27
or shed. The developmental life cycle comes full circle when dispersed biofilm
cells revert to the planktonic mode of growth. Microscopic observations
demonstrated that bacteria having physiologies from more than one stage of
biofilm could be present simultaneously within the biofilms (Sauer et al., 2002).
There is also evidence for developmental sequences in Escherichia coli (Reisner
et al., 2003) and Vibrio cholera biofilms (Watnick and Kolter, 1999). Until
recently, it was thought that highly regulated social behaviour in prokaryotes was
an unusual feature of myxobacteria only (Kaiser, 2003).
2.2.4 Stages of biofilm development
2.2.4.1 Stage 1: Reversible attachment
Initial event in biofilm development occurs when contact is made between the
surface of the cell and an interface. Using nonmotile mutants, a significant
decrease in attachment efficiency compared to flagellated cultures was observed
under continuous flow (Sauer et al., 2002). A similar observation was made
previously by O’Toole and Kolter (1998) for biofilms grown under static biofilm
conditions. Therefore, flagella-mediated motility appears to be required for a
planktonic bacterium to swim toward a surface and to initiate reversible (or
transient) attachment (O'Toole and Kolter, 1998) via the cell pole (Sauer et al.,
2002).
Individual adherent cells that initiate biofilm formation on a surface are
surrounded by only small amounts of EPS (Stoodley et al., 2002). Davies and

Literature Review
Department of Microbiology, NUS 28
Geesey (1995) showed that within 15 minutes of P. aeruginosa cell initial contact
with substratum, the cluster of genes responsible for alginate production is
upregulated and that this genetic event initiates the process of biofilm formation.
2.2.4.2 Stage 2: Irreversible attachment
In continuous flow, irreversible attachment is indicated by cessation of motility of
the attached cells (Sauer et al., 2002) and the cells are associated to the substratum
via the long axis of the cell body (Caiazza and O’Toole, 2004). The earliest time
of onset of irreversible attachment was 2 hrs (Sauer et al., 2002). Caiazza and
O’Toole (2004) demonstrated that SadB locus is required for the transition from
reversible to irreversible attachment in P. aeruginosa. However, the exact
mechanism by which SadB promotes this transition is unknown.
Furthermore, the cell clusters formed during this stage were observed to remain
attached to the substratum through to the last stage of biofilm development (9 to
12 days of incubation) (Sauer et al., 2002). In the same study, the Las quorum-
sensing system became active upon irreversible attachment, as determined by
onset of reporter activity for the lasB gene, which has been shown to be
responsive to induction by PAI-1 autoinducer (Pearson et al., 1994). However,
proteomics study and in situ observation of lasB:lacZ reporter gene demonstrated
that cells of P. aeruginosa which are in the planktonic and early attachment stage
did not display substantially different physiologies (Sauer et al., 2002). Therefore,
this implies that quorum sensing does not have an influence on this transitional
stage of biofilm.
Literature Review
Department of Microbiology, NUS 29
An earlier study by Davies et al. (1998) demonstrated that the Las quorum-
sensing system was involved in the development of P. aeruginosa biofilm. A lasI
mutant formed flat, undifferentiated biofilms that unlike wild-type biofilms are
sensitive to the biocide sodium dodecyl sulphate (SDS). In addition, mutant
biofilms appeared normal when grown in the presence of a synthetic signal
molecule. The differences in biofilm architecture imparted by las inactivation
were found to be related to changes in the structure of EPS (Sauer et al., 2002 and
Davies et al., 1998).
2.2.4.3 Stage 3: Maturation-1
After 3 days of biofilm development, cell clusters became progressively layered
and was defined as the point in time at which cell clusters are thicker than 10µm
(Sauer et al., 2002). In addition, this maturation-1 stage is accompanied by the
activation of the Rhl quorum-sensing system which was determined by the onset
of reporter activity for the rhlA gene (Sauer et al., 2002). The rhlA gene was
shown to be induced by the PAI-2 autoinducer (Pearson et al., 1995).
2.2.4.4 Stage 4: Maturation-2
As defined by Davies et al. (1998), the penultimate stage in biofilm development
is reached when cell clusters attain their maximum average thickness. In the
reactor study conducted by Sauer et al. (2002) reported that this stage of P.
aeruginosa PAO1 biofilm development was reached after 6 days of growth in
minimal media supplied with glutamic acid as sole carbon source. In the same
study, it was microscopically observed that cells within clusters were nonmotile,

Literature Review
Department of Microbiology, NUS 30
the cell clusters reach their maximum dimensions, the majority of the cells are
segregated within cell clusters and clusters are displaced from the glass surface.
This is also the point at which biofilm bacteria are profoundly different from
planktonic bacteria with respect to the number of differentially expressed proteins.
More than 50% of all detectable proteins undergo changes in regulation between
planktonic growth and maturation-2 stage growth, with the majority being
upregulated. Many cells alter their physiological processes (e.g., grow
anaerobically) in response to conditions in their particular niches (Stoodley et al.,
2002)
2.2.4.5 Stage 5: Dispersion
After 9 days, Sauer et al. (2002) noted that cell clusters undergo alterations in
their structure due to the dispersion of bacteria from their interior portions. These
bacteria were motile and were observed to swim away from the inner portions of
the cell cluster through openings in the cluster and enter the bulk liquid, leaving
behind structures that appear shell-like, with a hollow center and walls of
nonmotile bacteria. Presumably, this dispersion allows cells to swim back into the
bulk liquid to gain better access to nutrients for the cells that remain in the
biofilm. Sauer et al. (2002) also noted that the protein patterns for this stage are
closer to that for planktonic bacteria than for maturation-2 stage cells and the
transition to dispersion phase is the only episode in biofilm development where
more proteins were downregulated than upregulated.

Literature Review
Department of Microbiology, NUS 31
Recently, new levels of multicellular organization have been observed inside
mature microcolonies. These features included localized dissolution of the biofilm
matrix (Sauer et al., 2002 and Tolker-Nielsen et al., 2000) and dispersal of a
subpopulation of cells from internalized portions of the microcolony and death of
a subpopulation of cells inside the microcolony (Webb et al., 2003).
2.2.5 Determinants of biofilm structure
There is a continuing debate among biofilm researchers concerning the relative
contributions of genetics (active response) and environmental conditions (passive
response) to the development of biofilm structure and development (Kjelleberg
and Molin, 2002).
Davies et al. (1998) demonstrated that a quorum-sensing signal, N-(3-
oxododecanoyl)-L-homoserine lactone (3OC12-HSL), associated with the
production of virulence factors, is involved in the differentiation of individual
cells of P. aeruginosa PAO1 into complex multicellular structures, thus opening
the concept that biofilm structure was genetically regulated. A mutation that
blocks generation of the signal molecule hinders differentiation and the resulting
flat biofilm appears to be sensitive to detergent biocide SDS. Molecular
techniques, such as random transposon mutagenesis and knockout mutant studies,
have since been used extensively to identify ‘biofilm-specific’ genes (Heydorn et
al., 2002, Sauer et al., 2002 and Klausen et al., 2003a).

Literature Review
Department of Microbiology, NUS 32
On the other hand, environmental factors such as hydrodynamics and nutrient load
have major impacts on biofilm structure. Stoodley et al. (1999) reported that under
conditions of low-shear laminar flow, the biofilm consisted of a monolayer of
cells with mound-shaped circular microcolonies but under high-shear, turbulent
flow conditions, the biofilm formed filamentous streamers. In addition, a study by
Liu and Tay (2001) found that biofilms grown at higher shear were smoother and
denser than those grown at lower shear. Klausen et al. (2003a) demonstrated that
when citrate was used as a carbon source, P. aeruginosa PAO1 formed a flat,
uniform biofilm, whereas when glucose was used, P. aeruginosa PAO1 formed a
heterogeneous biofilm containing mushroom-shaped multicellular structures
separated by water-filled channels.
van Loosdrecht et al. (2002) successfully modeled the structural and temporal
complexity of biofilms using simple rules that are based on localized growth
patterns determined by the distribution of nutrients and fluid shear. In another
words, biofilm differentiation into mature biofilms of organized communities with
functional heterogeneity does not necessarily require a genetic programme, but
may in fact constitute the sum of a large number of cellular adaptations and
growth cycles influenced by environmental factors.
Also, Purevdorj et al. (2002) demonstrated that environmental factors such as
hydrodynamics, can ‘override’ cell-cell communications as a principal
determinant of biofilm structure, illustrating that biofilm development is a
multifactorial process influenced by both environmental and genetic factors.

Literature Review
Department of Microbiology, NUS 33
2.2.6 Microbial diversity of biofilms
Microorganisms are found in a wide range of diverse ecosystems as highly
structured, multi-species biofilms (Stoodley et al., 2002). Such bacterial
communities in nature play a key role in the production and degradation of
organic matter, the degradation of many environmental pollutants, and the cycling
of nitrogen, sulphur and many metals. Most of these processes require the
concerted effort of bacteria with different metabolic capabilities and it is likely
that bacteria residing within biofilm communities carry out many of these
complex processes (Davey and O’Toole, 2000). Particularly, microbial diversity is
a property that is important with regard to the potential of opportunistic pathogens
such as Legionella spp. to integrate into biofilms.
It has been shown that hydrodynamic shear rates affect biofilm diversity as well as
the relative proportions of aggregating bacteria (Rickard et al., 2004). Highest
proportion of autoaggregating bacteria was present at high shear rates, while
intermediate shear rate selected for the highest proportion of coaggregating
bacteria. Coaggregation (interactions between two genetically distinct planktonic
microorganisms) between freshwater bacteria is mediated by growth-phase-
dependent lectin-saccharide interactions, which are optimal in stationary phase
cultures (Rickard et al., 2000). Additionally, coaggregation often occurs between
bacteria that are taxonomically distant (intergeneric coaggregation) and
occasionally between strains belonging to the same species (intraspecies
coaggregation) (Rickard et al., 2002), and enhances the development of
freshwater multi-species biofilm (Rickard et al., 2003).

Literature Review
Department of Microbiology, NUS 34
2.2.7 Microbial positioning in biofilm
The natural habitats prokaryotes are remarkably diverse (Pace, 1997). Their ability
to persist throughout the biosphere is due, in part, to their unequaled metabolic
versatility and phenotypic plasticity. One key element of their adaptability is their
ability to position themselves in a niche where they can propagate (Fenchel, 2002).
Numerous positioning mechanisms have been discovered. The most common
mechanism is flagellar motility and different methods of surface translocation,
including twitching, gliding, darting and sliding (Henrichsen, 1972).
Apart from active motility mechanisms, there are other mechanisms utilized by
bacteria to position themselves in response to their environment, such as
aggregation and attachment (Davey and O’Toole, 2000). Aggregation enhances
cell-cell interaction as well as the sedimentation rate of cells. Through attachment,
the bacteria not only position themselves on a surface, they can form communities
and obtain the additional benefit of the phenotypic versatility of their neighbours.
Cells of particular species are found consistently in certain locations, near the
colonized surface or at the apices of mushroom-structures of the biofilm. The
sessile cells that comprise single-species biofilms are located within the
microcolonies in species-specific distribution patterns, such that the
preponderance of the sessile cells may be found in the caps of mushrooms in a
highly organized pattern and the stalks of mushrooms formed by some species are
virtually devoid of cells (Stoodley et al., 2002).

Literature Review
Department of Microbiology, NUS 35
Only a few reports with regards to cell movement within biofilm matrix have been
made. Okabe et al. (1996) demonstrated that trapped tracer beads were gradually
transferred from the depth of the biofilm to the surface. Klausen et al. (2003b)
demonstrated that the mushroom-shaped multicellular structures in P. aeruginosa
PAO1 biofilms are formed in a sequential process involving a non-motile bacterial
subpopulation and a migrating bacterial subpopulation. The non-motile bacteria
form the mushroom stalks by growth in certain foci of the biofilm while the
migrating bacteria form the mushroom caps by climbing the stalks and
aggregating on the tops in a process driven by type-IV pili. In addition, a biofilm
model, which is derived by combining individual description of microbial
particles with a continuum representation of the biofilm matrix, suggests cells in
biofilm matrix move due to pushing mechanism between cells in colonies and by
an advective mechanism supported by the EPS dynamics (Alpkvist et al., 2006).
In this model, the EPS matrix is described by a continuum representation as
incompressible viscous fluid, which can expand and retract due to generation and
consumption processes.
2.3 Prevention of legionellosis
2.3.1 Control of legionellosis
Maintaining a clean system is of critical importance in reducing the risk of
legionellosis and it is the goal of a maintenance program to provide efficient
operation of the system while minimizing the risk of legionellosis through
preventing the amplification of Legionella (Fliermans, 1995). Since cooling
towers have been identified as one of the reservoirs and amplifiers for Legionella

Literature Review
Department of Microbiology, NUS 36
bacteria (Shelton et al., 1994; Bentham and Broadbent, 1993; Garbe et al., 1985),
routine maintenance service, including visual inspections, and mechanical and
physical cleaning programs designed to maintain year-round system cleanliness,
are an important part of an effective water treatment program.
Although good maintenance may reduce the likelihood of Legionella
amplification, there is very little data to indicate that cleaning alone is effective in
controlling Legionella (Fliermans, 1995). Therefore chemical biocidal treatment is
required. In addition, microbiological monitoring for Legionella must be included
as part of the quality assurance / quality control program to insure effectiveness of
any control measures.
Well maintained cooling towers with proper water treatment have generally not
been associated with outbreaks of legionellosis (Fliermans, 1995). In Singapore,
the Ministry of the Environment published a Code of Practice for the Control of
Legionella Bacteria in Cooling Towers (4th edition) in 2001 that provided
guidelines to cooling tower monitoring and maintenance to minimize the risk of
outbreaks of LD here.
2.3.2 Detection of Legionella
Unfortunately, measurements of water quality such as total bacterial counts, total
dissolved solids and pH have not proven to be good indicators of Legionella levels
in cooling towers (Boss and Day, 2003). Cultivation of Legionella remains the
standard method of detection (Steinert et al., 2002). The most widely used growth

Literature Review
Department of Microbiology, NUS 37
medium is commercially available buffered charcoal yeast extract agar, which is
supplemented with cysteine, iron salts and α-ketoglutarate. However, a number of
factors, including other bacteria, can interfere with the growth of Legionella, even
on selective media (Feeley et al., 1979; Edelstein, 1982). Serology-based methods
are not regarded to be the gold standard anymore since the progressive
characterization of new species has shown that antigen cross-reactivity limits
specificity (Maiwald et al., 1998). Further routine methods rely on pulsed field gel
electrophoresis (PFGE), amplified fragment length polymorphism (AFLP),
arbitrarily primed and nested PCR (Benson and Fields, 1998). Additionally, gas
chromatographic mass spectrometry based on the unique 3-hydroxy and 2,3-
dihydroxy fatty acids of the Legionella lipopolysaccharide has been described for
complex microbial consortia (Walker et al., 1993).
2.3.3 Risk assessment of cooling tower for Legionnaires’ disease outbreaks
From historical data compiled from outbreaks of LD worldwide, Shelton et al.
(1994) suggested that high numbers of Legionella were unusual and could be
equated to an increased risk of disease outbreak. Thus, routine monitoring of
Legionella counts and total bacterial counts were used to assess the risk of cooling
towers for potential LD outbreaks.
Other risk factors for determining the likelihood that a cooling tower may be
associated with human illness are not well defined. However, some towers appear
to be more likely to be associated with an outbreak of LD than other towers.
Fliermans (1995) provided a general guideline to risk assessment of cooling

Literature Review
Department of Microbiology, NUS 38
towers based on the location of host population and potential susceptibility of
host. Monthy monitoring was recommended for cooling towers with the highest
risk, while yearly monitoring was recommended for those with the least risk.
2.3.4 Water treatment in cooling towers
The method of choice for controlling bacterial populations within cooling towers
remains the use of industrial biocides. These may be oxidizing or non-oxidizing
(Characklis, 1990b). Traditional oxidizing agents such as chlorine and bromine
have been proven effective in controlling Legionella in cooling towers
(Characklis, 1990b; Fliermans, 1995).
While continuous chlorination at 0.2-0.3ppm is effective against a wide range of
bacteria (Kuchta et al., 1983), such levels are generally not effective in removing
Legionella from a highly contaminated cooling tower system (Fliermans et al.,
1982). Early field investigations demonstrated the effectiveness of 1.5ppm free
residual chlorine for a short duration in reducing the levels of Legionella in large
industrial cooling towers (Fliermans et al., 1979; Fliermans et al., 1982;
Fitzgeorge and Dennis, 1983). However, levels of free residual chlorine above
1ppm may be corrosive to the metallurgy of a system (Fliermans, 1995). In
addition, high levels of chlorine may also form toxic by-products with organic
substances present in water and may be of environmental and public health
concern.

Literature Review
Department of Microbiology, NUS 39
Although Fliermans and Harvey (1984) reported the lack of effectiveness of
continuous bromo-chloro-dimethyl-hydantoin (BCD) treatment at 2.0ppm free
residual levels against Legionella, Australian studies (Broadbent, 1993) indicated
that a slow release of the bromocide at 300ppm were effective in controlling the
growth of Legionella. The latter study also indicated that quaternary ammonium
compounds which were frequently used for biofouling control in cooling towers
were not effective in controlling Legionella. Among non-oxidizing agents, 2,2-
dibromo-3-nitropropionamide appears to be the most effective in controlling
Legionella in water systems (Kim et al., 2002).
New biocidal actives are slow to emerge due to regulatory and environmental
concerns, but novel methods of delivery and new synergistic combinations of
existing biocides are continually being investigated for use in controlling
microorganisms in various process streams, including cooling towers (Wright,
2000). However, only few studies have been conducted on the effectiveness of
various biocides in controlling Legionella under field conditions (England et al.,
1982; Fliermans and Harvey, 1984; Elsmore, 1986; Yamamoto et al., 1991; Prince
et al., 2002). Since sensitivity testing of L. pneumophila suspended in tap water to
biocides cannot predict culture results from biocide-treated cooling towers
(England et al., 1982) and the application of biocides at concentrations
recommended by the manufacturer may not be able to reduce L. pneumophila in
cooling towers to source water concentration (Fliermans and Harvey, 1984), it is
necessary monitor Legionella counts to verify the effectiveness of new biocides
under field conditions.

Literature Review
Department of Microbiology, NUS 40
Recurrence of Legionella in biocide-treated cooling towers has been reported
(Kurtz et al., 1982) and without biocide treatment, Legionella bacteria may reach
densities that present a health risk (Negron-Alvira et al., 1988). Furthermore,
Bentham (2000) found that the culture results from Legionella samples taken from
the same systems 2 weeks apart were not statistically related in 25 out of 28
cooling tower systems studied, suggesting that the determinations of health risks
from cooling towers cannot be reliably based upon single or infrequent Legionella
tests. Considering the ubiquity of Legionella, it is prudent to diligently execute
periodic application of industrial biocide to ensure control of Legionella growth
within these devices, while frequently monitoring the effectiveness of control
measures applied.

Materials and Methods
Department of Microbiology, NUS 41
Chapter 3: Materials and Methods
3.1 Bacterial strains and culture
3.1.1 Bacterial Strains
Legionella pneumophila subsp. pneumophila, Philadelphia-1 (ATCC® 33152) was
provided by courtesy of Dr Gamini Kumarasinghe from the Department of
Laboratory Medicine, National University Hospital, Singapore. The wild type P.
aeruginosa PAO1 was a generous gift from Associate Professor Zhang Lian Hui
from Institute of Molecular and Cell Biology, Singapore while Pseudomonas
aeruginosa PAO1 tagged with cyan-fluorescent-protein (PAO1-CFP) was
generously granted by Associate Professor Tim Tolker-Nielsen from BioCentrum-
DTU, The Technical University of Denmark, Denmark (Klausen et al., 2003a).
3.1.2 Culture Media
In this study, L. pneumophila was cultured on Buffered Charcoal Yeast Extract
agar supplemented with ferric pyrophosphate, α-ketoglutarate and L-cysteine
(Edelstein BCYE agar, Oxoid Limited, U.K.) and in also Edelstein BCYE liquid
media (Appendix I). P. aeruginosa PAO1 was cultured on both Luria Bertani (LB;
Appendix II) media and minimal media (MM; Appendix III), where the latter is a
defined medium. Similarly, P. aeruginosa PAO1-CFP was cultured on LB and
MM, both media supplemented with 60µg/ml gentamicin (Sigma-Aldrich, U.S.A.;
LB+gen and MM+gen respectively) in order to select for the fluorescent tagged
cells.

Materials and Methods
Department of Microbiology, NUS 42
3.1.3 Maintenance of stock cultures
L. pneumophila was grown on Edelstein BCYE agar at 37°C for at least 2 days. P.
aeruginosa PAO1-CFP and P. aeruginosa PAO1 were grown on LB+gen and LB
agar respectively, and were incubated at 37°C for 1 day. After incubation, all the
agar plates were stored at 4°C for 3 weeks before subculturing.
To prepare cryogenized stock strains, L. pneumophila and P. aeruginosa cells at
late-log phase were harvested at 24 and 28hrs of growth respectively. Cryogenized
stocks were then prepared by suspending the cells of each strain in a final
concentration of 25% glycerol in fresh media. Finally, the cell suspensions were
dispensed into NUNCTM CryoTube Vials (NUNC, Denmark) and stored at -70°C.
3.2 Growth kinetic studies
3.2.1 Growth kinetics of L. pneumophila
Overnight culture of L. pneumophila was inoculated into fresh Edelstein BCYE
liquid medium at a 1:50 ratio and incubated at 37°C with shaking at 120rpm.
Subsequently, optical density (OD) of the culture was taken every hourly, using a
spectrophotometer (Shimadzu, Japan) at λ = 600nm. Dilutions were performed
when OD exceeds 0.5 and this study was triplicated.
Materials and Methods
Department of Microbiology, NUS 43
3.2.2 Growth kinetics of P. aeruginosa PAO1
Overnight culture of P. aeruginosa PAO1 was inoculated into fresh MM medium
at a ratio of 1:100 and incubated at 30°C with shaking at 120rpm. Subsequently,
OD600nm of the culture was taken every hourly, using spectrophotometer. Dilutions
were performed when OD exceeds 0.5 and this study was triplicated.
3.2.3 Growth kinetics of P. aeruginosa PAO1-CFP
Overnight culture of P. aeruginosa PAO1-CFP was inoculated into fresh
MM+gen medium at a 1:100 ratio and incubated at 30°C with shaking at 120rpm.
Subsequently, OD600nm of the culture was taken every hourly, using
spectrophotometer. Dilutions were performed when OD exceeds 0.5 and this study
was triplicated.
3.3 Determination of the influent flow rate (Q) for continuous
culture in CDC Biofilm Reactor (CBR)
Maximum specific growth rate (µmax) of P. aeruginosa PAO1-CFP was
determined by obtaining the gradient of exponential growth from the graph of
OD600nm against time. Doubling time (td) of P. aeruginosa PAO1-CFP was
calculated using the following formula: µmax = (ln2)/td. The determination of the
nutrient influent flow rate (Q) to be used for continuous system required that the
hydraulic residence time, θ is less than td and the following formula was applied: θ
= V/Q (where V is the maximum volume of bulk fluid in CBR during continuous
flow).

Materials and Methods
Department of Microbiology, NUS 44
3.4 Optimization of labelling processes
3.4.1 Optimization of L. pneumophila labelling with CFDA-SE
L. pneumophila cells at late-log phase were harvested at 24 hrs of growth and
washed with PBS (Appendix IV). Using PBS, cell concentration was adjusted to
approximately 109 colony forming units (CFU)/ml (corresponding to 10×
concentrate of cell suspension at OD600nm = 1) before a final concentration of
10µM 5-(and-6)-carboxyfluorescein diacetate, succinimidyl ester (CFDA-SE;
Molecular Probes Inc., U.S.A.; Appendix V) was added. The mixture was mixed
well, dispensed into 3 tubes and incubated at 37°C in the dark with shaking at
120rpm for 20, 30 and 40 mins respectively. To terminate the labelling process,
the L. pneumophila cells were centrifuged at 5,000g for 10 mins and washed twice
with PBS to remove residual CFDA-SE. A portion of the labelled cells were
plated onto BCYE agar using Miles and Misra method (Harrigan, 1998) to ensure
that the cells remained viable after the labelling process, while the remaining
portion were fixed with 1% formaldehyde (Merck, Germany) at 4°C overnight,
before analysis with flow cytometry. A tube of L. pneumophila cells that were
mock-treated with PBS instead of CFDA-SE served as a negative control and
blank.
3.4.2 Optimization of planktonic P. aeruginosa PAO1-CFP labelling with PI
P. aeruginosa PAO1-CFP cells at late-log phase were harvested at 28 hrs of
growth, fixed with 1% formaldehyde at 4°C overnight and washed with PBS.
Using PBS, cell concentration was adjusted to approximately 107 CFU/ml
(corresponding to P. aeruginosa PAO1-CFP cell suspension at OD600nm = 0.5) and

Materials and Methods
Department of Microbiology, NUS 45
separated into 2 portions. Final concentrations of freshly prepared 0.1 and
1.0mg/ml propidium iodide (PI; Sigma-Aldrich, U.S.A.) in PBS were then added
into each portion respectively. After vortexing, the mixtures were incubated at
room temperature in the dark and immediately analyzed using flow cytometry at 5
mins interval each. A tube of P. aeruginosa PAO1-CFP that were similarly
processed but mock-treated with PBS instead of PI served as a negative control
and blank.
3.4.3 Flow cytometry
A total of 10,000 cells were analyzed using flow cytometry, FACSVantageTM SE
(Becton Dickinson, U.S.A.) operated on CellQuest program. The WinMDI
Version 2.8 software was used to plot histograms with number of events against
green CFDA-SE fluorescence in 4 decade log (as FL1-H) or red PI fluorescence in
4 decade log (as PMT4 Log).
3.4.4 Optimization of P. aeruginosa PAO1-CFP biofilm labelling with PI
Approximately 107 CFU/ml CFDA-labelled L. pneumophila was inoculated into 7
days old P. aeruginosa PAO1-CFP biofilms (grown in CDC Biofilm Reactor
continous culture system) and allowed to adhere without continuous flow for 1hr.
After allowing for re-stabilization of the continuous system for 3 hours, a coupon
(on which the biofilm was formed) was harvested and soaked in 6ml 4%
paraformaldehyde (PFA) for 30mins in the dark. Then, freshly prepared 600µl of
1mg/ml PI was added into the 4% PFA, and mixed gentle (taking care not to
disturb the biofilm), and incubated at room temperature for 5, 15 and 30 mins in

Materials and Methods
Department of Microbiology, NUS 46
the dark. The staining process was terminated by transferring the coupon into
60ml sterile PBS contained in a standard petri dish, with the biofilm surface facing
upwards. A biofilm mock-treated with PBS served as a negative control.
These coupons were then viewed using confocal laser scanning microscope
(CLSM). For PI stains, image scanning was carried out with 543nm laser line
from a HeNe-G laser. To reduce background, emission filter BA-610IF was used.
Similarly, for CFP and CFDA detection, image scanning was carried out with the
405nm laser line from a LD405 laser and 488nm laser line from an M-Ar laser,
respectively. Background was also reduced using BA430-460 and BA505-525
emission filters, respectively. Images of the biofilm in the x-y plane or sections
through the biofilm were generated using Olympus FLUOVIEW Ver.1.3 Viewer.
3.5 P. aeruginosa PAO1-CFP biofilm formation in CDC Biofilm
Reactor (CBR)
3.5.1 CDC Biofilm Reactor
The CBR (BioSurface Technologies Corp., U.S.A.) is a one litre glass vessel with
an effluent spout at approximately 400ml. Continuous mixing of the reactor’s bulk
fluid was provided by a Teflon baffled stir bar that was magnetically driven by a
CERAMAG Midi magnetic stirrer (Ika®, U.S.A.). An UHMW (ultra high
molecular weight) polyethylene lid supports 8 independent polypropylene coupon
holders. Each coupon holder houses 3 removable stainless steel coupons
(diameter: 12.7mm), which served as the biofilm growth surfaces, for a total of 24
sampling opportunities. The coupons experienced a consistent high shear from the

Materials and Methods
Department of Microbiology, NUS 47
rotation of the baffled stir bar at 120rpm. The CBR operates as a continuous flow
stirred tank reactor (CFSTR), meaning that nutrients are continuously pumped
into and flow out of the reactor at the same rate.
3.5.2 Setup of CDC Biofilm Reactor assembly
Connector
Air vent
Baffled stir bar
Stainless steel
coupon
Coupon holder
Connector
Influent tap
Effluent tap
Air vent
Magnetic stirrer (120rpm)
Nutrient carboy
CBR
Air vent Peristaltic pump
Flow break
Incubator (30°C)
Waste carboy
Figure 3.1. Schematic diagram of the CDC Biofilm Reactor assembly used in this study. The arrow head indicated the direction of continuous flow when the peristaltic pump was switched on. Biofilm was formed on the surface of stainless steel coupons which was facing the baffled stir bar indicated by the striped coupons.

Materials and Methods
Department of Microbiology, NUS 48
An autoclavable 10L carboy (Nalge Nunc International, U.S.A.) was used to
contain fresh media to feed into CBR. The carboy top was equipped with 2 barbed
fittings to accommodate the tubings for nutrient and air vent, HEPA-VENTTM
(Whatman, U.K.) attachment. Incorporation of an autoclavable connector before
peristaltic pump facilitated the changing of emptied nutrient carboy with another
that was filled with sterile 10L fresh media. Peristaltic pump, Masterflex® Digital
Console Pump (Cole-Parmer Instrument Company, U.S.A.), was only switched on
for pumping media into CBR during continuous flow phase and the Masterflex®
precision tubing (Cole-Parmer Instrument Company, U.S.A.) passing through the
pump head had an internal diameter of 14mm. Before the fresh media entered
CBR, a flow break (BioSurface Technologies Corp., U.S.A.) prevented backward
contamination of media carboy from CBR. The bulk fluid in CBR was well mixed
by the baffled magnetic stir bar and extra fluid in CBR was drained into the waste
carboy. Positioning of a connector after the spout of CBR allowed changing of a
filled waste carboy with an autoclaved empty carboy.
3.5.3 P. aeruginosa PAO1-CFP biofilm formation
An overnight culture of P. aeruginosa PAO1-CFP (grown in MM+gen at 37°C
with shaking at 120rpm) was inoculated into 400ml fresh MM medium in CBR at
a ratio of 1:100 under sterile conditions. The inoculated CBR was then operated as
a batch culture system at 30°C with 120rpm stirring for 24 hours, with closed
influent and effluent taps. After which, the CBR was switched to continuous
culture phase where both influent and effluent taps were released and a continuous
flow of fresh MM medium was pumped into the CBR at a constant influent flow

Materials and Methods
Department of Microbiology, NUS 49
rate of 2.5ml/min (Refer to Chapter 4.2 for the determination of influent flow
rate). Kinetics of P. aeruginosa PAO1-CFP biofilm formation was monitored by:
• Taking planktonic and biofilm samples,
• Enumerating P. aeruginosa PAO1-CFP by plating onto LB+gen plates,
• Detecting contamination from exogenous source(s) by plating onto LB
plates,
• Visualizing biofilm structure using confocal laser scanning microscopy
(CLSM), and
• Image analysis using COMSTAT image analysis software package
(Heydorn A. et al., 2000)
For the study of P. aeruginosa PAO1-CFP biofilm formation, six independent
experiments were performed. For each experiment, there were 6 sampling points
as shown in table 3.1. For image data acquisition, at least 3 image stacks were
taken from 1 or 2 coupon samples at each time point.
Table 3.1. Sampling points of 6 independent experiments for the study of P. aeruginosa PAO1-CFP biofilm formation.
Days from start of continuous culture
Experiment 1 to 3 Experiment 4 to 6
2 3 4 5 6 7 8 9 10 11

Materials and Methods
Department of Microbiology, NUS 50
3.6 Introduction of L. pneumophila into P. aeruginosa PAO1-CFP
biofilms
Approximately 109 CFU/ml L. pneumophila grown to late log phase, was stained
with 10µM CFDA-SE for 30 mins and washed with PBS twice, before a ratio of
1:100 was inoculated into the CBR containing developing (Day 3) or mature
biofilm (Day 7). A portion of the legionellae inoculum was serially diluted and
enumerated by immunofluorescence. The continuous flow was stopped for the
adhesion of L. pneumophila onto pre-formed P. aeruginosa PAO1-CFP biofilm
and restarted 1 hr later. Samples of bulk fluid and biofilm were taken immediately
before the addition of L. pneumophila, 3 hrs after the continuous flow was
restarted (to allow for re-stabilization of the continuous flow system) and
everyday for up to 5 days after inoculation. Adhesion and persistence of L.
pneumophila was monitored by:
• Enumerating L. pneumophila by immunofluorescence method,
• Visualizing legionellae distribution using confocal laser scanning
microscopy (CLSM), and
• Image analysis using COMSTATWCY image analysis software package.
At the same time, the surface-to-biovolume ratio and porosity distributions of the
biofilm were also monitored by applying COMSTATLAYER and
COMSTATWCY image analysis software package respectively. At least 3
independent experiments were carried out for each developing stage of biofilm
development. For image data acquisition, at least 3 image stacks were taken from
1 or 2 coupon samples at each time point.

Materials and Methods
Department of Microbiology, NUS 51
3.7 Introduction of NALCO 7320 into developing and mature P.
aeruginosa PAO1-CFP biofilms containing L. pneumophila
According to the procedure mentioned in Chapter 3.6, L. pneumophila was
introduced into developing and mature biofilms on day 3 and day 7 respectively.
Twenty four hours later, the peristaltic pump was stopped and fresh culture media
with a final concentration of 100ppm of NALCO 7320 was connected to CBR
continuous flow system. At time zero, 315µl of 100,000ppm NALCO 7320 was
added into the CBR, yielding a final concentration of 100ppm NALCO 7320
within the CBR with the constant mixing by baffle. At the same time, the
peristaltic pump was switched on again, bringing in fresh supply of nutrients and
biofilm removing agent.
Samples of bulk fluid and biofilm were taken before and immediately after the
addition of NALCO 7320. Samples were also taken in the subsequent 4, 8, 12 and
24hrs. Persistence of P. aeruginosa PAO1-CFP and L. pneumophila was
monitored by:
• Enumerating P. aeruginosa PAO1-CFP and L. pneumophila by culture and
immunofluorescence methods respectively,
• Visualizing biofilm structure, biofilm porosity and legionellae distribution
using confocal laser scanning microscopy (CLSM), and
• Image analysis using COMSTAT and COMSTATWCY image analysis
software package respectively.

Materials and Methods
Department of Microbiology, NUS 52
Two independent biofilm experiments were carried out for each developing stage
of biofilm development. However, at least 3 image stacks were taken from each of
the 2 coupon samples at each time point.
3.8 Monitoring of each organism in CBR continuous flow system
3.8.1 Preparation for sampling
In preparation of sampling under sterile conditions, 75% denatured ethanol was
sprayed on and around the CBR lid and allowed to air dry for approximately 2
mins. Disturbance to the air within the 30°C incubator was minimized to prevent
contamination of the continuous culture.
3.8.2 Taking samples
3.8.2.1 Sampling bulk fluid
For every sampling point, two 1ml planktonic samples were taken and processed
in parallel. To take planktonic samples, one of the 8 coupon holders was removed
and placed inside a 1L sterile glass bottle (for biofilm sampling) before inserting a
1ml pipette into the CBR to sample the bulk fluid repeatedly. Once removed, the
coupon holder with biofilm covered coupons cannot be replaced back into CBR
because air-water interval of the bulk fluid can detach the biofilm significantly.
For every coupon holders removed, a sterile rubber bung was used to stopper the
hole in the CBR lid to prevent the entry of exogenous contaminants.
Materials and Methods
Department of Microbiology, NUS 53
3.8.2.2 Sampling biofilm
For every sampling point, one coupon holder accommodating 3 coupons was
removed. One out of the 3 coupons was used for enumeration by plating and the
rest were prepared for visualization by CLSM. The coupon holder was held
straight up and removed from the 1L bottle. Any drips were collected in a sterile
petri dish placed beneath the rod. All 3 set screws were loosen with sterile set
screw driver (BioSurface Technologies Corp., U.S.A.) to release the coupons,
which were then removed using sterile haemostat, being careful not to disturb the
biofilm on coupon surface that was facing the interior of CBR. Once the coupons
were removed, the coupon holder was re-inserted back to the CBR so as to
minimize any changes in the final volume of bulk fluid in the CBR.
3.8.3 Preparation of coupons
3.8.3.1 Preparation of coupons intended for enumeration
A coupon was held in place on a petri dish with a sterile haemostat and scraped on
the side that faced the baffle with a sterile toothpick. The loosened biofilm was
washed into an empty eppendorf tube using 1ml PBS and then the toothpick was
rinsed by swirling on the bottom of the tube.
3.8.3.2 Preparation of coupons intended for visualization by CLSM
A coupon was immersed in 6ml 4% paraformaldehyde (PFA; Appendix VI)
contained in small sterile tissue culture plates (35×10mm; NuncTM, Denmark) at
room temperature for 30 mins in the dark. Slow immersion of coupon into liquid
resulted in significant biofilm sloughing off, thus each coupon was held near to

Materials and Methods
Department of Microbiology, NUS 54
the liquid surface using a haemostat with the biofilm surface facing upwards and
dropped directly into the liquid below. This was done as soon as the coupon was
removed from CBR so as to prevent drying up of the biofilm. Then, freshly
prepared 600µl of 1mg/ml PI was added into 6ml 4% PFA, pipetted up and down
for gentle mixing, and incubated at room temperature for 5mins in the dark. The
staining process was promptly terminated by dropping the coupon into 60ml
sterile PBS contained in a standard petri dish, with the biofilm surface facing
upwards.
Taking care not to touch the top surface of the coupon where the biofilm was to be
visualized, the bottom of coupon was dried using a tissue paper and then placed in
a humid chamber with the biofilm surface facing upwards. To preserve the
fluorescence in the samples, a 20×60mm coverslip with 20µl of FluorSaveTM
Reagent (Merck, Germany) dropped in the middle was inverted and mounted onto
the biofilm surface of the coupon. The mounted coupons were then stored at 4°C
in a humid chamber in the dark for not more than 1 week. These mounted coupons
were air dried at room temperature in the dark overnight before viewing under
CLSM.
3.8.4 Disaggregation by homogenization
For a more accurate enumeration of each organism in either planktonic or biofilm
samples, the samples were subjected to disaggregation by homogenization before
serial dilution. Firstly, 750µl of planktonic and biofilm samples were transferred
into sterilized disposable culture tubes (Asahi Techno Glass Corporation, Japan)

Materials and Methods
Department of Microbiology, NUS 55
and homogenized at 20,500rpm for 30 secs using a sterile homogenizer probe, T
25 basic ULTRA-TURRAX® (Ika®, U.S.A.). The probe was cleaned between
samples by firstly rinsing for 30 secs at 20,500rpm in 10ml of sterile PBS,
followed by rinsing at 20,500rpm for 15 secs in 10ml of 75% ethanol. The probe
was then soaked in the ethanol for 1 min. Finally, the probe was rinsed two more
times with 10ml PBS at 20,500rpm for 30 secs each. Any excess liquid on the
probe was removed by gently tapping the tip of the probe against the inner wall of
the last tube containing PBS before inserting the probe into the sample.
3.8.5 Enumeration of each organism
3.8.5.1 Enumeration of P. aeruginosa PAO1-CFP by culture
The disaggregated planktonic and biofilm samples were serially diluted using PBS
as diluent and plated onto LB+gen plates respectively, using Miles and Misra
method (Harrigan, 1998) in duplicates. The plates were then incubated at 37°C for
24 hrs. Density of planktonic P. aeruginosa PAO1-CFP was expressed as Log10
[colony-forming units (CFU)/ml of bulk fluid] while that of biofilm P. aeruginosa
PAO1-CFP was expressed as Log10 (CFU/mm2). Respective calculations were
shown below:
Planktonic P. aeruginosa PAO1-CFP count
Log10 (CFU/ml) = Log10 [(Average CFU/drop of 25µl) × 40 × Dilution Factor]
Biofilm P. aeruginosa PAO1-CFP count
Log10 (CFU/mm2)
= Log10 {[(Average CFU/drop of 25µl) × 40 × Dilution Factor] / Area of coupon}

Materials and Methods
Department of Microbiology, NUS 56
= Log10 {[(Average CFU/drop of 25µl) × 40 × Dilution Factor] / [π (12.7/2) 2]}
3.8.5.2 Enumeration of L. pneumophila by immunofluorescence
L. pneumophila counts were monitored by immunofluorescence method where L.
pneumophila Serogroup 1 Direct Fluorescent Antibody Kit (PRO-LAB
Diagnostics, Canada) was used. Briefly, 20µl of homogenized planktonic and
biofilm samples was placed on the 6mm diameter wells in the Bellco® Antibody
Slides (Bellco® Glass Inc., U.S.A.), air-dried and gently heat fixed. L.
pneumophila sergroup 1 DFA Reagent (FITC-monoclonal antibody conjugate)
was applied to each well and the slides were incubated in a moist chamber for 30
mins at 37°C in the dark. The slides were then rinsed with PBS to remove the
conjugates and rinsed with dH2O before air dried. Lastly the slides were mounted
and examined using a fluorescence microscope (Olympus, Japan) within 24 hrs.
FITC-labelled antibody-antigen complex was detected by exposing the slide to
ultraviolet light and L. pneumophila cells appeared as bright yellow-green bacilli
under a 40× objective. At least 3 fields were examined for legionellae count.
Wells containing only L. pneumophila cells and only P. aeruginosa PAO1-CFP
cells served as positive and negative control respectively.
Density of planktonic L. pneumophila was expressed as Log10 (cells/ml of bulk
fluid) while that of biofilm L. pneumophila was expressed as Log10 (cells/mm2).
Calculations were shown below:

Materials and Methods
Department of Microbiology, NUS 57
Planktonic L. pneumophila count
Log10 (cells/ml)
= Log10 [(Average number of cells per field) × (Area of each well/Area of each
field*) × (50/concentration factor)]
= Log10 [(Average number of cells per field) × (π(3)2 / π(0.2)2) ×
(50/concentration factor)]
Biofilm L. pneumophila count
Log10 (cells/mm2)
= Log10 {[(Average number of cells per field) × (Area of each well/Area of each
field*) × (50/concentration factor)] / (Area of coupon)}
= Log10 {[(Average number of cells per field) × (π(3)2 / π(0.2)2) ×
(50/concentration factor)] / (π(12.7/2)2)}
* Diameter of each field of 40× objective was measured using a stage micrometer.
L. pneumophila adhesion to P. aeruginosa PAO1-CFP biofilm
Number of legionellae adhering to biofilm per coupon per 106 legionellae
inoculated into CBR
= (Number of legionellae per coupon/ Total number of legionellae inoculated into
CBR) × 106

Materials and Methods
Department of Microbiology, NUS 58
L. pneumophila persistence in P. aeruginosa PAO1-CFP biofilm
Percentage legionellae remaining in biofilm
= (Biofilm legionellae count at day n/ Biofilm legionellae count on day of
inoculation) × 100%
where, n = number of days following legionellae inoculation
Loss of L. pneumophila from biofilm
Amount of legionellae loss from biofilm
= (Biofilm legionellae count before the addition of biocide - Biofilm legionellae
count at 24hrs of exposure to biocide)
Loss of L. pneumophila per unit biomass lost
Legionellae loss per unit biomass lost
= (Biofilm legionellae count before the addition of biocide - Biofilm legionellae
count at 24hrs of exposure to biocide)*1000 / (Bio-volume before addition of
biocide – Bio-volume at 24hrs of exposure to biocide)
= (cells/mm3)
3.8.6 Detection of exogenous contaminants
In addition to plating on LB+gen for P. aeruginosa PAO1-CFP counts, serially
diluted samples were also plated on LB for detection of exogenous contaminants
using Miles and Misra method. Similarly, these plates were incubated at 37°C for
24 hrs before observation.

Materials and Methods
Department of Microbiology, NUS 59
3.8.7 Visualization and image acquisition by CLSM
At each sampling point, two coupons were processed for visualization by CLSM.
From each coupon, at least three image stacks were acquired from random
positions using Olympus FV500 confocal scanning laser microscope (Olympus
Corporation, Japan).
Images were acquired at 1.0µm intervals down through the biofilm, thus the
number of images in each stack varied according to the thickness of the biofilm.
The 512 pixels × 512 pixels images were obtained with a PlanApo 60× /1.40 oil
immersion objective. Together, each pixel was considered as a box (voxel) with
the dimensions 0.41432µm3 (x-axis) × 0.41432µm3 (y-axis) × 1.000µm3 (z-axis).
Since each image had a coverage of 45,000µm2, thus a total of 3 images per
coupon reflected the coverage of >100,000µm2 per coupon, sufficient to obtain a
representative data of the Pseudomonas biofilm (Korber et al., 1993). For CFP, PI
and CFDA, image scanning was carried out using the 405nm laser line from a
LD405 laser, 543nm laser line from a HeNe-G laser and 488nm laser line from an
M-Ar laser respectively. To reduce background, either emission filter BA430-460,
BA-610IF and BA505-525 was used respectively. Variables that may influence
the quality of the images for each fluorescence, like the photomultiplier tube
(PMT), confocal aperture (CA) and laser power, were kept constant for all
experiments.

Materials and Methods
Department of Microbiology, NUS 60
3.8.8 Application of COMSTAT image analysis software package
COMSTAT (Heydorn et al., 2000) was written as a script in MATLAB 5.1 (The
MathWorks Inc., Natick, Massachusetts), equipped with Image Processing
Toolbox. The COMSTAT package contained 5 programs (COMSTAT,
CHECKALL, LOOK, LOOKTIF and CONVERT000) and a number of functions
used by the programs.
3.8.8.1 Preparation of image stacks
In order to store image data in a format that can be analyzed by COMSTAT, the
images were prepared as follows:
• Images of a stack, of each fluorescence type, acquired by CLSM were
extracted and saved as individual ‘.tif’ files in the MATLABR11/work
folder using Olympus FLUOVIEW Ver.1.3 Viewer.
• An ‘.info’ file was created using Notepad by writing a text file with the
extension ‘.info’ and the ‘.info’ file contained vital information of the
image stack arranged in the following order:
Range #1# #13# Pixelsize (x) #0.41432# Pixelsize (y) #0.41432# Pixelsize (z) #1.000# ‘Range’ reflected the number of images in this stack. The ‘pixelsize’
represented the distance between 2 neighboring pixels and was given in

Materials and Methods
Department of Microbiology, NUS 61
micrometer. The name of the ‘.info’ file was also changed according to the
name of the images in the stack.
• The original MATBLAB script of the CONVERT000 program was
improved to allow renaming and reversing the order of the images of a
stack in a way that COMSTAT can analyze. The improved program was
named “CONVERTWKL”.
• CHECKALL program was run to check that all the stacks of images were
intact.
3.8.8.2 Thresholding of images
After the image preparations, LOOK program was run to allow manual
determination of the threshold value for each stack of images of different
fluorescence type. LOOKTIF program allowed closer view of individual images.
Such thresholding of a stack of images in COMSTAT resulted in the formation of
a 3-dimensional matrix with a value of ONE in positions where pixel values in the
original image were above or equal to the threshold value (representing biomass
or data point of biofilm) and ZERO where the pixel values were below the
threshold value (representing background).
3.8.8.3 COMSTAT image analysis for P. aeruginosa PAO1-CFP biofilm
structure
To study P. aeruginosa PAO1-CFP biofilm structure, stacks of CFP images were
analyzed by COMSTAT program running on ‘connected volume filtered images’.
Connected volume filtration of the stacks of images removed noise from images

Materials and Methods
Department of Microbiology, NUS 62
by removing biomass that is not in some way connected to the substratum. The
following COMSTAT image analysis features were run:
• Bio-volume (µm3/µm2) - volume of the biofilm normalized by the surface
area of the field of view.
• Average thickness (µm) – average biofilm height taken over the entire
field of view.
• Maximum thickness (µm) – maximum distance from the substratum that
the biofilm reaches.
• Surface to bio-volume ratio (SBR) (µm2/µm3) – the area summation of all
biomass voxel surfaces exposed to the background per unit bio-volume,
thus reflects the fraction of biofilm apparently exposed to nutrient flow.
• Substratum coverage (%) – the area coverage in the first image of the
stack, i.e. at the substratum, thus reflects how efficiently the substratum is
colonized by bacteria of the population.
• Roughness coefficient – a measure of variability in biofilm thickness and
consequently, an indicator of biofilm heterogeneity.
To obtain the distribution of bio-volume, the image analysis program COMSTAT
was improved to report the number of CFP pixels in each layer of the biofilm. The
improved program was named “COMSTATWCY” and run with connected
volume filtration. For each stacks of images, the number of CFP pixels belonging
to each sections of the biofilm were summed up. Bio-volume of the biofilm was
then calculated using the following formula:

Materials and Methods
Department of Microbiology, NUS 63
Bio-volume
Bio-volume (µm3µm-2) = [(Number of CFP pixels × voxel size) / (area of the field
of view)]
Loss of bio-volume
Amount of bio-volume loss
= (Bio-volume before the addition of biocide – Bio-volume at 24hrs of exposure
to biocide)
To obtain the distribution of SBR, the image analysis program COMSTAT was
improved to report the SBR in each layer of the biofilm. The improved program
was named “COMSTATLAYER” and run with connected volume filtration.
Surface area of each layer of the biofilm was then obtained by dividing SBR with
corresponding bio-volume. For each stack of images, both the surface area and
bio-volume belonging to each sections of the biofilm were summed up separately
before calculating the sectional SBR by dividing sectional surface area with
corresponding sectional bio-volume.
3.8.8.4 COMSTAT image analysis for porosity of P. aeruginosa PAO1-CFP
biofilm
To study the porosity of the biofilms, COMSTATWCY was used to analyze the
stacks of PI and CFP images, and run without connected volume filtration. The
report of the analysis detailed the number of PI and CFP pixels in each images of
a stack, that is, in each layer of the biofilm. For each stack of images, the numbers

Materials and Methods
Department of Microbiology, NUS 64
of PI and CFP pixels belonging to each sections of the biofilm were summed up.
Porosity of the biofilm was then calculated using the following formula:
Porosity
Porosity = [Number of PI pixels / (Number of CFP pixels × voxel size)] = Number
of PI pixels per µm3 of biomass
3.8.8.5 COMSTAT image analysis for L. pneumophila distribution
COMSTATWCY was also used to analyze the stacks of CFDA images, without
connected volume filtration. The report stated the number of CFDA pixels in each
layer of the biofilm. For each stack of images, the numbers of CFDA pixels
belonging to each sections of the biofilm were summed up while the CFP data was
the same as that in the above section. Subsequently, the following calculations
were performed:
L. pneumophila concentration
Log (Legionellae concentration)
= Log [Number of CFDA pixels / (Number of CFP pixels × voxel size)]
= Log (Number of CFDA pixels per µm3 of biomass)
L. pneumophila loss from P. aeruginosa PAO1-CFP biofilm
% Loss of legionellae
= {[(legionellae concentration at day of inoculation) – (legionellae concentration
at day n)] / (legionellae concentration at day of inoculation)} × 100%
where, n = number of days following legionellae inoculation

Materials and Methods
Department of Microbiology, NUS 65
3.8.9 Statistical analysis
All statistical analyses in this study were carried out using SPSS 13.0.
Independent samples t-test was used to compare the means for 2 groups of cases.
If the significance value for the Levene test was high (typically greater than 0.05),
equal variances for both groups were assumed. A low significance value for the t-
test (typically less than 0.05) indicated significant difference between the 2 group
means. In addition, if the confidence interval for the mean difference did not
contain zero, this indicated that the difference was significant.
Pearson correlation was used to determine if there is a linear association between
variables on the assumption that the data are normally distributed. The values of
the correlation coefficient ranged from -1 to 1. The sign of the correlation
coefficient indicated the direction of the relationship while the absolute value of
the correlation coefficient indicated the strength, with larger absolute values
indicating stronger relationships. The significance level (or p-value) was the
probability of obtaining results as extreme as the one observed.
3.9 Screening for effective P. aeruginosa PAO1 biofilm-removing
agent
3.9.1 Kinetics of P. aeruginosa PAO1 biofilm formation in microtiter plate
An overnight culture of P. aeruginosa PAO1 (grown in MM at 37°C with shaking
at 120rpm) was inoculated into fresh MM medium at a ratio of 1:100. The freshly
inoculated medium was dispensed into each of the 8 wells (100µl per well) of the
first column of non-tissue culture treated, flat bottom, 96-well polystyrene plates

Materials and Methods
Department of Microbiology, NUS 66
(BD FalconTM, U.S.A.). The inoculated 96-well plate was then incubated at 30°C
with shaking at 120rpm, while the remaining inoculated medium was stored at
4°C to prevent any growth. At every 2 hr interval, the inoculated medium was
mixed well and dispensed in the same way, into the subsequent column of 8 wells.
One column of every 96-well plate contained only MM (blank and negative
control). After 40 hrs from the first inoculation, the biofilm formed on the walls of
each wells were quantified as described below. Three independent experiments
were conducted for this study.
3.9.2 Quantification of biofilm (O’Toole et al., 1999)
After biofilm was formed in 96-well plates, optical density reflecting total
bacterial growth (OD600nm) of the 96-well plates were first taken using ELISA
Touch Screen plate reader (Tecan, Austria) operated on Magellan2 software. The
spent culture medium, together with unattached bacteria, were then carefully
removed from each wells and replaced with 100µl of 1% (w/v) crystal violet in
deionized water (dH2O). After 10 mins of incubation at room temperature, excess
crystal violet was washed away by rinsing the plate in several basins of dH2O.
These washed plates were then tapped to remove excess water and air-dried.
Biofilm-bound crystal violet (reflecting the amount of biofilm formed) was
solubilized by adding 100µl of 95% ethanol to each well, incubated at room
temperature with shaking at 100rpm for 10 mins and then quantified by measuring
OD470nm of the 96-well plates.

Materials and Methods
Department of Microbiology, NUS 67
3.9.3 Biofilm-removing agents used
To obtain the most effective biofilm-removing agent, commercially available
products of a variety of nature were screened. All 8 biofilm-removing agents used
in this study were listed in table 3.2.
Table 3.2. All biofilm-removing agents used. * represents active ingredients of the various biofilm-removing agents.
Biofilm-removing
agents Ingredients Proportion
%(w/w) Applications
- Sodium Hypochlorite* 5.0-10.0 - Sodium Hydroxide* 1.0-5.0
ACTI-PLUS 2818
- Inorganic salt (s) and water To 100
Stabilized sodium hypochlorite microorganism control chemical
- Dimethyl-Dioctyl-Ammonium Chloride*
10.0-30.0
- Ethanol 1.0-5.0
NALCO 90001
- Water To 100
Algaecide
- 2,2-Dibromo-3-nitrilopropionamide (DBNPA)*
10.0-30.0
- Dibromoacetonitrile 0.1-1.0
NALCO 7320
- Glycol and water To 100
Microorganism control chemical
- 5-chloro-2-methyl-4-isothiazolin-3-one*
1.1
- 2-methyl-4-isothiazolin-3-one*
0.1-1.0
NALCO 7330
- Water To 100
Biocide
- Glutaraldehyde* 30.0-60.0 NALCO 7338 - Water To 100
Biocide
NALSPERSE ® 7348
- Polyglycol* 100 Biodispersant
- C10-16 Polyglycoside* 10.0-30.0 - C8-10 Polyglycoside* 10.0-30.0
NALCO 73550
- Water 100
Biodetergent
- Enzyme protein Protease Subtilisin*
proprietary COOLING TOWER QUARTERLY CLEANER
- Enzyme protein Metalloprotease*
proprietary
Concentrated enzymatic formulation for digestion of

Materials and Methods
Department of Microbiology, NUS 68
- Enzyme protein Lipase triacylglycerol*
proprietary
- Enzyme protein Cellulase* proprietary - Enzyme protein Cellulase* proprietary - Enzyme protein Amylase* proprietary - Enzyme protein Alpha-Amylase*
proprietary
- 5-Chloro-2-methyl-4-isothiazolin-3-one*
<0.09
- 2-Methyl-4-isothiazolin-3-one*
<0.09
- Linear alkyl pyrrolidone <5 - Polyethylene oxide derivative of synthetic alcohols
<20
- Polyoxyethylene, polyoxypropylene, polyoxybuthylene ether of a mixture of aliphatic alcohols
<10
- Glycerine <10 - Borax <10
biological debris, biofilm, protozoa and reducing bacterial resistance to common biocides
3.9.4 P. aeruginosa PAO1 biofilm removal screening
P. aeruginosa PAO1 biofilm was formed in 96-well plates for 12 hrs at 30°C with
shaking at 120rpm before biofilm-removing agents, diluted with dH2O to varying
concentrations (in terms of parts per million, ppm), were added into each column
of 8 wells and their efficiency of biofilm removal were monitored over the
subsequent 8 hrs (with 2 hrs interval). The concentrations of biofilm-removing
agents used were 10, 50, 100, 500 and 1000ppm. One column of every 96-well
plate was mock-treated with dH2O (negative control) and similarly, one column of
every 96-well plate contained only MM (blank). Three independent experiments
were conducted for this study.

Materials and Methods
Department of Microbiology, NUS 69
3.10 Antimicrobial susceptibility testing of NALCO 7320
Standard macrodilution method (Ferraro, 2003) was used to ascertain the
minimum inhibitory concentration (MIC) and minimum bactericidal concentration
(MBC) of NALCO 7320. P. aeruginosa PAO1 and L. pneumophila cells grown to
late-log phase were harvested at 28 and 24 hrs of growth respectively, and re-
suspended in PBS. Cell concentrations were adjusted to OD600nm = 0.5 and
enumerated by Miles and Misra method on appropriate agar. 3ml of culture media,
MM for P. aeruginosa PAO1 and 20% BCYE broth for L. pneumophila,
containing different concentrations of biofilm-removing agents (1,000ppm,
500ppm, 100ppm, 50ppm and 10ppm) were inoculated with 100µl of the cell
suspension and incubated at 30°C for 24 hrs. One tube was mock-treated with
dH2O (negative control) and similarly, one tube contained culture media only
(blank).
The MIC was recorded as the lowest concentration of biofilm-removing agent that
completely inhibited visible growth. The MBC was determined by spread plating
100µl from the tubes with no visible growth onto appropriate agar. Three
independent experiments were conducted for this study.

Results
Department of Microbiology, NUS 70
Chapter 4: Results
4.1 Growth kinetics
Figure 4.1, 4.2 and 4.3 illustrated the growth kinetics and time taken to reach late
log phase of L. pneumophila ATCC 33152, P. aeruginosa PAO1 and P.
aeruginosa PAO1-CFP respectively. All Legionella, P. aeruginosa PAO1 and P.
aeruginosa PAO1-CFP cells used in the subsequent experiments were harvested at
late log phase, unless otherwise stated.
Growth Curve of L. pneumophila ATCC 33152
0.0
1.0
2.0
3.0
4.0
5.0
6.0
0 5 10 15 20 25 30 35
Time (hr)
OD
(600
nm)
Late Log Phase (24hr)
Figure 4.1. Growth curve of L. pneumophila cultured in BCYE broth at 37°C with shaking at 120rpm. The error bars represent standard deviation of 3 independent experiments.

Results
Department of Microbiology, NUS 71
Growth Curve of Pseudomonas aeruginosa PAO1
0.0
0.2
0.4
0.6
0.8
1.0
1.2
1.4
1.6
1.8
2.0
0 5 10 15 20 25 30 35
Time (hr)
OD
(600
nm)
Late Log Phase (28hr)
Figure 4.2. Growth curve of P. aeruginosa PAO1 cultured in MM liquid media at 30°C with shaking at 120rpm. The error bars represent standard deviation of 3 independent experiments.
Growth Curve of Pseudomonas aeruginosa PAO1-CFP
0.0
0.2
0.4
0.6
0.8
1.0
1.2
1.4
1.6
1.8
2.0
0 5 10 15 20 25 30 35
Time (hr)
OD
(600
nm)
Late Log Phase (28hr)
Exponential Phase
Figure 4.3. Growth curve of P. aeruginosa PAO1-CFP cultured in MM liquid media at 30°C with shaking at 120rpm. The error bars represent standard deviation of 3 independent experiments.

Results
Department of Microbiology, NUS 72
4.2 Determination of the influent flow rate (Q) for continuous
culture in CDC Biofilm Reactor (CBR)
Exponential growth phase of Pseudomonas aeruginosa PAO1-CFP
y = 0.2505x - 6.5649R2 = 0.9951
-2.0
-1.5
-1.0
-0.5
0.0
0.5
1.0
18 20 22 24 26 28 30
Time (hr)
Ln [O
D (6
00nm
)]
Figure 4.4. Graph of Ln(OD600nm) against time (hr) was plotted for the exponential growth phase of P. aeruginosa PAO1-CFP, so as to obtain the maximum specific growth rate, which was reflected by the gradient of the best straight line plotted. The error bars represent standard deviation of 3 independent experiments.
From figure 4.4, the maximum specific growth rate (µmax) = 0.2505 hr-1
= 4.18 × 10⁻³ min-1.
Doubling time (td) = ln2 / µmax = ln2 / (4.18 × 10⁻³) = 165.8 mins = 2.76 hr.
In order to select for biofilm growth in the CBR, the hydraulic residence time (θ)
must be less than the doubling time for the suspended cells. This will result in the
suspended cells washing out of the reactor, leaving only biofilm.

Results
Department of Microbiology, NUS 73
To determine the nutrient influent flow rate (Q) such that θ < td, the following
calculations were performed:
Since θ = V/Q,
V/Q < 165.8
Q > V/165.8
Q > 400 / 165.8
∴Q > 2.41 ml/min
Where, V is maximum volume of bulk fluid in CBR during continuous flow (with
all coupons and coupon holders removed) = 400ml.
In conclusion, continuous culture were conducted with Q = 2.5ml/min.
As such, highest possible θ = V/Q = 400 / 2.5 = 160mins = 2.6hr.

Results
Department of Microbiology, NUS 74
4.3 Optimization of labelling processes
4.3.1 Optimization of L. pneumophila labelling with CFDA-SE
Together, figure 4.5 and table 4.1, show that 30mins was the longest treatment
duration (with 10µM CFDA-SE) that resulted in more than 95% of Legionella
cells being labeled with CFDA without compromising viability.
(A) (B) (C) (D)
FL1-H FL1-H FL1-H FL1-H
Figure 4.5. Histograms illustrating the number of events (cells) plotted against FL1-H (representing green fluorescence of CFDA-stained cells) for L. pneumophila cells that were (A) mock treated, or treated with CFDA-SE for (B) 20mins, (C) 30mins, or (D) 40mins. Table 4.1. Effect of treatment duration on staining and viability of L. pneumophila cells. * represents % Cells stained represented the area of graph (see above) under Marker 1 (M1). Duration of treatment with CFDA-SE Mock-treated 20mins 30mins 40mins % Cells stained*
1.90% 97.0% 97.0% 97.5%
% Viable cells after staining process
- 100% 100% 86.8%

Results
Department of Microbiology, NUS 75
4.3.2 Optimization of planktonic P. aeruginosa PAO1-CFP labelling with PI
Figure 4.6 and table 4.2 below, show that within 5mins of 1.0mg/ml PI treatment,
majority (up to 88.1%) of formaldehyde fixed P. aeruginosa PAO1-CFP cells
picked up PI stain. Unsurprisingly, fewer cells attained the comparable level of
fluorescence for the same treatment duration when 0.1mg/ml PI was used instead
(figure 4.7 and table 4.2). In addition, even after 30mins of treatment with
0.1mg/ml PI, only 64.2% of the cells attained comparable high level of
fluorescence. These imply that the PI concentration of 0.1mg/ml was limited for
substantial staining of a 107 CFU/ml P. aeruginosa PAO1-CFP cell suspension.
igure 4.6. Histograms illustrating the number of events (cells) plotted against
(A) (B) (D) (C)
FPMT4 Log (representing red fluorescence of PI-stained cells) for P. aeruginosa PAO1-CFP cells that were (A) mock treated, or treated with 1.0mg/ml PI for (B) 5mins, (C) 10mins, or (D) 15mins.

Results
Department of Microbiology, NUS 76
(A) (B) (C)
(D) (E)
Figure 4.7. Histograms illustrating the number of events (cells) plotted against PMT4 Log (representing red fluorescence of PI-stained cells) for P. aeruginosa PAO1-CFP cells that were (A) mock treated, or treated with 0.1mg/ml PI for (B) 5mins, (C) 10mins, (D) 15mins, or (E) 30mins. Table 4.2. Effect of treatment duration on staining of P. aeruginosa PAO1-CFP cells. * represents % Cells stained represented the area of graph (see above) under Marker 1 (M1).
Duration of treatment in 1.0mg/ml PI
Duration of treatment in 0.1mg/ml PI
Negative control
5mins 10mins 15mins 5mins 10mins 15mins 30mins
% Cells stained*
9.91% 88.7% 91.8% 92.8% 55.0% 53.3% 60.2% 64.2%

Results
Department of Microbiology, NUS 77
4.3.3 Optimization of P. aeruginosa PAO1-CFP biofilm labelling with PI
When a low concentration of 0.1mg/ml PI was applied to formaldehyde-fixed 7
days old P. aeruginosa PAO1-CFP biofilm with L. pneumophila for merely
5mins, regions of the biofilm with the greatest access to the external dye was
observed to be stained with a higher intensity of redness (figure 4.8 (C)). Since
freshly introduced L. pneumophila co-localized with these regions as seen in
figure 4.8 (D), this further affirms the proposition that the more PI pixels per unit
biomass, the higher the porosity of the biofilm.
(A) (B)
(C) (D)
Figure 4.8. CLSM images of a 7 day old P. aeruginosa PAO1-CFP biofilm and adhered L. pneumophila, stained with 0.1mg/ml PI for 5mins: (A) P. aeruginosa PAO1-CFP biofilm (blue fluorescence), (B) CFDA-stained L. pneumophila (green fluorescence), (C) PI-stained P. aeruginosa PAO1-CFP biofilm, and (D) overlapping display of the above 3 images. The scale represents 30µm in each image. Arrow indicates the porous flow channel within cell clusters of biofilm.

Results
Department of Microbiology, NUS 78
However, when the PI treatment duration was increased to 15mins (figure 4.9) and
30mins (figure 4.10), the biofilms were over-stained and regions of higher
porosity were not discernible. Henceforth, a concentration of 0.1mg/ml PI and
treatment duration of 5mins were applied to all biofilm samples intended for
CLSM examination.
(C) (D)
(A) (B)
Figure 4.9. CLSM images of a 7 day old P. aeruginosa PAO1-CFP biofilm and adhered L. pneumophila, stained with 0.1mg/ml PI for 15mins: (A) P. aeruginosa PAO1-CFP biofilm (blue fluorescence), (B) CFDA-stained L. pneumophila (green fluorescence), (C) PI-stained P. aeruginosa PAO1-CFP biofilm, and (D) overlapping display of the above 3 images. The scale represents 30µm in each image.

Results
Department of Microbiology, NUS 79
(C) (D)
(A) (B)
Figure 4.10. CLSM images of a 7 day old P. aeruginosa PAO1-CFP biofilm and adhered L. pneumophila, stained with 0.1mg/ml PI for 30mins: (A) P. aeruginosa PAO1-CFP biofilm (blue fluorescence), (B) CFDA-stained L. pneumophila (green fluorescence), (C) PI-stained P. aeruginosa PAO1-CFP biofilm, and (D) overlapping display of the above 3 images. The scale represents 30µm in each image.

Results
Department of Microbiology, NUS 80
4.4 Kinetics of P. aeruginosa PAO1-CFP biofilm formation in
CDC Biofilm Reactor (CBR)
4.4.1 Kinetics of biofilm formation
Figure 4.11 illustrated the steady increase in the average number of viable P.
aeruginosa PAO1-CFP cells in biofilm until it became relatively levelled off (at
7.04 ×10⁴ CFU/mm2) after 6 days of growth in the continuous flow CBR system.
This developmental plateau was observed in at least 3 independent experiments,
thus was reproducible in this system. Henceforth, mature biofilm was demarcated
by the 6th day of development in this system, while developing biofilm
corresponded to the days before the plateau was reached. Even so, there was a
slight but insignificant increase (independent sample t-test, p > 0.1; assuming
equal variance) in the average viable cell counts on Day 10 and 11 of biofilm
Figure 4.11. Viable cell counts of P. aeruginosa PAO1-CFP biofilm formed in
development to 1.18 × 10⁵ CFU/mm2 and 1.64 × 10⁵ CFU/mm2 respectively.
CBR at 30°C with stirring at 120rpm. The error bars represent standard deviation of at least 3 independent experiments.
Pseudomonas aeruginosa PAO1-CFP counts in biofilm
0.0
1.0
2.0
3.0
4.0
5.0
6.0
2 3 4 5 6 7 8 9 10 11Days
Log
PAO
1-C
FP c
once
ntra
tion
[Log
(C
FU/m
m2 )]
Mature biofilmDeveloping biofilm

Results
Department of Microbiology, NUS 81
4.4.2 Structure of biofilm by image analysis
Image analysis revealed that the profile of biofilm bio-volume (figure 4.12),
average thickness (figure 4.13) and maximum thickness (figure 4.14)
corresponded with that of P. aeruginosa PAO1-CFP viable counts up to day 9.
Despite the relatively constant maximum thickness, there was a noticeable but not
significant increase in bio-volume and average thickness on day 10 and 11. Figure
4.15 illustrated yet another perspective of the biofilm where average substratum
coverage peaked on day 3 at 74.5% ± 10.2% and dropped drastically to reach a
low of 13.1% ± 8.88% on day 6. On subsequent days, the average substratum
coverage remained low between 20.0%-30.0% as compared to >50.0% for early
developing biofilm.
urface-to-biovolume ratio (SBR) remained comparable (between 0.400 – 0.650
µm2/µm3) throughout biofilm development, as shown in figure 4.16. However,
figure 4.17 demonstrated that the roughness coefficient started off high at 0.483 ±
0.145 and decreased gradually to 0.319 ± 0.220 on day 8, before dropping
noticeably to between 0.110 – 0.130 on day 9 onwards.
S

Results
Department of Microbiology, NUS 82
Bio-volume
0.0
5.0
10.0
15.0
20.0
25.0
30.0
35.0
40.0
2 3 4 5 6 7 8 9 10 11Days
Bio
-vol
ume
(µm
3 /µm
2 )Developing biofilm Mature biofilm
Figure 4.12. Bio-volume of P. aeruginosa PAO1-CFP biofilm formed in CBR at 30°C with stirring at 120rpm. The bio-volume of each experiment was obtained from 3-8 image stacks from 1 or 2 coupons. The error bars represent standard deviation of at least 3 independent experiments.
Average thickness
0.0
5.0
10.0
15.0
20.0
25.0
30.0
35.0
40.0
45.0
2 3 4 5 6 7 8 9 10 11Days
Ave
rage
thic
knes
s (µ
m)
Developing biofilm Mature biofilm
Figure 4.13. Average thickness of P. aeruginosa PAO1-CFP biofilm formed in CBR at 30°C with stirring at 120rpm. The average thickness of each experiment was obtained from 3-8 image stacks from 1 or 2 coupons. The error bars represent standard deviation of at least 3 independent experiments.

Results
Department of Microbiology, NUS 83
Maximum thickness
0.0
10.0
20.0
30.0
40.0
50.0
60.0
2 3 4 5 6 7 8 9 10 11Days
Max
imum
thic
knes
s (µ
m)
Developing biofilm Mature biofilm
Figure 4.14. Maximum thickness of P. aeruginosa PAO1-CFP biofilm formed in CBR at 30°C with stirring at 120rpm. The maximum thickness of each experiment was obtained from 3-8 image stacks from 1 or 2 coupons. The error bars represent standard deviation of at least 3 independent experiments.
Substratum coverage
0%
10%
20%
30%
40%
50%
60%
70%
80%
90%
100%
2 3 4 5 6 7 8 9 10 11Days
Subs
trat
um c
over
age
(%)
Developing biofilm Mature biofilm
Figure 4.15. Substratum coverage of P. aeruginosa PAO1-CFP biofilm formed in CBR at 30°C with stirring at 120rpm. The substratum coverage of each experiment was obtained from 3-8 image stacks from 1 or 2 coupons. The error bars represent standard deviation of at least 3 independent experiments.

Results
Department of Microbiology, NUS 84
Surface-to-biovolume ratio0.90
0.00
0.10
0.20
0.30
0.40
0.50
0.60
0.70
0.80
2 3 4 5 6 7 8 9 10 11Days
Surf
ace-
to-b
iovo
lum
e ra
tio (µ
m2 /µ
m3 )
Developing biofilm Mature biofilm
Figure 4.16. Surface-to-biovolume ratio (SBR) of P. aeruginosa PAO1-CFP iofilm formed in CBR at 30°C with stirring at 120rpm. The SBR of each
CBR at 30°C with stirring at 120rpm. The roughness coefficient of each
bexperiment was obtained from 3-8 image stacks from 1 or 2 coupons. The error bars represent standard deviation of at least 3 independent experiments.
Roughness coefficient
0.000
0.100
0.200
0.300
0.400
0.500
0.600
0.700
2 3 4 5 6 7 8 9 10 11Days
Rou
ghne
ss c
oeffi
cien
t
Developing biofilm Mature biofilm
Figure 4.17. Roughness coefficient of P. aeruginosa PAO1-CFP biofilm formed inexperiment was obtained from 3-8 image stacks from 1 or 2 coupons. The error bars represent standard deviation of at least 3 independent experiments

Results
Department of Microbiology, NUS 85
4.4.3 Detachment of biofilm
Figure 4.18 illustrated a gradual increase in the average number of P. aeruginosa
om a low of 1.01 × 10⁵ CFU/ml on day 2 to 2.26 ×
andard deviation of at least 3 independent experiments .
PAO1-CFP in the bulk fluid fr
105 CFU/ml on day 5, followed by a significant increase (independent sample t-
test, p = 0.006, assuming equal variance) to 6.58 × 10⁵ CFU/ml on day 6. After
which, the average planktonic viable count remained relatively constant but
increased slightly from day 10 onwards to a high of 1.65 × 10⁶ CFU/ml on day 11.
Such viable counts of P. aeruginosa PAO1-CFP in the bulk fluid reflected
instantaneous detachment of biofilm because the high nutrient influent flow rate
applied to the CBR would have resulted in the washout of planktonic P.
aeruginosa PAO1-CFP before these cells could replicate (Chapter 4.2).
Planktonic P. aeruginosa PAO1-CFP counts
0.0
1.0
2.0
3.0
4.0
5.0
6.0
7.0
2 3 4 5 6 7 8 9 10 11Days
Log
PAO
1-C
FP c
once
ntra
tion
[Log
(C
FU/m
l)]
Developing biofilm Mature biofilm
Figure 4.18. Viable cell counts of planktonic P. aeruginosa PAO1-CFP in the bulk fluid of CBR at 30°C with stirring at 120rpm. The error bars represent st

Results
Department of Microbiology, NUS 86
Biofilm structures indicative of the final stage in Pseudomonas biofilm
development, namely the dispersion stage (Tolker-Nielsen et al., 2000; Sauer et
(blue) structure L.
neumophila (green). Biofilm stained with PI (red) reflected porous regions. The -y view of the biofilm (main view) is flanked by y-z (right) and x-z (bottom)
al., 2002), were observed occasionally and earliest seen on day 7 of P. aeruginosa
PAO1-CFP biofilm development (Figure 4.19). The “wall” of P. aeruginosa
PAO1-CFP cells that encompassed the void space containing sparse amount of P.
aeruginosa PAO1-CFP cells were low in porosity, thereby preventing PI staining
of the P. aeruginosa PAO1-CFP cells within the void. It is also worth noting that
no legionellae has been found within such voids.
Void
Figure 4.19. CLSM image of a P. aeruginosa PAO1-CFP biofilmindicative of dispersion stage of biofilm development, with adhered pxsections of the biofilm, with red arrows pointed towards the top of biofilm. The scale represents 30µm in each image.

Results
Department of Microbiology, NUS 87
4.5 Introduction of L. pneumophila to developing and mature P.
eruginosa PAO1-CFP biofilmsa
4.5.1 Adhesion and persistence of L. pneumophila in developing and mature
biofilms
per coupon per 106 inoculated legionellae and 38.7 ± 26.4 cells per
The amount of legionellae adhering to developing and mature biofilm were 10.8 ±
9.0 cells
coupon per 106 inoculated legionellae respectively, as shown in figure 4.20. Using
SPSS, independent samples t-test was calculated. It was found that p = 0.056
(assuming equal variances), thus we cannot conclude that there was significant
difference between the adhesion of L. pneumophila to each coupon of developing
and mature biofilms.
Adhesion of L. pneumophila to P. aeruginosa PAO1-CFP biofilm
0.000
10.000
20.000
30.000
40.000
50.000
60.000
Developing Mature
Num
ber o
f leg
ione
llae
per c
oupo
n pe
r 106
legi
onel
lae
inoc
ulat
ed in
to C
BR
70.000
Figure 4.20. Adhesion of L. pneumophila to different developmental stages of P. aeruginosa PAO1-CFP biofilm. The error bars represent standard deviation of 5 independent experiments.

Results
Department of Microbiology, NUS 88
With regards to the persistence of L. pneumophila in P. aeruginosa PAO1-CFP
biofilm, figure 4.21 illustrated an approximately 1 log decrease in legionellae
counts over 5 and 4 days following its introduction to developing and mature
biofilm respectively. Interestingly, in developing biofilms, L. pneumophila cell
counts only started to decrease noticeably on day 6 of the biofilm development,
which corresponds to the maturation of the P. aeruginosa PAO1-CFP biofilm.
Figure 4.21 also showed that the average planktonic L. pneumophila cell counts
remained high at >1.00 × 10 cells/ml, even after 3 hrs of allowance for washout
following legionellae introduction into both types of biofilms, revealing the
instability of initial legionellae adhesion to the biofilms. Nevertheless, on
subsequent days after L. pneumophila introduction into both types of biofilm,
planktonic legionellae dropped drastically and remained low at <100 cells/ml.
When the persistence of L. pneumophila in P. aeruginosa PAO1-CFP biofilms
was examined more closely in figure 4.22, only 35.2% ± 16.8% of legionellae
remained in mature biofilm 1 day after its introduction into CBR while 98.8% ±
1.0% of legionellae remained in developing biofilm. It was 3 days after
legionellae introduction, which corresponded to the maturation of the developing
biofilm, when the biofilm legionellae started to decrease, leaving 47.9% ± 9.8% in
the biofilm. The release of legionellae from matured biofilms was fastest initially
and slowed down within the next 3 days. Finally, legionellae loss from mature
biofilm tended to stabilize with slightly >10% of legionellae remaining in the
mature biofilm 4 days after the introduction of exogenous legionellae into CBR.
4

Results
Department of Microbiology, NUS 89
Status of L. pneumophila in continuous flow CBR system
0.0
1.0
2.0
3.0
4.0
5.0
6.0
1 2 3 4 5 6 7 8 9 10 11 12
Days
Log
Legi
onel
la c
once
ntra
tion
in
plan
kton
ic p
hase
[Log
(c
ells
/ml)]
0.0
1.0
2.0
3.0
4.0
5.0
6.0Log Legionella concentration in
biofilm [Log (cells/m
m2)]
Figure 4.21. Status of L. pneumophila in our continuous flow CBR system. The error bars represent standard deviation of 3 independent experiments.
Figure 4.22. Persistence of L. pneumophila in P. aeruginosa PAO1-CFP biofilm. The error bars represent standard deviation of 3 independent experiments.
Developing biofilm - planktonic Mature biofilm - planktonicDeveloping biofilm - biofilm Mature biofilm - biofilm
Legionella addedLegionella added
Persistence of L. pneumophila in P. aeruginosa PAO1-CFP biofilm
98.8100.0
0 1 2 3 4 5 6Days following inoculation of Legionella
% L
egio
nella
rem
aini
ng in
bio
film
18.7
29.2
47.9
91.9
35.2
20.715.1 14.2
0.0
20.0
40.0
60.0
80.0
100.0
120.0Developing biofilmMature biofilm

Results
Department of Microbiology, NUS 90
4.5.2 Distributions of L. pneumophila cells in developing and mature biofilms
Table 4.3 demonstrated that there was a significant positive linear correlation (at
0.511) between Log (Number of Legionella cells) and Log (Number of CFDA
pixels per µm3 of biofilm) from 6 independent experiments. Henceforth, Log
(Number of CDFA pixels per µm3 of biofilm) can well represent the amount of
CFDA-labelled legionellae in the biofilm.
To study the distribution of L. pneumophila cells in P. aeruginosa PAO1-CFP
biofilm, the latter was divided into 5 sections along its height (z-axis). The x<20%
represented the bottom most section of the biofilm while x≥80% represented the
top most section.
Adhesion distribution of L. pneumophila in both developing and mature biofilm
appeared similar in figure 4.23(A) and (B) respectively, where most legionellae
adhered to the top of the biofilms. Referring to figure 4.23(A), there was a shift in
the peak of legionellae unimodal distribution from 40%-60% to 20%-40% and
finally bottom 20% of biofilm from day 1 to day 3. On day 4, legionellae
distribution became bimodal. Here, least amount of legionellae was found in the
middle section (40%-60%) of the biofilm (where Log (Number of CFDA pixels
per µm3) was -3.84µm-3), sandwiched between two peaks at 20%-40% and 60%-
80% of the biofilm (-3.40µm-3 and -3.41µm-3 respectively). Finally, on day 5,
distribution of legionellae remained bimodal, but with most of them found at the
bottom 20% of biofilm where Log (Number of CFDA pixels per µm3) was -
3.71µm-3, followed by 60%-80% of the biofilm where Log (Number of CFDA

Results
Department of Microbiology, NUS 91
pixels per µm3) was -3.78µm-3. On the other hand, least legionellae were found
distributions (refer to figure 4.23(B)).
he distribution changed to and fro from a unimodal distribution on day 1 (peak
odal distribution on day 4 (peaks of -2.52µm-3 and -2.43µm-3 at
ottom 20% and 60%-80% of biofilm respectively).
both at 40%-60% and top 20% of the biofilm where Log (Number of CFDA pixels
per µm3) were both -3.97µm-3.
In contrast, legionellae distribution in mature biofilm from day 1 to day 3
fluctuated between unimodal and bimodal
T
of -1.88µm-3 at 40%-60% of biofilm) to a bimodal distribution on day 2 (peaks of
-2.22µm-3 and -2.21µm-3 at bottom 20% and 60%-80% of biofilm respectively), to
unimodal distribution on day 3 (peak of -2.40µm-3 at bottom 20% of biofilm) and
finally back to bim
b
The losses of legionellae from different regions of developing and mature P.
aeruginosa PAO1-CFP biofilms were illustrated in figure 4.24 and 4.25
respectively. Generally, highest legionellae losses were located at the top 40% of
both types of biofilm while lowest legionellae losses were found at bottom 60%,
especially at bottom 20%. Legionellae was lost faster from bottom 60% of
developing biofilm than that of mature biofilm, since 2-3 days were enough for
legionellae loss at bottom 60% of developing biofilm to reach >90% while 4 days
were required in mature biofilm. On the contrary, the rate of legionellae loss at top
40% of both developing and mature biofilms were comparable.

Results
Department of Microbiology, NUS 92
Table 4.3. Table showing Pearson’s correlation between Log (Number of L. 3
CFDA pixels per µmpneumophila cells) and Log (Number of CFDA pixels per µm ). Each number of
each experiment. The correlation between the 2 variables was obtained from all
3 was obtained from 3-8 image stacks from 1 or 2 coupons of
data of 6 independent experiments.
Correlations
1 .511**. .002
33 33.511** 1.002 .
33 33
Pearson CorrelationSig. (2-tailed)NPearson CorrelationSig. (2-tailed)N
Log (Number of CFDApixels per um3 of biofilm)
Log (Number oflegionellae)
Log
CFDA pixelsper um3 of
(Number of
biofilm)Log (Numberof legionellae)
Correlation is significant at the 0.01 level (2-tailed).**.
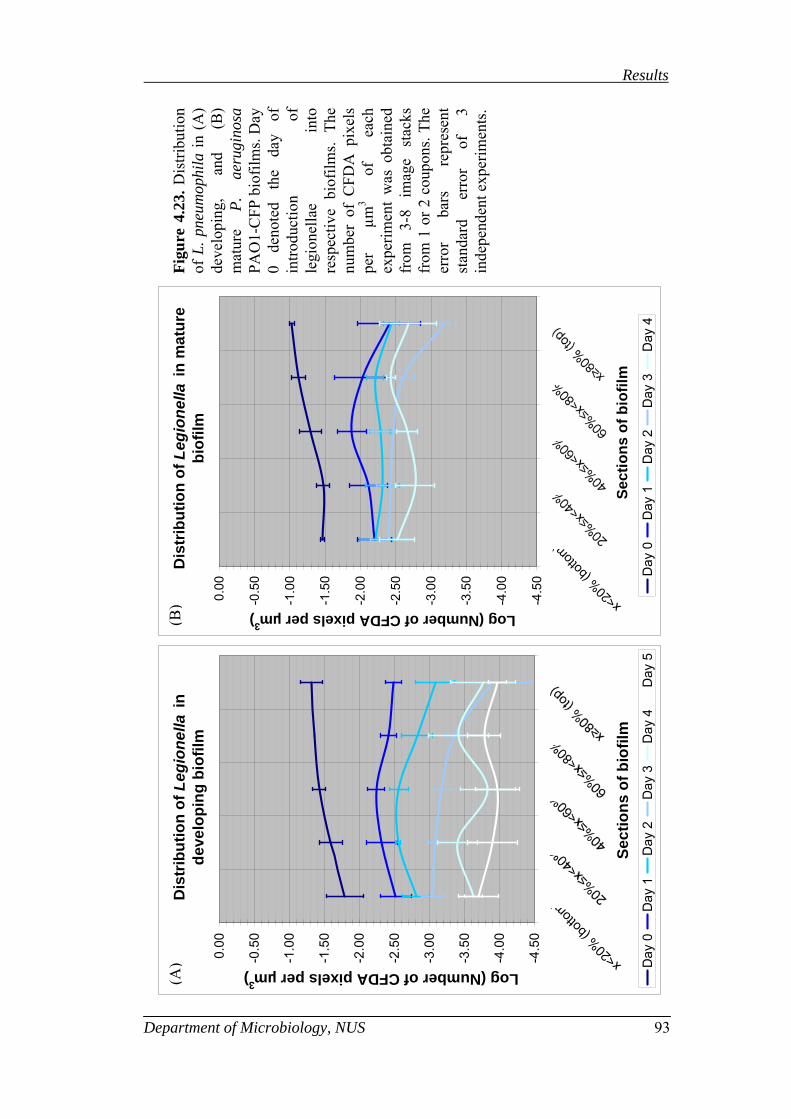
Results
Department of Microbiology, NUS 93
Dis
trib
utio
n of
Leg
ione
lla in
de
velo
ping
bio
film
-4.5
-4.0
-3.5
-3.0
-2.5
-2.0
-1.5
-1.0
-0.50.00
x<20
% 000000000 (botto
m)
Sect
ions
of b
iofil
m
Log (Number of CFDA pixels per µm3) D
ay 0
Day
1D
ay 2
Day
3D
ay 4
Day
5
Dis
trib
utio
n of
-4.5
0
-4.0
0
-3.5
0
-3.0
0
-2.5
0
-2.0
0
-1.5
0
-1.0
0
-0.5
0
0.00
x<20
% (bott
om)
Legi
onel
la in
mat
ure
biof
ilm
Sect
i
Log (Number of CFDA pixels per µm3)
ons
of b
iofil
mD
ay 0
Day
1D
ay 2
Day
3D
ay 4
Figu
re 4
.23.
Dis
tribu
tion
in (
A)
deve
lopi
ng,
and
(B)
P.
aeru
gino
sa
PAO
1-C
FP b
iofil
ms.
Day
0
deno
ted
the
day
of
of
in
to
tive
biof
ilms.
The
num
ber
of C
FDA
pix
els
of
ea
ch
rs
repr
esen
t rr
or
of
3
of L
. pne
umop
hila
mat
ure
intro
duct
ion
le
gion
ella
ere
spec
per
µm3
expe
rimen
t w
as o
btai
ned
from
3-
8 im
age
stac
ks
from
1 o
r 2 c
oupo
ns. T
he
erro
r ba
stan
dard
e
inde
pend
ent e
xper
imen
ts.
B
)(
A
)(

Results
Department of Microbiology, NUS 94
Figure 4.24. Percentage loss of L. pneumophila in developing P. aeruginosa
AO1-CFP biofilm. The error bars represent standard deviation of 3 independent ents. x represents the spacial location within biofilm.
igure 4.25. Percentage loss of L. pneumophila in mature P. aeruginosa PAO1-F iofilm. The error bars represent standard deviation of 3 independent
experiments. x represents the spacial location within biofilm.
Pexperim
FC P b
Loss of L. pneumophila from develo
Day 1
Day 2
Day 3
ping biofilm
50% 60% 70% 80% 90% 100% 110%
Day 4
Day 5
Day
s af
ter l
egio
nella
e ad
ditio
n
% Loss of legionellae
x≥80% (top)60%≤x<80%40%≤x<60%20%≤x<40%x<20% (bottom)
Loss of L. pneumophila from mature biofilm
50% 60% 70% 80% 90% 100% 110%
Day 1
Day 2
Day 3
Day 4
Day
s af
ter l
egio
nella
e ad
ditio
n
% Loss of legionellae
x≥80% (top)60%≤x<80%40%≤x<60%20%≤x<40%x<20% (bottom)

Results
Department of Microbiology, NUS 95
4.5.3 Bio-volume distributions of developing and mature biofilms
Bio-volume distributions of both biofilm types, to which L. pneumophila was
introduced, were presented in figure 4.26(A) and (B) respectively. On day 0 and 1
(corresponding to day 3 and 4 of biofilm development in continuous flow system),
the peak of bio-volume distribution in developing biofilm was found at 20%-40%
region of the biofilm while least bio-volume was found at top 20% of the biofilm
(Figure 4.26(A)). After which, the peak was shifted to 40%-60% region of the
biofilm and the amount of bio-volume found at bottom 20% of the biofilm
decreased appreciably from within the range of 2.50µm3µm-2 - 3.00µm3µm-2 and
remained low within the range of 1.50µm3µm-2 - 2.50µm3µm-2.
Figure 4.26(B) illustrated another peak shift from 40%-60% to 60%-80% region
of the biofilm on day 2 (corresponding to day 9 of biofilm development in
continuous flow system). Generally, majority of the cell mass of mature biofilm
resided within 40%-80% region while least fraction of the cell mass was found at
the bottom 20% of mature biofilm.

Results
Department of Microbiology, NUS 96
Bio
-vol
ume
dist
ribut
ion
in
deve
lopi
ng b
iofil
m
0.00
1.00
2.00
3.00
4.00
5.00
6.00
7.00
8.00
9.00
x<20
% (bott
om)
Sect
ions
of b
iofil
m
Bio-volume (µm3µm
-2) D
ay 0
Day
1D
ay 2
Day
3D
ay 4
Day
5
Bio
-vol
u
0.00
1.00
2.00
3.00
4.00
5.00
6.00
7.00
8.00
9.00 20
% (tto
m)
me
dibu
ia
bi
m
x<
bo
stri
tion
n m
ture
ofil
Sect
ions
of b
iofil
m
Bio-volume (µm3µm
-2)
Day
0D
ay 1
Day
2D
ay 3
Day
4
Figu
re 4
.26.
Bio
-vol
ume
dist
ribut
ion
of
(A)
deve
lopi
ng,
and
(B)
mat
ure
P.
aeru
gino
sa
PAO
1-C
FP b
iofil
ms.
Day
0
deno
ted
the
day
of
intro
duct
ion
ofle
gion
ella
resp
ectiv
e bi
ofilm
s. T
bio-
volu
me
of
each
ex
perim
ent
was
obt
aine
d fr
om
3-8
imag
e st
acks
fr
om 1
or 2
cou
pons
. The
stan
dard
er
ror
of
3 in
depe
nden
t exp
erim
ents
. e
erro
r ba
rs
repr
es
in
to
he
ent
(A)
(B)

Results
Department of Microbiology, NUS 97
4.5.4 f developing and mature
iofi
urfa th biofilm types, to which L.
neu was introduced, were presented in figures 4.27(A) and (B)
spe troduction to biofilm), SBR
BR of 0.839µm2µm-3 at top 20% sector, followed by 0.583µm2µm-3 at bottom
0% sector and lowest SBR of 0.257µm2µm-3 at 40%-60% region of the biofilm.
contrast, SBR distribution in mature biofilm on day 0 tended to be a sharper
V” shape with highest SBR of 1.87µm2µm-3 at bottom 20% sector, followed by
.04µm2µm-3 at top 20% sector and lowest SBR of 0.321µm2µm-3 at 40%-60%
gion of the biofilm.
efer to figure 4.27(A), SBR at the top and bottom 20% of developing biofilm
creased at different rates as days pass. At the bottom, SBR increased drastically
iofilm development in continuous flow system) and then remained high within
e range of 1.50µm2µm-3-2.00µm2µm-3. In comparison, SBR at the top remained
latively comparable within the range of 0.800µm2µm-3– 1.20µm2µm-3. The
west SBR also remained comparable within the range of 0.200µm2µm-3-
.400µm2µm-3 at 40%-80% region of the biofilm (more prone towards the 40%-
0% region). As such, the “U” shape of SBR distribution in early developing
iofilm became a more distinct “V” shape on day 2 and remained so afterwards.
Surface-to-biovolume ratio distributions o
lms
ce-to-biovolume ratio (SBR) distributions of bo
mophila
ctively. On day 0 (the day of legionellae in
b
S
p
re
distribution in developing biofilm tended to be a wide “U” shape with highest
S
2
In
“
1
re
R ring
in
from 0.770µm2µm-3 on day 1 to 1.68µm2µm-3 on day 2 (corresponding to day 5 of
b
th
re
lo
0
6
b

Results
Department of Microbiology, NUS 98
Referring to figure 4.27(B), SBR at the bottom 20% of mature biofilm remained
high within the range of 1.50µm2µm-3-2.00µm2µm-3 while that at the top 20%
e range of 2.00-2.50 on day 2 onwards in the developing
iofilm (corresponding to day 5 of biofilm development in continuous flow
decreased from >0.900µm2µm-3 on day 0 and 1, to within the range of
0.550µm2µm-3-0.600µm2µm-3 on day 2 (corresponding to day 9 of biofilm
development in continuous flow system) onwards. Lowest SBR remained
relatively stable within the range of 0.100µm2µm-3-0.400µm2µm-3 but was shifted
from 40%-60% to 60%-80% region of the mature biofilm on day 1.
The change in SBR ratio (SBR at bottom 20%: top 20% of biofilm) was shown in
table 4.4. At day 0, the SBR ratio was 0.795 ± 0.407 and 2.31 ± 1.60 in
developing and mature biofilm respectively. With time, the SBR ratio increased
and stabilized within th
b
system). However in mature biofilm, the SBR ratio increased further to >3.00 on
day 2 onwards (corresponding to day 9 of biofilm development in continuous flow
system).

Results
Department of Microbiology, NUS 99
Figu
re 4
.27.
Sur
face
-to-
R)
dist
ribut
ion
of
(A)
deve
lopi
ng,
and
(B)
mat
ure
P.
aeru
gino
sa
PAO
1-C
FP b
iofil
ms.
Day
0
deno
ted
the
day
of
intro
duct
ion
ofle
gion
ella
in
to
resp
ectiv
e bi
ofilm
s. Th
e SB
Rof
eh
exer
imen
t w
as
obta
ined
fr
om
3-8
imag
e st
acks
fro
m 1
or
2 he
err
or b
ars
repr
esen
t st
rror
of
3
inde
pend
ent
expe
rimen
ts.
biov
olum
e ra
tio
(SB
e
ac
p
coup
ons.
Tan
dard
e
Surf
ace-
to-b
iovo
lum
e ra
tio
dist
ribut
ion
in d
evel
opin
g bi
ofilm
0.0
0.5
1.0
1.5
2.0
2.5
x<20
% (bott
om)
Sect
ions
of b
iofil
m
Surface-to-biovolume ratio (µm2µm
-3) D
ay 0
Day
1D
ay 2
Day
3D
ay 4
Day
5
S-to
-bvo
lum
e ra
tiodi
bu i
ae
biof
ilur
face
iost
ritio
nn
mtu
r
0.0
0.5
1.0
1.5
2.0
2.5
x<20
% (bott
om)
m
Seon
silm
cti
of b
iof
Surface-to-biovolume ratio (µm2µm
-3)
Day
0D
ay 1
Day
2D
aD
ay 4
y 3
(B
)
A)
(

Results
Department of Microbiology, NUS 100
Tab sus the top 20% of developing and obtained from 3 independent xp
top 20% of biofilm)
le 4.4. The ratio of SBR at the bottom 20% ver mature biofilm. The standard deviations wereeriments.
SBR ratio (SBR at bottom 20% : SBR at
e
Days Developing biofilm Mature biofilm 0 0.795 ± 0.407 2.315 ± 1.604 1 1.070 ± 0.723 2.396 ± 1.026 2 2.195 ± 0.541 3.007 ± 0.789 3 2.437 ± 1.113 4.322 ± 3.067 4 2.087 ± 1.214 3.481 ± 2.327 5 2.230 ± 1.870 -
Figure 4.28 illustrated that as the P. aeruginosa PAO1-CFP biofilm developed,
s decreased steadily, reaching 5.68 ± 1.25µm-3 on
p < 0.05; Table 4.5) to
-3 and remained low, within the range of 2.50 – 3.50µm-3 till day
1
ted that the distribution profile of biofilm porosity
ained similar throughout the experimental period, with the highest porosity
e biofilm and least porosity at bottom 40% region.
4.5.5 Porosity distributions of developing and mature biofilms
the overall porosity of biofilm
day 7. By day 8, the overall porosity dropped significantly (
3.44 ± 1.05µm
1 .
In addition, figure 4.29 illustra
rem
located at top 40% of th

Results
Department of Microbiology, NUS 101
Porosity
2.0
4.
6.
8.
10.0
12.0
3 4 5 6 7 8 9 10 11
Num
ber o
f PI p
ixel
s pe
r µm
3 )
experiment was obtained from 3-8 image stacks from 1 or 2 coupons. The error
Table 4.5. Comparing means of porosity over time, using one-way ANOVA.
Figure 4.28. Porosity of P. aeruginosa PAO1-CFP biofilm. The porosity of each
bars represent standard deviation of at least 3 independent experiments.
0.0
0
0
0
Days
Poro
sity
(
Developing biofilm re biofilmMatu
Multiple Comparisons
Dependent Variable: PorosityScheffe(I) Day: 3
1.509280 1.210937 .989 -3.74689 6.765452.041144 1.210937 .934 -3.21503 7.297311.849624 1.210937 .962 -3.40655 7.105792.882132 1.048702 .500 -1.66984 7.434115.124096* 1.048702 .018 .57212 9.676075.669294* 1.210937 .027 .41312 10.925465.901725* 1.210937 .018 .64556 11.157895.609074* 1.210937 .029 .35290 10.86524
(J) Day
MeanDifference
(I-J) Std. Error Sig. Lower Bound Upper Bound95% Confidence Interval
4567891011
The mean difference is significant at the .05 level.*.

Results
Department of Microbiology, NUS 102
Figu
re
4.29
. Po
rosi
ty
dist
ribut
ion
of
(A)
deve
lopi
ng,
and
(B)
mat
ure
P.
aeru
gino
sa
PAO
1-C
FP b
iofil
ms.
Day
0
deno
ted
the
day
of
intro
duct
ion
of
legi
onel
lae
into
re
spec
tive
biof
ilms.
The
num
ber
of P
I pi
xels
of
each
ex
perim
ent
was
ob
tain
ed f
rom
3-8
im
age
stac
ks
from
1
or
2 co
upon
s. Th
e er
ror
bars
re
pres
ent
stan
dard
er
ror
of
3 in
depe
nden
t ex
perim
ents
.
Poro
sity
dis
trib
utio
n in
dev
elop
ing
biof
ilm
0.0
0.5
1.0
1.5
2.0
2.5
3.0
3.5
4.0
20% (b
ottom
)
x<
Sect
ions
of b
iofil
m
Porosity (Number of PI pixels per µm3) D
ay 0
Day
1D
ay 2
Day
3D
ay 4
Day
5
Poro
sity
dis
trib
utio
n in
mat
ure
biof
ilm
x<
(bott
om)
0.0
0.5
1.0
1.5
2.0
2.5
3.0
3.5
4.0
20%
Day
4
Sect
ions
of b
iofil
m
Porosity (Number of PI pixels per µm3)
Day
3D
ay 2
Day
1D
ay 0
B)
(
A)
(
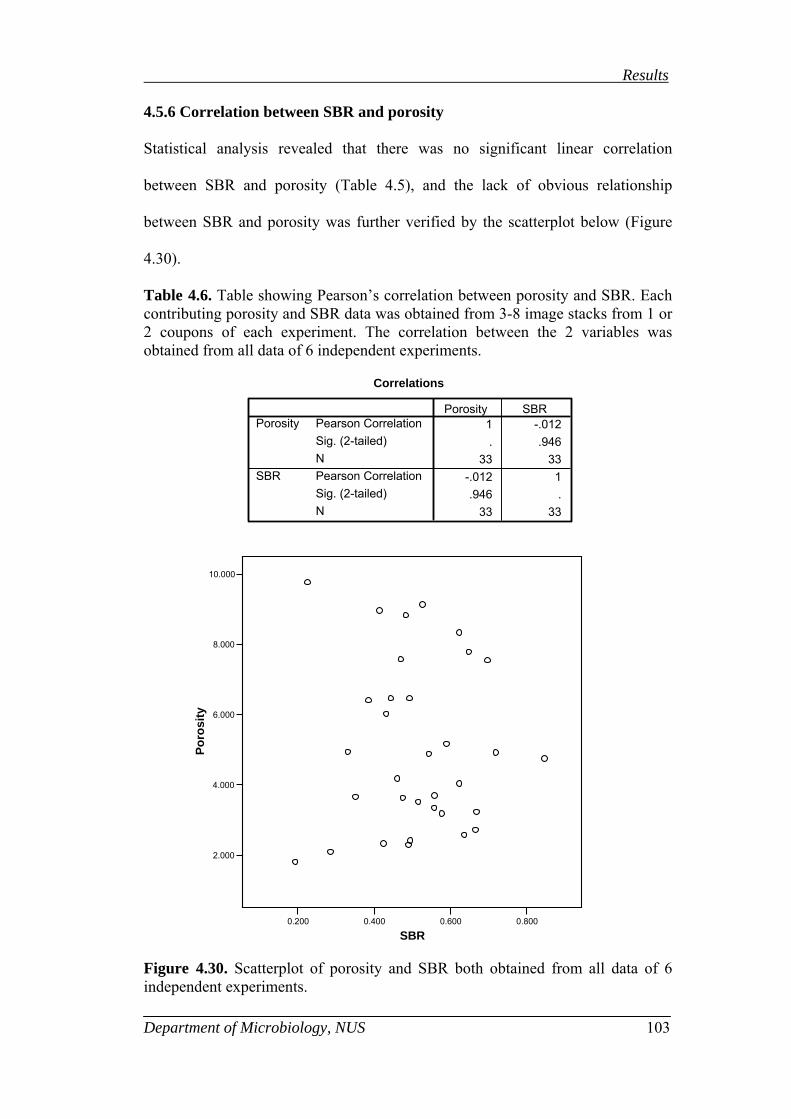
Results
Department of Microbiology, NUS 103
4.5
Sta significant linear correlation
bet lack of obvious relationship
bet e scatterplot below (Figure
4.3
Table 4.6. Table showing Pearson’s correlation between porosity and SBR. Each ontributing porosity and SBR data was obtained from 3-8 image stacks from 1 or
2 coupons of each experiment. The correlation between the 2 variables was btained from all data of 6 independent experiments.
Figure 4.30. Scatterplot of porosity and SBR both obtained from all data of 6 independent experiments.
.6 Correlation between SBR and porosity
tistical analysis revealed that there was no
ween SBR and porosity (Table 4.5), and the
ween SBR and porosity was further verified by th
0).
c
o
Correlations
1 -.012. .946
33 33-.012 1.946 .
33 33
Pearson CorrelationSig. (2-tailed)NPearson CorrelationSig. (2-tailed)N
Porosity
SBR
Porosity SBR
0.200 0.400 0.600 0.800
SBR
2.000
4.000
6.000
8.000
10.000
Poro
sity

Results
Department of Microbiology, NUS 104
4.5.7 Correlation between legionellae adh
Correlations
Legionellae adhesion to PAO1-CFP biofilm1.
10-.485.156
10.639*.047
10.030.934
10.303.394
10.309.385
10-.626.053
10-.178.623
10
Pearson CorrelationSig. (2-tailed)NPearson CorrelationSig. (2-tailed)NPearson CorrelationSig. (2-tailed)NPearson CorrelationSig. (2-tailed)NPearson CorrelationSig. (2-tailed)NPearson CorrelationSig. (2-tailed)NPearson CorrelationSig. (2-tailed)NPearson CorrelationSig. (2-tailed)N
Legionellae adhesionto PAO1-CFP biofilm
Porosity
SBR
Biomass
Average thickness
Maximum thickness
Substratum coverage
Roughness coefficient
Correlation is significant at the 0.05 level (2-tailed).*.
esion and parameters of P.
amount of legionellae adhering to P. aeruginosa PAO1-CFP biofilm was
gionellae adhesion and the rest of the biofilm parameters.
Table 4.7. Table showing Pearson’s correlation between legionellae adhesion to . aeruginosa PAO1-CFP biofilm (representing the number of legionellae per
coupon per 106 legionellae inoculated into CBR) and parameters of the biofilm. or each experiments, 3-8 image stacks from 1 or 2 coupons were used. The
correlations between the variables were obtained from 10 independent xperiments.
aeruginosa PAO1-CFP biofilm
Pearson’s correlations between the number of legionellae per coupon per 106
legionellae inoculated into CBR and biofilm parameters are presented in Table
4.6. The
significantly positively correlated (at 0.05 level) to the overall SBR of biofilm.
Otherwise, there was no significant linear relationship between the amount of
le
P
F
e

Results
Department of Microbiology, NUS 105
4.5.8 Localization of L. pneumophila in P. aeruginosa PAO1-CFP biofilms
Figure 4.31(A) and (C) revealed that L. pneumophila adhered to regions of high
porosity in both developing and mature P. aeruginosa PAO1-CFP biofilms, and
could also be found near the substratum. Four days later, majority of the
remaining legionellae were found “hidden” within the biofilms, away from
regions stained by PI (figure 4.31(B) and (D)).
(A)

Results
Department of Microbiology, NUS 106
(C)
(B)

Results
Department of Microbiology, NUS 107
(D)
Fi (blue) with
gionellae introduction to developing biofilm (3-days-old), (B) 4 days after legionellae introduction to developing biofilm, (C) 3hrs after legionellae
troduction to mature biofilm (7-days-old), and (D) 4 days after legionellae introduction to mature biofilm. Biofilm stained with PI (red) reflected porous
gions. The x-y view of the biofilm (main view) is flanked by y-z (right) and x-z (bottom) sections of the biofilm, with red arrows pointed towards the top of
iofilm. The scale represents 30µm in each image.
gure 4.31. CLSM images of P. aeruginosa PAO1-CFP biofilmadhered L. pneumophila (green) taken on different occasions: (A) 3hrs after le
in
re
b

Results
Department of Microbiology, NUS 108
4
Kinetics of P. aeruginosa PAO1 Biofilm Formation at 30°C
0.000
0.010
0.020
0.030
0.040
0.050
30282624222018161412
OD
470nm
0.000
0.100
0.200
0.300
0.400
OD
600n
m
0.060
0.070
80
4038363432Time (hr)
0.500
0.600 0.0
Amount of biofilm (OD470nm) Amount of total bacteria (OD600nm)
.6 Screening for effective P. aeruginosa PAO1 biofilm removing
gent
P. aeruginosa PAO1 biofilm formation in microtiter plate
P. aeruginosa PAO1 biofilm formation reached a
ximum on the 18th hour, detached drastically after 20th hour and subsequently
ained low with OD470nm at approximately 0.010. The detachment corresponded
rise and high level of total bacteria in the well. Therefore biofilm removal
hour intervals starting from the 12th hour of
formation.
Figure 4.32. Kinetics of P. aeruginosa PAO1 biofilm formation in microtitre plate at 30°C. The error bars represent standard deviations of 3 independent experiments.
a
4.6.1 Kinetics of
As shown in figure 4.32,
ma
rem
to the
assays were conducted at every 2
biofilm
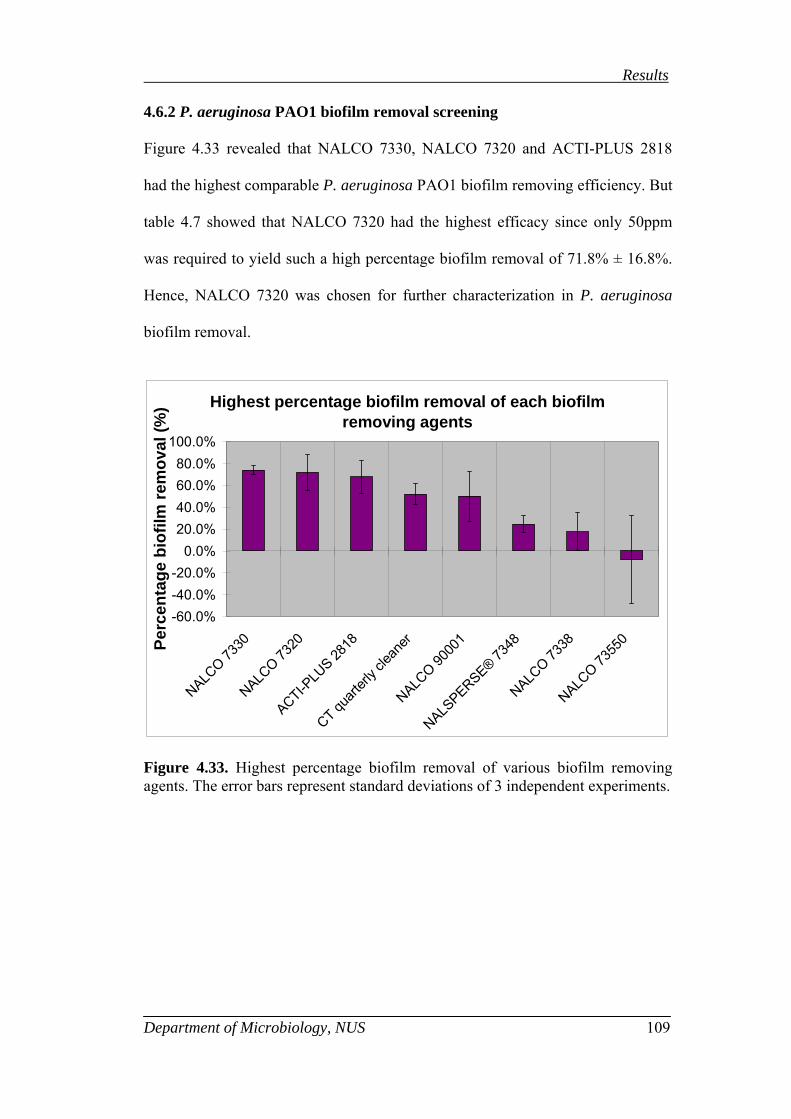
Results
Department of Microbiology, NUS 109
4.6.2 P. aeruginosa PAO1 biofilm removal screening
Figure 4.33 revealed that NALCO 7330, NALCO 7320 and ACTI-PLUS 2818
had the highest comparable P. aeruginosa PAO1 biofilm removing efficiency. But
table 4.7 showed that NALCO 7320 had the highest efficacy since only 50ppm
was required to yield such a high percentage biofilm removal of 71.8% ± 16.8%.
Hence, NALCO 7320 was chosen for further characterization in P. aeruginosa
biofilm removal.
Figure 4.33. Highest percentage biofilm removal of various biofilm removing agents. The error bars represent standard deviations of 3 independent experiments.
Highest percentage biofilm removal of each biofilm removing agents
100.0%
(
-60.0%-40.0%-20.0%
0.0%20.0%40.0%60.0%80.0%
NALCO 73
30
NALCO 73
20
ACTI-PLU
S 2818
CT quart
erly c
leane
r
NALCO 90
001
NALSPERSE® 73
48
NALCO 73
38
NALCO 73
550Pe
rcen
tage
bio
film
rem
oval
%)

Results
Department of Microbiology, NUS 110
Table 4.8. Efficacy of biofilm removing agents. The standard deviations were obtained from 3 independent experiments.
Biofilm removing agent Percentage biofilm Concentration Time
removal (%) (ppm) taken (hr) NALCO 7330 74.0 ± 4.2 1,000 6 NALCO 7320 71.8 ± 16.8 50 8
CT quarterly cleaner 51.9 ± 9.6 50,000 8
NALSPERSE® 7348 24.4 ± 7.8 50 0
NALCO 735
ACTI-PLUS 2818 67.6 ± 15.4 500 8
NALCO 90001 50.0 ± 22.9 500 6
NALCO 7338 17.5 ± 17.2 50 0 50 -7.9 ± 40.0 5 0

Results 4.7 Characterization of NALCO 7320
4.7.1 Kinetics of P. aeruginosa PAO1 biofilm removal
As shown in figure 4.34, biofil NALCO s time dependent
but no dependent ency of lowering removal efficacy
with increasing concentration abo Nevertheless, at 10ppm, no biofilm
rem
Figure 4.34. Kinetics of biofilm removal by NALCO 7320. The error bars represent standard deviations of 3 independent experiments.
m removal by 7320 wa
t concentration , with a tend
ve 50ppm.
oval was observed.
Kinetics of biofilm removal by NALCO 7320
-250.0%
-200.0%
-150.0%
-100.0%
-50.0%
0.0%
50.0%
100.0%
0 2 4 6 8Exposure time (hr)
Perc
enta
ge b
iofil
m re
mov
al
(%)
1000ppm500ppm100ppm50ppm10ppmMock treated
Department of Microbiology, NUS 111

Results
Department of Microbiology, NUS 112
4.7.2 Antimicrobial susceptibility testing
Minimum inhibitory concentration (MIC) is defined the lowest concentration of
spread plating.
Figure 4.35 demonstrated that MIC of NALCO 7320 on P. aeruginosa PAO1 and
L. pneumophila were 50ppm and 10ppm respectively. In addition, figure 4.36
revealed that MBC of NALCO 7320 on P. aeruginosa PAO1 and L. pneumophila
were 100ppm and 50ppm respectively. Hence, to ensure maximum biofilm
removal with bactericidal effect on planktonic P. aeruginosa PAO1, a final
concentration of 100ppm of NALCO 7320 was chosen for further characterization
in P. aeruginosa biofilm removal.
antimicrobial agent that completely inhibits the growth of the organism as
detected by the unaided eye while minimum bactericidal concentration (MBC) is
the lowest concentration of antimicrobial agent that completely eradicated the
organism as detected by

Results
Department of Microbiology, NUS 113
NALCO 7320
Figure 4.35. Visual determination of minimum inhibitory concentration (MIC).
Figure 4.36. Determination of minimum bactericidal concentration (MBC) of NALCO 7320. The error bars represent standard deviations of 3 independent experiments. The dashed line denotes the detection limit of spread plating technique. ‘to’ represent the initial bacterial concentration before the addition of NALCO 7320.
L. pneumophila
P. aeruginosa
Bla
nk
PAO1
Moc
k tre
ated
500p
pm
100p
pm
50pp
m
10pp
m
1,00
0ppm
Determination of minimum bactericidal concentration (MBC)
9.0010.00
0.001.002.003.004.005.006.007.008.00
to
Mock t
reated
1k pp
m
500 p
pm
100 p
pm
50 pp
m
10 pp
m
Log
(CFU
/ml)
P. aeruginosa L. pneumophila

Results
Department of Microbiology, NUS 114
Persistence of P. aeruginosa PAO1-CFP biofilms treated with NALCO 7320
0.0
1.0
2.0
3.0
4.0
5.0
6.0
Beforetreatment
0hr 4hr 8hr 12hr 24hr
Exposure time
Log
PAO
1-C
FP
conc
entr
atio
n [L
og
(CFU
/mm
2 )]
Developing biofilm - expt 1 Developing biofilm - expt 2Mature biofilm - expt 1 Mature biofilm - expt 2
4.8 Introduction of NALCO 7320 into developing and mature P.
aeruginosa PAO1-CFP biofilms containing L. pneumophila
4.8.1 Persistence of P. aeruginosa PAO1-CFP in CBR
Figure 4.37 showed that the concentration of viable P. aeruginosa PAO1-CFP
cells in mature biofilms decreased at a greater extent than that in developing
biofilms during the first 8hrs of exposure to NALCO 7320 and remained relatively
constant within the range of 1.00–2.00CFU/mm2 after 8 hours of exposure. The
concentration of viable P. aeruginosa PAO1-CFP cells in developing biofilms
decreased steadily for the first 12 hours of exposure and was not detected after
24hrs of exposure to NALCO 7320. Figure 4.38 showed that viable P. aeruginosa
of
treatment with NALCO 7320.
PAO1-CFP cell was not detected anymore in the bulk fluid of CBR after 8hrs
Figure 4.37. Viable cell counts of P. aeruginosa PAO1-CFP biofilms treated with NALCO 7320.

Results
Department of Microbiology, NUS 115
P. aeruginosa PAO1-CFP in bulk fluid of CBR treated with NALCO 7320
7.0
0.0
1.0
3.0
4.0
treatment
Log
PAO
1-C
conc
entr
(CFU
/ml)]
2.0
Before 0hr 4hr 8hr 12hr 24hr
Exposure time
atio
n [L
og
5.0
6.0
FP
Developing biofilm - expt 1 Developing biofilm - expt 2Mature biofilm - expt 1 Mature biofilm - expt 2
treated with NALCO 7320. The dashed line represented the detection limit of the
Figure 4.38. Viable cell counts of planktonic P. aeruginosa PAO1-CFP in CBR
plating technique used.
4.8.2 Structure of P. aeruginosa PAO1-CFP biofilms treated by NALCO 7320
Upon addition of NALCO 7320, bio-volume (Figure 4.39), average thickness
(Figure 4.40) and maximum thickness (Figure 4.41) of developing biofilm
immediately dropped and subsequently recovered by the 4th hr. Next, bio-volume
(Figure 4.39) and average thickness (Figure 4.40) dropped even lower than before
and remained low within the range of 6.00-10.0µm3µm-2 and 6.00-11.0µm
respectively, from the 8th hr of exposure to NALCO 7320 onwards. However, the
maximum thickness (Figure 4.41) dropped slightly and remain within the range of
15.0-22.0µm until 24th hr.

Results
Department of Microbiology, NUS 116
In mature biofilm, by the 4th hr of exposure to NALCO 7320, bio-volume (Figure
ple t-test, p = 0.015, assuming equal variance) 4hrs
fter the addition of NALCO 7320 and remained at <65% thereafter. Substratum
ALCO 7320. Figure 4.43 demonstrated that the surface-to-biovolume ratio of
dependent sample t-test, p = 0.01, assuming equal
ariance) from <0.20 to 0.612 ± 0.220.
4.39) and average thickness (Figure 4.40) decreased significantly (independent
sample t-test, p = 0.002 and 0.007 respectively, assuming equal variance) and
remained within the range of 18.0-22.0µm3µm-2 and 21.0-26.0µm respectively, for
the subsequent 8hrs. However, maximum thickness (Figure 4.41) of mature
biofilm merely exhibited a decreasing trend. Nevertheless, at the end of 24hrs, the
bio-volume, average thickness and maximum thickness in both developing and
mature biofilm were comparable.
Figure 4.42 showed that substratum coverage of developing biofilm dropped
significantly (independent sam
a
coverage of mature biofilm remained comparable with or without exposure to
N
developing biofilm increased to >0.800µm2µm-3 after 24hrs of exposure. In
contrast, NALCO 7320 had no apparent effect on the surface-to-biovolume ratio
of mature biofilm.
Roughness coefficient of developing biofilm increased significantly (independent
sample t-test, p = 0.031, assuming equal variance) from <0.15 to >0.55 after 8hrs
of exposure to NALCO 7320 (figure 4.44). However, it was only after 24hrs of
exposure to NALCO 7320, when the roughness coefficient of mature biofilm
increased significantly (in
v

Results
Department of Microbiology, NUS 117
with NALCO 7320. The bio-volume was obtained from at least 3 image stacks per coupon. The error bars represent standard deviation of 4 coupons from 2 independent experiments.
Figure 4.39. Bio-volume of P. aeruginosa PAO1-CFP biofilm in CBR treated
represent standard deviation of 4 coupons
Figure 4.40. Average thickness of P. aeruginosa PAO1-CFP biofilm in CBR treated with NALCO 7320. The average thickness was obtained from at least 3 image stacks per coupon. The error barsfrom 2 independent experiments.
Bio-volume
25.0
30.0
35.0B
o-vo
lum
e (µ
m3 /µ
m2
0.0
5.0
10.0
15.0
20.0
Beforetreatment
0hr 4hr 8hr 12hr 24hr
Exposure time
i)
Developing biofilm (day 4) Mature biofilm (day 8)
Average thickness
20.0
25.0
35.0
40.0
ickn
ess
(µ
0.0
5.0
15.0
30.0
Exposure time
e th
m)
10.0
Beforetreatment
0hr 4hr 8hr 12hr 24hr
Ave
rag
Developing biofilm (day 4) Mature biofilm (day 8)
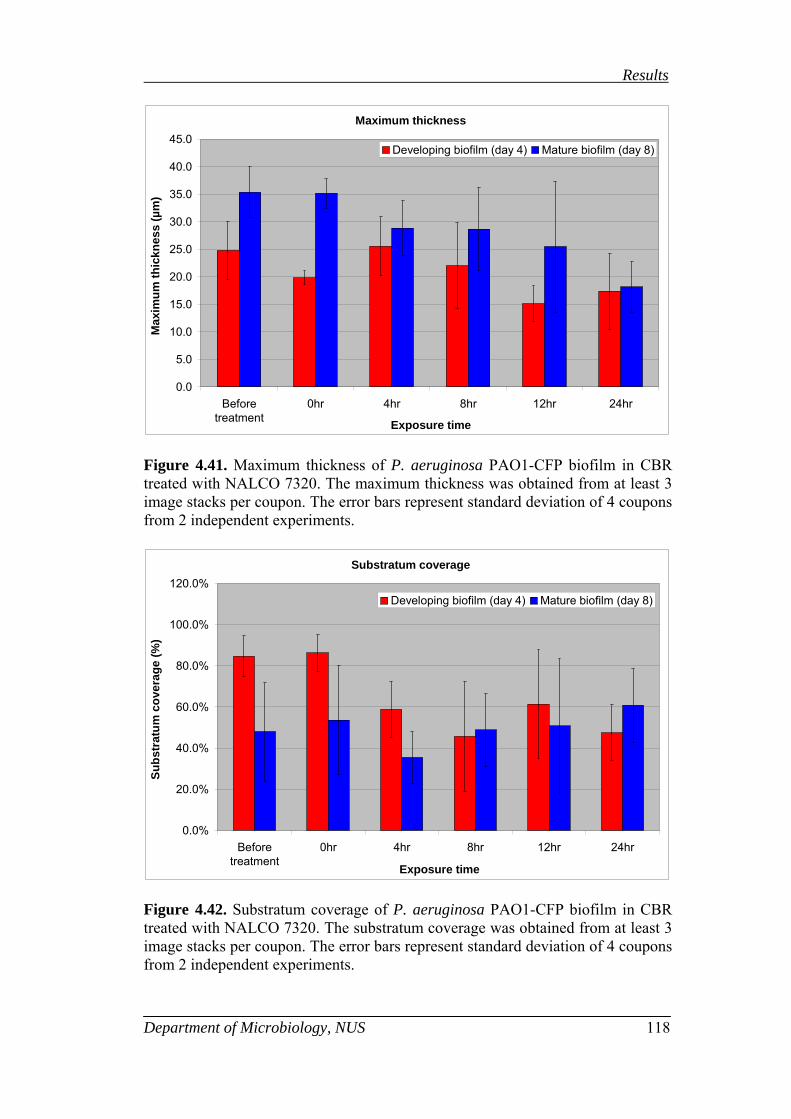
Results
Department of Microbiology, NUS 118
Figure 4.41. Maximum thickness of P. aeruginosa PAO1-CFP biofilm in CBR treated with NALCO 7320. The maximum thickness was obtained from at least 3 image stacks per coupon. The error bars represent standard deviation of 4 coupons from 2 independent experiments.
Maximum thickness
0.0
5.0
10.0
15.0
20.0
25.0
30.0
35.0
40.0
45.0
Beforetreatment
0hr 4hr 8hr 12hr 24hr
Exposure time
Max
imum
thic
knes
s (µ
m)
Developing biofilm (day 4) Mature biofilm (day 8)
Substratum coverage
0.0%
20.0%
40.0%
60.0%
80.0%
100.0%
120.0%
Beforetreatment
0hr 4hr 8hr 12hr 24hr
Exposure time
Subs
trat
um c
over
age
(%)
Developing biofilm (day 4) Mature biofilm (day 8)
Figure 4.42. Substratum coverage of P. aeruginosa PAO1-CFP biofilm in CBR treated with NALCO 7320. The substratum coverage was obtained from at least 3 image stacks per coupon. The error bars represent standard deviation of 4 coupons from 2 independent experiments.

Results
Department of Microbiology, NUS 119
Figure 4.43. Surface-to-biovolume ratio of P. aeruginosa PAO1-CFP biofilm in CBR treated with NALCO 7320. The surface-to-biovolume ratio was obtained from at least 3 image stacks per coupon. The error bars represent standard deviation of 4 coupons from 2 ind
e error bars represent standard deviation of 4 coupons from 2 independent experiments.
igure 4.44. Roughness coefficient of P. aeruginosa PAO1-CFP biofilm in CBR
ependent experiments.
igure 4.44. Roughness coefficient of P. aeruginosa PAO1-CFP biofilm in CBR
Surface-to-biovolume ratio
0.0
0.2
0.4
0.6
0.8
1.0
1.2
1.4
1.6
1.8
Beforetreatment
0hr 4hr 8hr 12hr 24hr
Exposure time
Surf
ace-
to-b
iovo
lum
e ra
tio (µ
m2 /µ
m3 )
Developing biofilm (day 4) Mature biofilm (day 8)
Roughness coefficient
0.0
0.2
0.4
0.6
0.8
1.0
1.2
1.4
Beforetreatment
0hr 4hr 8hr 12hr 24hr
Exposure time
Rou
ghne
ss c
oeffi
cien
t
Developing biofilm (day 4) Mature biofilm (day 8)
FFtreated with NALCO 7320. The roughness coefficient was obtained from at least 3 image stacks per coupon. The error bars represent standard deviation of 4 coupons from 2 independent experiments.
treated with NALCO 7320. The roughness coefficient was obtained from at least 3 image stacks per coupon. The error bars represent standard deviation of 4 coupons from 2 independent experiments.

Results
Department of Microbiology, NUS 120
4.8.3 Persistence of L. pneumophila in P. aeruginosa PAO1-CFP biofilms
o apparent linear correlation was found between legionella and bio-volume loss
treated with NALCO 7320
As shown in figure 4.45, there was a steady and gradual decrease in legionellae
viable cell counts in both developing and mature biofilms. Figure 4.46
demonstrated the presence of legionellae in the bulk fluid of CBR (at between 2.0-
2.5 cells/ml for every experiments) even after 24hrs of exposure to NALCO 7320.
Loss of legionellae per unit biomass lost from developing and mature biofilms
were calculated and no significant difference between them were found
(independent sample t-test, p = 0.414, equal variances not assumed). In addition,
n
(Table 4.8). Nevertheless, the scatterplot (Figure 4.47) revealed that 3 out of 4
data points have a linear relationship, thus implying the need for more work to
examine this relationship.
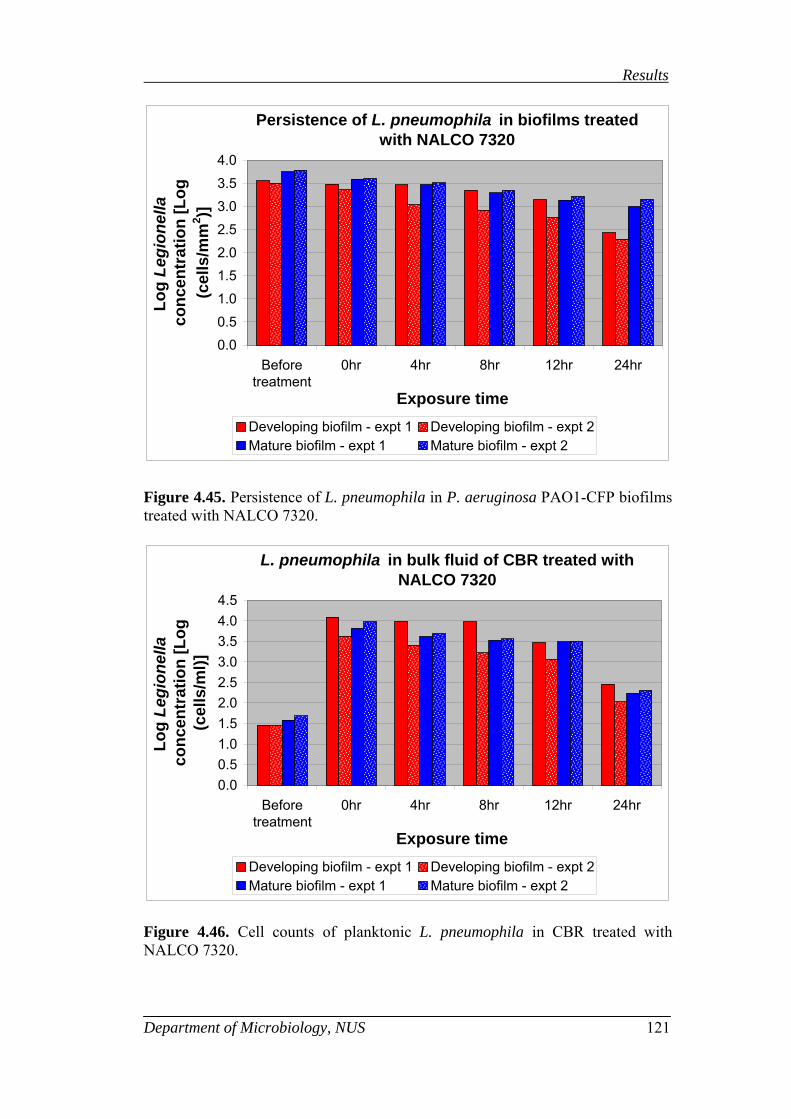
Results
Department of Microbiology, NUS 121
Persistence of L. pneumophila in biofilms treated with NALCO 7320
1.0
3.5
Beforetreatment
0hr 4hr 8hr 12hr 24hr
Exposure time
Log
gion
ella
2
0.00.5
1.52.02.5
Leco
ncen
tr(c
ells
/mm
3.0
4.0at
ion
[Log
)]
Developing biofilm - expt 1 Developing biofilm - expt 2Mature biofilm - expt 1 Mature biofilm - expt 2
treated with NALCO 7320.
Figure 4.46. Cell counts of planktonic L. pneumophila in CBR treated with NALCO 7320.
Figure 4.45. Persistence of L. pneumophila in P. aeruginosa PAO1-CFP biofilms
L. pneumophila in bulk fluid of CBR treated with NALCO 7320
3.5
4.5
atio
n [L
og
0.00.51.01.52.02.53.0
4.0
Beforetreatment
0hr 4hr 8hr 12hr 24hr
Exposure time
Log
Legi
onel
la
conc
entr
(cel
ls/m
l)]
Developing biofilm - expt 1 Developing biofilm - expt 2Mature biofilm - expt 1 Mature biofilm - expt 2

Results
Department of Microbiology, NUS 122
Correlations
1 .510. .4904 4
.510 1
.490 .4 4
Pearson CorrelationSig. (2-tailed)N
Bio-volumeloss
Legionellaeloss
Bio-volume loss
Pearson CorrelationSig. (2-tailed)
Legionellae loss
N
Table 4.9. Table showing Pearson’s correlation between bio-volume and legionellae loss. Each contributing bio-volume data was obtained from at least 3 image stacks from each of the 2 coupons used per experiment. The correlation between the 2 variables was obtained from 4 independent experiments.
dependent experiments.
Figure 4.47. Scatterplot of bio-volume and legionellae loss, obtained from 4
3000.000 3500.000 4000.000 4500.000
Legionellae loss
20.000
14.000
15.000
16.000
17.000
18.000
19.000
21.000
Bio
-vol
ume
loss
in

Results
Department of Microbiology, NUS 123
4.8.4 Distribution of L. pneumophila in P. aeruginosa PAO1-CFP biofilms
treated with NALCO 7320
Despite increasing exposure time to NALCO 7320, the distribution of L.
ost L.
s while least
biofilm
rema L.
ature
biofilm
bottom
pneumophila in developing biofilm (figure 4.48(A)) remained similar, with the
exception of the fourth hour after NALCO 7320 addition. Generally, m
pneumophila resided in the 20%-60% region of developing biofilm
legionellae were found at the top 20% of the biofilm. But 4hrs after NALCO 7320
addition, the peak was temporarily shifted to 60%-80% of the biofilm.
Figure 4.48(B) showed that the distribution of L. pneumophila in mature
ined similar with increasing exposure time to NALCO 7320. Most
pneumophila resided in the 40%-80%, especially 60%-80% region of m
s while least legionellae were found at comparable levels at both top and
20% of mature biofilms.

Results
Department of Microbiology, NUS 124
Ef
fect
of
L.
in
(A)
P.
aeru
gino
sa
obta
ied
e
ent
Figu
re
4.48
.N
ALC
O
7320
on
th
e di
strib
utio
n of
pn
eum
ophi
la
deve
lopi
ng,
and
(B)
mat
ure
PAO
1-C
FP b
iofil
ms.
The
num
ber
of C
FDA
pix
els
per
µm
3
nfr
om
at
leas
t 3
imag
erro
r ba
rs
repr
es
was
stac
ks p
er c
oupo
n. T
he
stan
dard
dev
iatio
n of
4
coup
ons
from
2
inde
pend
ent e
xper
imen
ts.
(A)
(B)
Effe
ct o
f NA
LCO
732
0 tr
eatm
ent o
n di
strib
utio
n of
L. p
neum
ophi
la i
n de
velo
ping
bio
film
-4.0
0
-3.5
0
-3.0
0
-2.5
0
-2.0
0
-1.5
0
-1.0
0
x<20
% (bott
om)
Sect
ions
of b
iofil
m
Log (Number of CFDA pixels per µm3) B
efor
e tre
atm
ent
0hr
4hr
8hr
12hr
24hr
Effe
ct o
f A
732
dist
ibut
n of
L.m
a b
i
-2.0
0
-1.5
0
-1.0
0
tom)
NLC
O
0 tr
eaen
tr
io
pne
umla
ture
ofilm
-4.0
0
-3.5
0
-3.0
0
-2.5
0
x<20
% (bot
tm o
n op
hi in
Sect
ins
of
o b
iofil
m
Log (Number of CFDA pixels per µm3) B
efor
e tre
atm
ent
0hr
4hr
8hr
12hr
24hr

Results
Department of Microbiology, NUS 125
4.8 and mature biofilms treated
it
ig cell mass was rather uniformly
ist % biofilm, before and immediately
fte 4hrs later, the peak was shifted
.
ubsequently, the peak of bio-volume was progressively shifted towards the 20%-
0% region of the biofilm, maintaining at this spot until the 24th hr of exposure to
ALCO 7320.
igure 4.49(B) illustrated that peak bio-volume was found at 60%-80% region of
ature biofilm, before and up to the 8th hr of exposure to NALCO 7320.
ubsequently, the peak was shifted to 40%-60% region by the 12th hr of exposure
nd e tually to 20%-40% region by the 24th hr.
.5 Bio-volume distributions of developing
h NALCO 7320
ure 4.49(A) revealed that majority of the
ributed in the 20 -80% region of developing
r the addition of NALCO 7320. However,
w
F
d
a
upwards and was more concentrated at the 60%-80% region of the biofilm
S
4
N
F
m
S
a ven

Results
Department of Microbiology, NUS 126
Effe
ct o
f NA
LCO
732
0 tr
eatm
ent o
n bi
o-vo
lum
e di
strib
utio
n in
dev
elop
ing
biof
ilm
0.00
1.00
2.00
3.00
4.00
5.00
6.00
7.00
8.00
x<20
% (bott
om)
Sect
ions
of b
iofil
m
Bio-volume (µm3µm
-2) B
efor
e tre
atm
ent
0hr
4hr
8hr
12hr
24hr
Effe
ct
bio-
volu
e di
2.00
3.00
4.00
5.00
6.00
7.00
8.00
tom)
of N
ALC
O 7
320
tm
strib
u i
a
biof
ilm
0.00
1.00
x<20
% (bot
reat
men
t on
tion
n m
ture
Sect
ions
of b
iofi
Bio-volume (µm3µm
-2)
lmB
efor
e tre
atm
ent
0hr
4hr
8hr
12hr
24hr
Figu
re
4.49
.N
ALC
O
7320
on
th
e di
strib
utio
n of
bi
o-vo
lum
e de
velo
ping
, an
d (B
) m
atur
e
aPA
O1-
CFP
bio
film
s. Th
e bi
o-vo
lum
e w
as o
btai
ned
stac
ks p
er c
oupo
n. T
he
stan
dard
dev
iatio
n of
4
coup
ons
from
2
inde
pend
ent e
xper
imen
ts.
Ef
fect
of
in
(A)
ugin
sa e
ent
P.er
o
from
at
le
ast
3 im
ag
erro
r ba
rs
repr
es

Results
Department of Microbiology, NUS 127
4.8.6 treated with
AL
igu osity from 8.80 ± 1.95µm-3 to 14.8
0.4 fter the addition of NALCO 7320.
y t dropped and remained <4.50µm-3
.19µm-3 in mature biofilm was also observed immediately after the addition of
ALCO 7320. The level of porosity also dropped by the 4th hr of exposure and
mained <4.00µm-3 until the 24th hr.
igure 4.51(A) demonstrated that the porosity at the lower 60% of developing
iofilm increased drastically to >3.000µm-3 (with peak porosity at 20%-40%
gion of the biofilm) immediately after the addition of NALCO 7320 into the
BR. However, 4hrs later, the level of peak porosity dropped and remain within
e range of 1.000-1.500µm-3 at 40%-80% of the biofilm until the 24th hr of
enerally, NALCO 7320 had no observable effect on the porosity distribution of
ature biofilm where peak porosity was always found at 60%-80% region of the
iofilm (figure 4.51(B)). However, there was a noticeable increase in the porosity
f mature biofilm from peak porosity between 1.000-1.500µm-3 to >2.000µm-3),
mediately after the addition of NALCO 7320 into the CBR.
Porosity distributions of P. aeruginosa PAO1-CFP biofilms
CO 7320
re 4.50 illustrated a drastic increase of por
µm
N
F
-3 in developing biofilm immediately a
he 4
±
th hr of exposure, the level of porosityB
until the 24th hr. A slight increase of porosity from 3.49 ± 2.59µm-3 to 6.59 ±
1
N
re
F
b
re
C
th
exposure.
G
m
b
o
im

Results
Department of Microbiology, NUS 128
Figure 4.50. P. aeruginosa
Porosity of PAO1-CFP biofilm in CBR treated with NALCO 7320. The porosity was obtained from at least 3 image stacks per coupon. The error bars represent standard deviation of 4 coupons from 2 independent experiments.
Porosity18.0
)
0.0
8.0
16.0
treatmenthr 8hr 12hr 24hr
er p
i p
e3
2.0
4.0
6.0
10.0
12.0
14.0
Before 0hr 4
Poro
sity
(Num
b o
f PI
xels
r µm
Developing biofilm (Day 4) Mature biofilm (Day 8)

Results
Department of Microbiology, NUS 129
Figu
re
4.51
. Ef
fect
of
N
ALC
O
7320
on
po
rosi
ty
dist
ribut
ion
of
(A)
deve
lopi
ng,
and
(B)
mat
ure
P.
aeru
gino
sa
PAO
1-C
FP b
iofil
ms.
The
poro
sity
w
as
obta
ined
fr
om
at
leas
t 3
imag
e st
acks
per
cou
pon.
The
er
ror
bars
re
pres
ent
stan
dard
dev
iatio
n of
4
coup
ons
from
2
inde
pend
ent e
xper
imen
ts.
Effe
ct o
f NA
LCO
732
0 tr
eatm
ent o
n po
rosi
ty d
istr
ibut
ion
in d
evel
opin
g bi
ofilm
0.00
0.50
1.00
1.50
2.00
2.50
3.00
3.50
4.00
4.50
5.00
x<20
% (bott
om)
Sect
ions
of b
iofil
m
Porosity (Number of PI pixels per µm3) B
efor
e tre
atm
ent
0hr
4hr
8hr
12hr
24hr
Effe
ct73
20 tr
eatm
ent o
n po
rbu
tion
in m
atur
e of
ilm
0.00
0.50
1.00
1.50
2.00
2.50
3.00
3.50
4.00
4.50
5.00
x<20
% (bott
om)
24hr
of N
ALC
O
osity
dis
tri
bi
Sect
ions
of b
iofil
m
Porosity (Number of PI pixels per µm3)
12hr
8hr
4hr
t0h
rB
efor
e tre
atm
en

Discussion
Department of Microbiology, NUS 130
Chapter 5: Discussion
Biofilm formation
To date, biofilm development is best studied in P. aeruginosa PAO1. The fusion
of an ecfp gene (encoding for enhanced cyan fluorescent protein) to a constitutive
promoter and subsequent insertion into a neutral intergenic region downstream of
the glmS gene on P. aeruginosa PAO1 genome (Klausen et al., 2003) allowed
CLSM observations of P. aeruginosa PAO1-CFP biofilms in the absence of
exogenous fluorescent dyes. The fluorescently tagged strain did not show any
phenotypic changes compared with the parental strain when tested in liquid
medium or flow chamber biofilms (Klausen et al., 2003). Similarly, the growth of
P. aeruginosa PAO1 and P. aeruginosa PAO1-CFP in minimal media supplied
with mannitol as the sole carbon source yielded indistinguishable growth curves
(Figure 4.2 and 4.3) in the present study.
The P. aeruginosa PAO1-CFP biofilm model was established at 30°C under high
shear, in the CBR system with continuous supply of minimal media containing
mannitol as the sole carbon source. After 6 days of growth under continuous
culture, both viable counts of P. aeruginosa PAO1-CFP in the biofilm (Figure
4.11) and the maximum thickness of the biofilm (Figure 4.14) reached a
reproducible plateau. This finding corroborated with a P. aeruginosa PAO1
biofilm development study, in which minimal medium containing glutamic acid as
the sole carbon source was used (Sauer et al., 2002). Thus in the present study,
mature biofilm is defined as one that has reached its maximum thickness on day 6

Discussion
Department of Microbiology, NUS 131
while developing biofilm is one that has yet to reach its penultimate thickness
(before day 6).
Despite the attainment of maximum thickness on day 6 (Figure 4.14), the slight
increase in viable counts of planktonic (Figure 4.18) and biofilm (Figure 4.11) P.
aeruginosa PAO1-CFP, and in bio-volume (Figure 4.12) and average thickness
(Figure 4.13) of the biofilm on day 10 and 11, provided yet another experimental
evidence to support the hypothesis that biofilms never reached steady state
(Heydorn et al., 2000; Lewandowski et al., 2004). Early study by Bakke et al.
(1989) also demonstrated that older biofilms were continuously increasing their
density, even though their thickness remained constant. However, it is not possible
to differentiate between growth and attachment. Therefore, it is possible that
bacteria in the bulk fluid had been “captured” by mature biofilm. Additionally, no
sloughing event that might jeopardize the reproducibility of the biofilm structure
(Lewandowski et al., 2004), was observed during the course of this study.
As the P. aeruginosa PAO1-CFP biofilm matures, structural changes were
detected. The cell mass of biofilm started to move upwards on day 5, as suggested
by the drastic decrease in substratum coverage (Figure 4.15), the peak shift in
biomass distribution from 20%-40% to 40%-60% region of biofilm (Figure
4.26(A)), and drastic increase in SBR at bottom 20% of biofilm (Figure 4.27(A))
and in corresponding SBR ratio (bottom 20%: top 20% of biofilm) (Table 4.4).
Another upward movement of the cell mass was detected on day 9 when the
roughness coefficient of the biofilm dropped appreciably (Figure 4.17), a peak

Discussion
Department of Microbiology, NUS 132
shift in biomass distribution from 40%-60% to 60%-80% region of the biofilm
was observed (Figure 4.26(B)), and the SBR at top 20% of biofilm decreased
noticeably (Figure 4.27(B)) resulting in the further increase in SBR ratio (Table
4.4). Eventually, the cell mass congregated at the 40%-80% region of the mature
P. aeruginosa PAO1-CFP biofilm with the least bio-volume found at the bottom
20% (Figure 4.26(B)). Expectedly, the region of biofilm with the lowest SBR
became increasingly prominent and coincided with that of the cell mass core on
day 5 onwards (Figure 4.27(B)). The roughness coefficient of P. aeruginosa
PAO1-CFP biofilm exhibited a general decreasing trend (Figure 4.17) thus
implying decreasing structural heterogeneity of the biofilm structure in the CBR
continuous flow system of this study. The production and redistribution of
biomass has been modeled in several investigations, where each model assumes a
different mechanism for biomass redistribution (Cogan and Keener, 2004;
Picioreanu et al., 2004; Alpkvist et al., 2006). However, in the absence of
empirical investigation, it is not clear how to judge the validity of the
redistribution mechanisms in the models.
Interestingly, despite the structural changes, the overall SBR remained relatively
uniform (Figure 4.16). Few studies applied the SBR function in COMSTAT in
their studies, but observations in this study corroborated with that of a previous
study in which P. aureofaciens, P. fluorescens and P. aeruginosa PAO1 each
exhibited relatively constant SBR throughout respective biofilm development and
structural changes (Heydorn et al., 2000). By extricating the overall SBR into 5
sections along the biofilm thickness, the present study demonstrated the

Discussion
Department of Microbiology, NUS 133
usefulness of SBR distribution in providing insights into biofilm structural
differences.
Yang et al. (2000) first attempted to describe biofilm porosity using areal porosity.
Areal porosity is the ratio of the combined areas of the voids to the total area of
the image. However it is calculated from two-dimensional confocal images when
porosity characterizes three-dimensional space (Lewandowski, 2000). This study
presented an unprecedented method of quantifying porosity of paraformaldehyde
fixed biofilms by limiting the time of staining with PI (Chapter 3.4.4), obtaining
confocal image stacks under constant variables that may affect the quality of the
images (Chapter 3.8.7), applying constant threshold to all image stacks (Chapter
3.8.8.2) and quantifying the number of PI pixels per unit biomass (Chapter
3.8.8.4). PI has specificity for double stranded nucleic acids and bears a double
positive charge, thus readily enters and stains non-viable cells (Shapiro and Nebe-
von-Caron, 2004). Since with increasing incubation with 0.1mg/ml PI beyond 5
minutes resulted in excessive staining of the biofilm (Chapter 4.3.3), the amount
of PI molecules were not limiting. In this study, no viable bacteria were detected
from paraformaldehyde fixed biofilms, hence the possibility that the cells within
the biofilms remained viable (thus not picking up the PI dye) is eliminated.
Furthermore, extracellular DNA comprises <1-2% of the biofilm matrix
(Sutherland, 2001) therefore is not likely to contribute significantly to the number
of PI pixels detected. These imply that any variation in the number of PI pixels per
unit biomass is dependent on the accessibility of the biofilm cells to PI molecule,
thus reflecting the porosity of the biofilm in a three-dimensional context.

Discussion
Department of Microbiology, NUS 134
Knowledge of the way in which substances are transported within biofilm is
essential for control or eradication. Based on the fact that biofilms consist of
microbial cell clusters separated by interstitial “voids”, “channels” or “pores”
(Lawrence et al., 1991; de Beer et al., 1994a and 1994b; Massol-Deya et al.,
1995), mass transport in the interstitial voids is mainly facilitated by convective
flow (Stoodley et al., 1994) and mass transfer inside the microbial clusters is
entirely due to molecular diffusion (de Beer et al., 1994a). On the contrary, Yang
and Lewandowski (1995) demonstrated that mass transfer coefficients were not
only found to vary both horizontally and vertically in the biofilm, they also
fluctuated significantly inside microbial cell clusters. This observation spurred the
proposal of a new conceptual model of biofilm microbial cluster structure, which
assumes the existence of flow channels with variable cross-sectional areas and
irregular orientations inside biofilm clusters. To the best of our knowledge, the
present study provided the first physical evidence of porous flow channels within
biofilm cell cluster (Figure 4.8).
Previous studies applied SBR to reflect the fraction of the biofilm that is exposed
to nutrient flow (Heydorn et al., 2000). Similar fraction of the biofilm has been
experimentally proven to be stained by PI (Figure 4.8) and can be represented by
the parameter “porosity” in the present study. On the contrary, overall SBR does
not correlate to overall porosity of P. aeruginosa PAO1-CFP biofilm (Chapter
4.5.6). Furthermore, there is no obvious correlation between the distribution of
SBR (Figure 4.27) and porosity (Figure 4.29). These observations suggest that the
structure of the biofilm alone is not enough to reflect the porosity of the biofilm.

Discussion
Department of Microbiology, NUS 135
Although no attempts were made to detect EPS in the present study, it is well
established that biofilms comprise microbial cells within a matrix of EPS and
these microcolonies are separated by interstitial voids and channels. EPS, as the
major structural components of the biofilm matrix, has been implicated in the
protection of embedded microbial cells by either neutralizing or binding to toxic
substances, or merely serving as a physical barrier to environmental challenges
(Hall-Stoodley et al., 2004). Therefore, it is highly likely that the changes in the
quantity or nature of EPS had influenced the porosity of the biofilm in this study.
The overall porosity of the biofilm exhibited a general decreasing trend but
dropped significantly (p<0.01) on day 8 of development (Figure 4.28), suggesting
a drastic change in the quantity or property of EPS. However, throughout biofilm
development, the profile of porosity distribution remained comparable (Figure
4.29(A) and (B)). Thus suggesting the change in EPS was rather uniform
throughout the biofilm.

Discussion
Department of Microbiology, NUS 136
Association of Legionella with biofilm
In this study, there was no significant difference (p=0.056) between the number of
legionellae adhering to developing and mature biofilm (Figure 4.20). The amount
of legionellae adhesion was found to be dependent on overall SBR of the biofilm
and independent on other biofilm parameters, especially porosity (Table 4.6). On
the contrary, legionellae adhesion patterns (Figure 4.23) did not emulate the
distribution patterns of SBR (Figure 4.27) for both developing and mature
biofilms. Interestingly, the legionellae adhesion patterns and biofilm porosity
distributions (Figure 4.23 and 4.29 respectively) were comparable, and the
attached legionellae were found co-localized with regions of high porosity even if
it was at the bottom of the biofilm (Figure 4.31(A) and (C)). These results
demonstrated that legionellae adhesion was dependent on the structure of the
biofilm, where biofilms with higher SBR can capture more planktonic legionellae,
but the adhesion might be hindered because legionellae only had access to biofilm
at areas of higher porosity. In a similar study, Langmark et al. (2005) found that
the accumulation of model pathogens (including L. pneumophila) was generally
independent of the biofilm cell density and was shown to be dependent on the
particle surface properties, where hydrophilic spheres accumulated to a larger
extent than hydrophobic ones. Taken together with the current study, the amount
and localization of legionellae adhering to biofilms may be determined by the
interplay of cell surface properties, biofilm structure and porosity.
In this study, figure 4.22 illustrated the 2-days delayed release of legionellae from
developing biofilm, until day 6 of biofilm development (Figure 4.21), which

Discussion
Department of Microbiology, NUS 137
corresponded to biofilm maturation. The significant increase (p<0.01) in P.
aeruginosa PAO1-CFP biofilm detachment on day 6 (Figure 4.18) was likely the
cause of the sudden release of legionellae from P. aeruginosa PAO1-CFP biofilm
after the latter matured. This corroborated with another study which demonstrated
that detachment was one of the primary mechanisms affecting the loss of
microspheres and legionellae from biofilms within a pilot-scale distribution
system, as well as disinfection and biological grazing (Langmark et al., 2005).
Although the transport of particulates in biofilms has been largely neglected, it is
believed that in microbial competition in mixed population biofilms, slow
growing microorganisms are forced towards the biofilm surface and eventually
displaced (Okabe et al., 1996). In present study, legionellae release slowed down
(Figure 4.21 and 4.22) even though the bacteria was unable to replicate in the
continuous flow CBR system (which was fed with minimal media that supported
the growth of P. aeruginosa PAO1-CFP only) and the biofilm detachment
remained high, or even increased slightly on day 10 and 11 (Figure 4.18). In
addition, majority of remaining legionellae were found embedded in the biofilms,
away from porous regions (Figure 4.31(B) and (D)), implying reattachment of
planktonic legionellae to P. aeruginosa PAO1-CFP biofilm was not significant.
These indicate the existence of stable regions within P. aeruginosa PAO1-CFP
biofilm that harbored and protected legionellae from being desorbed. Figure 4.24
and 4.25 revealed that highest legionellae losses were found at the top 40% of the
biofilm while least legionellae losses were located at the bottom 60%, especially
at bottom 20%.

Discussion
Department of Microbiology, NUS 138
The development of bimodal legionellae distribution 4 days after its adhesion to
developing biofilm (corresponding to day 7 of biofilm development) and
occurrence of alternate unimodal and bimodal distributions in mature biofilm
(Figure 4.23) revealed unbalanced advective transport of legionellae towards
biofilm surface took place after biofilm maturation. Similarly, Okabe et al. (1996)
observed that the trapped tracer beads were gradually transferred from the depth
of the biofilm to the surface but this advective transport was unbalanced. Since the
authors concluded that cell growth is an important factor for the entrapment and
release of the tracer beads, they attributed this phenomenon to unbalanced cell
growth. Therefore, it is likely that the concentration of biomass (thus cell growth)
near the substratum in developing biofilms (Figure 4.26(A)) resulted in unimodal
legionellae distributions (Figure 4.23(A)) and the faster loss of legionellae from
bottom 60% of developing biofilm (Figure 4.24) than from mature biofilm (Figure
4.25). On the other hand, the concentration of biomass in 40%-60% region of
mature biofilm (Figure 4.26(B)) was likely to result in bimodal legionellae
distributions (Figure 4.23), where legionellae from 40%-60% region of biofilm
were advected towards the surface of biofilm while legionellae loss at the bottom
slowed down (Figure 4.25). Therefore, the results from present study supported
the proposition of the existence of unbalanced cell growth in mature biofilm.

Discussion
Department of Microbiology, NUS 139
Applications of biofilm-removing agents used in this study
Products from NALCO Company (www.nalco.com) such as NALCO 7320,
NALCO 7330, NALCO 7338, NALSPERSE® 7348 and NALCO 73550 are
registered as water treatment products to the NSF Registration Guidelines for
Proprietary Substances and Nonfood Compounds (www.nsf.org/usda) while
NALCO 90001 is registered to the New Zealand Food Safety Authority
(www.nzfsa.govt.nz). All the above products, except NALCO 73550, are
acceptable for treating boilers, steam lines and/or cooling systems where neither
the treated water nor the steam produced may contact edible products in and
around food processing areas. On the other hand, all the products, except NALCO
7320, 7330 and 90001, are acceptable for treatment of cooling and retort water in
and around food processing areas (www.nsf.org/usda). In addition, ACTI-PLUS
2818 is registered with U.S. Environmental Protection Agency (www.epa.gov),
under the Pest Control Products Act. It is an agent for controlling algal, bacteria
and fungal slime in condensing and cooling equipment to which recirculating
water is used as a cooling media. It can also be used to control bacterial and algal
slime in decorative fountains and brewery pasteurizers. Lastly, COOLING
TOWER QUARTERLY CLEANER was a product by Novapharm Research
(Australia) Pty Ltd., subsequently renamed and patented as Aeris-Guard
Enzymatic Coil Cleaner in 2003 (www.aerisguard.com). In March 2006 Quarterly
Report, Aeris Technologies Ltd. (www.aerisguard.com) reported several
successful applications of this product in both cooling towers and large industrial
water systems, and stated intentions to widen industrial applications in areas such
as mining operations and paper mills.

Discussion
Department of Microbiology, NUS 140
Effect of biocide NALCO 7320 on biofilm and associated legionellae
Without biofilm porosity as a concern, thin P. aeruginosa PAO1 biofilms of at
most 72hrs of age exhibited no correlation between initial cell density of the
biofilm and disinfection rate coefficient (Cochran et al., 2000). On the contrary, in
this study, the amount of viable P. aeruginosa PAO1-CFP cells in 8-days-old
mature biofilm decreased to a greater extent than in 4-days-old developing biofilm
during the first 8hrs of exposure to NALCO 7320, even when the former
contained more viable cells (Figure 4.37) and was relatively thicker than
developing biofilm (Figure 4.40). Since PI (molecular weight of 668.4) was able
to penetrate and stain the whole of 7-days-old mature biofilm within 30mins
(Figure 4.10), complete penetration of both developing and mature biofilms by
smaller 2,2-dibromo-3-nitrilopropionamide (DBNPA; molecular weight of 242)
was not likely to be hindered, if not faster. Thus the decreased resistance of the 8-
days-old mature biofilm to NALCO 7320 was most probably due to physiological
changes of biofilm organisms.
Such physiological changes could be explained by the fact that protein patterns for
dispersion stage biofilms (last stage of biofilm development) were reported to be
closer to the patterns observed from planktonic bacteria than for mature biofilms
(Sauer et al., 2002) and it is widely accepted that biofilm-grown cells are more
resistant to killing by biocides when compared with the same cells grown in
planktonic phase (Mah and O'Toole, 2001; Drenkard, 2003). Interestingly, biofilm
structures indicative of dispersion stage of biofilm development (Tolker-Nielsen
et al., 2000; Sauer et al., 2002) were observed occasionally and were earliest seen

Discussion
Department of Microbiology, NUS 141
on day 7 of biofilm development, in the present study (Figure 4.19). To date, the
contribution of such dispersion mechanism to overall detachment of biofilm has
not been established.
Upon prolonged exposure to NALCO 7320 for 24hrs, no viable P. aeruginosa
PAO1-CFP cells were detected in developing biofilms while the amount of viable
cells in mature biofilms remained relatively constant since 8 hours of exposure
(Figure 4.37). Thus, suggesting the existence of either slow or non-growing cells,
or subpopulations of resistant phenotypes in mature biofilm. Occurrence of such
resistant P. aeruginosa subpopulations to DBNPA has been reported (Grobe et al.,
2002). Reflective of the bactericidal effects of NALCO 7320 on planktonic P.
aeruginosa PAO1 cells (Figure 4.36), no viable P. aeruginosa PAO1-CFP cells
were detected in the bulk fluid of CBR 8hrs after the addition of NALCO 7320
(Figure 4.38).
NALCO 7320 had different effects on the structures of developing and mature P.
aeruginosa PAO1-CFP biofilms. The effect on developing biofilm was immediate,
where the bio-volume (Figure 4.39), average thickness (Figure 4.40) and
maximum thickness (Figure 4.41) decreased immediately after NALCO 7320
addition, while those of mature biofilm remained relatively unchanged.
Additionally, the overall porosity of developing biofilm increased drastically
while that of mature biofilm only increased slightly (Figure 4.50). Upon closer
inspection, figure 4.51(A) demonstrated that the increase in porosity occurred at
bottom 60% of the developing biofilm but relatively uniform throughout mature

Discussion
Department of Microbiology, NUS 142
biofilm. Four hours later, developing biofilm lifted off slightly from the
substratum but remained attached to the stainless steel coupons, as demonstrated
by the drop in substratum coverage (Figure 4.42), increase in average thickness
(Figure 4.40) and maximum thickness (Figure 4.41), and the shift in peak bio-
volume distribution to 60%-80% region of the biofilm (Figure 4.49(A)). As
established earlier in the discussion, changes in the quantity or nature of EPS
influence the porosity of the biofilm. Therefore, NALCO 7320 might have
immediate effect on the nature of EPS, which was then reflected by the increase in
porosity at the bottom 60% of developing biofilm where EPS accumulated, and
caused the lift off of developing biofilm from substratum. At the same time, the
increase in bio-volume suggested that portions of developing biofilm that had
detached might have been “recaptured” (Figure 4.39). Subsequently, majority of
the biomass accumulated at top 40% of the biofilm sloughed off by the 8th hr
(Figure 4.49(A)), resulting in a basal level of biomass (Figure 4.39), with low
average thickness (Figure 4.40) and substratum coverage (Figure 4.42), and high
SBR (Figure 4.43) and roughness coefficient (Figure 4.44). Interestingly, although
no viable P. aeruginosa PAO1-CFP cells were detected in developing biofilm at
24th hr (Figure 4.37), the basal biofilm structure remained (Figure 4.39).
By the 4th hr of treatment of NALCO 7320, the first significant drop (p<0.01) in
bio-volume (Figure 4.39) and average thickness (Figure 4.40) occurred, with
uniform decrease in bio-volume distribution throughout the mature biofilm
(Figure 4.49(B)). Thus, suggesting that the “outer layer” of mature biofilm had
peeled off. Interestingly, the bactericidal effects of NALCO 7320 continued to

Discussion
Department of Microbiology, NUS 143
work on P. aeruginosa PAO1-CFP cells in mature biofilm while the structure
remained comparable for the subsequent 8hrs (Figure 4.39). Nevertheless, twenty-
four hours after the addition of NALCO 7320, the structure of the mature biofilm
was comparable with the basal structure of developing biofilm, where the peak of
biomass distribution was found at the 20%-40% region of the biofilms (Figure
4.49) and overall porosity remaining low (Figure 4.51). Taken together, it is
hypothesized that NALCO 7320 caused biofilm detachment by affecting the
nature of EPS that bound the microbial cells together as a microcolony, while
applying biocidal effect on P. aeruginosa PAO1-CFP cells within the biofilm.
Persistence of biofilm basal structures after exposure to biocides, such as
hydrogen peroxide and isothiazolinone, was also reported by Schmid et al. (2004)
who investigated biocide efficacy by using photoacoustic spectroscopy for biofilm
monitoring. However, the present study further demonstrated that even when
majority of biofilm structure is removed, the existence of viable cells within the
basal biofilm is possible.
Legionellae cells persisted (Figure 4.45) within biofilms despite detachment of the
latter (Figure 4.39). The lack of significant difference (p=0.414) between
legionellae loss per unit biomass lost from developing and mature biofilms
(Chapter 4.8.3), together with the apparent lack of correlation between legionellae
loss from the biofilms and biofilm bio-volume loss (Table 4.8) suggests that the
persistence of legionellae in biocide-treated biofilms is dependent on factor(s)
other than biofilm structure, such as the nature of EPS, which may be affected by
NALCO 7320. Nevertheless, it was found that most legionellae persisted in 20%-

Discussion
Department of Microbiology, NUS 144
60% and 40%-80% region of the remains of developing and mature biofilm
respectively, while least legionellae was found at top 20%, and both top and
bottom 20% of the remains of developing and mature biofilm respectively (Figure
4.48). This shows the existence of regions within the biocide-treated biofilms that
are more conducive for legionellae persistence. Furthermore, upon addition of
NALCO 7320, legionellae were found in the bulk fluid of CBR at high levels
(Figure 4.46), about more than 10× of that found in the bulk fluid of CBR without
NALCO 7320 added (Figure 4.42). This indicates high level of legionellae
detachment from biofilms treated with NALCO 7320, most likely together with
biomass from the P. aeruginosa PAO1-CFP biofilm.
Conclusion
In conclusion, the biofilm model set up in present study is reproducible and has
distinct developmental stages corroborating with that formed in other laboratory
(Sauer et al., 2002). To achieve greater insights of biofilm structure and properties,
certain data, such as bio-volume and SBR, were split up into 5 sections along the
biofilm thickness, and a method to quantify biofilm porosity was optimized and
applied in present study. Consequently, biofilm structures and development were
better described and the first physical evidence of porous flow channels within
biofilm cell cluster was discovered. Legionellae adhesion to biofilms was not
dependent on the developmental stage of the latter. Instead, biofilm structure and
porosity were found to determine the amount and even localization of legionellae
adhesion to biofilm. This opens up an unexplored possibility of controlling
legionellae colonization of existing biofilms in cooling towers by decreasing the

Discussion
Department of Microbiology, NUS 145
porosity of biofilms. In addition, the bottom 60% of biofilms, especially at bottom
20%, was found to be stable regions within P. aeruginosa PAO1-CFP biofilm that
harbored and protected legionellae from being desorbed. Nevertheless, unbalanced
advective transport of legionellae towards biofilm surface took place after biofilm
maturation, and is most probably due to unbalanced cell growth. Thus, suggesting
that the bottom region of mature biofilm could harbor most legionellae eventually,
as compared to the rest of the biofilm. This further adds emphasis to the
overwhelming need of deep penetrating biocides to eradicate legionellae.
Developing P. aeruginosa PAO1-CFP biofilm was completely disinfected by
24hrs of exposure to NALCO 7320, which contained DBNPA as the active
ingredient, while a resistant subpopulation was found in the remains of mature
biofilm. NALCO 7320 exerted different effects on developing and mature
biofilms. From the porosity distribution data and biofilm structural analysis, it is
theorized that NALCO 7320 caused biofilm detachment by affecting the nature of
EPS matrix that bound the microbial cells together as a microcolony, while
applying biocidal effect on P. aeruginosa PAO1-CFP cells within the biofilm.
Persistence of legionellae in biocide-treated biofilms was found to be independent
on the stage of biofilm development and loss of biomass, but there exists regions
of the biofilms in which legionellae best persist. Since EPS is a major component
in biofilm matrix, it may play an important role in legionellae persistence in
biocide-treated biofilms.

Discussion
Department of Microbiology, NUS 146
Future Directions
Quick re-establishments of legionellae in biocide-treated cooling towers are
common (Kurtz et al., 1982). Therefore, it is necessary to improve on our
knowledge on legionellae persistence in biocide-treated biofilms. Since this study
suggests that EPS may play a role in legionellae persistence in biocide-treated
biofilms, further studies is required to verify this hypothesis.
In addition, it is also necessary to conduct further studies to determine whether
these persisting legionellae and even legionellae detached from the biofilm are
viable. Although 50ppm of NALCO 7320 was sufficiently bactericidal to
planktonic legionellae, it is unsure if 100ppm of NALCO 7320 is bactericidal to
legionellae detached from biofilms. This is because detaching biomass could
range from single cells to aggregate with a diameter of approximately 500µm
(Stoodley et al., 2001), which could provide shelter for legionellae from the
biocide in the bulk fluid. Problems can arise when concentrated numbers of such
biofilm-associated legionellae become detached from substrata (Stoodley et al.,
2001) where they have the potential to reach the consumer as an infective dose.
Last but not least, further studies should be conducted to determine the mode of
action of biofilm-removing agents used in this study, because this knowledge may
in turn provide insights into novel strategies of preventing public health problem.
However, since these biofilm-removing agents are proprietary products, closer
collaborations with the respective companies will be necessary.

References
Department of Microbiology, NUS 147
References
Adeleke A, Pruckler J, Benson R, Rowbotham T, Halablab M, Fields B. 1996.
Legionella-like amebal pathogens--phylogenetic status and possible role in
respiratory disease. Emerg Infect Dis. 2(3):225-30.
Alpkvist E, Picioreanu C, van Loosdrecht MC, Heyden A. 2006. Three-
dimensional biofilm model with individual cells and continuum EPS matrix.
Biotechnol Bioeng. [Epub ahead of print].
Atlas RM. 1999. Legionella: from environmental habitats to disease pathology,
detection and control. Environ Microbiol. 1(4):283-93.
Bakke R, Characklis WG, Turakhia MH, Yeh AI. 1989. Modeling a
monopopulation biofilm system: Pseudomonas aeruginosa. pp487-520. In:
Characklis WG and Marshall KC (eds.), Biofilms. Wiley, New York.
Barker J, Brown MR, Collier PJ, Farrell I, Gilbert P. 1992. Relationship between
Legionella pneumophila and Acanthamoeba polyphaga: physiological status and
susceptibility to chemical inactivation. Appl Environ Microbiol. 58(8):2420-5.
[Erratum in: Appl Environ Microbiol. 1992. 58(12):4089].
Bartlett JG, Dowell SF, Mandell LA, File Jr TM, Musher DM, Fine MJ. 2000.
Practice guidelines for the management of community-acquired pneumonia in
adults. Infectious Diseases Society of America. Clin Infect Dis. 31(2):347-82.

References
Department of Microbiology, NUS 148
Benson RF, Fields BS. 1998. Classification of the genus Legionella. Semin Respir
Infect. 13(2):90-9.
Bentham RH. 2000. Routine sampling and the control of Legionella spp. in
cooling tower water systems. Curr Microbiol. 41(4):271-5.
Bentham RH, Broadbent CR. 1993. A model for autumn outbreaks of
Legionnaires' disease associated with cooling towers, linked to system operation
and size. Epidemiol Infect. 111(2):287-95.
Berk SG, Ting RS, Turner GW, Ashburn RJ. 1998. Production of respirable
vesicles containing live Legionella pneumophila cells by two Acanthamoeba spp.
Appl Environ Microbiol. 64(1):279-86.
Blatt SP, Parkinson MD, Pace E, Hoffman P, Dolan D, Lauderdale P, Zajac RA,
Melcher GP. 1993. Nosocomial Legionnaires' disease: aspiration as a primary
mode of disease acquisition. Am J Med. 95(1):16-22.
Borella P, Guerrieri E, Marchesi I, Bondi M, Messi P. 2005. Water ecology of
Legionella and protozoan: environmental and public health perspectives.
Biotechnol Annu Rev.11:355-80.
Boshuizen HC, Neppelenbroek SE, van Vliet H, Schellekens JF, den Boer JW,
Peeters MF, Conyn-van Spaendonck MA. 2001. Subclinical Legionella infection

References
Department of Microbiology, NUS 149
in workers near the source of a large outbreak of Legionnaires’ disease. J Infect
Dis. 184(4):515-8.
Boss MJ, Day DW. 2003. Legionella and cooling towers. pp267-306. In: Boss MJ
and Day DW (eds.), Biological risk engineering handbook: infection control and
decontamination. Lewis Pub, Boca Raton, Fla.
Bosshardt SC, Benson RF, Fields BS. 1997. Flagella are a positive predictor for
virulence in Legionella. Microb Pathog. 23(2):107-12.
Brieland JK, Fantone JC, Remick DG, LeGendre M, McClain M, Engleberg NC.
1997. The role of Legionella pneumophila-infected Hartmannella vermiformis as
an infectious particle in a murine model of Legionnaire's disease. Infect Immun.
65(12):5330-3.
Brenner DJ, Feeley JC, Weaver RE. 1985. Family VII. Legionellaceae. Vol.1.
pp279-288. In: Krieg NR and Holt JG (eds.), Bergey’s manual of systematic
bacteriology. The Williams & Wilkins Co., Baltimore, London.
Broadbent CR. 1993. Strategies for prevention and control of Legionellosis in
Australia. pp283-7. In: Barbaree JM et al. (eds.), Legionella: Current Status and
Emerging Perspectives. Washington, D.C.: American Society for Microbiology.

References
Department of Microbiology, NUS 150
Caiazza NC, O'Toole GA. 2004. SadB is required for the transition from
reversible to irreversible attachment during biofilm formation by Pseudomonas
aeruginosa PA14. J Bacteriol. 186(14):4476-85.
Characklis WG. 1990a. Microbial fouling. pp523-84. In: Characklis WG and
Marshall KC (eds.), Biofilms. New York: Wiley.
Characklis WG. 1990b. Microbial biofouling control. pp585-633. In: Characklis
WG and Marshall KC (eds.), Biofilms. Wiley, New York.
Chedid MB, Ilha Dde O, Chedid MF, Dalcin PR, Buzzetti M, Jaconi Saraiva P,
Griza D, Menna Barreto SS. 2005. Community-acquired pneumonia by Legionella
pneumophila serogroups 1-6 in Brazil. Respir Med. 99(8):966-75.
Ciesielski CA, Blaser MJ, Wang WL. 1984. Role of stagnation and obstruction of
water flow in isolation of Legionella pneumophila from hospital plumbing. Appl
Environ Microbiol. 48(5):984-7.
Cirillo JD, Cirillo SL, Yan L, Bermudez LE, Falkow S, Tompkins LS. 1999.
Intracellular growth in Acanthamoeba castellanii affects monocyte entry
mechanisms and enhances virulence of Legionella pneumophila. Infect Immun.
67(9):4427-34.

References
Department of Microbiology, NUS 151
Cirillo JD, Falkow S, Tompkins LS.1994. Growth of Legionella pneumophila in
Acanthamoeba castellanii enhances invasion. Infect Immun. 62(8):3254-61.
Cochran WL, McFeters GA, Stewart PS. 2000. Reduced susceptibility of thin
Pseudomonas aeruginosa biofilms to hydrogen peroxide and monochloramine. J
Appl Microbiol. 88(1):22-30.
Cogan NG, Keener JP. 2004. The role of the biofilm matrix in structural
development. Math Med Biol. 21(2):147-66.
Davey ME, O'Toole GA. 2000. Microbial biofilms: from ecology to molecular
genetics. Microbiol Mol Biol Rev. 64(4):847-67.
Davies DG, Parsek MR, Pearson JP, Iglewski BH, Costerton JW, Greenberg EP.
1998. The involvement of cell-to-cell signals in the development of a bacterial
biofilm. Science. 280(5361):295-8.
Davies DG, Geesey GG. 1995. Regulation of the alginate biosynthesis gene algC
in Pseudomonas aeruginosa during biofilm development in continuous culture.
Appl Environ Microbiol. 61(3):860-7.
deBeer D, Stoodley P, Roe F, Lewandowski Z. 1994a. Effects of biofilm
structures on oxygen distribution and mass transport. Biotechnol Bioeng. 43:1131-
8.

References
Department of Microbiology, NUS 152
de Beer D, Srinivasan R, Stewart PS. 1994b. Direct measurement of chlorine
penetration into biofilms during disinfection. Appl Environ Microbiol.
60(12):4339-44.
Den Boer JW, Yzerman EP. 2004. Diagnosis of Legionella infection in
Legionnaires' disease. Eur J Clin Microbiol Infect Dis. 23(12):871-8.
Diogo A, Verissimo A, Nobre MF, da Costa MS. 1999. Usefulness of fatty acid
composition for differentiation of Legionella species. J Clin Microbiol.
37(7):2248-54.
Drenkard E. 2003. Antimicrobial resistance of Pseudomonas aeruginosa biofilms.
Microbes Infect. 5(13):1213-9.
Edelstein PH. 1998. Antimicrobial chemotherapy for Legionnaires’ disease: time
for a change. Ann Intern Med. 129(4):328-30.
Edelstein PH. 1993. Legionnaires' disease. Clin Infect Dis. 16(6):741-9.
Edelstein PH. 1982. Comparative study of selective media for isolation of
Legionella pneumophila from potable water. J Clin Microbiol. 16(4):697-9.
Elsmore R. 1986. Biocidal control of legionellae. Isr J Med Sci. 22(9):647-54.

References
Department of Microbiology, NUS 153
England AC 3rd, Fraser DW, Mallison GF, Mackel DC, Skaliy P, Gorman GW.
1982. Failure of Legionella pneumophila sensitivities to predict culture results
from disinfectant-treated air-conditioning cooling towers. Appl Environ
Microbiol. 43(1):240-4.
Fang GD, Yu VL, Vickers RM. 1989. Disease due to the Legionellaceae (other
than Legionella pneumophila). Historical, microbiological, clinical, and
epidemiological review. Medicine (Baltimore). 68(2):116-32.
Feeley JC, Gibson RJ, Gorman GW, Langford NC, Rasheed JK, Mackel DC,
Baine WB. 1979. Charcoal-yeast extract agar: primary isolation medium for
Legionella pneumophila. J Clin Microbiol. 10(4):437-41.
Feeley JC, Gorman GW, Weaver RE, Mackel DC, Smith HW. 1978. Primary
isolation media for Legionnaires’ disease bacterium. J Clin Microbiol. 8(3):320-5.
Fenchel T. 2002. Microbial behavior in a heterogeneous world. Science.
296(5570):1068-71.
Ferraro MJ. 2003. Methods for dilution antimicrobial susceptibility tests for
bacteria that grow aerobically: approved standard. 6th Edition. NCCLS, Wayne,
PA.

References
Department of Microbiology, NUS 154
Fields BS. 2002. Legionellae and Legionnaires’ Disease. pp860-70. In: Christon J.
Hurst (ed.), Manual of environmental microbiology, 2nd Edition. ASM Press,
Washington, D.C.
Fields BS, Benson RF, Besser RE. 2002. Legionella and Legionnaires’ disease: 25
years of investigation. Clin Microbiol. 3:506–26.
Fields BS, Haupt T, Davis JP, Arduino MJ, Miller PH, Butler JC. 2001. Pontiac
fever due to Legionella micdadei from a whirlpool spa: possible role of bacterial
endotoxin. J Infect Dis. 15:1289–92.
Fields BS. 1996. The molecular ecology of legionellae. Trends in Microbiol.
4(7):286-90.
Fields BS, Barbaree JM, Sanden GN, Morrill WE. 1990. Virulence of a
Legionella anisa strain associated with Pontiac fever: an evaluation using
protozoan, cell culture, and guinea pig models. Infect Immun. 58(9):3139-42.
Fisher-Hoch S, Hudson MJ, Thompson MH. 1979. Identification of a clinical
isolate as Legionella pneumophila by gas chromatography and mass spectrometry
of cellular fatty acids. Lancet. 2(8138):323-5.

References
Department of Microbiology, NUS 155
Fitzgeorge RB, Dennis PJ. 1983. Isolation of Legionella pneumophila from water
supplies: comparison of methods based on the guinea-pig and culture media. J
Hyg (Lond). 91(2):179-87.
Flemming HC. 2002. Biofouling in water systems – cases, caused and
countermeasures. Appl Microbiol Biotechnol. 59:629-40.
Fliermans, CB. 1996. Ecology of Legionella: from data to knowledge with a little
wisdom. Microb Ecol. 32:203-28.
Fliermans CB. 1995. Legionella ecology. pp 49-76. In: Burge HA (ed.),
Bioaerosols. Lewis Publishers, Boca Raton.
Fliermans CB, Harvey RS. 1984. Effectiveness of 1-bromo-3-chloro-5,5-
dimethylhydantoin against Legionella pneumophila in a cooling tower. Appl
Environ Microbiol. 47(6):1307-10.
Fliermans CB, Bettinger GE and Fynsk AW. 1982. Treatment of cooling systems
containing high levels of Legionella pneumophila. Water Research. 16(6):903-
909.
Fliermans CB, Cherry WB, Orrison LH, Smith SJ, Tison DL, Pope DH. 1981.
Ecological distribution of Legionella pneumophila. Appl Environ Microbiol.
41(1):9-16.

References
Department of Microbiology, NUS 156
Fliermans CB, Cherry WB, Orrison LH, Thacker L. 1979. Isolation of Legionella
pneumophila from nonepidemic-related aquatic habitats. Appl Environ Microbiol.
37(6):1239-42.
Foy HM, Broome CV, Hayes PS, Allan I, Cooney MK, Tobe R. 1979.
Legionnaires' disease in a prepaid medical-care group in Seattle 1963--75. Lancet.
1(8119):767-70.
Fraser DW, Tsai TR, Orenstein W, Parkin WE, Beecham HJ, Sharrar RG, Harris
J, Mallison GF, Martin SM, McDade JE, Shepard CC, Brachman PS. 1977.
Legionnaires' disease: description of an epidemic of pneumonia. N Engl J Med.
297(22):1189-97.
Fry NK, Rowbotham TJ, Saunders NA, Embley TM. 1991. Direct amplification
and sequencing of the 16S ribosomal DNA of an intracellular Legionella species
recovered by amoebal enrichment from the sputum of a patient with pneumonia.
FEMS Microbiol Lett. 67(2):165-8.
Garbe PL, Davis BJ, Weisfeld JS, Markowitz L, Miner P, Garrity F, Barbaree JM,
Reingold AL. 1985. Nosocomial Legionnaires' disease: Epidemiologic
demonstration of cooling towers as a source. JAMA. 254(4):521-4.

References
Department of Microbiology, NUS 157
Glick TH, Gregg MB, Berman B, Mallison G, Rhodes WW Jr, Kassanoff I. 1978.
Pontiac fever. An epidemic of unknown etiology in a health department: I.
Clinical and epidemiologic aspects. Am J Epidemiol. 107(2):149-60.
Goh KT, Ng DL, Yap J, Ma S, Ooi EE. 2005. Surveillance, prevention, and
control of legionellosis in a tropical city-state. Am J Infect Control. 33(5):286-91.
Gomez-Lus, R., Lomba, E., Gomez-Lus, P. et al. 1993. In vitro antagonistic
activity of Pseudomonas aeruginosa, Klebsiella pneumoniae, and Aeromonas spp.
against Legionella spp. pp. 265-67. In: Barbaree JM et al. (eds.), Legionella:
Current Status and Emerging Perspectives. Washington, D.C.: American Society
for Microbiology.
Grobe KJ, Zahller J, Stewart PS. 2002. Role of dose concentration in biocide
efficacy against Pseudomonas aeruginosa biofilms. J Ind Microbiol Biotechnol.
29(1):10-5.
Harrigan WF. 1998. Miles and Misra surface colony count, pp58-9. In:
Laboratory methods in food microbiology, 3rd Edition. San Diego: Academic
Press.
Hall-Stoodley L, Costerton JW, Stoodley P. 2004. Bacterial biofilms: from the
natural environment to infectious diseases. Nat Rev Microbiol. 2(2):95-108.

References
Department of Microbiology, NUS 158
Heath CH, Grove DI, Looke DF. 1996. Delay in appropriate therapy of Legionella
pneumonia associated with increased mortality. Eur J Clin Microbiol Infect Dis.
15(4):286-90.
Heller R, Holler C, Sussmuth R, Gundermann KO. 1998. Effect of salt
concentration and temperature on survival of Legionella pneumophila. Lett Appl
Microbiol. 26(1):64-8.
Heng BH, Goh KT, Ng DL, Ling AE. 1997. Surveillance of legionellosis and
Legionella bacteria in the built environment in Singapore. Ann Acad Med
Singapore. 26(5):557-65.
Henrichsen J. 1972. Bacterial surface translocation: a survey and a classification.
Bacteriol Rev. 36(4):478-503.
Heuner K, Brand BC, Hacker J. 1999. The expression of the flagellum of
Legionella pneumophila is modulated by different environmental factors. FEMS
Microbiol Lett. 175(1):69-77.
Heuner K, Bender-Beck L, Brand BC, Luck PC, Mann KH, Marre R, Ott M,
Hacker J. 1995. Cloning and genetic characterization of the flagellum subunit
gene (flaA) of Legionella pneumophila serogroup 1. Infect Immun. 63(7):2499-
507.

References
Department of Microbiology, NUS 159
Heydorn A, Ersboll B, Kato J, Hentzer M, Parsek MR, Tolker-Nielsen T, Givskov
M, Molin S. 2002. Statistical analysis of Pseudomonas aeruginosa biofilm
development: impact of mutations in genes involved in twitching motility, cell-to-
cell signaling, and stationary-phase sigma factor expression. Appl Environ
Microbiol. 68(4):2008-17.
Heydorn A, Nielsen AT, Hentzer M, Sternberg C, Givskov M, Ersboll BK, Molin
S. 2000. Quantification of biofilm structures by the novel computer program
COMSTAT. Microbiology. 146(10):2395-407.
Holloway BW. 1955. Genetic recombination in Pseudomonas aeruginosa. J Gen
Microbiol. 13(3):572-81.
Hussong D, Colwell RR, O’Brien M, Weiss E, Pearson AD, Weiner RM, Burge
WD. 1987. Viable Legionella pneumophila not culturable by culture on agar
medium. BioTechnology 5:947-50.
Kaiser D. 2003. Coupling cell movement to multicellular development in
myxobacteria. Nat Rev Microbiol. 1(1):45-54.
Katz SM, Hammel JM. 1987. The effect of drying, heat, and pH on the survival of
Legionella pneumophila. Ann Clin Lab Sci. 17(3):150-6.

References
Department of Microbiology, NUS 160
Kaufmann AF, McDade JE, Patton CM, Bennett JV, Skaliy P, Feeley JC,
Anderson DC, Potter ME, Newhouse VF, Gregg MB, Brachman PS. 1981.
Pontiac fever: isolation of the etiologic agent (Legionella pneumophilia) and
demonstration of its mode of transmission. Am J Epidemiol. 114(3):337-47.
Kilvington S, Price J. 1990. Survival of Legionella pneumophila within cysts of
Acanthamoeba polyphaga following chlorine exposure. J Appl Bacteriol.
68(5):519-25.
Kim BR, Anderson JE, Mueller SA, Gaines WA, Kendall AM. 2002. Literature
review--efficacy of various disinfectants against Legionella in water systems.
Water Res. 36(18):4433-44.
Kimura S, Tateda K, Ishii Y, Fuse ET, Yamaguchi K. 2005. Pseudomonas
aeruginosa Las-quorum-sensing autoinducer suppresses growth of and virulence
factors in Legionella pneumophila. 6th International Conference on Legionella.
Chicago, IL, USA. October 16-20.
Kjelleberg S, Molin S. 2002 . Is there a role for quorum sensing signals in
bacterial biofilms? Curr Opin Microbiol. 5(3):254-8.
Klausen M, Heydorn A, Ragas P, Lambertsen L, Aaes-Jorgensen A, Molin S,
Tolker-Nielsen T. 2003a. Biofilm formation by Pseudomonas aeruginosa wild
type, flagella and type IV pili mutants. Mol Microbiol. 48(6):1511-24.

References
Department of Microbiology, NUS 161
Klausen M, Aaes-Jorgensen A, Molin S, Tolker-Nielsen T. 2003b. Involvement of
bacterial migration in the development of complex multicellular structures in
Pseudomonas aeruginosa biofilms. Mol Microbiol. 50(1):61-8.
Korber DR, Lawrence JR, Henry MJ and Caldwell DE. 1993. Analysis of spatial
variability within Mot+ and Mot- Pseudomonas fluorescens biofilms using
representative elements. Biofouling. 7: 339-58.
Kuchta JM, States SJ, McNamara AM, Wadowsky RM, Yee RB. 1983.
Susceptibility of Legionella pneumophila to chlorine in tap water. Appl Environ
Microbiol. 46(5):1134-9.
Kurtz JB, Bartlett CL, Newton UA, White RA, Jones NL. 1982. Legionella
pneumophila in cooling water systems. Report of a survey of cooling towers in
London and a pilot trial of selected biocides. J Hyg (Lond). 88(3):369-81.
Langmark J, Storey MV, Ashbolt NJ, Stenstrom TA. 2005. Accumulation and fate
of microorganisms and microspheres in biofilms formed in a pilot-scale water
distribution system. Appl Environ Microbiol. 71(2):706-12.
Lawrence JR, Korber DR, Hoyle BD, Costerton JW, Caldwell DE. 1991. Optical
sectioning of microbial biofilms. J Bacteriol. 173(20):6558-67.
LeChevallier MW, Cawthon CD, Lee RG. 1988. Inactivation of biofilm bacteria.

References
Department of Microbiology, NUS 162
Appl Environ Microbiol. 54(10):2492-9.
Leoni E, Legnani PP. 2001. Comparison of selective procedures for isolation and
enumeration of Legionella species from hot water systems. J Appl Microbiol.
90(1):27-33.
Lewandowski Z, Beyenal H, Stookey D. 2004. Reproducibility of biofilm
processes and the meaning of steady state in biofilm reactors. Water Sci Technol.
49(11-12):359-64.
Lewandowski Z. 2000. Notes on biofilm porosity. Water Research. 34(9):2620-4.
Lim HS, Tham MK, Chua KL.1986. Legionnaires' disease--report of Singapore's
first local case. Ann Acad Med Singapore. 15(4):610-6.
Liu Y, Tay JH. 2001. Metabolic response of biofilm to shear stress in fixed-film
culture. J Appl Microbiol. 90(3):337-42.
Mah TF, O'Toole GA. 2001. Mechanisms of biofilm resistance to antimicrobial
agents. Trends Microbiol. 9(1):34-9.
Maiwald M, Helbig JH, Luck PC. 1998. Laboratory methods for diagnosis of
Legionella infections. J Microbiol Methods. 33:59-79.

References
Department of Microbiology, NUS 163
Mampel J, Spirig T, Weber SS, Haagensen JA, Molin S, Hilbi H. 2006. Planktonic
replication is essential for biofilm formation by Legionella pneumophila in a
complex medium under static and dynamic flow conditions. Appl Environ
Microbiol. 72(4):2885-95.
Marrão G, Veríssimo A, Bowker RG, da Costa MS. 1993. Biofilms as major
sources of Legionella spp. in hydrothermal areas and their dispersion into stream
water. FEMS Microbiology Ecology. 12(1):25-33.
Marston BJ, Plouffe JF, File TM Jr, Hackman BA, Salstrom SJ, Lipman HB,
Kolczak MS, Breiman RF. 1997. Incidence of community-acquired pneumonia
requiring hospitalization. Results of a population-based active surveillance study
in Ohio. The Community-Based Pneumonia Incidence Study Group. Arch Intern
Med. 157(15):1709-18.
Marston BJ, Lipman HB, Breiman RF. 1994. Surveillance for Legionnaires'
disease. Risk factors for morbidity and mortality. Arch Intern Med. 154(21):2417-
22.
Massol-Deya AA, Whallon J, Hickey RF, Tiedje JM. 1995. Channel structures in
aerobic biofilms of fixed-film reactors treating contaminated groundwater. Appl
Environ Microbiol. 61(2):769-77.

References
Department of Microbiology, NUS 164
McDade JE, Brenner DJ, Bozeman FM. 1979. Legionnaires' disease bacterium
isolated in 1947. Ann Intern Med. 90(4):659-61.
McDade JE, Shepard CC, Fraser DW, Tsai TR, Redus MA, Dowdle WR. 1977.
Legionnaires' disease: isolation of a bacterium and demonstration of its role in
other respiratory disease. N Engl J Med. 297(22):1197-203.
Meers PD, Goh KT, Lim EW.1989. Legionella species, serogroups and subgroups
found in the environment in Singapore. Ann Acad Med Singapore. 18(4):375-8.
Montagna MT, Napoli C, Tato D, Spilotros G, Barbuti G, Barbuti S. 2006.
Clinical-environmental surveillance of legionellosis: an experience in southern
Italy. Eur J Epidemiol. 21(4):325-31.
Muder RR, Yu VL. 2002. Infection due to Legionella species other than L.
pneumophila. Clin Infect Dis. 35(8):990-8.
Murga R, Forster TS, Brown E, Pruckler JM, Fields BS, Donlan RM. 2001. Role
of biofilms in the survival of Legionella pneumophila in a model potable-water
system. Microbiology. 147(11):3121-6.
Nadarajah M, Singam S, Jalil HA. 1987. Sero-survey for Legionella pneumophila
antibodies--Singapore experience. Ann Acad Med Singapore. 16(4):583-5.

References
Department of Microbiology, NUS 165
Nadarajah M, Goh KT. 1986. Isolation of Legionella pneumophila from hospital
cooling towers. Ann Acad Med Singapore. 15(1):6-8.
Negron-Alvira A, Perez-Suarez I, Hazen TC. 1988. Legionella spp. in Puerto Rico
cooling towers. Appl Environ Microbiol. 54(10):2331-4.
Okabe S, Yasuda T, Watanabe Y. 1996. Uptake and release of inert fluorescence
particles by mixed population biofilms. Biotechnology and Bioengineering.
53(5):459-69.
Ong KC, Eng P. 1995. Community-acquired pneumonia. Singapore Med J.
36(5):539-44.
O’Toole GA, Pratt LA, Watnick PI, Newman DK, Weaver VB, Kolter R. 1999.
Genetic approaches to study of biofilms. Methods Enzymol. 310: 91-109.
O'Toole GA, Kolter R. 1998. Flagellar and twitching motility are necessary for
Pseudomonas aeruginosa biofilm development. Mol Microbiol. 30(2):295-304.
Ott M, Messner P, Heesemann J, Marre R, Hacker J. 1991. Temperature-
dependent expression of flagella in Legionella. J Gen Microbiol. 137(8):1955-61.
Pace NR. 1997. A molecular view of microbial diversity and the biosphere.
Science. 276(5313):734-40.

References
Department of Microbiology, NUS 166
Paszko-Kolva C, Shahmat M, Keiser J and Colwell RR. 1993. Prevalence of
antibodies against Legionella species in healthy and patient populations. pp. 24-5.
In: Barbaree JM et al. (eds.), Legionella: Current Status and Emerging
Perspectives. Washington, D.C.: American Society for Microbiology.
Palmer CJ, Tsai YL, Paszko-Kolva C, Mayer C, Sangermano LR. 1993. Detection
of Legionella species in sewage and ocean water by polymerase chain reaction,
direct fluorescent-antibody, and plate culture methods. Appl Environ Microbiol.
59(11):3618-24.
Pearson JP, Passador L, Iglewski BH, Greenberg EP. 1995. A second N-
acylhomoserine lactone signal produced by Pseudomonas aeruginosa. Proc Natl
Acad Sci U S A. 92(5):1490-4.
Pearson JP, Gray KM, Passador L, Tucker KD, Eberhard A, Iglewski BH,
Greenberg EP. 1994. Structure of the autoinducer required for expression of
Pseudomonas aeruginosa virulence genes. Proc Natl Acad Sci U S A. 91(1):197-
201.
Picioreanu C, Kreft JU, Van Loosdrecht MC. 2004. Particle-based
multidimensional multispecies biofilm model. Appl Environ Microbiol.
70(5):3024-40.

References
Department of Microbiology, NUS 167
Prince EL, Muir AV, Thomas WM, Stollard RJ, Sampson M, Lewis JA. 2002. An
evaluation of the efficacy of Aqualox for microbiological control of industrial
cooling tower systems. J Hosp Infect. 52(4):243-9.
Purevdorj B, Costerton JW, Stoodley P. 2002. Influence of hydrodynamics and
cell signaling on the structure and behavior of Pseudomonas aeruginosa biofilms.
Appl Environ Microbiol. 68(9):4457-64.
Reisner A, Haagensen JA, Schembri MA, Zechner EL, Molin S. 2003.
Development and maturation of Escherichia coli K-12 biofilms. Mol Microbiol.
48(4):933-46.
Rickard AH, McBain AJ, Stead AT, Gilbert P. 2004. Shear rate moderates
community diversity in freshwater biofilms. Appl Environ Microbiol.
70(12):7426-35.
Rickard AH, McBain AJ, Ledder RG, Handley PS, Gilbert P. 2003.
Coaggregation between freshwater bacteria within biofilm and planktonic
communities. FEMS Microbiol Lett. 220(1):133-40.
Rickard AH, Leach SA, Hall LS, Buswell CM, High NJ, Handley PS. 2002.
Phylogenetic relationships and coaggregation ability of freshwater biofilm
bacteria. Appl Environ Microbiol. 68(7):3644-50.

References
Department of Microbiology, NUS 168
Rickard AH, Leach SA, Buswell CM, High NJ, Handley PS. 2000. Coaggregation
between aquatic bacteria is mediated by specific-growth-phase-dependent lectin-
saccharide interactions. Appl Environ Microbiol. 66(1):431-4.
Ricketts K, Joseph C. 2005. Legionnaires' disease in Europe 2003-2004. Euro
Surveill. 10(12): 256-9.
Rogers J, Dowsett AB, Keevil CW. 1995. A paint incorporating silver to control
mixed biofilms containing Legionella pneumophila. J Ind Microbiol. 15(4):377-
83.
Rogers J, Dowsett AB, Dennis PJ, Lee JV, Keevil CW. 1994. Influence of
temperature and plumbing material selection on biofilm formation and growth of
Legionella pneumophila in a model potable water system containing complex
microbial flora. Appl Environ Microbiol. 60(5):1585-92.
Rogers J, Keevil CW. 1992. Immunogold and fluorescein immunolabelling of
Legionella pneumophila within an aquatic biofilm visualized by using episcopic
differential interference contrast microscopy. Appl Environ Microbiol.
58(7):2326-30.
Rowbotham TJ. 1986. Current views on the relationships between amoebae,
legionellae and man. Isr J Med Sci. 22(9):678-89.

References
Department of Microbiology, NUS 169
Ruehlemann SA, Crawford GR. 1996. Panic in the potting shed: The association
between Legionella longbeachae serogroup 1 and potting soils in Australia. Med J
Aust. 164(1):36-8. Erratum in: Med J Aust. 1996. 164(11):704.
Sauer K, Camper AK, Ehrlich GD, Costerton JW, Davies DG. 2002.
Pseudomonas aeruginosa displays multiple phenotypes during development as a
biofilm. J Bacteriol. 184(4):1140-54.
Schmid T, Panne U, Adams J, Niessner R. 2004. Investigation of biocide efficacy
by photoacoustic biofilm monitoring. Water Res. 38(5):1189-96.
Shapiro HM, Nebe-von-Caron G. 2004. Multiparameter flow cytometry of
bacteria. pp33-43. In: Hawley TS and Hawley RG (eds.). Flow cytometry
protocols, 2nd Edition. Humana Press, Totowa, N.J.
Shelton BG, Flanders WD, Morris GK. 1994. Legionnaires’ disease outbreaks and
cooling towers with amplified Legionella concentrations. Curr Microbiol. 28:359-
363.
Srikanth S, Berk SG. 1993. Stimulatory effect of cooling tower biocides on
amoebae. Appl Environ Microbiol. 59(10):3245-9.
Steele TW, Lanser J, Sangster N. 1990. Isolation of Legionella longbeachae
serogroup 1 from potting mixes. Appl Environ Microbiol. 56(1):49-53.

References
Department of Microbiology, NUS 170
Steinert M, Hentschel U, Hacker J. 2002. Legionella pneumophila: an aquatic
microbe goes astray. FEMS Microbiol Rev. 26(2):149-62.
Steinert M, Emody L, Amann R, Hacker J. 1997. Resuscitation of viable but
nonculturable Legionella pneumophila Philadelphia JR32 by Acanthamoeba
castellanii. Appl Environ Microbiol. 63(5):2047-53.
Stoodley P, Sauer K, Davies DG, Costerton JW. 2002. Biofilms as complex
differentiated communities. Annu Rev Microbiol. 56:187-209.
Stoodley P, Wilson S, Hall-Stoodley L, Boyle JD, Lappin-Scott HM, Costerton
JW. 2001. Growth and detachment of cell clusters from mature mixed-species
biofilms. Appl Environ Microbiol. 67(12):5608-13.
Stoodley P, Lewandowski Z, Boyle JD, Lappin-Scott HM. 1999. Structural
deformation of bacterial biofilms caused by short-term fluctuations in fluid shear:
an in situ investigation of biofilm rheology. Biotechnol Bioeng. 65(1):83-92.
Stoodley P, deBeer D and Lewandowski Z. 1994. Liquid flow in biofilm systems.
Appl. Environ. Microbiol. 60(8):2711-6.
Stout JE, Rihs JD, Yu VL. 2003. Legionella. Vol.2. pp809-23. In: Murray PR
(ed.), Manual of clinical microbiology, 8th Edition. ASM Press, Washington, D.C.
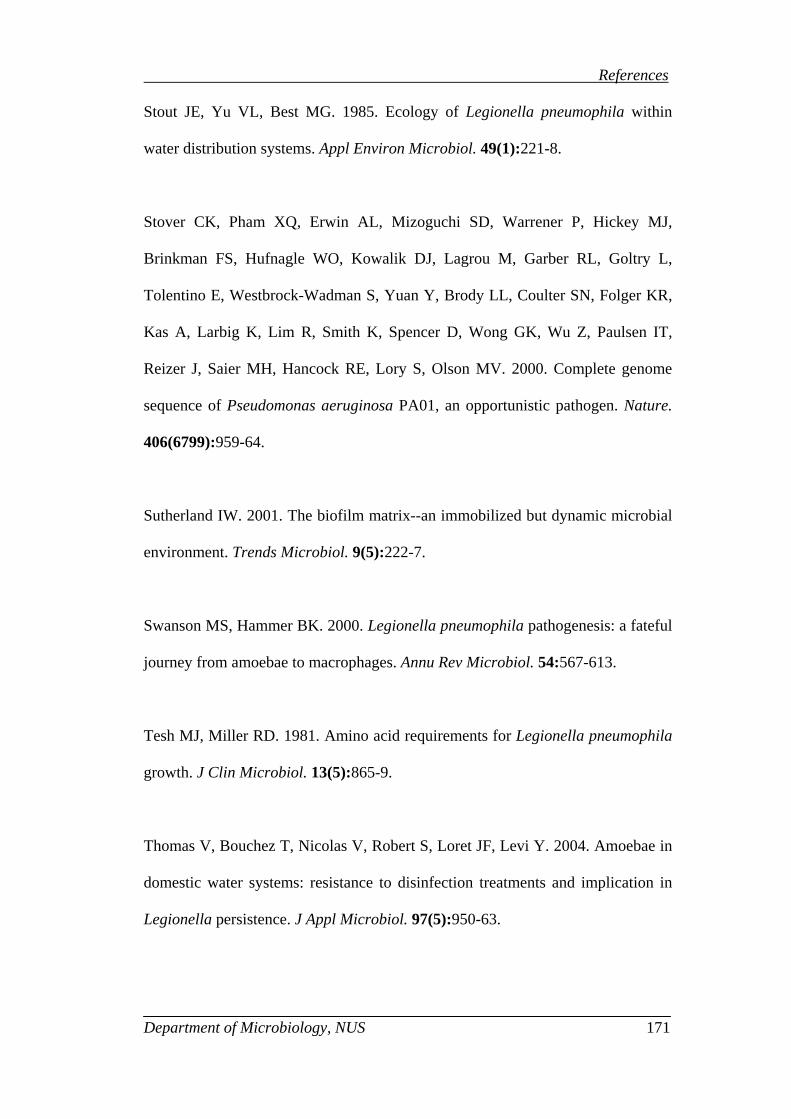
References
Department of Microbiology, NUS 171
Stout JE, Yu VL, Best MG. 1985. Ecology of Legionella pneumophila within
water distribution systems. Appl Environ Microbiol. 49(1):221-8.
Stover CK, Pham XQ, Erwin AL, Mizoguchi SD, Warrener P, Hickey MJ,
Brinkman FS, Hufnagle WO, Kowalik DJ, Lagrou M, Garber RL, Goltry L,
Tolentino E, Westbrock-Wadman S, Yuan Y, Brody LL, Coulter SN, Folger KR,
Kas A, Larbig K, Lim R, Smith K, Spencer D, Wong GK, Wu Z, Paulsen IT,
Reizer J, Saier MH, Hancock RE, Lory S, Olson MV. 2000. Complete genome
sequence of Pseudomonas aeruginosa PA01, an opportunistic pathogen. Nature.
406(6799):959-64.
Sutherland IW. 2001. The biofilm matrix--an immobilized but dynamic microbial
environment. Trends Microbiol. 9(5):222-7.
Swanson MS, Hammer BK. 2000. Legionella pneumophila pathogenesis: a fateful
journey from amoebae to macrophages. Annu Rev Microbiol. 54:567-613.
Tesh MJ, Miller RD. 1981. Amino acid requirements for Legionella pneumophila
growth. J Clin Microbiol. 13(5):865-9.
Thomas V, Bouchez T, Nicolas V, Robert S, Loret JF, Levi Y. 2004. Amoebae in
domestic water systems: resistance to disinfection treatments and implication in
Legionella persistence. J Appl Microbiol. 97(5):950-63.

References
Department of Microbiology, NUS 172
Tison DL, Pope DH, Cherry WB, Fliermans CB. 1980. Growth of Legionella
pneumophila in association with blue-green algae (cyanobacteria). Appl Environ
Microbiol. 39(2):456-9.
Tolker-Nielsen T, Brinch UC, Ragas PC, Andersen JB, Jacobsen CS, Molin S.
2000. Development and dynamics of Pseudomonas sp. biofilms. J Bacteriol.
182(22):6482-9.
Tossa P, Deloge-Abarkan M, Zmirou-Navier D, Hartemann P, Mathieu L. 2006.
Pontiac fever: an operational definition for epidemiological studies. BMC Public
Health. 6:112.
Tsai TF, Finn DR, Plikaytis BD, McCauley W, Martin SM, Fraser DW. 1979.
Legionnaires' disease: clinical features of the epidemic in Philadelphia. Ann Intern
Med. 90(4):509-17.
van Loosdrecht MC, Heijnen JJ, Eberl H, Kreft J, Picioreanu C. 2002.
Mathematical modelling of biofilm structures. Antonie Van Leeuwenhoek. 81(1-
4):245-56.
Verissimo A, Marrao G, da Silva FG, da Costa MS. 1991. Distribution of
Legionella spp. in hydrothermal areas in continental Portugal and the island of
Sao Miguel, Azores. Appl Environ Microbiol. 57(10):2921-7.

References
Department of Microbiology, NUS 173
Wadowsky RM, Yee RB. 1985. Effect of non-Legionellaceae bacteria on the
multiplication of Legionella pneumophila in potable water. Appl Environ
Microbiol. 49(5):1206-10.
Walker JT, Sonesson A, Keevil CW, White DC. 1993. Detection of Legionella
pneumophila in biofilms containing a complex microbial consortium by gas
chromatography-mass spectrometry analysis of genus-specific hydroxy fatty
acids. FEMS Microbiol Lett. 113(2):139-44.
Watnick PI, Kolter R. 1999. Steps in the development of a Vibrio cholerae El Tor
biofilm. Mol Microbiol. 34(3):586-95.
Webb JS, Thompson LS, James S, Charlton T, Tolker-Nielsen T, Koch B,
Givskov M, Kjelleberg S. 2003. Cell death in Pseudomonas aeruginosa biofilm
development. J Bacteriol. 185(15):4585-92.
Westall F, de Wit MJ, Dann J, van der Gaast S, de Ronde CEJ and Gerneke D.
2001. Early Archean fossil bacteria and biofilms in hydrothermally-influenced
sediments from the Barberton greenstone belt, South Africa. Precambrian Res.
106:93-116.
Winiecka-Krusnell J, Linder E. 1999. Free-living amoebae protecting Legionella
in water: the tip of an iceberg? Scand J Infect Dis. 31(4):383-5.

References
Department of Microbiology, NUS 174
Winn WC Jr. 1999. Legionella. pp572-85. In: Murray PR (ed.), Manual of clinical
microbiology, 7th Edition. ASM Press, Washington D.C.
Wright JB. 2000. Legionella Biofilms: their Implications, Study and Control.
pp291-310. In: L.V. Evans (ed.), Biofilms: recent advances in their study and
control. Harwood Academic, Amsterdam.
Yamamoto H, Ezaki T, Ikedo M, Yabuuchi E. 1991. Effects of biocidal treatments
to inhibit the growth of legionellae and other microorganisms in cooling towers.
Microbiol Immunol. 35(9):795-802.
Yang X, Beyenal H, Harkin G, Lewandowski Z. 2000. Quantifying biofilm
structure using image analysis. Journal of Microbiological Methods. 39(2):109-
19.
Yang S, Lewandowski Z. 1995. Measurement of local mass transfer coefficient in
biofilms. Biotechnology and Bioengineering. 48:737-44.
Yu VL, Plouffe JF, Pastoris MC, Stout JE, Schousboe M, Widmer A, Summersgill
J, File T, Heath CM, Paterson DL, Chereshsky A. 2002. Distribution of Legionella
species and serogroups isolated by culture in patients with sporadic community-
acquired legionellosis: an international collaborative survey. J Infect Dis.
186:127–8.

Appendix
Department of Microbiology, NUS 175
Appendix Appendix I Edelstein BCYE liquid media: 2.0g Activated charcoal 10.0g Yeast extract 1L Deionized water Autoclaved at 121°C for 15mins. The media was allowed to cool before adding Legionella BCYE growth supplement (Oxoid Limited, UK) reconstituted as directed and filter sterilized. Appendix II Luria Bertani (LB) broth: 5g Yeast extract 10g Tryptone 10g NaCl 1L Deionized water Autoclaved at 121°C for 15mins. LB agar: Additional inclusion of 15g granulated agar in 1L LB broth and autoclaved at 121°C for 15mins. Appendix III Minimal media (MM): 10.5g K2HPO44.5g KH2PO42.0g (NH4)2SO42.0g Mannitol 0.2g MgSO4.7H2O 10mg CaCl25mg FeSO4.7H2O 2mg MnCl21L Deionized water Autoclaved at 121°C for 15mins. Appendix IV Phosphate Buffer Saline (PBS): 0.24g KH2PO41.44g Na2HPO48g NaCl 0.2g KCl 1L Deionized water Adjusted to pH 7.4 with 1N NaOH or 1M HCl, and autoclaved at 121°C for 15mins.

Appendix
Department of Microbiology, NUS 176
Appendix V CFDA-SE stock solution (3.6mM): 1) Dissolve 2mg CFDA-SE (Molecular weight: 557) in 20μl DMSO 2) Top up to 1ml with ethanol (reagent grade) 3) Filter-sterilize & store at -20ºC in the dark 4) Working concentration: 10µM Appendix VI 4% Para-formaldehyde (PFA) solution: 1) Dissolved EM grade PFA in PBS with stir bar (4g to 100ml). 2) Add few drops of 1N NaOH and heat in hood (keep bottle cap loose) at 60°C
to dissolve. 3) Cool to room temperature and adjust to pH 7.4 with 1M HCl. *Prepare fresh prior to use.
Related Documents