Inter-regulation of the unfolded protein response and auxin signaling Yani Chen 1 , Kyaw Aung 1 , Jakub Rol c ık 2 , Kathryn Walicki 1 , Ji r ı Friml 3,4 and Federica Brandizzi 1, * 1 Department of Energy Plant Research Laboratory, Department of Plant Biology, Michigan State University, East Lansing, MI 48824, USA, 2 Laboratory of Growth Regulators, Faculty of Science, Palacky ´ University and Institute of Experimental Botany AS CR, S ˇ lechtitelu ˚ 11, 78371 Olomouc, Czech Republic, 3 Department of Functional Genomics and Proteomics, Central European Institute of Technology (CEITEC), Masaryk University, 62500 Brno, Czech Republic, and 4 Institute of Science and Technology Austria (IST Austria), 3400 Klosterneuburg, Austria Received 8 July 2013; revised 17 October 2013; accepted 21 October 2013; published online 4 November 2013. *For correspondence (e-mail [email protected]). SUMMARY The unfolded protein response (UPR) is a signaling network triggered by overload of protein-folding demand in the endoplasmic reticulum (ER), a condition termed ER stress. The UPR is critical for growth and development; nonetheless, connections between the UPR and other cellular regulatory processes remain largely unknown. Here, we identify a link between the UPR and the phytohormone auxin, a master regulator of plant physiology. We show that ER stress triggers down-regulation of auxin receptors and transporters in Arabidopsis thaliana. We also demonstrate that an Arabidopsis mutant of a conserved ER stress sensor IRE1 exhibits defects in the auxin response and levels. These data not only support that the plant IRE1 is required for auxin homeostasis, they also reveal a species-specific feature of IRE1 in multicellular eukary- otes. Furthermore, by establishing that UPR activation is reduced in mutants of ER-localized auxin trans- porters, including PIN5, we define a long-neglected biological significance of ER-based auxin regulation. We further examine the functional relationship of IRE1 and PIN5 by showing that an ire1 pin5 triple mutant enhances defects of UPR activation and auxin homeostasis in ire1 or pin5. Our results imply that the plant UPR has evolved a hormone-dependent strategy for coordinating ER function with physiological processes. Keywords: endoplasmic reticulum stress, unfolded protein response, auxin response, IRE1, PIN5, Arabidop- sis thaliana. INTRODUCTION The unfolded protein response (UPR) adjusts the endoplas- mic reticulum (ER) protein-folding capacity to cope with the dynamic secretory protein demands in cells (Kozutsumi et al., 1988; Schroder and Kaufman, 2005). When the ER protein-folding machinery is competent, stress sensors are restrained in the ER by ER-resident chaperones (Bertolotti et al., 2000; Kimata et al., 2003). Accumulation of unfolded proteins in the ER activates ER stress sensors either by causing them to dissociate from protein chaperones or to associate with unfolded proteins (Bertolotti et al., 2000; Kimata et al., 2003; Credle et al., 2005; Gardner and Walter, 2011). Activated ER stress sensors transmit signals to the nucleus for transcriptional regulation of UPR target genes (Kozutsumi et al., 1988; Schroder and Kaufman, 2005). If ER stress is not resolved, the UPR triggers the activation of cell death (Lin et al., 2007). IRE1, the only identified ER stress sensor in yeast, is conserved in multicellular eukary- otes (Cox et al., 1993; Mori et al., 1993). Two IRE1 homo- logues, AtIRE1A and AtIRE1B, have been proven to be functional ER stress sensors in Arabidopsis (Nagashima et al., 2011; Chen and Brandizzi, 2012). The activation of IRE1 relies on auto-phosphorylation, conformational modi- fication, and oligomerization. Activated IRE1 splices an intron from the mRNA of a UPR-specific bZIP transcription factor (Cox and Walter, 1996). The spliced transcription fac- tor enters the nucleus to control UPR target genes (Cox and Walter, 1996). The UPR is critical for numerous fundamental cellular processes (Wu and Kaufman, 2006). IRE1 alpha knockout mice exhibit embryonic lethality (Iwawaki et al., 2009). © 2013 The Authors The Plant Journal © 2013 John Wiley & Sons Ltd 97 The Plant Journal (2014) 77, 97–107 doi: 10.1111/tpj.12373

Welcome message from author
This document is posted to help you gain knowledge. Please leave a comment to let me know what you think about it! Share it to your friends and learn new things together.
Transcript
Inter-regulation of the unfolded protein response and auxinsignaling
Yani Chen1, Kyaw Aung1, Jakub Rol�c�ık2, Kathryn Walicki1, Ji�r�ı Friml3,4 and Federica Brandizzi1,*1Department of Energy Plant Research Laboratory, Department of Plant Biology, Michigan State University, East Lansing, MI
48824, USA,2Laboratory of Growth Regulators, Faculty of Science, Palacky University and Institute of Experimental Botany AS CR,
Slechtitelu 11, 78371 Olomouc, Czech Republic,3Department of Functional Genomics and Proteomics, Central European Institute of Technology (CEITEC), Masaryk
University, 62500 Brno, Czech Republic, and4Institute of Science and Technology Austria (IST Austria), 3400 Klosterneuburg, Austria
Received 8 July 2013; revised 17 October 2013; accepted 21 October 2013; published online 4 November 2013.
*For correspondence (e-mail [email protected]).
SUMMARY
The unfolded protein response (UPR) is a signaling network triggered by overload of protein-folding
demand in the endoplasmic reticulum (ER), a condition termed ER stress. The UPR is critical for growth and
development; nonetheless, connections between the UPR and other cellular regulatory processes remain
largely unknown. Here, we identify a link between the UPR and the phytohormone auxin, a master regulator
of plant physiology. We show that ER stress triggers down-regulation of auxin receptors and transporters in
Arabidopsis thaliana. We also demonstrate that an Arabidopsis mutant of a conserved ER stress sensor
IRE1 exhibits defects in the auxin response and levels. These data not only support that the plant IRE1 is
required for auxin homeostasis, they also reveal a species-specific feature of IRE1 in multicellular eukary-
otes. Furthermore, by establishing that UPR activation is reduced in mutants of ER-localized auxin trans-
porters, including PIN5, we define a long-neglected biological significance of ER-based auxin regulation. We
further examine the functional relationship of IRE1 and PIN5 by showing that an ire1 pin5 triple mutant
enhances defects of UPR activation and auxin homeostasis in ire1 or pin5. Our results imply that the plant
UPR has evolved a hormone-dependent strategy for coordinating ER function with physiological processes.
Keywords: endoplasmic reticulum stress, unfolded protein response, auxin response, IRE1, PIN5, Arabidop-
sis thaliana.
INTRODUCTION
The unfolded protein response (UPR) adjusts the endoplas-
mic reticulum (ER) protein-folding capacity to cope with
the dynamic secretory protein demands in cells (Kozutsumi
et al., 1988; Schroder and Kaufman, 2005). When the ER
protein-folding machinery is competent, stress sensors are
restrained in the ER by ER-resident chaperones (Bertolotti
et al., 2000; Kimata et al., 2003). Accumulation of unfolded
proteins in the ER activates ER stress sensors either by
causing them to dissociate from protein chaperones or to
associate with unfolded proteins (Bertolotti et al., 2000;
Kimata et al., 2003; Credle et al., 2005; Gardner and Walter,
2011). Activated ER stress sensors transmit signals to the
nucleus for transcriptional regulation of UPR target genes
(Kozutsumi et al., 1988; Schroder and Kaufman, 2005). If
ER stress is not resolved, the UPR triggers the activation of
cell death (Lin et al., 2007). IRE1, the only identified ER
stress sensor in yeast, is conserved in multicellular eukary-
otes (Cox et al., 1993; Mori et al., 1993). Two IRE1 homo-
logues, AtIRE1A and AtIRE1B, have been proven to be
functional ER stress sensors in Arabidopsis (Nagashima
et al., 2011; Chen and Brandizzi, 2012). The activation of
IRE1 relies on auto-phosphorylation, conformational modi-
fication, and oligomerization. Activated IRE1 splices an
intron from the mRNA of a UPR-specific bZIP transcription
factor (Cox and Walter, 1996). The spliced transcription fac-
tor enters the nucleus to control UPR target genes (Cox
and Walter, 1996).
The UPR is critical for numerous fundamental cellular
processes (Wu and Kaufman, 2006). IRE1 alpha knockout
mice exhibit embryonic lethality (Iwawaki et al., 2009).
© 2013 The AuthorsThe Plant Journal © 2013 John Wiley & Sons Ltd
97
The Plant Journal (2014) 77, 97–107 doi: 10.1111/tpj.12373
Dysregulation of the UPR contributes to the pathology of
several significant diseases, including diabetes, neurode-
generation, and cancer (Marciniak and Ron, 2006). In
Arabidopsis, mutations of IRE1 lead to a short primary root
phenotype (Chen and Brandizzi, 2012). Despite the high
significance of the UPR in growth and development in mul-
ticellular eukaryotes, the regulatory connections between
the UPR and other cellular responses remain unclear.
Because the hormone auxin has profound roles in most
plant developmental processes, nucleus-based auxin sig-
naling and plasma membrane (PM)-based inter-cellular
auxin transport have been intensively studied. Three major
classes of auxin signaling regulators exist in the nucleus:
TIR1/AFB auxin co-receptors (Gray et al., 1999; Dharmasiri
et al., 2005; Kepinski and Leyser, 2005), AUX/IAA transcrip-
tional repressors (Gray et al., 2001), and ARF transcription
factors (Ulmasov et al., 1997). To initiate the auxin
response in the nucleus, TIR1/AFBs and auxin coordinately
promote degradation of AUX/IAA transcriptional repres-
sors. Consequently, ARFs are released from repression and
activate the transcription of auxin-responsive genes (Gray
et al., 1999; Dharmasiri et al., 2005; Kepinski and Leyser,
2005).
Directional (polar) transport between cells is another cru-
cial regulatory aspect of the auxin response. The auxin
efflux carriers of the PIN family are the principal compo-
nents of the polar auxin transport machinery (Petrasek
et al., 2006; Wisniewska et al., 2006). Based on protein
topology and sub-cellular localization, PINs can be classi-
fied into PM- or ER-localized types (Mravec et al., 2009; Dal
Bosco et al., 2012; Ding et al., 2012). While PM-based inter-
cellular auxin transport has been considered the most criti-
cal point of regulation in the auxin response, it has
recently been revealed that ER-based auxin regulation is
also important. A putative auxin receptor, ABP1, and sev-
eral auxin transporters (PIN5, PIN6, PIN8, and PILSs) have
been shown to localize to the ER. The requirement of the
ER-localized regulators in the auxin response underscores
the existence of ER-based auxin biology (Mravec et al.,
2009; Barbez et al., 2012; Dal Bosco et al., 2012). Despite
accumulating evidence that the ER is crucial for auxin reg-
ulation (Friml and Jones, 2010), the physiological impact of
ER-based auxin signaling is largely unknown.
As the UPR is critical for growth and development, we
sought to identify the regulatory connection between the
UPR and other cellular regulatory processes. Given the
central roles of auxin in numerous aspects of plant physiol-
ogy, we hypothesized that the UPR regulates auxin signal-
ing for coordinating secretory activities and physiological
responses. Through biochemical, molecular biology, and
genetic analyses, we demonstrate a connection between
the UPR and auxin biology. Specifically, we show that ER
stress negatively influences auxin signaling and that the
ER-based auxin homoeostasis is important for UPR activa-
tion, supporting that the plant UPR alters auxin signaling
to cope with ER stress. On the contrary, by establishing
that IRE1 is required for the auxin responses, our work
reveals that IRE1 has a specific role in hormonal signaling.
The regulatory connections between the UPR and auxin
biology revealed here hint that plants have evolved an
organism-specific strategy to maintain balance between
stress adaption and growth regulation.
RESULTS
ER stress alters the expression of auxin regulators
To examine whether ER stress modulates the transcription
of auxin regulators, we monitored the expression of four
auxin co-receptors: TIR1, AFB1, AFB2, and AFB3 (TIR1/
AFBs), under ER stress. The UPR was activated by inhibit-
ing protein N-glycosylation using a classical ER stress
inducer termed tunicamycin (Tm). Arabidopsis seedlings
were subjected to Tm for various periods of time, as
adopted in established protocols (Koizumi et al., 2001; Noh
et al., 2002; Mishiba et al., 2013). The transcriptional induc-
tion of UPR target genes is a molecular indication of UPR
activation. To quantify the UPR activation levels, we moni-
tored the transcription of classical UPR activation indica-
tors, BiP1/2 and PDI6 over a 4-h time course of Tm
treatment using quantitative reverse transcription-polymer-
ase chain reaction (RT-qPCR) analyses (Kamauchi et al.,
2005). BiP1/2 is an ER chaperone essential for the UPR and
a primary UPR target gene. PDI6 encodes protein disulfide
isomerase. Similar to BiP proteins, upregulation of PDI6
under ER stress contributes to increasing protein-folding
capacity in the ER. RT-qPCR showed that both BiP1/2 and
PDI6 were induced more than twofold at 0.5 h of Tm treat-
ment and their levels increased over the time course of
treatment (Figure S1). Interestingly, we found that there
was a 20–55% percent reduction in the level of TIR1/AFB
transcripts 4 h after Tm treatment in wild-type Col-0 seed-
lings (Figure 1a). These results imply that ER stress nega-
tively influences auxin signaling by repressing TIR1/AFB
transcripts. As TIR1/AFBs activate the auxin response by
promoting degradation of the AUX/IAA transcriptional
repressors, we sought to determine whether the ER stress-
induced repression of TIR1/AFB transcripts resulted in the
stabilization of AUX/IAA proteins. To do so, we conducted
western blot analyses using transgenic Arabidopsis plants
expressing DII-VENUS, a fluorescently tagged auxin-inter-
action domain (DII) of AUX/IAAs that contains the canoni-
cal degron responsible for auxin- and TIR1/AFB-mediated
protein degradation (Brunoud et al., 2012). As the stabiliza-
tion of AUX/IAAs is a downstream response of TIR1/AFB
reduction, we examined DII-VENUS protein levels 6 h after
Tm treatment. Indeed, immunoblot analyses showed that
the protein levels of DII-VENUS increased in wild-type Col-
0 roots under ER stress treatment (Figure 1b). Consistent
© 2013 The AuthorsThe Plant Journal © 2013 John Wiley & Sons Ltd, The Plant Journal, (2014), 77, 97–107
98 Yani Chen et al.

with the western blot analysis results, a confocal micros-
copy approach revealed that DII-VENUS fluorescence
levels, and therefore AUX/IAA protein levels, were
consistently greater in roots challenged by the ER stress
inducer than in mock-treated ones (Figure 1c). Together
these observations support that ER stress leads to an
increase in AUX/IAA levels, which is most likely a conse-
quence of protein stabilization resulting from the down-
regulation of TIR1/AFBs (Figure 1a).
Next, we investigated whether ER stress could control
the transcription of auxin transporters. Using RT-qPCR
analyses, we detected a 30–80% decrease in the mRNA
levels of PIN1, PIN2, PIN3, PIN4, PIN5, PIN6, and PIN7 in
wild-type Col-0 seedlings during ER stress treatment
(Figure 1d). In contrast, the transcriptional levels of an ER-
associated ethylene receptor (ETR1), two ER-localized cyto-
kinin receptors (AHK2 and AHK3), three nuclear protein
(RAN2, ABH1, and FIB1), and two secretory proteins (VSR1
and SCAMP3; Chang et al., 1993; Ahmed et al., 1997;
Kanneganti et al., 2007; Ma et al., 2007; Kierzkowski et al.,
2009; Wulfetange et al., 2011; Law et al., 2012) remained
unchanged in ER stress conditions (Figure S2). Thus, we
conclude that the Tm-induced decrease in the abundance
of TIR1/AFB and PIN transcripts is a specific cellular
response. When ER stress was triggered by reduction of
disulfide bond formation using dithiotreitol (DTT) treat-
ment, similar down-regulation of TIR1/AFB and PIN tran-
scripts was observed (Figure S3). Overall, these results
show that ER stress specifically modulates the auxin
response by repressing the transcription of auxin co-recep-
tors and transporters.
Next, we examined whether either IRE1 or TIR1/AFBs is
essential for ER stress-induced down-regulation of auxin
regulators. To do so, we performed the same ER stress
treatment coupled with RT-qPCR analyses in an atire1a
atire1b double mutant and a tir1 afb1 afb2 afb3 mutant
(Dharmasiri et al., 2005; Chen and Brandizzi, 2012). In
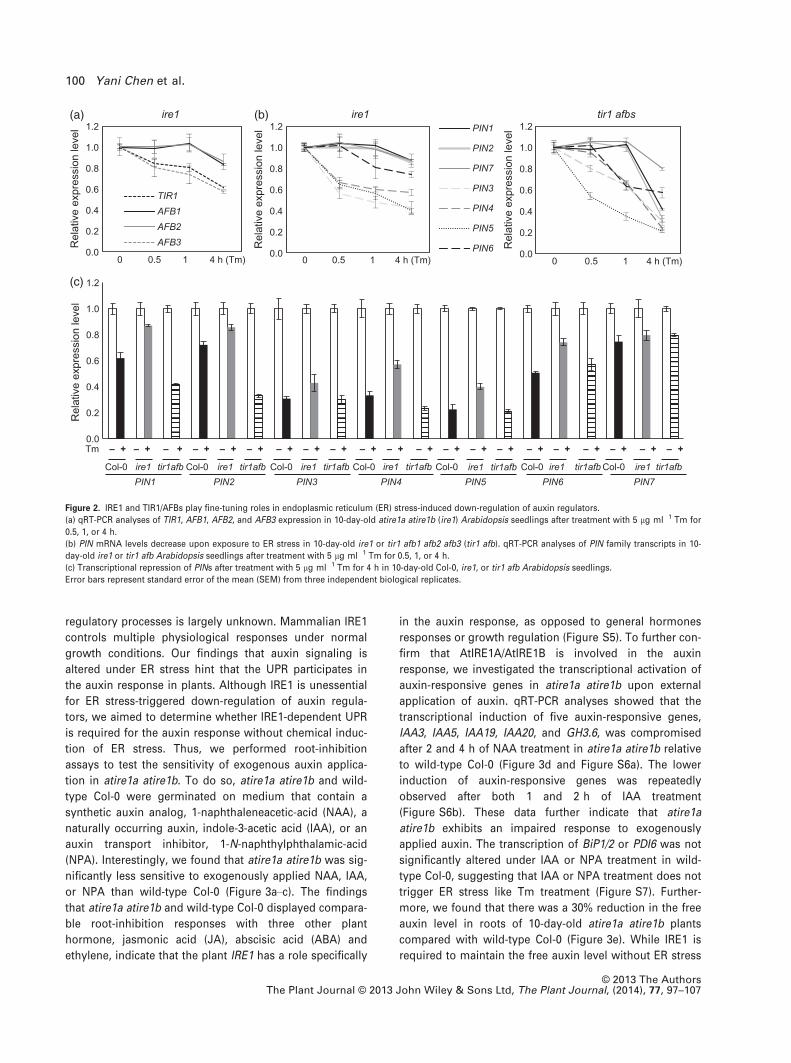
atire1a atire1b, both TIR1/AFB and PIN transcripts were still
reduced under ER stress conditions (Figure 2a,b), similar
to the decreased TIR1/AFB and PIN transcripts pattern seen
in wild-type Col-0 (Figure 1a). The PIN transcripts also
decreased under ER stress conditions in tir1 afb1 afb2 afb3
mutant backgrounds (Figure 2b). With the exception of
PIN7, in atire1a atire1b, the PIN and TIR1/AFB transcription
levels were further slightly reduced compared with wild-
type Col-0 (Figure 2c and Figure S4). In contrast, the reduc-
tion of PIN1, PIN2, and PIN4 transcript levels was larger in
the tir1 afb1 afb2 afb3 mutant compared with wild-type
Col-0 (Figure 2c). These data indicate that down-regulation
of PIN transcripts on ER stress is partially and slightly
affected by mutations of either IRE1 or TIR1/AFBs. These
results further suggest that the IRE1 and TIR1/AFBs play
unessential but fine-tuning roles in ER stress-mediated
repression of auxin regulators.
IRE1 is required for auxin responses and homeostasis
While the UPR is necessary for growth and development,
the manner by which the UPR influences other cellular
0.0
0.2
0.4
0.6
0.8
1.0
1.2
TIR1AFB1AFB2AFB3
Rel
ativ
e ex
pres
sion
leve
l
0.0
0.2
0.4
0.6
0.8
1.0
1.2 ETR1
PIN1
PIN2
PIN7
PIN3
PIN4
PIN5
PIN60 0.5 1 4 h (Tm)
Rel
ativ
e ex
pres
sion
leve
l
DMSO
Tm
0 0.5 1 4 h (Tm)
DII-VENUS
DMSO Tm
130
55
36
9572
55
36
(a) (b) (d)(c)
Figure 1. Endoplasmic reticulum (ER) stress alters the expression of auxin regulators.
(a) qRT-PCR analyses of TIR1, AFB1, AFB2, and AFB3 expression in 10-day-old Col-0 Arabidopsis seedlings after treatment with 5 lg ml�1 Tm for 0.5, 1, or 4 h.
Error bars represent standard error of the mean (SEM) from three independent biological replicates. P-values were calculated by Student’s two-tailed t-test
against expression levels at 4 h relative to 0 h: TIR1 (P = 0.00036), AFB1 (P = 0.00041), AFB2 (P = 0.00048), AFB3 (P = 0.00032).
(b) The levels of DII-VENUS fusion proteins increase upon exposure to ER stress. Ten-day-old DII-VENUS transgenic plants were treated with 5 lg ml�1 Tm or
dimethyl sulfoxide (DMSO) for 6 h. Proteins were extracted from root tissues and the fusion proteins were detected by immunoblot analysis using anti-GFP
serum (upper panel). Coomassie blue staining gel used as loading control (lower panel).
(c) Ten-day-old transgenic plants expressing DII-VENUS were treated with 5 lg ml�1 Tm or DMSO for 6 h. Primary root tips were subjected to confocal micros-
copy analyses. Scale bars = 50 lm.
(d) PIN mRNA levels decrease upon exposure to ER stress. qRT-PCR analyses of PIN family transcripts in 10-day-old wild-type Col-0 seedlings during treatment
with 5 lg ml�1 Tm for 0.5, 1, or 4 h. Error bars represent standard error of the mean (SEM) from three independent biological replicates. P-values were calcu-
lated against expression levels at 4 h relative to 0 h: PIN1 (P = 0.00221), PIN2 (P = 0.00316), PIN3 (P = 5.4E�05), PIN4 (P = 4.9E�05), PIN5 (P = 6.4E�05), PIN6
(P = 0.00012), PIN7 (P = 0.00353). The transcriptional level of ETR1, an endoplasmic reticulum (ER)-associated ethylene receptor, was unchanged after treatment
with Tm for 0.5, 1, or 4 h.
© 2013 The AuthorsThe Plant Journal © 2013 John Wiley & Sons Ltd, The Plant Journal, (2014), 77, 97–107
UPR and auxin signaling 99
regulatory processes is largely unknown. Mammalian IRE1
controls multiple physiological responses under normal
growth conditions. Our findings that auxin signaling is
altered under ER stress hint that the UPR participates in
the auxin response in plants. Although IRE1 is unessential
for ER stress-triggered down-regulation of auxin regula-
tors, we aimed to determine whether IRE1-dependent UPR
is required for the auxin response without chemical induc-
tion of ER stress. Thus, we performed root-inhibition
assays to test the sensitivity of exogenous auxin applica-
tion in atire1a atire1b. To do so, atire1a atire1b and wild-
type Col-0 were germinated on medium that contain a
synthetic auxin analog, 1-naphthaleneacetic-acid (NAA), a
naturally occurring auxin, indole-3-acetic acid (IAA), or an
auxin transport inhibitor, 1-N-naphthylphthalamic-acid
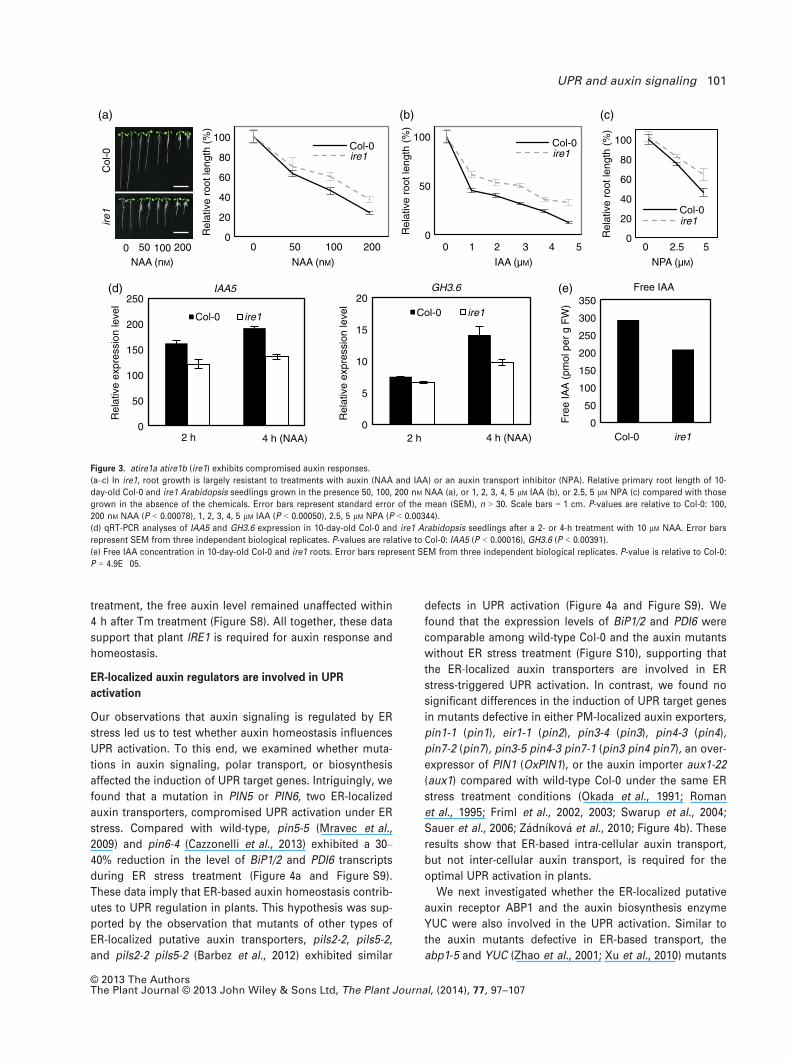
(NPA). Interestingly, we found that atire1a atire1b was sig-
nificantly less sensitive to exogenously applied NAA, IAA,
or NPA than wild-type Col-0 (Figure 3a–c). The findings
that atire1a atire1b and wild-type Col-0 displayed compara-
ble root-inhibition responses with three other plant
hormone, jasmonic acid (JA), abscisic acid (ABA) and
ethylene, indicate that the plant IRE1 has a role specifically
in the auxin response, as opposed to general hormones
responses or growth regulation (Figure S5). To further con-
firm that AtIRE1A/AtIRE1B is involved in the auxin
response, we investigated the transcriptional activation of
auxin-responsive genes in atire1a atire1b upon external
application of auxin. qRT-PCR analyses showed that the
transcriptional induction of five auxin-responsive genes,
IAA3, IAA5, IAA19, IAA20, and GH3.6, was compromised
after 2 and 4 h of NAA treatment in atire1a atire1b relative
to wild-type Col-0 (Figure 3d and Figure S6a). The lower
induction of auxin-responsive genes was repeatedly
observed after both 1 and 2 h of IAA treatment
(Figure S6b). These data further indicate that atire1a
atire1b exhibits an impaired response to exogenously
applied auxin. The transcription of BiP1/2 or PDI6 was not
significantly altered under IAA or NPA treatment in wild-
type Col-0, suggesting that IAA or NPA treatment does not
trigger ER stress like Tm treatment (Figure S7). Further-
more, we found that there was a 30% reduction in the free
auxin level in roots of 10-day-old atire1a atire1b plants
compared with wild-type Col-0 (Figure 3e). While IRE1 is
required to maintain the free auxin level without ER stress
Rel
ativ
e ex
pres
sion
leve
l
ire1
0.0
0.2
0.4
0.6
0.8
1.0
1.2
TIR1AFB1AFB2AFB3
0 0.5 1 4 h (Tm)
(a)
0.0
0.2
0.4
0.6
0.8
1.0
1.2 PIN1
PIN2
PIN7
PIN3
PIN4
PIN5
PIN6 Rel
ativ
e ex
pres
sion
leve
l
0.0
0.2
0.4
0.6
0.8
1.0
1.2
0 0.5 1 4 h (Tm) 0 0.5 1 4 h (Tm)R
elat
ive
expr
essi
on le
vel
(b) ire1 tir1 afbs
Col-0 ire1 tir1afb ire1 tir1afbire1 tir1afbCol-0 Col-0 Col-0 Col-0 Col-0 Col-0PIN1 PIN2 PIN3 PIN4 PIN5 PIN6 PIN7
0.0
0.2
0.4
0.6
0.8
1.0
1.2
Tm – + – + – + – + – + – + – + – + – + – + – + – + – + – + – + – + – + – + – + – + – +
Rel
ativ
e ex
pres
sion
leve
l
(c)
ire1 tir1afb ire1 tir1afb ire1 tir1afb ire1 tir1afb
Figure 2. IRE1 and TIR1/AFBs play fine-tuning roles in endoplasmic reticulum (ER) stress-induced down-regulation of auxin regulators.
(a) qRT-PCR analyses of TIR1, AFB1, AFB2, and AFB3 expression in 10-day-old atire1a atire1b (ire1) Arabidopsis seedlings after treatment with 5 lg ml�1 Tm for
0.5, 1, or 4 h.
(b) PIN mRNA levels decrease upon exposure to ER stress in 10-day-old ire1 or tir1 afb1 afb2 afb3 (tir1 afb). qRT-PCR analyses of PIN family transcripts in 10-
day-old ire1 or tir1 afb Arabidopsis seedlings after treatment with 5 lg ml�1 Tm for 0.5, 1, or 4 h.
(c) Transcriptional repression of PINs after treatment with 5 lg ml�1 Tm for 4 h in 10-day-old Col-0, ire1, or tir1 afb Arabidopsis seedlings.
Error bars represent standard error of the mean (SEM) from three independent biological replicates.
© 2013 The AuthorsThe Plant Journal © 2013 John Wiley & Sons Ltd, The Plant Journal, (2014), 77, 97–107
100 Yani Chen et al.
treatment, the free auxin level remained unaffected within
4 h after Tm treatment (Figure S8). All together, these data
support that plant IRE1 is required for auxin response and
homeostasis.
ER-localized auxin regulators are involved in UPR
activation
Our observations that auxin signaling is regulated by ER
stress led us to test whether auxin homeostasis influences
UPR activation. To this end, we examined whether muta-
tions in auxin signaling, polar transport, or biosynthesis
affected the induction of UPR target genes. Intriguingly, we
found that a mutation in PIN5 or PIN6, two ER-localized
auxin transporters, compromised UPR activation under ER
stress. Compared with wild-type, pin5-5 (Mravec et al.,
2009) and pin6-4 (Cazzonelli et al., 2013) exhibited a 30–
40% reduction in the level of BiP1/2 and PDI6 transcripts
during ER stress treatment (Figure 4a and Figure S9).
These data imply that ER-based auxin homeostasis contrib-
utes to UPR regulation in plants. This hypothesis was sup-
ported by the observation that mutants of other types of
ER-localized putative auxin transporters, pils2-2, pils5-2,
and pils2-2 pils5-2 (Barbez et al., 2012) exhibited similar
defects in UPR activation (Figure 4a and Figure S9). We
found that the expression levels of BiP1/2 and PDI6 were
comparable among wild-type Col-0 and the auxin mutants
without ER stress treatment (Figure S10), supporting that
the ER-localized auxin transporters are involved in ER
stress-triggered UPR activation. In contrast, we found no
significant differences in the induction of UPR target genes
in mutants defective in either PM-localized auxin exporters,
pin1-1 (pin1), eir1-1 (pin2), pin3-4 (pin3), pin4-3 (pin4),
pin7-2 (pin7), pin3-5 pin4-3 pin7-1 (pin3 pin4 pin7), an over-
expressor of PIN1 (OxPIN1), or the auxin importer aux1-22
(aux1) compared with wild-type Col-0 under the same ER
stress treatment conditions (Okada et al., 1991; Roman
et al., 1995; Friml et al., 2002, 2003; Swarup et al., 2004;
Sauer et al., 2006; Z�adn�ıkov�a et al., 2010; Figure 4b). These
results show that ER-based intra-cellular auxin transport,
but not inter-cellular auxin transport, is required for the
optimal UPR activation in plants.
We next investigated whether the ER-localized putative
auxin receptor ABP1 and the auxin biosynthesis enzyme
YUC were also involved in the UPR activation. Similar to
the auxin mutants defective in ER-based transport, the
abp1-5 and YUC (Zhao et al., 2001; Xu et al., 2010) mutants
Rel
ativ
e ro
ot le
ngth
(%
)
0
50
100 Col-0ire1
0
20
40
60
80
100Col-0ire1
Rel
ativ
e ro
ot le
ngth
(%
)
0 50 100 200
NAA (nM)0 50 100 200
NAA (nM)
Col
-0ire
1
0
20
40
60
80
100
Col-0ire1
Rel
ativ
e ro
ot le
ngth
(%
)
0 2.5 5
NPA (µM)
0
50
100
150
200
250
Col-0 ire1
IAA5
0
5
10
15
20Col-0 ire1
0
50
100
150
200
250
300
350Free IAA(d) (e)GH3.6
Fre
e IA
A (
pmol
per
g F
W)
Rel
ativ
e ex
pres
sion
leve
l
2 h 4 h (NAA)
Rel
ativ
e ex
pres
sion
leve
l
2 h 4 h (NAA) Col-0 ire1
0 1 2 3 4 5
IAA (µM)
(a) (b) (c)
Figure 3. atire1a atire1b (ire1) exhibits compromised auxin responses.
(a–c) In ire1, root growth is largely resistant to treatments with auxin (NAA and IAA) or an auxin transport inhibitor (NPA). Relative primary root length of 10-
day-old Col-0 and ire1 Arabidopsis seedlings grown in the presence 50, 100, 200 nM NAA (a), or 1, 2, 3, 4, 5 lM IAA (b), or 2.5, 5 lM NPA (c) compared with those
grown in the absence of the chemicals. Error bars represent standard error of the mean (SEM), n > 30. Scale bars = 1 cm. P-values are relative to Col-0: 100,
200 nM NAA (P < 0.00078), 1, 2, 3, 4, 5 lM IAA (P < 0.00050), 2.5, 5 lM NPA (P < 0.00344).
(d) qRT-PCR analyses of IAA5 and GH3.6 expression in 10-day-old Col-0 and ire1 Arabidopsis seedlings after a 2- or 4-h treatment with 10 lM NAA. Error bars
represent SEM from three independent biological replicates. P-values are relative to Col-0: IAA5 (P < 0.00016), GH3.6 (P < 0.00391).
(e) Free IAA concentration in 10-day-old Col-0 and ire1 roots. Error bars represent SEM from three independent biological replicates. P-value is relative to Col-0:
P = 4.9E�05.
© 2013 The AuthorsThe Plant Journal © 2013 John Wiley & Sons Ltd, The Plant Journal, (2014), 77, 97–107
UPR and auxin signaling 101

also exhibited reduced levels in the activation of UPR tar-
get genes under ER stress (Figure 4a and Figure S9). Con-
versely, the transcription levels of UPR target genes were
higher in the tir1 afb1 afb2 afb3 auxin co-receptor mutant
than in wild-type Col-0 (Figure 3a and Figure S9), suggest-
ing that TIR1/AFBs plays a negative role in UPR target gene
induction. Altogether, these data highlight that the ER-
based regulation of auxin homeostasis may operate as a
molecular link between the UPR and other cellular pro-
cesses.
pin5 enhances the ire1 phenotype in auxin responses and
UPR activation
To investigate a functional relationship of IRE1 and PIN5 in
the UPR and auxin response, we generated an atire1a
atire1b pin5 triple mutant and performed phenotypic analy-
ses. Consistent with previous reports, atire1a atire1b and
pin5-5 displayed a short primary root phenotype (Mravec
et al., 2009; Chen and Brandizzi, 2012). We found that the
roots of the atire1a atire1b pin5 triple mutant were signifi-
cantly shorter than those of atire1a atire1b or pin5-5
(Figure 5a). However, atire1a atire1b, pin5-5, and atire1a
atire1b pin5 showed comparable lateral root density and
hypocotyl length to wild-type Col-0 (Figure S11), suggest-
ing that the IRE1 and PIN5 have a role specifically in regu-
lation of primary root elongation. In addition, atire1a
atire1b pin5 also displayed lower free auxin levels com-
pared with atire1a atire1b or pin5-5 (Figure 5b). Specifi-
cally, compared with wild-type Col-0, the roots of pin5-5
and atire1a atire1b exhibited a 15 and 30% reduction in
free auxin levels, respectively. Nonetheless, the roots of
atire1a atire1b pin5 displayed a 45% reduction in free auxin
level (Figure 5b). Finally, in agreement with previous find-
ings (Mravec et al., 2009), root-inhibition assays showed
that pin5-5 was less sensitive than wild-type Col-0 to low
concentrations of IAA but displayed a normal response to
NAA, NPA, or high concentrations of IAA (Mravec et al.,
2009). Intriguingly, the atire1a atire1b pin5 mutant was sig-
nificantly less sensitive than atire1a atire1b to all three
treatments (Figure 5c–e). A comparable root-inhibition
response to JA, ABA, and ethylene in atire1a atire1b pin5
indicated that the genetic interaction between IRE1 and
PIN5 is specific to the auxin response (Figure S5).
We next tested the functional relationship of IRE1 and
PIN5 under ER stress. RT-qPCR revealed that the induction
of BiP1/2 and PDI6 was also reduced in atire1a atire1b pin5
0.0
0.5
1.0
1.5
2.0
2.5
BiP1/2
0.0
0.5
1.0
1.5
2.0
2.5PDI6
Col
-0pi
n5pi
n6pi
ls2
pils
5pi
ls2
pils
5ab
p1Y
UC
tri1
afb
Rel
ativ
e ex
pres
sion
leve
l
Rel
ativ
e ex
pres
sion
leve
l
Col
-0pi
n5pi
n6pi
ls2
pils
5pi
ls2
pils
5ab
p1Y
UC
tri1
afb
(a)
(b)
Rel
ativ
e ex
pres
sion
leve
l
Col
-0pi
n1pi
n2pi
n3pi
n4pi
n7pi
n3 p
in4
pin7
OxP
IN1
aux1
0
0.5
1
1.5
0
0.5
1
1.5PDI6BiP1/2
Rel
ativ
e ex
pres
sion
leve
l
Col
-0pi
n1pi
n2pi
n3pi
n4pi
n7pi
n3 p
in4
pin7
OxP
IN1
aux1
Figure 4. Mutants impaired in intra-cellular
auxin transport display a defective unfolded
protein response phenotype.
(a) qRT-PCR analyses of BiP1/2 and PDI6 in 10-
day-old pin5-5 (pin5), pin6-4 (pin6), pils2-2
(pils2), pils5-2 (pils5), pils2-2 pils5-2 (pils2
pils5), abp1-5 (abp1), YUC, and tir1 afb1 afb2
afb3 (tir1 afb) relative to wild-type Col-0 Arabid-
opsis seedlings after a 1-h treatment with
5 lg ml�1 Tm. Error bars represent standard
error of the mean (SEM) from three indepen-
dent biological replicates. P-values are relative
to Col-0: pin5 (P = 0.00029), pin6 (P = 0.00095),
pils2 (P = 0.00093), pils5 (P = 0.00067), pils2
pils5 (P = 0.00089), abp1 (P = 0.00215), YUC
(P = 0.00014), tir1 afb (P = 0.00026).
(b) RT-qPCR analyses of BiP1/2 and PDI6 in 10-
day-old pin1-1 (pin1), eir1-1 (pin2), pin3-4
(pin3), pin4-3 (pin4), pin7-2 (pin7), pin3-4 pin4-3
pin7-2 (pin3 pin4 pin7), OxPIN1, and aux1-22
(aux1) relative to wild-type Col-0 Arabidopsis
seedlings after a 1-h treatment with 5 lg ml�1
Tm. Error bars represent standard error of the
mean (SEM) from three independent biological
replicates.
© 2013 The AuthorsThe Plant Journal © 2013 John Wiley & Sons Ltd, The Plant Journal, (2014), 77, 97–107
102 Yani Chen et al.
compared with atire1a atire1b or pin5-5 (Figure 5f), support-
ing that PIN5 participates in the UPR activation in a manner
not entirely dependent on IRE1. Altogether, our results
imply that regulation of ER-based auxin homeostasis is part
of ER stress adaptive mechanisms that plants have evolved
to parallel the classical UPR signaling pathways.
DISCUSSION
Our findings uncover an unpredicted but critical regulatory
relationship between two fundamental signaling pathways
in plants, the UPR and auxin response. Studies of the
mammalian UPR indicate that distinct UPR signaling path-
ways mediate specific physiological processes (Wu and
Kaufman, 2006). While the IRE1-dependent mRNA splicing
event is the most evolutionarily conserved UPR pathway in
eukaryotes, IRE1 has also evolved specific functions in
multicellular organisms to associate the UPR with more
complex physiological processes (Urano et al., 2000; Hetz
et al., 2006). Nevertheless, our understanding of the con-
nection between the UPR and other cellular processes is
still in its infancy. Here, we have defined a plant-specific
regulatory role for IRE1 in the auxin response. Although
we cannot exclude the possibility that IRE1 regulates auxin
response independently from the classical UPR, it is plausi-
ble that IRE1-dependent UPR signaling is involved in auxin
transport. The auxin transport is one of the most crucial
regulatory mechanisms in the auxin biology. As most
regulatory components of the auxin transport system are
secretory proteins, we speculate that the IRE1-dependent
UPR signaling maintains a robust and efficient membrane
trafficking system for the supply of functional auxin regula-
tors. The identification of auxin regulators directly con-
trolled by IRE1 will elucidate how IRE1 modulates specific
aspects of auxin biology to coordinate the secretory path-
way with physiological responses. Together with the
involvement of UPR-specific membrane tethered transcrip-
tion factors in brassinosteroid signaling (Che et al., 2010),
our results support the significance of the plant UPR in
hormone signaling.
IRE1 regulates the UPR through various mechanisms
including unconventional splicing, RNA decay, and pro-
tein-protein interaction. It has recently been reported that
0
20
40
60
80
100
120
Rel
ativ
e ro
ot le
ngth
(%
)
0
100
200
300
400Free IAA
Fre
e IA
A (
pmol
per
g F
W)
(a) (b) (c)
Col-0 pin5 ire1 ire1 pin5
Rel
ativ
e ex
pres
sion
leve
l
BiP1/2 PDI6(f)
Rel
ativ
e ro
ot le
ngth
(%
)
0 1 2 3 4 5IAA (µM)
Rel
ativ
e ro
ot le
ngth
(%
)
0 50 100 200
NAA (nM)R
elat
ive
root
leng
th (
%)
0 2.5 5NPA (µM)
0
50
100
Col-0ire1pin5ire1 pin5
0
20
40
60
80
100
120 Col-0ire1pin5ire1 pin5
0
20
40
60
80
100
120
Col-0ire1pin5ire1 pin5
(d) (e)
0 50 100 200
NAA (nM)
pin5
ire1
pin5
**
0.0
1.0
2.0
3.0
4.0
0.0
0.5
1.0
1.5
2.0
2.5
3.0
3.5
Col-0 pin5 ire1 ire1 pin5
Col-0 pin5 ire1 ire1 pin5
Rel
ativ
e ex
pres
sion
leve
l
Col-0 pin5 ire1 ire1 pin5
* *
Root length
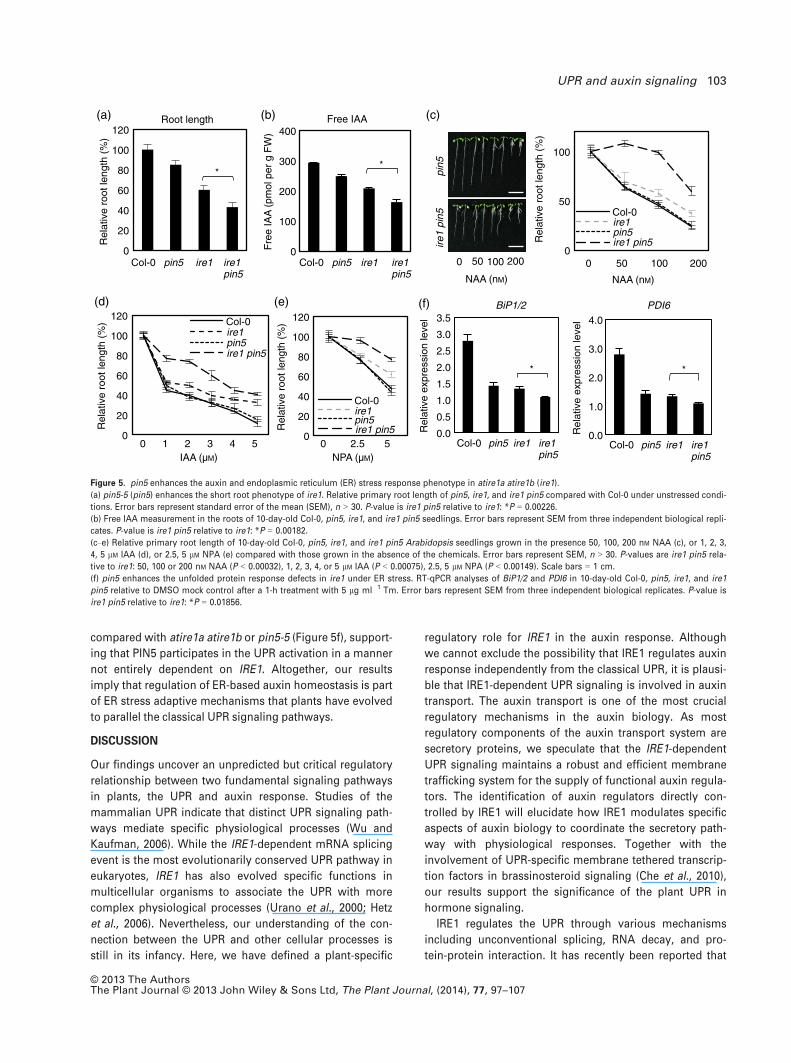
Figure 5. pin5 enhances the auxin and endoplasmic reticulum (ER) stress response phenotype in atire1a atire1b (ire1).
(a) pin5-5 (pin5) enhances the short root phenotype of ire1. Relative primary root length of pin5, ire1, and ire1 pin5 compared with Col-0 under unstressed condi-
tions. Error bars represent standard error of the mean (SEM), n > 30. P-value is ire1 pin5 relative to ire1: *P = 0.00226.
(b) Free IAA measurement in the roots of 10-day-old Col-0, pin5, ire1, and ire1 pin5 seedlings. Error bars represent SEM from three independent biological repli-
cates. P-value is ire1 pin5 relative to ire1: *P = 0.00182.
(c–e) Relative primary root length of 10-day-old Col-0, pin5, ire1, and ire1 pin5 Arabidopsis seedlings grown in the presence 50, 100, 200 nM NAA (c), or 1, 2, 3,
4, 5 lM IAA (d), or 2.5, 5 lM NPA (e) compared with those grown in the absence of the chemicals. Error bars represent SEM, n > 30. P-values are ire1 pin5 rela-
tive to ire1: 50, 100 or 200 nM NAA (P < 0.00032), 1, 2, 3, 4, or 5 lM IAA (P < 0.00075), 2.5, 5 lM NPA (P < 0.00149). Scale bars = 1 cm.
(f) pin5 enhances the unfolded protein response defects in ire1 under ER stress. RT-qPCR analyses of BiP1/2 and PDI6 in 10-day-old Col-0, pin5, ire1, and ire1
pin5 relative to DMSO mock control after a 1-h treatment with 5 lg ml�1 Tm. Error bars represent SEM from three independent biological replicates. P-value is
ire1 pin5 relative to ire1: *P = 0.01856.
© 2013 The AuthorsThe Plant Journal © 2013 John Wiley & Sons Ltd, The Plant Journal, (2014), 77, 97–107
UPR and auxin signaling 103
similar to its mammalian counterpart, plant IRE1 controls
gene expression through RNA decay in addition of splicing
bZIP60 transcription factor (Mishiba et al., 2013). Mamma-
lian IRE1 operates RNA decay to trigger diverse UPR sig-
naling pathways. It would be interesting to test whether
plant IRE1 also relies on its RNA decay function for the
auxin response. If IRE1-dependent RNA decay contributes
at least partially to the regulation of auxin signaling on ER
stress, it would represent a specific regulatory event of the
UPR as opposed to random RNA decay under stress. Nota-
bly, we have established that IRE1 is required for the opti-
mal auxin response under exogenously applied auxin
(Figures 3 and 6a), but plays only partial role in ER stress-
induced down-regulation of auxin regulators (Figure 2).
These findings support that distinct mechanisms regulate
auxin signaling under various conditions to achieve con-
text-specific auxin responses.
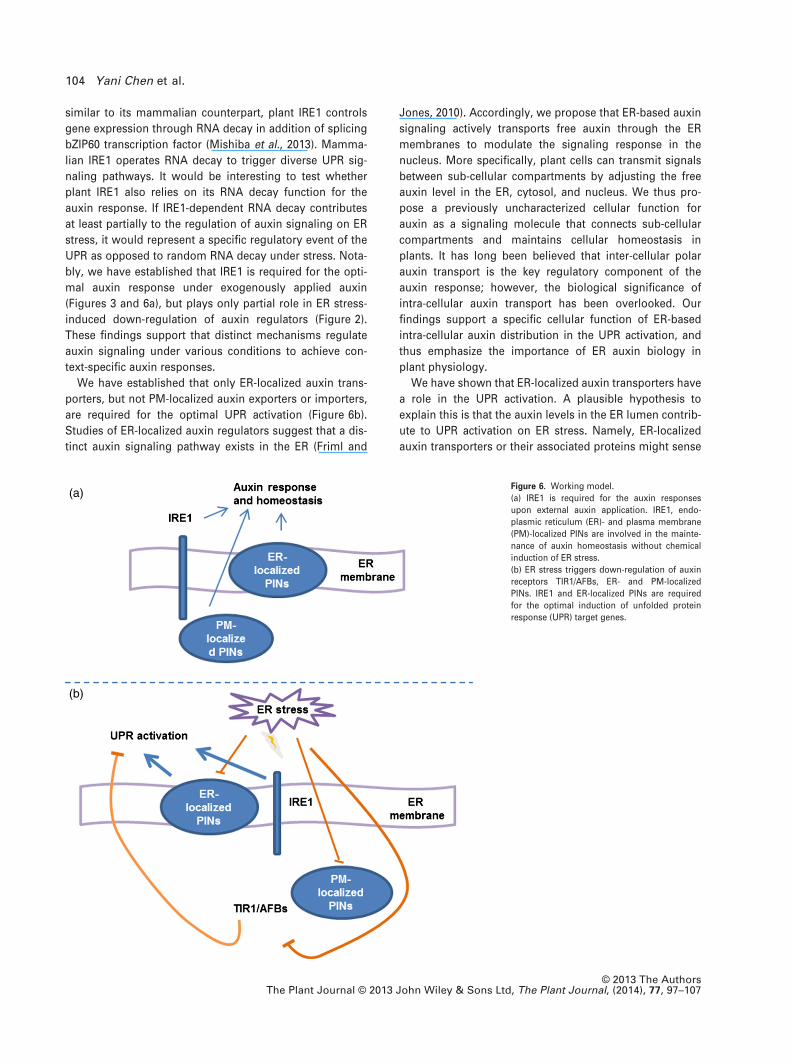
We have established that only ER-localized auxin trans-
porters, but not PM-localized auxin exporters or importers,
are required for the optimal UPR activation (Figure 6b).
Studies of ER-localized auxin regulators suggest that a dis-
tinct auxin signaling pathway exists in the ER (Friml and
Jones, 2010). Accordingly, we propose that ER-based auxin
signaling actively transports free auxin through the ER
membranes to modulate the signaling response in the
nucleus. More specifically, plant cells can transmit signals
between sub-cellular compartments by adjusting the free
auxin level in the ER, cytosol, and nucleus. We thus pro-
pose a previously uncharacterized cellular function for
auxin as a signaling molecule that connects sub-cellular
compartments and maintains cellular homeostasis in
plants. It has long been believed that inter-cellular polar
auxin transport is the key regulatory component of the
auxin response; however, the biological significance of
intra-cellular auxin transport has been overlooked. Our
findings support a specific cellular function of ER-based
intra-cellular auxin distribution in the UPR activation, and
thus emphasize the importance of ER auxin biology in
plant physiology.
We have shown that ER-localized auxin transporters have
a role in the UPR activation. A plausible hypothesis to
explain this is that the auxin levels in the ER lumen contrib-
ute to UPR activation on ER stress. Namely, ER-localized
auxin transporters or their associated proteins might sense
(a)
(b)
Figure 6. Working model.
(a) IRE1 is required for the auxin responses
upon external auxin application. IRE1, endo-
plasmic reticulum (ER)- and plasma membrane
(PM)-localized PINs are involved in the mainte-
nance of auxin homeostasis without chemical
induction of ER stress.
(b) ER stress triggers down-regulation of auxin
receptors TIR1/AFBs, ER- and PM-localized
PINs. IRE1 and ER-localized PINs are required
for the optimal induction of unfolded protein
response (UPR) target genes.
© 2013 The AuthorsThe Plant Journal © 2013 John Wiley & Sons Ltd, The Plant Journal, (2014), 77, 97–107
104 Yani Chen et al.
ER stress and rapidly adjust auxin levels in the ER lumen.
The consequent fluctuation of auxin levels in the ER could
in turn affect the magnitude of UPR activation. Neverthe-
less, because a mutation of PIN5 enhances the atire1a
atire1b mutant phenotype in the UPR activation (Figure 5f),
PIN5-dependent regulation of auxin levels under ER stress
does not completely rely on IRE1. Whether ER-localized
auxin transporters can directly monitor ER stress or indi-
rectly sense ER stress-related cellular homeostasis is yet to
be established; however, the findings presented here sup-
port that ER-localized transporters play a role in the UPR
activation. Once a reliable system to monitor auxin levels in
the ER lumen is developed, it will be interesting to experi-
mentally confirm that ER-localized transporters mediate
auxin transport between ER lumen and cytosol on ER
stress.
PIN5 has been proposed to play a unique role in the auxin
response since its transcriptional regulation and regulatory
mechanisms appear to be different from PM-localized PINs.
It was reported that the transcription of PIN5 is decreased
under exogenous application of auxin although PIN5 is
required for the auxin response (Mravec et al., 2009). Like-
wise, our study also showed that ER stress induces a
decrease in the transcription of PIN5 while PIN5 is required
for the optimal induction of UPR activation. As the PIN5 pro-
tein levels have not been monitored under auxin or ER
stress treatment, one possibility is that the down-regulation
of PIN5 transcript represents a feedback regulatory mecha-
nism. Namely, the cellular availability or the activity of PIN5
may be increased in response to ER stress (e.g. by protein
stabilization events or post-translational modifications).
This situation in turn may cause reduction of PIN5 transcrip-
tional levels to safeguard cellular auxin homeostasis.
Another possibility is that ER stress represses general auxin
responses including inter- and intra-cellular auxin transport
to optimize cellular responses to cope with stress. Thus,
both PM- and ER-localized transporter are down-regulated
under ER stress; however, a basal level of ER-localized
transporters may be still required for optimal induction of
UPR target gene as they might be involved in stress signal
transmission through transport the auxin between sub-cel-
lular compartments. Thus, mutants of ER-localized auxin
regulators would display a compromised UPR activation.
Further experimental evidences are needed to verify the
possibilities. Nonetheless, our data support that regulation
of PIN5 transcripts is a mechanism to maintain PIN5-related
cellular homeostasis. Also, pin5-5 was shown to have a
higher free auxin levels (Mravec et al., 2009) but we found
that pin5-5 displayed lower free auxin level. This is possibly
because unlike Mravec et al., which used intact seedlings,
we used only root tissues in the free auxin level assay.
Future comprehensive quantification analyses of free auxin
levels in various tissues will likely reveal whether PIN5 regu-
lates auxin distribution among tissues.
The molecular mechanisms underlying transcriptional
down-regulation of auxin receptors and transporters on ER
stress are still unknown. Whether UPR regulators can
directly control transcription of auxin receptors and trans-
porters or ER stress-dependent cellular responses mediate
auxin homeostasis in a manner independent of classical
UPR regulation awaits further validation.
In contrast with animals, plants, as sessile organisms,
have an extraordinary plasticity in post-embryonic devel-
opment, responding to both internal and external cues.
Nonetheless, our understanding of how plants integrate
developmental and environmental signals to balance
growth and adaptive regulation is limited. The inter-regula-
tion between the UPR and auxin response demonstrated in
this study opens a new area of investigation in plant physi-
ology. Given the essential roles of the UPR in multiple
stresses adaptation, the integrated action of the UPR and
auxin response highlights a plant-specific strategy that
evolved to maintain the crucial balance between stress
response and growth regulation for ultimate fitness.
EXPERIMENTAL PROCEDURES
Plant material and growth conditions
Arabidopsis thaliana ecotype Columbia (Col-0) plants were used.Surface-sterilized seeds were plated directly onto Petri dishescontaining half-strength Linsmaier and Skoog (LS) medium, 1.5%w/v sucrose, and 0.4% Phytagel (P8169; Sigma, St. Louis, MO,USA, http://www.sigmaaldrich.com/united-states.html). For normalgrowth conditions, plants were grown at 21°C under a 16-h light/8-h dark cycle.
Tm treatment
Seeds were germinated and grown on half-strength LS mediumfor 10 days, and then transferred to half-strength LS medium thatcontained 5 lg ml�1 Tm (Sigma) for the indicated periods of time.
RNA extraction and quantitative RT-PCR analysis
Total RNA was extracted from whole seedlings using an RNeasyPlant Mini Kit (74904; Qiagen, Germantown, MD, USA, http://www.qiagen.com/) and treated with DNase I (Qiagen). All sampleswithin an experiment were reverse-transcribed simultaneouslyusing SuperScript� VILOTM Master Mix (11755250; Invitrogen, Carls-bad, CA, USA). A no-RT reaction, in which RNA was subjected tothe same conditions of cDNA synthesis but without reverse trans-criptase, was included as a negative control in all real-time quanti-tative PCR (qRT-PCR) assays. qRT-PCR with SYBR Green detectionusing a relative standard curve method was performed in triplicateusing the Applied Biosystem 7500 Fast Real-Time 7500 PCR sys-tem. Data were analyzed by the summary of efficiency (DDCT)method. The values presented are the mean of three independentbiological replicates. Primers used are listed in Table S1.
Phenotypic analysis
Root length and hypocotyl elongation measurements were aver-aged from 30 plants for each genotype. Data were analyzed byStudent’s two-tailed t-test, assuming equal variance; differenceswith a P-value < 0.05 were considered significant.
© 2013 The AuthorsThe Plant Journal © 2013 John Wiley & Sons Ltd, The Plant Journal, (2014), 77, 97–107
UPR and auxin signaling 105

Immunoblotting and confocal microscopy analyses
Fifty milligrams of fresh root tissues was ground in plastic tubeswith plastic pestles using liquid nitrogen and 500 ml of SDS-con-taining extraction buffer [60 mM Tris–HCl (pH 8.8), 2% SDS, 2.5%glycerol, 0.13 mM EDTA (pH 8.0), and 19 Protease Inhibitor CocktailComplete (11836153001; Roche, South San Francisco, CA, USA)].The tissue lysates were vortexed for 30 sec, heated at 70°C for10 min, and then centrifuged at 13 000 g twice for 5 min at roomtemperature. The supernatants were transferred to new tubes. ForSDS-PAGE analysis, 5 ll of the extract in 19 NuPAGE LDS SampleBuffer (Invitrogen) was separated on 4–12% NuPage gel (Invitro-gen) and transferred to polyvinyl difluoride (PVDF) membrane. Themembrane was incubated with 3% BSA in 19 TBST (50 mM Tris-base, 150 mM NaCl, 0.05% Tween 20, pH 8.0) overnight at 4°C, andwas probed with antibody (a-GFP, 1:20 000; ab6556, Abcam, Cam-bridge, MA, USA) diluted in the blocking buffer (1:20 000) at roomtemperature for 1 h. The probed membrane was washed threetimes with 19 TBST for 5 min and then incubated with secondaryantibody (goat anti-rabbit IgG for a-GFP, 1:20 000; Abcam) at roomtemperature for 1 h. The membrane was further washed four timeswith 19 TBST for 10 min before the signals were visualized withSuperSignal� West Dura Extended Duration Substrate (34075;Pierce Biotechnology, Rockford, IL, USA). To visualize YFP fluores-cence, an inverted laser scanning confocal microscope Zeiss LSM510(Thornwood, NY, USA, http://corporate.zeiss.com/country-page/en_us/home.html) was used to detect the DII expression.
Free IAA analysis
Approximately 20 roots were cut from 10-day-old seedlings andtransferred into an Eppendorf tube containing 1 ml of methanol.Internal standard of [2H5] IAA was added to the sample at amountof 100 fmol per root.
ACKNOWLEDGEMENTS
We thank Teva Vernoux for sharing the DII-VENUS seeds andJ€urgen Kleine-Vehn for sharing the pils2-2, pils5-2, and pils2-2pils5-2 seeds and the Arabidopsis Biological Resource Center(ABRC) for seed stocks. This study was supported by grants fromthe Chemical Sciences, Geosciences and Biosciences Division,Office of Basic Energy Sciences, Office of Science, U.S. DOE (DE-FG02-91ER20021) for the infrastructure, National Institutes ofHealth (R01 GM101038-01), and NASA (NNX12AN71G).
SUPPORTING INFORMATION
Additional Supporting Information may be found in the onlineversion of this article.Figure S1. Tunicamycin induces activation of UPR target gene.
Figure S2. The transcripts of genes encoding ER-localized andnuclear proteins remain unchanged under Tm treatment.
Figure S3. DTT transcriptionally activates UPR target genes anddown-regulates auxin regulators.
Figure S4. IRE1 plays fine-tuning roles in ER stress-induced down-regulation of TIR1/AFBs.
Figure S5. ire1 and ire1 pin5 display comparable sensitivity to JA,ACC, and ABA.
Figure S6. ire1 displays reduced activation of auxin-responsivegenes upon NAA and IAA treatment.
Figure S7. The UPR target genes were not altered under IAA orNPA treatment.
Figure S8. The free auxin level is unchanged under ER stress.
Figure S9. Mutants impaired in auxin intra-cellular transport dis-play a defective UPR phenotype.
Figure S10. Mutants impaired in intra-cellular auxin transport dis-play comparable expression levels of UPR genes.
Figure S11. ire1 and ire1 pin5 display normal root density andhypocotyl elongation.
Table S1. Primer list.
REFERENCES
Ahmed, S.U., Bar-Peled, M. and Raikhel, N.V. (1997) Cloning and subcellular
location of an Arabidopsis receptor-like protein that shares common fea-
tures with protein-sorting receptors of eukaryotic cells. Plant Physiol.
114, 325–336.Barbez, E., Kubes, M., Rolcik, J. et al. (2012) A novel putative auxin carrier
family regulates intra-cellular auxin homeostasis in plants. Nature, 485,
119–122.Bertolotti, A., Zhang, Y., Hendershot, L.M., Harding, H.P. and Ron, D. (2000)
Dynamic interaction of BiP and ER stress transducers in the
unfolded-protein response. Nat. Cell Biol. 2, 326–332.Brunoud, G., Wells, D.M., Oliva, M. et al. (2012) A novel sensor to map
auxin response and distribution at high spatio-temporal resolution. Nat-
ure, 482, 103–106.Cazzonelli, C.I., Vanstraelen, M., Simon, S. et al. (2013) Role of the Arabid-
opsis PIN6 auxin transporter in auxin homeostasis and auxin-mediated
development. PLoS One, 8(7), e70069.
Chang, C., Kwok, S.F., Bleecker, A.B. and Meyerowitz, E.M. (1993) Arabid-
opsis ethylene-response gene ETR1: similarity of product to two-compo-
nent regulators. Science, 262, 539–544.Che, P., Bussell, J.D., Zhou, W., Estavillo, G.M., Pogson, B.J. and Smith,
S.M. (2010) Signaling from the endoplasmic reticulum activates brassi-
nosteroid signaling and promotes acclimation to stress in Arabidopsis.
Sci. Signal. 3, ra69.
Chen, Y. and Brandizzi, F. (2012) AtIRE1A/AtIRE1B and AGB1 independently
control two essential unfolded protein response pathways in Arabidop-
sis. Plant J. 69, 266–277.Cox, J.S. and Walter, P. (1996) A novel mechanism for regulating activity of
a transcription factor that controls the unfolded protein response. Cell,
87, 391–404.Cox, J.S., Shamu, C.E. and Walter, P. (1993) Transcriptional induction of
genes encoding endoplasmic reticulum resident proteins requires a
transmembrane protein kinase. Cell, 73, 1197–1206.Credle, J.J., Finer-Moore, J.S., Papa, F.R., Stroud, R.M. and Walter, P. (2005)
On the mechanism of sensing unfolded protein in the endoplasmic retic-
ulum. Proc. Natl Acad. Sci. USA, 102, 18773–18784.Dal Bosco, C., Dovzhenko, A., Liu, X. et al. (2012) The endoplasmic reticu-
lum localized PIN8 is a pollen-specific auxin carrier involved in intra-cel-
lular auxin homeostasis. Plant J. 71, 860–870.Dharmasiri, N., Dharmasiri, S. and Estelle, M. (2005) The F-box protein TIR1
is an auxin receptor. Nature, 435, 441–445.Ding, Z., Wang, B., Moreno, I. et al. (2012) ER-localized auxin transporter
PIN8 regulates auxin homeostasis and male gametophyte development
in Arabidopsis. Nat. Commun. 3, 941.
Friml, J. and Jones, A.R. (2010) Endoplasmic reticulum: the rising compart-
ment in auxin biology. Plant Physiol. 154, 458–462.Friml, J., Benkov�a, E., Blilou, I. et al. (2002) AtPIN4 mediates
sink-driven auxin gradients and root patterning in Arabidopsis. Cell,
108, 661–673.Friml, J., Vieten, A., Sauer, M., Weijers, D., Schwarz, H., Hamann, T., Offrin-
ga, R. and Jurgens, G. (2003) Efflux-dependent auxin gradients establish
the apical-basal axis of Arabidopsis. Nature, 426, 147–153.Gardner, B.M. and Walter, P. (2011) Unfolded proteins are Ire1-activating
ligands that directly induce the unfolded protein response. Science, 333,
1891–1894.Gray, W.M., del Pozo, J.C., Walker, L., Hobbie, L., Risseeuw, E., Banks, T.,
Crosby, W.L., Yang, M., Ma, H. and Estelle, M. (1999) Identification of an
SCF ubiquitin-ligase complex required for auxin response in Arabidopsis
thaliana. Genes Dev. 13, 1678–1691.
© 2013 The AuthorsThe Plant Journal © 2013 John Wiley & Sons Ltd, The Plant Journal, (2014), 77, 97–107
106 Yani Chen et al.
Gray, W.M., Kepinski, S., Rouse, D., Leyser, O. and Estelle, M. (2001) Auxin
regulates SCF(TIR1)-dependent degradation of AUX/IAA proteins. Nature,
414, 271–276.Hetz, C., Bernasconi, P., Fisher, J. et al. (2006) Proapoptotic BAX and BAK
modulate the unfolded protein response by a direct interaction with
IRE1alpha. Science, 312, 572–576.Iwawaki, T., Akai, R., Yamanaka, S. and Kohno, K. (2009) Function of IRE1
alpha in the placenta is essential for placental development and embry-
onic viability. Proc. Natl Acad. Sci. USA, 106, 16657–16662.Kamauchi, S., Nakatani, H., Nakano, C. and Urade, R. (2005) Gene expres-
sion in response to endoplasmic reticulum stress in Arabidopsis thali-
ana. FEBS J. 272, 3461–3476.Kanneganti, T.D., Bai, X., Tsai, C.W., Win, J., Meulia, T., Goodin, M.,
Kamoun, S. and Hogenhout, S.A. (2007) A functional genetic assay
for nuclear trafficking in plants. Plant J. 50, 149–158.Kepinski, S. and Leyser, O. (2005) The Arabidopsis F-box protein TIR1 is an
auxin receptor. Nature, 435, 446–451.Kierzkowski, D., Kmieciak, M., Piontek, P., Wojtaszek, P., Szweykowska-
Kulinska, Z. and Jarmolowski, A. (2009) The Arabidopsis CBP20 targets
the cap-binding complex to the nucleus, and is stabilized by CBP80. Plant
J. 59, 814–825.Kimata, Y., Kimata, Y.I., Shimizu, Y., Abe, H., Farcasanu, I.C., Takeuchi, M.,
Rose, M.D. and Kohno, K. (2003) Genetic evidence for a role of BiP/Kar2
that regulates Ire1 in response to accumulation of unfolded proteins.
Mol. Biol. Cell, 14, 2559–2569.Koizumi, N., Martinez, I.M., Kimata, Y., Kohno, K., Sano, H. and Chrispeels,
M.J. (2001) Molecular characterization of two Arabidopsis Ire1 homologs,
endoplasmic reticulum-located transmembrane protein kinases. Plant
Physiol. 127, 949–962.Kozutsumi, Y., Segal, M., Normington, K., Gething, M.J. and Sambrook, J.
(1988) The presence of malfolded proteins in the endoplasmic reticulum
signals the induction of glucose-regulated proteins. Nature, 332, 462–464.
Law, A.H., Chow, C.M. and Jiang, L. (2012) Secretory carrier membrane pro-
teins. Protoplasma, 249, 269–283.Lin, J.H., Li, H., Yasumura, D., Cohen, H.R., Zhang, C., Panning, B., Shokat,
K.M., Lavail, M.M. and Walter, P. (2007) IRE1 signaling affects cell fate
during the unfolded protein response. Science, 318, 944–949.Ma, L., Hong, Z. and Zhang, Z. (2007) Perinuclear and nuclear envelope
localizations of Arabidopsis Ran proteins. Plant Cell Rep. 26, 1373–1382.Marciniak, S.J. and Ron, D. (2006) Endoplasmic reticulum stress signaling
in disease. Physiol. Rev. 86, 1133–1149.Mishiba, K., Nagashima, Y., Suzuki, E., Hayashi, N., Ogata, Y., Shimada, Y.
and Koizumi, N. (2013) Defects in IRE1 enhance cell death and fail to
degrade mRNAs encoding secretory pathway proteins in the Arabidopsis
unfolded protein response. Proc. Natl Acad. Sci. USA, 110, 5713–5718.Mori, K., Ma, W., Gething, M.J. and Sambrook, J. (1993) A transmembrane
protein with a cdc2 + /CDC28-related kinase activity is required for sig-
naling from the ER to the nucleus. Cell, 74, 743–756.
Mravec, J., Skupa, P., Bailly, A. et al. (2009) Subcellular homeostasis of phy-
tohormone auxin is mediated by the ER-localized PIN5 transporter. Nat-
ure, 459, 1136–1140.Nagashima, Y., Mishiba, K., Suzuki, E., Shimada, Y., Iwata, Y. and Koizumi,
N. (2011) Arabidopsis IRE1 catalyses unconventional splicing of bZIP60
mRNA to produce the active transcription factor. Sci. Rep. 1, 29.
Noh, S.J., Kwon, C.S. and Chung, W.I. (2002) Characterization of two homo-
logs of Ire1p, a kinase/endoribonuclease in yeast, in Arabidopsis thali-
ana. Biochim. Biophys. Acta, 1575, 130–134.Okada, K., Ueda, J., Komaki, M.K., Bell, C.J. and Shimura, Y. (1991) Require-
ment of the auxin polar transport system in early stages of Arabidopsis
floral bud formation. Plant Cell, 3, 677–684.Petrasek, J., Mravec, J., Bouchard, R. et al. (2006) PIN proteins perform a
rate-limiting function in cellular auxin efflux. Science, 312, 914–918.Roman, G., Lubarsky, B., Kieber, J.J., Rothenberg, M. and Ecker, J.R. (1995)
Genetic analysis of ethylene signal transduction in Arabidopsis Thaliana:
five novel mutant loci integrated into a stress response pathway. Genet-
ics, 139, 1393–1409.Sauer, M., Balla, J., Luschnig, C., Wisniewska, J., Rein€ohl, V., Friml, J. and
Benkov�a, E. (2006) Canalization of auxin flow by Aux/IAA-ARF-dependent
feedback regulation of PIN polarity. Genes Dev. 20, 2902–2911.Schroder, M. and Kaufman, R.J. (2005) The mammalian unfolded protein
response. Annu. Rev. Biochem. 74, 739–789.Swarup, R., Kargul, J., Marchant, A. et al. (2004) Structure–function analysis
of the presumptive Arabidopsis auxin permease AUX1. Plant Cell, 16,
3069–3083.Ulmasov, T., Hagen, G. and Guilfoyle, T.J. (1997) ARF1, a transcription fac-
tor that binds to auxin response elements. Science, 276, 1865–1868.Urano, F., Wang, X., Bertolotti, A., Zhang, Y., Chung, P., Harding, H.P. and
Ron, D. (2000) Coupling of stress in the ER to activation of JNK protein
kinases by transmembrane protein kinase IRE1. Science, 287, 664–666.Wisniewska, J., Xu, J., Seifertova, D., Brewer, P.B., Ruzicka, K., Blilou, I.,
Rouquie, D., Benkova, E., Scheres, B. and Friml, J. (2006) Polar PIN locali-
zation directs auxin flow in plants. Science, 312, 883.
Wu, J. and Kaufman, R.J. (2006) From acute ER stress to physiological roles
of the unfolded protein response. Cell Death Differ. 13, 374–384.Wulfetange, K., Lomin, S.N., Romanov, G.A., Stolz, A., Heyl, A. and Schmul-
ling, T. (2011) The cytokinin receptors of Arabidopsis are located mainly
to the endoplasmic reticulum. Plant Physiol. 156, 1808–1818.Xu, T., Wen, M., Nagawa, S., Fu, Y., Chen, J.G., Wu, M.J., Perrot-Rechen-
mann, C., Friml, J., Jones, A.M. and Yang, Z. (2010) Cell surface- and rho
GTPase-based auxin signaling controls cellular interdigitation in Arabid-
opsis. Cell, 143, 99–110.Z�adn�ıkov�a, P., Petr�asek, J., Marhavy, P. et al. (2010) Role of PIN-mediated
auxin efflux in apical hook development of Arabidopsis thaliana. Devel-
opment, 137, 607–617.Zhao, Y., Christensen, S.K., Fankhauser, C., Cashman, J.R., Cohen, J.D.,
Weigel, D. and Chory, J. (2001) A role for flavin monooxygenase-like
enzymes in auxin biosynthesis. Science, 291, 306–309.
© 2013 The AuthorsThe Plant Journal © 2013 John Wiley & Sons Ltd, The Plant Journal, (2014), 77, 97–107
UPR and auxin signaling 107
Related Documents