Inter-group difference s in road-traffic cras h involvement Accident Analysis and Prevention 40 (2008) 2000–2007

Inter-group differences in road-traffic crash involvement Accident Analysis and Prevention 40 (2008) 2000–2007.
Dec 17, 2015
Welcome message from author
This document is posted to help you gain knowledge. Please leave a comment to let me know what you think about it! Share it to your friends and learn new things together.
Transcript

Inter-group differences in road-traffic crash involvement
Accident Analysis and Prevention 40 (2008) 2000–2007

Objective
• Analyzing the data from Israeli census database with logistics regression, the study aimed to investigate the severe and fatal car accidents between different groups based on social-cultural model.
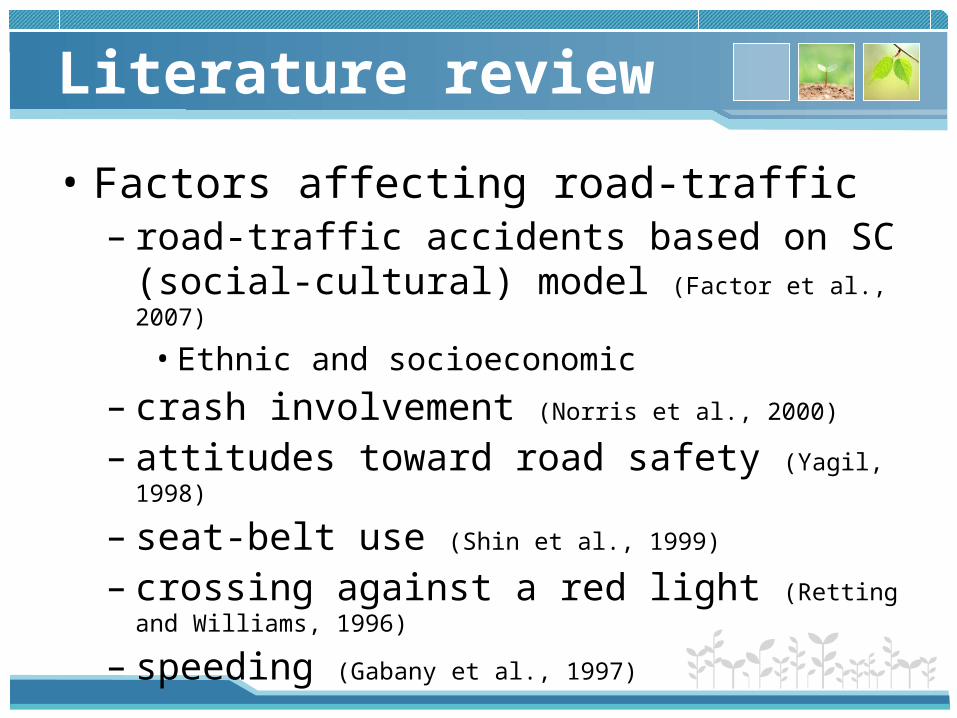
Literature review
• Factors affecting road-traffic– road-traffic accidents based on SC (social-
cultural) model (Factor et al., 2007)
• Ethnic and socioeconomic
– crash involvement (Norris et al., 2000)
– attitudes toward road safety (Yagil, 1998)
– seat-belt use (Shin et al., 1999)
– crossing against a red light (Retting and Williams, 1996)
– speeding (Gabany et al., 1997)
Literature review
• effects of social-economic feature on car accidents– Gender– Age– Education level– Ethnic– Asset

Literature review
• Gender– Compare to female, car accidents involvement
of male is double. – Men were inclined to shorten the distances
between cars.
Literature review
• Age– Resulting from car accidents, death mostly
happened to 15-29 aged. (Sivak, 2002)– Young drivers have exaggerated sense of their
driving ability, and underestimated the danger. (DeJoy, 1992; Gabany et al., 1997)
Literature review
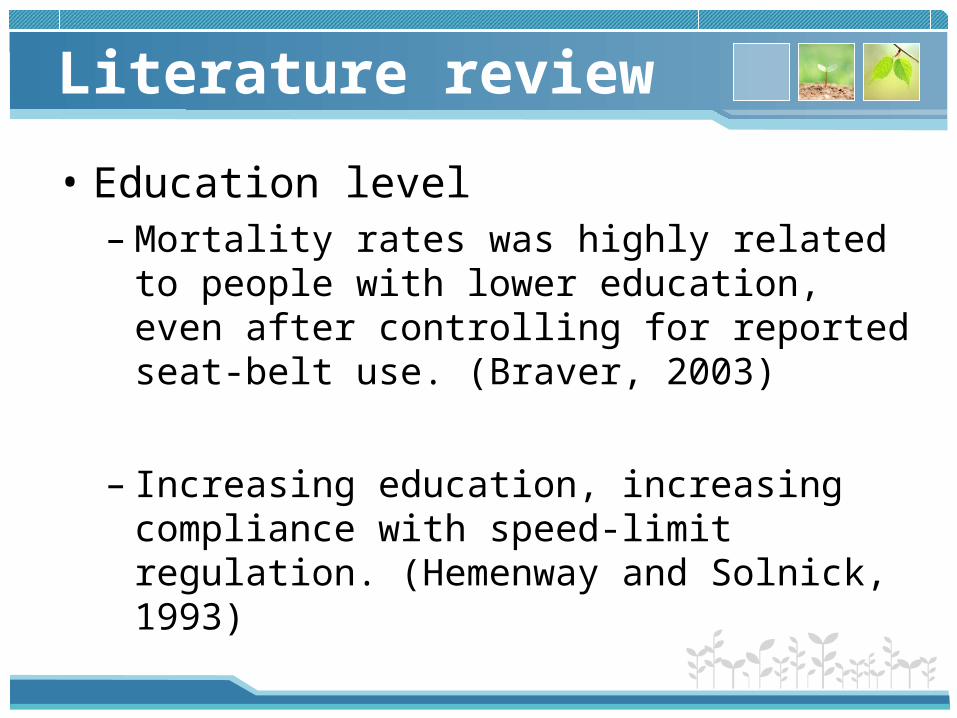
• Education level– Mortality rates was highly related to people
with lower education, even after controlling for reported seat-belt use. (Braver, 2003)
– Increasing education, increasing compliance with speed-limit regulation. (Hemenway and Solnick, 1993)

Literature review
• Ethnic– Correlation between ethnics and driving
violations, perception of risk, and road-accident involvement. (Outcalt et al., 2003; Stiles and Grieshop, 1999; Vredenburgh and Cohen, 1995)
Literature review
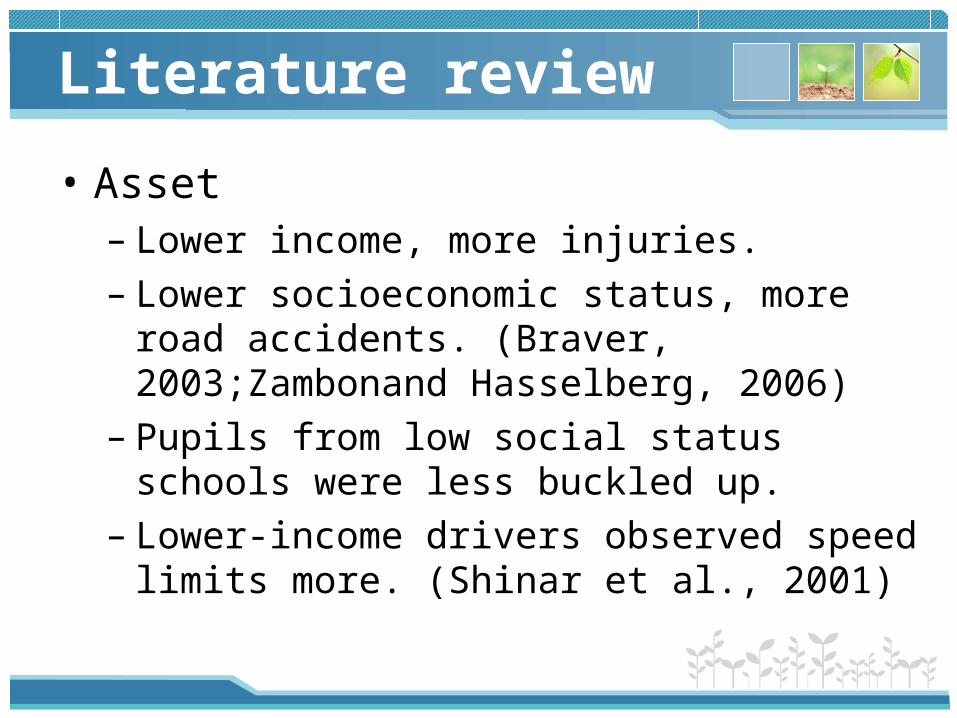
• Asset – Lower income, more injuries. – Lower socioeconomic status, more road
accidents. (Braver, 2003;Zambonand Hasselberg, 2006)
– Pupils from low social status schools were less buckled up.
– Lower-income drivers observed speed limits more. (Shinar et al., 2001)

Literature review
• Studies based on SC model was difficult to conduct. – Aggregative calculation of casualty or injury
rates – It was hard to distinguish the effects of
demographic and socioeconomic characteristics.
– Ethnic, socioeconomic status, gender, and education.
Methodology
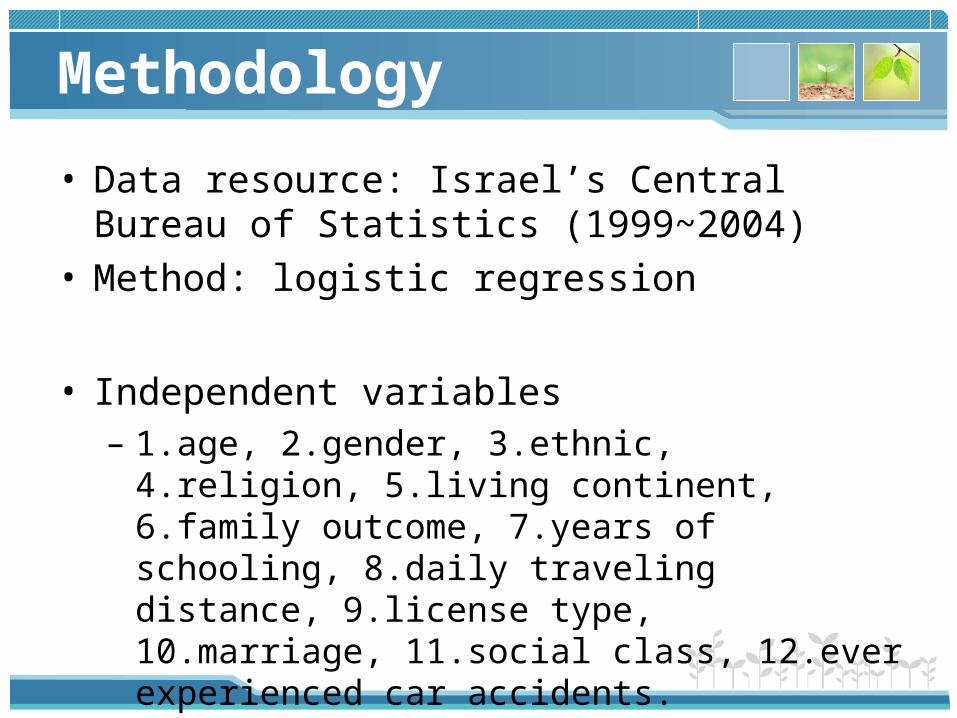
• Data resource: Israel’s Central Bureau of Statistics (1999~2004)
• Method: logistic regression
• Independent variables – 1.age, 2.gender, 3.ethnic, 4.religion, 5.living
continent, 6.family outcome, 7.years of schooling, 8.daily traveling distance, 9.license type, 10.marriage, 11.social class, 12.ever experienced car accidents.

Methodology
Sample distribution (n=409,051)
With accidents Without accidents
People 98.9% 1.1%
Age 34.6 37.9
Gender Male Female
Religion Jew Jew
Continent of living Africa Europe
Daily traveling distance 50.95 km 43.27 km
Years for schooling 11.8 years 12.5 years
License type More than one license Car only
Monthly family income $820 $1072
Social class Non-skilled worker White collar

Methodology
• Socioeconomic measures– Class schema (Erikson et al., 1979)– Occupation and personal status at work
• White collar• Blue collar• Non-skilled workers
(Erikson and Goldthorpe, 1992)

Methodology
• Exposure estimation– The database didn’t include daily driving
distance.– Used a proxy measure.– Israeli Travel Habits Survey 1996/1997– 52 groups: gender, age, and areas.

Methodology
• Transformed the regression coefficients into probabilities with equation:
• Its objective was to compare the group differences, not getting an “accurate value”, so this equation was adequate in certain level.

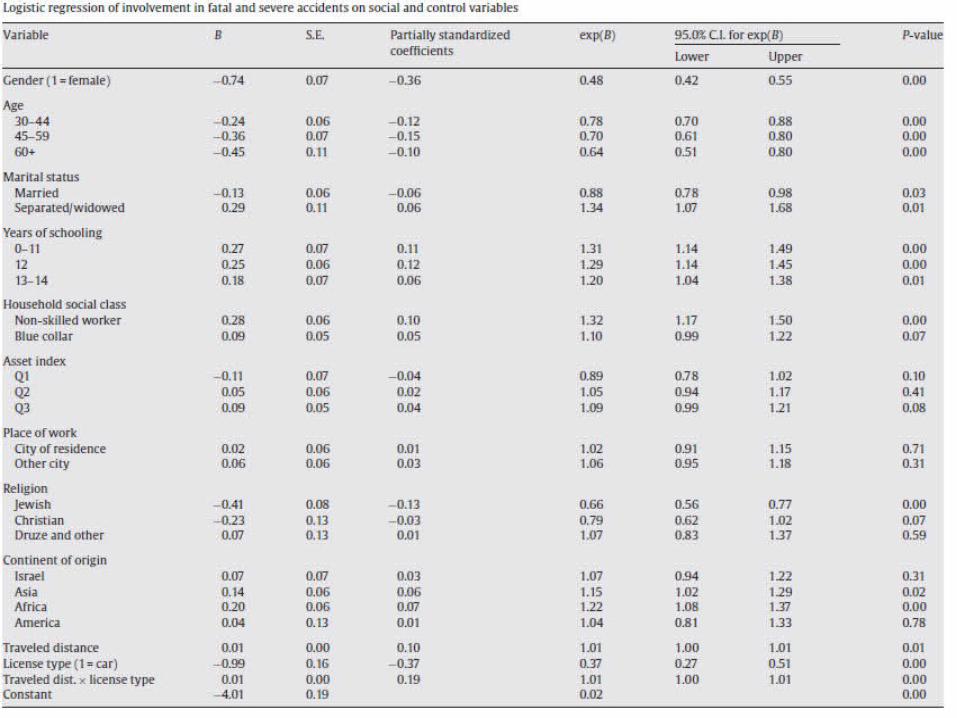
Results

Results

Results

Results

Conclusion
• Higher rates– Africa and Asia– Lower income – Lower education level– 16-29 aged– Non-Jewish

Conclusion
• Social and cultural characteristics were associated the car accidents, and the frequency can be decreased via driving behavior changes.
• As for practical way, changing the group’s perception was a great idea, instead of focusing on individual level.
• The results offered school about road safety controlling by teaching students how to prevent injuries, especially focusing on teaching “traits” of different social groups.

www.themegallery.com
Thank You!
Related Documents


![IGLAD - INTERNATIONAL HARMONIZED IN-DEPTH ACCIDENT …indexsmart.mirasmart.com/25esv/PDFfiles/25ESV-000248.pdf · crash phase in IGLAD [5]. The resulting pre-crash matrix contains](https://static.cupdf.com/doc/110x72/5ec7dd660c03b81237121241/iglad-international-harmonized-in-depth-accident-crash-phase-in-iglad-5-the.jpg)