Intel® System Debugger 2018 - Installation Guide and Release Notes 1 Intel® System Debugger 2018 for System Debug Installation Guide and Release Notes Installation Guide and Release Notes for Windows* host 26 February 2018 Table of Contents 1 Introduction.............................................................................................................................. 6 1.1 Technical Support and Documentation .................................................................................... 6 1.2 Product Contents ..................................................................................................................... 7 2 What's New in Intel® System Debugger 2018 Update 1 .......................................................... 8 3 System Requirements ............................................................................................................. 8 3.1 Host Software Requirements ................................................................................................... 8 3.2 Target Software Requirements ................................................................................................ 8 3.3 Host Hardware Requirements.................................................................................................. 9 3.4 Target Hardware Requirements ............................................................................................... 9 3.5 Ordering Connection Device for Intel® System Debugger ....................................................... 9 3.5.1 Intel® ITP-XDP3 ............................................................................................................... 9 3.5.2 Intel® SVT Closed Chassis Adapter ............................................................................... 10 3.5.3 Intel® DCI USB Native Debug Class .............................................................................. 10 4 Installation ............................................................................................................................. 10

Welcome message from author
This document is posted to help you gain knowledge. Please leave a comment to let me know what you think about it! Share it to your friends and learn new things together.
Transcript
Intel® System Debugger 2018 - Installation Guide and Release Notes
1
Intel® System Debugger 2018 for System Debug Installation Guide and Release Notes
Installation Guide and Release Notes for Windows* host
26 February 2018
Table of Contents
1 Introduction .............................................................................................................................. 6
1.1 Technical Support and Documentation .................................................................................... 6
1.2 Product Contents ..................................................................................................................... 7
2 What's New in Intel® System Debugger 2018 Update 1 .......................................................... 8
3 System Requirements ............................................................................................................. 8
3.1 Host Software Requirements ................................................................................................... 8
3.2 Target Software Requirements ................................................................................................ 8
3.3 Host Hardware Requirements .................................................................................................. 9
3.4 Target Hardware Requirements ............................................................................................... 9
3.5 Ordering Connection Device for Intel® System Debugger ....................................................... 9
3.5.1 Intel® ITP-XDP3 ............................................................................................................... 9
3.5.2 Intel® SVT Closed Chassis Adapter ............................................................................... 10
3.5.3 Intel® DCI USB Native Debug Class .............................................................................. 10
4 Installation ............................................................................................................................. 10

Intel® System Debugger 2018 - Installation Guide and Release Notes
2
4.1 Note on Microsoft* Visual Studio generated UEFI debug ....................................................... 10
4.2 Product Installation (Online Installer) ..................................................................................... 11
4.3 Product Installation (Full Product) .......................................................................................... 11
4.4 Installing Intel® XDP3 JTAG Probe ....................................................................................... 11
4.5 Uninstalling the Product ......................................................................................................... 11
5 Intel® System Debugger Usage Notes .................................................................................. 12
5.1 Starting the Debugger ............................................................................................................ 12
5.1.1 Through Intel® System Studio IDE ................................................................................. 12
5.1.2 Using startup scripts in installation directory ................................................................... 13
5.2 Handling of Target Access Issues .......................................................................................... 14
5.3 Troubleshooting Target Stability issues ................................................................................. 14
5.3.1 Considerations ..................................................................................................................... 14
5.3.2 Techniques for isolating causes ........................................................................................... 14
5.4 OS Awareness / Kernel Module Debugging ........................................................................... 15
5.5 Troubleshooting Simics Simulated Target .............................................................................. 16
5.5.1 Connection fails with error message: “E-2201 TCP/IP Socket initialization or connection
failed: Connection to host localhost:9123 failed, please verify server is running, and that the
address and port are correct” ........................................................................................................ 16
6 Issues and Limitations ........................................................................................................... 16
6.1 Symbol offset issue with GCC compiled firmware .................................................................. 16
6.2 Intel® Atom™ Processor Z35xx Support Limitations.............................................................. 17
6.3 Intel® Atom™ Processor Z3xxx and E3xxx specific issues .................................................... 18
6.3.1 Platform power management policy may limit debugger control of the target: ................. 18
6.3.2 Launching the debugger when the target is off or in a low-power state may cause
unexpected behavior .................................................................................................................... 18
Intel® System Debugger 2018 - Installation Guide and Release Notes
3
6.3.3 Hardware Threads window may show no threads/partial threads/disabled threads ........ 18
6.3.4 User-initiated Halt may occasionally return errors, especially if the target is in a low-power
state. 18
6.3.5 Kernel module load configurations may be unreliable ..................................................... 18
6.4 Intel® Atom™ Processors N4200, N3350, x7-E3950, x5-39xx (Apollo Lake) ......................... 19
6.4.1 Re-connection to the target is not reliably working .......................................................... 19
6.4.2 Resuming the target after hitting software breakpoint is not reliably working .................. 19
6.5 Problems with setting breakpoints for Intel® Processor code-named “Coffee Lake” from
disassembly view ............................................................................................................................. 19
6.6 Other Target-specific issues: ................................................................................................. 19
6.6.1 3rd generation Intel® Core™ Processor support only available on request...................... 19
6.6.2 Functional differences of 60-pin vs. 10-pin JTAG ............................................................ 20
6.6.3 Platform reset policy may inhibit debugger operation ...................................................... 20
6.6.4 Platform security policy may inhibit debugger operation ................................................. 20
6.6.5 Target power management and platform power policy on tablet systems may inhibit
debugger operation ....................................................................................................................... 20
6.6.6 Platform reset implementation may limit debugger-initiated reset: .................................. 21
6.6.7 Platform reset implementation may limit ability to halt at reset vector: ............................ 21
6.6.8 There could be loss in control while doing stepping around reset ................................... 21
6.7 Installation related issues ...................................................................................................... 22
6.7.1 Intel® System Debugger use in conjunction with PVT product ........................................ 22
6.7.2 Sharedinfo.txt not writable .............................................................................................. 22
6.7.3 Network access for MasterFrame.HostApplication.exe blocked by Microsoft* Windows*
firewall 22
6.7.4 MSDIA DLL not registered .............................................................................................. 22
Intel® System Debugger 2018 - Installation Guide and Release Notes
4
6.7.5 XDB Grey unresponsive window .................................................................................... 23
6.8 General Feature Limitations ................................................................................................... 23
6.8.1 Debugging a module on the watchlist ............................................................................. 23
6.8.2 Using breakpoints ........................................................................................................... 23
6.8.3 Support for Intel® Atom™ processor bitfield editor register views ................................... 24
6.8.4 Failure of initial debugger re-connection can lead to debugger hang .............................. 24
6.8.5 Locals Window updates can be slow .............................................................................. 24
6.8.6 Kernel Threads Window Population Slow ....................................................................... 24
6.8.7 Debugger puts a Windows file system lock on symbol files............................................. 24
6.8.8 Memory Reads with Uninitialized Memory ...................................................................... 24
6.8.9 Memory Writes to Uninitialized Memory .......................................................................... 24
6.8.10 Flash Writer disables pre-existing Breakpoints ............................................................... 25
6.8.11 Master Flash Header Read/Write not supported for Intel® Atom™ Processor CE4200 .. 25
7 Change History ...................................................................................................................... 25
7.1 Intel® System Debugger 2018 Initial Release ........................................................................ 25
7.1.1 New Features ................................................................................................................. 25
7.1.2 Bug Fixes ....................................................................................................................... 26
7.2 Intel® System Debugger 2018 Beta ....................................................................................... 26
7.2.1 New Features ................................................................................................................. 26
7.3 Intel® System Debugger 2017 Update 3................................................................................ 26
7.3.1 New Features ................................................................................................................. 26
7.3.2 Bug Fixes ....................................................................................................................... 26
7.4 Intel® System Debugger 2017 Update 2................................................................................ 27
7.4.1 New Features ................................................................................................................. 27

Intel® System Debugger 2018 - Installation Guide and Release Notes
5
7.4.2 Bug Fixes ....................................................................................................................... 27
7.5 Intel® System Debugger 2017 Update 1................................................................................ 28
7.6 Intel® System Debugger 2017 Initial Release ........................................................................ 28
7.6.1 EFI Script: ....................................................................................................................... 28
7.6.2 System Management Mode (SMM) debug support ......................................................... 28
7.6.3 Single Startup ................................................................................................................. 29
7.7 Intel® System Debugger 2016 ............................................................................................... 29
7.8 Intel® System Debugger 2015 Update 2................................................................................ 29
7.9 Intel® System Debugger 2015 Update 1................................................................................ 29
7.10 Intel® System Debugger 2015 (Initial Release) ..................................................................... 30
7.10.1 General Usage ............................................................................................................... 30
7.10.2 Target Platform Support ................................................................................................. 30
8 Attributions ............................................................................................................................ 31
9 Disclaimer and Legal Information ........................................................................................... 33
Intel® System Debugger 2018 - Installation Guide and Release Notes
6
1 Introduction
This Intel® System Debugger 2018 release provides a Windows* 7, 8 or 10 hosted cross-debug solution for software developers to debug kernel sources and dynamically loaded drivers and kernel modules on devices based on the Intel® architecture. It does so using one of the supported JTAG target probes listed under the System Requirements.
Beyond the JTAG communication device the debugger also offers convenient and in-depth access to underlying hardware properties through a powerful graphical user interface (GUI). This makes it an ideal assistant for initial platform bring-up, firmware, BIOS, OS and device driver debugging. A set of features providing in-depth access to the development platform complete the offering for system developers:
Execution trace support using LBR (last branch record), RTIT (real-time instruction tracing and
Intel® PT (Intel® Processor Trace) for identifying incorrect execution paths or memory accesses
Support for UEFI firmware debug via JTAG as well as EDKII (EFI Development Kit) debug
agent
Graphical representation of the page translation table with full access of the descriptor tables
Flashing Support available upon request
These debugger capabilities minimize the time it takes to isolate and correct platform and system level problems.
This document provides system requirements, installation instructions, issues and limitations, and
legal information.
Note:
Intel® System Debugger is available with Intel® System Studio. The Intel® System Studio without JTAG distributions are clearly labeled as such. To find out more about the installation and purchase options, please go to https://software.intel.com/en-us/intel-system-studio/try-buy .
1.1 Technical Support and Documentation
The default installation directory of the Intel® System Studio including the Intel® System Debugger,
in the following also called <INSTALLDIR>, is
For Linux Target: C:\IntelSWTools\system_studio_2018
Intel® System Debugger 2018 - Installation Guide and Release Notes
7
For Windows Target: C:\Program Files (x86)\IntelSWTools
This installation directory can be specified by the user with a 'Custom' installation. The product
however is being installed in a fixed directory structure below <INSTALLDIR>.
All documentation about the Intel® System Debugger 2018 and its components can be found under
<INSTALLDIR>\documentation_2018\en\debugger\system_studio_2018\system_deb
ugger\
An overview document with getting started information about all components included in the Intel® System Debugger (system debug, system trace and WinDbg extension) is located at:
<INSTALLDIR>\documentation_2018\en\debugger\system_studio_2018\overview.h
tml
If you did not register your debugger during installation, please do so at the Intel® Software Development Products Registration Center. Registration entitles you to free technical support, product updates and upgrades for the duration of the support term.
To submit issues related to this product please visit the Online Service Center webpage and submit issues under the product Intel(R) System Studio.
Additionally you may submit questions and browse issues in the Intel® System Studio User Forum.
For information about how to find Technical Support, product documentation and samples, please
visit http://software.intel.com/en-us/intel-system-studio.
Note: If your distributor provides technical support for this product, please contact them for support
rather than Intel.
1.2 Product Contents
Intel® System Debugger 2018 for System Debug and System Trace
Eclipse* 4.6 Neon, Eclipse* CDT and additional debug extensions
Intel® Dfx Abstraction Layer (Intel® DAL) v1.9.9400
Open IPC Debug Library v1.17029
Intel® ITP XDP3 Driver 2.0.3.0
Intel® DCI Driver 1.7.0.0

Intel® System Debugger 2018 - Installation Guide and Release Notes
8
2 What's New in Intel® System Debugger 2018 Update 1
No changes.
3 System Requirements
If you have any doubts about installation requirements, please check the Prerequisites Guide
3.1 Host Software Requirements
1. Microsoft* Windows* 7, 8 and 10 64bit.
2. 64bit Java runtime environment (JRE) 1.7 or newer to use the Eclipse* framework. In a web
browser, access www.java.com , and download and install JRE 1.7 or higher. Ensure that the
Java runtime environment is 64 bit. (Go to http://www.java.com/en/download/manual.jsp and
select “Windows Offline (64-bit)”).
64-bit host system:
3. Microsoft .NET Framework 4 (dotNetFx40_Full_x86_x64.exe)
4. Microsoft .NET Framework 3.5 SP1 runtime (pre-installed by default on Microsoft* Windows* 7)
5. Microsoft Visual C++ 2008 Redistributable Package version 9.0.30729 (vcredist9_x86_x64.exe)
6. Microsoft Visual C++ 2010 SP1 Redistributable Package version 10.0.30319
(vcredist10_x86_x64.exe)
7. Microsoft Visual C++ 2012 Redistributable Package version 11.0.61030 (vcredist_x64.exe)
Microsoft* Visual Studio* redistributables will be installed automatically if they are not found on
the system.
3.2 Target Software Requirements
The target platform should be based on one of the following environments:
Bare metal, BIOS, firmware environment
Yocto Project* 1.4 – 1.6 on
o Intel® Atom™ Processor Z5xx, E6xx, E3xxx, C2xxx
o 4th Gen or newer Intel® Core™ Processor
Android* 4.0.x -4.4.x on
o Intel® Atom™ Processor Z2400, Z2500, Z2700, Z3680, Z37xx
o 4th Gen Intel® Core™ U-Processor Line
Intel® System Debugger 2018 - Installation Guide and Release Notes
9
Wind River* Linux* 4, 5, 6 on
o Intel® Atom™ Processor Z5xx, E6xx, E3xxx, C2xxx
o 4th Gen Intel® Core™ Processors
Tizen* IVI 2.x, 3.x on
o Intel® Atom™ Processor E3xxx
3.3 Host Hardware Requirements
Second generation Intel® Core™ i5 processor or Intel® Core™ i7 processor.
2GB RAM
10GB free disk space for all product features and all architectures
USB 2.0 host interface
3.4 Target Hardware Requirements
Intel® In-Target Probe eXtended Debug Port
JTAG Device
o Intel® ITP-XDP3
One of the following target platforms:
o Intel® development kit based on the Intel® Atom™ Processor E6xx
o Intel® development kit based on Intel® Atom™ Processor Z36xx, Z37xx - 2 cores (Baytrail / MinnowBoard MAX)
o Intel® development kit based on Intel® Atom™ Processor C2xxx o Intel® development kit based on Intel® Atom™ Processor Z24xx, Z25xx, Z27xx
o Intel® development kit based on Intel® Atom™ Processor E38xx, Z3680, Z37xx
o Intel® Atom™ x7 Z8700 & x5 Z8500/X8400 processor series (Cherry Trail)
o Intel® development kit based on 4th, 5th , 6th and 7th generation Intel® Core™ and Intel® Xeon™ Processor
o Intel® development kit based on 5th generation Intel® Core™ M Processor
Note: Please find more details about debugger startup support for specific JTAG probe and target CPU/Platform combinations under section 5.1 Starting the Debugger
3.5 Ordering Connection Device for Intel® System Debugger
3.5.1 Intel® ITP-XDP3
To order the Intel® ITP-XDP3 device, please

Intel® System Debugger 2018 - Installation Guide and Release Notes
10
1. Go to https://designintools.intel.com/, select the Debug Tools product category and add ITP-
XDP BR3 to your cart.
2. or contact the Hibbert Group* at [email protected] and request the VTG order form.
We will also gladly assist with the ordering process.If you have any questions please submit an
issue in the Intel® System Studio product of Online Service Center https://supporttickets.intel.com
or send an email to [email protected].
3.5.2 Intel® SVT Closed Chassis Adapter
To order the Intel® SVT Closed Chassis Adapter (CCA) device, please
Go to https://designintools.intel.com/, select the Debug Tools product category and select the
Intel® SVT Closed Chassis Adapter. https://designintools.intel.com/product_p/itpxdpsvt.htm
For assistance with the ordering process or if you have any questions please submit an issue in the
Intel® System Studio product of Online Service Center https://supporttickets.intel.com or send an
email to [email protected].
3.5.3 Intel® DCI USB Native Debug Class
To order the Intel® DCI USB Native Debug Class (DbC) device, please go to the websites
A-to-A 1.0 meter: https://designintools.intel.com/product_p/itpdciamam1m.htm
A-to-A 1.5 meter: https://designintools.intel.com/product_p/itpdciamam2m.htm
A-to-C 1.0 meter:
https://designintools.intel.com/ProductDetails.asp?ProductCode=ITPDCIAMCM1M
C-to-C 1.0 meter: https://designintools.intel.com/product_p/itpdcic2cd2u1m.htm
4 Installation
4.1 Note on Microsoft* Visual Studio generated UEFI debug
The debugger is dependent on a shared library provided by Microsoft* for access to debug
information generated with the Microsoft* compiler. In some cases this library will not be correctly
registered on the host system, which will lead to an error message when trying to load symbols for
modules (e.g. EFI modules) that are compiled using the Microsoft* toolchain. The user can resolve
this issue by manually registering the correct library using an administrator command prompt.
From a command line window go to:
C:\Program Files (x86)\Common Files\microsoft shared\VC
Intel® System Debugger 2018 - Installation Guide and Release Notes
11
Run:
regsvr32 msdia90.dll
if the msdia90.dll file is not found there, reinstall the Microsoft* Visual C++ 2008 Redistributable
Package after downloading it from Microsoft’s website
4.2 Product Installation (Online Installer)
The Intel® System Debugger 2018 on Windows* host component of the Intel® System Studio 2018
is available as part of a downloadable online installer. If you only intend to install the Intel® System
Debugger you can thus reduce the package size that is downloaded for the actual install. Using the
online installer requires to be connected to the internet and that https protocol based component
downloads are permitted by your firewall.
Double-click on the executable file (system_studio_2018.0.xxx_online.exe) to begin installation. And follow the installer guidance.
The default installation directory is <INSTALLDIR>
4.3 Product Installation (Full Product)
The Intel® System Debugger 2018 on Windows* is part of the Intel® System Studio 2018 downloadable installer. Double-click on the executable file (system_studio_2018.0.xxx.exe) to begin installation and follow the on-screen instructions.
If you have any doubts about installation requirements, please check the Prerequisites Guide
The default installation directory is <INSTALLDIR>
4.4 Installing Intel® XDP3 JTAG Probe
The Intel® ITP-XDP3 driver is automatically installed as part of the Intel® System Debugger installation process.
4.5 Uninstalling the Product
Run setup.bat file present in <INSTALLDIR> directory and follow steps in order to uninstall the
product.
To also uninstall the Intel® ITP-XDP3 driver please select
Windows Driver Package – Intel Corporation ... ITP_ON_USB as well.

Intel® System Debugger 2018 - Installation Guide and Release Notes
12
5 Intel® System Debugger Usage Notes
5.1 Starting the Debugger
Intel® System Debugger is now integrated into Intel® System Studio IDE and is recommended to
be started through this IDE. However, in case of issues with this new way of starting the debugger,
the older way of starting the debugger (through startup scripts) can also be used. Both are
explained below.
5.1.1 Through Intel® System Studio IDE
To start the Intel® System Debugger, got to <INSTALLDIR> and run iss_ide_eclipse-
launcher.bat that opens Intel® System Studio IDE. In the menu, click on Intel System
Studio > System Debugger > Launch System Debugger
For details on how to start a debugging session, please refer to Getting Started with the Intel® System Debugger 2018 - System Debug.
System Debugger Demo Application
Allows basic debugging of a little demo application running under Simics
System Debugger for Intel Atom processor
Allows the user to debug Intel Atom Processors/Platforms using the Intel® ITP-XDP3 device with support of:
o Intel Atom Processor Z36xx, Z37xx - 2 cores (Baytrail / MinnowBoard MAX)
o Intel Atom Processor C2xxx (Avoton)
o Intel Atom Processor E6xx (Tunnel Creek)
o Intel Atom Processor E6xx (Tunnel Creek) – overlay
o Intel Atom Processor x5-Z8xxx, x7-Z8700 (Cherry Trail)
o Intel Atom Processor E3805, E382x, Z3680 - 2 cores (Valleyview)
o Intel Atom Processor E384x, Z37xx - 4 cores (Valleyview)
With using the Intel® ITP-XDP3 (MOFD) and Intel® ITP-XDP3B (MOFD) JTAG probes the following processors are supported:
o Intel Atom Processor Z35xx (Anniedale/Moorefield)
Allows the user to debug Intel Atom Processors/Platforms using Intel(R) DCI USB 3.x Debug Class with support of:

Intel® System Debugger 2018 - Installation Guide and Release Notes
13
o Intel Atom Processors N4200, N3350, x7-E3950, x5-39xx (Apollo Lake)
o Intel Atom Processor C3xxx (Denverton)
System Debugger for Intel Core processor
Allows the user to debug Intel Core Processors/Platforms using the Intel® ITP-XDP3 device with support of:
o 4th Gen Intel Core Processors (Haswell)
o 4th Gen Intel Core U-Processor Line (Haswell ULT)
o 5th Gen Intel Core Processor (Broadwell)
o 6th Gen Intel Core Processor (Skylake)
o 7th Gen Intel Core Processor (Kaby Lake)
Allows the user to debug Intel Core Processors/Platforms using the Intel® SVT Closed Chassis Adapter (DCI-OOB) device with support of:
o 6th Gen Intel Core Processor (Skylake)
o 7th Gen Intel Core processor (Kaby Lake) / Intel 100 Series chipset (SunrisePoint PCH-H)
o 7th Gen Intel Core processor (Kaby Lake) / Intel 200 Series chipset (Kaby Lake PCH-H)
Allows the user to debug Intel Core Processors/Platforms using Intel(R) DCI USB 3.x Debug Class with support of:
7th Gen Intel Core processor (Kaby Lake) / Intel 100 Series chipset (SunrisePoint PCH-H)
7th Gen Intel Core processor (Kaby Lake) / Intel 200 Series chipset (Kaby Lake PCH-H)
System Debugger for Other processors
Allows the user to debug following Processors/Platforms using Intel(R) DCI USB 3.x Debug Class with support of
Intel Xeon Scalable Processor (Skylake-SP) / Intel C620 Series Chipset (Lewisburg)
System Debugger UEFI Agent
Allows the user to debug UEFI BIOS over serial connection. See Agent Based UEFI Debugging for
more details.
5.1.2 Using startup scripts in installation directory
Alternatively to invoking the debugger from Intel® System Studio IDE, you can also run xdb.bat
batch startup script from the following installation directory:
Intel® System Debugger 2018 - Installation Guide and Release Notes
14
<INSTALLDIR>\system_debugger_2018\system_debug\
5.2 Handling of Target Access Issues
Please ensure that the target system is running a recent firmware version allowing JTAG debugging. If a “no threads found” error message appears, and applying the restart recipe (see below) doesn’t help the situation, please contact customer support for that specific platform.
If target access issues occur, please apply the following recipe for a complete reset of all the components that take part in JTAG debugging, in this order:
1. Close the debugger.
2. Unplug both the USB and power connectors from the XDP3 probe at the same time, so no cable is connected to the XDP3 probe anymore.
3. Using the task manager, kill the process MasterFrame.HostApplication.exe
4. Power off the target system.
5. Plug the USB and power connectors back into the XDP3 probe.
6. Power on the target system.
7. Start the debugger.
5.3 Troubleshooting Target Stability issues
5.3.1 Considerations
The Intel® System Debugger requires a great deal of data to construct a full source-level view of
the target state. For a simple operation such as step, there can be tens to hundreds of individual
accesses to target state. In the case where one of these accesses crashes the target, it can be
difficult to identify the exact root cause.
5.3.2 Techniques for isolating causes
1. Close as many GUI panels as possible
Each panel in the debugger (e.g., the registers panel, MSR panel, etc.) is self-updating. If many
panels are open, then there are many target accesses. Closing panels is one way to isolate which
functional group is causing the problem.
2. Use the TCI_LOG flag to turn on API logging
Intel® System Debugger 2018 - Installation Guide and Release Notes
15
The debugger can log all transactions made to the communication backend. Although this
information is primarily intended for developers, it may also be useful for identifying root causes of
stability issues. Enable logging by setting the environment variable TCI_LOG=1.
For example, you can edit the startup script to include the command
set TCI_LOG=1.
On request from you Intel support team you may additionally include the command
set ENGINE_LOG=1, which will however slow down debugger startup considerably to provide
very detailed logs.
This technique causes a log file to be created in the folder
C:\users\<name>\.sysdbg_2018, where <name> is the user login.
5.4 OS Awareness / Kernel Module Debugging
The Linux* OS awareness pulldown menu allows visibility of all currently active kernel threads. It also provides the ability to view a list of all currently loaded kernel modules with status information and memory location of initialization methods and cleanup methods. Setting whether to stop the target and commence debugging a kernel module on module load, initialization or cleanup/exit allows to start debugging a kernel module and loading its symbolic information. You can then set your breakpoints at the function entry points of the kernel module you want to debug, release the target using the run command and trigger an event that will cause the breakpoint to be hit to start your actual debug session.
You do not need to select kernel modules that are already loaded, but can add additional kernel module names to the list of kernel modules that are monitored and have the debugger stop at load, initialization or cleanup just as it would with the kernel modules that are already populated in the OS awareness pulldown menu as they were loaded during the Linux* OS boot process.
To debug kernel modules the following steps additional to selecting or adding a kernel module in the module list are necessary.
In a debugger script or in the debugger console window enter the following commands:
SET DIRECTORY "<kernel module path>"
This path setting is necessary to enable the automatic source and symbol info mapping upon kernel module load as described above.
To use this feature for runtime loaded kernel module debugging you will need to have the kernel module xdbntf.ko running and installed on the target device. The folder
Intel® System Debugger 2018 - Installation Guide and Release Notes
16
<INSTALLDIR>\system_debugger_2018\system_debug\kernel-modules\xdbntf
contains code to generate a Linux* kernel module that enables kernel module debugging with the Intel® System Debugger.
For generation simply transfer these files to your target system and invoke make. This will generate the kernel object xdbntf.ko.
To enable module debugging this object has to be loaded prior to starting the debugger via the command insmod xdbntf.ko. After finishing the debug session, the module can be unloaded with rmmod xdbntf.
5.5 Troubleshooting Simics Simulated Target
5.5.1 Connection fails with error message: “E-2201 TCP/IP Socket initialization or connection
failed: Connection to host localhost:9123 failed, please verify server is running, and that
the address and port are correct”
The error indicates that the Intel® System Debugger could not connect to the Simics software. This
can be caused by:
1. There is a local firewall running which permits TCP accesses to localhost:9123
2. The license for Simics is expired. Either update to the latest version of Intel® System
Debugger or contact technical support.
6 Issues and Limitations
6.1 Symbol offset issue with GCC compiled firmware
When debugging GCC compiled firmware the automatic symbol load feature loads the symbols to the
wrong offset. Symbols need to be reloaded to the correct offset manually:
Command “efi loadthis” shows the path to loaded symbol file.
Example:
> efi loadthis
INFO: Searching backwards from 0x0000000077AC7000 to 0x00000000779C7000 for PE/COFF header
(semantics=MEM align=0x00001000 range=0x00100000)
INFO: Found PE/COFF module at 0x0000000077AC7000 - 0x0000000077AD72A0 Entrypoint:
0x0000000077AC72AF (size: 66208 bytes)
Intel® System Debugger 2018 - Installation Guide and Release Notes
17
INFO: Successfully loaded debug symbols found at offset 0x0000000077AC6FC0 instead of
0x0000000077AC7000:
C:\uefi_64_gcc\Build\Vlv2TbltDevicePkg\DEBUG_GCC46\X64\Vlv2TbltDevicePkg\SmBiosMiscDxe\SmBiosM
iscDxe\DEBUG\MiscSubclass.debug
Use eval command to get the module entry point address.
Example:
> eval _ModuleEntryPoint
_ModuleEntryPoint [ at address 0x0000000077AC728F ] : type procedure is not evaluatable
[\\_MODULEENTRYPOINT]
NOTE! The default module entry point function name may change from module to module. Check the
module code to find the correct entry point function name.
If evaluated entry point doesn’t match the one shown by efi loadthis command, the symbols need to be
reloaded to an adjusted address.
Reload the module symbol file with the correct offset:
LOAD /NOLOAD /OFFSET = <offset> OF <filename>
Where <filename> is the path to the module symbol file from efi loadthis command result print.
Where <offset> is original load address + (original entry point address - evaluated entry point address)
Example: To get the adjustment subtract evaluated address from the original entry point address:
0x0000000077AC72AF - 0x0000000077AC728F = 0x20. Add the adjustment to the original
module load address = 0x0000000077AC6FC0 + 0x20
6.2 Intel® Atom™ Processor Z35xx Support Limitations
IO breakpoints are not working
Reset break is currently not supported
No power management support due to hardware limitations. Ensure that all OS power
management is disabled, including low power C-states, and sleep states (S0iX and S3)
Only supported on Windows* host
The target needs to have the the eXtended Debug Port enabled (unlocked).
Intel® System Debugger 2018 - Installation Guide and Release Notes
18
6.3 Intel® Atom™ Processor Z3xxx and E3xxx specific issues
6.3.1 Platform power management policy may limit debugger control of the target:
The platform power-management policy may include power management of the CPUs, this may
limit availability of debugger features when the threads are in a low-power state. Examples include:
6.3.2 Launching the debugger when the target is off or in a low-power state may cause
unexpected behavior
The debugger needs to see all threads when connecting to the target in order to correctly initialize
both the debugger state, and the debug resources in the target. The Debugger will report the
number and type of threads observed during initialization (e.g. “INFO: Connected to Processor
type: <name> (4 threads)”) the user should confirm that this matches the expected
configuration. Resetting the target (with the debugger running) should clear the issue and cause all
expected threads to show up in the hardware threads window.
6.3.3 Hardware Threads window may show no threads/partial threads/disabled threads
Hardware Threads window may show no threads/partial threads/disabled threads due to the CPUs
appearing/disappearing from the JTAG scanchain, and/or showing up in the JTAG scanchain as
“disabled”. This condition should only happen when the target is in “run” state, when halted (e.g.
from hitting a breakpoint) the debugger should correctly show all threads. *if the debugger halts
and all threads are not shown* then the debugger is in an incoherent state and you may need to
restart your debug session.
6.3.4 User-initiated Halt may occasionally return errors, especially if the target is in a low-
power state.
Errors include “E-2201: Target has no active threads, this operation is not permitted.” and
“E-2201: Target did not halt execution.”
This condition occurs when the debugger attempts to halt the target, but the CPUs are asleep and
therefore unresponsive to debugger commands. Workaround: manually bring the CPUs out of
sleep (e.g. by fiddling with the tablet) *or* try repeatedly to halt via the debugger, after 2-3 tries the
target typically wakes up.
6.3.5 Kernel module load configurations may be unreliable
Due to limitations in silicon debug features, kernel module load notifications may not function
correctly on Intel® Atom™ Processor Z3xxx and E3xxx based platforms. The following should be
observed to work around this:

Intel® System Debugger 2018 - Installation Guide and Release Notes
19
Software breakpoint in the target must be set prior to using xdbntf. The breakpoint should be
in an unused/unreachable code location, it is not necessary that the breakpoint is ever hit, its
purpose is to enable the Intel® System Debugger redirection logic in the Silicon, which will allow the
kernel module notifications to function correctly.
in some cases the notification will only partially work: this will manifest as a hung system, with
the Intel® System Debugger indicating a “running” state. In this case the user should manually halt
the target, at which point the debugger will detect the notification, consume it, and resume target
execution.
6.4 Intel® Atom™ Processors N4200, N3350, x7-E3950, x5-39xx (Apollo Lake)
6.4.1 Re-connection to the target is not reliably working
Symptom: The connection to the target is sometimes failing if a previous established connection
was disconnected. Power cycling of the target usually resolves the issue.
6.4.2 Resuming the target after hitting software breakpoint is not reliably working
Symptom: Executing “run” command doesn’t work reliably after software breakpoint is hit. The way
to solve it is to either step after the breakpoint or remove the breakpoint.
6.5 Problems with setting breakpoints for Intel® Processor code-named “Coffee Lake”
from disassembly view
Setting breakpoint by double clicking on an instruction in disassembly window may cause an error in
DAL and the breakpoint might not be set correctly. Please use “Create Breakpoint” command to set
it.
6.6 Other Target-specific issues:
6.6.1 3rd generation Intel® Core™ Processor support only available on request
Intel® System Debugger support for the 3rd generation Intel® Core™ Processor code-named “Ivy
Bridge” is currently only available on request. Please contact Intel® System Studio support via
https://premier.intel.com or [email protected] to request the patch necessary to enable
it.
Intel® System Debugger 2018 - Installation Guide and Release Notes
20
6.6.2 Functional differences of 60-pin vs. 10-pin JTAG
Some platforms do not implement the full 60-pin debug port that is traditionally used on Intel
systems, in this case the functionality of the debugger will be limited, especially in the following
areas:
- Detection of reset by the debugger
- Initiation of reset by the debugger
- Halting the target at the reset vector
6.6.3 Platform reset policy may inhibit debugger operation
Some platforms implement reset in such a way that the debugger may not be able to gain control of
the target immediately after reset. This impacts the debugger operation in the following ways:
- The debugger may not be able to restore breakpoints after reset; the breakpoints may appear “enabled” in the GUI but will not in fact be enabled in the target.
- The debugger will not halt automatically at the reset vector; if the user wishes to debug early in the boot process there will be no way to manually initiate a halt quickly enough.
6.6.4 Platform security policy may inhibit debugger operation
In some platforms the security policy may disable JTAG access to the CPU, this is intended to
prevent reverse-engineering. In this case the Intel® System Debugger will successfully connect to
the target, however it will not be able to discover any CPUs on the JTAG bus, and will warn the user
that no CPUs are available. To resolve this issue please ensure that that platform firmware has
enabled access to the CPUs via JTAG, this is typically done by flashing a special “debug” firmware
into the target.
Also note that in some cases the CPU or CPU module may have physically disabled JTAG access,
especially in production or near-production versions. In this case please work with the platform
business unit to obtain JTAG-enabled hardware.
6.6.5 Target power management and platform power policy on tablet systems may inhibit
debugger operation
On some tablet designs the platform architecture includes aggressive power-management of the
CPU, this will impact debugger operation in that a CPU in a low-power state cannot be accessed via
JTAG. This will manifest in a variety of ways:
Error messages indicating that “no threads are available”

Intel® System Debugger 2018 - Installation Guide and Release Notes
21
Error messages indicating that “target could not halt”
No threads displayed in the hardware threads window
In general these problems will be mitigated by doing one or more of the following:
Ensure that the CPUs are in an active state when the debugger is first started (e.g. in early boot firmware where no power management is present)
Ensure that the OS has a workload that will inhibit low power states (e.g. play a video, run animated wallpaper, etc.)
Disable low-power states in the platform when possible (generally a BIOS setting)
6.6.6 Platform reset implementation may limit debugger-initiated reset:
Debugger-initiated reset is not an industry standard feature, it is implemented using sideband
signals on the 60-pin Intel XDP port, and it is subject to the reset implementation on the target
system. Some targets may not reset reliably via the debugger’s reset/restart feature, this will
typically result in a message such as “WARNING: target did not halt after reset, forcing a
halt” being displayed in the debugger console, followed by additional error messages. In this case
the user may need to manually initiate a reset on the target via buttons, debug card, etc.
6.6.7 Platform reset implementation may limit ability to halt at reset vector:
Halting the CPU at the reset vector (first instruction fetched) is a CPU/platform dependent feature
and may be limited due to target implementation details. The main impact to the user is:
inability to debug early platform boot code due to a runaway target. In this case it may be
necessary to build a special firmware with a hard-coded infinite loop early in the boot flow.
inability of the debugger to re-apply breakpoints after target reset. In this case the
debugger may show breakpoints as “enabled” in the GUI, but they will not be installed in the
target, the user should manually halt the target, disable, re-enable breakpoints to ensure they
are applied correctly.
6.6.8 There could be loss in control while doing stepping around reset
On some targets, there could be loss in control while doing stepping around reset.

Intel® System Debugger 2018 - Installation Guide and Release Notes
22
6.7 Installation related issues
6.7.1 Intel® System Debugger use in conjunction with PVT product
In order to use Intel® System Debugger in conjunction with a PVT product, please update OpenIPC
and DAL files inside <INSTALLDIR>/env.d folder.
6.7.2 Sharedinfo.txt not writable
The debugger is dependent on writing to a file called “sharedinfo.txt” which is normally installed at
“C:\ProgramData\Intel\DAL\MasterFrame\sharedinfo.txt”. Default security policy on the host system
may cause this file to be read-only after Intel® System Studio installation. If this is the case then the
user will observe an error message when connecting to the target. To resolve this issue either (a)
run the debugger with administrator privileges or (b) change the permissions on this file (and any
containing folders) to be writable.
6.7.3 Network access for MasterFrame.HostApplication.exe blocked by Microsoft* Windows*
firewall
The debugger utilizes a server process to access the target, this “Masterframe” process will attempt
to access the network when initializing, and this access may trigger a warning from the Microsoft*
Windows* firewall. This is expected and the user should allow the access for the debugger to
function correctly.
6.7.4 MSDIA DLL not registered
The debugger is dependent on a shared library provided by Microsoft* for access to debug
information generated with the Microsoft* compiler. In some cases this library will not be correctly
registered on the host system, which will lead to an error message when trying to load symbols for
modules (e.g. EFI modules) that are compiled using the Microsoft* toolchain. The user can resolve
this issue by manually registering the correct library using an administrator command prompt.
From a command line window go to:
C:\Program Files (x86)\Common Files\microsoft shared\VC
Run:
regsvr32 msdia90.dll
if the msdia90.dll file is not found there, reinstall the Microsoft* Visual C++ 2008 Redistributable
Package after downloading it from Microsoft’s website
Intel® System Debugger 2018 - Installation Guide and Release Notes
23
6.7.5 XDB Grey unresponsive window
On some hosts the System Debugger may come up with an empty gray unresponsive window. If
this is observed then please verify that the Intel Remote Monitor opt-in dialog is not hidden behind
the main window. If this dialog is present, clicking to dismiss it will allow the debugger to launch
normally.
6.8 General Feature Limitations
6.8.1 Debugging a module on the watchlist
The debugger will stop the target when a module on the watchlist gets loaded. Target will stop at
the debug agent code and load the symbols for the module on the watchlist. To debug the module
you need to browse to the module source files and set a breakpoint somewhere in the code.
1. Add your module into the watchlist.
2. Wait for the module to get loaded and target to stop.
3. Open the “Source Files” window. The window is visible at the left side of the screen.
4. Browse to module source code and set a breakpoint.
5. Run the target. Execution stops at the breakpoint and you can debug the module.
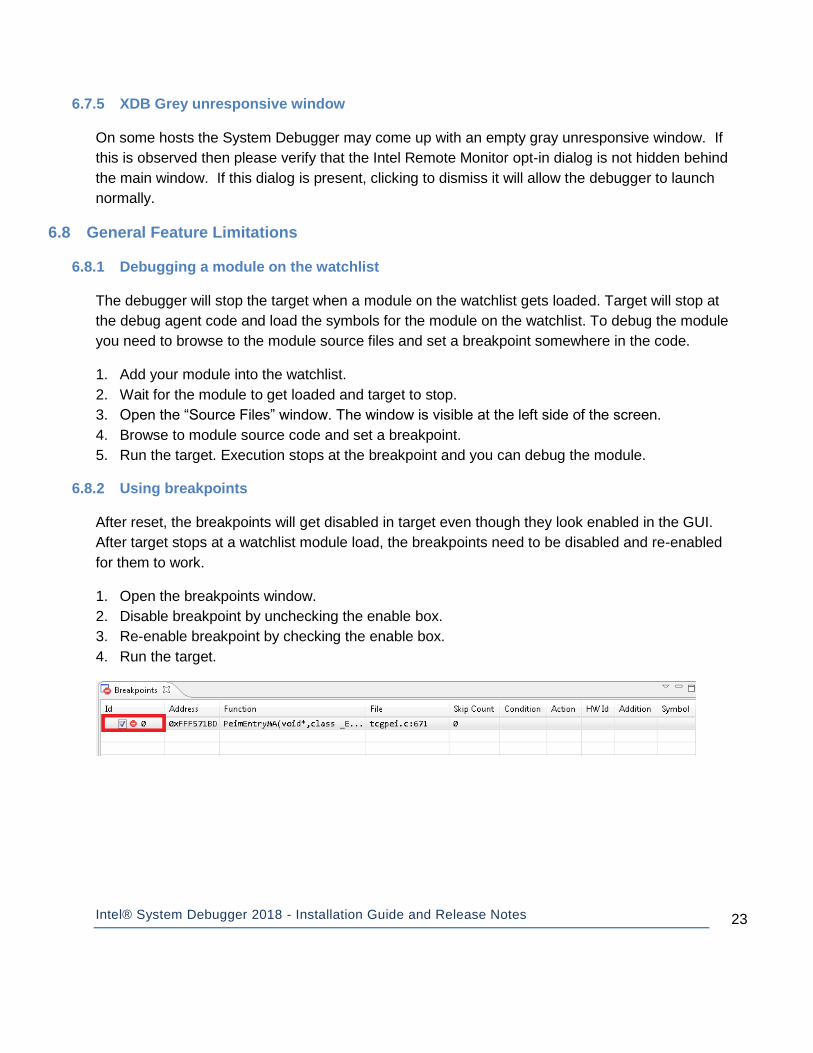
6.8.2 Using breakpoints
After reset, the breakpoints will get disabled in target even though they look enabled in the GUI.
After target stops at a watchlist module load, the breakpoints need to be disabled and re-enabled
for them to work.
1. Open the breakpoints window. 2. Disable breakpoint by unchecking the enable box. 3. Re-enable breakpoint by checking the enable box. 4. Run the target.
Intel® System Debugger 2018 - Installation Guide and Release Notes
24
6.8.3 Support for Intel® Atom™ processor bitfield editor register views
To receive information on how to access bitfield editor chipset register views for Intel® Atom™ Processors, please send an email to [email protected] for details.
6.8.4 Failure of initial debugger re-connection can lead to debugger hang
In some cases the debugger will hang when re-connecting to the target. This is typically observed
when the initial connect attempt has failed (e.g. due to the CPUs or target being powered
off). Workaround: always shut down the debugger and re-launch it when re-connecting to the
target.
6.8.5 Locals Window updates can be slow
The local window updates may be slow in many cases where it is evaluating many large structs or
in scopes with many locals. If the slowness is noticed, it is recommended to close the locals
window.
6.8.6 Kernel Threads Window Population Slow
The Linux* OS awareness plug-in for the Intel® System Debugger includes a Kernel Threads
Window, that displays all current kernel threads and information about their state. When the Kernel
Threads Window is opened it can take several seconds before the actual content is displayed. The
initial window content of “No data.” will disappear once kernel thread data is available. This can take
up to 20 seconds.
6.8.7 Debugger puts a Windows file system lock on symbol files
Currently when a symbol file is loaded in the debugger a file system lock is placed on this file to
prevent other processes from deleting or modifying this file. If this lock is preventing you from
recompiling your program, simply use the Unload feature found in the Load Dialog. Unloading a
symbol file will release the file system lock and allow you to modify or delete the symbol file without
exiting the debugger.
6.8.8 Memory Reads with Uninitialized Memory
If any window other than the memory window is open on uninitialized memory (e.g. Assembly
Window), memory read attempts may lead to the target entering an undefined state.
6.8.9 Memory Writes to Uninitialized Memory
Memory writes to uninitialized or read-only memory (this includes setting software breakpoints or
accessing memory mapped registers) can lead to a crash of the target or a loss of the target
Intel® System Debugger 2018 - Installation Guide and Release Notes
25
control. The debugger will not prevent these memory accesses when requested by the user (e.g.
changing instructions in the disassembly window).
6.8.10 Flash Writer disables pre-existing Breakpoints
Flashing the BIOS will disable all code breakpoints and data breakpoints you may have had set
prior to using the flash writer.
6.8.11 Master Flash Header Read/Write not supported for Intel® Atom™ Processor CE4200
On the Intel® Atom™ Processor CE4200 the Master Flash Header serves as a road map for the contents of flash that are processed by security and host firmware. It contains the location and size of each element in the flash, as well as a list of host firmware images that the security processor will attempt to boot. Currently the flash writer plug-in for the Intel® System Debugger does not support writing or modifying the Master Flash Header.
It is of course possible to use the terminal Master Flash Header commands mfhlist mfhinfo and mfhinit in conjunction with the Intel® System Debugger flash writer plug-in.
mfhlist provides the location of the Master Flash Header entries and where the current platform boot configuration expects the various flash images to be put. It’s output can be used as a guidance for setting the start address when using the flash writer plug-in.
For NOR Non-Trusted Boot and NAND/eMMC Non-Trusted boot can be configured such that target boot is possible even if no Master Flash Header is present on the platform.
eMMC Trusted Boot does require the presence of a Master Flash Header and requires that the actual memory layout does match its contents.
Please read the Platform User Guide closely for further details on the Master Flash Header and its usage.
7 Change History
Below are features listed for older versions of the Intel® System Debugger 2015 to 2018 Beta
releases.
7.1 Intel® System Debugger 2018 Initial Release
7.1.1 New Features
Added support for targets “8th Gen Intel Core Processor (Kaby Lake R) / Intel 100 Series
Chipset (SunrisePoint PCH-H)” and “8th Gen Intel Core Processor (Coffee Lake-S) / Intel Z370
Series Chipset (Kaby Lake PCH-H)”
Updated Simics to a new version
Intel® System Debugger 2018 - Installation Guide and Release Notes
26
7.1.2 Bug Fixes
Intel® Atom™ Processor Z36xx, Z37xx - 2 cores (Baytrail / MinnowBoard MAX) can now be
connected with the new connection establishment method
7.2 Intel® System Debugger 2018 Beta
7.2.1 New Features
Added support for “Intel Atom Processor C3xxx (Denverton)” and “Intel Xeon Scalable
Processor (Skylake-SP) / Intel C620 Series chipset (Lewisburg)”
Intel(R) System Debugger is now integrated into Intel(R) System Studio IDE and can be
invoked from within this IDE as well (except for Wind River* Workbench* integration)
o New connections can now be made from the Intel(R) System Studio IDE as well (see
the “Getting Started with the Intel(R) System Debugger 2018 – System Debug” guide
for instructions)
Microsoft* Windows* 10 64-bit is now supported as a Host Operating System
OpenOCD* support has been discontinued since this release
7.3 Intel® System Debugger 2017 Update 3
7.3.1 New Features
Providing information to the users about breakpoint re-application after target reset
Updated Intel® DFx Abstraction Layer (Intel® DAL)
IO port based reset shows now an information which port writes were executed.
Improved System Table discovery for LoadDXEModules function.
The Target Access Module hang detection timeout can now be configured in the options
dialog. Especially for server platforms with a large number of threads increasing the timeout
helps to identify real target access module hangs.
Intel® Processor Trace Plugin added support for multiple configuration tables and regions.
7.3.2 Bug Fixes
Providing an appropriate message if a target access call is taking a long time instead of
trying to abort the call
Fixed crash during usage of the LoadPEIM function if PEI modules were built in release
mode.
Intel® System Debugger 2018 - Installation Guide and Release Notes
27
IO port based reset does not use to default reset method anymore but do a port based
reset.
7.4 Intel® System Debugger 2017 Update 2
7.4.1 New Features
Added support for 7th Gen Intel Core processor family (Kaby Lake)
Added the platform breakpoint types: Shutdown Break and Machine Check Break
For code lines that are mapping to multiple assembly blocks the context menu provides now
also the options “Go Here”, “Set Current Location” and “Jump to assembler”.
Improved the messaging for cases when no additional hardware breakpoints are available.
Updated Simics
The context menu in the assembler and source window allows now to set a software or
hardware breakpoint explicitly.
The Script file:
<INSTALLDIR>\system_debugger_2018\system_debug\scripts\startup.xdb
was added to allow execution of commands automatically during startup of Intel® System
Debugger
Variables are now marked as <optimized out> if not available because of compiler
optimizations and as <currently unavailable> if they are out of scope.
UEFI Buttons are loaded automatically. No need to manually execute efi.xdb anymore
Improved DWARF Version 4 debug information support.
7.4.2 Bug Fixes
Corrected masking of base addresses in paging structures.
Added correct handling of Memory Protection Key IDs in paging structures.
For the BATCH command the option /NOOUT was fixed.
Complex debug information decoding improved especially for Memory Reference Code
(MRC) debugging.
Setting breakpoints on source lines that map to multiple assembly locations is working now
also if the source file is not part of the first symbol file loaded.
Intel® System Debugger 2018 - Installation Guide and Release Notes
28
7.5 Intel® System Debugger 2017 Update 1
No changes.
7.6 Intel® System Debugger 2017 Initial Release
7.6.1 EFI Script:
New script "EFI.xdb" adds UEFI-specific helper buttons to the user interface to discover PEI/DXE
phase debug symbols.” In order to use the script, use either of these methods:
Via the menu of the debugger GUI:
Click File -> Execute Command File and point it to the file “efi.xdb” which is contained
in the debugger’s “scripts” subdirectory.
Alternatively, on the debugger command line, use this command:
BATCH “scripts/efi.xdb”
This will add three new buttons to the debugger’s toolbar:
LoadThis: This will parse memory around the current instruction pointer and load
symbolic source information for the currently executing UEFI module.
LoadPEIMs: This will search the flash firmware volume and load debug information for
all the PEI-phase modules.
LoadDXEModules: This will search DRAM for the system table, and load debug
information for all the DXE-phase modules that have been loaded by the target up to
this point.
Please note that any of these commands may sometimes lead to the debugger’s disassembly
window showing “No data”. This can be fixed by right clicking into the window and selecting
“Reload” from the context menu.
7.6.2 System Management Mode (SMM) debug support
Improved the support for SMM debugging (currently only available for Intel® DAL based target
connections). See the “Debugging System Management Mode” chapter in the user documentation
for details and usage instructions.
Special stepping handling for RSM (Return from System Management Mode) instruction: Stepping over the RSM instruction will now use SMM Exit Break (and not have the target freely running).
SMM Entry Break and SMM Exit Break available to set from the GUI: Use the “Platform” tab in the “Create Breakpoint” dialog. Also these special breaks can be set by commands
Intel® System Debugger 2018 - Installation Guide and Release Notes
29
SET BREAKPOINT ON “SMM Entry Break” or SET BREAKPOINT ON “SMM Exit Break”, respectively
7.6.3 Single Startup
Single startup, “xdb.bat” and “xdb.sh” are added. This provides a single interface to connect to
different targets and platforms. The previous startup scripts are still present in case of issues
with the new startup script.
7.7 Intel® System Debugger 2016
Support for Intel® Atom™ x7 Z8700 & x5 Z8500/X8400 processor series (Cherry Trail)
Support for 5th Generation (Broadwell) and 6th Generation (Skylake) Intel® Core™ Processor
Family
Platforms that use the Lynx Point PCH are no longer supported and have been removed from
the connection dialog.
The start_xdb_firmware_recovery startup script has been removed. The flash utility from the
GUI should be used for flashing instead.
Support for the Macraigor Systems* usb2Demon* JTAG hardware adapter has been removed.
Agent based UEFI debugging is now exclusively supported via serial connection.
Several bug fixes and stability improvements
7.8 Intel® System Debugger 2015 Update 2
Intel® Atom™ Processor Z35xx code-named “Moorefield” support added
Additional improvements in support for Intel® Atom™ Processors E38xx, Z37xx, N29xx
codenamed “Baytrail”. Now supported exclusively with start_xdb_legacy_products.bat
Additional improvements in support for Intel® Quark™ SoC. Now supported exclusively with
OpenOCD* and start_xdb_gdb_remote.bat
Improved faster and more reliable symbol information handing
Intel® System Debugger Options menu settings are remembered between debugger sessions
Memory evaluations can be saved in hex format
Update to Intel® Dfx Abstraction Layer version 1504 (1.9.5968)
7.9 Intel® System Debugger 2015 Update 1
Update to Intel® Dfx Abstraction Layer (Intel® DAL) version 1448
Yocto Project* 1.7 and Wind River* Linux* 7 support
Stability Improvements
Improvements to UEFI Debug functionality
Intel® System Debugger 2018 - Installation Guide and Release Notes
30
Improved support for the Intel® Atom™ Processor N29xx, E38xx, Z374x and Z377x
code-named “Baytrail”
Additional communication API for faster interface to Intel® Atom™ Processor N29xx, E38xx,
Z374x and Z377x code-named “Baytrail” – Use start_xdb_legacy_products.bat to test the new
sAPI
Improved support for Intel® Quark™ SoC with OpenOCD*
Debugger User and Reference Guide has been updated to include latest improvements to UEFI
debug
7.10 Intel® System Debugger 2015 (Initial Release)
7.10.1 General Usage
Support for Wind River* VxWorks* 7 target OS
o VxWorks* Task and Kernel Module Viewer
Support for OpenOCD* and compatible JTAG devices for Intel® Quark™ SoC
Intel® System Debugger Launch from within Wind River* Workbench*
Instruction trace window and source level instruction flow visualization improvements
Required Microsoft* Visual Studio* redistributables are now automatically installed if missing on
system.
PCI-Bus Scan Tool Technology Preview
7.10.2 Target Platform Support
Support for platforms based on the processors listed below using the Intel® ITPXDP3
device
o Intel® Atom™ Processor C2xxx
o Intel® Atom™ Processor E38xx, Z3680, Z37xx
o 3rd generation Intel® Core™ Processor
o 4th generation Intel® Core™ and Intel® Xeon™ Processor
o 5th generation Intel® Core™ M Processor
Support for Intel® Quark™ SoC using the following OpenOCD* compatible devices
o TinCanTools* FLYSWATTER2 http://www.tincantools.com/wiki/Compiling_OpenOCD
o Olimex* ARM-USB-OCD-H
https://www.olimex.com/Products/ARM/JTAG/ARM-USB-OCD-H/
The following pin adapter was used to connect the Intel® System Debugger to the Intel®
Quark™ SoC board:
https://www.olimex.com/Products/ARM/JTAG/ARM-JTAG-20-10/
Support of BIOS flashing for 4th generation Intel® Core™ processor

Intel® System Debugger 2018 - Installation Guide and Release Notes
31
Support for 3rd generation Intel® Core™ processor target on request via
Agent-based debugging of UEFI (EDK2) BIOS
The Intel® System Debugger now supports non-JTAG based debug of UEFI BIOS, this requires
the use of a target-side debug agent. For more information see chapter 8 on Agent-based UEFI
Debugging.
Extensible Firmware Interface (EFI) Support:
When the target is booting through an EFI BIOS (PEI or DXE phase of the boot process) which
has been built with debug information, the debugger can parse the PE/COFF headers and
locate an address in source.
Use the command
xdb> efi “loadthis <address>”
Providing an address is optional. If no address is passed on the current instruction pointer is
used.
In addition the EFI plugin is able to automatically search and find the system table pointer. Once
found many of the key aspects of the EFI environment including loaded services and modules
can be listed.
xdb> efi “showsystab”
xdb> efi “showmodules”
Please see the output of the
xdb> efi “showhelp”
command for more details
8 Attributions
Portions of this software were originally based on the following: - software copyright (c) 1999, IBM Corporation., http://www.ibm.com. - software copyright (c) 1999, Sun Microsystems., http://www.sun.com. - the W3C consortium (http://www.w3c.org) ,

Intel® System Debugger 2018 - Installation Guide and Release Notes
32
- the SAX project (http://www.saxproject.org) - voluntary contributions made by Paul Eng on behalf of the Apache Software Foundation that were originally developed at iClick, Inc., software copyright (c) 1999. This product includes updcrc macro, Satchell Evaluations and Chuck Forsberg. Copyright (C) 1986 Stephen Satchell. This product includes software developed by the MX4J project (http://mx4j.sourceforge.net). This product includes ICU 1.8.1 and later. Copyright (c) 1995-2006 International Business Machines Corporation and others. Portions copyright (c) 1997-2007 Cypress Semiconductor Corporation. All rights reserved. This product includes XORP. Copyright (c) 2001-2004 International Computer Science Institute
This product includes software from the book "Linux Device Drivers" by Alessandro Rubini and Jonathan Corbet, published by O'Reilly & Associates. This product includes hashtab.c. Bob Jenkins, 1996.

Intel® System Debugger 2018 - Installation Guide and Release Notes
33
9 Disclaimer and Legal Information
No license (express or implied, by estoppel or otherwise) to any intellectual property rights is granted by this document.
Intel disclaims all express and implied warranties, including without limitation, the implied warranties of merchantability, fitness for a particular purpose, and non-infringement, as well as any warranty arising from course of performance, course of dealing, or usage in trade.
This document contains information on products, services and/or processes in development. All information provided here is subject to change without notice. Contact your Intel representative to obtain the latest forecast, schedule, specifications and roadmaps.
The products and services described may contain defects or errors known as errata which may cause deviations from published specifications. Current characterized errata are available on request.
Intel technologies’ features and benefits depend on system configuration and may require enabled hardware, software or service activation. Learn more at Intel.com, or from the OEM or retailer.
Copies of documents which have an order number and are referenced in this document may be obtained by calling 1-800-548-4725 or by visiting www.intel.com/design/literature.htm.
Intel, the Intel logo, Xeon, and Xeon Phi are trademarks of Intel Corporation in the U.S. and/or other countries.
Optimization Notice: Intel's compilers may or may not optimize to the same degree for non-Intel microprocessors for optimizations that are not unique to Intel microprocessors. These optimizations include SSE2, SSE3, and SSSE3 instruction sets and other optimizations. Intel does not guarantee the availability, functionality, or effectiveness of any optimization on microprocessors not manufactured by Intel. Microprocessor-dependent optimizations in this product are intended for use with Intel microprocessors. Certain optimizations not specific to Intel microarchitecture are reserved for Intel microprocessors. Please refer to the applicable product User and Reference Guides for more information regarding the specific instruction sets covered by this notice.
Notice Revision #20110804
*Other names and brands may be claimed as the property of others
© 2017 Intel Corporation.
Related Documents