Rochester Institute of Technology Rochester Institute of Technology RIT Scholar Works RIT Scholar Works Theses 5-14-2021 Intelligent STATCOM Voltage Regulation using Fuzzy Logic Intelligent STATCOM Voltage Regulation using Fuzzy Logic Control Control Saleh Hussein [email protected] Follow this and additional works at: https://scholarworks.rit.edu/theses Recommended Citation Recommended Citation Hussein, Saleh, "Intelligent STATCOM Voltage Regulation using Fuzzy Logic Control" (2021). Thesis. Rochester Institute of Technology. Accessed from This Thesis is brought to you for free and open access by RIT Scholar Works. It has been accepted for inclusion in Theses by an authorized administrator of RIT Scholar Works. For more information, please contact [email protected].

Welcome message from author
This document is posted to help you gain knowledge. Please leave a comment to let me know what you think about it! Share it to your friends and learn new things together.
Transcript

Rochester Institute of Technology Rochester Institute of Technology
RIT Scholar Works RIT Scholar Works
Theses
5-14-2021
Intelligent STATCOM Voltage Regulation using Fuzzy Logic Intelligent STATCOM Voltage Regulation using Fuzzy Logic
Control Control
Saleh Hussein [email protected]
Follow this and additional works at: https://scholarworks.rit.edu/theses
Recommended Citation Recommended Citation Hussein, Saleh, "Intelligent STATCOM Voltage Regulation using Fuzzy Logic Control" (2021). Thesis. Rochester Institute of Technology. Accessed from
This Thesis is brought to you for free and open access by RIT Scholar Works. It has been accepted for inclusion in Theses by an authorized administrator of RIT Scholar Works. For more information, please contact [email protected].

Intelligent STATCOM Voltage Regulation using Fuzzy Logic Control
By
Saleh Hussein
A Thesis Submitted in Partial Fulfilment of the Requirements for the
Degree of Master of Science in Electrical Engineering
Department of Electrical Engineering and Computing Sciences
Rochester Institute of Technology
RIT Dubai
May 14, 2021

Intelligent STATCOM Voltage Regulation using Fuzzy Logic Control
By
Saleh Hussein
Committee Approval
Dr. Abdulla Ismail Date
Professor of Electrical Engineering, RIT Dubai
Thesis Advisor
Dr. Boutheina Tlili Date
Associate Professor of Electrical Engineering, RIT Dubai
Committee Member
Dr. Jinane Al Mounsef Date
Assistant Professor of Electrical Engineering, RIT Dubai
Committee Member

Acknowledgement
I would first like to express my sincere gratitude to my supervisor, Dr. Abdulla Ismail, whose
expertise was invaluable in formulating this research work and methodology. Your insightful
discussions and feedback pushed me to sharpen my thinking and brought my work to a higher
level. I would also like to thank all my instructors at RIT Dubai for their valuable guidance
throughout my studies. You provided me with the tools that I needed to choose the right direction
and successfully complete my dissertation.
Sincere appreciation is extended to my wife for her encouragement, support, and enthusiasm
throughout this journey. Many thanks to my older brother who always pushes me to pursue greater
things. And finally, many thanks to all my family members and friends for their prayers and
continuous support.

Dedication
To my wife for her never-ending encouragement.
To the memory of my late father may Allah have mercy on his soul

i
ABSTRACT
Reactive power compensation is a very important and challenging task in electrical power systems
today. Future trends foreseen in power systems such as high interconnectivity and the integration
of renewable energy resources produce even more issues related to power system control and
stability. Flexible AC transmission systems are vastly used in power systems in order to mitigate
several performance aspects found in typical power systems. One shunt connected device in
particular, STATCOM, is very powerful and commonly used in voltage regulation at the power
transmission level. STATCOM uses voltage sourced converters to inject or absorb reactive power
from the power grid as commanded to stabilize the transmission line voltage at the point of
connection. The control of STATCOM has relied historically on using traditional PI controllers,
however, since the dynamic response of STATCOM highly affects its ability to perform its task,
improving the capabilities of STATCOM using more advanced control approaches has become
vital for both manufacturers and power systems operators. Fuzzy logic control, as one area of
artificial intelligence techniques, has been emerging in recent years as a complement to the
conventional methods in various areas of power systems control. The most significant advantage
of fuzzy controller as an intelligent controller is that it doesn’t require mathematical modelling. It
is robust and nonlinear in its nature, and expert’s knowledge can be utilized in generating control
rules. The main contribution is to use fuzzy logic control theory to design a pure fuzzy logic control
and another fuzzy adaptive PI control strategies for STATCOM that are superior in performance
to traditional PI control approach. This will increase STATCOM’s ability to seamlessly perform
their task in voltage regulation. This work investigates the performance of classical PI controlled
STATCOM then compares it with fuzzy logic based STATCOM and fuzzy adaptive PI controlled
STATCOM. Simulations done using MATLAB on a three generator test system show that adaptive
fuzzy PI control technique is faster in responding to voltage variations and better in tracking the
reactive current reference. Results also show that a direct control using fuzzy logic provides even
faster voltage regulation and acts almost as a perfect tracker for reference reactive current.
Keywords: STATCOM Voltage Regulation, Fuzzy Logic Control, Fuzzy Adaptive PI
Control.

ii
Table of Contents
Acknowledgement ......................................................................................................................... iii
Dedication ...................................................................................................................................... iv
ABSTRACT ..................................................................................................................................... i
Table of Contents ............................................................................................................................ ii
List of Figures ................................................................................................................................ iv
List of Tables ................................................................................................................................ vii
List of Abbreviations ................................................................................................................... viii
1 Introduction ............................................................................................................................. 1
1.1 Overview .......................................................................................................................... 1
1.2 Thesis objectives .............................................................................................................. 4
1.3 Research contributions ..................................................................................................... 4
1.4 Thesis organization .......................................................................................................... 4
2 Background and Literature Review ........................................................................................ 5
2.1 Literature review .............................................................................................................. 5
2.2 Background ...................................................................................................................... 6
2.2.1 Power Transmission Networks ................................................................................. 6
2.2.2 Introduction to FACTS Technology ......................................................................... 9
2.2.3 STATCOM Design and Operation ......................................................................... 16
3 Mathematical Modelling of STATCOM .............................................................................. 34
3.1 STATCOM Three-Phase Mathematical Model ............................................................. 34
3.2 Mathematical Model in the α-β Coordinate System ...................................................... 37
3.3 Mathematical Model in the Rotating d-q Coordinate System ........................................ 41
4 STATCOM Classical Controller Design .............................................................................. 46
4.1 Introduction .................................................................................................................... 46
4.2 Reactive Current Control in STATCOM ....................................................................... 48
4.3 Line Voltage Control in STATCOM ............................................................................. 49
4.4 STATCOM Model Simulation and Results ................................................................... 52
5 Fuzzy Logic Controller for STATCOM ............................................................................... 56
5.1 Fuzzy Logic Control Theory .......................................................................................... 56

iii
5.1.1 Introduction to Fuzzy Logic.................................................................................... 56
5.1.2 Fuzzy Sets and Membership Functions .................................................................. 58
5.1.3 Fuzzy Logic Processing .......................................................................................... 61
5.1.4 Control with Fuzzy Logic Systems ......................................................................... 66
5.2 FLC Based STATCOM .................................................................................................. 68
5.2.1 Fuzzy Logic Controller Structure ........................................................................... 68
5.2.2 FLC Design in MATLAB and Choice of Membership Functions ......................... 70
5.2.3 Mapping Expert Knowledge to Fuzzy Rules .......................................................... 74
5.2.4 Simulation Results .................................................................................................. 80
6 Adaptive Fuzzy PI Controller for STATCOM ..................................................................... 83
6.1 Adaptive Fuzzy PI Controller Structure ......................................................................... 83
6.2 Adaptive FLC Design in MATLAB and Choice of Membership Functions ................. 85
6.3 Mapping Expert Knowledge to Fuzzy Rules ................................................................. 90
6.4 Simulation Results.......................................................................................................... 92
7 Performance Comparison between Control Approaches ...................................................... 95
7.1 Scenario I: Voltage Sag due to Sudden Load Increase .................................................. 96
7.2 Scenario II: Voltage Swell due to Sudden Load Shutdown ........................................... 96
7.3 Control Loops Performance Comparison ....................................................................... 97
8 Conclusions and future Work ............................................................................................. 100
9 References ........................................................................................................................... 101

iv
List of Figures
Figure 1.1 Simple STATCOM Representation ............................................................................... 3
Figure 2.1 Electrical power system layout ...................................................................................... 7
Figure 2.2 Operational limits of transmission lines for different voltage levels .......................... 11
Figure 2.3 Series FACTS devices ................................................................................................. 12
Figure 2.4 Shunt FACTS devices ................................................................................................. 13
Figure 2.5 Combined series-series FACTS devices ..................................................................... 14
Figure 2.6 Combined series-shunt FACTS devices ...................................................................... 14
Figure 2.7 STATCOM structure and voltage / current characteristic ........................................... 17
Figure 2.8 Power semiconductors range of applications [32]....................................................... 18
Figure 2.9 Voltage sourced converter concept [1] ........................................................................ 20
Figure 2.10 Basic 6-pulse VSC STATCOM................................................................................ 21
Figure 2.11 Operation of a three-phase full-wave VSC [1] .......................................................... 22
Figure 2.12 Operation of a phase-leg through four quadrants [1] ................................................ 23
Figure 2.13 Transformer neutral and phase voltages .................................................................... 25
Figure 2.14 12-pulse voltage sourced converter ........................................................................... 27
Figure 2.15 24-pulse converter transformer connections with two 12-pulse converters .............. 28
Figure 2.16 Three-level diode-clamped phase leg [1] .................................................................. 29
Figure 2.17 Three-level flying capacitor phase leg [33] ............................................................... 30
Figure 2.18 Five-level CHB STATCOM [34] .............................................................................. 31
Figure 2.19 PWM converter operation [1] .................................................................................... 32
Figure 3.1 Basic STATCOM equivalent circuit ........................................................................... 35
Figure 3.2 Equivalent block diagram of the three-phase STATCOM mathematical model ........ 37
Figure 3.3 Space phasor representation in the complex plane ...................................................... 39
Figure 3.4 The αβ-frame components of a space phasor .............................................................. 40
Figure 3.5 Rotating d-q coordinate systems [35] .......................................................................... 41
Figure 3.6 Block diagram of STATCOM mathematical model in the rotating d-q frame ........... 45
Figure 4.1 Power System with STATCOM .................................................................................. 47
Figure 4.2 48-pulse STATCOM ................................................................................................... 48
Figure 4.3 Reactive Current Control Loop in STATCOM ........................................................... 49

v
Figure 4.4 Line Voltage Outer Control Loop in STATCOM ....................................................... 50
Figure 4.5 Droop Control in STATCOM [30] .............................................................................. 51
Figure 4.6 Bus voltages without STATCOM ............................................................................... 52
Figure 4.7 Bus voltages with STATCOM .................................................................................... 53
Figure 4.8 STATCOM reactive power and capacitor voltage ...................................................... 54
Figure 4.9 STATCOM Current and Firing Angle ........................................................................ 55
Figure 5.1 Fuzzy Logic System Architecture ............................................................................... 57
Figure 5.2 Triangular membership function ................................................................................. 59
Figure 5.3 Trapezoid membership function .................................................................................. 60
Figure 5.4 Fuzzy processing stages .............................................................................................. 62
Figure 5.5 Mamdani fuzzy reasoning algorithm ........................................................................... 64
Figure 5.6 FLC architecture in control systems ............................................................................ 67
Figure 5.7 FLC for reactive current control .................................................................................. 69
Figure 5.8 FLC for voltage control ............................................................................................... 70
Figure 5.9 Reactive current FLC in MATLAB ............................................................................ 70
Figure 5.10 Voltage control FLC in MATLAB ............................................................................ 71
Figure 5.11 Reactive current error membership functions ........................................................... 71
Figure 5.12 Error rate of change membership functions .............................................................. 72
Figure 5.13 Control signal variation membership functions ........................................................ 72
Figure 5.14 STATCOM V-I characterestics ................................................................................. 73
Figure 5.15 Measured line voltage membership functions ........................................................... 73
Figure 5.16 Reference reactive current membership functions .................................................... 74
Figure 5.17 Generalized step response of a seconf order system ................................................. 75
Figure 5.18 Bus voltages with FLC based STATCOM ................................................................ 81
Figure 5.19 Line voltage vs Reference reactive current in FLC based STATCOM ..................... 81
Figure 5.20 Actual and reference reactive currents in FLC based STATCOM ............................ 82
Figure 6.1 Fuzzy adaptive PI controller for reactive current control ............................................ 84
Figure 6.2 Fuzzy adaptive PI controller for line voltage control .................................................. 85
Figure 6.3 Reactive current / Line voltage adapting FLC in MATLAB ...................................... 86
Figure 6.4 Reactive current error membership functions in adaptive FLC .................................. 86

vi
Figure 6.5 Reactive current error rate of change membership functions in adaptive FLC ........... 87
Figure 6.6 Gain variation membership functions in reactive current controller ........................... 87
Figure 6.7 Integral gain variation membership functions in reactive current controller .............. 88
Figure 6.8 Line voltage error membership functions in adaptive FLC......................................... 88
Figure 6.9 Voltage error rate of change membership functions in adaptive FLC ........................ 89
Figure 6.10 Gain variation membership functions in voltage controller ...................................... 89
Figure 6.11 Integral gain variation membership functions in voltage controller ......................... 90
Figure 6.12 Bus voltages with fuzzy adaptive PI controlled STATCOM .................................... 93
Figure 6.13 Line voltage vs Reference reactive current in adaptive fuzzy PI STATCOM .......... 93
Figure 6.14 Actual and reference reactive currents in fuzzy adaptive PI controlled STATCOM 94
Figure 7.1 Power system Simulation model with load variation .................................................. 95
Figure 7.2 Line voltage response for all controllers due to voltage dip ....................................... 96
Figure 7.3 Line voltage response for all controllers due to voltage swell .................................... 97
Figure 7.4 Reference reactive current output for all controllers ................................................... 98
Figure 7.5 Reference vs actual reactive current for all controllers ............................................... 99
Figure 7.6 Actual reactive current for all controllers .................................................................... 99

vii
List of Tables
Table 2.1 Overview of major FACTS devices.............................................................................. 15
Table 2.2 Estimated number of worldwide installed FACTS devices and their estimated .......... 16
Table 5.1 Initial nine-rule table ..................................................................................................... 77
Table 5.2 Initial 49-rule table........................................................................................................ 77
Table 5.3 Initial 49-rule table with zero diagonal ......................................................................... 78
Table 5.4 Finalized 49-rule symmetrical table ............................................................................. 79
Table 5.5 Voltage control direct 9-rules mapping table ............................................................... 80
Table 6.1 Kp and Ki effect on system transient response .............................................................. 90
Table 6.2 Fuzzy rule base of Kp .................................................................................................... 91
Table 6.3 Fuzzy rule base of Ki .................................................................................................... 91

viii
List of Abbreviations
FACTS Flexible AC Transmission Systems
STATCOM Static Synchronous Compensator
AC Alternating Current
DC Direct Current
VSC Voltage Source Converter
HVDC High Voltage Direct Current
PI Proportional Integral
FL Fuzzy Logic
FLC Fuzzy Logic Control
LQR Linear Quadratic Regulator
FBLC Feedback Linearization Control
PSO Particle Swarm Optimization
GA Genetic Algorithm
ANN Artificial Neural Network
ANFIS Artificial Neural Fuzzy Inference System
SSDC SubSynchronous Damping Controller
AGC Automatic Generation Control
AVR Automatic Voltage Regulator
LFC Load Frequency Control
TCSR Thyristor Controlled Series Reactor
TCSC Thyristor Controlled Series Capacitor
TCR Thyristor Controlled Reactor
TSC Thyristor Switched Capacitor
SVC Static VAR Compensator
SSSC Static Synchronous Series Compensator
IPFC Interline Power Flow Controller

ix
UPFC Unified Power Flow Controller
IGBT Insulated Gate Bipolar Transistor
GTO Gate Turn-Off Thyristors
MTO MOS Turn-off Thyristor
IGCT Integrated Gate-Commutated Thyristors
MLC Multi-Level Converters
FC Flying Capacitor
CHB Cascaded H-bridge
PWM Pulse width modulation
PCC Point of Common Coupling
PLL Phase Locked Loop
CRI Compositional Rule of Inference
FP Fuzzy Processor
FRA Fuzzy Reasoning Algorithms
COA Center of areas

1
1 Introduction
In this chapter, a short introduction about the current encountered problems in the field of power
systems transmission and possible opportunities for enhancement is addressed. Then, the problem
investigated in this study as well as the thesis contribution are presented. Finally, general
organization of the thesis is illustrated.
1.1 Overview
In recent years, the power systems operators have been challenged with relatively complex
problems. Aside from the continuously increasing power demand across the globe, widely
distributed grid interconnections, high penetration of renewable energy resources, minimizing
carbon footprint, and improving power quality have placed even more pressure on power systems
controllability and reliability.
The power grids of today is highly interconnected; starting from utilities interconnections to inter-
regional and then international connections. The motive behind such interconnections is of course
to utilize the new transmission network in order to pool generation and load centers minimizing
the overall cost of power generation and improving the overall power grid reliability. The
complication behind power grids interconnections is that it results in a more complex system to
operate and less stable towards major outages [1].
The need for clean energy in an effort to reduce emissions and minimize reliance on fossil fuels
has led to worldwide installation of large-scale renewable energy systems. Utilities are expected
to face some new nontraditional operational problems due to differences in the dynamic
characteristics of large-scale Photo-Voltaic (PV) and wind farms compared to the conventional
generators. The fluctuation of PV output power due to the variation of solar irradiance and the
inertia-less integration of bulk PV continues to impose many limitations and challenges on grid
angle and frequency stability, post fault voltage regulation, and voltage stability due to lack of
reactive power compensation [2].
The search for technologies to overcome these challenges gave rise to the Flexible AC
Transmission Systems (FACTS); a collection of semiconductor devices with a variety of

2
innovative circuit concepts that can improve power grid controllability and power system stability.
Simply, FACTS devices consist of an assembly of high power AC switches and/or DC to AC
converters controlled to achieve a certain functionality [1].
There are several known types of FACTS devices which are mainly classified based on how the
FACTS device is connected to the transmission line; series, shunt, or a combination of both. Within
each type, several FACTS device concepts exist targeting the enhancement of a certain aspect
within the transmission system of a power grid. Here are some of the main use cases for FACTS
devices:
Voltage control at a certain bus.
Controlling power flow in transmission networks.
Increasing the transmission capacity of existing lines by alleviating stability constrains.
Improving the stability margins of the grid.
Shunt FACTS devices are mainly used for voltage regulation by reactive power compensation and
hence increasing the stability margins. One of the key shunt FACTS devices, the Static
Synchronous Compensator (STATCOM), is further capable of improving the quality of the power
grid against voltage dips and flickers.
The heart of a STATCOM device is the Voltage Source Converter (VSC) which is also the main
part of other high power applications like High Voltage Direct Current (HVDC) transmission lines
and electric drives. As shown in Figure 1.1, the STATCOM connects a capacitor bank to the DC
side of the VSC and on the AC side it is connected to the transmission line via a step down coupling
transformer. Without a DC power source on the DC side of the VSC, the STATCOM can only
exchange reactive power with the grid. The amount and direction of reactive power exchanged
with the grid is controlled by proper firing sequence of the VSC’s power electronic devices; thus
controlling the magnitude and phase angle of the generated waveform on the AC side.
The control of STATCOM devices can be divided into the actual STATCOM reactive current
control and the supervisory line voltage control of STATCOM. Typical STATCOM controllers
are based on decoupled PI control scheme which uses the synchronously rotating reference frame

3
d-q in order to simplify the controller design since only quadrature current component is associated
with the reactive power exchange. Although traditional PI controllers are very common and simple
to implement, they are designed according to the linearized mathematical model of any system. In
addition to the fact that linearization itself introduces uncertainties and errors in the actual system
behavior, PI controllers requires tuning of parameters which can be a complicated task, especially
in case of cascaded PI control loops.
Figure 1.1 Simple STATCOM Representation
Fuzzy logic technology has achieved impressive success in diverse engineering applications
ranging from mass market consumer products to sophisticated decision and control problems. With
the penetration of fuzzy set theory into manufacturing and computer products, applications of
fuzzy set theory in power systems are beginning to receive attention from power systems
researchers. The fuzzy logic control approach stands out among other control techniques in the
fact that it doesn’t need mathematical modelling of the physical system to design its control in
which knowledge from experiences are incorporated to the control engine as a set of linguistic
rules. Fuzzy logic systems can be applied directly as a stand-alone control system, or it can be
applied within a control system in order to make it adaptive in nature to the continuously changing
system dynamics [3].

4
1.2 Thesis objectives
The main objective of the thesis is to improve the design of STATCOM control system by applying
the theoretical power systems knowledge in the creation of Fuzzy Logic Control (FLC) based
STATCOM and adaptive fuzzy PI controlled STATCOM. This will enhance the capabilities of the
STATCOM device in regulating power system voltage and increasing the power system stability
margins.
1.3 Research contributions
The contributions of this research work are:
A practical PI controlled STATCOM model is developed, tested, and simulated in an actual
power transmission line setup.
A complete FLC is designed for STATCOM to replace the traditional PI controller. The
designed FLC provides significantly faster response compared to PI controller.
Building on the classical PI controlled STATCOM, Fuzzy Logic (FL) is applied to auto-
tune the proportional gain and integral gain parameters in PI controlled STATCOM to
achieve better transient and steady state response.
1.4 Thesis organization
The rest of the thesis is organized as follows: Chapter 2 provides background about challenges in
power transmission networks and introduces the concept of FACTS technology. Moreover, a
detailed description of STATCOM operational principle and topologies are discussed. The
mathematical modelling of STATCOM is covered in Chapter 3. Chapter 4 models the classical PI
control approach used to control STATCOM devices and shows the simulation results. The fuzzy
logic control theory is introduced in Chapter 5 along with the FLC based STATCOM design and
simulation results. In Chapter 6, adaptive fuzzy PI controlled STATCOM is designed and
simulated. Finally, Chapter 7 provides performance comparison between the different control
techniques.

5
2 Background and Literature Review
This chapter highlights the recent work achieved in regards of STATCOM control. Next, it
introduces the concept of FACTS devices and how they are used to enhance the power
transmission system. Finally, it provides the details of STATCOM operation.
2.1 Literature review
The research done on STATCOM control in the literature review can be classified into three
categories. First, investigating better STATCOM controller design focusing on the core
functionality of STATCOM, which is voltage regulation. A simple method for STATCOM control
by capacitor voltage regulation has been introduced in [4]. In references [5, 6, and 7], decoupled
PI control, the most common classical control approach, of active and reactive power in
STATCOM was thoroughly studied. Linear optimal control based on LQR control was compared
to conventional PI control method and showed superior response in [8]. The authors in [9] designed
a robust state feedback controller for STATCOM using a zero set concept. In [10], a novel
STATCOM control based on Feedback Linearization Control (FBLC) is proposed and validated
on the IEEE 118-bus system.
In [11], self-tuning PI controller in which the gains are adapted using the Particle Swarm
Optimization (PSO) technique was proposed for a STATCOM yielding better response than the
fixed PI controller. Authors in [12] demonstrated the use of Genetic Algorithm (GA), Artificial
Neural Network (ANN), and Artificial Neural Fuzzy Inference System (ANFIS) to auto-tune
STATCOM PI controller parameter. In references [13, 14], various ANN based controller concepts
has been proposed to enhance the STATCOM controllability.
Fuzzy logic controller was designed for STATCOM to enhance interconnected power system
stability. In [15, 16], a constant voltage fuzzy controller was proposed to improve system dynamic
behavior in which voltage variations is directly translated using fuzzy rules into switching
functions of GTO’s. However, direct voltage control is universally not recommended due to its
high sensitivity. Authors in [17] presented a fuzzy PI based direct output voltage control strategy
for STATCOM control building on the classical decoupled PI control scheme. In this work, the
controller is tested in a simple 6-pulse VSC connected to a low voltage electrical system which is

6
unpractical in STATCOM devices used on medium and high voltage power systems. Several
researchers implemented fuzzy logic controllers in a decoupled control scheme in [18, 19] but with
the approach of mimicking PI controllers and thus not utilizing the power of fuzzy logic control
theory.
The second course of research is attempting to improve certain control tasks that is specific to a
single STATCOM topology type. In [20], authors presents a control scheme of cascaded H-bridge
STATCOM in three-phase power systems using zero-sequence voltage and negative-sequence
current technique. A novel DC capacitor voltage balance control algorithm for cascade multilevel
STATCOM was proposed in [21] where balance control strategy based on active voltage vector
superposition was used. Authors in [22, 23] developed a model predictive control scheme able to
exploit H-bridge STATCOM redundancy to simultaneously balance the capacitor voltages,
provide excellent current reference tracking, and minimize converter switching losses.
Finally, certain amount of research was directed towards the design of auxiliary controllers
addressing other system performance concerns when STATCOM is used in power systems. An
auxiliary SubSynchronous Damping Controller (SSDC) on STATCOM was proposed in [24]
based on nonlinear optimization in order to damp subsynchronous resonance caused by series
capacitors in STATCOM. The authors in [25] proposed a novel controller based on pole-zero
cancellation, root locus method, and pole assignment method to minimize voltage and current
harmonics for a distribution STATCOM. In [26], a novel power losses reduction method based on
applying PSO algorithm in STATCOM control is studied.
2.2 Background
An overview of the rapidly developing power system transmission challenges leading to the
indefinite rising of FACTS technology is discussed. Moreover, the section entails the technical
details of STATCOM device components, topologies, and working principle.
2.2.1 Power Transmission Networks
The presence of energy sources, land availability, load centers locations, and existing layout of a
transmission network dictates building electric power generation plants in remote locations from

7
load centers. To mention a few, hydroelectric stations depend on having high heads and significant
water flows, fossil fuel stations are usually placed in proximity to coal mines or natural gas supply,
nuclear power plants are intentionally built distant from urban centers as a safety measure, and
renewable energy power plants in particular are highly dependent on the availability of the natural
resource such as solar radiation and wind. For this reason, transmission lines are used to transport
electrical energy from the generation source to load centers as illustrated in Figure 2.1. An
electrical power transmission network consists mostly of three phase Alternating Current (AC)
lines typically operating at 230 kV or higher voltages. As the required transmitted power capacity
and the length of transmission lines increase, the transmission operating voltages is also increased
in order to keep the transmission losses within an acceptable margin [27].
Figure 2.1 Electrical power system layout
In Modern electric power systems, it is always desired to have multiple levels of redundancy to
ensure the reliability of power system transmission. That is why modern electric transmission
systems are built to have multiple sources connected to load centers in a mesh configuration.
Gradually, this has led to the evolution of highly-interconnected complex transmission networks
that includes inter-utility, inter-regional, and international connections. In addition to high system
reliability, such interconnections significantly reduce the total generation cost of the electric power
system by utilizing modern power dispatch controls that take advantage of loads diversity, power
sources availability, and different fuel cost variations to optimize power generation. Basically, if
the power transmission network is built in radial lines stretching from each individual generator to

8
corresponding load centers without being part of an interconnected network, more generators
would be required to achieve the same system reliability, therefore the electricity prices would be
much more expensive. With this in mind, we can think of interconnections at the transmission
level as an additional generation resources [1].
In a typical power transmission system, the power flow has two components: active and reactive
power. Excluding the transmission line resistance losses, active power moves from one side to
another where it is used by consumers and converted into mechanical, lighting, thermal energy,
and so on. Since transmission lines have inductive and capacitive components in addition to the
resistive component, the inductive and capacitive reactances of the line conductor absorb and
generate reactive power. Besides, there is the existence of reactive inductive loads such as motors
and reactive capacitive loads such as telecommunication equipment, the result is extra losses in
the line conductor resistance [28].
In a highly intercommoned power transmission grid, power often finds multiple paths to flow
through. Active and reactive power flow via the different parallel paths is naturally decided as a
result of transmission lines impedances and the voltage values at the different buses. From this
perspective, and although interconnected transmission networks provide reliability, transmission
lines power loading is completely uncontrolled. This usually results in overloaded or underloaded
transmission lines within the system. A good example is the power flow from Ontario Hydro
Canada to the North East United States over the long loop of the Pennsylvania, Jersey, Maryland
power pool (PJM) system as it has powerful low impedance lines [1].
Power systems are always responsible for delivering power with certain quality attributes.
Recently, more and more pressure to increase the power quality has been placed upon power
system operators due to the high sensitivity of loads to voltage waveform characteristics. There
are mainly two issues concerned with power quality in any power system: voltage regulation and
harmonic distortion containment. Voltage variations results from sudden load switching or
extremely overloaded circuits. Harmonic distortion in principle results from the increasing number
of nonlinear and power electronics based loads connected to the grid. Such loads introduce a
deviation from an ideal sine wave represented by sinusoidal components at frequencies that are

9
integer multiples of the fundamental frequency which then propagates throughout the entire power
system [29].
In AC power systems, given the insignificant electrical storage, the electrical generation and load
balance at all times resulting in a self-regulating system. When the load increases, the voltage and
frequency drop, and thereby the load, decreases to equal the generation minus the transmission
losses. However, there is a minimal tolerance margin for such self-regulation. If voltage is
supported with reactive power compensation, the load increases again causing the system to
collapse for violating frequency limits. On the other hand, if there is inadequate reactive power,
the system can have voltage collapse [1]. Classical power systems relied on Automatic Generation
Control (AGC) systems comprising an Automatic Voltage Regulator (AVR) and Load Frequency
Control (LFC) implemented at generators for grid regulation. The main function of AVR system
is to regulate voltage and reactive power while that of LFC system is to assess and rectify the
power and frequency. Apart from regulation at the generation plants, components such as tap-
changing transformers are used for voltage regulation. Concerning voltage harmonic containment,
devices such as ferro-resonant power conditioners or active filters are usually used [30].
In the next section, we discuss the challenges faced in electrical transmission systems and how
they progressively resulted in the development of an umbrella of innovative concepts and solutions
known to us today as Flexible AC Transmission Systems (FACTS).
2.2.2 Introduction to FACTS Technology
In addition to the typical problems found in any electrical power transmission system, a new
reconstructing trends have emerged in recent years that calls the power systems operators to
consider non-traditional measures for coping with these trends and prepare the power systems for
the future. The most important issues are listed below with their effect on power systems.
Continuous increase in electrical energy demand globally which has resulted in operating
the transmission lines close to their technical and safety utilization limits. Since installing
new transmission lines is highly difficult due to escalating cost, environmental constrains,
and public regulations, it is vital to explore possibilities of using the existing infrastructure
in a more efficient manner [28].

10
Increasing complexity of the power transmission system as a result of continuous
unpredictable interconnections, expansions, topology modifications, and shifts in
generation and load. This has resulted in a less stable system for riding through major
faults, large power flows with inadequate control, excessive reactive power in various parts
of the system, increased voltage variation, extra power losses, and bottlenecks, and thus
the full potential of transmission interconnections cannot be truly utilized [31].
Integration of large scale renewable energy resources to the existing transmission and
distribution networks. This shift towards green energy utilization comes in response to the
global warming phenomenon and its related environmental concerns which gained a lot of
focus due to the technological advancements in the field of power electronics. From
technical point of view, renewables has a significant impact on voltage regulation and
harmonic distortion containment all over the transmission network. The main challenge
here is to guarantee an adequate voltage amplitude and waveform despite random
variations in renewable energy resources without changes in the existing voltage and
reactive power control mechanisms [29].
The traditional power system is mainly mechanically controlled. Despite the common use of
microelectronics, computers and high-speed communications for control and protection to send
operating signals to the power circuits, the final power control action is taken by the switching
devices is mechanical. This presents two major problems; the limited speed at which control
signals can be applied, and the problem of frequent wear in mechanical contacts compared to static
devices. In reality, the system is completely uncontrolled from both dynamic and steady-state
operation point of view. Power system operators have learned to overcome this limitation by using
a variety of techniques, but at a price of providing greater operating margins and redundancies
which represent an asset that can be effectively utilized by using FACTS technology [1]. Figure 2.2
shows the basic idea of FACTS for transmission systems. The usage of lines for active power
transmission should be ideally up to the thermal limits. It is always desired to shift the voltage and
stability limits with the means of several different FACTS devices. It can be seen that with growing
line length, the opportunity for FACTS devices gets more and more important [32].

11
In most of the FACTS devices applications, it is used to avoid cost intensive or landscape requiring
extensions of power systems, such as upgrades or additions of substations and power lines. FACTS
devices provide a better adaptation to varying operational conditions and improve the usage of
existing installations. The main applications of FACTS devices when utilized in power
transmission networks are listed below.
Power flow control to meet utility needs, contractual agreements, or cost optimization of
power dispatch.
Increase of transmission capability of a line close to its thermal rating and at the same time,
control the line loading based on environmental conditions and loading history.
Voltage control through reactive power compensation.
Transient stability improvement by limiting overload or short circuit currents as well as
damping of electromechanical oscillations.
Power quality improvement through power conditioning and flicker mitigation.
Interconnection of renewable and distributed generation and storages.
Figure 2.2 Operational limits of transmission lines for different voltage levels

12
The development of FACTS devices has started with the rapid and ongoing developments in power
electronics technology and the availability of various types of semiconductor switches for high-
power applications, together with the ongoing advancements in microelectronics technology that
have enabled realization of sophisticated signal processing and control strategies and the
corresponding algorithms for a wide range of applications. From the internal construction point of
view, FACTS devices can be based on a variable impedance, such as capacitor, reactor, etc., or a
power electronics based variable source. On the other hand, irrespective of their internal
construction, FACTS devices can be classified based on how they are connected to the power
transmission network into four types as listed below. Table 2.1 summarizes the most common
FACTS devices based on each type.
Series FACTS devices.
In principle, all series FACTS devices inject voltage in series with the line as illustrated in
Figure 2.3. As long as the voltage is in phase quadrature with the line current, the series
FACTS device only exchanges variable reactive power with the transmission line. Any
other phase relationship will involve handling of real power as well. The series devices
influence the effective impedance on the line and therefore they are commonly used to
improve stability and controlling the power flow on transmission lines interconnections.
Figure 2.3 Series FACTS devices

13
Shunt FACTS devices.
Shown in Figure 2.4, Shunt FACTS devices inject current into the system at the point of
connection. As long as the injected current is in phase quadrature with the line voltage, the
shunt FACTS device only exchanges variable reactive power with the transmission line.
Any other phase relationship will involve handling of real power as well. The shunt FACTS
devices are therefore a good way to control voltage at and around the point of connection
through injection of reactive current (leading or lagging).
Figure 2.4 Shunt FACTS devices

14
Combined series-series FACTS devices.
These are a combination of separate series FACTS devices controlled in a coordinated
manner, or a unified FACTS device in which series devices run independently on each line
and transfer real power among the lines via the power link. This allows balancing both real
and reactive power flow in the lines and thereby maximize the utilization of the
transmission system. An example of such FACTS devices is depicted in Figure 2.5.
Figure 2.5 Combined series-series FACTS devices
Combined series-shunt FACTS devices.
These could be a combination of independent shunt and series devices controlled in a
coordinated manner, or merged into one device with series and shunt elements. As
indicated in Figure 2.6, the series-shunt FACTS devices inject current into the system with
the shunt element, and voltage in series in the line with the series element. Real power
exchange between the series and shunt parts of the device is done over the power link to
provide reactive power flow control.
Figure 2.6 Combined series-shunt FACTS devices

15
Any of the converter-based, series, shunt, or combined shunt-series FACTS devices can generally
accommodate energy storage facility, such as capacitors, batteries, and superconducting magnets,
which bring an added dimension to the FACTS device. A FACTS device with storage is much
more effective for controlling the system dynamics as it provides dynamic pumping of real power
in or out of the system.
Table 2.1 Overview of major FACTS devices
Type Reactor Based Converter Based
Series Thyristor Controlled Series Reactor
(TCSR).
Thyristor Controlled Series
Capacitor (TCSC).
Static Synchronous Series
Compensator (SSSC).
Shunt Thyristor Controlled Reactor (TCR).
Thyristor Switched Capacitor (TSC).
Static VAR Compensator (SVC).
Static Synchronous Compensator
(STATCOM).
Combined
Series - Series
- Interline Power Flow Controller
(IPFC).
Combined
Series - Shunt
- Unified Power Flow Controller
(UPFC).
Some of the Power Electronics devices, being folded into the FACTS concept, predate the
introduction of the FACTS concept to the technical community. Among these is the shunt-
connected SVC for voltage control which was first demonstrated in Nebraska, USA, and
commercialized by GE in 1974 and by Westinghouse in Minnesota in 1975. The first series
connected Controller, NGH-SSR Damping Scheme, a low power series capacitor impedance
control scheme, was demonstrated in California by Siemens in 1984 [1]. FACTS devices are

16
usually perceived as new technology, but hundreds of installations worldwide, especially of SVC
since early 1970s with a total installed power of 90,000 MVAR, show the acceptance of this kind
of technology. Table 2.2 shows the estimated number of worldwide installed FACTS devices and
the estimated total installed power till 2012. Even the newer developments like STATCOM or
TCSC show a quick growth rate in their specific application areas [32].
Table 2.2 Estimated number of worldwide installed FACTS devices and their estimated
Type Number Total installed power in MVA
SVC 600 90,000
STATCOM 20 3,000
TCSC 10 2,000
UPFC 2-3 250
The topic of this thesis is focused on one of the shunt FACTS devices, namely STATCOM, which
is explained in further details in the next subsection.
2.2.3 STATCOM Design and Operation
STATCOM is one of the key shunt FACTS devices. It is based on voltage sourced converters
(VSC) which present unidirectional DC voltage of a DC capacitor to the AC side as AC voltage
via sequential switching of power electronic devices. Through appropriate VSC topology and
control action, the VSC output voltage is maintained to be smaller or larger than the line voltage.
Therefore, the STATCOM essentially injects an almost sinusoidal reactive current of variable
magnitude at the point of compensation. This reactive current, in turn, regulates the transmission
line voltage. The basic schematic of a STATCOM is shown in Figure 2.7 [33]. STATCOM can
increase the power quality by performing several compensations such as dynamic voltage control,
oscillation damping of power line, pursuing the stability during transients, voltage flicker and sag-
swell controls, and active and reactive power control in transmission and distribution systems.
These are achieved since the STATCOM utilizes a VSC with power switches and a closed-loop

17
control system which controls the on-off states of switches. In the following subsections, power
electronic devices and VSC will be discussed in further details [34].
Figure 2.7 STATCOM structure and voltage / current characteristic
2.2.3.1 Power Electronics Devices
Mainly, STATCOM device is based on an assembly of DC/AC converters and high power AC
switches. A converter is an assembly of valves, and each valve in turn is an assembly of power
electronic devices and tum-on turn-off gate drive circuits. Similarly, each AC switch is an
assembly of back-to-back connected power electronic devices and turn-on/turn-off gate drive
circuits. High-power electronic devices are fast switches designed for a variety of switching
characteristics. In their forward-conducting direction, the devices may have control to turn on and
turn off the current flow when ordered to do so by means of gate control [1].
Power electronics have a widely spread range of applications from electrical machine drives to
excitation systems, industrial high current rectifiers for metal smelters, frequency controllers or
electrical trains. FACTS devices are just one application beside others, but use the same
technology trends. Since the first development of a Thyristor by General Electric in 1957, the
targets for power semiconductors are low switching losses for high switching rates and minimal
conduction losses. The innovation in the FACTS area is mainly driven by these developments.

18
Today, there are Thyristor and Transistor technologies available. Figure 2.8 shows the ranges of
power and voltage for the applications of the specific semiconductors [32].
Figure 2.8 Power semiconductors range of applications [32]
Power electronic devices are mainly categorized into three types; Diodes, Transistors, and
Thyristors. A diode conducts in a forward (conducting) direction from anode to cathode, when its
anode is positive with respect to the cathode. It does not have a gate to control conduction in its
forward direction. The diode blocks conduction in the reverse direction, when its cathode is made
positive with respect to its anode. A transistor conducts in its forward direction when one of its
electrodes, called a collector, is positive with respect to its other electrode, called an emitter, and
when a turn-on voltage or current signal is applied to the third electrode, called the base.
Transistors are widely used in low and medium power applications. One type of transistors known
as the Insulated Gate Bipolar Transistor (IGBT) is very common in applications going up to several
megawatts and even a few tens of megawatts [35].
Thyristors are the most important components for FACTS devices. The thyristor starts conduction
in a forward direction when a trigger current pulse is passed from gate to cathode, and rapidly
latches on into full conduction with a low forward voltage drop. Conventional thyristor cannot
force its current back to zero; instead, it relies on the circuit itself for the current to come to zero.

19
To increase the controllability, Gate Turn-Off Thyristors (GTO) have been developed, which like
a conventional thyristor, turns on in a fully conducting mode (latched mode) with a low forward
voltage drop, when a turn-on current pulse is applied to its gate with respect to its cathode, and
turn off when the current naturally comes to zero, however the GTO also has turn-off capability
when a turn-off pulse is applied to the gate in reverse direction. Compared to thyristors, transistors
generally have superior switching performance, in terms of faster switching and lower switching
losses. On the other hand thyristors have lower on-state conduction losses and higher power
handling capability than transistors. Just as the transistor is the basic element for a whole variety
of microelectronic chips and circuits, the thyristor or high-power transistor is the basic element for
a variety of high-power electronic Controllers [36].
2.2.3.2 Voltage Sourced Converters in STATCOM
Basically a Voltage Sourced Converter generates AC voltage from a DC voltage. With a VSC, the
magnitude, the phase angle and the frequency of the output AC voltage can be controlled. VSCs
are the primary building block of STATCOM and most FACTS devices with a wide variety of
converter concepts and topologies. Figure 2.9 shows a schematic representation of a VSC. Since
the direct current in a VSC flows in either direction, the converter valves have to be bidirectional,
and also, since the DC voltage does not reverse, the turn-off devices doesn’t need to have reverse
voltage capability; such turn-off devices are known as asymmetric turn-off devices. Conventional
thyristor device has only the turn-on control; its turn-off depends on the current coming to zero as
per circuit and system conditions. Devices such as the GTOs, IGBTs, MOS Turn-off Thyristor
(MTO), and Integrated Gate-Commutated Thyristors (IGCT) have turn-on and turn-off capability.
These devices (referred to as turn-off devices) are more expensive and have higher losses than
traditional thyristors; however, turn-off devices enable converter concepts that can have significant
overall system cost and performance advantages. Thus, a voltage-sourced converter valve is made
up of an asymmetric turn-off device with a parallel diode connected in reverse. On the DC side,
voltage is unipolar and is supported by a capacitor. This capacitor is large enough to at least handle
a sustained charge/discharge current that accompanies the switching sequence of the converter
valves and shifts in phase angle of the switching valves without significant change in the DC
voltage. On the AC side, the generated AC voltage is connected to the AC system via a coupling

20
transformer or reactor to ensure that the DC capacitor is not short-circuited and discharged rapidly
into a capacitive load such as a transmission line [37].
Figure 2.9 Voltage sourced converter concept [1]
Two main converter topologies are considered for building STATCOM applications; the multi-
pulse and the multi-level converters. Multi-pulse converter topologies such as 12-pulse, 24-pulse
and 48-pulse are developed by combining the most widely known 6-pulse converters via phase-
shifting isolation transformers. On the other hand, multilevel converters are considered to be used
in recent STATCOM topologies as an alternative to the multi-pulse configurations. They employ
one of three design concepts; diode clamped, flying capacitor, and cascaded H-bridge which
provide several advantages such as harmonic elimination, lower electromagnetic interference,
better output waveforms, and increased power factor correction capabilities together. Furthermore,
each switch can be controlled individually to robustly tackle the unbalanced load operations even
in higher switching frequencies relatively to the multi-pulse configuration [33].
2.2.3.2.1 Multi-pulse Converters
The preliminary STATCOM applications are based on multi-pulse converters owing to its low
losses and harmonic contents. The multi-pulse converter topologies consist of several 6-pulse VSC
circuits. A basic VSC STATCOM in the 6-pulse configuration is illustrated in Figure 2.10 that is
constituted with six GTOs and anti-parallel diodes where several other self-commutated devices
such as IGBT, MCT or IGCT could also be used. The GTOs are the switching devices of the
system where the converter can generate balanced three-phase AC output voltages from a DC
capacitor. The frequency of the output voltage is adjusted by the modulating frequency of GTO
switches and the phase voltages are coupled to the AC grid through an interconnection transformer
[27].

21
Figure 2.10 Basic 6-pulse VSC STATCOM
The operating principle of the STATCOM is based on generating a staircase waveform by
synthesizing the DC input voltage levels. The designated order 1 to 6 represents the sequence of
valve operation in time. It consists of three phase-legs, which operate in concert, 120 degrees apart.
The three phase-legs operate in a square wave mode, which means that each valve alternately
closes for 180 degrees as shown by the waveforms 𝑉𝑎, 𝑉𝑏, and 𝑉𝑐 in Figure 2.11. These three
square-wave waveforms are the voltages of AC buses a, b, and c with respect to the hypothetical
DC capacitor midpoint, N. As such, they have peak voltages of +𝑉𝑑/2 and −𝑉𝑑/2. The three phase
legs have their timing 120 degrees apart with respect to each other in what amounts to a 6-pulse
converter operation. Phase-leg 3-6 switches 120 degrees after phase-leg 1-4, and phase-leg 5-2
switches 120 degrees after phase-leg 3-6, thus completing the cycle as shown by the valve close-
open sequence.
Figure 2.11 also shows the three phase-to-phase voltages, 𝑉𝑎𝑏, 𝑉𝑏𝑐, and 𝑉𝑐𝑎, where 𝑉𝑎𝑏 = 𝑉𝑎 − 𝑉𝑏,
𝑉𝑏𝑐 = 𝑉𝑏 − 𝑉𝑐, and 𝑉𝑐𝑎 = 𝑉𝑐–𝑉𝑎 [1]. It is interesting to note that these phase to phase voltages have
120 degrees pulse width with peak voltage magnitude of 𝑉𝑑. The periods of 60 degrees, when the
phase-to-phase voltages are zero, represent the condition when two valves on the same side of the
DC bus are closed on their DC bus. As mentioned earlier, the turn-on and turn-off of the devices
establish the waveforms of the AC bus voltages in relation to the DC voltage, the current flow
itself is the result of the interaction of the AC voltage with the AC system. Also as mentioned
earlier, each converter phase-leg can handle resultant current flow in either direction.

22
Figure 2.11 Operation of a three-phase full-wave VSC [1]
In order to analyze the interaction between the generated AC waveform with the AC system, a
one-leg operation is considered which operates independently. It is clear that for power flow from
AC to DC, the current in the VSC flows through the diodes, and for power flow from DC to AC,
the current in the VSC will flow through the turn-off devices. Figure 2.12 shows an example of an
AC current waveform and the generated AC voltage of one phase-leg with a varying phase angle
in order to illustrate how controlling the generated AC waveform controls the direction of power
flow in STATCOM [1].

23
Figure 2.12 Operation of a phase-leg through four quadrants [1]
During the first one-cycle segment, the phase-leg works as an inverter with a unity power factor
as the current always flows through turn-off devices 1 and 4, and diodes are not involved in
conduction. It is worth mentioning that the current transfer between turn-off devices is at the
natural current zero, also called soft-switching, which involves much lower turn-off device stresses
and switching losses, compared to the switching when current is at a high value. Next, the turn-off
of device 1 and turn-on of device 4 is delayed by 60° in order to change the phase angle for the
following one cycle. Here, when the current reverses polarity, it is transferred from the turn-off
device to its corresponding diode resulting in inverter operation with a current lagging the voltage
by 120°, i.e. with inductive reactive power. In this cycle segment, turn-off devices have soft turn-

24
off but they turn on when the current is high and the voltage across the device is 𝑉𝑑. This hard
turn-on causes significant switching losses.
Introducing additional 30° delay will correspond to current lagging the voltage by 90° making the
VSC acting as a pure inductor. Just like in the previous mode of operation, the turn-off devices
endure a soft turn-off and a hard turn-on. With further delay of 60°, the VSC now operates as a
rectifier in inductive mode with current lagging voltage by 30°. This is followed by further delay
of 30° causing the VSC to operate as a rectifier with a unity power factor. During this cycle, only
the diodes are involved in conduction and current transfers naturally between diodes during current
polarity reversal. This completes the inductive modes of operation in a STATCOM.
With another 60° delay, the VSC now starts operating in the capacitive mode as a rectifier with
the current leading the voltage. In capacitive mode, opposite to inductive mode, the turn-on is soft,
but the turn-off is hard. Introducing additional 30° delay results in a pure capacitive operation of
the VSC. And with more 30° delay, the VSC operates as an inverter in capacitive mode, thus
covering all possible STATCOM modes of operation. It is important to note that the transfer from
pure inductive to pure capacitive mode is accomplished with 180° phase delay. Additionally, since
power devices and transformers have losses, these losses have to be supplied from the DC side or
the AC side during inverter or rectifier operation respectively. However, during full inductive or
capacitive operation, losses can be supplied from either side by operating very slightly in rectifier
or inverter mode.
In power electronics based devices connected to the grid, it is always vital to study the effect of
harmonics in the generated AC waveform. Fourier transform of 𝑣𝑎, 𝑣𝑏, and 𝑣𝑐 is given by (2.1)
𝑣𝑎 =4
π(𝑉𝑑2) [cos𝜔𝑡 −
1
3cos 3𝜔𝑡 +
1
5cos 5𝜔𝑡 −
1
7cos 7𝜔𝑡 + ⋯ ] (2.1)
where 𝑣𝑏 is obtained by replacing 𝜔𝑡 by (𝜔𝑡 − 2𝜋/3), and 𝑣𝑐 is obtained by replacing 𝜔𝑡 by
(𝜔𝑡 + 2𝜋/3). It is seen that all 3𝑛 harmonics (i.e. 3rd, 9th, 15th, etc) are actually in phase. Since
the AC neutral is floating, it is necessary to find out the phase to neutral voltages across the
transformer secondaries. Assuming a wye transformer secondary with floating neutral, then the

25
floating neutral will acquire a voltage with respect to the hypothetical DC midpoint. Applying
Kirchhoff’s current law on the 3 phases shows that this voltage equals to (𝑣𝑎 + 𝑣𝑏 + 𝑣𝑐)/3.
Figure 2.13 shows that 𝑣𝑛 is a square-wave of magnitude 𝑉𝑑/6 with three times the frequency, i.e.,
it has all the 3𝑛 harmonics of the terminal voltages [34].
To obtain the phase voltages across the transformer secondaries, 𝑣𝑛 is subtracted from each phase
voltage 𝑣𝑎, 𝑣𝑏, and 𝑣𝑐. The result according to (2.2) is shown in Figure 2.13 for only 𝑣𝑎𝑛 which
consists of steps of 𝑉𝑑/3, a six-pulse waveform free from 3𝑛 harmonics. It now has harmonics of
only the order of 6𝑛 ± 1, i.e., 5th, 7th, 11th, 13th, etc. Waveforms 𝑉𝑏𝑛 and 𝑉𝑐𝑛 would be the same
except phase shifted from 𝑉𝑎𝑛 by 120° and 240°, respectively. Here, the transformer phase to
neutral voltages are still in phase with the phase to DC midpoint voltages but without the 3𝑛
harmonics.
𝑣𝑎𝑛 =4
π(𝑉𝑑2) [cos𝜔𝑡 +
1
5cos 5𝜔𝑡 −
1
7cos 7𝜔𝑡 −
1
11cos 11𝜔𝑡 +
1
13cos 13𝜔𝑡 + ⋯ ] (2.2)
Figure 2.13 Transformer neutral and phase voltages

26
Now, looking at the phase to phase voltage 𝑣𝑎𝑏 in Figure 2.11 compared to the transformer phase
to neutral voltage 𝑣𝑎𝑛 in Figure 2.13 shows that the two are 30° shifted and 𝑣𝑎𝑏 = √3 𝑣𝑎𝑛. And
since 𝑣𝑎𝑏 can be obtained by 𝑣𝑎𝑛 − 𝑣𝑏𝑛, it is also free from all 3𝑛 harmonics and its Fourier
transform is given by
𝑣𝑎𝑛 =2√3
π𝑉𝑑 [cos𝜔𝑡 +
1
5cos 5𝜔𝑡 −
1
7cos 7𝜔𝑡 −
1
11cos 11𝜔𝑡 +
1
13cos 13𝜔𝑡 + ⋯ ] (2.3)
While the 6-pulse VSC based STATCOM is free of 3𝑛 harmonics, the overall harmonics content
is still significant when integrated into the transmission lines. Although different filtering
techniques can be put in place to stop harmonics from travelling into the grid, harmonics can still
have a bad effect on the VSC components themselves. So, it is always preferable to eliminate as
much harmonics as possible within the design of the VSC. Multi-pulse converters utilize the fact
that phase to phase voltages are 30° shifted from the phase to neutral voltages in order eliminate
further harmonics through implementing ingenious techniques in coupling multiple 6-pulse
converters to the transmission system via different transformers connections [35].
In a 12-pulse VSC, as shown in Figure 2.14 (a), the phase-to-phase voltages of a second 6-pulse
VSC is interfaced with a delta connected secondary of another transformer. In order to bring 𝑣𝑎𝑏
and 𝑣𝑎𝑛 in phase, the pulse train of the second VSC is shifted by 30° with respect to the first VSC;
this way the harmonics of 𝑣𝑎𝑛, except for 12𝑛 ± 1 harmonics, would be in phase opposition to
𝑣𝑎𝑏 but with 1/√3 times the amplitude. To correct for the amplitude difference, the delta
connected transformer secondary side must have √3 times the turns compared to the wye
connected transformer secondary. The resulting output voltage from adding the adjusted phase to
neutral and phase to phase voltages shown in Figure 2.14 (b) would have a 12-pulse waveform
with only 12𝑛 ± 1 harmonics, i.e. 11th, 13th, 23rd, 25th . . ., and with amplitudes of 1/11, 1/13, 1/23,
1/25 …, respectively, of the fundamental frequency amplitude.

27
Figure 2.14 12-pulse voltage sourced converter
Two 12-pulse converters, phase shifted by 15° from each other, provide a 24-pulse converter,
obviously with much lower harmonics on the AC and DC side. Its AC output voltage would have
24n ±1 order harmonics, i.e., 23rd, 25th, 47th, 49th ... harmonics, with magnitudes of 1/23, 1/25,
1/47, 1/49 ..., respectively, of the fundamental AC voltage. Usually, the 15° phase shift is achieved
by providing phase-shift windings for +7.5° phase shift on the two transformers of one 12-pulse
converter and -7.5° on the two transformers of the other 12-pulse converter, as shown in
Figure 2.15.

28
Figure 2.15 24-pulse converter transformer connections with two 12-pulse converters
For high-power FACTS Controllers, from the point of view of the AC system, even a 24-pulse
converter without AC filters could have voltage harmonics, which are higher than the acceptable
level. In this case, a single high-pass filter tuned to the 23rd and 25th harmonics located on the
system side of the converter transformers should be adequate. The alternative, of course, is go with
a 48-pulse VSC with eight 6-pulse converters, with one set of transformers of one 24-pulse
converter phase-shifted from the other by 7.5°, or one set shifted by +3.75° and the other by -3.75°.
With 48-pulse operation, AC filters should not be necessary [31].
2.2.3.2.2 Multi-level Converters
The Multi-Level Converters (MLC) are one of the extensively studied research area of power
converters. Several topologies are proposed by researches to increase the efficiency of MLCs.
However, three topologies that are diode-clamped, flying capacitor (FC), and Cascaded H-bridge
(CHB) hold superior rate of utilization. MLCs offer a lot of benefits such as lower voltage stress
on switching devices, lower dv/dt in voltage source, higher power outputs, decreased
electromagnetic interference, and staircase output voltages depending to multilevel generation.

29
Almost all the STATCOM topologies introduced in the previous multi-pulse section are
implemented with three-level diode-clamped MLC where the switching devices were GTOs [33].
The widely used diode-clamped MLC is based on the three-level converter concept where each
half of phase leg is split into two series connected valves and the midpoint of the split valves is
connected by diodes to the DC capacitor midpoint N. Figure 2.16 (a) shows one phase leg of a
three-level converter where the other phase legs would be connected across the same DC bus and
the clamping diodes connected to the same midpoint N. The first waveform shown in Figure 2.16
(b) is the output voltage of a phase leg corresponding to a full 180° conduction sequence where
devices 1 and 1A are turned on for 180° followed by devices 4 and 4A turned on for another 180°.
Now to introduce a third voltage level into the waveform, device 1 is turned off and device 4A is
turned on an angle 𝛼 before the end of the half cycle. This, in combination with diodes D1 and D2,
clamp the phase voltage 𝑉𝑎 to zero with respect to the DC midpoint N. This continues for a period
2𝛼 until device lA is turned off, and device 4 is turned on. Of course, angle 𝛼 is variable, and the
output voltage 𝑉𝑎 is made up of 𝜎 = 180° − 2𝛼 square waves as shown in the second waveform
of Figure 2.16 (b). Figure 2.16 (b) also shows the output voltage of a second phase 𝑉𝑏 and the
phase-to-phase voltage 𝑉𝑎𝑏 for a three-phase converter.
Figure 2.16 Three-level diode-clamped phase leg [1]

30
In order to further reduce the harmonic content of the AC output voltage, the basic three-level
neutral point clamped phase leg can be extended to a multilevel, 2n+1- level (n = 1,2,3,. . .)
configuration. In this case, 2n DC capacitors (which are common to all three-phase legs of a
complete three-phase converter), are connected in series, providing 2n+1 discrete voltage levels.
4n turn-off devices and clamping diodes are required, along with 2(2n-1) clamp diode branches to
selectively connect the 2n+1 voltage levels to the output.
The second converter topology, referred to as the flying capacitor MLC, is created by using
capacitors instead of clamping diodes. A phase leg of the simplest three-level circuit is shown in
Figure 2.17 where in general, The contiguous capacitors are named as auxiliary capacitors and an
m-level FC MLC topology requires (m − 1) · (m − 2)/2 auxiliary capacitor with (m − 1) DC bus
capacitors. Although the FC MLC requires pre-charging arrangement for the contiguous
capacitors, it eliminates the output filter requirement, allows for more simple control algorithms,
and it enables voltage synthesis in more flexible and versatile way comparing to diode clamped
MLC. As with the diode clamped MLC phase leg, the positive voltage (1/2 Vdc) is obtained by
turning on devices 1 and 2, and the negative voltage (-1/2 Vdc) is obtained by turning on devices 3
and 4. However, the intermediate 0 voltage is obtained by switching on either devices 1 and 3 or
devices 2 and 4 [34].
Figure 2.17 Three-level flying capacitor phase leg [33]

31
The most extended utilization of MLCs in STATCOMs belongs to CHB topology. The CHB
topology consists of several H-bridge modules connected in series to generate a multilevel output
voltage. Most important features of this topology compared to the other two topologies are higher
switching frequency and increased power rate that is handled by the total device and equally shared
to the each module. In addition to these, the CHB based STATCOM is capable to eliminate
harmonics and compensate reactive power in superior in comparison with the other topologies. A
five-level three-phase CHB MLC is shown in Figure 2.18 where each phase leg includes two series
connected H-bridge cells. Any H-bridge cell generates three voltage levels as +Vdc, 0, −Vdc from
the DC bus voltage and supplies the AC output by different switching combinations of the four
switches. The CHB utilizes two sources for each phase to generate a five-level output voltage. One
salient feature of the CHB configuration is that it permits independent control of the three legs of
the converter. If a grounded neutral conductor is provided, the converter can also provide
independent control over the zero-sequence components of the three-phase current, in addition to
the positive-sequence and the negative-sequence components [34].
Figure 2.18 Five-level CHB STATCOM [34]

32
2.2.3.3 Pulse Width Modulation
In the multi-pulse or multi-level VSCs discussed in the previous section, there is only one turn-on,
turn-off per device per cycle, and so, the output AC voltage is controlled by varying the width of
the voltage pulses. Pulse width modulation (PWM) technique involves multiple pulses with
variable width per half cycle to vary the amplitude of the AC voltage and ultimately reduce low-
order harmonics. Figure 2.19 illustrates the concept of PWM applied to one phase leg of a 6-pulse
VSC. The switching pulses are generated for all the devices by considering three signals of main
frequency sine wave representing the three phases, and a sawtooth wave signal of multiple times
the main frequency. Turn-on and turn-off pulses to the devices correspond to the crossing points
of the sawtooth wave with the sine wave of corresponding phase. The resulting voltage of the AC
terminal a, with respect to the hypothetical midpoint N of the DC capacitor, is shown in Figure 2.19
(b) [1].
Figure 2.19 PWM converter operation [1]

33
Obviously, the output voltage waveform contains a fundamental frequency component and
harmonics. The output voltage pulses are symmetrical about the zero crossings of the sine wave,
because the sawtooth frequency is an odd integer multiple of the main frequency. Any even
multiple will create asymmetry about the zero crossing, which will result in even harmonics. With
a fixed sawtooth wave, increasing the magnitude of the sine wave will increase the output AC
voltage as the conduction time of device 1 will increase in the positive half cycle and the
conduction time of device 4 will increase in the negative half cycle. This PWM technique allows
varying specific notches (also referred to as chops) in the square wave such that specific harmonics
are eliminated from the waveform. More complex PWM techniques such as Space Vector PWM
(SVM), Selective Harmonic Elimination PWM (SHE-PWM), and Hysteresis Band PWM (HB-
PWM) have been recently developed and implemented which guarantees further improvements in
reducing switching losses and eliminating harmonics.

34
3 Mathematical Modelling of STATCOM
In this chapter, the STATCOM dynamics are analyzed to formulate a three-phase mathematical
model in the form of state space equations. In typical control tasks of power systems, and in the
attempt of simplifying the controllers design, the three-phase mathematical model is often
converted into the α-β coordinate system and then into the rotating d-q coordinate system. In the
following sub-sections, the three-phase model is obtained for the AC and DC side of STATCOM
and then the model is converted into the rotating d-q coordinates in preparation for controller
design.
3.1 STATCOM Three-Phase Mathematical Model
As explained in Chapter 2, the basic building block of the STATCOM is a VSC shunt connected
to the transmission line through a coupling transformer. The equivalent circuit of a STATCOM is
presented in Figure 3.1. The STATCOM can be modelled as an AC voltage source where the
magnitude, the phase angle and the frequency of the output voltage are controllable. In all
subsequent derivations a per-unit (pu) system is used where 𝑖𝐵 and 𝑣𝐵 are the base values and 𝜔𝐵
is the angular speed at the system nominal frequency:
𝑖𝑝𝑎′ =
𝑖𝑝𝑎
𝑖𝐵 𝑖𝑝𝑏
′ =𝑖𝑝𝑏
𝑖𝐵 𝑖𝑝𝑐
′ =𝑖𝑝𝑐
𝑖𝐵
𝑣𝑝𝑎′ =
𝑣𝑝𝑎
𝑣𝐵 𝑣𝑝𝑏
′ =𝑣𝑝𝑏
𝑣𝐵 𝑣𝑝𝑐
′ =𝑣𝑝𝑐
𝑣𝐵
𝑣𝑖𝑎′ =
𝑣𝑖𝑎𝑣𝐵
𝑣𝑖𝑏′ =
𝑣𝑖𝑏𝑣𝐵
𝑣𝑖𝑐′ =
𝑣𝑖𝑐𝑣𝐵
𝑧𝐵 =𝑣𝐵𝑖𝐵
𝐿𝑝′ =
𝜔𝐵𝐿𝑝
𝑧𝐵 𝑅𝑝
′ =𝑅𝑝
𝑧𝐵
𝑣𝑑𝑐′ =
𝑣𝑑𝑐𝑣𝐵
𝑖𝑑𝑐′ =
𝑖𝑑𝑐𝑖𝐵
𝐶′ =1
𝜔𝐵𝐶𝑧𝐵 𝑅𝑐
′ =𝑅𝑐𝑧𝐵

35
Figure 3.1 Basic STATCOM equivalent circuit
As seen from the STATCOM circuit, the device is modelled as a voltage source (voltages 𝑣𝑝𝑎′ ,
𝑣𝑝𝑏′ , 𝑣𝑝𝑐
′ ) that is connected to the network through the inductance 𝐿𝑝′ / 𝜔𝐵 and the resistance 𝑅𝑝
′
that represents the losses of the coupling circuit. The STATCOM current is denoted as 𝑖𝑝′ . The DC
circuit is modelled as a current source (𝑖𝑑𝑐′ ) connected to the capacitor 𝐶′ and the resistance 𝑅𝑐
′ .
The resistance 𝑅𝑐′ is used to represent semiconductor and DC circuit losses. Based on the three-
phase equivalent circuit shown in Figure 3.1 we can write differential equations for the STATCOM
currents. The voltage difference between the network voltages (𝑣𝑖𝑎′ , 𝑣𝑖𝑏
′ , 𝑣𝑖𝑐′ ) and the STATCOM
voltages (𝑣𝑝𝑎′ , 𝑣𝑝𝑏
′ , 𝑣𝑝𝑐′ ) results in the STATCOM current (𝑖𝑝𝑎
′ , 𝑖𝑝𝑏′ , 𝑖𝑝𝑐
′ ) through the coupling
circuit:
𝑑
𝑑𝑡 [
𝑖𝑝𝑎′
𝑖𝑝𝑏′
𝑖𝑝𝑐′
] = −𝑅𝑝
′𝜔𝐵
𝐿𝑝′ [
𝑖𝑝𝑎′
𝑖𝑝𝑏′
𝑖𝑝𝑐′
] +𝜔𝐵𝐿𝑝′[
(𝑣𝑖𝑎′ − 𝑣𝑝𝑎
′ )
(𝑣𝑖𝑏′ − 𝑣𝑝𝑏
′ )
(𝑣𝑖𝑐′ − 𝑣𝑝𝑐
′ )
] (3.1)
For an accurate modelling of STATCOM, also the DC side circuit has to be described as the DC
side voltage is not absolutely constant. The DC side current can be expressed as:
𝑖𝑑𝑐′ =
1
𝜔𝐵𝐶′𝑑𝑣𝑑𝑐
′
𝑑𝑡+𝑣𝑑𝑐′
𝑅𝑐′ (3.2)

36
To describe the connection between the AC and DC side we can consider the VSC instantaneous
power. Namely, the instantaneous power on the DC side of the converter is always equal to the
power on the AC side:
𝑣𝑑𝑐′ 𝑖𝑑𝑐
′ = 𝑣𝑝𝑎′ 𝑖𝑝𝑎
′ + 𝑣𝑝𝑏′ 𝑖𝑝𝑏
′ + 𝑣𝑝𝑐′ 𝑖𝑝𝑐
′ (3.3)
The connection between the VSC AC and DC side voltages can be described with the switching
function (signals 𝑆𝑎, 𝑆𝑏, 𝑆𝑐), describing the generation of AC voltages from DC voltage:
[
𝑣𝑝𝑎′
𝑣𝑝𝑏′
𝑣𝑝𝑐′
] = 𝐾𝑝 [
𝑆𝑎𝑆𝑏𝑆𝑐
] 𝑣𝑑𝑐′ (3.4)
where the factor 𝑘𝑝 depends on the converter type. The factor could be also omitted from the
derivations; however, it enables to take into account different converter topologies which have
different DC side voltage to AC side voltage amplitude ratios. Taking into account (3.3) and (3.4),
the expression for the DC side current is obtained:
𝑖𝑑𝑐′ = 𝐾𝑝𝑆𝑎𝑖𝑝𝑎
′ + 𝐾𝑝𝑆𝑏𝑖𝑝𝑏′ + 𝐾𝑝𝑆𝑐𝑖𝑝𝑐
′ (3.5)
The DC current (3.5) is included in (3.2) giving a complete description of the DC side circuit. The
complete set of equations describing STATCOM operation, including the DC side circuit is
mentioned below and the equivalent block diagram of the three-phase STATCOM model is shown
in Figure 3.2.
𝑑
𝑑𝑡
[ 𝑖𝑝𝑎′
𝑖𝑝𝑏′
𝑖𝑝𝑐′
𝑣′𝑑𝑐]
=
[ −
𝑅𝑝′𝜔𝐵
𝐿𝑝′
0 0 −𝑘𝑝𝜔𝐵
𝐿𝑝′
𝑆𝑎
0 −𝑅′𝑝𝜔𝐵𝐿𝑝′
0 −𝑘𝑝𝜔𝐵𝐿𝑝′
𝑆𝑏
0 0 −𝑅𝑝′𝜔𝐵
𝐿𝑝′−𝑘𝑝𝜔𝐵
𝐿𝑝′𝑆𝑐
𝑘𝑝𝜔𝐵𝐶′𝑆𝑎 𝑘𝑝𝜔𝐵𝐶
′𝑆𝑏 𝑘𝑝𝜔𝐵𝐶′𝑆𝑐 −
𝜔𝐵𝐶′
𝑅𝑐′ ]
[ 𝑖𝑝𝑎′
𝑖𝑝𝑏′
𝑖𝑝𝑐′
𝑣′𝑑𝑐]
+𝜔𝐵𝐿𝑝′[
𝑣𝑖𝑎′
𝑣𝑖𝑏′
𝑣𝑖𝑐′
0
] (3.6)

37
Figure 3.2 Equivalent block diagram of the three-phase STATCOM mathematical model
3.2 Mathematical Model in the α-β Coordinate System
As the ultimate goal of system modelling is to design a controller, it is always vital to explore the
optimal system model that allows for the simplest controller design. To obtain a high performing
STACOM system, the STATCOM control system must track a sinusoidal reference input.
Considering the three-phase system model derived in the previous section, the controller for such
system model that can track 3 sinusoidal reference inputs without producing significant steady
state errors must be of a relatively high order design and might be difficult to implement. In
addition, three different control loops for each phase must be implemented. A common approach
to simplify the system model of various power system control tasks is to derive the mathematical
model in the α-β coordinate system instead of the three-phase phasor representation [35].
The α-β coordinate system (also known as the Clarke transformation) invented by Edith Clarke is
a mathematical transformation employed to simplify the analysis of three-phase circuits.

38
Generally, any balanced three-phase sinusoidal function 𝑓(𝑡) has the below 𝑓𝑎, 𝑓𝑏, and 𝑓𝑐
components.
𝑓𝑎(𝑡) = 𝑓 cos(𝜔𝑡 + 𝜃0) (3.7)
𝑓𝑏(𝑡) = 𝑓 cos (𝜔𝑡 + 𝜃0 −2𝜋
3) (3.8)
𝑓𝑐(𝑡) = 𝑓 cos (𝜔𝑡 + 𝜃0 −4𝜋
3) (3.9)
where 𝑓, 𝜃0, and 𝜔 are the amplitude, the initial phase angle, and the angular frequency,
respectively. For this three-phase sinusoidal function, the three components can be represented in
a space phasor form defined as,
𝑓(𝑡) =2
3[𝑒𝑗0𝑓𝑎(𝑡) + 𝑒
𝑗2𝜋3 𝑓𝑏(𝑡) + 𝑒
𝑗4𝜋3 𝑓𝑐(𝑡)] (3.10)
Substituting (3.7), (3.8), and (3.9) in (3.10) yields
𝑓(𝑡) = (𝑓 ̂𝑒𝑗𝜃0)𝑒𝑗𝜔𝑡 = 𝑓𝑒𝑗𝜔𝑡 (3.11)
where 𝑓 = 𝑓 𝑒𝑗𝜃0. The complex quantity 𝑓 is represented by a vector in the complex plane. If 𝑓 is
constant, the vector is analogous to the conventional phasor that is used to analyze linear circuits
under steady-state sinusoidal conditions, and the tip of 𝑓(𝑡) moves along the circumference of a
circle centered at the complex plane origin (Figure 3.3).

39
Figure 3.3 Space phasor representation in the complex plane
Clarke transformation is based on decomposing the given space phasor 𝑓(𝑡) into its real and
imaginary components as shown in Figure 3.4. Thus, the three-phase quantities are translated from
the three-phase reference frame to a two-axis orthogonal stationary reference frame
𝑓(𝑡) = 𝑓𝛼(𝑡) + 𝑗𝑓𝛽(𝑡) (3.12)
Now, substituting (3.12) in (3.11) and equating the corresponding real and imaginary parts of both
sides of the resultant, we deduce
[𝑓𝛼(𝑡)𝑓𝛽(𝑡)
] =2
3𝐂 [
𝑓𝑎(𝑡)
𝑓𝑏(𝑡)
𝑓𝑐(𝑡)] (3.13)
where,
𝐂 =
[ 1 −
1
2−1
2
0√3
2−√3
2 ]
(3.14)

40
Figure 3.4 The αβ-frame components of a space phasor
Applying (3.13) to the three-phase model (3.1) yields the STATCOM AC side mathematical model
in the α-β frame:
𝑑
𝑑𝑡[𝑖p𝛼′
𝑖p𝛽′ ] =
[ −𝑅p′𝜔B
𝐿p′0
0 −𝑅p′𝜔B
𝐿p′ ]
[𝑖p𝛼′
𝑖p𝛽′ ] +
𝜔B𝐿p′[𝑣i𝛼′ − 𝑣p𝛼
′
𝑣i𝛽′ − 𝑣p𝛽
′ ] (3.15)
where the zero-sequence component has been omitted, due to three phase, three wire STATCOM
topology. In order to include the DC side circuit into the mathematical model, expressions (3.4)
and (3.5) are transformed into α-β frame equations.
𝑣p𝛼′ = 𝑘p𝑆𝛼𝑣dc
′ (3.16)
𝑣pβ′ = 𝑘p𝑆𝛽𝑣dc
′ (3.17)
𝑖dc′ =
3
2(𝑘p𝑆𝛼𝑖p𝛼
′ + 𝑘p𝑆𝛽𝑖pβ′ ) (3.18)
The complete set of equations in α-β coordinates describing STATCOM model is given below.

41
𝑑
𝑑𝑡[
𝑖p𝛼′
𝑖p𝛽′
𝑣dc′
] =
[ −
𝑅p′𝜔B
𝐿p′0 −
𝑘p𝜔B
𝐿p′𝑆𝛼
0 −𝑅′𝜔B𝐿p′
−𝑘p𝜔B
𝐿p′𝑆𝛽
3𝑘p𝜔B𝐶′
2𝑆𝛼
3𝑘p𝜔B𝐶′
2𝑆𝛽 −
𝜔B𝐶′
𝑅𝑐′ ]
[
𝑖p𝛼′
𝑖p𝛽′
𝑣dc′
] +
[ 𝜔B𝐿p′𝑣i𝛼′
𝜔B𝐿p′𝑣i𝛽′
0 ]
(3.19)
3.3 Mathematical Model in the Rotating d-q Coordinate System
In the previous section, the Clarke transformation was applied to transform the three-phase
mathematical model of STATCOM into the 2-axis α-β coordinate system; thus the control in α-β
coordinate system has the feature of reducing the number of required control loops from three to
two. However, the reference, feedback, and feed-forward signals are in general sinusoidal
functions of time. Therefore, to achieve a satisfactory performance and small steady-state errors,
the compensators may need to be of high orders, and the closed-loop bandwidths must be
adequately larger than the frequency of the reference commands. Consequently, the compensator
design is not a straightforward task. Transforming the mathematical model and controller design
into the rotating d-q coordinate system offers a solution to this problem [32].
Figure 3.5 Rotating d-q coordinate systems [35]
The rotating d-q coordinate system (also known as Park transformation) invented by Robert H.
Park builds on the α-β coordinate system by assuming a rotating axes with the space phasor at the
same angular speed. These rotating axes are called d-axis and q-axis as shown in Figure 3.5. Since

42
the coordinate system is rotating at the same angular frequency as the space phasor, the values of
the d-component and q-component doesn’t change cyclically each period and they can be
considered DC values. For the space phasor 𝑓 = 𝑓𝛼 + 𝑗𝑓𝛽, the α-β to d-q coordinate system
transformation is defined by
𝑓𝑑 + 𝑗𝑓𝑞 = (𝑓𝛼 + 𝑗𝑓𝛽)𝑒−𝑗𝜀(𝑡) (3.20)
which is equivalent to a phase shift in 𝑓(𝑡) by the angle −𝜀(𝑡). To highlight the usefulness of the
transformation given by (3.20), assume that 𝑓 has the following general form:
𝑓(𝑡) = 𝑓𝛼 + 𝑗𝑓𝛽 = 𝑓(𝑡)𝑒−𝑗[𝜃0+∫𝜔(𝜏)𝑑𝜏] (3.21)
where 𝜔(𝑡) is the frequency and 𝜃0 is the initial phase angle of the three-phase signal
corresponding to 𝑓(𝑡). If 𝜀(𝑡) is chosen as
𝜀(𝑡) = 𝜀0 +∫𝜔(𝜏)𝑑𝜏
then based on (3.20), the d-q coordinate system representation of 𝑓(𝑡) becomes
𝑓𝑑 + 𝑗𝑓𝑞 = 𝑓(𝑡)𝑒𝑗(𝜃0−𝜀0) (3.22)
which is stationary and, therefore, the constituents of its corresponding three-phase signal are DC
quantities. Note that 𝜃(𝑡) and 𝜀(𝑡) are not necessarily equal, but 𝑑𝜃(𝑡)/𝑑𝑡 = 𝑑𝜀(𝑡)/𝑑𝑡 must be
ensured (usually by using Phase Locked Loop circuits which will be discussed in details later on).
Based on the Euler’s identity 𝑒𝑗(.) = 𝑐𝑜𝑠(·) + 𝑗 𝑠𝑖𝑛(·), (3.20) can be written as
[𝑓𝑑(𝑡)𝑓𝑞(𝑡)
] = 𝑹[𝜀(𝑡)] [𝑓𝛼(𝑡)𝑓𝛽(𝑡)
] (3.23)
where,

43
𝑹[𝜀(𝑡)] = [cos 𝜀(𝑡) sin 𝜀(𝑡)− sin 𝜀(𝑡) cos 𝜀(𝑡)
]
A direct transformation from the three phase coordinate system to the rotating d-q coordinate
system can be obtained by substituting (3.13) in (3.23)
[𝑓𝑑(𝑡)𝑓𝑞(𝑡)
] =2
3𝑻[𝜀(𝑡)] [
𝑓𝑎(𝑡)𝑓𝑏(𝑡)𝑓𝑐(𝑡)
] (3.24)
where
𝑻[𝜀(𝑡)] = 𝑹[𝜀(𝑡)] 𝑪 = [cos 𝜀(𝑡) cos [𝜀(𝑡) −
2𝜋
3] cos [𝜀(𝑡) −
4𝜋
3]
sin 𝜀(𝑡) sin [𝜀(𝑡) −2𝜋
3] sin [𝜀(𝑡) −
4𝜋
3]
] (3.25)
In the next step, the mathematical model given in (3.1) is transformed into the d-q synchronous
frame by using the classic transformation matrix (3.26). The zero sequence component is omitted,
as a three-wire STATCOM cannot generate zero-sequence currents.
𝐓𝐝𝐪 =2
3[cos(𝜔𝑡) cos (𝜔𝑡 −
2𝜋
3) cos (𝜔𝑡 +
2𝜋
3)
−sin(𝜔𝑡) −sin (𝜔𝑡 −2𝜋
3) −sin (𝜔𝑡 +
2𝜋
3)
] (3.26)
Applying the transformation, yields the following mathematical model of the STATCOM’s AC
side.
𝑑
𝑑𝑡[𝑖𝑝d′
𝑖𝑝q′ ] =
[ −𝑅p′𝜔B
𝐿p′𝜔
−𝜔 −𝑅p′𝜔B
𝐿p′ ]
[𝑖𝑝d′
𝑖𝑝q′ ] +
𝜔B𝐿p′[𝑣id′ − 𝑣pd
′
𝑣iq′ − 𝑣pq
′ ] (3.27)

44
The DC side current equation is already described with (3.2). For the calculation of the DC side
current, the power balance equation is used again, this time written in the d-q coordinate system
as follows:
𝑣𝑑𝑐′ 𝑖dc
′ =3
2(𝑣𝑝𝑑
′ 𝑖𝑝𝑑 + 𝑣𝑝𝑞′ 𝑖𝑝𝑞
′ ) (3.28)
The connection between the AC and DC side voltages can be given with the expression (3.29) in
the d-q frame. 𝑆𝑑 and 𝑆𝑞 represent the switching function. The factor 𝑘𝑝 is dependent upon the
converter type.
[𝑣𝑝d′
𝑣𝑝q′ ] = 𝑘p [
𝑆d𝑆q] 𝑣dc
′ (3.29)
The connection between AC and DC currents, taking into account (3.28) and (3.29), is given in
(3.30) as:
𝑖dc′ =
3
2(𝐾𝑝𝑆𝑑𝑖′𝑝𝑑 + 𝐾𝑝𝑆𝑑𝑖′𝑝𝑞) (3.30)
The complete mathematical model in the d-q coordinate system is given in (3.31). The constant ω
is the angular speed of the fundamental frequency voltage component. Because the d-q
transformation is frequency dependent, the derived mathematical model is valid only for the
fundamental frequency component. Figure 3.6 shows the block diagram of the STATCOM model
in the rotating d-q frame.
𝑑
𝑑𝑡[
𝑖p𝑑′
𝑖pq′
𝑣dc′
] =
[ −
𝑅p′𝜔B
𝐿p′𝜔 −
𝑘p𝜔B
𝐿p′𝑆d
−𝜔 −𝑅′𝜔B𝐿p′
−𝑘p𝜔B
𝐿p′𝑆q
3𝑘p𝜔B𝐶′
2𝑆d
3𝑘p𝜔B𝐶′
2𝑆𝛽 −
𝜔B𝐶′
𝑅𝑐′ ]
[
𝑖p𝑑′
𝑖pq′
𝑣dc′
] +
[ 𝜔B𝐿p′𝑣id′
𝜔B𝐿p′𝑣iq′
0 ]
(3.31)

45
Figure 3.6 Block diagram of STATCOM mathematical model in the rotating d-q frame

46
4 STATCOM Classical Controller Design
In this chapter, classical approach of PI control is applied to the STATCOM mathematical model
in the rotating d-q coordinate system. At the beginning, the STATCOM control variables and
outputs are identified and then the various measurement circuits and control loops of the controller
is explained. Finally, the controller design in MATLAB is integrated into a transmission system
case study to illustrate the operational concept and simulation results of STATCOM.
4.1 Introduction
The control algorithm of STATCOM is based on the mathematical model in the rotating d-q frame.
As it can be seen from the model, the controllable parameters are the switching functions of the
VSC power electronic switches and there are three variables 𝑖𝑝𝑑′ , 𝑖𝑝𝑞
′ and 𝑣𝑑𝑐′ . As mentioned before,
STATCOM can be used to improve different aspects of the power transmission system, however
the control of transmission line voltage is the widely spread use of STATCOM installations and
therefore, the task of the controller in this thesis will be focused on controlling the transmission
line voltage at the Point of Common Coupling (PCC).
In the STATCOM, the required voltage source output is generated by inverting the DC voltage;
which is assumed available across the DC capacitor at all times. However, a practical STATCOM
is not lossless and if the active power going into the inverter from the grid is held at zero, the
initially charged capacitor will completely discharge due to components losses in the inverter. So,
a mechanism for controlling the phase angle of VSC output voltage must be used to draw just
enough power from the grid AC mains to supply all the losses due to the flow of the reactive
current demanded by the grid. This approach can also control the reactive power generated or
absorbed by STATCOM via increasing or decreasing the capacitor voltage and thereby the output
voltage. This technique is called “synchronous link-based control scheme” in which the AC
currents are controlled indirectly by controlling the phase angle of the inverter output voltage with
respect to the AC side source voltage [30].
On the other hand, the AC currents can be controlled directly by current feedback in the case of a
“current-controlled scheme”. In the latter case the inverter is current-regulated and its switches are
controlled in such a way that the inverter delivers a commanded current at its output, rather than a

47
commanded voltage. Consequently, the voltage required to see the commanded current flowing
out of the inverter will be synthesized automatically by the inverter. The current control scheme
produces a very fast STATCOM, which can adjust its reactive output within a period of tens of
microseconds after a sudden change in reactive demand making it the preferred technique in most
controller designs [30].
The STATCOM under study in this thesis is +100 Mvar/-100 Mvar 48-pulse GTO STATCOM
used for regulating voltage on a three bus 500 kV transmission line. Figure 4.1 shows the electrical
power system setup under study that consists of three buses, three generator units, and two load
centers. The STATCOM is placed on bus B1 for voltage stabilization at that bus during voltage
disturbances in generation simulated by a programmable source.
Figure 4.1 Power System with STATCOM
The 48-pulse STATCOM is shown in Figure 4.2 uses four Diode Clamped 12-pulse three level
VSC discussed earlier in chapter 2. The four sets of three-phase voltages obtained at the output of
the four three-level VSCs are applied to the secondary windings of four phase shifting transformers
with -15°, -7.5°, 7.5°, +7.5° phase shifts respectively to eliminate low order harmonics. The
fundamental components of voltages obtained on the 500 kV side of the transformers are added in
phase by the serial connection of primary windings. The output voltage of each VSC depends on
the pulses provided by the STATCOM controller which will be discussed in details in the next
section.

48
Figure 4.2 48-pulse STATCOM
Apart from the various control loops fit into the STATCOM controller design, powerful complex
measurement and conversion functions are applied. One vital part of the controller is the Phase
Locked Loop (PLL) which tracks the frequency and phase of a sinusoidal three-phase signal by
using an internal frequency oscillator. The PLL control system adjusts the internal oscillator
frequency to keep the phase difference 0 compared to the line frequency. The PLL produces the
online values of the frequency and phase necessary for the proper operation of dq-transformation
that is applied to line voltages and currents and used in the control loops. In addition, it provides
its outputs to the pulses generation circuit for proper generation of pulses applied to the gates of
GTOs in the voltage source converters.
4.2 Reactive Current Control in STATCOM
The basic functionality of a STATCOM is to inject a commanded reactive power value into the
grid. Since the controller is designed in the rotating dq-frame coordinate system, reactive power
control means the control of the quadrature current component (𝐼𝑞). Figure 4.3 shows the reactive

49
current control block diagram of the STATCOM. The instantaneous three-phase set of line
voltages is measured and fed into the PLL circuit which is phase locked to the phase A of the line
voltage to calculate the instantaneous frequency and phase angle (θ). The PLL outputs are applied
within the dq-transform to convert the instantaneous three-phase set of measured currents through
the VSC into decomposed active or direct component (𝐼𝑑) and reactive or quadrature component
(𝐼𝑞). The quadrature component is compared with the desired reference value (𝐼𝑞∗) and the error
signal is passed to the PI controller, which produces a relative phase angle (α) of the compensating
voltage with respect to the line voltage. The PWM will generate the pulses according to line
voltage angle (θ) and the compensation angle (α) which are then fed to the gates of the respective
GTO modules.
Figure 4.3 Reactive Current Control Loop in STATCOM
4.3 Line Voltage Control in STATCOM
The reference quadrature component (𝐼𝑞∗) of the current through the VSC is defined to be either
positive if the STATCOM is supplying reactive power to the grid or negative if it is absorbing
reactive power from the grid. The DC link capacitor voltage is dynamically adjusted in relationship
with the compensating voltage. The reactive current control scheme described before shows the
implementation of the inner current control loop, which regulates the reactive current flow through
the VSC regardless of the line voltage. However, if it is desired to regulate the line voltage, an
outer voltage control loop must be implemented. The outer voltage control loop automatically
determines the reference reactive current for the inner current control loop, which, in turn,
regulates the line voltage [28].

50
Figure 4.4 shows the voltage control block diagram of the STATCOM. Here, the PLL outputs are
applied within the dq-transform to convert the instantaneous three-phase set of measured line
voltages into its active or direct component (𝑉𝑑) and reactive or quadrature component (𝑉𝑞). The
magnitude of the voltage (𝑉𝑑𝑞) is calculated and compared with a desired reference value (𝑉∗)
adjusted by the droop factor (𝐾𝑑𝑟𝑜𝑜𝑝) discussed below in details, and the error is passed to another
PI controller that produces the reference current (𝐼𝑞∗) for the inner current control loop.
Figure 4.4 Line Voltage Outer Control Loop in STATCOM
The outer STATCOM control loop senses bus voltage, compares it with a set value and processes
the error in a PI controller that sets the reactive reference I for the inner control loop. Although
direct control of line voltage is possible, it is not recommended due to its low sensitivity (small
voltage amplitude control band) with respect to current and reactive power, which have larger
control ranges around a given operating condition [30].
The droop factor (𝐾𝑑𝑟𝑜𝑜𝑝), also known as Regulation Slope, is defined as the allowable voltage
variation at the rated reactive current flow through the STATCOM. To explain the importance of
incorporating the droop control into the line voltage outer control loop, in many transmission
applications the STATCOM does not function as a perfect voltage regulator; rather, terminal
voltage is allowed to vary in proportion to the compensating current. The useful lifetime of
equipment is extended if this kind of droop regulation is used which allows automatic load sharing

51
between various local static compensators. As a result, the STATCOM is not used as a perfect
terminal voltage regulator.
A possible reactive current feedback on the voltage reference value can be used (see Figure 4.5)
to determine a droop characteristic in the voltage regulation. A signal proportional to the amplitude
of the compensating current (𝐾𝑑𝑟𝑜𝑜𝑝 ∗ 𝐼𝑞∗) is derived and added to the fixed reference (𝑉∗) with an
inverted polarity such that the capacitive current provides a negative effect on the actual reference
(𝑉∗), which conversely increases with inductive current. The regulation slope (𝐾𝑑𝑟𝑜𝑜𝑝) is defined
by
𝐾𝑑𝑟𝑜𝑜𝑝 = |∆𝑉𝐶𝑚𝑎𝑥𝐼𝐶𝑚𝑎𝑥
| = |∆𝑉𝐿𝑚𝑎𝑥𝐼𝐿𝑚𝑎𝑥
| (4.1)
where:
𝛥𝑉𝐶𝑚𝑎𝑥 = deviation of line voltage with capacitive STATCOM current from zero to the maximum.
𝛥𝑉𝐿𝑚𝑎𝑥 = deviation of line voltage with inductive STATCOM current from zero to the maximum.
𝐼𝐶𝑚𝑎𝑥 = maximum capacitive compensating current.
𝐼𝐿𝑚𝑎𝑥 = maximum inductive compensating current.
Figure 4.5 Droop Control in STATCOM [30]

52
4.4 STATCOM Model Simulation and Results
The electrical power system setup under study shown in Figure 4.1 is created using the Simscape
specialized power systems library in MATLAB Simulink software. All measurements are
discretized and STATCOM controller is completely designed in the z-domain so the model
simulation is run using a discrete type solver with fixed-step sampling time 𝑇𝑠 = 25𝑒−6 𝑠. To
demonstrate the dynamic behavior of STATCOM, the output voltage amplitude of the generator
at Bus 1 is varied through the simulation time. Initially, the output voltage amplitude is set at 1 pu
then reduced to 0.955 pu at 𝑇 = 0.1 𝑠. Later at 𝑇 = 0.2 𝑠, the output voltage amplitude is increased
to 1.045 pu and finally brought back to 1 pu at 𝑇 = 0.3 𝑠.
Without the STATCOM added to the power system, the programmed amplitude changes in the
generator at Bus 1would result in variations in voltages on all system buses. This is illustrated in
Figure 4.6 where the highest impact is seen on Bus 1 being the closest to the varying output
generator with lowest voltage of 0.9735 pu and highest value of 1.026 pu. The other two buses are
also affected with a smaller impact as they are supported by their nearby generator units.
Figure 4.6 Bus voltages without STATCOM

53
Now, when the STATCOM is connected to the power system on Bus 1, the STATCOM will react
to system voltage variations by supplying or absorbing reactive power when Bus 1 voltage deviates
from its set point of 1 pu. The voltage droop factor of the line voltage control loop is set to 0.03.
Therefore when the STATCOM operating point changes from fully capacitive (+100 MVAR) to
fully inductive (-100 MVAR) the STATCOM voltage varies between 0.97 pu and 1.03 pu.
Figure 4.7 shows the voltage variation at system buses with the existence of STATCOM
supporting the transmission line voltage. Compared to buses voltages without the STATCOM in
Figure 4.6, it is seen that the STATCOM control was able to reduce the voltage variation at all
busses, especially on Bus 1 where STATCOM is located. The STATCOM capacitive action at
time 𝑇 = 0.1 𝑠 increases the voltage at Bus 1 to 0.9785 pu and the STATCOM inductive action at
𝑇 = 0.2 𝑠 decreases the voltage at Bus 1 to 1.021 pu.
Figure 4.7 Bus voltages with STATCOM
Initially the programmable generator is set at 1 pu. As the reference set point at Bus 1 is set to 1
pu, the STATCOM is initially floating (zero current). The DC voltage is 19.3 kV. At 𝑇 = 0.1 𝑠,
voltage is suddenly decreased to 0.955 pu of nominal voltage. The SVC reacts by generating
reactive power (𝑄 = +70 𝑀𝑉𝐴𝑅) in order to keep voltage at 0.985 pu. The STATCOM settling
time is approximately 47 ms which is significantly fast. At this point the DC voltage has increased

54
to 20.4 kV. Then, at 𝑇 = 0.2 𝑠 the source voltage is increased to1.045 pu of its nominal value. The
STATCOM reacts by changing its operating point from capacitive to inductive in order to keep
voltage at 1.021 pu. At this point the STATCOM absorbs 72 MVAR and the DC voltage has been
lowered to 18.2 kV. Finally, at 𝑇 = 0.3 𝑠 the generator voltage in set back to its nominal value and
the STATCOM operating point comes back to zero MVAR. Reactive power injected to the
transmission line and the STATCOM capacitor DC voltage is plotted in Figure 4.8.
Figure 4.8 STATCOM reactive power and capacitor voltage
It is also important to observe on Figure 4.9 the STATCOM primary current that is changing from
capacitive to inductive in approximately one cycle at 𝑇 = 0.2 𝑠. Finally, on the same figure the
transient changes on the firing angle of STATCOM VSC1 phase A GTO (alpha) is plotted (all
other firing angles to GTOs and other VSC blocks are derived with the proper phase shift keeping
the same value). The 1° steady state value of alpha is the phase shift required to maintain a small
active power flow compensating transformer and converter losses.

55
Figure 4.9 STATCOM Current and Firing Angle

56
5 Fuzzy Logic Controller for STATCOM
In this chapter, some basic background about Fuzzy Logic (FL) is discussed in details and how it
paved the way to the operational principle of Fuzzy Logic Controller (FLC). In addition, the steps
for designing an FLC based STATCOM controller is described along with simulation results.
5.1 Fuzzy Logic Control Theory
Fuzzy logic was first introduced by Lofti A. Zadeh of the University of California at Berkeley in
1965. The use of fuzzy logic has increased during the 1970s as a result of Lotfi A. Zadeh later
works ‘A Rationale for Fuzzy Control’ and ‘Linguistic Approach’ (in 1972 and 1973 respectively),
in which the application of fuzzy set theory to uncertain systems and decision-making was
described [38]. This has motivated the pioneering work done by other scientists. The first trial of
fuzzy control was conducted by Mamdani who used FL to control a plant comprising a steam
engine and boiler combination in 1974. The work on derivation of fuzzy control rules (1983) was
carried out by Takagi and Sugeno. Since mid-eighties research has been directed towards
incorporating FL at the hardware level itself. FL applications have been growing ever since the
Japanese started using them in commercially available appliances. Nowadays, it is possible to find
fuzzy-based applications in almost every area. FL is used in robotics, automation, tracking
systems, process control, commercial products and many more utilization areas of automatic
control systems. FL is also used as a mathematical tool in areas such as function optimization,
filtering, curve fitting, etc [39].
5.1.1 Introduction to Fuzzy Logic
Fuzzy logic can be viewed as the superset of Boolean logic. In Boolean logic, each element either
belongs to or does not belong to a set. If an element is a member of a given set, Boolean logic will
return a ‘ONE’ (representing complete membership) else a ‘ZERO’ (representing non-
membership) will be returned. In fuzzy logic, on the other hand, an element is given a degree of
membership to a given fuzzy set. Fuzzy sets are the core elements of fuzzy logic theory and they
are represented by inclusion degrees in related categories. Similarly to crisp sets, fuzzy sets
represent the inclusion of objects in a categorized group. However, the boundaries of fuzzy sets

57
are not sharp as they are in crisp sets. The boundaries of fuzzy sets change gradually from 0 to 1
or from 1 to 0, showing how much the object belongs to the set [3].
Fuzzy sets are characterized by membership functions which are considered the bridge between
crisp and fuzzy data sets. Through membership functions, the crisp universe of muddy data is
partitioned into subsections and is represented by fuzzy linguistic variables. Membership functions
characterizing fuzzy sets and aggregations done using them are the basis of fuzzy sets and fuzzy
logic systems. Fuzzy sets are defined in the interval [0, 1]. Each fuzzy set is characterized by a
membership function that assigns membership values between 0 and 1 to each element. If an
element is not a member of the fuzzy set, then its membership value is defined as 0. A membership
value 1 is assigned as a full membership degree if an element is known to be completely included
in that set. The interval [0, 1] is used to assign a membership value between 0 and 1 for an element,
which is somehow included in the set with an inclusion degree that may be any number between
0 and 1.
Any FL system follows the architecture illustrated in Figure 5.1 which divides the FL system into
four fundamental parts: Fuzzifier, Rule Base, Inference Engine, and Defuzzifier.
Figure 5.1 Fuzzy Logic System Architecture
Fuzzifier: It is used to convert crisp numerical inputs into fuzzy sets according to the definition of
membership functions created for each input variable. Crisp inputs are basically the exact inputs
measured by sensors and passed into the control system for processing. Fuzzification converts
input data into suitable linguistic values which may be viewed as labels of fuzzy sets.

58
Rule Base: This represents the expert knowledge based set of linguistic statements. The rule base
includes the knowledge of the system on which fuzzy rules need to be applied and the attendant
control gains. It consists of a “data base” and a “rule base”:
The data base includes necessary definitions that are required to define linguistic control
rules and fuzzy data manipulation in an FLC.
The rule base characterizes the control goals and control policy of the domain experts by
means of a set of linguistic control rules.
Inference Engine: Fuzzy inference is the core of a fuzzy logic controller, its main function is to
simulate human decisions based on fuzzy concepts and of determine fuzzy control actions by
applying the rules of inference in fuzzy logic. In Inference engine, fuzzy ‘IF-THEN’ rules from
fuzzy rule base is used to map fuzzy input sets to fuzzy output sets.
Defuzzifier: It is used to convert the fuzzy sets obtained by inference engine into a crisp value
according to the definition of membership functions created for each output variable. There are
several defuzzification methods available and the best suited one is used with a specific expert
system to reduce the error.
5.1.2 Fuzzy Sets and Membership Functions
A fuzzy set is represented by a membership or a characteristic function that shows the inclusion
degrees of the elements in that set. Fuzzy membership functions are defined either as continuous
or discrete functions. For example, a fuzzy set A can be represented by its membership function
as
𝐴 = {(𝑥; 𝜇_𝐴 (𝑥)); 𝑠𝑢𝑐ℎ 𝑡ℎ𝑎𝑡 𝑥 ∈ 𝑋} (5.1)
where 𝜇𝐴(𝑥) is the membership value of the element x in fuzzy subset A. The crisp variable x is
an element of the universe X. Various geometrical and pictorial shapes can be used to represent
membership functions of fuzzy sets. However, known mathematical functions are preferred to be
used as membership functions due to their simplicity. The most used membership function types
are triangular, trapezoid, bell, sinusoid, Gaussian, Cauchy and sigmoid. In order to make the

59
operations on fuzzy sets easier, the membership functions are formulized in terms of their
parameters, which include information about fuzziness and location range in the universe of
discourse. The flexibility of adjusting parameters makes membership functions adjustable, too.
Due to linearity in their structure, triangular and trapezoid type membership functions are preferred
over the others [38].
Triangular membership functions are made of lines as shown in Figure 5.2 and realized by the
combination of line equations given in (5.2):
𝜇𝐴(𝑥) =
{
|𝑥| − |𝑥1|
|𝑥2| − |𝑥1|, 𝑓𝑜𝑟 𝑥1 ≤ 𝑥 ≤ 𝑥2
|𝑥3| − |𝑥|
|𝑥3| − |𝑥2|, 𝑓𝑜𝑟 𝑥2 ≤ 𝑥 ≤ 𝑥3
0 , 𝑜𝑡ℎ𝑒𝑟𝑤𝑖𝑠𝑒
(5.2)
Figure 5.2 Triangular membership function
where the parameters 𝑥1, 𝑥2, and 𝑥3 represent the address of the membership function 𝐴 and show
where it is located in the corresponding universe. It is sufficient to change the values of parameters
in order to define a new membership function with a similar shape or change the location in the
universe of discourse. Due to their linear structures, triangular fuzzy subsets are easy to model and
easy to simulate. The sharp peak enables them to react to any changes even if they are very small.
Therefore, sharp peak makes triangle membership functions sensitive to the changes in the crisp
variable 𝑥.

60
The trapezoidal membership functions differ from the triangular types with its crisp region on the
top. As shown in Figure 5.3, trapezoidal membership functions have a flat top that is not fuzzy
while triangular membership functions have a sharp peak. A parameterized general view of
trapezoid fuzzy membership function is given as
𝜇𝐴(𝑥) =
{
|𝑥| − |𝑥1|
|𝑥2| − |𝑥1|, 𝑥1 ≤ 𝑥 ≤ 𝑥2
1 , 𝑥2 ≤ 𝑥 ≤ 𝑥3|𝑥4| − |𝑥|
|𝑥4| − |𝑥3|, 𝑥3 ≤ 𝑥 ≤ 𝑥4
0 , 𝑜𝑡ℎ𝑒𝑟𝑤𝑖𝑠𝑒
(5.3)
Figure 5.3 Trapezoid membership function
where the parameters 𝑥1, 𝑥2, 𝑥3, and 𝑥4 represent the address of the membership function 𝐴 and
show us where it is located in the corresponding universe. It is sufficient to change the values of
parameters in order to define a new membership function with a similar shape or change the
location in the universe of discourse. Due to their linear structures, trapezoid fuzzy subsets are also
easy to model and easy to simulate. The flat top gives a crisp behavior to trapezoid membership
functions so that the sensitivity of the membership function to the changes in the crisp variable is
reduced. This property makes trapezoid membership functions ideal for representing the edges of
crisp input universe.

61
5.1.3 Fuzzy Logic Processing
Processing of fuzzy sets within the FL system is based on the theory of approximate reasoning
which was introduced by Zadeh in 1979 as one of the application areas of fuzzy implication to
reach a decision from fuzzy data and information. Approximate reasoning applies aggregation
operations such as intersection, union and complement to implications, which are called rules in
reasoning, to widen the range of approximate reasoning. Zadeh has introduced the concept of
approximate reasoning with inference rules that enables the use of verbal expressions together with
the implications. Zadeh’s inference rules of approximate reasoning can be used to generate
different and meaningful inference engines for specific applications [38]. Among others, the
Compositional Rule of Inference (CRI) is the most widely used inference engine method in FL
control systems. In CRI, the fuzzy relation 𝑅 is defined as a relation between two or more fuzzy
sets as
𝑅 = 𝐴 × 𝐵 = ∫𝜇𝐴(𝑥) ∩ 𝜇𝐵(𝑦)
𝑥, 𝑦𝑋×𝑌
(5.4)
𝜇𝑅(𝑥, 𝑦) = min (𝜇𝐴(𝑥), 𝜇𝐵(𝑦)) (5.5)
The output fuzzy set 𝐵 is found from the known membership matrix 𝜇𝑅(𝑥, 𝑦) of relation 𝑅 and the
membership function of the input fuzzy set 𝐴 (𝜇𝐴(𝑥) of 𝐴 used to generate 𝐴) as in (5.6):
𝜇𝐵(𝑦) = 𝜇𝐴°𝑅 = 𝑚𝑎𝑥 (min((𝜇𝐴(𝑥), 𝜇𝑅(𝑥, 𝑦)) ) (5.6)
Because of the form in (5.6), CRI is also called max–min composition rule of inference. This rule
is used to extract the previously stored data from knowledge base. Since the relation 𝑅(𝑋, 𝑌) =
𝐴 × 𝐵 includes data from the universe of 𝑋 as the fuzzy subset 𝐴 and from the universe of 𝑌 as
the fuzzy subset 𝐵, then a fuzzy subset 𝐵′ can be extracted from the relation 𝑅 as long as 𝑅 and 𝐴
are known. The fuzzy inference system used in fuzzy logic control systems based on the CRI is
written as:

62
Rule Base
Data
:
:
If 𝑥 is 𝐴 then 𝑦 is 𝐵
𝑥 is 𝐴′
Conclusion : 𝑦 is 𝐵′
Fuzzy inference systems used for fuzzy reasoning have fuzzy data as input layer, an ‘IF-THEN’
rule processing layer, and a fuzzy conclusion layer. The process performed under these names is
very similar and all of them use the fuzzy rule-based reasoning algorithms. Since the inference
system is a series of fuzzy processes, it is called Fuzzy Processor (FP). The three parts of any FP
are shown in Figure 5.4 [3].
Figure 5.4 Fuzzy processing stages
In the FP, the knowledge, information or expert’s ideas are stored in a rule base system, which has
a processing structure in the form of ‘IF-THEN’. The input data may be fuzzy or crisp. If data is
uncertain or unclear, then it can be used as a fuzzy input data. The crisp data must be fuzzified first
before being used in the rule base. The rule processing unit yields an output for each rule. Then
these individual rule outputs are combined together in reasoning unit to yield a single fuzzy output.
The reasoning unit uses fuzzy aggregation operators such as union and intersection.

63
Typically, fuzzy systems are Multiple-input–multiple-rule inference systems. In a multiple rule
inference system, there will be one output from each rule yielding multiple outputs. All outputs
from the rules may or may not be defined in the same universe. The number of the outputs is
determined by the inclusion of input data sets in the fuzzy sets used in the fuzzy rules. In order to
generate an output, at least one of the input data sets should have nonzero membership degrees in
one of the sets in the rule. Otherwise, no output is generated. Therefore, all rules in a multiple rule
base system may or may not be active. Some rules may be active while some are not. A multiple-
input–multiple-rule inference system is expressed as:
Rule Base
Data
:
:
If 𝑥 is 𝐴1 and 𝑦 is 𝐵1 then 𝑧 is 𝐶1
If 𝑥 is 𝐴2 and 𝑦 is 𝐵2 then 𝑧 is 𝐶2
. . .
If 𝑥 is 𝐴𝑛 and 𝑦 is 𝐵𝑛 then 𝑧 is 𝐶𝑛
𝑥 is 𝐴′ and 𝑦 is 𝐵′
Conclusion : 𝑧 is 𝐶′
where 𝐶1, 𝐶2, ..., 𝐶𝑛 are the outputs from each individual rules and 𝐶′ is the final effect of all the
rules together. The rules are all standing independently from each other. In order to obtain a final
single-effective output, the rules should be combined. The combination of the rules is done using
either union or intersection operators.
Different Fuzzy Reasoning Algorithms (FRA) have been developed over time to implement the
aforementioned FP task. The following are three of the most known fuzzy reasoning algorithms:
Mamdani fuzzy reasoning.
Sugeno fuzzy reasoning.
Tsukamoto fuzzy reasoning.

64
Input and output data in Mamdani algorithm are not fuzzy but crisp. Due to this property, the
Mamdani reasoning algorithm is very suitable to be used in fuzzy control systems where in
industrial control, the input and output data are usually measurable and used in the process. The
system output is measured and fed back as an input to generate a new control signal by checking
its value and whether an adjustment is required.
The inference mechanism used by Mamdani is known as Mamdani fuzzy reasoning. This
reasoning algorithm, shown in Figure 5.5, uses the max–min composition rule of inference
explained earlier as the compositional rule of inference [38].
Figure 5.5 Mamdani fuzzy reasoning algorithm
The crisp inputs 𝑥 ∈ 𝑋 and 𝑦 ∈ 𝑌 in Mamdani fuzzy reasoning are mapped from crisp input
universes 𝑋 and 𝑌 onto fuzzy input universe in terms of fuzzy membership values 𝑚𝑖(𝑥) and
𝑚𝑗(𝑦), where 𝑖 and 𝑗 are the number of fuzzy sets in which 𝑥 and 𝑦 have nonzero membership
degrees. After the rule processing in rule base, the fuzzy outputs from each rule are obtained and
combined in the reasoning stage of output universe 𝑍. The crisp output is then obtained by applying
defuzzification, which is usually an averaging math function. Defuzzification is explained later on
this chapter.
After the fuzzification, each rule results in a membership value, which is obtained as the minimum
of the membership values coming from the input spaces. The resultant membership value from
each rule is a weighting factor used to determine effectiveness of the rule on the output space. The

65
membership values obtained from different input universes for each rule are used to obtain the
weighting factor of that rule as
𝑤𝑅𝑖(𝑧) = min (𝜇𝐴𝑗(𝑥), 𝜇𝐵𝑘(𝑦)) (5.7)
where 𝑅𝑖 stands for the ith rule, 𝐴𝑗 represents the jth fuzzy set in the universe of 𝑋, and 𝐵𝑘 is the kth
fuzzy set in the universe of 𝑌. Obviously, all rules having zero membership values in any input
will yield a zero weighing factor.
After the effect of each rule is determined by the weighting factor using (5.7), the membership
functions representing the fuzzy output universe for each active rule are obtained using ((5.8):
𝜇𝑅𝑖(𝑧) = min (𝑤𝑅𝑖 , 𝜇𝐶𝑔(𝑧)) (5.8)
where 𝐶𝑔 represents the gth fuzzy set in the universe of output 𝑍 set as a result in the ith rule. The
final conclusion from individual rules is the union (or maximum) of the resultant membership
functions from all active rules and can be written as:
𝜇𝑅𝑇(𝑧) = ⋃ 𝜇𝑅𝑖(𝑧)
𝑖=1,𝑁
(5.9)
where N is the total number of the rules.
As mentioned before, the FRA results in a fuzzy output set (𝜇𝑅𝑇(𝑧)) which needs to be defuzzified
in order to convert the fuzzy conclusion into a crisp value. Defuzzification may be explained as
the extraction of a single crisp value from an area that is representing the fuzzy conclusion of a
fuzzy reasoning process. The most known defuzzification methods are listed below.
Lower maximum.
Upper maximum.
Mean of maxima.
Equal areas.

66
Center of areas (COA).
Center of gravity.
The COA method is the most often used method in fuzzy logic control applications. In this method,
the crisp output is the point that corresponds to the COA that are obtained as the union of the areas
from individual rules. The defuzzification is done using the formula given in (5.10):
𝑧𝐶𝑂𝐴 =∑ 𝑤𝑅𝑖(𝑧) ∙ 𝑧𝑖𝑛𝑖=1
∑ 𝑤𝑅𝑖𝑛𝑖=1
(5.10)
where 𝑛 is the number of the active rules, 𝑤𝑅𝑖(𝑧) is the weighting factor from the ith rule, and 𝑧𝑖
is the crisp value defined in the output universe and corresponds to the center of the core set of the
output fuzzy set.
5.1.4 Control with Fuzzy Logic Systems
Control systems are one of the first application areas where FL was applied. Fuzzy logic controllers
(FLCs) based on fuzzy set theory are used to represent the experience and knowledge of a human
operator in terms of linguistic variables called fuzzy rules. Since an experienced human operator
adjusts the system inputs to get a desired output by just looking at the system output without any
knowledge of the system’s dynamics and interior parameter variations, the implementation of
linguistic fuzzy rules based on the procedures done by human operators does not also require a
mathematical model of the system. Therefore, an FLC becomes nonlinear and adaptive in nature
having a robust performance under parameter variations with the ability to get desired control
actions for complex, uncertain and nonlinear systems without the requirement of their
mathematical models and parameter estimation [39].
Traditionally, analytical approaches have been used over the years in control systems based on the
mathematical modelling of the physical system under study. In real life however, nothing is linear
and mathematical models are often linearized using proper approximation methods. However, any
linearization process reduces the accuracy of the system model, leading to operational errors with
PID controllers which are designed based on mathematical models. These errors due to
linearization does not affect the performance of FL controllers since they do not need the

67
mathematical model to generate the expert’s thoughts. The use of FL increases the system
performance and accuracy while simplifying and reducing the cost of the system. Selecting rules
closer to reality enables the FL controllers to deal with nonlinear systems better than conventional
linearized approaches. The nonlinearity of the systems is compensated through rules, membership
functions and decision making processing in fuzzy systems.
The architecture of an FLC is very similar to that of a fuzzy reasoning algorithm. As it was in the
Mamdani fuzzy reasoning architecture, an FLC also consists of four stages: Fuzzifier, Rule Base,
Inference Engine, and Defuzzifier, as shown in Figure 5.6 [38].
Figure 5.6 FLC architecture in control systems
The input and output signals of an FLC are crisp quantities, which require fuzzification and
defuzzification processes. Therefore, inputs are fuzzified for each sampling time then they are used
in the rule base system to yield the fuzzy consequences, which are combined as a fuzzy reasoning
and then converted to crisp decisions by the process called defuzzification. To design an FLC
based system, the following steps must be implemented:
1. Determine the values of input and output variables.
2. Obtain deep system control knowledge through data analysis.
3. Assign membership functions for input and output fuzzy variables.
4. Determine fuzzy rules.

68
5. Tune membership functions and rules by varying the scale of membership functions and
rules.
6. Repeat steps 1 to 5 until the desired performance obtained.
5.2 FLC Based STATCOM
This section illustrates the detailed design procedure for the FLC based STATCOM and the
simulation results obtained upon integrating the FLC based STATCOM in transmission lines with
voltage disturbances.
5.2.1 Fuzzy Logic Controller Structure
Similar to the approach followed in classical PI controlled STATCOM, the FLC based STATCOM
is based on measurements and control in the rotating d-q frame. Because of the same reasons
discussed in chapter 4, the FLC will be based on the “current control scheme” in which the
controller will always try to track a commanded quadrature current (𝐼𝑞) by controlling the
switching functions. This is done through the variation of the firing angle (𝛼).
The structure of the FLC for reactive current control is illustrated in Figure 5.7. The error between
the reference reactive current (𝐼𝑞∗) and the measured reactive current (𝐼𝑞) is computed in each
sample and fed into the FL control block. In addition, the rate of change of the reactive current
error is computed and fed to the FL control block as another input. Adding the error rate of change
significantly improves the FLC performance since its value and sign is an indication of the error
direction and speed and thus minimizes response time and overshoot. Since the fuzzy processor is
software based and operates digitally, the crisp inputs 𝑒(𝑘) and ∆𝑒(𝑘) are sampled data.
Consequently, so is the output ∆𝛼(𝑘). The fuzzy processor uses the error 𝑒(𝑘) and its change
∆𝑒(𝑘) as two crisp inputs and converts them to fuzzy membership values in the fuzzifier. The rule
base system then activates the related rules to yield a fuzzy consequent from each active rule. The
reasoning section of the fuzzy processor combines the individual consequents to a general fuzzy
conclusion of the process. Finally, the defuzzifier converts this general fuzzy conclusion to the
crisp output ∆𝛼(𝑘) as the final decision for the kth sample.

69
The FLC is designed to act as an integral controller, such that the final crisp output of the FLC is
the change ∆𝛼(𝑘), which is added to the previous value 𝛼(𝑘 – 1) of the control signal 𝛼(𝑘) to
yield the current output, which is the updated control signal 𝛼(𝑘). This technique is used because
the control signal for STATCOM without voltage variation is not actually zero due to the power
withdrawn from the grid to supply the internal reactances of the coupling transformers. The fuzzy
processor uses the Mamdani fuzzy reasoning method from the inputs 𝑒(𝑘) and ∆𝑒(𝑘) to the output
∆𝛼(𝑘). Depending on the magnitude of the control signal 𝛼(𝑘), the VSC generates the required
voltage at the output side of STATCOM that will withdraw the commanded reactive current. The
decision given by the fuzzy processor is expressed in terms of ∆𝛼(𝑘) either to increase or decrease
the control signal, or do nothing if the system output 𝐼𝑞 is tracking the reference 𝐼𝑞∗ within
acceptable limits. In order to get proper amount of increments and decrements, the fuzzy processor
should have correct and suitable rules in the rule base. Therefore, the performance of the FLC
depends on the rules, which represent the expert’s knowledge to operate the system. It is clear that
the construction of the rule base is very important for the FLC because it is the modeling of
knowledge and thoughts of the human operator.
Figure 5.7 FLC for reactive current control
The reactive current control scheme described before shows the implementation of the inner
current control loop, which regulates the reactive current flow through the VSC regardless of the
line voltage. However, STACOM is used to regulate the voltage at the PCC, and so an outer voltage
control mechanism must be implemented. Again, we rely on expert’s knowledge to design an outer
FLC that will automatically determine the reference reactive current for the inner current control

70
loop, which, in turn, regulates the line voltage. The outer voltage FLC is shown in Figure 5.8 where
the PLL outputs are applied within the dq-transform to convert the instantaneous three-phase set
of measured line voltages into its active or direct component (𝑉𝑑) and reactive or quadrature
component (𝑉𝑞). The magnitude of the voltage (𝑉𝑑𝑞) is calculated and fed to the fuzzy controller.
The fuzzy controller maps the line voltage variations into a commanded reactive current that is
used as a reference for the inner reactive current control FLC. Details of membership functions
and the rules used are further explained in later sections.
Figure 5.8 FLC for voltage control
5.2.2 FLC Design in MATLAB and Choice of Membership Functions
The FLC based STATCOM is modelled in MATLAB Simulink using the Simscpae specialized
power systems library. As for the fuzzy controller, it is designed using the Fuzzy Logic Designer
toolbox in MATLAB in which fuzzy inference systems for modeling complex system behaviors
can be designed and tested. The FLCs designed for STATCOM (both for voltage control and
reactive current control) are based on Mamdani fuzzy inference system type which uses the max-
min aggregation method and relies on the centroid defuzzification approach. The interior design
of the fuzzy controllers is illustrated in Figure 5.9 and Figure 5.10, respectively.
Figure 5.9 Reactive current FLC in MATLAB

71
Figure 5.10 Voltage control FLC in MATLAB
As discussed earlier, performance of FLC based systems highly depends on the knowledge of the
system to be controlled. A deep analysis and experimentation with STATCOM is done in order to
extract the optimal selection of membership functions in terms of range and how they should be
partitioned so fuzzy inference algorithm can yield the best results. For the reactive current control
FLC, the first input to the FLC is the reactive current error signal (e). For perfect tracking, the
universe of this signal is chosen to be in a very narrow range [-0.1, 0.1]. A mix of triangular and
trapezoidal membership functions are used to partition the error universe into 7 fuzzy sets as shown
in Figure 5.11. The different fuzzy sets are labeled with the following linguistic variables, Negative
Big (NB), Negative Medium (NM), Negative Small (NS), Zero (Z), Positive Small (PS), Positive
Medium (PM), and Positive Big (PB).
Figure 5.11 Reactive current error membership functions
The second input to the reactive current control FLC is the rate of change of error (ec). After
analyzing the model simulation, it is chosen that the universe of this signal should be in the range
of [-0.01, 0.01]. Similar to the error input, a mix of triangular and trapezoidal membership
functions are used to split the error rate of change universe into 7 fuzzy sets labeled with 7

72
linguistic variables (NB, NM, NS, Z, PS, PM, and PB). The membership functions of the error rate
of change is depicted in Figure 5.12 showing the boundaries of each fuzzy set.
Figure 5.12 Error rate of change membership functions
As for the output variable (Δα), the universe range is selected so increments or decrements in α are
neither so small as to slow down the response nor too large causing unnecessary overshooting
oscillations in α. The universe range is selected to be [-0.1, 0.1] and a mix of triangular and
trapezoidal membership functions is used to split the effective change in α universe into 7 fuzzy
sets labeled with 7 linguistic variables (NB, NM, NS, Z, PS, PM, and PB). Δα membership
functions are illustrated in Figure 5.13.
Figure 5.13 Control signal variation membership functions
Regarding the voltage control FLC, the deep theoretical knowledge of the STATCOM V-I
characteristics is utilized to set a proper universe range and membership functions for the FLC
input and output. Recalling the STATCOM V-I response shown in Figure 5.14, STATCOM should
deliver zero reactive current if the line voltage is at 1pu, and delivers variable capacitive or reactive

73
current if the line voltage is lower or higher than the set point, respectively. The amount of reactive
current delivered by STATCOM depends on the voltage variation in line voltage within the
acceptable voltage variation set by the operator. It is chosen here that line voltage variation limits
are [0.95, 1.05] which is the universe range of the Vmeas input to FLC.
Figure 5.14 STATCOM V-I characterestics
The universe of Vmeas is divided into 9 fuzzy sets using a mix of triangular and trapezoidal
membership functions to achieve the best possible mapping onto the reference reactive power
output of the FLC. Since the STATCOM V-I characteristics requires a linear relationship between
voltage and reactive current delivered, the membership functions are equally and uniformly
distributed within the input universe as shown in Figure 5.15. The fuzzy sets are given the linguistic
variables Negative Very Big (NVB), NB, NM, NS, Z, PS, PM, PB, and Positive Very Big (PVB).
Figure 5.15 Measured line voltage membership functions

74
On the other hand, the universe of the reference reactive current output should obviously be in the
range [-1, 1] in pu. This is because the STATCOM supplies full capacitive reactive power when
the current is at 1pu, and absorbs full reactive power when the reactive current is at -1 pu. To meet
the linear STATCOM V-I relationship within the variable operating range, 9 fuzzy sets with their
corresponding membership functions are created labeled with the linguistic variables NVB, NB,
NM, NS, Z, PS, PM, PB, and PVB. Membership functions for the reference reactive current output
of the FLC is shown in Figure 5.16.
Figure 5.16 Reference reactive current membership functions
5.2.3 Mapping Expert Knowledge to Fuzzy Rules
As discussed earlier, there are two inputs to the reactive current FLC. One is the control error 𝑒(𝑘),
which is the difference between the reference reactive current 𝐼𝑞∗(𝑘) and the measured reactive
current 𝐼𝑞(𝑘), the other one is the rate of change in the control error ∆𝑒(𝑘). These two inputs
defined in (5.11) and (5.12), are first fuzzified and converted to fuzzy membership values that are
used in the rule base in order to execute the related rules so that an output can be generated.
𝑒(𝑘) = 𝐼𝑞∗(𝑘) − 𝐼𝑞(𝑘) (5.11)
∆𝑒(𝑘) = 𝑒(𝑘) − 𝑒(𝑘 − 1) (5.12)
The fuzzy rule base, which may also be called as the fuzzy decision table, is the engine mapping
the two crisp inputs, 𝑒(𝑘) and ∆𝑒(𝑘) to the fuzzy output space defined on the universe of ∆𝛼(𝑘).
In order to intuitively generate the set of rules for the FIS, the system response is analyzed

75
thoroughly first. The time response of the control error 𝑒(𝑘) for a step input can be represented
by the generalized step response error of a second-order system as shown in Figure 5.17. This error
signal may have a damped or an oscillatory response with a decaying exponential component. The
latter one is considered for constructing the rule table since it includes overshoot effects, leading
the rule base to represent more generalized cases. The oscillatory error response is divided into 10
regions as shown in Figure 5.17 and each region is looked at more closely with the eye of a system
operator.
Figure 5.17 Generalized step response of a seconf order system
At region I: The error is positive and its change is negative, meaning that the error is decreasing
toward zero. Therefore, the control output 𝛼(𝑘) should be decreased so that the decrement of error
toward zero become faster. In order to decrease the value of 𝛼(𝑘), ∆𝑢(𝑘) should be negative.
At region II: The error is zero, but its change is negative. This means that the control signal 𝛼(𝑘)
is lower than the required value and must be increased. Otherwise, the error will be negative and
continue to get away from zero. Therefore, control output 𝛼(𝑘) should be increased by generating
a positive ∆𝛼(𝑘).

76
At region III: The error is negative and continues to be more negative. This means that the
overshoot is increasing. Something must be done to increase the control signal 𝛼(𝑘) so that the
overshoot and error will be smaller or brought to zero. Therefore, ∆𝛼(𝑘) must have a positive sign.
At region IV: The error is still negative, but getting toward zero because of positive ∆𝑒(𝑘). The
overshoot is also decreasing. In order to make this decrement faster, the control signal 𝛼(𝑘) should
be increased again. Therefore, ∆𝛼(𝑘) is kept positive.
At region V: The error is zero, but its change is positive. This means that the control signal 𝛼(𝑘)
is higher than required and must be decreased. Otherwise, the error will be positive and keeps
increasing in positive direction. Therefore, control output 𝛼(𝑘) should be decreased by generating
a negative ∆𝛼(𝑘).
At region VI: The error is positive and increases in positive direction. This means that the output
𝐼𝑞(𝑘) is under the reference 𝐼𝑞∗(𝑘) and needs to be increased. The control signal 𝛼(𝑘) must be
decreased to increase 𝐼𝑞(𝑘) so that error will be smaller or brought to zero. Therefore, ∆𝛼(𝑘) must
be positive.
At region VII: This is a repeat of region I with smaller magnitudes so governing rules should be
similar.
At region VIII: The error is positive and constant since there is no change. This means that the
oscillations are over or very small. However, the output is smaller than the reference and control
signal 𝛼(𝑘) needs to be decreased. Therefore, a negative value for ∆𝛼(𝑘) should be assigned.
At region IX: The error is negative and constant since there is no change. This means that the
oscillations are over or very small. However, the output is greater than the reference and control
signal 𝛼(𝑘) needs to be increased. Therefore, a positive value for ∆𝛼(𝑘) should be assigned to
decrease the error.
At region X: The error is zero and not changing anymore. Therefore, ∆𝛼(𝑘) is set to zero since no
change is required for the control signal 𝛼(𝑘).

77
So far, each one of 𝑒(𝑘), ∆𝑒(𝑘) and ∆𝛼(𝑘) has three different options for the signs to be assigned.
They are either positive or negative if not zero. Therefore, the universes of error, change in error
and change in control signal can be partitioned into three categories as Negative (N), Zero (Z), and
Positive (P), initially. Keeping in mind these three options, an initial rule decision table with nine
rules can be formed as shown in Table 5.1.
Table 5.1 Initial nine-rule table
𝒆(𝒌)
∆𝒆(𝒌)
N Z P
N P P P
Z P Z N
P N N N
A simple nine-rule fuzzy decision table may be sufficient for some simple applications. However,
in our application more precision is required. To quantify how much positive or negative the error
and its rate of change is, the input spaces are partitioned into more than three regions each. As
described in the previous section, it is chosen to divide the positive or negative ranges of the inputs
and the output into 3 sub regions as small, medium, and big. In addition to the subset zero (Z),
there will be seven fuzzy subsets defined in the universes of 𝑒(𝑘), ∆𝑒(𝑘), and ∆𝛼(𝑘). Therefore,
a 7 × 7 decision space is obtained at the output as given in Table 5.2.
Table 5.2 Initial 49-rule table
𝒆(𝒌)
∆𝒆(𝒌)
NB NM NS Z PS PM PB
NB PB PB PB PB PB PB PB
NM PM PM PM PM PM PM PM
NS PS PS PS PS PS PS PS

78
𝒆(𝒌)
∆𝒆(𝒌)
NB NM NS Z PS PM PB
Z PB PM PS Z NS NM NB
PS NS NS NS NS NS NS NS
PM NM NM NM NM NM NM NM
PB NB NB NB NB NB NB NB
The initial rules obtained in Table 5.2 needs to be adapted to fit the problem or application in hand
through experimentation and trial and error. One important observation was that while the fuzzy
subset zero stands as a separator between negative and positive fuzzy subsets in the universes of
𝑒(𝑘) and ∆𝑒(𝑘), the negative and positive fuzzy subsets are mixed and bordering each other
without a zero separator between them. Therefore, the initial fuzzy rule table given in Table 5.2
should be modified so that a zero fuzzy subset separate positives and negatives. The adapted set
of rules are given in Table 5.3 highlighting the changed rules.
Table 5.3 Initial 49-rule table with zero diagonal
𝒆(𝒌)
∆𝒆(𝒌)
NB NM NS Z PS PM PB
NB PB PB PB PB PB PB Z
NM PM PM PM PM PM Z PM
NS PS PS PS PS Z PS PS
Z PB PM PS Z NS NM NB
PS NS NS Z NS NS NS NS
PM NM Z NM NM NM NM NM
PB Z NB NB NB NB NB NB

79
Now, the zero diagonal in Table 5.3 is separating positives and negatives from each other.
However, it is observed that 4 fuzzy subsets, PS at line 5 column 1 and 2, PM at line 6 column 1,
NS at line3 columns 6 and 7, and NM at line 2 column 7, are breaking this rule. Therefore, these
four fuzzy subsets should be changed to proper fuzzy subsets. Since they are next to zero diagonal,
just a sign change corrects the rules. In addition, Mac Vicar-Whelan has showed the importance
of having a symmetrical fuzzy rule table for man–machine interaction in [40]. The symmetrical
fuzzy rule table can be used as a generalized rule table that works for many applications with small
changes. Since the universes of 𝑒(𝑘) and ∆𝑒(𝑘) are partitioned into fuzzy subsets in the order of
NB, NM, NS, Z, PS, PM, and PB, the same order in the output space ∆𝛼(𝑘) is used and the fuzzy
subsets are adapted into the same order from lower left corner to upper-right corner as shown in
Table 5.4. Table 5.4 is the final rule table programmed into the reactive current FLC using the
Fuzzy Logic Designer App in MATLAB.
Table 5.4 Finalized 49-rule symmetrical table
𝒆(𝒌)
∆𝒆(𝒌)
NB NM NS Z PS PM PB
NB PB PB PM PM PS PS Z
NM PB PM PM PS PS Z NS
NS PM PM PS PS Z NS NS
Z PM PS PS Z NS NS NM
PS PS PS Z NS NS NM NM
PM PS Z NS NS NM NM NB
PB Z NS NS NM NM NB NB
As for the FLC designed for voltage control, creating the set of rules is completely based on the
theoretical knowledge of the STATCOM V-I characteristics. As explained in the previous section,
the measured voltage input and the reference reactive current output universes are partitioned into

80
9 fuzzy sets. The set of rules defined for the voltage control FLC is a direct mapping between the
input and output universes and it is illustrated in Table 5.5.
Table 5.5 Voltage control direct 9-rules mapping table
𝑽𝒎𝒆𝒂𝒔 NVB NB NM NS Z PS PM PB PVB
𝑰𝒒∗ NVB NB NB NB Z PS PM PB PVB
5.2.4 Simulation Results
Using the same electrical power system setup shown in Figure 4.1 which is created using the
Simscape specialized power systems library in MATLAB Simulink software, the response of the
FLC based STATCOM is demonstrated. The output voltage amplitude of the generator at Bus 1 is
varied through the simulation time. Initially, the output voltage amplitude is set at 1 pu then
reduced to 0.955 pu at 𝑇 = 0.1 𝑠. Later at 𝑇 = 0.2 𝑠, the output voltage amplitude is increased to
1.045 pu and finally brought back to 1 pu at 𝑇 = 0.3 𝑠.
The simulation results without the STATCOM were depicted in Figure 4.6 shown in chapter 4
section 4. Figure 5.18 shows the voltage variation at system buses with the existence of the FLC
based STATCOM supporting the transmission line voltage. Compared to buses voltages without
the STATCOM in Figure 4.6, it is observed that the STATCOM control was able to reduce the
voltage variation at all busses, especially on Bus 1 where STATCOM is located. The STATCOM
capacitive action at time 𝑇 = 0.1 𝑠 increases the voltage at Bus 1 to nearly 0.98 pu and the
STATCOM inductive action at 𝑇 = 0.2 𝑠 decreases the voltage at Bus 1 to 1.019 pu very quickly.
To illustrate the performance of the FLC design, the measured line voltage and the resultant
reference reactive current are plotted in Figure 5.19. It is clearly shown that the FLC directly map
the voltage difference into a reference reactive current without any time delay according to the
rules defined. Since the line voltage during disturbance at 𝑇 = 0.1 𝑠 is slightly less than 0.98 pu,
the corresponding reference reactive current output is almost 0.92 pu as expected according to the
programmed membership functions boundaries and set of rules.

81
Figure 5.18 Bus voltages with FLC based STATCOM
Figure 5.19 Line voltage vs Reference reactive current in FLC based STATCOM
Finally, to showcase the accuracy of the reactive current control FLC in tracking the reference
reactive current, the reference and actual reactive current are plotted simultaneously in Figure 5.20.

82
It is evidently shown that the FLC with its programmed membership functions and finely tuned
set of rules acts almost as a perfectly to track the reference reactive current.
Figure 5.20 Actual and reference reactive currents in FLC based STATCOM

83
6 Adaptive Fuzzy PI Controller for STATCOM
The classical PI controllers are very common in industrial control tasks due to their simplicity and
versatile use. However, the performance of PI controllers is highly dependent on the tuning of
proportional gain and integration time which becomes very complex in the case of cascaded PI
controllers. In addition, fixed proportional gain and integration time factors for PI controllers are
often chosen to compromise between fast response, small oscillations, and low steady state error.
Therefore, it would be beneficial to increase or decrease the PI controller parameters throughout
the controller response time to achieve the best possible response behavior.
In this chapter, another FL based approach is studied and applied to STATCOM in which the
classical PI control scheme is revisited and transformed into an Adaptive Fuzzy PI controller in
which an FLC has a supervisory control over the PI controller proportional gain and integration
time. In the following sections, the structure of the adaptive controller is explained and the
systematic design approach of membership functions and fuzzy rules is illustrated. Finally,
simulation results for this control strategy is shown.
6.1 Adaptive Fuzzy PI Controller Structure
The adaptive fuzzy PI controller for STATCOM is built on top of the classical PI STATCOM
control scheme discussed in chapter 4. In this control strategy, two PI controllers are used; one for
reactive current control (called inner loop) and another for line voltage control (called outer loop).
In order to improve the transient stability of the overall control system, two fuzzy-PI controllers
have been designed to separately auto-tune the parameters of the reactive current and line voltage
PI controllers.
The structure of the FL adaptive PI controller for reactive current control is illustrated in Figure 6.1.
As in the traditional PI controller, the instantaneous three-phase voltages is measured and fed into
the PLL circuit to calculate the instantaneous frequency and phase angle (θ). The PLL outputs are
applied within the dq-transform to convert the instantaneous three-phase measured current through
the VSC into decomposed direct component (𝐼𝑑) and quadrature component (𝐼𝑞). The quadrature
component is compared with the reference value (𝐼𝑞∗) and the error signal is passed to the PI

84
controller, which produces the firing angle (α) of the compensating voltage with respect to the line
voltage.
Figure 6.1 Fuzzy adaptive PI controller for reactive current control
The improvement here is that the PI controller gain and integration time are not fixed. The FLC
produces two outputs to manipulate the PI controller parameters 𝐾𝑝∗ and 𝐾𝑖
∗ based on the values of
error (𝑒) and error rate of change (∆𝑒) and the programmed set of rules. The effective values of
proportional gain 𝐾𝑝 and integral gain 𝐾𝑖 are updated every sampling time according to (6.1) and
(6.2).
𝐾𝑝 = 𝐾𝑝∗ + ∆𝐾𝑝 (6.1)
𝐾𝑖 = 𝐾𝑖∗ + ∆𝐾𝑖 (6.2)
Similarly, for the voltage regulator (outer control loop), the PLL outputs are applied within the dq-
transform to convert the instantaneous three-phase measured line voltages into its direct
component (𝑉𝑑) and quadrature component (𝑉𝑞). The magnitude of the voltage (𝑉𝑑𝑞) is calculated
and compared with a the reference value (𝑉∗) adjusted by the droop factor (𝐾𝑑𝑟𝑜𝑜𝑝) discussed
before in chapter 4, and the error is passed to a PI controller that produces the reference current
(𝐼𝑞∗) for the inner reactive current controller.

85
The structure of the line voltage fuzzy adaptive PI controller is given in Figure 6.2. As shown in
the figure, an additional FLC is added to auto-tune the PI controller parameters based on the line
voltage error input signal (𝑒) and its rate of change (∆𝑒).
Figure 6.2 Fuzzy adaptive PI controller for line voltage control
The additional FLC’s added in each controller will dynamically adapt the PI controllers’
parameters in order to improve the transient response. The choice of membership functions and
fuzzy rule sets are based on the theoretical knowledge of the effect of varying PI controllers’
parameters and their effect on the shape of the controller response. This is discussed in details on
the following sections.
6.2 Adaptive FLC Design in MATLAB and Choice of Membership Functions
The fuzzy adaptive PI controlled STATCOM is modelled in MATLAB Simulink using the
Simscpae specialized power systems library. Fuzzy controllers are designed using the Fuzzy Logic
Designer toolbox in MATLAB in which fuzzy inference systems for modeling complex system
behaviors can be designed and tested. The adapting FLCs designed for voltage control and reactive
current control are based on Mamdani fuzzy inference system type which uses the max-min
aggregation method and relies on the centroid defuzzification approach. The interior design of the
fuzzy controllers is identical and illustrated in Figure 6.3.

86
Figure 6.3 Reactive current / Line voltage adapting FLC in MATLAB
For the reactive current control adaptive FLC, the first input to the FLC is the reactive current error
signal (e). After gathering and analyzing the reactive current error signal in the traditional PI
controlled STATCOM, the universe of this signal is chosen to be in the range [-0.15, 0.15] to cover
all outcomes. A mix of triangular and trapezoidal membership functions are used to partition the
error universe into 7 fuzzy sets as shown in Figure 6.4. The different fuzzy sets are labeled with
the following linguistic variables, NB, NM, NS, Z, PS, PM, and PB.
Figure 6.4 Reactive current error membership functions in adaptive FLC
The second input to the reactive current control adaptive FLC is the rate of change of error (ec).
After analyzing the model simulation, it is chosen that the universe of this signal should be in the
range of [-0.002, 0.002]. Similar to the error input, a mix of triangular and trapezoidal membership

87
functions are used to split the error rate of change universe into 7 fuzzy sets labeled with 7
linguistic variables (NB, NM, NS, Z, PS, PM, and PB). The membership functions of the error rate
of change is depicted in Figure 6.5 showing the boundaries of each fuzzy set.
Figure 6.5 Reactive current error rate of change membership functions in adaptive FLC
As for the outputs (∆𝐾𝑝 and ∆𝐾𝑖), extensive simulation is done to determine the best possible
choice of range that will result in stable optimal transient response. The preset reactive current
controller parameters (𝐾𝑝∗ and 𝐾𝑖
∗) are 5 and 40, respectively. The selected range of variations
applied by the FLC to the proportional gain is [-4, 4] which makes the proportional gain vary
between 1 and 9. A mix of triangular and trapezoidal membership functions is used to split the
gain variation universe into 7 fuzzy sets labeled with 7 linguistic variables (NB, NM, NS, Z, PS,
PM, and PB). 𝛥𝐾𝑝 membership functions are illustrated in Figure 6.6.
Figure 6.6 Gain variation membership functions in reactive current controller

88
Similarly deduced, the selected range of variations applied by the FLC to the integral action is [-
20, 20] which makes the integral gain vary between 20 and 60. A mix of triangular and trapezoidal
membership functions is used to split the integral gain variation universe into 7 fuzzy sets labeled
with 7 linguistic variables (NB, NM, NS, Z, PS, PM, and PB) illustrated in Figure 6.7.
Figure 6.7 Integral gain variation membership functions in reactive current controller
For the line voltage control adaptive FLC, the first input to the FLC is the voltage error signal (e).
After gathering and analyzing the voltage error signal in the traditional PI controlled STATCOM,
the universe of this signal is chosen to be in the range [-0.01, 0.01] to cover all outcomes. A mix
of triangular and trapezoidal membership functions are used to partition the error universe into 7
fuzzy sets as shown in Figure 6.8. The different fuzzy sets are labeled with the following linguistic
variables, NB, NM, NS, Z, PS, PM, and PB.
Figure 6.8 Line voltage error membership functions in adaptive FLC
The second input to the line voltage control adaptive FLC is the rate of change of error (ec). After
analyzing the model simulation, it is chosen that the universe of this signal should be in the range

89
of [-3e-5, 3e-5]. Similar to the error input, a mix of triangular and trapezoidal membership
functions are used to split the error rate of change universe into 7 fuzzy sets labeled with 7
linguistic variables (NB, NM, NS, Z, PS, PM, and PB). The membership functions of the error rate
of change is depicted in Figure 6.9 showing the boundaries of each fuzzy set.
Figure 6.9 Voltage error rate of change membership functions in adaptive FLC
On the output side, the preset line voltage controller parameters (𝐾𝑝∗ and 𝐾𝑖
∗) are 12 and 3000,
respectively. The variations applied by the FLC to the proportional gain is selected to be in the
range of [-3, 3] which makes the proportional gain vary between 9 and 15. A mix of triangular and
trapezoidal membership functions is used to split the gain variation universe into 7 fuzzy sets
labeled with 7 linguistic variables (NB, NM, NS, Z, PS, PM, and PB). 𝛥𝐾𝑝 membership functions
are illustrated in Figure 6.10.
Figure 6.10 Gain variation membership functions in voltage controller
Similarly deduced, the selected range of variations applied by the FLC to the integral action is [-
2000, 2000] which makes the integral gain vary between 1000 and 5000. A mix of triangular and

90
trapezoidal membership functions is used to split the integral gain variation universe into 7 fuzzy
sets labeled with 7 linguistic variables (NB, NM, NS, Z, PS, PM, and PB) illustrated in Figure 6.11.
Figure 6.11 Integral gain variation membership functions in voltage controller
6.3 Mapping Expert Knowledge to Fuzzy Rules
As discussed before, the FLC is used for regulating the parameters of line voltage and reactive
current PI controllers, 𝑘𝑝 and 𝑘𝑖, on-line by fuzzy logic control rules for better PI control
performance in different transient conditions. Hence, it is necessary to understand the function of
each PI parameters. Only then, it is possible to determine the relation between the fuzzy outputs,
∆𝑘𝑝 and ∆𝐾𝑖, and the fuzzy inputs, e and ec; and finally build the fuzzy rules table. The functions
of the proportional gain and integral gain and their impact on the system response can be
summarized according to Table 6.1.
Table 6.1 Kp and Ki effect on system transient response
Controller
Parameters Action
Response Performance Variable
Rise Time Settling Time Overshoot Steady State
Error
Increasing 𝑲𝒑 Decrease Increase Small Increase Decrease
Increasing 𝑲𝒊 Small Decrease Increase Increase Large Decrease
The set of rules for both reactive current and line voltage control are identical as both of the
controllers are originally PI based and follow the guidelines outlined in Table 6.1. Recalling from

91
the previous section that each input and output of the tuning FLC’s are programmed with 7
membership functions representing the variable universe, this will yield two 49-rule tables; one
representing 𝐾𝑝 adaptations (Table 6.2) and the other illustrates 𝐾𝑖 adaptations (Table 6.3).
Table 6.2 Fuzzy rule base of Kp
𝒆(𝒌)
∆𝒆(𝒌)
NB NM NS Z PS PM PB
NB PB PB PM PM PS Z Z
NM PB PB PM PS PS Z NS
NS PM PM PM PS Z NS NS
Z PM PM PS Z NS NM NM
PS PS PS Z NS NS NM NM
PM PS Z NS NM NM NM NB
PB Z Z NM NM NM NB NB
Table 6.3 Fuzzy rule base of Ki
𝒆(𝒌)
∆𝒆(𝒌)
NB NM NS Z PS PM PB
NB NB NB NM NM NS Z Z
NM NB NB NM NS NS Z Z
NS NB NM NS NS Z PS PS
Z NM NM NS Z PS PM PM
PS NM NS Z PS PS PM PB

92
𝒆(𝒌)
∆𝒆(𝒌)
NB NM NS Z PS PM PB
PM Z Z PS PS PM PB PB
PB Z Z PS PM PM PB PB
6.4 Simulation Results
Using the same electrical power system setup shown in Figure 4.1 which is created using the
Simscape specialized power systems library in MATLAB Simulink software, the response of the
fuzzy adaptive PI controlled STATCOM is demonstrated. The output voltage amplitude of the
generator at Bus 1 is varied through the simulation time. Initially, the output voltage amplitude is
set at 1 pu then reduced to 0.955 pu at 𝑇 = 0.1 𝑠. Later at 𝑇 = 0.2 𝑠, the output voltage amplitude
is increased to 1.045 pu and finally brought back to 1 pu at 𝑇 = 0.3 𝑠.
The simulation results without the STATCOM were depicted in Figure 4.6. Figure 6.12 shows the
voltage variation at system buses with the existence of the fuzzy adaptive PI controlled STATCOM
supporting the transmission line voltage. Compared to buses voltages without the STATCOM in
Figure 4.6, it is seen that the STATCOM control was able to reduce the voltage variation at all
busses, especially on Bus 1 where STATCOM is located. The STATCOM capacitive action at
time 𝑇 = 0.1 𝑠 increases the voltage at Bus 1 to nearly 0.978 pu and the STATCOM inductive
action at 𝑇 = 0.2 𝑠 decreases the voltage at Bus 1 to 1.021 pu in a relatively fast manner.

93
Figure 6.12 Bus voltages with fuzzy adaptive PI controlled STATCOM
To illustrate the performance of the fuzzy adaptive PI controller design, the measured line voltage
and the resultant reference reactive current are plotted in Figure 6.13. It is clearly shown that the
adaptive controller was able to react quickly to voltage variation by producing the required
reference reactive current with minimal time delay according due to the dynamically tuned PI
controller parameters.
Figure 6.13 Line voltage vs Reference reactive current in adaptive fuzzy PI STATCOM

94
Finally, to showcase the accuracy of the reactive current control adaptive controller in tracking the
reference reactive current, the reference and actual reactive current are plotted simultaneously in
Figure 6.14. It is evidently shown that the fuzzy adaptive PI controller with its online tuned
parameters according to the fuzzy set of rules closely track the reference reactive current with
minimal deviations.
Figure 6.14 Actual and reference reactive currents in fuzzy adaptive PI controlled STATCOM

95
7 Performance Comparison between Control Approaches
In this chapter, two common transmission line operational scenarios are simulated in MATLAB
Simulink to compare the response of the three STATCOM control techniques discussed in this
thesis. Afterwards, the performance of both outer and inner control loops in STATCOM is
analyzed and assessed for all three control approaches.
In the first scenario, a sudden substantial load change will be introduced to the power system at a
certain time that would cause the voltage to have a sudden drop (often called voltage sag). In
practice, this scenario occurs upon start-up of heavy industrial loads such as electrical steel
furnaces or high voltage gas compressors. In the next scenario, an instantaneous shutdown of large
load is triggered in the simulation at a certain time, which will result in a sudden increase in line
voltage (often called voltage swell). This happens usually due to unplanned emergency shutdowns
of high power industrial equipment in plants.
The Simulink model used to simulate both scenarios is depicted in Figure 7.1 where time-triggered
three-phase circuit breakers are used to connect or disconnect the loads to the power system at a
configured time. All generator units are set at a fixed value during the simulation time and
STATCOM voltage set point is kept at 1 pu.
Figure 7.1 Power system Simulation model with load variation

96
7.1 Scenario I: Voltage Sag due to Sudden Load Increase
In this scenario, an additional 300MW load is switched on at 𝑇 = 0.1 𝑠. The line voltage at Bus 1
drops and therefore the STATCOM will supply capacitive reactive power to support the line
voltage. The system response using all three controllers is shown in Figure 7.2 for comparison
where the three voltage responses from each controller is plotted along with the reference voltage
at Bus 1.
Figure 7.2 Line voltage response for all controllers due to voltage dip
It is noticed that the voltage response obtained using the traditional STATCOM with PI controller
is satisfactory but slower that the other two controllers which reacts quickly by supplying reactive
energy to the power system to increase the line voltage. FLC based controller, specifically, shows
a very fast response, thus preventing the line voltage from dropping to lower values compared to
the other controllers.
7.2 Scenario II: Voltage Swell due to Sudden Load Shutdown
In this scenario, the existing 300MW load at Bus 1 is switched off at 𝑇 = 0.1 𝑠. The line voltage
at Bus 1 increases and therefore the STATCOM will absorb excess reactive power to limit the

97
increase in line voltage. The system response using all three controllers is shown in Figure 7.3 for
comparison where the three voltage responses from each controller is plotted along with the
reference voltage at Bus 1.
Figure 7.3 Line voltage response for all controllers due to voltage swell
As it was with the first scenario, the FLC based STATCOM shows the best possible voltage
regulation in terms of minimizing the effect of voltage variation in the fastest possible time.
7.3 Control Loops Performance Comparison
In order to appreciate the value of the newly proposed control techniques used in the outer voltage
control loop, the reaction of PI controlled STATCOM, FLC based STATCOM, and adaptive fuzzy
controlled STATCOM to the same voltage abruption in the transmission line is analyzed. The
voltage disturbance is simulated by decreasing the voltage of Bus 1 generator at 𝑇 = 0.1𝑠 from 1
pu to 0.955 pu. The task of the outer voltage control loop is to sense the voltage variation and
produce the required reference reactive current at its output. The output reference reactive current
resulting from all three controllers is plotted in Figure 7.4 in order to compare the controller speed
in responding to the voltage error input.
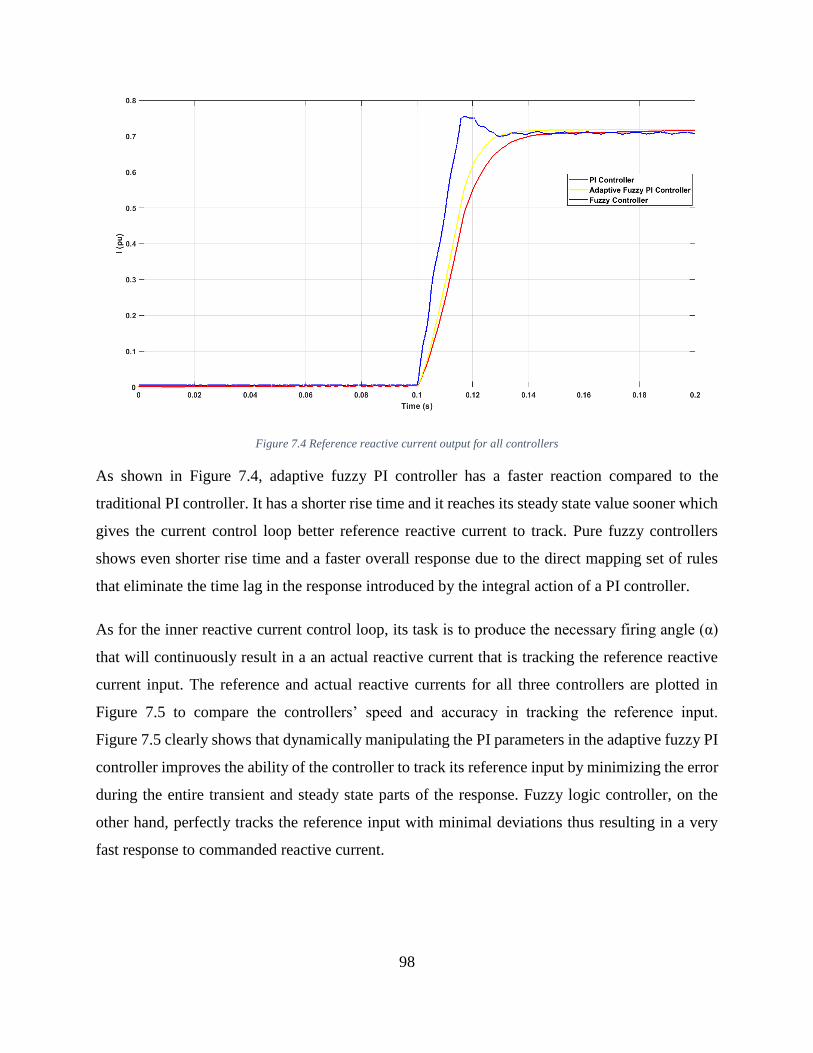
98
Figure 7.4 Reference reactive current output for all controllers
As shown in Figure 7.4, adaptive fuzzy PI controller has a faster reaction compared to the
traditional PI controller. It has a shorter rise time and it reaches its steady state value sooner which
gives the current control loop better reference reactive current to track. Pure fuzzy controllers
shows even shorter rise time and a faster overall response due to the direct mapping set of rules
that eliminate the time lag in the response introduced by the integral action of a PI controller.
As for the inner reactive current control loop, its task is to produce the necessary firing angle (α)
that will continuously result in a an actual reactive current that is tracking the reference reactive
current input. The reference and actual reactive currents for all three controllers are plotted in
Figure 7.5 to compare the controllers’ speed and accuracy in tracking the reference input.
Figure 7.5 clearly shows that dynamically manipulating the PI parameters in the adaptive fuzzy PI
controller improves the ability of the controller to track its reference input by minimizing the error
during the entire transient and steady state parts of the response. Fuzzy logic controller, on the
other hand, perfectly tracks the reference input with minimal deviations thus resulting in a very
fast response to commanded reactive current.

99
Figure 7.5 Reference vs actual reactive current for all controllers
Finally, a comparison between the resultant actual reactive current is depicted in figure xx to
illustrate the overall effect of the proposed controllers on STATCOM’s performance.
Figure 7.6 Actual reactive current for all controllers

100
8 Conclusions and future Work
The aim of this thesis to apply artificial intelligence in controlling a practical STATCOM FACTS
device integrated at the power transmission network level by replacing the traditional PI controllers
with direct fuzzy logic control and adaptive fuzzy PI control approach. The novelty in this
approach is the design of an FLC based STATCOM in addition to an adaptive fuzzy PI controlled
STATCOM that is superior in performance to the classical PI controlled STATCOM. This would
help power system operators achieve better voltage regulation and gain more control over the
reactive power exchange within the utility power system.
Although a STATCOM with classical PI controller is stable and provides a satisfactory operation,
simulations have shown that using fuzzy logic control to adaptively tune the PI controller
parameters decreases the rise time of the STATCOM response and therefore, results in a faster
reaction to voltage fluctuations. Furthermore, completely replacing the PI controller with only a
fuzzy logic based controller that directly controls the STATCOM firing angle has proven to have
even shorter response time and less oscillations when compared to the other two control
techniques. Fuzzy logic controller design doesn’t need mathematical modelling of STATCOM and
therefore can be universally applied to various STATCOM topologies.
As a future work, investigating further possibilities for applying artificial intelligence techniques
in enhancing the control of STATCOM devices shall be looked after. Artificial neural network
(ANN) models in particular have been applied successfully in many system control related fields,
hence the usability of ANN for direct ANN based STATCOM and ANN adaptive PI controlled
STATCOM shall be explored. In addition, applying a combination of FL and ANN approaches in
an Adaptive Neuro-Fuzzy Inference System (ANFIS) concept shall be attempted where ANN is
used as a supervisory learning and identification algorithm used to construct the fuzzy rule base
model.
.

101
9 References
[1] N. G. Hingorani and L. Gyugyi, Understanding FACTS: concepts and technology of flexible
AC transmission systems. New York: Institute of Electrical and Electronics Engineers, 2000.
[2] Rakibuzzaman Shah, N. Mithulananthan, R.C. Bansal, V.K. Ramachandaramurthy, A review
of key power system stability challenges for large-scale PV integration, Renewable and
Sustainable Energy Reviews, Volume 41, 2015.
[3] Jantzen, J. (2007) Foundations of fuzzy control. Hoboken, NJ: Wiley-Blackwell.
[4] SajediHir M, Hoseinpoor Y, Mosadegh Ardabili P, Pirzadeh T. Analysis and simulation of a
D-STATCOM for voltage quality improvement. Australian Journal of Basic and Applied Sciences
2011; 5(10):1157–1163.
[5] P. Garcia-Gonzalez and A. Garcia-Cerrada, "Control system for a PWM-based STATCOM,"
in IEEE Transactions on Power Delivery, vol. 15, no. 4, pp. 1252-1257, Oct. 2000, doi:
10.1109/61.891511.
[6] M. S. El-Moursi and A. M. Sharaf, "Novel controllers for the 48-pulse VSC STATCOM and
SSSC for voltage regulation and reactive power compensation," in IEEE Transactions on Power
Systems, vol. 20, no. 4, pp. 1985-1997, Nov. 2005, doi: 10.1109/TPWRS.2005.856996.
[7] S. K. Sethy and J. K. Moharana, "Design, analysis and simulation of linear controller of a
STATCOM for reactive power compensation on variation of DC link voltage," 2013 International
Conference on Power, Energy and Control (ICPEC), 2013, pp. 74-79, doi:
10.1109/ICPEC.2013.6527627.
[8] P. Rao, M. L. Crow and Z. Yang, "STATCOM control for power system voltage control
applications," in IEEE Transactions on Power Delivery, vol. 15, no. 4, pp. 1311-1317, Oct. 2000,
doi: 10.1109/61.891520.

102
[9] V. Spitsa, A. Alexandrovitz and E. Zeheb, "Design of a Robust State Feedback Controller for
a STATCOM Using a Zero Set Concept," in IEEE Transactions on Power Delivery, vol. 25, no. 1,
pp. 456-467, Jan. 2010, doi: 10.1109/TPWRD.2009.2034828.
[10] K. Wang and M. L. Crow, "Power System Voltage Regulation via STATCOM Internal
Nonlinear Control," in IEEE Transactions on Power Systems, vol. 26, no. 3, pp. 1252-1262, Aug.
2011, doi: 10.1109/TPWRS.2010.2072937.
[11] C. Liu and Y. Hsu, "Design of a Self-Tuning PI Controller for a STATCOM Using Particle
Swarm Optimization," in IEEE Transactions on Industrial Electronics, vol. 57, no. 2, pp. 702-715,
Feb. 2010, doi: 10.1109/TIE.2009.2028350.
[12] Nitin Kumar Saxena, Ashwani Kumar, Reactive power control in decentralized hybrid power
system with STATCOM using GA, ANN and ANFIS methods, International Journal of Electrical
Power & Energy Systems, Volume 83, 2016, Pages 175-187, ISSN 0142-0615,
https://doi.org/10.1016/j.ijepes.2016.04.009.
[13] S. Sumathi and Bansilal, "Atificial neural network application for control of STATCOM in
power systems for both voltage control mode and reactive power mode," 2009 International
Conference on Power Systems, 2009, pp. 1-4, doi: 10.1109/ICPWS.2009.5442763.
[14] P. M. Oliver, J. M. Ramirez, Z. H. Pavel and T. O. Ruben, "StatCom's Control by neural
networks: Results on a lab prototype," 2009 IEEE Bucharest PowerTech, 2009, pp. 1-6, doi:
10.1109/PTC.2009.5282123.
[15] L.O. Mak, Y.X. Ni, C.M. Shen, STATCOM with fuzzy controllers for interconnected power
systems, Electric Power Systems Research, Volume 55, Issue 2, 2000, Pages 87-95, ISSN 0378-
7796, https://doi.org/10.1016/S0378-7796(99)00100-5.
[16] Stella Morris, P.K. Dash, K.P. Basu, A fuzzy variable structure controller for STATCOM,
Electric Power Systems Research, Volume 65, Issue 1, 2003, Pages 23-34, ISSN 0378-7796,
https://doi.org/10.1016/S0378-7796(02)00212-2.

103
[17] A. Luo, C. Tang, Z. Shuai, J. Tang, X. Y. Xu and D. Chen, "Fuzzy-PI-Based Direct-Output-
Voltage Control Strategy for the STATCOM Used in Utility Distribution Systems," in IEEE
Transactions on Industrial Electronics, vol. 56, no. 7, pp. 2401-2411, July 2009, doi:
10.1109/TIE.2009.2021172.
[18] M. Ramya and P. U. Rani, "A fuzzy logic controller based static synchronous compensator,"
3rd International Conference on Electrical, Electronics, Engineering Trends, Communication,
Optimization and Sciences (EEECOS 2016), 2016, pp. 1-6, doi: 10.1049/cp.2016.1517.
[19] K. B. Mohanty and S. Pati, "Fuzzy logic controller based STATCOM for voltage profile
improvement in a micro-grid," 2016 Annual IEEE Systems Conference (SysCon), 2016, pp. 1-6,
doi: 10.1109/SYSCON.2016.7490645.
[20] N. Hatano and T. Ise, "Control Scheme of Cascaded H-Bridge STATCOM Using Zero-
Sequence Voltage and Negative-Sequence Current," in IEEE Transactions on Power Delivery, vol.
25, no. 2, pp. 543-550, April 2010, doi: 10.1109/TPWRD.2009.2035221.
[21] Z. Liu, B. Liu, S. Duan and Y. Kang, "A Novel DC Capacitor Voltage Balance Control
Method for Cascade Multilevel STATCOM," in IEEE Transactions on Power Electronics, vol. 27,
no. 1, pp. 14-27, Jan. 2012, doi: 10.1109/TPEL.2010.2050337.
[22] C. D. Townsend, T. J. Summers and R. E. Betz, "Multigoal Heuristic Model Predictive
Control Technique Applied to a Cascaded H-bridge StatCom," in IEEE Transactions on Power
Electronics, vol. 27, no. 3, pp. 1191-1200, March 2012, doi: 10.1109/TPEL.2011.2165854.
[23] Y. Zhang, X. Wu, X. Yuan, Y. Wang and P. Dai, "Fast Model Predictive Control for
Multilevel Cascaded H-Bridge STATCOM With Polynomial Computation Time," in IEEE
Transactions on Industrial Electronics, vol. 63, no. 8, pp. 5231-5243, Aug. 2016, doi:
10.1109/TIE.2016.2572662.
[24] K. R. Padiyar and N. Prabhu, "Design and performance evaluation of subsynchronous
damping controller with STATCOM," in IEEE Transactions on Power Delivery, vol. 21, no. 3, pp.
1398-1405, July 2006, doi: 10.1109/TPWRD.2005.861332.

104
[25] B. Chen and Y. Hsu, "A Minimal Harmonic Controller for a STATCOM," in IEEE
Transactions on Industrial Electronics, vol. 55, no. 2, pp. 655-664, Feb. 2008, doi:
10.1109/TIE.2007.896266.
[26] Tuzikova, V.; Tlusty, J.; Muller, Z. A Novel Power Losses Reduction Method Based on a
Particle Swarm Optimization Algorithm Using STATCOM. Energies 2018, 11, 2851.
https://doi.org/10.3390/en11102851.
[27] Mathur, R. M., and Rajiv K. Varma. Thyristor-based FACTS controllers for electrical
transmission systems. Piscataway, NJ New York: IEEE Wiley, 2002. Print.
[28] Sen, Kalyan K., and Mey L. Sen. Introduction to FACTS controllers: theory, modeling, and
applications. Hoboken, N.J. Piscataway, NJ: Wiley IEEE Press, 2009. Print.
[29] Fusco, Giuseppe, and Mario Russo. Adaptive voltage control in power systems: modeling,
design and applications. London: Springer, 2007. Print.
[30] Corsi, S. (2015). Voltage control and protection in electrical power systems: From system
components to wide-area control (2015th ed.). Guildford, England: Springer.
[31] Eremia, M. (2016). Advanced solutions in power systems: HVDC, FACTS, and artificial
intelligence (M. Eremia, C.-C. Liu, & A.-A. Edris, Eds.). Nashville, TN: John Wiley & Sons.
[32] Zhang., Rehtanz, C. & Pal, B. (2012). Flexible AC transmission systems: modelling and
control. Berlin New York: Springer.
[33] Andersen, B. R., & Nilsson, S. L. (Eds.). (2020). Flexible AC Transmission Systems: FACTS
(1st ed.). Cham, Switzerland: Springer Nature.
[34] Static Compensators (STATCOMs) in Power Systems. (2015). In F. Shahnia, S. Rajakaruna,
& A. Ghosh (Eds.), Power Systems. Springer Singapore. https://doi.org/10.1007/978-981-287-
281-4
[35] Yazdani, Amirnaser, and Reza Iravani. Voltage-sourced converters in power systems:
modeling, control, and applications. Hoboken, N.J: IEEE Press/John Wiley, 2010. Print.

105
[36] Tabatabaei, N. M., Bizon, N., & Blaabjerg, F. (Eds.). (2017). Reactive power control in AC
power systems: Fundamentals and current issues (1st ed.). Cham, Switzerland: Springer
International Publishing.
[37] Qin, N. (2017). Voltage control in the future power transmission systems (1st ed.). Cham,
Switzerland: Springer International Publishing.
[38] Altas, I. H. (2017). Fuzzy Logic Control in Energy Systems with design applications in
MATLAB (R)/Simulink (R). Stevenage, England: Institution of Engineering and Technology.
[39] Carvalho de Barros, L., Bassanezi, R. C., & Lodwick, W. A. (2016). A first course in fuzzy
logic, fuzzy dynamical systems, and biomathematics: Theory and applications (1st ed.). Berlin,
Germany: Springer.
[40] P.J. MacVicar-Whelan, Fuzzy sets for man-machine interaction, International Journal of Man-
Machine Studies, Volume 8, Issue 6, 1976, Pages 687-697, ISSN 0020-7373,
https://doi.org/10.1016/S0020-7373(76)80030-2.
Related Documents