1 | Page Executive Summary Last week we found, based on our analyses of the charts: “Our SPX2146-2069 target zone remains and can now be narrowed down to SPX2117-2069, as the S&P500 closed at SPX2128 yesterday, and possible to SPX2120-2100 for an even narrower target zone. “ The S&P500 the hit 2119 on Monday; close enough? The daily and weekly charts still look bullish, but the hourly S&P500 charts shows a possible bearish set up that can swiftly bring us to SPX2070 (the 62% retrace of the 5-wave up move from SPX1992 to SPX2194). At this point in time we cannot be certain which will pan out, but can use price levels to set the stage (see How to trade this? below) The RSI14 on the S&P500’s summation index has now reached its 3 rd lowest level since the March 2009 SPX667 low: even lower than the Aug. ’15 and Jan. ’16 corrections, and lower than at any time during the ‘08/’09 crash. It is thus running out of real estate to drop even further. This means positive market breadth is logically coming soon, which will mean rising market prices. Markets can either rise directly from here to new highs, or bounce first to set up positive divergence with a lower low before rallying to new highs. Based on the charts we can’t be certain about which it will be just yet. The VIX gave a “Sell the VIX, buy the SPX signal” on Friday, which fits with our observations. A potential significant turn in the markets can be expected later this month. How to trade this? Adding longs in the SPX2140-2110 zone will be well-rewarded longer term we believe. 1) A break & close below SPX 2119 targets SPX2070. 2) A break & close above SPX2148 should target SPX2168. 3) A break & close above SPX2168 (50d and 20d SMA) most likely means the correction is over. Even a drop to SPX2070 will mean short term pain, but long term gain as we remain our SPX2350+/-25 target longer term, which fits with our long term simple moving averages charts that are now 99% bullish.

Welcome message from author
This document is posted to help you gain knowledge. Please leave a comment to let me know what you think about it! Share it to your friends and learn new things together.
Transcript

1 | P a g e
Executive Summary
Last week we found, based on our analyses of the charts: “Our SPX2146-2069 target zone remains and can now be
narrowed down to SPX2117-2069, as the S&P500 closed at SPX2128 yesterday, and possible to SPX2120-2100 for an
even narrower target zone. “ The S&P500 the hit 2119 on Monday; close enough?
The daily and weekly charts still look bullish, but the hourly S&P500 charts shows a possible bearish set up that can
swiftly bring us to SPX2070 (the 62% retrace of the 5-wave up move from SPX1992 to SPX2194). At this point in time
we cannot be certain which will pan out, but can use price levels to set the stage (see How to trade this? below)
The RSI14 on the S&P500’s summation index has now reached its 3rd lowest level since the March 2009 SPX667 low:
even lower than the Aug. ’15 and Jan. ’16 corrections, and lower than at any time during the ‘08/’09 crash. It is thus
running out of real estate to drop even further. This means positive market breadth is logically coming soon, which
will mean rising market prices. Markets can either rise directly from here to new highs, or bounce first to set up
positive divergence with a lower low before rallying to new highs. Based on the charts we can’t be certain about
which it will be just yet.
The VIX gave a “Sell the VIX, buy the SPX signal” on Friday, which fits with our observations. A potential significant
turn in the markets can be expected later this month.
How to trade this?
Adding longs in the SPX2140-2110 zone will be well-rewarded longer term we believe.
1) A break & close below SPX 2119 targets SPX2070.
2) A break & close above SPX2148 should target SPX2168.
3) A break & close above SPX2168 (50d and 20d SMA) most likely means the correction is over.
Even a drop to SPX2070 will mean short term pain, but long term gain as we remain our SPX2350+/-25 target longer
term, which fits with our long term simple moving averages charts that are now 99% bullish.

2 | P a g e
Elliot wave update
Our preferred count continues to be shown in Figure 1. Last week we concluded “Hence, the SPX2100-2120, with
SPX2117 remains our ideal target.” This week we got SPX2119 and ended the week higher. Close enough to a bingo!?
Problem is, corrections are very hard to forecast, as they can take on any form and shape. As such, on the daily chart
we need to see price close back above 1) the upper black ascending trendline. 2) the 50d (and 20d) SMA to be more
certain the low is in. But, even then we can still be dealing with a larger b-wave although we have positive
divergences on the RSI5, an initital A.I. buy signal, and positive divergence on the MFI14. Hence, things are improving
internally and we now need price confirmation or otherwise we will have to content us with the bearish chart shown
in Figure 2, next page.
Figure 1. SPX daily TI chart: Initial ideal target remains SPX2117 reached, bounce underway or rally?
3 | P a g e
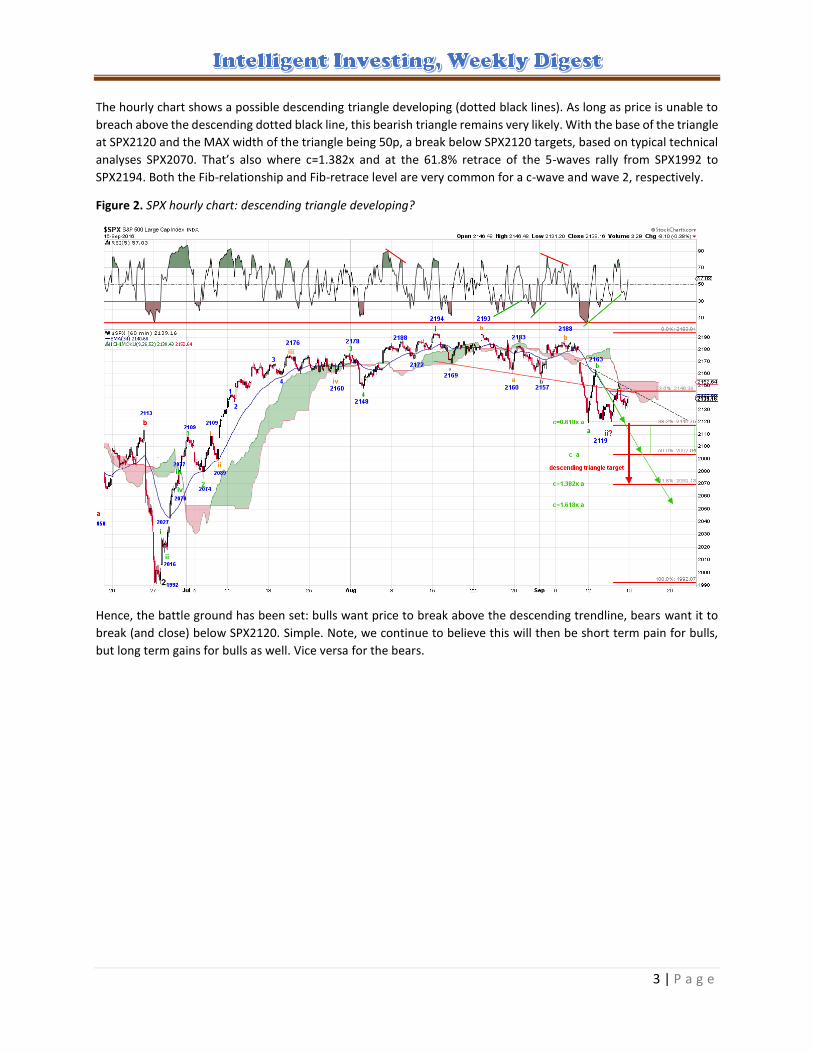
The hourly chart shows a possible descending triangle developing (dotted black lines). As long as price is unable to
breach above the descending dotted black line, this bearish triangle remains very likely. With the base of the triangle
at SPX2120 and the MAX width of the triangle being 50p, a break below SPX2120 targets, based on typical technical
analyses SPX2070. That’s also where c=1.382x and at the 61.8% retrace of the 5-waves rally from SPX1992 to
SPX2194. Both the Fib-relationship and Fib-retrace level are very common for a c-wave and wave 2, respectively.
Figure 2. SPX hourly chart: descending triangle developing?
Hence, the battle ground has been set: bulls want price to break above the descending trendline, bears want it to
break (and close) below SPX2120. Simple. Note, we continue to believe this will then be short term pain for bulls,
but long term gains for bulls as well. Vice versa for the bears.
4 | P a g e
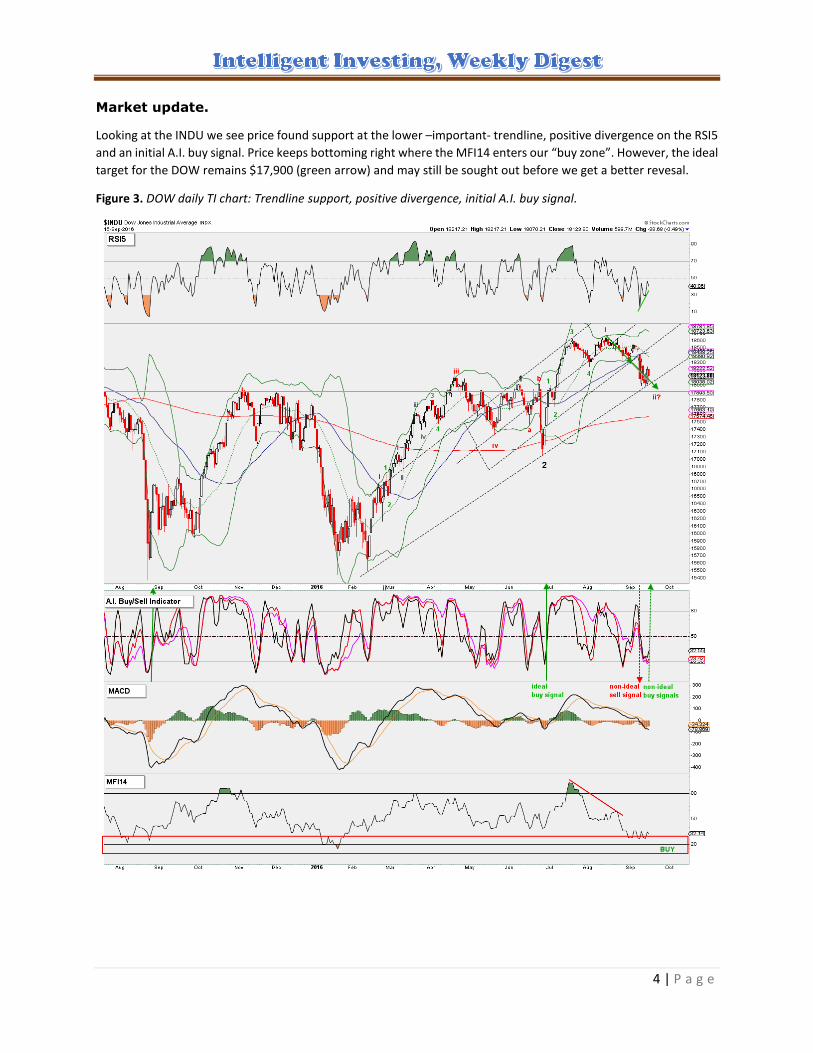
Market update.
Looking at the INDU we see price found support at the lower –important- trendline, positive divergence on the RSI5
and an initial A.I. buy signal. Price keeps bottoming right where the MFI14 enters our “buy zone”. However, the ideal
target for the DOW remains $17,900 (green arrow) and may still be sought out before we get a better revesal.
Figure 3. DOW daily TI chart: Trendline support, positive divergence, initial A.I. buy signal.

5 | P a g e
Our Time-Fib chart shows an important turn can be expected at the end of this month, which coincides with the
relatively strong Bradley turn date for September 28 (see last page). In addition, this next Fib-turn date is exactly the
same length of time between the Dec. ’15 and March ’16 tops and turns (Blue arrows). We can also see that price
continues to find support at the important longer term blue descending trendline (green arrow). If that doesn’t hold,
then the descending dotted black trendline will be next.
Figure 4. DOW Time-Fib and longer term trendlines.

6 | P a g e
A look at the weekly NAZ chart shows price found support at the critical $5100 level and rallied back over initial
support at $5200. There is no real A.I. sell signal as not all 3 TIs that comprise the A.I. moved below 80. In addition,
OBV remains positive and is making new highs and thus not even diverging yet (a lower OBV and higher prices)
Figure 5. COMPQ weekly TI chart: Bullish candle, OBV signals continued upside. $5100 support held.
7 | P a g e
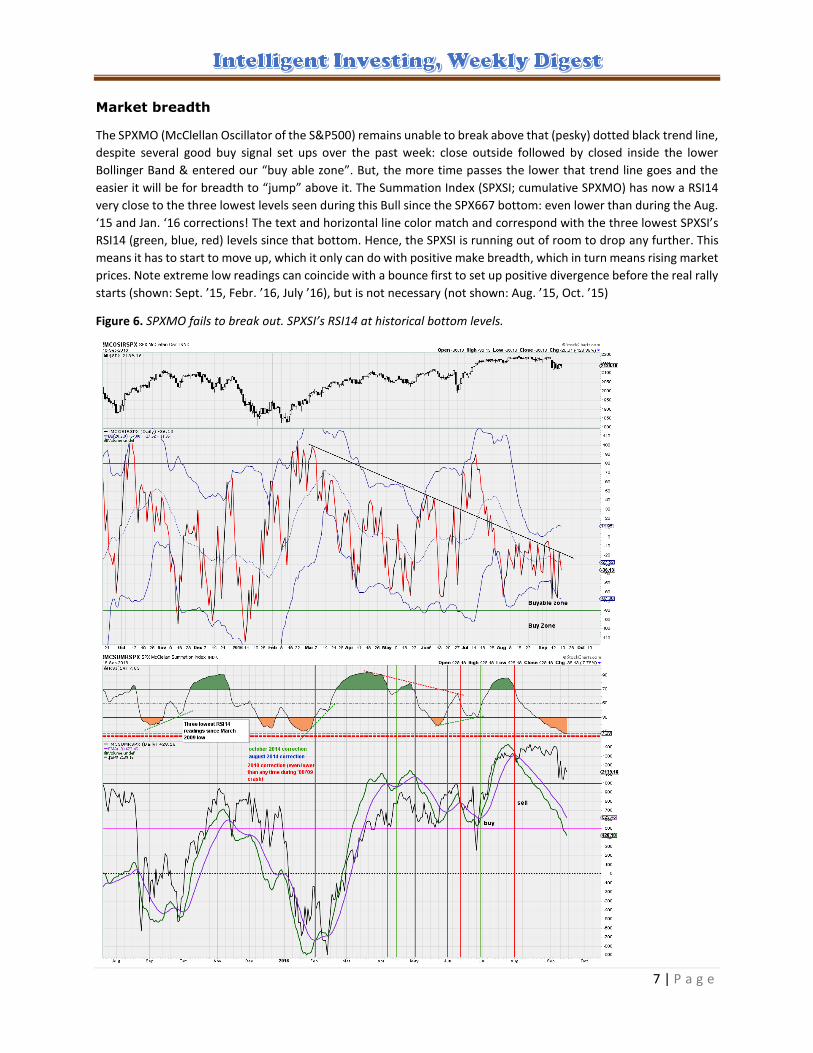
Market breadth
The SPXMO (McClellan Oscillator of the S&P500) remains unable to break above that (pesky) dotted black trend line,
despite several good buy signal set ups over the past week: close outside followed by closed inside the lower
Bollinger Band & entered our “buy able zone”. But, the more time passes the lower that trend line goes and the
easier it will be for breadth to “jump” above it. The Summation Index (SPXSI; cumulative SPXMO) has now a RSI14
very close to the three lowest levels seen during this Bull since the SPX667 bottom: even lower than during the Aug.
‘15 and Jan. ‘16 corrections! The text and horizontal line color match and correspond with the three lowest SPXSI’s
RSI14 (green, blue, red) levels since that bottom. Hence, the SPXSI is running out of room to drop any further. This
means it has to start to move up, which it only can do with positive make breadth, which in turn means rising market
prices. Note extreme low readings can coincide with a bounce first to set up positive divergence before the real rally
starts (shown: Sept. ’15, Febr. ’16, July ’16), but is not necessary (not shown: Aug. ’15, Oct. ’15)
Figure 6. SPXMO fails to break out. SPXSI’s RSI14 at historical bottom levels.

8 | P a g e
Miscellaneous
Despite all the price action of late, our long term simple moving averages chart (LT-SMA, for trend followers and
investing) continues to improve and is now 99% bullish as all but 1 of the SMAs are now above the dotted (reference
SMA). This has long term implications and fits with our initial SPX2350 +/25 target, as the market is now per the
SMAs in a strong bull believe it or not. Remember, it was full blown bearish until mid-March and didn’t turn decisively
more bullish until June of this year; when ALL LT-SMAs turned back up.
The Short term (ST-SMA, for traders to swing traders)) picture deteriorate over the past 5 days as expected last
week. All SMAs and price are still above the dotted (reference) SMAs and as such the LT-SMA continues to signal
strength as well.
Hence, these charts continue to foretell short and long term upside supporting our preferred Elliot Wave count.
Figure 7. LT-SMA chart almost 100% bullish ST-SMA chart 70% Bullish.
Below is how a 100% bullish chart look likes, everything points up. Price > fastest SMAs > slowest SMAs.
The “Ebola scare” correction
in 2014 didn’t even register
on the LT chart!

9 | P a g e
The VIX gave a “sell the VIX, buy the SPX” signal on Friday by closing below Thursday’s close after first closing outside
and then inside its upper Bollinger Band. Although we don’t find this to be the most reliable of indicators, it matches
with our other observations of extreme low market breadth readings, initial buy signals etc.
Figure 8. VIX “Sell the VIX, buy the SPX” signal on Friday.
10 | P a g e
All 2016 Bradley Turn Dates for the S&P 500
January 5 (0/100 Bradley Siderograph Power)
February 1 (0/100 Long Terms Power)
February 3 (100/100 Declinations Power)
February 6 (60/100 Middle Terms Power)
March 11 (52/100 Middle Terms Power)
May 10 (36/100 Bradley Siderograph Power)
May 11 (47/100 Middle Terms Power)
May 25 (100/100 Long Terms Power)
June 1 (49/100 Bradley Siderograph Power)
June 4 (47/100 Middle Terms Power)
July 1 (100/100 Declinations Power)
July 5 (100/100 Bradley Siderograph Power)
July 5 (51/100 Middle Terms Power)
August 5 (0/100 Long Terms Power)
August 8 (60/100 Middle Terms Power)
September 28 (32/100 Bradley Siderograph Power)
October 19 (42/100 Middle Terms Power)
November 26 (100/100 Declinations Power)
November 28 (86/100 Long Terms Power)
November 29 (100/100 Bradley Siderograph Power)
December 28 (50/100 Middle Terms Power)
ALOHA
Soul, Ph.D.
©2016, Intelligent Investing. This copyrighted weekly periodical is published on non-stock market trading weekend
days by Intelligent Investing, and is intended solely for use by designated recipients. No reproduction, retransmission,
or other use of the information or images is authorized. Legitimate news media may quote representative passages,
in context and with full attribution, for the purpose of reporting on our opinions.
Analysis is derived from data believed to be accurate, but such accuracy or completeness cannot be guaranteed. It
should not be assumed that such analysis, past or future, will be profitable or will equal past performance or
guarantee future performance or trends. All trading and investment decisions are the sole responsibility of the reader.
Inclusion of information about managed accounts program positions and other information is not intended as any
type of recommendation, nor solicitation.
For more information, contact intelligent investing at [email protected]. We reserve the right to refuse
service to anyone for any reason.
Related Documents